Embed Size (px)
Citation preview
Results from Interface Laboratory Experiments
- Interims report -
FORGE Report D309ndash VER0
Name Organization Signature Date
Compiled Till Popp IfG 15082011
Verified Klaus Salzer IfG 31082011
Approved RP Shaw BGS
Keywords
Bibliographical reference
Popp T T Fabig amp D Naumann 2011 Results from interface laboratory experiments ndash Interims report
FORGE Report D309 33pp
Euratom 7th Framework Programme Project FORGE
FORGE Report Dxxx ndash Ver0
i
Fate of repository gases (FORGE)
The multiple barrier concept is the cornerstone of all proposed schemes for underground disposal of radioactive wastes The concept invokes a series of barriers both engineered and natural between the waste and the surface Achieving this concept is the primary objective of all disposal programs from site appraisal and characterization to repository design and construction However the performance of the repository as a whole (waste buffer engineering disturbed zone host rock) and in particular its gas transport properties are still poorly understood Issues still to be adequately examined that relate to understanding basic processes include dilational versus visco-capillary flow mechanisms long-term integrity of seals in particular gas flow along contacts role of the EDZ as a conduit for preferential flow laboratory to field up-scaling Understanding gas generation and migration is thus vital in the quantitative assessment of repositories and is the focus of the research in this integrated multi-disciplinary project The FORGE project is a pan-European project with links to international radioactive waste management organizations regulators and academia specifically designed to tackle the key research issues associated with the generation and movement of repository gasses Of particular importance are the long-term performance of bentonite buffers plastic clays indurated mudrocks and crystalline formations Further experimental data are required to reduce uncertainty relating to the quantitative treatment of gas in performance assessment FORGE will address these issues through a series of laboratory and field-scale experiments including the development of new methods for up-scaling allowing the optimizationof concepts through detailed scenario analysis The FORGE partners are committed to training and CPD through a broad portfolio of training opportunities and initiatives which form a significant part of the project Further details on the FORGE project and its outcomes can be accessed at wwwFORGEprojectorg
Contact details
Author Till Popp Dirk Naumann amp Tobias FabigOrganisationTel (+49)34133600220 Fax (+49)34133600308email tillpoppifg-leipzigdeweb address httpwwwifg-leipzigdeAddress Institut fr Gebirgsmechanik GmbH
Friederikenstrae 6004279 LeipzigGermany
FORGE Report Dxxx ndash Ver0
ii
ForewordThis interims report summarizes the experimental work performed by IfG in WP33 ldquoGas transport through joints between buffer blocks and between host rockbufferrdquo Because gas will be created in a radioactive waste repository performance assessment requires quantification of the relevancy of various potential pathways Referring to the sealing plugs it is expected that in addition to the matrix properties of the sealing material conductive discrete interfaces inside the sealing elements itself and to the host rock may act not only as mechanical weakness planes but also as preferential gas pathways Our investigations are aiming on a comprehensive hydro-mechanical characterization of interfaces in bentonite buffers
AcknowledgementsThe studies presented in this report have been funded jointly by the European Commission under the Euratom Research and Training Program on Nuclear Energy within the SeventhFramework Programme (2007-2013) and the German Federal Ministry of Economics and Technology under contract 02 E 10659
ContentsFOREWORD II
ACKNOWLEDGEMENTS II
CONTENTS II
SUMMARY V
1 INTRODUCTION 6
11 IFG-WORK ndash ACTUAL STATE 712 MATERIAL DESCRIPTION 8
2 HYDRO-MECHANICAL CHARACTERISATION OF BENTONITE BRICKS 9
21 METHODOLOGY 10211 Strength testing 10212 Permeability testing 11213 Shear testing12
22 RESULTS 14221 Strength testing 14222 Gas permeability 16223 Shear strength (initial state) 18
3 GAS TRANSPORT PROPERTIES OF PARTIAL SATURATED BENTONITE23
31 PRE-SATURATION OF BENTONITE BRICKS WITH INTERFACES 23311 Lab test results25312 Comparison to the mock-up test Sondershausen25
32 GAS INJECTION TESTS ndash DETERMINATION OF GAS BREAKTHROUGH 2633 SHEAR STRENGTH (HEALED SPECIMENS) 29
4 CONCLUSIONS31
5 REFERENCES32
FORGE Report Dxxx ndash Ver0
iii
FIGURES
Figure 1-1 Scheme of fluid-transport through interfaces in a bentonite buffer consisting of bricks 6
Figure 1-2 Layout of the full scale drift sealing test Sondershausen (after SITZ et al 2001) 8
Figure 1-3 Wetro FS40 bricks 9
Figure 2-1 Loading geometry in direct shear test 12
Figure 2-2 The MTS ndash shear test system (model 816) available at the IfG (left) Schematic sketch of the MTS ndash test system (right) 13
Figure 2-3 Two-stage shear box for shear tests (Left) Schematic sketch with orientation of the specimen and the 25 mm opening between the two single boxes (Right) Prepared boxes with installed specimen The front panel with handle is for defined fixing of the shear boxes and will be removed before test start 13
Figure 2-4 Summary of triaxial test results on bentonite bricks in a confining pressure range between 1 and 20 MPa Note the well pronounced effect of increasing confining pressure resulting in a change from brittle to ductile behavior 15
Figure 2-5 Change from brittle to ductile deformation - Cracks patterns of deformed samples 15
Figure 2-6 MOHR-COULOMB-diagram of bentonite bricks 16
Figure 2-7 Sample arrangement for permeability testing a) matrix-permeability b) interface permeability 17
Figure 2-8 Permeability testing at hydrostatic loading Time-dependent course of the experiment with the different loading steps (up and down cycle) with the resulting compaction and gas permeability 17
Figure 2-9 Permeability testing at hydrostatic loading Gas permeability and volumetric strain vs confining pressure a) Bentonite brick matrix permeability b) Bentonite brick with artificial interface (saw cut) 18
Figure 2-10 Documentation of the interfaces of various test constellations a) View inside the open shear gap after the tests b) Scheme of the brickgranite arrangement 19
Figure 2-11 Multi-step shear test Bent-SV-MS1 (forward cycle) of the dry contact between two bentonite bricks The test was realized with σn = 05 1 2 4 and 6 MPa 19
Figure 2-12 Characterisation of the granite contact surface a) Histogram of the height distribution of the later shear surface b) sample dimensions c) schematics of the bentonite brickgranite aggregate prepared for shearing 20
Figure 2-13 Multi-step shear test BentGran-SV-MS1 (forward cycle) of the dry contact between bentonite brick granite surface The test was realized with σn = 05 1 and 2 MPa 21
FORGE Report Dxxx ndash Ver0
iv
Figure 2-14 Summary of shear tests on interfaces between bentonite brick bentonite brick respectively bentonite brick granite ndash MOHR-COULOMB-diagram 22
Figure 3-1 Principle of the new designed oedometer-cell for gas injection tests on bufferbuffer or bufferrock interfaces at defined bentonite swelling pressures 24
Figure 3-2 Pre-saturation of bentonite brick aggregates (left) ax = 2 MPa ndashcentral injection through a injection hole with radial fluid flow (middle) ax = 4 MPa ndash central injection through a injection hole with radial fluid flow (right) ax = zero ndash axial water injection with free swelling 24
Figure 3-3 Summary of the mock up test Sondershausen upper sketch the test design The picture below shows the humidity distribution inside the buffer (vertical profile along the dam axis) 26
Figure 3-4 Experimental setup for gas-breakthrough measurements under constant sample volume 27
Figure 3-5 Gas breakthrough test- axial stress and gas pressure respectively resulting gas flow vs time Ax ndashinit asymp 2 MPa 27
Figure 3-6 Gas breakthrough test- axial stress and gas pressure respectively resulting gas flow vs time Ax ndashinit asymp 4 MPa The inset shows the central filter plate ( = 9mm) which was installed to ensure no blockage of the fluid inflow to low-permeable bentonite matrix 28
Figure 3-7 Bentonite brickbrick aggregate ndash dismantled sample after controlled saturation by injecting water directly on the interface (compare injection filter plate in Figure 3-6) Note the sharp color contrast at the former interface (height of the sample 12 cm) 29
Figure 3-8 Single-step shear test on the healed contact between bentonite brick brick surface The test was realized with σn = 05MPa 30
Figure 3-8 Summary of both shear tests on ldquohealedrdquo interfaces between bentonite brick bentonite brick in comparison to the former results summarized in Figure 2-14 ndash MOHR-COULOMB-diagram 30
TABLES
Table 1-1 Material parameters of the reference material Wetro FS40 bentonite bricks (taken from SITZ et al 2001) 9
Table 2-1 Results from triaxial deformations tests ( = 2 10-5 1s) 14
Table 2-2 Shear test results 23
FORGE Report Dxxx ndash Ver0
v
SummaryThis report describes preliminary results obtained as part of IfG-work concerning the FORGE research program
Independently from the respective radioactive waste repository concept knowledge of gas transport properties through sealing or buffer materials is of vital importance for long-termperformance assessments because some gas generation may take place as a consequence of different processes (for instance corrosion of iron) In addition to the matrix properties of the sealing material it is expected that conductive discrete interfaces inside the sealing elements itself and to the host rock may act not only as mechanical weakness planes but also as preferential gas pathways For instance despite the self-sealing capacity of bentonite inherent existing interfaces may be reopened during gas injection However for interpretation resp numerical back analysis of field tests (ie FEBEX Lasgit) only limited experimental data from laboratory tests are available
The lab investigations are aiming (1) on hydro-mechanical properties of interfaces between bentonite bricks itself and (2) on mechanical contacts of bentonite blocks and concrete to various host rocks ie granite They consist of
long-term water injection tests in a new designed oedometer cell (duration of several month up to two years) with different sample constellations (brickbrick resp brickhost rock) under well controlled stress and swelling conditions to provide data about
o time dependent interface ldquopermeabilityrdquo changes (ie sealing) during long-termcompaction and fluid injection
o gas entry pressures and relative gas permeability changes during pressure dependent gas injection
shear tests to quantify mechanical interface properties under well controlled shear forces or displacements
As initial characterization (dry state) both triaxial and direct strength tests were performed which allow to separate between matrix and interface properties
Based on the experimental results the following conclusions can be drawn
At dry conditions gas flow along interfaces is at least 4 orders higher than through the matrix (eg 10-16 m2) Increase of confinement significantly lowers the gas flow (10 MPa more than one order) but the effect is more pronounced for interfaces crack sealing
Saturation of bentonite brick aggregates ie bricks with a common interface is not affected by the interfaces and only weakly by the acting confining pressure
During gas injection (stepwise increasing of the gas pressure) a significant effect is only observed if the minimal stress is passed resulting in some minor (local) gas flow
The gas break through results in stationary inflow but no significant effect on the total stress is measured probably due to the central (spherical) gas injection (no outflow)
The measured gas threshold pressures under constant volume conditions significantly exceed the sum of the swelling pressure and externally-applied porewater pressure ndashdrained conditions (pi gt ax some MPa)
Despite the former interface the bentonite block aggregate behaves like a homogenous matrix ie healing of the interface took place during saturation This favorable effectwas confirmed by shear tests demonstrating the development of cohesion
FORGE Report Dxxx ndash Ver0
6
1 IntroductionThe current report is a part of the activities in Work Package 3 (WP3) in the FORGE Project
The long-term safety of the disposal of nuclear waste is an important issue in all countries with a significant nuclear program Repositories for the disposal of high-level and long-lived radioactive waste generally rely on a multi-barrier system to isolate the waste from the biosphere The multi-barrier system typically comprises the natural geological barrier provided by the repository host rock and its surroundings and an engineered barrier system (EBS) ie the backfilling and sealing of shafts and galleries to block any preferential path for radioactive contaminants
This multi-barrier principle creates an overall robustness of the system that enhances confidence that the waste will be successfully contained However independently from the respective radioactive waste repository concept knowledge of gas transport properties through sealing or buffer materials is of vital importance for long-term performance assessments because some gas generation may take place as a consequence of different processes (for instance corrosion of iron)
Figure 1-1 Scheme of fluid-transport through interfaces in a bentonite buffer consisting of bricks
In the last two decades reliable information about the potential host rocks and the sealing materials (eg bentonite mixtures concrete rock backfill) has been obtained (for recentreviews see METCALF et al 2009 and NORRIS 2009) However only limited knowledge exists about the importance of contacts or interfaces between these different materials or construction parts ie seal plugs eg POPP (2009) As schematically shown in Figure 1-1 it is expected that in addition to the matrix properties of the sealing material conductive discreteinterfaces inside the sealing elements itself and to the host rock may act not only as mechanical weakness planes but also as preferential gas pathways For instance despite the self sealing
FORGE Report Dxxx ndash Ver0
7
capacity of bentonite inherent existing interfaces may be reopened during gas injectionMoreover it has been shown by BUZZI et al (2006) that bentonite is very sensitive to hydraulic erosion producing flow channels within the interface zone
But for interpretation of the relevancy of such phenomena resp numerical back analysis of field tests (ie FEBEX Lasgit) only limited experimental data from laboratory tests are availableTherefore it can be stated that further laboratory test results are important to deduce the hydro-mechanical (HM) parameters for numerical calculations evaluating the long-termintegrity of EBS especially bentonite bearing buffer systems
In the literature a variety of different possible bentonite mixtures or clay minerals has been projected as backfill material in the nuclear waste context Pure bentonite has been rarely proposed for the engineered barrier due to technical reasons eg low mechanical strength of the blocks or aggregates limitation of swelling pressure Therefore pre-fabricated bentonite blocks are an option where usually some aggregates (eg sand or crushed rock) are added to the bentonite in order to enhance its mechanical properties In the past several in situ tests have demonstrated that bentonite buffer or sealing plugs may be built as masonry of different bricks or as a monolith system consisting of large blocks
In the framework of WP3 IfG performed lab investigations aiming (1) on interfaces between bentonite bricks itself and (2) on mechanical contacts of bentonite blocks and concrete to various host rocks ie granite
11 IFG-WORK ndash ACTUAL STATEThe main objectives of the laboratory work of IfG are twofold
1 to investigate gas transport properties of interfaces between bentonite blocks The sub-items are
a to perform long-term laboratory tests (duration of several month up to two years) on artificial contact interfaces between sealing material bricks (ie bentonite) and to the host rock under well controlled stress and swelling conditions with water injection resp subsequent gas injection
b to provide data for time dependent interface ldquopermeabilityrdquo changes (ie sealing) during long-term compaction and fluid injection
c to provide data about gas entry pressures and relative gas permeability changes during pressure dependent gas injection
2 to provide experimental data from short term tests in a direct shear apparatus with measuring of gas transport and mechanical contact properties for the various interface configurations undergoing shear deformation at defined normal stresses1
The actual report describes results of the hydro-mechanical pre-characterization of bentonite bricks supplemented by shear tests between brick interfaces and to the host rock (granite) and preliminary results of gas injection tests on partially flooded bentonite sample constellations
1 The ldquoshear failurerdquo of a sealing plug due to fluid pressurisation or swelling phenomena is governed by hydro-mechanical characteristics of the confined plug host rock interface If shear slip occurs on a critically stressed interface it can raise the permeability of the fracture through several mechanisms including brecciation surface roughness and breakdown of seals (BARTON et al 1995) However increased pore pressures acting in the interface may also lower the acting minimal stress thus initiating the shear failure
FORGE Report Dxxx ndash Ver0
8
12 MATERIAL DESCRIPTIONWe used as reference material artificial bentonite bricks consisting of a sand clay-bentonite mixture but the variety of bentonite-based buffer materials has to be taken in mind The bricks were manufactured in the frame work of the so-called dam - project ldquoSondershausenrdquo ie a German research project between 1997 and 2002 funded by BMBF2 and TMLNU3
The underground test was performed as a demonstration experiment of a multi-component drift barrier system in a salt repository (details are given by SITZ et al 2001) The sealing element consists of the already mentioned bentonite bricks which were hydraulically tested by pressurization through pressure chamber 1 (Figure 1-2) A static abutment was constructed consisting of a salt brick masonry in a prismatoid shaped extension of the drift The completesystem was installed and tested in the salt mine Sondershausen Afterwards the dam was rebuilt4
Figure 1-2 Layout of the full scale drift sealing test Sondershausen (after SITZ et al 2001)
2 BMBF Bundesministerium fr Bildung und Forschung 3 TMLNU Thringer Ministerium fr Landwirtschaft Naturschutz und Umwelt4 In the test phase of several months the dam was loaded with a brine fluid pressure up to 8 MPa However as later found due to leakage through the so called floor-channel (central leading through the building for cables and pressure tubes) and fluid flow around the sealing system the salt bricks were partially flooded with brine which induces a spontaneous loss of strength resulting in a movement of the sealing element for more than 15 cm After finishing the pressure tests the dam has been completely rebuild to provide access to the various elements and to the contact zone between dam and the surrounding rock salt By that means it was possible to take samples of the partially flooded bentonite to measure its humidity content
Although the humidity distribution in the sealing elements indicated that partial flooding through the contact zone took place only weak indications for erosion phenomena in the contact zone between dam and the salt contour were observed but local fluid leakage points were attributed to movements of brine through the EDZ However the obtained swelling pressure in the sealing elements was not high enough to closure these pathways
FORGE Report Dxxx ndash Ver0
9
An important topic of the project was the development of appropriate pre-compacted bentonite bricks composed of bentonite (Calcigel5) and sand which should act as the long-term sealing element supposed to NaCl-brine Evaluating a suite of varies composition ratiosbetween both constituents finally the so-called Wetro FS40 bentonite bricks were selected for the test
The manufactured bentonite bricks (at least 140t material) were industrially produced by the company ldquoFeuerfestwerke Wetrordquo with a size of 25cm x 125cm x 625cm applying compressive stresses in the order of 40 ndash 50 MPa The relevant material properties of the bricks aresummarized in Table 1-1
Table 1-1 Material parameters of the reference material Wetro FS40 bentonite bricks (taken from Sitz et al 2001)
Composition ca 60 bentonite (Calcigel) + 40 quartz-sand
Water-content () 7505 Compressed density (gcm3) 227001 Bentonite dry density (gcm3) 189002 Initial saturation (-) 077004 Hydraulic conductivity with NaCl-brine (ms) ca 10-12
Swelling pressure (MPa) - NaCl 35
Figure 1-3 Wetro FS40 bricks
After producing the bricks the bricks were sealed with plastic wrap and stored at ambient conditions on pallets For our lab tests cylindrical samples were prepared in specified dimensions for carrying out the laboratory tests using a lathe
2 Hydro-mechanical characterization of bentonite bricksFor a performance assessment of the long-term sealing or buffer system build up by bentonite bricks knowledge of the hydro-mechanical properties eg permeability and strength are of urgent need not only for dimensioning a drift sealing plug but also for a prognoses of property changes which may occur in the long-term after closure of the repository eg due to rock convergence or water inflow However because artificial interfaces between the various elements and to the host rocks exist also the contact properties between these bricks and between the bricks and host rock ie granite have to be determined
The investigations are aiming on the characterization of
Matrix properties ieo Compressive strengtho Gas permeability (dry state)
5 CALCIGEL is a natural Calcium bentonite produced from selected Bavarian bentonite deposits The material has the following mineralogical composition Montmorillonite 60 ndash 70 Quartz 6 ndash 9 Feldspar 1 ndash 4 Kaolinite 1 ndash2 Mica 1 ndash 6 and other minerals 5 ndash 10 (source httpwwws-cppcom)
FORGE Report Dxxx ndash Ver0
10
Interface properties ie
o Shear strength between blocks and to the rock contouro Gas permeability ie block aggregates with interfaces
21 METHODOLOGY
211 Strength testingThe strength and permeability measurements were performed in a standard Karman-cell (KRMN 1911) in the servo-hydraulic testing machine (RBA 2500 SCHENKTREBEL Germany ndashusing the MTS-TestStar software) allowing independent control of the radial (2 = 3 = pc) and axial stresses (Ax = 1) The cylindrical samples are sealed with rubber tubes and oil is used as confining medium Outside the vessel three LVDT transducers are mounted between the piston and the load frame near the sample for the measurement of the axial strain The axial load is determined from an external load cell
Figure 2-1 The servohydraulic testing machine RBA 2500 (a) and the scheme of the pressure vessel (b)
Axial deformation experiments (Δh resp the deformation ε1 = Δh h0) in compression or extension mode can be performed at various confining pressures (pc up to 100 MPa) and at temperatures up to 100C within a deformation rate range of 1 = 10-5 ndash 10-7 1s to chosen values of ε1 As a standard technique during the experiments the sample volume changes ΔV are determined by a volume balance of the mantle oil volume changes as measured via the pressure intensifier and the axial piston displacement in the cell
PIPIPP ASAhV (2-1)
FORGE Report Dxxx ndash Ver0
11
with ΔSPI = displacement of the cylinder within the pressure intensifierAPI = cross section of the piston within the pressure intensifierΔh = displacement of the piston of the triaxial cellAPP = cross section of the piston of the triaxial cell
0V V
V (2-2)
In calculation of the stress difference (σ1 ndash σ3) deformation-induced variation of the cross section of the specimen is considered
The leakage-freeness of the oil volume measurement equipment is tested before beginning of each measuring cycle over a waiting period of ca 1 hour However the accuracy of the volume measurement depends on the constancy of the oil temperature within the triaxial cell and within the pressure intensifier
212 Permeability testingAs shown in the schematic drawing of the triaxial pressure cell (depicted in Figure 2-1) permeability can be measured parallel to the sample cylinder axis (dimensions ca 90 mm in diameter and 180 mm long) To maintain access of the gas to the sample either a central hole exists in the plates whereby the specimens additionally will be prepared with small boreholes on their axial ends to minimize end effects during straining or filter plates are used to provide flow over the whole cross section of the sample
Figure 2-2 Flow-meter used for permeability testing
Gas-permeability is measured using nitrogen with an equipment similar to that described by PEACH amp SPIERS (1996) allowing both transient and stationary permeability measurements
Two methods are used to determine the gas flow (q) through the samples To perform the permeability measurement the primary gas pressure p1 is applied Its value depends on the test specimenrsquos permeability and on the measurement range of the gas flow-meter (0 - 10 resp 0 -500 cmmin manufacturer BRONKHORST Model F-230M)
Alternatively using a defined gas volume on the in- (V1) and outlet (V2) and measuring the
pressure increase Δp2 resp t
pp 22
is verified to determine 222 pVV whereby 2Vˆq
FORGE Report Dxxx ndash Ver0
12
At a given injection pressure gas enters into the assumed relatively large pores and displaces the pore water This process is regarded as two-phase flow After reaching a stationary flow through the specimen the amount of gas flow over a defined period of time is recorded (q)
The intrinsic permeability is calculated by the modified DARCYrsquos law for compressive media
)pp(pq
Alk L
22
21
2
(2-3)
with η = dynamical viscosityl = (h ndash t) = effective length of the flow path through the sampleh = height of the sampleA = cross section of the samplepL = pressure at gas flow measurementt = sum of the length of both holes in the samplep1 = injection pressurep2 = outlet pressure
The absence of leakage of the permeability equipment is tested before each measuring cycle using a steal sample over a waiting period of around 1 hour
213 Shear testingGeomechanical discontinuities between various buffer elements and to the host rock are probably the clearest example of existing interfaces acting as mechanical weakness zone or preferred pathways For the mechanical behavior of interfaces the relevant variables are stress traction vector with one normal component and one tangential in a simple 2-dimensional stress field (or two tangential in 3D) and the conjugate strain variables are the corresponding relative displacements (Figure 2-1) However such stress conditions can be only realized in direct shear tests which are therefore of urgent need to reproduce slip between various materials
In the past several companies have developed modern state-of-art testing equipment which allows new types of testing procedures to determine the mechanical parameters of joints and intact rock High-response servo-hydraulic systems with digital control technology strain measurement equipment mounted onto the specimen and programmable control modes enable new types of test procedures to be performed which are tailored to the specific problem eg BLUEMEL (2000) BLUEMEL amp POETSCH (2003) For realization of required shear tests a modern shear test system is available at the IfG (Figure 2-2)
Figure 2-1 Loading geometry in direct shear test
FORGE Report Dxxx ndash Ver0
13
The loading frame consists of a two-axle experimental setup with vertical and horizontal stress initiation a platform for shear test with a two-stage shear box and a servo-hydraulic control unit for two channels (vertical and horizontal) Both can be managed force or displacement controlled The test arrangement is shown in Figure 2-2 The frontal part (right) is an extremely stiff four-columned housing for fixing and vertical loading of the two-stage shear box by the upper hydraulic cylinder (up to 500 kN axial load)
Figure 2-2 The MTS ndash shear test system (model 816) available at the IfG (left) Schematic sketch of the MTS ndash test system (right)
Figure 2-3 Two-stage shear box for shear tests (Left) Schematic sketch with orientation of the specimen and the 25 mm opening between the two single boxes (Right) Prepared boxes with installed specimen The front panel with handle is for defined fixing of the shear boxes and will be removed before test start
A robust desk with a horizontal cylinder (-250 kN pressure - 160kN tension) is laterally positioned in a horizontal housing This cylinder supplies the lateral shear force The upper shear box is fixed by a horizontal housing that enables yet a twisting of approx 2 around the horizontal axes referring to the shear midpoint While a vertical load acts to the whole shear box the lower box can be horizontally displaced under weight The box is lead with less friction by mechanically high quality linear guides
The displacement of the boxes to each other under load is measured and recorded by 4 displacement transducers on the edges of the box (for vertical displacement) and by 2 additional position encoders (for horizontal displacement) Thereby a possible twisting is measured as well
FORGE Report Dxxx ndash Ver0
14
A sufficiently stiff fixing of the specimens in the shear box is a prerequisite for an exact determination of shear resistance (Figure 2-3) Therefore as the first step for investigation of the shear strength of bentonite bentonite or bentonitegranite interfaces two cut in half bricks (125 cm x 125 cm) were stacked one on the top of the other (respectively one half brick on a rough granite surface) The aggregate was covered with a plastic foil to protect them against wetting by the wet concrete that fixes the samples in the shear boxes So the contact planes between the two bricks are exactly perpendicular to the shear direction in the center of the shear box with 25 cm opening (Figure 2-10)
Samples for the second test row (brickgranite interface) were similarly prepared Instead of two bentonite bricks (or bentonite brick halves) a bentonite brick was arranged on a rough contact plane of a host rock block (ie medium-grained grained granite with an artificial fracture surface) Between both blocks was a loose horizontal contact Further preparations were done like mentioned above
22 RESULTS
221 Strength testingIn order to investigate the effect of deviatoric loading on the hydro-mechnical integrity we performed five compression tests The applied confining pressures varied between 10 and 200 MPa After hydrostatic compaction ndash pre-loading at the respective stress state ndash the samples were deformed in triaxial compression (1 gt 2 = 3) with a constant strain rate of 25 ∙ 10-5 1s
For comparison the obtained stress strain curves and the respective evolution of volumetric strain (ie dilatancy) are compared in Figure 2-4 The resulting peak strength (failure) and minimum dilatancy values (onset of dilatancy) are summarized in Table 2-1
As general starting from hydrostatical conditions the deviatoric stress increases to ensure constant rate deformation Generally the slope of the stress-strain curve of all samples exhibits the characteristic transition from initial quasi-elastic (linear) behavior to a curve with relatively large radius indicating typical strain hardening until failure at strains The stress-strain curves depicted in Figure 2-4 nicely demonstrate the effect of increasing pressure resulting in higher strength and deformability
Table 2-1 Results from triaxial deformations tests ( = 2 10-5 1s)
sample pc 1 - fail Diff-failure 1-failure (VV) 1 - min w(MPa) () (MPa) (MPa) () () (wt-)
20611 10 157 868 97 -015 032 44
20608 25 134 1313 156 -010 031 59
20607 50 343 1432 193 -035 316 54
20612 100 715 2110 311 -146 1068 48
20620 200 1150 3101 510 -413 1886 48
As evident from the experiments the deformation style changes from brittle to quasi ductile behavior with increasing confining pressure as indicated by increasing failure strains and different post failure behavior One can see a change from a sharp stress-strain curve with a significant lower post-failure stage to a more or less broad plateau without a significant failure peak
FORGE Report Dxxx ndash Ver0
15
Most important dilatant deformations occur only in a low peripheral pressure range (3 5 MPa) At higher pressures (3 10 MPa) brittle deformation is suppressed resulting in a significant compaction of several percent The change of deformation behavior is also documented in the evolution of dilatancy Whereas at low confinement dilatancy onsets significantly before the failure at low strain is dilatancy at confining pressures higher than 5 MPa suppressed and compaction dominates during the whole deformation cycle
Figure 2-4 Summary of triaxial test results on bentonite bricks in a confining pressure range between 1 and 20 MPa Note the well pronounced effect of increasing confining pressureresulting in a change from brittle to ductile behavior
Figure 2-5 Change from brittle to ductile deformation - Cracks patterns of deformed samples
The visual inspection of deformed specimens after the experiment the deformation style of the specimens demonstrates the change of deformation style from brittle to ductile At lower
FORGE Report Dxxx ndash Ver0
16
confining pressures as can be seen from Figure 2-5 a complex shear failure signature occurred whereas at 3 gt 5 MPa compressive failure dominates
For evaluating the strength behavior all test results (standard TC-tests) are graphical depicted inFigure 2-6 Despite the scattering of the strength values it can be easily seen that the general trend of increasing strength with increasing minimal stress is nicely represented by a linear strength boundary according to the MOHR-COULOMB-criterion with the respective values of
ndash friction angle () 22c ndash cohesion (MPa) 28
It has to be mentioned that the friction angle of 22 corresponds fairly well to the results of the shear tests on interfaces between bentonite bricks but without cohesion (see chapter 223)
Figure 2-6 MOHR-COULOMB-diagram of bentonite bricks
Extrapolation of the obtained straight line to a confining pressure zero delivers a value of ca 9 MPa Based on a larger number of samples the average strength of the bentonite bricks was determined in the order of 55 to 65 MPa (SITZ et al 2001) This indicates some non-linearity to unconfined conditions demonstrating the need of triaxial tests for evaluation of the strength behavior of bentonite bricks
222 Gas permeabilityAs a prerequisite for evaluation of the later saturation tests the gas permeability of the bentonite bricks was determined using different sample arrangements As depicted in Figure 2-7 two different sample arrangements were used to realize axial gas-injection tests both on the intact matrix and also on an artificial interface between two bentonite bricks
Both samples were stepwise hydrostatically loaded (up and down cycle) with continuous gas injection which facilitates permeability determination by measuring the gas flow Exemplarily
FORGE Report Dxxx ndash Ver0
17
Figure 2-8 shows the time dependent change of gas permeability through the intact bentonite brick matrix according the different loading and un-loading steps Starting from an initial gas-permeability of ca 2 ∙ 10-16 m2 the permeability decreases with increasing the applied confining stress Increase of the confining pressure up to 3 = 9 MPa results in a decrease of permeability for more than one order of magnitude At constant confining pressure permeability decreases with time indicating visco-elastic matrix-compaction The time- and stress-dependent compaction effect is at least partial reversible if the confinement is reduced ie irreversible compaction becomes visible But close inspection of pressure-dependent change of permeability as depicted in Figure 2-9 indicates that during the unloading cycle phyd lt 2 MPa the permeability increases significant which may indicate inelastic crack opening during stress release
Figure 2-7 Sample arrangement for permeability testing a) matrix-permeability b) interface permeability
Figure 2-8 Permeability testing at hydrostatic loading Time-dependent course of the experiment with the different loading steps (up and down cycle) with the resulting compactionand gas permeability
Figure 2-9 compares the results measured on the two different sample arrangements ie (left) intact matrix and (right) matrix with an artificial interface (saw cut) It becomes obvious that the
FORGE Report Dxxx ndash Ver0
18
ldquointegralrdquo permeability of the bentonite aggregate with an artificial interface is initially four orders of magnitude higher than the intact matrix ie ko-interface asymp 10-12 m2 Increase of confining pressure up to 10 MPa lowers the permeability for more than 2 orders whereas unloading of the sample results in a significant hysteresis This is clearly indicates crack sealing
Figure 2-9 Permeability testing at hydrostatic loading Gas permeability and volumetric strain vs confining pressure a) Bentonite brick matrix permeability b) Bentonite brick with artificial interface (saw cut)
223 Shear strength (initial state)
The shear testing program consists of the following sample configurations and test number(1) Bentonite brick bentonite brick
a Dry (delivery state) 2 multi-step shear testsb Wetted surface (only just before the test) 1 multi-step shear testsc Healed interface between bentonite bricks
after pre-saturation over one year 2 single-step shear tests(2) Bentonite brick rough granite surface (dry) 4 single-step shear tests
1 multi-step shear tests
Principally the test realization comprises two phases ie pre-consolidation followed by the original shear phase which can be divided in several steps at various normal stresses The test results are typically represented by a peak strength and a residual strength value after loss of cohesion between the shear interfaces
FORGE Report Dxxx ndash Ver0
19
Figure 2-10 Documentation of the interfaces of various test constellations a) View inside the open shear gap after the tests b) Scheme of the brickgranite arrangement
2231 SHEAR TESTS ON DRY BENTONITE BRICK INTERFACES
First of all the shear strength of the dry interfaces between two bentonite bricks was determined in two multiple-step shear tests each with 4 steps at normal stresses n = 05 10 2 and 4 MPa6 During the tests the lower shear box was controlled displaced forward (resp backwards) with a shear rate of 0002 mms
Figure 2-11 Multi-step shear test Bent-SV-MS1 (forward cycle) of the dry contact between two bentonite bricks The test was realized with σn = 05 1 2 4 and 6 MPa
6 To avoid brick failure the maximum normal load was set generally smaller than the average uniaxial strength
FORGE Report Dxxx ndash Ver0
20
The results of a selected shear test (Bent-SV-MS1) are shown as a variation of shear stress and dilatancy vs shear displacement (increasing load cycle) in Figure 2-11 Pre-loading of the sample to the respective normal stress results in some small compaction which developsfurther during the following shear cycles During the various shear steps contrary to experiences from tests on compact material or natural interfaces no stress peak occurs but a more or less constant shear strength level is apparent At higher normal stress states the shear stresses increase as well Concomitantly with the increase of normal stress the variation of dilatancy (always decrease) documents progressive compaction of the bentonite brick aggregate (eg the total compaction ndash during the whole test at n = 1 MPa - is ca 1mm)
The strength and dilatancy behavior does not depend on the course of loading ie if the vertical load steps are varied as upwards or downwards cycle
2232 SHEAR TESTS ON BENTONITE BRICK GRANITE INTERFACES
As a reference material for shear tests on interfaces between bentonite and granite we selected an artificial fractured cuboid of granite (20cm x 15cm x 75cm) of unknown origin The roughness of the artificial split surface was measured using a 3D surface and body scanner at the University of Freiberg (Prof KONIETZKY) The maximum scanner resolution is in the order of 2m As can be seen from Figure 2-12 the mean difference between highest and lowest asperity is in the order of 15 cm
Figure 2-12 Characterization of the granite contact surface a) Histogram of the height distribution of the later shear surface b) Sample dimensions c) Scheme of the bentonite brickgranite aggregate prepared for shearing
Overall one multiple-step shear test and four single-shear tests of bentonite brick granite samples were performed The sample arrangement is qualitatively the same as before
FORGE Report Dxxx ndash Ver0
21
Principally the test realization comprises two steps pre-loading to the respective normal stress state followed by the shear phase
Remarkably despite the existing asperities the initial compaction is only in the order of some few millimeters (depending on the stress level) which indicate that the interface ie the gap between the flat bentonite brick and the asperities is only partially closed during loading This results from the high uniaxial strength of the bentonite bricks
Exemplarily the results of the multi-step shear test are shown in Figure 2-13 which was performed with three steps at n = 05 10 and 20 MPa with displacement rates of 0002 mms Qualitatively the results are comparably to the results of the tests reported in the chapter before Surprisingly also no significant shear peak is observed but post inspection of the sheared planes indicates that local sliding of spikes with linear erosion dominates during shearing Although no significant compaction and local shear failure occurred the shearing along the rough surface requires local overcoming of the existing cohesion
Figure 2-13 Multi-step shear test BentGran-SV-MS1 (forward cycle) of the dry contact between bentonite brick granite surface The test was realized with σn = 05 1 and 2 MPa
2233 SUMMARY HYDRO-MECHANICAL PROPERTIES ndash DRY STATE
The results of the various shear tests were compiled in Table 2-2 and graphical depicted in Figure 2-14
Analog to the strength properties of an intact rock the MOHR-COLOUMB criterion can be used to describe the discontinuity plane characteristics of a jointed rock Accordingly the shear resistance on an interface at critical stress conditions (shear failure) can be expressed stress-depended by a linear dependency of cohesion (c) and angle of friction ()
τf = c + σf tan φ
FORGE Report Dxxx ndash Ver0
22
According to the different material groups two linear trends of results are clearly visible Whereas bentonitebentonite interfaces show no cohesion but significant friction obviously due to the sand content demonstrate shear tests for bentonite bricksgranite a small but significant occurrence of cohesion which was already indicated by post-evaluation of sheared interfaces The tips of the existing roughness of the granite surface are pressed into the bentonite material resulting in local erosion channels
The respective MOHR-COULOMB-parameters are as follows
τ = C + σN tanφ MOHR-COULOMBC φ
brick brick 002 210brick granite 019 196
(MPa) ()
In summary despite the small difference between both interface types comparison with Figure 2-6 demonstrate the importance of artificial interfaces between bentonite bricks as potential weakness planes
Figure 2-14 Summary of shear tests on interfaces between bentonite brick bentonite brick respectively bentonite brick granite ndash MOHR-COULOMB-diagram
FORGE Report Dxxx ndash Ver0
23
Table 2-2 Shear test results
shear strain n dilatancy time
(mm) (MPa) (MPa) (mm) (min)
bentonite brick bentonite brick
057 050 023 -040 503
383 050 021 -046 3215
782 100 038 -075 6548
1186 200 073 -120 9932
1575 400 140 -199 13208
1220 075 033 -017 2492
839 150 064 -033 5682
429 300 123 -068 9123
042 600 240 -170 12397
bentonite brick granite surface
987 200 094 -540 9120
457 400 160 -354 23913
982 100 053 -362 9120bentonite brick granite surface (wetted)
985 100 029 456 10403
3 Gas transport properties of partial saturated bentonite
31 PRE-SATURATION OF BENTONITE BRICKS WITH INTERFACESFor pre-saturation of the samples respectively for the later gas injection tests a new oedometer-like pressure cell is constructed allowing in additions gas flow measurements under defined axial sample consolidation respectively swelling conditions due to different injected water amounts
The sample arrangement consists of a stiff tube ndash oedometer ndash with two sample cylinders of pre-compacted bentonite (respectively one rock sample with a natural rough surface) which are separated by an axial interface inside Two movable pistons equipped with sinter metal plates allow control of volume changes of the sample ie compaction due to a defined axial load or expansion induced by swelling due to water injection Resulting changes in volume or axial force are measured with dial gauges or an axial oriented load cell
As can be seen from Figure 3-1 the cell design facilitates measurements of fluid transport properties through the buffer respectively along the interface between block contacts ie bufferbuffer and bufferblock at defined interface conditions The cell diameter is 90 mm and the overall sample height is ca 120 mm (consisting of two cylindrical specimens ndash 60 mm height) Sinter metal plates ensure access to the axial ends of the sample
FORGE Report Dxxx ndash Ver0
24
The special design of the cell allows fluid injection (1) along the axial direction ie for pre-saturation of the bentonite to induce swelling or measurement of the matrix permeability and (2) through a central hole along the interface ie investigation of contact permeability
pGAs - Inlet
pGas - Outlet
pH2O - Inlet
pH2O - Outlet
FaxLoad cell
Figure 3-1 Principle of the new designed oedometer-cell for gas injection tests on bufferbuffer or bufferrock interfaces at defined bentonite swelling pressures
0 100 200 300
Time (d)0 100 200 300
Time (d)
00
10
20
30
40
50
60
70
80
90
100
0 100 200 300
Time (d)
Axia
l stre
ss (M
Pa)
Inje
cted
wat
er (w
t-
)Vo
lum
etric
sw
ellin
g (
)
I I
ax
water
Vol
ax
water
Volax
water
Vol
Figure 3-2 Pre-saturation of bentonite brick aggregates (left) ax = 2 MPa ndash central injection through a injection hole with radial fluid flow (middle) ax = 4 MPa ndash central injection through a injection hole with radial fluid flow (right) ax = zero ndash axial water injection with free swelling
FORGE Report Dxxx ndash Ver0
25
311 Lab test resultsThree long-term injection tests (pi = 04 MPa) were started in Spring 2010 whereby three different situations were realized
(1) central water injection through an injection hole through a central tube resulting (as proposed) in radial fluid flow along the brick interface
a ax = 4 MPa
b ax = 2 MPa
(2) axial water injection (without axial load) through the end plates (sintered metal) resulting in free axial swelling
The various curves of water consumption and the resulting swelling are summarized in Figure 3-2 The results can be summarized as follows
(1) The water consumption during swelling depends
a obviously not on the injection geometry
b and only weakly on the axial load
No preferred flow along the interface ie matrix swelling
(2) More than 1 year water injection was not sufficient to reach full saturation ie no water out flow but in the center full saturation is assumed Therefore after one year water injection the tests 1a and 1b were finished to facilitate gas injection tests
312 Comparison to the mock-up test SondershausenDespite the different scales of lab and field tests and the limited number of tests the results correspond very well to existing experiences made from in situ tests where sealing elements are constructed of different blocks or bricks Figure 3-3 illustrates the observations made during testing the sealing element of the mock up test Sondershausen (see short description in chapter 12) The sealing element consists of masonry of bentonite bricks (FS 50) which was tested with NaCl-fluid at a maximum fluid pressure of pfl asymp 8 MPa (pswellasymp 1 MPa) (for details see SITZ 2001)
The following conclusions were drawn from the in situ test (evaluation of the humidity distribution after rebuilding the plug)
1Proof of clear saturation front during fluid pressurization
2Homogenous humidity distribution inside the partially saturated buffer
Low effect of artificial interfaces inside the buffer
3Clear pathways in the contact zone buffer host rock (salt)
Interfaces to the host rock are obviously the most relevant pathways
These observations correspond to the results of the laboratory tests therefore demonstrating that interfaces inside the sealing plug are of minor importance because due to the overall swelling effect they will be efficiently sealed
FORGE Report Dxxx ndash Ver0
26
Figure 3-3 Summary of the mock-up test Sondershausen Upper sketch the test design The picture below shows the humidity distribution inside the buffer (vertical profile along the dam axis)
32 GAS INJECTION TESTS ndash DETERMINATION OF GAS BREAKTHROUGHFor the gas-injection tests we used a constant volume radial flow geometry realized in the experimental setup depicted in Figure 3-4
Gas flow measurements under constant volume conditions
A servo-controlled load frame (up to 250kN load capacity) ensures defined loading respectively volume conditions The axial strain (measured between the load plates) is kept constant during the test (resolution 1 m) ie if the sample volume increases due to gas-injection the axial force is automatically increased During the test the change of the axial stress is measured via a load cell
Gas injection at constant injection pressure on the at least partial saturated bentonite sample with a radial flow geometry
After finishing the saturation instead of water gas was injected through the central pipeof the swelling cell which should result in radial flow if preferred flow along the former interface occurs During the test the samples is drained in the axial direction ie through the axial filter plates
During stepwise increase of the primary gas pressure the inflow of gas is measured with a flow-meter ie during each pressure step firstly the dead volume before the gas access to the sample is pressurized which results in an inflow-peak If gas pressureequilibrium before and after the flow-meter is reached and the sample behaves nearly gastight the apparent flow rate becomes zero Gas break through ie overcome of the
FORGE Report Dxxx ndash Ver0
27
capillary entry pressure is indicated by quasi-constant gas-in-flow or gas-outflow (ie bubbles in a burette)
Two gas breakthrough tests were performed at initial axial pressures of 2 respectively 4 MPa The results are summarized in Figure 3-5 respectively Figure 3-6
Figure 3-4 Experimental setup for gas-breakthrough measurements under constant sample volume
Figure 3-5 Gas breakthrough test ndash axial stress and gas pressure respectively resulting gas flow vs time Ax ndashinit asymp 2 MPa
FORGE Report Dxxx ndash Ver0
28
After finishing the pre-saturation of the bentonite the samples were axially unloaded and the cells were put into the servo-hydraulic load frame Before the tests a waiting period of ca 1 day (at the nominal axial stress) was usually applied to ensure equilibrium inside the sampleExemplarily Figure 3-5 shows the stability of the axially applied strain control which is in the order of 1 m However this results in a variation of the axial stress of 02 MPa
Then the gas pressure was stepwise increased each with a waiting period of ca 05 hour The change of the gas pressure is always followed by peak of gas-inflow as explained before but becomes zero If a gas pressure state some few bars below the axial stress is reached the gas pressure was kept constant over a period of 12 to 15 hours to exclude time effects of a gas breakthrough ie delay to slow water expulsion Despite some scattering no significant gas in- or outflow was observed
In the next phase the stepwise pressurization was continued If the gas-pressure reaches the acting axial stress ie Ax ndashinit = min some local gas flow becomes apparent but with some instability Further pressure increase did not change the gas flow significant until the breakthrough occurred
1st test Ax ndashinit = min asymp 2 MPa 27 ndash 29 MPa ie 07 ndash 09 MPa higher than min
2nd test Ax ndashinit = min asymp 4 MPa 75 MPa ie 35 MPa higher than min
The tests clearly demonstrate that the gas-entry pressures are significantly higher than min In addition no effect of the interface ie preferred radial gas flow is visible In a first approach the bentonite brick aggregate seems to behave like a homogenous buffer material For further discussion see the next chapter
Figure 3-6 Gas breakthrough test- axial stress and gas pressure respectively resulting gas flow vs time Ax ndashinit asymp 4 MPa The inset shows the central filter plate ( = 9mm) which was installed to ensure no blockage of the fluid inflow to low-permeable bentonite matrix
FORGE Report Dxxx ndash Ver0
29
33 SHEAR STRENGTH (HEALED SPECIMENS)The gas injection tests results delivered very high gas entry pressures which succeeded the minimal stress which has been axially applied by about several MPa (depending on the order of stress) A possible explanation could be that due to the central gas injection locally a high water pressure is generated The local pore fluid pressure may be temporarily preserved during the fast pressurization with gas due to the low permeability of the matrix although the system is drained by the axial filter plates However it becomes obvious that the effect of the former interface as a potential pathway does not exist anymore This may indicate that the interface is healed during the time-dependent swelling process
Healing means the development of cohesion ie which results in bentonite from electrostatic forces among fine particles (clay minerals) and water Shear tests represent a simple way to quantify the amount of cohesion as already demonstrated before Here we used the bentonite brick aggregates after dismantling the sample Visual inspection of the former interface give no hints for a mechanical or hydraulical weakness plane ie only the color contrast indicates the former contact plane
Figure 3-7 Bentonite brickbrick aggregate ndash dismantled sample after controlled saturation by injecting water directly on the interface (compare injection filter plate in Figure 3-6) Note the sharp color contrast at the former interface (total height of the sample 12 cm)
To demonstrate that real healing took place we performed with both specimens direct shear tests on the former interface between both bentonite brick halves The procedure is the same as described in 213
FORGE Report Dxxx ndash Ver0
30
Figure 3-8 Single-step shear test on the healed contact between bentonite brick brick surface The test was realized with σn = 05 MPa
Figure 3-9 Summary of both shear tests on ldquohealedrdquo interfaces between bentonite brick bentonite brick in comparison to the former results summarized in Figure 2-14 ndash MOHR-COULOMB-diagram
FORGE Report Dxxx ndash Ver0
31
The results differ significantly from the shear tests performed on the dry or only short wetted contact planes The following results are obtained from Figure 3-8
bull Shear test curves
Exemplarily the results of the shear test performed at n = 05 MPa are shown As usual for intact material shear stress grows with progressive shear displacement in elastic manner up to a peak and then drops down to a residual value Peak and residual values are higher with applied normal stress Repeating the experiment with the 2nd sample at n = 15 MPa (not shown here) results in a similar shape of the strength curve but the increase of strength is not so significant indicating that the influence of the acting normal stress is low ie the friction angle is only small
bull Dilatancy curves
Due to the surface roughness and asperities a bedding plane tends to dilate upon shear although this effect tends to level off after certain amount of prescribed shear displacement and is lower for higher normal stress (not shown here)
For comparison with earlier measurements on dry interfaces shear stress peaks and residual values of shear stress obtained in both single experiments are represented in Figure 3-9 against normal stress leading to open envelopes of the Coulomb type The evaluation of these tests with σn = 05 resp 15 MPa documents a cohesion of 06 MPa in the τ-σn-diagram Remarkably the angle of friction with ca 10 is much lower than that of tests on dry contacts before healing
4 ConclusionsThe performed lab investigations cover a wide field of hydro-mechanical properties of bentonite bricks which represent a favorable option for constructing sealing plugs in different host rock environments
Based on the experimental results the following conclusions can be drawn
At dry conditions gas flow along interfaces is at least 4 orders higher than through the matrix (eg 10-16 m2) Increase of confinement significantly lowers the gas flow (10 MPa more than one order) but the effect is more pronounced for interfaces crack sealing
Saturation of bentonite brick aggregates ie bricks with a common interface is not affected by the interfaces and only weakly by the acting confining pressure
During gas injection (stepwise increasing of the gas pressure) a significant effect is only observed if the minimal stress is passed resulting in some minor (local) gas flow
The gas break through results in stationary inflow but no significant effect on the total stress is measured probably due to the central (spherical) gas injection (no outflow)
The measured gas threshold pressures under constant volume conditions significantly exceed the sum of the swelling pressure and externally-applied porewater pressure ndashdrained conditions (pi gt ax some MPa)
An important observation is that despite the former interface the bentonite block aggregatebehaves during the saturation of the buffer not different than the homogenous matrix This has been confirmed as well by gas injection tests on the former interface as well by shear tests The
FORGE Report Dxxx ndash Ver0
32
demonstration of the development of cohesion after pre-saturation is a favorable finding because this verifies physical healing of the interface In addition cohesion inside the matrix helps to explain why the measured gas entry pressures are higher than the applied minimal stress
However this observation is only based on two tests which need to be confirmed by the forthcoming experiments Also for understanding the physical background of high entry pressures of gas into the water-saturated bentonite matrix more experimental investigations are of urgent need
5 ReferencesBARTON C A ZOBACK M D amp MOOS D 1995 Fluid flow along potentially active faults in crystalline rock
Geology 23 683ndash686
BLUEMEL M 2000 Improved Procedures for Laboratory Rock Testing EUROCK 2000 ISRM Symposium Aachen 573 ndash 578
BLUEMEL M amp POETSCH M 2003 Direct Shear Testing System International Symposium on GeoTechnical Measurements and Modelling Karlsruhe 327 ndash 331
BUZZI O 2004 Hydromecanique du contact entre geomateriaux Experimentation et modelisation Application au stockage de dechets nucleaires These Universite Joseph Fourier Grenoble France
METCALF R WATSON S P REES J H HUMPHREYS PAUL AND KING F 2008 Gas generation and migration from a deep geological repository for radioactive waste A review of NirexNDArsquos work Technical Report NWAT Environment Agency Penrith Cumbria
NORRIS S 2009 Summary of Gas Generation and Migration Current State-of-the-Art (draft - July 2009) FORGE D12-R
PEACH CJ amp SPIERS CJ 1996 Influence of crystal plastic de-formation on dilatancy and permeability development in synthetic salt rock Tectonophysics 256 101-128
POPP T 2009 State of the art report on gas transport through interfaces FORGE D31-R (WP 33) 48 pp
SITZ P 2003 Entwicklung eines Grundkonzeptes fr langzeitstabile Streckenverschlussbauwerke fr UTD im Salinar Bau und Test eines Versuchsverschlussbauwerkes unter realen Bedingungen (BMBF-gefrdertes FE-Vorhaben Nr 02 C 05472) Abschlubericht TU Bergakademie Freiberg Institut fr Bergbau 2003

FORGE Report Dxxx ndash Ver0
ii
ForewordThis interims report summarizes the experimental work performed by IfG in WP33 ldquoGas transport through joints between buffer blocks and between host rockbufferrdquo Because gas will be created in a radioactive waste repository performance assessment requires quantification of the relevancy of various potential pathways Referring to the sealing plugs it is expected that in addition to the matrix properties of the sealing material conductive discrete interfaces inside the sealing elements itself and to the host rock may act not only as mechanical weakness planes but also as preferential gas pathways Our investigations are aiming on a comprehensive hydro-mechanical characterization of interfaces in bentonite buffers
AcknowledgementsThe studies presented in this report have been funded jointly by the European Commission under the Euratom Research and Training Program on Nuclear Energy within the SeventhFramework Programme (2007-2013) and the German Federal Ministry of Economics and Technology under contract 02 E 10659
ContentsFOREWORD II
ACKNOWLEDGEMENTS II
CONTENTS II
SUMMARY V
1 INTRODUCTION 6
11 IFG-WORK ndash ACTUAL STATE 712 MATERIAL DESCRIPTION 8
2 HYDRO-MECHANICAL CHARACTERISATION OF BENTONITE BRICKS 9
21 METHODOLOGY 10211 Strength testing 10212 Permeability testing 11213 Shear testing12
22 RESULTS 14221 Strength testing 14222 Gas permeability 16223 Shear strength (initial state) 18
3 GAS TRANSPORT PROPERTIES OF PARTIAL SATURATED BENTONITE23
31 PRE-SATURATION OF BENTONITE BRICKS WITH INTERFACES 23311 Lab test results25312 Comparison to the mock-up test Sondershausen25
32 GAS INJECTION TESTS ndash DETERMINATION OF GAS BREAKTHROUGH 2633 SHEAR STRENGTH (HEALED SPECIMENS) 29
4 CONCLUSIONS31
5 REFERENCES32
FORGE Report Dxxx ndash Ver0
iii
FIGURES
Figure 1-1 Scheme of fluid-transport through interfaces in a bentonite buffer consisting of bricks 6
Figure 1-2 Layout of the full scale drift sealing test Sondershausen (after SITZ et al 2001) 8
Figure 1-3 Wetro FS40 bricks 9
Figure 2-1 Loading geometry in direct shear test 12
Figure 2-2 The MTS ndash shear test system (model 816) available at the IfG (left) Schematic sketch of the MTS ndash test system (right) 13
Figure 2-3 Two-stage shear box for shear tests (Left) Schematic sketch with orientation of the specimen and the 25 mm opening between the two single boxes (Right) Prepared boxes with installed specimen The front panel with handle is for defined fixing of the shear boxes and will be removed before test start 13
Figure 2-4 Summary of triaxial test results on bentonite bricks in a confining pressure range between 1 and 20 MPa Note the well pronounced effect of increasing confining pressure resulting in a change from brittle to ductile behavior 15
Figure 2-5 Change from brittle to ductile deformation - Cracks patterns of deformed samples 15
Figure 2-6 MOHR-COULOMB-diagram of bentonite bricks 16
Figure 2-7 Sample arrangement for permeability testing a) matrix-permeability b) interface permeability 17
Figure 2-8 Permeability testing at hydrostatic loading Time-dependent course of the experiment with the different loading steps (up and down cycle) with the resulting compaction and gas permeability 17
Figure 2-9 Permeability testing at hydrostatic loading Gas permeability and volumetric strain vs confining pressure a) Bentonite brick matrix permeability b) Bentonite brick with artificial interface (saw cut) 18
Figure 2-10 Documentation of the interfaces of various test constellations a) View inside the open shear gap after the tests b) Scheme of the brickgranite arrangement 19
Figure 2-11 Multi-step shear test Bent-SV-MS1 (forward cycle) of the dry contact between two bentonite bricks The test was realized with σn = 05 1 2 4 and 6 MPa 19
Figure 2-12 Characterisation of the granite contact surface a) Histogram of the height distribution of the later shear surface b) sample dimensions c) schematics of the bentonite brickgranite aggregate prepared for shearing 20
Figure 2-13 Multi-step shear test BentGran-SV-MS1 (forward cycle) of the dry contact between bentonite brick granite surface The test was realized with σn = 05 1 and 2 MPa 21
FORGE Report Dxxx ndash Ver0
iv
Figure 2-14 Summary of shear tests on interfaces between bentonite brick bentonite brick respectively bentonite brick granite ndash MOHR-COULOMB-diagram 22
Figure 3-1 Principle of the new designed oedometer-cell for gas injection tests on bufferbuffer or bufferrock interfaces at defined bentonite swelling pressures 24
Figure 3-2 Pre-saturation of bentonite brick aggregates (left) ax = 2 MPa ndashcentral injection through a injection hole with radial fluid flow (middle) ax = 4 MPa ndash central injection through a injection hole with radial fluid flow (right) ax = zero ndash axial water injection with free swelling 24
Figure 3-3 Summary of the mock up test Sondershausen upper sketch the test design The picture below shows the humidity distribution inside the buffer (vertical profile along the dam axis) 26
Figure 3-4 Experimental setup for gas-breakthrough measurements under constant sample volume 27
Figure 3-5 Gas breakthrough test- axial stress and gas pressure respectively resulting gas flow vs time Ax ndashinit asymp 2 MPa 27
Figure 3-6 Gas breakthrough test- axial stress and gas pressure respectively resulting gas flow vs time Ax ndashinit asymp 4 MPa The inset shows the central filter plate ( = 9mm) which was installed to ensure no blockage of the fluid inflow to low-permeable bentonite matrix 28
Figure 3-7 Bentonite brickbrick aggregate ndash dismantled sample after controlled saturation by injecting water directly on the interface (compare injection filter plate in Figure 3-6) Note the sharp color contrast at the former interface (height of the sample 12 cm) 29
Figure 3-8 Single-step shear test on the healed contact between bentonite brick brick surface The test was realized with σn = 05MPa 30
Figure 3-8 Summary of both shear tests on ldquohealedrdquo interfaces between bentonite brick bentonite brick in comparison to the former results summarized in Figure 2-14 ndash MOHR-COULOMB-diagram 30
TABLES
Table 1-1 Material parameters of the reference material Wetro FS40 bentonite bricks (taken from SITZ et al 2001) 9
Table 2-1 Results from triaxial deformations tests ( = 2 10-5 1s) 14
Table 2-2 Shear test results 23
FORGE Report Dxxx ndash Ver0
v
SummaryThis report describes preliminary results obtained as part of IfG-work concerning the FORGE research program
Independently from the respective radioactive waste repository concept knowledge of gas transport properties through sealing or buffer materials is of vital importance for long-termperformance assessments because some gas generation may take place as a consequence of different processes (for instance corrosion of iron) In addition to the matrix properties of the sealing material it is expected that conductive discrete interfaces inside the sealing elements itself and to the host rock may act not only as mechanical weakness planes but also as preferential gas pathways For instance despite the self-sealing capacity of bentonite inherent existing interfaces may be reopened during gas injection However for interpretation resp numerical back analysis of field tests (ie FEBEX Lasgit) only limited experimental data from laboratory tests are available
The lab investigations are aiming (1) on hydro-mechanical properties of interfaces between bentonite bricks itself and (2) on mechanical contacts of bentonite blocks and concrete to various host rocks ie granite They consist of
long-term water injection tests in a new designed oedometer cell (duration of several month up to two years) with different sample constellations (brickbrick resp brickhost rock) under well controlled stress and swelling conditions to provide data about
o time dependent interface ldquopermeabilityrdquo changes (ie sealing) during long-termcompaction and fluid injection
o gas entry pressures and relative gas permeability changes during pressure dependent gas injection
shear tests to quantify mechanical interface properties under well controlled shear forces or displacements
As initial characterization (dry state) both triaxial and direct strength tests were performed which allow to separate between matrix and interface properties
Based on the experimental results the following conclusions can be drawn
At dry conditions gas flow along interfaces is at least 4 orders higher than through the matrix (eg 10-16 m2) Increase of confinement significantly lowers the gas flow (10 MPa more than one order) but the effect is more pronounced for interfaces crack sealing
Saturation of bentonite brick aggregates ie bricks with a common interface is not affected by the interfaces and only weakly by the acting confining pressure
During gas injection (stepwise increasing of the gas pressure) a significant effect is only observed if the minimal stress is passed resulting in some minor (local) gas flow
The gas break through results in stationary inflow but no significant effect on the total stress is measured probably due to the central (spherical) gas injection (no outflow)
The measured gas threshold pressures under constant volume conditions significantly exceed the sum of the swelling pressure and externally-applied porewater pressure ndashdrained conditions (pi gt ax some MPa)
Despite the former interface the bentonite block aggregate behaves like a homogenous matrix ie healing of the interface took place during saturation This favorable effectwas confirmed by shear tests demonstrating the development of cohesion
FORGE Report Dxxx ndash Ver0
6
1 IntroductionThe current report is a part of the activities in Work Package 3 (WP3) in the FORGE Project
The long-term safety of the disposal of nuclear waste is an important issue in all countries with a significant nuclear program Repositories for the disposal of high-level and long-lived radioactive waste generally rely on a multi-barrier system to isolate the waste from the biosphere The multi-barrier system typically comprises the natural geological barrier provided by the repository host rock and its surroundings and an engineered barrier system (EBS) ie the backfilling and sealing of shafts and galleries to block any preferential path for radioactive contaminants
This multi-barrier principle creates an overall robustness of the system that enhances confidence that the waste will be successfully contained However independently from the respective radioactive waste repository concept knowledge of gas transport properties through sealing or buffer materials is of vital importance for long-term performance assessments because some gas generation may take place as a consequence of different processes (for instance corrosion of iron)
Figure 1-1 Scheme of fluid-transport through interfaces in a bentonite buffer consisting of bricks
In the last two decades reliable information about the potential host rocks and the sealing materials (eg bentonite mixtures concrete rock backfill) has been obtained (for recentreviews see METCALF et al 2009 and NORRIS 2009) However only limited knowledge exists about the importance of contacts or interfaces between these different materials or construction parts ie seal plugs eg POPP (2009) As schematically shown in Figure 1-1 it is expected that in addition to the matrix properties of the sealing material conductive discreteinterfaces inside the sealing elements itself and to the host rock may act not only as mechanical weakness planes but also as preferential gas pathways For instance despite the self sealing
FORGE Report Dxxx ndash Ver0
7
capacity of bentonite inherent existing interfaces may be reopened during gas injectionMoreover it has been shown by BUZZI et al (2006) that bentonite is very sensitive to hydraulic erosion producing flow channels within the interface zone
But for interpretation of the relevancy of such phenomena resp numerical back analysis of field tests (ie FEBEX Lasgit) only limited experimental data from laboratory tests are availableTherefore it can be stated that further laboratory test results are important to deduce the hydro-mechanical (HM) parameters for numerical calculations evaluating the long-termintegrity of EBS especially bentonite bearing buffer systems
In the literature a variety of different possible bentonite mixtures or clay minerals has been projected as backfill material in the nuclear waste context Pure bentonite has been rarely proposed for the engineered barrier due to technical reasons eg low mechanical strength of the blocks or aggregates limitation of swelling pressure Therefore pre-fabricated bentonite blocks are an option where usually some aggregates (eg sand or crushed rock) are added to the bentonite in order to enhance its mechanical properties In the past several in situ tests have demonstrated that bentonite buffer or sealing plugs may be built as masonry of different bricks or as a monolith system consisting of large blocks
In the framework of WP3 IfG performed lab investigations aiming (1) on interfaces between bentonite bricks itself and (2) on mechanical contacts of bentonite blocks and concrete to various host rocks ie granite
11 IFG-WORK ndash ACTUAL STATEThe main objectives of the laboratory work of IfG are twofold
1 to investigate gas transport properties of interfaces between bentonite blocks The sub-items are
a to perform long-term laboratory tests (duration of several month up to two years) on artificial contact interfaces between sealing material bricks (ie bentonite) and to the host rock under well controlled stress and swelling conditions with water injection resp subsequent gas injection
b to provide data for time dependent interface ldquopermeabilityrdquo changes (ie sealing) during long-term compaction and fluid injection
c to provide data about gas entry pressures and relative gas permeability changes during pressure dependent gas injection
2 to provide experimental data from short term tests in a direct shear apparatus with measuring of gas transport and mechanical contact properties for the various interface configurations undergoing shear deformation at defined normal stresses1
The actual report describes results of the hydro-mechanical pre-characterization of bentonite bricks supplemented by shear tests between brick interfaces and to the host rock (granite) and preliminary results of gas injection tests on partially flooded bentonite sample constellations
1 The ldquoshear failurerdquo of a sealing plug due to fluid pressurisation or swelling phenomena is governed by hydro-mechanical characteristics of the confined plug host rock interface If shear slip occurs on a critically stressed interface it can raise the permeability of the fracture through several mechanisms including brecciation surface roughness and breakdown of seals (BARTON et al 1995) However increased pore pressures acting in the interface may also lower the acting minimal stress thus initiating the shear failure
FORGE Report Dxxx ndash Ver0
8
12 MATERIAL DESCRIPTIONWe used as reference material artificial bentonite bricks consisting of a sand clay-bentonite mixture but the variety of bentonite-based buffer materials has to be taken in mind The bricks were manufactured in the frame work of the so-called dam - project ldquoSondershausenrdquo ie a German research project between 1997 and 2002 funded by BMBF2 and TMLNU3
The underground test was performed as a demonstration experiment of a multi-component drift barrier system in a salt repository (details are given by SITZ et al 2001) The sealing element consists of the already mentioned bentonite bricks which were hydraulically tested by pressurization through pressure chamber 1 (Figure 1-2) A static abutment was constructed consisting of a salt brick masonry in a prismatoid shaped extension of the drift The completesystem was installed and tested in the salt mine Sondershausen Afterwards the dam was rebuilt4
Figure 1-2 Layout of the full scale drift sealing test Sondershausen (after SITZ et al 2001)
2 BMBF Bundesministerium fr Bildung und Forschung 3 TMLNU Thringer Ministerium fr Landwirtschaft Naturschutz und Umwelt4 In the test phase of several months the dam was loaded with a brine fluid pressure up to 8 MPa However as later found due to leakage through the so called floor-channel (central leading through the building for cables and pressure tubes) and fluid flow around the sealing system the salt bricks were partially flooded with brine which induces a spontaneous loss of strength resulting in a movement of the sealing element for more than 15 cm After finishing the pressure tests the dam has been completely rebuild to provide access to the various elements and to the contact zone between dam and the surrounding rock salt By that means it was possible to take samples of the partially flooded bentonite to measure its humidity content
Although the humidity distribution in the sealing elements indicated that partial flooding through the contact zone took place only weak indications for erosion phenomena in the contact zone between dam and the salt contour were observed but local fluid leakage points were attributed to movements of brine through the EDZ However the obtained swelling pressure in the sealing elements was not high enough to closure these pathways
FORGE Report Dxxx ndash Ver0
9
An important topic of the project was the development of appropriate pre-compacted bentonite bricks composed of bentonite (Calcigel5) and sand which should act as the long-term sealing element supposed to NaCl-brine Evaluating a suite of varies composition ratiosbetween both constituents finally the so-called Wetro FS40 bentonite bricks were selected for the test
The manufactured bentonite bricks (at least 140t material) were industrially produced by the company ldquoFeuerfestwerke Wetrordquo with a size of 25cm x 125cm x 625cm applying compressive stresses in the order of 40 ndash 50 MPa The relevant material properties of the bricks aresummarized in Table 1-1
Table 1-1 Material parameters of the reference material Wetro FS40 bentonite bricks (taken from Sitz et al 2001)
Composition ca 60 bentonite (Calcigel) + 40 quartz-sand
Water-content () 7505 Compressed density (gcm3) 227001 Bentonite dry density (gcm3) 189002 Initial saturation (-) 077004 Hydraulic conductivity with NaCl-brine (ms) ca 10-12
Swelling pressure (MPa) - NaCl 35
Figure 1-3 Wetro FS40 bricks
After producing the bricks the bricks were sealed with plastic wrap and stored at ambient conditions on pallets For our lab tests cylindrical samples were prepared in specified dimensions for carrying out the laboratory tests using a lathe
2 Hydro-mechanical characterization of bentonite bricksFor a performance assessment of the long-term sealing or buffer system build up by bentonite bricks knowledge of the hydro-mechanical properties eg permeability and strength are of urgent need not only for dimensioning a drift sealing plug but also for a prognoses of property changes which may occur in the long-term after closure of the repository eg due to rock convergence or water inflow However because artificial interfaces between the various elements and to the host rocks exist also the contact properties between these bricks and between the bricks and host rock ie granite have to be determined
The investigations are aiming on the characterization of
Matrix properties ieo Compressive strengtho Gas permeability (dry state)
5 CALCIGEL is a natural Calcium bentonite produced from selected Bavarian bentonite deposits The material has the following mineralogical composition Montmorillonite 60 ndash 70 Quartz 6 ndash 9 Feldspar 1 ndash 4 Kaolinite 1 ndash2 Mica 1 ndash 6 and other minerals 5 ndash 10 (source httpwwws-cppcom)
FORGE Report Dxxx ndash Ver0
10
Interface properties ie
o Shear strength between blocks and to the rock contouro Gas permeability ie block aggregates with interfaces
21 METHODOLOGY
211 Strength testingThe strength and permeability measurements were performed in a standard Karman-cell (KRMN 1911) in the servo-hydraulic testing machine (RBA 2500 SCHENKTREBEL Germany ndashusing the MTS-TestStar software) allowing independent control of the radial (2 = 3 = pc) and axial stresses (Ax = 1) The cylindrical samples are sealed with rubber tubes and oil is used as confining medium Outside the vessel three LVDT transducers are mounted between the piston and the load frame near the sample for the measurement of the axial strain The axial load is determined from an external load cell
Figure 2-1 The servohydraulic testing machine RBA 2500 (a) and the scheme of the pressure vessel (b)
Axial deformation experiments (Δh resp the deformation ε1 = Δh h0) in compression or extension mode can be performed at various confining pressures (pc up to 100 MPa) and at temperatures up to 100C within a deformation rate range of 1 = 10-5 ndash 10-7 1s to chosen values of ε1 As a standard technique during the experiments the sample volume changes ΔV are determined by a volume balance of the mantle oil volume changes as measured via the pressure intensifier and the axial piston displacement in the cell
PIPIPP ASAhV (2-1)
FORGE Report Dxxx ndash Ver0
11
with ΔSPI = displacement of the cylinder within the pressure intensifierAPI = cross section of the piston within the pressure intensifierΔh = displacement of the piston of the triaxial cellAPP = cross section of the piston of the triaxial cell
0V V
V (2-2)
In calculation of the stress difference (σ1 ndash σ3) deformation-induced variation of the cross section of the specimen is considered
The leakage-freeness of the oil volume measurement equipment is tested before beginning of each measuring cycle over a waiting period of ca 1 hour However the accuracy of the volume measurement depends on the constancy of the oil temperature within the triaxial cell and within the pressure intensifier
212 Permeability testingAs shown in the schematic drawing of the triaxial pressure cell (depicted in Figure 2-1) permeability can be measured parallel to the sample cylinder axis (dimensions ca 90 mm in diameter and 180 mm long) To maintain access of the gas to the sample either a central hole exists in the plates whereby the specimens additionally will be prepared with small boreholes on their axial ends to minimize end effects during straining or filter plates are used to provide flow over the whole cross section of the sample
Figure 2-2 Flow-meter used for permeability testing
Gas-permeability is measured using nitrogen with an equipment similar to that described by PEACH amp SPIERS (1996) allowing both transient and stationary permeability measurements
Two methods are used to determine the gas flow (q) through the samples To perform the permeability measurement the primary gas pressure p1 is applied Its value depends on the test specimenrsquos permeability and on the measurement range of the gas flow-meter (0 - 10 resp 0 -500 cmmin manufacturer BRONKHORST Model F-230M)
Alternatively using a defined gas volume on the in- (V1) and outlet (V2) and measuring the
pressure increase Δp2 resp t
pp 22
is verified to determine 222 pVV whereby 2Vˆq
FORGE Report Dxxx ndash Ver0
12
At a given injection pressure gas enters into the assumed relatively large pores and displaces the pore water This process is regarded as two-phase flow After reaching a stationary flow through the specimen the amount of gas flow over a defined period of time is recorded (q)
The intrinsic permeability is calculated by the modified DARCYrsquos law for compressive media
)pp(pq
Alk L
22
21
2
(2-3)
with η = dynamical viscosityl = (h ndash t) = effective length of the flow path through the sampleh = height of the sampleA = cross section of the samplepL = pressure at gas flow measurementt = sum of the length of both holes in the samplep1 = injection pressurep2 = outlet pressure
The absence of leakage of the permeability equipment is tested before each measuring cycle using a steal sample over a waiting period of around 1 hour
213 Shear testingGeomechanical discontinuities between various buffer elements and to the host rock are probably the clearest example of existing interfaces acting as mechanical weakness zone or preferred pathways For the mechanical behavior of interfaces the relevant variables are stress traction vector with one normal component and one tangential in a simple 2-dimensional stress field (or two tangential in 3D) and the conjugate strain variables are the corresponding relative displacements (Figure 2-1) However such stress conditions can be only realized in direct shear tests which are therefore of urgent need to reproduce slip between various materials
In the past several companies have developed modern state-of-art testing equipment which allows new types of testing procedures to determine the mechanical parameters of joints and intact rock High-response servo-hydraulic systems with digital control technology strain measurement equipment mounted onto the specimen and programmable control modes enable new types of test procedures to be performed which are tailored to the specific problem eg BLUEMEL (2000) BLUEMEL amp POETSCH (2003) For realization of required shear tests a modern shear test system is available at the IfG (Figure 2-2)
Figure 2-1 Loading geometry in direct shear test
FORGE Report Dxxx ndash Ver0
13
The loading frame consists of a two-axle experimental setup with vertical and horizontal stress initiation a platform for shear test with a two-stage shear box and a servo-hydraulic control unit for two channels (vertical and horizontal) Both can be managed force or displacement controlled The test arrangement is shown in Figure 2-2 The frontal part (right) is an extremely stiff four-columned housing for fixing and vertical loading of the two-stage shear box by the upper hydraulic cylinder (up to 500 kN axial load)
Figure 2-2 The MTS ndash shear test system (model 816) available at the IfG (left) Schematic sketch of the MTS ndash test system (right)
Figure 2-3 Two-stage shear box for shear tests (Left) Schematic sketch with orientation of the specimen and the 25 mm opening between the two single boxes (Right) Prepared boxes with installed specimen The front panel with handle is for defined fixing of the shear boxes and will be removed before test start
A robust desk with a horizontal cylinder (-250 kN pressure - 160kN tension) is laterally positioned in a horizontal housing This cylinder supplies the lateral shear force The upper shear box is fixed by a horizontal housing that enables yet a twisting of approx 2 around the horizontal axes referring to the shear midpoint While a vertical load acts to the whole shear box the lower box can be horizontally displaced under weight The box is lead with less friction by mechanically high quality linear guides
The displacement of the boxes to each other under load is measured and recorded by 4 displacement transducers on the edges of the box (for vertical displacement) and by 2 additional position encoders (for horizontal displacement) Thereby a possible twisting is measured as well
FORGE Report Dxxx ndash Ver0
14
A sufficiently stiff fixing of the specimens in the shear box is a prerequisite for an exact determination of shear resistance (Figure 2-3) Therefore as the first step for investigation of the shear strength of bentonite bentonite or bentonitegranite interfaces two cut in half bricks (125 cm x 125 cm) were stacked one on the top of the other (respectively one half brick on a rough granite surface) The aggregate was covered with a plastic foil to protect them against wetting by the wet concrete that fixes the samples in the shear boxes So the contact planes between the two bricks are exactly perpendicular to the shear direction in the center of the shear box with 25 cm opening (Figure 2-10)
Samples for the second test row (brickgranite interface) were similarly prepared Instead of two bentonite bricks (or bentonite brick halves) a bentonite brick was arranged on a rough contact plane of a host rock block (ie medium-grained grained granite with an artificial fracture surface) Between both blocks was a loose horizontal contact Further preparations were done like mentioned above
22 RESULTS
221 Strength testingIn order to investigate the effect of deviatoric loading on the hydro-mechnical integrity we performed five compression tests The applied confining pressures varied between 10 and 200 MPa After hydrostatic compaction ndash pre-loading at the respective stress state ndash the samples were deformed in triaxial compression (1 gt 2 = 3) with a constant strain rate of 25 ∙ 10-5 1s
For comparison the obtained stress strain curves and the respective evolution of volumetric strain (ie dilatancy) are compared in Figure 2-4 The resulting peak strength (failure) and minimum dilatancy values (onset of dilatancy) are summarized in Table 2-1
As general starting from hydrostatical conditions the deviatoric stress increases to ensure constant rate deformation Generally the slope of the stress-strain curve of all samples exhibits the characteristic transition from initial quasi-elastic (linear) behavior to a curve with relatively large radius indicating typical strain hardening until failure at strains The stress-strain curves depicted in Figure 2-4 nicely demonstrate the effect of increasing pressure resulting in higher strength and deformability
Table 2-1 Results from triaxial deformations tests ( = 2 10-5 1s)
sample pc 1 - fail Diff-failure 1-failure (VV) 1 - min w(MPa) () (MPa) (MPa) () () (wt-)
20611 10 157 868 97 -015 032 44
20608 25 134 1313 156 -010 031 59
20607 50 343 1432 193 -035 316 54
20612 100 715 2110 311 -146 1068 48
20620 200 1150 3101 510 -413 1886 48
As evident from the experiments the deformation style changes from brittle to quasi ductile behavior with increasing confining pressure as indicated by increasing failure strains and different post failure behavior One can see a change from a sharp stress-strain curve with a significant lower post-failure stage to a more or less broad plateau without a significant failure peak
FORGE Report Dxxx ndash Ver0
15
Most important dilatant deformations occur only in a low peripheral pressure range (3 5 MPa) At higher pressures (3 10 MPa) brittle deformation is suppressed resulting in a significant compaction of several percent The change of deformation behavior is also documented in the evolution of dilatancy Whereas at low confinement dilatancy onsets significantly before the failure at low strain is dilatancy at confining pressures higher than 5 MPa suppressed and compaction dominates during the whole deformation cycle
Figure 2-4 Summary of triaxial test results on bentonite bricks in a confining pressure range between 1 and 20 MPa Note the well pronounced effect of increasing confining pressureresulting in a change from brittle to ductile behavior
Figure 2-5 Change from brittle to ductile deformation - Cracks patterns of deformed samples
The visual inspection of deformed specimens after the experiment the deformation style of the specimens demonstrates the change of deformation style from brittle to ductile At lower
FORGE Report Dxxx ndash Ver0
16
confining pressures as can be seen from Figure 2-5 a complex shear failure signature occurred whereas at 3 gt 5 MPa compressive failure dominates
For evaluating the strength behavior all test results (standard TC-tests) are graphical depicted inFigure 2-6 Despite the scattering of the strength values it can be easily seen that the general trend of increasing strength with increasing minimal stress is nicely represented by a linear strength boundary according to the MOHR-COULOMB-criterion with the respective values of
ndash friction angle () 22c ndash cohesion (MPa) 28
It has to be mentioned that the friction angle of 22 corresponds fairly well to the results of the shear tests on interfaces between bentonite bricks but without cohesion (see chapter 223)
Figure 2-6 MOHR-COULOMB-diagram of bentonite bricks
Extrapolation of the obtained straight line to a confining pressure zero delivers a value of ca 9 MPa Based on a larger number of samples the average strength of the bentonite bricks was determined in the order of 55 to 65 MPa (SITZ et al 2001) This indicates some non-linearity to unconfined conditions demonstrating the need of triaxial tests for evaluation of the strength behavior of bentonite bricks
222 Gas permeabilityAs a prerequisite for evaluation of the later saturation tests the gas permeability of the bentonite bricks was determined using different sample arrangements As depicted in Figure 2-7 two different sample arrangements were used to realize axial gas-injection tests both on the intact matrix and also on an artificial interface between two bentonite bricks
Both samples were stepwise hydrostatically loaded (up and down cycle) with continuous gas injection which facilitates permeability determination by measuring the gas flow Exemplarily
FORGE Report Dxxx ndash Ver0
17
Figure 2-8 shows the time dependent change of gas permeability through the intact bentonite brick matrix according the different loading and un-loading steps Starting from an initial gas-permeability of ca 2 ∙ 10-16 m2 the permeability decreases with increasing the applied confining stress Increase of the confining pressure up to 3 = 9 MPa results in a decrease of permeability for more than one order of magnitude At constant confining pressure permeability decreases with time indicating visco-elastic matrix-compaction The time- and stress-dependent compaction effect is at least partial reversible if the confinement is reduced ie irreversible compaction becomes visible But close inspection of pressure-dependent change of permeability as depicted in Figure 2-9 indicates that during the unloading cycle phyd lt 2 MPa the permeability increases significant which may indicate inelastic crack opening during stress release
Figure 2-7 Sample arrangement for permeability testing a) matrix-permeability b) interface permeability
Figure 2-8 Permeability testing at hydrostatic loading Time-dependent course of the experiment with the different loading steps (up and down cycle) with the resulting compactionand gas permeability
Figure 2-9 compares the results measured on the two different sample arrangements ie (left) intact matrix and (right) matrix with an artificial interface (saw cut) It becomes obvious that the
FORGE Report Dxxx ndash Ver0
18
ldquointegralrdquo permeability of the bentonite aggregate with an artificial interface is initially four orders of magnitude higher than the intact matrix ie ko-interface asymp 10-12 m2 Increase of confining pressure up to 10 MPa lowers the permeability for more than 2 orders whereas unloading of the sample results in a significant hysteresis This is clearly indicates crack sealing
Figure 2-9 Permeability testing at hydrostatic loading Gas permeability and volumetric strain vs confining pressure a) Bentonite brick matrix permeability b) Bentonite brick with artificial interface (saw cut)
223 Shear strength (initial state)
The shear testing program consists of the following sample configurations and test number(1) Bentonite brick bentonite brick
a Dry (delivery state) 2 multi-step shear testsb Wetted surface (only just before the test) 1 multi-step shear testsc Healed interface between bentonite bricks
after pre-saturation over one year 2 single-step shear tests(2) Bentonite brick rough granite surface (dry) 4 single-step shear tests
1 multi-step shear tests
Principally the test realization comprises two phases ie pre-consolidation followed by the original shear phase which can be divided in several steps at various normal stresses The test results are typically represented by a peak strength and a residual strength value after loss of cohesion between the shear interfaces
FORGE Report Dxxx ndash Ver0
19
Figure 2-10 Documentation of the interfaces of various test constellations a) View inside the open shear gap after the tests b) Scheme of the brickgranite arrangement
2231 SHEAR TESTS ON DRY BENTONITE BRICK INTERFACES
First of all the shear strength of the dry interfaces between two bentonite bricks was determined in two multiple-step shear tests each with 4 steps at normal stresses n = 05 10 2 and 4 MPa6 During the tests the lower shear box was controlled displaced forward (resp backwards) with a shear rate of 0002 mms
Figure 2-11 Multi-step shear test Bent-SV-MS1 (forward cycle) of the dry contact between two bentonite bricks The test was realized with σn = 05 1 2 4 and 6 MPa
6 To avoid brick failure the maximum normal load was set generally smaller than the average uniaxial strength
FORGE Report Dxxx ndash Ver0
20
The results of a selected shear test (Bent-SV-MS1) are shown as a variation of shear stress and dilatancy vs shear displacement (increasing load cycle) in Figure 2-11 Pre-loading of the sample to the respective normal stress results in some small compaction which developsfurther during the following shear cycles During the various shear steps contrary to experiences from tests on compact material or natural interfaces no stress peak occurs but a more or less constant shear strength level is apparent At higher normal stress states the shear stresses increase as well Concomitantly with the increase of normal stress the variation of dilatancy (always decrease) documents progressive compaction of the bentonite brick aggregate (eg the total compaction ndash during the whole test at n = 1 MPa - is ca 1mm)
The strength and dilatancy behavior does not depend on the course of loading ie if the vertical load steps are varied as upwards or downwards cycle
2232 SHEAR TESTS ON BENTONITE BRICK GRANITE INTERFACES
As a reference material for shear tests on interfaces between bentonite and granite we selected an artificial fractured cuboid of granite (20cm x 15cm x 75cm) of unknown origin The roughness of the artificial split surface was measured using a 3D surface and body scanner at the University of Freiberg (Prof KONIETZKY) The maximum scanner resolution is in the order of 2m As can be seen from Figure 2-12 the mean difference between highest and lowest asperity is in the order of 15 cm
Figure 2-12 Characterization of the granite contact surface a) Histogram of the height distribution of the later shear surface b) Sample dimensions c) Scheme of the bentonite brickgranite aggregate prepared for shearing
Overall one multiple-step shear test and four single-shear tests of bentonite brick granite samples were performed The sample arrangement is qualitatively the same as before
FORGE Report Dxxx ndash Ver0
21
Principally the test realization comprises two steps pre-loading to the respective normal stress state followed by the shear phase
Remarkably despite the existing asperities the initial compaction is only in the order of some few millimeters (depending on the stress level) which indicate that the interface ie the gap between the flat bentonite brick and the asperities is only partially closed during loading This results from the high uniaxial strength of the bentonite bricks
Exemplarily the results of the multi-step shear test are shown in Figure 2-13 which was performed with three steps at n = 05 10 and 20 MPa with displacement rates of 0002 mms Qualitatively the results are comparably to the results of the tests reported in the chapter before Surprisingly also no significant shear peak is observed but post inspection of the sheared planes indicates that local sliding of spikes with linear erosion dominates during shearing Although no significant compaction and local shear failure occurred the shearing along the rough surface requires local overcoming of the existing cohesion
Figure 2-13 Multi-step shear test BentGran-SV-MS1 (forward cycle) of the dry contact between bentonite brick granite surface The test was realized with σn = 05 1 and 2 MPa
2233 SUMMARY HYDRO-MECHANICAL PROPERTIES ndash DRY STATE
The results of the various shear tests were compiled in Table 2-2 and graphical depicted in Figure 2-14
Analog to the strength properties of an intact rock the MOHR-COLOUMB criterion can be used to describe the discontinuity plane characteristics of a jointed rock Accordingly the shear resistance on an interface at critical stress conditions (shear failure) can be expressed stress-depended by a linear dependency of cohesion (c) and angle of friction ()
τf = c + σf tan φ
FORGE Report Dxxx ndash Ver0
22
According to the different material groups two linear trends of results are clearly visible Whereas bentonitebentonite interfaces show no cohesion but significant friction obviously due to the sand content demonstrate shear tests for bentonite bricksgranite a small but significant occurrence of cohesion which was already indicated by post-evaluation of sheared interfaces The tips of the existing roughness of the granite surface are pressed into the bentonite material resulting in local erosion channels
The respective MOHR-COULOMB-parameters are as follows
τ = C + σN tanφ MOHR-COULOMBC φ
brick brick 002 210brick granite 019 196
(MPa) ()
In summary despite the small difference between both interface types comparison with Figure 2-6 demonstrate the importance of artificial interfaces between bentonite bricks as potential weakness planes
Figure 2-14 Summary of shear tests on interfaces between bentonite brick bentonite brick respectively bentonite brick granite ndash MOHR-COULOMB-diagram
FORGE Report Dxxx ndash Ver0
23
Table 2-2 Shear test results
shear strain n dilatancy time
(mm) (MPa) (MPa) (mm) (min)
bentonite brick bentonite brick
057 050 023 -040 503
383 050 021 -046 3215
782 100 038 -075 6548
1186 200 073 -120 9932
1575 400 140 -199 13208
1220 075 033 -017 2492
839 150 064 -033 5682
429 300 123 -068 9123
042 600 240 -170 12397
bentonite brick granite surface
987 200 094 -540 9120
457 400 160 -354 23913
982 100 053 -362 9120bentonite brick granite surface (wetted)
985 100 029 456 10403
3 Gas transport properties of partial saturated bentonite
31 PRE-SATURATION OF BENTONITE BRICKS WITH INTERFACESFor pre-saturation of the samples respectively for the later gas injection tests a new oedometer-like pressure cell is constructed allowing in additions gas flow measurements under defined axial sample consolidation respectively swelling conditions due to different injected water amounts
The sample arrangement consists of a stiff tube ndash oedometer ndash with two sample cylinders of pre-compacted bentonite (respectively one rock sample with a natural rough surface) which are separated by an axial interface inside Two movable pistons equipped with sinter metal plates allow control of volume changes of the sample ie compaction due to a defined axial load or expansion induced by swelling due to water injection Resulting changes in volume or axial force are measured with dial gauges or an axial oriented load cell
As can be seen from Figure 3-1 the cell design facilitates measurements of fluid transport properties through the buffer respectively along the interface between block contacts ie bufferbuffer and bufferblock at defined interface conditions The cell diameter is 90 mm and the overall sample height is ca 120 mm (consisting of two cylindrical specimens ndash 60 mm height) Sinter metal plates ensure access to the axial ends of the sample
FORGE Report Dxxx ndash Ver0
24
The special design of the cell allows fluid injection (1) along the axial direction ie for pre-saturation of the bentonite to induce swelling or measurement of the matrix permeability and (2) through a central hole along the interface ie investigation of contact permeability
pGAs - Inlet
pGas - Outlet
pH2O - Inlet
pH2O - Outlet
FaxLoad cell
Figure 3-1 Principle of the new designed oedometer-cell for gas injection tests on bufferbuffer or bufferrock interfaces at defined bentonite swelling pressures
0 100 200 300
Time (d)0 100 200 300
Time (d)
00
10
20
30
40
50
60
70
80
90
100
0 100 200 300
Time (d)
Axia
l stre
ss (M
Pa)
Inje
cted
wat
er (w
t-
)Vo
lum
etric
sw
ellin
g (
)
I I
ax
water
Vol
ax
water
Volax
water
Vol
Figure 3-2 Pre-saturation of bentonite brick aggregates (left) ax = 2 MPa ndash central injection through a injection hole with radial fluid flow (middle) ax = 4 MPa ndash central injection through a injection hole with radial fluid flow (right) ax = zero ndash axial water injection with free swelling
FORGE Report Dxxx ndash Ver0
25
311 Lab test resultsThree long-term injection tests (pi = 04 MPa) were started in Spring 2010 whereby three different situations were realized
(1) central water injection through an injection hole through a central tube resulting (as proposed) in radial fluid flow along the brick interface
a ax = 4 MPa
b ax = 2 MPa
(2) axial water injection (without axial load) through the end plates (sintered metal) resulting in free axial swelling
The various curves of water consumption and the resulting swelling are summarized in Figure 3-2 The results can be summarized as follows
(1) The water consumption during swelling depends
a obviously not on the injection geometry
b and only weakly on the axial load
No preferred flow along the interface ie matrix swelling
(2) More than 1 year water injection was not sufficient to reach full saturation ie no water out flow but in the center full saturation is assumed Therefore after one year water injection the tests 1a and 1b were finished to facilitate gas injection tests
312 Comparison to the mock-up test SondershausenDespite the different scales of lab and field tests and the limited number of tests the results correspond very well to existing experiences made from in situ tests where sealing elements are constructed of different blocks or bricks Figure 3-3 illustrates the observations made during testing the sealing element of the mock up test Sondershausen (see short description in chapter 12) The sealing element consists of masonry of bentonite bricks (FS 50) which was tested with NaCl-fluid at a maximum fluid pressure of pfl asymp 8 MPa (pswellasymp 1 MPa) (for details see SITZ 2001)
The following conclusions were drawn from the in situ test (evaluation of the humidity distribution after rebuilding the plug)
1Proof of clear saturation front during fluid pressurization
2Homogenous humidity distribution inside the partially saturated buffer
Low effect of artificial interfaces inside the buffer
3Clear pathways in the contact zone buffer host rock (salt)
Interfaces to the host rock are obviously the most relevant pathways
These observations correspond to the results of the laboratory tests therefore demonstrating that interfaces inside the sealing plug are of minor importance because due to the overall swelling effect they will be efficiently sealed
FORGE Report Dxxx ndash Ver0
26
Figure 3-3 Summary of the mock-up test Sondershausen Upper sketch the test design The picture below shows the humidity distribution inside the buffer (vertical profile along the dam axis)
32 GAS INJECTION TESTS ndash DETERMINATION OF GAS BREAKTHROUGHFor the gas-injection tests we used a constant volume radial flow geometry realized in the experimental setup depicted in Figure 3-4
Gas flow measurements under constant volume conditions
A servo-controlled load frame (up to 250kN load capacity) ensures defined loading respectively volume conditions The axial strain (measured between the load plates) is kept constant during the test (resolution 1 m) ie if the sample volume increases due to gas-injection the axial force is automatically increased During the test the change of the axial stress is measured via a load cell
Gas injection at constant injection pressure on the at least partial saturated bentonite sample with a radial flow geometry
After finishing the saturation instead of water gas was injected through the central pipeof the swelling cell which should result in radial flow if preferred flow along the former interface occurs During the test the samples is drained in the axial direction ie through the axial filter plates
During stepwise increase of the primary gas pressure the inflow of gas is measured with a flow-meter ie during each pressure step firstly the dead volume before the gas access to the sample is pressurized which results in an inflow-peak If gas pressureequilibrium before and after the flow-meter is reached and the sample behaves nearly gastight the apparent flow rate becomes zero Gas break through ie overcome of the
FORGE Report Dxxx ndash Ver0
27
capillary entry pressure is indicated by quasi-constant gas-in-flow or gas-outflow (ie bubbles in a burette)
Two gas breakthrough tests were performed at initial axial pressures of 2 respectively 4 MPa The results are summarized in Figure 3-5 respectively Figure 3-6
Figure 3-4 Experimental setup for gas-breakthrough measurements under constant sample volume
Figure 3-5 Gas breakthrough test ndash axial stress and gas pressure respectively resulting gas flow vs time Ax ndashinit asymp 2 MPa
FORGE Report Dxxx ndash Ver0
28
After finishing the pre-saturation of the bentonite the samples were axially unloaded and the cells were put into the servo-hydraulic load frame Before the tests a waiting period of ca 1 day (at the nominal axial stress) was usually applied to ensure equilibrium inside the sampleExemplarily Figure 3-5 shows the stability of the axially applied strain control which is in the order of 1 m However this results in a variation of the axial stress of 02 MPa
Then the gas pressure was stepwise increased each with a waiting period of ca 05 hour The change of the gas pressure is always followed by peak of gas-inflow as explained before but becomes zero If a gas pressure state some few bars below the axial stress is reached the gas pressure was kept constant over a period of 12 to 15 hours to exclude time effects of a gas breakthrough ie delay to slow water expulsion Despite some scattering no significant gas in- or outflow was observed
In the next phase the stepwise pressurization was continued If the gas-pressure reaches the acting axial stress ie Ax ndashinit = min some local gas flow becomes apparent but with some instability Further pressure increase did not change the gas flow significant until the breakthrough occurred
1st test Ax ndashinit = min asymp 2 MPa 27 ndash 29 MPa ie 07 ndash 09 MPa higher than min
2nd test Ax ndashinit = min asymp 4 MPa 75 MPa ie 35 MPa higher than min
The tests clearly demonstrate that the gas-entry pressures are significantly higher than min In addition no effect of the interface ie preferred radial gas flow is visible In a first approach the bentonite brick aggregate seems to behave like a homogenous buffer material For further discussion see the next chapter
Figure 3-6 Gas breakthrough test- axial stress and gas pressure respectively resulting gas flow vs time Ax ndashinit asymp 4 MPa The inset shows the central filter plate ( = 9mm) which was installed to ensure no blockage of the fluid inflow to low-permeable bentonite matrix
FORGE Report Dxxx ndash Ver0
29
33 SHEAR STRENGTH (HEALED SPECIMENS)The gas injection tests results delivered very high gas entry pressures which succeeded the minimal stress which has been axially applied by about several MPa (depending on the order of stress) A possible explanation could be that due to the central gas injection locally a high water pressure is generated The local pore fluid pressure may be temporarily preserved during the fast pressurization with gas due to the low permeability of the matrix although the system is drained by the axial filter plates However it becomes obvious that the effect of the former interface as a potential pathway does not exist anymore This may indicate that the interface is healed during the time-dependent swelling process
Healing means the development of cohesion ie which results in bentonite from electrostatic forces among fine particles (clay minerals) and water Shear tests represent a simple way to quantify the amount of cohesion as already demonstrated before Here we used the bentonite brick aggregates after dismantling the sample Visual inspection of the former interface give no hints for a mechanical or hydraulical weakness plane ie only the color contrast indicates the former contact plane
Figure 3-7 Bentonite brickbrick aggregate ndash dismantled sample after controlled saturation by injecting water directly on the interface (compare injection filter plate in Figure 3-6) Note the sharp color contrast at the former interface (total height of the sample 12 cm)
To demonstrate that real healing took place we performed with both specimens direct shear tests on the former interface between both bentonite brick halves The procedure is the same as described in 213
FORGE Report Dxxx ndash Ver0
30
Figure 3-8 Single-step shear test on the healed contact between bentonite brick brick surface The test was realized with σn = 05 MPa
Figure 3-9 Summary of both shear tests on ldquohealedrdquo interfaces between bentonite brick bentonite brick in comparison to the former results summarized in Figure 2-14 ndash MOHR-COULOMB-diagram
FORGE Report Dxxx ndash Ver0
31
The results differ significantly from the shear tests performed on the dry or only short wetted contact planes The following results are obtained from Figure 3-8
bull Shear test curves
Exemplarily the results of the shear test performed at n = 05 MPa are shown As usual for intact material shear stress grows with progressive shear displacement in elastic manner up to a peak and then drops down to a residual value Peak and residual values are higher with applied normal stress Repeating the experiment with the 2nd sample at n = 15 MPa (not shown here) results in a similar shape of the strength curve but the increase of strength is not so significant indicating that the influence of the acting normal stress is low ie the friction angle is only small
bull Dilatancy curves
Due to the surface roughness and asperities a bedding plane tends to dilate upon shear although this effect tends to level off after certain amount of prescribed shear displacement and is lower for higher normal stress (not shown here)
For comparison with earlier measurements on dry interfaces shear stress peaks and residual values of shear stress obtained in both single experiments are represented in Figure 3-9 against normal stress leading to open envelopes of the Coulomb type The evaluation of these tests with σn = 05 resp 15 MPa documents a cohesion of 06 MPa in the τ-σn-diagram Remarkably the angle of friction with ca 10 is much lower than that of tests on dry contacts before healing
4 ConclusionsThe performed lab investigations cover a wide field of hydro-mechanical properties of bentonite bricks which represent a favorable option for constructing sealing plugs in different host rock environments
Based on the experimental results the following conclusions can be drawn
At dry conditions gas flow along interfaces is at least 4 orders higher than through the matrix (eg 10-16 m2) Increase of confinement significantly lowers the gas flow (10 MPa more than one order) but the effect is more pronounced for interfaces crack sealing
Saturation of bentonite brick aggregates ie bricks with a common interface is not affected by the interfaces and only weakly by the acting confining pressure
During gas injection (stepwise increasing of the gas pressure) a significant effect is only observed if the minimal stress is passed resulting in some minor (local) gas flow
The gas break through results in stationary inflow but no significant effect on the total stress is measured probably due to the central (spherical) gas injection (no outflow)
The measured gas threshold pressures under constant volume conditions significantly exceed the sum of the swelling pressure and externally-applied porewater pressure ndashdrained conditions (pi gt ax some MPa)
An important observation is that despite the former interface the bentonite block aggregatebehaves during the saturation of the buffer not different than the homogenous matrix This has been confirmed as well by gas injection tests on the former interface as well by shear tests The
FORGE Report Dxxx ndash Ver0
32
demonstration of the development of cohesion after pre-saturation is a favorable finding because this verifies physical healing of the interface In addition cohesion inside the matrix helps to explain why the measured gas entry pressures are higher than the applied minimal stress
However this observation is only based on two tests which need to be confirmed by the forthcoming experiments Also for understanding the physical background of high entry pressures of gas into the water-saturated bentonite matrix more experimental investigations are of urgent need
5 ReferencesBARTON C A ZOBACK M D amp MOOS D 1995 Fluid flow along potentially active faults in crystalline rock
Geology 23 683ndash686
BLUEMEL M 2000 Improved Procedures for Laboratory Rock Testing EUROCK 2000 ISRM Symposium Aachen 573 ndash 578
BLUEMEL M amp POETSCH M 2003 Direct Shear Testing System International Symposium on GeoTechnical Measurements and Modelling Karlsruhe 327 ndash 331
BUZZI O 2004 Hydromecanique du contact entre geomateriaux Experimentation et modelisation Application au stockage de dechets nucleaires These Universite Joseph Fourier Grenoble France
METCALF R WATSON S P REES J H HUMPHREYS PAUL AND KING F 2008 Gas generation and migration from a deep geological repository for radioactive waste A review of NirexNDArsquos work Technical Report NWAT Environment Agency Penrith Cumbria
NORRIS S 2009 Summary of Gas Generation and Migration Current State-of-the-Art (draft - July 2009) FORGE D12-R
PEACH CJ amp SPIERS CJ 1996 Influence of crystal plastic de-formation on dilatancy and permeability development in synthetic salt rock Tectonophysics 256 101-128
POPP T 2009 State of the art report on gas transport through interfaces FORGE D31-R (WP 33) 48 pp
SITZ P 2003 Entwicklung eines Grundkonzeptes fr langzeitstabile Streckenverschlussbauwerke fr UTD im Salinar Bau und Test eines Versuchsverschlussbauwerkes unter realen Bedingungen (BMBF-gefrdertes FE-Vorhaben Nr 02 C 05472) Abschlubericht TU Bergakademie Freiberg Institut fr Bergbau 2003
FORGE Report Dxxx ndash Ver0
iii
FIGURES
Figure 1-1 Scheme of fluid-transport through interfaces in a bentonite buffer consisting of bricks 6
Figure 1-2 Layout of the full scale drift sealing test Sondershausen (after SITZ et al 2001) 8
Figure 1-3 Wetro FS40 bricks 9
Figure 2-1 Loading geometry in direct shear test 12
Figure 2-2 The MTS ndash shear test system (model 816) available at the IfG (left) Schematic sketch of the MTS ndash test system (right) 13
Figure 2-3 Two-stage shear box for shear tests (Left) Schematic sketch with orientation of the specimen and the 25 mm opening between the two single boxes (Right) Prepared boxes with installed specimen The front panel with handle is for defined fixing of the shear boxes and will be removed before test start 13
Figure 2-4 Summary of triaxial test results on bentonite bricks in a confining pressure range between 1 and 20 MPa Note the well pronounced effect of increasing confining pressure resulting in a change from brittle to ductile behavior 15
Figure 2-5 Change from brittle to ductile deformation - Cracks patterns of deformed samples 15
Figure 2-6 MOHR-COULOMB-diagram of bentonite bricks 16
Figure 2-7 Sample arrangement for permeability testing a) matrix-permeability b) interface permeability 17
Figure 2-8 Permeability testing at hydrostatic loading Time-dependent course of the experiment with the different loading steps (up and down cycle) with the resulting compaction and gas permeability 17
Figure 2-9 Permeability testing at hydrostatic loading Gas permeability and volumetric strain vs confining pressure a) Bentonite brick matrix permeability b) Bentonite brick with artificial interface (saw cut) 18
Figure 2-10 Documentation of the interfaces of various test constellations a) View inside the open shear gap after the tests b) Scheme of the brickgranite arrangement 19
Figure 2-11 Multi-step shear test Bent-SV-MS1 (forward cycle) of the dry contact between two bentonite bricks The test was realized with σn = 05 1 2 4 and 6 MPa 19
Figure 2-12 Characterisation of the granite contact surface a) Histogram of the height distribution of the later shear surface b) sample dimensions c) schematics of the bentonite brickgranite aggregate prepared for shearing 20
Figure 2-13 Multi-step shear test BentGran-SV-MS1 (forward cycle) of the dry contact between bentonite brick granite surface The test was realized with σn = 05 1 and 2 MPa 21
FORGE Report Dxxx ndash Ver0
iv
Figure 2-14 Summary of shear tests on interfaces between bentonite brick bentonite brick respectively bentonite brick granite ndash MOHR-COULOMB-diagram 22
Figure 3-1 Principle of the new designed oedometer-cell for gas injection tests on bufferbuffer or bufferrock interfaces at defined bentonite swelling pressures 24
Figure 3-2 Pre-saturation of bentonite brick aggregates (left) ax = 2 MPa ndashcentral injection through a injection hole with radial fluid flow (middle) ax = 4 MPa ndash central injection through a injection hole with radial fluid flow (right) ax = zero ndash axial water injection with free swelling 24
Figure 3-3 Summary of the mock up test Sondershausen upper sketch the test design The picture below shows the humidity distribution inside the buffer (vertical profile along the dam axis) 26
Figure 3-4 Experimental setup for gas-breakthrough measurements under constant sample volume 27
Figure 3-5 Gas breakthrough test- axial stress and gas pressure respectively resulting gas flow vs time Ax ndashinit asymp 2 MPa 27
Figure 3-6 Gas breakthrough test- axial stress and gas pressure respectively resulting gas flow vs time Ax ndashinit asymp 4 MPa The inset shows the central filter plate ( = 9mm) which was installed to ensure no blockage of the fluid inflow to low-permeable bentonite matrix 28
Figure 3-7 Bentonite brickbrick aggregate ndash dismantled sample after controlled saturation by injecting water directly on the interface (compare injection filter plate in Figure 3-6) Note the sharp color contrast at the former interface (height of the sample 12 cm) 29
Figure 3-8 Single-step shear test on the healed contact between bentonite brick brick surface The test was realized with σn = 05MPa 30
Figure 3-8 Summary of both shear tests on ldquohealedrdquo interfaces between bentonite brick bentonite brick in comparison to the former results summarized in Figure 2-14 ndash MOHR-COULOMB-diagram 30
TABLES
Table 1-1 Material parameters of the reference material Wetro FS40 bentonite bricks (taken from SITZ et al 2001) 9
Table 2-1 Results from triaxial deformations tests ( = 2 10-5 1s) 14
Table 2-2 Shear test results 23
FORGE Report Dxxx ndash Ver0
v
SummaryThis report describes preliminary results obtained as part of IfG-work concerning the FORGE research program
Independently from the respective radioactive waste repository concept knowledge of gas transport properties through sealing or buffer materials is of vital importance for long-termperformance assessments because some gas generation may take place as a consequence of different processes (for instance corrosion of iron) In addition to the matrix properties of the sealing material it is expected that conductive discrete interfaces inside the sealing elements itself and to the host rock may act not only as mechanical weakness planes but also as preferential gas pathways For instance despite the self-sealing capacity of bentonite inherent existing interfaces may be reopened during gas injection However for interpretation resp numerical back analysis of field tests (ie FEBEX Lasgit) only limited experimental data from laboratory tests are available
The lab investigations are aiming (1) on hydro-mechanical properties of interfaces between bentonite bricks itself and (2) on mechanical contacts of bentonite blocks and concrete to various host rocks ie granite They consist of
long-term water injection tests in a new designed oedometer cell (duration of several month up to two years) with different sample constellations (brickbrick resp brickhost rock) under well controlled stress and swelling conditions to provide data about
o time dependent interface ldquopermeabilityrdquo changes (ie sealing) during long-termcompaction and fluid injection
o gas entry pressures and relative gas permeability changes during pressure dependent gas injection
shear tests to quantify mechanical interface properties under well controlled shear forces or displacements
As initial characterization (dry state) both triaxial and direct strength tests were performed which allow to separate between matrix and interface properties
Based on the experimental results the following conclusions can be drawn
At dry conditions gas flow along interfaces is at least 4 orders higher than through the matrix (eg 10-16 m2) Increase of confinement significantly lowers the gas flow (10 MPa more than one order) but the effect is more pronounced for interfaces crack sealing
Saturation of bentonite brick aggregates ie bricks with a common interface is not affected by the interfaces and only weakly by the acting confining pressure
During gas injection (stepwise increasing of the gas pressure) a significant effect is only observed if the minimal stress is passed resulting in some minor (local) gas flow
The gas break through results in stationary inflow but no significant effect on the total stress is measured probably due to the central (spherical) gas injection (no outflow)
The measured gas threshold pressures under constant volume conditions significantly exceed the sum of the swelling pressure and externally-applied porewater pressure ndashdrained conditions (pi gt ax some MPa)
Despite the former interface the bentonite block aggregate behaves like a homogenous matrix ie healing of the interface took place during saturation This favorable effectwas confirmed by shear tests demonstrating the development of cohesion
FORGE Report Dxxx ndash Ver0
6
1 IntroductionThe current report is a part of the activities in Work Package 3 (WP3) in the FORGE Project
The long-term safety of the disposal of nuclear waste is an important issue in all countries with a significant nuclear program Repositories for the disposal of high-level and long-lived radioactive waste generally rely on a multi-barrier system to isolate the waste from the biosphere The multi-barrier system typically comprises the natural geological barrier provided by the repository host rock and its surroundings and an engineered barrier system (EBS) ie the backfilling and sealing of shafts and galleries to block any preferential path for radioactive contaminants
This multi-barrier principle creates an overall robustness of the system that enhances confidence that the waste will be successfully contained However independently from the respective radioactive waste repository concept knowledge of gas transport properties through sealing or buffer materials is of vital importance for long-term performance assessments because some gas generation may take place as a consequence of different processes (for instance corrosion of iron)
Figure 1-1 Scheme of fluid-transport through interfaces in a bentonite buffer consisting of bricks
In the last two decades reliable information about the potential host rocks and the sealing materials (eg bentonite mixtures concrete rock backfill) has been obtained (for recentreviews see METCALF et al 2009 and NORRIS 2009) However only limited knowledge exists about the importance of contacts or interfaces between these different materials or construction parts ie seal plugs eg POPP (2009) As schematically shown in Figure 1-1 it is expected that in addition to the matrix properties of the sealing material conductive discreteinterfaces inside the sealing elements itself and to the host rock may act not only as mechanical weakness planes but also as preferential gas pathways For instance despite the self sealing
FORGE Report Dxxx ndash Ver0
7
capacity of bentonite inherent existing interfaces may be reopened during gas injectionMoreover it has been shown by BUZZI et al (2006) that bentonite is very sensitive to hydraulic erosion producing flow channels within the interface zone
But for interpretation of the relevancy of such phenomena resp numerical back analysis of field tests (ie FEBEX Lasgit) only limited experimental data from laboratory tests are availableTherefore it can be stated that further laboratory test results are important to deduce the hydro-mechanical (HM) parameters for numerical calculations evaluating the long-termintegrity of EBS especially bentonite bearing buffer systems
In the literature a variety of different possible bentonite mixtures or clay minerals has been projected as backfill material in the nuclear waste context Pure bentonite has been rarely proposed for the engineered barrier due to technical reasons eg low mechanical strength of the blocks or aggregates limitation of swelling pressure Therefore pre-fabricated bentonite blocks are an option where usually some aggregates (eg sand or crushed rock) are added to the bentonite in order to enhance its mechanical properties In the past several in situ tests have demonstrated that bentonite buffer or sealing plugs may be built as masonry of different bricks or as a monolith system consisting of large blocks
In the framework of WP3 IfG performed lab investigations aiming (1) on interfaces between bentonite bricks itself and (2) on mechanical contacts of bentonite blocks and concrete to various host rocks ie granite
11 IFG-WORK ndash ACTUAL STATEThe main objectives of the laboratory work of IfG are twofold
1 to investigate gas transport properties of interfaces between bentonite blocks The sub-items are
a to perform long-term laboratory tests (duration of several month up to two years) on artificial contact interfaces between sealing material bricks (ie bentonite) and to the host rock under well controlled stress and swelling conditions with water injection resp subsequent gas injection
b to provide data for time dependent interface ldquopermeabilityrdquo changes (ie sealing) during long-term compaction and fluid injection
c to provide data about gas entry pressures and relative gas permeability changes during pressure dependent gas injection
2 to provide experimental data from short term tests in a direct shear apparatus with measuring of gas transport and mechanical contact properties for the various interface configurations undergoing shear deformation at defined normal stresses1
The actual report describes results of the hydro-mechanical pre-characterization of bentonite bricks supplemented by shear tests between brick interfaces and to the host rock (granite) and preliminary results of gas injection tests on partially flooded bentonite sample constellations
1 The ldquoshear failurerdquo of a sealing plug due to fluid pressurisation or swelling phenomena is governed by hydro-mechanical characteristics of the confined plug host rock interface If shear slip occurs on a critically stressed interface it can raise the permeability of the fracture through several mechanisms including brecciation surface roughness and breakdown of seals (BARTON et al 1995) However increased pore pressures acting in the interface may also lower the acting minimal stress thus initiating the shear failure
FORGE Report Dxxx ndash Ver0
8
12 MATERIAL DESCRIPTIONWe used as reference material artificial bentonite bricks consisting of a sand clay-bentonite mixture but the variety of bentonite-based buffer materials has to be taken in mind The bricks were manufactured in the frame work of the so-called dam - project ldquoSondershausenrdquo ie a German research project between 1997 and 2002 funded by BMBF2 and TMLNU3
The underground test was performed as a demonstration experiment of a multi-component drift barrier system in a salt repository (details are given by SITZ et al 2001) The sealing element consists of the already mentioned bentonite bricks which were hydraulically tested by pressurization through pressure chamber 1 (Figure 1-2) A static abutment was constructed consisting of a salt brick masonry in a prismatoid shaped extension of the drift The completesystem was installed and tested in the salt mine Sondershausen Afterwards the dam was rebuilt4
Figure 1-2 Layout of the full scale drift sealing test Sondershausen (after SITZ et al 2001)
2 BMBF Bundesministerium fr Bildung und Forschung 3 TMLNU Thringer Ministerium fr Landwirtschaft Naturschutz und Umwelt4 In the test phase of several months the dam was loaded with a brine fluid pressure up to 8 MPa However as later found due to leakage through the so called floor-channel (central leading through the building for cables and pressure tubes) and fluid flow around the sealing system the salt bricks were partially flooded with brine which induces a spontaneous loss of strength resulting in a movement of the sealing element for more than 15 cm After finishing the pressure tests the dam has been completely rebuild to provide access to the various elements and to the contact zone between dam and the surrounding rock salt By that means it was possible to take samples of the partially flooded bentonite to measure its humidity content
Although the humidity distribution in the sealing elements indicated that partial flooding through the contact zone took place only weak indications for erosion phenomena in the contact zone between dam and the salt contour were observed but local fluid leakage points were attributed to movements of brine through the EDZ However the obtained swelling pressure in the sealing elements was not high enough to closure these pathways
FORGE Report Dxxx ndash Ver0
9
An important topic of the project was the development of appropriate pre-compacted bentonite bricks composed of bentonite (Calcigel5) and sand which should act as the long-term sealing element supposed to NaCl-brine Evaluating a suite of varies composition ratiosbetween both constituents finally the so-called Wetro FS40 bentonite bricks were selected for the test
The manufactured bentonite bricks (at least 140t material) were industrially produced by the company ldquoFeuerfestwerke Wetrordquo with a size of 25cm x 125cm x 625cm applying compressive stresses in the order of 40 ndash 50 MPa The relevant material properties of the bricks aresummarized in Table 1-1
Table 1-1 Material parameters of the reference material Wetro FS40 bentonite bricks (taken from Sitz et al 2001)
Composition ca 60 bentonite (Calcigel) + 40 quartz-sand
Water-content () 7505 Compressed density (gcm3) 227001 Bentonite dry density (gcm3) 189002 Initial saturation (-) 077004 Hydraulic conductivity with NaCl-brine (ms) ca 10-12
Swelling pressure (MPa) - NaCl 35
Figure 1-3 Wetro FS40 bricks
After producing the bricks the bricks were sealed with plastic wrap and stored at ambient conditions on pallets For our lab tests cylindrical samples were prepared in specified dimensions for carrying out the laboratory tests using a lathe
2 Hydro-mechanical characterization of bentonite bricksFor a performance assessment of the long-term sealing or buffer system build up by bentonite bricks knowledge of the hydro-mechanical properties eg permeability and strength are of urgent need not only for dimensioning a drift sealing plug but also for a prognoses of property changes which may occur in the long-term after closure of the repository eg due to rock convergence or water inflow However because artificial interfaces between the various elements and to the host rocks exist also the contact properties between these bricks and between the bricks and host rock ie granite have to be determined
The investigations are aiming on the characterization of
Matrix properties ieo Compressive strengtho Gas permeability (dry state)
5 CALCIGEL is a natural Calcium bentonite produced from selected Bavarian bentonite deposits The material has the following mineralogical composition Montmorillonite 60 ndash 70 Quartz 6 ndash 9 Feldspar 1 ndash 4 Kaolinite 1 ndash2 Mica 1 ndash 6 and other minerals 5 ndash 10 (source httpwwws-cppcom)
FORGE Report Dxxx ndash Ver0
10
Interface properties ie
o Shear strength between blocks and to the rock contouro Gas permeability ie block aggregates with interfaces
21 METHODOLOGY
211 Strength testingThe strength and permeability measurements were performed in a standard Karman-cell (KRMN 1911) in the servo-hydraulic testing machine (RBA 2500 SCHENKTREBEL Germany ndashusing the MTS-TestStar software) allowing independent control of the radial (2 = 3 = pc) and axial stresses (Ax = 1) The cylindrical samples are sealed with rubber tubes and oil is used as confining medium Outside the vessel three LVDT transducers are mounted between the piston and the load frame near the sample for the measurement of the axial strain The axial load is determined from an external load cell
Figure 2-1 The servohydraulic testing machine RBA 2500 (a) and the scheme of the pressure vessel (b)
Axial deformation experiments (Δh resp the deformation ε1 = Δh h0) in compression or extension mode can be performed at various confining pressures (pc up to 100 MPa) and at temperatures up to 100C within a deformation rate range of 1 = 10-5 ndash 10-7 1s to chosen values of ε1 As a standard technique during the experiments the sample volume changes ΔV are determined by a volume balance of the mantle oil volume changes as measured via the pressure intensifier and the axial piston displacement in the cell
PIPIPP ASAhV (2-1)
FORGE Report Dxxx ndash Ver0
11
with ΔSPI = displacement of the cylinder within the pressure intensifierAPI = cross section of the piston within the pressure intensifierΔh = displacement of the piston of the triaxial cellAPP = cross section of the piston of the triaxial cell
0V V
V (2-2)
In calculation of the stress difference (σ1 ndash σ3) deformation-induced variation of the cross section of the specimen is considered
The leakage-freeness of the oil volume measurement equipment is tested before beginning of each measuring cycle over a waiting period of ca 1 hour However the accuracy of the volume measurement depends on the constancy of the oil temperature within the triaxial cell and within the pressure intensifier
212 Permeability testingAs shown in the schematic drawing of the triaxial pressure cell (depicted in Figure 2-1) permeability can be measured parallel to the sample cylinder axis (dimensions ca 90 mm in diameter and 180 mm long) To maintain access of the gas to the sample either a central hole exists in the plates whereby the specimens additionally will be prepared with small boreholes on their axial ends to minimize end effects during straining or filter plates are used to provide flow over the whole cross section of the sample
Figure 2-2 Flow-meter used for permeability testing
Gas-permeability is measured using nitrogen with an equipment similar to that described by PEACH amp SPIERS (1996) allowing both transient and stationary permeability measurements
Two methods are used to determine the gas flow (q) through the samples To perform the permeability measurement the primary gas pressure p1 is applied Its value depends on the test specimenrsquos permeability and on the measurement range of the gas flow-meter (0 - 10 resp 0 -500 cmmin manufacturer BRONKHORST Model F-230M)
Alternatively using a defined gas volume on the in- (V1) and outlet (V2) and measuring the
pressure increase Δp2 resp t
pp 22
is verified to determine 222 pVV whereby 2Vˆq
FORGE Report Dxxx ndash Ver0
12
At a given injection pressure gas enters into the assumed relatively large pores and displaces the pore water This process is regarded as two-phase flow After reaching a stationary flow through the specimen the amount of gas flow over a defined period of time is recorded (q)
The intrinsic permeability is calculated by the modified DARCYrsquos law for compressive media
)pp(pq
Alk L
22
21
2
(2-3)
with η = dynamical viscosityl = (h ndash t) = effective length of the flow path through the sampleh = height of the sampleA = cross section of the samplepL = pressure at gas flow measurementt = sum of the length of both holes in the samplep1 = injection pressurep2 = outlet pressure
The absence of leakage of the permeability equipment is tested before each measuring cycle using a steal sample over a waiting period of around 1 hour
213 Shear testingGeomechanical discontinuities between various buffer elements and to the host rock are probably the clearest example of existing interfaces acting as mechanical weakness zone or preferred pathways For the mechanical behavior of interfaces the relevant variables are stress traction vector with one normal component and one tangential in a simple 2-dimensional stress field (or two tangential in 3D) and the conjugate strain variables are the corresponding relative displacements (Figure 2-1) However such stress conditions can be only realized in direct shear tests which are therefore of urgent need to reproduce slip between various materials
In the past several companies have developed modern state-of-art testing equipment which allows new types of testing procedures to determine the mechanical parameters of joints and intact rock High-response servo-hydraulic systems with digital control technology strain measurement equipment mounted onto the specimen and programmable control modes enable new types of test procedures to be performed which are tailored to the specific problem eg BLUEMEL (2000) BLUEMEL amp POETSCH (2003) For realization of required shear tests a modern shear test system is available at the IfG (Figure 2-2)
Figure 2-1 Loading geometry in direct shear test
FORGE Report Dxxx ndash Ver0
13
The loading frame consists of a two-axle experimental setup with vertical and horizontal stress initiation a platform for shear test with a two-stage shear box and a servo-hydraulic control unit for two channels (vertical and horizontal) Both can be managed force or displacement controlled The test arrangement is shown in Figure 2-2 The frontal part (right) is an extremely stiff four-columned housing for fixing and vertical loading of the two-stage shear box by the upper hydraulic cylinder (up to 500 kN axial load)
Figure 2-2 The MTS ndash shear test system (model 816) available at the IfG (left) Schematic sketch of the MTS ndash test system (right)
Figure 2-3 Two-stage shear box for shear tests (Left) Schematic sketch with orientation of the specimen and the 25 mm opening between the two single boxes (Right) Prepared boxes with installed specimen The front panel with handle is for defined fixing of the shear boxes and will be removed before test start
A robust desk with a horizontal cylinder (-250 kN pressure - 160kN tension) is laterally positioned in a horizontal housing This cylinder supplies the lateral shear force The upper shear box is fixed by a horizontal housing that enables yet a twisting of approx 2 around the horizontal axes referring to the shear midpoint While a vertical load acts to the whole shear box the lower box can be horizontally displaced under weight The box is lead with less friction by mechanically high quality linear guides
The displacement of the boxes to each other under load is measured and recorded by 4 displacement transducers on the edges of the box (for vertical displacement) and by 2 additional position encoders (for horizontal displacement) Thereby a possible twisting is measured as well
FORGE Report Dxxx ndash Ver0
14
A sufficiently stiff fixing of the specimens in the shear box is a prerequisite for an exact determination of shear resistance (Figure 2-3) Therefore as the first step for investigation of the shear strength of bentonite bentonite or bentonitegranite interfaces two cut in half bricks (125 cm x 125 cm) were stacked one on the top of the other (respectively one half brick on a rough granite surface) The aggregate was covered with a plastic foil to protect them against wetting by the wet concrete that fixes the samples in the shear boxes So the contact planes between the two bricks are exactly perpendicular to the shear direction in the center of the shear box with 25 cm opening (Figure 2-10)
Samples for the second test row (brickgranite interface) were similarly prepared Instead of two bentonite bricks (or bentonite brick halves) a bentonite brick was arranged on a rough contact plane of a host rock block (ie medium-grained grained granite with an artificial fracture surface) Between both blocks was a loose horizontal contact Further preparations were done like mentioned above
22 RESULTS
221 Strength testingIn order to investigate the effect of deviatoric loading on the hydro-mechnical integrity we performed five compression tests The applied confining pressures varied between 10 and 200 MPa After hydrostatic compaction ndash pre-loading at the respective stress state ndash the samples were deformed in triaxial compression (1 gt 2 = 3) with a constant strain rate of 25 ∙ 10-5 1s
For comparison the obtained stress strain curves and the respective evolution of volumetric strain (ie dilatancy) are compared in Figure 2-4 The resulting peak strength (failure) and minimum dilatancy values (onset of dilatancy) are summarized in Table 2-1
As general starting from hydrostatical conditions the deviatoric stress increases to ensure constant rate deformation Generally the slope of the stress-strain curve of all samples exhibits the characteristic transition from initial quasi-elastic (linear) behavior to a curve with relatively large radius indicating typical strain hardening until failure at strains The stress-strain curves depicted in Figure 2-4 nicely demonstrate the effect of increasing pressure resulting in higher strength and deformability
Table 2-1 Results from triaxial deformations tests ( = 2 10-5 1s)
sample pc 1 - fail Diff-failure 1-failure (VV) 1 - min w(MPa) () (MPa) (MPa) () () (wt-)
20611 10 157 868 97 -015 032 44
20608 25 134 1313 156 -010 031 59
20607 50 343 1432 193 -035 316 54
20612 100 715 2110 311 -146 1068 48
20620 200 1150 3101 510 -413 1886 48
As evident from the experiments the deformation style changes from brittle to quasi ductile behavior with increasing confining pressure as indicated by increasing failure strains and different post failure behavior One can see a change from a sharp stress-strain curve with a significant lower post-failure stage to a more or less broad plateau without a significant failure peak
FORGE Report Dxxx ndash Ver0
15
Most important dilatant deformations occur only in a low peripheral pressure range (3 5 MPa) At higher pressures (3 10 MPa) brittle deformation is suppressed resulting in a significant compaction of several percent The change of deformation behavior is also documented in the evolution of dilatancy Whereas at low confinement dilatancy onsets significantly before the failure at low strain is dilatancy at confining pressures higher than 5 MPa suppressed and compaction dominates during the whole deformation cycle
Figure 2-4 Summary of triaxial test results on bentonite bricks in a confining pressure range between 1 and 20 MPa Note the well pronounced effect of increasing confining pressureresulting in a change from brittle to ductile behavior
Figure 2-5 Change from brittle to ductile deformation - Cracks patterns of deformed samples
The visual inspection of deformed specimens after the experiment the deformation style of the specimens demonstrates the change of deformation style from brittle to ductile At lower
FORGE Report Dxxx ndash Ver0
16
confining pressures as can be seen from Figure 2-5 a complex shear failure signature occurred whereas at 3 gt 5 MPa compressive failure dominates
For evaluating the strength behavior all test results (standard TC-tests) are graphical depicted inFigure 2-6 Despite the scattering of the strength values it can be easily seen that the general trend of increasing strength with increasing minimal stress is nicely represented by a linear strength boundary according to the MOHR-COULOMB-criterion with the respective values of
ndash friction angle () 22c ndash cohesion (MPa) 28
It has to be mentioned that the friction angle of 22 corresponds fairly well to the results of the shear tests on interfaces between bentonite bricks but without cohesion (see chapter 223)
Figure 2-6 MOHR-COULOMB-diagram of bentonite bricks
Extrapolation of the obtained straight line to a confining pressure zero delivers a value of ca 9 MPa Based on a larger number of samples the average strength of the bentonite bricks was determined in the order of 55 to 65 MPa (SITZ et al 2001) This indicates some non-linearity to unconfined conditions demonstrating the need of triaxial tests for evaluation of the strength behavior of bentonite bricks
222 Gas permeabilityAs a prerequisite for evaluation of the later saturation tests the gas permeability of the bentonite bricks was determined using different sample arrangements As depicted in Figure 2-7 two different sample arrangements were used to realize axial gas-injection tests both on the intact matrix and also on an artificial interface between two bentonite bricks
Both samples were stepwise hydrostatically loaded (up and down cycle) with continuous gas injection which facilitates permeability determination by measuring the gas flow Exemplarily
FORGE Report Dxxx ndash Ver0
17
Figure 2-8 shows the time dependent change of gas permeability through the intact bentonite brick matrix according the different loading and un-loading steps Starting from an initial gas-permeability of ca 2 ∙ 10-16 m2 the permeability decreases with increasing the applied confining stress Increase of the confining pressure up to 3 = 9 MPa results in a decrease of permeability for more than one order of magnitude At constant confining pressure permeability decreases with time indicating visco-elastic matrix-compaction The time- and stress-dependent compaction effect is at least partial reversible if the confinement is reduced ie irreversible compaction becomes visible But close inspection of pressure-dependent change of permeability as depicted in Figure 2-9 indicates that during the unloading cycle phyd lt 2 MPa the permeability increases significant which may indicate inelastic crack opening during stress release
Figure 2-7 Sample arrangement for permeability testing a) matrix-permeability b) interface permeability
Figure 2-8 Permeability testing at hydrostatic loading Time-dependent course of the experiment with the different loading steps (up and down cycle) with the resulting compactionand gas permeability
Figure 2-9 compares the results measured on the two different sample arrangements ie (left) intact matrix and (right) matrix with an artificial interface (saw cut) It becomes obvious that the
FORGE Report Dxxx ndash Ver0
18
ldquointegralrdquo permeability of the bentonite aggregate with an artificial interface is initially four orders of magnitude higher than the intact matrix ie ko-interface asymp 10-12 m2 Increase of confining pressure up to 10 MPa lowers the permeability for more than 2 orders whereas unloading of the sample results in a significant hysteresis This is clearly indicates crack sealing
Figure 2-9 Permeability testing at hydrostatic loading Gas permeability and volumetric strain vs confining pressure a) Bentonite brick matrix permeability b) Bentonite brick with artificial interface (saw cut)
223 Shear strength (initial state)
The shear testing program consists of the following sample configurations and test number(1) Bentonite brick bentonite brick
a Dry (delivery state) 2 multi-step shear testsb Wetted surface (only just before the test) 1 multi-step shear testsc Healed interface between bentonite bricks
after pre-saturation over one year 2 single-step shear tests(2) Bentonite brick rough granite surface (dry) 4 single-step shear tests
1 multi-step shear tests
Principally the test realization comprises two phases ie pre-consolidation followed by the original shear phase which can be divided in several steps at various normal stresses The test results are typically represented by a peak strength and a residual strength value after loss of cohesion between the shear interfaces
FORGE Report Dxxx ndash Ver0
19
Figure 2-10 Documentation of the interfaces of various test constellations a) View inside the open shear gap after the tests b) Scheme of the brickgranite arrangement
2231 SHEAR TESTS ON DRY BENTONITE BRICK INTERFACES
First of all the shear strength of the dry interfaces between two bentonite bricks was determined in two multiple-step shear tests each with 4 steps at normal stresses n = 05 10 2 and 4 MPa6 During the tests the lower shear box was controlled displaced forward (resp backwards) with a shear rate of 0002 mms
Figure 2-11 Multi-step shear test Bent-SV-MS1 (forward cycle) of the dry contact between two bentonite bricks The test was realized with σn = 05 1 2 4 and 6 MPa
6 To avoid brick failure the maximum normal load was set generally smaller than the average uniaxial strength
FORGE Report Dxxx ndash Ver0
20
The results of a selected shear test (Bent-SV-MS1) are shown as a variation of shear stress and dilatancy vs shear displacement (increasing load cycle) in Figure 2-11 Pre-loading of the sample to the respective normal stress results in some small compaction which developsfurther during the following shear cycles During the various shear steps contrary to experiences from tests on compact material or natural interfaces no stress peak occurs but a more or less constant shear strength level is apparent At higher normal stress states the shear stresses increase as well Concomitantly with the increase of normal stress the variation of dilatancy (always decrease) documents progressive compaction of the bentonite brick aggregate (eg the total compaction ndash during the whole test at n = 1 MPa - is ca 1mm)
The strength and dilatancy behavior does not depend on the course of loading ie if the vertical load steps are varied as upwards or downwards cycle
2232 SHEAR TESTS ON BENTONITE BRICK GRANITE INTERFACES
As a reference material for shear tests on interfaces between bentonite and granite we selected an artificial fractured cuboid of granite (20cm x 15cm x 75cm) of unknown origin The roughness of the artificial split surface was measured using a 3D surface and body scanner at the University of Freiberg (Prof KONIETZKY) The maximum scanner resolution is in the order of 2m As can be seen from Figure 2-12 the mean difference between highest and lowest asperity is in the order of 15 cm
Figure 2-12 Characterization of the granite contact surface a) Histogram of the height distribution of the later shear surface b) Sample dimensions c) Scheme of the bentonite brickgranite aggregate prepared for shearing
Overall one multiple-step shear test and four single-shear tests of bentonite brick granite samples were performed The sample arrangement is qualitatively the same as before
FORGE Report Dxxx ndash Ver0
21
Principally the test realization comprises two steps pre-loading to the respective normal stress state followed by the shear phase
Remarkably despite the existing asperities the initial compaction is only in the order of some few millimeters (depending on the stress level) which indicate that the interface ie the gap between the flat bentonite brick and the asperities is only partially closed during loading This results from the high uniaxial strength of the bentonite bricks
Exemplarily the results of the multi-step shear test are shown in Figure 2-13 which was performed with three steps at n = 05 10 and 20 MPa with displacement rates of 0002 mms Qualitatively the results are comparably to the results of the tests reported in the chapter before Surprisingly also no significant shear peak is observed but post inspection of the sheared planes indicates that local sliding of spikes with linear erosion dominates during shearing Although no significant compaction and local shear failure occurred the shearing along the rough surface requires local overcoming of the existing cohesion
Figure 2-13 Multi-step shear test BentGran-SV-MS1 (forward cycle) of the dry contact between bentonite brick granite surface The test was realized with σn = 05 1 and 2 MPa
2233 SUMMARY HYDRO-MECHANICAL PROPERTIES ndash DRY STATE
The results of the various shear tests were compiled in Table 2-2 and graphical depicted in Figure 2-14
Analog to the strength properties of an intact rock the MOHR-COLOUMB criterion can be used to describe the discontinuity plane characteristics of a jointed rock Accordingly the shear resistance on an interface at critical stress conditions (shear failure) can be expressed stress-depended by a linear dependency of cohesion (c) and angle of friction ()
τf = c + σf tan φ
FORGE Report Dxxx ndash Ver0
22
According to the different material groups two linear trends of results are clearly visible Whereas bentonitebentonite interfaces show no cohesion but significant friction obviously due to the sand content demonstrate shear tests for bentonite bricksgranite a small but significant occurrence of cohesion which was already indicated by post-evaluation of sheared interfaces The tips of the existing roughness of the granite surface are pressed into the bentonite material resulting in local erosion channels
The respective MOHR-COULOMB-parameters are as follows
τ = C + σN tanφ MOHR-COULOMBC φ
brick brick 002 210brick granite 019 196
(MPa) ()
In summary despite the small difference between both interface types comparison with Figure 2-6 demonstrate the importance of artificial interfaces between bentonite bricks as potential weakness planes
Figure 2-14 Summary of shear tests on interfaces between bentonite brick bentonite brick respectively bentonite brick granite ndash MOHR-COULOMB-diagram
FORGE Report Dxxx ndash Ver0
23
Table 2-2 Shear test results
shear strain n dilatancy time
(mm) (MPa) (MPa) (mm) (min)
bentonite brick bentonite brick
057 050 023 -040 503
383 050 021 -046 3215
782 100 038 -075 6548
1186 200 073 -120 9932
1575 400 140 -199 13208
1220 075 033 -017 2492
839 150 064 -033 5682
429 300 123 -068 9123
042 600 240 -170 12397
bentonite brick granite surface
987 200 094 -540 9120
457 400 160 -354 23913
982 100 053 -362 9120bentonite brick granite surface (wetted)
985 100 029 456 10403
3 Gas transport properties of partial saturated bentonite
31 PRE-SATURATION OF BENTONITE BRICKS WITH INTERFACESFor pre-saturation of the samples respectively for the later gas injection tests a new oedometer-like pressure cell is constructed allowing in additions gas flow measurements under defined axial sample consolidation respectively swelling conditions due to different injected water amounts
The sample arrangement consists of a stiff tube ndash oedometer ndash with two sample cylinders of pre-compacted bentonite (respectively one rock sample with a natural rough surface) which are separated by an axial interface inside Two movable pistons equipped with sinter metal plates allow control of volume changes of the sample ie compaction due to a defined axial load or expansion induced by swelling due to water injection Resulting changes in volume or axial force are measured with dial gauges or an axial oriented load cell
As can be seen from Figure 3-1 the cell design facilitates measurements of fluid transport properties through the buffer respectively along the interface between block contacts ie bufferbuffer and bufferblock at defined interface conditions The cell diameter is 90 mm and the overall sample height is ca 120 mm (consisting of two cylindrical specimens ndash 60 mm height) Sinter metal plates ensure access to the axial ends of the sample
FORGE Report Dxxx ndash Ver0
24
The special design of the cell allows fluid injection (1) along the axial direction ie for pre-saturation of the bentonite to induce swelling or measurement of the matrix permeability and (2) through a central hole along the interface ie investigation of contact permeability
pGAs - Inlet
pGas - Outlet
pH2O - Inlet
pH2O - Outlet
FaxLoad cell
Figure 3-1 Principle of the new designed oedometer-cell for gas injection tests on bufferbuffer or bufferrock interfaces at defined bentonite swelling pressures
0 100 200 300
Time (d)0 100 200 300
Time (d)
00
10
20
30
40
50
60
70
80
90
100
0 100 200 300
Time (d)
Axia
l stre
ss (M
Pa)
Inje
cted
wat
er (w
t-
)Vo
lum
etric
sw
ellin
g (
)
I I
ax
water
Vol
ax
water
Volax
water
Vol
Figure 3-2 Pre-saturation of bentonite brick aggregates (left) ax = 2 MPa ndash central injection through a injection hole with radial fluid flow (middle) ax = 4 MPa ndash central injection through a injection hole with radial fluid flow (right) ax = zero ndash axial water injection with free swelling
FORGE Report Dxxx ndash Ver0
25
311 Lab test resultsThree long-term injection tests (pi = 04 MPa) were started in Spring 2010 whereby three different situations were realized
(1) central water injection through an injection hole through a central tube resulting (as proposed) in radial fluid flow along the brick interface
a ax = 4 MPa
b ax = 2 MPa
(2) axial water injection (without axial load) through the end plates (sintered metal) resulting in free axial swelling
The various curves of water consumption and the resulting swelling are summarized in Figure 3-2 The results can be summarized as follows
(1) The water consumption during swelling depends
a obviously not on the injection geometry
b and only weakly on the axial load
No preferred flow along the interface ie matrix swelling
(2) More than 1 year water injection was not sufficient to reach full saturation ie no water out flow but in the center full saturation is assumed Therefore after one year water injection the tests 1a and 1b were finished to facilitate gas injection tests
312 Comparison to the mock-up test SondershausenDespite the different scales of lab and field tests and the limited number of tests the results correspond very well to existing experiences made from in situ tests where sealing elements are constructed of different blocks or bricks Figure 3-3 illustrates the observations made during testing the sealing element of the mock up test Sondershausen (see short description in chapter 12) The sealing element consists of masonry of bentonite bricks (FS 50) which was tested with NaCl-fluid at a maximum fluid pressure of pfl asymp 8 MPa (pswellasymp 1 MPa) (for details see SITZ 2001)
The following conclusions were drawn from the in situ test (evaluation of the humidity distribution after rebuilding the plug)
1Proof of clear saturation front during fluid pressurization
2Homogenous humidity distribution inside the partially saturated buffer
Low effect of artificial interfaces inside the buffer
3Clear pathways in the contact zone buffer host rock (salt)
Interfaces to the host rock are obviously the most relevant pathways
These observations correspond to the results of the laboratory tests therefore demonstrating that interfaces inside the sealing plug are of minor importance because due to the overall swelling effect they will be efficiently sealed
FORGE Report Dxxx ndash Ver0
26
Figure 3-3 Summary of the mock-up test Sondershausen Upper sketch the test design The picture below shows the humidity distribution inside the buffer (vertical profile along the dam axis)
32 GAS INJECTION TESTS ndash DETERMINATION OF GAS BREAKTHROUGHFor the gas-injection tests we used a constant volume radial flow geometry realized in the experimental setup depicted in Figure 3-4
Gas flow measurements under constant volume conditions
A servo-controlled load frame (up to 250kN load capacity) ensures defined loading respectively volume conditions The axial strain (measured between the load plates) is kept constant during the test (resolution 1 m) ie if the sample volume increases due to gas-injection the axial force is automatically increased During the test the change of the axial stress is measured via a load cell
Gas injection at constant injection pressure on the at least partial saturated bentonite sample with a radial flow geometry
After finishing the saturation instead of water gas was injected through the central pipeof the swelling cell which should result in radial flow if preferred flow along the former interface occurs During the test the samples is drained in the axial direction ie through the axial filter plates
During stepwise increase of the primary gas pressure the inflow of gas is measured with a flow-meter ie during each pressure step firstly the dead volume before the gas access to the sample is pressurized which results in an inflow-peak If gas pressureequilibrium before and after the flow-meter is reached and the sample behaves nearly gastight the apparent flow rate becomes zero Gas break through ie overcome of the
FORGE Report Dxxx ndash Ver0
27
capillary entry pressure is indicated by quasi-constant gas-in-flow or gas-outflow (ie bubbles in a burette)
Two gas breakthrough tests were performed at initial axial pressures of 2 respectively 4 MPa The results are summarized in Figure 3-5 respectively Figure 3-6
Figure 3-4 Experimental setup for gas-breakthrough measurements under constant sample volume
Figure 3-5 Gas breakthrough test ndash axial stress and gas pressure respectively resulting gas flow vs time Ax ndashinit asymp 2 MPa
FORGE Report Dxxx ndash Ver0
28
After finishing the pre-saturation of the bentonite the samples were axially unloaded and the cells were put into the servo-hydraulic load frame Before the tests a waiting period of ca 1 day (at the nominal axial stress) was usually applied to ensure equilibrium inside the sampleExemplarily Figure 3-5 shows the stability of the axially applied strain control which is in the order of 1 m However this results in a variation of the axial stress of 02 MPa
Then the gas pressure was stepwise increased each with a waiting period of ca 05 hour The change of the gas pressure is always followed by peak of gas-inflow as explained before but becomes zero If a gas pressure state some few bars below the axial stress is reached the gas pressure was kept constant over a period of 12 to 15 hours to exclude time effects of a gas breakthrough ie delay to slow water expulsion Despite some scattering no significant gas in- or outflow was observed
In the next phase the stepwise pressurization was continued If the gas-pressure reaches the acting axial stress ie Ax ndashinit = min some local gas flow becomes apparent but with some instability Further pressure increase did not change the gas flow significant until the breakthrough occurred
1st test Ax ndashinit = min asymp 2 MPa 27 ndash 29 MPa ie 07 ndash 09 MPa higher than min
2nd test Ax ndashinit = min asymp 4 MPa 75 MPa ie 35 MPa higher than min
The tests clearly demonstrate that the gas-entry pressures are significantly higher than min In addition no effect of the interface ie preferred radial gas flow is visible In a first approach the bentonite brick aggregate seems to behave like a homogenous buffer material For further discussion see the next chapter
Figure 3-6 Gas breakthrough test- axial stress and gas pressure respectively resulting gas flow vs time Ax ndashinit asymp 4 MPa The inset shows the central filter plate ( = 9mm) which was installed to ensure no blockage of the fluid inflow to low-permeable bentonite matrix
FORGE Report Dxxx ndash Ver0
29
33 SHEAR STRENGTH (HEALED SPECIMENS)The gas injection tests results delivered very high gas entry pressures which succeeded the minimal stress which has been axially applied by about several MPa (depending on the order of stress) A possible explanation could be that due to the central gas injection locally a high water pressure is generated The local pore fluid pressure may be temporarily preserved during the fast pressurization with gas due to the low permeability of the matrix although the system is drained by the axial filter plates However it becomes obvious that the effect of the former interface as a potential pathway does not exist anymore This may indicate that the interface is healed during the time-dependent swelling process
Healing means the development of cohesion ie which results in bentonite from electrostatic forces among fine particles (clay minerals) and water Shear tests represent a simple way to quantify the amount of cohesion as already demonstrated before Here we used the bentonite brick aggregates after dismantling the sample Visual inspection of the former interface give no hints for a mechanical or hydraulical weakness plane ie only the color contrast indicates the former contact plane
Figure 3-7 Bentonite brickbrick aggregate ndash dismantled sample after controlled saturation by injecting water directly on the interface (compare injection filter plate in Figure 3-6) Note the sharp color contrast at the former interface (total height of the sample 12 cm)
To demonstrate that real healing took place we performed with both specimens direct shear tests on the former interface between both bentonite brick halves The procedure is the same as described in 213
FORGE Report Dxxx ndash Ver0
30
Figure 3-8 Single-step shear test on the healed contact between bentonite brick brick surface The test was realized with σn = 05 MPa
Figure 3-9 Summary of both shear tests on ldquohealedrdquo interfaces between bentonite brick bentonite brick in comparison to the former results summarized in Figure 2-14 ndash MOHR-COULOMB-diagram
FORGE Report Dxxx ndash Ver0
31
The results differ significantly from the shear tests performed on the dry or only short wetted contact planes The following results are obtained from Figure 3-8
bull Shear test curves
Exemplarily the results of the shear test performed at n = 05 MPa are shown As usual for intact material shear stress grows with progressive shear displacement in elastic manner up to a peak and then drops down to a residual value Peak and residual values are higher with applied normal stress Repeating the experiment with the 2nd sample at n = 15 MPa (not shown here) results in a similar shape of the strength curve but the increase of strength is not so significant indicating that the influence of the acting normal stress is low ie the friction angle is only small
bull Dilatancy curves
Due to the surface roughness and asperities a bedding plane tends to dilate upon shear although this effect tends to level off after certain amount of prescribed shear displacement and is lower for higher normal stress (not shown here)
For comparison with earlier measurements on dry interfaces shear stress peaks and residual values of shear stress obtained in both single experiments are represented in Figure 3-9 against normal stress leading to open envelopes of the Coulomb type The evaluation of these tests with σn = 05 resp 15 MPa documents a cohesion of 06 MPa in the τ-σn-diagram Remarkably the angle of friction with ca 10 is much lower than that of tests on dry contacts before healing
4 ConclusionsThe performed lab investigations cover a wide field of hydro-mechanical properties of bentonite bricks which represent a favorable option for constructing sealing plugs in different host rock environments
Based on the experimental results the following conclusions can be drawn
At dry conditions gas flow along interfaces is at least 4 orders higher than through the matrix (eg 10-16 m2) Increase of confinement significantly lowers the gas flow (10 MPa more than one order) but the effect is more pronounced for interfaces crack sealing
Saturation of bentonite brick aggregates ie bricks with a common interface is not affected by the interfaces and only weakly by the acting confining pressure
During gas injection (stepwise increasing of the gas pressure) a significant effect is only observed if the minimal stress is passed resulting in some minor (local) gas flow
The gas break through results in stationary inflow but no significant effect on the total stress is measured probably due to the central (spherical) gas injection (no outflow)
The measured gas threshold pressures under constant volume conditions significantly exceed the sum of the swelling pressure and externally-applied porewater pressure ndashdrained conditions (pi gt ax some MPa)
An important observation is that despite the former interface the bentonite block aggregatebehaves during the saturation of the buffer not different than the homogenous matrix This has been confirmed as well by gas injection tests on the former interface as well by shear tests The
FORGE Report Dxxx ndash Ver0
32
demonstration of the development of cohesion after pre-saturation is a favorable finding because this verifies physical healing of the interface In addition cohesion inside the matrix helps to explain why the measured gas entry pressures are higher than the applied minimal stress
However this observation is only based on two tests which need to be confirmed by the forthcoming experiments Also for understanding the physical background of high entry pressures of gas into the water-saturated bentonite matrix more experimental investigations are of urgent need
5 ReferencesBARTON C A ZOBACK M D amp MOOS D 1995 Fluid flow along potentially active faults in crystalline rock
Geology 23 683ndash686
BLUEMEL M 2000 Improved Procedures for Laboratory Rock Testing EUROCK 2000 ISRM Symposium Aachen 573 ndash 578
BLUEMEL M amp POETSCH M 2003 Direct Shear Testing System International Symposium on GeoTechnical Measurements and Modelling Karlsruhe 327 ndash 331
BUZZI O 2004 Hydromecanique du contact entre geomateriaux Experimentation et modelisation Application au stockage de dechets nucleaires These Universite Joseph Fourier Grenoble France
METCALF R WATSON S P REES J H HUMPHREYS PAUL AND KING F 2008 Gas generation and migration from a deep geological repository for radioactive waste A review of NirexNDArsquos work Technical Report NWAT Environment Agency Penrith Cumbria
NORRIS S 2009 Summary of Gas Generation and Migration Current State-of-the-Art (draft - July 2009) FORGE D12-R
PEACH CJ amp SPIERS CJ 1996 Influence of crystal plastic de-formation on dilatancy and permeability development in synthetic salt rock Tectonophysics 256 101-128
POPP T 2009 State of the art report on gas transport through interfaces FORGE D31-R (WP 33) 48 pp
SITZ P 2003 Entwicklung eines Grundkonzeptes fr langzeitstabile Streckenverschlussbauwerke fr UTD im Salinar Bau und Test eines Versuchsverschlussbauwerkes unter realen Bedingungen (BMBF-gefrdertes FE-Vorhaben Nr 02 C 05472) Abschlubericht TU Bergakademie Freiberg Institut fr Bergbau 2003

FORGE Report Dxxx ndash Ver0
iv
Figure 2-14 Summary of shear tests on interfaces between bentonite brick bentonite brick respectively bentonite brick granite ndash MOHR-COULOMB-diagram 22
Figure 3-1 Principle of the new designed oedometer-cell for gas injection tests on bufferbuffer or bufferrock interfaces at defined bentonite swelling pressures 24
Figure 3-2 Pre-saturation of bentonite brick aggregates (left) ax = 2 MPa ndashcentral injection through a injection hole with radial fluid flow (middle) ax = 4 MPa ndash central injection through a injection hole with radial fluid flow (right) ax = zero ndash axial water injection with free swelling 24
Figure 3-3 Summary of the mock up test Sondershausen upper sketch the test design The picture below shows the humidity distribution inside the buffer (vertical profile along the dam axis) 26
Figure 3-4 Experimental setup for gas-breakthrough measurements under constant sample volume 27
Figure 3-5 Gas breakthrough test- axial stress and gas pressure respectively resulting gas flow vs time Ax ndashinit asymp 2 MPa 27
Figure 3-6 Gas breakthrough test- axial stress and gas pressure respectively resulting gas flow vs time Ax ndashinit asymp 4 MPa The inset shows the central filter plate ( = 9mm) which was installed to ensure no blockage of the fluid inflow to low-permeable bentonite matrix 28
Figure 3-7 Bentonite brickbrick aggregate ndash dismantled sample after controlled saturation by injecting water directly on the interface (compare injection filter plate in Figure 3-6) Note the sharp color contrast at the former interface (height of the sample 12 cm) 29
Figure 3-8 Single-step shear test on the healed contact between bentonite brick brick surface The test was realized with σn = 05MPa 30
Figure 3-8 Summary of both shear tests on ldquohealedrdquo interfaces between bentonite brick bentonite brick in comparison to the former results summarized in Figure 2-14 ndash MOHR-COULOMB-diagram 30
TABLES
Table 1-1 Material parameters of the reference material Wetro FS40 bentonite bricks (taken from SITZ et al 2001) 9
Table 2-1 Results from triaxial deformations tests ( = 2 10-5 1s) 14
Table 2-2 Shear test results 23
FORGE Report Dxxx ndash Ver0
v
SummaryThis report describes preliminary results obtained as part of IfG-work concerning the FORGE research program
Independently from the respective radioactive waste repository concept knowledge of gas transport properties through sealing or buffer materials is of vital importance for long-termperformance assessments because some gas generation may take place as a consequence of different processes (for instance corrosion of iron) In addition to the matrix properties of the sealing material it is expected that conductive discrete interfaces inside the sealing elements itself and to the host rock may act not only as mechanical weakness planes but also as preferential gas pathways For instance despite the self-sealing capacity of bentonite inherent existing interfaces may be reopened during gas injection However for interpretation resp numerical back analysis of field tests (ie FEBEX Lasgit) only limited experimental data from laboratory tests are available
The lab investigations are aiming (1) on hydro-mechanical properties of interfaces between bentonite bricks itself and (2) on mechanical contacts of bentonite blocks and concrete to various host rocks ie granite They consist of
long-term water injection tests in a new designed oedometer cell (duration of several month up to two years) with different sample constellations (brickbrick resp brickhost rock) under well controlled stress and swelling conditions to provide data about
o time dependent interface ldquopermeabilityrdquo changes (ie sealing) during long-termcompaction and fluid injection
o gas entry pressures and relative gas permeability changes during pressure dependent gas injection
shear tests to quantify mechanical interface properties under well controlled shear forces or displacements
As initial characterization (dry state) both triaxial and direct strength tests were performed which allow to separate between matrix and interface properties
Based on the experimental results the following conclusions can be drawn
At dry conditions gas flow along interfaces is at least 4 orders higher than through the matrix (eg 10-16 m2) Increase of confinement significantly lowers the gas flow (10 MPa more than one order) but the effect is more pronounced for interfaces crack sealing
Saturation of bentonite brick aggregates ie bricks with a common interface is not affected by the interfaces and only weakly by the acting confining pressure
During gas injection (stepwise increasing of the gas pressure) a significant effect is only observed if the minimal stress is passed resulting in some minor (local) gas flow
The gas break through results in stationary inflow but no significant effect on the total stress is measured probably due to the central (spherical) gas injection (no outflow)
The measured gas threshold pressures under constant volume conditions significantly exceed the sum of the swelling pressure and externally-applied porewater pressure ndashdrained conditions (pi gt ax some MPa)
Despite the former interface the bentonite block aggregate behaves like a homogenous matrix ie healing of the interface took place during saturation This favorable effectwas confirmed by shear tests demonstrating the development of cohesion
FORGE Report Dxxx ndash Ver0
6
1 IntroductionThe current report is a part of the activities in Work Package 3 (WP3) in the FORGE Project
The long-term safety of the disposal of nuclear waste is an important issue in all countries with a significant nuclear program Repositories for the disposal of high-level and long-lived radioactive waste generally rely on a multi-barrier system to isolate the waste from the biosphere The multi-barrier system typically comprises the natural geological barrier provided by the repository host rock and its surroundings and an engineered barrier system (EBS) ie the backfilling and sealing of shafts and galleries to block any preferential path for radioactive contaminants
This multi-barrier principle creates an overall robustness of the system that enhances confidence that the waste will be successfully contained However independently from the respective radioactive waste repository concept knowledge of gas transport properties through sealing or buffer materials is of vital importance for long-term performance assessments because some gas generation may take place as a consequence of different processes (for instance corrosion of iron)
Figure 1-1 Scheme of fluid-transport through interfaces in a bentonite buffer consisting of bricks
In the last two decades reliable information about the potential host rocks and the sealing materials (eg bentonite mixtures concrete rock backfill) has been obtained (for recentreviews see METCALF et al 2009 and NORRIS 2009) However only limited knowledge exists about the importance of contacts or interfaces between these different materials or construction parts ie seal plugs eg POPP (2009) As schematically shown in Figure 1-1 it is expected that in addition to the matrix properties of the sealing material conductive discreteinterfaces inside the sealing elements itself and to the host rock may act not only as mechanical weakness planes but also as preferential gas pathways For instance despite the self sealing
FORGE Report Dxxx ndash Ver0
7
capacity of bentonite inherent existing interfaces may be reopened during gas injectionMoreover it has been shown by BUZZI et al (2006) that bentonite is very sensitive to hydraulic erosion producing flow channels within the interface zone
But for interpretation of the relevancy of such phenomena resp numerical back analysis of field tests (ie FEBEX Lasgit) only limited experimental data from laboratory tests are availableTherefore it can be stated that further laboratory test results are important to deduce the hydro-mechanical (HM) parameters for numerical calculations evaluating the long-termintegrity of EBS especially bentonite bearing buffer systems
In the literature a variety of different possible bentonite mixtures or clay minerals has been projected as backfill material in the nuclear waste context Pure bentonite has been rarely proposed for the engineered barrier due to technical reasons eg low mechanical strength of the blocks or aggregates limitation of swelling pressure Therefore pre-fabricated bentonite blocks are an option where usually some aggregates (eg sand or crushed rock) are added to the bentonite in order to enhance its mechanical properties In the past several in situ tests have demonstrated that bentonite buffer or sealing plugs may be built as masonry of different bricks or as a monolith system consisting of large blocks
In the framework of WP3 IfG performed lab investigations aiming (1) on interfaces between bentonite bricks itself and (2) on mechanical contacts of bentonite blocks and concrete to various host rocks ie granite
11 IFG-WORK ndash ACTUAL STATEThe main objectives of the laboratory work of IfG are twofold
1 to investigate gas transport properties of interfaces between bentonite blocks The sub-items are
a to perform long-term laboratory tests (duration of several month up to two years) on artificial contact interfaces between sealing material bricks (ie bentonite) and to the host rock under well controlled stress and swelling conditions with water injection resp subsequent gas injection
b to provide data for time dependent interface ldquopermeabilityrdquo changes (ie sealing) during long-term compaction and fluid injection
c to provide data about gas entry pressures and relative gas permeability changes during pressure dependent gas injection
2 to provide experimental data from short term tests in a direct shear apparatus with measuring of gas transport and mechanical contact properties for the various interface configurations undergoing shear deformation at defined normal stresses1
The actual report describes results of the hydro-mechanical pre-characterization of bentonite bricks supplemented by shear tests between brick interfaces and to the host rock (granite) and preliminary results of gas injection tests on partially flooded bentonite sample constellations
1 The ldquoshear failurerdquo of a sealing plug due to fluid pressurisation or swelling phenomena is governed by hydro-mechanical characteristics of the confined plug host rock interface If shear slip occurs on a critically stressed interface it can raise the permeability of the fracture through several mechanisms including brecciation surface roughness and breakdown of seals (BARTON et al 1995) However increased pore pressures acting in the interface may also lower the acting minimal stress thus initiating the shear failure
FORGE Report Dxxx ndash Ver0
8
12 MATERIAL DESCRIPTIONWe used as reference material artificial bentonite bricks consisting of a sand clay-bentonite mixture but the variety of bentonite-based buffer materials has to be taken in mind The bricks were manufactured in the frame work of the so-called dam - project ldquoSondershausenrdquo ie a German research project between 1997 and 2002 funded by BMBF2 and TMLNU3
The underground test was performed as a demonstration experiment of a multi-component drift barrier system in a salt repository (details are given by SITZ et al 2001) The sealing element consists of the already mentioned bentonite bricks which were hydraulically tested by pressurization through pressure chamber 1 (Figure 1-2) A static abutment was constructed consisting of a salt brick masonry in a prismatoid shaped extension of the drift The completesystem was installed and tested in the salt mine Sondershausen Afterwards the dam was rebuilt4
Figure 1-2 Layout of the full scale drift sealing test Sondershausen (after SITZ et al 2001)
2 BMBF Bundesministerium fr Bildung und Forschung 3 TMLNU Thringer Ministerium fr Landwirtschaft Naturschutz und Umwelt4 In the test phase of several months the dam was loaded with a brine fluid pressure up to 8 MPa However as later found due to leakage through the so called floor-channel (central leading through the building for cables and pressure tubes) and fluid flow around the sealing system the salt bricks were partially flooded with brine which induces a spontaneous loss of strength resulting in a movement of the sealing element for more than 15 cm After finishing the pressure tests the dam has been completely rebuild to provide access to the various elements and to the contact zone between dam and the surrounding rock salt By that means it was possible to take samples of the partially flooded bentonite to measure its humidity content
Although the humidity distribution in the sealing elements indicated that partial flooding through the contact zone took place only weak indications for erosion phenomena in the contact zone between dam and the salt contour were observed but local fluid leakage points were attributed to movements of brine through the EDZ However the obtained swelling pressure in the sealing elements was not high enough to closure these pathways
FORGE Report Dxxx ndash Ver0
9
An important topic of the project was the development of appropriate pre-compacted bentonite bricks composed of bentonite (Calcigel5) and sand which should act as the long-term sealing element supposed to NaCl-brine Evaluating a suite of varies composition ratiosbetween both constituents finally the so-called Wetro FS40 bentonite bricks were selected for the test
The manufactured bentonite bricks (at least 140t material) were industrially produced by the company ldquoFeuerfestwerke Wetrordquo with a size of 25cm x 125cm x 625cm applying compressive stresses in the order of 40 ndash 50 MPa The relevant material properties of the bricks aresummarized in Table 1-1
Table 1-1 Material parameters of the reference material Wetro FS40 bentonite bricks (taken from Sitz et al 2001)
Composition ca 60 bentonite (Calcigel) + 40 quartz-sand
Water-content () 7505 Compressed density (gcm3) 227001 Bentonite dry density (gcm3) 189002 Initial saturation (-) 077004 Hydraulic conductivity with NaCl-brine (ms) ca 10-12
Swelling pressure (MPa) - NaCl 35
Figure 1-3 Wetro FS40 bricks
After producing the bricks the bricks were sealed with plastic wrap and stored at ambient conditions on pallets For our lab tests cylindrical samples were prepared in specified dimensions for carrying out the laboratory tests using a lathe
2 Hydro-mechanical characterization of bentonite bricksFor a performance assessment of the long-term sealing or buffer system build up by bentonite bricks knowledge of the hydro-mechanical properties eg permeability and strength are of urgent need not only for dimensioning a drift sealing plug but also for a prognoses of property changes which may occur in the long-term after closure of the repository eg due to rock convergence or water inflow However because artificial interfaces between the various elements and to the host rocks exist also the contact properties between these bricks and between the bricks and host rock ie granite have to be determined
The investigations are aiming on the characterization of
Matrix properties ieo Compressive strengtho Gas permeability (dry state)
5 CALCIGEL is a natural Calcium bentonite produced from selected Bavarian bentonite deposits The material has the following mineralogical composition Montmorillonite 60 ndash 70 Quartz 6 ndash 9 Feldspar 1 ndash 4 Kaolinite 1 ndash2 Mica 1 ndash 6 and other minerals 5 ndash 10 (source httpwwws-cppcom)
FORGE Report Dxxx ndash Ver0
10
Interface properties ie
o Shear strength between blocks and to the rock contouro Gas permeability ie block aggregates with interfaces
21 METHODOLOGY
211 Strength testingThe strength and permeability measurements were performed in a standard Karman-cell (KRMN 1911) in the servo-hydraulic testing machine (RBA 2500 SCHENKTREBEL Germany ndashusing the MTS-TestStar software) allowing independent control of the radial (2 = 3 = pc) and axial stresses (Ax = 1) The cylindrical samples are sealed with rubber tubes and oil is used as confining medium Outside the vessel three LVDT transducers are mounted between the piston and the load frame near the sample for the measurement of the axial strain The axial load is determined from an external load cell
Figure 2-1 The servohydraulic testing machine RBA 2500 (a) and the scheme of the pressure vessel (b)
Axial deformation experiments (Δh resp the deformation ε1 = Δh h0) in compression or extension mode can be performed at various confining pressures (pc up to 100 MPa) and at temperatures up to 100C within a deformation rate range of 1 = 10-5 ndash 10-7 1s to chosen values of ε1 As a standard technique during the experiments the sample volume changes ΔV are determined by a volume balance of the mantle oil volume changes as measured via the pressure intensifier and the axial piston displacement in the cell
PIPIPP ASAhV (2-1)
FORGE Report Dxxx ndash Ver0
11
with ΔSPI = displacement of the cylinder within the pressure intensifierAPI = cross section of the piston within the pressure intensifierΔh = displacement of the piston of the triaxial cellAPP = cross section of the piston of the triaxial cell
0V V
V (2-2)
In calculation of the stress difference (σ1 ndash σ3) deformation-induced variation of the cross section of the specimen is considered
The leakage-freeness of the oil volume measurement equipment is tested before beginning of each measuring cycle over a waiting period of ca 1 hour However the accuracy of the volume measurement depends on the constancy of the oil temperature within the triaxial cell and within the pressure intensifier
212 Permeability testingAs shown in the schematic drawing of the triaxial pressure cell (depicted in Figure 2-1) permeability can be measured parallel to the sample cylinder axis (dimensions ca 90 mm in diameter and 180 mm long) To maintain access of the gas to the sample either a central hole exists in the plates whereby the specimens additionally will be prepared with small boreholes on their axial ends to minimize end effects during straining or filter plates are used to provide flow over the whole cross section of the sample
Figure 2-2 Flow-meter used for permeability testing
Gas-permeability is measured using nitrogen with an equipment similar to that described by PEACH amp SPIERS (1996) allowing both transient and stationary permeability measurements
Two methods are used to determine the gas flow (q) through the samples To perform the permeability measurement the primary gas pressure p1 is applied Its value depends on the test specimenrsquos permeability and on the measurement range of the gas flow-meter (0 - 10 resp 0 -500 cmmin manufacturer BRONKHORST Model F-230M)
Alternatively using a defined gas volume on the in- (V1) and outlet (V2) and measuring the
pressure increase Δp2 resp t
pp 22
is verified to determine 222 pVV whereby 2Vˆq
FORGE Report Dxxx ndash Ver0
12
At a given injection pressure gas enters into the assumed relatively large pores and displaces the pore water This process is regarded as two-phase flow After reaching a stationary flow through the specimen the amount of gas flow over a defined period of time is recorded (q)
The intrinsic permeability is calculated by the modified DARCYrsquos law for compressive media
)pp(pq
Alk L
22
21
2
(2-3)
with η = dynamical viscosityl = (h ndash t) = effective length of the flow path through the sampleh = height of the sampleA = cross section of the samplepL = pressure at gas flow measurementt = sum of the length of both holes in the samplep1 = injection pressurep2 = outlet pressure
The absence of leakage of the permeability equipment is tested before each measuring cycle using a steal sample over a waiting period of around 1 hour
213 Shear testingGeomechanical discontinuities between various buffer elements and to the host rock are probably the clearest example of existing interfaces acting as mechanical weakness zone or preferred pathways For the mechanical behavior of interfaces the relevant variables are stress traction vector with one normal component and one tangential in a simple 2-dimensional stress field (or two tangential in 3D) and the conjugate strain variables are the corresponding relative displacements (Figure 2-1) However such stress conditions can be only realized in direct shear tests which are therefore of urgent need to reproduce slip between various materials
In the past several companies have developed modern state-of-art testing equipment which allows new types of testing procedures to determine the mechanical parameters of joints and intact rock High-response servo-hydraulic systems with digital control technology strain measurement equipment mounted onto the specimen and programmable control modes enable new types of test procedures to be performed which are tailored to the specific problem eg BLUEMEL (2000) BLUEMEL amp POETSCH (2003) For realization of required shear tests a modern shear test system is available at the IfG (Figure 2-2)
Figure 2-1 Loading geometry in direct shear test
FORGE Report Dxxx ndash Ver0
13
The loading frame consists of a two-axle experimental setup with vertical and horizontal stress initiation a platform for shear test with a two-stage shear box and a servo-hydraulic control unit for two channels (vertical and horizontal) Both can be managed force or displacement controlled The test arrangement is shown in Figure 2-2 The frontal part (right) is an extremely stiff four-columned housing for fixing and vertical loading of the two-stage shear box by the upper hydraulic cylinder (up to 500 kN axial load)
Figure 2-2 The MTS ndash shear test system (model 816) available at the IfG (left) Schematic sketch of the MTS ndash test system (right)
Figure 2-3 Two-stage shear box for shear tests (Left) Schematic sketch with orientation of the specimen and the 25 mm opening between the two single boxes (Right) Prepared boxes with installed specimen The front panel with handle is for defined fixing of the shear boxes and will be removed before test start
A robust desk with a horizontal cylinder (-250 kN pressure - 160kN tension) is laterally positioned in a horizontal housing This cylinder supplies the lateral shear force The upper shear box is fixed by a horizontal housing that enables yet a twisting of approx 2 around the horizontal axes referring to the shear midpoint While a vertical load acts to the whole shear box the lower box can be horizontally displaced under weight The box is lead with less friction by mechanically high quality linear guides
The displacement of the boxes to each other under load is measured and recorded by 4 displacement transducers on the edges of the box (for vertical displacement) and by 2 additional position encoders (for horizontal displacement) Thereby a possible twisting is measured as well
FORGE Report Dxxx ndash Ver0
14
A sufficiently stiff fixing of the specimens in the shear box is a prerequisite for an exact determination of shear resistance (Figure 2-3) Therefore as the first step for investigation of the shear strength of bentonite bentonite or bentonitegranite interfaces two cut in half bricks (125 cm x 125 cm) were stacked one on the top of the other (respectively one half brick on a rough granite surface) The aggregate was covered with a plastic foil to protect them against wetting by the wet concrete that fixes the samples in the shear boxes So the contact planes between the two bricks are exactly perpendicular to the shear direction in the center of the shear box with 25 cm opening (Figure 2-10)
Samples for the second test row (brickgranite interface) were similarly prepared Instead of two bentonite bricks (or bentonite brick halves) a bentonite brick was arranged on a rough contact plane of a host rock block (ie medium-grained grained granite with an artificial fracture surface) Between both blocks was a loose horizontal contact Further preparations were done like mentioned above
22 RESULTS
221 Strength testingIn order to investigate the effect of deviatoric loading on the hydro-mechnical integrity we performed five compression tests The applied confining pressures varied between 10 and 200 MPa After hydrostatic compaction ndash pre-loading at the respective stress state ndash the samples were deformed in triaxial compression (1 gt 2 = 3) with a constant strain rate of 25 ∙ 10-5 1s
For comparison the obtained stress strain curves and the respective evolution of volumetric strain (ie dilatancy) are compared in Figure 2-4 The resulting peak strength (failure) and minimum dilatancy values (onset of dilatancy) are summarized in Table 2-1
As general starting from hydrostatical conditions the deviatoric stress increases to ensure constant rate deformation Generally the slope of the stress-strain curve of all samples exhibits the characteristic transition from initial quasi-elastic (linear) behavior to a curve with relatively large radius indicating typical strain hardening until failure at strains The stress-strain curves depicted in Figure 2-4 nicely demonstrate the effect of increasing pressure resulting in higher strength and deformability
Table 2-1 Results from triaxial deformations tests ( = 2 10-5 1s)
sample pc 1 - fail Diff-failure 1-failure (VV) 1 - min w(MPa) () (MPa) (MPa) () () (wt-)
20611 10 157 868 97 -015 032 44
20608 25 134 1313 156 -010 031 59
20607 50 343 1432 193 -035 316 54
20612 100 715 2110 311 -146 1068 48
20620 200 1150 3101 510 -413 1886 48
As evident from the experiments the deformation style changes from brittle to quasi ductile behavior with increasing confining pressure as indicated by increasing failure strains and different post failure behavior One can see a change from a sharp stress-strain curve with a significant lower post-failure stage to a more or less broad plateau without a significant failure peak
FORGE Report Dxxx ndash Ver0
15
Most important dilatant deformations occur only in a low peripheral pressure range (3 5 MPa) At higher pressures (3 10 MPa) brittle deformation is suppressed resulting in a significant compaction of several percent The change of deformation behavior is also documented in the evolution of dilatancy Whereas at low confinement dilatancy onsets significantly before the failure at low strain is dilatancy at confining pressures higher than 5 MPa suppressed and compaction dominates during the whole deformation cycle
Figure 2-4 Summary of triaxial test results on bentonite bricks in a confining pressure range between 1 and 20 MPa Note the well pronounced effect of increasing confining pressureresulting in a change from brittle to ductile behavior
Figure 2-5 Change from brittle to ductile deformation - Cracks patterns of deformed samples
The visual inspection of deformed specimens after the experiment the deformation style of the specimens demonstrates the change of deformation style from brittle to ductile At lower
FORGE Report Dxxx ndash Ver0
16
confining pressures as can be seen from Figure 2-5 a complex shear failure signature occurred whereas at 3 gt 5 MPa compressive failure dominates
For evaluating the strength behavior all test results (standard TC-tests) are graphical depicted inFigure 2-6 Despite the scattering of the strength values it can be easily seen that the general trend of increasing strength with increasing minimal stress is nicely represented by a linear strength boundary according to the MOHR-COULOMB-criterion with the respective values of
ndash friction angle () 22c ndash cohesion (MPa) 28
It has to be mentioned that the friction angle of 22 corresponds fairly well to the results of the shear tests on interfaces between bentonite bricks but without cohesion (see chapter 223)
Figure 2-6 MOHR-COULOMB-diagram of bentonite bricks
Extrapolation of the obtained straight line to a confining pressure zero delivers a value of ca 9 MPa Based on a larger number of samples the average strength of the bentonite bricks was determined in the order of 55 to 65 MPa (SITZ et al 2001) This indicates some non-linearity to unconfined conditions demonstrating the need of triaxial tests for evaluation of the strength behavior of bentonite bricks
222 Gas permeabilityAs a prerequisite for evaluation of the later saturation tests the gas permeability of the bentonite bricks was determined using different sample arrangements As depicted in Figure 2-7 two different sample arrangements were used to realize axial gas-injection tests both on the intact matrix and also on an artificial interface between two bentonite bricks
Both samples were stepwise hydrostatically loaded (up and down cycle) with continuous gas injection which facilitates permeability determination by measuring the gas flow Exemplarily
FORGE Report Dxxx ndash Ver0
17
Figure 2-8 shows the time dependent change of gas permeability through the intact bentonite brick matrix according the different loading and un-loading steps Starting from an initial gas-permeability of ca 2 ∙ 10-16 m2 the permeability decreases with increasing the applied confining stress Increase of the confining pressure up to 3 = 9 MPa results in a decrease of permeability for more than one order of magnitude At constant confining pressure permeability decreases with time indicating visco-elastic matrix-compaction The time- and stress-dependent compaction effect is at least partial reversible if the confinement is reduced ie irreversible compaction becomes visible But close inspection of pressure-dependent change of permeability as depicted in Figure 2-9 indicates that during the unloading cycle phyd lt 2 MPa the permeability increases significant which may indicate inelastic crack opening during stress release
Figure 2-7 Sample arrangement for permeability testing a) matrix-permeability b) interface permeability
Figure 2-8 Permeability testing at hydrostatic loading Time-dependent course of the experiment with the different loading steps (up and down cycle) with the resulting compactionand gas permeability
Figure 2-9 compares the results measured on the two different sample arrangements ie (left) intact matrix and (right) matrix with an artificial interface (saw cut) It becomes obvious that the
FORGE Report Dxxx ndash Ver0
18
ldquointegralrdquo permeability of the bentonite aggregate with an artificial interface is initially four orders of magnitude higher than the intact matrix ie ko-interface asymp 10-12 m2 Increase of confining pressure up to 10 MPa lowers the permeability for more than 2 orders whereas unloading of the sample results in a significant hysteresis This is clearly indicates crack sealing
Figure 2-9 Permeability testing at hydrostatic loading Gas permeability and volumetric strain vs confining pressure a) Bentonite brick matrix permeability b) Bentonite brick with artificial interface (saw cut)
223 Shear strength (initial state)
The shear testing program consists of the following sample configurations and test number(1) Bentonite brick bentonite brick
a Dry (delivery state) 2 multi-step shear testsb Wetted surface (only just before the test) 1 multi-step shear testsc Healed interface between bentonite bricks
after pre-saturation over one year 2 single-step shear tests(2) Bentonite brick rough granite surface (dry) 4 single-step shear tests
1 multi-step shear tests
Principally the test realization comprises two phases ie pre-consolidation followed by the original shear phase which can be divided in several steps at various normal stresses The test results are typically represented by a peak strength and a residual strength value after loss of cohesion between the shear interfaces
FORGE Report Dxxx ndash Ver0
19
Figure 2-10 Documentation of the interfaces of various test constellations a) View inside the open shear gap after the tests b) Scheme of the brickgranite arrangement
2231 SHEAR TESTS ON DRY BENTONITE BRICK INTERFACES
First of all the shear strength of the dry interfaces between two bentonite bricks was determined in two multiple-step shear tests each with 4 steps at normal stresses n = 05 10 2 and 4 MPa6 During the tests the lower shear box was controlled displaced forward (resp backwards) with a shear rate of 0002 mms
Figure 2-11 Multi-step shear test Bent-SV-MS1 (forward cycle) of the dry contact between two bentonite bricks The test was realized with σn = 05 1 2 4 and 6 MPa
6 To avoid brick failure the maximum normal load was set generally smaller than the average uniaxial strength
FORGE Report Dxxx ndash Ver0
20
The results of a selected shear test (Bent-SV-MS1) are shown as a variation of shear stress and dilatancy vs shear displacement (increasing load cycle) in Figure 2-11 Pre-loading of the sample to the respective normal stress results in some small compaction which developsfurther during the following shear cycles During the various shear steps contrary to experiences from tests on compact material or natural interfaces no stress peak occurs but a more or less constant shear strength level is apparent At higher normal stress states the shear stresses increase as well Concomitantly with the increase of normal stress the variation of dilatancy (always decrease) documents progressive compaction of the bentonite brick aggregate (eg the total compaction ndash during the whole test at n = 1 MPa - is ca 1mm)
The strength and dilatancy behavior does not depend on the course of loading ie if the vertical load steps are varied as upwards or downwards cycle
2232 SHEAR TESTS ON BENTONITE BRICK GRANITE INTERFACES
As a reference material for shear tests on interfaces between bentonite and granite we selected an artificial fractured cuboid of granite (20cm x 15cm x 75cm) of unknown origin The roughness of the artificial split surface was measured using a 3D surface and body scanner at the University of Freiberg (Prof KONIETZKY) The maximum scanner resolution is in the order of 2m As can be seen from Figure 2-12 the mean difference between highest and lowest asperity is in the order of 15 cm
Figure 2-12 Characterization of the granite contact surface a) Histogram of the height distribution of the later shear surface b) Sample dimensions c) Scheme of the bentonite brickgranite aggregate prepared for shearing
Overall one multiple-step shear test and four single-shear tests of bentonite brick granite samples were performed The sample arrangement is qualitatively the same as before
FORGE Report Dxxx ndash Ver0
21
Principally the test realization comprises two steps pre-loading to the respective normal stress state followed by the shear phase
Remarkably despite the existing asperities the initial compaction is only in the order of some few millimeters (depending on the stress level) which indicate that the interface ie the gap between the flat bentonite brick and the asperities is only partially closed during loading This results from the high uniaxial strength of the bentonite bricks
Exemplarily the results of the multi-step shear test are shown in Figure 2-13 which was performed with three steps at n = 05 10 and 20 MPa with displacement rates of 0002 mms Qualitatively the results are comparably to the results of the tests reported in the chapter before Surprisingly also no significant shear peak is observed but post inspection of the sheared planes indicates that local sliding of spikes with linear erosion dominates during shearing Although no significant compaction and local shear failure occurred the shearing along the rough surface requires local overcoming of the existing cohesion
Figure 2-13 Multi-step shear test BentGran-SV-MS1 (forward cycle) of the dry contact between bentonite brick granite surface The test was realized with σn = 05 1 and 2 MPa
2233 SUMMARY HYDRO-MECHANICAL PROPERTIES ndash DRY STATE
The results of the various shear tests were compiled in Table 2-2 and graphical depicted in Figure 2-14
Analog to the strength properties of an intact rock the MOHR-COLOUMB criterion can be used to describe the discontinuity plane characteristics of a jointed rock Accordingly the shear resistance on an interface at critical stress conditions (shear failure) can be expressed stress-depended by a linear dependency of cohesion (c) and angle of friction ()
τf = c + σf tan φ
FORGE Report Dxxx ndash Ver0
22
According to the different material groups two linear trends of results are clearly visible Whereas bentonitebentonite interfaces show no cohesion but significant friction obviously due to the sand content demonstrate shear tests for bentonite bricksgranite a small but significant occurrence of cohesion which was already indicated by post-evaluation of sheared interfaces The tips of the existing roughness of the granite surface are pressed into the bentonite material resulting in local erosion channels
The respective MOHR-COULOMB-parameters are as follows
τ = C + σN tanφ MOHR-COULOMBC φ
brick brick 002 210brick granite 019 196
(MPa) ()
In summary despite the small difference between both interface types comparison with Figure 2-6 demonstrate the importance of artificial interfaces between bentonite bricks as potential weakness planes
Figure 2-14 Summary of shear tests on interfaces between bentonite brick bentonite brick respectively bentonite brick granite ndash MOHR-COULOMB-diagram
FORGE Report Dxxx ndash Ver0
23
Table 2-2 Shear test results
shear strain n dilatancy time
(mm) (MPa) (MPa) (mm) (min)
bentonite brick bentonite brick
057 050 023 -040 503
383 050 021 -046 3215
782 100 038 -075 6548
1186 200 073 -120 9932
1575 400 140 -199 13208
1220 075 033 -017 2492
839 150 064 -033 5682
429 300 123 -068 9123
042 600 240 -170 12397
bentonite brick granite surface
987 200 094 -540 9120
457 400 160 -354 23913
982 100 053 -362 9120bentonite brick granite surface (wetted)
985 100 029 456 10403
3 Gas transport properties of partial saturated bentonite
31 PRE-SATURATION OF BENTONITE BRICKS WITH INTERFACESFor pre-saturation of the samples respectively for the later gas injection tests a new oedometer-like pressure cell is constructed allowing in additions gas flow measurements under defined axial sample consolidation respectively swelling conditions due to different injected water amounts
The sample arrangement consists of a stiff tube ndash oedometer ndash with two sample cylinders of pre-compacted bentonite (respectively one rock sample with a natural rough surface) which are separated by an axial interface inside Two movable pistons equipped with sinter metal plates allow control of volume changes of the sample ie compaction due to a defined axial load or expansion induced by swelling due to water injection Resulting changes in volume or axial force are measured with dial gauges or an axial oriented load cell
As can be seen from Figure 3-1 the cell design facilitates measurements of fluid transport properties through the buffer respectively along the interface between block contacts ie bufferbuffer and bufferblock at defined interface conditions The cell diameter is 90 mm and the overall sample height is ca 120 mm (consisting of two cylindrical specimens ndash 60 mm height) Sinter metal plates ensure access to the axial ends of the sample
FORGE Report Dxxx ndash Ver0
24
The special design of the cell allows fluid injection (1) along the axial direction ie for pre-saturation of the bentonite to induce swelling or measurement of the matrix permeability and (2) through a central hole along the interface ie investigation of contact permeability
pGAs - Inlet
pGas - Outlet
pH2O - Inlet
pH2O - Outlet
FaxLoad cell
Figure 3-1 Principle of the new designed oedometer-cell for gas injection tests on bufferbuffer or bufferrock interfaces at defined bentonite swelling pressures
0 100 200 300
Time (d)0 100 200 300
Time (d)
00
10
20
30
40
50
60
70
80
90
100
0 100 200 300
Time (d)
Axia
l stre
ss (M
Pa)
Inje
cted
wat
er (w
t-
)Vo
lum
etric
sw
ellin
g (
)
I I
ax
water
Vol
ax
water
Volax
water
Vol
Figure 3-2 Pre-saturation of bentonite brick aggregates (left) ax = 2 MPa ndash central injection through a injection hole with radial fluid flow (middle) ax = 4 MPa ndash central injection through a injection hole with radial fluid flow (right) ax = zero ndash axial water injection with free swelling
FORGE Report Dxxx ndash Ver0
25
311 Lab test resultsThree long-term injection tests (pi = 04 MPa) were started in Spring 2010 whereby three different situations were realized
(1) central water injection through an injection hole through a central tube resulting (as proposed) in radial fluid flow along the brick interface
a ax = 4 MPa
b ax = 2 MPa
(2) axial water injection (without axial load) through the end plates (sintered metal) resulting in free axial swelling
The various curves of water consumption and the resulting swelling are summarized in Figure 3-2 The results can be summarized as follows
(1) The water consumption during swelling depends
a obviously not on the injection geometry
b and only weakly on the axial load
No preferred flow along the interface ie matrix swelling
(2) More than 1 year water injection was not sufficient to reach full saturation ie no water out flow but in the center full saturation is assumed Therefore after one year water injection the tests 1a and 1b were finished to facilitate gas injection tests
312 Comparison to the mock-up test SondershausenDespite the different scales of lab and field tests and the limited number of tests the results correspond very well to existing experiences made from in situ tests where sealing elements are constructed of different blocks or bricks Figure 3-3 illustrates the observations made during testing the sealing element of the mock up test Sondershausen (see short description in chapter 12) The sealing element consists of masonry of bentonite bricks (FS 50) which was tested with NaCl-fluid at a maximum fluid pressure of pfl asymp 8 MPa (pswellasymp 1 MPa) (for details see SITZ 2001)
The following conclusions were drawn from the in situ test (evaluation of the humidity distribution after rebuilding the plug)
1Proof of clear saturation front during fluid pressurization
2Homogenous humidity distribution inside the partially saturated buffer
Low effect of artificial interfaces inside the buffer
3Clear pathways in the contact zone buffer host rock (salt)
Interfaces to the host rock are obviously the most relevant pathways
These observations correspond to the results of the laboratory tests therefore demonstrating that interfaces inside the sealing plug are of minor importance because due to the overall swelling effect they will be efficiently sealed
FORGE Report Dxxx ndash Ver0
26
Figure 3-3 Summary of the mock-up test Sondershausen Upper sketch the test design The picture below shows the humidity distribution inside the buffer (vertical profile along the dam axis)
32 GAS INJECTION TESTS ndash DETERMINATION OF GAS BREAKTHROUGHFor the gas-injection tests we used a constant volume radial flow geometry realized in the experimental setup depicted in Figure 3-4
Gas flow measurements under constant volume conditions
A servo-controlled load frame (up to 250kN load capacity) ensures defined loading respectively volume conditions The axial strain (measured between the load plates) is kept constant during the test (resolution 1 m) ie if the sample volume increases due to gas-injection the axial force is automatically increased During the test the change of the axial stress is measured via a load cell
Gas injection at constant injection pressure on the at least partial saturated bentonite sample with a radial flow geometry
After finishing the saturation instead of water gas was injected through the central pipeof the swelling cell which should result in radial flow if preferred flow along the former interface occurs During the test the samples is drained in the axial direction ie through the axial filter plates
During stepwise increase of the primary gas pressure the inflow of gas is measured with a flow-meter ie during each pressure step firstly the dead volume before the gas access to the sample is pressurized which results in an inflow-peak If gas pressureequilibrium before and after the flow-meter is reached and the sample behaves nearly gastight the apparent flow rate becomes zero Gas break through ie overcome of the
FORGE Report Dxxx ndash Ver0
27
capillary entry pressure is indicated by quasi-constant gas-in-flow or gas-outflow (ie bubbles in a burette)
Two gas breakthrough tests were performed at initial axial pressures of 2 respectively 4 MPa The results are summarized in Figure 3-5 respectively Figure 3-6
Figure 3-4 Experimental setup for gas-breakthrough measurements under constant sample volume
Figure 3-5 Gas breakthrough test ndash axial stress and gas pressure respectively resulting gas flow vs time Ax ndashinit asymp 2 MPa
FORGE Report Dxxx ndash Ver0
28
After finishing the pre-saturation of the bentonite the samples were axially unloaded and the cells were put into the servo-hydraulic load frame Before the tests a waiting period of ca 1 day (at the nominal axial stress) was usually applied to ensure equilibrium inside the sampleExemplarily Figure 3-5 shows the stability of the axially applied strain control which is in the order of 1 m However this results in a variation of the axial stress of 02 MPa
Then the gas pressure was stepwise increased each with a waiting period of ca 05 hour The change of the gas pressure is always followed by peak of gas-inflow as explained before but becomes zero If a gas pressure state some few bars below the axial stress is reached the gas pressure was kept constant over a period of 12 to 15 hours to exclude time effects of a gas breakthrough ie delay to slow water expulsion Despite some scattering no significant gas in- or outflow was observed
In the next phase the stepwise pressurization was continued If the gas-pressure reaches the acting axial stress ie Ax ndashinit = min some local gas flow becomes apparent but with some instability Further pressure increase did not change the gas flow significant until the breakthrough occurred
1st test Ax ndashinit = min asymp 2 MPa 27 ndash 29 MPa ie 07 ndash 09 MPa higher than min
2nd test Ax ndashinit = min asymp 4 MPa 75 MPa ie 35 MPa higher than min
The tests clearly demonstrate that the gas-entry pressures are significantly higher than min In addition no effect of the interface ie preferred radial gas flow is visible In a first approach the bentonite brick aggregate seems to behave like a homogenous buffer material For further discussion see the next chapter
Figure 3-6 Gas breakthrough test- axial stress and gas pressure respectively resulting gas flow vs time Ax ndashinit asymp 4 MPa The inset shows the central filter plate ( = 9mm) which was installed to ensure no blockage of the fluid inflow to low-permeable bentonite matrix
FORGE Report Dxxx ndash Ver0
29
33 SHEAR STRENGTH (HEALED SPECIMENS)The gas injection tests results delivered very high gas entry pressures which succeeded the minimal stress which has been axially applied by about several MPa (depending on the order of stress) A possible explanation could be that due to the central gas injection locally a high water pressure is generated The local pore fluid pressure may be temporarily preserved during the fast pressurization with gas due to the low permeability of the matrix although the system is drained by the axial filter plates However it becomes obvious that the effect of the former interface as a potential pathway does not exist anymore This may indicate that the interface is healed during the time-dependent swelling process
Healing means the development of cohesion ie which results in bentonite from electrostatic forces among fine particles (clay minerals) and water Shear tests represent a simple way to quantify the amount of cohesion as already demonstrated before Here we used the bentonite brick aggregates after dismantling the sample Visual inspection of the former interface give no hints for a mechanical or hydraulical weakness plane ie only the color contrast indicates the former contact plane
Figure 3-7 Bentonite brickbrick aggregate ndash dismantled sample after controlled saturation by injecting water directly on the interface (compare injection filter plate in Figure 3-6) Note the sharp color contrast at the former interface (total height of the sample 12 cm)
To demonstrate that real healing took place we performed with both specimens direct shear tests on the former interface between both bentonite brick halves The procedure is the same as described in 213
FORGE Report Dxxx ndash Ver0
30
Figure 3-8 Single-step shear test on the healed contact between bentonite brick brick surface The test was realized with σn = 05 MPa
Figure 3-9 Summary of both shear tests on ldquohealedrdquo interfaces between bentonite brick bentonite brick in comparison to the former results summarized in Figure 2-14 ndash MOHR-COULOMB-diagram
FORGE Report Dxxx ndash Ver0
31
The results differ significantly from the shear tests performed on the dry or only short wetted contact planes The following results are obtained from Figure 3-8
bull Shear test curves
Exemplarily the results of the shear test performed at n = 05 MPa are shown As usual for intact material shear stress grows with progressive shear displacement in elastic manner up to a peak and then drops down to a residual value Peak and residual values are higher with applied normal stress Repeating the experiment with the 2nd sample at n = 15 MPa (not shown here) results in a similar shape of the strength curve but the increase of strength is not so significant indicating that the influence of the acting normal stress is low ie the friction angle is only small
bull Dilatancy curves
Due to the surface roughness and asperities a bedding plane tends to dilate upon shear although this effect tends to level off after certain amount of prescribed shear displacement and is lower for higher normal stress (not shown here)
For comparison with earlier measurements on dry interfaces shear stress peaks and residual values of shear stress obtained in both single experiments are represented in Figure 3-9 against normal stress leading to open envelopes of the Coulomb type The evaluation of these tests with σn = 05 resp 15 MPa documents a cohesion of 06 MPa in the τ-σn-diagram Remarkably the angle of friction with ca 10 is much lower than that of tests on dry contacts before healing
4 ConclusionsThe performed lab investigations cover a wide field of hydro-mechanical properties of bentonite bricks which represent a favorable option for constructing sealing plugs in different host rock environments
Based on the experimental results the following conclusions can be drawn
At dry conditions gas flow along interfaces is at least 4 orders higher than through the matrix (eg 10-16 m2) Increase of confinement significantly lowers the gas flow (10 MPa more than one order) but the effect is more pronounced for interfaces crack sealing
Saturation of bentonite brick aggregates ie bricks with a common interface is not affected by the interfaces and only weakly by the acting confining pressure
During gas injection (stepwise increasing of the gas pressure) a significant effect is only observed if the minimal stress is passed resulting in some minor (local) gas flow
The gas break through results in stationary inflow but no significant effect on the total stress is measured probably due to the central (spherical) gas injection (no outflow)
The measured gas threshold pressures under constant volume conditions significantly exceed the sum of the swelling pressure and externally-applied porewater pressure ndashdrained conditions (pi gt ax some MPa)
An important observation is that despite the former interface the bentonite block aggregatebehaves during the saturation of the buffer not different than the homogenous matrix This has been confirmed as well by gas injection tests on the former interface as well by shear tests The
FORGE Report Dxxx ndash Ver0
32
demonstration of the development of cohesion after pre-saturation is a favorable finding because this verifies physical healing of the interface In addition cohesion inside the matrix helps to explain why the measured gas entry pressures are higher than the applied minimal stress
However this observation is only based on two tests which need to be confirmed by the forthcoming experiments Also for understanding the physical background of high entry pressures of gas into the water-saturated bentonite matrix more experimental investigations are of urgent need
5 ReferencesBARTON C A ZOBACK M D amp MOOS D 1995 Fluid flow along potentially active faults in crystalline rock
Geology 23 683ndash686
BLUEMEL M 2000 Improved Procedures for Laboratory Rock Testing EUROCK 2000 ISRM Symposium Aachen 573 ndash 578
BLUEMEL M amp POETSCH M 2003 Direct Shear Testing System International Symposium on GeoTechnical Measurements and Modelling Karlsruhe 327 ndash 331
BUZZI O 2004 Hydromecanique du contact entre geomateriaux Experimentation et modelisation Application au stockage de dechets nucleaires These Universite Joseph Fourier Grenoble France
METCALF R WATSON S P REES J H HUMPHREYS PAUL AND KING F 2008 Gas generation and migration from a deep geological repository for radioactive waste A review of NirexNDArsquos work Technical Report NWAT Environment Agency Penrith Cumbria
NORRIS S 2009 Summary of Gas Generation and Migration Current State-of-the-Art (draft - July 2009) FORGE D12-R
PEACH CJ amp SPIERS CJ 1996 Influence of crystal plastic de-formation on dilatancy and permeability development in synthetic salt rock Tectonophysics 256 101-128
POPP T 2009 State of the art report on gas transport through interfaces FORGE D31-R (WP 33) 48 pp
SITZ P 2003 Entwicklung eines Grundkonzeptes fr langzeitstabile Streckenverschlussbauwerke fr UTD im Salinar Bau und Test eines Versuchsverschlussbauwerkes unter realen Bedingungen (BMBF-gefrdertes FE-Vorhaben Nr 02 C 05472) Abschlubericht TU Bergakademie Freiberg Institut fr Bergbau 2003
FORGE Report Dxxx ndash Ver0
v
SummaryThis report describes preliminary results obtained as part of IfG-work concerning the FORGE research program
Independently from the respective radioactive waste repository concept knowledge of gas transport properties through sealing or buffer materials is of vital importance for long-termperformance assessments because some gas generation may take place as a consequence of different processes (for instance corrosion of iron) In addition to the matrix properties of the sealing material it is expected that conductive discrete interfaces inside the sealing elements itself and to the host rock may act not only as mechanical weakness planes but also as preferential gas pathways For instance despite the self-sealing capacity of bentonite inherent existing interfaces may be reopened during gas injection However for interpretation resp numerical back analysis of field tests (ie FEBEX Lasgit) only limited experimental data from laboratory tests are available
The lab investigations are aiming (1) on hydro-mechanical properties of interfaces between bentonite bricks itself and (2) on mechanical contacts of bentonite blocks and concrete to various host rocks ie granite They consist of
long-term water injection tests in a new designed oedometer cell (duration of several month up to two years) with different sample constellations (brickbrick resp brickhost rock) under well controlled stress and swelling conditions to provide data about
o time dependent interface ldquopermeabilityrdquo changes (ie sealing) during long-termcompaction and fluid injection
o gas entry pressures and relative gas permeability changes during pressure dependent gas injection
shear tests to quantify mechanical interface properties under well controlled shear forces or displacements
As initial characterization (dry state) both triaxial and direct strength tests were performed which allow to separate between matrix and interface properties
Based on the experimental results the following conclusions can be drawn
At dry conditions gas flow along interfaces is at least 4 orders higher than through the matrix (eg 10-16 m2) Increase of confinement significantly lowers the gas flow (10 MPa more than one order) but the effect is more pronounced for interfaces crack sealing
Saturation of bentonite brick aggregates ie bricks with a common interface is not affected by the interfaces and only weakly by the acting confining pressure
During gas injection (stepwise increasing of the gas pressure) a significant effect is only observed if the minimal stress is passed resulting in some minor (local) gas flow
The gas break through results in stationary inflow but no significant effect on the total stress is measured probably due to the central (spherical) gas injection (no outflow)
The measured gas threshold pressures under constant volume conditions significantly exceed the sum of the swelling pressure and externally-applied porewater pressure ndashdrained conditions (pi gt ax some MPa)
Despite the former interface the bentonite block aggregate behaves like a homogenous matrix ie healing of the interface took place during saturation This favorable effectwas confirmed by shear tests demonstrating the development of cohesion
FORGE Report Dxxx ndash Ver0
6
1 IntroductionThe current report is a part of the activities in Work Package 3 (WP3) in the FORGE Project
The long-term safety of the disposal of nuclear waste is an important issue in all countries with a significant nuclear program Repositories for the disposal of high-level and long-lived radioactive waste generally rely on a multi-barrier system to isolate the waste from the biosphere The multi-barrier system typically comprises the natural geological barrier provided by the repository host rock and its surroundings and an engineered barrier system (EBS) ie the backfilling and sealing of shafts and galleries to block any preferential path for radioactive contaminants
This multi-barrier principle creates an overall robustness of the system that enhances confidence that the waste will be successfully contained However independently from the respective radioactive waste repository concept knowledge of gas transport properties through sealing or buffer materials is of vital importance for long-term performance assessments because some gas generation may take place as a consequence of different processes (for instance corrosion of iron)
Figure 1-1 Scheme of fluid-transport through interfaces in a bentonite buffer consisting of bricks
In the last two decades reliable information about the potential host rocks and the sealing materials (eg bentonite mixtures concrete rock backfill) has been obtained (for recentreviews see METCALF et al 2009 and NORRIS 2009) However only limited knowledge exists about the importance of contacts or interfaces between these different materials or construction parts ie seal plugs eg POPP (2009) As schematically shown in Figure 1-1 it is expected that in addition to the matrix properties of the sealing material conductive discreteinterfaces inside the sealing elements itself and to the host rock may act not only as mechanical weakness planes but also as preferential gas pathways For instance despite the self sealing
FORGE Report Dxxx ndash Ver0
7
capacity of bentonite inherent existing interfaces may be reopened during gas injectionMoreover it has been shown by BUZZI et al (2006) that bentonite is very sensitive to hydraulic erosion producing flow channels within the interface zone
But for interpretation of the relevancy of such phenomena resp numerical back analysis of field tests (ie FEBEX Lasgit) only limited experimental data from laboratory tests are availableTherefore it can be stated that further laboratory test results are important to deduce the hydro-mechanical (HM) parameters for numerical calculations evaluating the long-termintegrity of EBS especially bentonite bearing buffer systems
In the literature a variety of different possible bentonite mixtures or clay minerals has been projected as backfill material in the nuclear waste context Pure bentonite has been rarely proposed for the engineered barrier due to technical reasons eg low mechanical strength of the blocks or aggregates limitation of swelling pressure Therefore pre-fabricated bentonite blocks are an option where usually some aggregates (eg sand or crushed rock) are added to the bentonite in order to enhance its mechanical properties In the past several in situ tests have demonstrated that bentonite buffer or sealing plugs may be built as masonry of different bricks or as a monolith system consisting of large blocks
In the framework of WP3 IfG performed lab investigations aiming (1) on interfaces between bentonite bricks itself and (2) on mechanical contacts of bentonite blocks and concrete to various host rocks ie granite
11 IFG-WORK ndash ACTUAL STATEThe main objectives of the laboratory work of IfG are twofold
1 to investigate gas transport properties of interfaces between bentonite blocks The sub-items are
a to perform long-term laboratory tests (duration of several month up to two years) on artificial contact interfaces between sealing material bricks (ie bentonite) and to the host rock under well controlled stress and swelling conditions with water injection resp subsequent gas injection
b to provide data for time dependent interface ldquopermeabilityrdquo changes (ie sealing) during long-term compaction and fluid injection
c to provide data about gas entry pressures and relative gas permeability changes during pressure dependent gas injection
2 to provide experimental data from short term tests in a direct shear apparatus with measuring of gas transport and mechanical contact properties for the various interface configurations undergoing shear deformation at defined normal stresses1
The actual report describes results of the hydro-mechanical pre-characterization of bentonite bricks supplemented by shear tests between brick interfaces and to the host rock (granite) and preliminary results of gas injection tests on partially flooded bentonite sample constellations
1 The ldquoshear failurerdquo of a sealing plug due to fluid pressurisation or swelling phenomena is governed by hydro-mechanical characteristics of the confined plug host rock interface If shear slip occurs on a critically stressed interface it can raise the permeability of the fracture through several mechanisms including brecciation surface roughness and breakdown of seals (BARTON et al 1995) However increased pore pressures acting in the interface may also lower the acting minimal stress thus initiating the shear failure
FORGE Report Dxxx ndash Ver0
8
12 MATERIAL DESCRIPTIONWe used as reference material artificial bentonite bricks consisting of a sand clay-bentonite mixture but the variety of bentonite-based buffer materials has to be taken in mind The bricks were manufactured in the frame work of the so-called dam - project ldquoSondershausenrdquo ie a German research project between 1997 and 2002 funded by BMBF2 and TMLNU3
The underground test was performed as a demonstration experiment of a multi-component drift barrier system in a salt repository (details are given by SITZ et al 2001) The sealing element consists of the already mentioned bentonite bricks which were hydraulically tested by pressurization through pressure chamber 1 (Figure 1-2) A static abutment was constructed consisting of a salt brick masonry in a prismatoid shaped extension of the drift The completesystem was installed and tested in the salt mine Sondershausen Afterwards the dam was rebuilt4
Figure 1-2 Layout of the full scale drift sealing test Sondershausen (after SITZ et al 2001)
2 BMBF Bundesministerium fr Bildung und Forschung 3 TMLNU Thringer Ministerium fr Landwirtschaft Naturschutz und Umwelt4 In the test phase of several months the dam was loaded with a brine fluid pressure up to 8 MPa However as later found due to leakage through the so called floor-channel (central leading through the building for cables and pressure tubes) and fluid flow around the sealing system the salt bricks were partially flooded with brine which induces a spontaneous loss of strength resulting in a movement of the sealing element for more than 15 cm After finishing the pressure tests the dam has been completely rebuild to provide access to the various elements and to the contact zone between dam and the surrounding rock salt By that means it was possible to take samples of the partially flooded bentonite to measure its humidity content
Although the humidity distribution in the sealing elements indicated that partial flooding through the contact zone took place only weak indications for erosion phenomena in the contact zone between dam and the salt contour were observed but local fluid leakage points were attributed to movements of brine through the EDZ However the obtained swelling pressure in the sealing elements was not high enough to closure these pathways
FORGE Report Dxxx ndash Ver0
9
An important topic of the project was the development of appropriate pre-compacted bentonite bricks composed of bentonite (Calcigel5) and sand which should act as the long-term sealing element supposed to NaCl-brine Evaluating a suite of varies composition ratiosbetween both constituents finally the so-called Wetro FS40 bentonite bricks were selected for the test
The manufactured bentonite bricks (at least 140t material) were industrially produced by the company ldquoFeuerfestwerke Wetrordquo with a size of 25cm x 125cm x 625cm applying compressive stresses in the order of 40 ndash 50 MPa The relevant material properties of the bricks aresummarized in Table 1-1
Table 1-1 Material parameters of the reference material Wetro FS40 bentonite bricks (taken from Sitz et al 2001)
Composition ca 60 bentonite (Calcigel) + 40 quartz-sand
Water-content () 7505 Compressed density (gcm3) 227001 Bentonite dry density (gcm3) 189002 Initial saturation (-) 077004 Hydraulic conductivity with NaCl-brine (ms) ca 10-12
Swelling pressure (MPa) - NaCl 35
Figure 1-3 Wetro FS40 bricks
After producing the bricks the bricks were sealed with plastic wrap and stored at ambient conditions on pallets For our lab tests cylindrical samples were prepared in specified dimensions for carrying out the laboratory tests using a lathe
2 Hydro-mechanical characterization of bentonite bricksFor a performance assessment of the long-term sealing or buffer system build up by bentonite bricks knowledge of the hydro-mechanical properties eg permeability and strength are of urgent need not only for dimensioning a drift sealing plug but also for a prognoses of property changes which may occur in the long-term after closure of the repository eg due to rock convergence or water inflow However because artificial interfaces between the various elements and to the host rocks exist also the contact properties between these bricks and between the bricks and host rock ie granite have to be determined
The investigations are aiming on the characterization of
Matrix properties ieo Compressive strengtho Gas permeability (dry state)
5 CALCIGEL is a natural Calcium bentonite produced from selected Bavarian bentonite deposits The material has the following mineralogical composition Montmorillonite 60 ndash 70 Quartz 6 ndash 9 Feldspar 1 ndash 4 Kaolinite 1 ndash2 Mica 1 ndash 6 and other minerals 5 ndash 10 (source httpwwws-cppcom)
FORGE Report Dxxx ndash Ver0
10
Interface properties ie
o Shear strength between blocks and to the rock contouro Gas permeability ie block aggregates with interfaces
21 METHODOLOGY
211 Strength testingThe strength and permeability measurements were performed in a standard Karman-cell (KRMN 1911) in the servo-hydraulic testing machine (RBA 2500 SCHENKTREBEL Germany ndashusing the MTS-TestStar software) allowing independent control of the radial (2 = 3 = pc) and axial stresses (Ax = 1) The cylindrical samples are sealed with rubber tubes and oil is used as confining medium Outside the vessel three LVDT transducers are mounted between the piston and the load frame near the sample for the measurement of the axial strain The axial load is determined from an external load cell
Figure 2-1 The servohydraulic testing machine RBA 2500 (a) and the scheme of the pressure vessel (b)
Axial deformation experiments (Δh resp the deformation ε1 = Δh h0) in compression or extension mode can be performed at various confining pressures (pc up to 100 MPa) and at temperatures up to 100C within a deformation rate range of 1 = 10-5 ndash 10-7 1s to chosen values of ε1 As a standard technique during the experiments the sample volume changes ΔV are determined by a volume balance of the mantle oil volume changes as measured via the pressure intensifier and the axial piston displacement in the cell
PIPIPP ASAhV (2-1)
FORGE Report Dxxx ndash Ver0
11
with ΔSPI = displacement of the cylinder within the pressure intensifierAPI = cross section of the piston within the pressure intensifierΔh = displacement of the piston of the triaxial cellAPP = cross section of the piston of the triaxial cell
0V V
V (2-2)
In calculation of the stress difference (σ1 ndash σ3) deformation-induced variation of the cross section of the specimen is considered
The leakage-freeness of the oil volume measurement equipment is tested before beginning of each measuring cycle over a waiting period of ca 1 hour However the accuracy of the volume measurement depends on the constancy of the oil temperature within the triaxial cell and within the pressure intensifier
212 Permeability testingAs shown in the schematic drawing of the triaxial pressure cell (depicted in Figure 2-1) permeability can be measured parallel to the sample cylinder axis (dimensions ca 90 mm in diameter and 180 mm long) To maintain access of the gas to the sample either a central hole exists in the plates whereby the specimens additionally will be prepared with small boreholes on their axial ends to minimize end effects during straining or filter plates are used to provide flow over the whole cross section of the sample
Figure 2-2 Flow-meter used for permeability testing
Gas-permeability is measured using nitrogen with an equipment similar to that described by PEACH amp SPIERS (1996) allowing both transient and stationary permeability measurements
Two methods are used to determine the gas flow (q) through the samples To perform the permeability measurement the primary gas pressure p1 is applied Its value depends on the test specimenrsquos permeability and on the measurement range of the gas flow-meter (0 - 10 resp 0 -500 cmmin manufacturer BRONKHORST Model F-230M)
Alternatively using a defined gas volume on the in- (V1) and outlet (V2) and measuring the
pressure increase Δp2 resp t
pp 22
is verified to determine 222 pVV whereby 2Vˆq
FORGE Report Dxxx ndash Ver0
12
At a given injection pressure gas enters into the assumed relatively large pores and displaces the pore water This process is regarded as two-phase flow After reaching a stationary flow through the specimen the amount of gas flow over a defined period of time is recorded (q)
The intrinsic permeability is calculated by the modified DARCYrsquos law for compressive media
)pp(pq
Alk L
22
21
2
(2-3)
with η = dynamical viscosityl = (h ndash t) = effective length of the flow path through the sampleh = height of the sampleA = cross section of the samplepL = pressure at gas flow measurementt = sum of the length of both holes in the samplep1 = injection pressurep2 = outlet pressure
The absence of leakage of the permeability equipment is tested before each measuring cycle using a steal sample over a waiting period of around 1 hour
213 Shear testingGeomechanical discontinuities between various buffer elements and to the host rock are probably the clearest example of existing interfaces acting as mechanical weakness zone or preferred pathways For the mechanical behavior of interfaces the relevant variables are stress traction vector with one normal component and one tangential in a simple 2-dimensional stress field (or two tangential in 3D) and the conjugate strain variables are the corresponding relative displacements (Figure 2-1) However such stress conditions can be only realized in direct shear tests which are therefore of urgent need to reproduce slip between various materials
In the past several companies have developed modern state-of-art testing equipment which allows new types of testing procedures to determine the mechanical parameters of joints and intact rock High-response servo-hydraulic systems with digital control technology strain measurement equipment mounted onto the specimen and programmable control modes enable new types of test procedures to be performed which are tailored to the specific problem eg BLUEMEL (2000) BLUEMEL amp POETSCH (2003) For realization of required shear tests a modern shear test system is available at the IfG (Figure 2-2)
Figure 2-1 Loading geometry in direct shear test
FORGE Report Dxxx ndash Ver0
13
The loading frame consists of a two-axle experimental setup with vertical and horizontal stress initiation a platform for shear test with a two-stage shear box and a servo-hydraulic control unit for two channels (vertical and horizontal) Both can be managed force or displacement controlled The test arrangement is shown in Figure 2-2 The frontal part (right) is an extremely stiff four-columned housing for fixing and vertical loading of the two-stage shear box by the upper hydraulic cylinder (up to 500 kN axial load)
Figure 2-2 The MTS ndash shear test system (model 816) available at the IfG (left) Schematic sketch of the MTS ndash test system (right)
Figure 2-3 Two-stage shear box for shear tests (Left) Schematic sketch with orientation of the specimen and the 25 mm opening between the two single boxes (Right) Prepared boxes with installed specimen The front panel with handle is for defined fixing of the shear boxes and will be removed before test start
A robust desk with a horizontal cylinder (-250 kN pressure - 160kN tension) is laterally positioned in a horizontal housing This cylinder supplies the lateral shear force The upper shear box is fixed by a horizontal housing that enables yet a twisting of approx 2 around the horizontal axes referring to the shear midpoint While a vertical load acts to the whole shear box the lower box can be horizontally displaced under weight The box is lead with less friction by mechanically high quality linear guides
The displacement of the boxes to each other under load is measured and recorded by 4 displacement transducers on the edges of the box (for vertical displacement) and by 2 additional position encoders (for horizontal displacement) Thereby a possible twisting is measured as well
FORGE Report Dxxx ndash Ver0
14
A sufficiently stiff fixing of the specimens in the shear box is a prerequisite for an exact determination of shear resistance (Figure 2-3) Therefore as the first step for investigation of the shear strength of bentonite bentonite or bentonitegranite interfaces two cut in half bricks (125 cm x 125 cm) were stacked one on the top of the other (respectively one half brick on a rough granite surface) The aggregate was covered with a plastic foil to protect them against wetting by the wet concrete that fixes the samples in the shear boxes So the contact planes between the two bricks are exactly perpendicular to the shear direction in the center of the shear box with 25 cm opening (Figure 2-10)
Samples for the second test row (brickgranite interface) were similarly prepared Instead of two bentonite bricks (or bentonite brick halves) a bentonite brick was arranged on a rough contact plane of a host rock block (ie medium-grained grained granite with an artificial fracture surface) Between both blocks was a loose horizontal contact Further preparations were done like mentioned above
22 RESULTS
221 Strength testingIn order to investigate the effect of deviatoric loading on the hydro-mechnical integrity we performed five compression tests The applied confining pressures varied between 10 and 200 MPa After hydrostatic compaction ndash pre-loading at the respective stress state ndash the samples were deformed in triaxial compression (1 gt 2 = 3) with a constant strain rate of 25 ∙ 10-5 1s
For comparison the obtained stress strain curves and the respective evolution of volumetric strain (ie dilatancy) are compared in Figure 2-4 The resulting peak strength (failure) and minimum dilatancy values (onset of dilatancy) are summarized in Table 2-1
As general starting from hydrostatical conditions the deviatoric stress increases to ensure constant rate deformation Generally the slope of the stress-strain curve of all samples exhibits the characteristic transition from initial quasi-elastic (linear) behavior to a curve with relatively large radius indicating typical strain hardening until failure at strains The stress-strain curves depicted in Figure 2-4 nicely demonstrate the effect of increasing pressure resulting in higher strength and deformability
Table 2-1 Results from triaxial deformations tests ( = 2 10-5 1s)
sample pc 1 - fail Diff-failure 1-failure (VV) 1 - min w(MPa) () (MPa) (MPa) () () (wt-)
20611 10 157 868 97 -015 032 44
20608 25 134 1313 156 -010 031 59
20607 50 343 1432 193 -035 316 54
20612 100 715 2110 311 -146 1068 48
20620 200 1150 3101 510 -413 1886 48
As evident from the experiments the deformation style changes from brittle to quasi ductile behavior with increasing confining pressure as indicated by increasing failure strains and different post failure behavior One can see a change from a sharp stress-strain curve with a significant lower post-failure stage to a more or less broad plateau without a significant failure peak
FORGE Report Dxxx ndash Ver0
15
Most important dilatant deformations occur only in a low peripheral pressure range (3 5 MPa) At higher pressures (3 10 MPa) brittle deformation is suppressed resulting in a significant compaction of several percent The change of deformation behavior is also documented in the evolution of dilatancy Whereas at low confinement dilatancy onsets significantly before the failure at low strain is dilatancy at confining pressures higher than 5 MPa suppressed and compaction dominates during the whole deformation cycle
Figure 2-4 Summary of triaxial test results on bentonite bricks in a confining pressure range between 1 and 20 MPa Note the well pronounced effect of increasing confining pressureresulting in a change from brittle to ductile behavior
Figure 2-5 Change from brittle to ductile deformation - Cracks patterns of deformed samples
The visual inspection of deformed specimens after the experiment the deformation style of the specimens demonstrates the change of deformation style from brittle to ductile At lower
FORGE Report Dxxx ndash Ver0
16
confining pressures as can be seen from Figure 2-5 a complex shear failure signature occurred whereas at 3 gt 5 MPa compressive failure dominates
For evaluating the strength behavior all test results (standard TC-tests) are graphical depicted inFigure 2-6 Despite the scattering of the strength values it can be easily seen that the general trend of increasing strength with increasing minimal stress is nicely represented by a linear strength boundary according to the MOHR-COULOMB-criterion with the respective values of
ndash friction angle () 22c ndash cohesion (MPa) 28
It has to be mentioned that the friction angle of 22 corresponds fairly well to the results of the shear tests on interfaces between bentonite bricks but without cohesion (see chapter 223)
Figure 2-6 MOHR-COULOMB-diagram of bentonite bricks
Extrapolation of the obtained straight line to a confining pressure zero delivers a value of ca 9 MPa Based on a larger number of samples the average strength of the bentonite bricks was determined in the order of 55 to 65 MPa (SITZ et al 2001) This indicates some non-linearity to unconfined conditions demonstrating the need of triaxial tests for evaluation of the strength behavior of bentonite bricks
222 Gas permeabilityAs a prerequisite for evaluation of the later saturation tests the gas permeability of the bentonite bricks was determined using different sample arrangements As depicted in Figure 2-7 two different sample arrangements were used to realize axial gas-injection tests both on the intact matrix and also on an artificial interface between two bentonite bricks
Both samples were stepwise hydrostatically loaded (up and down cycle) with continuous gas injection which facilitates permeability determination by measuring the gas flow Exemplarily
FORGE Report Dxxx ndash Ver0
17
Figure 2-8 shows the time dependent change of gas permeability through the intact bentonite brick matrix according the different loading and un-loading steps Starting from an initial gas-permeability of ca 2 ∙ 10-16 m2 the permeability decreases with increasing the applied confining stress Increase of the confining pressure up to 3 = 9 MPa results in a decrease of permeability for more than one order of magnitude At constant confining pressure permeability decreases with time indicating visco-elastic matrix-compaction The time- and stress-dependent compaction effect is at least partial reversible if the confinement is reduced ie irreversible compaction becomes visible But close inspection of pressure-dependent change of permeability as depicted in Figure 2-9 indicates that during the unloading cycle phyd lt 2 MPa the permeability increases significant which may indicate inelastic crack opening during stress release
Figure 2-7 Sample arrangement for permeability testing a) matrix-permeability b) interface permeability
Figure 2-8 Permeability testing at hydrostatic loading Time-dependent course of the experiment with the different loading steps (up and down cycle) with the resulting compactionand gas permeability
Figure 2-9 compares the results measured on the two different sample arrangements ie (left) intact matrix and (right) matrix with an artificial interface (saw cut) It becomes obvious that the
FORGE Report Dxxx ndash Ver0
18
ldquointegralrdquo permeability of the bentonite aggregate with an artificial interface is initially four orders of magnitude higher than the intact matrix ie ko-interface asymp 10-12 m2 Increase of confining pressure up to 10 MPa lowers the permeability for more than 2 orders whereas unloading of the sample results in a significant hysteresis This is clearly indicates crack sealing
Figure 2-9 Permeability testing at hydrostatic loading Gas permeability and volumetric strain vs confining pressure a) Bentonite brick matrix permeability b) Bentonite brick with artificial interface (saw cut)
223 Shear strength (initial state)
The shear testing program consists of the following sample configurations and test number(1) Bentonite brick bentonite brick
a Dry (delivery state) 2 multi-step shear testsb Wetted surface (only just before the test) 1 multi-step shear testsc Healed interface between bentonite bricks
after pre-saturation over one year 2 single-step shear tests(2) Bentonite brick rough granite surface (dry) 4 single-step shear tests
1 multi-step shear tests
Principally the test realization comprises two phases ie pre-consolidation followed by the original shear phase which can be divided in several steps at various normal stresses The test results are typically represented by a peak strength and a residual strength value after loss of cohesion between the shear interfaces
FORGE Report Dxxx ndash Ver0
19
Figure 2-10 Documentation of the interfaces of various test constellations a) View inside the open shear gap after the tests b) Scheme of the brickgranite arrangement
2231 SHEAR TESTS ON DRY BENTONITE BRICK INTERFACES
First of all the shear strength of the dry interfaces between two bentonite bricks was determined in two multiple-step shear tests each with 4 steps at normal stresses n = 05 10 2 and 4 MPa6 During the tests the lower shear box was controlled displaced forward (resp backwards) with a shear rate of 0002 mms
Figure 2-11 Multi-step shear test Bent-SV-MS1 (forward cycle) of the dry contact between two bentonite bricks The test was realized with σn = 05 1 2 4 and 6 MPa
6 To avoid brick failure the maximum normal load was set generally smaller than the average uniaxial strength
FORGE Report Dxxx ndash Ver0
20
The results of a selected shear test (Bent-SV-MS1) are shown as a variation of shear stress and dilatancy vs shear displacement (increasing load cycle) in Figure 2-11 Pre-loading of the sample to the respective normal stress results in some small compaction which developsfurther during the following shear cycles During the various shear steps contrary to experiences from tests on compact material or natural interfaces no stress peak occurs but a more or less constant shear strength level is apparent At higher normal stress states the shear stresses increase as well Concomitantly with the increase of normal stress the variation of dilatancy (always decrease) documents progressive compaction of the bentonite brick aggregate (eg the total compaction ndash during the whole test at n = 1 MPa - is ca 1mm)
The strength and dilatancy behavior does not depend on the course of loading ie if the vertical load steps are varied as upwards or downwards cycle
2232 SHEAR TESTS ON BENTONITE BRICK GRANITE INTERFACES
As a reference material for shear tests on interfaces between bentonite and granite we selected an artificial fractured cuboid of granite (20cm x 15cm x 75cm) of unknown origin The roughness of the artificial split surface was measured using a 3D surface and body scanner at the University of Freiberg (Prof KONIETZKY) The maximum scanner resolution is in the order of 2m As can be seen from Figure 2-12 the mean difference between highest and lowest asperity is in the order of 15 cm
Figure 2-12 Characterization of the granite contact surface a) Histogram of the height distribution of the later shear surface b) Sample dimensions c) Scheme of the bentonite brickgranite aggregate prepared for shearing
Overall one multiple-step shear test and four single-shear tests of bentonite brick granite samples were performed The sample arrangement is qualitatively the same as before
FORGE Report Dxxx ndash Ver0
21
Principally the test realization comprises two steps pre-loading to the respective normal stress state followed by the shear phase
Remarkably despite the existing asperities the initial compaction is only in the order of some few millimeters (depending on the stress level) which indicate that the interface ie the gap between the flat bentonite brick and the asperities is only partially closed during loading This results from the high uniaxial strength of the bentonite bricks
Exemplarily the results of the multi-step shear test are shown in Figure 2-13 which was performed with three steps at n = 05 10 and 20 MPa with displacement rates of 0002 mms Qualitatively the results are comparably to the results of the tests reported in the chapter before Surprisingly also no significant shear peak is observed but post inspection of the sheared planes indicates that local sliding of spikes with linear erosion dominates during shearing Although no significant compaction and local shear failure occurred the shearing along the rough surface requires local overcoming of the existing cohesion
Figure 2-13 Multi-step shear test BentGran-SV-MS1 (forward cycle) of the dry contact between bentonite brick granite surface The test was realized with σn = 05 1 and 2 MPa
2233 SUMMARY HYDRO-MECHANICAL PROPERTIES ndash DRY STATE
The results of the various shear tests were compiled in Table 2-2 and graphical depicted in Figure 2-14
Analog to the strength properties of an intact rock the MOHR-COLOUMB criterion can be used to describe the discontinuity plane characteristics of a jointed rock Accordingly the shear resistance on an interface at critical stress conditions (shear failure) can be expressed stress-depended by a linear dependency of cohesion (c) and angle of friction ()
τf = c + σf tan φ
FORGE Report Dxxx ndash Ver0
22
According to the different material groups two linear trends of results are clearly visible Whereas bentonitebentonite interfaces show no cohesion but significant friction obviously due to the sand content demonstrate shear tests for bentonite bricksgranite a small but significant occurrence of cohesion which was already indicated by post-evaluation of sheared interfaces The tips of the existing roughness of the granite surface are pressed into the bentonite material resulting in local erosion channels
The respective MOHR-COULOMB-parameters are as follows
τ = C + σN tanφ MOHR-COULOMBC φ
brick brick 002 210brick granite 019 196
(MPa) ()
In summary despite the small difference between both interface types comparison with Figure 2-6 demonstrate the importance of artificial interfaces between bentonite bricks as potential weakness planes
Figure 2-14 Summary of shear tests on interfaces between bentonite brick bentonite brick respectively bentonite brick granite ndash MOHR-COULOMB-diagram
FORGE Report Dxxx ndash Ver0
23
Table 2-2 Shear test results
shear strain n dilatancy time
(mm) (MPa) (MPa) (mm) (min)
bentonite brick bentonite brick
057 050 023 -040 503
383 050 021 -046 3215
782 100 038 -075 6548
1186 200 073 -120 9932
1575 400 140 -199 13208
1220 075 033 -017 2492
839 150 064 -033 5682
429 300 123 -068 9123
042 600 240 -170 12397
bentonite brick granite surface
987 200 094 -540 9120
457 400 160 -354 23913
982 100 053 -362 9120bentonite brick granite surface (wetted)
985 100 029 456 10403
3 Gas transport properties of partial saturated bentonite
31 PRE-SATURATION OF BENTONITE BRICKS WITH INTERFACESFor pre-saturation of the samples respectively for the later gas injection tests a new oedometer-like pressure cell is constructed allowing in additions gas flow measurements under defined axial sample consolidation respectively swelling conditions due to different injected water amounts
The sample arrangement consists of a stiff tube ndash oedometer ndash with two sample cylinders of pre-compacted bentonite (respectively one rock sample with a natural rough surface) which are separated by an axial interface inside Two movable pistons equipped with sinter metal plates allow control of volume changes of the sample ie compaction due to a defined axial load or expansion induced by swelling due to water injection Resulting changes in volume or axial force are measured with dial gauges or an axial oriented load cell
As can be seen from Figure 3-1 the cell design facilitates measurements of fluid transport properties through the buffer respectively along the interface between block contacts ie bufferbuffer and bufferblock at defined interface conditions The cell diameter is 90 mm and the overall sample height is ca 120 mm (consisting of two cylindrical specimens ndash 60 mm height) Sinter metal plates ensure access to the axial ends of the sample
FORGE Report Dxxx ndash Ver0
24
The special design of the cell allows fluid injection (1) along the axial direction ie for pre-saturation of the bentonite to induce swelling or measurement of the matrix permeability and (2) through a central hole along the interface ie investigation of contact permeability
pGAs - Inlet
pGas - Outlet
pH2O - Inlet
pH2O - Outlet
FaxLoad cell
Figure 3-1 Principle of the new designed oedometer-cell for gas injection tests on bufferbuffer or bufferrock interfaces at defined bentonite swelling pressures
0 100 200 300
Time (d)0 100 200 300
Time (d)
00
10
20
30
40
50
60
70
80
90
100
0 100 200 300
Time (d)
Axia
l stre
ss (M
Pa)
Inje
cted
wat
er (w
t-
)Vo
lum
etric
sw
ellin
g (
)
I I
ax
water
Vol
ax
water
Volax
water
Vol
Figure 3-2 Pre-saturation of bentonite brick aggregates (left) ax = 2 MPa ndash central injection through a injection hole with radial fluid flow (middle) ax = 4 MPa ndash central injection through a injection hole with radial fluid flow (right) ax = zero ndash axial water injection with free swelling
FORGE Report Dxxx ndash Ver0
25
311 Lab test resultsThree long-term injection tests (pi = 04 MPa) were started in Spring 2010 whereby three different situations were realized
(1) central water injection through an injection hole through a central tube resulting (as proposed) in radial fluid flow along the brick interface
a ax = 4 MPa
b ax = 2 MPa
(2) axial water injection (without axial load) through the end plates (sintered metal) resulting in free axial swelling
The various curves of water consumption and the resulting swelling are summarized in Figure 3-2 The results can be summarized as follows
(1) The water consumption during swelling depends
a obviously not on the injection geometry
b and only weakly on the axial load
No preferred flow along the interface ie matrix swelling
(2) More than 1 year water injection was not sufficient to reach full saturation ie no water out flow but in the center full saturation is assumed Therefore after one year water injection the tests 1a and 1b were finished to facilitate gas injection tests
312 Comparison to the mock-up test SondershausenDespite the different scales of lab and field tests and the limited number of tests the results correspond very well to existing experiences made from in situ tests where sealing elements are constructed of different blocks or bricks Figure 3-3 illustrates the observations made during testing the sealing element of the mock up test Sondershausen (see short description in chapter 12) The sealing element consists of masonry of bentonite bricks (FS 50) which was tested with NaCl-fluid at a maximum fluid pressure of pfl asymp 8 MPa (pswellasymp 1 MPa) (for details see SITZ 2001)
The following conclusions were drawn from the in situ test (evaluation of the humidity distribution after rebuilding the plug)
1Proof of clear saturation front during fluid pressurization
2Homogenous humidity distribution inside the partially saturated buffer
Low effect of artificial interfaces inside the buffer
3Clear pathways in the contact zone buffer host rock (salt)
Interfaces to the host rock are obviously the most relevant pathways
These observations correspond to the results of the laboratory tests therefore demonstrating that interfaces inside the sealing plug are of minor importance because due to the overall swelling effect they will be efficiently sealed
FORGE Report Dxxx ndash Ver0
26
Figure 3-3 Summary of the mock-up test Sondershausen Upper sketch the test design The picture below shows the humidity distribution inside the buffer (vertical profile along the dam axis)
32 GAS INJECTION TESTS ndash DETERMINATION OF GAS BREAKTHROUGHFor the gas-injection tests we used a constant volume radial flow geometry realized in the experimental setup depicted in Figure 3-4
Gas flow measurements under constant volume conditions
A servo-controlled load frame (up to 250kN load capacity) ensures defined loading respectively volume conditions The axial strain (measured between the load plates) is kept constant during the test (resolution 1 m) ie if the sample volume increases due to gas-injection the axial force is automatically increased During the test the change of the axial stress is measured via a load cell
Gas injection at constant injection pressure on the at least partial saturated bentonite sample with a radial flow geometry
After finishing the saturation instead of water gas was injected through the central pipeof the swelling cell which should result in radial flow if preferred flow along the former interface occurs During the test the samples is drained in the axial direction ie through the axial filter plates
During stepwise increase of the primary gas pressure the inflow of gas is measured with a flow-meter ie during each pressure step firstly the dead volume before the gas access to the sample is pressurized which results in an inflow-peak If gas pressureequilibrium before and after the flow-meter is reached and the sample behaves nearly gastight the apparent flow rate becomes zero Gas break through ie overcome of the
FORGE Report Dxxx ndash Ver0
27
capillary entry pressure is indicated by quasi-constant gas-in-flow or gas-outflow (ie bubbles in a burette)
Two gas breakthrough tests were performed at initial axial pressures of 2 respectively 4 MPa The results are summarized in Figure 3-5 respectively Figure 3-6
Figure 3-4 Experimental setup for gas-breakthrough measurements under constant sample volume
Figure 3-5 Gas breakthrough test ndash axial stress and gas pressure respectively resulting gas flow vs time Ax ndashinit asymp 2 MPa
FORGE Report Dxxx ndash Ver0
28
After finishing the pre-saturation of the bentonite the samples were axially unloaded and the cells were put into the servo-hydraulic load frame Before the tests a waiting period of ca 1 day (at the nominal axial stress) was usually applied to ensure equilibrium inside the sampleExemplarily Figure 3-5 shows the stability of the axially applied strain control which is in the order of 1 m However this results in a variation of the axial stress of 02 MPa
Then the gas pressure was stepwise increased each with a waiting period of ca 05 hour The change of the gas pressure is always followed by peak of gas-inflow as explained before but becomes zero If a gas pressure state some few bars below the axial stress is reached the gas pressure was kept constant over a period of 12 to 15 hours to exclude time effects of a gas breakthrough ie delay to slow water expulsion Despite some scattering no significant gas in- or outflow was observed
In the next phase the stepwise pressurization was continued If the gas-pressure reaches the acting axial stress ie Ax ndashinit = min some local gas flow becomes apparent but with some instability Further pressure increase did not change the gas flow significant until the breakthrough occurred
1st test Ax ndashinit = min asymp 2 MPa 27 ndash 29 MPa ie 07 ndash 09 MPa higher than min
2nd test Ax ndashinit = min asymp 4 MPa 75 MPa ie 35 MPa higher than min
The tests clearly demonstrate that the gas-entry pressures are significantly higher than min In addition no effect of the interface ie preferred radial gas flow is visible In a first approach the bentonite brick aggregate seems to behave like a homogenous buffer material For further discussion see the next chapter
Figure 3-6 Gas breakthrough test- axial stress and gas pressure respectively resulting gas flow vs time Ax ndashinit asymp 4 MPa The inset shows the central filter plate ( = 9mm) which was installed to ensure no blockage of the fluid inflow to low-permeable bentonite matrix
FORGE Report Dxxx ndash Ver0
29
33 SHEAR STRENGTH (HEALED SPECIMENS)The gas injection tests results delivered very high gas entry pressures which succeeded the minimal stress which has been axially applied by about several MPa (depending on the order of stress) A possible explanation could be that due to the central gas injection locally a high water pressure is generated The local pore fluid pressure may be temporarily preserved during the fast pressurization with gas due to the low permeability of the matrix although the system is drained by the axial filter plates However it becomes obvious that the effect of the former interface as a potential pathway does not exist anymore This may indicate that the interface is healed during the time-dependent swelling process
Healing means the development of cohesion ie which results in bentonite from electrostatic forces among fine particles (clay minerals) and water Shear tests represent a simple way to quantify the amount of cohesion as already demonstrated before Here we used the bentonite brick aggregates after dismantling the sample Visual inspection of the former interface give no hints for a mechanical or hydraulical weakness plane ie only the color contrast indicates the former contact plane
Figure 3-7 Bentonite brickbrick aggregate ndash dismantled sample after controlled saturation by injecting water directly on the interface (compare injection filter plate in Figure 3-6) Note the sharp color contrast at the former interface (total height of the sample 12 cm)
To demonstrate that real healing took place we performed with both specimens direct shear tests on the former interface between both bentonite brick halves The procedure is the same as described in 213
FORGE Report Dxxx ndash Ver0
30
Figure 3-8 Single-step shear test on the healed contact between bentonite brick brick surface The test was realized with σn = 05 MPa
Figure 3-9 Summary of both shear tests on ldquohealedrdquo interfaces between bentonite brick bentonite brick in comparison to the former results summarized in Figure 2-14 ndash MOHR-COULOMB-diagram
FORGE Report Dxxx ndash Ver0
31
The results differ significantly from the shear tests performed on the dry or only short wetted contact planes The following results are obtained from Figure 3-8
bull Shear test curves
Exemplarily the results of the shear test performed at n = 05 MPa are shown As usual for intact material shear stress grows with progressive shear displacement in elastic manner up to a peak and then drops down to a residual value Peak and residual values are higher with applied normal stress Repeating the experiment with the 2nd sample at n = 15 MPa (not shown here) results in a similar shape of the strength curve but the increase of strength is not so significant indicating that the influence of the acting normal stress is low ie the friction angle is only small
bull Dilatancy curves
Due to the surface roughness and asperities a bedding plane tends to dilate upon shear although this effect tends to level off after certain amount of prescribed shear displacement and is lower for higher normal stress (not shown here)
For comparison with earlier measurements on dry interfaces shear stress peaks and residual values of shear stress obtained in both single experiments are represented in Figure 3-9 against normal stress leading to open envelopes of the Coulomb type The evaluation of these tests with σn = 05 resp 15 MPa documents a cohesion of 06 MPa in the τ-σn-diagram Remarkably the angle of friction with ca 10 is much lower than that of tests on dry contacts before healing
4 ConclusionsThe performed lab investigations cover a wide field of hydro-mechanical properties of bentonite bricks which represent a favorable option for constructing sealing plugs in different host rock environments
Based on the experimental results the following conclusions can be drawn
At dry conditions gas flow along interfaces is at least 4 orders higher than through the matrix (eg 10-16 m2) Increase of confinement significantly lowers the gas flow (10 MPa more than one order) but the effect is more pronounced for interfaces crack sealing
Saturation of bentonite brick aggregates ie bricks with a common interface is not affected by the interfaces and only weakly by the acting confining pressure
During gas injection (stepwise increasing of the gas pressure) a significant effect is only observed if the minimal stress is passed resulting in some minor (local) gas flow
The gas break through results in stationary inflow but no significant effect on the total stress is measured probably due to the central (spherical) gas injection (no outflow)
The measured gas threshold pressures under constant volume conditions significantly exceed the sum of the swelling pressure and externally-applied porewater pressure ndashdrained conditions (pi gt ax some MPa)
An important observation is that despite the former interface the bentonite block aggregatebehaves during the saturation of the buffer not different than the homogenous matrix This has been confirmed as well by gas injection tests on the former interface as well by shear tests The
FORGE Report Dxxx ndash Ver0
32
demonstration of the development of cohesion after pre-saturation is a favorable finding because this verifies physical healing of the interface In addition cohesion inside the matrix helps to explain why the measured gas entry pressures are higher than the applied minimal stress
However this observation is only based on two tests which need to be confirmed by the forthcoming experiments Also for understanding the physical background of high entry pressures of gas into the water-saturated bentonite matrix more experimental investigations are of urgent need
5 ReferencesBARTON C A ZOBACK M D amp MOOS D 1995 Fluid flow along potentially active faults in crystalline rock
Geology 23 683ndash686
BLUEMEL M 2000 Improved Procedures for Laboratory Rock Testing EUROCK 2000 ISRM Symposium Aachen 573 ndash 578
BLUEMEL M amp POETSCH M 2003 Direct Shear Testing System International Symposium on GeoTechnical Measurements and Modelling Karlsruhe 327 ndash 331
BUZZI O 2004 Hydromecanique du contact entre geomateriaux Experimentation et modelisation Application au stockage de dechets nucleaires These Universite Joseph Fourier Grenoble France
METCALF R WATSON S P REES J H HUMPHREYS PAUL AND KING F 2008 Gas generation and migration from a deep geological repository for radioactive waste A review of NirexNDArsquos work Technical Report NWAT Environment Agency Penrith Cumbria
NORRIS S 2009 Summary of Gas Generation and Migration Current State-of-the-Art (draft - July 2009) FORGE D12-R
PEACH CJ amp SPIERS CJ 1996 Influence of crystal plastic de-formation on dilatancy and permeability development in synthetic salt rock Tectonophysics 256 101-128
POPP T 2009 State of the art report on gas transport through interfaces FORGE D31-R (WP 33) 48 pp
SITZ P 2003 Entwicklung eines Grundkonzeptes fr langzeitstabile Streckenverschlussbauwerke fr UTD im Salinar Bau und Test eines Versuchsverschlussbauwerkes unter realen Bedingungen (BMBF-gefrdertes FE-Vorhaben Nr 02 C 05472) Abschlubericht TU Bergakademie Freiberg Institut fr Bergbau 2003

FORGE Report Dxxx ndash Ver0
6
1 IntroductionThe current report is a part of the activities in Work Package 3 (WP3) in the FORGE Project
The long-term safety of the disposal of nuclear waste is an important issue in all countries with a significant nuclear program Repositories for the disposal of high-level and long-lived radioactive waste generally rely on a multi-barrier system to isolate the waste from the biosphere The multi-barrier system typically comprises the natural geological barrier provided by the repository host rock and its surroundings and an engineered barrier system (EBS) ie the backfilling and sealing of shafts and galleries to block any preferential path for radioactive contaminants
This multi-barrier principle creates an overall robustness of the system that enhances confidence that the waste will be successfully contained However independently from the respective radioactive waste repository concept knowledge of gas transport properties through sealing or buffer materials is of vital importance for long-term performance assessments because some gas generation may take place as a consequence of different processes (for instance corrosion of iron)
Figure 1-1 Scheme of fluid-transport through interfaces in a bentonite buffer consisting of bricks
In the last two decades reliable information about the potential host rocks and the sealing materials (eg bentonite mixtures concrete rock backfill) has been obtained (for recentreviews see METCALF et al 2009 and NORRIS 2009) However only limited knowledge exists about the importance of contacts or interfaces between these different materials or construction parts ie seal plugs eg POPP (2009) As schematically shown in Figure 1-1 it is expected that in addition to the matrix properties of the sealing material conductive discreteinterfaces inside the sealing elements itself and to the host rock may act not only as mechanical weakness planes but also as preferential gas pathways For instance despite the self sealing
FORGE Report Dxxx ndash Ver0
7
capacity of bentonite inherent existing interfaces may be reopened during gas injectionMoreover it has been shown by BUZZI et al (2006) that bentonite is very sensitive to hydraulic erosion producing flow channels within the interface zone
But for interpretation of the relevancy of such phenomena resp numerical back analysis of field tests (ie FEBEX Lasgit) only limited experimental data from laboratory tests are availableTherefore it can be stated that further laboratory test results are important to deduce the hydro-mechanical (HM) parameters for numerical calculations evaluating the long-termintegrity of EBS especially bentonite bearing buffer systems
In the literature a variety of different possible bentonite mixtures or clay minerals has been projected as backfill material in the nuclear waste context Pure bentonite has been rarely proposed for the engineered barrier due to technical reasons eg low mechanical strength of the blocks or aggregates limitation of swelling pressure Therefore pre-fabricated bentonite blocks are an option where usually some aggregates (eg sand or crushed rock) are added to the bentonite in order to enhance its mechanical properties In the past several in situ tests have demonstrated that bentonite buffer or sealing plugs may be built as masonry of different bricks or as a monolith system consisting of large blocks
In the framework of WP3 IfG performed lab investigations aiming (1) on interfaces between bentonite bricks itself and (2) on mechanical contacts of bentonite blocks and concrete to various host rocks ie granite
11 IFG-WORK ndash ACTUAL STATEThe main objectives of the laboratory work of IfG are twofold
1 to investigate gas transport properties of interfaces between bentonite blocks The sub-items are
a to perform long-term laboratory tests (duration of several month up to two years) on artificial contact interfaces between sealing material bricks (ie bentonite) and to the host rock under well controlled stress and swelling conditions with water injection resp subsequent gas injection
b to provide data for time dependent interface ldquopermeabilityrdquo changes (ie sealing) during long-term compaction and fluid injection
c to provide data about gas entry pressures and relative gas permeability changes during pressure dependent gas injection
2 to provide experimental data from short term tests in a direct shear apparatus with measuring of gas transport and mechanical contact properties for the various interface configurations undergoing shear deformation at defined normal stresses1
The actual report describes results of the hydro-mechanical pre-characterization of bentonite bricks supplemented by shear tests between brick interfaces and to the host rock (granite) and preliminary results of gas injection tests on partially flooded bentonite sample constellations
1 The ldquoshear failurerdquo of a sealing plug due to fluid pressurisation or swelling phenomena is governed by hydro-mechanical characteristics of the confined plug host rock interface If shear slip occurs on a critically stressed interface it can raise the permeability of the fracture through several mechanisms including brecciation surface roughness and breakdown of seals (BARTON et al 1995) However increased pore pressures acting in the interface may also lower the acting minimal stress thus initiating the shear failure
FORGE Report Dxxx ndash Ver0
8
12 MATERIAL DESCRIPTIONWe used as reference material artificial bentonite bricks consisting of a sand clay-bentonite mixture but the variety of bentonite-based buffer materials has to be taken in mind The bricks were manufactured in the frame work of the so-called dam - project ldquoSondershausenrdquo ie a German research project between 1997 and 2002 funded by BMBF2 and TMLNU3
The underground test was performed as a demonstration experiment of a multi-component drift barrier system in a salt repository (details are given by SITZ et al 2001) The sealing element consists of the already mentioned bentonite bricks which were hydraulically tested by pressurization through pressure chamber 1 (Figure 1-2) A static abutment was constructed consisting of a salt brick masonry in a prismatoid shaped extension of the drift The completesystem was installed and tested in the salt mine Sondershausen Afterwards the dam was rebuilt4
Figure 1-2 Layout of the full scale drift sealing test Sondershausen (after SITZ et al 2001)
2 BMBF Bundesministerium fr Bildung und Forschung 3 TMLNU Thringer Ministerium fr Landwirtschaft Naturschutz und Umwelt4 In the test phase of several months the dam was loaded with a brine fluid pressure up to 8 MPa However as later found due to leakage through the so called floor-channel (central leading through the building for cables and pressure tubes) and fluid flow around the sealing system the salt bricks were partially flooded with brine which induces a spontaneous loss of strength resulting in a movement of the sealing element for more than 15 cm After finishing the pressure tests the dam has been completely rebuild to provide access to the various elements and to the contact zone between dam and the surrounding rock salt By that means it was possible to take samples of the partially flooded bentonite to measure its humidity content
Although the humidity distribution in the sealing elements indicated that partial flooding through the contact zone took place only weak indications for erosion phenomena in the contact zone between dam and the salt contour were observed but local fluid leakage points were attributed to movements of brine through the EDZ However the obtained swelling pressure in the sealing elements was not high enough to closure these pathways
FORGE Report Dxxx ndash Ver0
9
An important topic of the project was the development of appropriate pre-compacted bentonite bricks composed of bentonite (Calcigel5) and sand which should act as the long-term sealing element supposed to NaCl-brine Evaluating a suite of varies composition ratiosbetween both constituents finally the so-called Wetro FS40 bentonite bricks were selected for the test
The manufactured bentonite bricks (at least 140t material) were industrially produced by the company ldquoFeuerfestwerke Wetrordquo with a size of 25cm x 125cm x 625cm applying compressive stresses in the order of 40 ndash 50 MPa The relevant material properties of the bricks aresummarized in Table 1-1
Table 1-1 Material parameters of the reference material Wetro FS40 bentonite bricks (taken from Sitz et al 2001)
Composition ca 60 bentonite (Calcigel) + 40 quartz-sand
Water-content () 7505 Compressed density (gcm3) 227001 Bentonite dry density (gcm3) 189002 Initial saturation (-) 077004 Hydraulic conductivity with NaCl-brine (ms) ca 10-12
Swelling pressure (MPa) - NaCl 35
Figure 1-3 Wetro FS40 bricks
After producing the bricks the bricks were sealed with plastic wrap and stored at ambient conditions on pallets For our lab tests cylindrical samples were prepared in specified dimensions for carrying out the laboratory tests using a lathe
2 Hydro-mechanical characterization of bentonite bricksFor a performance assessment of the long-term sealing or buffer system build up by bentonite bricks knowledge of the hydro-mechanical properties eg permeability and strength are of urgent need not only for dimensioning a drift sealing plug but also for a prognoses of property changes which may occur in the long-term after closure of the repository eg due to rock convergence or water inflow However because artificial interfaces between the various elements and to the host rocks exist also the contact properties between these bricks and between the bricks and host rock ie granite have to be determined
The investigations are aiming on the characterization of
Matrix properties ieo Compressive strengtho Gas permeability (dry state)
5 CALCIGEL is a natural Calcium bentonite produced from selected Bavarian bentonite deposits The material has the following mineralogical composition Montmorillonite 60 ndash 70 Quartz 6 ndash 9 Feldspar 1 ndash 4 Kaolinite 1 ndash2 Mica 1 ndash 6 and other minerals 5 ndash 10 (source httpwwws-cppcom)
FORGE Report Dxxx ndash Ver0
10
Interface properties ie
o Shear strength between blocks and to the rock contouro Gas permeability ie block aggregates with interfaces
21 METHODOLOGY
211 Strength testingThe strength and permeability measurements were performed in a standard Karman-cell (KRMN 1911) in the servo-hydraulic testing machine (RBA 2500 SCHENKTREBEL Germany ndashusing the MTS-TestStar software) allowing independent control of the radial (2 = 3 = pc) and axial stresses (Ax = 1) The cylindrical samples are sealed with rubber tubes and oil is used as confining medium Outside the vessel three LVDT transducers are mounted between the piston and the load frame near the sample for the measurement of the axial strain The axial load is determined from an external load cell
Figure 2-1 The servohydraulic testing machine RBA 2500 (a) and the scheme of the pressure vessel (b)
Axial deformation experiments (Δh resp the deformation ε1 = Δh h0) in compression or extension mode can be performed at various confining pressures (pc up to 100 MPa) and at temperatures up to 100C within a deformation rate range of 1 = 10-5 ndash 10-7 1s to chosen values of ε1 As a standard technique during the experiments the sample volume changes ΔV are determined by a volume balance of the mantle oil volume changes as measured via the pressure intensifier and the axial piston displacement in the cell
PIPIPP ASAhV (2-1)
FORGE Report Dxxx ndash Ver0
11
with ΔSPI = displacement of the cylinder within the pressure intensifierAPI = cross section of the piston within the pressure intensifierΔh = displacement of the piston of the triaxial cellAPP = cross section of the piston of the triaxial cell
0V V
V (2-2)
In calculation of the stress difference (σ1 ndash σ3) deformation-induced variation of the cross section of the specimen is considered
The leakage-freeness of the oil volume measurement equipment is tested before beginning of each measuring cycle over a waiting period of ca 1 hour However the accuracy of the volume measurement depends on the constancy of the oil temperature within the triaxial cell and within the pressure intensifier
212 Permeability testingAs shown in the schematic drawing of the triaxial pressure cell (depicted in Figure 2-1) permeability can be measured parallel to the sample cylinder axis (dimensions ca 90 mm in diameter and 180 mm long) To maintain access of the gas to the sample either a central hole exists in the plates whereby the specimens additionally will be prepared with small boreholes on their axial ends to minimize end effects during straining or filter plates are used to provide flow over the whole cross section of the sample
Figure 2-2 Flow-meter used for permeability testing
Gas-permeability is measured using nitrogen with an equipment similar to that described by PEACH amp SPIERS (1996) allowing both transient and stationary permeability measurements
Two methods are used to determine the gas flow (q) through the samples To perform the permeability measurement the primary gas pressure p1 is applied Its value depends on the test specimenrsquos permeability and on the measurement range of the gas flow-meter (0 - 10 resp 0 -500 cmmin manufacturer BRONKHORST Model F-230M)
Alternatively using a defined gas volume on the in- (V1) and outlet (V2) and measuring the
pressure increase Δp2 resp t
pp 22
is verified to determine 222 pVV whereby 2Vˆq
FORGE Report Dxxx ndash Ver0
12
At a given injection pressure gas enters into the assumed relatively large pores and displaces the pore water This process is regarded as two-phase flow After reaching a stationary flow through the specimen the amount of gas flow over a defined period of time is recorded (q)
The intrinsic permeability is calculated by the modified DARCYrsquos law for compressive media
)pp(pq
Alk L
22
21
2
(2-3)
with η = dynamical viscosityl = (h ndash t) = effective length of the flow path through the sampleh = height of the sampleA = cross section of the samplepL = pressure at gas flow measurementt = sum of the length of both holes in the samplep1 = injection pressurep2 = outlet pressure
The absence of leakage of the permeability equipment is tested before each measuring cycle using a steal sample over a waiting period of around 1 hour
213 Shear testingGeomechanical discontinuities between various buffer elements and to the host rock are probably the clearest example of existing interfaces acting as mechanical weakness zone or preferred pathways For the mechanical behavior of interfaces the relevant variables are stress traction vector with one normal component and one tangential in a simple 2-dimensional stress field (or two tangential in 3D) and the conjugate strain variables are the corresponding relative displacements (Figure 2-1) However such stress conditions can be only realized in direct shear tests which are therefore of urgent need to reproduce slip between various materials
In the past several companies have developed modern state-of-art testing equipment which allows new types of testing procedures to determine the mechanical parameters of joints and intact rock High-response servo-hydraulic systems with digital control technology strain measurement equipment mounted onto the specimen and programmable control modes enable new types of test procedures to be performed which are tailored to the specific problem eg BLUEMEL (2000) BLUEMEL amp POETSCH (2003) For realization of required shear tests a modern shear test system is available at the IfG (Figure 2-2)
Figure 2-1 Loading geometry in direct shear test
FORGE Report Dxxx ndash Ver0
13
The loading frame consists of a two-axle experimental setup with vertical and horizontal stress initiation a platform for shear test with a two-stage shear box and a servo-hydraulic control unit for two channels (vertical and horizontal) Both can be managed force or displacement controlled The test arrangement is shown in Figure 2-2 The frontal part (right) is an extremely stiff four-columned housing for fixing and vertical loading of the two-stage shear box by the upper hydraulic cylinder (up to 500 kN axial load)
Figure 2-2 The MTS ndash shear test system (model 816) available at the IfG (left) Schematic sketch of the MTS ndash test system (right)
Figure 2-3 Two-stage shear box for shear tests (Left) Schematic sketch with orientation of the specimen and the 25 mm opening between the two single boxes (Right) Prepared boxes with installed specimen The front panel with handle is for defined fixing of the shear boxes and will be removed before test start
A robust desk with a horizontal cylinder (-250 kN pressure - 160kN tension) is laterally positioned in a horizontal housing This cylinder supplies the lateral shear force The upper shear box is fixed by a horizontal housing that enables yet a twisting of approx 2 around the horizontal axes referring to the shear midpoint While a vertical load acts to the whole shear box the lower box can be horizontally displaced under weight The box is lead with less friction by mechanically high quality linear guides
The displacement of the boxes to each other under load is measured and recorded by 4 displacement transducers on the edges of the box (for vertical displacement) and by 2 additional position encoders (for horizontal displacement) Thereby a possible twisting is measured as well
FORGE Report Dxxx ndash Ver0
14
A sufficiently stiff fixing of the specimens in the shear box is a prerequisite for an exact determination of shear resistance (Figure 2-3) Therefore as the first step for investigation of the shear strength of bentonite bentonite or bentonitegranite interfaces two cut in half bricks (125 cm x 125 cm) were stacked one on the top of the other (respectively one half brick on a rough granite surface) The aggregate was covered with a plastic foil to protect them against wetting by the wet concrete that fixes the samples in the shear boxes So the contact planes between the two bricks are exactly perpendicular to the shear direction in the center of the shear box with 25 cm opening (Figure 2-10)
Samples for the second test row (brickgranite interface) were similarly prepared Instead of two bentonite bricks (or bentonite brick halves) a bentonite brick was arranged on a rough contact plane of a host rock block (ie medium-grained grained granite with an artificial fracture surface) Between both blocks was a loose horizontal contact Further preparations were done like mentioned above
22 RESULTS
221 Strength testingIn order to investigate the effect of deviatoric loading on the hydro-mechnical integrity we performed five compression tests The applied confining pressures varied between 10 and 200 MPa After hydrostatic compaction ndash pre-loading at the respective stress state ndash the samples were deformed in triaxial compression (1 gt 2 = 3) with a constant strain rate of 25 ∙ 10-5 1s
For comparison the obtained stress strain curves and the respective evolution of volumetric strain (ie dilatancy) are compared in Figure 2-4 The resulting peak strength (failure) and minimum dilatancy values (onset of dilatancy) are summarized in Table 2-1
As general starting from hydrostatical conditions the deviatoric stress increases to ensure constant rate deformation Generally the slope of the stress-strain curve of all samples exhibits the characteristic transition from initial quasi-elastic (linear) behavior to a curve with relatively large radius indicating typical strain hardening until failure at strains The stress-strain curves depicted in Figure 2-4 nicely demonstrate the effect of increasing pressure resulting in higher strength and deformability
Table 2-1 Results from triaxial deformations tests ( = 2 10-5 1s)
sample pc 1 - fail Diff-failure 1-failure (VV) 1 - min w(MPa) () (MPa) (MPa) () () (wt-)
20611 10 157 868 97 -015 032 44
20608 25 134 1313 156 -010 031 59
20607 50 343 1432 193 -035 316 54
20612 100 715 2110 311 -146 1068 48
20620 200 1150 3101 510 -413 1886 48
As evident from the experiments the deformation style changes from brittle to quasi ductile behavior with increasing confining pressure as indicated by increasing failure strains and different post failure behavior One can see a change from a sharp stress-strain curve with a significant lower post-failure stage to a more or less broad plateau without a significant failure peak
FORGE Report Dxxx ndash Ver0
15
Most important dilatant deformations occur only in a low peripheral pressure range (3 5 MPa) At higher pressures (3 10 MPa) brittle deformation is suppressed resulting in a significant compaction of several percent The change of deformation behavior is also documented in the evolution of dilatancy Whereas at low confinement dilatancy onsets significantly before the failure at low strain is dilatancy at confining pressures higher than 5 MPa suppressed and compaction dominates during the whole deformation cycle
Figure 2-4 Summary of triaxial test results on bentonite bricks in a confining pressure range between 1 and 20 MPa Note the well pronounced effect of increasing confining pressureresulting in a change from brittle to ductile behavior
Figure 2-5 Change from brittle to ductile deformation - Cracks patterns of deformed samples
The visual inspection of deformed specimens after the experiment the deformation style of the specimens demonstrates the change of deformation style from brittle to ductile At lower
FORGE Report Dxxx ndash Ver0
16
confining pressures as can be seen from Figure 2-5 a complex shear failure signature occurred whereas at 3 gt 5 MPa compressive failure dominates
For evaluating the strength behavior all test results (standard TC-tests) are graphical depicted inFigure 2-6 Despite the scattering of the strength values it can be easily seen that the general trend of increasing strength with increasing minimal stress is nicely represented by a linear strength boundary according to the MOHR-COULOMB-criterion with the respective values of
ndash friction angle () 22c ndash cohesion (MPa) 28
It has to be mentioned that the friction angle of 22 corresponds fairly well to the results of the shear tests on interfaces between bentonite bricks but without cohesion (see chapter 223)
Figure 2-6 MOHR-COULOMB-diagram of bentonite bricks
Extrapolation of the obtained straight line to a confining pressure zero delivers a value of ca 9 MPa Based on a larger number of samples the average strength of the bentonite bricks was determined in the order of 55 to 65 MPa (SITZ et al 2001) This indicates some non-linearity to unconfined conditions demonstrating the need of triaxial tests for evaluation of the strength behavior of bentonite bricks
222 Gas permeabilityAs a prerequisite for evaluation of the later saturation tests the gas permeability of the bentonite bricks was determined using different sample arrangements As depicted in Figure 2-7 two different sample arrangements were used to realize axial gas-injection tests both on the intact matrix and also on an artificial interface between two bentonite bricks
Both samples were stepwise hydrostatically loaded (up and down cycle) with continuous gas injection which facilitates permeability determination by measuring the gas flow Exemplarily
FORGE Report Dxxx ndash Ver0
17
Figure 2-8 shows the time dependent change of gas permeability through the intact bentonite brick matrix according the different loading and un-loading steps Starting from an initial gas-permeability of ca 2 ∙ 10-16 m2 the permeability decreases with increasing the applied confining stress Increase of the confining pressure up to 3 = 9 MPa results in a decrease of permeability for more than one order of magnitude At constant confining pressure permeability decreases with time indicating visco-elastic matrix-compaction The time- and stress-dependent compaction effect is at least partial reversible if the confinement is reduced ie irreversible compaction becomes visible But close inspection of pressure-dependent change of permeability as depicted in Figure 2-9 indicates that during the unloading cycle phyd lt 2 MPa the permeability increases significant which may indicate inelastic crack opening during stress release
Figure 2-7 Sample arrangement for permeability testing a) matrix-permeability b) interface permeability
Figure 2-8 Permeability testing at hydrostatic loading Time-dependent course of the experiment with the different loading steps (up and down cycle) with the resulting compactionand gas permeability
Figure 2-9 compares the results measured on the two different sample arrangements ie (left) intact matrix and (right) matrix with an artificial interface (saw cut) It becomes obvious that the
FORGE Report Dxxx ndash Ver0
18
ldquointegralrdquo permeability of the bentonite aggregate with an artificial interface is initially four orders of magnitude higher than the intact matrix ie ko-interface asymp 10-12 m2 Increase of confining pressure up to 10 MPa lowers the permeability for more than 2 orders whereas unloading of the sample results in a significant hysteresis This is clearly indicates crack sealing
Figure 2-9 Permeability testing at hydrostatic loading Gas permeability and volumetric strain vs confining pressure a) Bentonite brick matrix permeability b) Bentonite brick with artificial interface (saw cut)
223 Shear strength (initial state)
The shear testing program consists of the following sample configurations and test number(1) Bentonite brick bentonite brick
a Dry (delivery state) 2 multi-step shear testsb Wetted surface (only just before the test) 1 multi-step shear testsc Healed interface between bentonite bricks
after pre-saturation over one year 2 single-step shear tests(2) Bentonite brick rough granite surface (dry) 4 single-step shear tests
1 multi-step shear tests
Principally the test realization comprises two phases ie pre-consolidation followed by the original shear phase which can be divided in several steps at various normal stresses The test results are typically represented by a peak strength and a residual strength value after loss of cohesion between the shear interfaces
FORGE Report Dxxx ndash Ver0
19
Figure 2-10 Documentation of the interfaces of various test constellations a) View inside the open shear gap after the tests b) Scheme of the brickgranite arrangement
2231 SHEAR TESTS ON DRY BENTONITE BRICK INTERFACES
First of all the shear strength of the dry interfaces between two bentonite bricks was determined in two multiple-step shear tests each with 4 steps at normal stresses n = 05 10 2 and 4 MPa6 During the tests the lower shear box was controlled displaced forward (resp backwards) with a shear rate of 0002 mms
Figure 2-11 Multi-step shear test Bent-SV-MS1 (forward cycle) of the dry contact between two bentonite bricks The test was realized with σn = 05 1 2 4 and 6 MPa
6 To avoid brick failure the maximum normal load was set generally smaller than the average uniaxial strength
FORGE Report Dxxx ndash Ver0
20
The results of a selected shear test (Bent-SV-MS1) are shown as a variation of shear stress and dilatancy vs shear displacement (increasing load cycle) in Figure 2-11 Pre-loading of the sample to the respective normal stress results in some small compaction which developsfurther during the following shear cycles During the various shear steps contrary to experiences from tests on compact material or natural interfaces no stress peak occurs but a more or less constant shear strength level is apparent At higher normal stress states the shear stresses increase as well Concomitantly with the increase of normal stress the variation of dilatancy (always decrease) documents progressive compaction of the bentonite brick aggregate (eg the total compaction ndash during the whole test at n = 1 MPa - is ca 1mm)
The strength and dilatancy behavior does not depend on the course of loading ie if the vertical load steps are varied as upwards or downwards cycle
2232 SHEAR TESTS ON BENTONITE BRICK GRANITE INTERFACES
As a reference material for shear tests on interfaces between bentonite and granite we selected an artificial fractured cuboid of granite (20cm x 15cm x 75cm) of unknown origin The roughness of the artificial split surface was measured using a 3D surface and body scanner at the University of Freiberg (Prof KONIETZKY) The maximum scanner resolution is in the order of 2m As can be seen from Figure 2-12 the mean difference between highest and lowest asperity is in the order of 15 cm
Figure 2-12 Characterization of the granite contact surface a) Histogram of the height distribution of the later shear surface b) Sample dimensions c) Scheme of the bentonite brickgranite aggregate prepared for shearing
Overall one multiple-step shear test and four single-shear tests of bentonite brick granite samples were performed The sample arrangement is qualitatively the same as before
FORGE Report Dxxx ndash Ver0
21
Principally the test realization comprises two steps pre-loading to the respective normal stress state followed by the shear phase
Remarkably despite the existing asperities the initial compaction is only in the order of some few millimeters (depending on the stress level) which indicate that the interface ie the gap between the flat bentonite brick and the asperities is only partially closed during loading This results from the high uniaxial strength of the bentonite bricks
Exemplarily the results of the multi-step shear test are shown in Figure 2-13 which was performed with three steps at n = 05 10 and 20 MPa with displacement rates of 0002 mms Qualitatively the results are comparably to the results of the tests reported in the chapter before Surprisingly also no significant shear peak is observed but post inspection of the sheared planes indicates that local sliding of spikes with linear erosion dominates during shearing Although no significant compaction and local shear failure occurred the shearing along the rough surface requires local overcoming of the existing cohesion
Figure 2-13 Multi-step shear test BentGran-SV-MS1 (forward cycle) of the dry contact between bentonite brick granite surface The test was realized with σn = 05 1 and 2 MPa
2233 SUMMARY HYDRO-MECHANICAL PROPERTIES ndash DRY STATE
The results of the various shear tests were compiled in Table 2-2 and graphical depicted in Figure 2-14
Analog to the strength properties of an intact rock the MOHR-COLOUMB criterion can be used to describe the discontinuity plane characteristics of a jointed rock Accordingly the shear resistance on an interface at critical stress conditions (shear failure) can be expressed stress-depended by a linear dependency of cohesion (c) and angle of friction ()
τf = c + σf tan φ
FORGE Report Dxxx ndash Ver0
22
According to the different material groups two linear trends of results are clearly visible Whereas bentonitebentonite interfaces show no cohesion but significant friction obviously due to the sand content demonstrate shear tests for bentonite bricksgranite a small but significant occurrence of cohesion which was already indicated by post-evaluation of sheared interfaces The tips of the existing roughness of the granite surface are pressed into the bentonite material resulting in local erosion channels
The respective MOHR-COULOMB-parameters are as follows
τ = C + σN tanφ MOHR-COULOMBC φ
brick brick 002 210brick granite 019 196
(MPa) ()
In summary despite the small difference between both interface types comparison with Figure 2-6 demonstrate the importance of artificial interfaces between bentonite bricks as potential weakness planes
Figure 2-14 Summary of shear tests on interfaces between bentonite brick bentonite brick respectively bentonite brick granite ndash MOHR-COULOMB-diagram
FORGE Report Dxxx ndash Ver0
23
Table 2-2 Shear test results
shear strain n dilatancy time
(mm) (MPa) (MPa) (mm) (min)
bentonite brick bentonite brick
057 050 023 -040 503
383 050 021 -046 3215
782 100 038 -075 6548
1186 200 073 -120 9932
1575 400 140 -199 13208
1220 075 033 -017 2492
839 150 064 -033 5682
429 300 123 -068 9123
042 600 240 -170 12397
bentonite brick granite surface
987 200 094 -540 9120
457 400 160 -354 23913
982 100 053 -362 9120bentonite brick granite surface (wetted)
985 100 029 456 10403
3 Gas transport properties of partial saturated bentonite
31 PRE-SATURATION OF BENTONITE BRICKS WITH INTERFACESFor pre-saturation of the samples respectively for the later gas injection tests a new oedometer-like pressure cell is constructed allowing in additions gas flow measurements under defined axial sample consolidation respectively swelling conditions due to different injected water amounts
The sample arrangement consists of a stiff tube ndash oedometer ndash with two sample cylinders of pre-compacted bentonite (respectively one rock sample with a natural rough surface) which are separated by an axial interface inside Two movable pistons equipped with sinter metal plates allow control of volume changes of the sample ie compaction due to a defined axial load or expansion induced by swelling due to water injection Resulting changes in volume or axial force are measured with dial gauges or an axial oriented load cell
As can be seen from Figure 3-1 the cell design facilitates measurements of fluid transport properties through the buffer respectively along the interface between block contacts ie bufferbuffer and bufferblock at defined interface conditions The cell diameter is 90 mm and the overall sample height is ca 120 mm (consisting of two cylindrical specimens ndash 60 mm height) Sinter metal plates ensure access to the axial ends of the sample
FORGE Report Dxxx ndash Ver0
24
The special design of the cell allows fluid injection (1) along the axial direction ie for pre-saturation of the bentonite to induce swelling or measurement of the matrix permeability and (2) through a central hole along the interface ie investigation of contact permeability
pGAs - Inlet
pGas - Outlet
pH2O - Inlet
pH2O - Outlet
FaxLoad cell
Figure 3-1 Principle of the new designed oedometer-cell for gas injection tests on bufferbuffer or bufferrock interfaces at defined bentonite swelling pressures
0 100 200 300
Time (d)0 100 200 300
Time (d)
00
10
20
30
40
50
60
70
80
90
100
0 100 200 300
Time (d)
Axia
l stre
ss (M
Pa)
Inje
cted
wat
er (w
t-
)Vo
lum
etric
sw
ellin
g (
)
I I
ax
water
Vol
ax
water
Volax
water
Vol
Figure 3-2 Pre-saturation of bentonite brick aggregates (left) ax = 2 MPa ndash central injection through a injection hole with radial fluid flow (middle) ax = 4 MPa ndash central injection through a injection hole with radial fluid flow (right) ax = zero ndash axial water injection with free swelling
FORGE Report Dxxx ndash Ver0
25
311 Lab test resultsThree long-term injection tests (pi = 04 MPa) were started in Spring 2010 whereby three different situations were realized
(1) central water injection through an injection hole through a central tube resulting (as proposed) in radial fluid flow along the brick interface
a ax = 4 MPa
b ax = 2 MPa
(2) axial water injection (without axial load) through the end plates (sintered metal) resulting in free axial swelling
The various curves of water consumption and the resulting swelling are summarized in Figure 3-2 The results can be summarized as follows
(1) The water consumption during swelling depends
a obviously not on the injection geometry
b and only weakly on the axial load
No preferred flow along the interface ie matrix swelling
(2) More than 1 year water injection was not sufficient to reach full saturation ie no water out flow but in the center full saturation is assumed Therefore after one year water injection the tests 1a and 1b were finished to facilitate gas injection tests
312 Comparison to the mock-up test SondershausenDespite the different scales of lab and field tests and the limited number of tests the results correspond very well to existing experiences made from in situ tests where sealing elements are constructed of different blocks or bricks Figure 3-3 illustrates the observations made during testing the sealing element of the mock up test Sondershausen (see short description in chapter 12) The sealing element consists of masonry of bentonite bricks (FS 50) which was tested with NaCl-fluid at a maximum fluid pressure of pfl asymp 8 MPa (pswellasymp 1 MPa) (for details see SITZ 2001)
The following conclusions were drawn from the in situ test (evaluation of the humidity distribution after rebuilding the plug)
1Proof of clear saturation front during fluid pressurization
2Homogenous humidity distribution inside the partially saturated buffer
Low effect of artificial interfaces inside the buffer
3Clear pathways in the contact zone buffer host rock (salt)
Interfaces to the host rock are obviously the most relevant pathways
These observations correspond to the results of the laboratory tests therefore demonstrating that interfaces inside the sealing plug are of minor importance because due to the overall swelling effect they will be efficiently sealed
FORGE Report Dxxx ndash Ver0
26
Figure 3-3 Summary of the mock-up test Sondershausen Upper sketch the test design The picture below shows the humidity distribution inside the buffer (vertical profile along the dam axis)
32 GAS INJECTION TESTS ndash DETERMINATION OF GAS BREAKTHROUGHFor the gas-injection tests we used a constant volume radial flow geometry realized in the experimental setup depicted in Figure 3-4
Gas flow measurements under constant volume conditions
A servo-controlled load frame (up to 250kN load capacity) ensures defined loading respectively volume conditions The axial strain (measured between the load plates) is kept constant during the test (resolution 1 m) ie if the sample volume increases due to gas-injection the axial force is automatically increased During the test the change of the axial stress is measured via a load cell
Gas injection at constant injection pressure on the at least partial saturated bentonite sample with a radial flow geometry
After finishing the saturation instead of water gas was injected through the central pipeof the swelling cell which should result in radial flow if preferred flow along the former interface occurs During the test the samples is drained in the axial direction ie through the axial filter plates
During stepwise increase of the primary gas pressure the inflow of gas is measured with a flow-meter ie during each pressure step firstly the dead volume before the gas access to the sample is pressurized which results in an inflow-peak If gas pressureequilibrium before and after the flow-meter is reached and the sample behaves nearly gastight the apparent flow rate becomes zero Gas break through ie overcome of the
FORGE Report Dxxx ndash Ver0
27
capillary entry pressure is indicated by quasi-constant gas-in-flow or gas-outflow (ie bubbles in a burette)
Two gas breakthrough tests were performed at initial axial pressures of 2 respectively 4 MPa The results are summarized in Figure 3-5 respectively Figure 3-6
Figure 3-4 Experimental setup for gas-breakthrough measurements under constant sample volume
Figure 3-5 Gas breakthrough test ndash axial stress and gas pressure respectively resulting gas flow vs time Ax ndashinit asymp 2 MPa
FORGE Report Dxxx ndash Ver0
28
After finishing the pre-saturation of the bentonite the samples were axially unloaded and the cells were put into the servo-hydraulic load frame Before the tests a waiting period of ca 1 day (at the nominal axial stress) was usually applied to ensure equilibrium inside the sampleExemplarily Figure 3-5 shows the stability of the axially applied strain control which is in the order of 1 m However this results in a variation of the axial stress of 02 MPa
Then the gas pressure was stepwise increased each with a waiting period of ca 05 hour The change of the gas pressure is always followed by peak of gas-inflow as explained before but becomes zero If a gas pressure state some few bars below the axial stress is reached the gas pressure was kept constant over a period of 12 to 15 hours to exclude time effects of a gas breakthrough ie delay to slow water expulsion Despite some scattering no significant gas in- or outflow was observed
In the next phase the stepwise pressurization was continued If the gas-pressure reaches the acting axial stress ie Ax ndashinit = min some local gas flow becomes apparent but with some instability Further pressure increase did not change the gas flow significant until the breakthrough occurred
1st test Ax ndashinit = min asymp 2 MPa 27 ndash 29 MPa ie 07 ndash 09 MPa higher than min
2nd test Ax ndashinit = min asymp 4 MPa 75 MPa ie 35 MPa higher than min
The tests clearly demonstrate that the gas-entry pressures are significantly higher than min In addition no effect of the interface ie preferred radial gas flow is visible In a first approach the bentonite brick aggregate seems to behave like a homogenous buffer material For further discussion see the next chapter
Figure 3-6 Gas breakthrough test- axial stress and gas pressure respectively resulting gas flow vs time Ax ndashinit asymp 4 MPa The inset shows the central filter plate ( = 9mm) which was installed to ensure no blockage of the fluid inflow to low-permeable bentonite matrix
FORGE Report Dxxx ndash Ver0
29
33 SHEAR STRENGTH (HEALED SPECIMENS)The gas injection tests results delivered very high gas entry pressures which succeeded the minimal stress which has been axially applied by about several MPa (depending on the order of stress) A possible explanation could be that due to the central gas injection locally a high water pressure is generated The local pore fluid pressure may be temporarily preserved during the fast pressurization with gas due to the low permeability of the matrix although the system is drained by the axial filter plates However it becomes obvious that the effect of the former interface as a potential pathway does not exist anymore This may indicate that the interface is healed during the time-dependent swelling process
Healing means the development of cohesion ie which results in bentonite from electrostatic forces among fine particles (clay minerals) and water Shear tests represent a simple way to quantify the amount of cohesion as already demonstrated before Here we used the bentonite brick aggregates after dismantling the sample Visual inspection of the former interface give no hints for a mechanical or hydraulical weakness plane ie only the color contrast indicates the former contact plane
Figure 3-7 Bentonite brickbrick aggregate ndash dismantled sample after controlled saturation by injecting water directly on the interface (compare injection filter plate in Figure 3-6) Note the sharp color contrast at the former interface (total height of the sample 12 cm)
To demonstrate that real healing took place we performed with both specimens direct shear tests on the former interface between both bentonite brick halves The procedure is the same as described in 213
FORGE Report Dxxx ndash Ver0
30
Figure 3-8 Single-step shear test on the healed contact between bentonite brick brick surface The test was realized with σn = 05 MPa
Figure 3-9 Summary of both shear tests on ldquohealedrdquo interfaces between bentonite brick bentonite brick in comparison to the former results summarized in Figure 2-14 ndash MOHR-COULOMB-diagram
FORGE Report Dxxx ndash Ver0
31
The results differ significantly from the shear tests performed on the dry or only short wetted contact planes The following results are obtained from Figure 3-8
bull Shear test curves
Exemplarily the results of the shear test performed at n = 05 MPa are shown As usual for intact material shear stress grows with progressive shear displacement in elastic manner up to a peak and then drops down to a residual value Peak and residual values are higher with applied normal stress Repeating the experiment with the 2nd sample at n = 15 MPa (not shown here) results in a similar shape of the strength curve but the increase of strength is not so significant indicating that the influence of the acting normal stress is low ie the friction angle is only small
bull Dilatancy curves
Due to the surface roughness and asperities a bedding plane tends to dilate upon shear although this effect tends to level off after certain amount of prescribed shear displacement and is lower for higher normal stress (not shown here)
For comparison with earlier measurements on dry interfaces shear stress peaks and residual values of shear stress obtained in both single experiments are represented in Figure 3-9 against normal stress leading to open envelopes of the Coulomb type The evaluation of these tests with σn = 05 resp 15 MPa documents a cohesion of 06 MPa in the τ-σn-diagram Remarkably the angle of friction with ca 10 is much lower than that of tests on dry contacts before healing
4 ConclusionsThe performed lab investigations cover a wide field of hydro-mechanical properties of bentonite bricks which represent a favorable option for constructing sealing plugs in different host rock environments
Based on the experimental results the following conclusions can be drawn
At dry conditions gas flow along interfaces is at least 4 orders higher than through the matrix (eg 10-16 m2) Increase of confinement significantly lowers the gas flow (10 MPa more than one order) but the effect is more pronounced for interfaces crack sealing
Saturation of bentonite brick aggregates ie bricks with a common interface is not affected by the interfaces and only weakly by the acting confining pressure
During gas injection (stepwise increasing of the gas pressure) a significant effect is only observed if the minimal stress is passed resulting in some minor (local) gas flow
The gas break through results in stationary inflow but no significant effect on the total stress is measured probably due to the central (spherical) gas injection (no outflow)
The measured gas threshold pressures under constant volume conditions significantly exceed the sum of the swelling pressure and externally-applied porewater pressure ndashdrained conditions (pi gt ax some MPa)
An important observation is that despite the former interface the bentonite block aggregatebehaves during the saturation of the buffer not different than the homogenous matrix This has been confirmed as well by gas injection tests on the former interface as well by shear tests The
FORGE Report Dxxx ndash Ver0
32
demonstration of the development of cohesion after pre-saturation is a favorable finding because this verifies physical healing of the interface In addition cohesion inside the matrix helps to explain why the measured gas entry pressures are higher than the applied minimal stress
However this observation is only based on two tests which need to be confirmed by the forthcoming experiments Also for understanding the physical background of high entry pressures of gas into the water-saturated bentonite matrix more experimental investigations are of urgent need
5 ReferencesBARTON C A ZOBACK M D amp MOOS D 1995 Fluid flow along potentially active faults in crystalline rock
Geology 23 683ndash686
BLUEMEL M 2000 Improved Procedures for Laboratory Rock Testing EUROCK 2000 ISRM Symposium Aachen 573 ndash 578
BLUEMEL M amp POETSCH M 2003 Direct Shear Testing System International Symposium on GeoTechnical Measurements and Modelling Karlsruhe 327 ndash 331
BUZZI O 2004 Hydromecanique du contact entre geomateriaux Experimentation et modelisation Application au stockage de dechets nucleaires These Universite Joseph Fourier Grenoble France
METCALF R WATSON S P REES J H HUMPHREYS PAUL AND KING F 2008 Gas generation and migration from a deep geological repository for radioactive waste A review of NirexNDArsquos work Technical Report NWAT Environment Agency Penrith Cumbria
NORRIS S 2009 Summary of Gas Generation and Migration Current State-of-the-Art (draft - July 2009) FORGE D12-R
PEACH CJ amp SPIERS CJ 1996 Influence of crystal plastic de-formation on dilatancy and permeability development in synthetic salt rock Tectonophysics 256 101-128
POPP T 2009 State of the art report on gas transport through interfaces FORGE D31-R (WP 33) 48 pp
SITZ P 2003 Entwicklung eines Grundkonzeptes fr langzeitstabile Streckenverschlussbauwerke fr UTD im Salinar Bau und Test eines Versuchsverschlussbauwerkes unter realen Bedingungen (BMBF-gefrdertes FE-Vorhaben Nr 02 C 05472) Abschlubericht TU Bergakademie Freiberg Institut fr Bergbau 2003
FORGE Report Dxxx ndash Ver0
7
capacity of bentonite inherent existing interfaces may be reopened during gas injectionMoreover it has been shown by BUZZI et al (2006) that bentonite is very sensitive to hydraulic erosion producing flow channels within the interface zone
But for interpretation of the relevancy of such phenomena resp numerical back analysis of field tests (ie FEBEX Lasgit) only limited experimental data from laboratory tests are availableTherefore it can be stated that further laboratory test results are important to deduce the hydro-mechanical (HM) parameters for numerical calculations evaluating the long-termintegrity of EBS especially bentonite bearing buffer systems
In the literature a variety of different possible bentonite mixtures or clay minerals has been projected as backfill material in the nuclear waste context Pure bentonite has been rarely proposed for the engineered barrier due to technical reasons eg low mechanical strength of the blocks or aggregates limitation of swelling pressure Therefore pre-fabricated bentonite blocks are an option where usually some aggregates (eg sand or crushed rock) are added to the bentonite in order to enhance its mechanical properties In the past several in situ tests have demonstrated that bentonite buffer or sealing plugs may be built as masonry of different bricks or as a monolith system consisting of large blocks
In the framework of WP3 IfG performed lab investigations aiming (1) on interfaces between bentonite bricks itself and (2) on mechanical contacts of bentonite blocks and concrete to various host rocks ie granite
11 IFG-WORK ndash ACTUAL STATEThe main objectives of the laboratory work of IfG are twofold
1 to investigate gas transport properties of interfaces between bentonite blocks The sub-items are
a to perform long-term laboratory tests (duration of several month up to two years) on artificial contact interfaces between sealing material bricks (ie bentonite) and to the host rock under well controlled stress and swelling conditions with water injection resp subsequent gas injection
b to provide data for time dependent interface ldquopermeabilityrdquo changes (ie sealing) during long-term compaction and fluid injection
c to provide data about gas entry pressures and relative gas permeability changes during pressure dependent gas injection
2 to provide experimental data from short term tests in a direct shear apparatus with measuring of gas transport and mechanical contact properties for the various interface configurations undergoing shear deformation at defined normal stresses1
The actual report describes results of the hydro-mechanical pre-characterization of bentonite bricks supplemented by shear tests between brick interfaces and to the host rock (granite) and preliminary results of gas injection tests on partially flooded bentonite sample constellations
1 The ldquoshear failurerdquo of a sealing plug due to fluid pressurisation or swelling phenomena is governed by hydro-mechanical characteristics of the confined plug host rock interface If shear slip occurs on a critically stressed interface it can raise the permeability of the fracture through several mechanisms including brecciation surface roughness and breakdown of seals (BARTON et al 1995) However increased pore pressures acting in the interface may also lower the acting minimal stress thus initiating the shear failure
FORGE Report Dxxx ndash Ver0
8
12 MATERIAL DESCRIPTIONWe used as reference material artificial bentonite bricks consisting of a sand clay-bentonite mixture but the variety of bentonite-based buffer materials has to be taken in mind The bricks were manufactured in the frame work of the so-called dam - project ldquoSondershausenrdquo ie a German research project between 1997 and 2002 funded by BMBF2 and TMLNU3
The underground test was performed as a demonstration experiment of a multi-component drift barrier system in a salt repository (details are given by SITZ et al 2001) The sealing element consists of the already mentioned bentonite bricks which were hydraulically tested by pressurization through pressure chamber 1 (Figure 1-2) A static abutment was constructed consisting of a salt brick masonry in a prismatoid shaped extension of the drift The completesystem was installed and tested in the salt mine Sondershausen Afterwards the dam was rebuilt4
Figure 1-2 Layout of the full scale drift sealing test Sondershausen (after SITZ et al 2001)
2 BMBF Bundesministerium fr Bildung und Forschung 3 TMLNU Thringer Ministerium fr Landwirtschaft Naturschutz und Umwelt4 In the test phase of several months the dam was loaded with a brine fluid pressure up to 8 MPa However as later found due to leakage through the so called floor-channel (central leading through the building for cables and pressure tubes) and fluid flow around the sealing system the salt bricks were partially flooded with brine which induces a spontaneous loss of strength resulting in a movement of the sealing element for more than 15 cm After finishing the pressure tests the dam has been completely rebuild to provide access to the various elements and to the contact zone between dam and the surrounding rock salt By that means it was possible to take samples of the partially flooded bentonite to measure its humidity content
Although the humidity distribution in the sealing elements indicated that partial flooding through the contact zone took place only weak indications for erosion phenomena in the contact zone between dam and the salt contour were observed but local fluid leakage points were attributed to movements of brine through the EDZ However the obtained swelling pressure in the sealing elements was not high enough to closure these pathways
FORGE Report Dxxx ndash Ver0
9
An important topic of the project was the development of appropriate pre-compacted bentonite bricks composed of bentonite (Calcigel5) and sand which should act as the long-term sealing element supposed to NaCl-brine Evaluating a suite of varies composition ratiosbetween both constituents finally the so-called Wetro FS40 bentonite bricks were selected for the test
The manufactured bentonite bricks (at least 140t material) were industrially produced by the company ldquoFeuerfestwerke Wetrordquo with a size of 25cm x 125cm x 625cm applying compressive stresses in the order of 40 ndash 50 MPa The relevant material properties of the bricks aresummarized in Table 1-1
Table 1-1 Material parameters of the reference material Wetro FS40 bentonite bricks (taken from Sitz et al 2001)
Composition ca 60 bentonite (Calcigel) + 40 quartz-sand
Water-content () 7505 Compressed density (gcm3) 227001 Bentonite dry density (gcm3) 189002 Initial saturation (-) 077004 Hydraulic conductivity with NaCl-brine (ms) ca 10-12
Swelling pressure (MPa) - NaCl 35
Figure 1-3 Wetro FS40 bricks
After producing the bricks the bricks were sealed with plastic wrap and stored at ambient conditions on pallets For our lab tests cylindrical samples were prepared in specified dimensions for carrying out the laboratory tests using a lathe
2 Hydro-mechanical characterization of bentonite bricksFor a performance assessment of the long-term sealing or buffer system build up by bentonite bricks knowledge of the hydro-mechanical properties eg permeability and strength are of urgent need not only for dimensioning a drift sealing plug but also for a prognoses of property changes which may occur in the long-term after closure of the repository eg due to rock convergence or water inflow However because artificial interfaces between the various elements and to the host rocks exist also the contact properties between these bricks and between the bricks and host rock ie granite have to be determined
The investigations are aiming on the characterization of
Matrix properties ieo Compressive strengtho Gas permeability (dry state)
5 CALCIGEL is a natural Calcium bentonite produced from selected Bavarian bentonite deposits The material has the following mineralogical composition Montmorillonite 60 ndash 70 Quartz 6 ndash 9 Feldspar 1 ndash 4 Kaolinite 1 ndash2 Mica 1 ndash 6 and other minerals 5 ndash 10 (source httpwwws-cppcom)
FORGE Report Dxxx ndash Ver0
10
Interface properties ie
o Shear strength between blocks and to the rock contouro Gas permeability ie block aggregates with interfaces
21 METHODOLOGY
211 Strength testingThe strength and permeability measurements were performed in a standard Karman-cell (KRMN 1911) in the servo-hydraulic testing machine (RBA 2500 SCHENKTREBEL Germany ndashusing the MTS-TestStar software) allowing independent control of the radial (2 = 3 = pc) and axial stresses (Ax = 1) The cylindrical samples are sealed with rubber tubes and oil is used as confining medium Outside the vessel three LVDT transducers are mounted between the piston and the load frame near the sample for the measurement of the axial strain The axial load is determined from an external load cell
Figure 2-1 The servohydraulic testing machine RBA 2500 (a) and the scheme of the pressure vessel (b)
Axial deformation experiments (Δh resp the deformation ε1 = Δh h0) in compression or extension mode can be performed at various confining pressures (pc up to 100 MPa) and at temperatures up to 100C within a deformation rate range of 1 = 10-5 ndash 10-7 1s to chosen values of ε1 As a standard technique during the experiments the sample volume changes ΔV are determined by a volume balance of the mantle oil volume changes as measured via the pressure intensifier and the axial piston displacement in the cell
PIPIPP ASAhV (2-1)
FORGE Report Dxxx ndash Ver0
11
with ΔSPI = displacement of the cylinder within the pressure intensifierAPI = cross section of the piston within the pressure intensifierΔh = displacement of the piston of the triaxial cellAPP = cross section of the piston of the triaxial cell
0V V
V (2-2)
In calculation of the stress difference (σ1 ndash σ3) deformation-induced variation of the cross section of the specimen is considered
The leakage-freeness of the oil volume measurement equipment is tested before beginning of each measuring cycle over a waiting period of ca 1 hour However the accuracy of the volume measurement depends on the constancy of the oil temperature within the triaxial cell and within the pressure intensifier
212 Permeability testingAs shown in the schematic drawing of the triaxial pressure cell (depicted in Figure 2-1) permeability can be measured parallel to the sample cylinder axis (dimensions ca 90 mm in diameter and 180 mm long) To maintain access of the gas to the sample either a central hole exists in the plates whereby the specimens additionally will be prepared with small boreholes on their axial ends to minimize end effects during straining or filter plates are used to provide flow over the whole cross section of the sample
Figure 2-2 Flow-meter used for permeability testing
Gas-permeability is measured using nitrogen with an equipment similar to that described by PEACH amp SPIERS (1996) allowing both transient and stationary permeability measurements
Two methods are used to determine the gas flow (q) through the samples To perform the permeability measurement the primary gas pressure p1 is applied Its value depends on the test specimenrsquos permeability and on the measurement range of the gas flow-meter (0 - 10 resp 0 -500 cmmin manufacturer BRONKHORST Model F-230M)
Alternatively using a defined gas volume on the in- (V1) and outlet (V2) and measuring the
pressure increase Δp2 resp t
pp 22
is verified to determine 222 pVV whereby 2Vˆq
FORGE Report Dxxx ndash Ver0
12
At a given injection pressure gas enters into the assumed relatively large pores and displaces the pore water This process is regarded as two-phase flow After reaching a stationary flow through the specimen the amount of gas flow over a defined period of time is recorded (q)
The intrinsic permeability is calculated by the modified DARCYrsquos law for compressive media
)pp(pq
Alk L
22
21
2
(2-3)
with η = dynamical viscosityl = (h ndash t) = effective length of the flow path through the sampleh = height of the sampleA = cross section of the samplepL = pressure at gas flow measurementt = sum of the length of both holes in the samplep1 = injection pressurep2 = outlet pressure
The absence of leakage of the permeability equipment is tested before each measuring cycle using a steal sample over a waiting period of around 1 hour
213 Shear testingGeomechanical discontinuities between various buffer elements and to the host rock are probably the clearest example of existing interfaces acting as mechanical weakness zone or preferred pathways For the mechanical behavior of interfaces the relevant variables are stress traction vector with one normal component and one tangential in a simple 2-dimensional stress field (or two tangential in 3D) and the conjugate strain variables are the corresponding relative displacements (Figure 2-1) However such stress conditions can be only realized in direct shear tests which are therefore of urgent need to reproduce slip between various materials
In the past several companies have developed modern state-of-art testing equipment which allows new types of testing procedures to determine the mechanical parameters of joints and intact rock High-response servo-hydraulic systems with digital control technology strain measurement equipment mounted onto the specimen and programmable control modes enable new types of test procedures to be performed which are tailored to the specific problem eg BLUEMEL (2000) BLUEMEL amp POETSCH (2003) For realization of required shear tests a modern shear test system is available at the IfG (Figure 2-2)
Figure 2-1 Loading geometry in direct shear test
FORGE Report Dxxx ndash Ver0
13
The loading frame consists of a two-axle experimental setup with vertical and horizontal stress initiation a platform for shear test with a two-stage shear box and a servo-hydraulic control unit for two channels (vertical and horizontal) Both can be managed force or displacement controlled The test arrangement is shown in Figure 2-2 The frontal part (right) is an extremely stiff four-columned housing for fixing and vertical loading of the two-stage shear box by the upper hydraulic cylinder (up to 500 kN axial load)
Figure 2-2 The MTS ndash shear test system (model 816) available at the IfG (left) Schematic sketch of the MTS ndash test system (right)
Figure 2-3 Two-stage shear box for shear tests (Left) Schematic sketch with orientation of the specimen and the 25 mm opening between the two single boxes (Right) Prepared boxes with installed specimen The front panel with handle is for defined fixing of the shear boxes and will be removed before test start
A robust desk with a horizontal cylinder (-250 kN pressure - 160kN tension) is laterally positioned in a horizontal housing This cylinder supplies the lateral shear force The upper shear box is fixed by a horizontal housing that enables yet a twisting of approx 2 around the horizontal axes referring to the shear midpoint While a vertical load acts to the whole shear box the lower box can be horizontally displaced under weight The box is lead with less friction by mechanically high quality linear guides
The displacement of the boxes to each other under load is measured and recorded by 4 displacement transducers on the edges of the box (for vertical displacement) and by 2 additional position encoders (for horizontal displacement) Thereby a possible twisting is measured as well
FORGE Report Dxxx ndash Ver0
14
A sufficiently stiff fixing of the specimens in the shear box is a prerequisite for an exact determination of shear resistance (Figure 2-3) Therefore as the first step for investigation of the shear strength of bentonite bentonite or bentonitegranite interfaces two cut in half bricks (125 cm x 125 cm) were stacked one on the top of the other (respectively one half brick on a rough granite surface) The aggregate was covered with a plastic foil to protect them against wetting by the wet concrete that fixes the samples in the shear boxes So the contact planes between the two bricks are exactly perpendicular to the shear direction in the center of the shear box with 25 cm opening (Figure 2-10)
Samples for the second test row (brickgranite interface) were similarly prepared Instead of two bentonite bricks (or bentonite brick halves) a bentonite brick was arranged on a rough contact plane of a host rock block (ie medium-grained grained granite with an artificial fracture surface) Between both blocks was a loose horizontal contact Further preparations were done like mentioned above
22 RESULTS
221 Strength testingIn order to investigate the effect of deviatoric loading on the hydro-mechnical integrity we performed five compression tests The applied confining pressures varied between 10 and 200 MPa After hydrostatic compaction ndash pre-loading at the respective stress state ndash the samples were deformed in triaxial compression (1 gt 2 = 3) with a constant strain rate of 25 ∙ 10-5 1s
For comparison the obtained stress strain curves and the respective evolution of volumetric strain (ie dilatancy) are compared in Figure 2-4 The resulting peak strength (failure) and minimum dilatancy values (onset of dilatancy) are summarized in Table 2-1
As general starting from hydrostatical conditions the deviatoric stress increases to ensure constant rate deformation Generally the slope of the stress-strain curve of all samples exhibits the characteristic transition from initial quasi-elastic (linear) behavior to a curve with relatively large radius indicating typical strain hardening until failure at strains The stress-strain curves depicted in Figure 2-4 nicely demonstrate the effect of increasing pressure resulting in higher strength and deformability
Table 2-1 Results from triaxial deformations tests ( = 2 10-5 1s)
sample pc 1 - fail Diff-failure 1-failure (VV) 1 - min w(MPa) () (MPa) (MPa) () () (wt-)
20611 10 157 868 97 -015 032 44
20608 25 134 1313 156 -010 031 59
20607 50 343 1432 193 -035 316 54
20612 100 715 2110 311 -146 1068 48
20620 200 1150 3101 510 -413 1886 48
As evident from the experiments the deformation style changes from brittle to quasi ductile behavior with increasing confining pressure as indicated by increasing failure strains and different post failure behavior One can see a change from a sharp stress-strain curve with a significant lower post-failure stage to a more or less broad plateau without a significant failure peak
FORGE Report Dxxx ndash Ver0
15
Most important dilatant deformations occur only in a low peripheral pressure range (3 5 MPa) At higher pressures (3 10 MPa) brittle deformation is suppressed resulting in a significant compaction of several percent The change of deformation behavior is also documented in the evolution of dilatancy Whereas at low confinement dilatancy onsets significantly before the failure at low strain is dilatancy at confining pressures higher than 5 MPa suppressed and compaction dominates during the whole deformation cycle
Figure 2-4 Summary of triaxial test results on bentonite bricks in a confining pressure range between 1 and 20 MPa Note the well pronounced effect of increasing confining pressureresulting in a change from brittle to ductile behavior
Figure 2-5 Change from brittle to ductile deformation - Cracks patterns of deformed samples
The visual inspection of deformed specimens after the experiment the deformation style of the specimens demonstrates the change of deformation style from brittle to ductile At lower
FORGE Report Dxxx ndash Ver0
16
confining pressures as can be seen from Figure 2-5 a complex shear failure signature occurred whereas at 3 gt 5 MPa compressive failure dominates
For evaluating the strength behavior all test results (standard TC-tests) are graphical depicted inFigure 2-6 Despite the scattering of the strength values it can be easily seen that the general trend of increasing strength with increasing minimal stress is nicely represented by a linear strength boundary according to the MOHR-COULOMB-criterion with the respective values of
ndash friction angle () 22c ndash cohesion (MPa) 28
It has to be mentioned that the friction angle of 22 corresponds fairly well to the results of the shear tests on interfaces between bentonite bricks but without cohesion (see chapter 223)
Figure 2-6 MOHR-COULOMB-diagram of bentonite bricks
Extrapolation of the obtained straight line to a confining pressure zero delivers a value of ca 9 MPa Based on a larger number of samples the average strength of the bentonite bricks was determined in the order of 55 to 65 MPa (SITZ et al 2001) This indicates some non-linearity to unconfined conditions demonstrating the need of triaxial tests for evaluation of the strength behavior of bentonite bricks
222 Gas permeabilityAs a prerequisite for evaluation of the later saturation tests the gas permeability of the bentonite bricks was determined using different sample arrangements As depicted in Figure 2-7 two different sample arrangements were used to realize axial gas-injection tests both on the intact matrix and also on an artificial interface between two bentonite bricks
Both samples were stepwise hydrostatically loaded (up and down cycle) with continuous gas injection which facilitates permeability determination by measuring the gas flow Exemplarily
FORGE Report Dxxx ndash Ver0
17
Figure 2-8 shows the time dependent change of gas permeability through the intact bentonite brick matrix according the different loading and un-loading steps Starting from an initial gas-permeability of ca 2 ∙ 10-16 m2 the permeability decreases with increasing the applied confining stress Increase of the confining pressure up to 3 = 9 MPa results in a decrease of permeability for more than one order of magnitude At constant confining pressure permeability decreases with time indicating visco-elastic matrix-compaction The time- and stress-dependent compaction effect is at least partial reversible if the confinement is reduced ie irreversible compaction becomes visible But close inspection of pressure-dependent change of permeability as depicted in Figure 2-9 indicates that during the unloading cycle phyd lt 2 MPa the permeability increases significant which may indicate inelastic crack opening during stress release
Figure 2-7 Sample arrangement for permeability testing a) matrix-permeability b) interface permeability
Figure 2-8 Permeability testing at hydrostatic loading Time-dependent course of the experiment with the different loading steps (up and down cycle) with the resulting compactionand gas permeability
Figure 2-9 compares the results measured on the two different sample arrangements ie (left) intact matrix and (right) matrix with an artificial interface (saw cut) It becomes obvious that the
FORGE Report Dxxx ndash Ver0
18
ldquointegralrdquo permeability of the bentonite aggregate with an artificial interface is initially four orders of magnitude higher than the intact matrix ie ko-interface asymp 10-12 m2 Increase of confining pressure up to 10 MPa lowers the permeability for more than 2 orders whereas unloading of the sample results in a significant hysteresis This is clearly indicates crack sealing
Figure 2-9 Permeability testing at hydrostatic loading Gas permeability and volumetric strain vs confining pressure a) Bentonite brick matrix permeability b) Bentonite brick with artificial interface (saw cut)
223 Shear strength (initial state)
The shear testing program consists of the following sample configurations and test number(1) Bentonite brick bentonite brick
a Dry (delivery state) 2 multi-step shear testsb Wetted surface (only just before the test) 1 multi-step shear testsc Healed interface between bentonite bricks
after pre-saturation over one year 2 single-step shear tests(2) Bentonite brick rough granite surface (dry) 4 single-step shear tests
1 multi-step shear tests
Principally the test realization comprises two phases ie pre-consolidation followed by the original shear phase which can be divided in several steps at various normal stresses The test results are typically represented by a peak strength and a residual strength value after loss of cohesion between the shear interfaces
FORGE Report Dxxx ndash Ver0
19
Figure 2-10 Documentation of the interfaces of various test constellations a) View inside the open shear gap after the tests b) Scheme of the brickgranite arrangement
2231 SHEAR TESTS ON DRY BENTONITE BRICK INTERFACES
First of all the shear strength of the dry interfaces between two bentonite bricks was determined in two multiple-step shear tests each with 4 steps at normal stresses n = 05 10 2 and 4 MPa6 During the tests the lower shear box was controlled displaced forward (resp backwards) with a shear rate of 0002 mms
Figure 2-11 Multi-step shear test Bent-SV-MS1 (forward cycle) of the dry contact between two bentonite bricks The test was realized with σn = 05 1 2 4 and 6 MPa
6 To avoid brick failure the maximum normal load was set generally smaller than the average uniaxial strength
FORGE Report Dxxx ndash Ver0
20
The results of a selected shear test (Bent-SV-MS1) are shown as a variation of shear stress and dilatancy vs shear displacement (increasing load cycle) in Figure 2-11 Pre-loading of the sample to the respective normal stress results in some small compaction which developsfurther during the following shear cycles During the various shear steps contrary to experiences from tests on compact material or natural interfaces no stress peak occurs but a more or less constant shear strength level is apparent At higher normal stress states the shear stresses increase as well Concomitantly with the increase of normal stress the variation of dilatancy (always decrease) documents progressive compaction of the bentonite brick aggregate (eg the total compaction ndash during the whole test at n = 1 MPa - is ca 1mm)
The strength and dilatancy behavior does not depend on the course of loading ie if the vertical load steps are varied as upwards or downwards cycle
2232 SHEAR TESTS ON BENTONITE BRICK GRANITE INTERFACES
As a reference material for shear tests on interfaces between bentonite and granite we selected an artificial fractured cuboid of granite (20cm x 15cm x 75cm) of unknown origin The roughness of the artificial split surface was measured using a 3D surface and body scanner at the University of Freiberg (Prof KONIETZKY) The maximum scanner resolution is in the order of 2m As can be seen from Figure 2-12 the mean difference between highest and lowest asperity is in the order of 15 cm
Figure 2-12 Characterization of the granite contact surface a) Histogram of the height distribution of the later shear surface b) Sample dimensions c) Scheme of the bentonite brickgranite aggregate prepared for shearing
Overall one multiple-step shear test and four single-shear tests of bentonite brick granite samples were performed The sample arrangement is qualitatively the same as before
FORGE Report Dxxx ndash Ver0
21
Principally the test realization comprises two steps pre-loading to the respective normal stress state followed by the shear phase
Remarkably despite the existing asperities the initial compaction is only in the order of some few millimeters (depending on the stress level) which indicate that the interface ie the gap between the flat bentonite brick and the asperities is only partially closed during loading This results from the high uniaxial strength of the bentonite bricks
Exemplarily the results of the multi-step shear test are shown in Figure 2-13 which was performed with three steps at n = 05 10 and 20 MPa with displacement rates of 0002 mms Qualitatively the results are comparably to the results of the tests reported in the chapter before Surprisingly also no significant shear peak is observed but post inspection of the sheared planes indicates that local sliding of spikes with linear erosion dominates during shearing Although no significant compaction and local shear failure occurred the shearing along the rough surface requires local overcoming of the existing cohesion
Figure 2-13 Multi-step shear test BentGran-SV-MS1 (forward cycle) of the dry contact between bentonite brick granite surface The test was realized with σn = 05 1 and 2 MPa
2233 SUMMARY HYDRO-MECHANICAL PROPERTIES ndash DRY STATE
The results of the various shear tests were compiled in Table 2-2 and graphical depicted in Figure 2-14
Analog to the strength properties of an intact rock the MOHR-COLOUMB criterion can be used to describe the discontinuity plane characteristics of a jointed rock Accordingly the shear resistance on an interface at critical stress conditions (shear failure) can be expressed stress-depended by a linear dependency of cohesion (c) and angle of friction ()
τf = c + σf tan φ
FORGE Report Dxxx ndash Ver0
22
According to the different material groups two linear trends of results are clearly visible Whereas bentonitebentonite interfaces show no cohesion but significant friction obviously due to the sand content demonstrate shear tests for bentonite bricksgranite a small but significant occurrence of cohesion which was already indicated by post-evaluation of sheared interfaces The tips of the existing roughness of the granite surface are pressed into the bentonite material resulting in local erosion channels
The respective MOHR-COULOMB-parameters are as follows
τ = C + σN tanφ MOHR-COULOMBC φ
brick brick 002 210brick granite 019 196
(MPa) ()
In summary despite the small difference between both interface types comparison with Figure 2-6 demonstrate the importance of artificial interfaces between bentonite bricks as potential weakness planes
Figure 2-14 Summary of shear tests on interfaces between bentonite brick bentonite brick respectively bentonite brick granite ndash MOHR-COULOMB-diagram
FORGE Report Dxxx ndash Ver0
23
Table 2-2 Shear test results
shear strain n dilatancy time
(mm) (MPa) (MPa) (mm) (min)
bentonite brick bentonite brick
057 050 023 -040 503
383 050 021 -046 3215
782 100 038 -075 6548
1186 200 073 -120 9932
1575 400 140 -199 13208
1220 075 033 -017 2492
839 150 064 -033 5682
429 300 123 -068 9123
042 600 240 -170 12397
bentonite brick granite surface
987 200 094 -540 9120
457 400 160 -354 23913
982 100 053 -362 9120bentonite brick granite surface (wetted)
985 100 029 456 10403
3 Gas transport properties of partial saturated bentonite
31 PRE-SATURATION OF BENTONITE BRICKS WITH INTERFACESFor pre-saturation of the samples respectively for the later gas injection tests a new oedometer-like pressure cell is constructed allowing in additions gas flow measurements under defined axial sample consolidation respectively swelling conditions due to different injected water amounts
The sample arrangement consists of a stiff tube ndash oedometer ndash with two sample cylinders of pre-compacted bentonite (respectively one rock sample with a natural rough surface) which are separated by an axial interface inside Two movable pistons equipped with sinter metal plates allow control of volume changes of the sample ie compaction due to a defined axial load or expansion induced by swelling due to water injection Resulting changes in volume or axial force are measured with dial gauges or an axial oriented load cell
As can be seen from Figure 3-1 the cell design facilitates measurements of fluid transport properties through the buffer respectively along the interface between block contacts ie bufferbuffer and bufferblock at defined interface conditions The cell diameter is 90 mm and the overall sample height is ca 120 mm (consisting of two cylindrical specimens ndash 60 mm height) Sinter metal plates ensure access to the axial ends of the sample
FORGE Report Dxxx ndash Ver0
24
The special design of the cell allows fluid injection (1) along the axial direction ie for pre-saturation of the bentonite to induce swelling or measurement of the matrix permeability and (2) through a central hole along the interface ie investigation of contact permeability
pGAs - Inlet
pGas - Outlet
pH2O - Inlet
pH2O - Outlet
FaxLoad cell
Figure 3-1 Principle of the new designed oedometer-cell for gas injection tests on bufferbuffer or bufferrock interfaces at defined bentonite swelling pressures
0 100 200 300
Time (d)0 100 200 300
Time (d)
00
10
20
30
40
50
60
70
80
90
100
0 100 200 300
Time (d)
Axia
l stre
ss (M
Pa)
Inje
cted
wat
er (w
t-
)Vo
lum
etric
sw
ellin
g (
)
I I
ax
water
Vol
ax
water
Volax
water
Vol
Figure 3-2 Pre-saturation of bentonite brick aggregates (left) ax = 2 MPa ndash central injection through a injection hole with radial fluid flow (middle) ax = 4 MPa ndash central injection through a injection hole with radial fluid flow (right) ax = zero ndash axial water injection with free swelling
FORGE Report Dxxx ndash Ver0
25
311 Lab test resultsThree long-term injection tests (pi = 04 MPa) were started in Spring 2010 whereby three different situations were realized
(1) central water injection through an injection hole through a central tube resulting (as proposed) in radial fluid flow along the brick interface
a ax = 4 MPa
b ax = 2 MPa
(2) axial water injection (without axial load) through the end plates (sintered metal) resulting in free axial swelling
The various curves of water consumption and the resulting swelling are summarized in Figure 3-2 The results can be summarized as follows
(1) The water consumption during swelling depends
a obviously not on the injection geometry
b and only weakly on the axial load
No preferred flow along the interface ie matrix swelling
(2) More than 1 year water injection was not sufficient to reach full saturation ie no water out flow but in the center full saturation is assumed Therefore after one year water injection the tests 1a and 1b were finished to facilitate gas injection tests
312 Comparison to the mock-up test SondershausenDespite the different scales of lab and field tests and the limited number of tests the results correspond very well to existing experiences made from in situ tests where sealing elements are constructed of different blocks or bricks Figure 3-3 illustrates the observations made during testing the sealing element of the mock up test Sondershausen (see short description in chapter 12) The sealing element consists of masonry of bentonite bricks (FS 50) which was tested with NaCl-fluid at a maximum fluid pressure of pfl asymp 8 MPa (pswellasymp 1 MPa) (for details see SITZ 2001)
The following conclusions were drawn from the in situ test (evaluation of the humidity distribution after rebuilding the plug)
1Proof of clear saturation front during fluid pressurization
2Homogenous humidity distribution inside the partially saturated buffer
Low effect of artificial interfaces inside the buffer
3Clear pathways in the contact zone buffer host rock (salt)
Interfaces to the host rock are obviously the most relevant pathways
These observations correspond to the results of the laboratory tests therefore demonstrating that interfaces inside the sealing plug are of minor importance because due to the overall swelling effect they will be efficiently sealed
FORGE Report Dxxx ndash Ver0
26
Figure 3-3 Summary of the mock-up test Sondershausen Upper sketch the test design The picture below shows the humidity distribution inside the buffer (vertical profile along the dam axis)
32 GAS INJECTION TESTS ndash DETERMINATION OF GAS BREAKTHROUGHFor the gas-injection tests we used a constant volume radial flow geometry realized in the experimental setup depicted in Figure 3-4
Gas flow measurements under constant volume conditions
A servo-controlled load frame (up to 250kN load capacity) ensures defined loading respectively volume conditions The axial strain (measured between the load plates) is kept constant during the test (resolution 1 m) ie if the sample volume increases due to gas-injection the axial force is automatically increased During the test the change of the axial stress is measured via a load cell
Gas injection at constant injection pressure on the at least partial saturated bentonite sample with a radial flow geometry
After finishing the saturation instead of water gas was injected through the central pipeof the swelling cell which should result in radial flow if preferred flow along the former interface occurs During the test the samples is drained in the axial direction ie through the axial filter plates
During stepwise increase of the primary gas pressure the inflow of gas is measured with a flow-meter ie during each pressure step firstly the dead volume before the gas access to the sample is pressurized which results in an inflow-peak If gas pressureequilibrium before and after the flow-meter is reached and the sample behaves nearly gastight the apparent flow rate becomes zero Gas break through ie overcome of the
FORGE Report Dxxx ndash Ver0
27
capillary entry pressure is indicated by quasi-constant gas-in-flow or gas-outflow (ie bubbles in a burette)
Two gas breakthrough tests were performed at initial axial pressures of 2 respectively 4 MPa The results are summarized in Figure 3-5 respectively Figure 3-6
Figure 3-4 Experimental setup for gas-breakthrough measurements under constant sample volume
Figure 3-5 Gas breakthrough test ndash axial stress and gas pressure respectively resulting gas flow vs time Ax ndashinit asymp 2 MPa
FORGE Report Dxxx ndash Ver0
28
After finishing the pre-saturation of the bentonite the samples were axially unloaded and the cells were put into the servo-hydraulic load frame Before the tests a waiting period of ca 1 day (at the nominal axial stress) was usually applied to ensure equilibrium inside the sampleExemplarily Figure 3-5 shows the stability of the axially applied strain control which is in the order of 1 m However this results in a variation of the axial stress of 02 MPa
Then the gas pressure was stepwise increased each with a waiting period of ca 05 hour The change of the gas pressure is always followed by peak of gas-inflow as explained before but becomes zero If a gas pressure state some few bars below the axial stress is reached the gas pressure was kept constant over a period of 12 to 15 hours to exclude time effects of a gas breakthrough ie delay to slow water expulsion Despite some scattering no significant gas in- or outflow was observed
In the next phase the stepwise pressurization was continued If the gas-pressure reaches the acting axial stress ie Ax ndashinit = min some local gas flow becomes apparent but with some instability Further pressure increase did not change the gas flow significant until the breakthrough occurred
1st test Ax ndashinit = min asymp 2 MPa 27 ndash 29 MPa ie 07 ndash 09 MPa higher than min
2nd test Ax ndashinit = min asymp 4 MPa 75 MPa ie 35 MPa higher than min
The tests clearly demonstrate that the gas-entry pressures are significantly higher than min In addition no effect of the interface ie preferred radial gas flow is visible In a first approach the bentonite brick aggregate seems to behave like a homogenous buffer material For further discussion see the next chapter
Figure 3-6 Gas breakthrough test- axial stress and gas pressure respectively resulting gas flow vs time Ax ndashinit asymp 4 MPa The inset shows the central filter plate ( = 9mm) which was installed to ensure no blockage of the fluid inflow to low-permeable bentonite matrix
FORGE Report Dxxx ndash Ver0
29
33 SHEAR STRENGTH (HEALED SPECIMENS)The gas injection tests results delivered very high gas entry pressures which succeeded the minimal stress which has been axially applied by about several MPa (depending on the order of stress) A possible explanation could be that due to the central gas injection locally a high water pressure is generated The local pore fluid pressure may be temporarily preserved during the fast pressurization with gas due to the low permeability of the matrix although the system is drained by the axial filter plates However it becomes obvious that the effect of the former interface as a potential pathway does not exist anymore This may indicate that the interface is healed during the time-dependent swelling process
Healing means the development of cohesion ie which results in bentonite from electrostatic forces among fine particles (clay minerals) and water Shear tests represent a simple way to quantify the amount of cohesion as already demonstrated before Here we used the bentonite brick aggregates after dismantling the sample Visual inspection of the former interface give no hints for a mechanical or hydraulical weakness plane ie only the color contrast indicates the former contact plane
Figure 3-7 Bentonite brickbrick aggregate ndash dismantled sample after controlled saturation by injecting water directly on the interface (compare injection filter plate in Figure 3-6) Note the sharp color contrast at the former interface (total height of the sample 12 cm)
To demonstrate that real healing took place we performed with both specimens direct shear tests on the former interface between both bentonite brick halves The procedure is the same as described in 213
FORGE Report Dxxx ndash Ver0
30
Figure 3-8 Single-step shear test on the healed contact between bentonite brick brick surface The test was realized with σn = 05 MPa
Figure 3-9 Summary of both shear tests on ldquohealedrdquo interfaces between bentonite brick bentonite brick in comparison to the former results summarized in Figure 2-14 ndash MOHR-COULOMB-diagram
FORGE Report Dxxx ndash Ver0
31
The results differ significantly from the shear tests performed on the dry or only short wetted contact planes The following results are obtained from Figure 3-8
bull Shear test curves
Exemplarily the results of the shear test performed at n = 05 MPa are shown As usual for intact material shear stress grows with progressive shear displacement in elastic manner up to a peak and then drops down to a residual value Peak and residual values are higher with applied normal stress Repeating the experiment with the 2nd sample at n = 15 MPa (not shown here) results in a similar shape of the strength curve but the increase of strength is not so significant indicating that the influence of the acting normal stress is low ie the friction angle is only small
bull Dilatancy curves
Due to the surface roughness and asperities a bedding plane tends to dilate upon shear although this effect tends to level off after certain amount of prescribed shear displacement and is lower for higher normal stress (not shown here)
For comparison with earlier measurements on dry interfaces shear stress peaks and residual values of shear stress obtained in both single experiments are represented in Figure 3-9 against normal stress leading to open envelopes of the Coulomb type The evaluation of these tests with σn = 05 resp 15 MPa documents a cohesion of 06 MPa in the τ-σn-diagram Remarkably the angle of friction with ca 10 is much lower than that of tests on dry contacts before healing
4 ConclusionsThe performed lab investigations cover a wide field of hydro-mechanical properties of bentonite bricks which represent a favorable option for constructing sealing plugs in different host rock environments
Based on the experimental results the following conclusions can be drawn
At dry conditions gas flow along interfaces is at least 4 orders higher than through the matrix (eg 10-16 m2) Increase of confinement significantly lowers the gas flow (10 MPa more than one order) but the effect is more pronounced for interfaces crack sealing
Saturation of bentonite brick aggregates ie bricks with a common interface is not affected by the interfaces and only weakly by the acting confining pressure
During gas injection (stepwise increasing of the gas pressure) a significant effect is only observed if the minimal stress is passed resulting in some minor (local) gas flow
The gas break through results in stationary inflow but no significant effect on the total stress is measured probably due to the central (spherical) gas injection (no outflow)
The measured gas threshold pressures under constant volume conditions significantly exceed the sum of the swelling pressure and externally-applied porewater pressure ndashdrained conditions (pi gt ax some MPa)
An important observation is that despite the former interface the bentonite block aggregatebehaves during the saturation of the buffer not different than the homogenous matrix This has been confirmed as well by gas injection tests on the former interface as well by shear tests The
FORGE Report Dxxx ndash Ver0
32
demonstration of the development of cohesion after pre-saturation is a favorable finding because this verifies physical healing of the interface In addition cohesion inside the matrix helps to explain why the measured gas entry pressures are higher than the applied minimal stress
However this observation is only based on two tests which need to be confirmed by the forthcoming experiments Also for understanding the physical background of high entry pressures of gas into the water-saturated bentonite matrix more experimental investigations are of urgent need
5 ReferencesBARTON C A ZOBACK M D amp MOOS D 1995 Fluid flow along potentially active faults in crystalline rock
Geology 23 683ndash686
BLUEMEL M 2000 Improved Procedures for Laboratory Rock Testing EUROCK 2000 ISRM Symposium Aachen 573 ndash 578
BLUEMEL M amp POETSCH M 2003 Direct Shear Testing System International Symposium on GeoTechnical Measurements and Modelling Karlsruhe 327 ndash 331
BUZZI O 2004 Hydromecanique du contact entre geomateriaux Experimentation et modelisation Application au stockage de dechets nucleaires These Universite Joseph Fourier Grenoble France
METCALF R WATSON S P REES J H HUMPHREYS PAUL AND KING F 2008 Gas generation and migration from a deep geological repository for radioactive waste A review of NirexNDArsquos work Technical Report NWAT Environment Agency Penrith Cumbria
NORRIS S 2009 Summary of Gas Generation and Migration Current State-of-the-Art (draft - July 2009) FORGE D12-R
PEACH CJ amp SPIERS CJ 1996 Influence of crystal plastic de-formation on dilatancy and permeability development in synthetic salt rock Tectonophysics 256 101-128
POPP T 2009 State of the art report on gas transport through interfaces FORGE D31-R (WP 33) 48 pp
SITZ P 2003 Entwicklung eines Grundkonzeptes fr langzeitstabile Streckenverschlussbauwerke fr UTD im Salinar Bau und Test eines Versuchsverschlussbauwerkes unter realen Bedingungen (BMBF-gefrdertes FE-Vorhaben Nr 02 C 05472) Abschlubericht TU Bergakademie Freiberg Institut fr Bergbau 2003
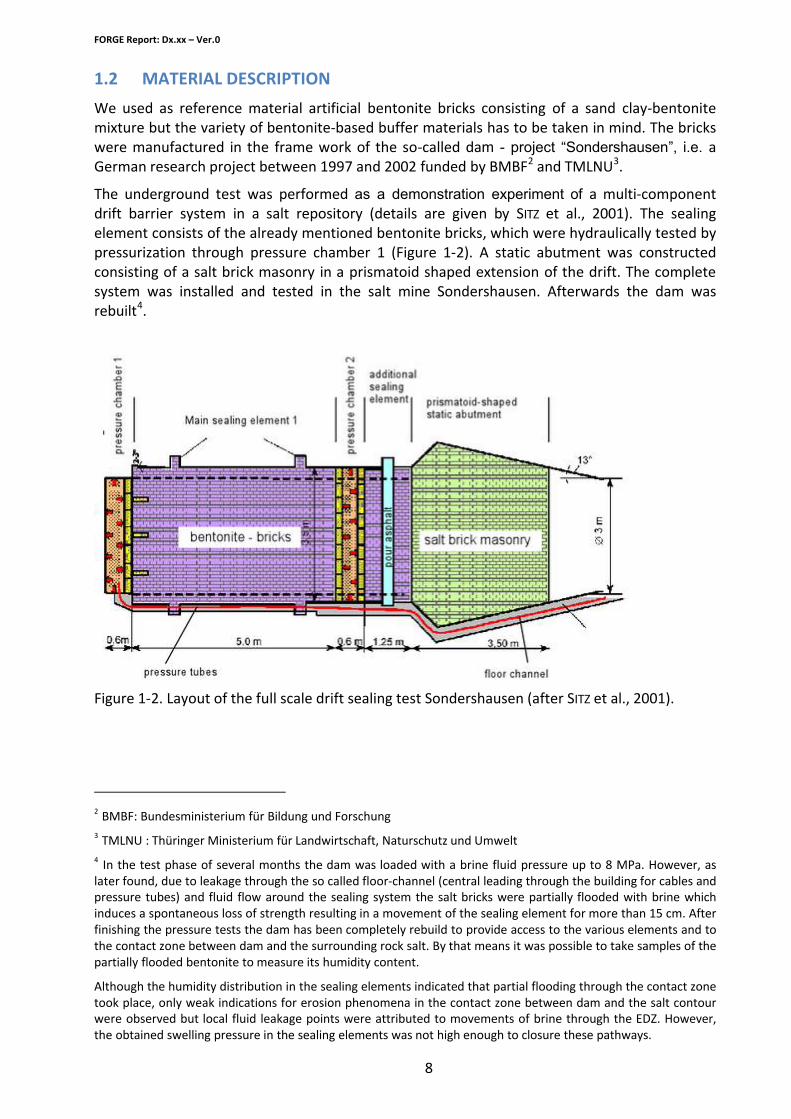
FORGE Report Dxxx ndash Ver0
10
Interface properties ie
o Shear strength between blocks and to the rock contouro Gas permeability ie block aggregates with interfaces
21 METHODOLOGY
211 Strength testingThe strength and permeability measurements were performed in a standard Karman-cell (KRMN 1911) in the servo-hydraulic testing machine (RBA 2500 SCHENKTREBEL Germany ndashusing the MTS-TestStar software) allowing independent control of the radial (2 = 3 = pc) and axial stresses (Ax = 1) The cylindrical samples are sealed with rubber tubes and oil is used as confining medium Outside the vessel three LVDT transducers are mounted between the piston and the load frame near the sample for the measurement of the axial strain The axial load is determined from an external load cell
Figure 2-1 The servohydraulic testing machine RBA 2500 (a) and the scheme of the pressure vessel (b)
Axial deformation experiments (Δh resp the deformation ε1 = Δh h0) in compression or extension mode can be performed at various confining pressures (pc up to 100 MPa) and at temperatures up to 100C within a deformation rate range of 1 = 10-5 ndash 10-7 1s to chosen values of ε1 As a standard technique during the experiments the sample volume changes ΔV are determined by a volume balance of the mantle oil volume changes as measured via the pressure intensifier and the axial piston displacement in the cell
PIPIPP ASAhV (2-1)
FORGE Report Dxxx ndash Ver0
11
with ΔSPI = displacement of the cylinder within the pressure intensifierAPI = cross section of the piston within the pressure intensifierΔh = displacement of the piston of the triaxial cellAPP = cross section of the piston of the triaxial cell
0V V
V (2-2)
In calculation of the stress difference (σ1 ndash σ3) deformation-induced variation of the cross section of the specimen is considered
The leakage-freeness of the oil volume measurement equipment is tested before beginning of each measuring cycle over a waiting period of ca 1 hour However the accuracy of the volume measurement depends on the constancy of the oil temperature within the triaxial cell and within the pressure intensifier
212 Permeability testingAs shown in the schematic drawing of the triaxial pressure cell (depicted in Figure 2-1) permeability can be measured parallel to the sample cylinder axis (dimensions ca 90 mm in diameter and 180 mm long) To maintain access of the gas to the sample either a central hole exists in the plates whereby the specimens additionally will be prepared with small boreholes on their axial ends to minimize end effects during straining or filter plates are used to provide flow over the whole cross section of the sample
Figure 2-2 Flow-meter used for permeability testing
Gas-permeability is measured using nitrogen with an equipment similar to that described by PEACH amp SPIERS (1996) allowing both transient and stationary permeability measurements
Two methods are used to determine the gas flow (q) through the samples To perform the permeability measurement the primary gas pressure p1 is applied Its value depends on the test specimenrsquos permeability and on the measurement range of the gas flow-meter (0 - 10 resp 0 -500 cmmin manufacturer BRONKHORST Model F-230M)
Alternatively using a defined gas volume on the in- (V1) and outlet (V2) and measuring the
pressure increase Δp2 resp t
pp 22
is verified to determine 222 pVV whereby 2Vˆq
FORGE Report Dxxx ndash Ver0
12
At a given injection pressure gas enters into the assumed relatively large pores and displaces the pore water This process is regarded as two-phase flow After reaching a stationary flow through the specimen the amount of gas flow over a defined period of time is recorded (q)
The intrinsic permeability is calculated by the modified DARCYrsquos law for compressive media
)pp(pq
Alk L
22
21
2
(2-3)
with η = dynamical viscosityl = (h ndash t) = effective length of the flow path through the sampleh = height of the sampleA = cross section of the samplepL = pressure at gas flow measurementt = sum of the length of both holes in the samplep1 = injection pressurep2 = outlet pressure
The absence of leakage of the permeability equipment is tested before each measuring cycle using a steal sample over a waiting period of around 1 hour
213 Shear testingGeomechanical discontinuities between various buffer elements and to the host rock are probably the clearest example of existing interfaces acting as mechanical weakness zone or preferred pathways For the mechanical behavior of interfaces the relevant variables are stress traction vector with one normal component and one tangential in a simple 2-dimensional stress field (or two tangential in 3D) and the conjugate strain variables are the corresponding relative displacements (Figure 2-1) However such stress conditions can be only realized in direct shear tests which are therefore of urgent need to reproduce slip between various materials
In the past several companies have developed modern state-of-art testing equipment which allows new types of testing procedures to determine the mechanical parameters of joints and intact rock High-response servo-hydraulic systems with digital control technology strain measurement equipment mounted onto the specimen and programmable control modes enable new types of test procedures to be performed which are tailored to the specific problem eg BLUEMEL (2000) BLUEMEL amp POETSCH (2003) For realization of required shear tests a modern shear test system is available at the IfG (Figure 2-2)
Figure 2-1 Loading geometry in direct shear test
FORGE Report Dxxx ndash Ver0
13
The loading frame consists of a two-axle experimental setup with vertical and horizontal stress initiation a platform for shear test with a two-stage shear box and a servo-hydraulic control unit for two channels (vertical and horizontal) Both can be managed force or displacement controlled The test arrangement is shown in Figure 2-2 The frontal part (right) is an extremely stiff four-columned housing for fixing and vertical loading of the two-stage shear box by the upper hydraulic cylinder (up to 500 kN axial load)
Figure 2-2 The MTS ndash shear test system (model 816) available at the IfG (left) Schematic sketch of the MTS ndash test system (right)
Figure 2-3 Two-stage shear box for shear tests (Left) Schematic sketch with orientation of the specimen and the 25 mm opening between the two single boxes (Right) Prepared boxes with installed specimen The front panel with handle is for defined fixing of the shear boxes and will be removed before test start
A robust desk with a horizontal cylinder (-250 kN pressure - 160kN tension) is laterally positioned in a horizontal housing This cylinder supplies the lateral shear force The upper shear box is fixed by a horizontal housing that enables yet a twisting of approx 2 around the horizontal axes referring to the shear midpoint While a vertical load acts to the whole shear box the lower box can be horizontally displaced under weight The box is lead with less friction by mechanically high quality linear guides
The displacement of the boxes to each other under load is measured and recorded by 4 displacement transducers on the edges of the box (for vertical displacement) and by 2 additional position encoders (for horizontal displacement) Thereby a possible twisting is measured as well
FORGE Report Dxxx ndash Ver0
14
A sufficiently stiff fixing of the specimens in the shear box is a prerequisite for an exact determination of shear resistance (Figure 2-3) Therefore as the first step for investigation of the shear strength of bentonite bentonite or bentonitegranite interfaces two cut in half bricks (125 cm x 125 cm) were stacked one on the top of the other (respectively one half brick on a rough granite surface) The aggregate was covered with a plastic foil to protect them against wetting by the wet concrete that fixes the samples in the shear boxes So the contact planes between the two bricks are exactly perpendicular to the shear direction in the center of the shear box with 25 cm opening (Figure 2-10)
Samples for the second test row (brickgranite interface) were similarly prepared Instead of two bentonite bricks (or bentonite brick halves) a bentonite brick was arranged on a rough contact plane of a host rock block (ie medium-grained grained granite with an artificial fracture surface) Between both blocks was a loose horizontal contact Further preparations were done like mentioned above
22 RESULTS
221 Strength testingIn order to investigate the effect of deviatoric loading on the hydro-mechnical integrity we performed five compression tests The applied confining pressures varied between 10 and 200 MPa After hydrostatic compaction ndash pre-loading at the respective stress state ndash the samples were deformed in triaxial compression (1 gt 2 = 3) with a constant strain rate of 25 ∙ 10-5 1s
For comparison the obtained stress strain curves and the respective evolution of volumetric strain (ie dilatancy) are compared in Figure 2-4 The resulting peak strength (failure) and minimum dilatancy values (onset of dilatancy) are summarized in Table 2-1
As general starting from hydrostatical conditions the deviatoric stress increases to ensure constant rate deformation Generally the slope of the stress-strain curve of all samples exhibits the characteristic transition from initial quasi-elastic (linear) behavior to a curve with relatively large radius indicating typical strain hardening until failure at strains The stress-strain curves depicted in Figure 2-4 nicely demonstrate the effect of increasing pressure resulting in higher strength and deformability
Table 2-1 Results from triaxial deformations tests ( = 2 10-5 1s)
sample pc 1 - fail Diff-failure 1-failure (VV) 1 - min w(MPa) () (MPa) (MPa) () () (wt-)
20611 10 157 868 97 -015 032 44
20608 25 134 1313 156 -010 031 59
20607 50 343 1432 193 -035 316 54
20612 100 715 2110 311 -146 1068 48
20620 200 1150 3101 510 -413 1886 48
As evident from the experiments the deformation style changes from brittle to quasi ductile behavior with increasing confining pressure as indicated by increasing failure strains and different post failure behavior One can see a change from a sharp stress-strain curve with a significant lower post-failure stage to a more or less broad plateau without a significant failure peak
FORGE Report Dxxx ndash Ver0
15
Most important dilatant deformations occur only in a low peripheral pressure range (3 5 MPa) At higher pressures (3 10 MPa) brittle deformation is suppressed resulting in a significant compaction of several percent The change of deformation behavior is also documented in the evolution of dilatancy Whereas at low confinement dilatancy onsets significantly before the failure at low strain is dilatancy at confining pressures higher than 5 MPa suppressed and compaction dominates during the whole deformation cycle
Figure 2-4 Summary of triaxial test results on bentonite bricks in a confining pressure range between 1 and 20 MPa Note the well pronounced effect of increasing confining pressureresulting in a change from brittle to ductile behavior
Figure 2-5 Change from brittle to ductile deformation - Cracks patterns of deformed samples
The visual inspection of deformed specimens after the experiment the deformation style of the specimens demonstrates the change of deformation style from brittle to ductile At lower
FORGE Report Dxxx ndash Ver0
16
confining pressures as can be seen from Figure 2-5 a complex shear failure signature occurred whereas at 3 gt 5 MPa compressive failure dominates
For evaluating the strength behavior all test results (standard TC-tests) are graphical depicted inFigure 2-6 Despite the scattering of the strength values it can be easily seen that the general trend of increasing strength with increasing minimal stress is nicely represented by a linear strength boundary according to the MOHR-COULOMB-criterion with the respective values of
ndash friction angle () 22c ndash cohesion (MPa) 28
It has to be mentioned that the friction angle of 22 corresponds fairly well to the results of the shear tests on interfaces between bentonite bricks but without cohesion (see chapter 223)
Figure 2-6 MOHR-COULOMB-diagram of bentonite bricks
Extrapolation of the obtained straight line to a confining pressure zero delivers a value of ca 9 MPa Based on a larger number of samples the average strength of the bentonite bricks was determined in the order of 55 to 65 MPa (SITZ et al 2001) This indicates some non-linearity to unconfined conditions demonstrating the need of triaxial tests for evaluation of the strength behavior of bentonite bricks
222 Gas permeabilityAs a prerequisite for evaluation of the later saturation tests the gas permeability of the bentonite bricks was determined using different sample arrangements As depicted in Figure 2-7 two different sample arrangements were used to realize axial gas-injection tests both on the intact matrix and also on an artificial interface between two bentonite bricks
Both samples were stepwise hydrostatically loaded (up and down cycle) with continuous gas injection which facilitates permeability determination by measuring the gas flow Exemplarily
FORGE Report Dxxx ndash Ver0
17
Figure 2-8 shows the time dependent change of gas permeability through the intact bentonite brick matrix according the different loading and un-loading steps Starting from an initial gas-permeability of ca 2 ∙ 10-16 m2 the permeability decreases with increasing the applied confining stress Increase of the confining pressure up to 3 = 9 MPa results in a decrease of permeability for more than one order of magnitude At constant confining pressure permeability decreases with time indicating visco-elastic matrix-compaction The time- and stress-dependent compaction effect is at least partial reversible if the confinement is reduced ie irreversible compaction becomes visible But close inspection of pressure-dependent change of permeability as depicted in Figure 2-9 indicates that during the unloading cycle phyd lt 2 MPa the permeability increases significant which may indicate inelastic crack opening during stress release
Figure 2-7 Sample arrangement for permeability testing a) matrix-permeability b) interface permeability
Figure 2-8 Permeability testing at hydrostatic loading Time-dependent course of the experiment with the different loading steps (up and down cycle) with the resulting compactionand gas permeability
Figure 2-9 compares the results measured on the two different sample arrangements ie (left) intact matrix and (right) matrix with an artificial interface (saw cut) It becomes obvious that the
FORGE Report Dxxx ndash Ver0
18
ldquointegralrdquo permeability of the bentonite aggregate with an artificial interface is initially four orders of magnitude higher than the intact matrix ie ko-interface asymp 10-12 m2 Increase of confining pressure up to 10 MPa lowers the permeability for more than 2 orders whereas unloading of the sample results in a significant hysteresis This is clearly indicates crack sealing
Figure 2-9 Permeability testing at hydrostatic loading Gas permeability and volumetric strain vs confining pressure a) Bentonite brick matrix permeability b) Bentonite brick with artificial interface (saw cut)
223 Shear strength (initial state)
The shear testing program consists of the following sample configurations and test number(1) Bentonite brick bentonite brick
a Dry (delivery state) 2 multi-step shear testsb Wetted surface (only just before the test) 1 multi-step shear testsc Healed interface between bentonite bricks
after pre-saturation over one year 2 single-step shear tests(2) Bentonite brick rough granite surface (dry) 4 single-step shear tests
1 multi-step shear tests
Principally the test realization comprises two phases ie pre-consolidation followed by the original shear phase which can be divided in several steps at various normal stresses The test results are typically represented by a peak strength and a residual strength value after loss of cohesion between the shear interfaces
FORGE Report Dxxx ndash Ver0
19
Figure 2-10 Documentation of the interfaces of various test constellations a) View inside the open shear gap after the tests b) Scheme of the brickgranite arrangement
2231 SHEAR TESTS ON DRY BENTONITE BRICK INTERFACES
First of all the shear strength of the dry interfaces between two bentonite bricks was determined in two multiple-step shear tests each with 4 steps at normal stresses n = 05 10 2 and 4 MPa6 During the tests the lower shear box was controlled displaced forward (resp backwards) with a shear rate of 0002 mms
Figure 2-11 Multi-step shear test Bent-SV-MS1 (forward cycle) of the dry contact between two bentonite bricks The test was realized with σn = 05 1 2 4 and 6 MPa
6 To avoid brick failure the maximum normal load was set generally smaller than the average uniaxial strength
FORGE Report Dxxx ndash Ver0
20
The results of a selected shear test (Bent-SV-MS1) are shown as a variation of shear stress and dilatancy vs shear displacement (increasing load cycle) in Figure 2-11 Pre-loading of the sample to the respective normal stress results in some small compaction which developsfurther during the following shear cycles During the various shear steps contrary to experiences from tests on compact material or natural interfaces no stress peak occurs but a more or less constant shear strength level is apparent At higher normal stress states the shear stresses increase as well Concomitantly with the increase of normal stress the variation of dilatancy (always decrease) documents progressive compaction of the bentonite brick aggregate (eg the total compaction ndash during the whole test at n = 1 MPa - is ca 1mm)
The strength and dilatancy behavior does not depend on the course of loading ie if the vertical load steps are varied as upwards or downwards cycle
2232 SHEAR TESTS ON BENTONITE BRICK GRANITE INTERFACES
As a reference material for shear tests on interfaces between bentonite and granite we selected an artificial fractured cuboid of granite (20cm x 15cm x 75cm) of unknown origin The roughness of the artificial split surface was measured using a 3D surface and body scanner at the University of Freiberg (Prof KONIETZKY) The maximum scanner resolution is in the order of 2m As can be seen from Figure 2-12 the mean difference between highest and lowest asperity is in the order of 15 cm
Figure 2-12 Characterization of the granite contact surface a) Histogram of the height distribution of the later shear surface b) Sample dimensions c) Scheme of the bentonite brickgranite aggregate prepared for shearing
Overall one multiple-step shear test and four single-shear tests of bentonite brick granite samples were performed The sample arrangement is qualitatively the same as before
FORGE Report Dxxx ndash Ver0
21
Principally the test realization comprises two steps pre-loading to the respective normal stress state followed by the shear phase
Remarkably despite the existing asperities the initial compaction is only in the order of some few millimeters (depending on the stress level) which indicate that the interface ie the gap between the flat bentonite brick and the asperities is only partially closed during loading This results from the high uniaxial strength of the bentonite bricks
Exemplarily the results of the multi-step shear test are shown in Figure 2-13 which was performed with three steps at n = 05 10 and 20 MPa with displacement rates of 0002 mms Qualitatively the results are comparably to the results of the tests reported in the chapter before Surprisingly also no significant shear peak is observed but post inspection of the sheared planes indicates that local sliding of spikes with linear erosion dominates during shearing Although no significant compaction and local shear failure occurred the shearing along the rough surface requires local overcoming of the existing cohesion
Figure 2-13 Multi-step shear test BentGran-SV-MS1 (forward cycle) of the dry contact between bentonite brick granite surface The test was realized with σn = 05 1 and 2 MPa
2233 SUMMARY HYDRO-MECHANICAL PROPERTIES ndash DRY STATE
The results of the various shear tests were compiled in Table 2-2 and graphical depicted in Figure 2-14
Analog to the strength properties of an intact rock the MOHR-COLOUMB criterion can be used to describe the discontinuity plane characteristics of a jointed rock Accordingly the shear resistance on an interface at critical stress conditions (shear failure) can be expressed stress-depended by a linear dependency of cohesion (c) and angle of friction ()
τf = c + σf tan φ
FORGE Report Dxxx ndash Ver0
22
According to the different material groups two linear trends of results are clearly visible Whereas bentonitebentonite interfaces show no cohesion but significant friction obviously due to the sand content demonstrate shear tests for bentonite bricksgranite a small but significant occurrence of cohesion which was already indicated by post-evaluation of sheared interfaces The tips of the existing roughness of the granite surface are pressed into the bentonite material resulting in local erosion channels
The respective MOHR-COULOMB-parameters are as follows
τ = C + σN tanφ MOHR-COULOMBC φ
brick brick 002 210brick granite 019 196
(MPa) ()
In summary despite the small difference between both interface types comparison with Figure 2-6 demonstrate the importance of artificial interfaces between bentonite bricks as potential weakness planes
Figure 2-14 Summary of shear tests on interfaces between bentonite brick bentonite brick respectively bentonite brick granite ndash MOHR-COULOMB-diagram
FORGE Report Dxxx ndash Ver0
23
Table 2-2 Shear test results
shear strain n dilatancy time
(mm) (MPa) (MPa) (mm) (min)
bentonite brick bentonite brick
057 050 023 -040 503
383 050 021 -046 3215
782 100 038 -075 6548
1186 200 073 -120 9932
1575 400 140 -199 13208
1220 075 033 -017 2492
839 150 064 -033 5682
429 300 123 -068 9123
042 600 240 -170 12397
bentonite brick granite surface
987 200 094 -540 9120
457 400 160 -354 23913
982 100 053 -362 9120bentonite brick granite surface (wetted)
985 100 029 456 10403
3 Gas transport properties of partial saturated bentonite
31 PRE-SATURATION OF BENTONITE BRICKS WITH INTERFACESFor pre-saturation of the samples respectively for the later gas injection tests a new oedometer-like pressure cell is constructed allowing in additions gas flow measurements under defined axial sample consolidation respectively swelling conditions due to different injected water amounts
The sample arrangement consists of a stiff tube ndash oedometer ndash with two sample cylinders of pre-compacted bentonite (respectively one rock sample with a natural rough surface) which are separated by an axial interface inside Two movable pistons equipped with sinter metal plates allow control of volume changes of the sample ie compaction due to a defined axial load or expansion induced by swelling due to water injection Resulting changes in volume or axial force are measured with dial gauges or an axial oriented load cell
As can be seen from Figure 3-1 the cell design facilitates measurements of fluid transport properties through the buffer respectively along the interface between block contacts ie bufferbuffer and bufferblock at defined interface conditions The cell diameter is 90 mm and the overall sample height is ca 120 mm (consisting of two cylindrical specimens ndash 60 mm height) Sinter metal plates ensure access to the axial ends of the sample
FORGE Report Dxxx ndash Ver0
24
The special design of the cell allows fluid injection (1) along the axial direction ie for pre-saturation of the bentonite to induce swelling or measurement of the matrix permeability and (2) through a central hole along the interface ie investigation of contact permeability
pGAs - Inlet
pGas - Outlet
pH2O - Inlet
pH2O - Outlet
FaxLoad cell
Figure 3-1 Principle of the new designed oedometer-cell for gas injection tests on bufferbuffer or bufferrock interfaces at defined bentonite swelling pressures
0 100 200 300
Time (d)0 100 200 300
Time (d)
00
10
20
30
40
50
60
70
80
90
100
0 100 200 300
Time (d)
Axia
l stre
ss (M
Pa)
Inje
cted
wat
er (w
t-
)Vo
lum
etric
sw
ellin
g (
)
I I
ax
water
Vol
ax
water
Volax
water
Vol
Figure 3-2 Pre-saturation of bentonite brick aggregates (left) ax = 2 MPa ndash central injection through a injection hole with radial fluid flow (middle) ax = 4 MPa ndash central injection through a injection hole with radial fluid flow (right) ax = zero ndash axial water injection with free swelling
FORGE Report Dxxx ndash Ver0
25
311 Lab test resultsThree long-term injection tests (pi = 04 MPa) were started in Spring 2010 whereby three different situations were realized
(1) central water injection through an injection hole through a central tube resulting (as proposed) in radial fluid flow along the brick interface
a ax = 4 MPa
b ax = 2 MPa
(2) axial water injection (without axial load) through the end plates (sintered metal) resulting in free axial swelling
The various curves of water consumption and the resulting swelling are summarized in Figure 3-2 The results can be summarized as follows
(1) The water consumption during swelling depends
a obviously not on the injection geometry
b and only weakly on the axial load
No preferred flow along the interface ie matrix swelling
(2) More than 1 year water injection was not sufficient to reach full saturation ie no water out flow but in the center full saturation is assumed Therefore after one year water injection the tests 1a and 1b were finished to facilitate gas injection tests
312 Comparison to the mock-up test SondershausenDespite the different scales of lab and field tests and the limited number of tests the results correspond very well to existing experiences made from in situ tests where sealing elements are constructed of different blocks or bricks Figure 3-3 illustrates the observations made during testing the sealing element of the mock up test Sondershausen (see short description in chapter 12) The sealing element consists of masonry of bentonite bricks (FS 50) which was tested with NaCl-fluid at a maximum fluid pressure of pfl asymp 8 MPa (pswellasymp 1 MPa) (for details see SITZ 2001)
The following conclusions were drawn from the in situ test (evaluation of the humidity distribution after rebuilding the plug)
1Proof of clear saturation front during fluid pressurization
2Homogenous humidity distribution inside the partially saturated buffer
Low effect of artificial interfaces inside the buffer
3Clear pathways in the contact zone buffer host rock (salt)
Interfaces to the host rock are obviously the most relevant pathways
These observations correspond to the results of the laboratory tests therefore demonstrating that interfaces inside the sealing plug are of minor importance because due to the overall swelling effect they will be efficiently sealed
FORGE Report Dxxx ndash Ver0
26
Figure 3-3 Summary of the mock-up test Sondershausen Upper sketch the test design The picture below shows the humidity distribution inside the buffer (vertical profile along the dam axis)
32 GAS INJECTION TESTS ndash DETERMINATION OF GAS BREAKTHROUGHFor the gas-injection tests we used a constant volume radial flow geometry realized in the experimental setup depicted in Figure 3-4
Gas flow measurements under constant volume conditions
A servo-controlled load frame (up to 250kN load capacity) ensures defined loading respectively volume conditions The axial strain (measured between the load plates) is kept constant during the test (resolution 1 m) ie if the sample volume increases due to gas-injection the axial force is automatically increased During the test the change of the axial stress is measured via a load cell
Gas injection at constant injection pressure on the at least partial saturated bentonite sample with a radial flow geometry
After finishing the saturation instead of water gas was injected through the central pipeof the swelling cell which should result in radial flow if preferred flow along the former interface occurs During the test the samples is drained in the axial direction ie through the axial filter plates
During stepwise increase of the primary gas pressure the inflow of gas is measured with a flow-meter ie during each pressure step firstly the dead volume before the gas access to the sample is pressurized which results in an inflow-peak If gas pressureequilibrium before and after the flow-meter is reached and the sample behaves nearly gastight the apparent flow rate becomes zero Gas break through ie overcome of the
FORGE Report Dxxx ndash Ver0
27
capillary entry pressure is indicated by quasi-constant gas-in-flow or gas-outflow (ie bubbles in a burette)
Two gas breakthrough tests were performed at initial axial pressures of 2 respectively 4 MPa The results are summarized in Figure 3-5 respectively Figure 3-6
Figure 3-4 Experimental setup for gas-breakthrough measurements under constant sample volume
Figure 3-5 Gas breakthrough test ndash axial stress and gas pressure respectively resulting gas flow vs time Ax ndashinit asymp 2 MPa
FORGE Report Dxxx ndash Ver0
28
After finishing the pre-saturation of the bentonite the samples were axially unloaded and the cells were put into the servo-hydraulic load frame Before the tests a waiting period of ca 1 day (at the nominal axial stress) was usually applied to ensure equilibrium inside the sampleExemplarily Figure 3-5 shows the stability of the axially applied strain control which is in the order of 1 m However this results in a variation of the axial stress of 02 MPa
Then the gas pressure was stepwise increased each with a waiting period of ca 05 hour The change of the gas pressure is always followed by peak of gas-inflow as explained before but becomes zero If a gas pressure state some few bars below the axial stress is reached the gas pressure was kept constant over a period of 12 to 15 hours to exclude time effects of a gas breakthrough ie delay to slow water expulsion Despite some scattering no significant gas in- or outflow was observed
In the next phase the stepwise pressurization was continued If the gas-pressure reaches the acting axial stress ie Ax ndashinit = min some local gas flow becomes apparent but with some instability Further pressure increase did not change the gas flow significant until the breakthrough occurred
1st test Ax ndashinit = min asymp 2 MPa 27 ndash 29 MPa ie 07 ndash 09 MPa higher than min
2nd test Ax ndashinit = min asymp 4 MPa 75 MPa ie 35 MPa higher than min
The tests clearly demonstrate that the gas-entry pressures are significantly higher than min In addition no effect of the interface ie preferred radial gas flow is visible In a first approach the bentonite brick aggregate seems to behave like a homogenous buffer material For further discussion see the next chapter
Figure 3-6 Gas breakthrough test- axial stress and gas pressure respectively resulting gas flow vs time Ax ndashinit asymp 4 MPa The inset shows the central filter plate ( = 9mm) which was installed to ensure no blockage of the fluid inflow to low-permeable bentonite matrix
FORGE Report Dxxx ndash Ver0
29
33 SHEAR STRENGTH (HEALED SPECIMENS)The gas injection tests results delivered very high gas entry pressures which succeeded the minimal stress which has been axially applied by about several MPa (depending on the order of stress) A possible explanation could be that due to the central gas injection locally a high water pressure is generated The local pore fluid pressure may be temporarily preserved during the fast pressurization with gas due to the low permeability of the matrix although the system is drained by the axial filter plates However it becomes obvious that the effect of the former interface as a potential pathway does not exist anymore This may indicate that the interface is healed during the time-dependent swelling process
Healing means the development of cohesion ie which results in bentonite from electrostatic forces among fine particles (clay minerals) and water Shear tests represent a simple way to quantify the amount of cohesion as already demonstrated before Here we used the bentonite brick aggregates after dismantling the sample Visual inspection of the former interface give no hints for a mechanical or hydraulical weakness plane ie only the color contrast indicates the former contact plane
Figure 3-7 Bentonite brickbrick aggregate ndash dismantled sample after controlled saturation by injecting water directly on the interface (compare injection filter plate in Figure 3-6) Note the sharp color contrast at the former interface (total height of the sample 12 cm)
To demonstrate that real healing took place we performed with both specimens direct shear tests on the former interface between both bentonite brick halves The procedure is the same as described in 213
FORGE Report Dxxx ndash Ver0
30
Figure 3-8 Single-step shear test on the healed contact between bentonite brick brick surface The test was realized with σn = 05 MPa
Figure 3-9 Summary of both shear tests on ldquohealedrdquo interfaces between bentonite brick bentonite brick in comparison to the former results summarized in Figure 2-14 ndash MOHR-COULOMB-diagram
FORGE Report Dxxx ndash Ver0
31
The results differ significantly from the shear tests performed on the dry or only short wetted contact planes The following results are obtained from Figure 3-8
bull Shear test curves
Exemplarily the results of the shear test performed at n = 05 MPa are shown As usual for intact material shear stress grows with progressive shear displacement in elastic manner up to a peak and then drops down to a residual value Peak and residual values are higher with applied normal stress Repeating the experiment with the 2nd sample at n = 15 MPa (not shown here) results in a similar shape of the strength curve but the increase of strength is not so significant indicating that the influence of the acting normal stress is low ie the friction angle is only small
bull Dilatancy curves
Due to the surface roughness and asperities a bedding plane tends to dilate upon shear although this effect tends to level off after certain amount of prescribed shear displacement and is lower for higher normal stress (not shown here)
For comparison with earlier measurements on dry interfaces shear stress peaks and residual values of shear stress obtained in both single experiments are represented in Figure 3-9 against normal stress leading to open envelopes of the Coulomb type The evaluation of these tests with σn = 05 resp 15 MPa documents a cohesion of 06 MPa in the τ-σn-diagram Remarkably the angle of friction with ca 10 is much lower than that of tests on dry contacts before healing
4 ConclusionsThe performed lab investigations cover a wide field of hydro-mechanical properties of bentonite bricks which represent a favorable option for constructing sealing plugs in different host rock environments
Based on the experimental results the following conclusions can be drawn
At dry conditions gas flow along interfaces is at least 4 orders higher than through the matrix (eg 10-16 m2) Increase of confinement significantly lowers the gas flow (10 MPa more than one order) but the effect is more pronounced for interfaces crack sealing
Saturation of bentonite brick aggregates ie bricks with a common interface is not affected by the interfaces and only weakly by the acting confining pressure
During gas injection (stepwise increasing of the gas pressure) a significant effect is only observed if the minimal stress is passed resulting in some minor (local) gas flow
The gas break through results in stationary inflow but no significant effect on the total stress is measured probably due to the central (spherical) gas injection (no outflow)
The measured gas threshold pressures under constant volume conditions significantly exceed the sum of the swelling pressure and externally-applied porewater pressure ndashdrained conditions (pi gt ax some MPa)
An important observation is that despite the former interface the bentonite block aggregatebehaves during the saturation of the buffer not different than the homogenous matrix This has been confirmed as well by gas injection tests on the former interface as well by shear tests The
FORGE Report Dxxx ndash Ver0
32
demonstration of the development of cohesion after pre-saturation is a favorable finding because this verifies physical healing of the interface In addition cohesion inside the matrix helps to explain why the measured gas entry pressures are higher than the applied minimal stress
However this observation is only based on two tests which need to be confirmed by the forthcoming experiments Also for understanding the physical background of high entry pressures of gas into the water-saturated bentonite matrix more experimental investigations are of urgent need
5 ReferencesBARTON C A ZOBACK M D amp MOOS D 1995 Fluid flow along potentially active faults in crystalline rock
Geology 23 683ndash686
BLUEMEL M 2000 Improved Procedures for Laboratory Rock Testing EUROCK 2000 ISRM Symposium Aachen 573 ndash 578
BLUEMEL M amp POETSCH M 2003 Direct Shear Testing System International Symposium on GeoTechnical Measurements and Modelling Karlsruhe 327 ndash 331
BUZZI O 2004 Hydromecanique du contact entre geomateriaux Experimentation et modelisation Application au stockage de dechets nucleaires These Universite Joseph Fourier Grenoble France
METCALF R WATSON S P REES J H HUMPHREYS PAUL AND KING F 2008 Gas generation and migration from a deep geological repository for radioactive waste A review of NirexNDArsquos work Technical Report NWAT Environment Agency Penrith Cumbria
NORRIS S 2009 Summary of Gas Generation and Migration Current State-of-the-Art (draft - July 2009) FORGE D12-R
PEACH CJ amp SPIERS CJ 1996 Influence of crystal plastic de-formation on dilatancy and permeability development in synthetic salt rock Tectonophysics 256 101-128
POPP T 2009 State of the art report on gas transport through interfaces FORGE D31-R (WP 33) 48 pp
SITZ P 2003 Entwicklung eines Grundkonzeptes fr langzeitstabile Streckenverschlussbauwerke fr UTD im Salinar Bau und Test eines Versuchsverschlussbauwerkes unter realen Bedingungen (BMBF-gefrdertes FE-Vorhaben Nr 02 C 05472) Abschlubericht TU Bergakademie Freiberg Institut fr Bergbau 2003
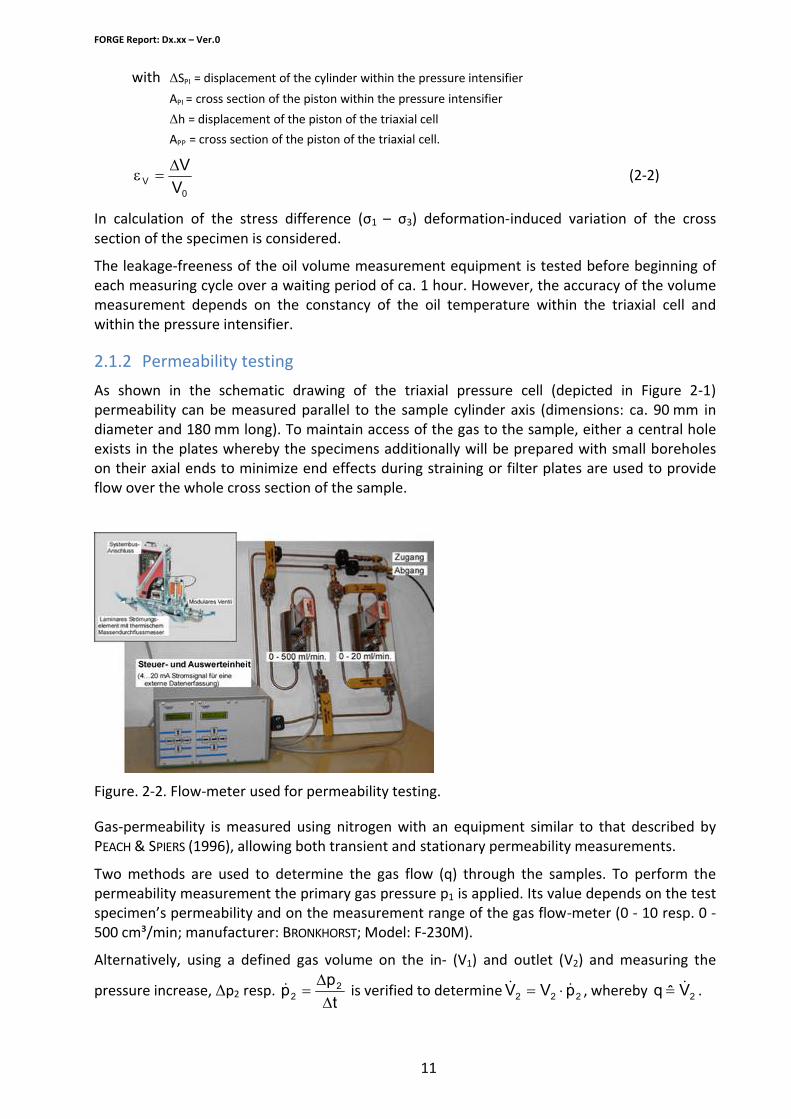
FORGE Report Dxxx ndash Ver0
13
The loading frame consists of a two-axle experimental setup with vertical and horizontal stress initiation a platform for shear test with a two-stage shear box and a servo-hydraulic control unit for two channels (vertical and horizontal) Both can be managed force or displacement controlled The test arrangement is shown in Figure 2-2 The frontal part (right) is an extremely stiff four-columned housing for fixing and vertical loading of the two-stage shear box by the upper hydraulic cylinder (up to 500 kN axial load)
Figure 2-2 The MTS ndash shear test system (model 816) available at the IfG (left) Schematic sketch of the MTS ndash test system (right)
Figure 2-3 Two-stage shear box for shear tests (Left) Schematic sketch with orientation of the specimen and the 25 mm opening between the two single boxes (Right) Prepared boxes with installed specimen The front panel with handle is for defined fixing of the shear boxes and will be removed before test start
A robust desk with a horizontal cylinder (-250 kN pressure - 160kN tension) is laterally positioned in a horizontal housing This cylinder supplies the lateral shear force The upper shear box is fixed by a horizontal housing that enables yet a twisting of approx 2 around the horizontal axes referring to the shear midpoint While a vertical load acts to the whole shear box the lower box can be horizontally displaced under weight The box is lead with less friction by mechanically high quality linear guides
The displacement of the boxes to each other under load is measured and recorded by 4 displacement transducers on the edges of the box (for vertical displacement) and by 2 additional position encoders (for horizontal displacement) Thereby a possible twisting is measured as well
FORGE Report Dxxx ndash Ver0
14
A sufficiently stiff fixing of the specimens in the shear box is a prerequisite for an exact determination of shear resistance (Figure 2-3) Therefore as the first step for investigation of the shear strength of bentonite bentonite or bentonitegranite interfaces two cut in half bricks (125 cm x 125 cm) were stacked one on the top of the other (respectively one half brick on a rough granite surface) The aggregate was covered with a plastic foil to protect them against wetting by the wet concrete that fixes the samples in the shear boxes So the contact planes between the two bricks are exactly perpendicular to the shear direction in the center of the shear box with 25 cm opening (Figure 2-10)
Samples for the second test row (brickgranite interface) were similarly prepared Instead of two bentonite bricks (or bentonite brick halves) a bentonite brick was arranged on a rough contact plane of a host rock block (ie medium-grained grained granite with an artificial fracture surface) Between both blocks was a loose horizontal contact Further preparations were done like mentioned above
22 RESULTS
221 Strength testingIn order to investigate the effect of deviatoric loading on the hydro-mechnical integrity we performed five compression tests The applied confining pressures varied between 10 and 200 MPa After hydrostatic compaction ndash pre-loading at the respective stress state ndash the samples were deformed in triaxial compression (1 gt 2 = 3) with a constant strain rate of 25 ∙ 10-5 1s
For comparison the obtained stress strain curves and the respective evolution of volumetric strain (ie dilatancy) are compared in Figure 2-4 The resulting peak strength (failure) and minimum dilatancy values (onset of dilatancy) are summarized in Table 2-1
As general starting from hydrostatical conditions the deviatoric stress increases to ensure constant rate deformation Generally the slope of the stress-strain curve of all samples exhibits the characteristic transition from initial quasi-elastic (linear) behavior to a curve with relatively large radius indicating typical strain hardening until failure at strains The stress-strain curves depicted in Figure 2-4 nicely demonstrate the effect of increasing pressure resulting in higher strength and deformability
Table 2-1 Results from triaxial deformations tests ( = 2 10-5 1s)
sample pc 1 - fail Diff-failure 1-failure (VV) 1 - min w(MPa) () (MPa) (MPa) () () (wt-)
20611 10 157 868 97 -015 032 44
20608 25 134 1313 156 -010 031 59
20607 50 343 1432 193 -035 316 54
20612 100 715 2110 311 -146 1068 48
20620 200 1150 3101 510 -413 1886 48
As evident from the experiments the deformation style changes from brittle to quasi ductile behavior with increasing confining pressure as indicated by increasing failure strains and different post failure behavior One can see a change from a sharp stress-strain curve with a significant lower post-failure stage to a more or less broad plateau without a significant failure peak
FORGE Report Dxxx ndash Ver0
15
Most important dilatant deformations occur only in a low peripheral pressure range (3 5 MPa) At higher pressures (3 10 MPa) brittle deformation is suppressed resulting in a significant compaction of several percent The change of deformation behavior is also documented in the evolution of dilatancy Whereas at low confinement dilatancy onsets significantly before the failure at low strain is dilatancy at confining pressures higher than 5 MPa suppressed and compaction dominates during the whole deformation cycle
Figure 2-4 Summary of triaxial test results on bentonite bricks in a confining pressure range between 1 and 20 MPa Note the well pronounced effect of increasing confining pressureresulting in a change from brittle to ductile behavior
Figure 2-5 Change from brittle to ductile deformation - Cracks patterns of deformed samples
The visual inspection of deformed specimens after the experiment the deformation style of the specimens demonstrates the change of deformation style from brittle to ductile At lower
FORGE Report Dxxx ndash Ver0
16
confining pressures as can be seen from Figure 2-5 a complex shear failure signature occurred whereas at 3 gt 5 MPa compressive failure dominates
For evaluating the strength behavior all test results (standard TC-tests) are graphical depicted inFigure 2-6 Despite the scattering of the strength values it can be easily seen that the general trend of increasing strength with increasing minimal stress is nicely represented by a linear strength boundary according to the MOHR-COULOMB-criterion with the respective values of
ndash friction angle () 22c ndash cohesion (MPa) 28
It has to be mentioned that the friction angle of 22 corresponds fairly well to the results of the shear tests on interfaces between bentonite bricks but without cohesion (see chapter 223)
Figure 2-6 MOHR-COULOMB-diagram of bentonite bricks
Extrapolation of the obtained straight line to a confining pressure zero delivers a value of ca 9 MPa Based on a larger number of samples the average strength of the bentonite bricks was determined in the order of 55 to 65 MPa (SITZ et al 2001) This indicates some non-linearity to unconfined conditions demonstrating the need of triaxial tests for evaluation of the strength behavior of bentonite bricks
222 Gas permeabilityAs a prerequisite for evaluation of the later saturation tests the gas permeability of the bentonite bricks was determined using different sample arrangements As depicted in Figure 2-7 two different sample arrangements were used to realize axial gas-injection tests both on the intact matrix and also on an artificial interface between two bentonite bricks
Both samples were stepwise hydrostatically loaded (up and down cycle) with continuous gas injection which facilitates permeability determination by measuring the gas flow Exemplarily
FORGE Report Dxxx ndash Ver0
17
Figure 2-8 shows the time dependent change of gas permeability through the intact bentonite brick matrix according the different loading and un-loading steps Starting from an initial gas-permeability of ca 2 ∙ 10-16 m2 the permeability decreases with increasing the applied confining stress Increase of the confining pressure up to 3 = 9 MPa results in a decrease of permeability for more than one order of magnitude At constant confining pressure permeability decreases with time indicating visco-elastic matrix-compaction The time- and stress-dependent compaction effect is at least partial reversible if the confinement is reduced ie irreversible compaction becomes visible But close inspection of pressure-dependent change of permeability as depicted in Figure 2-9 indicates that during the unloading cycle phyd lt 2 MPa the permeability increases significant which may indicate inelastic crack opening during stress release
Figure 2-7 Sample arrangement for permeability testing a) matrix-permeability b) interface permeability
Figure 2-8 Permeability testing at hydrostatic loading Time-dependent course of the experiment with the different loading steps (up and down cycle) with the resulting compactionand gas permeability
Figure 2-9 compares the results measured on the two different sample arrangements ie (left) intact matrix and (right) matrix with an artificial interface (saw cut) It becomes obvious that the
FORGE Report Dxxx ndash Ver0
18
ldquointegralrdquo permeability of the bentonite aggregate with an artificial interface is initially four orders of magnitude higher than the intact matrix ie ko-interface asymp 10-12 m2 Increase of confining pressure up to 10 MPa lowers the permeability for more than 2 orders whereas unloading of the sample results in a significant hysteresis This is clearly indicates crack sealing
Figure 2-9 Permeability testing at hydrostatic loading Gas permeability and volumetric strain vs confining pressure a) Bentonite brick matrix permeability b) Bentonite brick with artificial interface (saw cut)
223 Shear strength (initial state)
The shear testing program consists of the following sample configurations and test number(1) Bentonite brick bentonite brick
a Dry (delivery state) 2 multi-step shear testsb Wetted surface (only just before the test) 1 multi-step shear testsc Healed interface between bentonite bricks
after pre-saturation over one year 2 single-step shear tests(2) Bentonite brick rough granite surface (dry) 4 single-step shear tests
1 multi-step shear tests
Principally the test realization comprises two phases ie pre-consolidation followed by the original shear phase which can be divided in several steps at various normal stresses The test results are typically represented by a peak strength and a residual strength value after loss of cohesion between the shear interfaces
FORGE Report Dxxx ndash Ver0
19
Figure 2-10 Documentation of the interfaces of various test constellations a) View inside the open shear gap after the tests b) Scheme of the brickgranite arrangement
2231 SHEAR TESTS ON DRY BENTONITE BRICK INTERFACES
First of all the shear strength of the dry interfaces between two bentonite bricks was determined in two multiple-step shear tests each with 4 steps at normal stresses n = 05 10 2 and 4 MPa6 During the tests the lower shear box was controlled displaced forward (resp backwards) with a shear rate of 0002 mms
Figure 2-11 Multi-step shear test Bent-SV-MS1 (forward cycle) of the dry contact between two bentonite bricks The test was realized with σn = 05 1 2 4 and 6 MPa
6 To avoid brick failure the maximum normal load was set generally smaller than the average uniaxial strength
FORGE Report Dxxx ndash Ver0
20
The results of a selected shear test (Bent-SV-MS1) are shown as a variation of shear stress and dilatancy vs shear displacement (increasing load cycle) in Figure 2-11 Pre-loading of the sample to the respective normal stress results in some small compaction which developsfurther during the following shear cycles During the various shear steps contrary to experiences from tests on compact material or natural interfaces no stress peak occurs but a more or less constant shear strength level is apparent At higher normal stress states the shear stresses increase as well Concomitantly with the increase of normal stress the variation of dilatancy (always decrease) documents progressive compaction of the bentonite brick aggregate (eg the total compaction ndash during the whole test at n = 1 MPa - is ca 1mm)
The strength and dilatancy behavior does not depend on the course of loading ie if the vertical load steps are varied as upwards or downwards cycle
2232 SHEAR TESTS ON BENTONITE BRICK GRANITE INTERFACES
As a reference material for shear tests on interfaces between bentonite and granite we selected an artificial fractured cuboid of granite (20cm x 15cm x 75cm) of unknown origin The roughness of the artificial split surface was measured using a 3D surface and body scanner at the University of Freiberg (Prof KONIETZKY) The maximum scanner resolution is in the order of 2m As can be seen from Figure 2-12 the mean difference between highest and lowest asperity is in the order of 15 cm
Figure 2-12 Characterization of the granite contact surface a) Histogram of the height distribution of the later shear surface b) Sample dimensions c) Scheme of the bentonite brickgranite aggregate prepared for shearing
Overall one multiple-step shear test and four single-shear tests of bentonite brick granite samples were performed The sample arrangement is qualitatively the same as before
FORGE Report Dxxx ndash Ver0
21
Principally the test realization comprises two steps pre-loading to the respective normal stress state followed by the shear phase
Remarkably despite the existing asperities the initial compaction is only in the order of some few millimeters (depending on the stress level) which indicate that the interface ie the gap between the flat bentonite brick and the asperities is only partially closed during loading This results from the high uniaxial strength of the bentonite bricks
Exemplarily the results of the multi-step shear test are shown in Figure 2-13 which was performed with three steps at n = 05 10 and 20 MPa with displacement rates of 0002 mms Qualitatively the results are comparably to the results of the tests reported in the chapter before Surprisingly also no significant shear peak is observed but post inspection of the sheared planes indicates that local sliding of spikes with linear erosion dominates during shearing Although no significant compaction and local shear failure occurred the shearing along the rough surface requires local overcoming of the existing cohesion
Figure 2-13 Multi-step shear test BentGran-SV-MS1 (forward cycle) of the dry contact between bentonite brick granite surface The test was realized with σn = 05 1 and 2 MPa
2233 SUMMARY HYDRO-MECHANICAL PROPERTIES ndash DRY STATE
The results of the various shear tests were compiled in Table 2-2 and graphical depicted in Figure 2-14
Analog to the strength properties of an intact rock the MOHR-COLOUMB criterion can be used to describe the discontinuity plane characteristics of a jointed rock Accordingly the shear resistance on an interface at critical stress conditions (shear failure) can be expressed stress-depended by a linear dependency of cohesion (c) and angle of friction ()
τf = c + σf tan φ
FORGE Report Dxxx ndash Ver0
22
According to the different material groups two linear trends of results are clearly visible Whereas bentonitebentonite interfaces show no cohesion but significant friction obviously due to the sand content demonstrate shear tests for bentonite bricksgranite a small but significant occurrence of cohesion which was already indicated by post-evaluation of sheared interfaces The tips of the existing roughness of the granite surface are pressed into the bentonite material resulting in local erosion channels
The respective MOHR-COULOMB-parameters are as follows
τ = C + σN tanφ MOHR-COULOMBC φ
brick brick 002 210brick granite 019 196
(MPa) ()
In summary despite the small difference between both interface types comparison with Figure 2-6 demonstrate the importance of artificial interfaces between bentonite bricks as potential weakness planes
Figure 2-14 Summary of shear tests on interfaces between bentonite brick bentonite brick respectively bentonite brick granite ndash MOHR-COULOMB-diagram
FORGE Report Dxxx ndash Ver0
23
Table 2-2 Shear test results
shear strain n dilatancy time
(mm) (MPa) (MPa) (mm) (min)
bentonite brick bentonite brick
057 050 023 -040 503
383 050 021 -046 3215
782 100 038 -075 6548
1186 200 073 -120 9932
1575 400 140 -199 13208
1220 075 033 -017 2492
839 150 064 -033 5682
429 300 123 -068 9123
042 600 240 -170 12397
bentonite brick granite surface
987 200 094 -540 9120
457 400 160 -354 23913
982 100 053 -362 9120bentonite brick granite surface (wetted)
985 100 029 456 10403
3 Gas transport properties of partial saturated bentonite
31 PRE-SATURATION OF BENTONITE BRICKS WITH INTERFACESFor pre-saturation of the samples respectively for the later gas injection tests a new oedometer-like pressure cell is constructed allowing in additions gas flow measurements under defined axial sample consolidation respectively swelling conditions due to different injected water amounts
The sample arrangement consists of a stiff tube ndash oedometer ndash with two sample cylinders of pre-compacted bentonite (respectively one rock sample with a natural rough surface) which are separated by an axial interface inside Two movable pistons equipped with sinter metal plates allow control of volume changes of the sample ie compaction due to a defined axial load or expansion induced by swelling due to water injection Resulting changes in volume or axial force are measured with dial gauges or an axial oriented load cell
As can be seen from Figure 3-1 the cell design facilitates measurements of fluid transport properties through the buffer respectively along the interface between block contacts ie bufferbuffer and bufferblock at defined interface conditions The cell diameter is 90 mm and the overall sample height is ca 120 mm (consisting of two cylindrical specimens ndash 60 mm height) Sinter metal plates ensure access to the axial ends of the sample
FORGE Report Dxxx ndash Ver0
24
The special design of the cell allows fluid injection (1) along the axial direction ie for pre-saturation of the bentonite to induce swelling or measurement of the matrix permeability and (2) through a central hole along the interface ie investigation of contact permeability
pGAs - Inlet
pGas - Outlet
pH2O - Inlet
pH2O - Outlet
FaxLoad cell
Figure 3-1 Principle of the new designed oedometer-cell for gas injection tests on bufferbuffer or bufferrock interfaces at defined bentonite swelling pressures
0 100 200 300
Time (d)0 100 200 300
Time (d)
00
10
20
30
40
50
60
70
80
90
100
0 100 200 300
Time (d)
Axia
l stre
ss (M
Pa)
Inje
cted
wat
er (w
t-
)Vo
lum
etric
sw
ellin
g (
)
I I
ax
water
Vol
ax
water
Volax
water
Vol
Figure 3-2 Pre-saturation of bentonite brick aggregates (left) ax = 2 MPa ndash central injection through a injection hole with radial fluid flow (middle) ax = 4 MPa ndash central injection through a injection hole with radial fluid flow (right) ax = zero ndash axial water injection with free swelling
FORGE Report Dxxx ndash Ver0
25
311 Lab test resultsThree long-term injection tests (pi = 04 MPa) were started in Spring 2010 whereby three different situations were realized
(1) central water injection through an injection hole through a central tube resulting (as proposed) in radial fluid flow along the brick interface
a ax = 4 MPa
b ax = 2 MPa
(2) axial water injection (without axial load) through the end plates (sintered metal) resulting in free axial swelling
The various curves of water consumption and the resulting swelling are summarized in Figure 3-2 The results can be summarized as follows
(1) The water consumption during swelling depends
a obviously not on the injection geometry
b and only weakly on the axial load
No preferred flow along the interface ie matrix swelling
(2) More than 1 year water injection was not sufficient to reach full saturation ie no water out flow but in the center full saturation is assumed Therefore after one year water injection the tests 1a and 1b were finished to facilitate gas injection tests
312 Comparison to the mock-up test SondershausenDespite the different scales of lab and field tests and the limited number of tests the results correspond very well to existing experiences made from in situ tests where sealing elements are constructed of different blocks or bricks Figure 3-3 illustrates the observations made during testing the sealing element of the mock up test Sondershausen (see short description in chapter 12) The sealing element consists of masonry of bentonite bricks (FS 50) which was tested with NaCl-fluid at a maximum fluid pressure of pfl asymp 8 MPa (pswellasymp 1 MPa) (for details see SITZ 2001)
The following conclusions were drawn from the in situ test (evaluation of the humidity distribution after rebuilding the plug)
1Proof of clear saturation front during fluid pressurization
2Homogenous humidity distribution inside the partially saturated buffer
Low effect of artificial interfaces inside the buffer
3Clear pathways in the contact zone buffer host rock (salt)
Interfaces to the host rock are obviously the most relevant pathways
These observations correspond to the results of the laboratory tests therefore demonstrating that interfaces inside the sealing plug are of minor importance because due to the overall swelling effect they will be efficiently sealed
FORGE Report Dxxx ndash Ver0
26
Figure 3-3 Summary of the mock-up test Sondershausen Upper sketch the test design The picture below shows the humidity distribution inside the buffer (vertical profile along the dam axis)
32 GAS INJECTION TESTS ndash DETERMINATION OF GAS BREAKTHROUGHFor the gas-injection tests we used a constant volume radial flow geometry realized in the experimental setup depicted in Figure 3-4
Gas flow measurements under constant volume conditions
A servo-controlled load frame (up to 250kN load capacity) ensures defined loading respectively volume conditions The axial strain (measured between the load plates) is kept constant during the test (resolution 1 m) ie if the sample volume increases due to gas-injection the axial force is automatically increased During the test the change of the axial stress is measured via a load cell
Gas injection at constant injection pressure on the at least partial saturated bentonite sample with a radial flow geometry
After finishing the saturation instead of water gas was injected through the central pipeof the swelling cell which should result in radial flow if preferred flow along the former interface occurs During the test the samples is drained in the axial direction ie through the axial filter plates
During stepwise increase of the primary gas pressure the inflow of gas is measured with a flow-meter ie during each pressure step firstly the dead volume before the gas access to the sample is pressurized which results in an inflow-peak If gas pressureequilibrium before and after the flow-meter is reached and the sample behaves nearly gastight the apparent flow rate becomes zero Gas break through ie overcome of the
FORGE Report Dxxx ndash Ver0
27
capillary entry pressure is indicated by quasi-constant gas-in-flow or gas-outflow (ie bubbles in a burette)
Two gas breakthrough tests were performed at initial axial pressures of 2 respectively 4 MPa The results are summarized in Figure 3-5 respectively Figure 3-6
Figure 3-4 Experimental setup for gas-breakthrough measurements under constant sample volume
Figure 3-5 Gas breakthrough test ndash axial stress and gas pressure respectively resulting gas flow vs time Ax ndashinit asymp 2 MPa
FORGE Report Dxxx ndash Ver0
28
After finishing the pre-saturation of the bentonite the samples were axially unloaded and the cells were put into the servo-hydraulic load frame Before the tests a waiting period of ca 1 day (at the nominal axial stress) was usually applied to ensure equilibrium inside the sampleExemplarily Figure 3-5 shows the stability of the axially applied strain control which is in the order of 1 m However this results in a variation of the axial stress of 02 MPa
Then the gas pressure was stepwise increased each with a waiting period of ca 05 hour The change of the gas pressure is always followed by peak of gas-inflow as explained before but becomes zero If a gas pressure state some few bars below the axial stress is reached the gas pressure was kept constant over a period of 12 to 15 hours to exclude time effects of a gas breakthrough ie delay to slow water expulsion Despite some scattering no significant gas in- or outflow was observed
In the next phase the stepwise pressurization was continued If the gas-pressure reaches the acting axial stress ie Ax ndashinit = min some local gas flow becomes apparent but with some instability Further pressure increase did not change the gas flow significant until the breakthrough occurred
1st test Ax ndashinit = min asymp 2 MPa 27 ndash 29 MPa ie 07 ndash 09 MPa higher than min
2nd test Ax ndashinit = min asymp 4 MPa 75 MPa ie 35 MPa higher than min
The tests clearly demonstrate that the gas-entry pressures are significantly higher than min In addition no effect of the interface ie preferred radial gas flow is visible In a first approach the bentonite brick aggregate seems to behave like a homogenous buffer material For further discussion see the next chapter
Figure 3-6 Gas breakthrough test- axial stress and gas pressure respectively resulting gas flow vs time Ax ndashinit asymp 4 MPa The inset shows the central filter plate ( = 9mm) which was installed to ensure no blockage of the fluid inflow to low-permeable bentonite matrix
FORGE Report Dxxx ndash Ver0
29
33 SHEAR STRENGTH (HEALED SPECIMENS)The gas injection tests results delivered very high gas entry pressures which succeeded the minimal stress which has been axially applied by about several MPa (depending on the order of stress) A possible explanation could be that due to the central gas injection locally a high water pressure is generated The local pore fluid pressure may be temporarily preserved during the fast pressurization with gas due to the low permeability of the matrix although the system is drained by the axial filter plates However it becomes obvious that the effect of the former interface as a potential pathway does not exist anymore This may indicate that the interface is healed during the time-dependent swelling process
Healing means the development of cohesion ie which results in bentonite from electrostatic forces among fine particles (clay minerals) and water Shear tests represent a simple way to quantify the amount of cohesion as already demonstrated before Here we used the bentonite brick aggregates after dismantling the sample Visual inspection of the former interface give no hints for a mechanical or hydraulical weakness plane ie only the color contrast indicates the former contact plane
Figure 3-7 Bentonite brickbrick aggregate ndash dismantled sample after controlled saturation by injecting water directly on the interface (compare injection filter plate in Figure 3-6) Note the sharp color contrast at the former interface (total height of the sample 12 cm)
To demonstrate that real healing took place we performed with both specimens direct shear tests on the former interface between both bentonite brick halves The procedure is the same as described in 213
FORGE Report Dxxx ndash Ver0
30
Figure 3-8 Single-step shear test on the healed contact between bentonite brick brick surface The test was realized with σn = 05 MPa
Figure 3-9 Summary of both shear tests on ldquohealedrdquo interfaces between bentonite brick bentonite brick in comparison to the former results summarized in Figure 2-14 ndash MOHR-COULOMB-diagram
FORGE Report Dxxx ndash Ver0
31
The results differ significantly from the shear tests performed on the dry or only short wetted contact planes The following results are obtained from Figure 3-8
bull Shear test curves
Exemplarily the results of the shear test performed at n = 05 MPa are shown As usual for intact material shear stress grows with progressive shear displacement in elastic manner up to a peak and then drops down to a residual value Peak and residual values are higher with applied normal stress Repeating the experiment with the 2nd sample at n = 15 MPa (not shown here) results in a similar shape of the strength curve but the increase of strength is not so significant indicating that the influence of the acting normal stress is low ie the friction angle is only small
bull Dilatancy curves
Due to the surface roughness and asperities a bedding plane tends to dilate upon shear although this effect tends to level off after certain amount of prescribed shear displacement and is lower for higher normal stress (not shown here)
For comparison with earlier measurements on dry interfaces shear stress peaks and residual values of shear stress obtained in both single experiments are represented in Figure 3-9 against normal stress leading to open envelopes of the Coulomb type The evaluation of these tests with σn = 05 resp 15 MPa documents a cohesion of 06 MPa in the τ-σn-diagram Remarkably the angle of friction with ca 10 is much lower than that of tests on dry contacts before healing
4 ConclusionsThe performed lab investigations cover a wide field of hydro-mechanical properties of bentonite bricks which represent a favorable option for constructing sealing plugs in different host rock environments
Based on the experimental results the following conclusions can be drawn
At dry conditions gas flow along interfaces is at least 4 orders higher than through the matrix (eg 10-16 m2) Increase of confinement significantly lowers the gas flow (10 MPa more than one order) but the effect is more pronounced for interfaces crack sealing
Saturation of bentonite brick aggregates ie bricks with a common interface is not affected by the interfaces and only weakly by the acting confining pressure
During gas injection (stepwise increasing of the gas pressure) a significant effect is only observed if the minimal stress is passed resulting in some minor (local) gas flow
The gas break through results in stationary inflow but no significant effect on the total stress is measured probably due to the central (spherical) gas injection (no outflow)
The measured gas threshold pressures under constant volume conditions significantly exceed the sum of the swelling pressure and externally-applied porewater pressure ndashdrained conditions (pi gt ax some MPa)
An important observation is that despite the former interface the bentonite block aggregatebehaves during the saturation of the buffer not different than the homogenous matrix This has been confirmed as well by gas injection tests on the former interface as well by shear tests The
FORGE Report Dxxx ndash Ver0
32
demonstration of the development of cohesion after pre-saturation is a favorable finding because this verifies physical healing of the interface In addition cohesion inside the matrix helps to explain why the measured gas entry pressures are higher than the applied minimal stress
However this observation is only based on two tests which need to be confirmed by the forthcoming experiments Also for understanding the physical background of high entry pressures of gas into the water-saturated bentonite matrix more experimental investigations are of urgent need
5 ReferencesBARTON C A ZOBACK M D amp MOOS D 1995 Fluid flow along potentially active faults in crystalline rock
Geology 23 683ndash686
BLUEMEL M 2000 Improved Procedures for Laboratory Rock Testing EUROCK 2000 ISRM Symposium Aachen 573 ndash 578
BLUEMEL M amp POETSCH M 2003 Direct Shear Testing System International Symposium on GeoTechnical Measurements and Modelling Karlsruhe 327 ndash 331
BUZZI O 2004 Hydromecanique du contact entre geomateriaux Experimentation et modelisation Application au stockage de dechets nucleaires These Universite Joseph Fourier Grenoble France
METCALF R WATSON S P REES J H HUMPHREYS PAUL AND KING F 2008 Gas generation and migration from a deep geological repository for radioactive waste A review of NirexNDArsquos work Technical Report NWAT Environment Agency Penrith Cumbria
NORRIS S 2009 Summary of Gas Generation and Migration Current State-of-the-Art (draft - July 2009) FORGE D12-R
PEACH CJ amp SPIERS CJ 1996 Influence of crystal plastic de-formation on dilatancy and permeability development in synthetic salt rock Tectonophysics 256 101-128
POPP T 2009 State of the art report on gas transport through interfaces FORGE D31-R (WP 33) 48 pp
SITZ P 2003 Entwicklung eines Grundkonzeptes fr langzeitstabile Streckenverschlussbauwerke fr UTD im Salinar Bau und Test eines Versuchsverschlussbauwerkes unter realen Bedingungen (BMBF-gefrdertes FE-Vorhaben Nr 02 C 05472) Abschlubericht TU Bergakademie Freiberg Institut fr Bergbau 2003
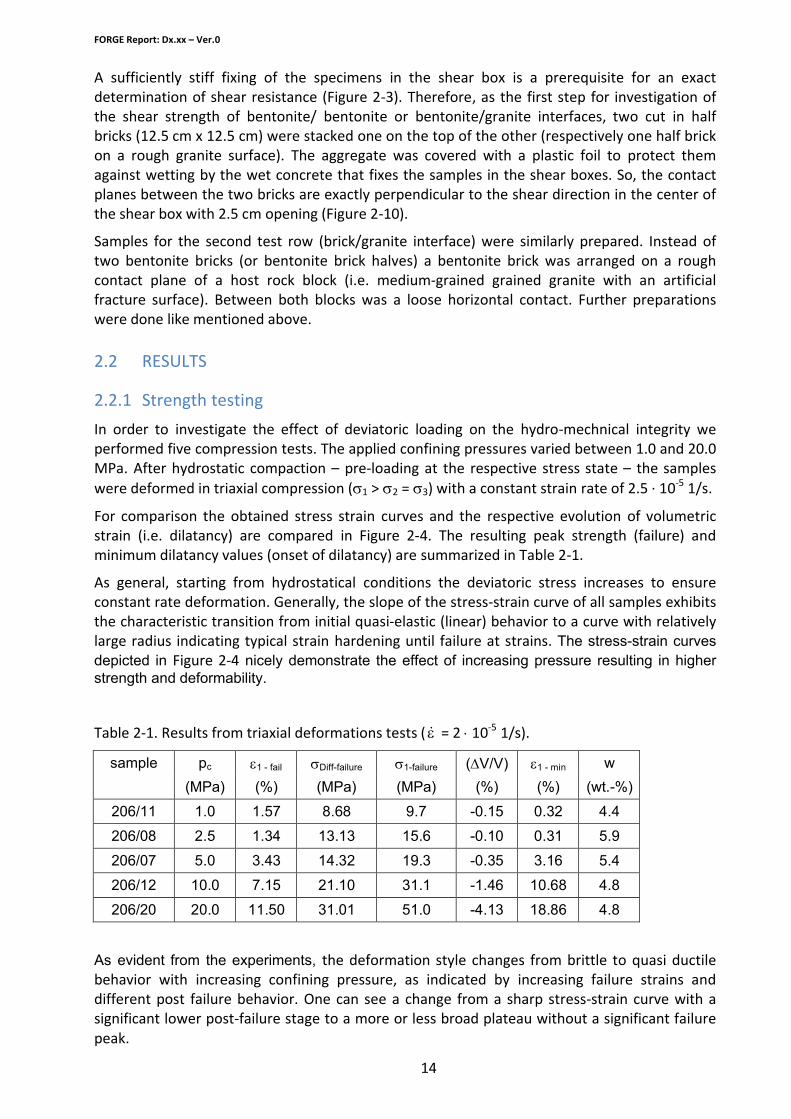
FORGE Report Dxxx ndash Ver0
14
A sufficiently stiff fixing of the specimens in the shear box is a prerequisite for an exact determination of shear resistance (Figure 2-3) Therefore as the first step for investigation of the shear strength of bentonite bentonite or bentonitegranite interfaces two cut in half bricks (125 cm x 125 cm) were stacked one on the top of the other (respectively one half brick on a rough granite surface) The aggregate was covered with a plastic foil to protect them against wetting by the wet concrete that fixes the samples in the shear boxes So the contact planes between the two bricks are exactly perpendicular to the shear direction in the center of the shear box with 25 cm opening (Figure 2-10)
Samples for the second test row (brickgranite interface) were similarly prepared Instead of two bentonite bricks (or bentonite brick halves) a bentonite brick was arranged on a rough contact plane of a host rock block (ie medium-grained grained granite with an artificial fracture surface) Between both blocks was a loose horizontal contact Further preparations were done like mentioned above
22 RESULTS
221 Strength testingIn order to investigate the effect of deviatoric loading on the hydro-mechnical integrity we performed five compression tests The applied confining pressures varied between 10 and 200 MPa After hydrostatic compaction ndash pre-loading at the respective stress state ndash the samples were deformed in triaxial compression (1 gt 2 = 3) with a constant strain rate of 25 ∙ 10-5 1s
For comparison the obtained stress strain curves and the respective evolution of volumetric strain (ie dilatancy) are compared in Figure 2-4 The resulting peak strength (failure) and minimum dilatancy values (onset of dilatancy) are summarized in Table 2-1
As general starting from hydrostatical conditions the deviatoric stress increases to ensure constant rate deformation Generally the slope of the stress-strain curve of all samples exhibits the characteristic transition from initial quasi-elastic (linear) behavior to a curve with relatively large radius indicating typical strain hardening until failure at strains The stress-strain curves depicted in Figure 2-4 nicely demonstrate the effect of increasing pressure resulting in higher strength and deformability
Table 2-1 Results from triaxial deformations tests ( = 2 10-5 1s)
sample pc 1 - fail Diff-failure 1-failure (VV) 1 - min w(MPa) () (MPa) (MPa) () () (wt-)
20611 10 157 868 97 -015 032 44
20608 25 134 1313 156 -010 031 59
20607 50 343 1432 193 -035 316 54
20612 100 715 2110 311 -146 1068 48
20620 200 1150 3101 510 -413 1886 48
As evident from the experiments the deformation style changes from brittle to quasi ductile behavior with increasing confining pressure as indicated by increasing failure strains and different post failure behavior One can see a change from a sharp stress-strain curve with a significant lower post-failure stage to a more or less broad plateau without a significant failure peak
FORGE Report Dxxx ndash Ver0
15
Most important dilatant deformations occur only in a low peripheral pressure range (3 5 MPa) At higher pressures (3 10 MPa) brittle deformation is suppressed resulting in a significant compaction of several percent The change of deformation behavior is also documented in the evolution of dilatancy Whereas at low confinement dilatancy onsets significantly before the failure at low strain is dilatancy at confining pressures higher than 5 MPa suppressed and compaction dominates during the whole deformation cycle
Figure 2-4 Summary of triaxial test results on bentonite bricks in a confining pressure range between 1 and 20 MPa Note the well pronounced effect of increasing confining pressureresulting in a change from brittle to ductile behavior
Figure 2-5 Change from brittle to ductile deformation - Cracks patterns of deformed samples
The visual inspection of deformed specimens after the experiment the deformation style of the specimens demonstrates the change of deformation style from brittle to ductile At lower
FORGE Report Dxxx ndash Ver0
16
confining pressures as can be seen from Figure 2-5 a complex shear failure signature occurred whereas at 3 gt 5 MPa compressive failure dominates
For evaluating the strength behavior all test results (standard TC-tests) are graphical depicted inFigure 2-6 Despite the scattering of the strength values it can be easily seen that the general trend of increasing strength with increasing minimal stress is nicely represented by a linear strength boundary according to the MOHR-COULOMB-criterion with the respective values of
ndash friction angle () 22c ndash cohesion (MPa) 28
It has to be mentioned that the friction angle of 22 corresponds fairly well to the results of the shear tests on interfaces between bentonite bricks but without cohesion (see chapter 223)
Figure 2-6 MOHR-COULOMB-diagram of bentonite bricks
Extrapolation of the obtained straight line to a confining pressure zero delivers a value of ca 9 MPa Based on a larger number of samples the average strength of the bentonite bricks was determined in the order of 55 to 65 MPa (SITZ et al 2001) This indicates some non-linearity to unconfined conditions demonstrating the need of triaxial tests for evaluation of the strength behavior of bentonite bricks
222 Gas permeabilityAs a prerequisite for evaluation of the later saturation tests the gas permeability of the bentonite bricks was determined using different sample arrangements As depicted in Figure 2-7 two different sample arrangements were used to realize axial gas-injection tests both on the intact matrix and also on an artificial interface between two bentonite bricks
Both samples were stepwise hydrostatically loaded (up and down cycle) with continuous gas injection which facilitates permeability determination by measuring the gas flow Exemplarily
FORGE Report Dxxx ndash Ver0
17
Figure 2-8 shows the time dependent change of gas permeability through the intact bentonite brick matrix according the different loading and un-loading steps Starting from an initial gas-permeability of ca 2 ∙ 10-16 m2 the permeability decreases with increasing the applied confining stress Increase of the confining pressure up to 3 = 9 MPa results in a decrease of permeability for more than one order of magnitude At constant confining pressure permeability decreases with time indicating visco-elastic matrix-compaction The time- and stress-dependent compaction effect is at least partial reversible if the confinement is reduced ie irreversible compaction becomes visible But close inspection of pressure-dependent change of permeability as depicted in Figure 2-9 indicates that during the unloading cycle phyd lt 2 MPa the permeability increases significant which may indicate inelastic crack opening during stress release
Figure 2-7 Sample arrangement for permeability testing a) matrix-permeability b) interface permeability
Figure 2-8 Permeability testing at hydrostatic loading Time-dependent course of the experiment with the different loading steps (up and down cycle) with the resulting compactionand gas permeability
Figure 2-9 compares the results measured on the two different sample arrangements ie (left) intact matrix and (right) matrix with an artificial interface (saw cut) It becomes obvious that the
FORGE Report Dxxx ndash Ver0
18
ldquointegralrdquo permeability of the bentonite aggregate with an artificial interface is initially four orders of magnitude higher than the intact matrix ie ko-interface asymp 10-12 m2 Increase of confining pressure up to 10 MPa lowers the permeability for more than 2 orders whereas unloading of the sample results in a significant hysteresis This is clearly indicates crack sealing
Figure 2-9 Permeability testing at hydrostatic loading Gas permeability and volumetric strain vs confining pressure a) Bentonite brick matrix permeability b) Bentonite brick with artificial interface (saw cut)
223 Shear strength (initial state)
The shear testing program consists of the following sample configurations and test number(1) Bentonite brick bentonite brick
a Dry (delivery state) 2 multi-step shear testsb Wetted surface (only just before the test) 1 multi-step shear testsc Healed interface between bentonite bricks
after pre-saturation over one year 2 single-step shear tests(2) Bentonite brick rough granite surface (dry) 4 single-step shear tests
1 multi-step shear tests
Principally the test realization comprises two phases ie pre-consolidation followed by the original shear phase which can be divided in several steps at various normal stresses The test results are typically represented by a peak strength and a residual strength value after loss of cohesion between the shear interfaces
FORGE Report Dxxx ndash Ver0
19
Figure 2-10 Documentation of the interfaces of various test constellations a) View inside the open shear gap after the tests b) Scheme of the brickgranite arrangement
2231 SHEAR TESTS ON DRY BENTONITE BRICK INTERFACES
First of all the shear strength of the dry interfaces between two bentonite bricks was determined in two multiple-step shear tests each with 4 steps at normal stresses n = 05 10 2 and 4 MPa6 During the tests the lower shear box was controlled displaced forward (resp backwards) with a shear rate of 0002 mms
Figure 2-11 Multi-step shear test Bent-SV-MS1 (forward cycle) of the dry contact between two bentonite bricks The test was realized with σn = 05 1 2 4 and 6 MPa
6 To avoid brick failure the maximum normal load was set generally smaller than the average uniaxial strength
FORGE Report Dxxx ndash Ver0
20
The results of a selected shear test (Bent-SV-MS1) are shown as a variation of shear stress and dilatancy vs shear displacement (increasing load cycle) in Figure 2-11 Pre-loading of the sample to the respective normal stress results in some small compaction which developsfurther during the following shear cycles During the various shear steps contrary to experiences from tests on compact material or natural interfaces no stress peak occurs but a more or less constant shear strength level is apparent At higher normal stress states the shear stresses increase as well Concomitantly with the increase of normal stress the variation of dilatancy (always decrease) documents progressive compaction of the bentonite brick aggregate (eg the total compaction ndash during the whole test at n = 1 MPa - is ca 1mm)
The strength and dilatancy behavior does not depend on the course of loading ie if the vertical load steps are varied as upwards or downwards cycle
2232 SHEAR TESTS ON BENTONITE BRICK GRANITE INTERFACES
As a reference material for shear tests on interfaces between bentonite and granite we selected an artificial fractured cuboid of granite (20cm x 15cm x 75cm) of unknown origin The roughness of the artificial split surface was measured using a 3D surface and body scanner at the University of Freiberg (Prof KONIETZKY) The maximum scanner resolution is in the order of 2m As can be seen from Figure 2-12 the mean difference between highest and lowest asperity is in the order of 15 cm
Figure 2-12 Characterization of the granite contact surface a) Histogram of the height distribution of the later shear surface b) Sample dimensions c) Scheme of the bentonite brickgranite aggregate prepared for shearing
Overall one multiple-step shear test and four single-shear tests of bentonite brick granite samples were performed The sample arrangement is qualitatively the same as before
FORGE Report Dxxx ndash Ver0
21
Principally the test realization comprises two steps pre-loading to the respective normal stress state followed by the shear phase
Remarkably despite the existing asperities the initial compaction is only in the order of some few millimeters (depending on the stress level) which indicate that the interface ie the gap between the flat bentonite brick and the asperities is only partially closed during loading This results from the high uniaxial strength of the bentonite bricks
Exemplarily the results of the multi-step shear test are shown in Figure 2-13 which was performed with three steps at n = 05 10 and 20 MPa with displacement rates of 0002 mms Qualitatively the results are comparably to the results of the tests reported in the chapter before Surprisingly also no significant shear peak is observed but post inspection of the sheared planes indicates that local sliding of spikes with linear erosion dominates during shearing Although no significant compaction and local shear failure occurred the shearing along the rough surface requires local overcoming of the existing cohesion
Figure 2-13 Multi-step shear test BentGran-SV-MS1 (forward cycle) of the dry contact between bentonite brick granite surface The test was realized with σn = 05 1 and 2 MPa
2233 SUMMARY HYDRO-MECHANICAL PROPERTIES ndash DRY STATE
The results of the various shear tests were compiled in Table 2-2 and graphical depicted in Figure 2-14
Analog to the strength properties of an intact rock the MOHR-COLOUMB criterion can be used to describe the discontinuity plane characteristics of a jointed rock Accordingly the shear resistance on an interface at critical stress conditions (shear failure) can be expressed stress-depended by a linear dependency of cohesion (c) and angle of friction ()
τf = c + σf tan φ
FORGE Report Dxxx ndash Ver0
22
According to the different material groups two linear trends of results are clearly visible Whereas bentonitebentonite interfaces show no cohesion but significant friction obviously due to the sand content demonstrate shear tests for bentonite bricksgranite a small but significant occurrence of cohesion which was already indicated by post-evaluation of sheared interfaces The tips of the existing roughness of the granite surface are pressed into the bentonite material resulting in local erosion channels
The respective MOHR-COULOMB-parameters are as follows
τ = C + σN tanφ MOHR-COULOMBC φ
brick brick 002 210brick granite 019 196
(MPa) ()
In summary despite the small difference between both interface types comparison with Figure 2-6 demonstrate the importance of artificial interfaces between bentonite bricks as potential weakness planes
Figure 2-14 Summary of shear tests on interfaces between bentonite brick bentonite brick respectively bentonite brick granite ndash MOHR-COULOMB-diagram
FORGE Report Dxxx ndash Ver0
23
Table 2-2 Shear test results
shear strain n dilatancy time
(mm) (MPa) (MPa) (mm) (min)
bentonite brick bentonite brick
057 050 023 -040 503
383 050 021 -046 3215
782 100 038 -075 6548
1186 200 073 -120 9932
1575 400 140 -199 13208
1220 075 033 -017 2492
839 150 064 -033 5682
429 300 123 -068 9123
042 600 240 -170 12397
bentonite brick granite surface
987 200 094 -540 9120
457 400 160 -354 23913
982 100 053 -362 9120bentonite brick granite surface (wetted)
985 100 029 456 10403
3 Gas transport properties of partial saturated bentonite
31 PRE-SATURATION OF BENTONITE BRICKS WITH INTERFACESFor pre-saturation of the samples respectively for the later gas injection tests a new oedometer-like pressure cell is constructed allowing in additions gas flow measurements under defined axial sample consolidation respectively swelling conditions due to different injected water amounts
The sample arrangement consists of a stiff tube ndash oedometer ndash with two sample cylinders of pre-compacted bentonite (respectively one rock sample with a natural rough surface) which are separated by an axial interface inside Two movable pistons equipped with sinter metal plates allow control of volume changes of the sample ie compaction due to a defined axial load or expansion induced by swelling due to water injection Resulting changes in volume or axial force are measured with dial gauges or an axial oriented load cell
As can be seen from Figure 3-1 the cell design facilitates measurements of fluid transport properties through the buffer respectively along the interface between block contacts ie bufferbuffer and bufferblock at defined interface conditions The cell diameter is 90 mm and the overall sample height is ca 120 mm (consisting of two cylindrical specimens ndash 60 mm height) Sinter metal plates ensure access to the axial ends of the sample
FORGE Report Dxxx ndash Ver0
24
The special design of the cell allows fluid injection (1) along the axial direction ie for pre-saturation of the bentonite to induce swelling or measurement of the matrix permeability and (2) through a central hole along the interface ie investigation of contact permeability
pGAs - Inlet
pGas - Outlet
pH2O - Inlet
pH2O - Outlet
FaxLoad cell
Figure 3-1 Principle of the new designed oedometer-cell for gas injection tests on bufferbuffer or bufferrock interfaces at defined bentonite swelling pressures
0 100 200 300
Time (d)0 100 200 300
Time (d)
00
10
20
30
40
50
60
70
80
90
100
0 100 200 300
Time (d)
Axia
l stre
ss (M
Pa)
Inje
cted
wat
er (w
t-
)Vo
lum
etric
sw
ellin
g (
)
I I
ax
water
Vol
ax
water
Volax
water
Vol
Figure 3-2 Pre-saturation of bentonite brick aggregates (left) ax = 2 MPa ndash central injection through a injection hole with radial fluid flow (middle) ax = 4 MPa ndash central injection through a injection hole with radial fluid flow (right) ax = zero ndash axial water injection with free swelling
FORGE Report Dxxx ndash Ver0
25
311 Lab test resultsThree long-term injection tests (pi = 04 MPa) were started in Spring 2010 whereby three different situations were realized
(1) central water injection through an injection hole through a central tube resulting (as proposed) in radial fluid flow along the brick interface
a ax = 4 MPa
b ax = 2 MPa
(2) axial water injection (without axial load) through the end plates (sintered metal) resulting in free axial swelling
The various curves of water consumption and the resulting swelling are summarized in Figure 3-2 The results can be summarized as follows
(1) The water consumption during swelling depends
a obviously not on the injection geometry
b and only weakly on the axial load
No preferred flow along the interface ie matrix swelling
(2) More than 1 year water injection was not sufficient to reach full saturation ie no water out flow but in the center full saturation is assumed Therefore after one year water injection the tests 1a and 1b were finished to facilitate gas injection tests
312 Comparison to the mock-up test SondershausenDespite the different scales of lab and field tests and the limited number of tests the results correspond very well to existing experiences made from in situ tests where sealing elements are constructed of different blocks or bricks Figure 3-3 illustrates the observations made during testing the sealing element of the mock up test Sondershausen (see short description in chapter 12) The sealing element consists of masonry of bentonite bricks (FS 50) which was tested with NaCl-fluid at a maximum fluid pressure of pfl asymp 8 MPa (pswellasymp 1 MPa) (for details see SITZ 2001)
The following conclusions were drawn from the in situ test (evaluation of the humidity distribution after rebuilding the plug)
1Proof of clear saturation front during fluid pressurization
2Homogenous humidity distribution inside the partially saturated buffer
Low effect of artificial interfaces inside the buffer
3Clear pathways in the contact zone buffer host rock (salt)
Interfaces to the host rock are obviously the most relevant pathways
These observations correspond to the results of the laboratory tests therefore demonstrating that interfaces inside the sealing plug are of minor importance because due to the overall swelling effect they will be efficiently sealed
FORGE Report Dxxx ndash Ver0
26
Figure 3-3 Summary of the mock-up test Sondershausen Upper sketch the test design The picture below shows the humidity distribution inside the buffer (vertical profile along the dam axis)
32 GAS INJECTION TESTS ndash DETERMINATION OF GAS BREAKTHROUGHFor the gas-injection tests we used a constant volume radial flow geometry realized in the experimental setup depicted in Figure 3-4
Gas flow measurements under constant volume conditions
A servo-controlled load frame (up to 250kN load capacity) ensures defined loading respectively volume conditions The axial strain (measured between the load plates) is kept constant during the test (resolution 1 m) ie if the sample volume increases due to gas-injection the axial force is automatically increased During the test the change of the axial stress is measured via a load cell
Gas injection at constant injection pressure on the at least partial saturated bentonite sample with a radial flow geometry
After finishing the saturation instead of water gas was injected through the central pipeof the swelling cell which should result in radial flow if preferred flow along the former interface occurs During the test the samples is drained in the axial direction ie through the axial filter plates
During stepwise increase of the primary gas pressure the inflow of gas is measured with a flow-meter ie during each pressure step firstly the dead volume before the gas access to the sample is pressurized which results in an inflow-peak If gas pressureequilibrium before and after the flow-meter is reached and the sample behaves nearly gastight the apparent flow rate becomes zero Gas break through ie overcome of the
FORGE Report Dxxx ndash Ver0
27
capillary entry pressure is indicated by quasi-constant gas-in-flow or gas-outflow (ie bubbles in a burette)
Two gas breakthrough tests were performed at initial axial pressures of 2 respectively 4 MPa The results are summarized in Figure 3-5 respectively Figure 3-6
Figure 3-4 Experimental setup for gas-breakthrough measurements under constant sample volume
Figure 3-5 Gas breakthrough test ndash axial stress and gas pressure respectively resulting gas flow vs time Ax ndashinit asymp 2 MPa
FORGE Report Dxxx ndash Ver0
28
After finishing the pre-saturation of the bentonite the samples were axially unloaded and the cells were put into the servo-hydraulic load frame Before the tests a waiting period of ca 1 day (at the nominal axial stress) was usually applied to ensure equilibrium inside the sampleExemplarily Figure 3-5 shows the stability of the axially applied strain control which is in the order of 1 m However this results in a variation of the axial stress of 02 MPa
Then the gas pressure was stepwise increased each with a waiting period of ca 05 hour The change of the gas pressure is always followed by peak of gas-inflow as explained before but becomes zero If a gas pressure state some few bars below the axial stress is reached the gas pressure was kept constant over a period of 12 to 15 hours to exclude time effects of a gas breakthrough ie delay to slow water expulsion Despite some scattering no significant gas in- or outflow was observed
In the next phase the stepwise pressurization was continued If the gas-pressure reaches the acting axial stress ie Ax ndashinit = min some local gas flow becomes apparent but with some instability Further pressure increase did not change the gas flow significant until the breakthrough occurred
1st test Ax ndashinit = min asymp 2 MPa 27 ndash 29 MPa ie 07 ndash 09 MPa higher than min
2nd test Ax ndashinit = min asymp 4 MPa 75 MPa ie 35 MPa higher than min
The tests clearly demonstrate that the gas-entry pressures are significantly higher than min In addition no effect of the interface ie preferred radial gas flow is visible In a first approach the bentonite brick aggregate seems to behave like a homogenous buffer material For further discussion see the next chapter
Figure 3-6 Gas breakthrough test- axial stress and gas pressure respectively resulting gas flow vs time Ax ndashinit asymp 4 MPa The inset shows the central filter plate ( = 9mm) which was installed to ensure no blockage of the fluid inflow to low-permeable bentonite matrix
FORGE Report Dxxx ndash Ver0
29
33 SHEAR STRENGTH (HEALED SPECIMENS)The gas injection tests results delivered very high gas entry pressures which succeeded the minimal stress which has been axially applied by about several MPa (depending on the order of stress) A possible explanation could be that due to the central gas injection locally a high water pressure is generated The local pore fluid pressure may be temporarily preserved during the fast pressurization with gas due to the low permeability of the matrix although the system is drained by the axial filter plates However it becomes obvious that the effect of the former interface as a potential pathway does not exist anymore This may indicate that the interface is healed during the time-dependent swelling process
Healing means the development of cohesion ie which results in bentonite from electrostatic forces among fine particles (clay minerals) and water Shear tests represent a simple way to quantify the amount of cohesion as already demonstrated before Here we used the bentonite brick aggregates after dismantling the sample Visual inspection of the former interface give no hints for a mechanical or hydraulical weakness plane ie only the color contrast indicates the former contact plane
Figure 3-7 Bentonite brickbrick aggregate ndash dismantled sample after controlled saturation by injecting water directly on the interface (compare injection filter plate in Figure 3-6) Note the sharp color contrast at the former interface (total height of the sample 12 cm)
To demonstrate that real healing took place we performed with both specimens direct shear tests on the former interface between both bentonite brick halves The procedure is the same as described in 213
FORGE Report Dxxx ndash Ver0
30
Figure 3-8 Single-step shear test on the healed contact between bentonite brick brick surface The test was realized with σn = 05 MPa
Figure 3-9 Summary of both shear tests on ldquohealedrdquo interfaces between bentonite brick bentonite brick in comparison to the former results summarized in Figure 2-14 ndash MOHR-COULOMB-diagram
FORGE Report Dxxx ndash Ver0
31
The results differ significantly from the shear tests performed on the dry or only short wetted contact planes The following results are obtained from Figure 3-8
bull Shear test curves
Exemplarily the results of the shear test performed at n = 05 MPa are shown As usual for intact material shear stress grows with progressive shear displacement in elastic manner up to a peak and then drops down to a residual value Peak and residual values are higher with applied normal stress Repeating the experiment with the 2nd sample at n = 15 MPa (not shown here) results in a similar shape of the strength curve but the increase of strength is not so significant indicating that the influence of the acting normal stress is low ie the friction angle is only small
bull Dilatancy curves
Due to the surface roughness and asperities a bedding plane tends to dilate upon shear although this effect tends to level off after certain amount of prescribed shear displacement and is lower for higher normal stress (not shown here)
For comparison with earlier measurements on dry interfaces shear stress peaks and residual values of shear stress obtained in both single experiments are represented in Figure 3-9 against normal stress leading to open envelopes of the Coulomb type The evaluation of these tests with σn = 05 resp 15 MPa documents a cohesion of 06 MPa in the τ-σn-diagram Remarkably the angle of friction with ca 10 is much lower than that of tests on dry contacts before healing
4 ConclusionsThe performed lab investigations cover a wide field of hydro-mechanical properties of bentonite bricks which represent a favorable option for constructing sealing plugs in different host rock environments
Based on the experimental results the following conclusions can be drawn
At dry conditions gas flow along interfaces is at least 4 orders higher than through the matrix (eg 10-16 m2) Increase of confinement significantly lowers the gas flow (10 MPa more than one order) but the effect is more pronounced for interfaces crack sealing
Saturation of bentonite brick aggregates ie bricks with a common interface is not affected by the interfaces and only weakly by the acting confining pressure
During gas injection (stepwise increasing of the gas pressure) a significant effect is only observed if the minimal stress is passed resulting in some minor (local) gas flow
The gas break through results in stationary inflow but no significant effect on the total stress is measured probably due to the central (spherical) gas injection (no outflow)
The measured gas threshold pressures under constant volume conditions significantly exceed the sum of the swelling pressure and externally-applied porewater pressure ndashdrained conditions (pi gt ax some MPa)
An important observation is that despite the former interface the bentonite block aggregatebehaves during the saturation of the buffer not different than the homogenous matrix This has been confirmed as well by gas injection tests on the former interface as well by shear tests The
FORGE Report Dxxx ndash Ver0
32
demonstration of the development of cohesion after pre-saturation is a favorable finding because this verifies physical healing of the interface In addition cohesion inside the matrix helps to explain why the measured gas entry pressures are higher than the applied minimal stress
However this observation is only based on two tests which need to be confirmed by the forthcoming experiments Also for understanding the physical background of high entry pressures of gas into the water-saturated bentonite matrix more experimental investigations are of urgent need
5 ReferencesBARTON C A ZOBACK M D amp MOOS D 1995 Fluid flow along potentially active faults in crystalline rock
Geology 23 683ndash686
BLUEMEL M 2000 Improved Procedures for Laboratory Rock Testing EUROCK 2000 ISRM Symposium Aachen 573 ndash 578
BLUEMEL M amp POETSCH M 2003 Direct Shear Testing System International Symposium on GeoTechnical Measurements and Modelling Karlsruhe 327 ndash 331
BUZZI O 2004 Hydromecanique du contact entre geomateriaux Experimentation et modelisation Application au stockage de dechets nucleaires These Universite Joseph Fourier Grenoble France
METCALF R WATSON S P REES J H HUMPHREYS PAUL AND KING F 2008 Gas generation and migration from a deep geological repository for radioactive waste A review of NirexNDArsquos work Technical Report NWAT Environment Agency Penrith Cumbria
NORRIS S 2009 Summary of Gas Generation and Migration Current State-of-the-Art (draft - July 2009) FORGE D12-R
PEACH CJ amp SPIERS CJ 1996 Influence of crystal plastic de-formation on dilatancy and permeability development in synthetic salt rock Tectonophysics 256 101-128
POPP T 2009 State of the art report on gas transport through interfaces FORGE D31-R (WP 33) 48 pp
SITZ P 2003 Entwicklung eines Grundkonzeptes fr langzeitstabile Streckenverschlussbauwerke fr UTD im Salinar Bau und Test eines Versuchsverschlussbauwerkes unter realen Bedingungen (BMBF-gefrdertes FE-Vorhaben Nr 02 C 05472) Abschlubericht TU Bergakademie Freiberg Institut fr Bergbau 2003
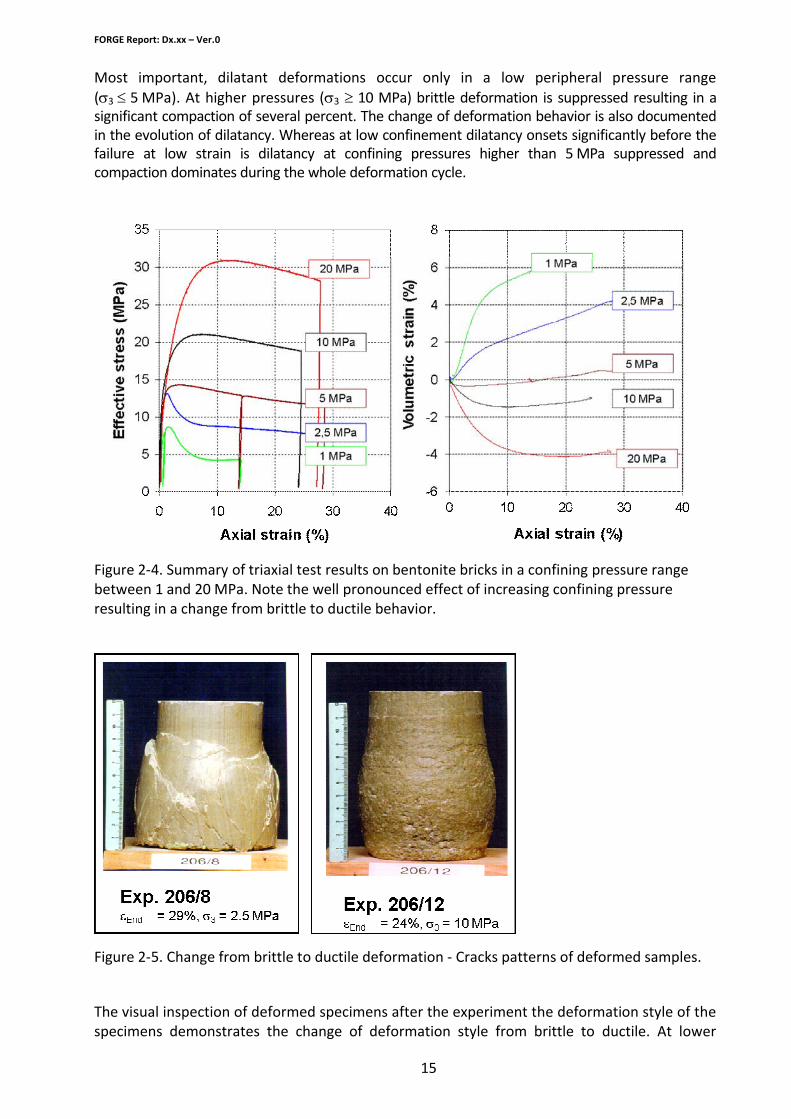
FORGE Report Dxxx ndash Ver0
16
confining pressures as can be seen from Figure 2-5 a complex shear failure signature occurred whereas at 3 gt 5 MPa compressive failure dominates
For evaluating the strength behavior all test results (standard TC-tests) are graphical depicted inFigure 2-6 Despite the scattering of the strength values it can be easily seen that the general trend of increasing strength with increasing minimal stress is nicely represented by a linear strength boundary according to the MOHR-COULOMB-criterion with the respective values of
ndash friction angle () 22c ndash cohesion (MPa) 28
It has to be mentioned that the friction angle of 22 corresponds fairly well to the results of the shear tests on interfaces between bentonite bricks but without cohesion (see chapter 223)
Figure 2-6 MOHR-COULOMB-diagram of bentonite bricks
Extrapolation of the obtained straight line to a confining pressure zero delivers a value of ca 9 MPa Based on a larger number of samples the average strength of the bentonite bricks was determined in the order of 55 to 65 MPa (SITZ et al 2001) This indicates some non-linearity to unconfined conditions demonstrating the need of triaxial tests for evaluation of the strength behavior of bentonite bricks
222 Gas permeabilityAs a prerequisite for evaluation of the later saturation tests the gas permeability of the bentonite bricks was determined using different sample arrangements As depicted in Figure 2-7 two different sample arrangements were used to realize axial gas-injection tests both on the intact matrix and also on an artificial interface between two bentonite bricks
Both samples were stepwise hydrostatically loaded (up and down cycle) with continuous gas injection which facilitates permeability determination by measuring the gas flow Exemplarily
FORGE Report Dxxx ndash Ver0
17
Figure 2-8 shows the time dependent change of gas permeability through the intact bentonite brick matrix according the different loading and un-loading steps Starting from an initial gas-permeability of ca 2 ∙ 10-16 m2 the permeability decreases with increasing the applied confining stress Increase of the confining pressure up to 3 = 9 MPa results in a decrease of permeability for more than one order of magnitude At constant confining pressure permeability decreases with time indicating visco-elastic matrix-compaction The time- and stress-dependent compaction effect is at least partial reversible if the confinement is reduced ie irreversible compaction becomes visible But close inspection of pressure-dependent change of permeability as depicted in Figure 2-9 indicates that during the unloading cycle phyd lt 2 MPa the permeability increases significant which may indicate inelastic crack opening during stress release
Figure 2-7 Sample arrangement for permeability testing a) matrix-permeability b) interface permeability
Figure 2-8 Permeability testing at hydrostatic loading Time-dependent course of the experiment with the different loading steps (up and down cycle) with the resulting compactionand gas permeability
Figure 2-9 compares the results measured on the two different sample arrangements ie (left) intact matrix and (right) matrix with an artificial interface (saw cut) It becomes obvious that the
FORGE Report Dxxx ndash Ver0
18
ldquointegralrdquo permeability of the bentonite aggregate with an artificial interface is initially four orders of magnitude higher than the intact matrix ie ko-interface asymp 10-12 m2 Increase of confining pressure up to 10 MPa lowers the permeability for more than 2 orders whereas unloading of the sample results in a significant hysteresis This is clearly indicates crack sealing
Figure 2-9 Permeability testing at hydrostatic loading Gas permeability and volumetric strain vs confining pressure a) Bentonite brick matrix permeability b) Bentonite brick with artificial interface (saw cut)
223 Shear strength (initial state)
The shear testing program consists of the following sample configurations and test number(1) Bentonite brick bentonite brick
a Dry (delivery state) 2 multi-step shear testsb Wetted surface (only just before the test) 1 multi-step shear testsc Healed interface between bentonite bricks
after pre-saturation over one year 2 single-step shear tests(2) Bentonite brick rough granite surface (dry) 4 single-step shear tests
1 multi-step shear tests
Principally the test realization comprises two phases ie pre-consolidation followed by the original shear phase which can be divided in several steps at various normal stresses The test results are typically represented by a peak strength and a residual strength value after loss of cohesion between the shear interfaces
FORGE Report Dxxx ndash Ver0
19
Figure 2-10 Documentation of the interfaces of various test constellations a) View inside the open shear gap after the tests b) Scheme of the brickgranite arrangement
2231 SHEAR TESTS ON DRY BENTONITE BRICK INTERFACES
First of all the shear strength of the dry interfaces between two bentonite bricks was determined in two multiple-step shear tests each with 4 steps at normal stresses n = 05 10 2 and 4 MPa6 During the tests the lower shear box was controlled displaced forward (resp backwards) with a shear rate of 0002 mms
Figure 2-11 Multi-step shear test Bent-SV-MS1 (forward cycle) of the dry contact between two bentonite bricks The test was realized with σn = 05 1 2 4 and 6 MPa
6 To avoid brick failure the maximum normal load was set generally smaller than the average uniaxial strength
FORGE Report Dxxx ndash Ver0
20
The results of a selected shear test (Bent-SV-MS1) are shown as a variation of shear stress and dilatancy vs shear displacement (increasing load cycle) in Figure 2-11 Pre-loading of the sample to the respective normal stress results in some small compaction which developsfurther during the following shear cycles During the various shear steps contrary to experiences from tests on compact material or natural interfaces no stress peak occurs but a more or less constant shear strength level is apparent At higher normal stress states the shear stresses increase as well Concomitantly with the increase of normal stress the variation of dilatancy (always decrease) documents progressive compaction of the bentonite brick aggregate (eg the total compaction ndash during the whole test at n = 1 MPa - is ca 1mm)
The strength and dilatancy behavior does not depend on the course of loading ie if the vertical load steps are varied as upwards or downwards cycle
2232 SHEAR TESTS ON BENTONITE BRICK GRANITE INTERFACES
As a reference material for shear tests on interfaces between bentonite and granite we selected an artificial fractured cuboid of granite (20cm x 15cm x 75cm) of unknown origin The roughness of the artificial split surface was measured using a 3D surface and body scanner at the University of Freiberg (Prof KONIETZKY) The maximum scanner resolution is in the order of 2m As can be seen from Figure 2-12 the mean difference between highest and lowest asperity is in the order of 15 cm
Figure 2-12 Characterization of the granite contact surface a) Histogram of the height distribution of the later shear surface b) Sample dimensions c) Scheme of the bentonite brickgranite aggregate prepared for shearing
Overall one multiple-step shear test and four single-shear tests of bentonite brick granite samples were performed The sample arrangement is qualitatively the same as before
FORGE Report Dxxx ndash Ver0
21
Principally the test realization comprises two steps pre-loading to the respective normal stress state followed by the shear phase
Remarkably despite the existing asperities the initial compaction is only in the order of some few millimeters (depending on the stress level) which indicate that the interface ie the gap between the flat bentonite brick and the asperities is only partially closed during loading This results from the high uniaxial strength of the bentonite bricks
Exemplarily the results of the multi-step shear test are shown in Figure 2-13 which was performed with three steps at n = 05 10 and 20 MPa with displacement rates of 0002 mms Qualitatively the results are comparably to the results of the tests reported in the chapter before Surprisingly also no significant shear peak is observed but post inspection of the sheared planes indicates that local sliding of spikes with linear erosion dominates during shearing Although no significant compaction and local shear failure occurred the shearing along the rough surface requires local overcoming of the existing cohesion
Figure 2-13 Multi-step shear test BentGran-SV-MS1 (forward cycle) of the dry contact between bentonite brick granite surface The test was realized with σn = 05 1 and 2 MPa
2233 SUMMARY HYDRO-MECHANICAL PROPERTIES ndash DRY STATE
The results of the various shear tests were compiled in Table 2-2 and graphical depicted in Figure 2-14
Analog to the strength properties of an intact rock the MOHR-COLOUMB criterion can be used to describe the discontinuity plane characteristics of a jointed rock Accordingly the shear resistance on an interface at critical stress conditions (shear failure) can be expressed stress-depended by a linear dependency of cohesion (c) and angle of friction ()
τf = c + σf tan φ
FORGE Report Dxxx ndash Ver0
22
According to the different material groups two linear trends of results are clearly visible Whereas bentonitebentonite interfaces show no cohesion but significant friction obviously due to the sand content demonstrate shear tests for bentonite bricksgranite a small but significant occurrence of cohesion which was already indicated by post-evaluation of sheared interfaces The tips of the existing roughness of the granite surface are pressed into the bentonite material resulting in local erosion channels
The respective MOHR-COULOMB-parameters are as follows
τ = C + σN tanφ MOHR-COULOMBC φ
brick brick 002 210brick granite 019 196
(MPa) ()
In summary despite the small difference between both interface types comparison with Figure 2-6 demonstrate the importance of artificial interfaces between bentonite bricks as potential weakness planes
Figure 2-14 Summary of shear tests on interfaces between bentonite brick bentonite brick respectively bentonite brick granite ndash MOHR-COULOMB-diagram
FORGE Report Dxxx ndash Ver0
23
Table 2-2 Shear test results
shear strain n dilatancy time
(mm) (MPa) (MPa) (mm) (min)
bentonite brick bentonite brick
057 050 023 -040 503
383 050 021 -046 3215
782 100 038 -075 6548
1186 200 073 -120 9932
1575 400 140 -199 13208
1220 075 033 -017 2492
839 150 064 -033 5682
429 300 123 -068 9123
042 600 240 -170 12397
bentonite brick granite surface
987 200 094 -540 9120
457 400 160 -354 23913
982 100 053 -362 9120bentonite brick granite surface (wetted)
985 100 029 456 10403
3 Gas transport properties of partial saturated bentonite
31 PRE-SATURATION OF BENTONITE BRICKS WITH INTERFACESFor pre-saturation of the samples respectively for the later gas injection tests a new oedometer-like pressure cell is constructed allowing in additions gas flow measurements under defined axial sample consolidation respectively swelling conditions due to different injected water amounts
The sample arrangement consists of a stiff tube ndash oedometer ndash with two sample cylinders of pre-compacted bentonite (respectively one rock sample with a natural rough surface) which are separated by an axial interface inside Two movable pistons equipped with sinter metal plates allow control of volume changes of the sample ie compaction due to a defined axial load or expansion induced by swelling due to water injection Resulting changes in volume or axial force are measured with dial gauges or an axial oriented load cell
As can be seen from Figure 3-1 the cell design facilitates measurements of fluid transport properties through the buffer respectively along the interface between block contacts ie bufferbuffer and bufferblock at defined interface conditions The cell diameter is 90 mm and the overall sample height is ca 120 mm (consisting of two cylindrical specimens ndash 60 mm height) Sinter metal plates ensure access to the axial ends of the sample
FORGE Report Dxxx ndash Ver0
24
The special design of the cell allows fluid injection (1) along the axial direction ie for pre-saturation of the bentonite to induce swelling or measurement of the matrix permeability and (2) through a central hole along the interface ie investigation of contact permeability
pGAs - Inlet
pGas - Outlet
pH2O - Inlet
pH2O - Outlet
FaxLoad cell
Figure 3-1 Principle of the new designed oedometer-cell for gas injection tests on bufferbuffer or bufferrock interfaces at defined bentonite swelling pressures
0 100 200 300
Time (d)0 100 200 300
Time (d)
00
10
20
30
40
50
60
70
80
90
100
0 100 200 300
Time (d)
Axia
l stre
ss (M
Pa)
Inje
cted
wat
er (w
t-
)Vo
lum
etric
sw
ellin
g (
)
I I
ax
water
Vol
ax
water
Volax
water
Vol
Figure 3-2 Pre-saturation of bentonite brick aggregates (left) ax = 2 MPa ndash central injection through a injection hole with radial fluid flow (middle) ax = 4 MPa ndash central injection through a injection hole with radial fluid flow (right) ax = zero ndash axial water injection with free swelling
FORGE Report Dxxx ndash Ver0
25
311 Lab test resultsThree long-term injection tests (pi = 04 MPa) were started in Spring 2010 whereby three different situations were realized
(1) central water injection through an injection hole through a central tube resulting (as proposed) in radial fluid flow along the brick interface
a ax = 4 MPa
b ax = 2 MPa
(2) axial water injection (without axial load) through the end plates (sintered metal) resulting in free axial swelling
The various curves of water consumption and the resulting swelling are summarized in Figure 3-2 The results can be summarized as follows
(1) The water consumption during swelling depends
a obviously not on the injection geometry
b and only weakly on the axial load
No preferred flow along the interface ie matrix swelling
(2) More than 1 year water injection was not sufficient to reach full saturation ie no water out flow but in the center full saturation is assumed Therefore after one year water injection the tests 1a and 1b were finished to facilitate gas injection tests
312 Comparison to the mock-up test SondershausenDespite the different scales of lab and field tests and the limited number of tests the results correspond very well to existing experiences made from in situ tests where sealing elements are constructed of different blocks or bricks Figure 3-3 illustrates the observations made during testing the sealing element of the mock up test Sondershausen (see short description in chapter 12) The sealing element consists of masonry of bentonite bricks (FS 50) which was tested with NaCl-fluid at a maximum fluid pressure of pfl asymp 8 MPa (pswellasymp 1 MPa) (for details see SITZ 2001)
The following conclusions were drawn from the in situ test (evaluation of the humidity distribution after rebuilding the plug)
1Proof of clear saturation front during fluid pressurization
2Homogenous humidity distribution inside the partially saturated buffer
Low effect of artificial interfaces inside the buffer
3Clear pathways in the contact zone buffer host rock (salt)
Interfaces to the host rock are obviously the most relevant pathways
These observations correspond to the results of the laboratory tests therefore demonstrating that interfaces inside the sealing plug are of minor importance because due to the overall swelling effect they will be efficiently sealed
FORGE Report Dxxx ndash Ver0
26
Figure 3-3 Summary of the mock-up test Sondershausen Upper sketch the test design The picture below shows the humidity distribution inside the buffer (vertical profile along the dam axis)
32 GAS INJECTION TESTS ndash DETERMINATION OF GAS BREAKTHROUGHFor the gas-injection tests we used a constant volume radial flow geometry realized in the experimental setup depicted in Figure 3-4
Gas flow measurements under constant volume conditions
A servo-controlled load frame (up to 250kN load capacity) ensures defined loading respectively volume conditions The axial strain (measured between the load plates) is kept constant during the test (resolution 1 m) ie if the sample volume increases due to gas-injection the axial force is automatically increased During the test the change of the axial stress is measured via a load cell
Gas injection at constant injection pressure on the at least partial saturated bentonite sample with a radial flow geometry
After finishing the saturation instead of water gas was injected through the central pipeof the swelling cell which should result in radial flow if preferred flow along the former interface occurs During the test the samples is drained in the axial direction ie through the axial filter plates
During stepwise increase of the primary gas pressure the inflow of gas is measured with a flow-meter ie during each pressure step firstly the dead volume before the gas access to the sample is pressurized which results in an inflow-peak If gas pressureequilibrium before and after the flow-meter is reached and the sample behaves nearly gastight the apparent flow rate becomes zero Gas break through ie overcome of the
FORGE Report Dxxx ndash Ver0
27
capillary entry pressure is indicated by quasi-constant gas-in-flow or gas-outflow (ie bubbles in a burette)
Two gas breakthrough tests were performed at initial axial pressures of 2 respectively 4 MPa The results are summarized in Figure 3-5 respectively Figure 3-6
Figure 3-4 Experimental setup for gas-breakthrough measurements under constant sample volume
Figure 3-5 Gas breakthrough test ndash axial stress and gas pressure respectively resulting gas flow vs time Ax ndashinit asymp 2 MPa
FORGE Report Dxxx ndash Ver0
28
After finishing the pre-saturation of the bentonite the samples were axially unloaded and the cells were put into the servo-hydraulic load frame Before the tests a waiting period of ca 1 day (at the nominal axial stress) was usually applied to ensure equilibrium inside the sampleExemplarily Figure 3-5 shows the stability of the axially applied strain control which is in the order of 1 m However this results in a variation of the axial stress of 02 MPa
Then the gas pressure was stepwise increased each with a waiting period of ca 05 hour The change of the gas pressure is always followed by peak of gas-inflow as explained before but becomes zero If a gas pressure state some few bars below the axial stress is reached the gas pressure was kept constant over a period of 12 to 15 hours to exclude time effects of a gas breakthrough ie delay to slow water expulsion Despite some scattering no significant gas in- or outflow was observed
In the next phase the stepwise pressurization was continued If the gas-pressure reaches the acting axial stress ie Ax ndashinit = min some local gas flow becomes apparent but with some instability Further pressure increase did not change the gas flow significant until the breakthrough occurred
1st test Ax ndashinit = min asymp 2 MPa 27 ndash 29 MPa ie 07 ndash 09 MPa higher than min
2nd test Ax ndashinit = min asymp 4 MPa 75 MPa ie 35 MPa higher than min
The tests clearly demonstrate that the gas-entry pressures are significantly higher than min In addition no effect of the interface ie preferred radial gas flow is visible In a first approach the bentonite brick aggregate seems to behave like a homogenous buffer material For further discussion see the next chapter
Figure 3-6 Gas breakthrough test- axial stress and gas pressure respectively resulting gas flow vs time Ax ndashinit asymp 4 MPa The inset shows the central filter plate ( = 9mm) which was installed to ensure no blockage of the fluid inflow to low-permeable bentonite matrix
FORGE Report Dxxx ndash Ver0
29
33 SHEAR STRENGTH (HEALED SPECIMENS)The gas injection tests results delivered very high gas entry pressures which succeeded the minimal stress which has been axially applied by about several MPa (depending on the order of stress) A possible explanation could be that due to the central gas injection locally a high water pressure is generated The local pore fluid pressure may be temporarily preserved during the fast pressurization with gas due to the low permeability of the matrix although the system is drained by the axial filter plates However it becomes obvious that the effect of the former interface as a potential pathway does not exist anymore This may indicate that the interface is healed during the time-dependent swelling process
Healing means the development of cohesion ie which results in bentonite from electrostatic forces among fine particles (clay minerals) and water Shear tests represent a simple way to quantify the amount of cohesion as already demonstrated before Here we used the bentonite brick aggregates after dismantling the sample Visual inspection of the former interface give no hints for a mechanical or hydraulical weakness plane ie only the color contrast indicates the former contact plane
Figure 3-7 Bentonite brickbrick aggregate ndash dismantled sample after controlled saturation by injecting water directly on the interface (compare injection filter plate in Figure 3-6) Note the sharp color contrast at the former interface (total height of the sample 12 cm)
To demonstrate that real healing took place we performed with both specimens direct shear tests on the former interface between both bentonite brick halves The procedure is the same as described in 213
FORGE Report Dxxx ndash Ver0
30
Figure 3-8 Single-step shear test on the healed contact between bentonite brick brick surface The test was realized with σn = 05 MPa
Figure 3-9 Summary of both shear tests on ldquohealedrdquo interfaces between bentonite brick bentonite brick in comparison to the former results summarized in Figure 2-14 ndash MOHR-COULOMB-diagram
FORGE Report Dxxx ndash Ver0
31
The results differ significantly from the shear tests performed on the dry or only short wetted contact planes The following results are obtained from Figure 3-8
bull Shear test curves
Exemplarily the results of the shear test performed at n = 05 MPa are shown As usual for intact material shear stress grows with progressive shear displacement in elastic manner up to a peak and then drops down to a residual value Peak and residual values are higher with applied normal stress Repeating the experiment with the 2nd sample at n = 15 MPa (not shown here) results in a similar shape of the strength curve but the increase of strength is not so significant indicating that the influence of the acting normal stress is low ie the friction angle is only small
bull Dilatancy curves
Due to the surface roughness and asperities a bedding plane tends to dilate upon shear although this effect tends to level off after certain amount of prescribed shear displacement and is lower for higher normal stress (not shown here)
For comparison with earlier measurements on dry interfaces shear stress peaks and residual values of shear stress obtained in both single experiments are represented in Figure 3-9 against normal stress leading to open envelopes of the Coulomb type The evaluation of these tests with σn = 05 resp 15 MPa documents a cohesion of 06 MPa in the τ-σn-diagram Remarkably the angle of friction with ca 10 is much lower than that of tests on dry contacts before healing
4 ConclusionsThe performed lab investigations cover a wide field of hydro-mechanical properties of bentonite bricks which represent a favorable option for constructing sealing plugs in different host rock environments
Based on the experimental results the following conclusions can be drawn
At dry conditions gas flow along interfaces is at least 4 orders higher than through the matrix (eg 10-16 m2) Increase of confinement significantly lowers the gas flow (10 MPa more than one order) but the effect is more pronounced for interfaces crack sealing
Saturation of bentonite brick aggregates ie bricks with a common interface is not affected by the interfaces and only weakly by the acting confining pressure
During gas injection (stepwise increasing of the gas pressure) a significant effect is only observed if the minimal stress is passed resulting in some minor (local) gas flow
The gas break through results in stationary inflow but no significant effect on the total stress is measured probably due to the central (spherical) gas injection (no outflow)
The measured gas threshold pressures under constant volume conditions significantly exceed the sum of the swelling pressure and externally-applied porewater pressure ndashdrained conditions (pi gt ax some MPa)
An important observation is that despite the former interface the bentonite block aggregatebehaves during the saturation of the buffer not different than the homogenous matrix This has been confirmed as well by gas injection tests on the former interface as well by shear tests The
FORGE Report Dxxx ndash Ver0
32
demonstration of the development of cohesion after pre-saturation is a favorable finding because this verifies physical healing of the interface In addition cohesion inside the matrix helps to explain why the measured gas entry pressures are higher than the applied minimal stress
However this observation is only based on two tests which need to be confirmed by the forthcoming experiments Also for understanding the physical background of high entry pressures of gas into the water-saturated bentonite matrix more experimental investigations are of urgent need
5 ReferencesBARTON C A ZOBACK M D amp MOOS D 1995 Fluid flow along potentially active faults in crystalline rock
Geology 23 683ndash686
BLUEMEL M 2000 Improved Procedures for Laboratory Rock Testing EUROCK 2000 ISRM Symposium Aachen 573 ndash 578
BLUEMEL M amp POETSCH M 2003 Direct Shear Testing System International Symposium on GeoTechnical Measurements and Modelling Karlsruhe 327 ndash 331
BUZZI O 2004 Hydromecanique du contact entre geomateriaux Experimentation et modelisation Application au stockage de dechets nucleaires These Universite Joseph Fourier Grenoble France
METCALF R WATSON S P REES J H HUMPHREYS PAUL AND KING F 2008 Gas generation and migration from a deep geological repository for radioactive waste A review of NirexNDArsquos work Technical Report NWAT Environment Agency Penrith Cumbria
NORRIS S 2009 Summary of Gas Generation and Migration Current State-of-the-Art (draft - July 2009) FORGE D12-R
PEACH CJ amp SPIERS CJ 1996 Influence of crystal plastic de-formation on dilatancy and permeability development in synthetic salt rock Tectonophysics 256 101-128
POPP T 2009 State of the art report on gas transport through interfaces FORGE D31-R (WP 33) 48 pp
SITZ P 2003 Entwicklung eines Grundkonzeptes fr langzeitstabile Streckenverschlussbauwerke fr UTD im Salinar Bau und Test eines Versuchsverschlussbauwerkes unter realen Bedingungen (BMBF-gefrdertes FE-Vorhaben Nr 02 C 05472) Abschlubericht TU Bergakademie Freiberg Institut fr Bergbau 2003
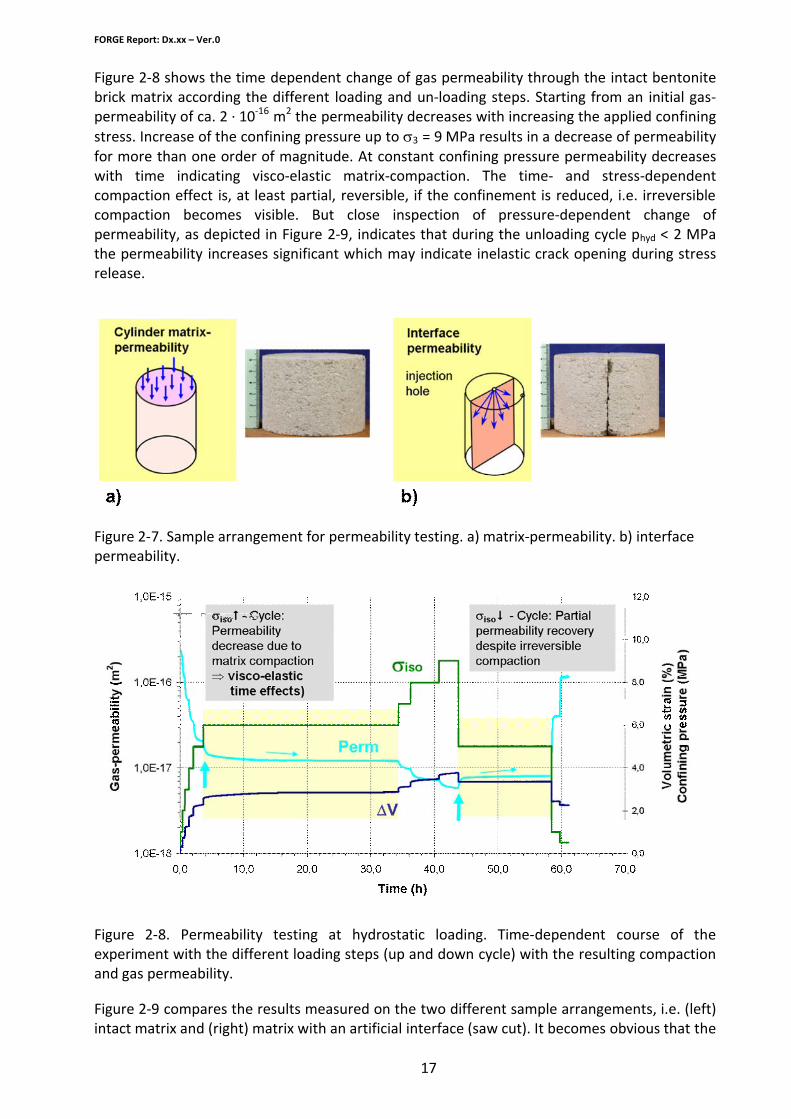
FORGE Report Dxxx ndash Ver0
20
The results of a selected shear test (Bent-SV-MS1) are shown as a variation of shear stress and dilatancy vs shear displacement (increasing load cycle) in Figure 2-11 Pre-loading of the sample to the respective normal stress results in some small compaction which developsfurther during the following shear cycles During the various shear steps contrary to experiences from tests on compact material or natural interfaces no stress peak occurs but a more or less constant shear strength level is apparent At higher normal stress states the shear stresses increase as well Concomitantly with the increase of normal stress the variation of dilatancy (always decrease) documents progressive compaction of the bentonite brick aggregate (eg the total compaction ndash during the whole test at n = 1 MPa - is ca 1mm)
The strength and dilatancy behavior does not depend on the course of loading ie if the vertical load steps are varied as upwards or downwards cycle
2232 SHEAR TESTS ON BENTONITE BRICK GRANITE INTERFACES
As a reference material for shear tests on interfaces between bentonite and granite we selected an artificial fractured cuboid of granite (20cm x 15cm x 75cm) of unknown origin The roughness of the artificial split surface was measured using a 3D surface and body scanner at the University of Freiberg (Prof KONIETZKY) The maximum scanner resolution is in the order of 2m As can be seen from Figure 2-12 the mean difference between highest and lowest asperity is in the order of 15 cm
Figure 2-12 Characterization of the granite contact surface a) Histogram of the height distribution of the later shear surface b) Sample dimensions c) Scheme of the bentonite brickgranite aggregate prepared for shearing
Overall one multiple-step shear test and four single-shear tests of bentonite brick granite samples were performed The sample arrangement is qualitatively the same as before
FORGE Report Dxxx ndash Ver0
21
Principally the test realization comprises two steps pre-loading to the respective normal stress state followed by the shear phase
Remarkably despite the existing asperities the initial compaction is only in the order of some few millimeters (depending on the stress level) which indicate that the interface ie the gap between the flat bentonite brick and the asperities is only partially closed during loading This results from the high uniaxial strength of the bentonite bricks
Exemplarily the results of the multi-step shear test are shown in Figure 2-13 which was performed with three steps at n = 05 10 and 20 MPa with displacement rates of 0002 mms Qualitatively the results are comparably to the results of the tests reported in the chapter before Surprisingly also no significant shear peak is observed but post inspection of the sheared planes indicates that local sliding of spikes with linear erosion dominates during shearing Although no significant compaction and local shear failure occurred the shearing along the rough surface requires local overcoming of the existing cohesion
Figure 2-13 Multi-step shear test BentGran-SV-MS1 (forward cycle) of the dry contact between bentonite brick granite surface The test was realized with σn = 05 1 and 2 MPa
2233 SUMMARY HYDRO-MECHANICAL PROPERTIES ndash DRY STATE
The results of the various shear tests were compiled in Table 2-2 and graphical depicted in Figure 2-14
Analog to the strength properties of an intact rock the MOHR-COLOUMB criterion can be used to describe the discontinuity plane characteristics of a jointed rock Accordingly the shear resistance on an interface at critical stress conditions (shear failure) can be expressed stress-depended by a linear dependency of cohesion (c) and angle of friction ()
τf = c + σf tan φ
FORGE Report Dxxx ndash Ver0
22
According to the different material groups two linear trends of results are clearly visible Whereas bentonitebentonite interfaces show no cohesion but significant friction obviously due to the sand content demonstrate shear tests for bentonite bricksgranite a small but significant occurrence of cohesion which was already indicated by post-evaluation of sheared interfaces The tips of the existing roughness of the granite surface are pressed into the bentonite material resulting in local erosion channels
The respective MOHR-COULOMB-parameters are as follows
τ = C + σN tanφ MOHR-COULOMBC φ
brick brick 002 210brick granite 019 196
(MPa) ()
In summary despite the small difference between both interface types comparison with Figure 2-6 demonstrate the importance of artificial interfaces between bentonite bricks as potential weakness planes
Figure 2-14 Summary of shear tests on interfaces between bentonite brick bentonite brick respectively bentonite brick granite ndash MOHR-COULOMB-diagram
FORGE Report Dxxx ndash Ver0
23
Table 2-2 Shear test results
shear strain n dilatancy time
(mm) (MPa) (MPa) (mm) (min)
bentonite brick bentonite brick
057 050 023 -040 503
383 050 021 -046 3215
782 100 038 -075 6548
1186 200 073 -120 9932
1575 400 140 -199 13208
1220 075 033 -017 2492
839 150 064 -033 5682
429 300 123 -068 9123
042 600 240 -170 12397
bentonite brick granite surface
987 200 094 -540 9120
457 400 160 -354 23913
982 100 053 -362 9120bentonite brick granite surface (wetted)
985 100 029 456 10403
3 Gas transport properties of partial saturated bentonite
31 PRE-SATURATION OF BENTONITE BRICKS WITH INTERFACESFor pre-saturation of the samples respectively for the later gas injection tests a new oedometer-like pressure cell is constructed allowing in additions gas flow measurements under defined axial sample consolidation respectively swelling conditions due to different injected water amounts
The sample arrangement consists of a stiff tube ndash oedometer ndash with two sample cylinders of pre-compacted bentonite (respectively one rock sample with a natural rough surface) which are separated by an axial interface inside Two movable pistons equipped with sinter metal plates allow control of volume changes of the sample ie compaction due to a defined axial load or expansion induced by swelling due to water injection Resulting changes in volume or axial force are measured with dial gauges or an axial oriented load cell
As can be seen from Figure 3-1 the cell design facilitates measurements of fluid transport properties through the buffer respectively along the interface between block contacts ie bufferbuffer and bufferblock at defined interface conditions The cell diameter is 90 mm and the overall sample height is ca 120 mm (consisting of two cylindrical specimens ndash 60 mm height) Sinter metal plates ensure access to the axial ends of the sample
FORGE Report Dxxx ndash Ver0
24
The special design of the cell allows fluid injection (1) along the axial direction ie for pre-saturation of the bentonite to induce swelling or measurement of the matrix permeability and (2) through a central hole along the interface ie investigation of contact permeability
pGAs - Inlet
pGas - Outlet
pH2O - Inlet
pH2O - Outlet
FaxLoad cell
Figure 3-1 Principle of the new designed oedometer-cell for gas injection tests on bufferbuffer or bufferrock interfaces at defined bentonite swelling pressures
0 100 200 300
Time (d)0 100 200 300
Time (d)
00
10
20
30
40
50
60
70
80
90
100
0 100 200 300
Time (d)
Axia
l stre
ss (M
Pa)
Inje
cted
wat
er (w
t-
)Vo
lum
etric
sw
ellin
g (
)
I I
ax
water
Vol
ax
water
Volax
water
Vol
Figure 3-2 Pre-saturation of bentonite brick aggregates (left) ax = 2 MPa ndash central injection through a injection hole with radial fluid flow (middle) ax = 4 MPa ndash central injection through a injection hole with radial fluid flow (right) ax = zero ndash axial water injection with free swelling
FORGE Report Dxxx ndash Ver0
25
311 Lab test resultsThree long-term injection tests (pi = 04 MPa) were started in Spring 2010 whereby three different situations were realized
(1) central water injection through an injection hole through a central tube resulting (as proposed) in radial fluid flow along the brick interface
a ax = 4 MPa
b ax = 2 MPa
(2) axial water injection (without axial load) through the end plates (sintered metal) resulting in free axial swelling
The various curves of water consumption and the resulting swelling are summarized in Figure 3-2 The results can be summarized as follows
(1) The water consumption during swelling depends
a obviously not on the injection geometry
b and only weakly on the axial load
No preferred flow along the interface ie matrix swelling
(2) More than 1 year water injection was not sufficient to reach full saturation ie no water out flow but in the center full saturation is assumed Therefore after one year water injection the tests 1a and 1b were finished to facilitate gas injection tests
312 Comparison to the mock-up test SondershausenDespite the different scales of lab and field tests and the limited number of tests the results correspond very well to existing experiences made from in situ tests where sealing elements are constructed of different blocks or bricks Figure 3-3 illustrates the observations made during testing the sealing element of the mock up test Sondershausen (see short description in chapter 12) The sealing element consists of masonry of bentonite bricks (FS 50) which was tested with NaCl-fluid at a maximum fluid pressure of pfl asymp 8 MPa (pswellasymp 1 MPa) (for details see SITZ 2001)
The following conclusions were drawn from the in situ test (evaluation of the humidity distribution after rebuilding the plug)
1Proof of clear saturation front during fluid pressurization
2Homogenous humidity distribution inside the partially saturated buffer
Low effect of artificial interfaces inside the buffer
3Clear pathways in the contact zone buffer host rock (salt)
Interfaces to the host rock are obviously the most relevant pathways
These observations correspond to the results of the laboratory tests therefore demonstrating that interfaces inside the sealing plug are of minor importance because due to the overall swelling effect they will be efficiently sealed
FORGE Report Dxxx ndash Ver0
26
Figure 3-3 Summary of the mock-up test Sondershausen Upper sketch the test design The picture below shows the humidity distribution inside the buffer (vertical profile along the dam axis)
32 GAS INJECTION TESTS ndash DETERMINATION OF GAS BREAKTHROUGHFor the gas-injection tests we used a constant volume radial flow geometry realized in the experimental setup depicted in Figure 3-4
Gas flow measurements under constant volume conditions
A servo-controlled load frame (up to 250kN load capacity) ensures defined loading respectively volume conditions The axial strain (measured between the load plates) is kept constant during the test (resolution 1 m) ie if the sample volume increases due to gas-injection the axial force is automatically increased During the test the change of the axial stress is measured via a load cell
Gas injection at constant injection pressure on the at least partial saturated bentonite sample with a radial flow geometry
After finishing the saturation instead of water gas was injected through the central pipeof the swelling cell which should result in radial flow if preferred flow along the former interface occurs During the test the samples is drained in the axial direction ie through the axial filter plates
During stepwise increase of the primary gas pressure the inflow of gas is measured with a flow-meter ie during each pressure step firstly the dead volume before the gas access to the sample is pressurized which results in an inflow-peak If gas pressureequilibrium before and after the flow-meter is reached and the sample behaves nearly gastight the apparent flow rate becomes zero Gas break through ie overcome of the
FORGE Report Dxxx ndash Ver0
27
capillary entry pressure is indicated by quasi-constant gas-in-flow or gas-outflow (ie bubbles in a burette)
Two gas breakthrough tests were performed at initial axial pressures of 2 respectively 4 MPa The results are summarized in Figure 3-5 respectively Figure 3-6
Figure 3-4 Experimental setup for gas-breakthrough measurements under constant sample volume
Figure 3-5 Gas breakthrough test ndash axial stress and gas pressure respectively resulting gas flow vs time Ax ndashinit asymp 2 MPa
FORGE Report Dxxx ndash Ver0
28
After finishing the pre-saturation of the bentonite the samples were axially unloaded and the cells were put into the servo-hydraulic load frame Before the tests a waiting period of ca 1 day (at the nominal axial stress) was usually applied to ensure equilibrium inside the sampleExemplarily Figure 3-5 shows the stability of the axially applied strain control which is in the order of 1 m However this results in a variation of the axial stress of 02 MPa
Then the gas pressure was stepwise increased each with a waiting period of ca 05 hour The change of the gas pressure is always followed by peak of gas-inflow as explained before but becomes zero If a gas pressure state some few bars below the axial stress is reached the gas pressure was kept constant over a period of 12 to 15 hours to exclude time effects of a gas breakthrough ie delay to slow water expulsion Despite some scattering no significant gas in- or outflow was observed
In the next phase the stepwise pressurization was continued If the gas-pressure reaches the acting axial stress ie Ax ndashinit = min some local gas flow becomes apparent but with some instability Further pressure increase did not change the gas flow significant until the breakthrough occurred
1st test Ax ndashinit = min asymp 2 MPa 27 ndash 29 MPa ie 07 ndash 09 MPa higher than min
2nd test Ax ndashinit = min asymp 4 MPa 75 MPa ie 35 MPa higher than min
The tests clearly demonstrate that the gas-entry pressures are significantly higher than min In addition no effect of the interface ie preferred radial gas flow is visible In a first approach the bentonite brick aggregate seems to behave like a homogenous buffer material For further discussion see the next chapter
Figure 3-6 Gas breakthrough test- axial stress and gas pressure respectively resulting gas flow vs time Ax ndashinit asymp 4 MPa The inset shows the central filter plate ( = 9mm) which was installed to ensure no blockage of the fluid inflow to low-permeable bentonite matrix
FORGE Report Dxxx ndash Ver0
29
33 SHEAR STRENGTH (HEALED SPECIMENS)The gas injection tests results delivered very high gas entry pressures which succeeded the minimal stress which has been axially applied by about several MPa (depending on the order of stress) A possible explanation could be that due to the central gas injection locally a high water pressure is generated The local pore fluid pressure may be temporarily preserved during the fast pressurization with gas due to the low permeability of the matrix although the system is drained by the axial filter plates However it becomes obvious that the effect of the former interface as a potential pathway does not exist anymore This may indicate that the interface is healed during the time-dependent swelling process
Healing means the development of cohesion ie which results in bentonite from electrostatic forces among fine particles (clay minerals) and water Shear tests represent a simple way to quantify the amount of cohesion as already demonstrated before Here we used the bentonite brick aggregates after dismantling the sample Visual inspection of the former interface give no hints for a mechanical or hydraulical weakness plane ie only the color contrast indicates the former contact plane
Figure 3-7 Bentonite brickbrick aggregate ndash dismantled sample after controlled saturation by injecting water directly on the interface (compare injection filter plate in Figure 3-6) Note the sharp color contrast at the former interface (total height of the sample 12 cm)
To demonstrate that real healing took place we performed with both specimens direct shear tests on the former interface between both bentonite brick halves The procedure is the same as described in 213
FORGE Report Dxxx ndash Ver0
30
Figure 3-8 Single-step shear test on the healed contact between bentonite brick brick surface The test was realized with σn = 05 MPa
Figure 3-9 Summary of both shear tests on ldquohealedrdquo interfaces between bentonite brick bentonite brick in comparison to the former results summarized in Figure 2-14 ndash MOHR-COULOMB-diagram
FORGE Report Dxxx ndash Ver0
31
The results differ significantly from the shear tests performed on the dry or only short wetted contact planes The following results are obtained from Figure 3-8
bull Shear test curves
Exemplarily the results of the shear test performed at n = 05 MPa are shown As usual for intact material shear stress grows with progressive shear displacement in elastic manner up to a peak and then drops down to a residual value Peak and residual values are higher with applied normal stress Repeating the experiment with the 2nd sample at n = 15 MPa (not shown here) results in a similar shape of the strength curve but the increase of strength is not so significant indicating that the influence of the acting normal stress is low ie the friction angle is only small
bull Dilatancy curves
Due to the surface roughness and asperities a bedding plane tends to dilate upon shear although this effect tends to level off after certain amount of prescribed shear displacement and is lower for higher normal stress (not shown here)
For comparison with earlier measurements on dry interfaces shear stress peaks and residual values of shear stress obtained in both single experiments are represented in Figure 3-9 against normal stress leading to open envelopes of the Coulomb type The evaluation of these tests with σn = 05 resp 15 MPa documents a cohesion of 06 MPa in the τ-σn-diagram Remarkably the angle of friction with ca 10 is much lower than that of tests on dry contacts before healing
4 ConclusionsThe performed lab investigations cover a wide field of hydro-mechanical properties of bentonite bricks which represent a favorable option for constructing sealing plugs in different host rock environments
Based on the experimental results the following conclusions can be drawn
At dry conditions gas flow along interfaces is at least 4 orders higher than through the matrix (eg 10-16 m2) Increase of confinement significantly lowers the gas flow (10 MPa more than one order) but the effect is more pronounced for interfaces crack sealing
Saturation of bentonite brick aggregates ie bricks with a common interface is not affected by the interfaces and only weakly by the acting confining pressure
During gas injection (stepwise increasing of the gas pressure) a significant effect is only observed if the minimal stress is passed resulting in some minor (local) gas flow
The gas break through results in stationary inflow but no significant effect on the total stress is measured probably due to the central (spherical) gas injection (no outflow)
The measured gas threshold pressures under constant volume conditions significantly exceed the sum of the swelling pressure and externally-applied porewater pressure ndashdrained conditions (pi gt ax some MPa)
An important observation is that despite the former interface the bentonite block aggregatebehaves during the saturation of the buffer not different than the homogenous matrix This has been confirmed as well by gas injection tests on the former interface as well by shear tests The
FORGE Report Dxxx ndash Ver0
32
demonstration of the development of cohesion after pre-saturation is a favorable finding because this verifies physical healing of the interface In addition cohesion inside the matrix helps to explain why the measured gas entry pressures are higher than the applied minimal stress
However this observation is only based on two tests which need to be confirmed by the forthcoming experiments Also for understanding the physical background of high entry pressures of gas into the water-saturated bentonite matrix more experimental investigations are of urgent need
5 ReferencesBARTON C A ZOBACK M D amp MOOS D 1995 Fluid flow along potentially active faults in crystalline rock
Geology 23 683ndash686
BLUEMEL M 2000 Improved Procedures for Laboratory Rock Testing EUROCK 2000 ISRM Symposium Aachen 573 ndash 578
BLUEMEL M amp POETSCH M 2003 Direct Shear Testing System International Symposium on GeoTechnical Measurements and Modelling Karlsruhe 327 ndash 331
BUZZI O 2004 Hydromecanique du contact entre geomateriaux Experimentation et modelisation Application au stockage de dechets nucleaires These Universite Joseph Fourier Grenoble France
METCALF R WATSON S P REES J H HUMPHREYS PAUL AND KING F 2008 Gas generation and migration from a deep geological repository for radioactive waste A review of NirexNDArsquos work Technical Report NWAT Environment Agency Penrith Cumbria
NORRIS S 2009 Summary of Gas Generation and Migration Current State-of-the-Art (draft - July 2009) FORGE D12-R
PEACH CJ amp SPIERS CJ 1996 Influence of crystal plastic de-formation on dilatancy and permeability development in synthetic salt rock Tectonophysics 256 101-128
POPP T 2009 State of the art report on gas transport through interfaces FORGE D31-R (WP 33) 48 pp
SITZ P 2003 Entwicklung eines Grundkonzeptes fr langzeitstabile Streckenverschlussbauwerke fr UTD im Salinar Bau und Test eines Versuchsverschlussbauwerkes unter realen Bedingungen (BMBF-gefrdertes FE-Vorhaben Nr 02 C 05472) Abschlubericht TU Bergakademie Freiberg Institut fr Bergbau 2003
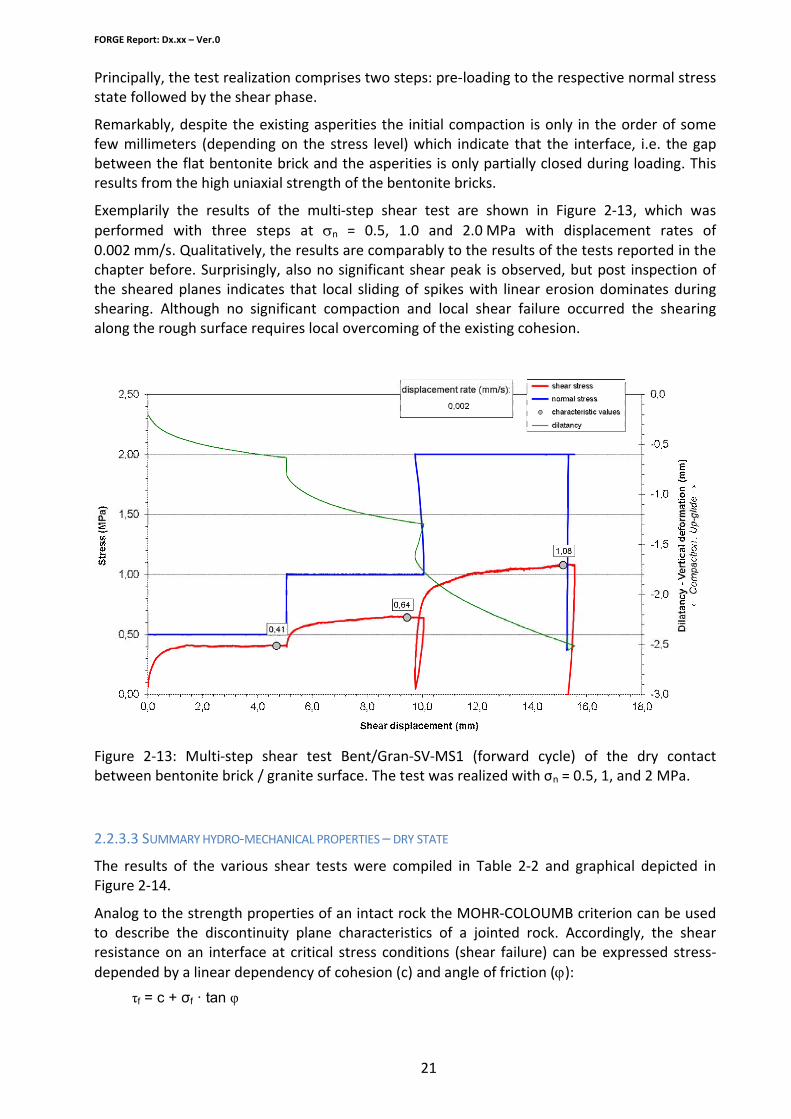
FORGE Report Dxxx ndash Ver0
22
According to the different material groups two linear trends of results are clearly visible Whereas bentonitebentonite interfaces show no cohesion but significant friction obviously due to the sand content demonstrate shear tests for bentonite bricksgranite a small but significant occurrence of cohesion which was already indicated by post-evaluation of sheared interfaces The tips of the existing roughness of the granite surface are pressed into the bentonite material resulting in local erosion channels
The respective MOHR-COULOMB-parameters are as follows
τ = C + σN tanφ MOHR-COULOMBC φ
brick brick 002 210brick granite 019 196
(MPa) ()
In summary despite the small difference between both interface types comparison with Figure 2-6 demonstrate the importance of artificial interfaces between bentonite bricks as potential weakness planes
Figure 2-14 Summary of shear tests on interfaces between bentonite brick bentonite brick respectively bentonite brick granite ndash MOHR-COULOMB-diagram
FORGE Report Dxxx ndash Ver0
23
Table 2-2 Shear test results
shear strain n dilatancy time
(mm) (MPa) (MPa) (mm) (min)
bentonite brick bentonite brick
057 050 023 -040 503
383 050 021 -046 3215
782 100 038 -075 6548
1186 200 073 -120 9932
1575 400 140 -199 13208
1220 075 033 -017 2492
839 150 064 -033 5682
429 300 123 -068 9123
042 600 240 -170 12397
bentonite brick granite surface
987 200 094 -540 9120
457 400 160 -354 23913
982 100 053 -362 9120bentonite brick granite surface (wetted)
985 100 029 456 10403
3 Gas transport properties of partial saturated bentonite
31 PRE-SATURATION OF BENTONITE BRICKS WITH INTERFACESFor pre-saturation of the samples respectively for the later gas injection tests a new oedometer-like pressure cell is constructed allowing in additions gas flow measurements under defined axial sample consolidation respectively swelling conditions due to different injected water amounts
The sample arrangement consists of a stiff tube ndash oedometer ndash with two sample cylinders of pre-compacted bentonite (respectively one rock sample with a natural rough surface) which are separated by an axial interface inside Two movable pistons equipped with sinter metal plates allow control of volume changes of the sample ie compaction due to a defined axial load or expansion induced by swelling due to water injection Resulting changes in volume or axial force are measured with dial gauges or an axial oriented load cell
As can be seen from Figure 3-1 the cell design facilitates measurements of fluid transport properties through the buffer respectively along the interface between block contacts ie bufferbuffer and bufferblock at defined interface conditions The cell diameter is 90 mm and the overall sample height is ca 120 mm (consisting of two cylindrical specimens ndash 60 mm height) Sinter metal plates ensure access to the axial ends of the sample
FORGE Report Dxxx ndash Ver0
24
The special design of the cell allows fluid injection (1) along the axial direction ie for pre-saturation of the bentonite to induce swelling or measurement of the matrix permeability and (2) through a central hole along the interface ie investigation of contact permeability
pGAs - Inlet
pGas - Outlet
pH2O - Inlet
pH2O - Outlet
FaxLoad cell
Figure 3-1 Principle of the new designed oedometer-cell for gas injection tests on bufferbuffer or bufferrock interfaces at defined bentonite swelling pressures
0 100 200 300
Time (d)0 100 200 300
Time (d)
00
10
20
30
40
50
60
70
80
90
100
0 100 200 300
Time (d)
Axia
l stre
ss (M
Pa)
Inje
cted
wat
er (w
t-
)Vo
lum
etric
sw
ellin
g (
)
I I
ax
water
Vol
ax
water
Volax
water
Vol
Figure 3-2 Pre-saturation of bentonite brick aggregates (left) ax = 2 MPa ndash central injection through a injection hole with radial fluid flow (middle) ax = 4 MPa ndash central injection through a injection hole with radial fluid flow (right) ax = zero ndash axial water injection with free swelling
FORGE Report Dxxx ndash Ver0
25
311 Lab test resultsThree long-term injection tests (pi = 04 MPa) were started in Spring 2010 whereby three different situations were realized
(1) central water injection through an injection hole through a central tube resulting (as proposed) in radial fluid flow along the brick interface
a ax = 4 MPa
b ax = 2 MPa
(2) axial water injection (without axial load) through the end plates (sintered metal) resulting in free axial swelling
The various curves of water consumption and the resulting swelling are summarized in Figure 3-2 The results can be summarized as follows
(1) The water consumption during swelling depends
a obviously not on the injection geometry
b and only weakly on the axial load
No preferred flow along the interface ie matrix swelling
(2) More than 1 year water injection was not sufficient to reach full saturation ie no water out flow but in the center full saturation is assumed Therefore after one year water injection the tests 1a and 1b were finished to facilitate gas injection tests
312 Comparison to the mock-up test SondershausenDespite the different scales of lab and field tests and the limited number of tests the results correspond very well to existing experiences made from in situ tests where sealing elements are constructed of different blocks or bricks Figure 3-3 illustrates the observations made during testing the sealing element of the mock up test Sondershausen (see short description in chapter 12) The sealing element consists of masonry of bentonite bricks (FS 50) which was tested with NaCl-fluid at a maximum fluid pressure of pfl asymp 8 MPa (pswellasymp 1 MPa) (for details see SITZ 2001)
The following conclusions were drawn from the in situ test (evaluation of the humidity distribution after rebuilding the plug)
1Proof of clear saturation front during fluid pressurization
2Homogenous humidity distribution inside the partially saturated buffer
Low effect of artificial interfaces inside the buffer
3Clear pathways in the contact zone buffer host rock (salt)
Interfaces to the host rock are obviously the most relevant pathways
These observations correspond to the results of the laboratory tests therefore demonstrating that interfaces inside the sealing plug are of minor importance because due to the overall swelling effect they will be efficiently sealed
FORGE Report Dxxx ndash Ver0
26
Figure 3-3 Summary of the mock-up test Sondershausen Upper sketch the test design The picture below shows the humidity distribution inside the buffer (vertical profile along the dam axis)
32 GAS INJECTION TESTS ndash DETERMINATION OF GAS BREAKTHROUGHFor the gas-injection tests we used a constant volume radial flow geometry realized in the experimental setup depicted in Figure 3-4
Gas flow measurements under constant volume conditions
A servo-controlled load frame (up to 250kN load capacity) ensures defined loading respectively volume conditions The axial strain (measured between the load plates) is kept constant during the test (resolution 1 m) ie if the sample volume increases due to gas-injection the axial force is automatically increased During the test the change of the axial stress is measured via a load cell
Gas injection at constant injection pressure on the at least partial saturated bentonite sample with a radial flow geometry
After finishing the saturation instead of water gas was injected through the central pipeof the swelling cell which should result in radial flow if preferred flow along the former interface occurs During the test the samples is drained in the axial direction ie through the axial filter plates
During stepwise increase of the primary gas pressure the inflow of gas is measured with a flow-meter ie during each pressure step firstly the dead volume before the gas access to the sample is pressurized which results in an inflow-peak If gas pressureequilibrium before and after the flow-meter is reached and the sample behaves nearly gastight the apparent flow rate becomes zero Gas break through ie overcome of the
FORGE Report Dxxx ndash Ver0
27
capillary entry pressure is indicated by quasi-constant gas-in-flow or gas-outflow (ie bubbles in a burette)
Two gas breakthrough tests were performed at initial axial pressures of 2 respectively 4 MPa The results are summarized in Figure 3-5 respectively Figure 3-6
Figure 3-4 Experimental setup for gas-breakthrough measurements under constant sample volume
Figure 3-5 Gas breakthrough test ndash axial stress and gas pressure respectively resulting gas flow vs time Ax ndashinit asymp 2 MPa
FORGE Report Dxxx ndash Ver0
28
After finishing the pre-saturation of the bentonite the samples were axially unloaded and the cells were put into the servo-hydraulic load frame Before the tests a waiting period of ca 1 day (at the nominal axial stress) was usually applied to ensure equilibrium inside the sampleExemplarily Figure 3-5 shows the stability of the axially applied strain control which is in the order of 1 m However this results in a variation of the axial stress of 02 MPa
Then the gas pressure was stepwise increased each with a waiting period of ca 05 hour The change of the gas pressure is always followed by peak of gas-inflow as explained before but becomes zero If a gas pressure state some few bars below the axial stress is reached the gas pressure was kept constant over a period of 12 to 15 hours to exclude time effects of a gas breakthrough ie delay to slow water expulsion Despite some scattering no significant gas in- or outflow was observed
In the next phase the stepwise pressurization was continued If the gas-pressure reaches the acting axial stress ie Ax ndashinit = min some local gas flow becomes apparent but with some instability Further pressure increase did not change the gas flow significant until the breakthrough occurred
1st test Ax ndashinit = min asymp 2 MPa 27 ndash 29 MPa ie 07 ndash 09 MPa higher than min
2nd test Ax ndashinit = min asymp 4 MPa 75 MPa ie 35 MPa higher than min
The tests clearly demonstrate that the gas-entry pressures are significantly higher than min In addition no effect of the interface ie preferred radial gas flow is visible In a first approach the bentonite brick aggregate seems to behave like a homogenous buffer material For further discussion see the next chapter
Figure 3-6 Gas breakthrough test- axial stress and gas pressure respectively resulting gas flow vs time Ax ndashinit asymp 4 MPa The inset shows the central filter plate ( = 9mm) which was installed to ensure no blockage of the fluid inflow to low-permeable bentonite matrix
FORGE Report Dxxx ndash Ver0
29
33 SHEAR STRENGTH (HEALED SPECIMENS)The gas injection tests results delivered very high gas entry pressures which succeeded the minimal stress which has been axially applied by about several MPa (depending on the order of stress) A possible explanation could be that due to the central gas injection locally a high water pressure is generated The local pore fluid pressure may be temporarily preserved during the fast pressurization with gas due to the low permeability of the matrix although the system is drained by the axial filter plates However it becomes obvious that the effect of the former interface as a potential pathway does not exist anymore This may indicate that the interface is healed during the time-dependent swelling process
Healing means the development of cohesion ie which results in bentonite from electrostatic forces among fine particles (clay minerals) and water Shear tests represent a simple way to quantify the amount of cohesion as already demonstrated before Here we used the bentonite brick aggregates after dismantling the sample Visual inspection of the former interface give no hints for a mechanical or hydraulical weakness plane ie only the color contrast indicates the former contact plane
Figure 3-7 Bentonite brickbrick aggregate ndash dismantled sample after controlled saturation by injecting water directly on the interface (compare injection filter plate in Figure 3-6) Note the sharp color contrast at the former interface (total height of the sample 12 cm)
To demonstrate that real healing took place we performed with both specimens direct shear tests on the former interface between both bentonite brick halves The procedure is the same as described in 213
FORGE Report Dxxx ndash Ver0
30
Figure 3-8 Single-step shear test on the healed contact between bentonite brick brick surface The test was realized with σn = 05 MPa
Figure 3-9 Summary of both shear tests on ldquohealedrdquo interfaces between bentonite brick bentonite brick in comparison to the former results summarized in Figure 2-14 ndash MOHR-COULOMB-diagram
FORGE Report Dxxx ndash Ver0
31
The results differ significantly from the shear tests performed on the dry or only short wetted contact planes The following results are obtained from Figure 3-8
bull Shear test curves
Exemplarily the results of the shear test performed at n = 05 MPa are shown As usual for intact material shear stress grows with progressive shear displacement in elastic manner up to a peak and then drops down to a residual value Peak and residual values are higher with applied normal stress Repeating the experiment with the 2nd sample at n = 15 MPa (not shown here) results in a similar shape of the strength curve but the increase of strength is not so significant indicating that the influence of the acting normal stress is low ie the friction angle is only small
bull Dilatancy curves
Due to the surface roughness and asperities a bedding plane tends to dilate upon shear although this effect tends to level off after certain amount of prescribed shear displacement and is lower for higher normal stress (not shown here)
For comparison with earlier measurements on dry interfaces shear stress peaks and residual values of shear stress obtained in both single experiments are represented in Figure 3-9 against normal stress leading to open envelopes of the Coulomb type The evaluation of these tests with σn = 05 resp 15 MPa documents a cohesion of 06 MPa in the τ-σn-diagram Remarkably the angle of friction with ca 10 is much lower than that of tests on dry contacts before healing
4 ConclusionsThe performed lab investigations cover a wide field of hydro-mechanical properties of bentonite bricks which represent a favorable option for constructing sealing plugs in different host rock environments
Based on the experimental results the following conclusions can be drawn
At dry conditions gas flow along interfaces is at least 4 orders higher than through the matrix (eg 10-16 m2) Increase of confinement significantly lowers the gas flow (10 MPa more than one order) but the effect is more pronounced for interfaces crack sealing
Saturation of bentonite brick aggregates ie bricks with a common interface is not affected by the interfaces and only weakly by the acting confining pressure
During gas injection (stepwise increasing of the gas pressure) a significant effect is only observed if the minimal stress is passed resulting in some minor (local) gas flow
The gas break through results in stationary inflow but no significant effect on the total stress is measured probably due to the central (spherical) gas injection (no outflow)
The measured gas threshold pressures under constant volume conditions significantly exceed the sum of the swelling pressure and externally-applied porewater pressure ndashdrained conditions (pi gt ax some MPa)
An important observation is that despite the former interface the bentonite block aggregatebehaves during the saturation of the buffer not different than the homogenous matrix This has been confirmed as well by gas injection tests on the former interface as well by shear tests The
FORGE Report Dxxx ndash Ver0
32
demonstration of the development of cohesion after pre-saturation is a favorable finding because this verifies physical healing of the interface In addition cohesion inside the matrix helps to explain why the measured gas entry pressures are higher than the applied minimal stress
However this observation is only based on two tests which need to be confirmed by the forthcoming experiments Also for understanding the physical background of high entry pressures of gas into the water-saturated bentonite matrix more experimental investigations are of urgent need
5 ReferencesBARTON C A ZOBACK M D amp MOOS D 1995 Fluid flow along potentially active faults in crystalline rock
Geology 23 683ndash686
BLUEMEL M 2000 Improved Procedures for Laboratory Rock Testing EUROCK 2000 ISRM Symposium Aachen 573 ndash 578
BLUEMEL M amp POETSCH M 2003 Direct Shear Testing System International Symposium on GeoTechnical Measurements and Modelling Karlsruhe 327 ndash 331
BUZZI O 2004 Hydromecanique du contact entre geomateriaux Experimentation et modelisation Application au stockage de dechets nucleaires These Universite Joseph Fourier Grenoble France
METCALF R WATSON S P REES J H HUMPHREYS PAUL AND KING F 2008 Gas generation and migration from a deep geological repository for radioactive waste A review of NirexNDArsquos work Technical Report NWAT Environment Agency Penrith Cumbria
NORRIS S 2009 Summary of Gas Generation and Migration Current State-of-the-Art (draft - July 2009) FORGE D12-R
PEACH CJ amp SPIERS CJ 1996 Influence of crystal plastic de-formation on dilatancy and permeability development in synthetic salt rock Tectonophysics 256 101-128
POPP T 2009 State of the art report on gas transport through interfaces FORGE D31-R (WP 33) 48 pp
SITZ P 2003 Entwicklung eines Grundkonzeptes fr langzeitstabile Streckenverschlussbauwerke fr UTD im Salinar Bau und Test eines Versuchsverschlussbauwerkes unter realen Bedingungen (BMBF-gefrdertes FE-Vorhaben Nr 02 C 05472) Abschlubericht TU Bergakademie Freiberg Institut fr Bergbau 2003
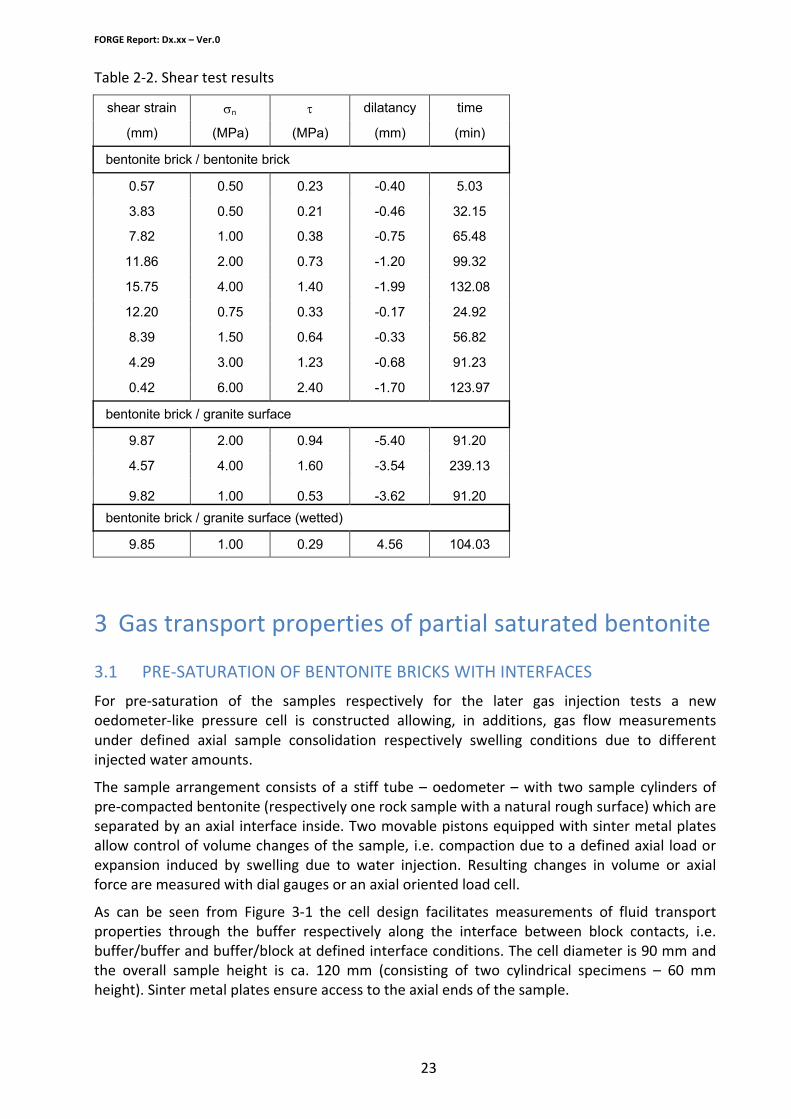
FORGE Report Dxxx ndash Ver0
24
The special design of the cell allows fluid injection (1) along the axial direction ie for pre-saturation of the bentonite to induce swelling or measurement of the matrix permeability and (2) through a central hole along the interface ie investigation of contact permeability
pGAs - Inlet
pGas - Outlet
pH2O - Inlet
pH2O - Outlet
FaxLoad cell
Figure 3-1 Principle of the new designed oedometer-cell for gas injection tests on bufferbuffer or bufferrock interfaces at defined bentonite swelling pressures
0 100 200 300
Time (d)0 100 200 300
Time (d)
00
10
20
30
40
50
60
70
80
90
100
0 100 200 300
Time (d)
Axia
l stre
ss (M
Pa)
Inje
cted
wat
er (w
t-
)Vo
lum
etric
sw
ellin
g (
)
I I
ax
water
Vol
ax
water
Volax
water
Vol
Figure 3-2 Pre-saturation of bentonite brick aggregates (left) ax = 2 MPa ndash central injection through a injection hole with radial fluid flow (middle) ax = 4 MPa ndash central injection through a injection hole with radial fluid flow (right) ax = zero ndash axial water injection with free swelling
FORGE Report Dxxx ndash Ver0
25
311 Lab test resultsThree long-term injection tests (pi = 04 MPa) were started in Spring 2010 whereby three different situations were realized
(1) central water injection through an injection hole through a central tube resulting (as proposed) in radial fluid flow along the brick interface
a ax = 4 MPa
b ax = 2 MPa
(2) axial water injection (without axial load) through the end plates (sintered metal) resulting in free axial swelling
The various curves of water consumption and the resulting swelling are summarized in Figure 3-2 The results can be summarized as follows
(1) The water consumption during swelling depends
a obviously not on the injection geometry
b and only weakly on the axial load
No preferred flow along the interface ie matrix swelling
(2) More than 1 year water injection was not sufficient to reach full saturation ie no water out flow but in the center full saturation is assumed Therefore after one year water injection the tests 1a and 1b were finished to facilitate gas injection tests
312 Comparison to the mock-up test SondershausenDespite the different scales of lab and field tests and the limited number of tests the results correspond very well to existing experiences made from in situ tests where sealing elements are constructed of different blocks or bricks Figure 3-3 illustrates the observations made during testing the sealing element of the mock up test Sondershausen (see short description in chapter 12) The sealing element consists of masonry of bentonite bricks (FS 50) which was tested with NaCl-fluid at a maximum fluid pressure of pfl asymp 8 MPa (pswellasymp 1 MPa) (for details see SITZ 2001)
The following conclusions were drawn from the in situ test (evaluation of the humidity distribution after rebuilding the plug)
1Proof of clear saturation front during fluid pressurization
2Homogenous humidity distribution inside the partially saturated buffer
Low effect of artificial interfaces inside the buffer
3Clear pathways in the contact zone buffer host rock (salt)
Interfaces to the host rock are obviously the most relevant pathways
These observations correspond to the results of the laboratory tests therefore demonstrating that interfaces inside the sealing plug are of minor importance because due to the overall swelling effect they will be efficiently sealed
FORGE Report Dxxx ndash Ver0
26
Figure 3-3 Summary of the mock-up test Sondershausen Upper sketch the test design The picture below shows the humidity distribution inside the buffer (vertical profile along the dam axis)
32 GAS INJECTION TESTS ndash DETERMINATION OF GAS BREAKTHROUGHFor the gas-injection tests we used a constant volume radial flow geometry realized in the experimental setup depicted in Figure 3-4
Gas flow measurements under constant volume conditions
A servo-controlled load frame (up to 250kN load capacity) ensures defined loading respectively volume conditions The axial strain (measured between the load plates) is kept constant during the test (resolution 1 m) ie if the sample volume increases due to gas-injection the axial force is automatically increased During the test the change of the axial stress is measured via a load cell
Gas injection at constant injection pressure on the at least partial saturated bentonite sample with a radial flow geometry
After finishing the saturation instead of water gas was injected through the central pipeof the swelling cell which should result in radial flow if preferred flow along the former interface occurs During the test the samples is drained in the axial direction ie through the axial filter plates
During stepwise increase of the primary gas pressure the inflow of gas is measured with a flow-meter ie during each pressure step firstly the dead volume before the gas access to the sample is pressurized which results in an inflow-peak If gas pressureequilibrium before and after the flow-meter is reached and the sample behaves nearly gastight the apparent flow rate becomes zero Gas break through ie overcome of the
FORGE Report Dxxx ndash Ver0
27
capillary entry pressure is indicated by quasi-constant gas-in-flow or gas-outflow (ie bubbles in a burette)
Two gas breakthrough tests were performed at initial axial pressures of 2 respectively 4 MPa The results are summarized in Figure 3-5 respectively Figure 3-6
Figure 3-4 Experimental setup for gas-breakthrough measurements under constant sample volume
Figure 3-5 Gas breakthrough test ndash axial stress and gas pressure respectively resulting gas flow vs time Ax ndashinit asymp 2 MPa
FORGE Report Dxxx ndash Ver0
28
After finishing the pre-saturation of the bentonite the samples were axially unloaded and the cells were put into the servo-hydraulic load frame Before the tests a waiting period of ca 1 day (at the nominal axial stress) was usually applied to ensure equilibrium inside the sampleExemplarily Figure 3-5 shows the stability of the axially applied strain control which is in the order of 1 m However this results in a variation of the axial stress of 02 MPa
Then the gas pressure was stepwise increased each with a waiting period of ca 05 hour The change of the gas pressure is always followed by peak of gas-inflow as explained before but becomes zero If a gas pressure state some few bars below the axial stress is reached the gas pressure was kept constant over a period of 12 to 15 hours to exclude time effects of a gas breakthrough ie delay to slow water expulsion Despite some scattering no significant gas in- or outflow was observed
In the next phase the stepwise pressurization was continued If the gas-pressure reaches the acting axial stress ie Ax ndashinit = min some local gas flow becomes apparent but with some instability Further pressure increase did not change the gas flow significant until the breakthrough occurred
1st test Ax ndashinit = min asymp 2 MPa 27 ndash 29 MPa ie 07 ndash 09 MPa higher than min
2nd test Ax ndashinit = min asymp 4 MPa 75 MPa ie 35 MPa higher than min
The tests clearly demonstrate that the gas-entry pressures are significantly higher than min In addition no effect of the interface ie preferred radial gas flow is visible In a first approach the bentonite brick aggregate seems to behave like a homogenous buffer material For further discussion see the next chapter
Figure 3-6 Gas breakthrough test- axial stress and gas pressure respectively resulting gas flow vs time Ax ndashinit asymp 4 MPa The inset shows the central filter plate ( = 9mm) which was installed to ensure no blockage of the fluid inflow to low-permeable bentonite matrix
FORGE Report Dxxx ndash Ver0
29
33 SHEAR STRENGTH (HEALED SPECIMENS)The gas injection tests results delivered very high gas entry pressures which succeeded the minimal stress which has been axially applied by about several MPa (depending on the order of stress) A possible explanation could be that due to the central gas injection locally a high water pressure is generated The local pore fluid pressure may be temporarily preserved during the fast pressurization with gas due to the low permeability of the matrix although the system is drained by the axial filter plates However it becomes obvious that the effect of the former interface as a potential pathway does not exist anymore This may indicate that the interface is healed during the time-dependent swelling process
Healing means the development of cohesion ie which results in bentonite from electrostatic forces among fine particles (clay minerals) and water Shear tests represent a simple way to quantify the amount of cohesion as already demonstrated before Here we used the bentonite brick aggregates after dismantling the sample Visual inspection of the former interface give no hints for a mechanical or hydraulical weakness plane ie only the color contrast indicates the former contact plane
Figure 3-7 Bentonite brickbrick aggregate ndash dismantled sample after controlled saturation by injecting water directly on the interface (compare injection filter plate in Figure 3-6) Note the sharp color contrast at the former interface (total height of the sample 12 cm)
To demonstrate that real healing took place we performed with both specimens direct shear tests on the former interface between both bentonite brick halves The procedure is the same as described in 213
FORGE Report Dxxx ndash Ver0
30
Figure 3-8 Single-step shear test on the healed contact between bentonite brick brick surface The test was realized with σn = 05 MPa
Figure 3-9 Summary of both shear tests on ldquohealedrdquo interfaces between bentonite brick bentonite brick in comparison to the former results summarized in Figure 2-14 ndash MOHR-COULOMB-diagram
FORGE Report Dxxx ndash Ver0
31
The results differ significantly from the shear tests performed on the dry or only short wetted contact planes The following results are obtained from Figure 3-8
bull Shear test curves
Exemplarily the results of the shear test performed at n = 05 MPa are shown As usual for intact material shear stress grows with progressive shear displacement in elastic manner up to a peak and then drops down to a residual value Peak and residual values are higher with applied normal stress Repeating the experiment with the 2nd sample at n = 15 MPa (not shown here) results in a similar shape of the strength curve but the increase of strength is not so significant indicating that the influence of the acting normal stress is low ie the friction angle is only small
bull Dilatancy curves
Due to the surface roughness and asperities a bedding plane tends to dilate upon shear although this effect tends to level off after certain amount of prescribed shear displacement and is lower for higher normal stress (not shown here)
For comparison with earlier measurements on dry interfaces shear stress peaks and residual values of shear stress obtained in both single experiments are represented in Figure 3-9 against normal stress leading to open envelopes of the Coulomb type The evaluation of these tests with σn = 05 resp 15 MPa documents a cohesion of 06 MPa in the τ-σn-diagram Remarkably the angle of friction with ca 10 is much lower than that of tests on dry contacts before healing
4 ConclusionsThe performed lab investigations cover a wide field of hydro-mechanical properties of bentonite bricks which represent a favorable option for constructing sealing plugs in different host rock environments
Based on the experimental results the following conclusions can be drawn
At dry conditions gas flow along interfaces is at least 4 orders higher than through the matrix (eg 10-16 m2) Increase of confinement significantly lowers the gas flow (10 MPa more than one order) but the effect is more pronounced for interfaces crack sealing
Saturation of bentonite brick aggregates ie bricks with a common interface is not affected by the interfaces and only weakly by the acting confining pressure
During gas injection (stepwise increasing of the gas pressure) a significant effect is only observed if the minimal stress is passed resulting in some minor (local) gas flow
The gas break through results in stationary inflow but no significant effect on the total stress is measured probably due to the central (spherical) gas injection (no outflow)
The measured gas threshold pressures under constant volume conditions significantly exceed the sum of the swelling pressure and externally-applied porewater pressure ndashdrained conditions (pi gt ax some MPa)
An important observation is that despite the former interface the bentonite block aggregatebehaves during the saturation of the buffer not different than the homogenous matrix This has been confirmed as well by gas injection tests on the former interface as well by shear tests The
FORGE Report Dxxx ndash Ver0
32
demonstration of the development of cohesion after pre-saturation is a favorable finding because this verifies physical healing of the interface In addition cohesion inside the matrix helps to explain why the measured gas entry pressures are higher than the applied minimal stress
However this observation is only based on two tests which need to be confirmed by the forthcoming experiments Also for understanding the physical background of high entry pressures of gas into the water-saturated bentonite matrix more experimental investigations are of urgent need
5 ReferencesBARTON C A ZOBACK M D amp MOOS D 1995 Fluid flow along potentially active faults in crystalline rock
Geology 23 683ndash686
BLUEMEL M 2000 Improved Procedures for Laboratory Rock Testing EUROCK 2000 ISRM Symposium Aachen 573 ndash 578
BLUEMEL M amp POETSCH M 2003 Direct Shear Testing System International Symposium on GeoTechnical Measurements and Modelling Karlsruhe 327 ndash 331
BUZZI O 2004 Hydromecanique du contact entre geomateriaux Experimentation et modelisation Application au stockage de dechets nucleaires These Universite Joseph Fourier Grenoble France
METCALF R WATSON S P REES J H HUMPHREYS PAUL AND KING F 2008 Gas generation and migration from a deep geological repository for radioactive waste A review of NirexNDArsquos work Technical Report NWAT Environment Agency Penrith Cumbria
NORRIS S 2009 Summary of Gas Generation and Migration Current State-of-the-Art (draft - July 2009) FORGE D12-R
PEACH CJ amp SPIERS CJ 1996 Influence of crystal plastic de-formation on dilatancy and permeability development in synthetic salt rock Tectonophysics 256 101-128
POPP T 2009 State of the art report on gas transport through interfaces FORGE D31-R (WP 33) 48 pp
SITZ P 2003 Entwicklung eines Grundkonzeptes fr langzeitstabile Streckenverschlussbauwerke fr UTD im Salinar Bau und Test eines Versuchsverschlussbauwerkes unter realen Bedingungen (BMBF-gefrdertes FE-Vorhaben Nr 02 C 05472) Abschlubericht TU Bergakademie Freiberg Institut fr Bergbau 2003
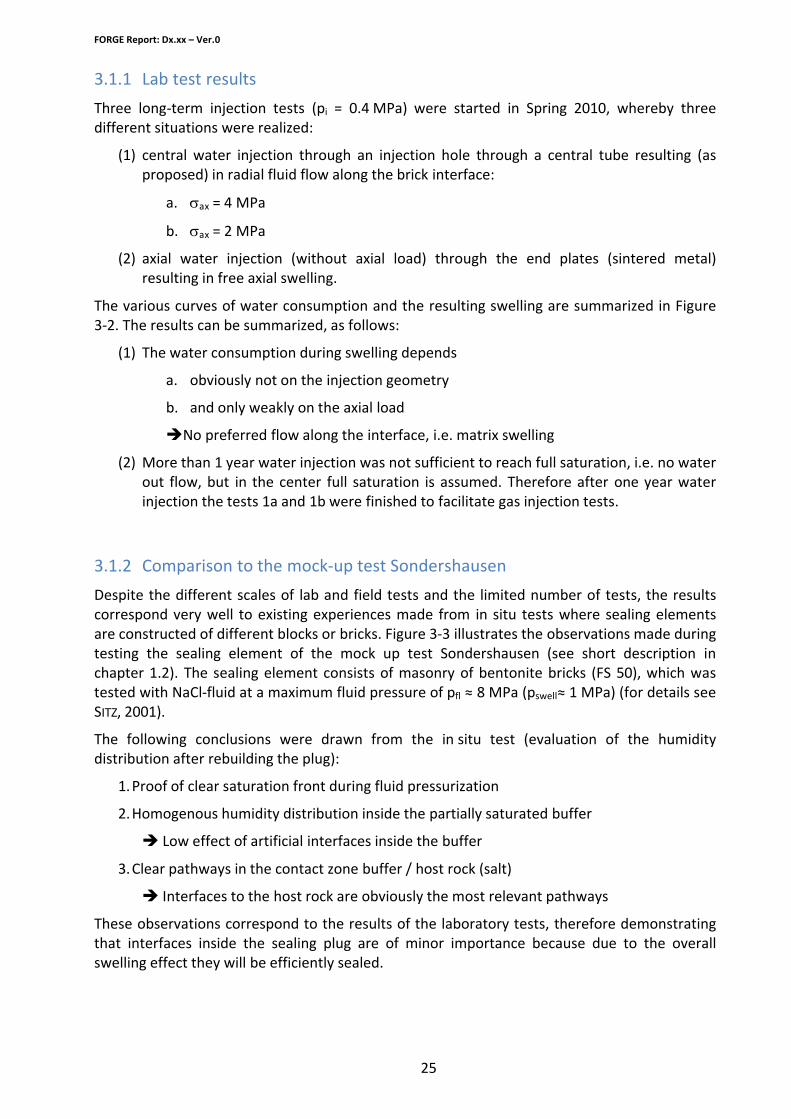
FORGE Report Dxxx ndash Ver0
25
311 Lab test resultsThree long-term injection tests (pi = 04 MPa) were started in Spring 2010 whereby three different situations were realized
(1) central water injection through an injection hole through a central tube resulting (as proposed) in radial fluid flow along the brick interface
a ax = 4 MPa
b ax = 2 MPa
(2) axial water injection (without axial load) through the end plates (sintered metal) resulting in free axial swelling
The various curves of water consumption and the resulting swelling are summarized in Figure 3-2 The results can be summarized as follows
(1) The water consumption during swelling depends
a obviously not on the injection geometry
b and only weakly on the axial load
No preferred flow along the interface ie matrix swelling
(2) More than 1 year water injection was not sufficient to reach full saturation ie no water out flow but in the center full saturation is assumed Therefore after one year water injection the tests 1a and 1b were finished to facilitate gas injection tests
312 Comparison to the mock-up test SondershausenDespite the different scales of lab and field tests and the limited number of tests the results correspond very well to existing experiences made from in situ tests where sealing elements are constructed of different blocks or bricks Figure 3-3 illustrates the observations made during testing the sealing element of the mock up test Sondershausen (see short description in chapter 12) The sealing element consists of masonry of bentonite bricks (FS 50) which was tested with NaCl-fluid at a maximum fluid pressure of pfl asymp 8 MPa (pswellasymp 1 MPa) (for details see SITZ 2001)
The following conclusions were drawn from the in situ test (evaluation of the humidity distribution after rebuilding the plug)
1Proof of clear saturation front during fluid pressurization
2Homogenous humidity distribution inside the partially saturated buffer
Low effect of artificial interfaces inside the buffer
3Clear pathways in the contact zone buffer host rock (salt)
Interfaces to the host rock are obviously the most relevant pathways
These observations correspond to the results of the laboratory tests therefore demonstrating that interfaces inside the sealing plug are of minor importance because due to the overall swelling effect they will be efficiently sealed
FORGE Report Dxxx ndash Ver0
26
Figure 3-3 Summary of the mock-up test Sondershausen Upper sketch the test design The picture below shows the humidity distribution inside the buffer (vertical profile along the dam axis)
32 GAS INJECTION TESTS ndash DETERMINATION OF GAS BREAKTHROUGHFor the gas-injection tests we used a constant volume radial flow geometry realized in the experimental setup depicted in Figure 3-4
Gas flow measurements under constant volume conditions
A servo-controlled load frame (up to 250kN load capacity) ensures defined loading respectively volume conditions The axial strain (measured between the load plates) is kept constant during the test (resolution 1 m) ie if the sample volume increases due to gas-injection the axial force is automatically increased During the test the change of the axial stress is measured via a load cell
Gas injection at constant injection pressure on the at least partial saturated bentonite sample with a radial flow geometry
After finishing the saturation instead of water gas was injected through the central pipeof the swelling cell which should result in radial flow if preferred flow along the former interface occurs During the test the samples is drained in the axial direction ie through the axial filter plates
During stepwise increase of the primary gas pressure the inflow of gas is measured with a flow-meter ie during each pressure step firstly the dead volume before the gas access to the sample is pressurized which results in an inflow-peak If gas pressureequilibrium before and after the flow-meter is reached and the sample behaves nearly gastight the apparent flow rate becomes zero Gas break through ie overcome of the
FORGE Report Dxxx ndash Ver0
27
capillary entry pressure is indicated by quasi-constant gas-in-flow or gas-outflow (ie bubbles in a burette)
Two gas breakthrough tests were performed at initial axial pressures of 2 respectively 4 MPa The results are summarized in Figure 3-5 respectively Figure 3-6
Figure 3-4 Experimental setup for gas-breakthrough measurements under constant sample volume
Figure 3-5 Gas breakthrough test ndash axial stress and gas pressure respectively resulting gas flow vs time Ax ndashinit asymp 2 MPa
FORGE Report Dxxx ndash Ver0
28
After finishing the pre-saturation of the bentonite the samples were axially unloaded and the cells were put into the servo-hydraulic load frame Before the tests a waiting period of ca 1 day (at the nominal axial stress) was usually applied to ensure equilibrium inside the sampleExemplarily Figure 3-5 shows the stability of the axially applied strain control which is in the order of 1 m However this results in a variation of the axial stress of 02 MPa
Then the gas pressure was stepwise increased each with a waiting period of ca 05 hour The change of the gas pressure is always followed by peak of gas-inflow as explained before but becomes zero If a gas pressure state some few bars below the axial stress is reached the gas pressure was kept constant over a period of 12 to 15 hours to exclude time effects of a gas breakthrough ie delay to slow water expulsion Despite some scattering no significant gas in- or outflow was observed
In the next phase the stepwise pressurization was continued If the gas-pressure reaches the acting axial stress ie Ax ndashinit = min some local gas flow becomes apparent but with some instability Further pressure increase did not change the gas flow significant until the breakthrough occurred
1st test Ax ndashinit = min asymp 2 MPa 27 ndash 29 MPa ie 07 ndash 09 MPa higher than min
2nd test Ax ndashinit = min asymp 4 MPa 75 MPa ie 35 MPa higher than min
The tests clearly demonstrate that the gas-entry pressures are significantly higher than min In addition no effect of the interface ie preferred radial gas flow is visible In a first approach the bentonite brick aggregate seems to behave like a homogenous buffer material For further discussion see the next chapter
Figure 3-6 Gas breakthrough test- axial stress and gas pressure respectively resulting gas flow vs time Ax ndashinit asymp 4 MPa The inset shows the central filter plate ( = 9mm) which was installed to ensure no blockage of the fluid inflow to low-permeable bentonite matrix
FORGE Report Dxxx ndash Ver0
29
33 SHEAR STRENGTH (HEALED SPECIMENS)The gas injection tests results delivered very high gas entry pressures which succeeded the minimal stress which has been axially applied by about several MPa (depending on the order of stress) A possible explanation could be that due to the central gas injection locally a high water pressure is generated The local pore fluid pressure may be temporarily preserved during the fast pressurization with gas due to the low permeability of the matrix although the system is drained by the axial filter plates However it becomes obvious that the effect of the former interface as a potential pathway does not exist anymore This may indicate that the interface is healed during the time-dependent swelling process
Healing means the development of cohesion ie which results in bentonite from electrostatic forces among fine particles (clay minerals) and water Shear tests represent a simple way to quantify the amount of cohesion as already demonstrated before Here we used the bentonite brick aggregates after dismantling the sample Visual inspection of the former interface give no hints for a mechanical or hydraulical weakness plane ie only the color contrast indicates the former contact plane
Figure 3-7 Bentonite brickbrick aggregate ndash dismantled sample after controlled saturation by injecting water directly on the interface (compare injection filter plate in Figure 3-6) Note the sharp color contrast at the former interface (total height of the sample 12 cm)
To demonstrate that real healing took place we performed with both specimens direct shear tests on the former interface between both bentonite brick halves The procedure is the same as described in 213
FORGE Report Dxxx ndash Ver0
30
Figure 3-8 Single-step shear test on the healed contact between bentonite brick brick surface The test was realized with σn = 05 MPa
Figure 3-9 Summary of both shear tests on ldquohealedrdquo interfaces between bentonite brick bentonite brick in comparison to the former results summarized in Figure 2-14 ndash MOHR-COULOMB-diagram
FORGE Report Dxxx ndash Ver0
31
The results differ significantly from the shear tests performed on the dry or only short wetted contact planes The following results are obtained from Figure 3-8
bull Shear test curves
Exemplarily the results of the shear test performed at n = 05 MPa are shown As usual for intact material shear stress grows with progressive shear displacement in elastic manner up to a peak and then drops down to a residual value Peak and residual values are higher with applied normal stress Repeating the experiment with the 2nd sample at n = 15 MPa (not shown here) results in a similar shape of the strength curve but the increase of strength is not so significant indicating that the influence of the acting normal stress is low ie the friction angle is only small
bull Dilatancy curves
Due to the surface roughness and asperities a bedding plane tends to dilate upon shear although this effect tends to level off after certain amount of prescribed shear displacement and is lower for higher normal stress (not shown here)
For comparison with earlier measurements on dry interfaces shear stress peaks and residual values of shear stress obtained in both single experiments are represented in Figure 3-9 against normal stress leading to open envelopes of the Coulomb type The evaluation of these tests with σn = 05 resp 15 MPa documents a cohesion of 06 MPa in the τ-σn-diagram Remarkably the angle of friction with ca 10 is much lower than that of tests on dry contacts before healing
4 ConclusionsThe performed lab investigations cover a wide field of hydro-mechanical properties of bentonite bricks which represent a favorable option for constructing sealing plugs in different host rock environments
Based on the experimental results the following conclusions can be drawn
At dry conditions gas flow along interfaces is at least 4 orders higher than through the matrix (eg 10-16 m2) Increase of confinement significantly lowers the gas flow (10 MPa more than one order) but the effect is more pronounced for interfaces crack sealing
Saturation of bentonite brick aggregates ie bricks with a common interface is not affected by the interfaces and only weakly by the acting confining pressure
During gas injection (stepwise increasing of the gas pressure) a significant effect is only observed if the minimal stress is passed resulting in some minor (local) gas flow
The gas break through results in stationary inflow but no significant effect on the total stress is measured probably due to the central (spherical) gas injection (no outflow)
The measured gas threshold pressures under constant volume conditions significantly exceed the sum of the swelling pressure and externally-applied porewater pressure ndashdrained conditions (pi gt ax some MPa)
An important observation is that despite the former interface the bentonite block aggregatebehaves during the saturation of the buffer not different than the homogenous matrix This has been confirmed as well by gas injection tests on the former interface as well by shear tests The
FORGE Report Dxxx ndash Ver0
32
demonstration of the development of cohesion after pre-saturation is a favorable finding because this verifies physical healing of the interface In addition cohesion inside the matrix helps to explain why the measured gas entry pressures are higher than the applied minimal stress
However this observation is only based on two tests which need to be confirmed by the forthcoming experiments Also for understanding the physical background of high entry pressures of gas into the water-saturated bentonite matrix more experimental investigations are of urgent need
5 ReferencesBARTON C A ZOBACK M D amp MOOS D 1995 Fluid flow along potentially active faults in crystalline rock
Geology 23 683ndash686
BLUEMEL M 2000 Improved Procedures for Laboratory Rock Testing EUROCK 2000 ISRM Symposium Aachen 573 ndash 578
BLUEMEL M amp POETSCH M 2003 Direct Shear Testing System International Symposium on GeoTechnical Measurements and Modelling Karlsruhe 327 ndash 331
BUZZI O 2004 Hydromecanique du contact entre geomateriaux Experimentation et modelisation Application au stockage de dechets nucleaires These Universite Joseph Fourier Grenoble France
METCALF R WATSON S P REES J H HUMPHREYS PAUL AND KING F 2008 Gas generation and migration from a deep geological repository for radioactive waste A review of NirexNDArsquos work Technical Report NWAT Environment Agency Penrith Cumbria
NORRIS S 2009 Summary of Gas Generation and Migration Current State-of-the-Art (draft - July 2009) FORGE D12-R
PEACH CJ amp SPIERS CJ 1996 Influence of crystal plastic de-formation on dilatancy and permeability development in synthetic salt rock Tectonophysics 256 101-128
POPP T 2009 State of the art report on gas transport through interfaces FORGE D31-R (WP 33) 48 pp
SITZ P 2003 Entwicklung eines Grundkonzeptes fr langzeitstabile Streckenverschlussbauwerke fr UTD im Salinar Bau und Test eines Versuchsverschlussbauwerkes unter realen Bedingungen (BMBF-gefrdertes FE-Vorhaben Nr 02 C 05472) Abschlubericht TU Bergakademie Freiberg Institut fr Bergbau 2003
FORGE Report Dxxx ndash Ver0
26
Figure 3-3 Summary of the mock-up test Sondershausen Upper sketch the test design The picture below shows the humidity distribution inside the buffer (vertical profile along the dam axis)
32 GAS INJECTION TESTS ndash DETERMINATION OF GAS BREAKTHROUGHFor the gas-injection tests we used a constant volume radial flow geometry realized in the experimental setup depicted in Figure 3-4
Gas flow measurements under constant volume conditions
A servo-controlled load frame (up to 250kN load capacity) ensures defined loading respectively volume conditions The axial strain (measured between the load plates) is kept constant during the test (resolution 1 m) ie if the sample volume increases due to gas-injection the axial force is automatically increased During the test the change of the axial stress is measured via a load cell
Gas injection at constant injection pressure on the at least partial saturated bentonite sample with a radial flow geometry
After finishing the saturation instead of water gas was injected through the central pipeof the swelling cell which should result in radial flow if preferred flow along the former interface occurs During the test the samples is drained in the axial direction ie through the axial filter plates
During stepwise increase of the primary gas pressure the inflow of gas is measured with a flow-meter ie during each pressure step firstly the dead volume before the gas access to the sample is pressurized which results in an inflow-peak If gas pressureequilibrium before and after the flow-meter is reached and the sample behaves nearly gastight the apparent flow rate becomes zero Gas break through ie overcome of the
FORGE Report Dxxx ndash Ver0
27
capillary entry pressure is indicated by quasi-constant gas-in-flow or gas-outflow (ie bubbles in a burette)
Two gas breakthrough tests were performed at initial axial pressures of 2 respectively 4 MPa The results are summarized in Figure 3-5 respectively Figure 3-6
Figure 3-4 Experimental setup for gas-breakthrough measurements under constant sample volume
Figure 3-5 Gas breakthrough test ndash axial stress and gas pressure respectively resulting gas flow vs time Ax ndashinit asymp 2 MPa
FORGE Report Dxxx ndash Ver0
28
After finishing the pre-saturation of the bentonite the samples were axially unloaded and the cells were put into the servo-hydraulic load frame Before the tests a waiting period of ca 1 day (at the nominal axial stress) was usually applied to ensure equilibrium inside the sampleExemplarily Figure 3-5 shows the stability of the axially applied strain control which is in the order of 1 m However this results in a variation of the axial stress of 02 MPa
Then the gas pressure was stepwise increased each with a waiting period of ca 05 hour The change of the gas pressure is always followed by peak of gas-inflow as explained before but becomes zero If a gas pressure state some few bars below the axial stress is reached the gas pressure was kept constant over a period of 12 to 15 hours to exclude time effects of a gas breakthrough ie delay to slow water expulsion Despite some scattering no significant gas in- or outflow was observed
In the next phase the stepwise pressurization was continued If the gas-pressure reaches the acting axial stress ie Ax ndashinit = min some local gas flow becomes apparent but with some instability Further pressure increase did not change the gas flow significant until the breakthrough occurred
1st test Ax ndashinit = min asymp 2 MPa 27 ndash 29 MPa ie 07 ndash 09 MPa higher than min
2nd test Ax ndashinit = min asymp 4 MPa 75 MPa ie 35 MPa higher than min
The tests clearly demonstrate that the gas-entry pressures are significantly higher than min In addition no effect of the interface ie preferred radial gas flow is visible In a first approach the bentonite brick aggregate seems to behave like a homogenous buffer material For further discussion see the next chapter
Figure 3-6 Gas breakthrough test- axial stress and gas pressure respectively resulting gas flow vs time Ax ndashinit asymp 4 MPa The inset shows the central filter plate ( = 9mm) which was installed to ensure no blockage of the fluid inflow to low-permeable bentonite matrix
FORGE Report Dxxx ndash Ver0
29
33 SHEAR STRENGTH (HEALED SPECIMENS)The gas injection tests results delivered very high gas entry pressures which succeeded the minimal stress which has been axially applied by about several MPa (depending on the order of stress) A possible explanation could be that due to the central gas injection locally a high water pressure is generated The local pore fluid pressure may be temporarily preserved during the fast pressurization with gas due to the low permeability of the matrix although the system is drained by the axial filter plates However it becomes obvious that the effect of the former interface as a potential pathway does not exist anymore This may indicate that the interface is healed during the time-dependent swelling process
Healing means the development of cohesion ie which results in bentonite from electrostatic forces among fine particles (clay minerals) and water Shear tests represent a simple way to quantify the amount of cohesion as already demonstrated before Here we used the bentonite brick aggregates after dismantling the sample Visual inspection of the former interface give no hints for a mechanical or hydraulical weakness plane ie only the color contrast indicates the former contact plane
Figure 3-7 Bentonite brickbrick aggregate ndash dismantled sample after controlled saturation by injecting water directly on the interface (compare injection filter plate in Figure 3-6) Note the sharp color contrast at the former interface (total height of the sample 12 cm)
To demonstrate that real healing took place we performed with both specimens direct shear tests on the former interface between both bentonite brick halves The procedure is the same as described in 213
FORGE Report Dxxx ndash Ver0
30
Figure 3-8 Single-step shear test on the healed contact between bentonite brick brick surface The test was realized with σn = 05 MPa
Figure 3-9 Summary of both shear tests on ldquohealedrdquo interfaces between bentonite brick bentonite brick in comparison to the former results summarized in Figure 2-14 ndash MOHR-COULOMB-diagram
FORGE Report Dxxx ndash Ver0
31
The results differ significantly from the shear tests performed on the dry or only short wetted contact planes The following results are obtained from Figure 3-8
bull Shear test curves
Exemplarily the results of the shear test performed at n = 05 MPa are shown As usual for intact material shear stress grows with progressive shear displacement in elastic manner up to a peak and then drops down to a residual value Peak and residual values are higher with applied normal stress Repeating the experiment with the 2nd sample at n = 15 MPa (not shown here) results in a similar shape of the strength curve but the increase of strength is not so significant indicating that the influence of the acting normal stress is low ie the friction angle is only small
bull Dilatancy curves
Due to the surface roughness and asperities a bedding plane tends to dilate upon shear although this effect tends to level off after certain amount of prescribed shear displacement and is lower for higher normal stress (not shown here)
For comparison with earlier measurements on dry interfaces shear stress peaks and residual values of shear stress obtained in both single experiments are represented in Figure 3-9 against normal stress leading to open envelopes of the Coulomb type The evaluation of these tests with σn = 05 resp 15 MPa documents a cohesion of 06 MPa in the τ-σn-diagram Remarkably the angle of friction with ca 10 is much lower than that of tests on dry contacts before healing
4 ConclusionsThe performed lab investigations cover a wide field of hydro-mechanical properties of bentonite bricks which represent a favorable option for constructing sealing plugs in different host rock environments
Based on the experimental results the following conclusions can be drawn
At dry conditions gas flow along interfaces is at least 4 orders higher than through the matrix (eg 10-16 m2) Increase of confinement significantly lowers the gas flow (10 MPa more than one order) but the effect is more pronounced for interfaces crack sealing
Saturation of bentonite brick aggregates ie bricks with a common interface is not affected by the interfaces and only weakly by the acting confining pressure
During gas injection (stepwise increasing of the gas pressure) a significant effect is only observed if the minimal stress is passed resulting in some minor (local) gas flow
The gas break through results in stationary inflow but no significant effect on the total stress is measured probably due to the central (spherical) gas injection (no outflow)
The measured gas threshold pressures under constant volume conditions significantly exceed the sum of the swelling pressure and externally-applied porewater pressure ndashdrained conditions (pi gt ax some MPa)
An important observation is that despite the former interface the bentonite block aggregatebehaves during the saturation of the buffer not different than the homogenous matrix This has been confirmed as well by gas injection tests on the former interface as well by shear tests The
FORGE Report Dxxx ndash Ver0
32
demonstration of the development of cohesion after pre-saturation is a favorable finding because this verifies physical healing of the interface In addition cohesion inside the matrix helps to explain why the measured gas entry pressures are higher than the applied minimal stress
However this observation is only based on two tests which need to be confirmed by the forthcoming experiments Also for understanding the physical background of high entry pressures of gas into the water-saturated bentonite matrix more experimental investigations are of urgent need
5 ReferencesBARTON C A ZOBACK M D amp MOOS D 1995 Fluid flow along potentially active faults in crystalline rock
Geology 23 683ndash686
BLUEMEL M 2000 Improved Procedures for Laboratory Rock Testing EUROCK 2000 ISRM Symposium Aachen 573 ndash 578
BLUEMEL M amp POETSCH M 2003 Direct Shear Testing System International Symposium on GeoTechnical Measurements and Modelling Karlsruhe 327 ndash 331
BUZZI O 2004 Hydromecanique du contact entre geomateriaux Experimentation et modelisation Application au stockage de dechets nucleaires These Universite Joseph Fourier Grenoble France
METCALF R WATSON S P REES J H HUMPHREYS PAUL AND KING F 2008 Gas generation and migration from a deep geological repository for radioactive waste A review of NirexNDArsquos work Technical Report NWAT Environment Agency Penrith Cumbria
NORRIS S 2009 Summary of Gas Generation and Migration Current State-of-the-Art (draft - July 2009) FORGE D12-R
PEACH CJ amp SPIERS CJ 1996 Influence of crystal plastic de-formation on dilatancy and permeability development in synthetic salt rock Tectonophysics 256 101-128
POPP T 2009 State of the art report on gas transport through interfaces FORGE D31-R (WP 33) 48 pp
SITZ P 2003 Entwicklung eines Grundkonzeptes fr langzeitstabile Streckenverschlussbauwerke fr UTD im Salinar Bau und Test eines Versuchsverschlussbauwerkes unter realen Bedingungen (BMBF-gefrdertes FE-Vorhaben Nr 02 C 05472) Abschlubericht TU Bergakademie Freiberg Institut fr Bergbau 2003

FORGE Report Dxxx ndash Ver0
29
33 SHEAR STRENGTH (HEALED SPECIMENS)The gas injection tests results delivered very high gas entry pressures which succeeded the minimal stress which has been axially applied by about several MPa (depending on the order of stress) A possible explanation could be that due to the central gas injection locally a high water pressure is generated The local pore fluid pressure may be temporarily preserved during the fast pressurization with gas due to the low permeability of the matrix although the system is drained by the axial filter plates However it becomes obvious that the effect of the former interface as a potential pathway does not exist anymore This may indicate that the interface is healed during the time-dependent swelling process
Healing means the development of cohesion ie which results in bentonite from electrostatic forces among fine particles (clay minerals) and water Shear tests represent a simple way to quantify the amount of cohesion as already demonstrated before Here we used the bentonite brick aggregates after dismantling the sample Visual inspection of the former interface give no hints for a mechanical or hydraulical weakness plane ie only the color contrast indicates the former contact plane
Figure 3-7 Bentonite brickbrick aggregate ndash dismantled sample after controlled saturation by injecting water directly on the interface (compare injection filter plate in Figure 3-6) Note the sharp color contrast at the former interface (total height of the sample 12 cm)
To demonstrate that real healing took place we performed with both specimens direct shear tests on the former interface between both bentonite brick halves The procedure is the same as described in 213
FORGE Report Dxxx ndash Ver0
30
Figure 3-8 Single-step shear test on the healed contact between bentonite brick brick surface The test was realized with σn = 05 MPa
Figure 3-9 Summary of both shear tests on ldquohealedrdquo interfaces between bentonite brick bentonite brick in comparison to the former results summarized in Figure 2-14 ndash MOHR-COULOMB-diagram
FORGE Report Dxxx ndash Ver0
31
The results differ significantly from the shear tests performed on the dry or only short wetted contact planes The following results are obtained from Figure 3-8
bull Shear test curves
Exemplarily the results of the shear test performed at n = 05 MPa are shown As usual for intact material shear stress grows with progressive shear displacement in elastic manner up to a peak and then drops down to a residual value Peak and residual values are higher with applied normal stress Repeating the experiment with the 2nd sample at n = 15 MPa (not shown here) results in a similar shape of the strength curve but the increase of strength is not so significant indicating that the influence of the acting normal stress is low ie the friction angle is only small
bull Dilatancy curves
Due to the surface roughness and asperities a bedding plane tends to dilate upon shear although this effect tends to level off after certain amount of prescribed shear displacement and is lower for higher normal stress (not shown here)
For comparison with earlier measurements on dry interfaces shear stress peaks and residual values of shear stress obtained in both single experiments are represented in Figure 3-9 against normal stress leading to open envelopes of the Coulomb type The evaluation of these tests with σn = 05 resp 15 MPa documents a cohesion of 06 MPa in the τ-σn-diagram Remarkably the angle of friction with ca 10 is much lower than that of tests on dry contacts before healing
4 ConclusionsThe performed lab investigations cover a wide field of hydro-mechanical properties of bentonite bricks which represent a favorable option for constructing sealing plugs in different host rock environments
Based on the experimental results the following conclusions can be drawn
At dry conditions gas flow along interfaces is at least 4 orders higher than through the matrix (eg 10-16 m2) Increase of confinement significantly lowers the gas flow (10 MPa more than one order) but the effect is more pronounced for interfaces crack sealing
Saturation of bentonite brick aggregates ie bricks with a common interface is not affected by the interfaces and only weakly by the acting confining pressure
During gas injection (stepwise increasing of the gas pressure) a significant effect is only observed if the minimal stress is passed resulting in some minor (local) gas flow
The gas break through results in stationary inflow but no significant effect on the total stress is measured probably due to the central (spherical) gas injection (no outflow)
The measured gas threshold pressures under constant volume conditions significantly exceed the sum of the swelling pressure and externally-applied porewater pressure ndashdrained conditions (pi gt ax some MPa)
An important observation is that despite the former interface the bentonite block aggregatebehaves during the saturation of the buffer not different than the homogenous matrix This has been confirmed as well by gas injection tests on the former interface as well by shear tests The
FORGE Report Dxxx ndash Ver0
32
demonstration of the development of cohesion after pre-saturation is a favorable finding because this verifies physical healing of the interface In addition cohesion inside the matrix helps to explain why the measured gas entry pressures are higher than the applied minimal stress
However this observation is only based on two tests which need to be confirmed by the forthcoming experiments Also for understanding the physical background of high entry pressures of gas into the water-saturated bentonite matrix more experimental investigations are of urgent need
5 ReferencesBARTON C A ZOBACK M D amp MOOS D 1995 Fluid flow along potentially active faults in crystalline rock
Geology 23 683ndash686
BLUEMEL M 2000 Improved Procedures for Laboratory Rock Testing EUROCK 2000 ISRM Symposium Aachen 573 ndash 578
BLUEMEL M amp POETSCH M 2003 Direct Shear Testing System International Symposium on GeoTechnical Measurements and Modelling Karlsruhe 327 ndash 331
BUZZI O 2004 Hydromecanique du contact entre geomateriaux Experimentation et modelisation Application au stockage de dechets nucleaires These Universite Joseph Fourier Grenoble France
METCALF R WATSON S P REES J H HUMPHREYS PAUL AND KING F 2008 Gas generation and migration from a deep geological repository for radioactive waste A review of NirexNDArsquos work Technical Report NWAT Environment Agency Penrith Cumbria
NORRIS S 2009 Summary of Gas Generation and Migration Current State-of-the-Art (draft - July 2009) FORGE D12-R
PEACH CJ amp SPIERS CJ 1996 Influence of crystal plastic de-formation on dilatancy and permeability development in synthetic salt rock Tectonophysics 256 101-128
POPP T 2009 State of the art report on gas transport through interfaces FORGE D31-R (WP 33) 48 pp
SITZ P 2003 Entwicklung eines Grundkonzeptes fr langzeitstabile Streckenverschlussbauwerke fr UTD im Salinar Bau und Test eines Versuchsverschlussbauwerkes unter realen Bedingungen (BMBF-gefrdertes FE-Vorhaben Nr 02 C 05472) Abschlubericht TU Bergakademie Freiberg Institut fr Bergbau 2003
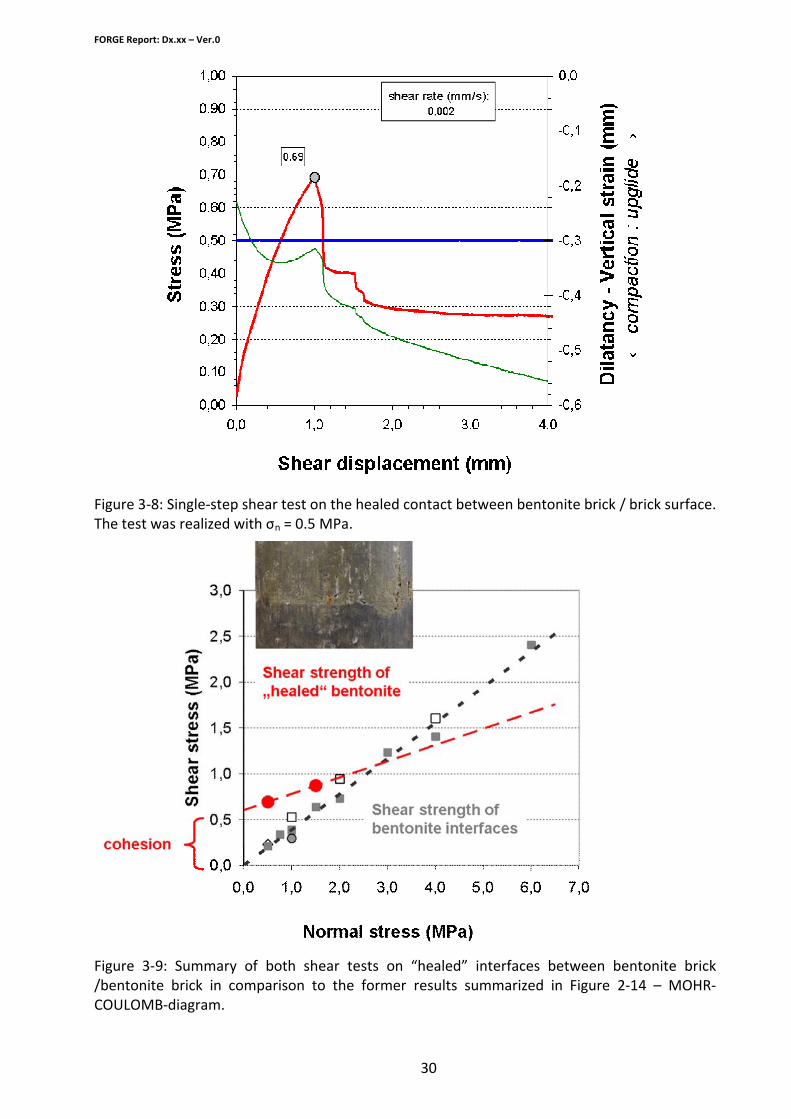
FORGE Report Dxxx ndash Ver0
30
Figure 3-8 Single-step shear test on the healed contact between bentonite brick brick surface The test was realized with σn = 05 MPa
Figure 3-9 Summary of both shear tests on ldquohealedrdquo interfaces between bentonite brick bentonite brick in comparison to the former results summarized in Figure 2-14 ndash MOHR-COULOMB-diagram
FORGE Report Dxxx ndash Ver0
31
The results differ significantly from the shear tests performed on the dry or only short wetted contact planes The following results are obtained from Figure 3-8
bull Shear test curves
Exemplarily the results of the shear test performed at n = 05 MPa are shown As usual for intact material shear stress grows with progressive shear displacement in elastic manner up to a peak and then drops down to a residual value Peak and residual values are higher with applied normal stress Repeating the experiment with the 2nd sample at n = 15 MPa (not shown here) results in a similar shape of the strength curve but the increase of strength is not so significant indicating that the influence of the acting normal stress is low ie the friction angle is only small
bull Dilatancy curves
Due to the surface roughness and asperities a bedding plane tends to dilate upon shear although this effect tends to level off after certain amount of prescribed shear displacement and is lower for higher normal stress (not shown here)
For comparison with earlier measurements on dry interfaces shear stress peaks and residual values of shear stress obtained in both single experiments are represented in Figure 3-9 against normal stress leading to open envelopes of the Coulomb type The evaluation of these tests with σn = 05 resp 15 MPa documents a cohesion of 06 MPa in the τ-σn-diagram Remarkably the angle of friction with ca 10 is much lower than that of tests on dry contacts before healing
4 ConclusionsThe performed lab investigations cover a wide field of hydro-mechanical properties of bentonite bricks which represent a favorable option for constructing sealing plugs in different host rock environments
Based on the experimental results the following conclusions can be drawn
At dry conditions gas flow along interfaces is at least 4 orders higher than through the matrix (eg 10-16 m2) Increase of confinement significantly lowers the gas flow (10 MPa more than one order) but the effect is more pronounced for interfaces crack sealing
Saturation of bentonite brick aggregates ie bricks with a common interface is not affected by the interfaces and only weakly by the acting confining pressure
During gas injection (stepwise increasing of the gas pressure) a significant effect is only observed if the minimal stress is passed resulting in some minor (local) gas flow
The gas break through results in stationary inflow but no significant effect on the total stress is measured probably due to the central (spherical) gas injection (no outflow)
The measured gas threshold pressures under constant volume conditions significantly exceed the sum of the swelling pressure and externally-applied porewater pressure ndashdrained conditions (pi gt ax some MPa)
An important observation is that despite the former interface the bentonite block aggregatebehaves during the saturation of the buffer not different than the homogenous matrix This has been confirmed as well by gas injection tests on the former interface as well by shear tests The
FORGE Report Dxxx ndash Ver0
32
demonstration of the development of cohesion after pre-saturation is a favorable finding because this verifies physical healing of the interface In addition cohesion inside the matrix helps to explain why the measured gas entry pressures are higher than the applied minimal stress
However this observation is only based on two tests which need to be confirmed by the forthcoming experiments Also for understanding the physical background of high entry pressures of gas into the water-saturated bentonite matrix more experimental investigations are of urgent need
5 ReferencesBARTON C A ZOBACK M D amp MOOS D 1995 Fluid flow along potentially active faults in crystalline rock
Geology 23 683ndash686
BLUEMEL M 2000 Improved Procedures for Laboratory Rock Testing EUROCK 2000 ISRM Symposium Aachen 573 ndash 578
BLUEMEL M amp POETSCH M 2003 Direct Shear Testing System International Symposium on GeoTechnical Measurements and Modelling Karlsruhe 327 ndash 331
BUZZI O 2004 Hydromecanique du contact entre geomateriaux Experimentation et modelisation Application au stockage de dechets nucleaires These Universite Joseph Fourier Grenoble France
METCALF R WATSON S P REES J H HUMPHREYS PAUL AND KING F 2008 Gas generation and migration from a deep geological repository for radioactive waste A review of NirexNDArsquos work Technical Report NWAT Environment Agency Penrith Cumbria
NORRIS S 2009 Summary of Gas Generation and Migration Current State-of-the-Art (draft - July 2009) FORGE D12-R
PEACH CJ amp SPIERS CJ 1996 Influence of crystal plastic de-formation on dilatancy and permeability development in synthetic salt rock Tectonophysics 256 101-128
POPP T 2009 State of the art report on gas transport through interfaces FORGE D31-R (WP 33) 48 pp
SITZ P 2003 Entwicklung eines Grundkonzeptes fr langzeitstabile Streckenverschlussbauwerke fr UTD im Salinar Bau und Test eines Versuchsverschlussbauwerkes unter realen Bedingungen (BMBF-gefrdertes FE-Vorhaben Nr 02 C 05472) Abschlubericht TU Bergakademie Freiberg Institut fr Bergbau 2003
FORGE Report Dxxx ndash Ver0
32
demonstration of the development of cohesion after pre-saturation is a favorable finding because this verifies physical healing of the interface In addition cohesion inside the matrix helps to explain why the measured gas entry pressures are higher than the applied minimal stress
However this observation is only based on two tests which need to be confirmed by the forthcoming experiments Also for understanding the physical background of high entry pressures of gas into the water-saturated bentonite matrix more experimental investigations are of urgent need
5 ReferencesBARTON C A ZOBACK M D amp MOOS D 1995 Fluid flow along potentially active faults in crystalline rock
Geology 23 683ndash686
BLUEMEL M 2000 Improved Procedures for Laboratory Rock Testing EUROCK 2000 ISRM Symposium Aachen 573 ndash 578
BLUEMEL M amp POETSCH M 2003 Direct Shear Testing System International Symposium on GeoTechnical Measurements and Modelling Karlsruhe 327 ndash 331
BUZZI O 2004 Hydromecanique du contact entre geomateriaux Experimentation et modelisation Application au stockage de dechets nucleaires These Universite Joseph Fourier Grenoble France
METCALF R WATSON S P REES J H HUMPHREYS PAUL AND KING F 2008 Gas generation and migration from a deep geological repository for radioactive waste A review of NirexNDArsquos work Technical Report NWAT Environment Agency Penrith Cumbria
NORRIS S 2009 Summary of Gas Generation and Migration Current State-of-the-Art (draft - July 2009) FORGE D12-R
PEACH CJ amp SPIERS CJ 1996 Influence of crystal plastic de-formation on dilatancy and permeability development in synthetic salt rock Tectonophysics 256 101-128
POPP T 2009 State of the art report on gas transport through interfaces FORGE D31-R (WP 33) 48 pp
SITZ P 2003 Entwicklung eines Grundkonzeptes fr langzeitstabile Streckenverschlussbauwerke fr UTD im Salinar Bau und Test eines Versuchsverschlussbauwerkes unter realen Bedingungen (BMBF-gefrdertes FE-Vorhaben Nr 02 C 05472) Abschlubericht TU Bergakademie Freiberg Institut fr Bergbau 2003