Embed Size (px)
Citation preview
Airflow for dryingResistance to airflow
Resistance of grain to airflowPressure drop due to:Energy loss due to friction & turbulenceTo overcome this: 1. High pressure at inlet plenum chamber2. Create a vacuum at the exit
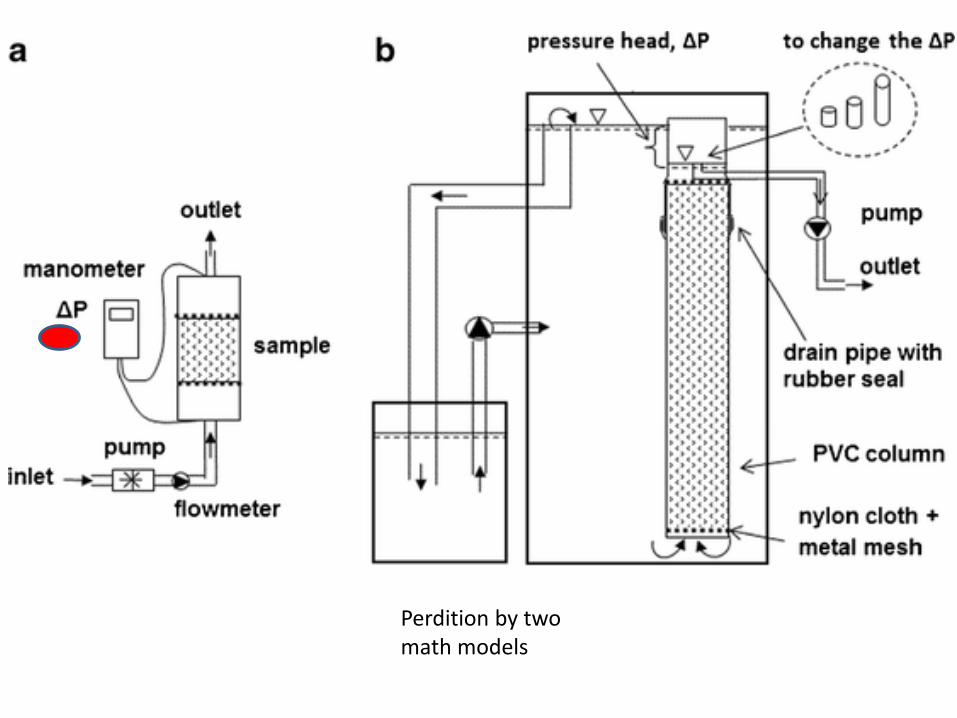
Perdition by two math models
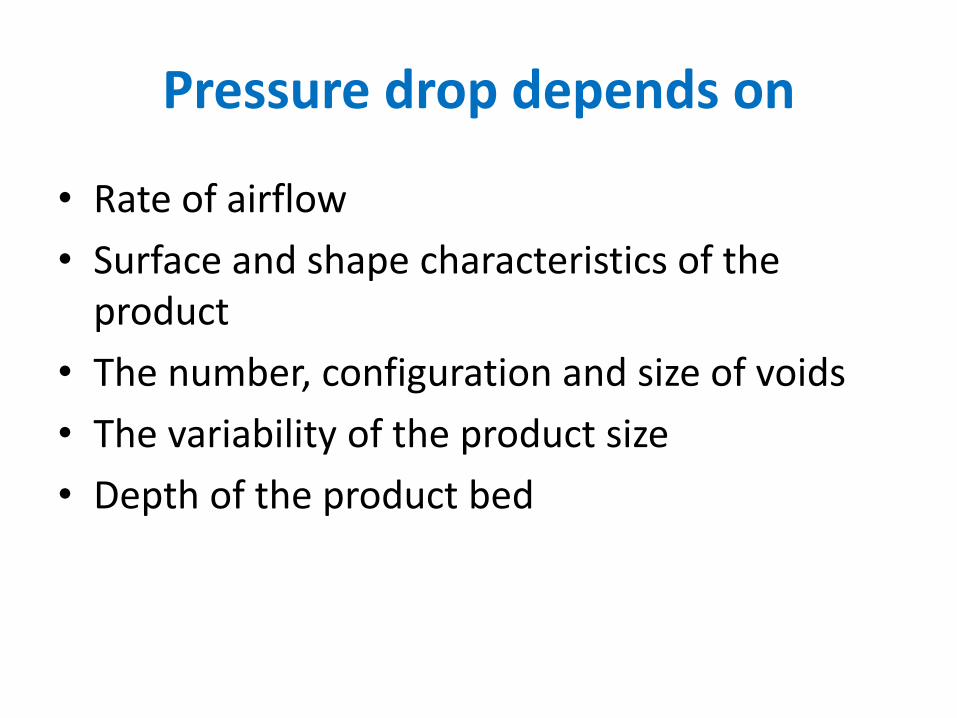
Pressure drop depends on
• Rate of airflow
• Surface and shape characteristics of the product
• The number, configuration and size of voids
• The variability of the product size
• Depth of the product bed
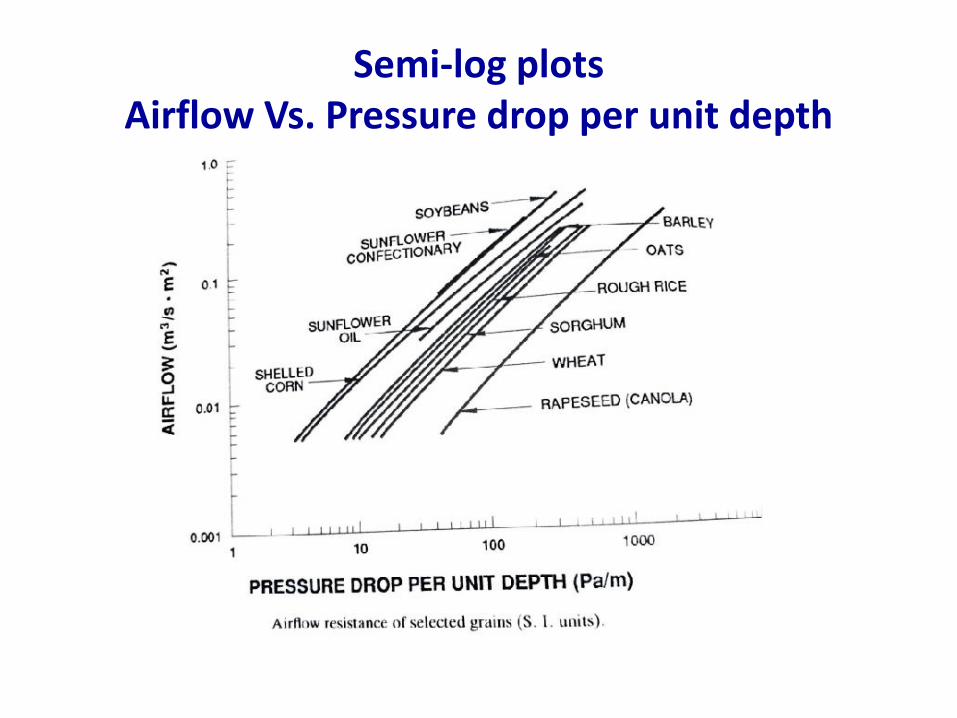
Semi-log plotsAirflow Vs. Pressure drop per unit depth
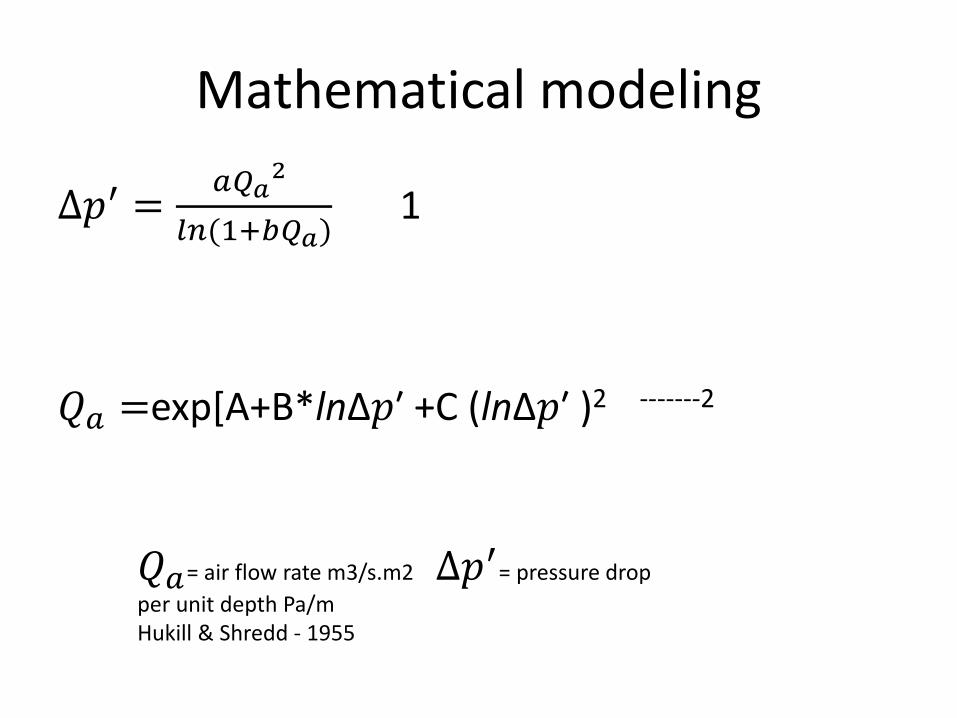
Mathematical modeling
∆𝑝′ =𝑎𝑄𝑎
2
𝑙𝑛(1+𝑏𝑄𝑎)1
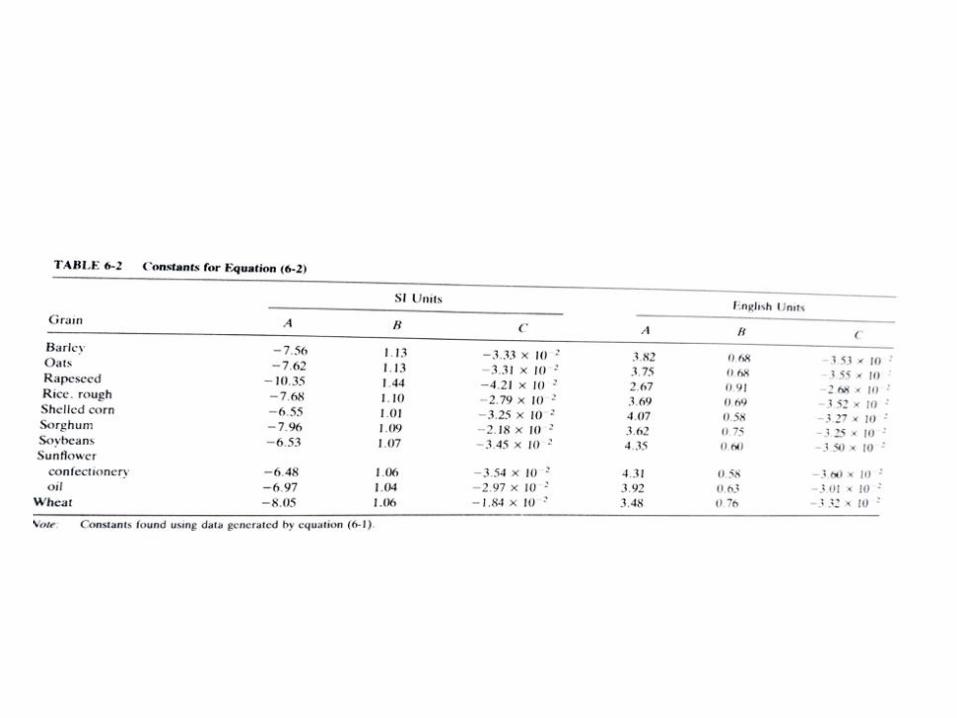
𝑄𝑎 =exp[A+B*ln∆𝑝′ +C (ln∆𝑝′ )2 -------2
𝑄𝑎= air flow rate m3/s.m2 ∆𝑝′= pressure drop
per unit depth Pa/mHukill & Shredd - 1955
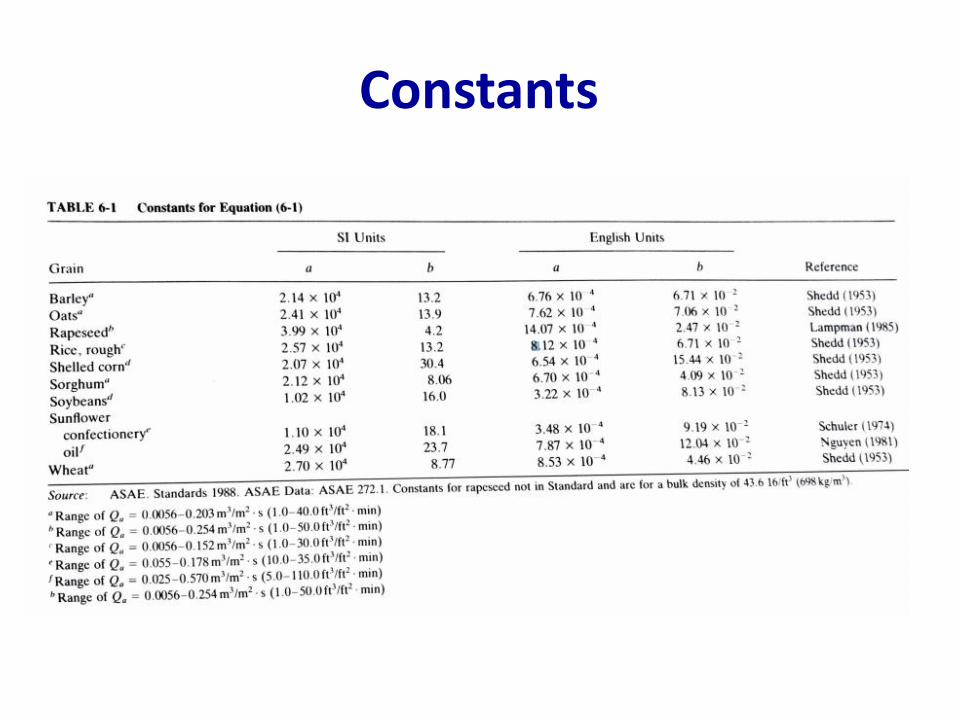
Constants
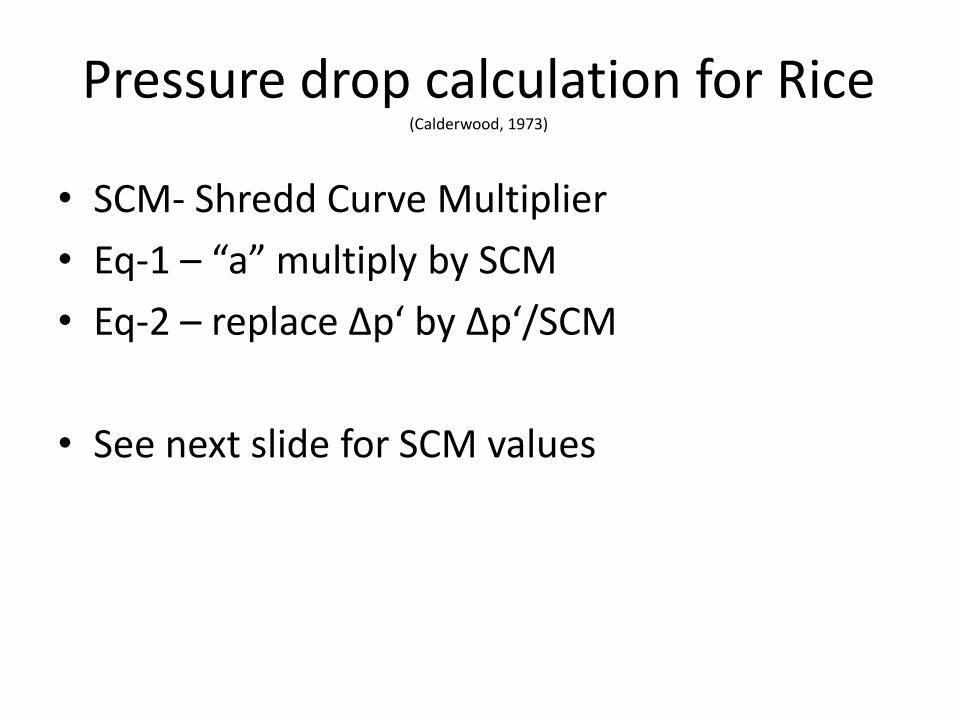
Pressure drop calculation for Rice(Calderwood, 1973)
• SCM- Shredd Curve Multiplier
• Eq-1 – “a” multiply by SCM
• Eq-2 – replace Δp‘ by Δp‘/SCM
• See next slide for SCM values
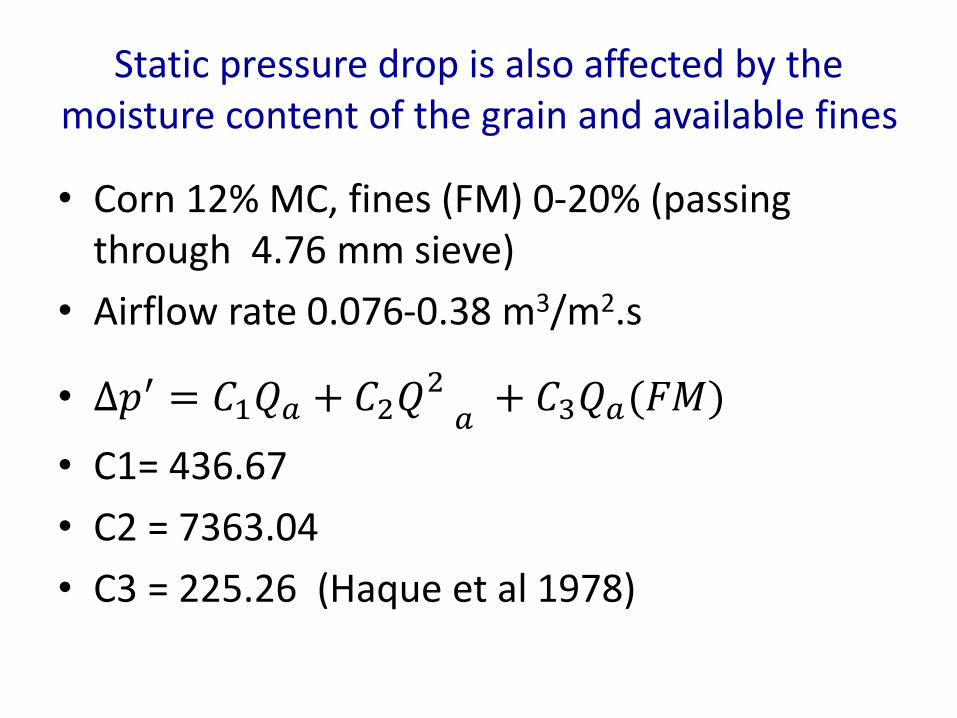
Static pressure drop is also affected by the moisture content of the grain and available fines
• Corn 12% MC, fines (FM) 0-20% (passing through 4.76 mm sieve)
• Airflow rate 0.076-0.38 m3/m2.s
• ∆𝑝′ = 𝐶1𝑄𝑎 + 𝐶2𝑄2𝑎+ 𝐶3𝑄𝑎(𝐹𝑀)
• C1= 436.67
• C2 = 7363.04
• C3 = 225.26 (Haque et al 1978)
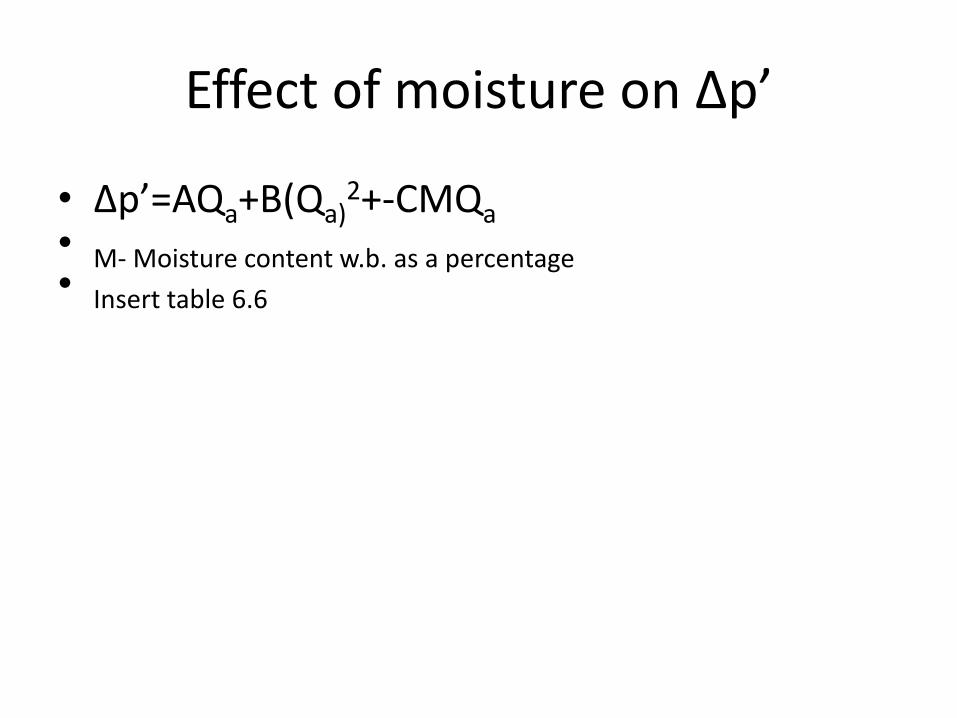
Effect of moisture on Δp’
• Δp’=AQa+B(Qa)2+-CMQa
• M- Moisture content w.b. as a percentage• Insert table 6.6
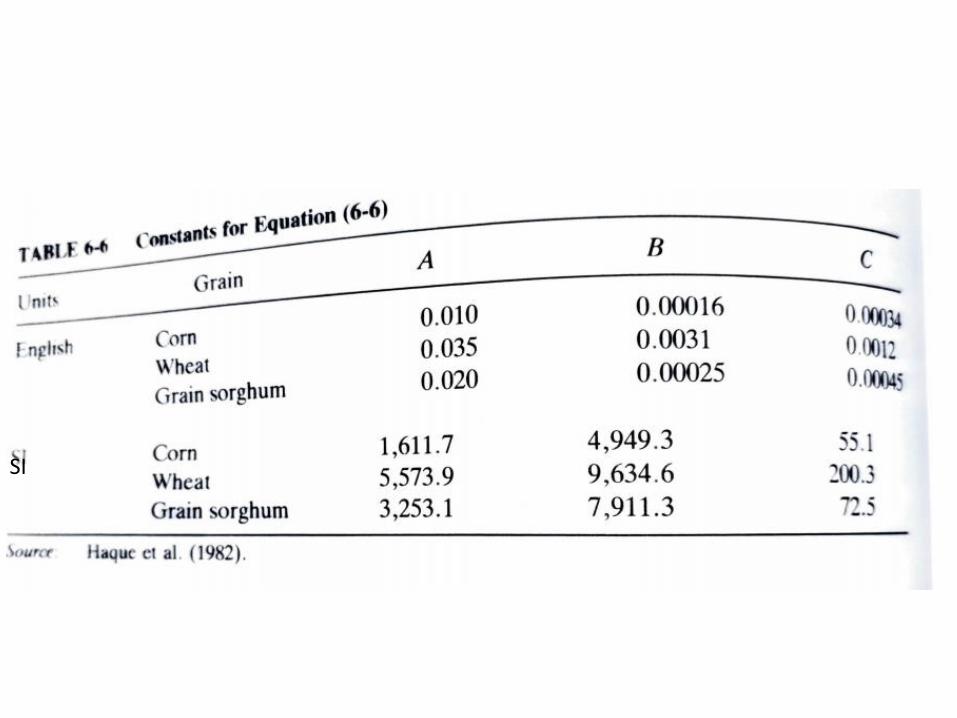
SI
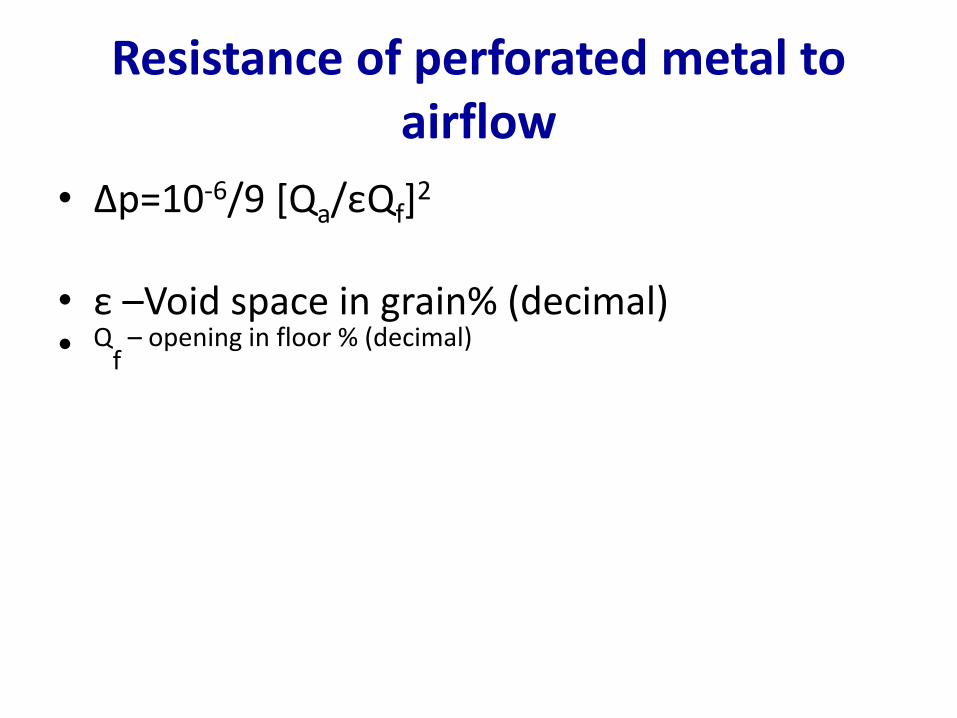
Resistance of perforated metal to airflow
• Δp=10-6/9 [Qa/εQf]2
• ε –Void space in grain% (decimal)• Q
f– opening in floor % (decimal)
Pressure losses in ducts
• Pressure loss is due to :
• 1. Friction
• 2.restriction to air (Fittings)
• 3.Change in direction
• 4. Enlargement or contraction of crossectional area
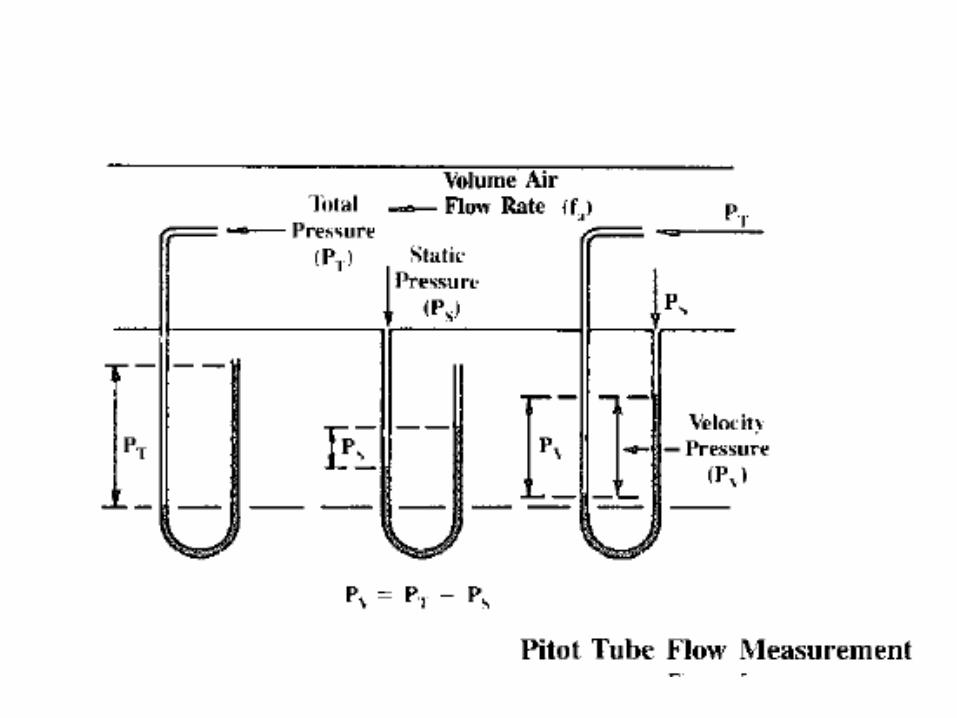
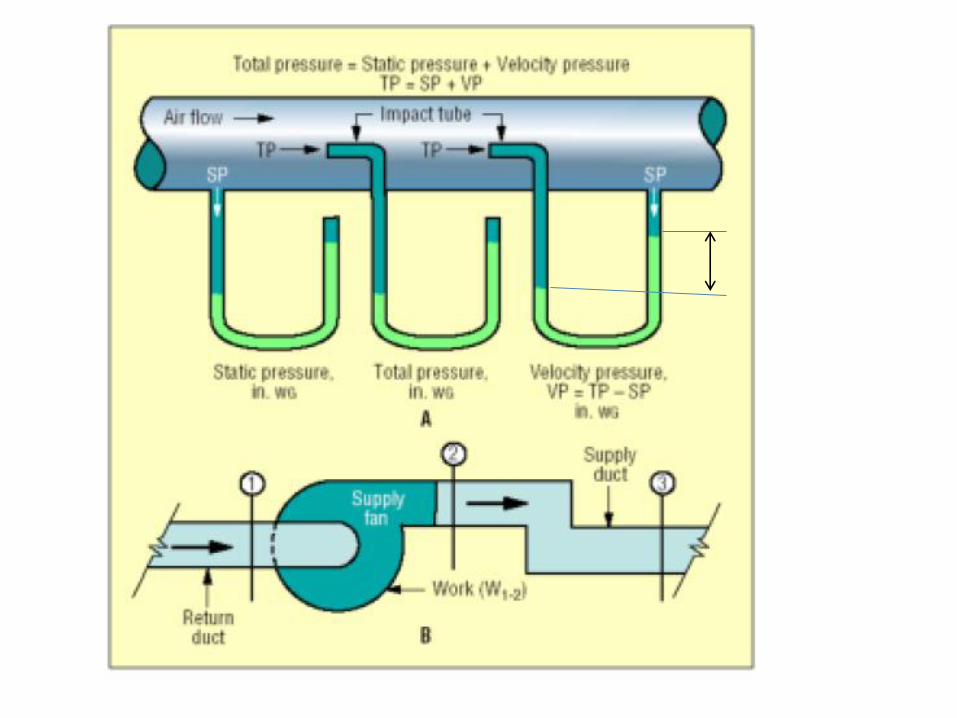
• Total pressure at any point of a duct = static pressure + Velocity pressure
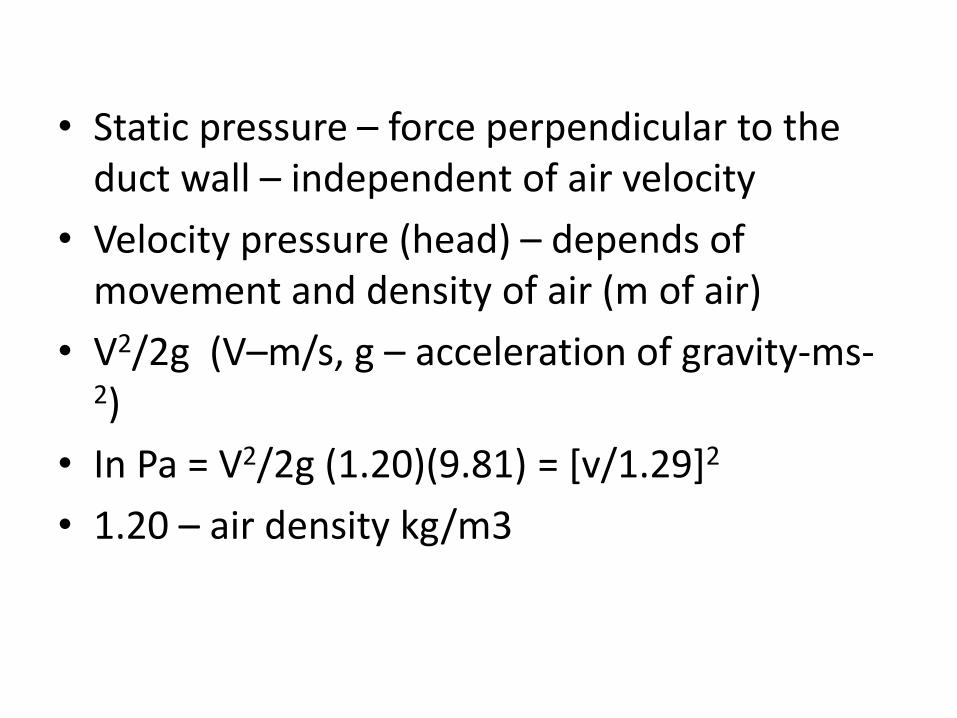
• Static pressure – force perpendicular to the duct wall – independent of air velocity
• Velocity pressure (head) – depends of movement and density of air (m of air)
• V2/2g (V–m/s, g – acceleration of gravity-ms-2)
• In Pa = V2/2g (1.20)(9.81) = [v/1.29]2
• 1.20 – air density kg/m3
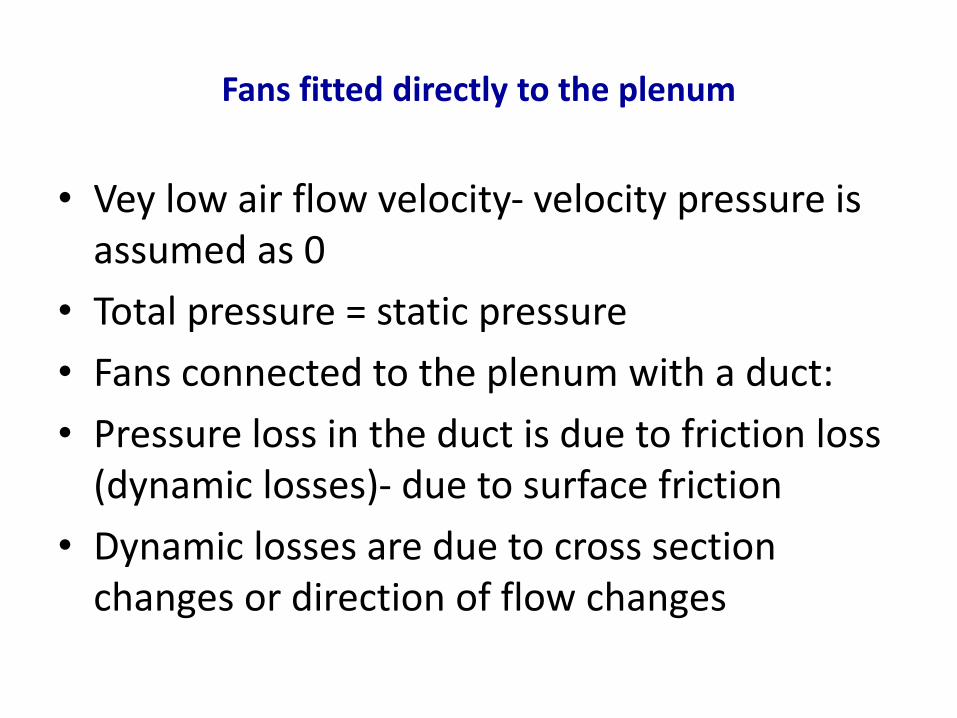
Fans fitted directly to the plenum
• Vey low air flow velocity- velocity pressure is assumed as 0
• Total pressure = static pressure
• Fans connected to the plenum with a duct:
• Pressure loss in the duct is due to friction loss (dynamic losses)- due to surface friction
• Dynamic losses are due to cross section changes or direction of flow changes
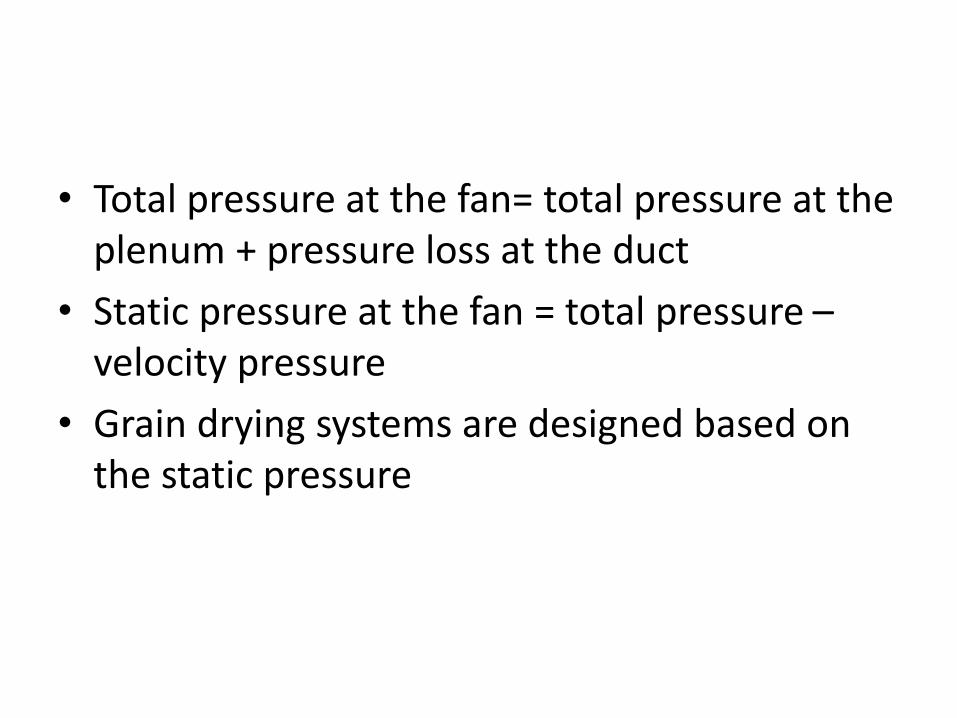
• Total pressure at the fan= total pressure at the plenum + pressure loss at the duct
• Static pressure at the fan = total pressure –velocity pressure
• Grain drying systems are designed based on the static pressure

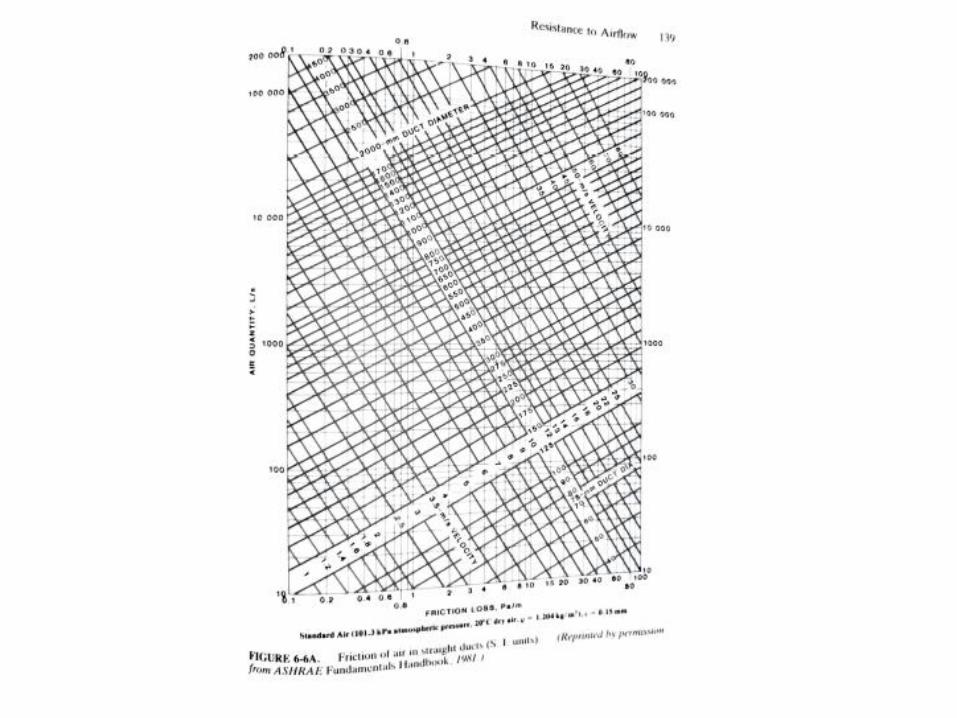
Pressure loss – straight ducts
• Eg. Temperature range 9-31 oC
• Insert 6-6A friction loss chart
• Different diameters & flow rates
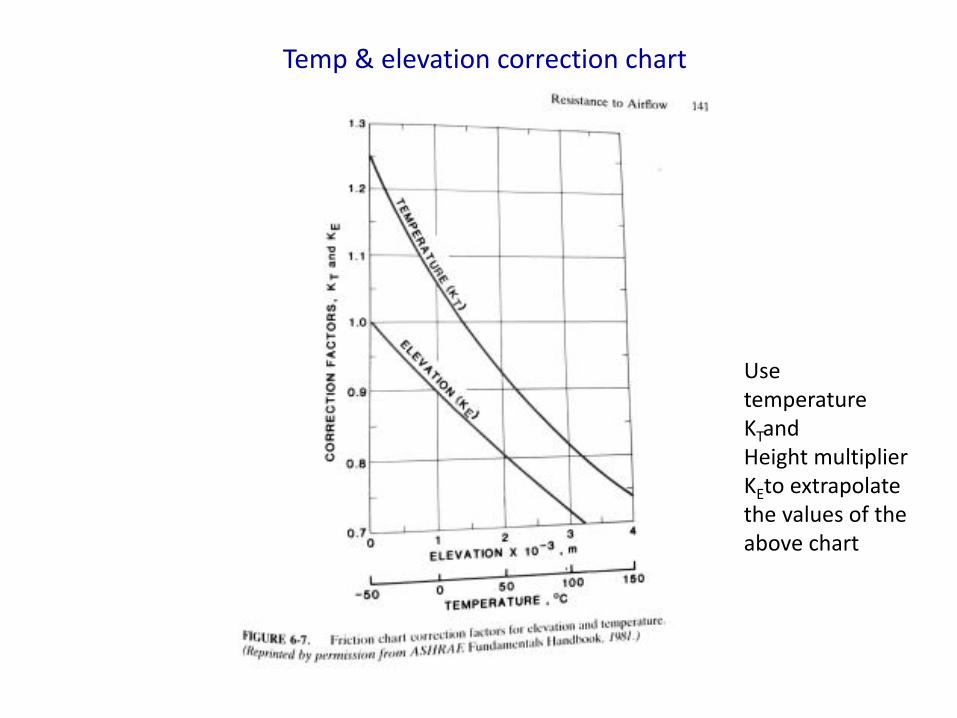
Temp & elevation correction chart
Use temperature KTandHeight multiplier KEto extrapolate the values of the above chart
Pressure losses in Elbows
• Pressure loss in Elbow
• ΔpT= C(V/1.29)2
• C- pressure loss coefficient
• Or use table values by the supplier
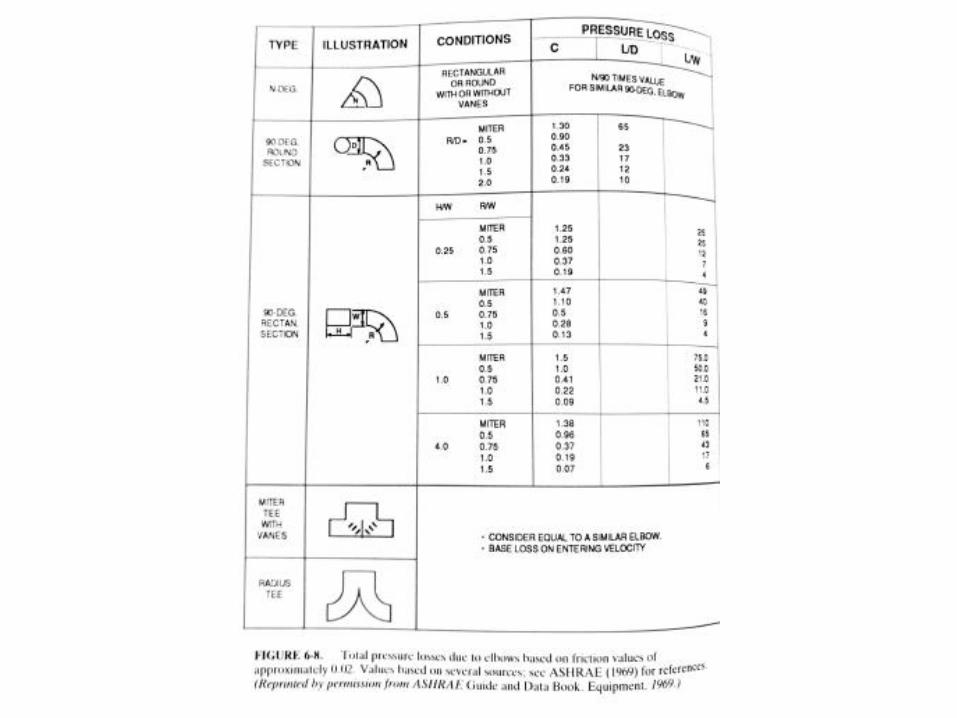
• Insert table 6-8
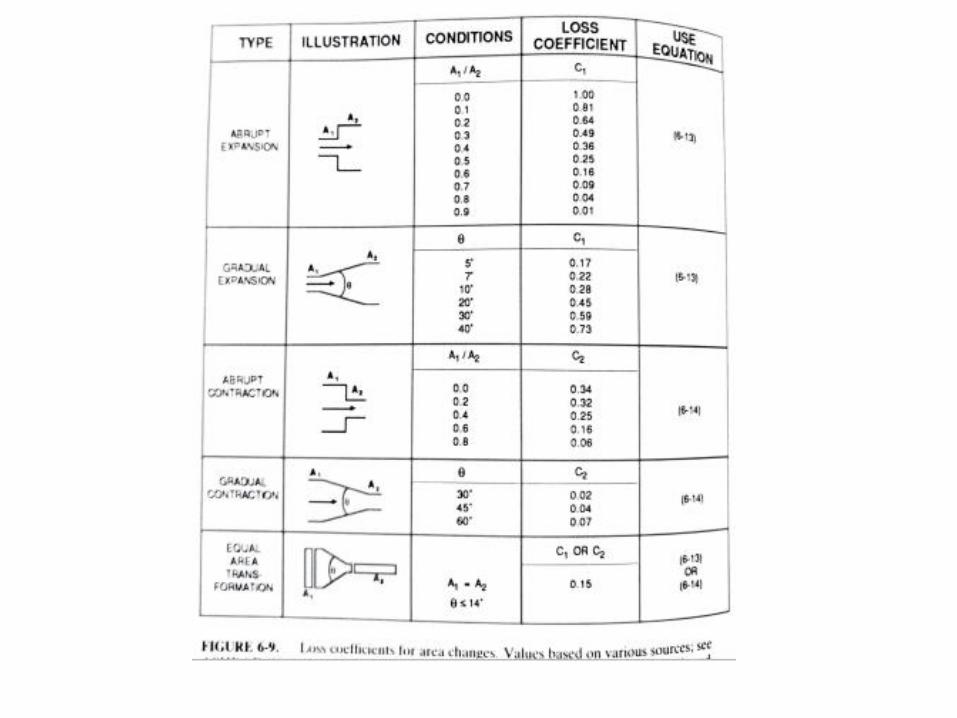
Changers in cross sectional area
• Change may be abrupt or gradual (empirical equations)
• Expansion of Area
• ΔpT= C1(V1/1.29)2
• Area reduction
• ΔpT= C2(V2/1.29)2
• Insert fig 6-8
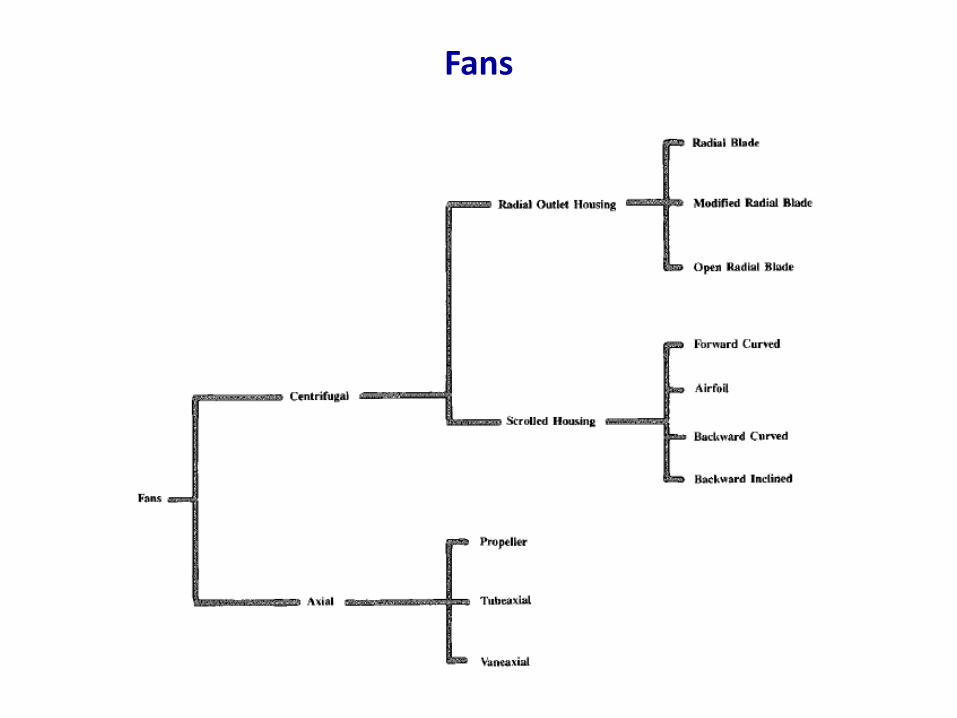
Fans
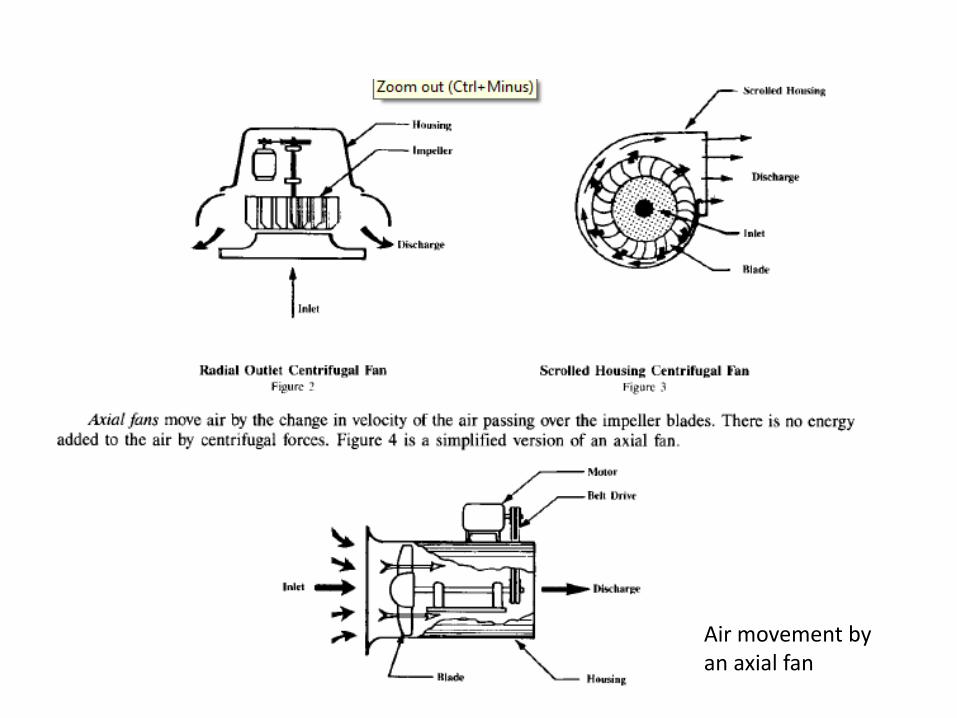
Air movement by an axial fan
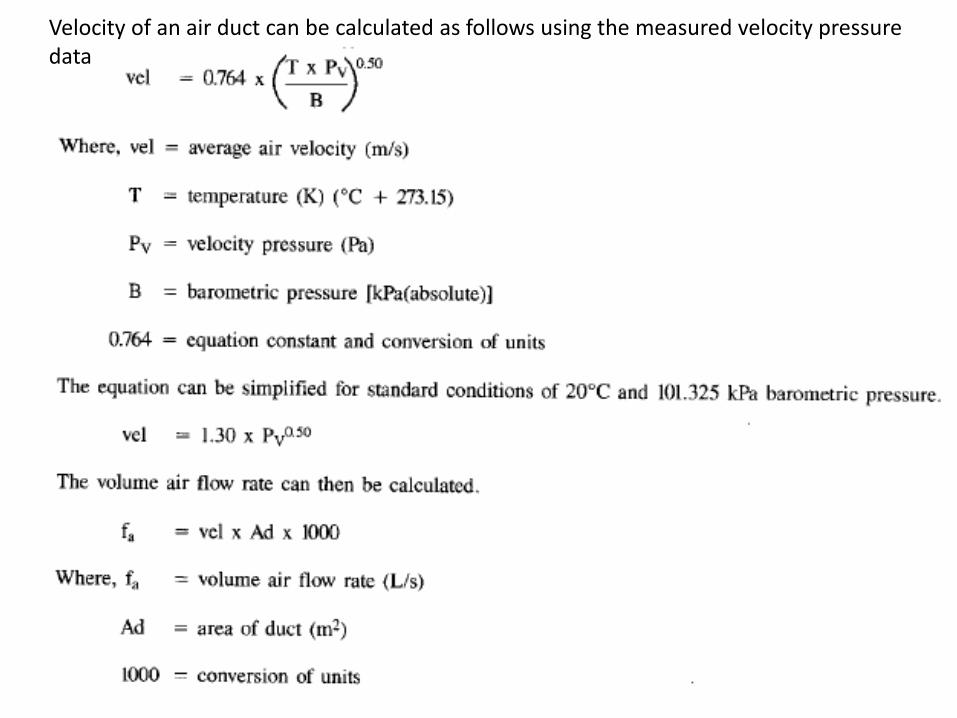
Velocity of an air duct can be calculated as follows using the measured velocity pressure data
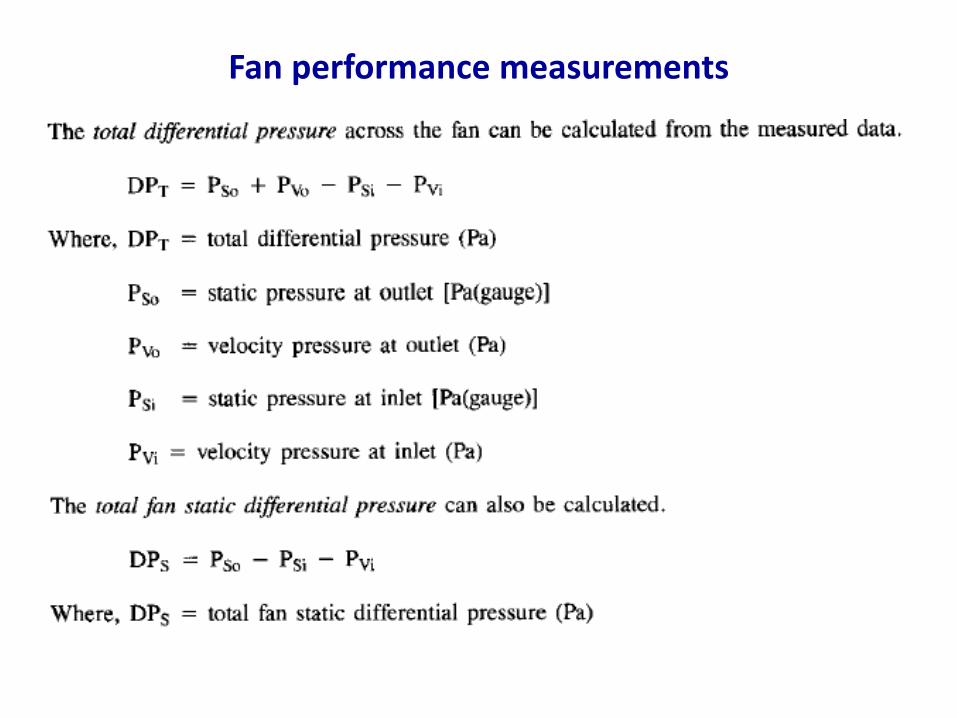
Fan performance measurements
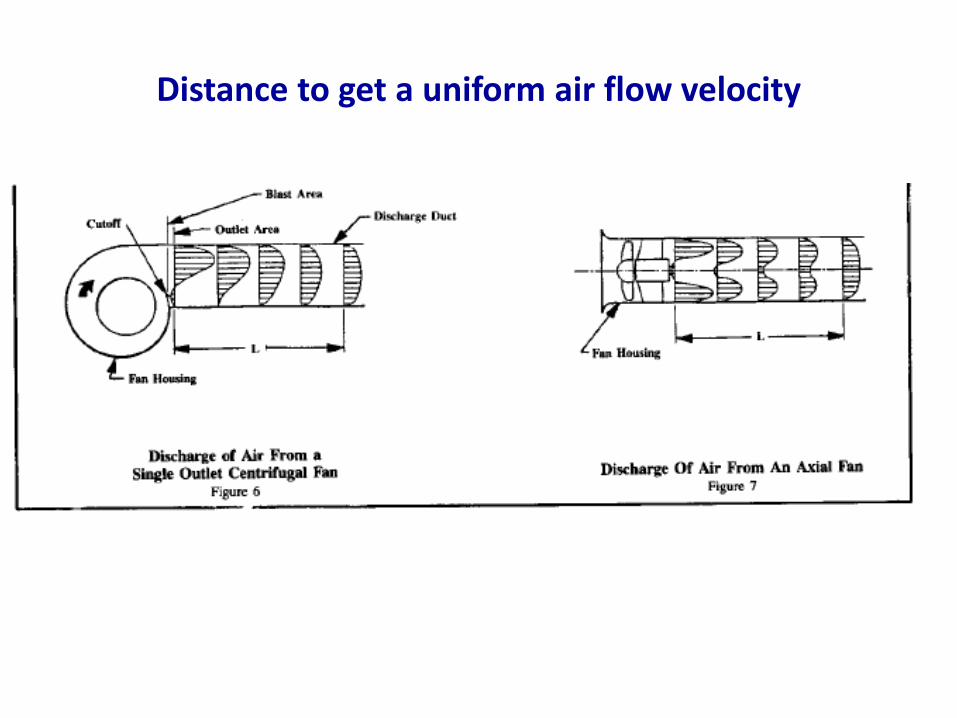
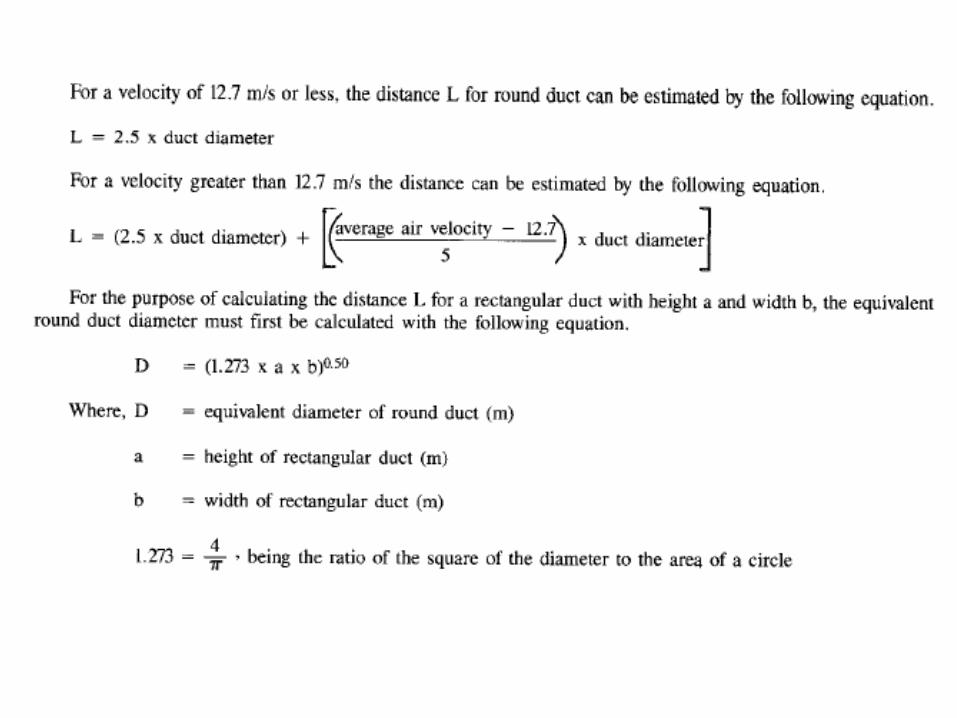
Distance to get a uniform air flow velocity
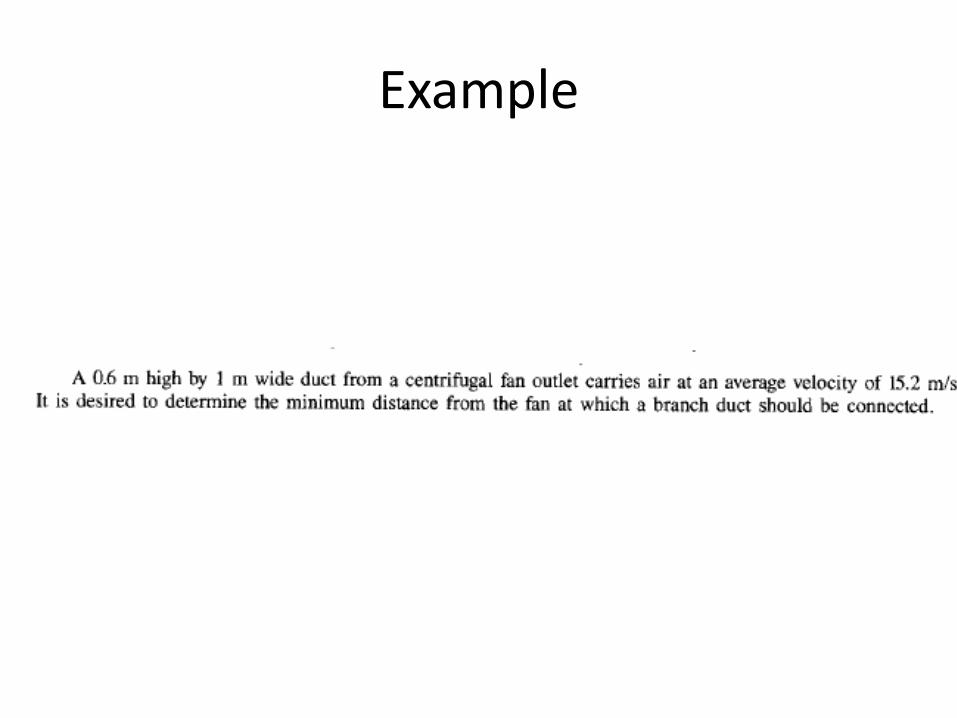
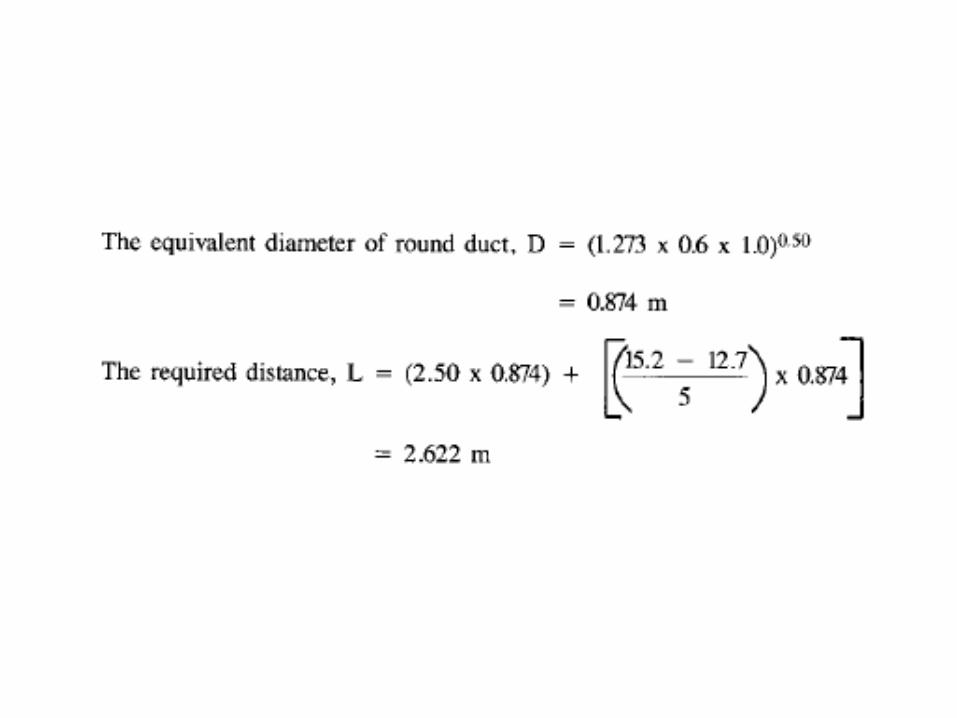
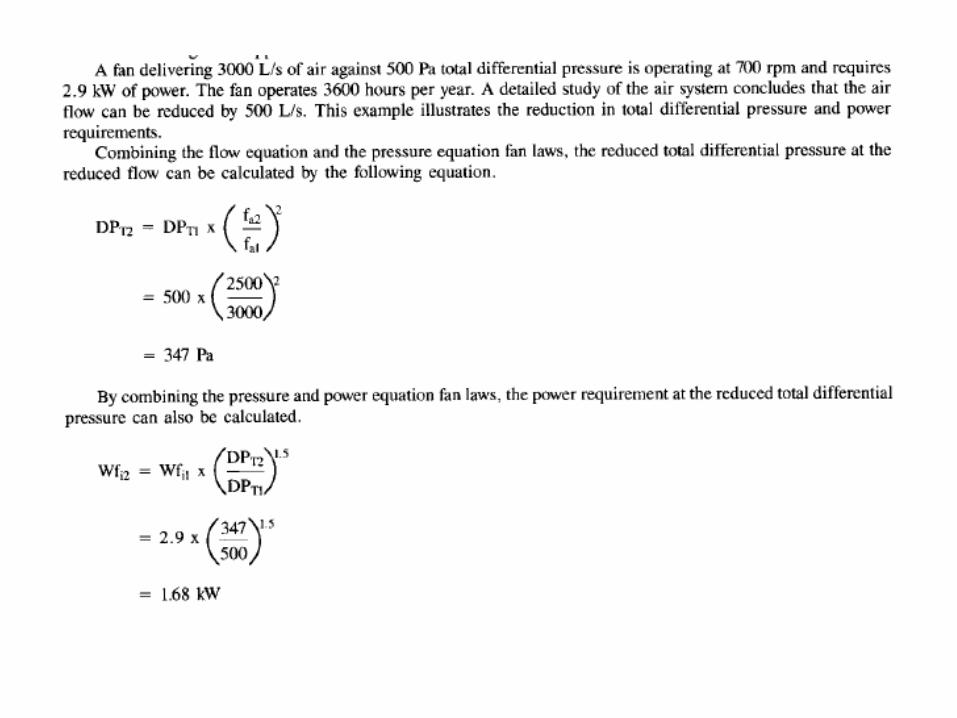
Example
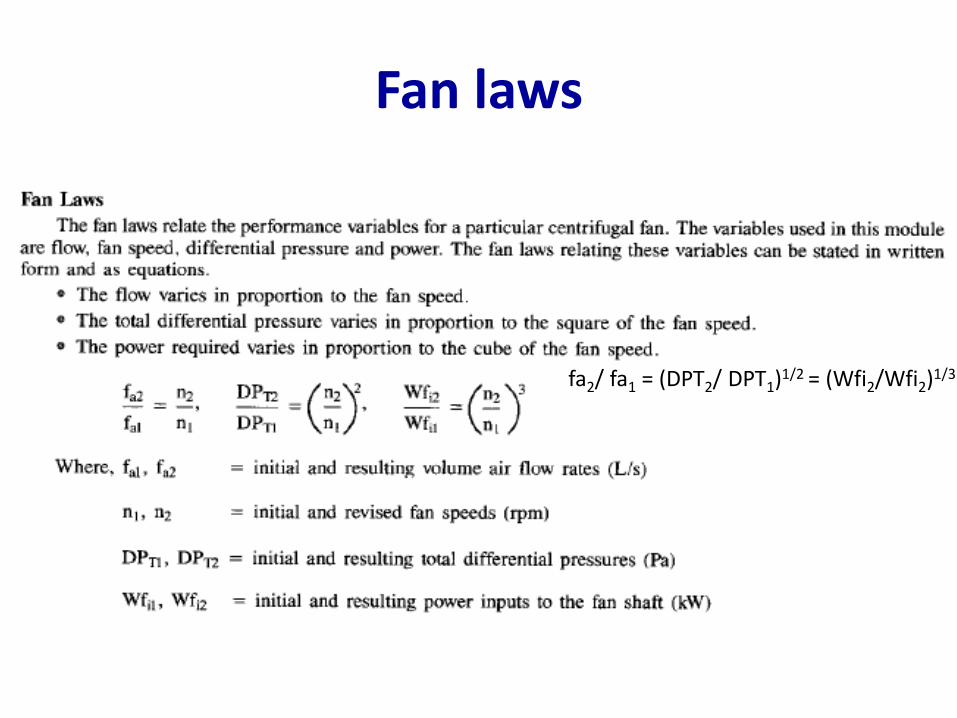
Fan laws
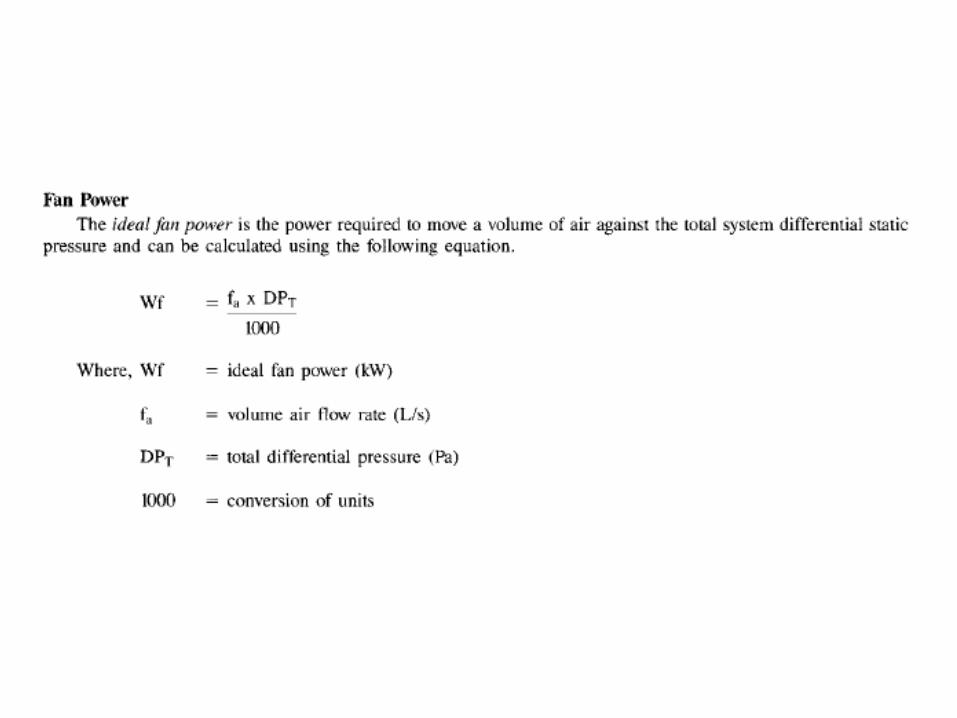
fa2/ fa1 = (DPT2/ DPT1)1/2 = (Wfi2/Wfi2)1/3
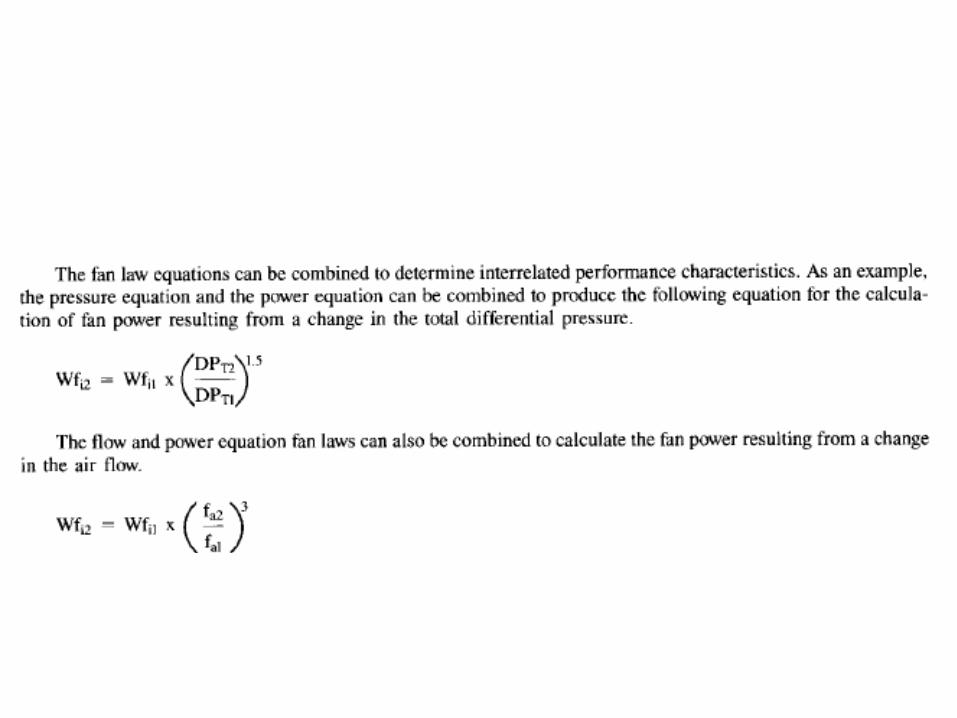
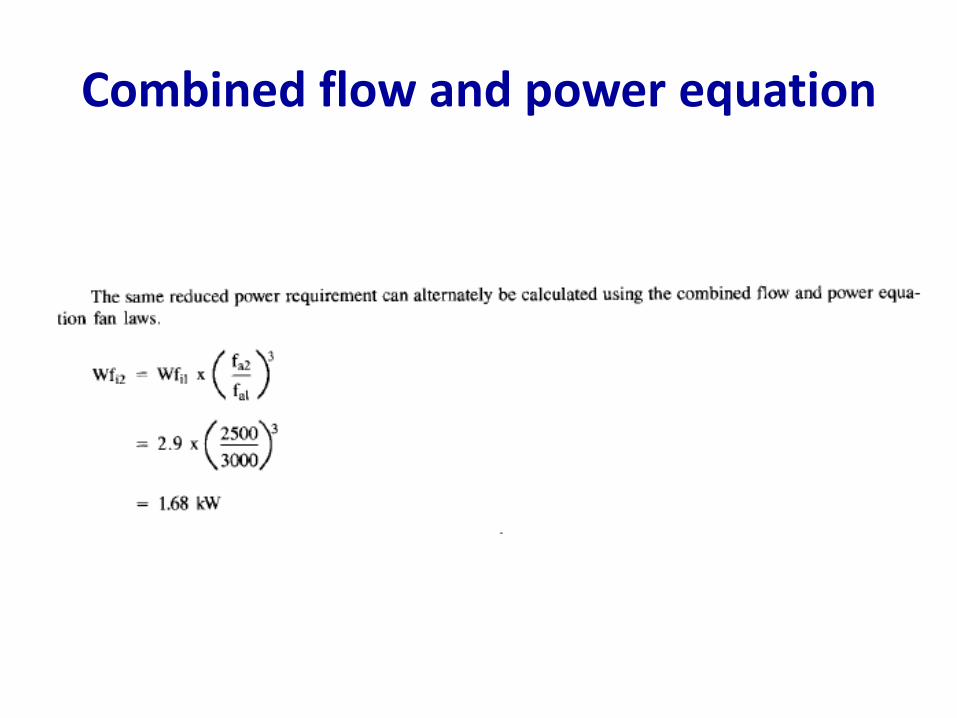
Combined flow and power equation
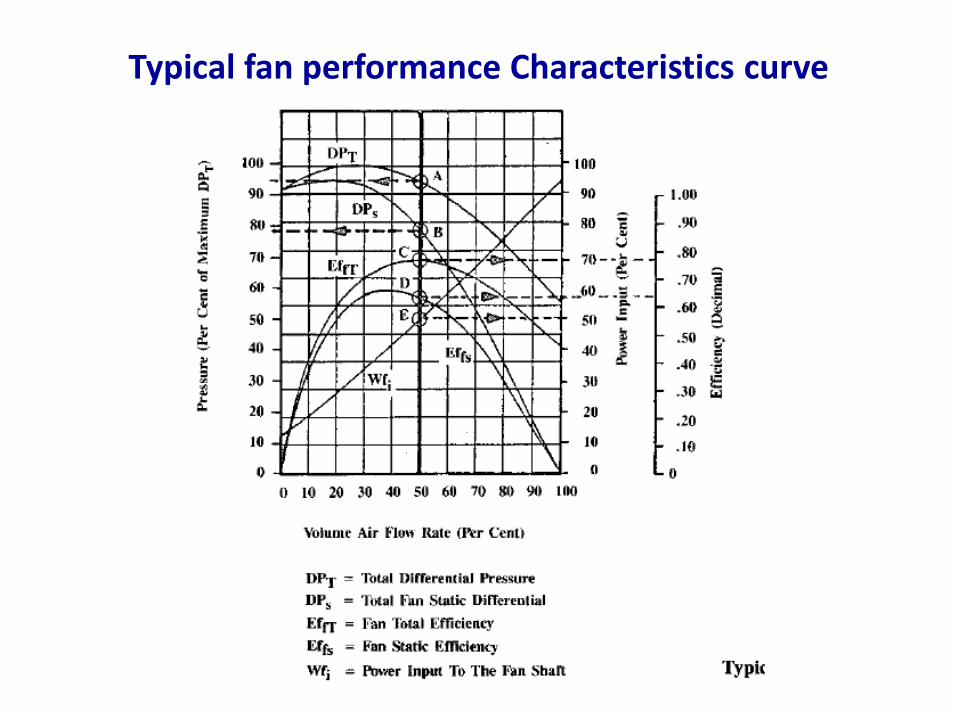
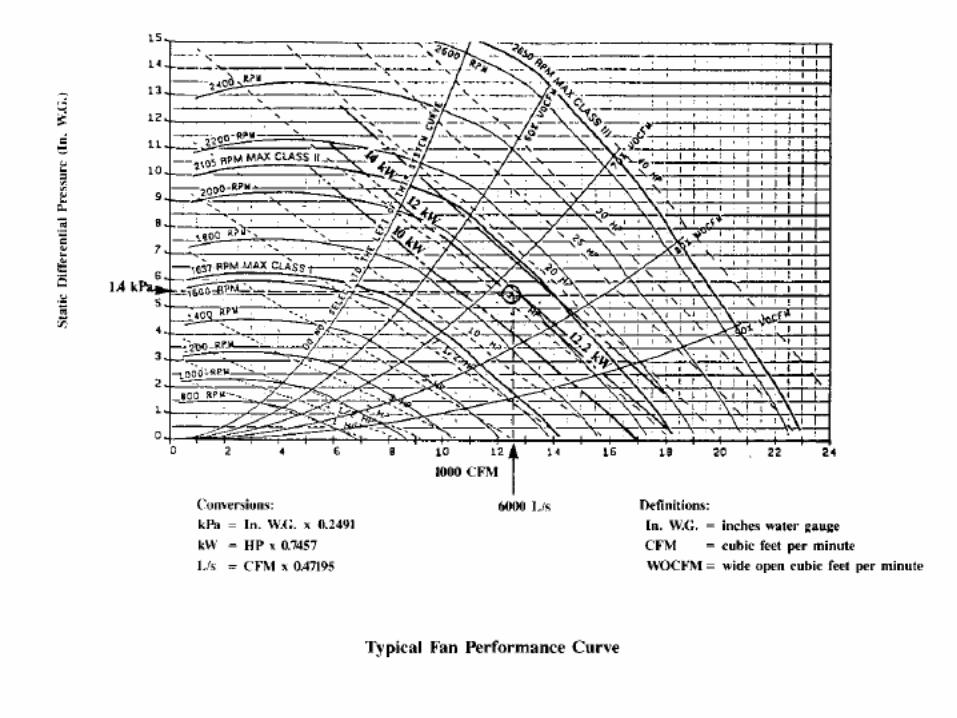
Typical fan performance Characteristics curve
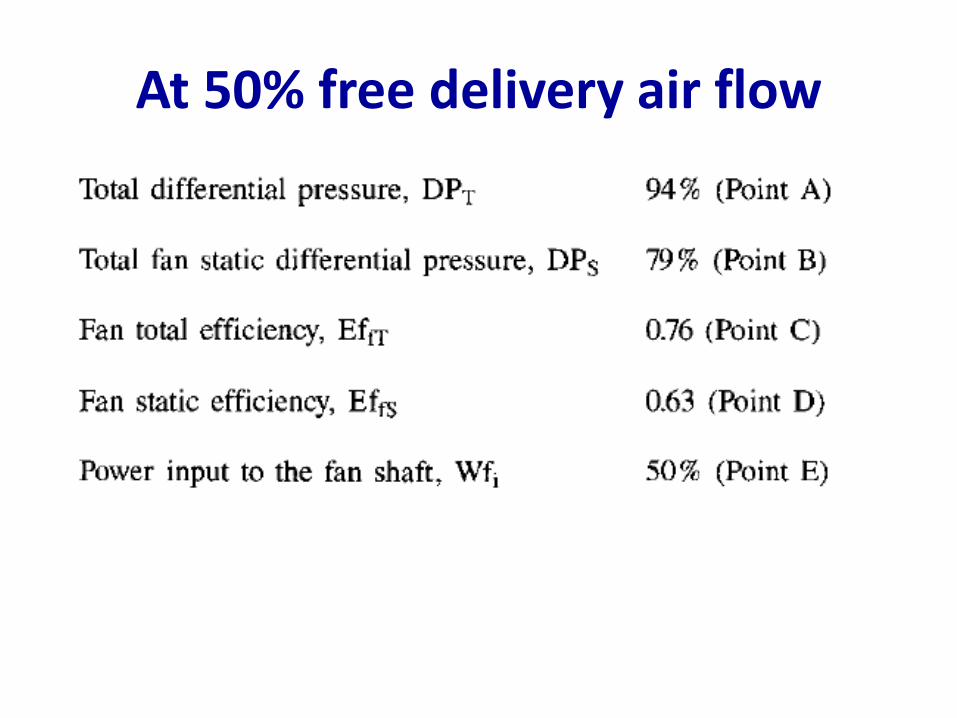
At 50% free delivery air flow

End