Embed Size (px)
Citation preview
Reservoir characterisation using macromolecular petroleum compounds including asphaltenes:
A case study of the Heidrun oil field in the Norwegian North Sea
von Diplom-Geologin Katja Theuerkorn
aus Leipzig
von der Fakultät VI – Planen Bauen Umwelt der Technischen Universität Berlin
zur Erlangung des akademischen Grades
Doktor der Naturwissenschaften Dr. rer. nat.
genehmigte Dissertation Promotionsausschuss: Vorsitzender: Prof. Dr. rer. nat. Gerhard Franz Berichter: Prof. Dr. Brian Horsfield Berichter: Prof. Dr. rer. nat. Jan Schwarzbauer Tag der wissenschaftlichen Aussprache: 30.04.2012
Berlin 2012 D 83
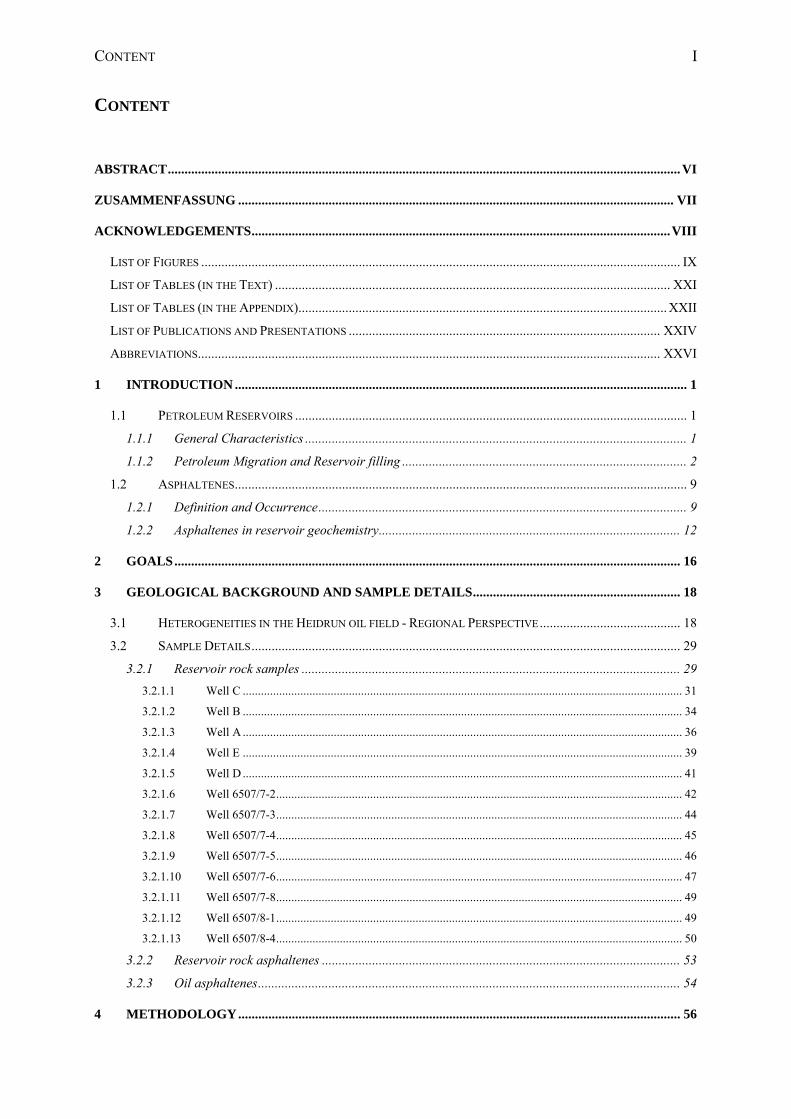
CONTENT
I
CONTENT
ABSTRACT ......................................................................................................................................................... VI
ZUSAMMENFASSUNG .................................................................................................................................. VII
ACKNOWLEDGEMENTS ............................................................................................................................. VIII
LIST OF FIGURES ............................................................................................................................................... IX
LIST OF TABLES (IN THE TEXT) ...................................................................................................................... XXI
LIST OF TABLES (IN THE APPENDIX).............................................................................................................. XXII
LIST OF PUBLICATIONS AND PRESENTATIONS ............................................................................................. XXIV
ABBREVIATIONS.......................................................................................................................................... XXVI
1 INTRODUCTION ....................................................................................................................................... 1
1.1 PETROLEUM RESERVOIRS ..................................................................................................................... 1
1.1.1 General Characteristics .................................................................................................................. 1
1.1.2 Petroleum Migration and Reservoir filling ..................................................................................... 2
1.2 ASPHALTENES ....................................................................................................................................... 9
1.2.1 Definition and Occurrence .............................................................................................................. 9
1.2.2 Asphaltenes in reservoir geochemistry .......................................................................................... 12
2 GOALS ....................................................................................................................................................... 16
3 GEOLOGICAL BACKGROUND AND SAMPLE DETAILS .............................................................. 18
3.1 HETEROGENEITIES IN THE HEIDRUN OIL FIELD - REGIONAL PERSPECTIVE .......................................... 18
3.2 SAMPLE DETAILS ................................................................................................................................ 29
3.2.1 Reservoir rock samples ................................................................................................................. 29 3.2.1.1 Well C ................................................................................................................................................. 31 3.2.1.2 Well B ................................................................................................................................................. 34 3.2.1.3 Well A ................................................................................................................................................. 36 3.2.1.4 Well E ................................................................................................................................................. 39 3.2.1.5 Well D ................................................................................................................................................. 41 3.2.1.6 Well 6507/7-2 ...................................................................................................................................... 42 3.2.1.7 Well 6507/7-3 ...................................................................................................................................... 44 3.2.1.8 Well 6507/7-4 ...................................................................................................................................... 45 3.2.1.9 Well 6507/7-5 ...................................................................................................................................... 46 3.2.1.10 Well 6507/7-6 ...................................................................................................................................... 47 3.2.1.11 Well 6507/7-8 ...................................................................................................................................... 49 3.2.1.12 Well 6507/8-1 ...................................................................................................................................... 49 3.2.1.13 Well 6507/8-4 ...................................................................................................................................... 50
3.2.2 Reservoir rock asphaltenes ........................................................................................................... 53
3.2.3 Oil asphaltenes .............................................................................................................................. 54
4 METHODOLOGY .................................................................................................................................... 56
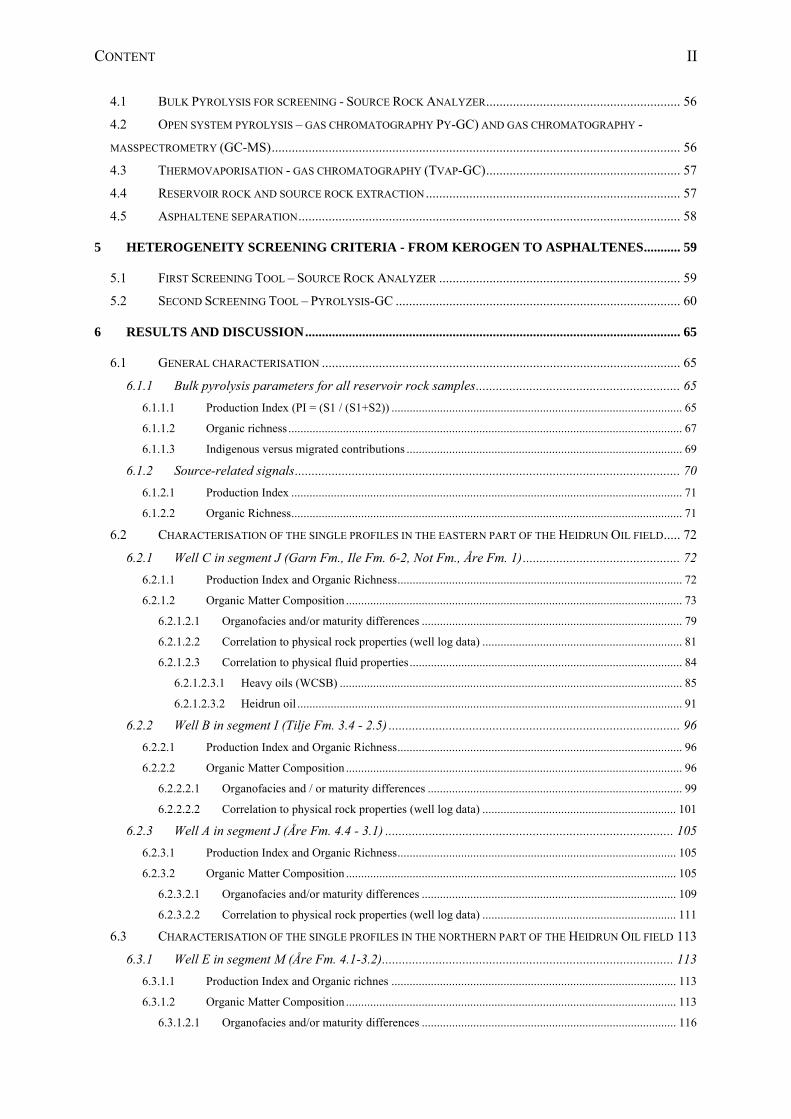
CONTENT II
4.1 BULK PYROLYSIS FOR SCREENING - SOURCE ROCK ANALYZER .......................................................... 56
4.2 OPEN SYSTEM PYROLYSIS – GAS CHROMATOGRAPHY PY-GC) AND GAS CHROMATOGRAPHY -
MASSPECTROMETRY (GC-MS) .......................................................................................................................... 56
4.3 THERMOVAPORISATION - GAS CHROMATOGRAPHY (TVAP-GC) .......................................................... 57
4.4 RESERVOIR ROCK AND SOURCE ROCK EXTRACTION ............................................................................ 57
4.5 ASPHALTENE SEPARATION .................................................................................................................. 58
5 HETEROGENEITY SCREENING CRITERIA - FROM KEROGEN TO ASPHALTENES ........... 59
5.1 FIRST SCREENING TOOL – SOURCE ROCK ANALYZER ........................................................................ 59
5.2 SECOND SCREENING TOOL – PYROLYSIS-GC ..................................................................................... 60
6 RESULTS AND DISCUSSION ................................................................................................................ 65
6.1 GENERAL CHARACTERISATION ........................................................................................................... 65
6.1.1 Bulk pyrolysis parameters for all reservoir rock samples ............................................................. 65 6.1.1.1 Production Index (PI = (S1 / (S1+S2)) ................................................................................................ 65 6.1.1.2 Organic richness .................................................................................................................................. 67 6.1.1.3 Indigenous versus migrated contributions ........................................................................................... 69
6.1.2 Source-related signals ................................................................................................................... 70 6.1.2.1 Production Index ................................................................................................................................. 71 6.1.2.2 Organic Richness ................................................................................................................................. 71
6.2 CHARACTERISATION OF THE SINGLE PROFILES IN THE EASTERN PART OF THE HEIDRUN OIL FIELD ..... 72
6.2.1 Well C in segment J (Garn Fm., Ile Fm. 6-2, Not Fm., Åre Fm. 1) ............................................... 72 6.2.1.1 Production Index and Organic Richness .............................................................................................. 72 6.2.1.2 Organic Matter Composition ............................................................................................................... 73
6.2.1.2.1 Organofacies and/or maturity differences ...................................................................................... 79 6.2.1.2.2 Correlation to physical rock properties (well log data) .................................................................. 81 6.2.1.2.3 Correlation to physical fluid properties .......................................................................................... 84
6.2.1.2.3.1 Heavy oils (WCSB) ................................................................................................................. 85 6.2.1.2.3.2 Heidrun oil ............................................................................................................................... 91
6.2.2 Well B in segment I (Tilje Fm. 3.4 - 2.5) ....................................................................................... 96 6.2.2.1 Production Index and Organic Richness .............................................................................................. 96 6.2.2.2 Organic Matter Composition ............................................................................................................... 96
6.2.2.2.1 Organofacies and / or maturity differences .................................................................................... 99 6.2.2.2.2 Correlation to physical rock properties (well log data) ................................................................ 101
6.2.3 Well A in segment J (Åre Fm. 4.4 - 3.1) ...................................................................................... 105 6.2.3.1 Production Index and Organic Richness ............................................................................................ 105 6.2.3.2 Organic Matter Composition ............................................................................................................. 105
6.2.3.2.1 Organofacies and/or maturity differences .................................................................................... 109 6.2.3.2.2 Correlation to physical rock properties (well log data) ................................................................ 111
6.3 CHARACTERISATION OF THE SINGLE PROFILES IN THE NORTHERN PART OF THE HEIDRUN OIL FIELD 113
6.3.1 Well E in segment M (Åre Fm. 4.1-3.2) ....................................................................................... 113 6.3.1.1 Production Index and Organic richnes .............................................................................................. 113 6.3.1.2 Organic Matter Composition ............................................................................................................. 113
6.3.1.2.1 Organofacies and/or maturity differences .................................................................................... 116
CONTENT III
6.3.1.2.2 Correlation to physical rock properties (well log data) ................................................................ 118 6.3.2 Well D in segment in segment Q (Åre Fm. 2.1) ........................................................................... 120
6.3.2.1 Production Index and Organic Richness ............................................................................................ 120 6.3.2.2 Organic Matter Composition ............................................................................................................. 120
6.3.2.2.1 Organofacies and/or maturity differences .................................................................................... 123 6.3.2.2.2 Correlation to physical rock properties (well log data) ................................................................ 125
6.3.3 Well 6507/8-4 in Heidrun North (Åre Fm. 2.1 - 1) ...................................................................... 126 6.3.3.1 Production Index and Organic Richness ............................................................................................ 126 6.3.3.2 Organic Matter Composition ............................................................................................................. 126
6.3.3.2.1 Organofacies and/or maturity differences .................................................................................... 129 6.3.3.2.2 Correlation to physical rock properties (well log data) ................................................................ 130
6.3.4 Well 6507/7-6 in segment I (Åre Fm.3.2 - 2) ............................................................................... 131 6.3.4.1 Production Index and Organic Richness ............................................................................................ 131 6.3.4.2 Organic Matter Composition ............................................................................................................. 131
6.3.4.2.1 Organofacies and/or maturity differences .................................................................................... 133 6.3.4.2.2 Correlation to physical rock properties (well log data) ................................................................ 133
6.4 CHARACTERISATION OF THE SINGLE PROFILES IN THE WESTERN PART OF THE HEIDRUN OIL FIELD .. 134
6.4.1 Well 6507/7-5 in segment O (Spekk Fm., Garn Fm., Ile Fm. 2) .................................................. 134 6.4.1.1 Production Index and Organic Richness ............................................................................................ 134 6.4.1.2 Organic Matter Composition ............................................................................................................. 135
6.4.1.2.1 Organofacies and/or maturity differences .................................................................................... 136 6.4.1.2.2 Correlation to physical rock properties (well log data) ................................................................ 137
6.4.2 Well 6507/7-2 in segment G (Tilje Fm. 3.2, 2.1, Åre Fm. 7.2, 6.2) ............................................. 138 6.4.2.1 Production Index and Organic Richness ............................................................................................ 138 6.4.2.2 Organic Matter Composition ............................................................................................................. 138
6.4.2.2.1 Organofacies and/or maturity differences .................................................................................... 140 6.4.2.2.2 Correlation to physical rock properties (well log data) ................................................................ 141
6.4.3 Well 6507/7-3 in segment E (Garn Fm., Ile Fm. 4 - 6, Ror Fm. 2) ............................................. 142 6.4.3.1 Production Index and Organic Richness ............................................................................................ 142 6.4.3.2 Organic Matter Composition ............................................................................................................. 142
6.4.3.2.1 Organofacies and/or maturity differences .................................................................................... 144 6.4.3.2.2 Correlation to physical rock properties (well log data) ................................................................ 145
6.4.4 Well 6507/7-4 in Segment C (Garn Fm., Ile Fm. 6 - 5) ............................................................... 145 6.4.4.1 Production Index and Organic Richness ............................................................................................ 145 6.4.4.2 Organic Matter Composition ............................................................................................................. 146
6.4.4.2.1 Organofacies and/or maturity differences .................................................................................... 147 6.4.4.2.2 Correlation to physical rock properties (well log data) ................................................................ 148
6.5 CHARACTERISATION OF THE SINGLE PROFILES IN THE SOUTHERN PART OF THE HEIDRUN OIL FIELD 149
6.5.1 Well 6507/7-8 in segment F (Melke Fm., Garn Fm., Ile Fm.) ..................................................... 149 6.5.1.1 Production Index and Organic Richness ............................................................................................ 149 6.5.1.2 Organic Matter Composition ............................................................................................................. 150
6.5.1.2.1 Organofacies and/or maturity differences .................................................................................... 151 6.5.1.2.2 Correlation to physical rock properties (well log data) ................................................................ 153
6.5.2 Well 6507/8-1 in segment I (Tilje Fm. 3.3 - 1) ............................................................................ 154 6.5.2.1 Production Index and Organic Richness ............................................................................................ 154
CONTENT IV
6.5.2.2 Organic Matter Composition ............................................................................................................. 154 6.5.2.2.1 Organofacies and/or maturity differences .................................................................................... 156 6.5.2.2.2 Correlation to physical rock properties (well log data) ................................................................ 157
6.6 DATA SYNTHESIS FOR THE INDIVIDUAL RESERVOIR FORMATIONS ................................................... 158
6.6.1 Organic Matter composition ....................................................................................................... 158
6.6.2 Organofacies and/or maturity differences ................................................................................... 168
7 SEPARATED ASPHALTENE FRACTIONS – DO THEY YIELD MORE INFORMATION? ..... 177
7.1 A REPRODUCIBLE AND LINEAR METHOD FOR SEPARATING ASPHALTENES FROM CRUDE OIL ............. 177
7.1.1 Abstract ....................................................................................................................................... 177
7.1.2 Introduction ................................................................................................................................. 178
7.1.3 Experimental ............................................................................................................................... 179 7.1.3.1 Precipitation of asphaltenes ............................................................................................................... 179 7.1.3.2 Analytical characterisation of asphaltenes ......................................................................................... 180
7.1.4 Results ......................................................................................................................................... 181 7.1.4.1 Solvent type and oil/solvent ratio ...................................................................................................... 181 7.1.4.2 Aging time ......................................................................................................................................... 181 7.1.4.3 Linearity ............................................................................................................................................ 182
7.1.5 Conclusion .................................................................................................................................. 182
7.2 POTENTIAL PROBLEMS WITH CONTAMINATION ................................................................................. 184
7.3 HETEROGENEITY SCREENING USING PURE RESERVOIR ROCK ASPHALTENES ..................................... 186
7.3.1 Comparison of asphaltenes and reservoir rocks from the eastern part of the Heidrun oil field . 187 7.3.1.1 Well C in segment J (Garn Fm, Ile Fm. 4 - 6, Not Fm. 1, Åre Fm. 1) ............................................... 187
7.3.1.1.1 Organic Matter Composition ........................................................................................................ 187 7.3.1.1.2 Organofacies and/or maturity differences .................................................................................... 188
7.3.1.2 Well B in segment I (Tilje Fm. 2.5 – 3.4) .......................................................................................... 189 7.3.1.2.1 Organic Matter Composition ........................................................................................................ 189 7.3.1.2.2 Organofacies and/or maturity differences .................................................................................... 190
7.3.2 Comparison of asphaltenes and reservoir rocks from the northern part of the Heidrun oil field 192 7.3.2.1 Well D in segment Q (Åre Fm 2.1) ................................................................................................... 192
7.3.2.1.1 Organic Matter Composition ........................................................................................................ 192 7.3.2.1.2 Organofacies and/or maturity differences .................................................................................... 193
7.3.2.2 Well E in segment in segment M (Åre Fm 4.1) ................................................................................. 195 7.3.2.2.1 Organic Matter Composition ........................................................................................................ 195 7.3.2.2.2 Organofacies and/or maturity differences .................................................................................... 196
7.3.3 Comparison of asphaltenes and reservoir rocks from the Western part of the Heidrun oil field 197 7.3.3.1 Well 6507/7-2 in segment G (Tilje Fm. 3.2 and 2.2/2.1, Åre Fm. 7.2) .............................................. 197
7.3.3.1.1 Organic Matter Composition ........................................................................................................ 197 7.3.3.1.2 Organofacies and/or maturity differences .................................................................................... 199
7.3.3.2 Well 6507/7-5 in segment O (Garn Fm., Ile Fm. 2)........................................................................... 200 7.3.3.2.1 Organic Matter Composition ........................................................................................................ 200 7.3.3.2.2 Organofacies and/or maturity differences .................................................................................... 201
7.3.4 Comparison of asphaltenes and reservoir rocks from the Southern part of the Heidrun oil field202 7.3.4.1 Well 6507/7-8 in segment F (Garn Fm., Ile Fm.) .............................................................................. 202
CONTENT V
7.3.4.1.1 Organic Matter Composition ........................................................................................................ 202 7.3.4.1.2 Organofacies and/or maturity differences .................................................................................... 203
7.3.5 Summary ...................................................................................................................................... 204
8 COMPOSITIONAL KINETIC MODELS ............................................................................................ 206
8.1 INTRODUCTION ................................................................................................................................. 206
8.2 STUDY AREAS - GEOLOGICAL BACKGROUND AND SAMPLES .............................................................. 208
8.2.1 Test I - Duvernay Formation ....................................................................................................... 208
8.2.2 Test II - Draupne Formation ....................................................................................................... 210
8.2.3 Main study area - Heidrun oilfield .............................................................................................. 210
8.3 ANALYTICAL METHODS ................................................................................................................... 211
8.3.1 Reservoir rock and source rock extraction ................................................................................. 211
8.3.2 Asphaltene separation ................................................................................................................. 212
8.3.3 Bulk Pyrolysis for kinetic modeling ............................................................................................. 212
8.3.4 Closed system pyrolysis – Micro scale sealed vessel pyrolysis (MSSV) ...................................... 213
8.3.5 Methodology and background on the PhaseKinetic approach (PKW tuning) ............................ 213
8.4 RESULTS AND DISCUSSION ............................................................................................................... 215
8.4.1 Duvernay Formation ................................................................................................................... 216 8.4.1.1 Predicting Petroleum Composition .................................................................................................... 216 8.4.1.2 Bulk Kinetic Parameters .................................................................................................................... 218 8.4.1.3 Compositional Kinetics – Evolving compositions using MSSV pyrolysis ........................................ 221 8.4.1.4 Compositional kinetic Model ............................................................................................................ 222
8.4.2 Draupne Formation .................................................................................................................... 225 8.4.2.1 Predicting Petroleum Composition .................................................................................................... 225 8.4.2.2 Bulk Kinetic Parameters .................................................................................................................... 225 8.4.2.3 Compositional Kinetics – Evolving composition using MSSV pyrolysis.......................................... 227 8.4.2.4 Compositional kinetic Model ............................................................................................................ 227
8.4.3 Main study area - Heidrun oilfield .............................................................................................. 229 8.4.3.1 Predicting Petroleum Composition .................................................................................................... 229 8.4.3.2 Bulk Kinetic Parameters .................................................................................................................... 232 8.4.3.3 Compositional Kinetic – Evolving composition with MSSV pyrolysis ............................................. 236 8.4.3.4 Compositional kinetic Model ............................................................................................................ 238
9 CONCLUSION ........................................................................................................................................ 243
10 APPENDIX .............................................................................................................................................. 246
11 REFERENCES ........................................................................................................................................ 257
ABSTRACT VI
ABSTRACT
The present thesis is part of the industry partnership project “BioPets Flux” between the GFZ
Potsdam and the industry partners BG Group, Devon Energy, ExxonMobil, Petrobras, Repsol
YPF, Shell, and Statoil. The study aims at improving predictions of reservoir alteration post-
filling, and enhancing the understanding of reservoir charge history.
The original composition and the volume of petroleum in reservoirs are often subjected to
post-filling alteration processes, in many cases to variable degrees due to the reservoir
compartmentalization. Such alteration processes, e.g. biodegradation or water washing, have
strong economic consequences since they lead to a decrease in oil quality and producibility.
The focus of this thesis was on the total macromolecular petroleum fraction of reservoir rocks
(including asphaltenes) and individual asphaltene fractions separated from oil-stained
reservoir rocks. Asphaltenes contain structural and maturity related information of the source,
and have been assumed to be unaffected by biodegradation or water washing. Thus, pyrolysis
of asphaltenes should provide the unaltered oil fingerprint, allowing the source
characterisation as well as the estimation of alteration and charge processes.
The thesis outlines detailed screening results of the Heidrun reservoir (Norwegian North Sea)
and a method developed for asphaltene separation with the main focus on reproducibility and
linearity. For the screening a sample set comprising 141 reservoir rocks and 31 single
asphaltenes was investigated using open system pyrolysis-GC and bulk pyrolysis in order to
detect lateral and vertical compositional variabilities in the Heidrun oil field. Parameters
known from kerogen typing studies and newly developed parameters were applied to both the
total macromolecular petroleum fraction and the single asphaltenes. Direct correlations were
found between the aromaticity of the total macromolecular petroleum fraction and
biodegradation. Gradients and regularities in the pyrolysate composition could be correlated
to differences in the biodegradation level of oil charges achieved in the field, and their
mixing. In the northern part of Heidrun a lacustrine source is suspected, while the main part of
the oil field shows indications for a marine source.
The asphaltene screening reflects the gradients of their corresponding reservoir rocks and
indicate so a possible influence of biodegradation on asphaltenes. MSSV pyrolysis
experiments were applied to single asphaltene samples in order to use their compositional
kinetic information’s for the delineation of reservoir heterogeneities. The Asphaltene
compositional information’s indicate differences concerning the source maturity and mixing
effects of oils generated from different sources.
ZUSAMMENFASSUNG VII
ZUSAMMENFASSUNG
Die vorliegende Arbeit ist Teil des Industriepartner Projektes „BioPets Flux“ zwischen dem GFZ
Potsdam und den Industriepartnern BG Group, Devon Energy, ExxonMobil, Petrobras, Repsol
YPF, Shell und Statoil. Ziele der Arbeit sind es Vorhersagen von Alterationsprozessen in
Erdöllagerstätten zu verbessern sowie das Verständnis über die Befüllung zu vertiefen.
Die ursprüngliche Zusammensetzung sowie das Volumen von Erdöl in einer Lagerstätte sind
häufig durch Prozesse, wie Biodegradation oder Auswaschung alteriert und dies oft zu
unterschiedlichem Maße in den einzelnen Lagerstättensegmenten. Solche Alterationsprozesse sind
von großer ökonomischer Bedeutung, da sie die Qualität und den Wert des Öls mindern.
Im Fokus dieser Arbeit steht das gesamte im Reservoirgestein enthaltene makromolekulare
organische Material (inklusive Asphaltene) sowie Asphaltene als separierte Phase. Asphaltene
zeigen eine sehr ähnliche Struktur wie das Kerogen aus dem sie gebildet wurden und gelten als
resistent gegenüber Alterationsprozessen, wie Biodegradation oder Auswaschung. Mittels der
Pyrolyse von Asphaltenen können Teile der ursprünglichen Erdölzusammensetzung der
jeweiligen Ölchargen rekonstruiert werden, wodurch sie zur Muttergesteinscharakterisierung
sowie zur Charakterisierung des Alterationszustandes und der Befüllung genutzt werden kann.
Die Arbeit präsentiert die Ergebnisse des detaillierten Reservoir-Screenings des Heidrun Ölfeldes
(Norwegische Nordsee) sowie eine reproduzierbare und lineare Methode zur Asphalten Fällung.
Für das Screening wurden 141 Reservoirgesteinsproben und 31 Asphaltene mittels Pyrolyse-GC
und Bulk-Pyrolyse analysiert, um laterale und vertikale Heterogenitäten in der
Erdölzusammensetzung zu erfassen. Das makromolekulare organische Material der
Reservoirgesteine und die separierten Asphaltene wurden mittels bekannter Parameter zur
Kerogentypisierung sowie neu entwickelten Parametern charakterisiert.
Im Norden des Heidrun Ölfeldes gibt es Hinweise auf eine lakustrin beeinflusste Quelle, während
der Hauptteil des Erdöls von einem marinen Muttergestein gebildet wurde. Die Aromatizität und
Gaszusammensetzung der Reservoirgestein Pyrolysate zeigen einen direkten Zusammenhang zur
Biodegradation. Die detektierten Gradienten in der Zusammensetzung der Pyrolysate konnten mit
Unterschieden bezüglich des Biodegradationslevel der Ölchargen die das Heidrun Ölfeld
erreichten in Verbindung gebracht werden sowie deren Vermischung. Die Pyrolysate der
Asphaltene reflektieren die Gradienten ihrer Reservoirgesteine und geben somit Hinweise so auf
eine geringere Resistenz gegenüber Biodegradation als angenommen. Um die kompositionelle
Kinetik von Asphaltenen zur Profilierung des Muttergesteins und zur Reservoircharakterisierung
zu nutzen, wurden MSSV-Pyrolyse Messungen durchgeführt. Die Ergebnisse dieser Experimente
zeigen Unterschiede bezüglich der Muttergesteinsreife und/oder deuten auf die Vermischung mit
Ölen von anderen Muttergesteinen hin.

ACKNOWLEDGEMENTS VIII
ACKNOWLEDGEMENTS
My particular thanks go firstly to my supervisor Prof. Dr. Brian Horsfield for the interesting
theme within the “BioPets Flux” project, for his ideas and critical comments on several talks
and reports, and for his patience in explaining me a part of the world of organic chemistry. He
is especially thanked for his support is the last month of my work. Thoughtful reviews and
critical comments by Prof. Dr. Rolando di Primio concerning the kinetic part supported the
success of this study. Many thanks go to all Industry Partners for the pleasant cooperation,
and in particular to Statoil and Shell for providing sample material. The possibility to present
the results of this study at conferences and to publish parts of the work is gratefully
acknowledged.
Thanks go to Dr. Raingard Haberer for her helpful suggestions on various drafts for reports,
and the nice time we spend on several official trips and to Dr. Eric Lehne for his support at
the beginning of my work. This work has benefited from several discussions and help of
many colleagues within the Organic Geochemistry Section at GFZ Potsdam, especially
Ferdinand Perssen and his support in the Pyrolysis laboratory as well as Anke Kaminsky and
Conny Karger for their help in the wet-chemical laboratory. The entire team at GFZ provided
an excellent working environment. Thanks to all of you!
I am grateful to my friends Alexandra Vetter, Dr. Clemens Glombitza, and Nicolaj Mahlstedt
for their mental and moral support to survive the last years, for their helpful discussions at
several beers, and for all the wonderful adventures and great times we had in Berlin. How
beautiful that you exist. Thanks go to my room mates Dr. Stefanie Pötz and Phillip “Daniel”
Kuhn for the wonderful uncomplicated working atmosphere, helpful comments and funny
times we had.
Infinite thanks go to my partner Alexander Schubert who supported me through the whole
PhD thesis with his tolerant character to stand all my moods, the confidence, and all the ways
he found to keep me going on with the thesis. Special thanks to my parents Peter and Sigrid
Theuerkorn, and my sister Conny for their support in the last years.
LIST OF FIGURES IX
LIST OF FIGURES
FIGURE 1 SCHEMATIC SEQUENCE OF THE RESERVOIR FILLING (ENGLAND, 1989). ................................................... 7
FIGURE 2 PHYSICAL STRUCTURE OF CRUDE OIL WITH A POSSIBLE MICELLE STRUCTURE OF ASPHALTENES AND
RESINS ACCORDING TO PFEIFFER & SAAL (1940) ADAPTED BY TISSOT & WELTE (1984). (A) FULLY
DISPERSED ASPHALTENES OCCURS IN CRUDE OILS WITH A SUFFICIENT AMOUNT OF RESINS AND AROMATIC
HYDROCARBONS. (B) ASPHALTENE-ASPHALTENE COMBINATION OCCURS IN CRUDE OILS WITH A DEPLETION
OF RESINS AND AROMATIC HYDROCARBONS COMPARED TO ASPHALTENES. ................................................. 11
FIGURE 3 LOCATION MAP OF THE STUDY AREA. LEFT: THE OIL AND GAS FIELDS OF THE NORWEGIAN CONTINENTAL
SHELF (WWW.NPD.NO/FACTMAPS). THE RED SQUARE MARKS THE HALTENBANKEN AREA. RIGHT: THE OIL
AND GAS FIELDS OF THE HALTENBANKEN AREA INCLUDING THE HEIDRUN OIL FIELD. ................................. 18
FIGURE 4 SCHEMATIC STRUCTURE OF THE HEIDRUN OIL FIELD INCLUDING THE MAIN FAULT TRENDS AND
STRUCTURAL COMPARTMENTS (SEGMENT A - T), DISTRIBUTION OF HYDROCARBONS (GAS/OIL) AND WELLS
INVESTIGATED IN THIS STUDY (AFTER KNAI & KNIPE, 1998). ...................................................................... 19
FIGURE 5 CROSS-SECTION THROUGH THE HEIDRUN OIL FIELD ILLUSTRATING RESERVOIR UNITS AND FLUID
CONTACTS (HEMMENS ET AL., 1994). ............................................................................................................ 20
FIGURE 6 STRATIGRAPHIC COLUMN OF THE PETROLEUM PROVINCE HALTENBANKEN SHOWS THE RESERVOIR UNITS
OF THE JURASSIC SANDSTONES IN YELLOW AS WELL AS THE ORGANIC RICH ROCKS IN RED (FROM KARLSEN
ET AL., 2004) ................................................................................................................................................. 21
FIGURE 7 STRUCTURE OF THE HEIDRUN RESERVOIR SHOWS THE PRESENT DAY STATE OF OIL ALTERATION.
BIODEGRADED OILS WITHOUT REACHING LATER OIL CHARGES ARE PREDOMINANTLY FOUND IN THE EASTERN
PART (YELLOW), WHILE BIODEGRADED OILS, WHICH HAVE BEEN ALTERED BY MIXING WITH A LATER
CHARGE, ARE PREDOMINANTLY FOUND IN THE WESTERN PART OF THE HEIDRUN OIL FIELD (GREY). IN THE
CHEQUERED CENTRAL PART, BOTH SIGNALS ARE OBSERVED (MODIFIED AFTER KNAI & KNIPE, 1998). ........ 29
FIGURE 8 SIMPLIFIED N-S PROFILE SHOWING WELL LOCATIONS. RED NUMBERS IN THE PROFILE REPRESENT THE
AMOUNT OF INVESTIGATED RESERVOIR ROCK SAMPLES FOR THE INDIVIDUAL WELLS. RECTANGLES ON THE
RIGHT SIDE OF THE PROFILE REPRESENT NUMBER AND DEPTH OF THE DST. ................................................. 30
FIGURE 9 SECTION OF THE WELL LOG PROFILE C SHOWS THE POROSITY LOG (LEFT), THE WATER SATURATION LOG
(MIDDLE) AND THE PERMEABILITY LOG (RIGHT) AS WELL AS BARRIERS AND COAL LAYERS OBSERVED. THE
SAMPLED INTERVAL IS MARKED BY THE DOUBLE ARROW RIGHT BESIDE THE LOG. ZONES MARKED BY BLACK
ARROWS ARE CHARACTERISED BY LOW POROSITY, LOW PERMEABILITY, AND HIGH WATER SATURATION. THE
WELL LOG WAS PROVIDED BY STATOIL. ....................................................................................................... 32
FIGURE 10 WELL LOG SECTION OF PROFILE B SHOWING THE POROSITY LOG (LEFT), WATER SATURATION LOG
(MIDDLE) AND PERMEABILITY LOG (RIGHT), AND OBSERVED CALCITE CEMENTED ZONES. THE SAMPLED
INTERVAL IS MARKED BY THE DOUBLE ARROW RIGHT BESIDE THE LOG. THE WELL LOG WAS PROVIDED BY
STATOIL. ...................................................................................................................................................... 34
FIGURE 11 WELL LOG SECTION OF THE PROFILE A (PROVIDED BY STATOIL) SHOWING THE POROSITY LOG (LEFT),
WATER SATURATION LOG (MIDDLE) AND PERMEABILITY LOG (RIGHT). THE SAMPLED INTERVALS ARE
MARKED BY THE DOUBLE ARROW RIGHT BESIDE THE LOG. THE COAL RICH LAYERS AND THE SHALE
DETECTED BETWEEN THE ÅRE RESERVOIR ZONE 3 AND 4 ARE MARKED IN THE LOG. .................................... 37
LIST OF FIGURES X
FIGURE 12 TYPICAL RESERVOIR ROCKS OF THE ÅRE FORMATION 4 (G004137, LEFT) AND THE ÅRE FORMATION 3
(G004160, RIGHT). ....................................................................................................................................... 39
FIGURE 13 WELL LOG SECTION OF PROFILE E SHOWING THE POROSITY LOG (LEFT), WATER SATURATION LOG
(MIDDLE) AND PERMEABILITY LOG (RIGHT) AS WELL AS OBSERVED LOW PERMEABLE ZONES (= BARRIERS).
THE SAMPLED INTERVAL MARKED BY THE DOUBLE ARROW RIGHT BESIDE THE LOG. STATOIL PROVIDED THE
LOG. ............................................................................................................................................................. 40
FIGURE 14 WELL LOG SECTION OF PROFILE D SHOWING THE POROSITY LOG (LEFT), WATER SATURATION LOG
(MIDDLE) AND PERMEABILITY LOG (RIGHT). THE SAMPLED INTERVAL MARKED BY THE DOUBLE ARROW
RIGHT BESIDE THE LOG. COAL FLAGS ARE MARKED BY THE RED COLOUR LEFT BESIDE THE POROSITY LOG.
THE WELL LOG WAS PROVIDED BY STATOIL. ................................................................................................ 42
FIGURE 15 WELL LOG SECTION OF PROFILE 6507/7-2 SHOWING THE POROSITY LOG (LEFT), WATER SATURATION
LOG (MIDDLE) AND PERMEABILITY LOG (RIGHT). THE DEPTH OF THE ANALYSED RESERVOIR ROCKS AS WELL
AS THE INTERVAL FOR THE OIL SAMPLES (DSTS) IS MARKED RIGHT BESIDE THE PERMEABILITY LOG. THE
WELL LOG WAS PROVIDED BY STATOIL. ....................................................................................................... 43
FIGURE 16 WELL LOG SECTION OF PROFILE 6507/ 7-3 SHOWING THE GAMMA RAY LOG (LEFT), RESISTIVITY LOG
(MIDDLE) AND ACOUSTIC LOG (RIGHT). THE RESERVOIR ROCKS AND THE OIL SAMPLES (DST) WITH THEIR
API GRAVITY ARE MARKED BY THE COLOURED CIRCLES. THE NUMBERS IN THE GREEN RECTANGLES GIVE
THE DST NUMBERS. THE WELL LOG IS TAKEN FROM THE OFFICIAL NPD WEBSITE
(WWW.FACTPAGES.NPD.NO/FACTPAGES). ..................................................................................................... 45
FIGURE 17 WELL LOG SECTION OF PROFILE 6507/7-4 SHOWING THE GAMMA RAY LOG (LEFT), RESISTIVITY LOG
(MIDDLE) AND ACOUSTIC LOG (RIGHT). THE RESERVOIR ROCKS AND THE OIL SAMPLES (DSTS) WITH THEIR
API GRAVITY ARE MARKED BY COLOURED CIRCLES. THE NUMBERS IN THE GREEN RECTANGLES ARE THE
DST NUMBERS. THE WELL LOG IS TAKEN FROM THE OFFICIAL NPD WEBSITE
(WWW.FACTPAGES.NPD.NO/FACTPAGES). ..................................................................................................... 46
FIGURE 18 WELL LOG SECTION OF THE PROFILE 6507/7-5 SHOWING THE GAMMA RAY LOG (LEFT), RESISTIVITY LOG
(MIDDLE) AND ACOUSTIC LOG (RIGHT). THE RESERVOIR ROCKS AND THE OIL SAMPLES (DSTS) WITH THEIR
API GRAVITY ARE MARKED BY DIFFERENT COLOURED CIRCLES. THE NUMBERS IN THE GREEN RECTANGLES
ARE THE DST NUMBERS. THE WELL LOG IS TAKEN FROM THE OFFICIAL NPD WEBSITE
(WWW.FACTPAGES.NPD.NO/FACTPAGES). ..................................................................................................... 47
FIGURE 19 WELL LOG SECTION OF THE PROFILE 6507/7-6 SHOWING THE GAMMA RAY LOG (LEFT), RESISTIVITY LOG
(MIDDLE) AND ACOUSTIC LOG (RIGHT). THE RESERVOIR ROCKS AND THE OIL SAMPLES (DSTS) WITH THEIR
API GRAVITY ARE MARKED BY PURPLE AND GREEN CIRCLES. THE NUMBERS IN THE GREEN RECTANGLES ARE
THE DST NUMBERS. THE WELL LOG IS TAKEN FROM THE OFFICIAL NPD WEBSITE
(WWW.FACTPAGES.NPD.NO/FACTPAGES). ..................................................................................................... 48
FIGURE 20 WELL LOG SECTION OF PROFILE 6507/8-1 SHOWING THE GAMMA RAY LOG (LEFT), ACOUSTIC LOG
(MIDDLE), AND RESISTIVITY LOG (RIGHT). THE RESERVOIR ROCKS AND THE OIL SAMPLES (DSTS) WITH THEIR
API GRAVITY ARE MARKED BY RED AND GREEN CIRCLES. THE NUMBERS IN THE GREEN RECTANGLES ARE
THE DST NUMBERS. DOLOMITE- / CALCITE-CEMENTED ZONES ARE MARKED BY RED ARROWS. THE WELL LOG
IS FROM THE OFFICIAL NPD WEBSITE (WWW.FACTPAGES.NPD.NO/FACTPAGES). .......................................... 50
FIGURE 21 WELL LOG SECTION OF PROFILE 8-4 SHOWING THE GAMMA RAY LOG (LEFT), ACOUSTIC LOG (MIDDLE),
AND RESISTIVITY LOG (RIGHT). THE RESERVOIR ROCKS AND THE OIL SAMPLES (DSTS) WITH THEIR API
LIST OF FIGURES XI
GRAVITY ARE MARKED BY PURPLE AND GREEN CIRCLES. THE NUMBERS IN THE GREEN RECTANGLES ARE THE
DST NUMBERS. THE WELL LOG IS TAKEN FROM THE OFFICIAL NPD WEBSITE
(WWW.FACTPAGES.NPD.NO/FACTPAGES). ..................................................................................................... 51
FIGURE 22 EXEMPLIFIED ILLUSTRATIONS OF THE THERMAL DISTILLATION AND PYROLYSIS YIELDS FROM
RESERVOIR ROCK SAMPLES. THE RESULTING THERMATOGRAM PROVIDES A ASSESSMENT OF OIL QUALITY
BASED ON THE DISTRIBUTION OF THERMALLY EXTRACTABLE COMPOUNDS (S1) AND PYROLYSIS PRODUCTS
(S2) (MODIFIED AFTER JARVIE ET AL., 2001). ............................................................................................... 59
FIGURE 23 EXAMPLE PYROLYSIS GAS CHROMATOGRAM SHOWS PYROLYSIS PRODUCTS MENTIONED IN THE TEXT
USED FOR THE DATA INTERPRETATION. MAIN COMPOUNDS ARE MARKED BY DIFFERENT RED SYMBOLS. THE
N-ALKENE / ALKANE DOUBLETS ARE MARKED BY DOTS, MONOAROMATIC HYDROCARBONS BY TRIANGLES,
DIAROMATIC COMPOUNDS BY RECTANGLES, SULPHUR COMPOUNDS BY STARS AND PHENOL COMPOUNDS BY
HEARTS. PYROLYSIS PRODUCTS IN THE RANGE OF C6 UP TO C14 ARE ENLARGED AND LABELLED. ................. 62
FIGURE 24 BASIS CONCEPT OF THE NEW SULPHUR TERNARY DIAGRAM BASED ON WORK OF SINNINGHE DAMSTE ET
AL. (1989) AND EGLINTON ET AL. (1992). ..................................................................................................... 64
FIGURE 25 PI (PRODUCTION INDEX) FOR ALL RESERVOIR ROCK SAMPLES OF THE HEIDRUN OIL FIELD. EACH SINGLE
WELL IS SHOWN IN DIFFERENT COLOURED BARS. THE PI WITHIN SINGLE WELLS IS SHOWN FROM THE WELL
TOP TO THE WELL BOTTOM WITH INCREASING DEPTH. RESERVOIR ROCK SAMPLES FROM NPD WELLS NAMED
WITH NUMBERS (6507/7-2, 6507/7-3, 6507/7-4, 6507/7-5, 6507/7-6, 6507/7-8, 6507/8-1, AND 6507/8-4).
STATOIL WELLS NAMED WITH THE LETTERS A, B, C, D, AND E. THE DOTTED LINES MARK THE OWC WITHIN
THE SINGLE WELLS. ...................................................................................................................................... 66
FIGURE 26 ORGANIC RICHNESS QUANTIFIED IN MG/G ORGANIC MATTER (OM) PER SAMPLE FOR ALL RESERVOIR
ROCKS OF THE HEIDRUN OIL FIELD. EACH SINGLE WELL IS SHOWN IN DIFFERENT COLOURED BARS. THE
ORGANIC RICHNESS WITHIN SINGLE WELLS IS SHOWN FROM THE WELL TOP TO THE WELL BOTTOM WITH
INCREASING DEPTH. RESERVOIR ROCK SAMPLES OF THE NPD WELLS ARE NAMED WITH NUMBERS (6507/7-2,
6507/7-3, 6507/7-4, 6507/7-5, 6507/7-6, 6507/7-8, 6507/8-1, AND 6507/8-4). WELLS FROM STATOIL ARE
NAMED WITH LETTERS A, B, C, D, AND E. .................................................................................................... 68
FIGURE 27 COMPARISON OF THE C5+ TOTAL PYROLYSIS YIELD OF SELECTED RESERVOIR ROCKS FROM DIFFERENT
WELLS AND RESERVOIR FORMATIONS BEFORE (RED) AND AFTER EXTRACTION (BLACK). LETTERS OR
NUMBERS BEFORE THE HYPHEN IN THE SAMPLE NAME NOMINATE THE WELL THE SAMPLE WAS TAKEN FROM.
..................................................................................................................................................................... 69
FIGURE 28 PHOTOS OF THE TWO POTENTIAL SOURCE ROCK SHALES OF THE HEIDRUN RESERVOIR. LEFT: THE
POTENTIAL SOURCE ROCK FROM THE UPPER JURASSIC SPEKK FORMATION, RIGHT: THE POTENTIAL SOURCE
ROCK FROM THE MIDDLE JURASSIC MELKE FORMATION. ............................................................................ 70
FIGURE 29 SELECTED PYROLYSIS GAS CHROMATOGRAMS OF WELL C FROM THE GARN-, ILE- AND ÅRE
FORMATION. ALKENE/ALKANE DOUBLETS, MONO- AND DIAROMATIC HYDROCARBONS, MOST ABUNDANT
ALKYLTHIOPHENES AND PHENOLIC COMPOUNDS ARE MARKED CORRESPONDING TO RETENTION TIME FROM
THE LEFT TO THE RIGHT. MONOAROMATIC HYDROCARBONS: BENZENE, TOLUENE, ETHYLBENZENE, M-/P-
XYLENE AND O-XYLENE; DIAROMATIC HYDROCARBONS: NAPHTHALENE, 2 METHYLNAPHTHALENE,
1 METHYLNAPHTHALENE AND TWO DIMETHYLNAPHTHALENES; ALKYLTHIOPHENES: 2 METHYLTHIOPHENE,
3 METHYLTHIOPHENE, 2.5 METHYLTHIOPHENE, 2.4 METHYLTHIOPHENE, 2.3 METHYLTHIOPHENE, AND
ETHYLMETHYLTHIOPHENE. .......................................................................................................................... 73
LIST OF FIGURES XII
FIGURE 30 GEOCHEMICAL PROFILES SHOWING PYROLYSIS-GC PRODUCTS FROM THE RESERVOIR ROCK SCREENING
OF WELL C. FROM A TO E THE AROMATICITY (A), MONOAROMATIC/DIAROMATIC HYDROCARBON RATIO (B),
RELATIVE PHENOL AMOUNT (C), GAS WETNESS (D) AND GAS AMOUNT (E) ARE SHOWN. ............................. 75
FIGURE 31 CORRELATION OF AROMATICITY AND MONOAROMATIC VERSUS DIAROMATIC HYDROCARBON RATIO OF
WELL C INCLUDING RESERVOIR ROCKS OF THE GARN FM., ILE FM. 2 - 6, AND NOT FM. THE YELLOW LINE
MARKS THE TREND OBSERVED IN THE GARN FM. ......................................................................................... 76
FIGURE 32 LEFT: INVERSE CORRELATION OF AROMATICITY AND GAS WETNESS FOR ALL RESERVOIR ROCKS OF
WELL C. RIGHT: INVERSE CORRELATION OF AROMATICITY AND GAS WETNESS WITHOUT THE ÅRE FM. COALS.
COLOURED LINES MARK THE TRENDS OBSERVED IN THE INDIVIDUAL RESERVOIR FORMATIONS, BLUE FOR THE
ILE FM., YELLOW FOR THE GARN FM., AND PURPLE FOR THE ÅRE FORMATION............................................ 77
FIGURE 33 GOR AND UNRESOLVED COMPOUND MIXTURE (UCM) IN PERCENT OF RESERVOIR ROCKS FROM PROFILE
C. SAMPLES WITH PHENOL RATIO > 1 (COAL) ARE DISREGARDED. ............................................................... 78
FIGURE 34 BULK PROPERTIES OF THE RESERVOIR- AND SOURCE ROCK PYROLYSATES CONCERNING (A) ALKYL
CHAIN LENGTH DISTRIBUTION, (B) PHENOL CONTENT, AND (C - D) SULPHUR CONTENT............................... 80
FIGURE 35 COMPARISON OF THE AROMATICITY (LEFT) ANALYSED IN WELL C TO A WELL LOG SECTION OF THE
PROFILE (RIGHT) INCLUDING POROSITY, WATER SATURATION, AND PERMEABILITY. COALY SAMPLES ARE NOT
CONSIDERED. THE WELL LOG IS PROVIDED STATOIL. ................................................................................... 82
FIGURE 36 DEPTH PLOT OF THE AROMATICITY AND C1+ OF THE RESOLVED COMPOUNDS (LEFT) AND AROMATICITY
VERSUS C1+ OF THE RESOLVED COMPOUNDS (RIGHT) OF THE RESERVOIR ROCKS OF WELL C. ....................... 84
FIGURE 37 VISCOSITY (LEFT), API DENSITY (MIDDLE) AND ASPHALTENE WT.% (RIGHT) OF THE HEAVY OIL
RESERVOIR ROCK EXTRACTS FROM THE WCSB VERSUS INCREASING DEPTH. ............................................... 86
FIGURE 38 WHOLE OIL CHROMATOGRAMS OF THE HEAVY OIL EXTRACTS, SHOWN FROM THE TOP TO THE BOTTOM
WITH INCREASING BIODEGRADATION LEVEL. ............................................................................................... 87
FIGURE 39 PI OF THE HEAVY OIL SERIES FROM THE WCSB VERSUS VISCOSITY (LEFT) AND VERSUS °API GRAVITY
(RIGHT)......................................................................................................................................................... 88
FIGURE 40 LEFT HEAVY OIL CHROMATOGRAMS FROM PYROLYSIS-GC EXPERIMENTS. RIGHT GEOCHEMICAL DEPTH
PLOTS FOR AROMATICITY VERSUS VISCOSITY (TOP), AND AROMATICITY VERSUS API GRAVITY (BOTTOM).
BOTH, THE PYROLYSIS GAS CHROMATOGRAMS AND DEPTH PLOTS ARE SHOWN FROM THE TOP TO THE
BOTTOM OF THE PROFILE. THE DIFFERENCE IN THE DATA POINTS OF THE AROMATICITY - VISCOSITY PLOT
RESULTS FROM THE CONSPICUOUS JUMP IN VISCOSITY FROM SAMPLE 3 TO SAMPLE 4 THAT IS NOT REFLECTED
IN THE API GRAVITY. ................................................................................................................................... 89
FIGURE 41 LEFT GOR OF THE HEAVY OIL SERIES FROM THE WCSB VERSUS VISCOSITY. RIGHT GOR OF THE HEAVY
OIL SERIES CORRELATED TO THE AROMATICITY. .......................................................................................... 91
FIGURE 42 LEFT UCM (%) OF THE HEAVY OIL SERIES FROM THE WCSB VERSUS VISCOSITY. RIGHT UCM (IN %) OF
THE HEAVY OIL SERIES CORRELATED TO THE AROMATICITY......................................................................... 91
FIGURE 43 CORRELATION OF API GRAVITY AND ASPHALTENE AMOUNT IN WT.% OF SELECTED HEIDRUN OILS WITH
API GRAVITY BETWEEN 20° AND 29°. .......................................................................................................... 92
FIGURE 44 WHOLE-OIL CHROMATOGRAMS OF THE OIL SAMPLES OF WELL 6507/7-2 AND 6507/8-1 WITH API
GRAVITY BETWEEN 20° AND 29° FROM THE HEIDRUN OIL FIELD. ................................................................. 93
FIGURE 45 PRODUCTION INDEX (PI) OF ALL OIL SAMPLES AND CONDENSATES ANALYSED IN THE HEIDRUN OIL
FIELD VERSUS CORRESPONDING API GRAVITY. ............................................................................................ 94
LIST OF FIGURES XIII
FIGURE 46 GEOCHEMICAL DEPTH PLOTS FOR THE AROMATICITY (LEFT) AND THE PYROLYSIS GAS
CHROMATOGRAMS OF THE FIVE HEIDRUN OILS (RIGHT). FROM THE TOP TO THE BOTTOM, THE OIL PYROLYSIS
GAS CHROMATOGRAMS ARE SHOWN WITH DECREASING API GRAVITY. ....................................................... 95
FIGURE 47 GEOCHEMICAL PROFILES OF THE PYROLYSIS PRODUCTS FROM THE RESERVOIR ROCK SCREENING OF
WELL B. FROM A TO E THE AROMATICITY (A), MONOAROMATIC/DIAROMATIC HYDROCARBON RATIO (B),
RELATIVE PHENOL AMOUNT (C), GAS WETNESS (D) AND GAS AMOUNT (E) ARE SHOWN. THE DASHED LINES
MARK THE CALCITE-CEMENTED ZONES DETECTED. ...................................................................................... 97
FIGURE 48 LEFT: GEOCHEMICAL DEPTH PROFILE FOR THE AROMATICITY IN WELL B AND THE CALCITE-CEMENTED
ZONES DETECTED (DOTTED LINES). THE GREY SHADED AREAS SHOW A FIRST INTERPRETATION OF THE
AROMATICITY TREND. RIGHT: THE AROMATICITY OF THE SINGLE TILJE FM. SUBUNITS IS SHOWN. .............. 98
FIGURE 49 INVERSE CORRELATION OF THE AROMATICITY AND GAS WETNESS FOR ALL RESERVOIR ROCKS OF WELL
B. THE LINE MARK THE TREND OBSERVED IN THE TILJE FORMATION. .......................................................... 98
FIGURE 50 GOR VALUES FOR THE RESERVOIR ROCKS OF WELL B. THE DASHED LINE MARKS THE CALCITE-
CEMENTED ZONE AT 3255 M MD-RKB. ....................................................................................................... 99
FIGURE 51 BULK PROPERTIES OF THE RESERVOIR ROCK PYROLYSATES OF WELL B AND SOURCE ROCK PYROLYSIS
PRODUCTS CONCERNING (A) ALKYL CHAIN LENGTH DISTRIBUTION, (B) PHENOL CONTENT, AND (C - D)
SULPHUR CONTENT. .................................................................................................................................... 100
FIGURE 52 GEOCHEMICAL DEPTH PROFILE SHOWING AROMATICITY OF WELL B (LEFT) IN RELATION TO THE
POROSITY LOG (MIDDLE) AND THE DEPTH PLOT OF THE POROSITY FOR ALL RESERVOIR ROCKS IN THE WHOLE
PROFILE (RIGHT). ........................................................................................................................................ 102
FIGURE 53 GEOCHEMICAL DEPTH PROFILE OF THE AROMATICITY OF WELL B (LEFT) IN RELATION TO THE
PERMEABILITY LOG (MIDDLE) AND THE DEPTH PLOT OF THE PERMEABILITY FOR ALL RESERVOIR ROCKS IN
THE WHOLE PROFILE (RIGHT). ..................................................................................................................... 103
FIGURE 54 GEOCHEMICAL DEPTH PROFILE OF THE AROMATICITY OF WELL B (LEFT) IN RELATION TO THE WATER
SATURATION LOG (RIGHT). ......................................................................................................................... 103
FIGURE 55 DEPTH PLOT OF THE AROMATICITY OF WELL B AND THE C1+ OF RESOLVED COMPOUNDS (LEFT) AND THE
AROMATICITY VERSUS C1+ OF THE RESOLVED COMPOUNDS (RIGHT). ......................................................... 104
FIGURE 56 GEOCHEMICAL PROFILES OF THE PYROLYSIS PRODUCTS FROM THE RESERVOIR ROCK SCREENING OF
WELL A. FROM A TO E THE AROMATICITY (A), MONOAROMATIC/DIAROMATIC HYDROCARBON RATIO (B),
RELATIVE PHENOL AMOUNT (C), GAS WETNESS (D) AND GAS AMOUNT (E) ARE SHOWN. THE GREY DASHED
LINE MARK A PROMINENT SHALE. ............................................................................................................... 106
FIGURE 57 LEFT GEOCHEMICAL PROFILE FOR THE AROMATICITY OF WELL A WITHOUT RESERVOIR ROCKS
CONTAINING DISSEMINATED COAL. RIGHT PHENOL DEPTH PLOT INDICATE THE RESERVOIR ROCKS WITH
DISSEMINATED COALS. THE GREY DASHED LINE MARK A PROMINENT SHALE AT 3225 M MD-RKB. .......... 107
FIGURE 58 LEFT CORRELATION OF THE AROMATICITY AND THE GAS WETNESS INCLUDING ALL RESERVOIR ROCKS
ANALYSED IN WELL A. RIGHT CORRELATION OF THE AROMATICITY AND THE GAS WETNESS WITHOUT
PHENOL RICH RESERVOIR ROCKS. THE BLACK LINE INDICATES THE TREND OBSERVED IN WELL A. ............ 108
FIGURE 59 LEFT GOR FOR THE INDIVIDUAL ÅRE FM. SUBUNITS OF WELL A. RIGHT UCM FOR THE INDIVIDUAL ÅRE
FM. SUBUNITS OF WELL A. RESERVOIR ROCKS WITH PHENOL RATIO > 1 ARE EXCLUDED IN BOTH PLOTS. THE
GREY DASHED LINE MARK A PROMINENT SHALE. ........................................................................................ 109
LIST OF FIGURES XIV
FIGURE 60 BULK PROPERTIES FOR THE RESERVOIR ROCK- AND SOURCE ROCK PYROLYSIS PRODUCTS OF WELL A,
CONCERNING (A) ALKYL CHAIN LENGTH DISTRIBUTION, (B) PHENOL CONTENT, AND (C - D) SULPHUR
CONTENT. ................................................................................................................................................... 110
FIGURE 61 AROMATICITY FOR THE RESERVOIR ROCKS OF THE INDIVIDUAL ÅRE RESERVOIR SUBZONES OF WELL A.
RESERVOIR ROCK SAMPLES WITH COAL ARE EXCLUDED IN THE PLOT. THE GREY DASHED LINE MARK A
PROMINENT SHALE. .................................................................................................................................... 111
FIGURE 62 LEFT DEPTH PLOT SHOWING THE RESERVOIR ROCK AROMATICITY OF WELL A AND THE C1+ OF THE
RESOLVED COMPOUNDS. RIGHT AROMATICITY VERSUS C1+ OF THE RESOLVED COMPOUNDS. .................... 112
FIGURE 63 GEOCHEMICAL PROFILES OF THE PYROLYSIS PRODUCTS FROM THE RESERVOIR ROCK SCREENING OF
WELL E. FROM A TO E THE AROMATICITY (A), MONOAROMATIC/DIAROMATIC HYDROCARBON RATIO (B),
RELATIVE PHENOL AMOUNT (C), GAS WETNESS (D) AND GAS AMOUNT (E) ARE SHOWN. GREY SHADED AREAS
INDICATE ZONES OF ALTERNATING SHALES AND SANDSTONES BASED ON THE CORE DESCRIPTION AND CORE
PHOTOS....................................................................................................................................................... 114
FIGURE 64 LEFT GEOCHEMICAL PROFILE FOR THE AROMATICITY OF WELL E (LEFT). RESERVOIR ROCKS WITH
DISSEMINATED COAL ARE NOT CONSIDERED IN THE PLOT. GREY SHADED AREAS INDICATE ZONES OF
ALTERNATING SHALES AND SANDSTONES. RIGHT PHENOL RATIO DEPTH PLOT SHOWING THE RESERVOIR
ROCKS WITH DISSEMINATED COALS. ........................................................................................................... 115
FIGURE 65 LEFT CORRELATION OF AROMATICITY AND GAS WETNESS INCLUDING ALL RESERVOIR ROCKS
ANALYSED IN WELL A. RIGHT CORRELATION OF AROMATICITY AND GAS WETNESS WITHOUT PHENOL RICH
RESERVOIR ROCKS IN WELL A. THE LINE MARKS THE CORRELATION TREND OBSERVED. ............................ 116
FIGURE 66 BULK PROPERTIES OF THE RESERVOIR- AND SOURCE ROCK PYROLYSATES OF WELL E CONCERNING (A)
ALKYL CHAIN LENGTH DISTRIBUTION, (B)RELATIVE PHENOL CONTENT, AND (C - D) RELATIVE SULPHUR
CONTENT. ................................................................................................................................................... 117
FIGURE 67 PYROLYSIS GAS CHROMATOGRAMS OF RESERVOIR ROCK SAMPLES NO. 11 (G004276) (TOP) AND NO. 14
(G004281) (BOTTOM) OF WELL E. .............................................................................................................. 118
FIGURE 68 GEOCHEMICAL PROFILES OF THE PYROLYSIS PRODUCTS FROM THE RESERVOIR ROCK SCREENING OF
WELL D. FROM A TO E THE AROMATICITY (A), MONOAROMATIC/DIAROMATIC HYDROCARBON RATIO (B),
RELATIVE PHENOL AMOUNT (C), GAS WETNESS (D) AND GAS AMOUNT (E) ARE SHOWN. ........................... 121
FIGURE 69 TOP: EXAMPLE PYROLYSIS GAS CHROMATOGRAM FOR THE RESERVOIR ROCKS FROM THE WATER-
SATURATED ZONE OF WELL D NEAR THE OWC. THESE SAMPLES ARE CHARACTERISED BY HIGH PHENOL
CONTENT AND A SIGNIFICANT AMOUNT OF AROMATICS IN THE PYROLYSATES. BOTTOM: EXAMPLE PYROLYSIS
GAS CHROMATOGRAM FOR THE RESERVOIR ROCKS FROM THE OIL-SATURATED ZONE OF WELL D. THESE
RESERVOIR ROCKS ARE CHARACTERISED BY NORMAL ALKENE/ALKANE DOUBLETS, MINOR AMOUNTS OF
AROMATIC COMPOUNDS AND A HIGH AMOUNT OF WAXY COMPOUNDS. ...................................................... 122
FIGURE 70 BULK PROPERTIES OF THE RESERVOIR ROCK AND SOURCE ROCK PYROLYSATES OF WELL D CONCERNING
(A) ALKYL CHAIN LENGTH DISTRIBUTION, (B) PHENOL CONTENT, AND (C - ) SULPHUR CONTENT. THE
PYROLYSIS CHROMATOGRAM SHOW THE LOWERMOST RESERVOIR ROCK NO. 6 (G004258) CHARACTERISED
BY HIGH WAX CONTENT. ............................................................................................................................. 124
FIGURE 71 GEOCHEMICAL PROFILES OF THE PYROLYSIS PRODUCTS FROM THE RESERVOIR ROCK SCREENING OF
WELL 6507/8-4. FROM A TO E AROMATICITY (A), MONOAROMATIC/DIAROMATIC HYDROCARBON RATIO (B),
LIST OF FIGURES XV
RELATIVE PHENOL AMOUNT (C), GAS WETNESS (D) AND GAS AMOUNT (E) ARE SHOWN. THE ADDITIONAL
PLOTS ENLARGE THE SCREENING RESULTS FOR THE RESERVOIR ROCKS NEAR THE OWC. .......................... 127
FIGURE 72 INVERSE CORRELATION OF THE AROMATICITY AND GAS WETNESS FOR THE RESERVOIR ROCKS OF WELL
6507/8-4 ABOVE THE OWC. BOTH RESERVOIR ROCKS BELOW THE OWC SHOW LOWER GAS WETNESS. .... 128
FIGURE 73 LEFT GOR ANALYSED IN THE RESERVOIR ROCKS OF WELL 6507/8-4. RIGHT THE PERCENTAGE OF THE
UNRESOLVED COMPOUND MIXTURE (UCM) OF THESE RESERVOIR ROCKS. ................................................. 128
FIGURE 74 BULK PROPERTIES OF THE RESERVOIR- AND SOURCE ROCK PYROLYSIS PRODUCTS OF WELL 6507/8-4
CONCERNING (A) ALKYL CHAIN LENGTH DISTRIBUTION, (B) PHENOL CONTENT, AND (C-D) SULPHUR
CONTENT. ................................................................................................................................................... 129
FIGURE 75 GEOCHEMICAL PROFILES OF THE PYROLYSIS PRODUCTS FROM THE RESERVOIR ROCK SCREENING OF
WELL 6507/7-6. FROM A TO E THE AROMATICITY (A), MONOAROMATIC/DIAROMATIC HYDROCARBON RATIO
(B), RELATIVE PHENOL AMOUNT (C), GAS WETNESS (D) AND GAS AMOUNT (E) ARE SHOWN. .................... 132
FIGURE 76 INVERSE CORRELATIONS OF THE AROMATICITY AND GAS WETNESS OBSERVED IN THE RESERVOIR ROCK
PYROLYSATES OF WELL 6507/7-6. THE LINE MARK THE TREND OBSERVED. ............................................... 132
FIGURE 77 BULK PROPERTIES OF THE RESERVOIR- AND SOURCE ROCK PYROLYSATES OF WELL 6507/7-6
CONCERNING (A) ALKYL CHAIN LENGTH DISTRIBUTION, (B) PHENOL CONTENT, AND (C - D) SULPHUR
CONTENT. ................................................................................................................................................... 133
FIGURE 78 GEOCHEMICAL PROFILES OF THE PYROLYSIS PRODUCTS FROM THE RESERVOIR ROCK SCREENING OF
WELL 6507/7-5. FROM A TO D AROMATICITY (A), MONOAROMATIC/DIAROMATIC HYDROCARBON RATIO (B),
RELATIVE PHENOL AMOUNT (C), GAS WETNESS (D) AND GAS AMOUNT (E) ARE SHOWN. ........................... 135
FIGURE 79 BULK PROPERTIES OF THE RESERVOIR- AND SOURCE ROCK PYROLYSIS PRODUCTS OF WELL 6507/7-5
CONCERNING (A) THE ALKYL CHAIN LENGTH DISTRIBUTION, (B) THE PHENOL CONTENT, AND (C-D) THE
SULPHUR CONTENT. .................................................................................................................................... 137
FIGURE 80 GEOCHEMICAL PROFILES OF THE PYROLYSIS PRODUCTS FROM THE RESERVOIR ROCK SCREENING OF
WELL 6507/7-2. FROM A TO D THE AROMATICITY (A), MONOAROMATIC/DIAROMATIC HYDROCARBON RATIO
(B), RELATIVE PHENOL AMOUNT (C), GAS WETNESS (D) AND GAS AMOUNT (E) ARE SHOWN. .................... 139
FIGURE 81 BULK PROPERTIES OF THE RESERVOIR- AND SOURCE ROCK PYROLYSATES OF WELL 6507/7-2
CONCERNING (A) ALKYL CHAIN LENGTH DISTRIBUTION, (B) PHENOL CONTENT, AND (C - D) SULPHUR
CONTENT. THE PYROLYSIS GAS CHROMATOGRAM SHOW SAMPLE G003998 CHARACTERISED BY LARGE
AMOUNTS OF LONG ALKYL CHAINS. ............................................................................................................ 140
FIGURE 82 GEOCHEMICAL PROFILES OF THE PYROLYSIS PRODUCTS FROM THE RESERVOIR ROCK SCREENING OF
WELL 6507/7-3. FROM A TO D THE AROMATICITY (A), MONOAROMATIC/DIAROMATIC HYDROCARBON RATIO
(B), RELATIVE PHENOL AMOUNT (C), GAS WETNESS (D) AND GAS AMOUNT (E) ARE SHOWN. .................... 143
FIGURE 83 BULK PROPERTIES OF THE RESERVOIR- AND SOURCE ROCK PYROLYSIS PRODUCTS OF WELL 6507/7-3
CONCERNING (A) ALKYL CHAIN LENGTH DISTRIBUTION, (B) PHENOL CONTENT, AND (C - D) SULPHUR
CONTENT. THE PYROLYSIS GAS CHROMATOGRAM SHOW RESERVOIR ROCK SAMPLE G004003 FROM THE ILE
FM. 4 - 6) CHARACTERISED BY SLIGHTLY HIGHER AMOUNTS OF LONG ALKYL CHAINS. .............................. 144
FIGURE 84 GEOCHEMICAL PROFILES OF THE PYROLYSIS PRODUCTS FROM THE RESERVOIR ROCK SCREENING OF
WELL 6507/7-4. FROM A TO D THE AROMATICITY (A), MONOAROMATIC/DIAROMATIC HYDROCARBON RATIO
(B), RELATIVE PHENOL AMOUNT (C), GAS WETNESS (D) AND THE GAS AMOUNT (E) ARE SHOWN. ............. 147
LIST OF FIGURES XVI
FIGURE 85 BULK PROPERTIES OF THE RESERVOIR- AND SOURCE ROCK PYROLYSIS PRODUCTS OF WELL 6507/7-4
CONCERNING (A) ALKYL CHAIN LENGTH DISTRIBUTION, (B) RELATIVE PHENOL CONTENT, AND (C - D)
RELATIVE SULPHUR CONTENT. THE PYROLYSIS GAS CHROMATOGRAM OF RESERVOIR ROCK SAMPLE G004023
FROM THE GARN FM. SHOWS EXEMPLARY THE LARGER AMOUNTS OF MEDIUM- AND LONG ALKYL CHAINS,
WHICH ARE TYPICAL FOR ALL RESERVOIR ROCKS WITHIN WELL 6507/7-4. ................................................. 148
FIGURE 86 GEOCHEMICAL PROFILES OF THE PYROLYSIS PRODUCTS FROM THE RESERVOIR ROCK SCREENING OF
WELL 6507/7-8. FROM A TO E THE AROMATICITY (A), MONOAROMATIC/DIAROMATIC HYDROCARBON RATIO
(B), RELATIVE PHENOL AMOUNT (C), GAS WETNESS (D) AND GAS AMOUNT (E) ARE SHOWN. .................... 151
FIGURE 87 BULK PROPERTIES OF THE RESERVOIR ROCK AND SOURCE ROCK PYROLYSATES OF WELL 6507/7-8
CONCERNING (A) ALKYL CHAIN LENGTH DISTRIBUTION, (B) RELATIVE PHENOL CONTENT, AND (C - D)
RELATIVE SULPHUR CONTENT. ................................................................................................................... 152
FIGURE 88 GEOCHEMICAL PROFILES OF THE PYROLYSIS PRODUCTS FROM THE RESERVOIR ROCK SCREENING OF
WELL 6507/8-1. FROM A TO E THE AROMATICITY (A), MONOAROMATIC/DIAROMATIC HYDROCARBON RATIO
(B), RELATIVE PHENOL AMOUNT (C), GAS WETNESS (D) AND GAS AMOUNT (E) ARE SHOWN. .................... 155
FIGURE 89 LEFT GOR ANALYSED IN THE RESERVOIR ROCKS OF WELL 6507/8-1. RIGHT PERCENTAGE OF THE
UNRESOLVED COMPOUND MIXTURE (UCM) OF THESE RESERVOIR ROCKS. ................................................. 155
FIGURE 90 BULK PROPERTIES OF THE RESERVOIR- AND SOURCE ROCK PYROLYSIS PRODUCTS OF WELL 6507/8-1
CONCERNING (A) ALKYL CHAIN LENGTH DISTRIBUTION, (B) RELATIVE PHENOL CONTENT, AND (C - D)
RELATIVE SULPHUR CONTENT. ................................................................................................................... 156
FIGURE 91 BAR CHART DIAGRAMS SHOWING THE PY-GC PARAMETER FROM THE LOWEST TO THE HIGHEST VALUE
FOR ALL RESERVOIR ROCK AND BOTH POTENTIAL SOURCE ROCK SAMPLES ANALYSED IN THE HEIDRUN OIL
FIELD. FROM A TO E THE AROMATICITY (A), GAS WETNESS (B), GAS AMOUNT IN % (C) AND
MONOAROMATIC/DIAROMATIC HYDROCARBON RATIO (D) ARE SHOWN. RESERVOIR ROCKS WITH
DISSEMINATED COAL ARE DISREGARDED IN THE PLOTS. ............................................................................. 159
FIGURE 92 INVERSE CORRELATIONS OF AROMATICITY AND GAS WETNESS FOR THE INDIVIDUAL RESERVOIR
FORMATIONS GARN, ILE, TILJE AND ÅRE. THE TWO HIGH AROMATIC RESERVOIR ROCK SAMPLES FROM THE
ÅRE FORMATION (UPPER PART OF WELL D) ARE NOT CONSIDERED IN THESE PLOT. THE BLACK LINES MARK
THE TRENDS OBSERVED. ............................................................................................................................. 160
FIGURE 93 LINEAR CORRELATIONS OF THE AROMATICITY AND THE GAS PERCENTAGE FOR THE INDIVIDUAL
RESERVOIR FORMATIONS GARN, ILE, TILJE AND ÅRE. THE TWO HIGHLY AROMATIC RESERVOIR ROCKS
(UPPER PART OF WELL D) ARE NOT CONSIDERED IN THESE PLOT. THE BLACK LINES MARK THE TRENDS
OBSERVED. ................................................................................................................................................. 161
FIGURE 94 CORRELATIONS BETWEEN OF THE AROMATICITY AND THE MONOAROMATIC / DIAROMATIC
HYDROCARBON RATIO OF THE INDIVIDUAL RESERVOIR FORMATIONS GARN, ILE, TILJE AND ÅRE. THE TWO
HIGH AROMATIC RESERVOIR ROCK SAMPLES FROM THE ÅRE FORMATION (UPPER PART OF WELL D) ARE NOT
CONSIDERED IN THESE PLOT. THE BLACK LINES MARK THE TRENDS OBSERVED. ........................................ 162
FIGURE 95 DISTRIBUTIONS OF THE AROMATICITY (A), GAS WETNESS (B), GAS PERCENTAGE (C), AND
MONOAROMATIC / DIAROMATIC HYDROCARBON RATIO (D) IN THE INDIVIDUAL RESERVOIR FORMATIONS OF
THE HEIDRUN OIL FIELD. THE COLOURED BOXES SHOW THE WELL NAME, THE AVERAGE VALUE OF THE PY-
GC PARAMETER AND ITS STANDARD DEVIATION IN BRACKETS. THE COLOURS OF THE BOXES REPRESENT THE
INDIVIDUAL RESERVOIR FORMATIONS. ....................................................................................................... 163
LIST OF FIGURES XVII
FIGURE 96 GOR DISTRIBUTIONS OF THE RESERVOIR ROCKS FROM THE NORTHERN, SOUTHERN, EASTERN, AND
WESTERN PART OF THE HEIDRUN OIL FIELD. N = NUMBER OF RESERVOIR ROCK SAMPLES. ......................... 166
FIGURE 97 BULK PROPERTIES OF THE INDIVIDUAL RESERVOIR FORMATIONS GARN-, ILE-, TILJE-, AND ÅRE
INCLUDING ALL RESERVOIR ROCK AND SOURCE ROCK SAMPLES ANALYSED IN THE HEIDRUN OIL FIELD. FROM
A TO E THE CLD (A), RELATIVE PHENOL CONTENT (B) AND RELATIVE SULPHUR CONTENT (C - D) ARE
SHOWN. ...................................................................................................................................................... 168
FIGURE 98 ALKYL CHAIN LENGTH DISTRIBUTION OF THE INDIVIDUAL RESERVOIR FORMATIONS WITHOUT
RESERVOIR ROCKS CONTAINING DISSEMINATED COAL. THE CLD SHOW THE GARN FM. (A), THE TILJE FM.
(B), THE ILE FM. (C) AND THE ÅRE FM. (D) RESERVOIR ROCK SAMPLES. ................................................... 169
FIGURE 99 ALKYL CHAIN LENGTH DISTRIBUTIONS OF THE INDIVIDUAL RESERVOIR FORMATIONS GARN (A), TILJE
(B), ILE. (C), AND ÅRE (D). RESERVOIR ROCKS CONTAINING DISSEMINATED COAL ARE GREEN COLOURED.
................................................................................................................................................................... 171
FIGURE 100 CORRELATION OF THE PHENOL RATIO AND GAS CONTENT OF THE RESERVOIR ROCKS CONTAINING
DISSEMINATED COAL. ................................................................................................................................. 172
FIGURE 101 ALKYL CHAIN LENGTH DISTRIBUTIONS OF RESERVOIR ROCKS WITH DISSEMINATED COAL ONLY,
COMPARED TO BOTH POTENTIAL SOURCE ROCK SAMPLES FROM THE SPEKK- AND MELKE FORMATION. .... 172
FIGURE 102 NEW SULPHUR TERNARY USING DIFFERENT ORGANIC SULPHUR PYROLYSIS PRODUCTS (OSPP) ON ITS
APICES AS REPRESENTATIVES FOR DIFFERENT LIPID PRECURSORS. 2ETHYL 5METHYLTHIOPHENE (2E5MT),
3METHYLTHIOPHENE (3MT), AND 2.4DIMETHYLTHIOPHENE (2.4DMT) REPRESENTING LINEAR, BRANCHED
AND ISOPRENOID LIPID PRECURSOR CARBON SKELETONS, RESPECTIVELY. ................................................. 174
FIGURE 103 REPRODUCIBILITY RESULTS FOR THE AGING TIME. THE ASPHALTENE AMOUNT (A), PI (B),
AROMATICITY (C) AND GOR (D) ARE SHOWN VERSUS INCREASING AGING TIME. ...................................... 183
FIGURE 104 LINEARITY TEST RESULTS OF THE INVESTIGATED METHOD. PRECIPITATED ASPHALTENE YIELDS (A), PI
(B), AROMATICITY (C) AND GOR (D) ARE PLOTTED VERSUS STEPWISE INCREASED OIL SAMPLE AMOUNTS.
................................................................................................................................................................... 183
FIGURE 105 RESERVOIR ROCK ASPHALTENE PYROLYSIS GAS CHROMATOGRAMS PRESENTING THE FORM OF
CONTAMINATION DETECTED. LEFT G004199 FROM THE GARN FORMATION IN WELL C; MIDDLE G004012
FROM THE ILE FORMATION OF WELL 6507/7-8; RIGHT G004023 FROM THE GARN FORMATION OF WELL
6507/7-4. .................................................................................................................................................... 185
FIGURE 106 GC-MS SPECTRA OF THE RESERVOIR ROCK ASPHALTENE G004199 FROM THE GARN FORMATION OF
WELL C. POLYETHYLENGLYCOL A DRILLING MUD ADDITIVE WAS IDENTIFIED. .......................................... 186
FIGURE 107 GEOCHEMICAL PROFILES OBTAINED FROM THE PYROLYSIS-GC PARAMETERS OF THE RESERVOIR ROCK
ASPHALTENES AND THEIR CORRESPONDING RESERVOIR ROCK SAMPLES FROM WELL C. FROM A TO E THE
AROMATICITY (A), MONOAROMATIC / DIAROMATIC HYDROCARBON RATIO (B), RELATIVE PHENOL AMOUNT
(C), GAS WETNESS (D), AND GAS AMOUNT (E) ARE SHOWN. ....................................................................... 187
FIGURE 108 BULK PROPERTIES OF THE RESERVOIR ROCK ASPHALTENE PYROLYSIS PRODUCTS OF WELL C IN
COMPARISON TO THE PYROLYSIS PRODUCTS OF THEIR CORRESPONDING RESERVOIR ROCK SAMPLES AND
BOTH POTENTIAL SOURCE ROCK SAMPLES ANALYSED IN THE HEIDRUN OIL FIELD. FROM A TO C THE ALKYL
CHAIN LENGTH DISTRIBUTION (A), THE PHENOL CONTENT (B), AND THE SULPHUR CONTENT (C) ARE SHOWN.
................................................................................................................................................................... 189
LIST OF FIGURES XVIII
FIGURE 109 GEOCHEMICAL PROFILES USING THE PYROLYSIS PRODUCTS OF THE RESERVOIR ROCK ASPHALTENES
AND THEIR CORRESPONDING RESERVOIR ROCK SAMPLES FROM WELL B. FROM A TO E THE AROMATICITY
(A), MONOAROMATIC / DIAROMATIC HYDROCARBON RATIO (B), RELATIVE PHENOL CONTENT (C), GAS
WETNESS (D), AND GAS CONTENT (E) ARE SHOWN. .................................................................................... 190
FIGURE 110 BULK PROPERTIES OF THE RESERVOIR ROCK ASPHALTENE PYROLYSIS PRODUCTS OF WELL B IN
COMPARISON TO THE PYROLYSIS PRODUCTS OF THEIR CORRESPONDING RESERVOIR ROCK SAMPLES AND
BOTH POTENTIAL SOURCE ROCK SAMPLES ANALYSED IN THE HEIDRUN OIL FIELD. FROM A TO D THE ALKYL
CHAIN LENGTH DISTRIBUTION (A), PHENOL CONTENT (B), AND SULPHUR CONTENT (C) ARE SHOWN. ........ 191
FIGURE 111 GEOCHEMICAL PROFILES USING THE PYROLYSIS PRODUCTS OF THE RESERVOIR ROCK ASPHALTENES
AND THEIR CORRESPONDING RESERVOIR ROCK SAMPLES FROM WELL D. FROM A TO E THE AROMATICITY
(A), MONOAROMATIC / DIAROMATIC HYDROCARBON RATIO (B), RELATIVE PHENOL AMOUNT (C), GAS
WETNESS (D), AND GAS AMOUNT (E) ARE SHOWN. ..................................................................................... 192
FIGURE 112 BULK PROPERTIES OF THE RESERVOIR ROCK ASPHALTENE PYROLYSIS PRODUCTS OF WELL D IN
COMPARISON TO THE PYROLYSIS PRODUCTS OF THEIR CORRESPONDING RESERVOIR ROCK SAMPLES AND
BOTH POTENTIAL SOURCE ROCK SAMPLES ANALYSED IN THE HEIDRUN OIL FIELD. FROM A TO D THE ALKYL
CHAIN LENGTH DISTRIBUTION (A), PHENOL CONTENT (B), AND SULPHUR CONTENT (C) ARE SHOWN. ........ 194
FIGURE 113 GEOCHEMICAL PROFILES USING THE PYROLYSIS PRODUCTS OF THE RESERVOIR ROCK ASPHALTENES
AND THEIR CORRESPONDING RESERVOIR ROCK SAMPLES OF WELL E. FROM A TO E THE AROMATICITY (A),
MONOAROMATIC / DIAROMATIC HYDROCARBON RATIO (B), RELATIVE PHENOL AMOUNT (C), GAS WETNESS
(D), AND GAS AMOUNT (E) ARE SHOWN. .................................................................................................... 195
FIGURE 114 BULK PROPERTIES OF THE RESERVOIR ROCK ASPHALTENE PYROLYSIS PRODUCTS OF WELL E IN
COMPARISON TO THE PYROLYSIS PRODUCTS OF THEIR CORRESPONDING RESERVOIR ROCKS AND BOTH
POTENTIAL SOURCE ROCKS ANALYSED IN THE HEIDRUN OIL FIELD. FROM A TO D THE ALKYL CHAIN LENGTH
DISTRIBUTION (A), PHENOL CONTENT (B), AND SULPHUR CONTENT (C) ARE SHOWN. ................................ 197
FIGURE 115 GEOCHEMICAL PROFILES USING THE PYROLYSIS GC PARAMETER OF THE RESERVOIR ROCK
ASPHALTENES AND THEIR CORRESPONDING RESERVOIR ROCK SAMPLES FROM WELL 6507/7-2. FROM A TO E
THE AROMATICITY (A), MONOAROMATIC / DIAROMATIC HYDROCARBON RATIO (B), RELATIVE PHENOL
AMOUNT (C), GAS WETNESS (D), AND GAS AMOUNT (E) ARE SHOWN. ........................................................ 198
FIGURE 116 BULK PROPERTIES OF THE RESERVOIR ROCK ASPHALTENE PYROLYSIS PRODUCTS OF WELL 6507/7-2 IN
COMPARISON TO THE PYROLYSIS PRODUCTS OF THEIR CORRESPONDING RESERVOIR ROCK SAMPLES AND
BOTH POTENTIAL SOURCE ROCK SAMPLES ANALYSED IN THE HEIDRUN OIL FIELD. FROM A TO D THE ALKYL
CHAIN LENGTH DISTRIBUTION (A), RELATIVE PHENOL CONTENT (B), AND RELATIVE SULPHUR CONTENT (C)
ARE SHOWN. ............................................................................................................................................... 199
FIGURE 117 GEOCHEMICAL PROFILES USING THE PYROLYSIS GC PARAMETER OF THE RESERVOIR ROCK
ASPHALTENES AND THEIR CORRESPONDING RESERVOIR ROCK SAMPLES FROM WELL 6507/7-5. FROM A TO E
THE AROMATICITY (A), MONOAROMATIC / DIAROMATIC HYDROCARBON RATIO (B), RELATIVE PHENOL
AMOUNT (C), GAS WETNESS (D) AND GAS AMOUNT (E) ARE SHOWN. ......................................................... 200
FIGURE 118 BULK PROPERTIES OF THE RESERVOIR ROCK ASPHALTENE PYROLYSIS PRODUCTS OF WELL 6507/7-5 IN
COMPARISON TO THE PYROLYSIS PRODUCTS OF THEIR CORRESPONDING RESERVOIR ROCK SAMPLES AND
BOTH POTENTIAL SOURCE ROCK SAMPLES ANALYSED IN THE HEIDRUN OIL FIELD. FROM A TO D THE ALKYL
LIST OF FIGURES XIX
CHAIN LENGTH DISTRIBUTION (A), RELATIVE PHENOL CONTENT (B), AND RELATIVE SULPHUR CONTENT (C)
ARE SHOWN. ............................................................................................................................................... 201
FIGURE 119 GEOCHEMICAL PROFILES USING THE PYROLYSIS GC PARAMETER OF THE RESERVOIR ROCK
ASPHALTENES AND THEIR CORRESPONDING RESERVOIR ROCK SAMPLES FROM WELL 6507/7-8. FROM A TO E
THE AROMATICITY (A), MONOAROMATIC / DIAROMATIC HYDROCARBON RATIO (B), RELATIVE PHENOL
AMOUNT (C), GAS WETNESS (D), AND GAS AMOUNT (E) ARE SHOWN. ........................................................ 202
FIGURE 120 BULK PROPERTIES OF THE RESERVOIR ROCK ASPHALTENE PYROLYSIS PRODUCTS OF WELL 6507/7-8 IN
COMPARISON TO THE PYROLYSIS PRODUCTS OF THEIR CORRESPONDING RESERVOIR ROCK SAMPLES AND
BOTH POTENTIAL SOURCE ROCK SAMPLES ANALYSED IN THE HEIDRUN OIL FIELD. FROM A TO D THE ALKYL
CHAIN LENGTH DISTRIBUTION (A), RELATIVE PHENOL CONTENT (B), AND RELATIVE SULPHUR CONTENT (C)
ARE SHOWN. ............................................................................................................................................... 203
FIGURE 121 ROCK-EVAL DATA OF THE SOURCE ROCKS FROM THE WHOLE DUVERNAY FORMATION SAMPLE SET.
THE SELECTED SAMPLES FOR THE PHASEKINETIC APPROACH ARE MARKED WITH ORANGE DOTS. LEFT THE
PSEUDO-VAN-KREVELEN DIAGRAM WITH HI VERSUS TMAX DATA; RIGHT ROCK EVAL S2 VERSUS TOC. . 209
FIGURE 122 CHROMATOGRAMS FROM OPEN SYSTEM PYROLYSIS-GC FOR THE KEROGEN (LEFT) AND SOURCE ROCK
ASPHALTENE (RIGHT) FROM THE DUVERNAY FORMATION. THE CONSPICUOUS PEAK IN THE MIDDLE PART OF
THE GC REPRESENTS 1, 2, 3, 4 - TETRAMETHYLBENZENE, MARKED WITH AN INVERTED TRIANGLE. .......... 216
FIGURE 123 CHROMATOGRAMS FROM OPEN SYSTEM PYROLYSIS GC FOR THE RESERVOIR ASPHALTENE FROM THE
DUVERNAY FORMATION. THE CONSPICUOUS PEAK IN THE MIDDLE PART OF THE GC REPRESENTS
1, 2, 3, 4 - TETRAMETHYLBENZENE, MARKED WITH AN INVERTED TRIANGLE. ........................................... 217
FIGURE 124 TERNARY DIAGRAMS FOR THE ALKYL CHAIN LENGTH DISTRIBUTION (CLD) (A), SULPHUR CONTENT
(B) AND PHENOL CONTENT (C) FOR PYROLYSATES OF KEROGEN AND SOURCE ROCK ASPHALTENES FROM THE
DUVERNAY FORMATION. ........................................................................................................................... 218
FIGURE 125 ACTIVATION ENERGY DISTRIBUTIONS (EA) AND FREQUENCY FACTORS (A) FOR THE SOURCE ROCK
KEROGEN (LEFT), THE RESERVOIR ASPHALTENE (MIDDLE), AND THE SOURCE ROCK ASPHALTENES (RIGHT).
UPPER ROW: SOURCE ROCK SAMPLE WITH TMAX 424 °C, LOWER ROW: SOURCE ROCK SAMPLE WITH TMAX
427 °C. ....................................................................................................................................................... 219
FIGURE 126 BULK PETROLEUM GENERATION RATES FROM SOURCE ROCK KEROGEN, SOURCE ROCK ASPHALTENE
AND RESERVOIR ASPHALTENE FOR A GEOLOGICAL HEATING RATE OF 3 K/MY. LEFT: SOURCE ROCK TMAX
424 °C, RIGHT: SOURCE ROCK TMAX 427 °C. ............................................................................................ 220
FIGURE 127 COMPARISON OF THE PETROLEUM GOR PREDICTED FROM THE MSSV PYROLYSIS AS A FUNCTION OF
INCREASING MATURITY (TR %), OF THE SOURCE ROCK KEROGEN, SOURCE ROCK ASPHALTENE AND
RESERVOIR ASPHALTENE. LEFT: SOURCE ROCK WITH TMAX 424 °C; RIGHT: SOURCE ROCK WITH TMAX
427 °C. ....................................................................................................................................................... 221
FIGURE 128 COMPOSITIONAL KINETIC MODELS FROM THE PVT SIMULATION OF THE SAMPLE FROM THE DUVERNAY
FORMATION. LEFT: KEROGEN (TOP) AND SOURCE ROCK ASPHALTENE (BOTTOM) OF THE SOURCE ROCK TMAX
424 °C. MIDDLE: KEROGEN (TOP) AND SOURCE ROCK ASPHALTENE (BOTTOM) OF THE SOURCE ROCK TMAX
427 °C. RIGHT: RESERVOIR ASPHALTENE WITH API 36°. ............................................................................ 223
FIGURE 129 PHASE ENVELOPES OF THE DUVERNAY SAMPLE WITH TMAX 424 °C FROM THE KEROGEN, SOURCE
ROCK ASPHALTENE AND RESERVOIR ASPHALTENE AT 50 % TR. ................................................................ 224
LIST OF FIGURES XX
FIGURE 130 ACTIVATION ENERGY DISTRIBUTION AND FREQUENCY FACTOR (A) FOR THE SOURCE ROCK KEROGEN
(LEFT) AND THE TAR MAT ASPHALTENE (RIGHT) OF THE DRAUPNE FORMATION. ....................................... 226
FIGURE 131 BULK PETROLEUM GENERATION RATES FROM SOURCE ROCK KEROGEN, TAR MAT ASPHALTENE AND
RESERVOIR ASPHALTENE FROM THE DRAUPNE FORMATION FOR A GEOLOGICAL HEATING RATE OF 3 K/MY.
................................................................................................................................................................... 226
FIGURE 132 COMPARISON OF THE PETROLEUM GOR PREDICTED FROM MSSV PYROLYSIS AS A FUNCTION OF
INCREASING MATURITY (TR %), OF THE SOURCE ROCK KEROGEN AND TAR MAT ASPHALTENE. ................. 227
FIGURE 133 COMPOSITIONAL KINETIC MODELS FROM THE PVT SIMULATION FOR THE DRAUPNE FORMATION
KEROGEN AND THE TAR MAT ASPHALTENE. ................................................................................................ 228
FIGURE 134 PHASE ENVELOPES FOR THE DRAUPNE KEROGEN AND TAR MAT ASPHALTENE AT 50 % TR. ............ 229
FIGURE 135 CHROMATOGRAMS FROM OPEN SYSTEM PY- GC FOR THE RESERVOIR ROCK ASPHALTENES, THE
SOURCE ROCK KEROGEN AND THE CORRESPONDING SOURCE ROCK ASPHALTENE ANALYSED ARE SHOWN
CONCERNING THERE GEOGRAPHICAL WELL POSITION AROUND A GREATLY SIMPLIFIED SKETCH OF THE
HEIDRUN OILFIELD. THE COLOURS IN THIS SKETCH MARK THE ROUGH DIVISION OF THE OIL FIELD INTO A
BIODEGRADED EASTERN PART (YELLOW) AND A BIODEGRADED AND MIXED PART (GREY) IN THE WEST. IN
THE CHEQUERED CENTRAL PART, BOTH SIGNALS WERE OBSERVED. ........................................................... 230
FIGURE 136 TERNARY DIAGRAM OF THE ALKYL CHAIN LENGTH DISTRIBUTION (A), RELATIVE SULPHUR CONTENT
(B) AND RELATIVE PHENOL CONTENT (C) FOR PYROLYSATES OF THE RESERVOIR ROCK ASPHALTENES,
SOURCE ROCK ASPHALTENE AND THE SOURCE ROCK KEROGEN OF THE SPEKK FORMATION SELECTED FROM
THE HEIDRUN OILFIELD. ............................................................................................................................. 232
FIGURE 137 ACTIVATION ENERGY DISTRIBUTION (EA) AND FREQUENCY FACTOR (A) FOR THE RESERVOIR ROCK
ASPHALTENES (BLUE) AND THE SOURCE ROCK KEROGEN (RED). ................................................................. 233
FIGURE 138 BULK PETROLEUM TRANSFORMATION RATIO CURVES OF THE SOURCE ROCK KEROGEN AND RESERVOIR
ROCK ASPHALTENES FOR A GEOLOGICAL HEATING RATE OF 3 K/MY. ......................................................... 234
FIGURE 139 COMPARISON OF THE PETROLEUM GOR (LEFT) AND THE GAS WETNESS (RIGHT) PREDICTED FROM
MSSV PYROLYSIS AS A FUNCTION OF INCREASING MATURITY (TR %), OF THE RESERVOIR ROCK
ASPHALTENES AND THE SOURCE ROCK KEROGEN. ...................................................................................... 236
FIGURE 140 COMPOSITIONAL KINETIC MODELS FROM THE PVT SIMULATION FOR THE RESERVOIR ROCK
ASPHALTENES AND THE SOURCE ROCK KEROGEN FROM THE HEIDRUN OILFIELD. ....................................... 239
FIGURE 141 PHASE ENVELOPES OF THE RESERVOIR ROCK ASPHALTENES WELL 6507/7-2, WELL B, WELL C
(G004207), WELL E AND THE SOURCE ROCK KEROGEN ANALYSED FROM THE HEIDRUN RESERVOIR AT 50 %
TR. THE PHASE ENVELOPE OF ASPHALTENE G004225 OF WELL C IS SHOWN FOR 70 % TR. THE CRITICAL
POINTS ARE INDICATED BY RED DOTS. ........................................................................................................ 240
LIST OF TABLES
XXI
LIST OF TABLES (IN THE TEXT)
TABLE 1 PHYSICAL RESERVOIR DATA FOR THE HEIDRUN OIL FIELD (FROM WHITLEY, 1992). ............................... 25
TABLE 2 SAMPLE NUMBERS, DEPTH AND GEOLOGICAL FORMATION OF RESERVOIR ROCKS ANALYSED FROM
WELL C. ....................................................................................................................................................... 31
TABLE 3 SAMPLE NUMBERS, DEPTH AND GEOLOGICAL FORMATION OF RESERVOIR ROCKS ANALYSED FROM
WELL B. ....................................................................................................................................................... 35
TABLE 4 SAMPLE NUMBERS, DEPTH AND GEOLOGICAL FORMATION OF RESERVOIR ROCKS ANALYSED FROM
WELL A. ....................................................................................................................................................... 38
TABLE 5 SAMPLE NUMBERS, DEPTH AND GEOLOGICAL FORMATION OF RESERVOIR ROCKS ANALYSED FROM
WELL E. ........................................................................................................................................................ 40
TABLE 6: THE SAMPLE NUMBERS, DEPTH, GEOLOGICAL FORMATION OF RESERVOIR ROCKS ANALYSED FROM
WELL D. ....................................................................................................................................................... 41
TABLE 7 SAMPLE NUMBERS, DEPTH AND GEOLOGICAL FORMATION OF RESERVOIR ROCKS ANALYSED FROM THE
NPD WELLS. ................................................................................................................................................. 52
TABLE 8 SAMPLE NUMBERS, DEPTH INTERVAL, GEOLOGICAL FORMATION, AND API GRAVITIES OF OIL SAMPLES
ANALYSED FROM THE NPD WELLS. .............................................................................................................. 53
TABLE 9 DEPTH, FIELD SEGMENT, STRATIGRAPHICAL UNIT, AND OBTAINED ASPHALTENE YIELDS OF THE
RESERVOIR ROCKS SELECTED FOR ASPHALTENE SEPARATION FROM THE HEIDRUN OIL FIELD. ..................... 54
TABLE 10 OIL SAMPLES (DSTS) SELECTED FOR ASPHALTENE SEPARATION, DEPTH INTERVAL, FIELD SEGMENT,
STRATIGRAPHICAL UNIT, AND OBTAINED ASPHALTENE YIELDS. ................................................................... 55
TABLE 11 LIST OF THE RESERVOIR ROCK EXTRACTED HEAVY OILS FROM THE BIODEGRADATION SERIES OF THE
WESTERN CANADA SEDIMENTARY BASIN (WCSB). *RCE = RESERVOIR ROCK EXTRACT. .......................... 85
TABLE 12 LIST OF THE WELLS, DST NUMBERS, DEPTH, API GRAVITY AND ASPHALTENE AMOUNT OF HEIDRUN OIL
SAMPLES USED. ............................................................................................................................................ 91
TABLE 13 AVERAGE VALUES (AV) AND STANDARD DEVIATION (STABW*) FOR THE PY-GC PARAMETER OF THE
INDIVIDUAL RESERVOIR FORMATIONS EVALUATED IN THE HEIDRUN OIL FIELD. * 222 nxxn ......... 167
TABLE 14 RESULTS OF THE REPRODUCIBILITY TESTS. FOR EACH PARAMETER, 3 SAMPLES WERE ANALYSED. THE
ASPHALTENE AMOUNT [WT. %], PI, AROMATICITY AND GOR ARE AVERAGE VALUES OF THE ASPHALTENE
CONCENTRATES PREPARED IN TRIPLICATE. * 222 nxxn ................................................................ 184
TABLE 15 RESULTS OF THE LINEARITY TESTS. FOR EACH PARAMETER, 3 SAMPLES WERE ANALYSED. THE
ASPHALTENE AMOUNT [WT. %], PI, AROMATICITY AND GOR ARE AVERAGE VALUES OF THE ASPHALTENE
CONCENTRATES PREPARED IN TRIPLICATE. * 222 nxxn ................................................................ 184
TABLE 16 ROCK-EVAL DATA (LEHNE, 2007) AND THE ASPHALTENE AMOUNT FOR SELECTED SOURCE ROCK
SAMPLES OF THE DUVERNAY FORMATION FOR THE PHASEKINETIC APPROACH. RED - REDWATER;
CAM - CAMROSE; IMP 3 - IMPERIAL ARMENA 3; IMC - IMPERIAL CYNTHIA. .......................................... 209
TABLE 17 SAMPLE NUMBER, WELL, DEPTHS, AND ROCK-EVAL SCREENING DATA OF THE DRAUPNE SOURCE ROCK
(ERDMANN, 1999). ..................................................................................................................................... 210
LIST OF TABLES
XXII
TABLE 18 - SAMPLE NUMBERS, WELLS, FORMATION, DEPTHS AND ASPHALTENE AMOUNT OF THE HEIDRUN
OILFIELD RESERVOIR ROCK ASPHALTENES AND THE SOURCE ROCK ASPHALTENE USED FOR THE
COMPOSITIONAL KINETIC MODELLING. ....................................................................................................... 211
TABLE 19 PREDICTED GOR AND GAS WETNESS FROM THE MSSV PYROLYSIS (0,7 K/MIN) FOR THE RESERVOIR
ASPHALTENE AND THE KEROGEN AND SOURCE ROCK ASPHALTENE OF BOTH INVESTIGATED SOURCE ROCKS
WITH TMAX 424 °C AND 427 °C. ............................................................................................................... 222
TABLE 20 PREDICTED GOR, BO AND PSAT FROM THE PVT SIMULATION. THE RANGE COVER THE PREDICTED VALUES
FROM 10% - 90% TR. ................................................................................................................................. 223
TABLE 21 PREDICTED GOR, PSAT AND BO FOR THE SOURCE ROCK KEROGEN AND TAR MAT ASPHALTENE FROM THE
DRAUPNE FORMATION. .............................................................................................................................. 228
TABLE 22 CALCULATED TEMPERATURES (°C) AND CALCULATED VITRINITE REFLECTANCE (R0 %) FOR THE
HYDROCARBON GENERATION AT A HEATING RATE OF 3 K/MY OF THE RESERVOIR ROCK ASPHALTENES AND
SOURCE ROCK KEROGEN FROM THE HEIDRUN OILFIELD. ............................................................................ 235
TABLE 23 PREDICTED GOR FROM THE MSSV PYROLYSIS (0.7 K/MIN) FOR THE RESERVOIR ROCK ASPHALTENE
AND THE SOURCE ROCK KEROGEN OF THE HEIDRUN OIL FIELD. .................................................................. 237
TABLE 24 PREDICTED GAS WETNESS FROM THE MSSV PYROLYSIS (0.7 K/MIN) FOR THE RESERVOIR ROCK
ASPHALTENE AND THE SOURCE ROCK KEROGEN OF THE HEIDRUN OIL FIELD.............................................. 238
LIST OF TABLES (IN THE APPENDIX)
TABLE X 1 AVERAGE (AV) AND STANDARD DEVIATION (STABW)* FOR THE PI AND ORGANIC RICHNESS OF THE
RESERVOIR ROCK SAMPLES AND POTENTIAL SOURCE ROCK SAMPLES OF THE HEIDRUN OIL FIELD.
* 222 nxxn .................................................................................................................................... 246
TABLE X 2 AVERAGE (AV) AND STANDARD DEVIATION (STABW)* FOR THE PY-GC PARAMETERS APPLIED TO THE
RESERVOIR ROCKS FOR EACH INDIVIDUAL WELL AND BOTH SOURCE ROCKS FROM THE HEIDRUN OIL FIELD.
* 222 nxxn .................................................................................................................................... 247
TABLE X 3 PY-GC PARAMETERS FOR EACH RESERVOIR ROCK ANALYSED IN WELL C. BLUE COLOURED RESERVOIR
ROCK SAMPLES WERE SELECTED FOR ASPHALTENE SEPARATION. ............................................................... 248
TABLE X 4 PY-GC PARAMETERS FOR THE HEAVY OIL SERIES OF THE WESTERN CANADA SEDIMENTARY BASIN
(WCSB). THE INDUSTRY PARTNER SHELL PROVIDES THE SAMPLES. ......................................................... 249
TABLE X 5 PY-GC PARAMETERS FOR THE HEIDRUN OIL SAMPLES WITH DIFFERENT API GRAVITY FROM 29 TO 20°.
................................................................................................................................................................... 249
TABLE X 6 PY-GC PARAMETERS FOR EACH RESERVOIR ROCK ANALYSED IN WELL B. BLUE COLOURED RESERVOIR
ROCK SAMPLES WERE SELECTED FOR ASPHALTENE SEPARATION. ............................................................... 250
TABLE X 7 PY-GC PARAMETERS FOR EACH RESERVOIR ROCK ANALYSED IN WELL A. ......................................... 251
TABLE X 8 PY-GC PARAMETER S FOR EACH RESERVOIR ROCK ANALYSED IN WELL E AND D. BLUE COLOURED
RESERVOIR ROCK SAMPLES WERE SELECTED FOR ASPHALTENE SEPARATION. ............................................ 252
TABLE X 9 PY-GC PARAMETER S FOR EACH RESERVOIR ROCK ANALYSED FROM THE NPD WELLS. BLUE COLOURED
RESERVOIR ROCK SAMPLES WERE SELECTED FOR ASPHALTENE SEPARATION. ............................................ 253

LIST OF TABLES
XXIII
TABLE X 10 PYROLYSIS-GC PARAMETERS OF THE RESERVOIR ROCK ASPHALTENES (RCA) COMPARED TO THEIR
CORRESPONDING RESERVOIR ROCK (RC) PY-GC PARAMETERS. ................................................................. 255
TABLE X 11 PREDICTED GOR, GAS WETNESS (C1 / C2 - C5), BO AND PSAT FROM THE PVT SIMULATION OF THE
HEIDRUN OIL FIELD RESERVOIR ROCK ASPHALTENES AND THE SOURCE ROCK KEROGEN SAMPLES. ........... 256
LIST OF PUBLICATIONS AND PRESENTATIONS XXIV
LIST OF PUBLICATIONS AND PRESENTATIONS
JOURNALS
THEUERKORN, K., HORSFIELD, B., WILKES, H., DI PRIMIO, R. AND LEHNE, E. (2008): A reproducible and linear method for separating asphaltenes from crude oil. Organic Geochemistry, Advances in Organic Geochemistry 2007 - Proceedings of the 23rd International Meeting on Organic Geochemistry 39, 929-934.
CONFERENCE PAPERS
THEUERKORN, K., HORSFIELD, B., DI PRIMIO, R. AND WILKES, H. (2007): Using Asphaltenes to reconstruct the original charge compositions and volumetrics of petroleum in reservoir compartments. 23rd International Meeting on Organic Geochemistry (IMOG), Torquay/England, (09-14/09/2007).
THEUERKORN, K., HORSFIELD, B. AND DI PRIMIO, R. (2009): Using asphaltene pyrolysates to build compositional kinetic models of petroleum formation. 11th Norwegian Meeting of Organic Geochemistry (NMOG), Stavanger/Norway, (23-24/10/2008).
THEUERKORN, K., HORSFIELD, B., DI PRIMIO, R., HABERER, R.M. AND VIETH, A. (2009): Charakterisierung von Heterogenitäten in Erdöllagerstätten mittels Asphaltenen. DGMK / ÖGEW Spring Meeting, Celle/Germany, (27-28.04.2009). THEUERKORN, K., HORSFIELD, B. AND DI PRIMIO, R. (2009): Characterisation of heterogeneities in petroleum reservoirs using the composition of macromolecules 24th International Meeting on Organic Geochemistry (IMOG), Bremen/Germany, (06-11/09/2009).
PRESENTATION AT INTERNATIONAL SYMPOSIA
THEUERKORN, K., HORSFIELD, B., DI PRIMIO, R. AND WILKES, H. (2007): Petroleum Asphaltenes in Reservoir Compartments - PARC - Using asphaltenes to reconstruct the original charge composition and volumetrics of petroleum in reservoir compartments. 23rd International Meeting on Organic Geochemistry (IMOG), Torquay/England, (09-14/09/2007) (poster presentation). THEUERKORN, K., HORSFIELD, B. AND DI PRIMIO, R. (2009): Using asphaltene pyrolysates to build compositional kinetic models of petroleum formation. 11th Norwegian Meeting of Organic Geochemistry (NMOG), Stavanger/Norway, (23-24/10/2008). (Oral presentation). THEUERKORN, K., HORSFIELD, B., DI PRIMIO, R., HABERER, R.M. AND VIETH, A. (2009): Charakterisierung von Heterogenitäten in Erdöllagerstätten mittels Asphaltenen. DGMK / ÖGEW Spring Meeting, Celle/Germany, (27-28.04.2009). (Oral presentation).
LIST OF PUBLICATIONS AND PRESENTATIONS XXV
THEUERKORN, K., HORSFIELD, B. AND DI PRIMIO, R. (2009): Characterisation of heterogeneities in petroleum reservoirs using the composition of macromolecules 24th International Meeting on Organic Geochemistry (IMOG), Bremen/Germany, (06-11/09/2009) (poster presentation).
ORAL PRESENTATIONS (internal)
THEUERKORN, K., HORSFIELD, B., DI PRIMIO, R. AND LEHNE, E. (2007): BioPets Flux - PARC - Petroleum Asphaltenes in Reservoir Compartments. 1st IPP Meeting Potsdam, 09/07. THEUERKORN, K., HORSFIELD, B., DI PRIMIO, R. AND LEHNE, E. (2008): Application of the PhaseKinetics Approach to Asphaltenes and Oil Asphaltene Characterisation from Heidrun Oil field. 2nd IPP Meeting Potsdam, 04/2008. THEUERKORN, K., HORSFIELD, B. AND DI PRIMIO, R. (2008): Heterogeneity screening of the Heidrun oil field. 3rd IPP Meeting Potsdam, 10/08. THEUERKORN, K., HABERER, R.M., HORSFIELD, B. AND DI PRIMIO, R. (2009): Characterisation of heterogeneities in petroleum reservoirs using the composition and distribution of high molecular weight polar compounds. 4th IPP Meeting Potsdam, 04/09. THEUERKORN, K., HORSFIELD, B., DI PRIMIO, R. AND HABERER, R.M., (2009): Using macromolecules for studying heterogeneities in petroleum reservoirs. 5th IPP Meeting Potsdam, 09/09.
INTERNAL REPORTS FOR THE INDUSTRY-PARTNERS (unpublished)
1st ANNUAL REPORT (10/2007)
2nd ANNUAL REPORT (01/2009)
3rd ANNUAL REPORT (06/2010)
ABBREVIATIONS XXVI
ABBREVIATIONS
A Frequency Factors
API gravity Specific Gravity scale developed by the American Petroleum Institute (141.5 / SG at 60°F) - 131.5
ASE Accelerated Solvent Extractor ASTM American Association for Testing Materials av Average bo Petroleum Volume Factor CLD Alkyl Chain Length Distribution d Darcy DCM Dichloromethane ∆m/z Mass/Charge Ratio (dimensionless) DMN Dimethylnaphthalene DST Drill Stem Test DT (∆t) Interval Transit Time EA Activation Energy Emean Mean Activation Energies FID Flame Ionisation Detector Fm. Formation (geological) GOC Gas-Oil Contact GR Gamma Ray H/C Hyrogen / Carbon Atomic Ratio HCL Hydrochloric acid or hydrogen chloride HF Hydrofluoric acid or hydrogen fluoride HI Hydrogen Index HMPLC Heterocompound-Medium Pressure Liquid Chromatography HMWF High Molecular Weight fraction IOR Improved Oil Recovery IPP-report Industry-Partner-Project Κ Permeability LWD LoggingWhile Drilling m Meter md Millidarcy MeOH Methanol MPLC Medium Pressure Liquid Chromatography MD-RKB Measured Depth - Rig Floor Kelly bushing MN Methylnaphthalene mPa*s Mega Pascal*second MWD Measurement While Drilling N North NGL Narural Gas Liquids NPD Norwegian Petroleum Directorate NPHI (ΦN) Neutron Density NSO-1 Norwegian Standard Oil - 1 NSO compounds Nitrogen, Sulphur and Oxygen Compounds NMR Nuclear Magnetic Resonance

ABBREVIATIONS XXVII
OI Oxygen Index OM Organic Matter ODT Oil Down To OSPP Organic Sulphur Pyrolysis Products OUT Oil Up To OWC Oil-Water Contact Φ(phi) Porosity ΦS Sonic-Derived Porosity PEG Polyethylenglycol PI Production Index (S1/S1+S2) PNA Paraffinic-Naphthenic-Aromatic Psat Saturation Pressure PVT Pressure Volume Temparature RCE Reservoir Cor Extracts RHOB (ρb) Bulk Density R0 Vitrinite Reflectance RT Resitivity S South SP Spontaneous Potential SRA Source Rock Analyzer STABW Standard Deviation STB Stock Tank Barrel STDV Standard Deviation Sw Water Saturation Sw irr Irreducible Water Saturation S1 Total Thermovaporised Compounds S2 Pyrolysis Products TLC - FID Thin Layer Chromatography - Flame Ionisation Detector TOC Total Organic Carbon TR Transfomation Ratio TVD-SS True Vertical Depth - Sub Sea Level UCM Unresolved Compound Mixture vol% - Volume Percentage WCSB Western Canada Sedimentary Basin WUT Water Up To
1 INTRODUCTION 1
1 INTRODUCTION
1.1 PETROLEUM RESERVOIRS
1.1.1 GENERAL CHARACTERISTICS
Petroleum reservoirs are sedimentary rock bodies in the subsurface, which are able to
accumulate large volumes of petroleum when specific conditions are fulfilled. Essential
prerequisites for reservoir rocks are suitable porosity (typically 10 - 25 %) and permeability
(typically 1 - 1000 md), to store and transmit petroleum fluids. The reservoir rock has further
to be overlain by a low permeable cap rock, and to be within a trap structure to prevent escape
of petroleum. The trap has to be in place before the oil generation commences as well as
accessible to hydrocarbons migrating from mature source rocks (described by many authors
e.g. Bjørlykke, 1989; Killops & Killops, 2005).
Hydrocarbon traps are usually classified into two main groups, structural and stratigraphic
traps (described by many authors e.g. Bjørlykke, 1989; Selley, 1997). Structural traps are very
common and primarily formed by tectonic deformation of reservoir beds after their
deposition. Typical structural traps are anticlines, folds and faults. The petroleum is trapped
below impervious strata because outward flow would require movement opposed to the
direction of buoyant forces. Nevertheless, if petroleum is generated in sufficient amounts it
can fill the trap and excess volumes can then spill out. A variety of structural traps can be
associated with salt domes. Halokinetic movements (salt tectonic) can form very effective
traps when the salt deposit thickness exceeds 100 - 200 m, e.g. the Permian Zechstein salt
sediments in the Ekofisk area in the North Sea (Bjørlykke, 1989). Stratigraphic traps are
depositional features in which the porous reservoir unit is surrounded by less porous and
permeable rocks such as shale or limestone preventing the outflow of petroleum. Typical cap
rocks such as shale are often slightly leaky with respect to gas and thus the smaller molecules
present in gases can escape through narrower pores than oil components (Killops & Killops,
2005).
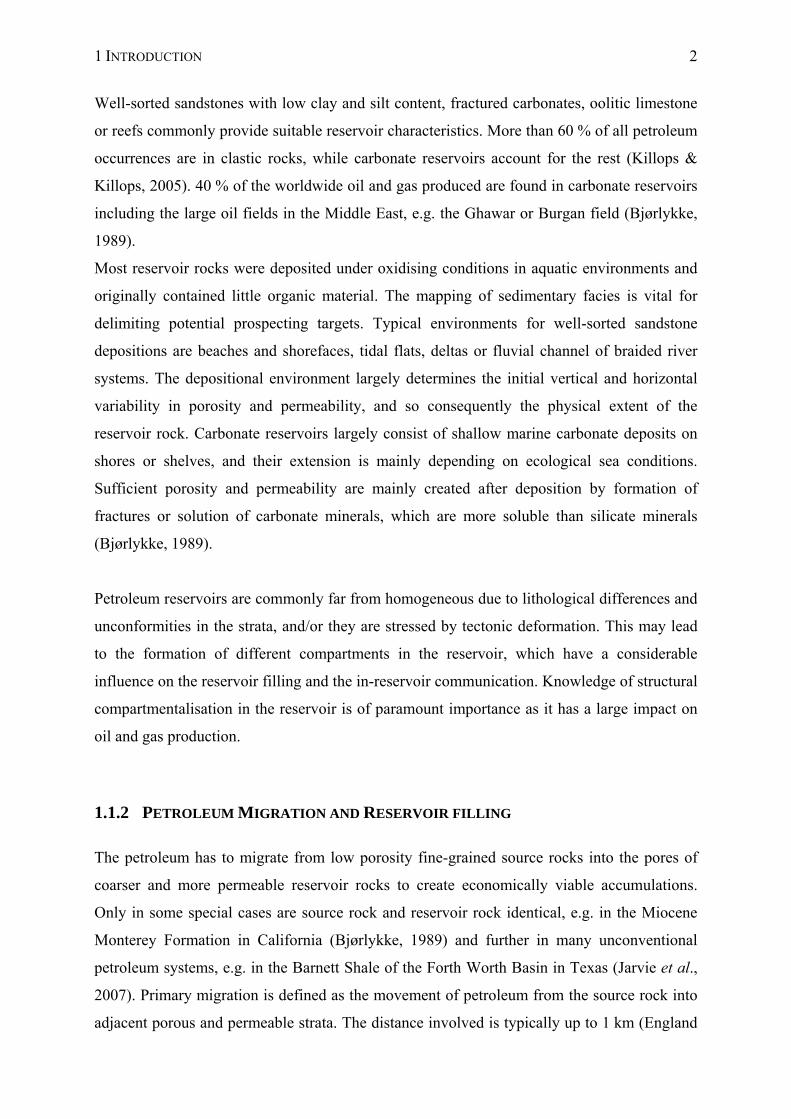
1 INTRODUCTION 2
Well-sorted sandstones with low clay and silt content, fractured carbonates, oolitic limestone
or reefs commonly provide suitable reservoir characteristics. More than 60 % of all petroleum
occurrences are in clastic rocks, while carbonate reservoirs account for the rest (Killops &
Killops, 2005). 40 % of the worldwide oil and gas produced are found in carbonate reservoirs
including the large oil fields in the Middle East, e.g. the Ghawar or Burgan field (Bjørlykke,
1989).
Most reservoir rocks were deposited under oxidising conditions in aquatic environments and
originally contained little organic material. The mapping of sedimentary facies is vital for
delimiting potential prospecting targets. Typical environments for well-sorted sandstone
depositions are beaches and shorefaces, tidal flats, deltas or fluvial channel of braided river
systems. The depositional environment largely determines the initial vertical and horizontal
variability in porosity and permeability, and so consequently the physical extent of the
reservoir rock. Carbonate reservoirs largely consist of shallow marine carbonate deposits on
shores or shelves, and their extension is mainly depending on ecological sea conditions.
Sufficient porosity and permeability are mainly created after deposition by formation of
fractures or solution of carbonate minerals, which are more soluble than silicate minerals
(Bjørlykke, 1989).
Petroleum reservoirs are commonly far from homogeneous due to lithological differences and
unconformities in the strata, and/or they are stressed by tectonic deformation. This may lead
to the formation of different compartments in the reservoir, which have a considerable
influence on the reservoir filling and the in-reservoir communication. Knowledge of structural
compartmentalisation in the reservoir is of paramount importance as it has a large impact on
oil and gas production.
1.1.2 PETROLEUM MIGRATION AND RESERVOIR FILLING
The petroleum has to migrate from low porosity fine-grained source rocks into the pores of
coarser and more permeable reservoir rocks to create economically viable accumulations.
Only in some special cases are source rock and reservoir rock identical, e.g. in the Miocene
Monterey Formation in California (Bjørlykke, 1989) and further in many unconventional
petroleum systems, e.g. in the Barnett Shale of the Forth Worth Basin in Texas (Jarvie et al.,
2007). Primary migration is defined as the movement of petroleum from the source rock into
adjacent porous and permeable strata. The distance involved is typically up to 1 km (England
1 INTRODUCTION 3
et al., 1987). Secondary migration is the subsequent transfer process of petroleum through
carrier beds into the reservoir. The expelled petroleum may coalesce into larger stringers or
globules within the carrier rock and travel large distances, until it escapes to the surface or is
trapped by an impermeable barrier (Tissot & Welte, 1984). Less permeable rock layers hinder
upward migration, thus secondary migration generally occurs along permeable strata in the
direction of decreasing pressure. The distance involved in secondary migration is usually up
to 100 km laterally and 2 km vertically, but depends on volume, type of petroleum and carrier
rocks involved (England et al., 1987). Extensive vertical migration generally requires suitable
pathways produced by large-scale faulting (Killops & Killops, 2005). The process of
petroleum migration into the reservoir is a relatively fast process compared to the time
necessary for formation or even storage of hydrocarbons (Tissot & Welte, 1984). The size of
an oil accumulation is related to the area of the source rock from which it was generated (the
drainage area) and hence to migration distance.
The upward movement of petroleum has strong effects on the petroleum composition and the
phase behaviour of the subsurface fluids, due to changes in temperature and pressure
conditions. Two phases usually coexist under subsurface conditions: gas-saturated petroleum
liquid and oil-saturated petroleum gas. Their phase behaviour mainly determines petroleum
fluid properties, density and viscosity. The density is a pressure dependent constant and is
mainly influenced by the quantity of gas compounds dissolved in the liquid phase (oil),
known as the gas : oil ratio (GOR). With increasing pressure, the dissolution of additional low
molecular weight components lowers the average molecular weight of the petroleum liquid
and thus its density, which results in increasing GOR. Thus, higher GOR fluids exhibit lower
densities and vice versa. The density of the subsurface fluids influences the direction of
migration, while the stability of the interface between two phases is related to the ratio of their
viscosities. The viscosity is a temperature dependent constant and decreases with increasing
temperature. It has a major influence on the mobility of petroleum, the speed with which a
fluid flows through a rock with a particular pressure gradient, and permeability. Liquid - and
gas properties become less similar with increasing vertical migration (England et al., 1987).
The driving forces controlling secondary migration are buoyancy, capillary pressure and
hydrodynamic flow (England, 1989; England et al., 1987). On large scale the buoyant rise
guiding the petroleum in water-wet porous rocks on average up-dip, because the specific
gravities of oil (0.7 - 1.0 kg/m3) and gas (< 0.0001 kg/m3) are lower than aqueous pore fluids
(Tissot & Welte, 1984). As the mutual solubility for the most hydrocarbons and water is
1 INTRODUCTION 4
below < 1 ppm, the petroleum phase will be saturated with respect to water and transported as
a separate phase. Only a small proportion is transported dissolved in pore water (Bjørlykke,
1989). On a local scale capillary forces will dictate the migration direction of petroleum as
coarser regions of the carrier bed with the lowest pore-entry pressure will be favoured
(England et al., 1987). Reservoir rocks commonly exhibit lower capillary pressures than cap
rocks preventing the oil from flowing through the cap rock, because the capillary force is
stronger than the buoyancy of oil in water.
Migration behaviour further depends on the physical rock properties of the carrier beds and
reservoir rocks. Of major importance are the porosity, permeability and water saturation as
well as the reservoir rock lithology. The porosity and permeability control the reservoir in-situ
hydrocarbons volume and are responsible for how easily hydrocarbons will flow in and out of
them. The porosity Φ can be defined as the ratio of voids to the total volume of rock and is
represented by a decimal fraction or percentage. The total porosity describes the total volume
of pore space in the rock, while the effective porosity is more important for the fluid
movement, because it describes the connected pore space in which the fluid might flow
through. The permeability Κ is an expression of the ability of rocks to transmit fluids. It is a
rock specific constant depending on the size of pore spaces and the connecting passages
between pores, called pore throats or capillaries. Κ is a proportionality-constant in Darcy's law
and is usually measured in Darcys (1 d = 9,869*10-9 cm2) or millidarcys (md). The absolute
permeability describes the ability of a rock to transmit a single fluid (single-phase flow), on
the condition that it is totally saturated with the given fluid, while the effective permeability
refers to the ability of a rock to transmit one fluid in the presence of another (multiphase flow)
if the two fluids are immiscible (partial saturation). The ratio between both is the relative
permeability. If the relative permeability of formation water is zero the reservoir formation
produces water-free hydrocarbons. With increasing relative permeability, the reservoir
formation produces increasing amounts of water relative to hydrocarbons (Asquith and
Krygowski, 2004). In hydrocarbon reservoirs, permeability between 10 - 1000 md describes
good to excellent reservoir conditions, while permeability below 10 md is negligible.
However, reservoirs with a low permeability might also be exploited commercially, e.g. the
Ekofisk field in the Norwegian North Sea due to fractures in the “dense” chalk matrix
(Bjørlykke, 1989).
Water saturation and rock lithology mainly influence the poroperm properties. The water
saturation Sw is the amount of pore volume in a rock that is occupied by formation water
1 INTRODUCTION 5
(connate water). It is represented by a decimal fraction or percentage. Formation water, which
is held by capillary forces in the pores and in the connecting passages between pores, may
block or reduce the ability of other fluids such as hydrocarbons to move through the rock.
When all formation water is adsorbed on grains in the rock or is held in place by capillary
pressure, the term irreducible water saturation (Sw irr) is used (Asquith and Krygowski, 2004).
The lithology describes the solid matrix of a rock in context with its primary mineralogy. For
instance, sandstones are primarily composed of quartz grains, limestones are primarily
composed of calcium carbonate, and shales mainly comprise clay minerals.
In the petroleum industry these rock properties are routinely and most effectively determined
using well log techniques. Measurement while drilling (MWD) or logging while drilling
(LWD) techniques are used since the 1980s. By continuous measurements in the uncased
portion of the borehole, the rock properties gradual changes from one bed to the next are
recorded (logged) (Asquith and Krygowski, 2004). The logs are recorded digitally at intervals
of 3 to 15 cm (Bjørlykke, 1989). Different logging tools can be applied for the measurements,
which use electric, nuclear or acoustic sources to create the log. The raw log data contains one
or more curves related to the characteristic reactions from different rock types, which are
subsequently interpreted to define the physical rock properties mentioned above. Logging
data are quantitatively used for stratigraphic correlation, identification of the sedimentary
facies, and depositional environment etc. (Bjørlykke, 1989). Qualitatively it is possible to
evaluate properties of reservoir rocks for production purposes, e.g. to identify productive
zones, their depth and thickness, to distinguish between oil, gas, and water in a reservoir, and
to estimate hydrocarbon reserves (Asquith and Krygowski, 2004). Different interpretive
methods can be used, including charts, cross-plots, and equations, e.g. Archie’s equation to
calculate Sw.
In the following, the most important logging tools are specified according their primary
interpretation target. Spontaneous potential (SP) log and gamma ray (GR) log are both used
primarily for the determination of the gross lithology. SP is a measure of the electric potential
(current) between drilling fluid and pore water. SP logs in shales are calibrated as baseline,
while permeable rocks (sandstones) show negative or positive record variations. Thus, the SP
log can be used to distinguish permeable from impermeable beds and to detect bed thickness
(Bjørlykke, 1989). GR is a measure of the natural radioactivity, which is elevated in shales
(high GR signal). Shale-free sandstones and carbonates usually show low GR readings.
However, sandstones with low shale content might also produce a high gamma ray response if
1 INTRODUCTION 6
feldspar, glauconite or mica are abundant (Asquith and Krygowski, 2004). SP and GR logs
are good indicators for the purity of sandstones, i.e. the degree of sorting or the clay content.
They record characteristic coarsening upward and fining upward sequences very efficiently,
which can be related to shallow marine and fluvial channels, respectively (Bjørlykke, 1989).
The three common log types generally referred to as porosity logs are the acoustic sonic log,
and the nuclear measurements density log and neutron log. The sonic log specifies the interval
transit time (Δt = DT) of a compressional sound wave through the borehole, which is
dependent upon both lithology and porosity. In the presence of hydrocarbons the DT increases.
This hydrocarbon effect has to be corrected, otherwise the sonic-drived porosity (ΦS) is too
high (Asquith and Krygowski, 2004). The density log displays the electron density of a
formation. This electron density is related to the bulk density (ρb = RHOB) of the formation,
which in turn is related to the porosity (Asquith and Krygowski, 2004). Neutron logs measure
the hydrogen concentration within a formation. In shale-free formations, in which the pores
are filled with oil or water, the neutron log defines the liquid filled porosity (ΦN = NPHI). The
logging tool emits neutrons, which will collide and/or become adsorbed on nuclei within the
formation. Thereby they lose energy and emit gamma rays. Maximum energy loss occurs
when the neutrons collide with hydrogen atoms. The NPHI is further used to distinguish
between gas and oil, because gas has a lower hydrogen concentration compared to water and
oil (Asquith and Krygowski, 2004).
The most important use of the resistivity log (RT) is the determination of hydrocarbon bearing
versus water-bearing zones. As most minerals of the rock matrix as well as hydrocarbons (in
particular gas) are nonconductive (high resistivity), the ability of the rock to transmit a current
is almost entirely a function of the water (salinity) in the pores (low resistivity). Well-
cemented limestones have a very high resistivity. Coal beds have an even higher resistivity,
because coals have virtually zero conductivity (Bjørlykke, 1989).
Of further importantance are dipmeter logs, which specify the slope of beds and laminations
in rocks, calliper logs that give a record of the borehole diameter, and formation temperature
logs.
The mechanisms of reservoir filling are a logical extension to previously discussed
mechanisms relevant for secondary migration. The filling process itself is described in detail
in England et al. (1987) and England (1989). The first petroleum will enter the reservoir
structure on a dendritic pathway that only involves coarser regions of the reservoir as
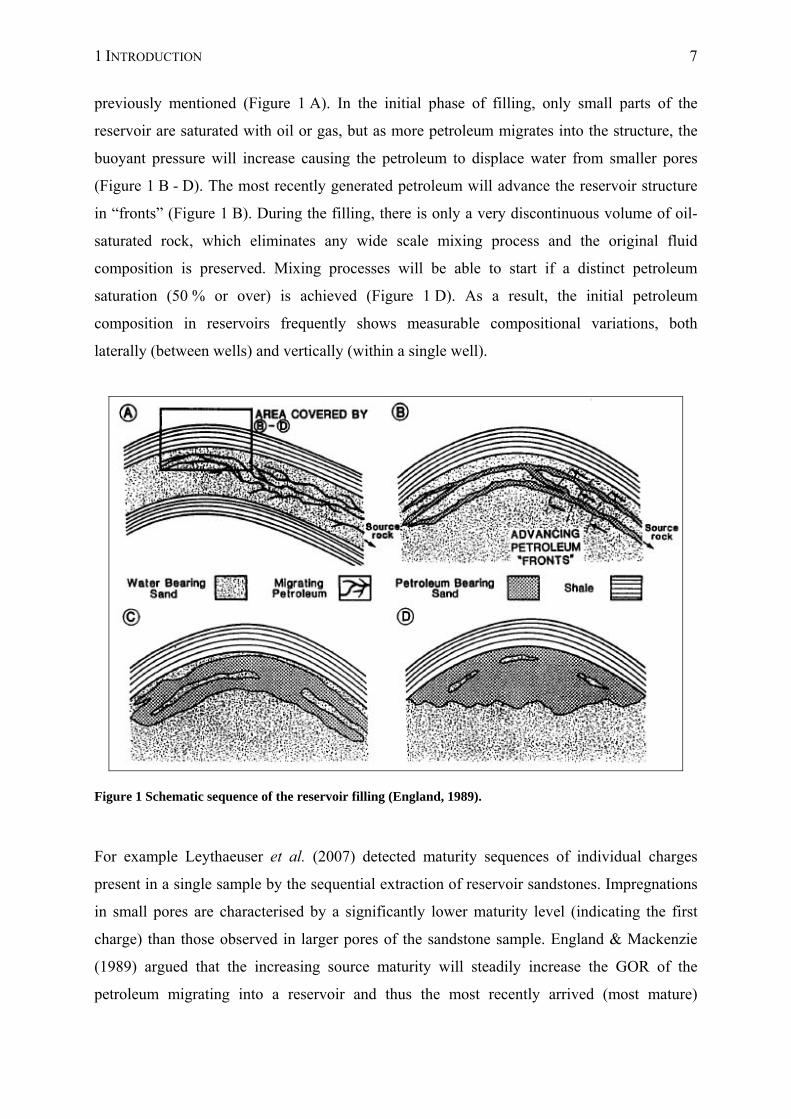
1 INTRODUCTION 7
previously mentioned (Figure 1 A). In the initial phase of filling, only small parts of the
reservoir are saturated with oil or gas, but as more petroleum migrates into the structure, the
buoyant pressure will increase causing the petroleum to displace water from smaller pores
(Figure 1 B - D). The most recently generated petroleum will advance the reservoir structure
in “fronts” (Figure 1 B). During the filling, there is only a very discontinuous volume of oil-
saturated rock, which eliminates any wide scale mixing process and the original fluid
composition is preserved. Mixing processes will be able to start if a distinct petroleum
saturation (50 % or over) is achieved (Figure 1 D). As a result, the initial petroleum
composition in reservoirs frequently shows measurable compositional variations, both
laterally (between wells) and vertically (within a single well).
Figure 1 Schematic sequence of the reservoir filling (England, 1989).
For example Leythaeuser et al. (2007) detected maturity sequences of individual charges
present in a single sample by the sequential extraction of reservoir sandstones. Impregnations
in small pores are characterised by a significantly lower maturity level (indicating the first
charge) than those observed in larger pores of the sandstone sample. England & Mackenzie
(1989) argued that the increasing source maturity will steadily increase the GOR of the
petroleum migrating into a reservoir and thus the most recently arrived (most mature)
1 INTRODUCTION 8
petroleum will be predominantly found nearest to the source rock kitchen or sourcing
direction in general (England, 1989; England et al., 1987).
Initial compositional heterogeneities within a newly filled reservoir are attempted to approach
a state of thermodynamic equilibrium, which might occur via a variety of mass-transfers or
mixing processes. In the Earth gravitational field, thermodynamically gradients will set up in
the oil column, which leads to gravitational segregation during geological time. These effects
increase the concentration of denser compounds at the base and lead to a progressive increase
of the GOR towards the top of the petroleum column, and a decrease in the subsurface density
(England, 1989). Differences in the GOR give a rise to variations in the density (higher GOR
= lower fluid density).
Density driven mixing, thermal convection, and diffusive mixing can operate as mixing types
on petroleum accumulation. The processes are described in England et al. (1987) and England
(1989). Thermal convection is unlikely to be a significant mixing process as in many reservoir
the magnitudes of thermal gradients (changes in the local temperature) are too low. Density
driven mixing is depended on the permeability and was shown to be fast in reservoirs or parts
of the reservoir with good (permeability) conditions and vice versa. In general, for both
mixing processes, reservoir anisotropy plays an important role, because mixing involves
vertical and horizontal movements. Except for good to excellent reservoirs England et al.
(1987) and England (1989) suggest a long time interval for density driven mixing with respect
to the time required for the reservoir filling, which will vary considerably depending on
reservoir structure, fluid type and viscosity. A typical value for the North Sea was set to
10 Ma. Diffusive mixing reduces or eliminates horizontal chemical potential differences in
fluids as a function of differences in the concentration. Vertical diffusion in the oil column is
relatively rapid (< 1 Ma) on a geological timescale, but horizontal diffusion is ineffective and
slow for large distances between different wells (100 Ma for reservoir with Κ = 10 md), e.g.
as a process for the elimination of variations in the GOR.
Due to distinctly lower viscosity, all mixing processes will be much faster in gas reservoirs.
Assessing the extent of reservoir mixing is important for the comparison and interpretation of
fluid analyses from different parts of the reservoir and for the reconstruction of the filling
history, because lateral compositional variations are related to the direction from which the
field was filled by migrating petroleum generated in the source rock kitchen area. Due to slow
1 INTRODUCTION 9
rates (geological time) of intra reservoir mixing the differences may persist to the present day
(England et al., 1987).
In many reservoirs, the original petroleum composition is affected by post-filling alteration
processes such as cap rock leakage, evaporative fractionation, deasphalting, water washing or
biodegradation. Petroleum alteration starts immediately after petroleum formation and has a
great influence on the physical fluid properties such as API gravity and viscosity. For
instance, biodegradation and water washing are processes initiated at the oil-water interface,
which lead to heavy, low API gravity oils depleted in hydrocarbons but enriched in non-
hydrocarbons such as NSO compounds and asphaltenes (Killops & Killops, 2005; Palmer,
1993; Peters et al., 2005; Tissot & Welte, 1984).
Petroleum reservoirs commonly have a complex filling history characterised by large and
small-scale heterogeneities induced by the filling process itself, in-reservoir mixing, and
alteration.
1.2 ASPHALTENES
1.2.1 DEFINITION AND OCCURRENCE
The proportion of aliphatic, aromatic and NSO compounds comprising resins and asphaltenes,
define the gross composition of petroleum. The heaviest and most polar fraction of petroleum
is named asphaltenes. J.B. Boussingault (1837), who described constituents of bitumen found
in the Eastern France and Peru, coined the term asphaltene. Boussingault named the fraction
of a distillation residue “asphaltene”, which was insoluble in alcohol but soluble in the
essence of turpentine, since it resembled pure asphalt. Nellensteyn (1924) defined the
asphaltene fraction of a crude oil as the fraction insoluble in low boiling point paraffinic
hydrocarbons, but soluble in carbon tetrachloride and benzene. Marcusson et al. (1931)
distinguished three petroleum fractions; asphaltenes which precipitated by petroleum ether,
resins which are soluble in petroleum ether but are adsorbed on fuller’s earth, and oil
constituents which are the ether soluble fraction that does not adsorb on fuller’s earth.
Nowadays asphaltenes are defined as that part of the solvent-extractable organic matter,
which precipitates upon the addition of excess light hydrocarbons (Hirschberg et al., 1984;
1 INTRODUCTION 10
Kawanaka et al., 1989; Leontaris & Mansoori, 1988; Mitchell & Speight, 1973). Asphaltenes
belong to the first petroleum products formed during diagenesis, which comprise mainly
heteroatomic NSO compounds (Nitrogen, Sulphur, and Oxygen). They are structurally very
complex, highly polar and are made up of high molecular weight carbon skeletons, which can
be aromatic or aliphatic in character (Tissot & Welte, 1984).
The amount of resins plus asphaltenes ranges from 0 - 40 % in non-degraded crude oils
(depending on genetic type and thermal maturation) up to 60 % in heavy degraded oils.
Source rock extracted bitumen is richer in asphaltenes and resins compared to crude oils
(Tissot & Welte, 1984). The quantity of precipitated asphaltenes varies for a given petroleum
with the solvent used, the temperature of mixing and the time elapsed between mixing and
separation (Pfeiffer & Saal, 1940).
During crude oil production, asphaltenes give rise to a variety of problems. It is widely
recognized that flocculation and deposition of asphaltenes may occur if the thermodynamic
equilibrium is disturbed (Hirschberg et al., 1984; Hammami et. al., 2000). This might be
triggered by changes in pressure and temperature or by injection of gas during improved oil
recovery (IOR) operations. Another possible problem is the adsorption of asphaltenes onto the
surface of minerals within the reservoir, whereby the wettability is changed from water-wet to
oil-wet thereby reducing the potential oil recovery (Leontaris, 1989; Leontaris & Mansoori,
1988). Thus, from the production point of view, asphaltene enrichments have predominantly
negative effects as they represent non-producible oil in place, acting as flow barriers, and
introducing oil quality differences in the reservoir (Wilhelms & Larter, 1994a; Wilhelms &
Larter, 1994b). Many authors have reported the immense problems initiated by the presence
and behaviour of asphaltenes, for instance plugging of wells, deposition on the steel walls in
the production line, accumulation of asphaltenes in separators or other fluid processing units,
or deactivation of catalysts (e.g. Calemma & Rausa, 1997; Leontaris & Mansoori, 1988).
Clean up of deposited asphaltenes in the field may necessitate well shut-in and might lead in
the worst case to the loss of producable oil. Hence, preventing asphaltene flocculation is a
necessity from both an operational and economical viewpoint.
The understanding of processes leading to asphaltene enrichments is very important for the
planning of platforms and safety issues on oil production installations (Leontaris, 1989).
Despite these negative effects, asphaltenes display structural and compositional features,
which make them a valuable tool for the geochemical investigations of petroleum reservoirs,
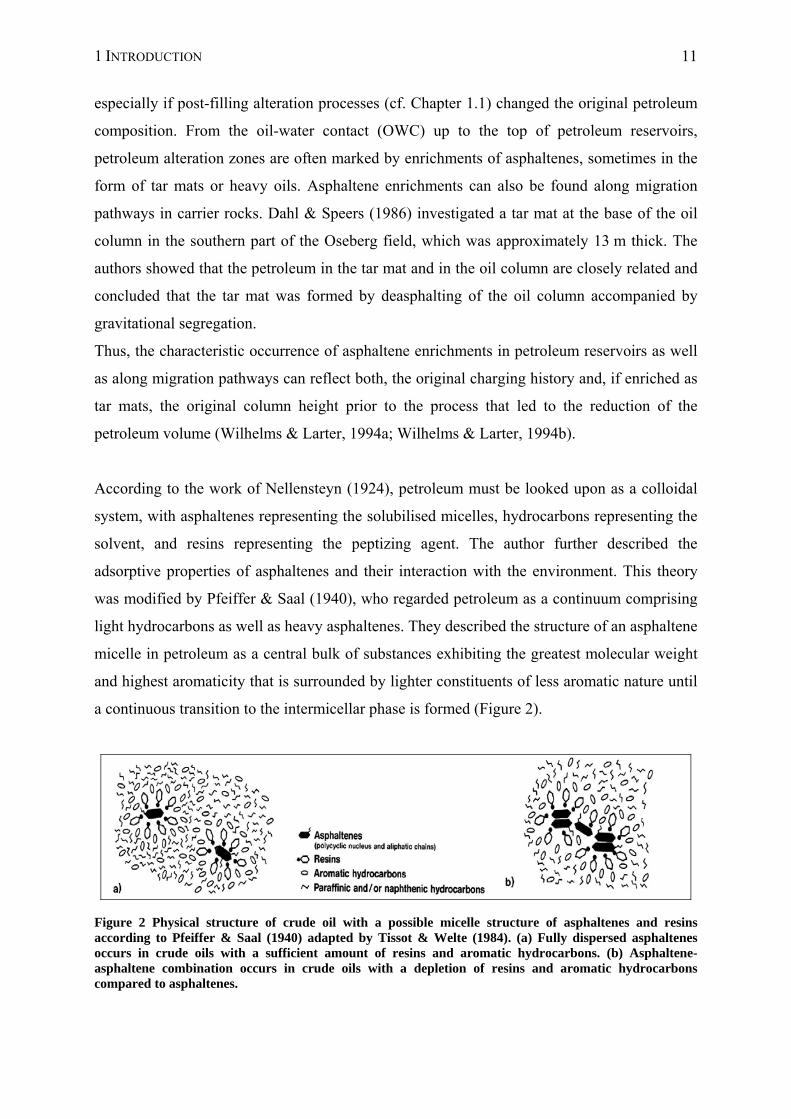
1 INTRODUCTION 11
especially if post-filling alteration processes (cf. Chapter 1.1) changed the original petroleum
composition. From the oil-water contact (OWC) up to the top of petroleum reservoirs,
petroleum alteration zones are often marked by enrichments of asphaltenes, sometimes in the
form of tar mats or heavy oils. Asphaltene enrichments can also be found along migration
pathways in carrier rocks. Dahl & Speers (1986) investigated a tar mat at the base of the oil
column in the southern part of the Oseberg field, which was approximately 13 m thick. The
authors showed that the petroleum in the tar mat and in the oil column are closely related and
concluded that the tar mat was formed by deasphalting of the oil column accompanied by
gravitational segregation.
Thus, the characteristic occurrence of asphaltene enrichments in petroleum reservoirs as well
as along migration pathways can reflect both, the original charging history and, if enriched as
tar mats, the original column height prior to the process that led to the reduction of the
petroleum volume (Wilhelms & Larter, 1994a; Wilhelms & Larter, 1994b).
According to the work of Nellensteyn (1924), petroleum must be looked upon as a colloidal
system, with asphaltenes representing the solubilised micelles, hydrocarbons representing the
solvent, and resins representing the peptizing agent. The author further described the
adsorptive properties of asphaltenes and their interaction with the environment. This theory
was modified by Pfeiffer & Saal (1940), who regarded petroleum as a continuum comprising
light hydrocarbons as well as heavy asphaltenes. They described the structure of an asphaltene
micelle in petroleum as a central bulk of substances exhibiting the greatest molecular weight
and highest aromaticity that is surrounded by lighter constituents of less aromatic nature until
a continuous transition to the intermicellar phase is formed (Figure 2).
Figure 2 Physical structure of crude oil with a possible micelle structure of asphaltenes and resins according to Pfeiffer & Saal (1940) adapted by Tissot & Welte (1984). (a) Fully dispersed asphaltenes occurs in crude oils with a sufficient amount of resins and aromatic hydrocarbons. (b) Asphaltene-asphaltene combination occurs in crude oils with a depletion of resins and aromatic hydrocarbons compared to asphaltenes.
1 INTRODUCTION 12
In their concept petroleum is an equilibrium mixture, which means that if a fraction becomes
modified an evolution takes place to recover the equilibrium. Thus, the addition of excess
hydrocarbons or the removal of resins causes asphaltene precipitation.
Differences in the physical properties of petroleum compounds are related to size and polarity
as well as structure and chemical composition. The latter mainly influence adsorptive
properties.
1.2.2 ASPHALTENES IN RESERVOIR GEOCHEMISTRY
It has been reported by several authors that kerogen and asphaltene pyrolysates show close
structural and compositional similarities (Behar & Pelet, 1985; di Primio et al., 2000;
Eglinton et al., 1991; Muscio, 1991; Pelet et al., 1986). Asphaltenes have been described as
“reservoired kerogen moieties”, which contain structural and maturity related information of
the source rock from which they were generated (Behar & Pelet, 1985; Pelet et al., 1986).
Qualitatively, pyrolysis products of asphaltenes and kerogen generate the same type of
compounds by thermal evolution (Behar & Pelet, 1985). Horsfield (1997) reported similar
alkyl chain length distributions for pyrolysates of kerogen, asphaltenes and heterocomponent
fractions (NSO fraction) of Posidonia Shale samples with an oil generating maturity
Rm = 0.53 - 0.88 %. Muscio (1991) as well recognised a good correlation of gas-oil ratios
(GOR) for these kerogen and related asphaltene samples with increasing maturity.
Both concluded that the organic matter quality can be determined either from kerogens or
from genetically related asphaltenes of rock bitumen and/or crude oils. This extends kerogen
typing and petroleum prediction concepts from source lithology to petroleum reservoirs
(Horsfield et al., 1993). Thus, geochemical techniques and parameters originally developed
for kerogen typing studies can be applied for reservoir characterisation using asphaltenes.
From kerogen typing studies, it is already known that pyrolysis yield and pyrolysate
composition can be used to characterise the genetic potential, quality and maturity of kerogen
(Curry & Simpler, 1988; di Primio & Horsfield, 1996; Eglinton et al., 1990; Horsfield, 1989;
Larter, 1984; Senftle et al., 1986; van Graas et al., 1981). Various compound classes have
been defined in kerogen pyrolysates e.g. hydrocarbons, ketones, thiols, alcohols or nitriles,
which are represented by saturated and unsaturated, cyclic and acyclic carbon skeletons. For
instance, phenolic compounds in pyrolysates are a useful indicator for the presence of higher
plant debris within the kerogen (Larter, 1984). Alkylated thiophenes are used to estimate the
relative content of organic sulphur with respect to organofacies of the source and the thermal
1 INTRODUCTION 13
maturity of the organic matter (Eglinton et al., 1991; 1990; 1992; Sinninghe Damste et al.,
1989; 1990). Horsfield (1989) demonstrated that the aromaticity of the volatilisable
substituents of kerogen can be used as measure of the aromaticity of the total kerogen. It was
shown that aromatic compounds can be used to discriminate kerogen types and that the
residual organic matter becomes more and more aromatic with decreasing H/C atomic ratio
(Horsfield, 1989; Larter, 1984; Muscio & Horsfield, 1996). Proportionately, large gas yields
in pyrolysis products are typically generated by hydrogen poor kerogen (Type III) or gas-
prone coals. Hydrogen poor kerogens often contain high proportions of lignocellulosic
material that is characterised by an increasing tendency to form gas with increasing maturity
(Horsfield, 1989; Horsfield, 1997). The ratio of gaseous to liquid compounds (GOR) changes
as a function of maturity, whereby higher gas amounts or higher GOR are related to higher
maturity levels (Santamaria-Orozco et al., 1998).
The application of thermal analytical methods on asphaltenes, e.g. pyrolysis-GC, for
petroleum reservoir characterisation is particularly useful when the oil has been altered or
biodegraded. Lehne & Dieckmann (2007) demonstrated that asphaltenes remain unaffected by
low temperature alteration processes such as biodegradation or water washing. Although
asphaltenes may precipitate during phase separation processes, their major characteristics are
preserved. As one constituent of migrating petroleum, asphaltenes in the reservoir can be
viewed as fingerprint of the original composition of individual oil charges, and therefore are
used as marker for alteration and migration processes.
Appling this concept the relative mass of unaltered petroleum originally present in the
Holzener Asphaltkalk of northern Germany could be inferred by micro scale sealed vessel
pyrolysis experiments (MSSV) of asphaltenes in the reservoir and its most likely source, the
Posidonia Shale (Horsfield et al., 1991). The mass balance calculation revealed that 50 - 90 %
of petroleum was lost due to alteration phenomena in the reservoir. Muscio et al. (1991)
suggested the application of oil asphaltenes for the reconstruction of the original GOR of
biodegraded oil accumulations.
Different reservoir compartments are often characterised by highly variable petroleum
compositions induced by post-filling alteration processes as documented e.g. for the North
Sea (Horstad et al., 1990) or for the Gulf of Mexico (Holba et al., 1996). Unravelling the
history of compartmentalized reservoirs with a complex charge and alteration history presents
a particularly difficult challenge, because subtle in-situ variabilities have to be recognised.
1 INTRODUCTION 14
While produced oils present the average product of a thick reservoir interval, reservoir rock
samples are useful for identifying small-scale variations within the reservoir. Reservoir rocks
enriched in NSO heterocompounds (asphaltene rich) represent residual oil or even organic
barriers leading to compartmentalization. They can be sampled in high resolution and used to
reconstruct the original oil composition at any place within the reservoir. On the other hand,
the labile constituents of asphaltenes still reflect the hydrocarbon fingerprint of the bulk
parent oil with which the asphaltenes were generated.
The analysis of reservoir rocks using pyrolysis techniques has been applied in reservoir
characterisation studies to delineate complex reservoir compartmentalisation, tracing the
movement of the oil in the reservoir, or for studies determining the timing of reservoir filling
(Cornford, 1998; Horstad et al., 1995; Karlsen & Larter, 1989). For instance, Karlsen &
Larter (1989) combined Iatroscan thin layer chromatography (TLC-FID) and Rock-Eval
pyrolysis using reservoir rocks for a petroleum population mapping within individual
petroleum reservoirs. Ehrenberg et al. (1995) have shown that asphaltenes from reservoir
rocks reflect high resolution variations within a reservoir structure due to the specific
charging history and that they are very helpful for a better understanding of reservoir
heterogeneities defined by the original oil charge. Jarvie et al. (2001) detected bypassed pay
zones and sand bodies using the Source Rock Analyzer. Bhullar et al. (1998) illustrated that
the enrichment of asphaltenes and their distribution throughout reservoir rocks can be used as
fundamental geomarker for the recognition of oil-water and especially paleo-oil-water
contacts in reservoir structures. They also clearly highlighted that petroleum in reservoir
structures is much more heterogeneous than previously thought based on studies on produced
oils.
Another application for asphaltenes is their use in the assessment of petroleum type
organofacies and maturity. Petroleum asphaltenes have been used to determine source rock
characteristics of active kitchen areas and to reconstruct the filling histories of reservoirs
(Horsfield et al., 1991; Keym & Dieckmann, 2006; Lehne & Dieckmann, 2007). This is
important because mature source rocks are usually found at great depth and thus are seldom
drilled, and oil accumulations in petroleum reservoirs are often situated in structural heights
where the potential source rock is immature and of a different organofacies.
All these findings point to the importance of asphaltenes in petroleum accumulations for the
determination of kerogen type and source facies and as well as the gross compositional

1 INTRODUCTION 15
characteristics of the original unaltered petroleum expelled from the source. Asphaltenes are a
useful tool for correlation studies as substitution for the source rock kerogen. The features of
asphaltenes can significantly aid in improving predictions of post-filling reservoir alteration
and in enhancing the understanding of compartmentalisation and reservoir filling history.
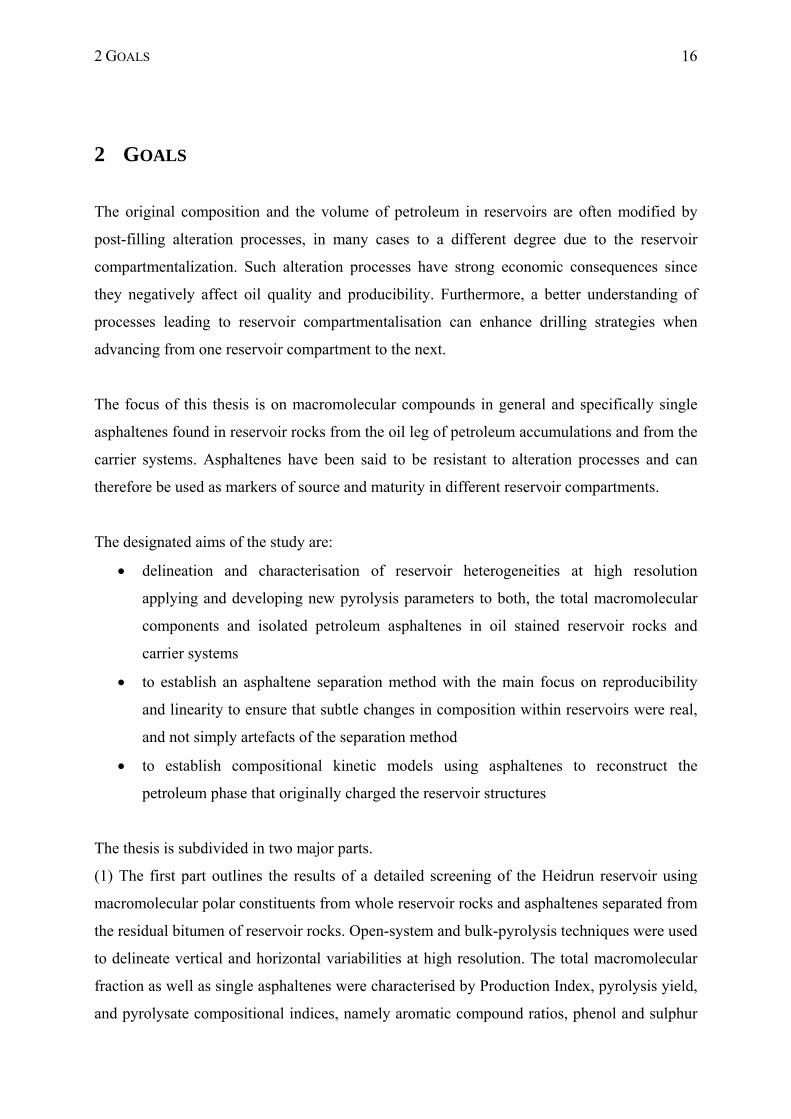
2 GOALS 16
2 GOALS
The original composition and the volume of petroleum in reservoirs are often modified by
post-filling alteration processes, in many cases to a different degree due to the reservoir
compartmentalization. Such alteration processes have strong economic consequences since
they negatively affect oil quality and producibility. Furthermore, a better understanding of
processes leading to reservoir compartmentalisation can enhance drilling strategies when
advancing from one reservoir compartment to the next.
The focus of this thesis is on macromolecular compounds in general and specifically single
asphaltenes found in reservoir rocks from the oil leg of petroleum accumulations and from the
carrier systems. Asphaltenes have been said to be resistant to alteration processes and can
therefore be used as markers of source and maturity in different reservoir compartments.
The designated aims of the study are:
delineation and characterisation of reservoir heterogeneities at high resolution
applying and developing new pyrolysis parameters to both, the total macromolecular
components and isolated petroleum asphaltenes in oil stained reservoir rocks and
carrier systems
to establish an asphaltene separation method with the main focus on reproducibility
and linearity to ensure that subtle changes in composition within reservoirs were real,
and not simply artefacts of the separation method
to establish compositional kinetic models using asphaltenes to reconstruct the
petroleum phase that originally charged the reservoir structures
The thesis is subdivided in two major parts.
(1) The first part outlines the results of a detailed screening of the Heidrun reservoir using
macromolecular polar constituents from whole reservoir rocks and asphaltenes separated from
the residual bitumen of reservoir rocks. Open-system and bulk-pyrolysis techniques were used
to delineate vertical and horizontal variabilities at high resolution. The total macromolecular
fraction as well as single asphaltenes were characterised by Production Index, pyrolysis yield,
and pyrolysate compositional indices, namely aromatic compound ratios, phenol and sulphur
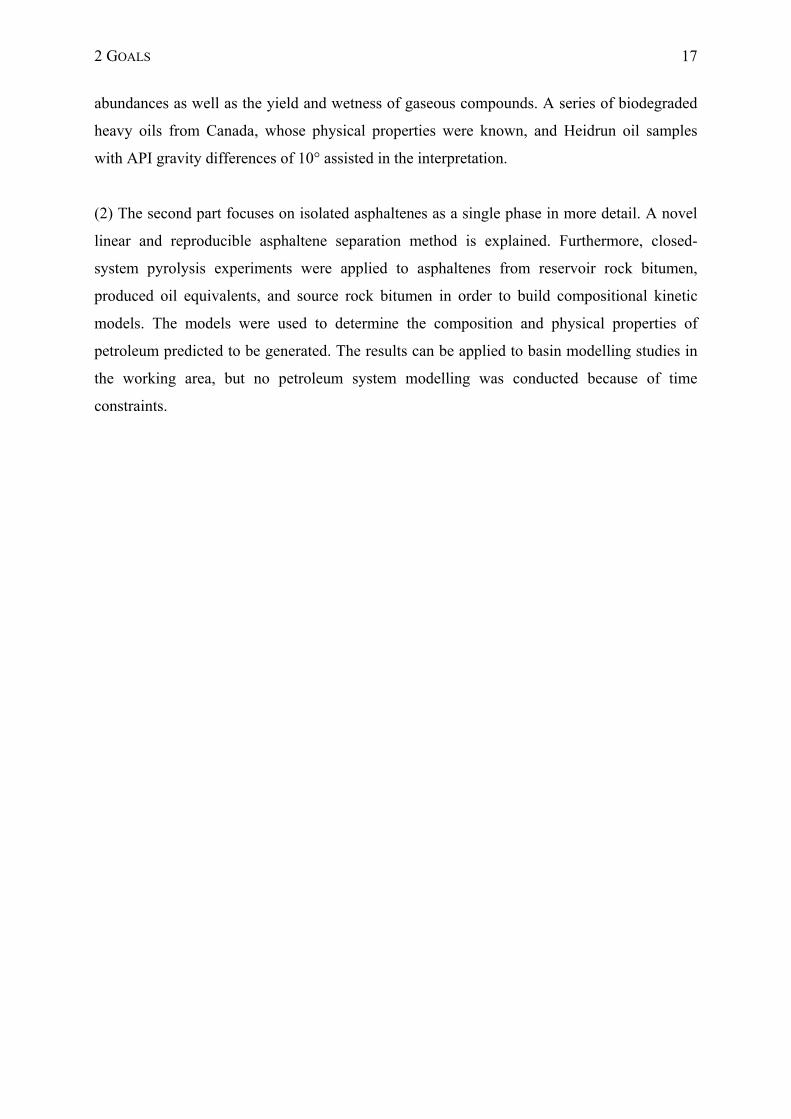
2 GOALS 17
abundances as well as the yield and wetness of gaseous compounds. A series of biodegraded
heavy oils from Canada, whose physical properties were known, and Heidrun oil samples
with API gravity differences of 10° assisted in the interpretation.
(2) The second part focuses on isolated asphaltenes as a single phase in more detail. A novel
linear and reproducible asphaltene separation method is explained. Furthermore, closed-
system pyrolysis experiments were applied to asphaltenes from reservoir rock bitumen,
produced oil equivalents, and source rock bitumen in order to build compositional kinetic
models. The models were used to determine the composition and physical properties of
petroleum predicted to be generated. The results can be applied to basin modelling studies in
the working area, but no petroleum system modelling was conducted because of time
constraints.
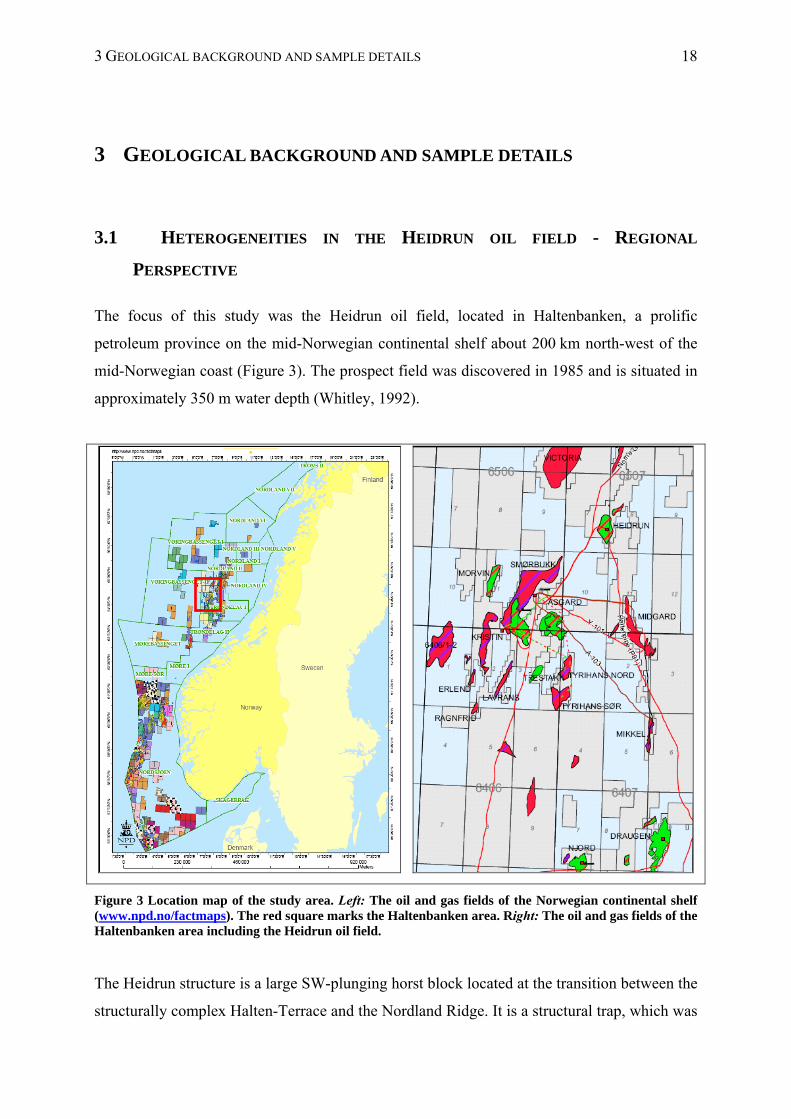
3 GEOLOGICAL BACKGROUND AND SAMPLE DETAILS 18
3 GEOLOGICAL BACKGROUND AND SAMPLE DETAILS
3.1 HETEROGENEITIES IN THE HEIDRUN OIL FIELD - REGIONAL
PERSPECTIVE
The focus of this study was the Heidrun oil field, located in Haltenbanken, a prolific
petroleum province on the mid-Norwegian continental shelf about 200 km north-west of the
mid-Norwegian coast (Figure 3). The prospect field was discovered in 1985 and is situated in
approximately 350 m water depth (Whitley, 1992).
Figure 3 Location map of the study area. Left: The oil and gas fields of the Norwegian continental shelf (www.npd.no/factmaps). The red square marks the Haltenbanken area. Right: The oil and gas fields of the Haltenbanken area including the Heidrun oil field.
The Heidrun structure is a large SW-plunging horst block located at the transition between the
structurally complex Halten-Terrace and the Nordland Ridge. It is a structural trap, which was
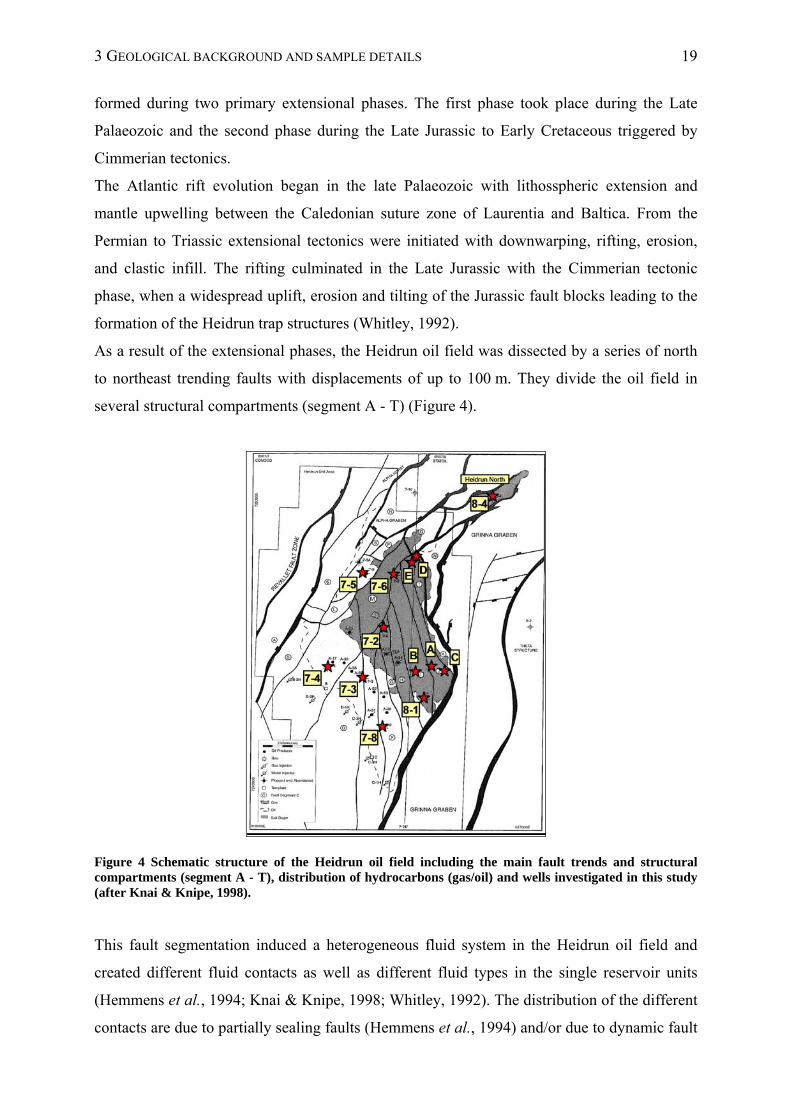
3 GEOLOGICAL BACKGROUND AND SAMPLE DETAILS 19
formed during two primary extensional phases. The first phase took place during the Late
Palaeozoic and the second phase during the Late Jurassic to Early Cretaceous triggered by
Cimmerian tectonics.
The Atlantic rift evolution began in the late Palaeozoic with lithosspheric extension and
mantle upwelling between the Caledonian suture zone of Laurentia and Baltica. From the
Permian to Triassic extensional tectonics were initiated with downwarping, rifting, erosion,
and clastic infill. The rifting culminated in the Late Jurassic with the Cimmerian tectonic
phase, when a widespread uplift, erosion and tilting of the Jurassic fault blocks leading to the
formation of the Heidrun trap structures (Whitley, 1992).
As a result of the extensional phases, the Heidrun oil field was dissected by a series of north
to northeast trending faults with displacements of up to 100 m. They divide the oil field in
several structural compartments (segment A - T) (Figure 4).
Figure 4 Schematic structure of the Heidrun oil field including the main fault trends and structural compartments (segment A - T), distribution of hydrocarbons (gas/oil) and wells investigated in this study (after Knai & Knipe, 1998).
This fault segmentation induced a heterogeneous fluid system in the Heidrun oil field and
created different fluid contacts as well as different fluid types in the single reservoir units
(Hemmens et al., 1994; Knai & Knipe, 1998; Whitley, 1992). The distribution of the different
contacts are due to partially sealing faults (Hemmens et al., 1994) and/or due to dynamic fault
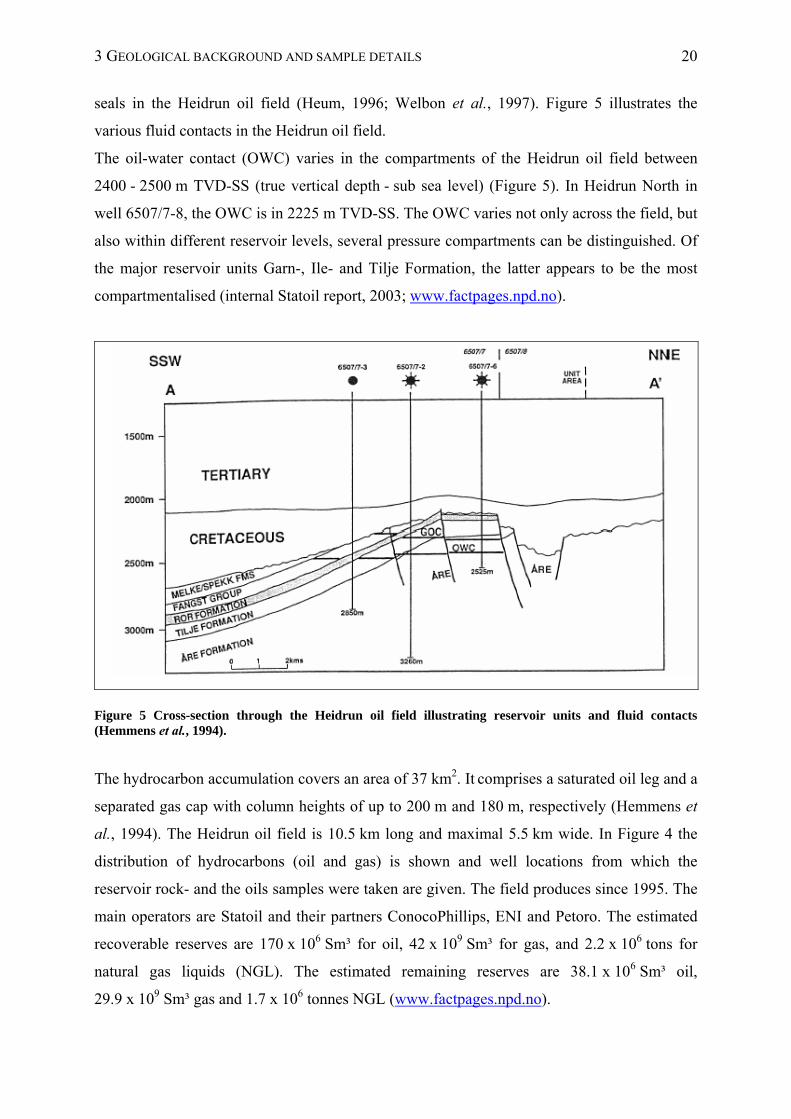
3 GEOLOGICAL BACKGROUND AND SAMPLE DETAILS 20
seals in the Heidrun oil field (Heum, 1996; Welbon et al., 1997). Figure 5 illustrates the
various fluid contacts in the Heidrun oil field.
The oil-water contact (OWC) varies in the compartments of the Heidrun oil field between
2400 - 2500 m TVD-SS (true vertical depth - sub sea level) (Figure 5). In Heidrun North in
well 6507/7-8, the OWC is in 2225 m TVD-SS. The OWC varies not only across the field, but
also within different reservoir levels, several pressure compartments can be distinguished. Of
the major reservoir units Garn-, Ile- and Tilje Formation, the latter appears to be the most
compartmentalised (internal Statoil report, 2003; www.factpages.npd.no).
Figure 5 Cross-section through the Heidrun oil field illustrating reservoir units and fluid contacts (Hemmens et al., 1994).
The hydrocarbon accumulation covers an area of 37 km2. It comprises a saturated oil leg and a
separated gas cap with column heights of up to 200 m and 180 m, respectively (Hemmens et
al., 1994). The Heidrun oil field is 10.5 km long and maximal 5.5 km wide. In Figure 4 the
distribution of hydrocarbons (oil and gas) is shown and well locations from which the
reservoir rock- and the oils samples were taken are given. The field produces since 1995. The
main operators are Statoil and their partners ConocoPhillips, ENI and Petoro. The estimated
recoverable reserves are 170 x 106 Sm³ for oil, 42 x 109 Sm³ for gas, and 2.2 x 10⁶ tons for
natural gas liquids (NGL). The estimated remaining reserves are 38.1 x 10⁶ Sm³ oil,
29.9 x 10⁹ Sm³ gas and 1.7 x 10⁶ tonnes NGL (www.factpages.npd.no).
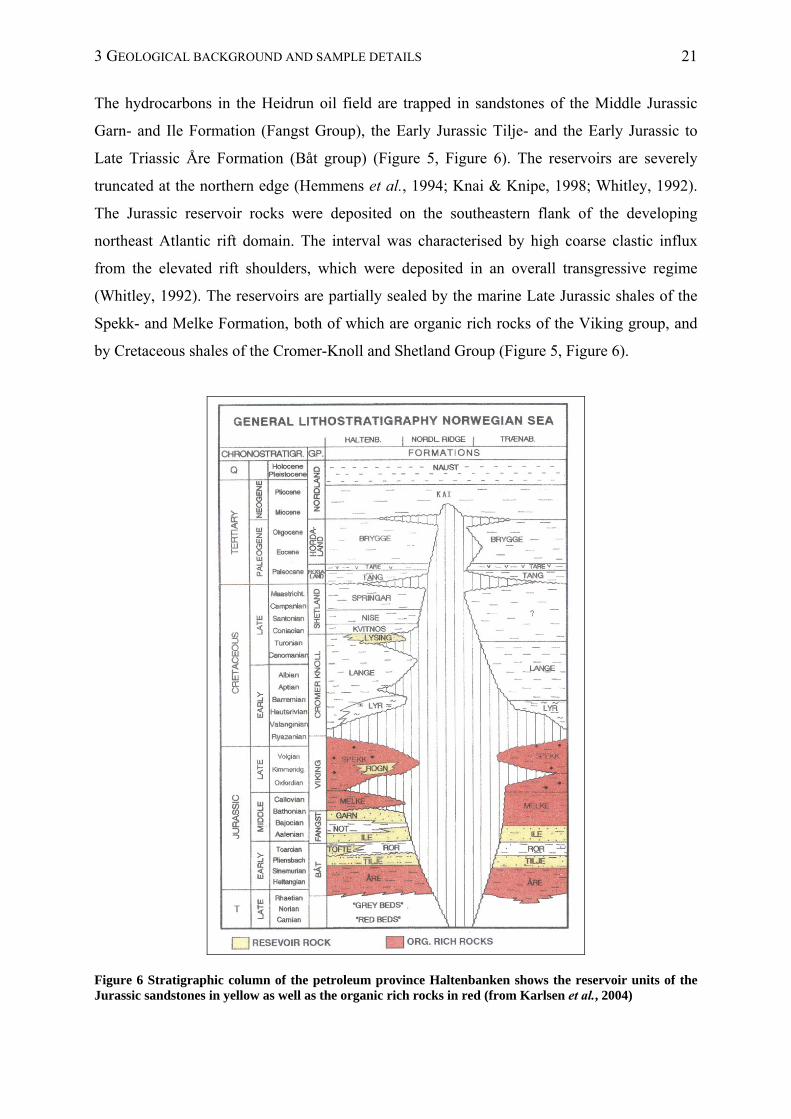
3 GEOLOGICAL BACKGROUND AND SAMPLE DETAILS 21
The hydrocarbons in the Heidrun oil field are trapped in sandstones of the Middle Jurassic
Garn- and Ile Formation (Fangst Group), the Early Jurassic Tilje- and the Early Jurassic to
Late Triassic Åre Formation (Båt group) (Figure 5, Figure 6). The reservoirs are severely
truncated at the northern edge (Hemmens et al., 1994; Knai & Knipe, 1998; Whitley, 1992).
The Jurassic reservoir rocks were deposited on the southeastern flank of the developing
northeast Atlantic rift domain. The interval was characterised by high coarse clastic influx
from the elevated rift shoulders, which were deposited in an overall transgressive regime
(Whitley, 1992). The reservoirs are partially sealed by the marine Late Jurassic shales of the
Spekk- and Melke Formation, both of which are organic rich rocks of the Viking group, and
by Cretaceous shales of the Cromer-Knoll and Shetland Group (Figure 5, Figure 6).
Figure 6 Stratigraphic column of the petroleum province Haltenbanken shows the reservoir units of the Jurassic sandstones in yellow as well as the organic rich rocks in red (from Karlsen et al., 2004)
3 GEOLOGICAL BACKGROUND AND SAMPLE DETAILS 22
The Fangst group consists of three units. Two of them, the Garn- and the Ile Formation are
regarded as reservoirs. The third, the Not Formation is regarded as non-productive in the
Heidrun oil field (internal Statoil report, 2003).
The sandstones of the Fangst Group were mainly deposited in marine environments ranging
from shallow shelf to shoreline. The uppermost Fangst subzone, the Garn Formation, lacks
indications for marine deposition. The Garn Formation sediments have been deposited in a
braided-stream fluvial environment. They represent a mixture of fluvial and tidally influenced
deposits with multi-storey channel complexes and contain by far the highest quality reservoir
sandstones compared to any other subzone in the Heidrun oil field. Typical are trough cross
stratification in this subzone (Hemmens et al., 1994).
The Ile Formation is separated from the overlying Garn by the shallow marine shales and
sands of the Not Formation. The Ile Formation consists of two prograding delta / shoreface
units (Ile Fm. 1 - 2 and Ile Fm. 3 - 6). They were most likely deposited in a wave-dominated
delta on a storm-dominated coastline. The Ile Fm. 1 - 2 represents shallow marine tidally
dominated delta deposits and consists of fine to very fine grained cross- or ripple stratified
sandstones. They are shaly at the base and coarsen upwards (Hemmens et al., 1994; Whitley,
1992). The Ile Fm. 3 - 6 begins with lower shoreface hummocky cross-stratified sandstone
and coarsening upward through the upper shoreface and bay-fill sandstones.
The total thickness of the Fangst group is up to 90 m at the southern flank, while it is thinned
or partly completely absent in the crestal part of the field due to erosion (Figure 5) (Hemmens
et al., 1994). Compared to the Tilje and the Åre Formation Reservoirs, the Fangst group
contains higher quality sandstones concerning porosity, permeability and water saturation. It
further contains the largest oil column and oil with a higher API gravity (Whitley, 1992). The
physical reservoir parameters of the Heidrun oil field are listed in Table 1.
The Tilje Formation sandstones, with somewhat lower reservoir quality, are one of the four
formations of the Båt Group (Figure 6). The Tilje Formation is underlain by the Åre
Formation and overlain by the marine mudstones of the Ror Formation. The Tilje Formation
sandstones and the upper subzone of the Åre Formation are the products of shallow marine
shelf, subtidal, and intertidal environments, which results in highly variable depositional
patterns. The sedimentology in the Tilje is therefore very complex and the reservoir subzones
are extremely heterogeneous (Hemmens et al., 1994).
Facies associations of the Tilje Formation include inter alia storm influenced prodelta, delta
front, estuarine, tidal channel, and delta front bars deposited in a wave and storm dominated
3 GEOLOGICAL BACKGROUND AND SAMPLE DETAILS 23
environment. In the Heidrun oil field, the Tilje Formation is divided into four reservoir units
(Tilje Fm. 1 - 4) with several subunits (internal Statoil report, 2003).
The Tilje Fm. 1 is characterised by silt/mudstones and cross-stratified sandstones, which are
intensively burrowed indicating shallow marine depositional environment. The upper part of
the Tilje Fm. 1 is a tidal flat sequence with occasional desiccation cracks and rootlets. The
Tilje Fm. 2 is composed of a basal muddy unit, which grades upward in a series of five
upward coarsening and upward cleaning cycles. They vary from 5 m to 10 m thickness and
consist of heterolithic sand- and siltstones. The sands are intensively bioturbated, which
indicates a deposition under more marine conditions. The Tilje Fm 3 is typified by tidally
influenced deposits (mud rich sediments), which are interbedded with relatively thick
sandstones of tidal channel and tidal shoal deposition. These tidal channel sandstones are the
highest quality sandstones of the whole Tilje Formation. Sands in the tidal flat deposits are
lens-shaped ripples generated by traction transport. Silty shales drape these sand lenses as thin
parallel lamina, representing deposition from suspension. As a result, the sands deposited in
this environment are more discontinuous. The repeated alternation of traction and suspension
indicates dramatic fluctuations in flow intensity, which is a common attribute in tidal
environments. The Tilje Fm. 4 comprises a marine shelf to marine shoal sandstone with some
shale sandstone sequences. The fine to coarse grained clear sandstones are cemented by
siderite, which severely reduces the quality of the reservoir (Hemmens et al., 1994; Whitley,
1992; internal Statoil report, 2003).
The Åre Formation is the lowermost among the reservoir formations of the Heidrun oil field
and is divided in 7 reservoir zones (internal Statoil report, 2003). The lower part of the Åre
Formation (Åre Fm. 1 - 4) is dominated by fluvial to delta plain deposits, which reflect the
overall transgressive development of the formation. This zone is regionally approximately
500 m thick and comprises a series of fluvial channel sands and crevasse splay deposits.
Several reservoir subzones are locally capped by peat swamp coal. (Hemmens et al., 1994;
Knai & Knipe, 1998).
The sediments of the Åre subzones 1 and 2 were deposited in a mud-dominated delta plain
crossed by meandering channels with partly considerably depth (15 m and more) and lateral
dimension (several kilometres). The main reservoirs are bar sandstones lying in the meander
belts, which generally trend north south. Muddy floodplain deposits with thin coal beds
separate the channel sandstones and represent effective lateral and vertical seals. Coal beds
3 GEOLOGICAL BACKGROUND AND SAMPLE DETAILS 24
and organic shales may provide a source of hydrocarbons when thermally mature (Hemmens
et al., 1994; Whitley, 1992).
The Åre Fm. subzones 3 and 4 are characterised by a slightly increasing marine influence.
These sediments represent a complex mixture of bay fill and coastal plain deposits with
channel features and marine incursions. Bay fill deposits with minor coastal plain deposits
dominate reservoir 3, while coastal plain deposits with minor bay fills dominate reservoir 4.
Several reservoir subzones are locally capped by peat swamp coal (internal Statoil report,
2003).
The upper part of the Åre Formation (Åre Fm. 5 - 7) is the most heterogeneous unit in the
Heidrun oil field as the sediments have been deposited in varying environments. They range
from deltaic and intertidal to shallow marine shelf deposits, where marine, fluvial and tidal
forces interact. The highest marine influence can be observed for the middle and the upper
parts of the sequence. The total average thickness is about 200 m (Knai & Knipe, 1998;
Whitley, 1992).
The base of the upper part comprises sandstones deposited in shallower tidal environments,
which consist of flaser-bedded, rippled sand with interbedded mudstones. The upper part
comprises burrowed sands with wave ripples, which contain thin zones with interbedded
mudstones and ooids, indicating a subtidal environment. A general trend of increasing marine
influence can be seen from the transition of the fluvial dominated Åre Fm. 1 and 2 through the
bay fill sequences of the Åre Fm. 3 - 6 to the marginal marine sediments at the top of the
Åre Fm. 7. The upper boundary of the Åre Fm. 7 to the overlying Tilje Fm. 1 defines the start
of the more open marine environment (Whitley, 1992).
Due to the heterogeneous sediment and facies mixture both, the Tilje and the Upper Åre
reservoir (Åre Fm. 5 - 7) provide the lowest reservoir quality with respect to porosity and
permeability compared to the Fangst group and the lower Åre reservoir (Fm. 1 - 4) (Table 1).
The generally high quality of the reservoir sandstones in all reservoir formations is related to
the shallow depth of burial (less than 2500 m) that limited diagenetic changes (Hemmens et
al., 1994; Whitley, 1992). Thus reservoir quality is primarily controlled by depositional
features and primary porosity the predominant type of porosity. Only minor secondary
porosity due to feldspar dissolution is evident. Cemented zones (siderite and calcite) have
been noticed but are volumetrically insignificant and restricted to a few relatively thin layers
(Hemmens et al., 1994).
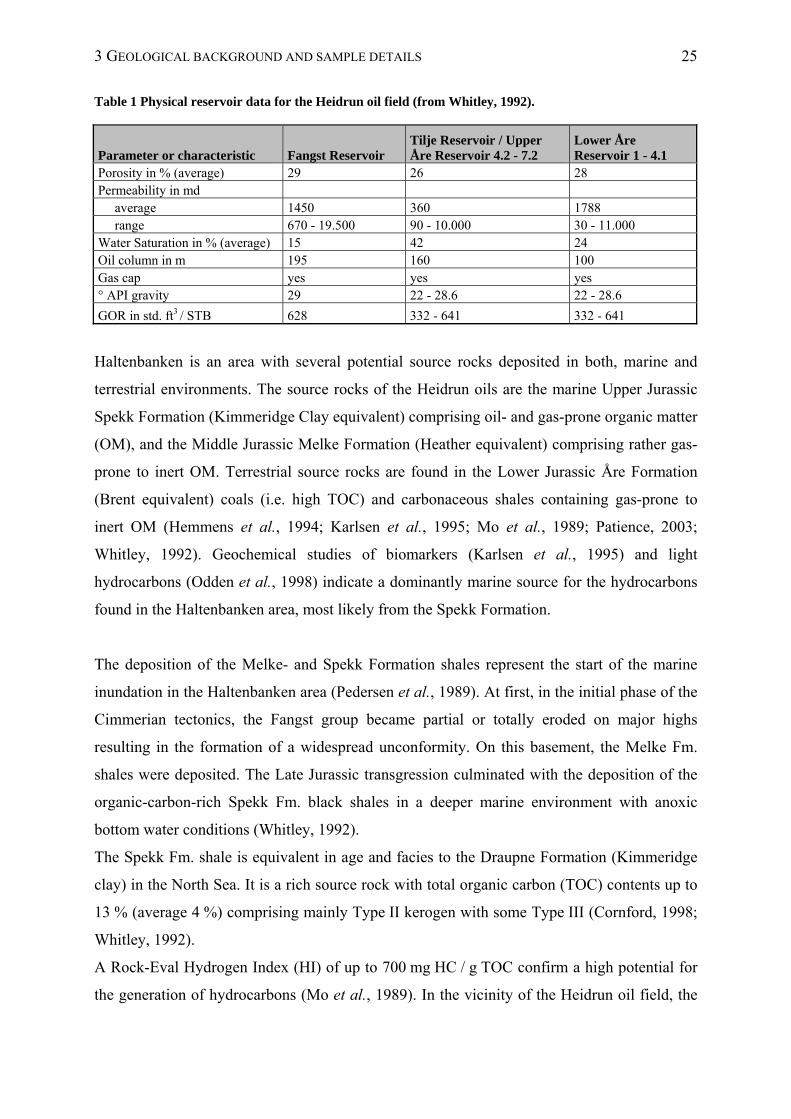
3 GEOLOGICAL BACKGROUND AND SAMPLE DETAILS 25
Table 1 Physical reservoir data for the Heidrun oil field (from Whitley, 1992).
Parameter or characteristic Fangst Reservoir Tilje Reservoir / Upper Åre Reservoir 4.2 - 7.2
Lower Åre Reservoir 1 - 4.1
Porosity in % (average) 29 26 28 Permeability in md average 1450 360 1788 range 670 - 19.500 90 - 10.000 30 - 11.000 Water Saturation in % (average) 15 42 24 Oil column in m 195 160 100 Gas cap yes yes yes ° API gravity 29 22 - 28.6 22 - 28.6
GOR in std. ft3 / STB 628 332 - 641 332 - 641
Haltenbanken is an area with several potential source rocks deposited in both, marine and
terrestrial environments. The source rocks of the Heidrun oils are the marine Upper Jurassic
Spekk Formation (Kimmeridge Clay equivalent) comprising oil- and gas-prone organic matter
(OM), and the Middle Jurassic Melke Formation (Heather equivalent) comprising rather gas-
prone to inert OM. Terrestrial source rocks are found in the Lower Jurassic Åre Formation
(Brent equivalent) coals (i.e. high TOC) and carbonaceous shales containing gas-prone to
inert OM (Hemmens et al., 1994; Karlsen et al., 1995; Mo et al., 1989; Patience, 2003;
Whitley, 1992). Geochemical studies of biomarkers (Karlsen et al., 1995) and light
hydrocarbons (Odden et al., 1998) indicate a dominantly marine source for the hydrocarbons
found in the Haltenbanken area, most likely from the Spekk Formation.
The deposition of the Melke- and Spekk Formation shales represent the start of the marine
inundation in the Haltenbanken area (Pedersen et al., 1989). At first, in the initial phase of the
Cimmerian tectonics, the Fangst group became partial or totally eroded on major highs
resulting in the formation of a widespread unconformity. On this basement, the Melke Fm.
shales were deposited. The Late Jurassic transgression culminated with the deposition of the
organic-carbon-rich Spekk Fm. black shales in a deeper marine environment with anoxic
bottom water conditions (Whitley, 1992).
The Spekk Fm. shale is equivalent in age and facies to the Draupne Formation (Kimmeridge
clay) in the North Sea. It is a rich source rock with total organic carbon (TOC) contents up to
13 % (average 4 %) comprising mainly Type II kerogen with some Type III (Cornford, 1998;
Whitley, 1992).
A Rock-Eval Hydrogen Index (HI) of up to 700 mg HC / g TOC confirm a high potential for
the generation of hydrocarbons (Mo et al., 1989). In the vicinity of the Heidrun oil field, the
3 GEOLOGICAL BACKGROUND AND SAMPLE DETAILS 26
Spekk Formation is immature. It is mature near the Smørbukk and Smørbukk Sør fields
south-west of the Heidrun oil field (Figure 3, right).
The underlying Melke Formation shows a high variability in organic matter quantity and
quality. In general, the Melke Formation can be assumed as being a leaner source rock
containing a mixed marine-terrestrial kerogen (Type II/III). TOCs and HIs range from 1 to
4 % TOC and 120 to 200 mg HC / g TOC, respectively (Ehrenberg et al., 1992; Forbes et al.,
1991).
Cornford (1998) and references therein describes that Middle Jurassic depositions in the
North Sea are limited and generally have a gas-generating potential, but coals are of minor
abundance in these sequences. Their gas-prone nature originates in the vitrinitic material
dominantly the OM of the mudstone facies.
Pyrolysis studies performed in this study (cf. Chapter 6) indicate a paraffinic-naphthenic-
aromatic (P-N-A) low wax petroleum type after Horsfield (1989) for the Spekk Formation.
For the Melke Formation the petroleum type organofacies range between gas condensate and
P-N-A low wax.
The abundance of coal beds and carbonaceous or siliciclastic shale intervals in the lower part
of the Åre Formation (1 - 4.1) are considerable. In total, the coal beds are 30 m - 60 m thick.
Hemmens et al. (1994) assumed that the coal beds and organic rich shales might locally
provide a source of hydrocarbons at sufficient maturation. According to Mo et al. (1989),
which published average values for the unit as a whole including coal seams, the moderate
Rock-Eval HI of 200 mg HC / g TOC points to gas prone Type III OM. In combination with
average organic carbon content of about 8.0 wt. %, the data indicates a high potential for
hydrocarbon generation.
Hvoslef et al. (1988) investigated cores from Haltenbanken with respect to hydrocarbon
generation, migration and expulsion processes in the coals of the Åre Formation. They found
that hydrocarbon expulsion from the coals associated with some compositional fractionation
has taken place in this region. The Åre Formation is mature in all basinal areas of
Haltenbanken, even in the eastern proximal basinal regions, which are important for
petroleum generation in the drainage area of the Midgard field, where the source rock is
immature.
Potential contributions of gas from the Åre Formation to hydrocarbon accumulations in the
Haltenbanken area are still under debate. Based on isotopic models Patience (2003) attributed
the reservoired gases in Mid-Norway to be predominantly of marine origin (Spekk Fm. ±
3 GEOLOGICAL BACKGROUND AND SAMPLE DETAILS 27
Melke Fm.). Only a small proportion is thought to be derived from terrestrial sources such as
the coals and shales from the Åre Formation, even though they reach the gas generation
window in many areas. The author suggested gas loss to be due to poor expulsion and/or
migration routes in the highly heterogeneous Åre Formation. Karlsen et al. (2004) argued that
the Åre Formation due to its stratigraphic depth has generated petroleum earlier than the
Spekk Formation, but that the generated fluids leaked out of the system as traps were either
not present at this time or the cap rock was not consolidated. This argument seems to lack
substance considering the kinetic behaviour of kerogen as marine source rocks generate
petroleum at lower levels of thermal stress than terrestrial sources (e.g. Schenk & Horsfield,
1998).
The Halten Terrace is characterised by two main pressure domains within the Jurassic units,
which are divided by the main fault zone, the Revallet Fault Zone (Figure 4). The area
exhibiting normal hydrostatic pressure is located east of this fault zone, the area with
overpressure is located west of the fault zone (Karlsen et al., 2004).
The filling of the Heidrun oil field started in the Early Cenozoic from the deep parts of the
basin west of Heidrun (overpressured area) where the Spekk Formation source rocks reached
sufficient maturities. With increasing burial of the Spekk Formation, all reservoirs around
Heidrun became charged. In addition to the Spekk Fm., the Melke Fm. may have also acted as
a source rock, but higher kinetic stabilities led to a delay in the organic matter transformation
in comparison to the overlying Spekk Formation (internal IPP report, 2010). The generated
hydrocarbons migrated along the Revallet fault zone into the reservoir structure until its seal-
off due to the quartz cementation (Karlsen et al., 2004). This resulted in a cut-off of the
Heidrun and Smørbukk oil fields from the western part of the basin. However, only a small
part of the first oil directly drained into Heidrun (internal IPP report, 2010). After the
migration scheme changed, Heidrun was charged from south-southwest by the mature source
rocks in the vicinity of Smørbukk and Smørbukk Sør, which imply long distance migration (>
15 km) (Hemmens et al., 1994). Again, only small proportions of hydrocarbons migrate
directly into Heidrun. The main route for hydrocarbons into the Heidrun oil field evolved
along a fill-spill pathway along the ridge connecting Smørbukk and Smørbukk Sør to Heidrun
from the south-southwest to southwest (Hemmens et al., 1994; internal IPP report, 2010). The
latest, probably still ongoing charge to the oil field occurred since the last 2 million years
(internal Statoil report, 2003). Leythaeuser et al. (2007) reconstructed the accumulation and
filling history of different compartments within the Heidrun oil field on the basis of molecular
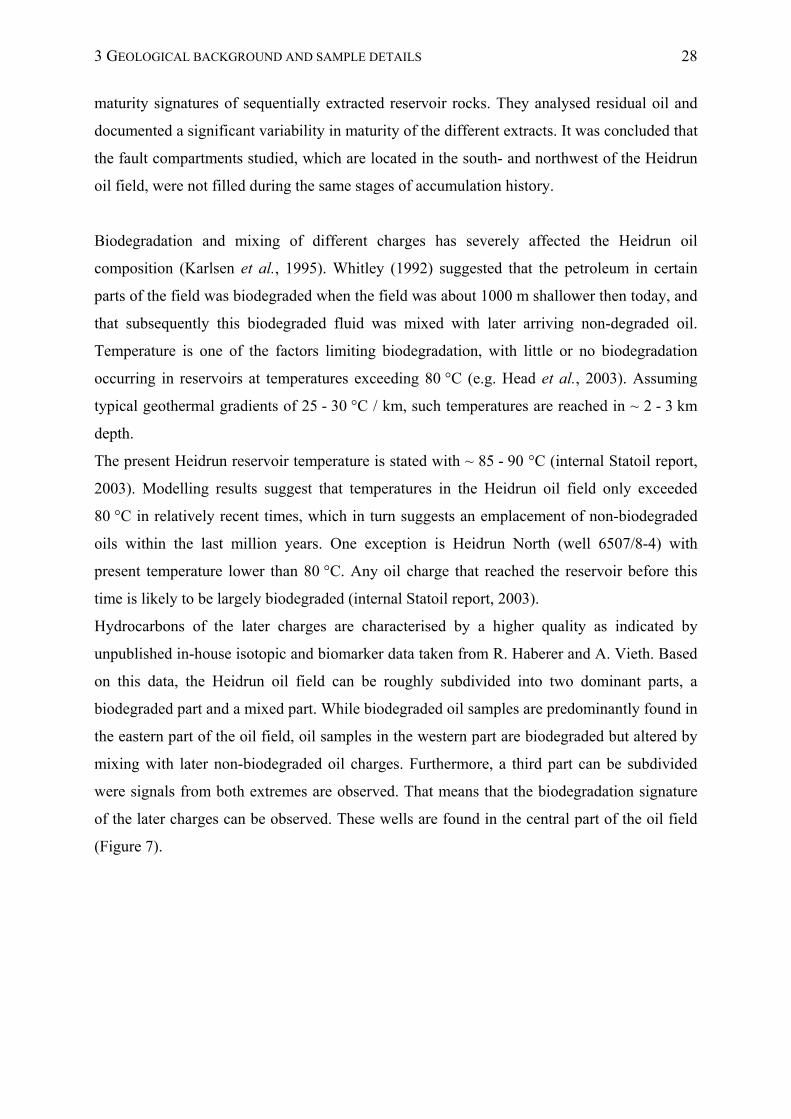
3 GEOLOGICAL BACKGROUND AND SAMPLE DETAILS 28
maturity signatures of sequentially extracted reservoir rocks. They analysed residual oil and
documented a significant variability in maturity of the different extracts. It was concluded that
the fault compartments studied, which are located in the south- and northwest of the Heidrun
oil field, were not filled during the same stages of accumulation history.
Biodegradation and mixing of different charges has severely affected the Heidrun oil
composition (Karlsen et al., 1995). Whitley (1992) suggested that the petroleum in certain
parts of the field was biodegraded when the field was about 1000 m shallower then today, and
that subsequently this biodegraded fluid was mixed with later arriving non-degraded oil.
Temperature is one of the factors limiting biodegradation, with little or no biodegradation
occurring in reservoirs at temperatures exceeding 80 °C (e.g. Head et al., 2003). Assuming
typical geothermal gradients of 25 - 30 °C / km, such temperatures are reached in ~ 2 - 3 km
depth.
The present Heidrun reservoir temperature is stated with ~ 85 - 90 °C (internal Statoil report,
2003). Modelling results suggest that temperatures in the Heidrun oil field only exceeded
80 °C in relatively recent times, which in turn suggests an emplacement of non-biodegraded
oils within the last million years. One exception is Heidrun North (well 6507/8-4) with
present temperature lower than 80 °C. Any oil charge that reached the reservoir before this
time is likely to be largely biodegraded (internal Statoil report, 2003).
Hydrocarbons of the later charges are characterised by a higher quality as indicated by
unpublished in-house isotopic and biomarker data taken from R. Haberer and A. Vieth. Based
on this data, the Heidrun oil field can be roughly subdivided into two dominant parts, a
biodegraded part and a mixed part. While biodegraded oil samples are predominantly found in
the eastern part of the oil field, oil samples in the western part are biodegraded but altered by
mixing with later non-biodegraded oil charges. Furthermore, a third part can be subdivided
were signals from both extremes are observed. That means that the biodegradation signature
of the later charges can be observed. These wells are found in the central part of the oil field
(Figure 7).
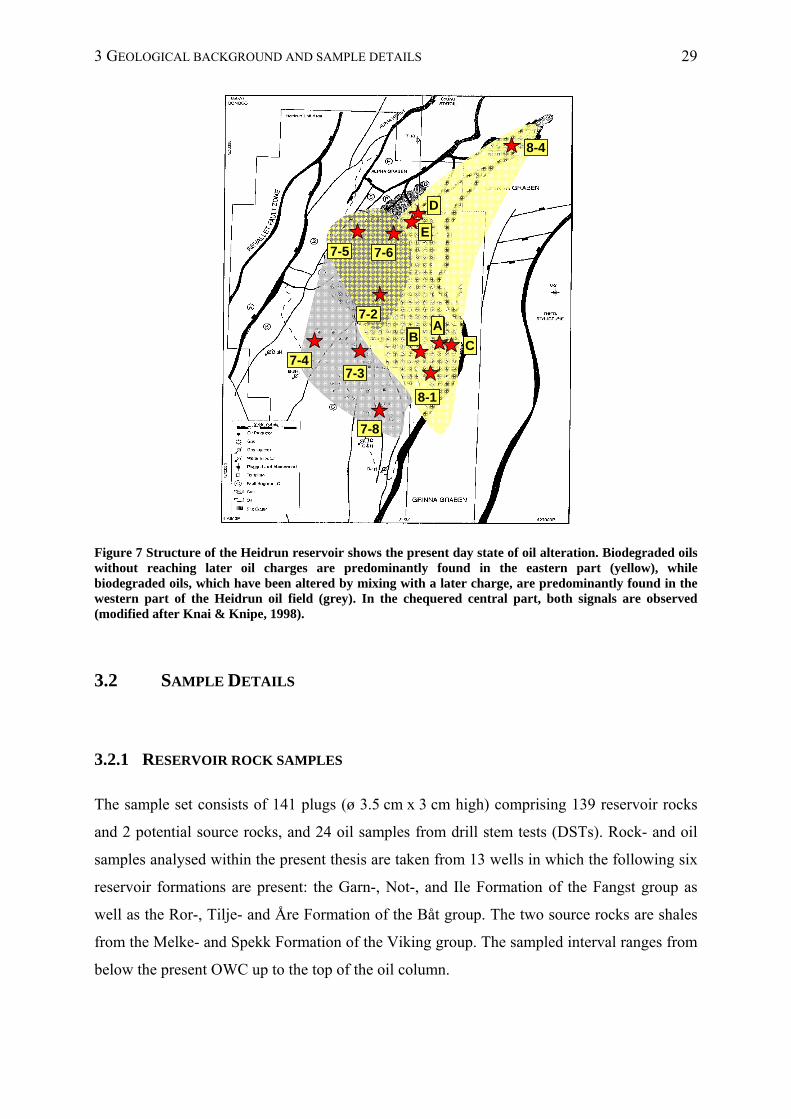
3 GEOLOGICAL BACKGROUND AND SAMPLE DETAILS 29
8-4
7-5
7-2
7-6
D
E
7-4
8-1
7-8
7-3
AB
CB
C
A
C
Figure 7 Structure of the Heidrun reservoir shows the present day state of oil alteration. Biodegraded oils without reaching later oil charges are predominantly found in the eastern part (yellow), while biodegraded oils, which have been altered by mixing with a later charge, are predominantly found in the western part of the Heidrun oil field (grey). In the chequered central part, both signals are observed (modified after Knai & Knipe, 1998).
3.2 SAMPLE DETAILS
3.2.1 RESERVOIR ROCK SAMPLES
The sample set consists of 141 plugs (ø 3.5 cm x 3 cm high) comprising 139 reservoir rocks
and 2 potential source rocks, and 24 oil samples from drill stem tests (DSTs). Rock- and oil
samples analysed within the present thesis are taken from 13 wells in which the following six
reservoir formations are present: the Garn-, Not-, and Ile Formation of the Fangst group as
well as the Ror-, Tilje- and Åre Formation of the Båt group. The two source rocks are shales
from the Melke- and Spekk Formation of the Viking group. The sampled interval ranges from
below the present OWC up to the top of the oil column.
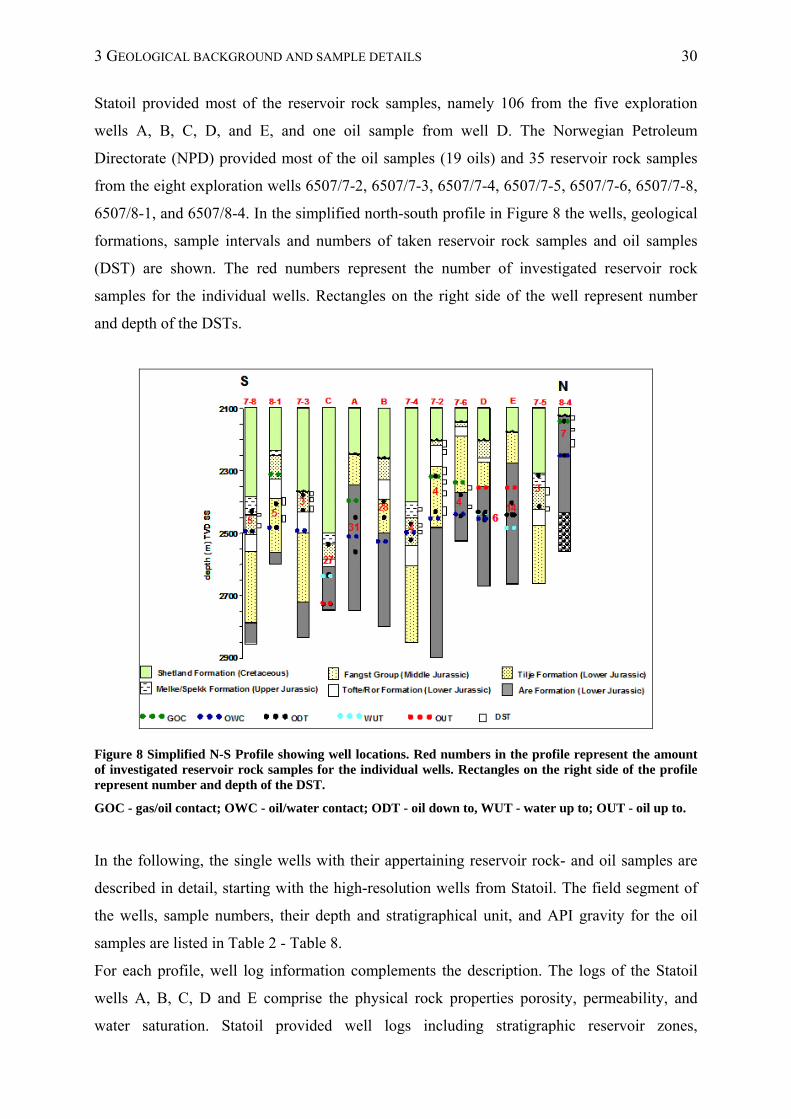
3 GEOLOGICAL BACKGROUND AND SAMPLE DETAILS 30
Statoil provided most of the reservoir rock samples, namely 106 from the five exploration
wells A, B, C, D, and E, and one oil sample from well D. The Norwegian Petroleum
Directorate (NPD) provided most of the oil samples (19 oils) and 35 reservoir rock samples
from the eight exploration wells 6507/7-2, 6507/7-3, 6507/7-4, 6507/7-5, 6507/7-6, 6507/7-8,
6507/8-1, and 6507/8-4. In the simplified north-south profile in Figure 8 the wells, geological
formations, sample intervals and numbers of taken reservoir rock samples and oil samples
(DST) are shown. The red numbers represent the number of investigated reservoir rock
samples for the individual wells. Rectangles on the right side of the well represent number
and depth of the DSTs.
Figure 8 Simplified N-S Profile showing well locations. Red numbers in the profile represent the amount of investigated reservoir rock samples for the individual wells. Rectangles on the right side of the profile represent number and depth of the DST.
GOC - gas/oil contact; OWC - oil/water contact; ODT - oil down to, WUT - water up to; OUT - oil up to.
In the following, the single wells with their appertaining reservoir rock- and oil samples are
described in detail, starting with the high-resolution wells from Statoil. The field segment of
the wells, sample numbers, their depth and stratigraphical unit, and API gravity for the oil
samples are listed in Table 2 - Table 8.
For each profile, well log information complements the description. The logs of the Statoil
wells A, B, C, D and E comprise the physical rock properties porosity, permeability, and
water saturation. Statoil provided well logs including stratigraphic reservoir zones,
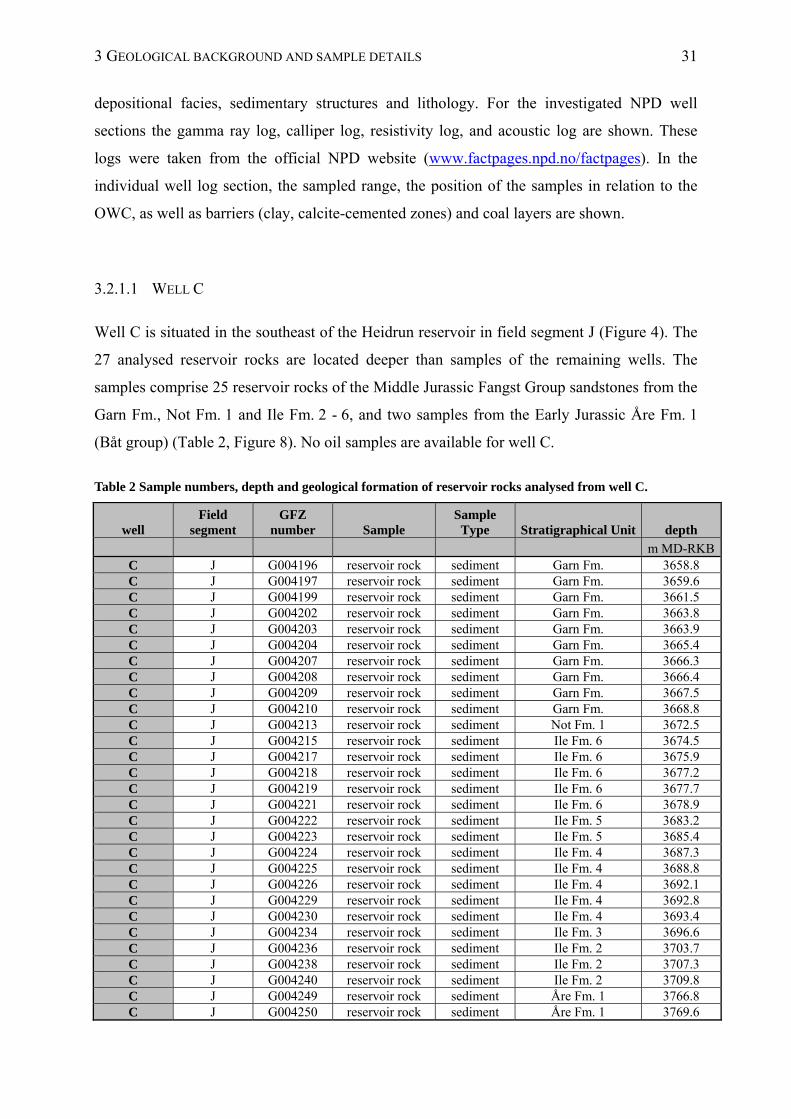
3 GEOLOGICAL BACKGROUND AND SAMPLE DETAILS 31
depositional facies, sedimentary structures and lithology. For the investigated NPD well
sections the gamma ray log, calliper log, resistivity log, and acoustic log are shown. These
logs were taken from the official NPD website (www.factpages.npd.no/factpages). In the
individual well log section, the sampled range, the position of the samples in relation to the
OWC, as well as barriers (clay, calcite-cemented zones) and coal layers are shown.
3.2.1.1 WELL C
Well C is situated in the southeast of the Heidrun reservoir in field segment J (Figure 4). The
27 analysed reservoir rocks are located deeper than samples of the remaining wells. The
samples comprise 25 reservoir rocks of the Middle Jurassic Fangst Group sandstones from the
Garn Fm., Not Fm. 1 and Ile Fm. 2 - 6, and two samples from the Early Jurassic Åre Fm. 1
(Båt group) (Table 2, Figure 8). No oil samples are available for well C.
Table 2 Sample numbers, depth and geological formation of reservoir rocks analysed from well C.
well Field
segment GFZ
number Sample Sample
Type Stratigraphical Unit depth
m MD-RKBC J G004196 reservoir rock sediment Garn Fm. 3658.8 C J G004197 reservoir rock sediment Garn Fm. 3659.6 C J G004199 reservoir rock sediment Garn Fm. 3661.5 C J G004202 reservoir rock sediment Garn Fm. 3663.8 C J G004203 reservoir rock sediment Garn Fm. 3663.9 C J G004204 reservoir rock sediment Garn Fm. 3665.4 C J G004207 reservoir rock sediment Garn Fm. 3666.3 C J G004208 reservoir rock sediment Garn Fm. 3666.4 C J G004209 reservoir rock sediment Garn Fm. 3667.5 C J G004210 reservoir rock sediment Garn Fm. 3668.8 C J G004213 reservoir rock sediment Not Fm. 1 3672.5 C J G004215 reservoir rock sediment Ile Fm. 6 3674.5 C J G004217 reservoir rock sediment Ile Fm. 6 3675.9 C J G004218 reservoir rock sediment Ile Fm. 6 3677.2 C J G004219 reservoir rock sediment Ile Fm. 6 3677.7 C J G004221 reservoir rock sediment Ile Fm. 6 3678.9 C J G004222 reservoir rock sediment Ile Fm. 5 3683.2 C J G004223 reservoir rock sediment Ile Fm. 5 3685.4 C J G004224 reservoir rock sediment Ile Fm. 4 3687.3 C J G004225 reservoir rock sediment Ile Fm. 4 3688.8 C J G004226 reservoir rock sediment Ile Fm. 4 3692.1 C J G004229 reservoir rock sediment Ile Fm. 4 3692.8 C J G004230 reservoir rock sediment Ile Fm. 4 3693.4 C J G004234 reservoir rock sediment Ile Fm. 3 3696.6 C J G004236 reservoir rock sediment Ile Fm. 2 3703.7 C J G004238 reservoir rock sediment Ile Fm. 2 3707.3 C J G004240 reservoir rock sediment Ile Fm. 2 3709.8 C J G004249 reservoir rock sediment Åre Fm. 1 3766.8 C J G004250 reservoir rock sediment Åre Fm. 1 3769.6
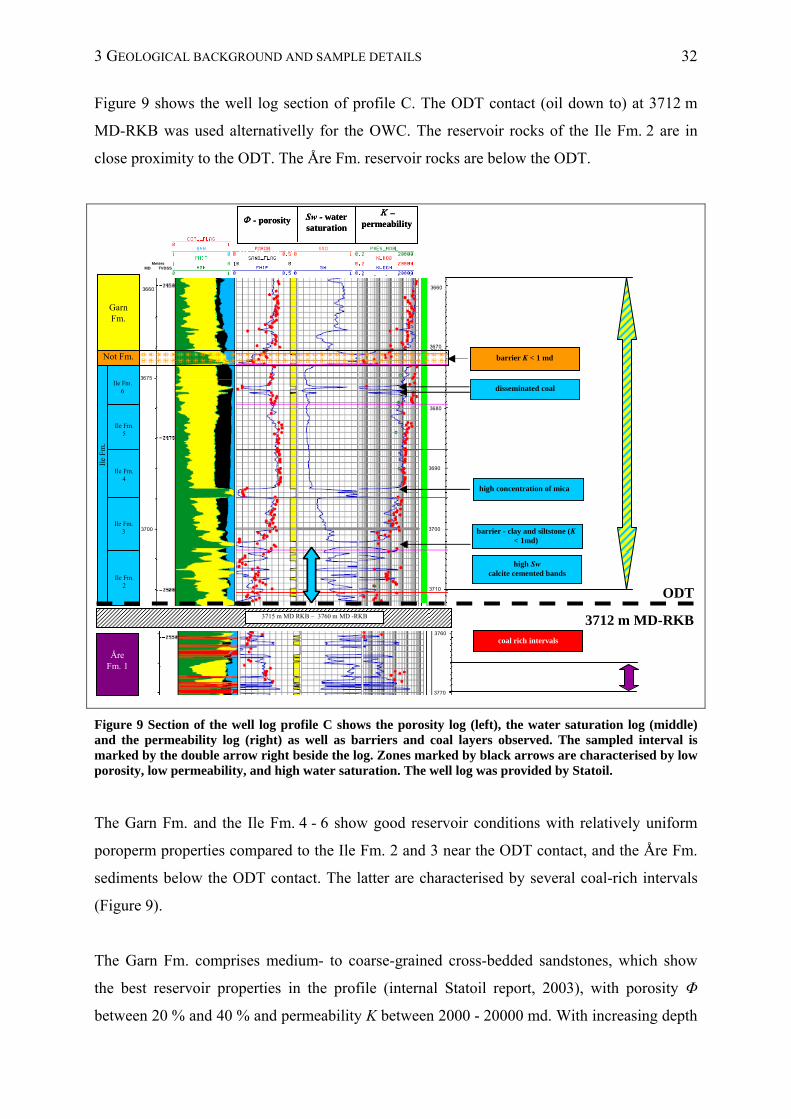
3 GEOLOGICAL BACKGROUND AND SAMPLE DETAILS 32
Figure 9 shows the well log section of profile C. The ODT contact (oil down to) at 3712 m
MD-RKB was used alternativelly for the OWC. The reservoir rocks of the Ile Fm. 2 are in
close proximity to the ODT. The Åre Fm. reservoir rocks are below the ODT.
Åre Fm. 1
ODT
3712 m MD-RKBcoal rich intervals
3715 m MD RKB – 3760 m MD -RKB
Garn Fm.
Ile Fm. 6
Ile Fm. 5
Ile Fm. 4
Ile Fm. 3
Ile Fm. 2
Not Fm.
high Sw calcite cemented bands
high Sw calcite cemented bands
high concentration of micahigh concentration of mica
disseminated coal
barrier K < 1 md
barrier - clay and siltstone (K < 1md)
barrier - clay and siltstone (K < 1md)
Φ - porosity Sw - watersaturation
Κ –permeabilityΦ - porosity Sw - water
saturation
Κ –permeability
3660
3670
3700
3680
3690
3760
3770
3700
3675
3660
MetersMD TVDSS
3710
Ile
Fm
.
Figure 9 Section of the well log profile C shows the porosity log (left), the water saturation log (middle) and the permeability log (right) as well as barriers and coal layers observed. The sampled interval is marked by the double arrow right beside the log. Zones marked by black arrows are characterised by low porosity, low permeability, and high water saturation. The well log was provided by Statoil.
The Garn Fm. and the Ile Fm. 4 - 6 show good reservoir conditions with relatively uniform
poroperm properties compared to the Ile Fm. 2 and 3 near the ODT contact, and the Åre Fm.
sediments below the ODT contact. The latter are characterised by several coal-rich intervals
(Figure 9).
The Garn Fm. comprises medium- to coarse-grained cross-bedded sandstones, which show
the best reservoir properties in the profile (internal Statoil report, 2003), with porosity Φ
between 20 % and 40 % and permeability Κ between 2000 - 20000 md. With increasing depth
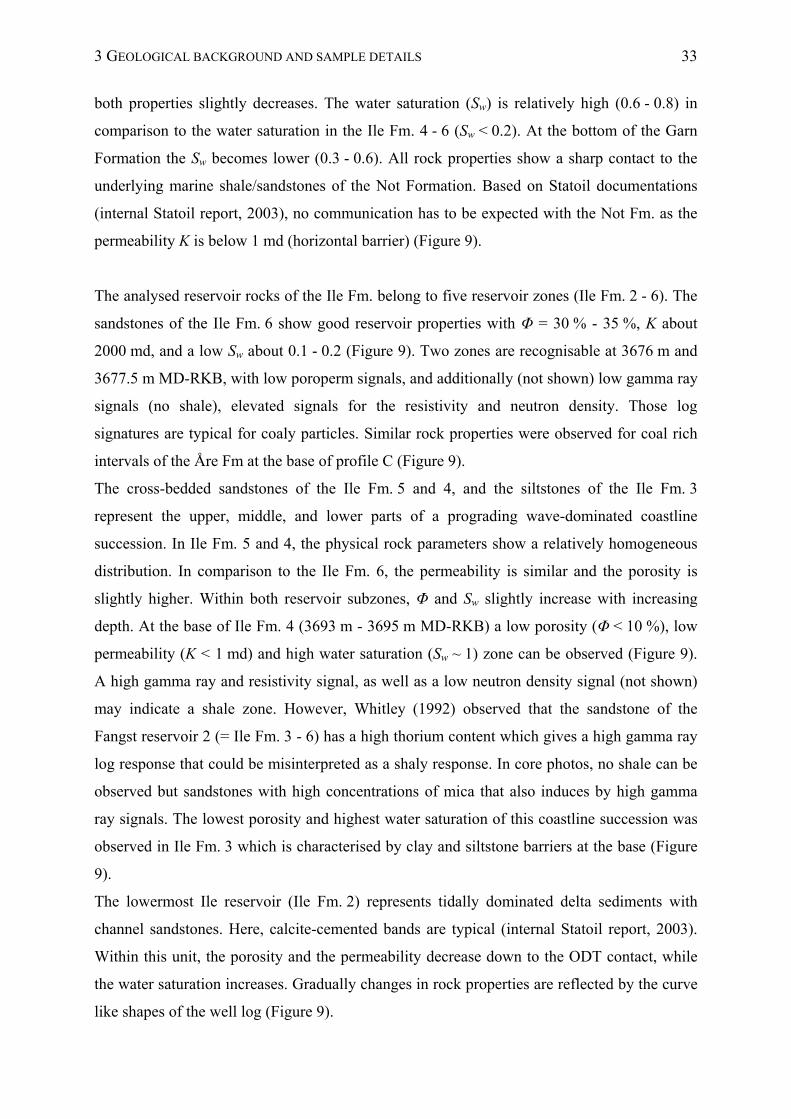
3 GEOLOGICAL BACKGROUND AND SAMPLE DETAILS 33
both properties slightly decreases. The water saturation (Sw) is relatively high (0.6 - 0.8) in
comparison to the water saturation in the Ile Fm. 4 - 6 (Sw < 0.2). At the bottom of the Garn
Formation the Sw becomes lower (0.3 - 0.6). All rock properties show a sharp contact to the
underlying marine shale/sandstones of the Not Formation. Based on Statoil documentations
(internal Statoil report, 2003), no communication has to be expected with the Not Fm. as the
permeability K is below 1 md (horizontal barrier) (Figure 9).
The analysed reservoir rocks of the Ile Fm. belong to five reservoir zones (Ile Fm. 2 - 6). The
sandstones of the Ile Fm. 6 show good reservoir properties with Φ = 30 % - 35 %, Κ about
2000 md, and a low Sw about 0.1 - 0.2 (Figure 9). Two zones are recognisable at 3676 m and
3677.5 m MD-RKB, with low poroperm signals, and additionally (not shown) low gamma ray
signals (no shale), elevated signals for the resistivity and neutron density. Those log
signatures are typical for coaly particles. Similar rock properties were observed for coal rich
intervals of the Åre Fm at the base of profile C (Figure 9).
The cross-bedded sandstones of the Ile Fm. 5 and 4, and the siltstones of the Ile Fm. 3
represent the upper, middle, and lower parts of a prograding wave-dominated coastline
succession. In Ile Fm. 5 and 4, the physical rock parameters show a relatively homogeneous
distribution. In comparison to the Ile Fm. 6, the permeability is similar and the porosity is
slightly higher. Within both reservoir subzones, Φ and Sw slightly increase with increasing
depth. At the base of Ile Fm. 4 (3693 m - 3695 m MD-RKB) a low porosity (Φ < 10 %), low
permeability (K < 1 md) and high water saturation (Sw ~ 1) zone can be observed (Figure 9).
A high gamma ray and resistivity signal, as well as a low neutron density signal (not shown)
may indicate a shale zone. However, Whitley (1992) observed that the sandstone of the
Fangst reservoir 2 (= Ile Fm. 3 - 6) has a high thorium content which gives a high gamma ray
log response that could be misinterpreted as a shaly response. In core photos, no shale can be
observed but sandstones with high concentrations of mica that also induces by high gamma
ray signals. The lowest porosity and highest water saturation of this coastline succession was
observed in Ile Fm. 3 which is characterised by clay and siltstone barriers at the base (Figure
9).
The lowermost Ile reservoir (Ile Fm. 2) represents tidally dominated delta sediments with
channel sandstones. Here, calcite-cemented bands are typical (internal Statoil report, 2003).
Within this unit, the porosity and the permeability decrease down to the ODT contact, while
the water saturation increases. Gradually changes in rock properties are reflected by the curve
like shapes of the well log (Figure 9).
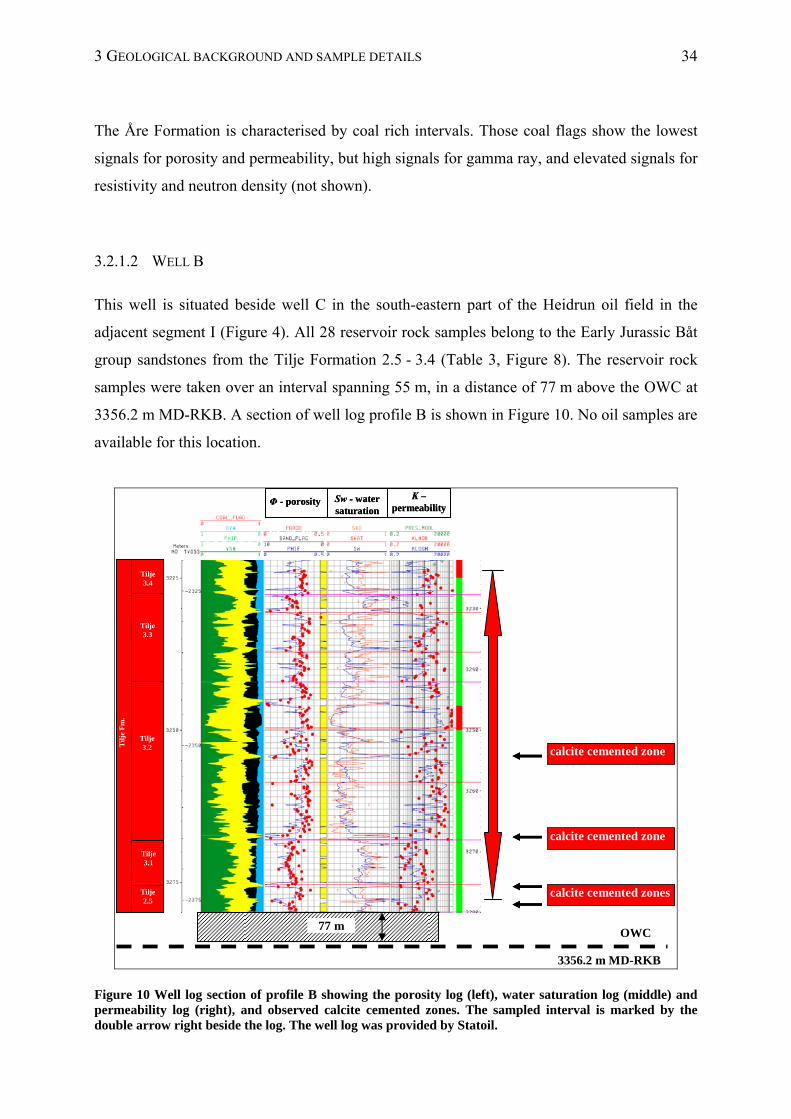
3 GEOLOGICAL BACKGROUND AND SAMPLE DETAILS 34
The Åre Formation is characterised by coal rich intervals. Those coal flags show the lowest
signals for porosity and permeability, but high signals for gamma ray, and elevated signals for
resistivity and neutron density (not shown).
3.2.1.2 WELL B
This well is situated beside well C in the south-eastern part of the Heidrun oil field in the
adjacent segment I (Figure 4). All 28 reservoir rock samples belong to the Early Jurassic Båt
group sandstones from the Tilje Formation 2.5 - 3.4 (Table 3, Figure 8). The reservoir rock
samples were taken over an interval spanning 55 m, in a distance of 77 m above the OWC at
3356.2 m MD-RKB. A section of well log profile B is shown in Figure 10. No oil samples are
available for this location.
calcite cemented zone
Φ - porosity Sw - watersaturation
Κ –permeability
Φ - porosity Sw - watersaturation
Κ –permeability
calcite cemented zone
calcite cemented zones
Tilje 3.4
Tilje3.3
Tilje3.2
Tilje3.1
Tilje2.5
Tilje 3.4
Tilje3.3
Tilje3.2
Tilje3.1
Tilje2.5
Tilj
e F
m.
OWC
3356.2 m MD-RKB
77 m
Figure 10 Well log section of profile B showing the porosity log (left), water saturation log (middle) and permeability log (right), and observed calcite cemented zones. The sampled interval is marked by the double arrow right beside the log. The well log was provided by Statoil.
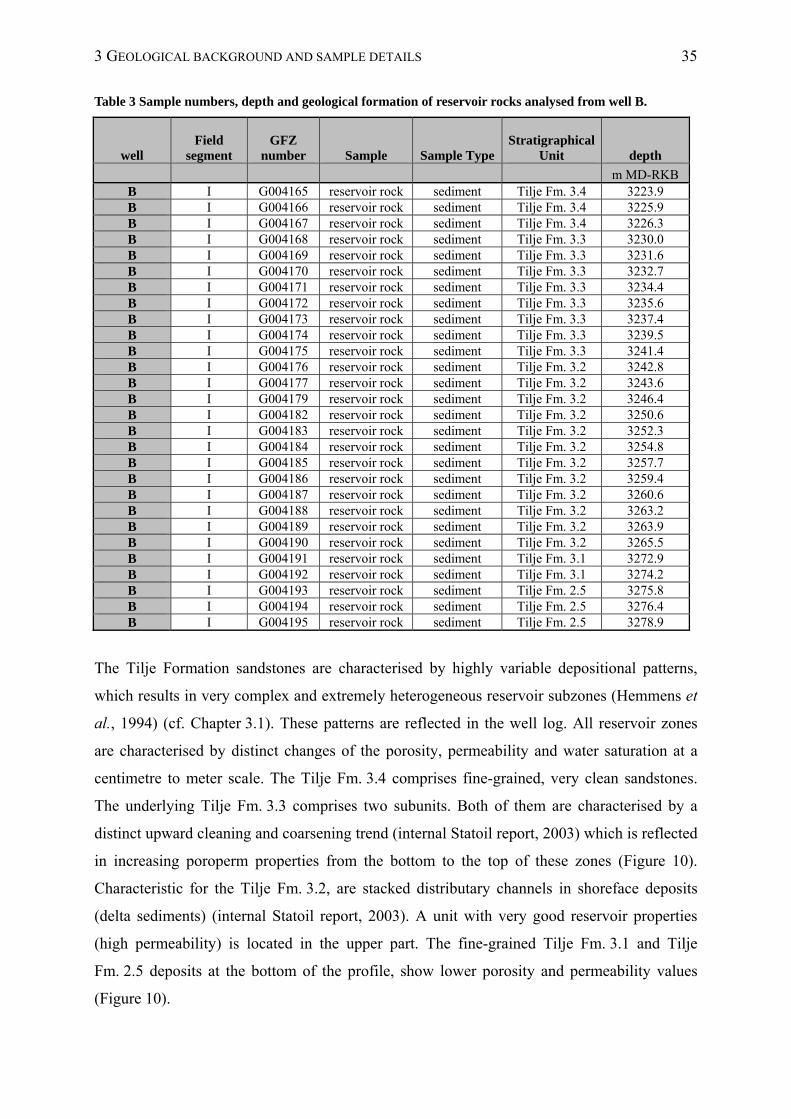
3 GEOLOGICAL BACKGROUND AND SAMPLE DETAILS 35
Table 3 Sample numbers, depth and geological formation of reservoir rocks analysed from well B.
well Field
segment GFZ
number Sample Sample Type Stratigraphical
Unit depth
m MD-RKB B I G004165 reservoir rock sediment Tilje Fm. 3.4 3223.9 B I G004166 reservoir rock sediment Tilje Fm. 3.4 3225.9 B I G004167 reservoir rock sediment Tilje Fm. 3.4 3226.3 B I G004168 reservoir rock sediment Tilje Fm. 3.3 3230.0 B I G004169 reservoir rock sediment Tilje Fm. 3.3 3231.6 B I G004170 reservoir rock sediment Tilje Fm. 3.3 3232.7 B I G004171 reservoir rock sediment Tilje Fm. 3.3 3234.4 B I G004172 reservoir rock sediment Tilje Fm. 3.3 3235.6 B I G004173 reservoir rock sediment Tilje Fm. 3.3 3237.4 B I G004174 reservoir rock sediment Tilje Fm. 3.3 3239.5 B I G004175 reservoir rock sediment Tilje Fm. 3.3 3241.4 B I G004176 reservoir rock sediment Tilje Fm. 3.2 3242.8 B I G004177 reservoir rock sediment Tilje Fm. 3.2 3243.6 B I G004179 reservoir rock sediment Tilje Fm. 3.2 3246.4 B I G004182 reservoir rock sediment Tilje Fm. 3.2 3250.6 B I G004183 reservoir rock sediment Tilje Fm. 3.2 3252.3 B I G004184 reservoir rock sediment Tilje Fm. 3.2 3254.8 B I G004185 reservoir rock sediment Tilje Fm. 3.2 3257.7 B I G004186 reservoir rock sediment Tilje Fm. 3.2 3259.4 B I G004187 reservoir rock sediment Tilje Fm. 3.2 3260.6 B I G004188 reservoir rock sediment Tilje Fm. 3.2 3263.2 B I G004189 reservoir rock sediment Tilje Fm. 3.2 3263.9 B I G004190 reservoir rock sediment Tilje Fm. 3.2 3265.5 B I G004191 reservoir rock sediment Tilje Fm. 3.1 3272.9 B I G004192 reservoir rock sediment Tilje Fm. 3.1 3274.2 B I G004193 reservoir rock sediment Tilje Fm. 2.5 3275.8 B I G004194 reservoir rock sediment Tilje Fm. 2.5 3276.4 B I G004195 reservoir rock sediment Tilje Fm. 2.5 3278.9
The Tilje Formation sandstones are characterised by highly variable depositional patterns,
which results in very complex and extremely heterogeneous reservoir subzones (Hemmens et
al., 1994) (cf. Chapter 3.1). These patterns are reflected in the well log. All reservoir zones
are characterised by distinct changes of the porosity, permeability and water saturation at a
centimetre to meter scale. The Tilje Fm. 3.4 comprises fine-grained, very clean sandstones.
The underlying Tilje Fm. 3.3 comprises two subunits. Both of them are characterised by a
distinct upward cleaning and coarsening trend (internal Statoil report, 2003) which is reflected
in increasing poroperm properties from the bottom to the top of these zones (Figure 10).
Characteristic for the Tilje Fm. 3.2, are stacked distributary channels in shoreface deposits
(delta sediments) (internal Statoil report, 2003). A unit with very good reservoir properties
(high permeability) is located in the upper part. The fine-grained Tilje Fm. 3.1 and Tilje
Fm. 2.5 deposits at the bottom of the profile, show lower porosity and permeability values
(Figure 10).
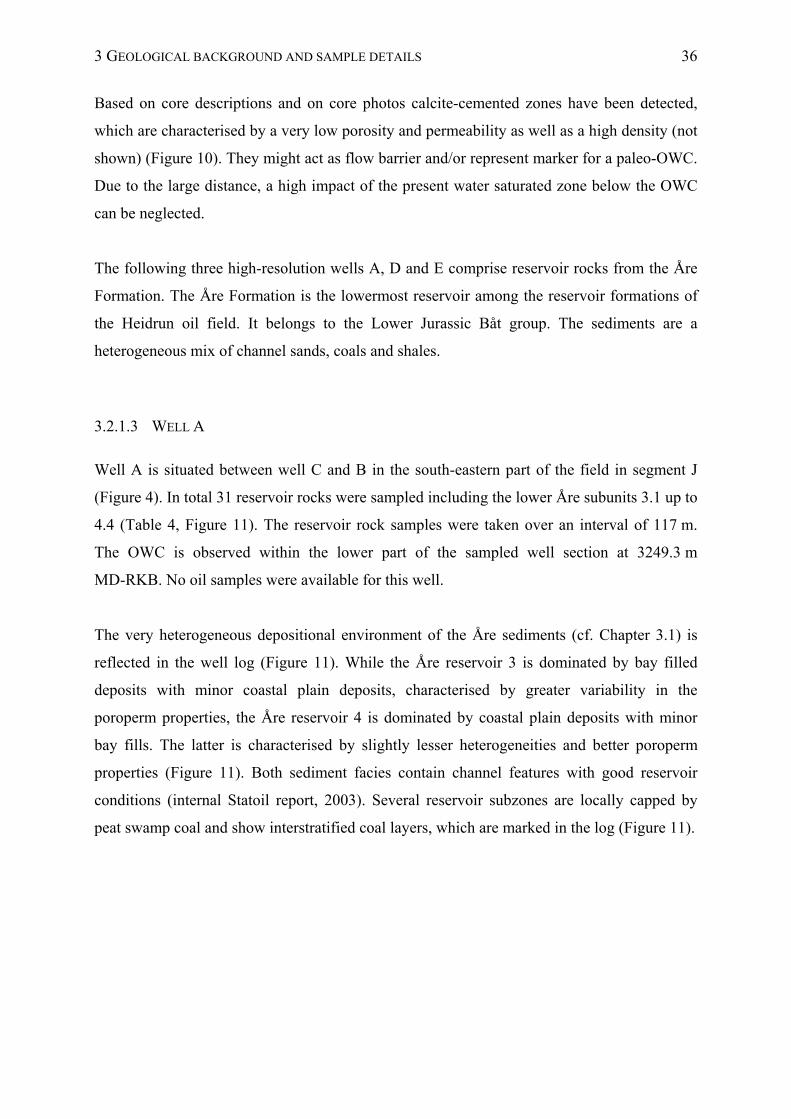
3 GEOLOGICAL BACKGROUND AND SAMPLE DETAILS 36
Based on core descriptions and on core photos calcite-cemented zones have been detected,
which are characterised by a very low porosity and permeability as well as a high density (not
shown) (Figure 10). They might act as flow barrier and/or represent marker for a paleo-OWC.
Due to the large distance, a high impact of the present water saturated zone below the OWC
can be neglected.
The following three high-resolution wells A, D and E comprise reservoir rocks from the Åre
Formation. The Åre Formation is the lowermost reservoir among the reservoir formations of
the Heidrun oil field. It belongs to the Lower Jurassic Båt group. The sediments are a
heterogeneous mix of channel sands, coals and shales.
3.2.1.3 WELL A
Well A is situated between well C and B in the south-eastern part of the field in segment J
(Figure 4). In total 31 reservoir rocks were sampled including the lower Åre subunits 3.1 up to
4.4 (Table 4, Figure 11). The reservoir rock samples were taken over an interval of 117 m.
The OWC is observed within the lower part of the sampled well section at 3249.3 m
MD-RKB. No oil samples were available for this well.
The very heterogeneous depositional environment of the Åre sediments (cf. Chapter 3.1) is
reflected in the well log (Figure 11). While the Åre reservoir 3 is dominated by bay filled
deposits with minor coastal plain deposits, characterised by greater variability in the
poroperm properties, the Åre reservoir 4 is dominated by coastal plain deposits with minor
bay fills. The latter is characterised by slightly lesser heterogeneities and better poroperm
properties (Figure 11). Both sediment facies contain channel features with good reservoir
conditions (internal Statoil report, 2003). Several reservoir subzones are locally capped by
peat swamp coal and show interstratified coal layers, which are marked in the log (Figure 11).
3 GEOLOGICAL BACKGROUND AND SAMPLE DETAILS 37
Φ - porosity Sw - water saturation
Κ –permeability
OWC
3249 m MD-RKB
coal
coal
coal
coal
coal
coal
coal
coal
coal
Åre 3.3
Åre 3.2
Åre 3.1
Åre 4.2
Åre 4.3
Åre 4.2
Åre 4.1
shale – barrier K < 1md
Åre
Fm
.
Figure 11 Well log section of the profile A (provided by Statoil) showing the porosity log (left), water saturation log (middle) and permeability log (right). The sampled intervals are marked by the double arrow right beside the log. The coal rich layers and the shale detected between the Åre reservoir zone 3 and 4 are marked in the log.
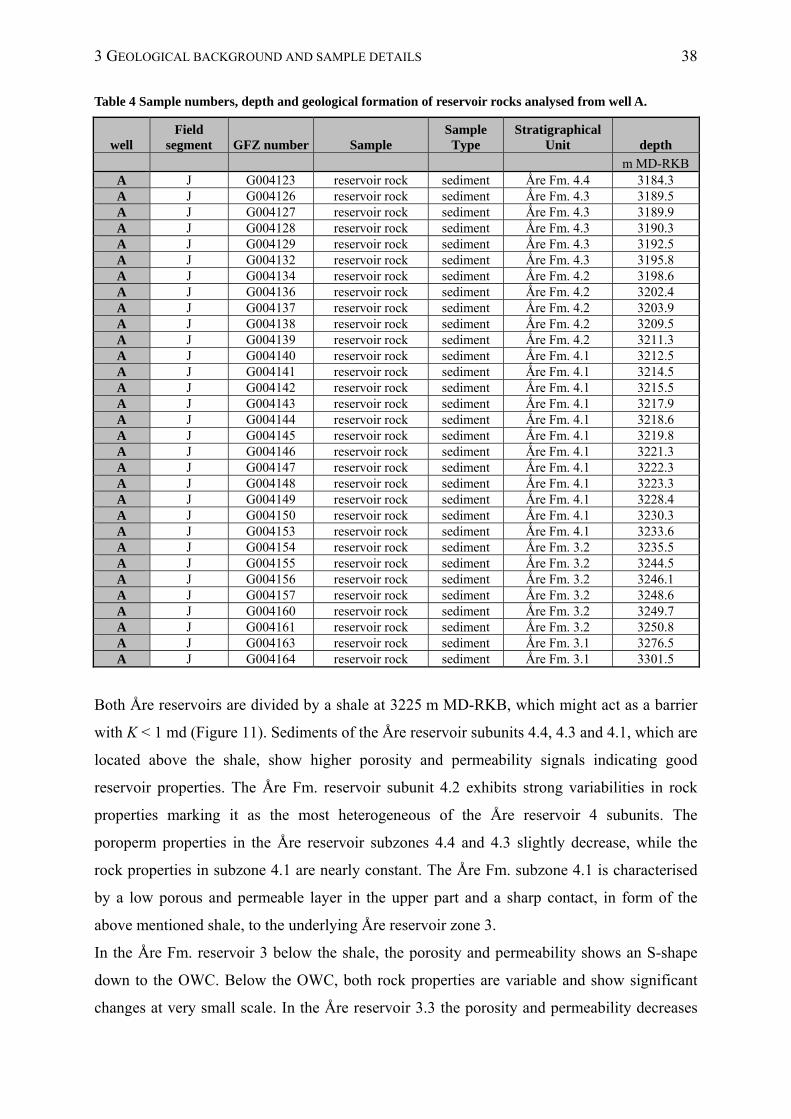
3 GEOLOGICAL BACKGROUND AND SAMPLE DETAILS 38
Table 4 Sample numbers, depth and geological formation of reservoir rocks analysed from well A.
well Field
segment GFZ number Sample Sample
Type Stratigraphical
Unit depth
m MD-RKB A J G004123 reservoir rock sediment Ǻre Fm. 4.4 3184.3 A J G004126 reservoir rock sediment Ǻre Fm. 4.3 3189.5 A J G004127 reservoir rock sediment Ǻre Fm. 4.3 3189.9 A J G004128 reservoir rock sediment Ǻre Fm. 4.3 3190.3 A J G004129 reservoir rock sediment Ǻre Fm. 4.3 3192.5 A J G004132 reservoir rock sediment Ǻre Fm. 4.3 3195.8 A J G004134 reservoir rock sediment Ǻre Fm. 4.2 3198.6 A J G004136 reservoir rock sediment Ǻre Fm. 4.2 3202.4 A J G004137 reservoir rock sediment Ǻre Fm. 4.2 3203.9 A J G004138 reservoir rock sediment Ǻre Fm. 4.2 3209.5 A J G004139 reservoir rock sediment Ǻre Fm. 4.2 3211.3 A J G004140 reservoir rock sediment Ǻre Fm. 4.1 3212.5 A J G004141 reservoir rock sediment Ǻre Fm. 4.1 3214.5 A J G004142 reservoir rock sediment Ǻre Fm. 4.1 3215.5 A J G004143 reservoir rock sediment Ǻre Fm. 4.1 3217.9 A J G004144 reservoir rock sediment Ǻre Fm. 4.1 3218.6 A J G004145 reservoir rock sediment Ǻre Fm. 4.1 3219.8 A J G004146 reservoir rock sediment Ǻre Fm. 4.1 3221.3 A J G004147 reservoir rock sediment Ǻre Fm. 4.1 3222.3 A J G004148 reservoir rock sediment Ǻre Fm. 4.1 3223.3 A J G004149 reservoir rock sediment Ǻre Fm. 4.1 3228.4 A J G004150 reservoir rock sediment Ǻre Fm. 4.1 3230.3 A J G004153 reservoir rock sediment Ǻre Fm. 4.1 3233.6 A J G004154 reservoir rock sediment Ǻre Fm. 3.2 3235.5 A J G004155 reservoir rock sediment Ǻre Fm. 3.2 3244.5 A J G004156 reservoir rock sediment Ǻre Fm. 3.2 3246.1 A J G004157 reservoir rock sediment Ǻre Fm. 3.2 3248.6 A J G004160 reservoir rock sediment Ǻre Fm. 3.2 3249.7 A J G004161 reservoir rock sediment Ǻre Fm. 3.2 3250.8 A J G004163 reservoir rock sediment Ǻre Fm. 3.1 3276.5 A J G004164 reservoir rock sediment Ǻre Fm. 3.1 3301.5
Both Åre reservoirs are divided by a shale at 3225 m MD-RKB, which might act as a barrier
with Κ < 1 md (Figure 11). Sediments of the Åre reservoir subunits 4.4, 4.3 and 4.1, which are
located above the shale, show higher porosity and permeability signals indicating good
reservoir properties. The Åre Fm. reservoir subunit 4.2 exhibits strong variabilities in rock
properties marking it as the most heterogeneous of the Åre reservoir 4 subunits. The
poroperm properties in the Åre reservoir subzones 4.4 and 4.3 slightly decrease, while the
rock properties in subzone 4.1 are nearly constant. The Åre Fm. subzone 4.1 is characterised
by a low porous and permeable layer in the upper part and a sharp contact, in form of the
above mentioned shale, to the underlying Åre reservoir zone 3.
In the Åre Fm. reservoir 3 below the shale, the porosity and permeability shows an S-shape
down to the OWC. Below the OWC, both rock properties are variable and show significant
changes at very small scale. In the Åre reservoir 3.3 the porosity and permeability decreases
3 GEOLOGICAL BACKGROUND AND SAMPLE DETAILS 39
with increasing depth, while the water saturation increases. An inverse picture is found in the
underlying Åre Fm. reservoir 3.2. The porosity and permeability increases down to the OWC,
while the water saturation conspicuously decreases. This zone is finished off by a very dense
zone at the bottom (Figure 11). The lowermost Åre Fm. reservoir 3.1 below the OWC shows
the greatest variability in poroperm properties and the thickest coal layer.
Typical reservoir rock plugs of the Åre Fm. 4 commonly comprise medium- to coarse-
grained, cross-stratified sandstones of light- and dark brown colour (G004137, Figure 12 left).
Reservoir rock samples of the Åre Fm. 3 are not stratified. They contain mica in high
abundance (micaceous siltstones) and have generally a light brown colour reflecting higher
water saturation (G004160, Figure 12 right).
Figure 12 Typical reservoir rocks of the Åre Formation 4 (G004137, left) and the Åre Formation 3 (G004160, right).
3.2.1.4 WELL E
14 Åre Formation reservoir rocks were analysed from well E, which is situated in the northern
part of the Heidrun oil field in segment M (Figure 4, Figure 8). These rock samples comprise
the lower Åre subunits 4.1, 3.3, and 3.2 (Table 5), shown in the well log section of profile E
in Figure 13. They were taken in an interval of 42 m in relatively great depth (> 3500 m MD-
RKB). All reservoir rocks are located above the ODT contact, which can be observed directly
at the bottom of the profile at 3585 m MD-RKB. Thus, lower reservoir rocks of well E are
very close to the water-saturated zone. No oil sample was available for this well.
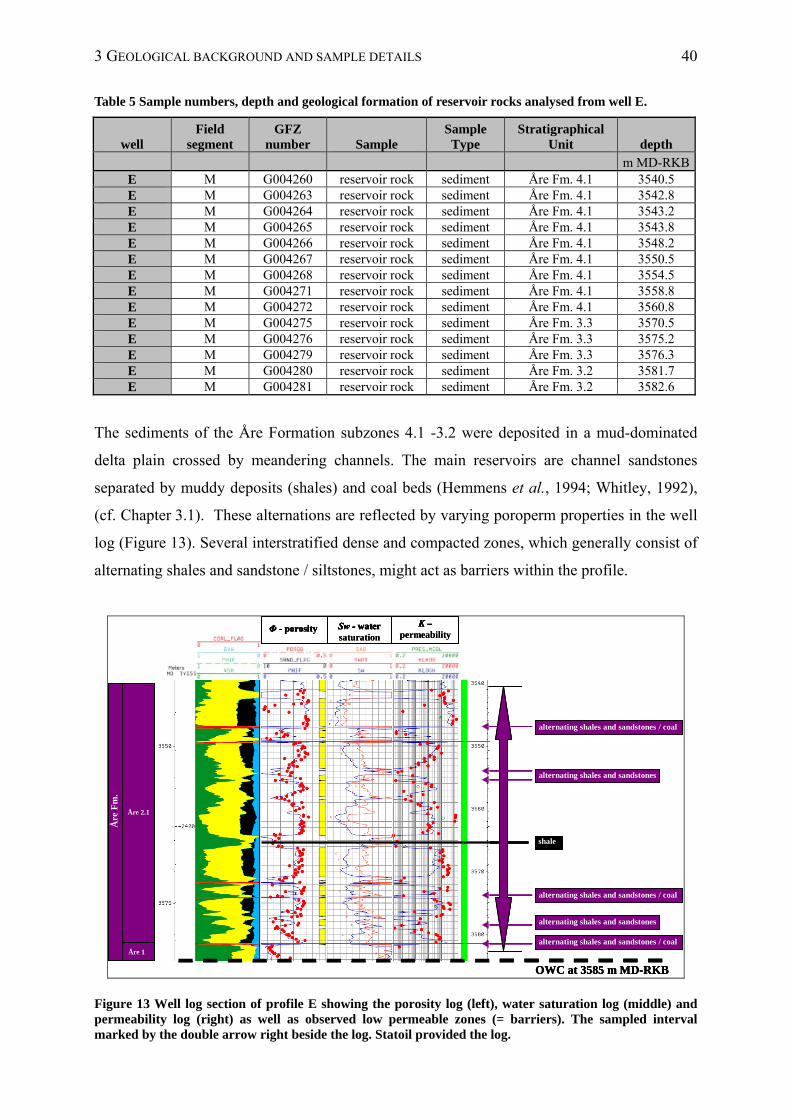
3 GEOLOGICAL BACKGROUND AND SAMPLE DETAILS 40
Table 5 Sample numbers, depth and geological formation of reservoir rocks analysed from well E.
well Field
segment GFZ
number Sample Sample Type
Stratigraphical Unit depth
m MD-RKBE M G004260 reservoir rock sediment Åre Fm. 4.1 3540.5 E M G004263 reservoir rock sediment Åre Fm. 4.1 3542.8 E M G004264 reservoir rock sediment Åre Fm. 4.1 3543.2 E M G004265 reservoir rock sediment Åre Fm. 4.1 3543.8 E M G004266 reservoir rock sediment Åre Fm. 4.1 3548.2 E M G004267 reservoir rock sediment Åre Fm. 4.1 3550.5 E M G004268 reservoir rock sediment Åre Fm. 4.1 3554.5 E M G004271 reservoir rock sediment Åre Fm. 4.1 3558.8 E M G004272 reservoir rock sediment Åre Fm. 4.1 3560.8 E M G004275 reservoir rock sediment Åre Fm. 3.3 3570.5 E M G004276 reservoir rock sediment Åre Fm. 3.3 3575.2 E M G004279 reservoir rock sediment Åre Fm. 3.3 3576.3 E M G004280 reservoir rock sediment Åre Fm. 3.2 3581.7 E M G004281 reservoir rock sediment Åre Fm. 3.2 3582.6
The sediments of the Åre Formation subzones 4.1 -3.2 were deposited in a mud-dominated
delta plain crossed by meandering channels. The main reservoirs are channel sandstones
separated by muddy deposits (shales) and coal beds (Hemmens et al., 1994; Whitley, 1992),
(cf. Chapter 3.1). These alternations are reflected by varying poroperm properties in the well
log (Figure 13). Several interstratified dense and compacted zones, which generally consist of
alternating shales and sandstone / siltstones, might act as barriers within the profile.
Φ - porosity Sw - watersaturation
Κ –permeability
OWC at 3585 m MD-RKB
alternating shales and sandstones / coal
alternating shales and sandstones
alternating shales and sandstones
Åre
Fm
.
Åre 2.1
Åre 1
shale
alternating shales and sandstones / coal
alternating shales and sandstones / coal
Φ - porosity Sw - watersaturation
Κ –permeability
OWC at 3585 m MD-RKB
alternating shales and sandstones / coal
alternating shales and sandstones
alternating shales and sandstones
Åre
Fm
.
Åre 2.1
Åre 1
shale
alternating shales and sandstones / coal
alternating shales and sandstones / coal
Φ - porosity Sw - watersaturation
Κ –permeability
Φ - porosity Sw - watersaturation
Κ –permeability
OWC at 3585 m MD-RKB
alternating shales and sandstones / coal alternating shales and sandstones / coal
alternating shales and sandstones alternating shales and sandstones
alternating shales and sandstones alternating shales and sandstones
Åre
Fm
.
Åre 2.1
Åre 1
Åre
Fm
.
Åre 2.1
Åre 1
Åre 2.1
Åre 1
shale
alternating shales and sandstones / coal alternating shales and sandstones / coal
alternating shales and sandstones / coal alternating shales and sandstones / coal
Figure 13 Well log section of profile E showing the porosity log (left), water saturation log (middle) and permeability log (right) as well as observed low permeable zones (= barriers). The sampled interval marked by the double arrow right beside the log. Statoil provided the log.
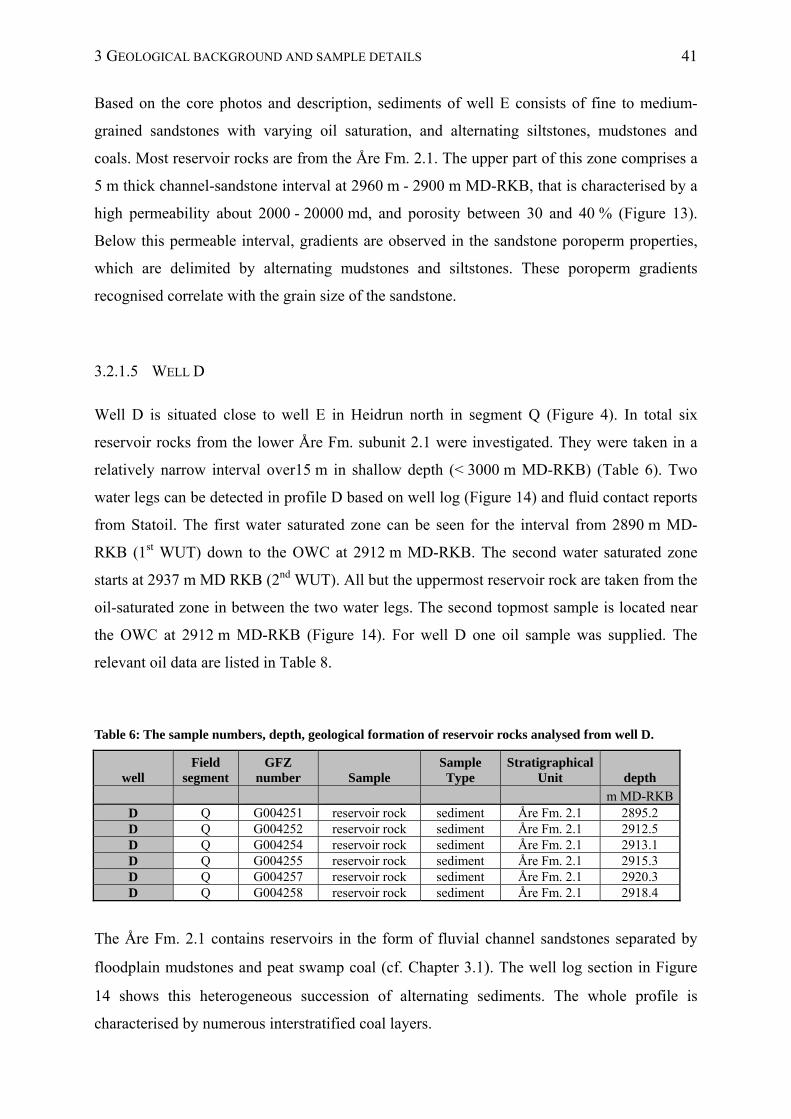
3 GEOLOGICAL BACKGROUND AND SAMPLE DETAILS 41
Based on the core photos and description, sediments of well E consists of fine to medium-
grained sandstones with varying oil saturation, and alternating siltstones, mudstones and
coals. Most reservoir rocks are from the Åre Fm. 2.1. The upper part of this zone comprises a
5 m thick channel-sandstone interval at 2960 m - 2900 m MD-RKB, that is characterised by a
high permeability about 2000 - 20000 md, and porosity between 30 and 40 % (Figure 13).
Below this permeable interval, gradients are observed in the sandstone poroperm properties,
which are delimited by alternating mudstones and siltstones. These poroperm gradients
recognised correlate with the grain size of the sandstone.
3.2.1.5 WELL D
Well D is situated close to well E in Heidrun north in segment Q (Figure 4). In total six
reservoir rocks from the lower Åre Fm. subunit 2.1 were investigated. They were taken in a
relatively narrow interval over15 m in shallow depth (< 3000 m MD-RKB) (Table 6). Two
water legs can be detected in profile D based on well log (Figure 14) and fluid contact reports
from Statoil. The first water saturated zone can be seen for the interval from 2890 m MD-
RKB (1st WUT) down to the OWC at 2912 m MD-RKB. The second water saturated zone
starts at 2937 m MD RKB (2nd WUT). All but the uppermost reservoir rock are taken from the
oil-saturated zone in between the two water legs. The second topmost sample is located near
the OWC at 2912 m MD-RKB (Figure 14). For well D one oil sample was supplied. The
relevant oil data are listed in Table 8.
Table 6: The sample numbers, depth, geological formation of reservoir rocks analysed from well D.
well Field
segment GFZ
number Sample Sample
Type Stratigraphical
Unit depth
m MD-RKBD Q G004251 reservoir rock sediment Åre Fm. 2.1 2895.2 D Q G004252 reservoir rock sediment Åre Fm. 2.1 2912.5 D Q G004254 reservoir rock sediment Åre Fm. 2.1 2913.1 D Q G004255 reservoir rock sediment Åre Fm. 2.1 2915.3 D Q G004257 reservoir rock sediment Åre Fm. 2.1 2920.3 D Q G004258 reservoir rock sediment Åre Fm. 2.1 2918.4
The Åre Fm. 2.1 contains reservoirs in the form of fluvial channel sandstones separated by
floodplain mudstones and peat swamp coal (cf. Chapter 3.1). The well log section in Figure
14 shows this heterogeneous succession of alternating sediments. The whole profile is
characterised by numerous interstratified coal layers.
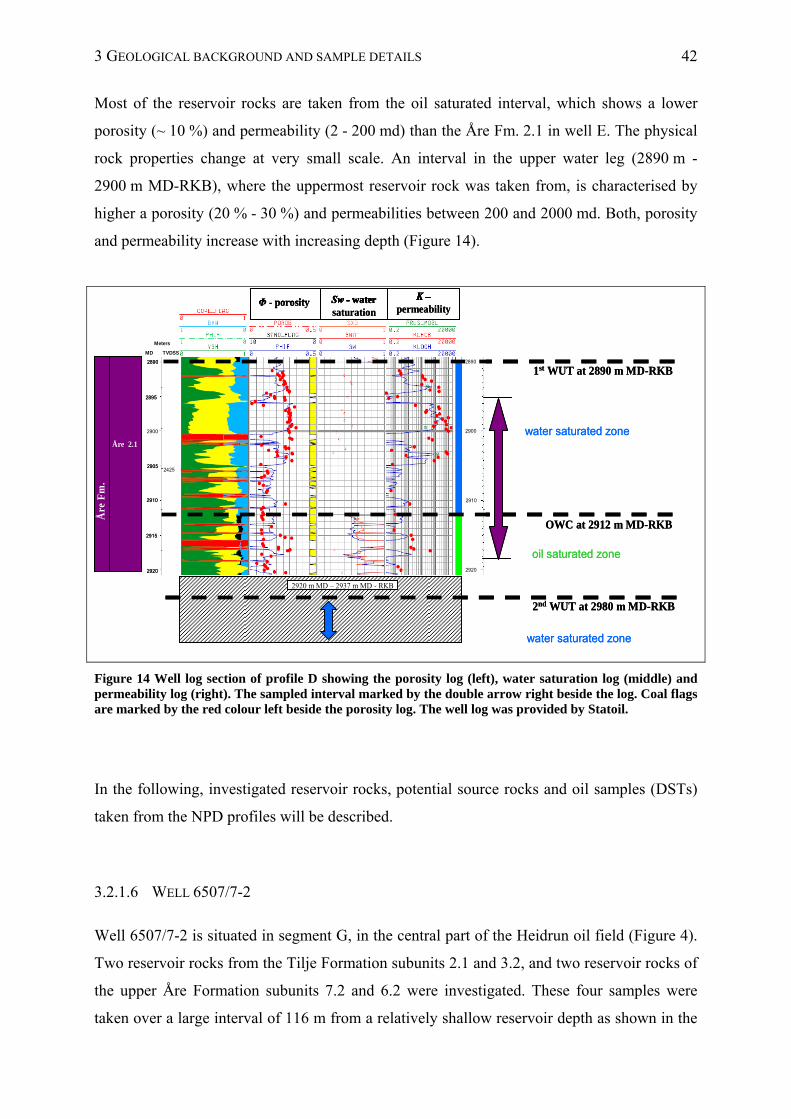
3 GEOLOGICAL BACKGROUND AND SAMPLE DETAILS 42
Most of the reservoir rocks are taken from the oil saturated interval, which shows a lower
porosity (~ 10 %) and permeability (2 - 200 md) than the Åre Fm. 2.1 in well E. The physical
rock properties change at very small scale. An interval in the upper water leg (2890 m -
2900 m MD-RKB), where the uppermost reservoir rock was taken from, is characterised by
higher a porosity (20 % - 30 %) and permeabilities between 200 and 2000 md. Both, porosity
and permeability increase with increasing depth (Figure 14).
Φ - porosity Sw - watersaturation
Κ –permeability
Åre 2.1
Åre
Fm
.
2425
2895
2900
2905
2910
2915
2920
2890
1st WUT at 2890 m MD-RKB
OWC at 2912 m MD-RKB
2920 m MD – 2937 m MD - RKB
2nd WUT at 2980 m MD-RKB
water saturated zone
oil saturated zone
water saturated zone
2890
2910
2920
2900
Meters
MD TVDSS
Φ - porosity Sw - watersaturation
Κ –permeability
Åre 2.1
Åre
Fm
.
2425
2895
2900
2905
2910
2915
2920
2890
Φ - porosity Sw - watersaturation
Κ –permeability
Φ - porosity Sw - watersaturation
Κ –permeability
Φ - porosity Sw - watersaturation
Κ –permeability
Åre 2.1
Åre
Fm
.
Åre 2.1Åre 2.1
Åre
Fm
.
2425
2895
2900
2905
2910
2915
2920
2890
2895
2900
2905
2910
2915
2920
2890
1st WUT at 2890 m MD-RKB
OWC at 2912 m MD-RKB
2920 m MD – 2937 m MD - RKB
2nd WUT at 2980 m MD-RKB
water saturated zone
oil saturated zone
water saturated zone
2890
2910
2920
2900
Meters
MD TVDSS
Figure 14 Well log section of profile D showing the porosity log (left), water saturation log (middle) and permeability log (right). The sampled interval marked by the double arrow right beside the log. Coal flags are marked by the red colour left beside the porosity log. The well log was provided by Statoil.
In the following, investigated reservoir rocks, potential source rocks and oil samples (DSTs)
taken from the NPD profiles will be described.
3.2.1.6 WELL 6507/7-2
Well 6507/7-2 is situated in segment G, in the central part of the Heidrun oil field (Figure 4).
Two reservoir rocks from the Tilje Formation subunits 2.1 and 3.2, and two reservoir rocks of
the upper Åre Formation subunits 7.2 and 6.2 were investigated. These four samples were
taken over a large interval of 116 m from a relatively shallow reservoir depth as shown in the
3 GEOLOGICAL BACKGROUND AND SAMPLE DETAILS 43
section of the well log in Figure 15. All reservoir rock samples are located above the OWC at
2451 m MD-RKB. Important reservoir rock data is listed in Table 7.
Three oil samples (DSTs) are available for this well. They show a distinct gradient in API
gravity from 29° to 22 ° (Table 8).
Åre 7.2
Åre 7.1
Åre 6.2
Tilje2.4
Tilje2.3
Tilje2.2
Tilje2.1
Tilje1.2
Tilje1.1
Tilje3.1
Tilje3.2
Tilj
e F
m.
Åre
Fm
.
Φ - porosity Sw - watersaturation
Κ –permeability
OWC
2451 m MD-RKB
16 m
DST 4A
DST 3
DST 2
G003998
G003999
G004000
G004001
2310
2320
2330
2340
2350
2360
2370
2380
2390
2400
2410
2420
2430
2435
Åre 7.2
Åre 7.1
Åre 6.2
Tilje2.4
Tilje2.3
Tilje2.2
Tilje2.1
Tilje1.2
Tilje1.1
Tilje3.1
Tilje3.2
Tilj
e F
m.
Åre
Fm
.
Åre 7.2
Åre 7.1
Åre 6.2
Åre 7.2
Åre 7.1
Åre 6.2
Tilje2.4
Tilje2.3
Tilje2.2
Tilje2.1
Tilje1.2
Tilje1.1
Tilje3.1
Tilje3.2
Tilj
e F
m.
Åre
Fm
.
Φ - porosity Sw - watersaturation
Κ –permeability
Φ - porosity Sw - watersaturation
Κ –permeability
OWC
2451 m MD-RKB
16 m
DST 4A
DST 3
DST 2
DST 4A
DST 3
DST 2
G003998
G003999
G004000
G004001
2310
2320
2330
2340
2350
2360
2370
2380
2390
2400
2410
2420
2430
2435
Figure 15 Well log section of profile 6507/7-2 showing the porosity log (left), water saturation log (middle) and permeability log (right). The depth of the analysed reservoir rocks as well as the interval for the oil samples (DSTs) is marked right beside the permeability log. The well log was provided by Statoil.
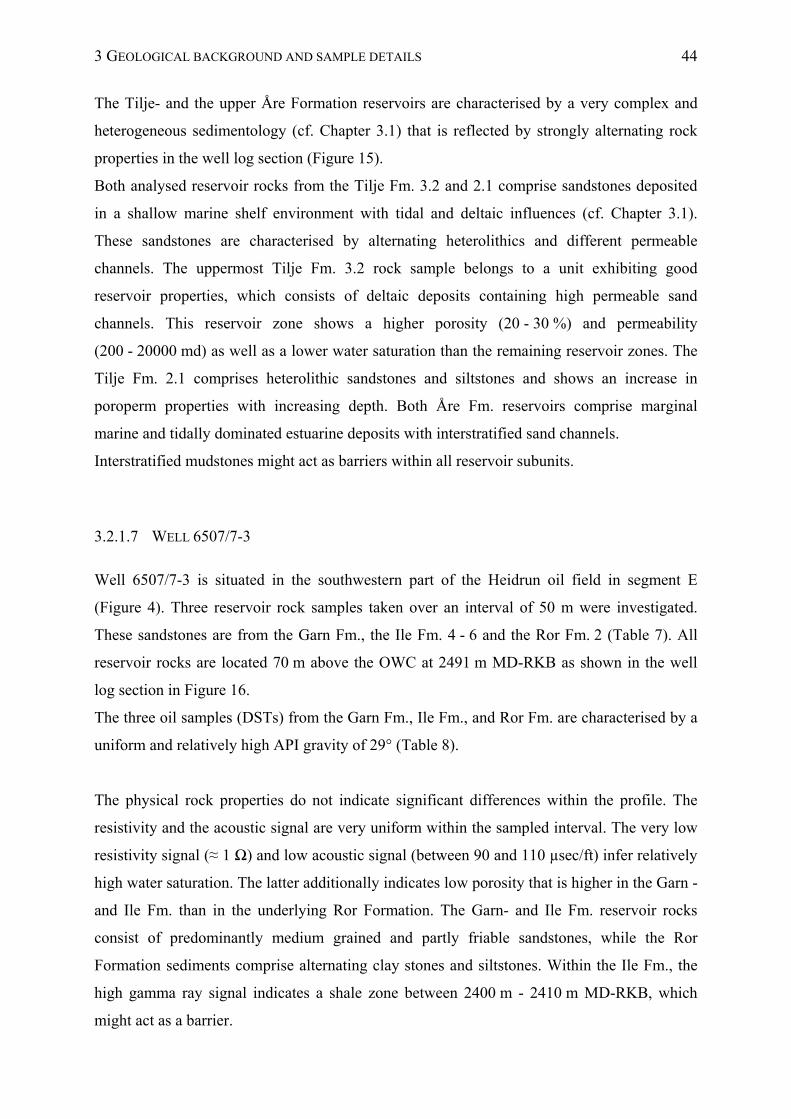
3 GEOLOGICAL BACKGROUND AND SAMPLE DETAILS 44
The Tilje- and the upper Åre Formation reservoirs are characterised by a very complex and
heterogeneous sedimentology (cf. Chapter 3.1) that is reflected by strongly alternating rock
properties in the well log section (Figure 15).
Both analysed reservoir rocks from the Tilje Fm. 3.2 and 2.1 comprise sandstones deposited
in a shallow marine shelf environment with tidal and deltaic influences (cf. Chapter 3.1).
These sandstones are characterised by alternating heterolithics and different permeable
channels. The uppermost Tilje Fm. 3.2 rock sample belongs to a unit exhibiting good
reservoir properties, which consists of deltaic deposits containing high permeable sand
channels. This reservoir zone shows a higher porosity (20 - 30 %) and permeability
(200 - 20000 md) as well as a lower water saturation than the remaining reservoir zones. The
Tilje Fm. 2.1 comprises heterolithic sandstones and siltstones and shows an increase in
poroperm properties with increasing depth. Both Åre Fm. reservoirs comprise marginal
marine and tidally dominated estuarine deposits with interstratified sand channels.
Interstratified mudstones might act as barriers within all reservoir subunits.
3.2.1.7 WELL 6507/7-3
Well 6507/7-3 is situated in the southwestern part of the Heidrun oil field in segment E
(Figure 4). Three reservoir rock samples taken over an interval of 50 m were investigated.
These sandstones are from the Garn Fm., the Ile Fm. 4 - 6 and the Ror Fm. 2 (Table 7). All
reservoir rocks are located 70 m above the OWC at 2491 m MD-RKB as shown in the well
log section in Figure 16.
The three oil samples (DSTs) from the Garn Fm., Ile Fm., and Ror Fm. are characterised by a
uniform and relatively high API gravity of 29° (Table 8).
The physical rock properties do not indicate significant differences within the profile. The
resistivity and the acoustic signal are very uniform within the sampled interval. The very low
resistivity signal (≈ 1 Ω) and low acoustic signal (between 90 and 110 µsec/ft) infer relatively
high water saturation. The latter additionally indicates low porosity that is higher in the Garn -
and Ile Fm. than in the underlying Ror Formation. The Garn- and Ile Fm. reservoir rocks
consist of predominantly medium grained and partly friable sandstones, while the Ror
Formation sediments comprise alternating clay stones and siltstones. Within the Ile Fm., the
high gamma ray signal indicates a shale zone between 2400 m - 2410 m MD-RKB, which
might act as a barrier.
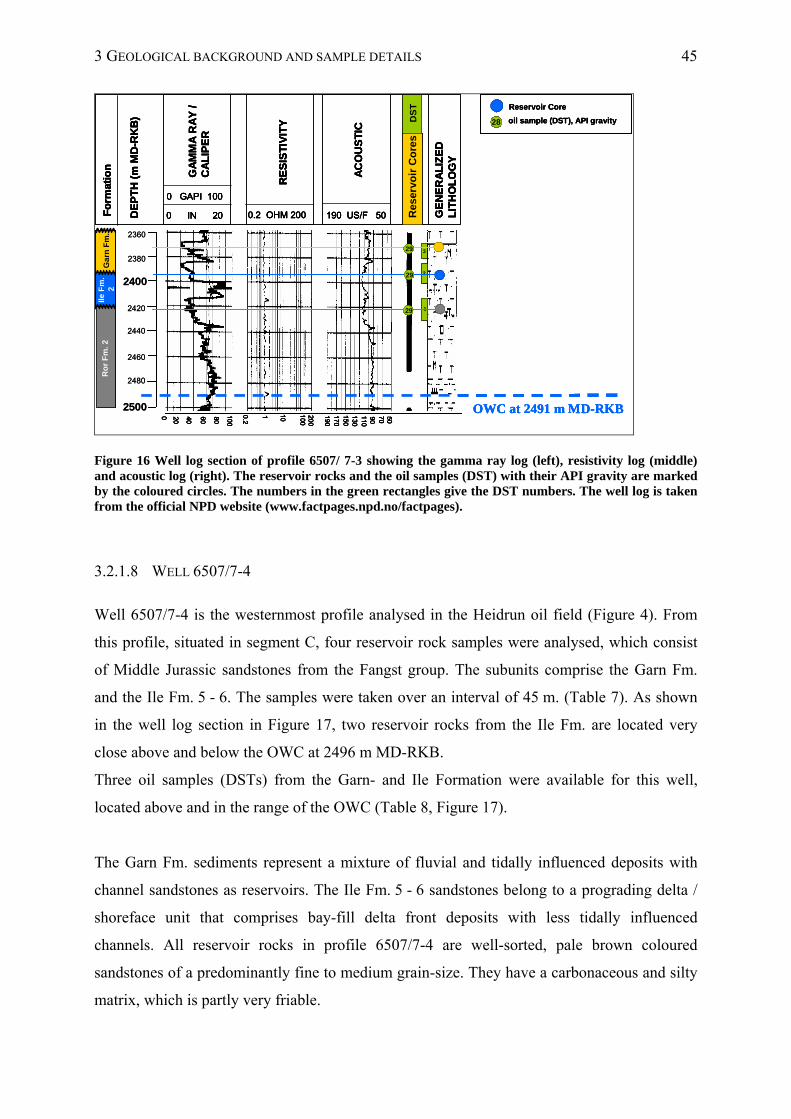
3 GEOLOGICAL BACKGROUND AND SAMPLE DETAILS 45
OWC at 2491 m MD-RKB
3
2
1
GE
NE
RA
LIZ
ED
L
ITH
OL
OG
Y
0 IN 20
0 GAPI 100
Fo
rmat
ion
DE
PT
H (
m M
D-R
KB
)
0.2 OHM 200 190 US/F 50 Res
ervo
ir
RE
SIS
TIV
ITY
GA
MM
A R
AY
/C
AL
IPE
R
AC
OU
ST
IC
DS
TR
eser
voir
Co
res
2500
2480
2460
2440
2420
2400
2380
2360
Ga
rn F
m.
Ro
r F
m.
2Ile
Fm
. 2
29
29
29
0 20 40 60 80
100
190170150
11090
50
0.2
1 10 100200
130
70
Reservoir Core
oil sample (DST), API gravity28
OWC at 2491 m MD-RKB
3
2
1
GE
NE
RA
LIZ
ED
L
ITH
OL
OG
Y
0 IN 20
0 GAPI 100
Fo
rmat
ion
DE
PT
H (
m M
D-R
KB
)
0.2 OHM 200 190 US/F 50 Res
ervo
ir
RE
SIS
TIV
ITY
GA
MM
A R
AY
/C
AL
IPE
R
AC
OU
ST
IC
DS
TR
eser
voir
Co
res
2500
2480
2460
2440
2420
2400
2380
2360
Ga
rn F
m.
Ro
r F
m.
2Ile
Fm
. 2
29
29
29
0 20 40 60 80
100
190170150
11090
50
0.2
1 10 100200
130
70OWC at 2491 m MD-RKB
3
2
1
GE
NE
RA
LIZ
ED
L
ITH
OL
OG
Y
0 IN 20
0 GAPI 100
Fo
rmat
ion
DE
PT
H (
m M
D-R
KB
)
0.2 OHM 200 190 US/F 50 Res
ervo
ir
RE
SIS
TIV
ITY
GA
MM
A R
AY
/C
AL
IPE
R
AC
OU
ST
IC
DS
TR
eser
voir
Co
res
GE
NE
RA
LIZ
ED
L
ITH
OL
OG
Y
0 IN 20
0 GAPI 100
Fo
rmat
ion
DE
PT
H (
m M
D-R
KB
)
0.2 OHM 200 190 US/F 50 Res
ervo
ir
RE
SIS
TIV
ITY
GA
MM
A R
AY
/C
AL
IPE
R
AC
OU
ST
IC
DS
TR
eser
voir
Co
res
2500
2480
2460
2440
2420
2400
2380
2360
2500
2480
2460
2440
2420
2400
2380
2360
Ga
rn F
m.
Ro
r F
m.
2Ile
Fm
. 2
Ga
rn F
m.
Ro
r F
m.
2Ile
Fm
. 2
29
29
29
29
29
29
0 20 40 60 80
100
190170150
11090
50
0.2
1 10 100200
130
700 20 40 60 80
100
190170150
11090
50
0.2
1 10 100200
130
70
Reservoir Core
oil sample (DST), API gravity28
Reservoir Core
oil sample (DST), API gravity28
Figure 16 Well log section of profile 6507/ 7-3 showing the gamma ray log (left), resistivity log (middle) and acoustic log (right). The reservoir rocks and the oil samples (DST) with their API gravity are marked by the coloured circles. The numbers in the green rectangles give the DST numbers. The well log is taken from the official NPD website (www.factpages.npd.no/factpages).
3.2.1.8 WELL 6507/7-4
Well 6507/7-4 is the westernmost profile analysed in the Heidrun oil field (Figure 4). From
this profile, situated in segment C, four reservoir rock samples were analysed, which consist
of Middle Jurassic sandstones from the Fangst group. The subunits comprise the Garn Fm.
and the Ile Fm. 5 - 6. The samples were taken over an interval of 45 m. (Table 7). As shown
in the well log section in Figure 17, two reservoir rocks from the Ile Fm. are located very
close above and below the OWC at 2496 m MD-RKB.
Three oil samples (DSTs) from the Garn- and Ile Formation were available for this well,
located above and in the range of the OWC (Table 8, Figure 17).
The Garn Fm. sediments represent a mixture of fluvial and tidally influenced deposits with
channel sandstones as reservoirs. The Ile Fm. 5 - 6 sandstones belong to a prograding delta /
shoreface unit that comprises bay-fill delta front deposits with less tidally influenced
channels. All reservoir rocks in profile 6507/7-4 are well-sorted, pale brown coloured
sandstones of a predominantly fine to medium grain-size. They have a carbonaceous and silty
matrix, which is partly very friable.
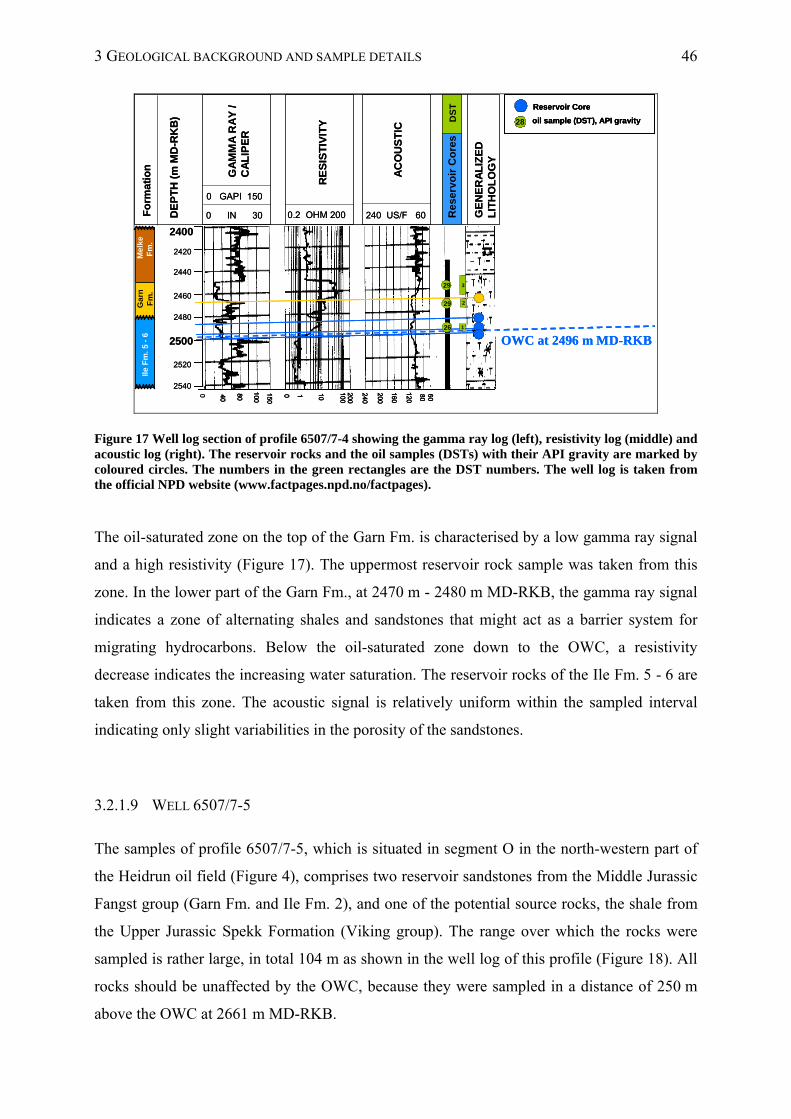
3 GEOLOGICAL BACKGROUND AND SAMPLE DETAILS 46
OWC at 2496 m MD-RKB
GE
NE
RA
LIZ
ED
L
ITH
OL
OG
Y
0 IN 30
0 GAPI 150
Fo
rmat
ion
DE
PT
H (
m M
D-R
KB
)
0.2 OHM 200 240 US/F 60 Res
ervo
ir
RE
SIS
TIV
ITY
GA
MM
A R
AY
/C
AL
IPE
R
AC
OU
ST
IC
DS
TR
eser
voir
Co
res
2500
2480
2460
2440
2420
2400
2540
2520
Me
lke
Fm
.Ile
Fm
. 5
-6
Ga
rn
Fm
.
Reservoir Core
oil sample (DST), API gravity28
1
29
29
26
2
3
0 40
80
100
0 1 10
100
150
200
240
200
160
120
8060
OWC at 2496 m MD-RKB
GE
NE
RA
LIZ
ED
L
ITH
OL
OG
Y
0 IN 30
0 GAPI 150
Fo
rmat
ion
DE
PT
H (
m M
D-R
KB
)
0.2 OHM 200 240 US/F 60 Res
ervo
ir
RE
SIS
TIV
ITY
GA
MM
A R
AY
/C
AL
IPE
R
AC
OU
ST
IC
DS
TR
eser
voir
Co
res
2500
2480
2460
2440
2420
2400
2540
2520
2500
2480
2460
2440
2420
2400
2540
2520
Me
lke
Fm
.Ile
Fm
. 5
-6
Ga
rn
Fm
. M
elk
eF
m.
Ile F
m.
5 -
6G
arn
F
m.
Reservoir Core
oil sample (DST), API gravity28
Reservoir Core
oil sample (DST), API gravity28
1
29
29
26
2
3
0 40
80
100
0 1 10
100
150
200
240
200
160
120
80600 40
80
100
0 1 10
100
150
200
240
200
160
120
8060
Figure 17 Well log section of profile 6507/7-4 showing the gamma ray log (left), resistivity log (middle) and acoustic log (right). The reservoir rocks and the oil samples (DSTs) with their API gravity are marked by coloured circles. The numbers in the green rectangles are the DST numbers. The well log is taken from the official NPD website (www.factpages.npd.no/factpages).
The oil-saturated zone on the top of the Garn Fm. is characterised by a low gamma ray signal
and a high resistivity (Figure 17). The uppermost reservoir rock sample was taken from this
zone. In the lower part of the Garn Fm., at 2470 m - 2480 m MD-RKB, the gamma ray signal
indicates a zone of alternating shales and sandstones that might act as a barrier system for
migrating hydrocarbons. Below the oil-saturated zone down to the OWC, a resistivity
decrease indicates the increasing water saturation. The reservoir rocks of the Ile Fm. 5 - 6 are
taken from this zone. The acoustic signal is relatively uniform within the sampled interval
indicating only slight variabilities in the porosity of the sandstones.
3.2.1.9 WELL 6507/7-5
The samples of profile 6507/7-5, which is situated in segment O in the north-western part of
the Heidrun oil field (Figure 4), comprises two reservoir sandstones from the Middle Jurassic
Fangst group (Garn Fm. and Ile Fm. 2), and one of the potential source rocks, the shale from
the Upper Jurassic Spekk Formation (Viking group). The range over which the rocks were
sampled is rather large, in total 104 m as shown in the well log of this profile (Figure 18). All
rocks should be unaffected by the OWC, because they were sampled in a distance of 250 m
above the OWC at 2661 m MD-RKB.
3 GEOLOGICAL BACKGROUND AND SAMPLE DETAILS 47
Two oil samples (DSTs), one of the Garn Fm. and one of the Ile Fm. 2 / 1 are available for
this well. Both are characterised by high API gravities of 32° and 28°, respectively (Table 8).
The Spekk Formation shale on the top of the profile is characterised by a very high gamma
ray signal (Figure 18, left). Below, the two reservoir rocks of the Garn Fm. and the Ile Fm. 2
are within the oil-saturated zone, which is characterised by a high resistivity signal (Figure 18,
middle). Both reservoir rocks comprise predominantly medium-grained, oil-stained
sandstones and show only slight differences in the resistivity signals, the lower being
observed in the Ile Fm. 2.
Gradients in the gamma ray signal can be observed for some intervals within the Garn- and Ile
Formation. Each interval is limited by a very dense layer consisting of shales and/or
limestones. These dense layers might act as barriers for migrating hydrocarbons.
28
32
GE
NE
RA
LIZ
ED
L
ITH
OL
OG
Y
0 IN 20
0 GAPI 100
Fo
rmat
ion
DE
PT
H (
m M
D-R
KB
)
0.2 OHM 200 240 US/F 60 Res
ervo
ir
RE
SIS
TIV
ITY
GA
MM
A R
AY
/C
AL
IPE
R
AC
OU
ST
IC
DS
TR
eser
voir
Co
res
2500
2480
2460
2440
2420
2400
2380
2360
2340
2320
2300
Sp
ekk
/ M
elke
Fm
.G
arn
Fm
.Il
e F
m.
2/1
Ro
rF
m.
OWC at 2661 m MD-RKB
2500 m – 2661 m MD-RKB
2A
1
Reservoir Core
oil sample (DST), API gravity28
0 20 40
60
80
120
0.2
1 10
100
200
240
200
160
120
80
60100
28
32
GE
NE
RA
LIZ
ED
L
ITH
OL
OG
Y
0 IN 20
0 GAPI 100
Fo
rmat
ion
DE
PT
H (
m M
D-R
KB
)
0.2 OHM 200 240 US/F 60 Res
ervo
ir
RE
SIS
TIV
ITY
GA
MM
A R
AY
/C
AL
IPE
R
AC
OU
ST
IC
DS
TR
eser
voir
Co
res
2500
2480
2460
2440
2420
2400
2380
2360
2340
2320
2300
2500
2480
2460
2440
2420
2400
2380
2360
2340
2320
2300
Sp
ekk
/ M
elke
Fm
.G
arn
Fm
.Il
e F
m.
2/1
Ro
rF
m.
OWC at 2661 m MD-RKB
2500 m – 2661 m MD-RKB
2A
1
Reservoir Core
oil sample (DST), API gravity28
Reservoir Core
oil sample (DST), API gravity28
0 20 40
60
80
120
0.2
1 10
100
200
240
200
160
120
80
60100
0 20 40
60
80
120
0.2
1 10
100
200
240
200
160
120
80
60100
Figure 18 Well log section of the profile 6507/7-5 showing the gamma ray log (left), resistivity log (middle) and acoustic log (right). The reservoir rocks and the oil samples (DSTs) with their API gravity are marked by different coloured circles. The numbers in the green rectangles are the DST numbers. The well log is taken from the official NPD website (www.factpages.npd.no/factpages).
3.2.1.10 WELL 6507/7-6
Well 6507/7-6 is one of two NPD wells in the northern part of the Heidrun oil field (Figure
4). Well 6507/7-6 is located in segment I, together with well B and well 6507/8-1. Four
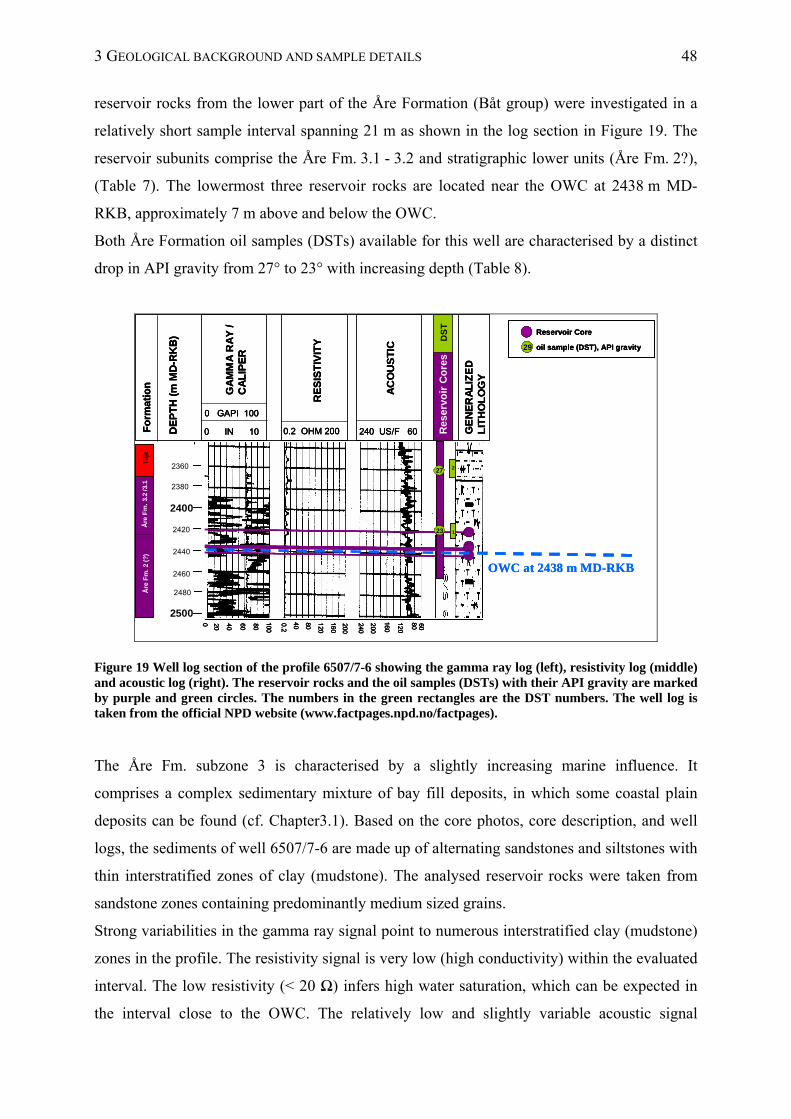
3 GEOLOGICAL BACKGROUND AND SAMPLE DETAILS 48
reservoir rocks from the lower part of the Åre Formation (Båt group) were investigated in a
relatively short sample interval spanning 21 m as shown in the log section in Figure 19. The
reservoir subunits comprise the Åre Fm. 3.1 - 3.2 and stratigraphic lower units (Åre Fm. 2?),
(Table 7). The lowermost three reservoir rocks are located near the OWC at 2438 m MD-
RKB, approximately 7 m above and below the OWC.
Both Åre Formation oil samples (DSTs) available for this well are characterised by a distinct
drop in API gravity from 27° to 23° with increasing depth (Table 8).
2
1
27 2
23
GE
NE
RA
LIZ
ED
L
ITH
OL
OG
Y
0 IN 10
0 GAPI 100
Fo
rmat
ion
DE
PT
H (
m M
D-R
KB
)
0.2 OHM 200 240 US/F 60 Res
ervo
ir
RE
SIS
TIV
ITY
GA
MM
A R
AY
/C
AL
IPE
R
AC
OU
ST
IC
DS
TR
eser
voir
Co
res
2500
2480
2460
2440
2420
2400
2360
2380
Til
jeT
ilje
Åre
Fm
. 2
(?)
Åre
Fm
. 3.
2 /3
.1
OWC at 2438 m MD-RKB0 20
40
60 80
100
0.2
40 80 120
160
200
240
200
160
120
80 60
Reservoir Core
29 oil sample (DST), API gravity
2
1
27 2
23
2
1
27 2
2323
GE
NE
RA
LIZ
ED
L
ITH
OL
OG
Y
0 IN 10
0 GAPI 100
Fo
rmat
ion
DE
PT
H (
m M
D-R
KB
)
0.2 OHM 200 240 US/F 60 Res
ervo
ir
RE
SIS
TIV
ITY
GA
MM
A R
AY
/C
AL
IPE
R
AC
OU
ST
IC
DS
TR
eser
voir
Co
res
GE
NE
RA
LIZ
ED
L
ITH
OL
OG
Y
0 IN 10
0 GAPI 100
Fo
rmat
ion
DE
PT
H (
m M
D-R
KB
)
0.2 OHM 200 240 US/F 60 Res
ervo
ir
RE
SIS
TIV
ITY
GA
MM
A R
AY
/C
AL
IPE
R
AC
OU
ST
IC
DS
TR
eser
voir
Co
res
2500
2480
2460
2440
2420
2400
2360
2380
Til
jeT
ilje
Åre
Fm
. 2
(?)
Åre
Fm
. 3.
2 /3
.1T
ilje
Tilj
eÅ
re F
m.
2 (?
)Å
re F
m.
3.2
/3.1
OWC at 2438 m MD-RKB0 20
40
60 80
100
0.2
40 80 120
160
200
240
200
160
120
80 60
0 20
40
60 80
100
0.2
40 80 120
160
200
240
200
160
120
80 60
Reservoir Core
29 oil sample (DST), API gravity
Reservoir Core
29 oil sample (DST), API gravity
Figure 19 Well log section of the profile 6507/7-6 showing the gamma ray log (left), resistivity log (middle) and acoustic log (right). The reservoir rocks and the oil samples (DSTs) with their API gravity are marked by purple and green circles. The numbers in the green rectangles are the DST numbers. The well log is taken from the official NPD website (www.factpages.npd.no/factpages).
The Åre Fm. subzone 3 is characterised by a slightly increasing marine influence. It
comprises a complex sedimentary mixture of bay fill deposits, in which some coastal plain
deposits can be found (cf. Chapter3.1). Based on the core photos, core description, and well
logs, the sediments of well 6507/7-6 are made up of alternating sandstones and siltstones with
thin interstratified zones of clay (mudstone). The analysed reservoir rocks were taken from
sandstone zones containing predominantly medium sized grains.
Strong variabilities in the gamma ray signal point to numerous interstratified clay (mudstone)
zones in the profile. The resistivity signal is very low (high conductivity) within the evaluated
interval. The low resistivity (< 20 Ω) infers high water saturation, which can be expected in
the interval close to the OWC. The relatively low and slightly variable acoustic signal
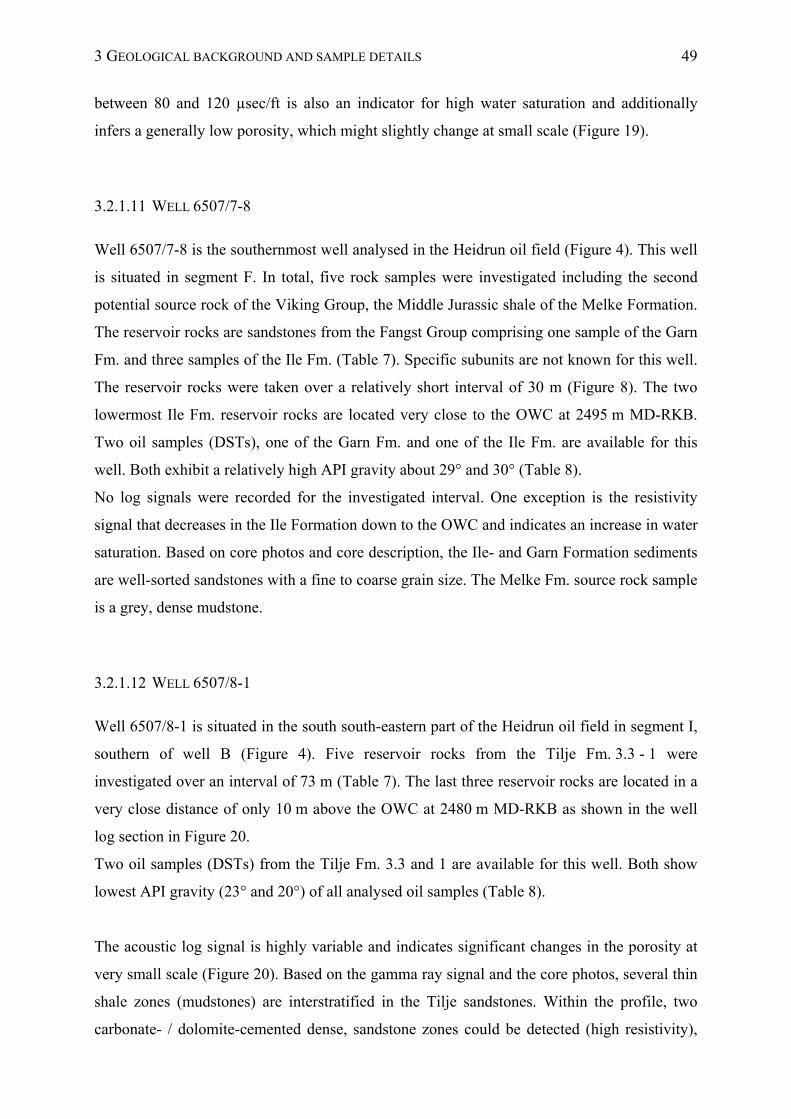
3 GEOLOGICAL BACKGROUND AND SAMPLE DETAILS 49
between 80 and 120 µsec/ft is also an indicator for high water saturation and additionally
infers a generally low porosity, which might slightly change at small scale (Figure 19).
3.2.1.11 WELL 6507/7-8
Well 6507/7-8 is the southernmost well analysed in the Heidrun oil field (Figure 4). This well
is situated in segment F. In total, five rock samples were investigated including the second
potential source rock of the Viking Group, the Middle Jurassic shale of the Melke Formation.
The reservoir rocks are sandstones from the Fangst Group comprising one sample of the Garn
Fm. and three samples of the Ile Fm. (Table 7). Specific subunits are not known for this well.
The reservoir rocks were taken over a relatively short interval of 30 m (Figure 8). The two
lowermost Ile Fm. reservoir rocks are located very close to the OWC at 2495 m MD-RKB.
Two oil samples (DSTs), one of the Garn Fm. and one of the Ile Fm. are available for this
well. Both exhibit a relatively high API gravity about 29° and 30° (Table 8).
No log signals were recorded for the investigated interval. One exception is the resistivity
signal that decreases in the Ile Formation down to the OWC and indicates an increase in water
saturation. Based on core photos and core description, the Ile- and Garn Formation sediments
are well-sorted sandstones with a fine to coarse grain size. The Melke Fm. source rock sample
is a grey, dense mudstone.
3.2.1.12 WELL 6507/8-1
Well 6507/8-1 is situated in the south south-eastern part of the Heidrun oil field in segment I,
southern of well B (Figure 4). Five reservoir rocks from the Tilje Fm. 3.3 - 1 were
investigated over an interval of 73 m (Table 7). The last three reservoir rocks are located in a
very close distance of only 10 m above the OWC at 2480 m MD-RKB as shown in the well
log section in Figure 20.
Two oil samples (DSTs) from the Tilje Fm. 3.3 and 1 are available for this well. Both show
lowest API gravity (23° and 20°) of all analysed oil samples (Table 8).
The acoustic log signal is highly variable and indicates significant changes in the porosity at
very small scale (Figure 20). Based on the gamma ray signal and the core photos, several thin
shale zones (mudstones) are interstratified in the Tilje sandstones. Within the profile, two
carbonate- / dolomite-cemented dense, sandstone zones could be detected (high resistivity),
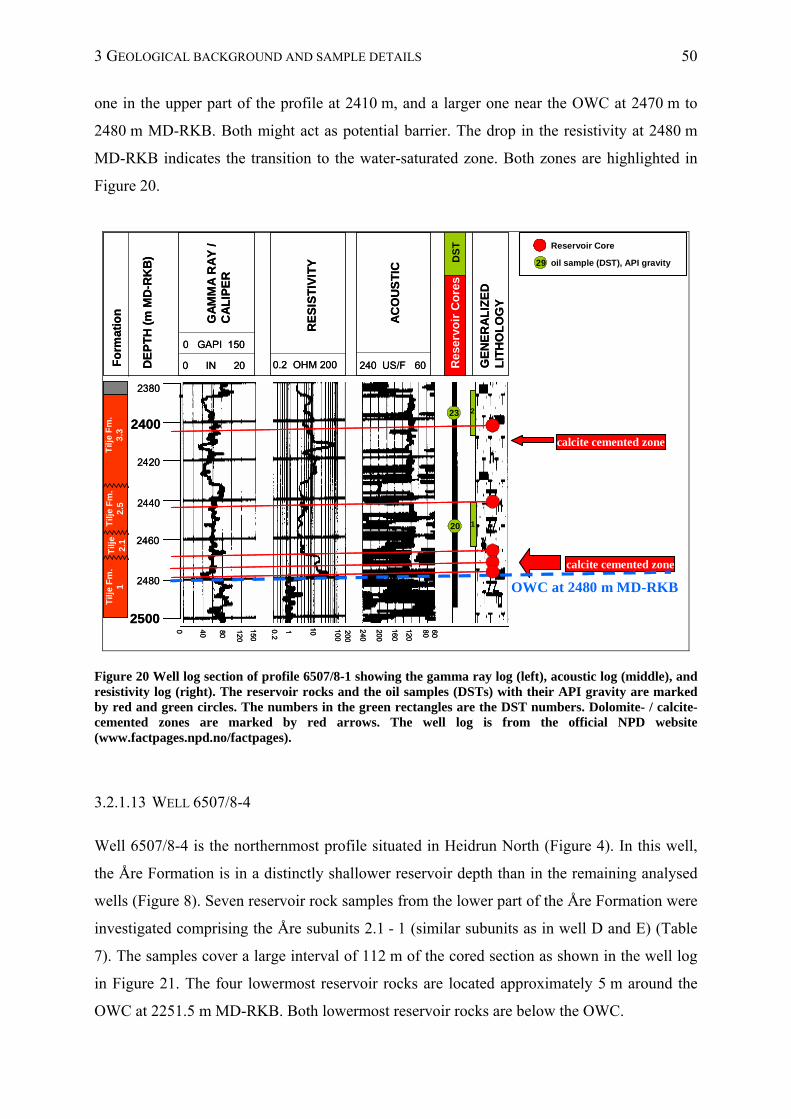
3 GEOLOGICAL BACKGROUND AND SAMPLE DETAILS 50
one in the upper part of the profile at 2410 m, and a larger one near the OWC at 2470 m to
2480 m MD-RKB. Both might act as potential barrier. The drop in the resistivity at 2480 m
MD-RKB indicates the transition to the water-saturated zone. Both zones are highlighted in
Figure 20.
OWC at 2480 m MD-RKB
calcite cemented zone
2
1
GE
NE
RA
LIZ
ED
L
ITH
OL
OG
Y
0 IN 20
0 GAPI 150
Fo
rmat
ion
DE
PT
H (
m M
D-R
KB
)
0.2 OHM 200 240 US/F 60 Res
ervo
ir
RE
SIS
TIV
ITY
GA
MM
A R
AY
/C
AL
IPE
R
AC
OU
ST
IC
DS
TR
eser
voir
Co
res
GE
NE
RA
LIZ
ED
L
ITH
OL
OG
Y
0 IN 20
0 GAPI 150
Fo
rmat
ion
DE
PT
H (
m M
D-R
KB
)
0.2 OHM 200 240 US/F 60 Res
ervo
ir
RE
SIS
TIV
ITY
GA
MM
A R
AY
/C
AL
IPE
R
AC
OU
ST
IC
DS
TR
eser
voir
Co
res
2400
2500
2420
2440
2460
2480
2380
2400
2500
2420
2440
2460
2480
2380
Tilj
e F
m.
2.5
Tilj
e2
.1
Tilj
e F
m.
1T
ilje
Fm
.3
.3T
ilje
Fm
.2
.5T
ilje
2.1
Tilj
e F
m.
1T
ilje
Fm
.3
.3
23
20
0 40 80
120
150
240
200
160
120
80 60
0.2
1 10 100
200
0 40 80
120
150
240
200
160
120
80 60
0.2
1 10 100
200
Reservoir Core
29 oil sample (DST), API gravity
calcite cemented zone
Figure 20 Well log section of profile 6507/8-1 showing the gamma ray log (left), acoustic log (middle), and resistivity log (right). The reservoir rocks and the oil samples (DSTs) with their API gravity are marked by red and green circles. The numbers in the green rectangles are the DST numbers. Dolomite- / calcite-cemented zones are marked by red arrows. The well log is from the official NPD website (www.factpages.npd.no/factpages).
3.2.1.13 WELL 6507/8-4
Well 6507/8-4 is the northernmost profile situated in Heidrun North (Figure 4). In this well,
the Åre Formation is in a distinctly shallower reservoir depth than in the remaining analysed
wells (Figure 8). Seven reservoir rock samples from the lower part of the Åre Formation were
investigated comprising the Åre subunits 2.1 - 1 (similar subunits as in well D and E) (Table
7). The samples cover a large interval of 112 m of the cored section as shown in the well log
in Figure 21. The four lowermost reservoir rocks are located approximately 5 m around the
OWC at 2251.5 m MD-RKB. Both lowermost reservoir rocks are below the OWC.
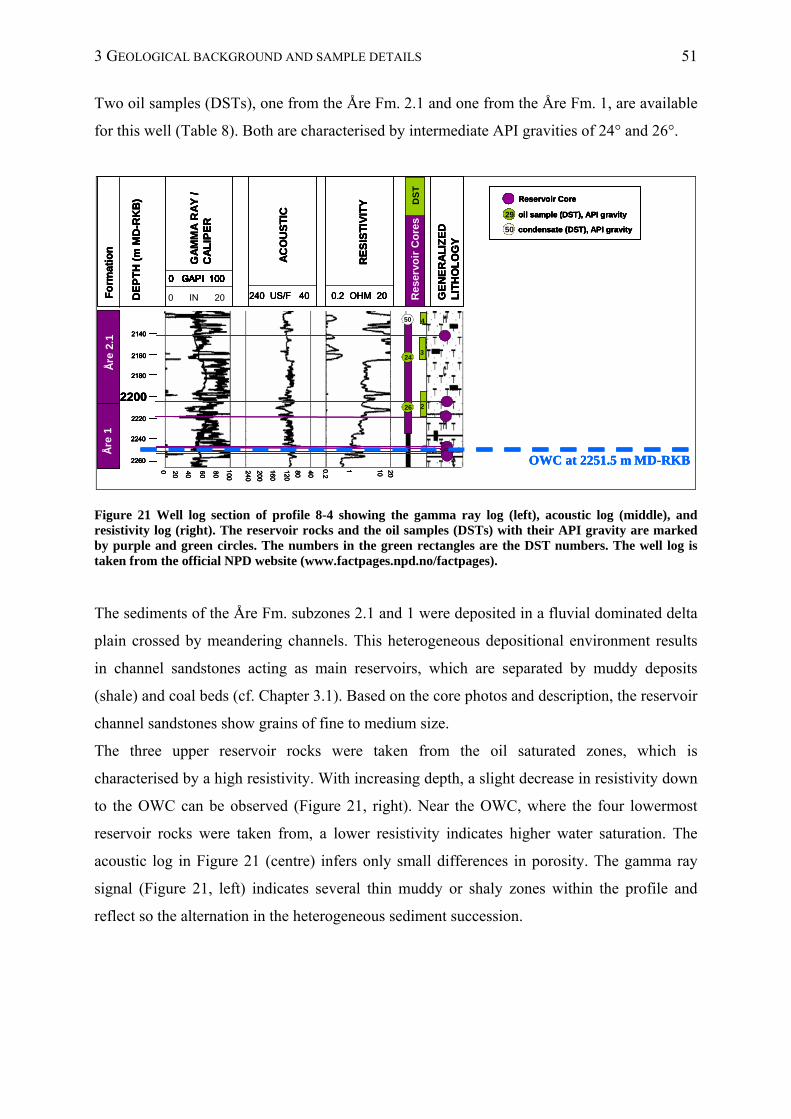
3 GEOLOGICAL BACKGROUND AND SAMPLE DETAILS 51
Two oil samples (DSTs), one from the Åre Fm. 2.1 and one from the Åre Fm. 1, are available
for this well (Table 8). Both are characterised by intermediate API gravities of 24° and 26°.
3
2
4
Åre
2.1
2200
2180
2160
2140
2260
2240
2220
OWC at 2251.5 m MD-RKB
24
26
50
Reservoir Core
29 oil sample (DST), API gravity
50 condensate (DST), API gravity
Åre
1
GE
NE
RA
LIZ
ED
L
ITH
OL
OG
Y
0 IN 10
0 GAPI 100
GA
MM
A R
AY
/C
AL
IPE
R
Fo
rmat
ion
DE
PT
H (
m M
D-R
KB
)
0 IN 10
0 GAPI 100
0.2 OHM 20 Res
ervo
ir
0 IN 10
0 GAPI 100
RE
SIS
TIV
ITY
AC
OU
ST
IC0 IN 20
0 GAPI 100
240 US/F 40
DS
TR
eser
voir
Co
res
0 20 40 60 80
100
240
200
160
120
80 40
0.2
1 10 20
3
2
4
Åre
2.1
2200
2180
2160
2140
2260
2240
2220
OWC at 2251.5 m MD-RKB
24
26
50
Reservoir Core
29 oil sample (DST), API gravity
50 condensate (DST), API gravity
Åre
1
GE
NE
RA
LIZ
ED
L
ITH
OL
OG
Y
0 IN 10
0 GAPI 100
GA
MM
A R
AY
/C
AL
IPE
R
Fo
rmat
ion
DE
PT
H (
m M
D-R
KB
)
0 IN 10
0 GAPI 100
0.2 OHM 20 Res
ervo
ir
0 IN 10
0 GAPI 100
RE
SIS
TIV
ITY
AC
OU
ST
IC0 IN 20
0 GAPI 100
240 US/F 40
DS
TR
eser
voir
Co
res
3
2
4
3
2
4
Åre
2.1
2200
2180
2160
2140
2260
2240
2220
2200
2180
2160
2140
2260
2240
2220
OWC at 2251.5 m MD-RKB
24
26
50
Reservoir Core
29 oil sample (DST), API gravity
50 condensate (DST), API gravity
Reservoir Core
29 oil sample (DST), API gravity
50 condensate (DST), API gravity
Åre
1
GE
NE
RA
LIZ
ED
L
ITH
OL
OG
Y
0 IN 10
0 GAPI 100
GA
MM
A R
AY
/C
AL
IPE
R
Fo
rmat
ion
DE
PT
H (
m M
D-R
KB
)
0 IN 10
0 GAPI 100
0.2 OHM 20 Res
ervo
ir
0 IN 10
0 GAPI 100
RE
SIS
TIV
ITY
AC
OU
ST
IC0 IN 20
0 GAPI 100
240 US/F 40
DS
TR
eser
voir
Co
res
GE
NE
RA
LIZ
ED
L
ITH
OL
OG
Y
0 IN 10
0 GAPI 100
GA
MM
A R
AY
/C
AL
IPE
R
Fo
rmat
ion
DE
PT
H (
m M
D-R
KB
)
0 IN 10
0 GAPI 100
0.2 OHM 20 Res
ervo
ir
0 IN 10
0 GAPI 100
RE
SIS
TIV
ITY
AC
OU
ST
IC0 IN 20
0 GAPI 100
240 US/F 40
DS
TR
eser
voir
Co
res
0 20 40 60 80
100
240
200
160
120
80 40
0.2
1 10 200 20 40 60 80
100
240
200
160
120
80 40
0.2
1 10 20
Figure 21 Well log section of profile 8-4 showing the gamma ray log (left), acoustic log (middle), and resistivity log (right). The reservoir rocks and the oil samples (DSTs) with their API gravity are marked by purple and green circles. The numbers in the green rectangles are the DST numbers. The well log is taken from the official NPD website (www.factpages.npd.no/factpages).
The sediments of the Åre Fm. subzones 2.1 and 1 were deposited in a fluvial dominated delta
plain crossed by meandering channels. This heterogeneous depositional environment results
in channel sandstones acting as main reservoirs, which are separated by muddy deposits
(shale) and coal beds (cf. Chapter 3.1). Based on the core photos and description, the reservoir
channel sandstones show grains of fine to medium size.
The three upper reservoir rocks were taken from the oil saturated zones, which is
characterised by a high resistivity. With increasing depth, a slight decrease in resistivity down
to the OWC can be observed (Figure 21, right). Near the OWC, where the four lowermost
reservoir rocks were taken from, a lower resistivity indicates higher water saturation. The
acoustic log in Figure 21 (centre) infers only small differences in porosity. The gamma ray
signal (Figure 21, left) indicates several thin muddy or shaly zones within the profile and
reflect so the alternation in the heterogeneous sediment succession.
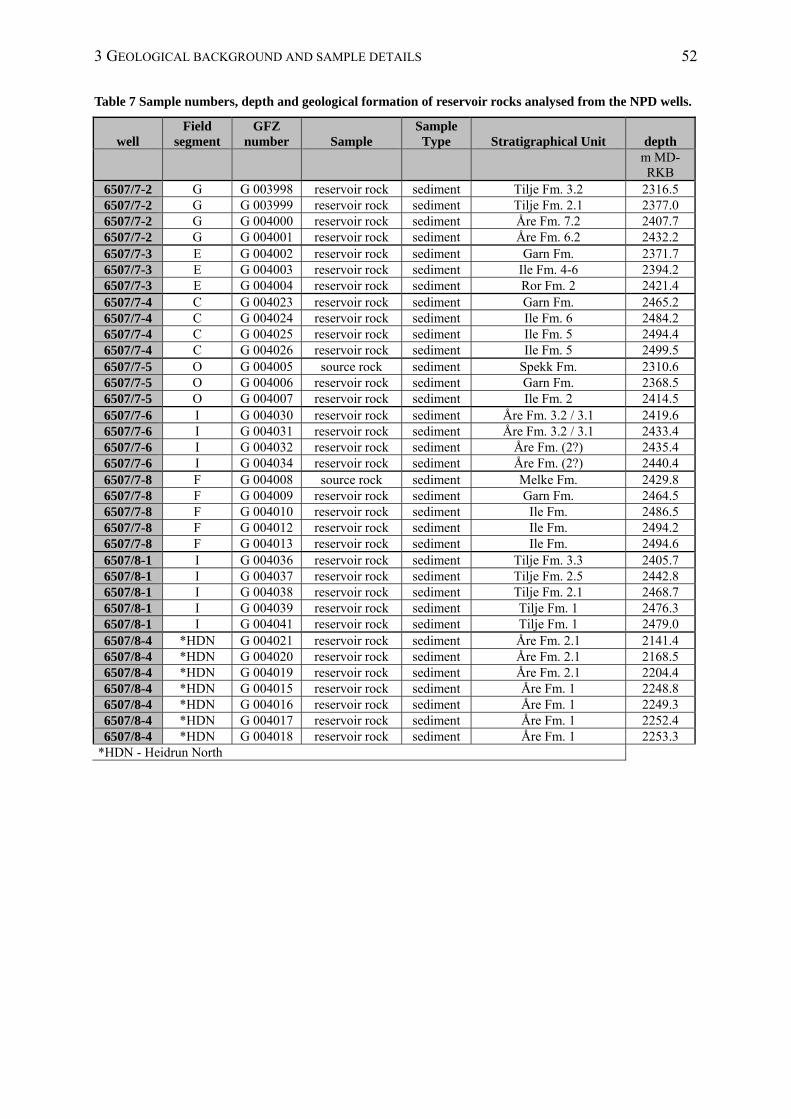
3 GEOLOGICAL BACKGROUND AND SAMPLE DETAILS 52
Table 7 Sample numbers, depth and geological formation of reservoir rocks analysed from the NPD wells.
well Field
segment GFZ
number Sample Sample Type Stratigraphical Unit depth
m MD-RKB
6507/7-2 G G 003998 reservoir rock sediment Tilje Fm. 3.2 2316.5 6507/7-2 G G 003999 reservoir rock sediment Tilje Fm. 2.1 2377.0 6507/7-2 G G 004000 reservoir rock sediment Åre Fm. 7.2 2407.7 6507/7-2 G G 004001 reservoir rock sediment Åre Fm. 6.2 2432.2 6507/7-3 E G 004002 reservoir rock sediment Garn Fm. 2371.7 6507/7-3 E G 004003 reservoir rock sediment Ile Fm. 4-6 2394.2 6507/7-3 E G 004004 reservoir rock sediment Ror Fm. 2 2421.4 6507/7-4 C G 004023 reservoir rock sediment Garn Fm. 2465.2 6507/7-4 C G 004024 reservoir rock sediment Ile Fm. 6 2484.2 6507/7-4 C G 004025 reservoir rock sediment Ile Fm. 5 2494.4 6507/7-4 C G 004026 reservoir rock sediment Ile Fm. 5 2499.5 6507/7-5 O G 004005 source rock sediment Spekk Fm. 2310.6 6507/7-5 O G 004006 reservoir rock sediment Garn Fm. 2368.5 6507/7-5 O G 004007 reservoir rock sediment Ile Fm. 2 2414.5 6507/7-6 I G 004030 reservoir rock sediment Åre Fm. 3.2 / 3.1 2419.6 6507/7-6 I G 004031 reservoir rock sediment Åre Fm. 3.2 / 3.1 2433.4 6507/7-6 I G 004032 reservoir rock sediment Åre Fm. (2?) 2435.4 6507/7-6 I G 004034 reservoir rock sediment Åre Fm. (2?) 2440.4 6507/7-8 F G 004008 source rock sediment Melke Fm. 2429.8 6507/7-8 F G 004009 reservoir rock sediment Garn Fm. 2464.5 6507/7-8 F G 004010 reservoir rock sediment Ile Fm. 2486.5 6507/7-8 F G 004012 reservoir rock sediment Ile Fm. 2494.2 6507/7-8 F G 004013 reservoir rock sediment Ile Fm. 2494.6 6507/8-1 I G 004036 reservoir rock sediment Tilje Fm. 3.3 2405.7 6507/8-1 I G 004037 reservoir rock sediment Tilje Fm. 2.5 2442.8 6507/8-1 I G 004038 reservoir rock sediment Tilje Fm. 2.1 2468.7 6507/8-1 I G 004039 reservoir rock sediment Tilje Fm. 1 2476.3 6507/8-1 I G 004041 reservoir rock sediment Tilje Fm. 1 2479.0 6507/8-4 *HDN G 004021 reservoir rock sediment Åre Fm. 2.1 2141.4 6507/8-4 *HDN G 004020 reservoir rock sediment Åre Fm. 2.1 2168.5 6507/8-4 *HDN G 004019 reservoir rock sediment Åre Fm. 2.1 2204.4 6507/8-4 *HDN G 004015 reservoir rock sediment Åre Fm. 1 2248.8 6507/8-4 *HDN G 004016 reservoir rock sediment Åre Fm. 1 2249.3 6507/8-4 *HDN G 004017 reservoir rock sediment Åre Fm. 1 2252.4 6507/8-4 *HDN G 004018 reservoir rock sediment Åre Fm. 1 2253.3
*HDN - Heidrun North
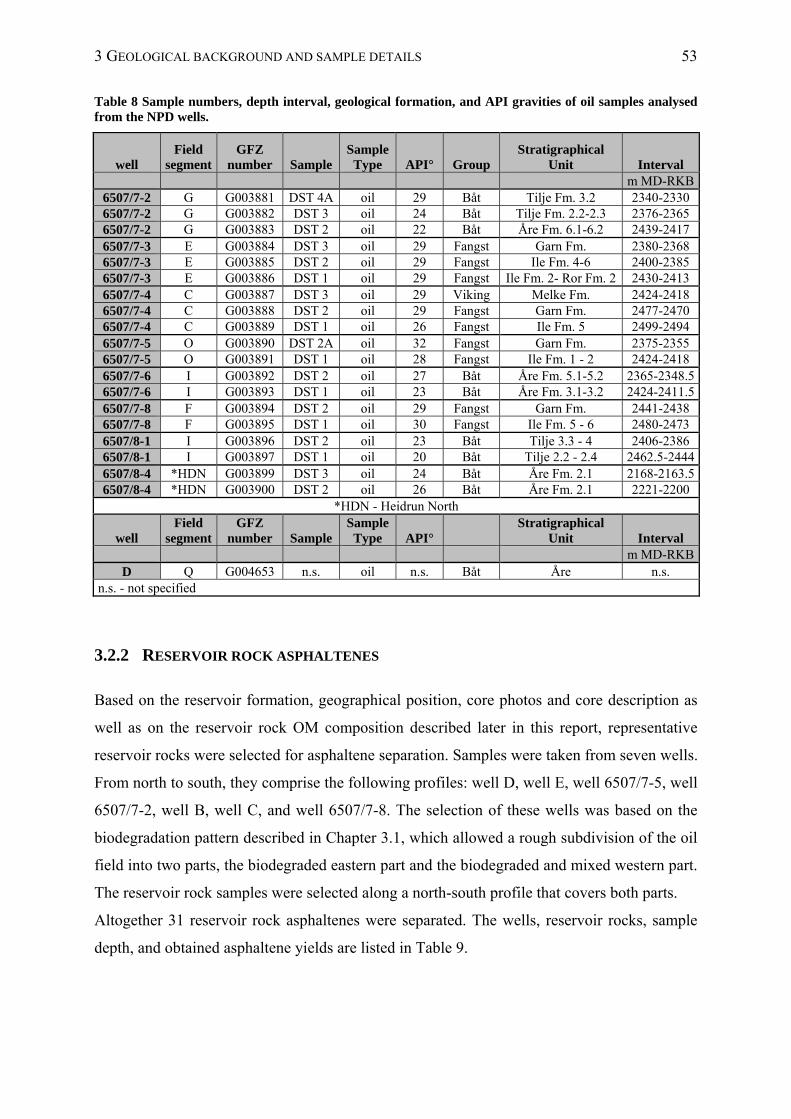
3 GEOLOGICAL BACKGROUND AND SAMPLE DETAILS 53
Table 8 Sample numbers, depth interval, geological formation, and API gravities of oil samples analysed from the NPD wells.
well Field
segment GFZ
number Sample Sample Type API° Group
Stratigraphical Unit Interval
m MD-RKB6507/7-2 G G003881 DST 4A oil 29 Båt Tilje Fm. 3.2 2340-2330 6507/7-2 G G003882 DST 3 oil 24 Båt Tilje Fm. 2.2-2.3 2376-2365 6507/7-2 G G003883 DST 2 oil 22 Båt Åre Fm. 6.1-6.2 2439-2417 6507/7-3 E G003884 DST 3 oil 29 Fangst Garn Fm. 2380-2368 6507/7-3 E G003885 DST 2 oil 29 Fangst Ile Fm. 4-6 2400-2385 6507/7-3 E G003886 DST 1 oil 29 Fangst Ile Fm. 2- Ror Fm. 2 2430-2413 6507/7-4 C G003887 DST 3 oil 29 Viking Melke Fm. 2424-2418 6507/7-4 C G003888 DST 2 oil 29 Fangst Garn Fm. 2477-2470 6507/7-4 C G003889 DST 1 oil 26 Fangst Ile Fm. 5 2499-2494 6507/7-5 O G003890 DST 2A oil 32 Fangst Garn Fm. 2375-2355 6507/7-5 O G003891 DST 1 oil 28 Fangst Ile Fm. 1 - 2 2424-2418 6507/7-6 I G003892 DST 2 oil 27 Båt Åre Fm. 5.1-5.2 2365-2348.56507/7-6 I G003893 DST 1 oil 23 Båt Åre Fm. 3.1-3.2 2424-2411.56507/7-8 F G003894 DST 2 oil 29 Fangst Garn Fm. 2441-2438 6507/7-8 F G003895 DST 1 oil 30 Fangst Ile Fm. 5 - 6 2480-2473 6507/8-1 I G003896 DST 2 oil 23 Båt Tilje 3.3 - 4 2406-2386 6507/8-1 I G003897 DST 1 oil 20 Båt Tilje 2.2 - 2.4 2462.5-24446507/8-4 *HDN G003899 DST 3 oil 24 Båt Åre Fm. 2.1 2168-2163.56507/8-4 *HDN G003900 DST 2 oil 26 Båt Åre Fm. 2.1 2221-2200
*HDN - Heidrun North
well Field
segment GFZ
number Sample Sample Type API°
Stratigraphical Unit Interval
m MD-RKBD Q G004653 n.s. oil n.s. Båt Åre n.s.
n.s. - not specified
3.2.2 RESERVOIR ROCK ASPHALTENES
Based on the reservoir formation, geographical position, core photos and core description as
well as on the reservoir rock OM composition described later in this report, representative
reservoir rocks were selected for asphaltene separation. Samples were taken from seven wells.
From north to south, they comprise the following profiles: well D, well E, well 6507/7-5, well
6507/7-2, well B, well C, and well 6507/7-8. The selection of these wells was based on the
biodegradation pattern described in Chapter 3.1, which allowed a rough subdivision of the oil
field into two parts, the biodegraded eastern part and the biodegraded and mixed western part.
The reservoir rock samples were selected along a north-south profile that covers both parts.
Altogether 31 reservoir rock asphaltenes were separated. The wells, reservoir rocks, sample
depth, and obtained asphaltene yields are listed in Table 9.
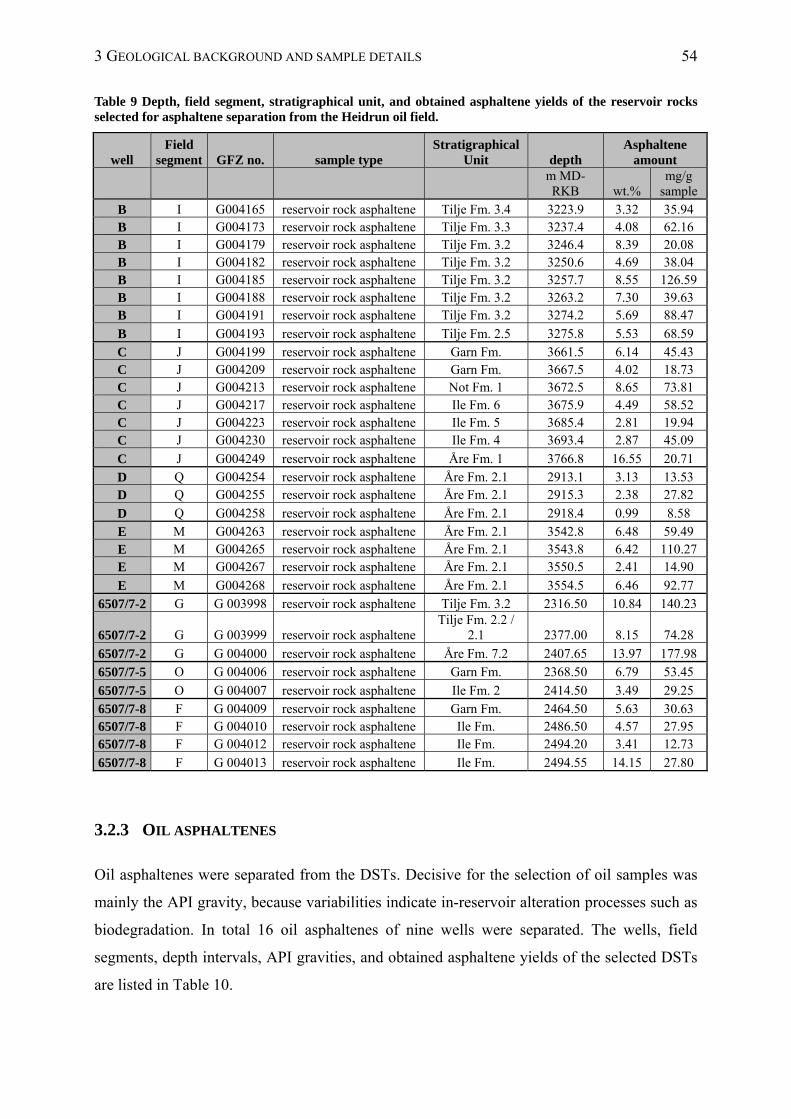
3 GEOLOGICAL BACKGROUND AND SAMPLE DETAILS 54
Table 9 Depth, field segment, stratigraphical unit, and obtained asphaltene yields of the reservoir rocks selected for asphaltene separation from the Heidrun oil field.
well Field
segment GFZ no. sample type Stratigraphical
Unit depth Asphaltene
amount
m MD-RKB wt.%
mg/g sample
B I G004165 reservoir rock asphaltene Tilje Fm. 3.4 3223.9 3.32 35.94 B I G004173 reservoir rock asphaltene Tilje Fm. 3.3 3237.4 4.08 62.16 B I G004179 reservoir rock asphaltene Tilje Fm. 3.2 3246.4 8.39 20.08 B I G004182 reservoir rock asphaltene Tilje Fm. 3.2 3250.6 4.69 38.04 B I G004185 reservoir rock asphaltene Tilje Fm. 3.2 3257.7 8.55 126.59 B I G004188 reservoir rock asphaltene Tilje Fm. 3.2 3263.2 7.30 39.63 B I G004191 reservoir rock asphaltene Tilje Fm. 3.2 3274.2 5.69 88.47
B I G004193 reservoir rock asphaltene Tilje Fm. 2.5 3275.8 5.53 68.59 C J G004199 reservoir rock asphaltene Garn Fm. 3661.5 6.14 45.43 C J G004209 reservoir rock asphaltene Garn Fm. 3667.5 4.02 18.73 C J G004213 reservoir rock asphaltene Not Fm. 1 3672.5 8.65 73.81 C J G004217 reservoir rock asphaltene Ile Fm. 6 3675.9 4.49 58.52 C J G004223 reservoir rock asphaltene Ile Fm. 5 3685.4 2.81 19.94 C J G004230 reservoir rock asphaltene Ile Fm. 4 3693.4 2.87 45.09
C J G004249 reservoir rock asphaltene Åre Fm. 1 3766.8 16.55 20.71 D Q G004254 reservoir rock asphaltene Åre Fm. 2.1 2913.1 3.13 13.53 D Q G004255 reservoir rock asphaltene Åre Fm. 2.1 2915.3 2.38 27.82
D Q G004258 reservoir rock asphaltene Åre Fm. 2.1 2918.4 0.99 8.58 E M G004263 reservoir rock asphaltene Åre Fm. 2.1 3542.8 6.48 59.49 E M G004265 reservoir rock asphaltene Åre Fm. 2.1 3543.8 6.42 110.27 E M G004267 reservoir rock asphaltene Åre Fm. 2.1 3550.5 2.41 14.90
E M G004268 reservoir rock asphaltene Åre Fm. 2.1 3554.5 6.46 92.77
6507/7-2 G G 003998 reservoir rock asphaltene Tilje Fm. 3.2 2316.50 10.84 140.23
6507/7-2 G G 003999 reservoir rock asphaltene Tilje Fm. 2.2 /
2.1 2377.00 8.15 74.28
6507/7-2 G G 004000 reservoir rock asphaltene Åre Fm. 7.2 2407.65 13.97 177.98 6507/7-5 O G 004006 reservoir rock asphaltene Garn Fm. 2368.50 6.79 53.45
6507/7-5 O G 004007 reservoir rock asphaltene Ile Fm. 2 2414.50 3.49 29.25 6507/7-8 F G 004009 reservoir rock asphaltene Garn Fm. 2464.50 5.63 30.63 6507/7-8 F G 004010 reservoir rock asphaltene Ile Fm. 2486.50 4.57 27.95 6507/7-8 F G 004012 reservoir rock asphaltene Ile Fm. 2494.20 3.41 12.73
6507/7-8 F G 004013 reservoir rock asphaltene Ile Fm. 2494.55 14.15 27.80
3.2.3 OIL ASPHALTENES
Oil asphaltenes were separated from the DSTs. Decisive for the selection of oil samples was
mainly the API gravity, because variabilities indicate in-reservoir alteration processes such as
biodegradation. In total 16 oil asphaltenes of nine wells were separated. The wells, field
segments, depth intervals, API gravities, and obtained asphaltene yields of the selected DSTs
are listed in Table 10.
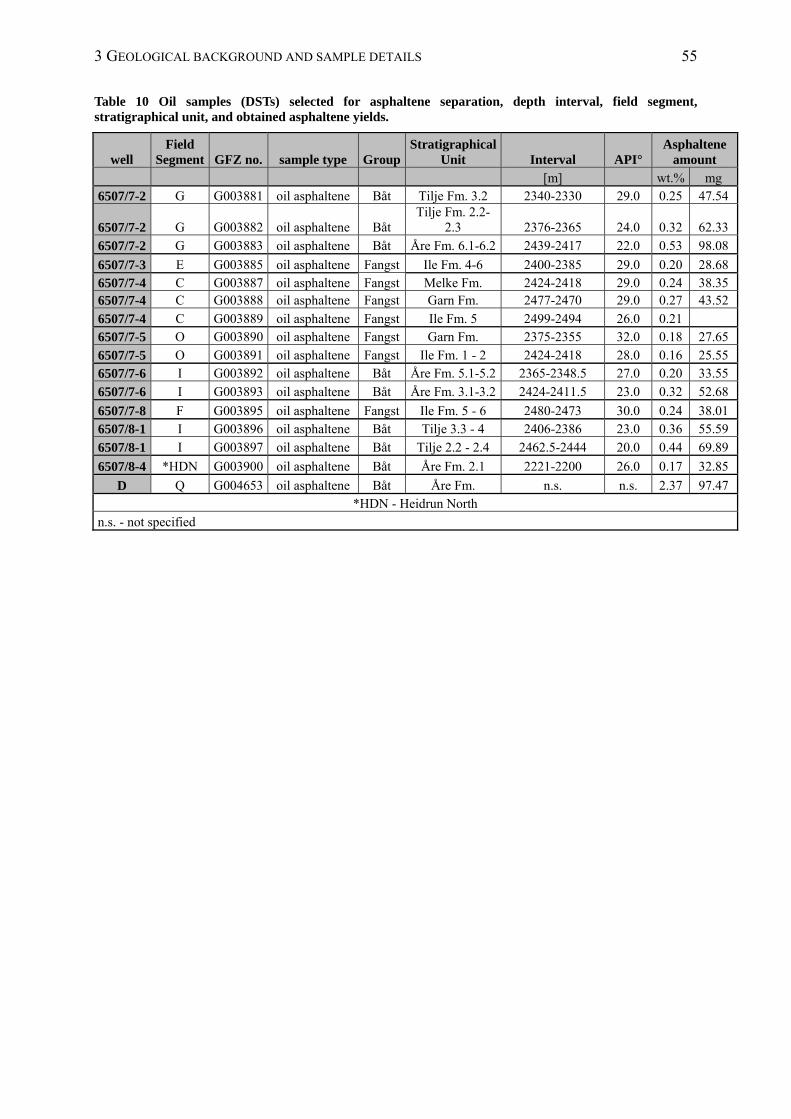
3 GEOLOGICAL BACKGROUND AND SAMPLE DETAILS 55
Table 10 Oil samples (DSTs) selected for asphaltene separation, depth interval, field segment, stratigraphical unit, and obtained asphaltene yields.
well Field
Segment GFZ no. sample type GroupStratigraphical
Unit Interval API° Asphaltene
amount [m] wt.% mg
6507/7-2 G G003881 oil asphaltene Båt Tilje Fm. 3.2 2340-2330 29.0 0.25 47.54
6507/7-2 G G003882 oil asphaltene Båt Tilje Fm. 2.2-
2.3 2376-2365 24.0 0.32 62.33
6507/7-2 G G003883 oil asphaltene Båt Åre Fm. 6.1-6.2 2439-2417 22.0 0.53 98.08
6507/7-3 E G003885 oil asphaltene Fangst Ile Fm. 4-6 2400-2385 29.0 0.20 28.68 6507/7-4 C G003887 oil asphaltene Fangst Melke Fm. 2424-2418 29.0 0.24 38.35 6507/7-4 C G003888 oil asphaltene Fangst Garn Fm. 2477-2470 29.0 0.27 43.52
6507/7-4 C G003889 oil asphaltene Fangst Ile Fm. 5 2499-2494 26.0 0.21 6507/7-5 O G003890 oil asphaltene Fangst Garn Fm. 2375-2355 32.0 0.18 27.65
6507/7-5 O G003891 oil asphaltene Fangst Ile Fm. 1 - 2 2424-2418 28.0 0.16 25.55 6507/7-6 I G003892 oil asphaltene Båt Åre Fm. 5.1-5.2 2365-2348.5 27.0 0.20 33.55
6507/7-6 I G003893 oil asphaltene Båt Åre Fm. 3.1-3.2 2424-2411.5 23.0 0.32 52.68
6507/7-8 F G003895 oil asphaltene Fangst Ile Fm. 5 - 6 2480-2473 30.0 0.24 38.01 6507/8-1 I G003896 oil asphaltene Båt Tilje 3.3 - 4 2406-2386 23.0 0.36 55.59
6507/8-1 I G003897 oil asphaltene Båt Tilje 2.2 - 2.4 2462.5-2444 20.0 0.44 69.89
6507/8-4 *HDN G003900 oil asphaltene Båt Åre Fm. 2.1 2221-2200 26.0 0.17 32.85
D Q G004653 oil asphaltene Båt Åre Fm. n.s. n.s. 2.37 97.47 *HDN - Heidrun North
n.s. - not specified
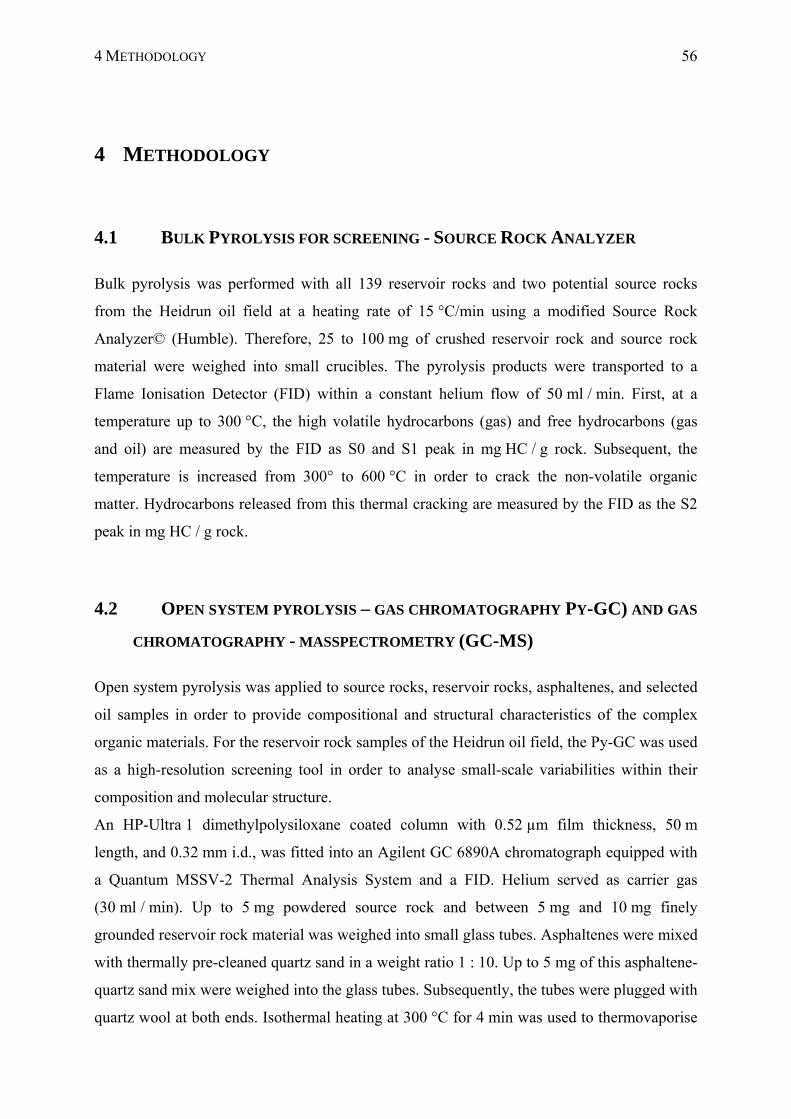
4 METHODOLOGY 56
4 METHODOLOGY
4.1 BULK PYROLYSIS FOR SCREENING - SOURCE ROCK ANALYZER
Bulk pyrolysis was performed with all 139 reservoir rocks and two potential source rocks
from the Heidrun oil field at a heating rate of 15 °C/min using a modified Source Rock
Analyzer© (Humble). Therefore, 25 to 100 mg of crushed reservoir rock and source rock
material were weighed into small crucibles. The pyrolysis products were transported to a
Flame Ionisation Detector (FID) within a constant helium flow of 50 ml / min. First, at a
temperature up to 300 °C, the high volatile hydrocarbons (gas) and free hydrocarbons (gas
and oil) are measured by the FID as S0 and S1 peak in mg HC / g rock. Subsequent, the
temperature is increased from 300° to 600 °C in order to crack the non-volatile organic
matter. Hydrocarbons released from this thermal cracking are measured by the FID as the S2
peak in mg HC / g rock.
4.2 OPEN SYSTEM PYROLYSIS – GAS CHROMATOGRAPHY PY-GC) AND GAS
CHROMATOGRAPHY - MASSPECTROMETRY (GC-MS)
Open system pyrolysis was applied to source rocks, reservoir rocks, asphaltenes, and selected
oil samples in order to provide compositional and structural characteristics of the complex
organic materials. For the reservoir rock samples of the Heidrun oil field, the Py-GC was used
as a high-resolution screening tool in order to analyse small-scale variabilities within their
composition and molecular structure.
An HP-Ultra 1 dimethylpolysiloxane coated column with 0.52 µm film thickness, 50 m
length, and 0.32 mm i.d., was fitted into an Agilent GC 6890A chromatograph equipped with
a Quantum MSSV-2 Thermal Analysis System and a FID. Helium served as carrier gas
(30 ml / min). Up to 5 mg powdered source rock and between 5 mg and 10 mg finely
grounded reservoir rock material was weighed into small glass tubes. Asphaltenes were mixed
with thermally pre-cleaned quartz sand in a weight ratio 1 : 10. Up to 5 mg of this asphaltene-
quartz sand mix were weighed into the glass tubes. Subsequently, the tubes were plugged with
quartz wool at both ends. Isothermal heating at 300 °C for 4 min was used to thermovaporise
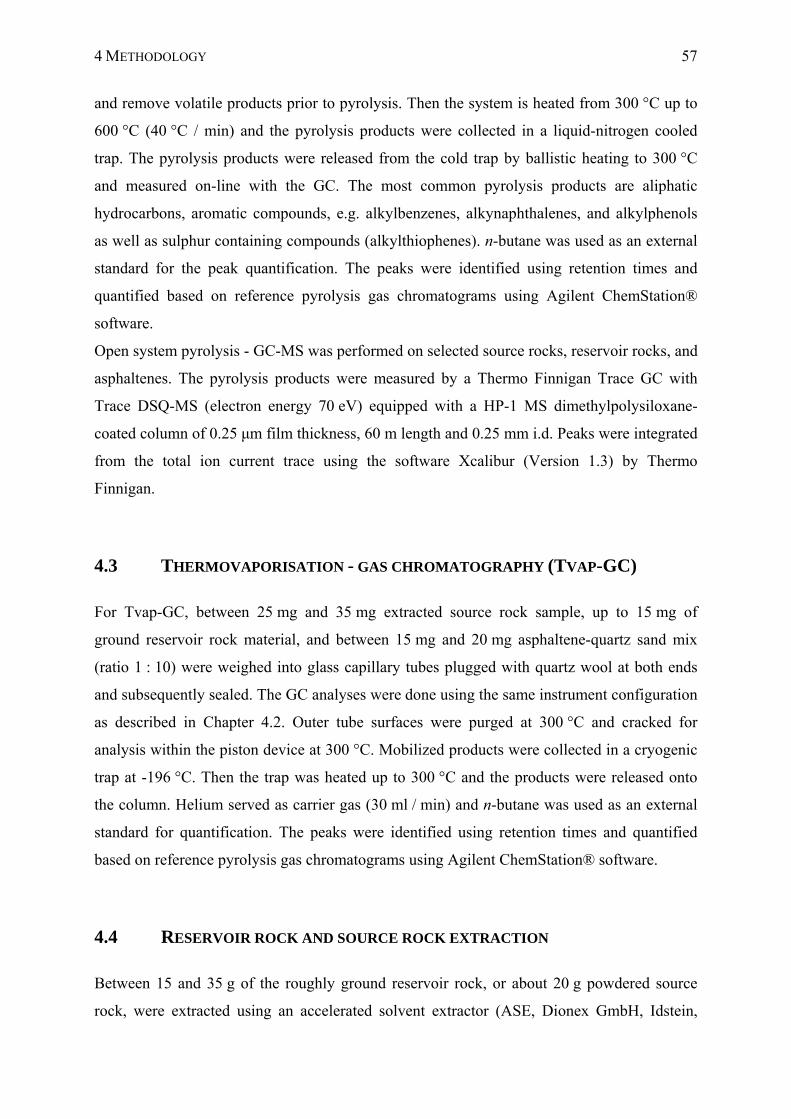
4 METHODOLOGY 57
and remove volatile products prior to pyrolysis. Then the system is heated from 300 °C up to
600 °C (40 °C / min) and the pyrolysis products were collected in a liquid-nitrogen cooled
trap. The pyrolysis products were released from the cold trap by ballistic heating to 300 °C
and measured on-line with the GC. The most common pyrolysis products are aliphatic
hydrocarbons, aromatic compounds, e.g. alkylbenzenes, alkynaphthalenes, and alkylphenols
as well as sulphur containing compounds (alkylthiophenes). n-butane was used as an external
standard for the peak quantification. The peaks were identified using retention times and
quantified based on reference pyrolysis gas chromatograms using Agilent ChemStation®
software.
Open system pyrolysis - GC-MS was performed on selected source rocks, reservoir rocks, and
asphaltenes. The pyrolysis products were measured by a Thermo Finnigan Trace GC with
Trace DSQ-MS (electron energy 70 eV) equipped with a HP-1 MS dimethylpolysiloxane-
coated column of 0.25 μm film thickness, 60 m length and 0.25 mm i.d. Peaks were integrated
from the total ion current trace using the software Xcalibur (Version 1.3) by Thermo
Finnigan.
4.3 THERMOVAPORISATION - GAS CHROMATOGRAPHY (TVAP-GC)
For Tvap-GC, between 25 mg and 35 mg extracted source rock sample, up to 15 mg of
ground reservoir rock material, and between 15 mg and 20 mg asphaltene-quartz sand mix
(ratio 1 : 10) were weighed into glass capillary tubes plugged with quartz wool at both ends
and subsequently sealed. The GC analyses were done using the same instrument configuration
as described in Chapter 4.2. Outer tube surfaces were purged at 300 °C and cracked for
analysis within the piston device at 300 °C. Mobilized products were collected in a cryogenic
trap at -196 °C. Then the trap was heated up to 300 °C and the products were released onto
the column. Helium served as carrier gas (30 ml / min) and n-butane was used as an external
standard for quantification. The peaks were identified using retention times and quantified
based on reference pyrolysis gas chromatograms using Agilent ChemStation® software.
4.4 RESERVOIR ROCK AND SOURCE ROCK EXTRACTION
Between 15 and 35 g of the roughly ground reservoir rock, or about 20 g powdered source
rock, were extracted using an accelerated solvent extractor (ASE, Dionex GmbH, Idstein,
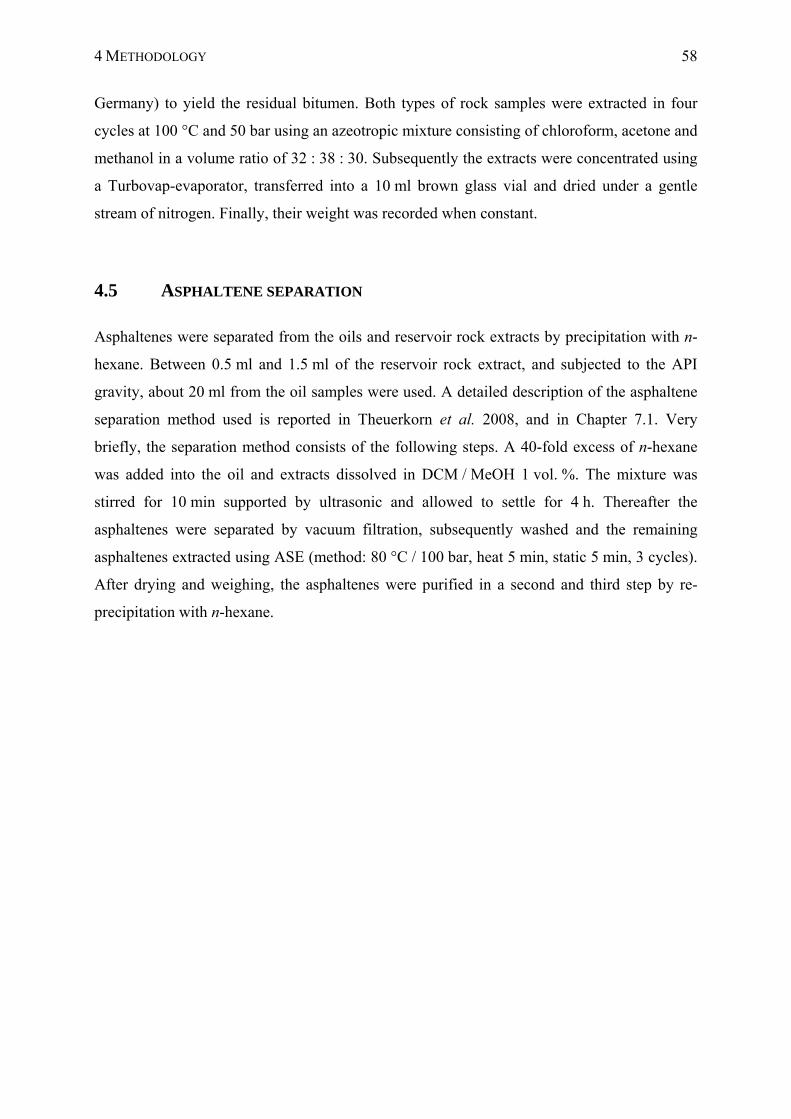
4 METHODOLOGY 58
Germany) to yield the residual bitumen. Both types of rock samples were extracted in four
cycles at 100 °C and 50 bar using an azeotropic mixture consisting of chloroform, acetone and
methanol in a volume ratio of 32 : 38 : 30. Subsequently the extracts were concentrated using
a Turbovap-evaporator, transferred into a 10 ml brown glass vial and dried under a gentle
stream of nitrogen. Finally, their weight was recorded when constant.
4.5 ASPHALTENE SEPARATION
Asphaltenes were separated from the oils and reservoir rock extracts by precipitation with n-
hexane. Between 0.5 ml and 1.5 ml of the reservoir rock extract, and subjected to the API
gravity, about 20 ml from the oil samples were used. A detailed description of the asphaltene
separation method used is reported in Theuerkorn et al. 2008, and in Chapter 7.1. Very
briefly, the separation method consists of the following steps. A 40-fold excess of n-hexane
was added into the oil and extracts dissolved in DCM / MeOH 1 vol. %. The mixture was
stirred for 10 min supported by ultrasonic and allowed to settle for 4 h. Thereafter the
asphaltenes were separated by vacuum filtration, subsequently washed and the remaining
asphaltenes extracted using ASE (method: 80 °C / 100 bar, heat 5 min, static 5 min, 3 cycles).
After drying and weighing, the asphaltenes were purified in a second and third step by re-
precipitation with n-hexane.
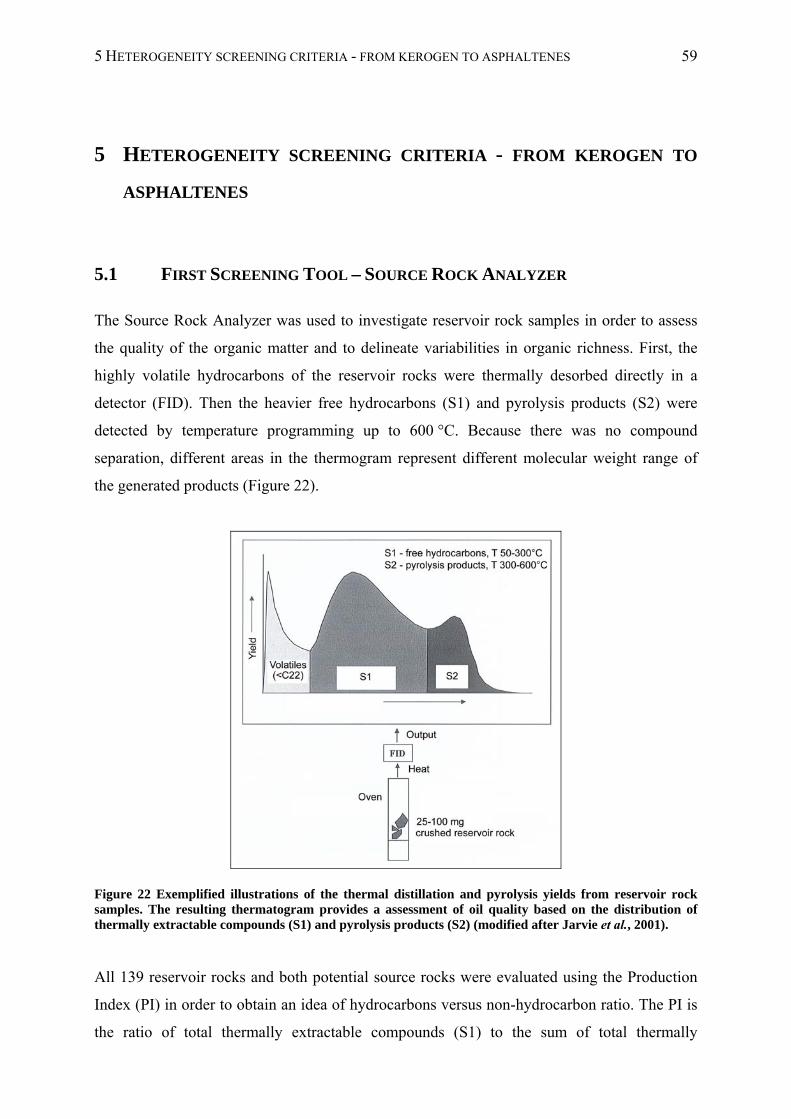
5 HETEROGENEITY SCREENING CRITERIA - FROM KEROGEN TO ASPHALTENES 59
5 HETEROGENEITY SCREENING CRITERIA - FROM KEROGEN TO
ASPHALTENES
5.1 FIRST SCREENING TOOL – SOURCE ROCK ANALYZER
The Source Rock Analyzer was used to investigate reservoir rock samples in order to assess
the quality of the organic matter and to delineate variabilities in organic richness. First, the
highly volatile hydrocarbons of the reservoir rocks were thermally desorbed directly in a
detector (FID). Then the heavier free hydrocarbons (S1) and pyrolysis products (S2) were
detected by temperature programming up to 600 °C. Because there was no compound
separation, different areas in the thermogram represent different molecular weight range of
the generated products (Figure 22).
Figure 22 Exemplified illustrations of the thermal distillation and pyrolysis yields from reservoir rock samples. The resulting thermatogram provides a assessment of oil quality based on the distribution of thermally extractable compounds (S1) and pyrolysis products (S2) (modified after Jarvie et al., 2001).
All 139 reservoir rocks and both potential source rocks were evaluated using the Production
Index (PI) in order to obtain an idea of hydrocarbons versus non-hydrocarbon ratio. The PI is
the ratio of total thermally extractable compounds (S1) to the sum of total thermally
5 HETEROGENEITY SCREENING CRITERIA - FROM KEROGEN TO ASPHALTENES 60
extractable compounds plus pyrolysis products (S1+S2). The S1 represents the free aliphatic
and aromatic hydrocarbons released at a temperature between 50 °C and 300 °C. The polar
and high molecular weight fraction (NSO compounds including asphaltenes) occur mainly in
the S2, which represents the pyrolysis products generated at a temperature between 300 °C
and 600 °C. These assignments were based on the analysis of the MPLC separated single
fractions (aliphatic hydrocarbons, aromatic hydrocarbons, NSO compounds) of the
Norwegian Geochemical Standard North Sea Oil-1 (NGS NSO-1).
A high PI reflect a high hydrocarbon abundance and indicate a good oil quality; on the other
hand low PI reflects a high proportion of non-hydrocarbons (NSO compounds and
asphaltenes) that may indicate lower oil quality. High hydrocarbon concentrations are typical
for free flowing oils, whereas heavier oils (API < 20) will have higher concentrations of non-
hydrocarbons. Attention should be drawn when high molecular weight waxes (C40+ paraffins)
are present as they will elute in the high temperature fraction suggesting a low API gravity oil
(Jarvie et al., 2001). The PI can also be an indicator for in-situ organic matter in the reservoir
rocks if indigenous disseminated kerogen or coal particles are present.
Furthermore, the Source Rock Analyzer was used to delineate variabilities in organic
richness. Therefore, the total petroleum hydrocarbon yield (sum S1 + S2) was quantified as
mg / g rock for each rock sample. The organic richness reflects the distribution of the total
organic matter (OM) within the reservoir and can be a useful marker for oil saturation. Zones
with less OM might inversely be water saturated, because high water saturation is commonly
correlated to low OM content. Applied vice versa, zones rich in OM can point to oil saturated
zones.
5.2 SECOND SCREENING TOOL – PYROLYSIS-GC
Open system pyrolysis - GC (cf. Chapter 4.2) was applied to all 139 reservoir rocks (complete
rock including asphaltenes), both potential source rocks, and 31 single asphaltenes separated
from the reservoir rock residual bitumen. This analysis highlights compositional and
structural heterogeneities in the macromolecular fraction of the OM. The source rocks and the
reservoir rock asphaltenes will assist in the comparison of the structural and compositional
characteristics of the potential parent kerogen with those obtained from whole reservoir rocks.
Prior to pyrolysis, the samples were thermovaporised in order to remove the volatile products
(S1).
5 HETEROGENEITY SCREENING CRITERIA - FROM KEROGEN TO ASPHALTENES 61
The term pyrolysis is defined as “chemical degradation reaction that is induced by thermal
energy alone” (Ericsson & Lattimer, 1989). High temperature pyrolysis in open systems for
short periods (heating rates e.g. 40 °C / min) leads to rapid cracking of OM into smaller
molecular fragments at a temperature range of 300 - 600 °C. The volatile pyrolysis products
released from kerogen are formed according to the same principles as in natural catagenesis,
i.e. thermal cleavage reactions and can be used to predict the composition of petroleum in
nature (Horsfield, 1997). Kerogen and asphaltenes due to their structural similarities (Behar &
Pelet, 1985; Pelet et al., 1986), degrade upon pyrolysis to yield many compound types
including hydrocarbons, ketones, alcohols, nitriles and thiols, which are represented by
saturated and unsaturated, cyclic and acyclic carbon skeletons (Rovere et al., 1983; Wilson et
al., 1983). The most common and identifiable compounds in the pyrolysis gas chromatograms
are aliphatic hydrocarbons (alkane / alk-1ene doublets), aromatic compounds (alkylbenzenes,
alkynaphthalenes, alkylphenols) and sulphur containing compounds (alkylthiophenes). It has
been reported by many authors that kerogen compositions and hence pyrolysate compositions,
depends on the origin of initial organic matter types (I, II and III = marine, lacustrine, deltaic,
terrestrial) and evolutionary stage (e.g. Behar & Vandenbroucke, 1987; Curry & Simpler,
1988; Eglinton et al., 1990; Horsfield, 1989; Larter, 1984; Senftle et al., 1986; van Graas et
al., 1981). Thus the molecular composition and structure of kerogen and asphaltenes is
determined by its biological precursors and the modifications brought about during diagenesis
and catagenesis (Rullkötter & Michaelis, 1990). Some views from these authors concerning
kerogen typing are adopted in this study and applied to pyrolysates from reservoir rocks
including asphaltene.
The most abundant pyrolysis products generated from reservoir rocks are aliphatic
hydrocarbons, aromatic compounds and sulphur containing compounds. They were quantified
and compared for each single well of the Heidrun oil field using representative geochemical
profiles and ternary diagrams to show differences or gradients in their OM composition and to
provide an in-field correlation tool.
Different ratios and parameters were applied based on the following resolved peaks in
pyrolysis gas chromatograms: C1 to n-C5 n-alkanes, n-alk-1-enes and iso-alkanes, and in the
C5+ range n-alkanes / n-alk-1-enes doublets, benzene, toluene, ethylbenzene, styrene, meta-
and para-xylene (1 peak), and ortho-xylene, naphthalene, methylnaphthalenes,
dimethylnaphthalenes, phenol, cresols, thiophene, methylthiophenes, ethylthiophene,
dimethylthiophene and ethylmethylthiophene. All identified peaks are shown in Figure 23.
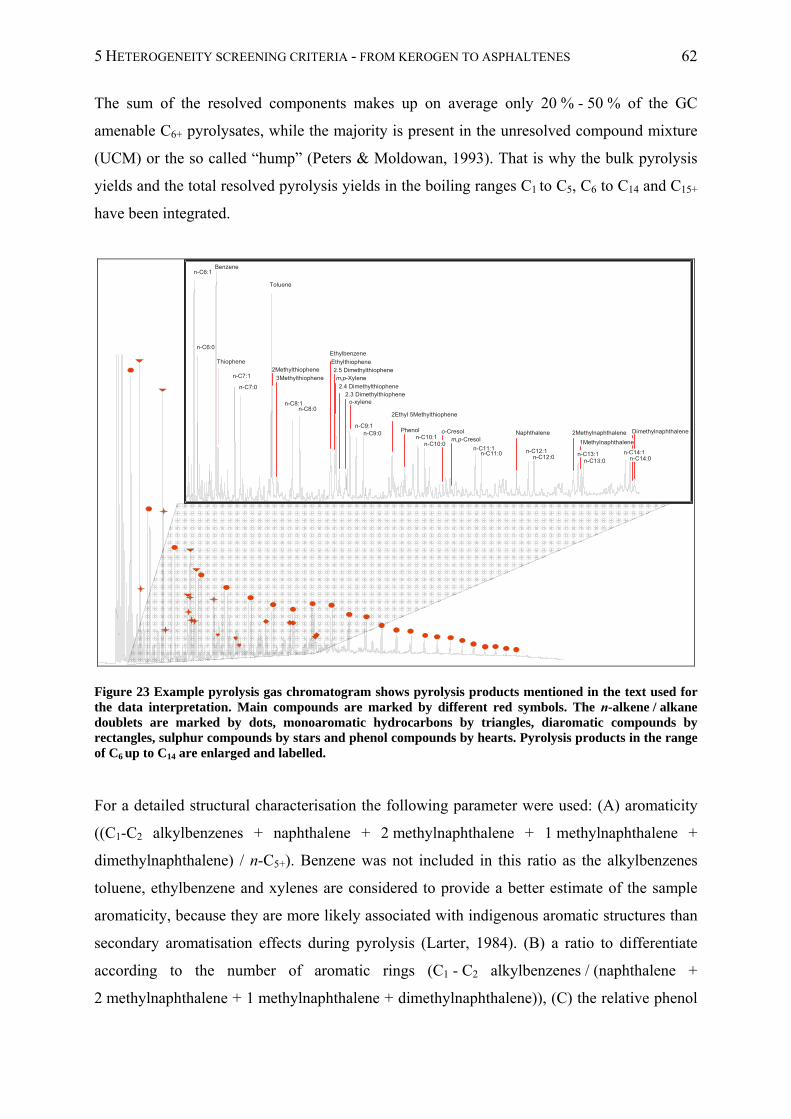
5 HETEROGENEITY SCREENING CRITERIA - FROM KEROGEN TO ASPHALTENES 62
The sum of the resolved components makes up on average only 20 % - 50 % of the GC
amenable C6+ pyrolysates, while the majority is present in the unresolved compound mixture
(UCM) or the so called “hump” (Peters & Moldowan, 1993). That is why the bulk pyrolysis
yields and the total resolved pyrolysis yields in the boiling ranges C1 to C5, C6 to C14 and C15+
have been integrated.
Toluene
Benzene
Thiophene2Methylthiophene
3Methylthiophene
Ethylbenzene
Ethylthiophene2.5 Dimethylthiophenem,p-Xylene2.4 Dimethylthiophene
2.3 Dimethylthiopheneo-xylene
2Ethyl 5Methylthiophene
Phenol o-Cresolm,p-Cresol
Naphthalene 2Methylnaphthalene Dimethylnaphthalene
n-C6:1
n-C6:0
n-C7:1
n-C7:0
n-C8:1n-C8:0
n-C9:0n-C9:1
n-C10:1
n-C11:1 n-C12:1n-C11:0n-C12:0
n-C13:0
n-C14:1n-C14:0
1Methylnaphthalene
n-C13:1
n-C10:0
Figure 23 Example pyrolysis gas chromatogram shows pyrolysis products mentioned in the text used for the data interpretation. Main compounds are marked by different red symbols. The n-alkene / alkane doublets are marked by dots, monoaromatic hydrocarbons by triangles, diaromatic compounds by rectangles, sulphur compounds by stars and phenol compounds by hearts. Pyrolysis products in the range of C6 up to C14 are enlarged and labelled.
For a detailed structural characterisation the following parameter were used: (A) aromaticity
((C1-C2 alkylbenzenes + naphthalene + 2 methylnaphthalene + 1 methylnaphthalene +
dimethylnaphthalene) / n-C5+). Benzene was not included in this ratio as the alkylbenzenes
toluene, ethylbenzene and xylenes are considered to provide a better estimate of the sample
aromaticity, because they are more likely associated with indigenous aromatic structures than
secondary aromatisation effects during pyrolysis (Larter, 1984). (B) a ratio to differentiate
according to the number of aromatic rings (C1 - C2 alkylbenzenes / (naphthalene +
2 methylnaphthalene + 1 methylnaphthalene + dimethylnaphthalene)), (C) the relative phenol
5 HETEROGENEITY SCREENING CRITERIA - FROM KEROGEN TO ASPHALTENES 63
content (phenol / n-C9:0), (D) the gas wetness (C2 - n-C4 / C1 - n-C4), and (E) the gas amount
in % (C1 - n-C5 / C1+ total resolved).
For bulk characterisation the gas to oil ratio (GOR (mg / mg) = bulk C1 - C5 / total resolved
C6+) and the amount of unresolved compound mixtures (UCM % = ((bulk C6+ - resolved C6+)
/ bulk C1+*100) were calculated. Concerning the calculation of the GOR, only the resolved
components (total) in the C6+ boiling range have been used. This approach was shown to be
more accurately resemble the generation characteristics of different types of organic matter
compared to the approach including the hump using the bulk ratio C1 - C5 / C6+
(Düppenbecker & Horsfield, 1990; Horsfield, 1997).
Bulk properties of the reservoir rocks and both potential source rocks are displayed by ternary
diagrams for (A) the alkyl chain length distribution (CLD) after Horsfield (1989), using at its
apices the proportions of total resolved C1 to n-C5 pyrolysates, summed n-alk-1-enes and n-
alkanes in the n-C6 to n-Cl4 range, and summed n-alk-1-enes and n-alkanes in the n-C15+
range. Additionally, (B) for the phenol content after Larter (1984) to characterise terrestrial
organic matter input using m,p-xylene, n-octene and phenol at its apices, and (C - D) for the
sulphur content. Ternary (C) use the relative amount of 2,3 dimethylthiophene in relation to
ortho-xylene and n-nonane after Eglinton et al. (1990), while ternary (D) use the relative
amount of 2,5 dimethylthiophene in relation to toluene and the sum of the n-nonane and
n-pentacosan after di Primio & Horsfield (1996)
Another ternary diagram, based on the work of Sinninghe Damste et al. (1989) and Eglinton
et al. (1992) is presented in Chapter 6.6. This ternary diagram is an attempt to identify
different lipid precursors (carbon skeletons) using organic sulphur pyrolysis products (OSPP)
in order to infer variabilities in the source OM inputs. The analysis of OSPP generated by the
macromolecular OM from reservoir- and source rocks, may yield information about the
relative content of various sulphur-containing structural moieties and thus, point to
contributions from different source organisms. Additionally, connections between different
mature source rock formations might be observed. The basic concept is shown in Figure 24.
Analysing OSPP of macromolecular OM, comprising kerogen, coal, and asphaltenes,
Sinninghe Damste et al. (1989) observed a dominance of specific isomers in the distribution
pattern of low molecular weight alkylthiophenes. These substitution patterns are similar to
those observed in immature bitumen or crude oils, which suggests a relation of the sulphur
containing pyrolysis products to specific alkylthiophene moieties in the kerogen, and
additionally, sulphur incorporation into these macromolecules at specific sites in the lipid
precursor moieties. The author discriminated four groups of sulphur-containing moieties
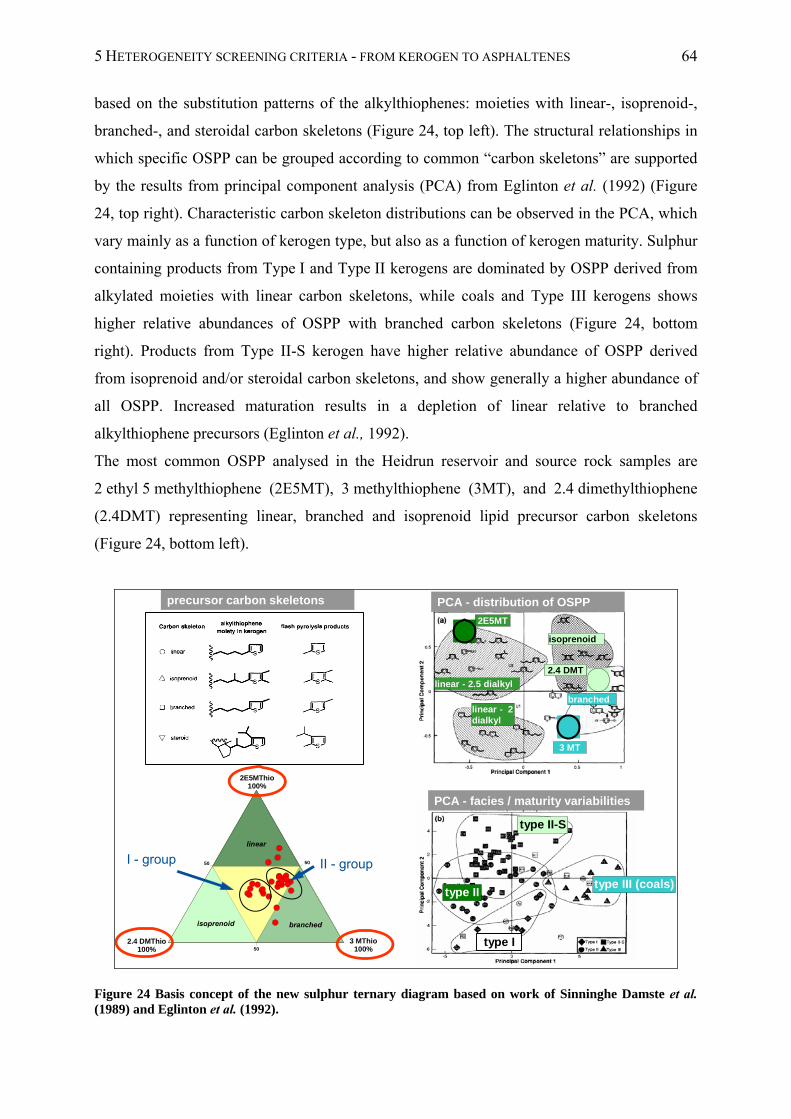
5 HETEROGENEITY SCREENING CRITERIA - FROM KEROGEN TO ASPHALTENES 64
based on the substitution patterns of the alkylthiophenes: moieties with linear-, isoprenoid-,
branched-, and steroidal carbon skeletons (Figure 24, top left). The structural relationships in
which specific OSPP can be grouped according to common “carbon skeletons” are supported
by the results from principal component analysis (PCA) from Eglinton et al. (1992) (Figure
24, top right). Characteristic carbon skeleton distributions can be observed in the PCA, which
vary mainly as a function of kerogen type, but also as a function of kerogen maturity. Sulphur
containing products from Type I and Type II kerogens are dominated by OSPP derived from
alkylated moieties with linear carbon skeletons, while coals and Type III kerogens shows
higher relative abundances of OSPP with branched carbon skeletons (Figure 24, bottom
right). Products from Type II-S kerogen have higher relative abundance of OSPP derived
from isoprenoid and/or steroidal carbon skeletons, and show generally a higher abundance of
all OSPP. Increased maturation results in a depletion of linear relative to branched
alkylthiophene precursors (Eglinton et al., 1992).
The most common OSPP analysed in the Heidrun reservoir and source rock samples are
2 ethyl 5 methylthiophene (2E5MT), 3 methylthiophene (3MT), and 2.4 dimethylthiophene
(2.4DMT) representing linear, branched and isoprenoid lipid precursor carbon skeletons
(Figure 24, bottom left).
precursor carbon skeletons
2E5MT
2.4 DMT
3 MT
type III (coals)type II
type I
type II-S
linear - 2.5 dialkyl
isoprenoid
branched
PCA - distribution of OSPP
PCA - facies / maturity variabilities
50
50
50
3 MThio100%
2E5MThio100%
2.4 DMThio100%
branched
linear
isoprenoid
I - group II - group
linear - 2 dialkyl
Figure 24 Basis concept of the new sulphur ternary diagram based on work of Sinninghe Damste et al. (1989) and Eglinton et al. (1992).
6 RESULTS AND DISCUSSION 65
6 RESULTS AND DISCUSSION
In the following chapter, the results of the heterogeneity screening are presented and
discussed in detail for each single well and individual reservoir formation. At first a general
characterisation of the bulk pyrolysis products of all analysed reservoir rocks and some
general information about their quality are given. Additionally, general source rock
characteristics are presented. In the main part, reservoir rock screening results are described,
including OM composition as well as an interpretation with respect to organofacies and
maturity. Subsequently, the observed heterogeneities are correlated to physical rock properties
from well log data such as permeability, porosity and water saturation as well as to the fluid
physical properties viscosity and API° gravity. Concerning the latter, a biodegradation series
(heavy oils) from the Western Canada Sedimentary Basin (WCSB) and Heidrun oils with
different API gravity were investigated. The heavy oil series was provided by Shell.
6.1 GENERAL CHARACTERISATION
6.1.1 BULK PYROLYSIS PARAMETERS FOR ALL RESERVOIR ROCK SAMPLES
6.1.1.1 PRODUCTION INDEX (PI = (S1 / (S1+S2))
PI bar charts have been used to delineate the heterogeneities of the Heidrun reservoir. Figure
25 shows the PI of all analysed rock samples. Different wells are shown by different coloured
bars independent of their geological formation and field position. Within a single well, the PI
is shown from the well top to the well bottom with increasing depth. The average (av) and
standard deviation (STABW) for the PI are listed in Table X 1 in the appendix.
The average PI of all analysed reservoir rock samples is 0.62 (± 0.13). The NPD wells show a
slightly higher PI (0.64 ± 0.06) compared to the wells from Statoil (0.61 ± 0.15).
Excluding the potential source rock samples, variabilities have been detected comparing the
PI of the single wells. Especially NPD wells show differences in oil quality. Higher oil quality
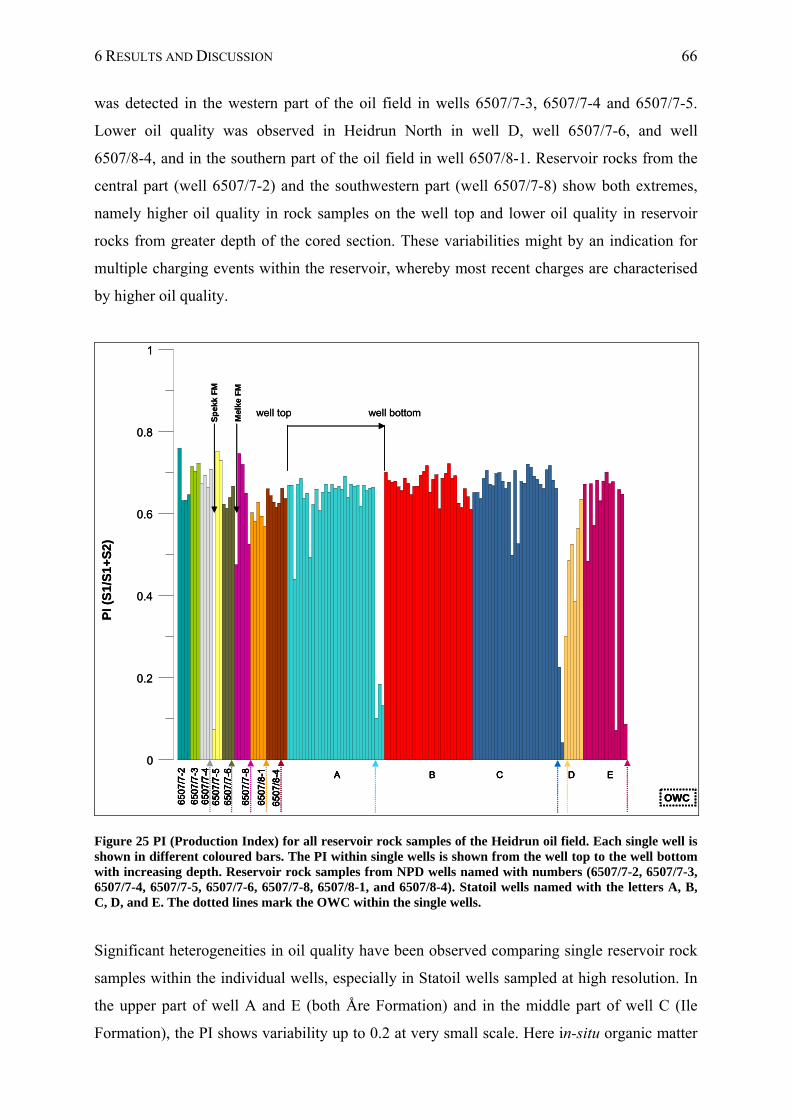
6 RESULTS AND DISCUSSION 66
was detected in the western part of the oil field in wells 6507/7-3, 6507/7-4 and 6507/7-5.
Lower oil quality was observed in Heidrun North in well D, well 6507/7-6, and well
6507/8-4, and in the southern part of the oil field in well 6507/8-1. Reservoir rocks from the
central part (well 6507/7-2) and the southwestern part (well 6507/7-8) show both extremes,
namely higher oil quality in rock samples on the well top and lower oil quality in reservoir
rocks from greater depth of the cored section. These variabilities might by an indication for
multiple charging events within the reservoir, whereby most recent charges are characterised
by higher oil quality.
0
0.2
0.4
0.6
0.8
1
PI
(S1
/S1
+S
2)
well top well bottom
OWC
Sp
ekk
FM
Mel
ke F
M
BA C D E
65
07/
7-3
65
07/
7-2
65
07/
7-4
65
07/
7-5
65
07/
7-6
65
07/
8-1
65
07/
8-4
65
07/
7-8
0
0.2
0.4
0.6
0.8
1
PI
(S1
/S1
+S
2)
well top well bottom
OWCOWC
Sp
ekk
FM
Mel
ke F
M
BA C D E
65
07/
7-3
65
07/
7-2
65
07/
7-4
65
07/
7-5
65
07/
7-6
65
07/
8-1
65
07/
8-4
65
07/
7-8 BA C D EBA C D E
65
07/
7-3
65
07/
7-2
65
07/
7-4
65
07/
7-5
65
07/
7-6
65
07/
8-1
65
07/
8-4
65
07/
7-8
65
07/
7-3
65
07/
7-2
65
07/
7-4
65
07/
7-5
65
07/
7-6
65
07/
8-1
65
07/
8-4
65
07/
7-8
Figure 25 PI (Production Index) for all reservoir rock samples of the Heidrun oil field. Each single well is shown in different coloured bars. The PI within single wells is shown from the well top to the well bottom with increasing depth. Reservoir rock samples from NPD wells named with numbers (6507/7-2, 6507/7-3, 6507/7-4, 6507/7-5, 6507/7-6, 6507/7-8, 6507/8-1, and 6507/8-4). Statoil wells named with the letters A, B, C, D, and E. The dotted lines mark the OWC within the single wells.
Significant heterogeneities in oil quality have been observed comparing single reservoir rock
samples within the individual wells, especially in Statoil wells sampled at high resolution. In
the upper part of well A and E (both Åre Formation) and in the middle part of well C (Ile
Formation), the PI shows variability up to 0.2 at very small scale. Here in-situ organic matter
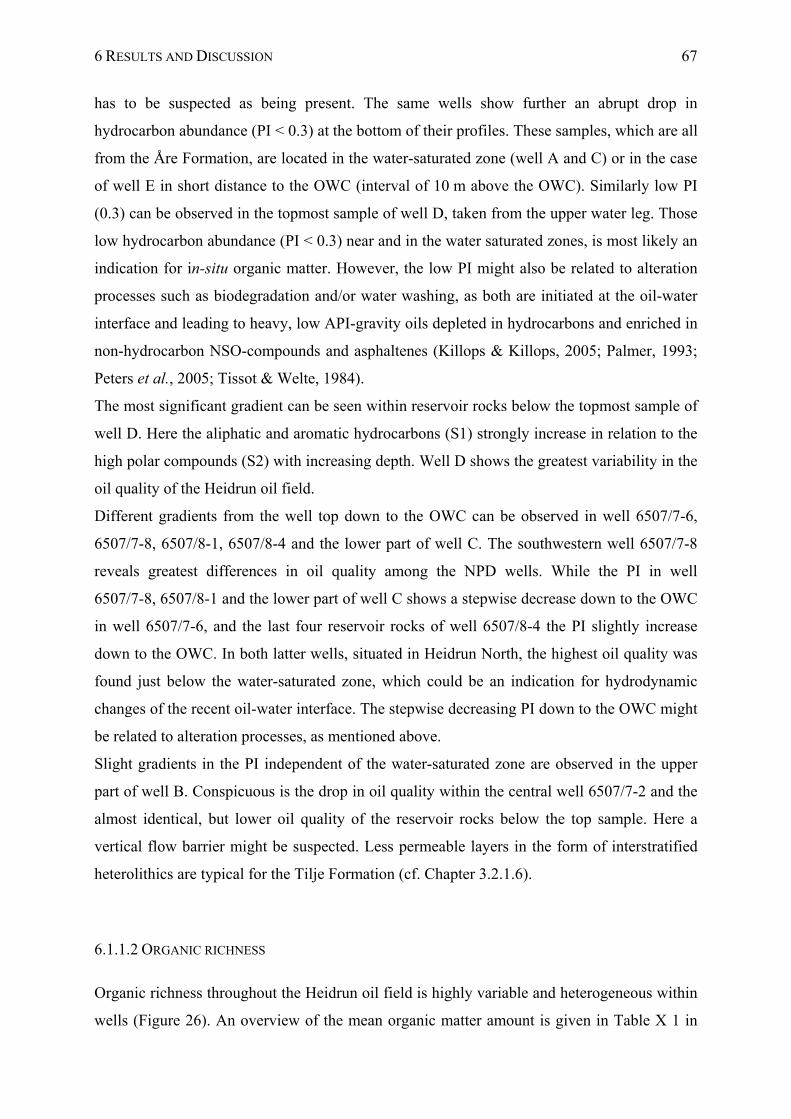
6 RESULTS AND DISCUSSION 67
has to be suspected as being present. The same wells show further an abrupt drop in
hydrocarbon abundance (PI < 0.3) at the bottom of their profiles. These samples, which are all
from the Åre Formation, are located in the water-saturated zone (well A and C) or in the case
of well E in short distance to the OWC (interval of 10 m above the OWC). Similarly low PI
(0.3) can be observed in the topmost sample of well D, taken from the upper water leg. Those
low hydrocarbon abundance (PI < 0.3) near and in the water saturated zones, is most likely an
indication for in-situ organic matter. However, the low PI might also be related to alteration
processes such as biodegradation and/or water washing, as both are initiated at the oil-water
interface and leading to heavy, low API-gravity oils depleted in hydrocarbons and enriched in
non-hydrocarbon NSO-compounds and asphaltenes (Killops & Killops, 2005; Palmer, 1993;
Peters et al., 2005; Tissot & Welte, 1984).
The most significant gradient can be seen within reservoir rocks below the topmost sample of
well D. Here the aliphatic and aromatic hydrocarbons (S1) strongly increase in relation to the
high polar compounds (S2) with increasing depth. Well D shows the greatest variability in the
oil quality of the Heidrun oil field.
Different gradients from the well top down to the OWC can be observed in well 6507/7-6,
6507/7-8, 6507/8-1, 6507/8-4 and the lower part of well C. The southwestern well 6507/7-8
reveals greatest differences in oil quality among the NPD wells. While the PI in well
6507/7-8, 6507/8-1 and the lower part of well C shows a stepwise decrease down to the OWC
in well 6507/7-6, and the last four reservoir rocks of well 6507/8-4 the PI slightly increase
down to the OWC. In both latter wells, situated in Heidrun North, the highest oil quality was
found just below the water-saturated zone, which could be an indication for hydrodynamic
changes of the recent oil-water interface. The stepwise decreasing PI down to the OWC might
be related to alteration processes, as mentioned above.
Slight gradients in the PI independent of the water-saturated zone are observed in the upper
part of well B. Conspicuous is the drop in oil quality within the central well 6507/7-2 and the
almost identical, but lower oil quality of the reservoir rocks below the top sample. Here a
vertical flow barrier might be suspected. Less permeable layers in the form of interstratified
heterolithics are typical for the Tilje Formation (cf. Chapter 3.2.1.6).
6.1.1.2 ORGANIC RICHNESS
Organic richness throughout the Heidrun oil field is highly variable and heterogeneous within
wells (Figure 26). An overview of the mean organic matter amount is given in Table X 1 in
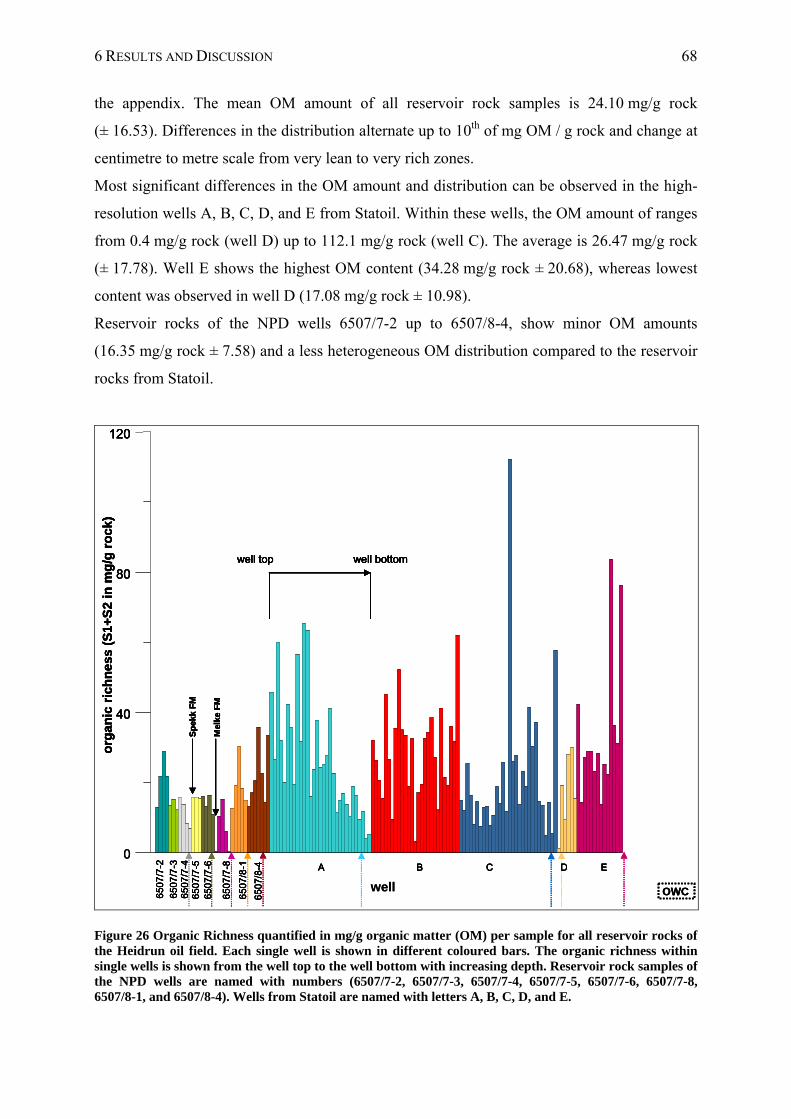
6 RESULTS AND DISCUSSION 68
the appendix. The mean OM amount of all reservoir rock samples is 24.10 mg/g rock
(± 16.53). Differences in the distribution alternate up to 10th of mg OM / g rock and change at
centimetre to metre scale from very lean to very rich zones.
Most significant differences in the OM amount and distribution can be observed in the high-
resolution wells A, B, C, D, and E from Statoil. Within these wells, the OM amount of ranges
from 0.4 mg/g rock (well D) up to 112.1 mg/g rock (well C). The average is 26.47 mg/g rock
(± 17.78). Well E shows the highest OM content (34.28 mg/g rock ± 20.68), whereas lowest
content was observed in well D (17.08 mg/g rock ± 10.98).
Reservoir rocks of the NPD wells 6507/7-2 up to 6507/8-4, show minor OM amounts
(16.35 mg/g rock ± 7.58) and a less heterogeneous OM distribution compared to the reservoir
rocks from Statoil.
well OWC
0
40
80
120
org
an
ic r
ich
ne
ss (
S1+
S2
in
mg
/g r
oc
k)
well top well bottom
Sp
ekk
FM
Mel
ke F
M
BA C D E
650
7/7-
3
650
7/7-
2
6507
/7-4
6507
/7-5
6507
/7-6
650
7/8
-1
650
7/8-
4
650
7/7
-8
well OWCOWC
0
40
80
120
org
an
ic r
ich
ne
ss (
S1+
S2
in
mg
/g r
oc
k)
well top well bottom
Sp
ekk
FM
Mel
ke F
M
0
40
80
120
org
an
ic r
ich
ne
ss (
S1+
S2
in
mg
/g r
oc
k)
well top well bottom
Sp
ekk
FM
Mel
ke F
M
40
80
120
org
an
ic r
ich
ne
ss (
S1+
S2
in
mg
/g r
oc
k)
well top well bottomwell top well bottom
Sp
ekk
FM
Mel
ke F
M
BA C D E
650
7/7-
3
650
7/7-
2
6507
/7-4
6507
/7-5
6507
/7-6
650
7/8
-1
650
7/8-
4
650
7/7
-8 BA C D EBA C D E
650
7/7-
3
650
7/7-
2
6507
/7-4
6507
/7-5
6507
/7-6
650
7/8
-1
650
7/8-
4
650
7/7
-8
650
7/7-
3
650
7/7-
2
6507
/7-4
6507
/7-5
6507
/7-6
650
7/8
-1
650
7/8-
4
650
7/7
-8
Figure 26 Organic Richness quantified in mg/g organic matter (OM) per sample for all reservoir rocks of the Heidrun oil field. Each single well is shown in different coloured bars. The organic richness within single wells is shown from the well top to the well bottom with increasing depth. Reservoir rock samples of the NPD wells are named with numbers (6507/7-2, 6507/7-3, 6507/7-4, 6507/7-5, 6507/7-6, 6507/7-8, 6507/8-1, and 6507/8-4). Wells from Statoil are named with letters A, B, C, D, and E.
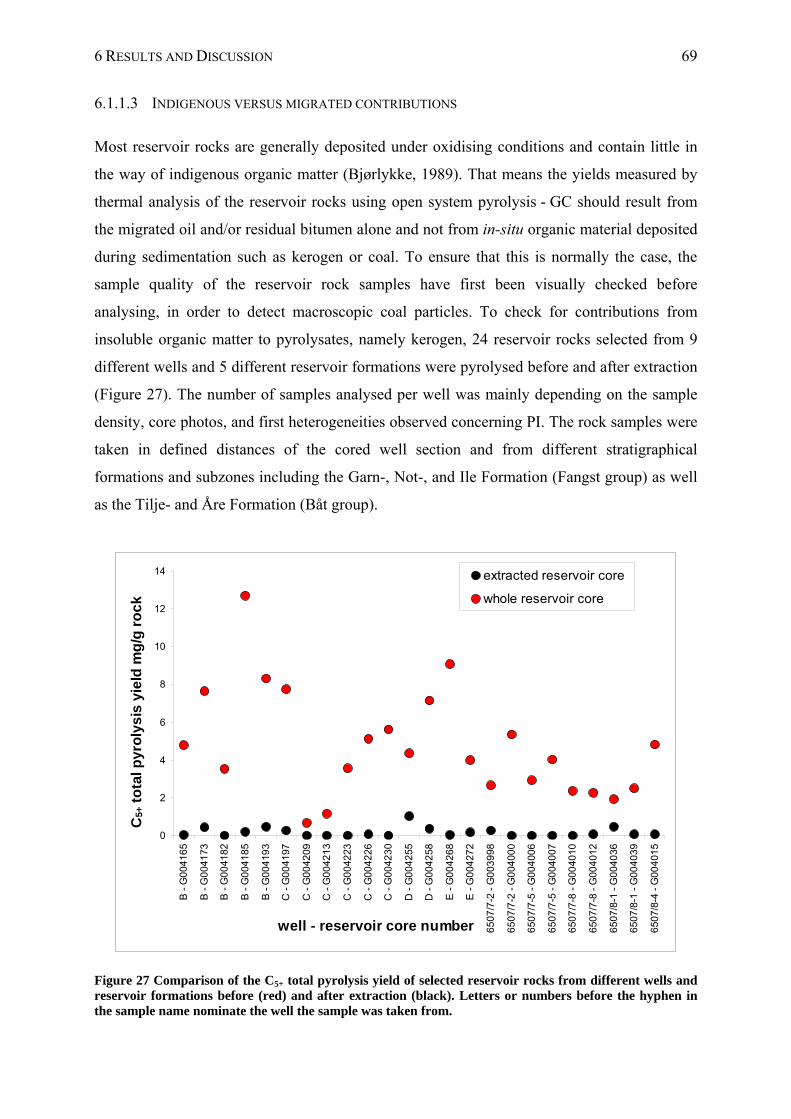
6 RESULTS AND DISCUSSION 69
6.1.1.3 INDIGENOUS VERSUS MIGRATED CONTRIBUTIONS
Most reservoir rocks are generally deposited under oxidising conditions and contain little in
the way of indigenous organic matter (Bjørlykke, 1989). That means the yields measured by
thermal analysis of the reservoir rocks using open system pyrolysis - GC should result from
the migrated oil and/or residual bitumen alone and not from in-situ organic material deposited
during sedimentation such as kerogen or coal. To ensure that this is normally the case, the
sample quality of the reservoir rock samples have first been visually checked before
analysing, in order to detect macroscopic coal particles. To check for contributions from
insoluble organic matter to pyrolysates, namely kerogen, 24 reservoir rocks selected from 9
different wells and 5 different reservoir formations were pyrolysed before and after extraction
(Figure 27). The number of samples analysed per well was mainly depending on the sample
density, core photos, and first heterogeneities observed concerning PI. The rock samples were
taken in defined distances of the cored well section and from different stratigraphical
formations and subzones including the Garn-, Not-, and Ile Formation (Fangst group) as well
as the Tilje- and Åre Formation (Båt group).
0
2
4
6
8
10
12
14
B -
G0
041
65
B -
G0
041
73
B -
G0
041
82
B -
G0
041
85
B -
G0
0419
3
C -
G0
041
97
C -
G0
042
09
C -
G0
042
13
C -
G0
042
23
C -
G0
042
26
C -
G0
042
30
D -
G0
042
55
D -
G0
042
58
E -
G0
042
68
E -
G0
0427
2
65
07/7
-2 -
G0
039
98
65
07/7
-2 -
G0
0400
0
650
7/7-
5 -
G00
400
6
65
07/7
-5 -
G0
040
07
650
7/7
-8 -
G00
401
0
650
7/7-
8 -
G00
401
2
65
07/8
-1 -
G0
040
36
650
7/8
-1 -
G00
403
9
650
7/8-
4 -
G00
401
5
well - reservoir core number
C5+
to
tal p
yro
lys
is y
ield
mg
/g r
oc
k
extracted reservoir core
whole reservoir core
Figure 27 Comparison of the C5+ total pyrolysis yield of selected reservoir rocks from different wells and reservoir formations before (red) and after extraction (black). Letters or numbers before the hyphen in the sample name nominate the well the sample was taken from.
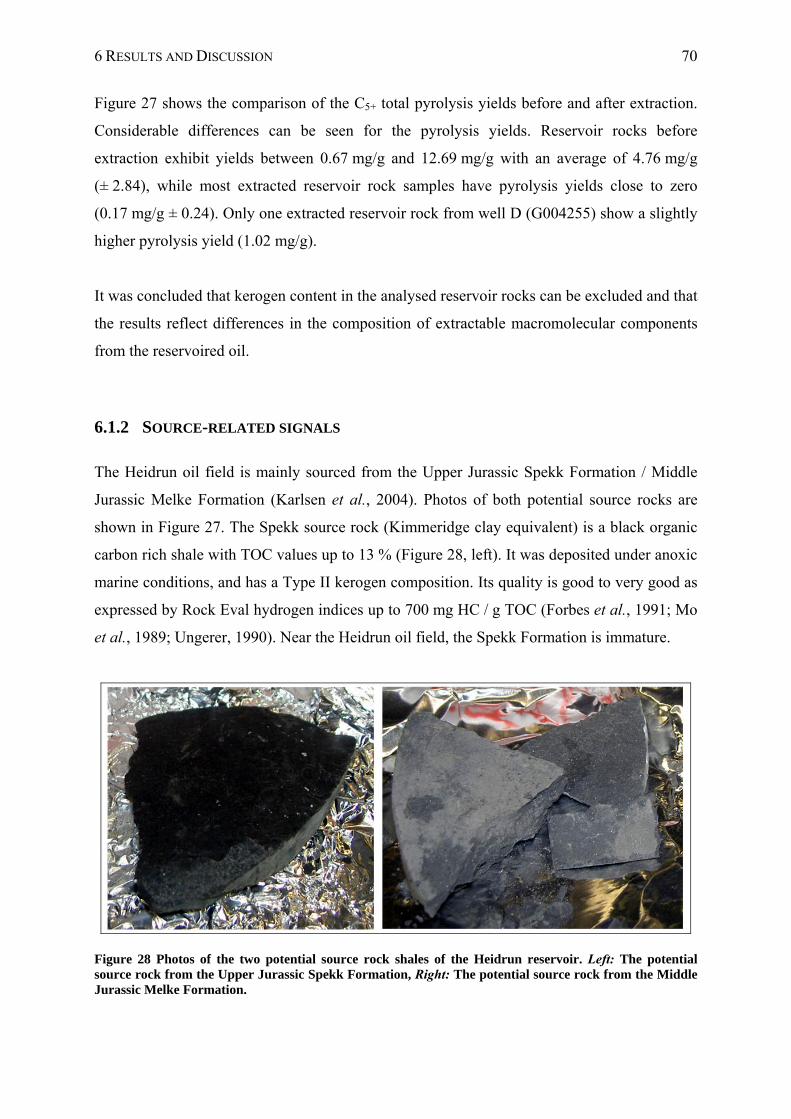
6 RESULTS AND DISCUSSION 70
Figure 27 shows the comparison of the C5+ total pyrolysis yields before and after extraction.
Considerable differences can be seen for the pyrolysis yields. Reservoir rocks before
extraction exhibit yields between 0.67 mg/g and 12.69 mg/g with an average of 4.76 mg/g
(± 2.84), while most extracted reservoir rock samples have pyrolysis yields close to zero
(0.17 mg/g ± 0.24). Only one extracted reservoir rock from well D (G004255) show a slightly
higher pyrolysis yield (1.02 mg/g).
It was concluded that kerogen content in the analysed reservoir rocks can be excluded and that
the results reflect differences in the composition of extractable macromolecular components
from the reservoired oil.
6.1.2 SOURCE-RELATED SIGNALS
The Heidrun oil field is mainly sourced from the Upper Jurassic Spekk Formation / Middle
Jurassic Melke Formation (Karlsen et al., 2004). Photos of both potential source rocks are
shown in Figure 27. The Spekk source rock (Kimmeridge clay equivalent) is a black organic
carbon rich shale with TOC values up to 13 % (Figure 28, left). It was deposited under anoxic
marine conditions, and has a Type II kerogen composition. Its quality is good to very good as
expressed by Rock Eval hydrogen indices up to 700 mg HC / g TOC (Forbes et al., 1991; Mo
et al., 1989; Ungerer, 1990). Near the Heidrun oil field, the Spekk Formation is immature.
Figure 28 Photos of the two potential source rock shales of the Heidrun reservoir. Left: The potential source rock from the Upper Jurassic Spekk Formation, Right: The potential source rock from the Middle Jurassic Melke Formation.
6 RESULTS AND DISCUSSION 71
The underlying Melke Formation source rock (Heather Formation equivalent) is lighter in
colour (Figure 28, right). In general, the Melke Formation is a leaner source rock (lower
potential) with a mixed marine-terrestrial Type II / III kerogen, and averaging TOC of ~ 2%
and HI of ~ 200 mg HC/g TOC, which are both distinctly lower compared to the Spekk
Formation source rock (Forbes et al., 1991).
6.1.2.1 PRODUCTION INDEX
The potential source rocks from the Spekk Formation (well 6507/7-5) and Melke Formation
(well 6507/7-8) are characterised by PIs of 0.07 and 0.47, respectively (Figure 25, Table X 1).
The Spekk Formation source rock shows lowest PI that is characteristic for its low maturity
mentioned above in Chapter 6.1.2. The low S1 reflect low amounts of hydrocarbons that are
already present in the source rock in a free or an adsorbed state. Based on the PI alone, the
Melke Formation source rock indicates a distinctly higher maturity compared to the Spekk
Formation. Additionally, the differences observed point to lithofacies differences in both
source rocks.
6.1.2.2 ORGANIC RICHNESS
The organic matter content of the Spekk Fm. source rock (15.74 mg OM/g rock) is
comparable to the mean organic matter amount observed in the analysed reservoir rock
samples from the NPD wells (15.9 mg/g ± 7.85) (Figure 26, Table X 1). Compared to Spekk
Fm., the Melke Fm. source rock shows an organic matter content nearly zero (0.09 mg OM/g
rock). This might be explained by quality variability within the underlying Melke Formation
mentioned in Chapter 6.1.2.
6 RESULTS AND DISCUSSION 72
6.2 CHARACTERISATION OF THE SINGLE PROFILES IN THE EASTERN PART
OF THE HEIDRUN OIL FIELD
6.2.1 WELL C IN SEGMENT J (GARN FM., ILE FM. 6-2, NOT FM., ÅRE FM. 1)
6.2.1.1 PRODUCTION INDEX AND ORGANIC RICHNESS
The sampled section in well C comprises the Garn-, Not-, Ile- and Åre Formation (Table 2).
The average PI is 0.63 (± 0.15) (Figure 25, Table X 1 in the appendix). The Garn and Ile
Formation reservoir rocks show a similar average oil quality with values of 0.67 ± 0.02 and
0.67 ± 0.06, respectively. The Ile samples, G004217 and G004219 from the middle of profile
C exhibit lower hydrocarbon abundance with PI of 0.50 and 0.53, which indicate the presence
of in-situ organic matter. Below these samples, in reservoir rocks from the Ile Fm. 4 and Ile
Fm. 2, the PI decreases stepwise. In the latter formation unit, the PI decreases stepwise
towards the ODT contact. Both Åre Formation samples at the bottom of the profile show an
abrupt drop in oil quality. They are below the ODT contact in the water-saturated zone and
show with PI of 0.23 and 0.04 the lowest hydrocarbon abundance within profile C. This low
oil quality indicates a significant content of high polar compounds and refers to in-situ
organic matter present in these reservoir rocks. However, a relation of low PI and higher
water saturation cannot be excluded.
Well C is characterised by a lower content of organic matter and minor differences in their
distribution in the upper part (Garn Fm. and Not Fm.), compared to the lower part with
organic rich samples and significant changes in the organic matter distribution (Ile Fm. and
Åre Fm.), (Figure 26). Regarding the stratigraphical units, an increase in organic matter
content was observed in the order of Garn-, Ile-, Not- and Åre Formation (Table X 1).
Two reservoir rocks, one in the middle (Ile Fm.) and the last one at the bottom of profile C
(Åre Fm.) have very high organic matter contents. The sample in the middle presents the
highest content of all analysed reservoir rocks. The lowest organic matter content was found
in two reservoir rocks (Ile Fm. and Åre Fm.) near the ODT contact. This might be a pointer to
low oil saturation near the water-saturated zone.
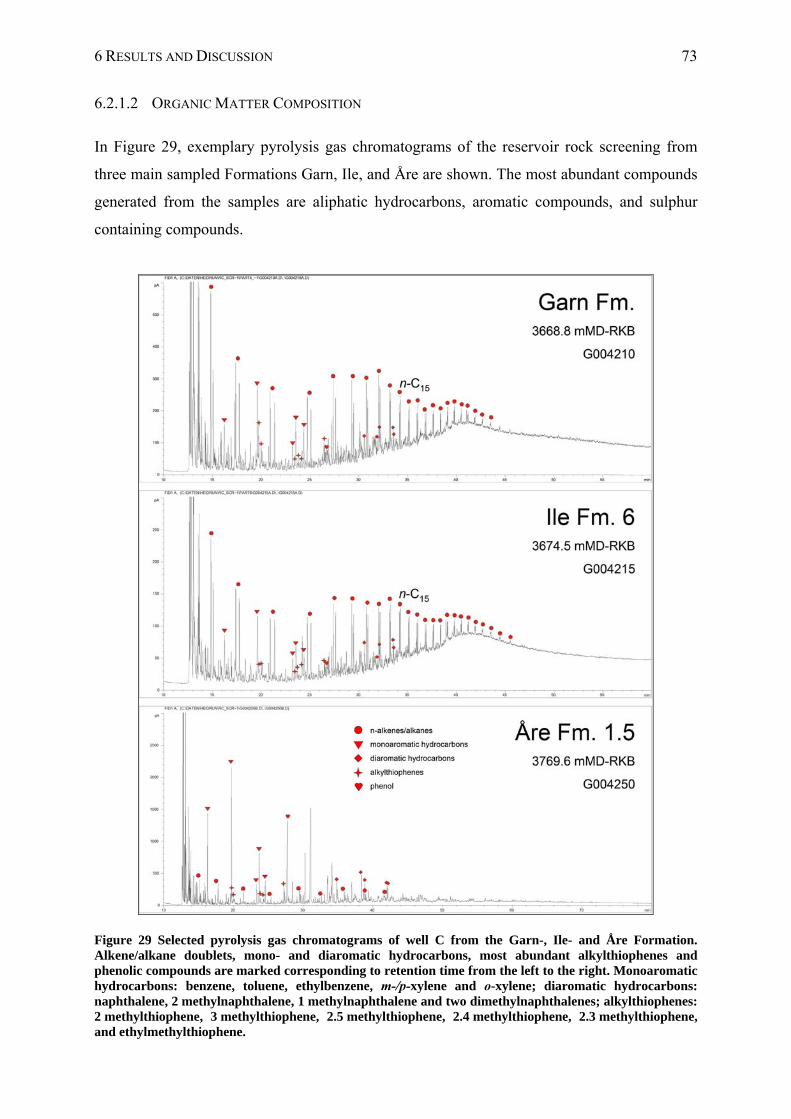
6 RESULTS AND DISCUSSION 73
6.2.1.2 ORGANIC MATTER COMPOSITION
In Figure 29, exemplary pyrolysis gas chromatograms of the reservoir rock screening from
three main sampled Formations Garn, Ile, and Åre are shown. The most abundant compounds
generated from the samples are aliphatic hydrocarbons, aromatic compounds, and sulphur
containing compounds.
Figure 29 Selected pyrolysis gas chromatograms of well C from the Garn-, Ile- and Åre Formation. Alkene/alkane doublets, mono- and diaromatic hydrocarbons, most abundant alkylthiophenes and phenolic compounds are marked corresponding to retention time from the left to the right. Monoaromatic hydrocarbons: benzene, toluene, ethylbenzene, m-/p-xylene and o-xylene; diaromatic hydrocarbons: naphthalene, 2 methylnaphthalene, 1 methylnaphthalene and two dimethylnaphthalenes; alkylthiophenes: 2 methylthiophene, 3 methylthiophene, 2.5 methylthiophene, 2.4 methylthiophene, 2.3 methylthiophene, and ethylmethylthiophene.
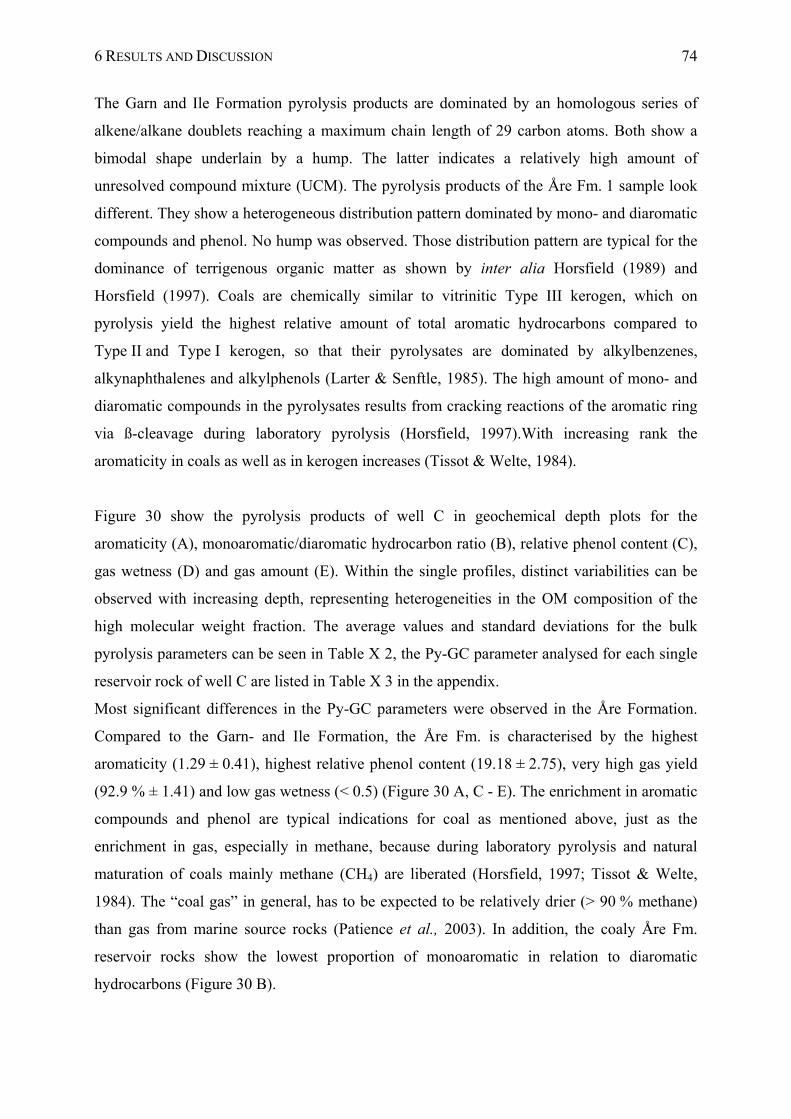
6 RESULTS AND DISCUSSION 74
The Garn and Ile Formation pyrolysis products are dominated by an homologous series of
alkene/alkane doublets reaching a maximum chain length of 29 carbon atoms. Both show a
bimodal shape underlain by a hump. The latter indicates a relatively high amount of
unresolved compound mixture (UCM). The pyrolysis products of the Åre Fm. 1 sample look
different. They show a heterogeneous distribution pattern dominated by mono- and diaromatic
compounds and phenol. No hump was observed. Those distribution pattern are typical for the
dominance of terrigenous organic matter as shown by inter alia Horsfield (1989) and
Horsfield (1997). Coals are chemically similar to vitrinitic Type III kerogen, which on
pyrolysis yield the highest relative amount of total aromatic hydrocarbons compared to
Type II and Type I kerogen, so that their pyrolysates are dominated by alkylbenzenes,
alkynaphthalenes and alkylphenols (Larter & Senftle, 1985). The high amount of mono- and
diaromatic compounds in the pyrolysates results from cracking reactions of the aromatic ring
via ß-cleavage during laboratory pyrolysis (Horsfield, 1997).With increasing rank the
aromaticity in coals as well as in kerogen increases (Tissot & Welte, 1984).
Figure 30 show the pyrolysis products of well C in geochemical depth plots for the
aromaticity (A), monoaromatic/diaromatic hydrocarbon ratio (B), relative phenol content (C),
gas wetness (D) and gas amount (E). Within the single profiles, distinct variabilities can be
observed with increasing depth, representing heterogeneities in the OM composition of the
high molecular weight fraction. The average values and standard deviations for the bulk
pyrolysis parameters can be seen in Table X 2, the Py-GC parameter analysed for each single
reservoir rock of well C are listed in Table X 3 in the appendix.
Most significant differences in the Py-GC parameters were observed in the Åre Formation.
Compared to the Garn- and Ile Formation, the Åre Fm. is characterised by the highest
aromaticity (1.29 ± 0.41), highest relative phenol content (19.18 ± 2.75), very high gas yield
(92.9 % ± 1.41) and low gas wetness (< 0.5) (Figure 30 A, C - E). The enrichment in aromatic
compounds and phenol are typical indications for coal as mentioned above, just as the
enrichment in gas, especially in methane, because during laboratory pyrolysis and natural
maturation of coals mainly methane (CH4) are liberated (Horsfield, 1997; Tissot & Welte,
1984). The “coal gas” in general, has to be expected to be relatively drier (> 90 % methane)
than gas from marine source rocks (Patience et al., 2003). In addition, the coaly Åre Fm.
reservoir rocks show the lowest proportion of monoaromatic in relation to diaromatic
hydrocarbons (Figure 30 B).
6 RESULTS AND DISCUSSION 75
Most of the Garn-, Not- and Ile Formation reservoir rocks show phenol ratios below 1,
excepting two Garn Fm. samples (G004199, G004202) and two Ile Fm. 6 samples (G004217,
G004219). Thus, it was concluded that an elevated phenol ratio > 1 indicates a greater extent
of terrestrial organic matter input, and refers to disseminated coal, which was found in six
samples of the analysed reservoir rocks in well C (2 x Garn Fm., 2 x Ile Fm., 2 x Åre Fm.).
A B C
D EGarn Fm.Not Fm.Ile Fm. 6Ile Fm. 3-5Ile Fm. 2Åre Fm. 1
B
0 0.4 0.8 1.2 1.6 2
3780
3760
3740
3720
3700
3680
3660
3640
0 1 2 3 4 5
3780
3760
3740
3720
3700
3680
3660
3640
0 2 4 6 16 18 20 22 24
3780
3760
3740
3720
3700
3680
3660
3640
50 60 70 80 90 100
3780
3760
3740
3720
3700
3680
3660
3640
0 0.2 0.4 0.6 0.8 1
3780
3760
3740
3720
3700
3680
3660
3640
de
pth
(m
MD
-RK
B)
aromaticityC1 – C2 alkylbenzenes + 2MN + 1MN + DMN / n-C5+
monoaromatic / diaromatic hydrocarbonsC1 – C2 alkylbenzenes / N + 2MN + 1MN + DMN
phenol / n-C9:0
C1 – C5 (%)C2 – C4 / C1 – C4
dep
th (
m M
D-R
KB
)
dep
th (
m M
D-R
KB
)
de
pth
(m
MD
-RK
B)
dep
th (
m M
D-R
KB
)
ODT at 3712 m MD-RKBODT at 3712 m MD-RKB ODT at 3712 m MD-RKBODT at 3712 m MD-RKB ODT at 3712 m MD-RKBODT at 3712 m MD-RKB
ODT at 3712 m MD-RKBODT at 3712 m MD-RKBODT at 3712 m MD-RKBODT at 3712 m MD-RKB
Figure 30 Geochemical profiles showing pyrolysis-GC products from the reservoir rock screening of well C. From A to E the aromaticity (A), monoaromatic/diaromatic hydrocarbon ratio (B), relative phenol amount (C), gas wetness (D) and gas amount (E) are shown.
The aromaticity of all analysed reservoir rocks ranges between 0.12 - 1.57 (Figure 30 A).
Highest aromaticity was observed in the Åre Fm. (coals), while reservoir rocks from the Garn
Fm. and Ile Fm. present distinctly lower aromaticity. The average aromaticity in the Garn Fm.
is about 0.24 (± 0.05). Reservoir rocks from the Ile Fm. present a similar average aromaticity
(0.24), but a higher standard deviation (± 0.13) compared to the Garn Formation. Two
reservoir rocks from the Ile Fm. 6 (G004217, G004219) exhibit a higher aromaticity about
0.43 and 0.54.
In both formations, an decrease in aromaticity with increasing depth was observed. This
might be an indication for changes in maturity, as with increasing rank the aromaticity of coal
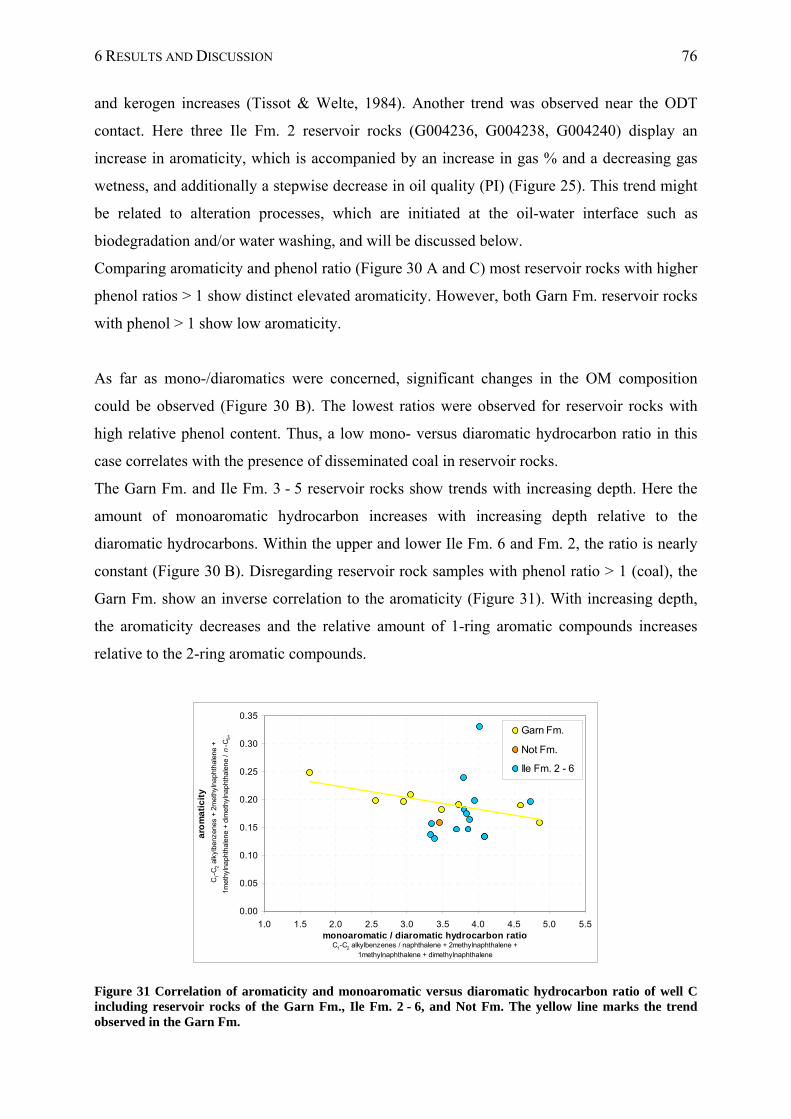
6 RESULTS AND DISCUSSION 76
and kerogen increases (Tissot & Welte, 1984). Another trend was observed near the ODT
contact. Here three Ile Fm. 2 reservoir rocks (G004236, G004238, G004240) display an
increase in aromaticity, which is accompanied by an increase in gas % and a decreasing gas
wetness, and additionally a stepwise decrease in oil quality (PI) (Figure 25). This trend might
be related to alteration processes, which are initiated at the oil-water interface such as
biodegradation and/or water washing, and will be discussed below.
Comparing aromaticity and phenol ratio (Figure 30 A and C) most reservoir rocks with higher
phenol ratios > 1 show distinct elevated aromaticity. However, both Garn Fm. reservoir rocks
with phenol > 1 show low aromaticity.
As far as mono-/diaromatics were concerned, significant changes in the OM composition
could be observed (Figure 30 B). The lowest ratios were observed for reservoir rocks with
high relative phenol content. Thus, a low mono- versus diaromatic hydrocarbon ratio in this
case correlates with the presence of disseminated coal in reservoir rocks.
The Garn Fm. and Ile Fm. 3 - 5 reservoir rocks show trends with increasing depth. Here the
amount of monoaromatic hydrocarbon increases with increasing depth relative to the
diaromatic hydrocarbons. Within the upper and lower Ile Fm. 6 and Fm. 2, the ratio is nearly
constant (Figure 30 B). Disregarding reservoir rock samples with phenol ratio > 1 (coal), the
Garn Fm. show an inverse correlation to the aromaticity (Figure 31). With increasing depth,
the aromaticity decreases and the relative amount of 1-ring aromatic compounds increases
relative to the 2-ring aromatic compounds.
0.00
0.05
0.10
0.15
0.20
0.25
0.30
0.35
1.0 1.5 2.0 2.5 3.0 3.5 4.0 4.5 5.0 5.5monoaromatic / diaromatic hydrocarbon ratio
C1-C2 alkylbenzenes / naphthalene + 2methylnaphthalene + 1methylnaphthalene + dimethylnaphthalene
aro
ma
tic
ity
C
1-C
2 a
lkyl
benz
enes
+ 2
met
hyln
apht
hale
ne +
1met
hyln
apht
hale
ne +
dim
ethy
lnap
htha
lene
/ n
-C5
+
Garn Fm.
Not Fm.
Ile Fm. 2 - 6
Figure 31 Correlation of aromaticity and monoaromatic versus diaromatic hydrocarbon ratio of well C including reservoir rocks of the Garn Fm., Ile Fm. 2 - 6, and Not Fm. The yellow line marks the trend observed in the Garn Fm.
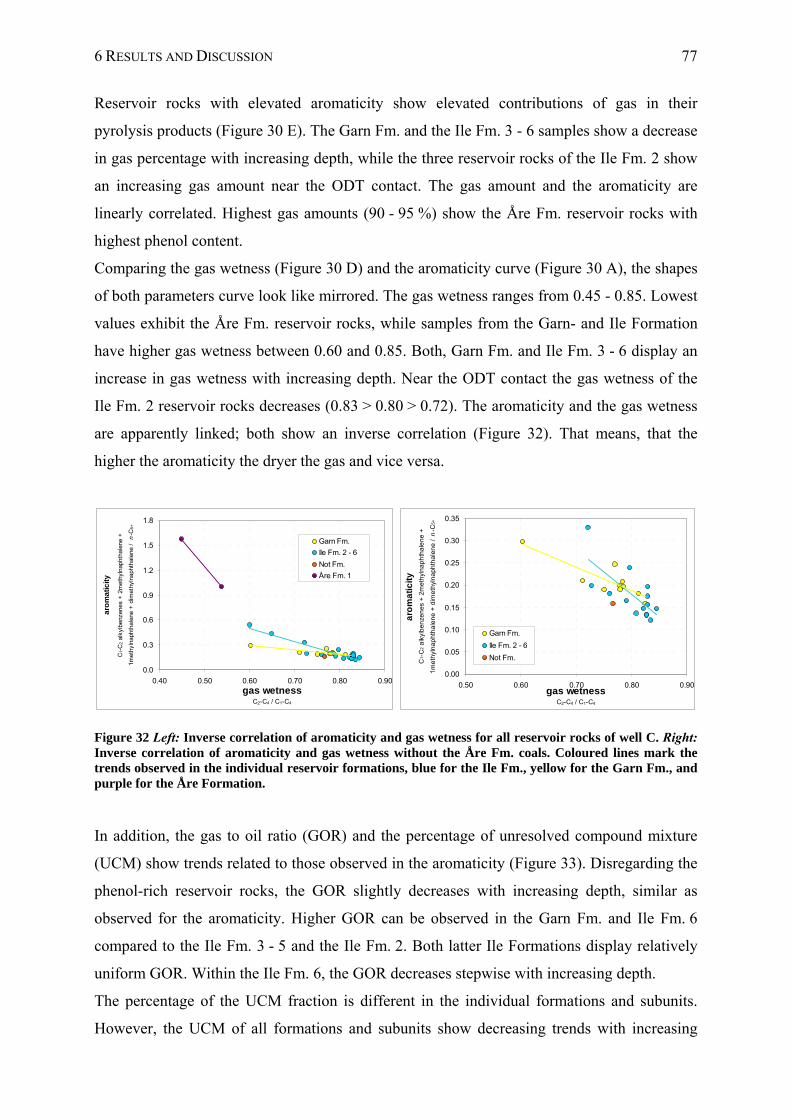
6 RESULTS AND DISCUSSION 77
Reservoir rocks with elevated aromaticity show elevated contributions of gas in their
pyrolysis products (Figure 30 E). The Garn Fm. and the Ile Fm. 3 - 6 samples show a decrease
in gas percentage with increasing depth, while the three reservoir rocks of the Ile Fm. 2 show
an increasing gas amount near the ODT contact. The gas amount and the aromaticity are
linearly correlated. Highest gas amounts (90 - 95 %) show the Åre Fm. reservoir rocks with
highest phenol content.
Comparing the gas wetness (Figure 30 D) and the aromaticity curve (Figure 30 A), the shapes
of both parameters curve look like mirrored. The gas wetness ranges from 0.45 - 0.85. Lowest
values exhibit the Åre Fm. reservoir rocks, while samples from the Garn- and Ile Formation
have higher gas wetness between 0.60 and 0.85. Both, Garn Fm. and Ile Fm. 3 - 6 display an
increase in gas wetness with increasing depth. Near the ODT contact the gas wetness of the
Ile Fm. 2 reservoir rocks decreases (0.83 > 0.80 > 0.72). The aromaticity and the gas wetness
are apparently linked; both show an inverse correlation (Figure 32). That means, that the
higher the aromaticity the dryer the gas and vice versa.
0.0
0.3
0.6
0.9
1.2
1.5
1.8
0.40 0.50 0.60 0.70 0.80 0.90gas wetness
C2-C4 / C1-C4
aro
ma
tic
ity
C1-
C2 a
lkyl
benz
enes
+ 2
met
hyln
apht
hale
ne +
1met
hyln
apht
hale
ne +
dim
ethy
lnap
htha
lene
/
n-C
5+
Garn Fm.
Ile Fm. 2 - 6
Not Fm.
Åre Fm. 1
0.00
0.05
0.10
0.15
0.20
0.25
0.30
0.35
0.50 0.60 0.70 0.80 0.90gas wetness
C2-C4 / C1-C4
aro
ma
tic
ity
C1-C
2 a
lkyl
be
nze
ne
s +
2m
eth
yln
ap
hth
ale
ne
+
1m
eth
yln
ap
hth
ale
ne
+ d
ime
thyl
na
ph
tha
len
e /
n-C
5+
Garn Fm.
Ile Fm. 2 - 6
Not Fm.
Figure 32 Left: Inverse correlation of aromaticity and gas wetness for all reservoir rocks of well C. Right: Inverse correlation of aromaticity and gas wetness without the Åre Fm. coals. Coloured lines mark the trends observed in the individual reservoir formations, blue for the Ile Fm., yellow for the Garn Fm., and purple for the Åre Formation.
In addition, the gas to oil ratio (GOR) and the percentage of unresolved compound mixture
(UCM) show trends related to those observed in the aromaticity (Figure 33). Disregarding the
phenol-rich reservoir rocks, the GOR slightly decreases with increasing depth, similar as
observed for the aromaticity. Higher GOR can be observed in the Garn Fm. and Ile Fm. 6
compared to the Ile Fm. 3 - 5 and the Ile Fm. 2. Both latter Ile Formations display relatively
uniform GOR. Within the Ile Fm. 6, the GOR decreases stepwise with increasing depth.
The percentage of the UCM fraction is different in the individual formations and subunits.
However, the UCM of all formations and subunits show decreasing trends with increasing
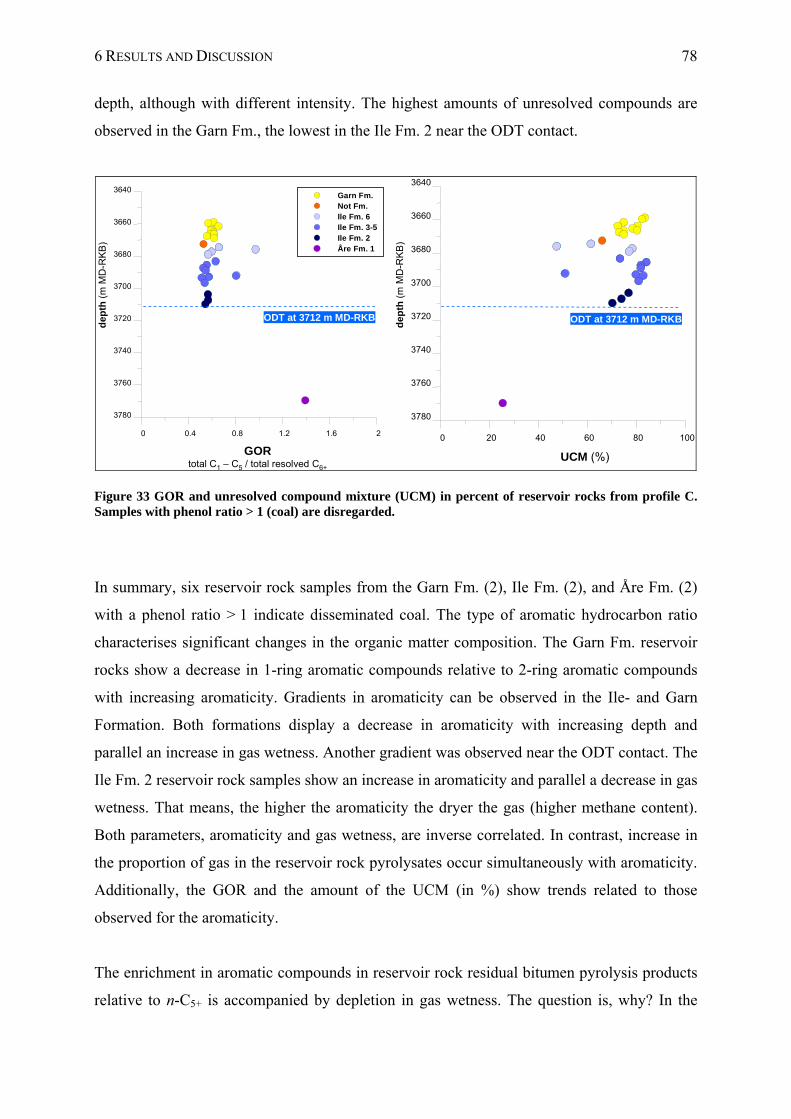
6 RESULTS AND DISCUSSION 78
depth, although with different intensity. The highest amounts of unresolved compounds are
observed in the Garn Fm., the lowest in the Ile Fm. 2 near the ODT contact.
Garn Fm.Not Fm.Ile Fm. 6Ile Fm. 3-5Ile Fm. 2Åre Fm. 1
0 0.4 0.8 1.2 1.6 2
3780
3760
3740
3720
3700
3680
3660
3640
0 20 40 60 80 100
3780
3760
3740
3720
3700
3680
3660
3640
dep
th (
m M
D-R
KB
)
GORtotal C1 – C5 / total resolved C6+
UCM (%)
dep
th (
m M
D-R
KB
)
ODT at 3712 m MD-RKB ODT at 3712 m MD-RKB
Figure 33 GOR and unresolved compound mixture (UCM) in percent of reservoir rocks from profile C. Samples with phenol ratio > 1 (coal) are disregarded.
In summary, six reservoir rock samples from the Garn Fm. (2), Ile Fm. (2), and Åre Fm. (2)
with a phenol ratio > 1 indicate disseminated coal. The type of aromatic hydrocarbon ratio
characterises significant changes in the organic matter composition. The Garn Fm. reservoir
rocks show a decrease in 1-ring aromatic compounds relative to 2-ring aromatic compounds
with increasing aromaticity. Gradients in aromaticity can be observed in the Ile- and Garn
Formation. Both formations display a decrease in aromaticity with increasing depth and
parallel an increase in gas wetness. Another gradient was observed near the ODT contact. The
Ile Fm. 2 reservoir rock samples show an increase in aromaticity and parallel a decrease in gas
wetness. That means, the higher the aromaticity the dryer the gas (higher methane content).
Both parameters, aromaticity and gas wetness, are inverse correlated. In contrast, increase in
the proportion of gas in the reservoir rock pyrolysates occur simultaneously with aromaticity.
Additionally, the GOR and the amount of the UCM (in %) show trends related to those
observed for the aromaticity.
The enrichment in aromatic compounds in reservoir rock residual bitumen pyrolysis products
relative to n-C5+ is accompanied by depletion in gas wetness. The question is, why? In the
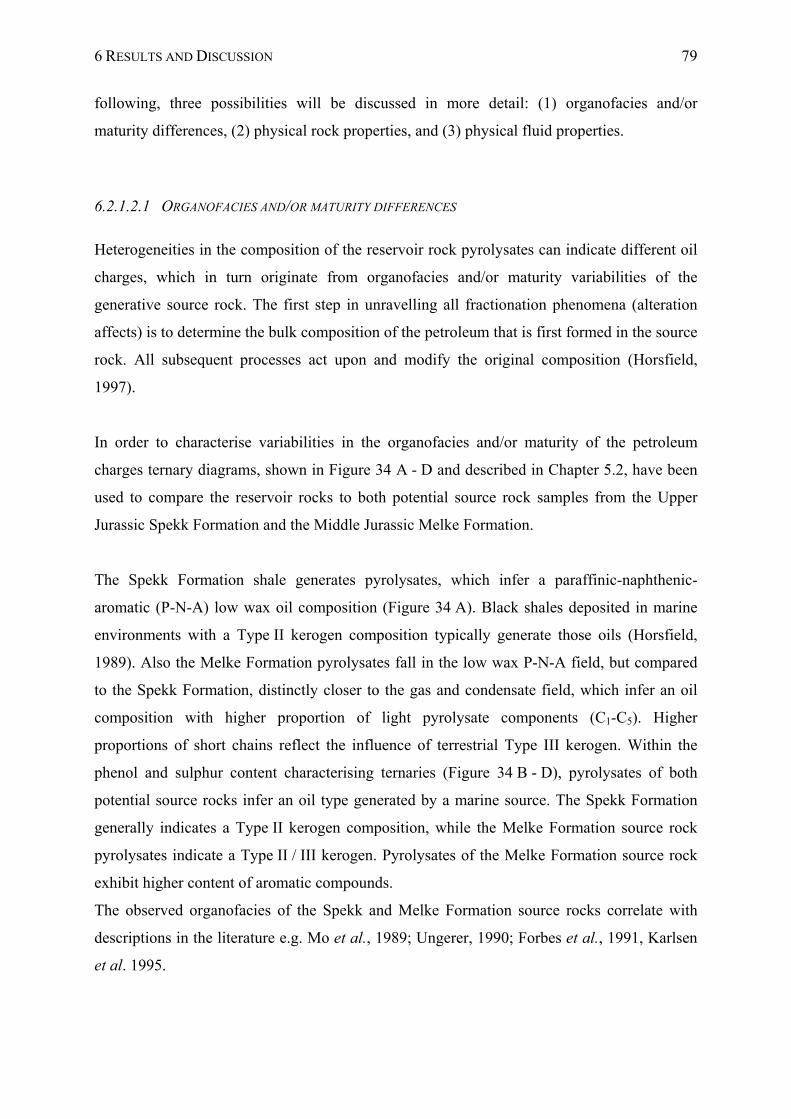
6 RESULTS AND DISCUSSION 79
following, three possibilities will be discussed in more detail: (1) organofacies and/or
maturity differences, (2) physical rock properties, and (3) physical fluid properties.
6.2.1.2.1 ORGANOFACIES AND/OR MATURITY DIFFERENCES
Heterogeneities in the composition of the reservoir rock pyrolysates can indicate different oil
charges, which in turn originate from organofacies and/or maturity variabilities of the
generative source rock. The first step in unravelling all fractionation phenomena (alteration
affects) is to determine the bulk composition of the petroleum that is first formed in the source
rock. All subsequent processes act upon and modify the original composition (Horsfield,
1997).
In order to characterise variabilities in the organofacies and/or maturity of the petroleum
charges ternary diagrams, shown in Figure 34 A - D and described in Chapter 5.2, have been
used to compare the reservoir rocks to both potential source rock samples from the Upper
Jurassic Spekk Formation and the Middle Jurassic Melke Formation.
The Spekk Formation shale generates pyrolysates, which infer a paraffinic-naphthenic-
aromatic (P-N-A) low wax oil composition (Figure 34 A). Black shales deposited in marine
environments with a Type II kerogen composition typically generate those oils (Horsfield,
1989). Also the Melke Formation pyrolysates fall in the low wax P-N-A field, but compared
to the Spekk Formation, distinctly closer to the gas and condensate field, which infer an oil
composition with higher proportion of light pyrolysate components (C1-C5). Higher
proportions of short chains reflect the influence of terrestrial Type III kerogen. Within the
phenol and sulphur content characterising ternaries (Figure 34 B - D), pyrolysates of both
potential source rocks infer an oil type generated by a marine source. The Spekk Formation
generally indicates a Type II kerogen composition, while the Melke Formation source rock
pyrolysates indicate a Type II / III kerogen. Pyrolysates of the Melke Formation source rock
exhibit higher content of aromatic compounds.
The observed organofacies of the Spekk and Melke Formation source rocks correlate with
descriptions in the literature e.g. Mo et al., 1989; Ungerer, 1990; Forbes et al., 1991, Karlsen
et al. 1995.
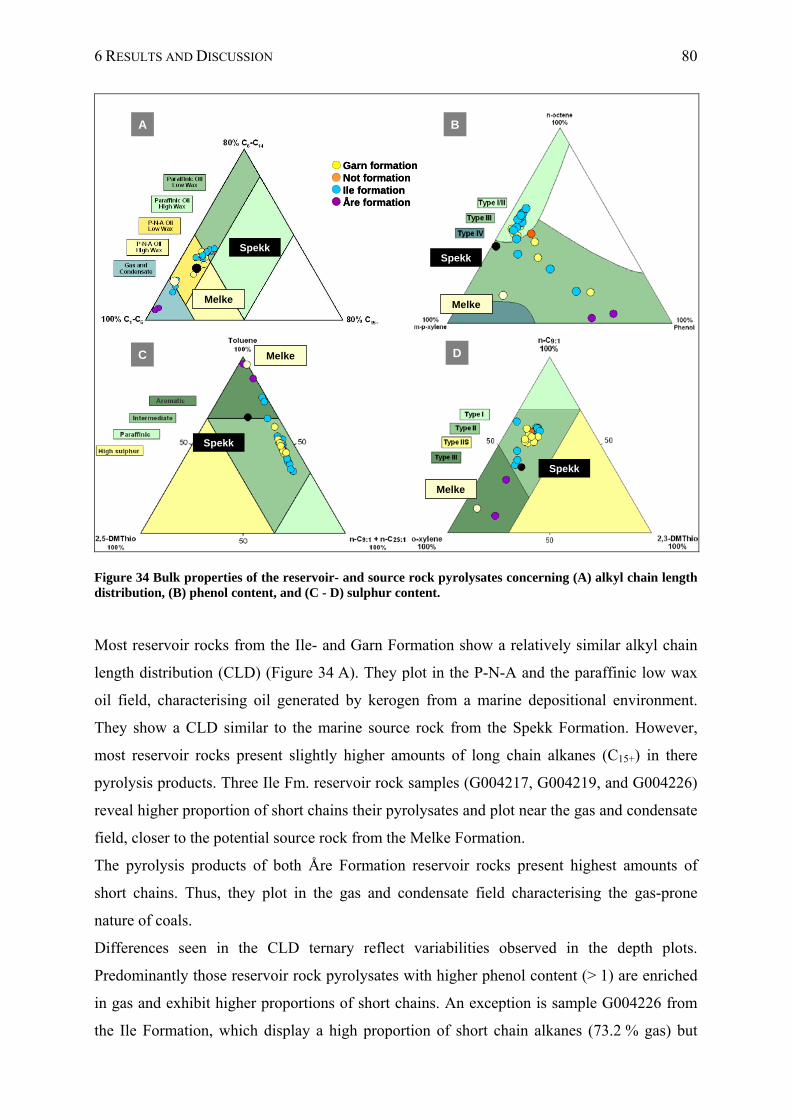
6 RESULTS AND DISCUSSION 80
Spekk
Melke
Spekk
Melke
Spekk
Melke
A B
Spekk
Melke
Spekk
Melke
C D
Garn formationNot formationIle formationÅre formation
Garn formationNot formationIle formationÅre formation
Figure 34 Bulk properties of the reservoir- and source rock pyrolysates concerning (A) alkyl chain length distribution, (B) phenol content, and (C - D) sulphur content.
Most reservoir rocks from the Ile- and Garn Formation show a relatively similar alkyl chain
length distribution (CLD) (Figure 34 A). They plot in the P-N-A and the paraffinic low wax
oil field, characterising oil generated by kerogen from a marine depositional environment.
They show a CLD similar to the marine source rock from the Spekk Formation. However,
most reservoir rocks present slightly higher amounts of long chain alkanes (C15+) in there
pyrolysis products. Three Ile Fm. reservoir rock samples (G004217, G004219, and G004226)
reveal higher proportion of short chains their pyrolysates and plot near the gas and condensate
field, closer to the potential source rock from the Melke Formation.
The pyrolysis products of both Åre Formation reservoir rocks present highest amounts of
short chains. Thus, they plot in the gas and condensate field characterising the gas-prone
nature of coals.
Differences seen in the CLD ternary reflect variabilities observed in the depth plots.
Predominantly those reservoir rock pyrolysates with higher phenol content (> 1) are enriched
in gas and exhibit higher proportions of short chains. An exception is sample G004226 from
the Ile Formation, which display a high proportion of short chain alkanes (73.2 % gas) but
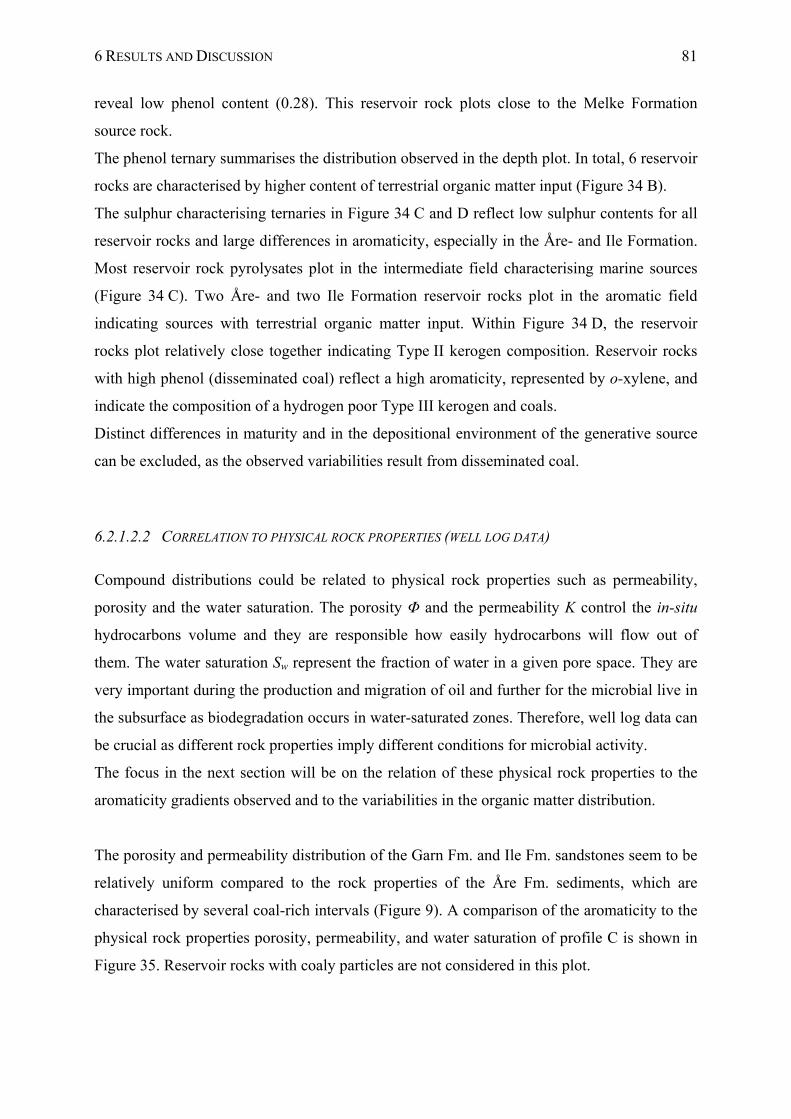
6 RESULTS AND DISCUSSION 81
reveal low phenol content (0.28). This reservoir rock plots close to the Melke Formation
source rock.
The phenol ternary summarises the distribution observed in the depth plot. In total, 6 reservoir
rocks are characterised by higher content of terrestrial organic matter input (Figure 34 B).
The sulphur characterising ternaries in Figure 34 C and D reflect low sulphur contents for all
reservoir rocks and large differences in aromaticity, especially in the Åre- and Ile Formation.
Most reservoir rock pyrolysates plot in the intermediate field characterising marine sources
(Figure 34 C). Two Åre- and two Ile Formation reservoir rocks plot in the aromatic field
indicating sources with terrestrial organic matter input. Within Figure 34 D, the reservoir
rocks plot relatively close together indicating Type II kerogen composition. Reservoir rocks
with high phenol (disseminated coal) reflect a high aromaticity, represented by o-xylene, and
indicate the composition of a hydrogen poor Type III kerogen and coals.
Distinct differences in maturity and in the depositional environment of the generative source
can be excluded, as the observed variabilities result from disseminated coal.
6.2.1.2.2 CORRELATION TO PHYSICAL ROCK PROPERTIES (WELL LOG DATA)
Compound distributions could be related to physical rock properties such as permeability,
porosity and the water saturation. The porosity Φ and the permeability Κ control the in-situ
hydrocarbons volume and they are responsible how easily hydrocarbons will flow out of
them. The water saturation Sw represent the fraction of water in a given pore space. They are
very important during the production and migration of oil and further for the microbial live in
the subsurface as biodegradation occurs in water-saturated zones. Therefore, well log data can
be crucial as different rock properties imply different conditions for microbial activity.
The focus in the next section will be on the relation of these physical rock properties to the
aromaticity gradients observed and to the variabilities in the organic matter distribution.
The porosity and permeability distribution of the Garn Fm. and Ile Fm. sandstones seem to be
relatively uniform compared to the rock properties of the Åre Fm. sediments, which are
characterised by several coal-rich intervals (Figure 9). A comparison of the aromaticity to the
physical rock properties porosity, permeability, and water saturation of profile C is shown in
Figure 35. Reservoir rocks with coaly particles are not considered in this plot.
6 RESULTS AND DISCUSSION 82
In the Garn Fm., which shows good reservoir conditions (cf. Chapter 3.2.1), the permeability
and the porosity slightly decrease with increasing depth. The Sw of this reservoir unit is
relatively high as compared to the underlying Ile Formation. The reservoir rocks from the
Garn Fm. show a relatively low organic matter content between 7.7 - 25.2 mg/g rock and a
relatively low aromaticity (0.16 - 0.30). Both parameters slightly decrease with increasing
depth parallel to the rock properties (Figure 35).
Not FM K<1mD
mica rich sandstone
coaly particles
clay and siltstone
Sw
Garn FormationNot FormationIle Formation
porosity (%) permeability (md)
water saturation
0 10 50 0.2 20000
3712 m MD-RKB
ODT
0 0.2 0.4 0.6 0.8 1
3720
3700
3680
3660
3640
de
pth
(m
MD
-RK
B)
aromaticity
C1-C2 alkylbenzenes + 2MN + 1MN + DMN / n-C5+
barrier
barrier
coal
Sw
Sw
Sw
Not FM K<1mD
mica rich sandstone
coaly particles
clay and siltstoneclay and siltstone
Sw
Garn FormationNot FormationIle Formation
porosity (%) permeability (md)
water saturation
0 10 50 0.2 20000
3712 m MD-RKB
ODT
0 0.2 0.4 0.6 0.8 1
3720
3700
3680
3660
3640
de
pth
(m
MD
-RK
B)
aromaticity
C1-C2 alkylbenzenes + 2MN + 1MN + DMN / n-C5+
0 0.2 0.4 0.6 0.8 1
3720
3700
3680
3660
3640
0 0.2 0.4 0.6 0.8 1
3720
3700
3680
3660
3640
de
pth
(m
MD
-RK
B)
aromaticity
C1-C2 alkylbenzenes + 2MN + 1MN + DMN / n-C5+
barrier
barrier
coal
Sw
Sw
Sw
Figure 35 Comparison of the aromaticity (left) analysed in well C to a well log section of the profile (right) including porosity, water saturation, and permeability. Coaly samples are not considered. The well log is provided Statoil.
ODT = oil down to contact
The reservoir rocks analysed from the Ile Fm. are from five reservoir zones (Ile Fm. 2 - 6)
(Figure 9). The Ile Formations 4 - 6 (3674 m - 3693 m MD - RKB) shows good poroperm
properties similarly to the Garn Fm., but with distinctly lower water saturation Sw (Figure 35).
Here the reservoir rocks are characterised by very low aromaticity (< 0.20). Excepted are
three zones with low poroperm properties and high Sw. One zone in the upper part of the Ile
Fm. 6 shows coaly particles. Here, low poroperm properties correlate to high aromaticity
(black dots) and high OM content (not shown). In another zone, at the base of Ile Fm. 4
sandstones at 3693 - 3695 m MD-RKB, a high concentration of mica was observed that
additionally result in low poroperm properties. Both reservoir rock samples (G004229,
6 RESULTS AND DISCUSSION 83
G004230) analysed here, show higher organic matter content (30.2 and 37.0 mg/g rock), but
also very low aromaticity (< 0.15). The third zone at the base of the Ile Fm. 3 (3702 m MD -
RKB) comprises clay and siltstones, and may act as a barrier.
In the channel sandstones of the Ile Fm. 2 near the ODT contact, calcite cemented bands are
typical (internal Statoil report, 2003). Within this unit, the porosity and permeability decrease,
and expectedly the Sw increase down to the ODT contact. The gradually changes in the rock
properties can be seen in the curve like shapes in the well log. The three lowermost Ile Fm.
reservoir rocks analysed here (G004236, G004238, and G004240), reflect the trend and show
an increase in aromaticity from 0.13 up to 0.33 (Figure 35). Thus, the aromaticity is
apparently linked to the water saturation. These samples are additionally characterised by a
stepwise decrease in the OM content. Thus, the combination of high water saturation, the
increase in aromaticity and the diminishing OM content could be an indication for higher
microbial activity near the OWC.
In summary, different barrier zones, coal beds and mica rich sandstones were detected, and
related to the OM distribution as well as the pyrolysis parameters. Near the ODT contact a
decrease in porosity and permeability and an increase in the water saturation was observed,
that goes along with an increase in aromaticity and a stepwise decrease in the OM content.
The aromaticity is apparently linked to water saturation. However, based on the visual
comparison alone no general correlation between the different heterogeneities in the
aromaticity and the organic matter distribution was found.
The observed correlation between the aromaticity and the water saturation could be an
indication of biodegradation. In other words, biodegradation appears to have resulted in
abstraction of hydrogen from the macromolecular components, and thus the enhanced
generation of aromatic hydrocarbons on pyrolysis. On the other hand, mineral matrix effects
have also to be considered in order to exclude the possibility that analytical artefacts could
have led to the aromatic pyrolysis products. Mineral matrix effects for a given mineralogy are
more pronounced when organic matter is in low abundance. Therefore, the aromaticity and
the whole reservoir rock pyrolysis yields C1+ (mg/g rock) of the resolved compounds were
compared to see if a relationship between yield and aromaticity could be establihsed. Figure
36 show both parameter versus increasing depth (left) and the C1+ (mg/g rock) resolved
compounds versus the aromaticity (right). The reservoir rock samples with disseminated coal
are excluded.
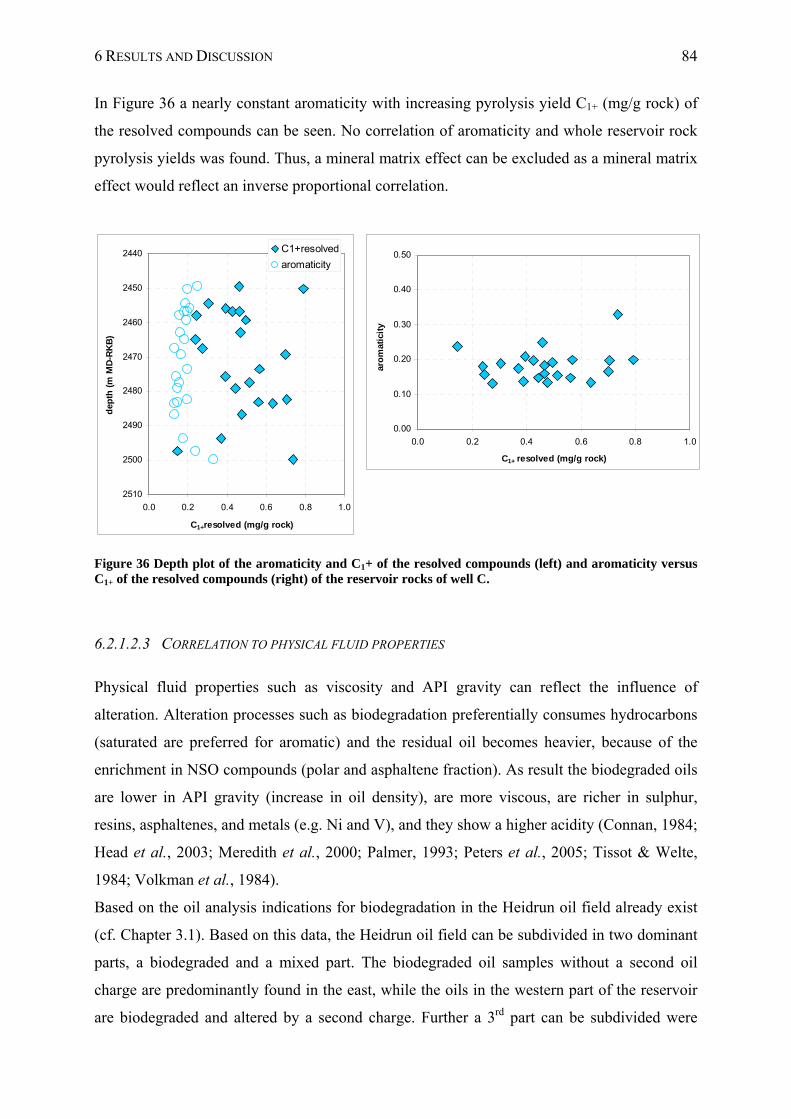
6 RESULTS AND DISCUSSION 84
In Figure 36 a nearly constant aromaticity with increasing pyrolysis yield C1+ (mg/g rock) of
the resolved compounds can be seen. No correlation of aromaticity and whole reservoir rock
pyrolysis yields was found. Thus, a mineral matrix effect can be excluded as a mineral matrix
effect would reflect an inverse proportional correlation.
0.00
0.10
0.20
0.30
0.40
0.50
0.0 0.2 0.4 0.6 0.8 1.0
C1+ resolved (mg/g rock)
aro
mat
icit
y
2440
2450
2460
2470
2480
2490
2500
2510
0.0 0.2 0.4 0.6 0.8 1.0
C1+resolved (mg/g rock)
dep
th (
m M
D-R
KB
)
C1+resolved
aromaticity
Figure 36 Depth plot of the aromaticity and C1+ of the resolved compounds (left) and aromaticity versus C1+ of the resolved compounds (right) of the reservoir rocks of well C.
6.2.1.2.3 CORRELATION TO PHYSICAL FLUID PROPERTIES
Physical fluid properties such as viscosity and API gravity can reflect the influence of
alteration. Alteration processes such as biodegradation preferentially consumes hydrocarbons
(saturated are preferred for aromatic) and the residual oil becomes heavier, because of the
enrichment in NSO compounds (polar and asphaltene fraction). As result the biodegraded oils
are lower in API gravity (increase in oil density), are more viscous, are richer in sulphur,
resins, asphaltenes, and metals (e.g. Ni and V), and they show a higher acidity (Connan, 1984;
Head et al., 2003; Meredith et al., 2000; Palmer, 1993; Peters et al., 2005; Tissot & Welte,
1984; Volkman et al., 1984).
Based on the oil analysis indications for biodegradation in the Heidrun oil field already exist
(cf. Chapter 3.1). Based on this data, the Heidrun oil field can be subdivided in two dominant
parts, a biodegraded and a mixed part. The biodegraded oil samples without a second oil
charge are predominantly found in the east, while the oils in the western part of the reservoir
are biodegraded and altered by a second charge. Further a 3rd part can be subdivided were
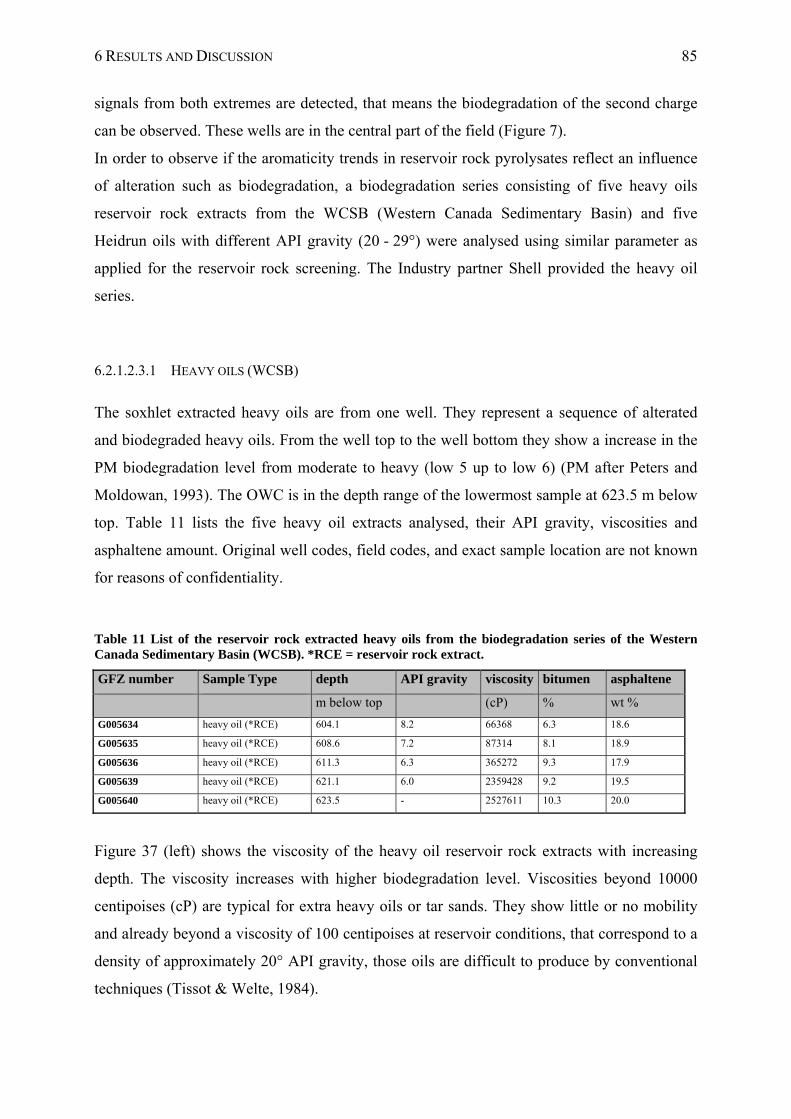
6 RESULTS AND DISCUSSION 85
signals from both extremes are detected, that means the biodegradation of the second charge
can be observed. These wells are in the central part of the field (Figure 7).
In order to observe if the aromaticity trends in reservoir rock pyrolysates reflect an influence
of alteration such as biodegradation, a biodegradation series consisting of five heavy oils
reservoir rock extracts from the WCSB (Western Canada Sedimentary Basin) and five
Heidrun oils with different API gravity (20 - 29°) were analysed using similar parameter as
applied for the reservoir rock screening. The Industry partner Shell provided the heavy oil
series.
6.2.1.2.3.1 HEAVY OILS (WCSB)
The soxhlet extracted heavy oils are from one well. They represent a sequence of alterated
and biodegraded heavy oils. From the well top to the well bottom they show a increase in the
PM biodegradation level from moderate to heavy (low 5 up to low 6) (PM after Peters and
Moldowan, 1993). The OWC is in the depth range of the lowermost sample at 623.5 m below
top. Table 11 lists the five heavy oil extracts analysed, their API gravity, viscosities and
asphaltene amount. Original well codes, field codes, and exact sample location are not known
for reasons of confidentiality.
Table 11 List of the reservoir rock extracted heavy oils from the biodegradation series of the Western Canada Sedimentary Basin (WCSB). *RCE = reservoir rock extract.
GFZ number Sample Type depth API gravity viscosity bitumen asphaltene
m below top (cP) % wt %
G005634 heavy oil (*RCE) 604.1 8.2 66368 6.3 18.6
G005635 heavy oil (*RCE) 608.6 7.2 87314 8.1 18.9
G005636 heavy oil (*RCE) 611.3 6.3 365272 9.3 17.9
G005639 heavy oil (*RCE) 621.1 6.0 2359428 9.2 19.5
G005640 heavy oil (*RCE) 623.5 - 2527611 10.3 20.0
Figure 37 (left) shows the viscosity of the heavy oil reservoir rock extracts with increasing
depth. The viscosity increases with higher biodegradation level. Viscosities beyond 10000
centipoises (cP) are typical for extra heavy oils or tar sands. They show little or no mobility
and already beyond a viscosity of 100 centipoises at reservoir conditions, that correspond to a
density of approximately 20° API gravity, those oils are difficult to produce by conventional
techniques (Tissot & Welte, 1984).
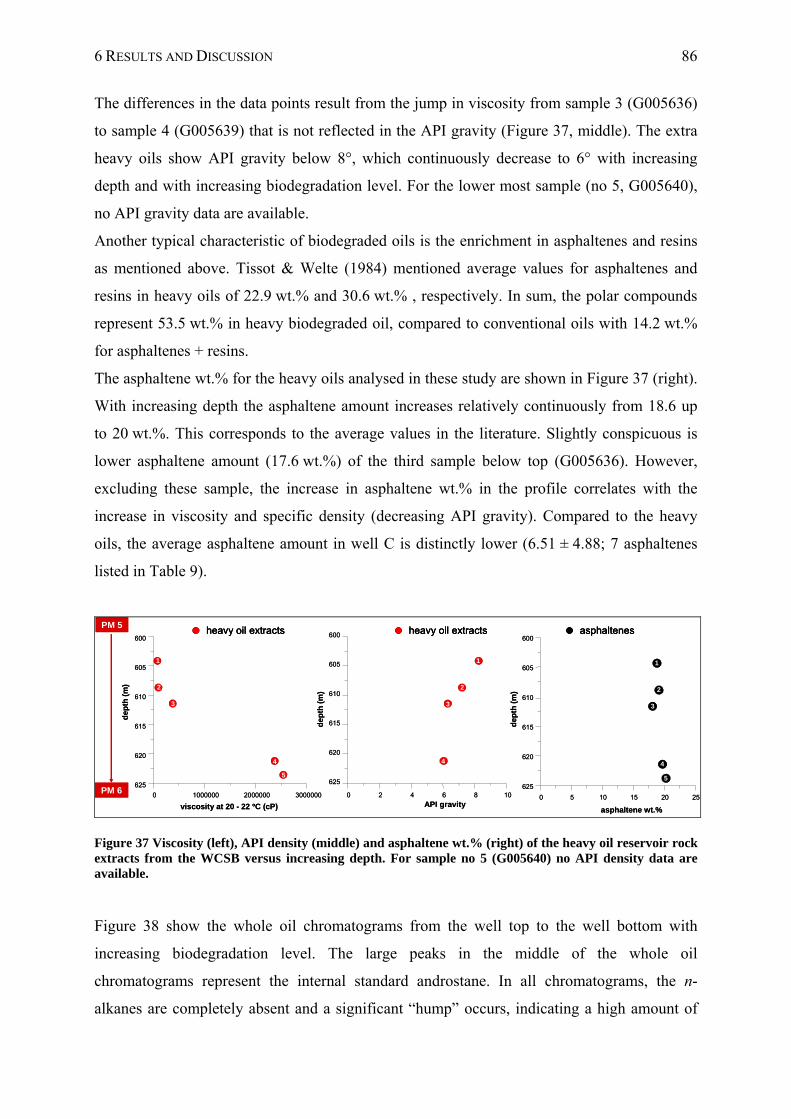
6 RESULTS AND DISCUSSION 86
The differences in the data points result from the jump in viscosity from sample 3 (G005636)
to sample 4 (G005639) that is not reflected in the API gravity (Figure 37, middle). The extra
heavy oils show API gravity below 8°, which continuously decrease to 6° with increasing
depth and with increasing biodegradation level. For the lower most sample (no 5, G005640),
no API gravity data are available.
Another typical characteristic of biodegraded oils is the enrichment in asphaltenes and resins
as mentioned above. Tissot & Welte (1984) mentioned average values for asphaltenes and
resins in heavy oils of 22.9 wt.% and 30.6 wt.% , respectively. In sum, the polar compounds
represent 53.5 wt.% in heavy biodegraded oil, compared to conventional oils with 14.2 wt.%
for asphaltenes + resins.
The asphaltene wt.% for the heavy oils analysed in these study are shown in Figure 37 (right).
With increasing depth the asphaltene amount increases relatively continuously from 18.6 up
to 20 wt.%. This corresponds to the average values in the literature. Slightly conspicuous is
lower asphaltene amount (17.6 wt.%) of the third sample below top (G005636). However,
excluding these sample, the increase in asphaltene wt.% in the profile correlates with the
increase in viscosity and specific density (decreasing API gravity). Compared to the heavy
oils, the average asphaltene amount in well C is distinctly lower (6.51 ± 4.88; 7 asphaltenes
listed in Table 9).
PM 5
PM 6
viscosity at 20 - 22 ºC (cP)
heavy oil extracts
0 1000000 2000000 3000000
625
620
615
610
605
600
dep
th (
m)
1
2
3
4
5
heavy oil extracts
0 2 4 6 8 10
625
620
615
610
605
600
1
2
3
4
API gravity
dep
th (
m)
asphaltenes
0 5 10 15 20 25
625
620
615
610
605
600
1
2
3
4
5
asphaltene wt.%
dep
th (
m)
PM 5
PM 6
viscosity at 20 - 22 ºC (cP)
heavy oil extractsheavy oil extracts
0 1000000 2000000 3000000
625
620
615
610
605
600
dep
th (
m)
1
2
3
4
5
heavy oil extractsheavy oil extracts
0 2 4 6 8 10
625
620
615
610
605
600
1
2
3
4
API gravity
dep
th (
m)
asphaltenesasphaltenes
0 5 10 15 20 25
625
620
615
610
605
600
1
2
3
4
5
asphaltene wt.%
dep
th (
m)
Figure 37 Viscosity (left), API density (middle) and asphaltene wt.% (right) of the heavy oil reservoir rock extracts from the WCSB versus increasing depth. For sample no 5 (G005640) no API density data are available.
Figure 38 show the whole oil chromatograms from the well top to the well bottom with
increasing biodegradation level. The large peaks in the middle of the whole oil
chromatograms represent the internal standard androstane. In all chromatograms, the n-
alkanes are completely absent and a significant “hump” occurs, indicating a high amount of
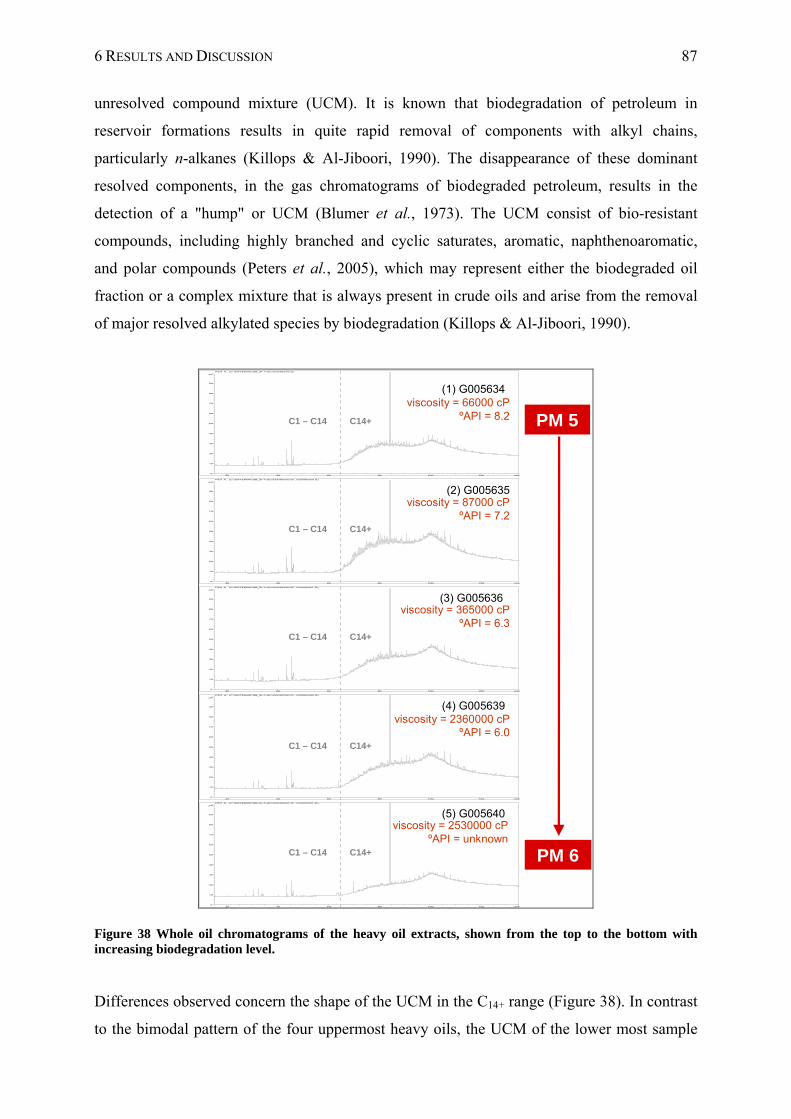
6 RESULTS AND DISCUSSION 87
unresolved compound mixture (UCM). It is known that biodegradation of petroleum in
reservoir formations results in quite rapid removal of components with alkyl chains,
particularly n-alkanes (Killops & Al-Jiboori, 1990). The disappearance of these dominant
resolved components, in the gas chromatograms of biodegraded petroleum, results in the
detection of a "hump" or UCM (Blumer et al., 1973). The UCM consist of bio-resistant
compounds, including highly branched and cyclic saturates, aromatic, naphthenoaromatic,
and polar compounds (Peters et al., 2005), which may represent either the biodegraded oil
fraction or a complex mixture that is always present in crude oils and arise from the removal
of major resolved alkylated species by biodegradation (Killops & Al-Jiboori, 1990).
min20 40 60 80 100 120
pA
0
10
20
30
40
50
60
70
80
90
FID1 A, (C:\DATEN\WCSB_B~1\GC\G0056340.D)
min20 40 60 80 100 120
pA
0
10
20
30
40
50
60
70
80
90
FID1 A, (C:\DATEN\WCSB_B~1\GC\G0056350.D\..\G0056350.D)
min20 40 60 80 100 120
pA
0
10
20
30
40
50
60
70
80
90
FID1 A, (C:\DATEN\WCSB_B~1\GC\G0056360.D\..\G0056351.D)
min20 40 60 80 100 120
pA
0
10
20
30
40
50
60
70
80
90
FID1 A, (C:\DATEN\WCSB_B~1\GC\G0056390.D\..\G0056390.D)
min20 40 60 80 100 120
pA
0
10
20
30
40
50
60
70
80
90
FID1 A, (C:\DATEN\WCSB_B~1\GC\G0056391.D\..\G0056391.D)
PM 5
PM 6
C1 – C14 C14+
C1 – C14 C14+
C1 – C14 C14+
C1 – C14 C14+
C1 – C14 C14+
(1) G005634
(2) G005635
(3) G005636
(4) G005639
(5) G005640
viscosity = 66000 cPºAPI = 8.2
viscosity = 87000 cPºAPI = 7.2
viscosity = 2360000 cPºAPI = 6.0
viscosity = 365000 cPºAPI = 6.3
viscosity = 2530000 cPºAPI = unknown
Figure 38 Whole oil chromatograms of the heavy oil extracts, shown from the top to the bottom with increasing biodegradation level.
Differences observed concern the shape of the UCM in the C14+ range (Figure 38). In contrast
to the bimodal pattern of the four uppermost heavy oils, the UCM of the lower most sample
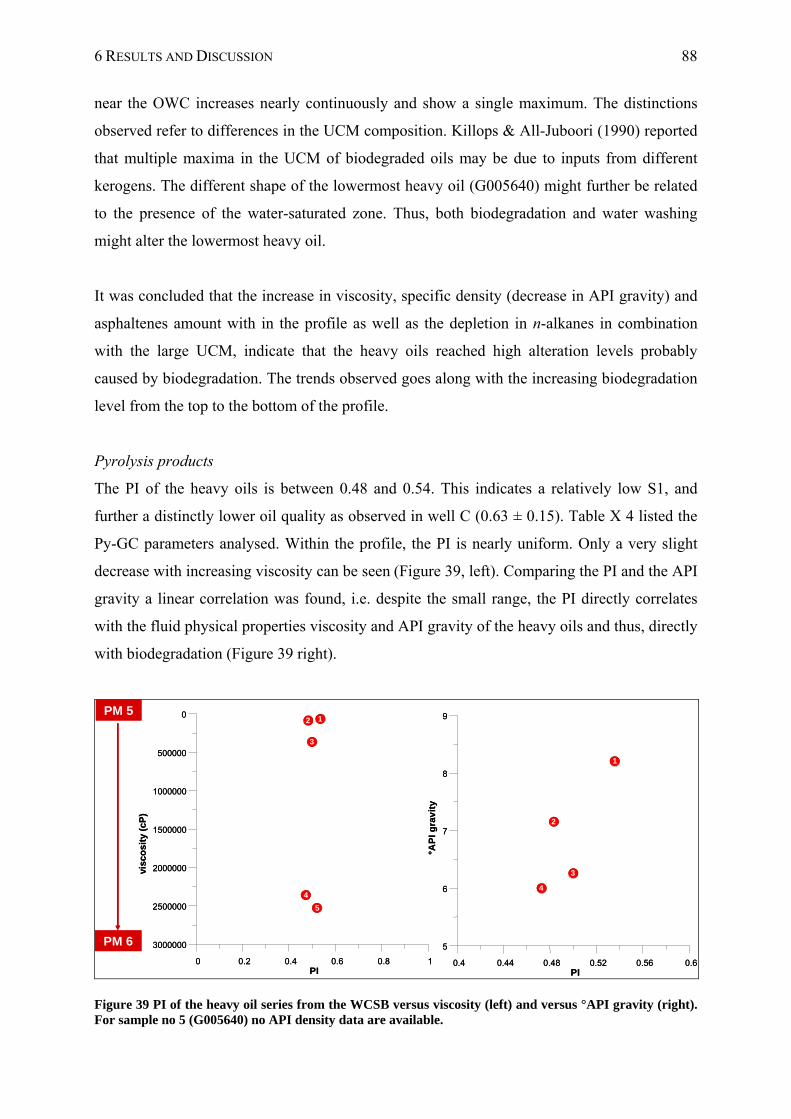
6 RESULTS AND DISCUSSION 88
near the OWC increases nearly continuously and show a single maximum. The distinctions
observed refer to differences in the UCM composition. Killops & All-Juboori (1990) reported
that multiple maxima in the UCM of biodegraded oils may be due to inputs from different
kerogens. The different shape of the lowermost heavy oil (G005640) might further be related
to the presence of the water-saturated zone. Thus, both biodegradation and water washing
might alter the lowermost heavy oil.
It was concluded that the increase in viscosity, specific density (decrease in API gravity) and
asphaltenes amount with in the profile as well as the depletion in n-alkanes in combination
with the large UCM, indicate that the heavy oils reached high alteration levels probably
caused by biodegradation. The trends observed goes along with the increasing biodegradation
level from the top to the bottom of the profile.
Pyrolysis products
The PI of the heavy oils is between 0.48 and 0.54. This indicates a relatively low S1, and
further a distinctly lower oil quality as observed in well C (0.63 ± 0.15). Table X 4 listed the
Py-GC parameters analysed. Within the profile, the PI is nearly uniform. Only a very slight
decrease with increasing viscosity can be seen (Figure 39, left). Comparing the PI and the API
gravity a linear correlation was found, i.e. despite the small range, the PI directly correlates
with the fluid physical properties viscosity and API gravity of the heavy oils and thus, directly
with biodegradation (Figure 39 right).
PM 5
PM 6
0 0.2 0.4 0.6 0.8 1PI
3000000
2500000
2000000
1500000
1000000
500000
0
vis
co
sit
y(c
P)
12
3
4
5
0.4 0.44 0.48 0.52 0.56 0.6PI
5
6
7
8
9
°AP
Ig
rav
ity
1
2
3
4
PM 5
PM 6
0 0.2 0.4 0.6 0.8 1PI
3000000
2500000
2000000
1500000
1000000
500000
0
vis
co
sit
y(c
P)
12
3
4
5
0.4 0.44 0.48 0.52 0.56 0.6PI
5
6
7
8
9
°AP
Ig
rav
ity
1
2
3
4
Figure 39 PI of the heavy oil series from the WCSB versus viscosity (left) and versus °API gravity (right). For sample no 5 (G005640) no API density data are available.
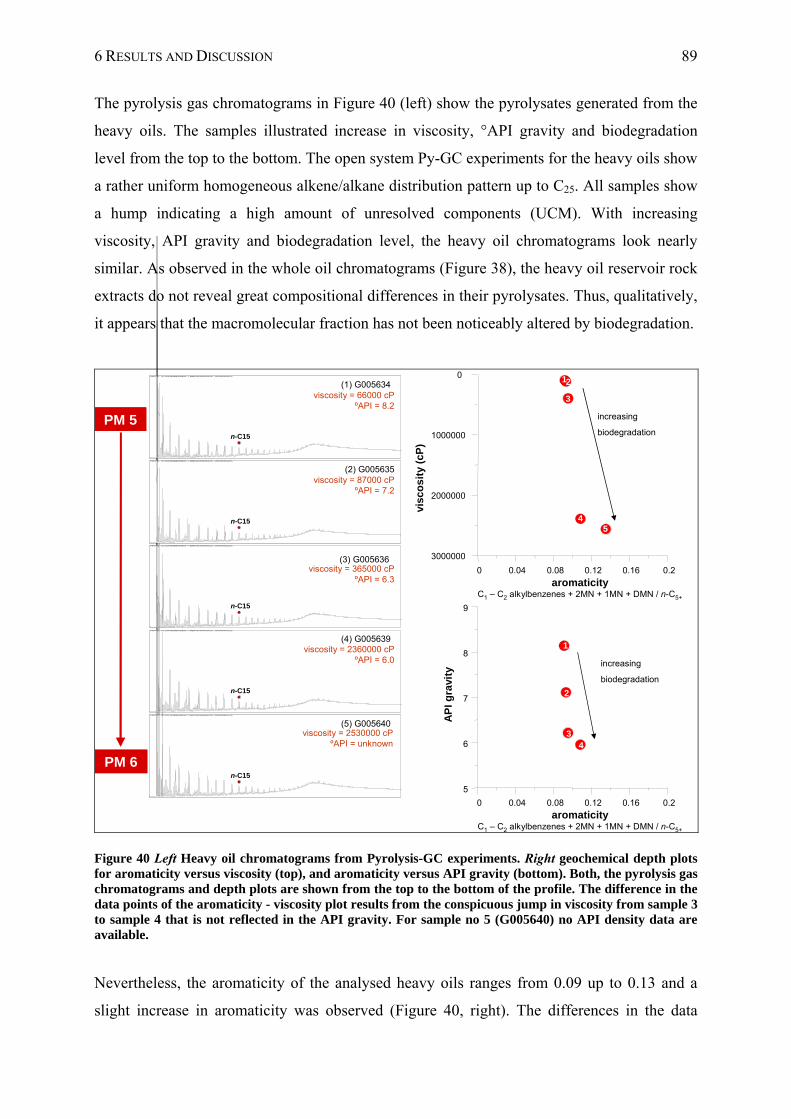
6 RESULTS AND DISCUSSION 89
The pyrolysis gas chromatograms in Figure 40 (left) show the pyrolysates generated from the
heavy oils. The samples illustrated increase in viscosity, °API gravity and biodegradation
level from the top to the bottom. The open system Py-GC experiments for the heavy oils show
a rather uniform homogeneous alkene/alkane distribution pattern up to C25. All samples show
a hump indicating a high amount of unresolved components (UCM). With increasing
viscosity, API gravity and biodegradation level, the heavy oil chromatograms look nearly
similar. As observed in the whole oil chromatograms (Figure 38), the heavy oil reservoir rock
extracts do not reveal great compositional differences in their pyrolysates. Thus, qualitatively,
it appears that the macromolecular fraction has not been noticeably altered by biodegradation.
increasing
biodegradationPM 5
PM 6
PM 5
PM 6
PM 5
PM 6
FID1 A, (C:\DATEN\BIODEG~1.SER\G005639A.D\..\G005639A.D)
FID1 A, (C:\DATEN\BIODEG~1.SER\G005636A.D\..\G005636A.D)
FID1 A, (C:\DATEN\BIODEG~1.SER\G005634A.D\..\G005634A.D)
FID1 A, (C:\DATEN\BIODEG~1.SER\G005635A.D\..\G005635A.D)
FID1 A, (C:\DATEN\BIODEG~1.SER\G005640A.D\..\G005640A.D)
(1) G005634
(2) G005635
(3) G005636
(4) G005639
(5) G005640
viscosity = 66000 cPºAPI = 8.2
viscosity = 87000 cPºAPI = 7.2
viscosity = 2360000 cPºAPI = 6.0
viscosity = 365000 cPºAPI = 6.3
viscosity = 2530000 cPºAPI = unknown
n-C15
n-C15
n-C15
n-C15
n-C15
increasing
biodegradation
aromaticityC1 – C2 alkylbenzenes + 2MN + 1MN + DMN / n-C5+
0 0.04 0.08 0.12 0.16 0.2
3000000
2000000
1000000
0
visc
os
ity
(cP
)
12
3
45
0 0.04 0.08 0.12 0.16 0.2
5
6
7
8
9
1
2
34
AP
I gra
vity
aromaticityC1 – C2 alkylbenzenes + 2MN + 1MN + DMN / n-C5+
Figure 40 Left Heavy oil chromatograms from Pyrolysis-GC experiments. Right geochemical depth plots for aromaticity versus viscosity (top), and aromaticity versus API gravity (bottom). Both, the pyrolysis gas chromatograms and depth plots are shown from the top to the bottom of the profile. The difference in the data points of the aromaticity - viscosity plot results from the conspicuous jump in viscosity from sample 3 to sample 4 that is not reflected in the API gravity. For sample no 5 (G005640) no API density data are available.
Nevertheless, the aromaticity of the analysed heavy oils ranges from 0.09 up to 0.13 and a
slight increase in aromaticity was observed (Figure 40, right). The differences in the data
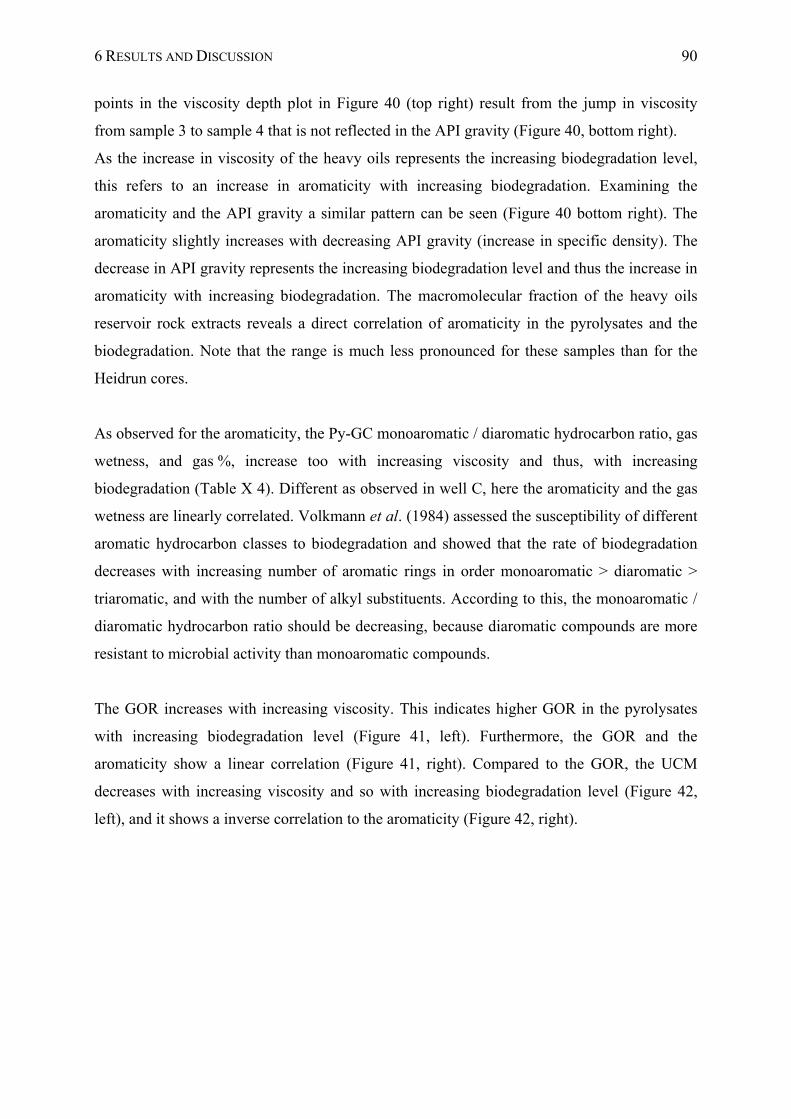
6 RESULTS AND DISCUSSION 90
points in the viscosity depth plot in Figure 40 (top right) result from the jump in viscosity
from sample 3 to sample 4 that is not reflected in the API gravity (Figure 40, bottom right).
As the increase in viscosity of the heavy oils represents the increasing biodegradation level,
this refers to an increase in aromaticity with increasing biodegradation. Examining the
aromaticity and the API gravity a similar pattern can be seen (Figure 40 bottom right). The
aromaticity slightly increases with decreasing API gravity (increase in specific density). The
decrease in API gravity represents the increasing biodegradation level and thus the increase in
aromaticity with increasing biodegradation. The macromolecular fraction of the heavy oils
reservoir rock extracts reveals a direct correlation of aromaticity in the pyrolysates and the
biodegradation. Note that the range is much less pronounced for these samples than for the
Heidrun cores.
As observed for the aromaticity, the Py-GC monoaromatic / diaromatic hydrocarbon ratio, gas
wetness, and gas %, increase too with increasing viscosity and thus, with increasing
biodegradation (Table X 4). Different as observed in well C, here the aromaticity and the gas
wetness are linearly correlated. Volkmann et al. (1984) assessed the susceptibility of different
aromatic hydrocarbon classes to biodegradation and showed that the rate of biodegradation
decreases with increasing number of aromatic rings in order monoaromatic > diaromatic >
triaromatic, and with the number of alkyl substituents. According to this, the monoaromatic /
diaromatic hydrocarbon ratio should be decreasing, because diaromatic compounds are more
resistant to microbial activity than monoaromatic compounds.
The GOR increases with increasing viscosity. This indicates higher GOR in the pyrolysates
with increasing biodegradation level (Figure 41, left). Furthermore, the GOR and the
aromaticity show a linear correlation (Figure 41, right). Compared to the GOR, the UCM
decreases with increasing viscosity and so with increasing biodegradation level (Figure 42,
left), and it shows a inverse correlation to the aromaticity (Figure 42, right).
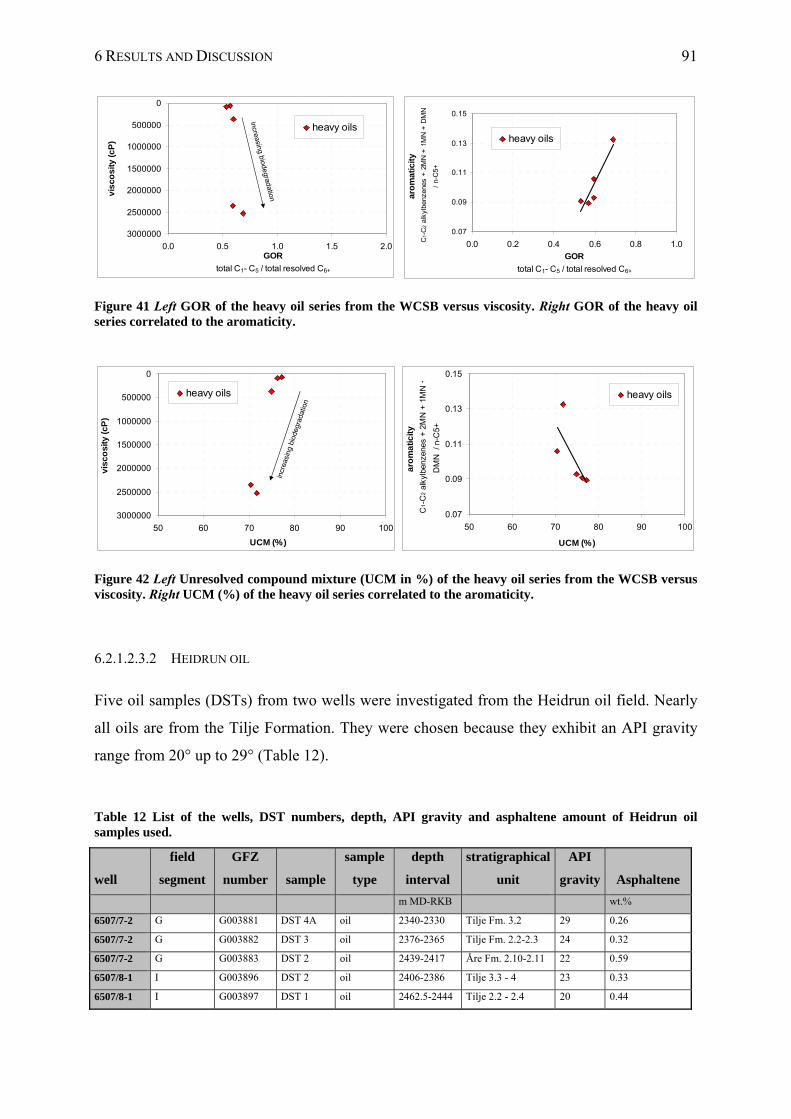
6 RESULTS AND DISCUSSION 91
0
500000
1000000
1500000
2000000
2500000
3000000
0.0 0.5 1.0 1.5 2.0GOR
total C1- C5 / total resolved C6+
vis
cos
ity (
cP
)
heavy oils
increasing biodegradation
0.07
0.09
0.11
0.13
0.15
0.0 0.2 0.4 0.6 0.8 1.0
GOR
total C1- C5 / total resolved C6+
aro
mat
icit
y C
1-C
2 a
lkyl
benz
enes
+ 2
MN
+ 1
MN
+ D
MN
/ n-
C5+
heavy oils
Figure 41 Left GOR of the heavy oil series from the WCSB versus viscosity. Right GOR of the heavy oil series correlated to the aromaticity.
0
500000
1000000
1500000
2000000
2500000
3000000
50 60 70 80 90 100
UCM (%)
vis
co
sit
y (
cP
)
heavy oils
incr
easi
ng b
iode
grad
atio
n
0.07
0.09
0.11
0.13
0.15
50 60 70 80 90 100
UCM (%)
aro
ma
tic
ity
C1-C
2 a
lkyl
benz
enes
+ 2
MN
+ 1
MN
+
DM
N /
n-C
5+
heavy oils
Figure 42 Left Unresolved compound mixture (UCM in %) of the heavy oil series from the WCSB versus viscosity. Right UCM (%) of the heavy oil series correlated to the aromaticity.
6.2.1.2.3.2 HEIDRUN OIL
Five oil samples (DSTs) from two wells were investigated from the Heidrun oil field. Nearly
all oils are from the Tilje Formation. They were chosen because they exhibit an API gravity
range from 20° up to 29° (Table 12).
Table 12 List of the wells, DST numbers, depth, API gravity and asphaltene amount of Heidrun oil samples used.
well
field
segment
GFZ
number sample
sample
type
depth
interval
stratigraphical
unit
API
gravity Asphaltene
m MD-RKB wt.%
6507/7-2 G G003881 DST 4A oil 2340-2330 Tilje Fm. 3.2 29 0.26
6507/7-2 G G003882 DST 3 oil 2376-2365 Tilje Fm. 2.2-2.3 24 0.32
6507/7-2 G G003883 DST 2 oil 2439-2417 Åre Fm. 2.10-2.11 22 0.59
6507/8-1 I G003896 DST 2 oil 2406-2386 Tilje 3.3 - 4 23 0.33
6507/8-1 I G003897 DST 1 oil 2462.5-2444 Tilje 2.2 - 2.4 20 0.44
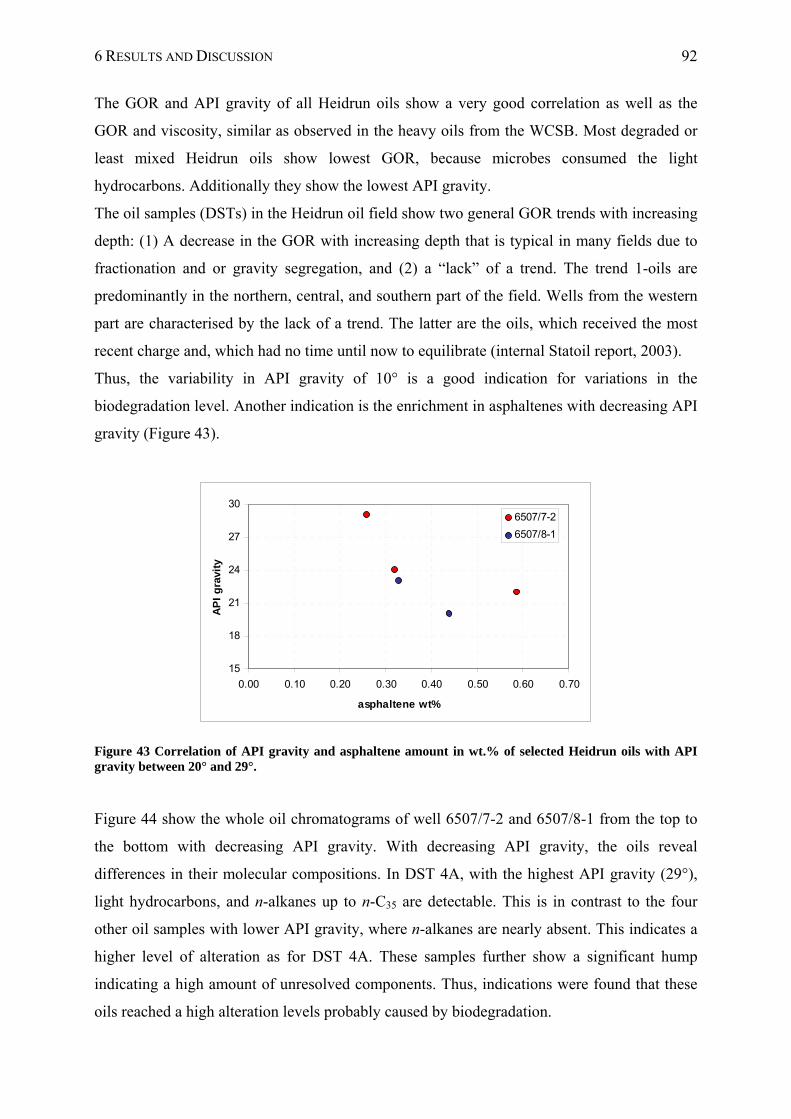
6 RESULTS AND DISCUSSION 92
The GOR and API gravity of all Heidrun oils show a very good correlation as well as the
GOR and viscosity, similar as observed in the heavy oils from the WCSB. Most degraded or
least mixed Heidrun oils show lowest GOR, because microbes consumed the light
hydrocarbons. Additionally they show the lowest API gravity.
The oil samples (DSTs) in the Heidrun oil field show two general GOR trends with increasing
depth: (1) A decrease in the GOR with increasing depth that is typical in many fields due to
fractionation and or gravity segregation, and (2) a “lack” of a trend. The trend 1-oils are
predominantly in the northern, central, and southern part of the field. Wells from the western
part are characterised by the lack of a trend. The latter are the oils, which received the most
recent charge and, which had no time until now to equilibrate (internal Statoil report, 2003).
Thus, the variability in API gravity of 10° is a good indication for variations in the
biodegradation level. Another indication is the enrichment in asphaltenes with decreasing API
gravity (Figure 43).
15
18
21
24
27
30
0.00 0.10 0.20 0.30 0.40 0.50 0.60 0.70
asphaltene wt%
AP
I g
ravi
ty
6507/7-2
6507/8-1
Figure 43 Correlation of API gravity and asphaltene amount in wt.% of selected Heidrun oils with API gravity between 20° and 29°.
Figure 44 show the whole oil chromatograms of well 6507/7-2 and 6507/8-1 from the top to
the bottom with decreasing API gravity. With decreasing API gravity, the oils reveal
differences in their molecular compositions. In DST 4A, with the highest API gravity (29°),
light hydrocarbons, and n-alkanes up to n-C35 are detectable. This is in contrast to the four
other oil samples with lower API gravity, where n-alkanes are nearly absent. This indicates a
higher level of alteration as for DST 4A. These samples further show a significant hump
indicating a high amount of unresolved components. Thus, indications were found that these
oils reached a high alteration levels probably caused by biodegradation.
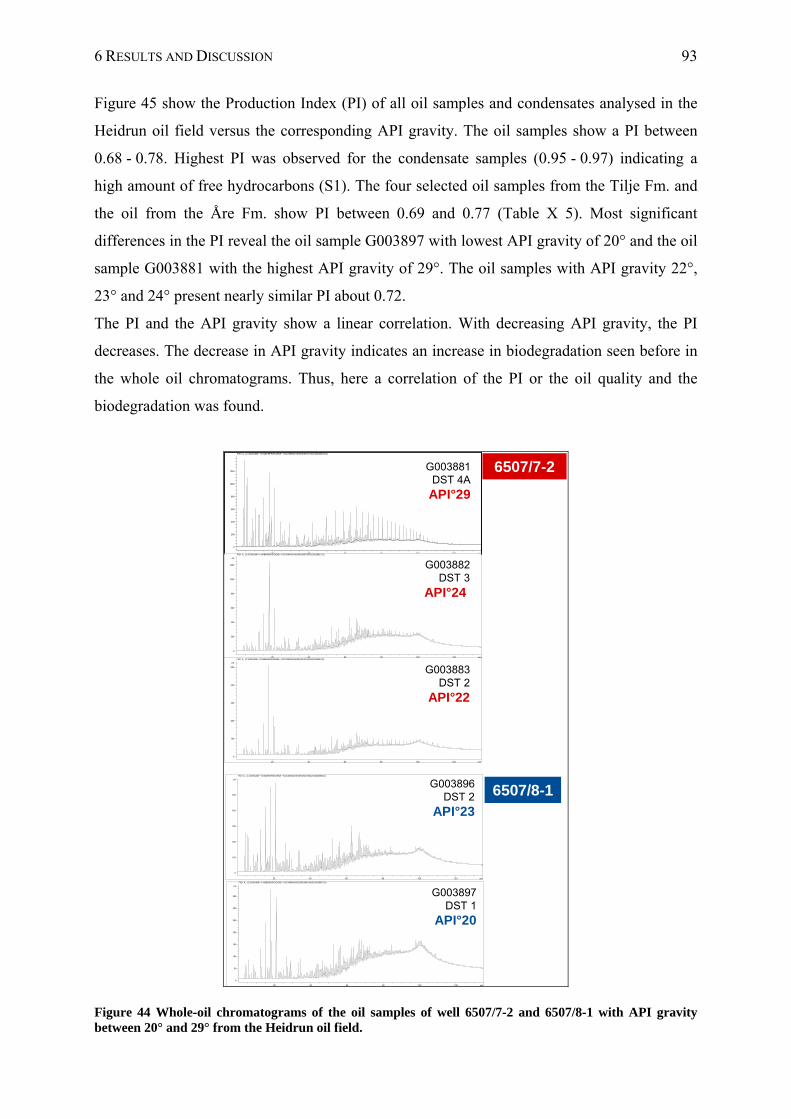
6 RESULTS AND DISCUSSION 93
Figure 45 show the Production Index (PI) of all oil samples and condensates analysed in the
Heidrun oil field versus the corresponding API gravity. The oil samples show a PI between
0.68 - 0.78. Highest PI was observed for the condensate samples (0.95 - 0.97) indicating a
high amount of free hydrocarbons (S1). The four selected oil samples from the Tilje Fm. and
the oil from the Åre Fm. show PI between 0.69 and 0.77 (Table X 5). Most significant
differences in the PI reveal the oil sample G003897 with lowest API gravity of 20° and the oil
sample G003881 with the highest API gravity of 29°. The oil samples with API gravity 22°,
23° and 24° present nearly similar PI about 0.72.
The PI and the API gravity show a linear correlation. With decreasing API gravity, the PI
decreases. The decrease in API gravity indicates an increase in biodegradation seen before in
the whole oil chromatograms. Thus, here a correlation of the PI or the oil quality and the
biodegradation was found.
min20 40 60 80 100 120
0
200
400
600
800
1000
1200
FID1 A, (C:\DOKUME~1\HABERER\EIGENE~1\GC\INRAD\HEIDRUN\070502\G0038810.D)
min20 40 60 80 100 120
0
200
400
600
800
1000
1200
FID1 A, (C:\DOKUME~1\HABERER\EIGENE~1\GC\INRAD\HEIDRUN\070502\G0038810.D)
G003881DST 4A
API°29
min20 40 60 80 100 120
pA
0
200
400
600
800
1000
1200
FID1 A, (C:\DOKUME~1\HABERER\EIGENE~1\GC\INRAD\HEIDRUN\070502\G0038821.D)
min20 40 60 80 100 120
pA
0
100
200
300
400
500
FID1 A, (C:\DOKUME~1\HABERER\EIGENE~1\GC\INRAD\HEIDRUN\070502\G0038830.D)
G003882DST 3
API°24
G003883DST 2
API°22
min20 40 60 80 100 120
pA
0
100
200
300
400
500
FID1 A, (C:\DOKUME~1\HABERER\EIGENE~1\GC\INRAD\HEIDRUN\070502\G0038960.D)
min20 40 60 80 100 120
pA
0
50
100
150
200
250
300
350
FID1 A, (C:\DOKUME~1\HABERER\EIGENE~1\GC\INRAD\HEIDRUN\070502\G0038970.D)
G003897DST 1
API°20
G003896DST 2
API°23
6507/7-2
6507/8-1
Figure 44 Whole-oil chromatograms of the oil samples of well 6507/7-2 and 6507/8-1 with API gravity between 20° and 29° from the Heidrun oil field.
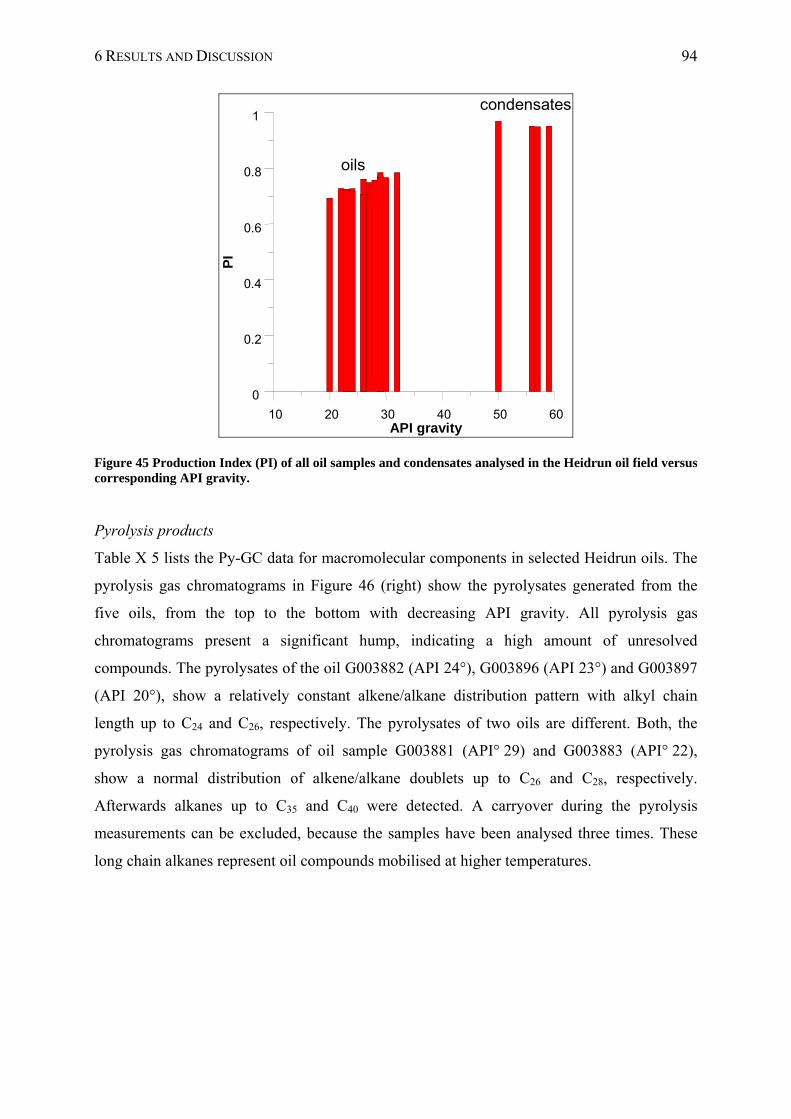
6 RESULTS AND DISCUSSION 94
condensates
oils
10 20 30 40 50 60API gravity
0
0.2
0.4
0.6
0.8
1
PI
Figure 45 Production Index (PI) of all oil samples and condensates analysed in the Heidrun oil field versus corresponding API gravity.
Pyrolysis products
Table X 5 lists the Py-GC data for macromolecular components in selected Heidrun oils. The
pyrolysis gas chromatograms in Figure 46 (right) show the pyrolysates generated from the
five oils, from the top to the bottom with decreasing API gravity. All pyrolysis gas
chromatograms present a significant hump, indicating a high amount of unresolved
compounds. The pyrolysates of the oil G003882 (API 24°), G003896 (API 23°) and G003897
(API 20°), show a relatively constant alkene/alkane distribution pattern with alkyl chain
length up to C24 and C26, respectively. The pyrolysates of two oils are different. Both, the
pyrolysis gas chromatograms of oil sample G003881 (API° 29) and G003883 (API° 22),
show a normal distribution of alkene/alkane doublets up to C26 and C28, respectively.
Afterwards alkanes up to C35 and C40 were detected. A carryover during the pyrolysis
measurements can be excluded, because the samples have been analysed three times. These
long chain alkanes represent oil compounds mobilised at higher temperatures.
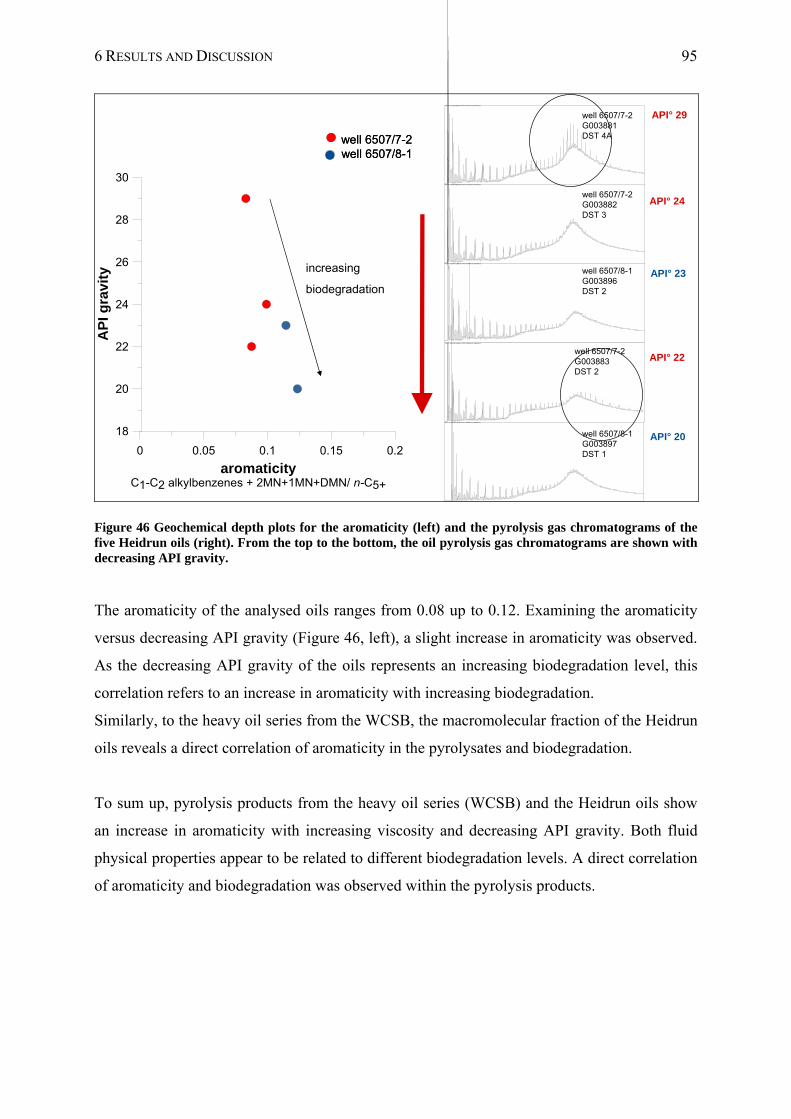
6 RESULTS AND DISCUSSION 95
FID1 A, (C:\DATEN\HEIDRUN\L-PYRO~1\G003881A.D\..\G003881A.D)
well 6507/7-2 G003881DST 4A
FID1 A, (C:\DATEN\HEIDRUN\L-PYRO~1\G003882A.D\..\G003882A.D)
well 6507/7-2 G003882DST 3
FID1 A, (C:\DATEN\HEIDRUN\L-PYRO~1\G003883A.D\..\G003883A.D)
well 6507/7-2 G003883DST 2
API° 29
API° 24
API° 22
FID1 A, (C:\DATEN\HEIDRUN\L-PYRO~1\G003896A.D\..\G003896A.D)
FID1 A, (C:\DATEN\HEIDRUN\L-PYRO~1\G003897A.D\..\G003897A.D)
well 6507/8-1 G003896DST 2
API° 23
well 6507/8-1 G003897DST 1
API° 20
well 6507/8-1well 6507/7-2well 6507/8-1well 6507/7-2
0 0.05 0.1 0.15 0.2
aromaticityC1-C2 alkylbenzenes + 2MN+1MN+DMN/ n-C5+
18
20
22
24
26
28
30
AP
I gra
vity increasing
biodegradation
Figure 46 Geochemical depth plots for the aromaticity (left) and the pyrolysis gas chromatograms of the five Heidrun oils (right). From the top to the bottom, the oil pyrolysis gas chromatograms are shown with decreasing API gravity.
The aromaticity of the analysed oils ranges from 0.08 up to 0.12. Examining the aromaticity
versus decreasing API gravity (Figure 46, left), a slight increase in aromaticity was observed.
As the decreasing API gravity of the oils represents an increasing biodegradation level, this
correlation refers to an increase in aromaticity with increasing biodegradation.
Similarly, to the heavy oil series from the WCSB, the macromolecular fraction of the Heidrun
oils reveals a direct correlation of aromaticity in the pyrolysates and biodegradation.
To sum up, pyrolysis products from the heavy oil series (WCSB) and the Heidrun oils show
an increase in aromaticity with increasing viscosity and decreasing API gravity. Both fluid
physical properties appear to be related to different biodegradation levels. A direct correlation
of aromaticity and biodegradation was observed within the pyrolysis products.
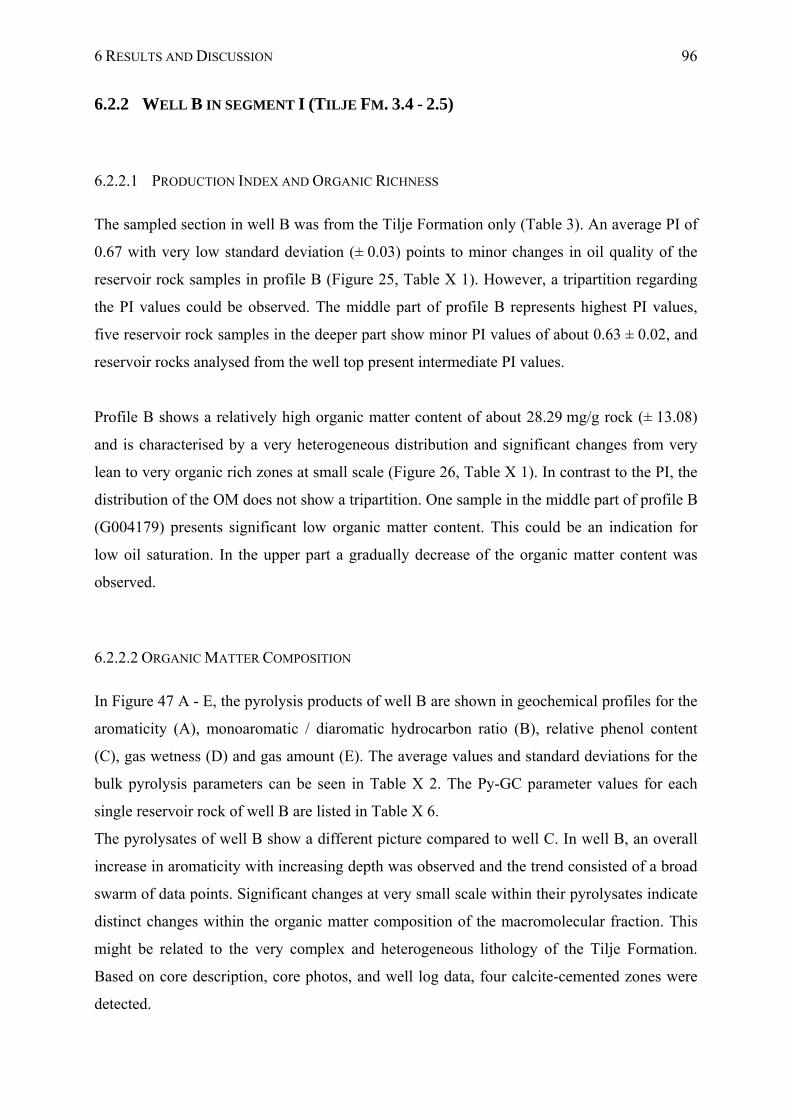
6 RESULTS AND DISCUSSION 96
6.2.2 WELL B IN SEGMENT I (TILJE FM. 3.4 - 2.5)
6.2.2.1 PRODUCTION INDEX AND ORGANIC RICHNESS
The sampled section in well B was from the Tilje Formation only (Table 3). An average PI of
0.67 with very low standard deviation (± 0.03) points to minor changes in oil quality of the
reservoir rock samples in profile B (Figure 25, Table X 1). However, a tripartition regarding
the PI values could be observed. The middle part of profile B represents highest PI values,
five reservoir rock samples in the deeper part show minor PI values of about 0.63 ± 0.02, and
reservoir rocks analysed from the well top present intermediate PI values.
Profile B shows a relatively high organic matter content of about 28.29 mg/g rock (± 13.08)
and is characterised by a very heterogeneous distribution and significant changes from very
lean to very organic rich zones at small scale (Figure 26, Table X 1). In contrast to the PI, the
distribution of the OM does not show a tripartition. One sample in the middle part of profile B
(G004179) presents significant low organic matter content. This could be an indication for
low oil saturation. In the upper part a gradually decrease of the organic matter content was
observed.
6.2.2.2 ORGANIC MATTER COMPOSITION
In Figure 47 A - E, the pyrolysis products of well B are shown in geochemical profiles for the
aromaticity (A), monoaromatic / diaromatic hydrocarbon ratio (B), relative phenol content
(C), gas wetness (D) and gas amount (E). The average values and standard deviations for the
bulk pyrolysis parameters can be seen in Table X 2. The Py-GC parameter values for each
single reservoir rock of well B are listed in Table X 6.
The pyrolysates of well B show a different picture compared to well C. In well B, an overall
increase in aromaticity with increasing depth was observed and the trend consisted of a broad
swarm of data points. Significant changes at very small scale within their pyrolysates indicate
distinct changes within the organic matter composition of the macromolecular fraction. This
might be related to the very complex and heterogeneous lithology of the Tilje Formation.
Based on core description, core photos, and well log data, four calcite-cemented zones were
detected.
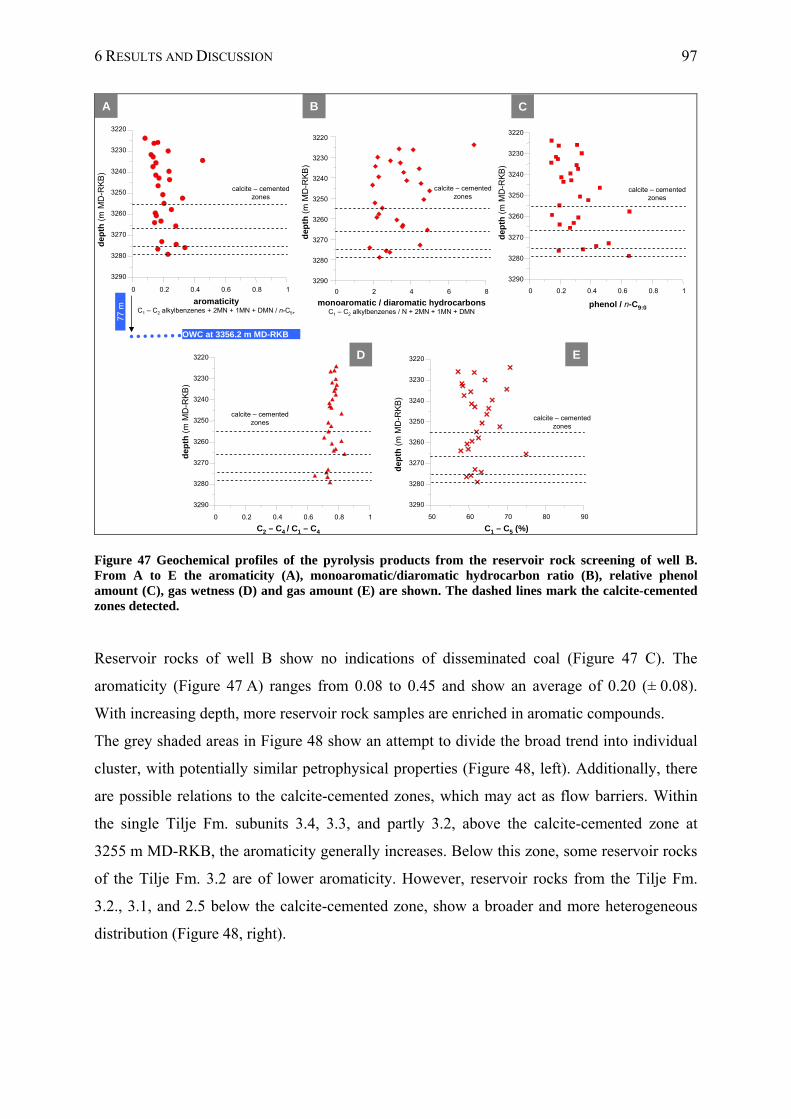
6 RESULTS AND DISCUSSION 97
OWC at 3356.2 m MD-RKB
77 m
0 0.2 0.4 0.6 0.8 1
3290
3280
3270
3260
3250
3240
3230
3220
dep
th (
m M
D-R
KB
)
aromaticityC1 – C2 alkylbenzenes + 2MN + 1MN + DMN / n-C5+
0 2 4 6 8
3290
3280
3270
3260
3250
3240
3230
3220
monoaromatic / diaromatic hydrocarbonsC1 – C2 alkylbenzenes / N + 2MN + 1MN + DMN
dep
th (
m M
D-R
KB
)
0 0.2 0.4 0.6 0.8 1
3290
3280
3270
3260
3250
3240
3230
3220
dep
th (
m M
D-R
KB
)
phenol / n-C9:0
50 60 70 80 90
3290
3280
3270
3260
3250
3240
3230
3220
C1 – C5 (%)
dep
th (
m M
D-R
KB
)
0 0.2 0.4 0.6 0.8 1
3290
3280
3270
3260
3250
3240
3230
3220
dep
th (
m M
D-R
KB
)
C2 – C4 / C1 – C4
calcite – cemented zones
calcite – cemented zones
calcite – cemented zones
calcite – cemented zones
calcite – cemented zones
A B C
E
B
D
Figure 47 Geochemical profiles of the pyrolysis products from the reservoir rock screening of well B. From A to E the aromaticity (A), monoaromatic/diaromatic hydrocarbon ratio (B), relative phenol amount (C), gas wetness (D) and gas amount (E) are shown. The dashed lines mark the calcite-cemented zones detected.
Reservoir rocks of well B show no indications of disseminated coal (Figure 47 C). The
aromaticity (Figure 47 A) ranges from 0.08 to 0.45 and show an average of 0.20 (± 0.08).
With increasing depth, more reservoir rock samples are enriched in aromatic compounds.
The grey shaded areas in Figure 48 show an attempt to divide the broad trend into individual
cluster, with potentially similar petrophysical properties (Figure 48, left). Additionally, there
are possible relations to the calcite-cemented zones, which may act as flow barriers. Within
the single Tilje Fm. subunits 3.4, 3.3, and partly 3.2, above the calcite-cemented zone at
3255 m MD-RKB, the aromaticity generally increases. Below this zone, some reservoir rocks
of the Tilje Fm. 3.2 are of lower aromaticity. However, reservoir rocks from the Tilje Fm.
3.2., 3.1, and 2.5 below the calcite-cemented zone, show a broader and more heterogeneous
distribution (Figure 48, right).
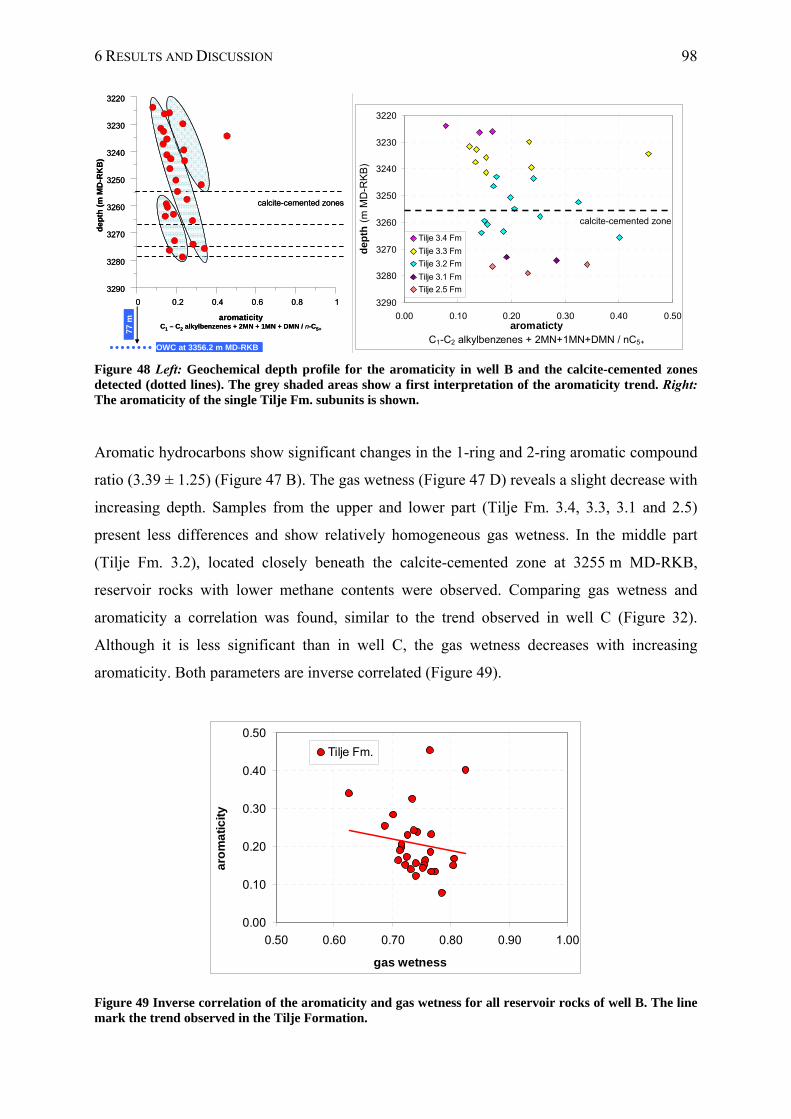
6 RESULTS AND DISCUSSION 98
OWC at 3356.2 m MD-RKB
77 m
calcite-cemented zones
0 0.2 0.4 0.6 0.8 1
3290
3280
3270
3260
3250
3240
3230
3220d
ep
th (
m M
D-R
KB
)
aromaticityC1 – C2 alkylbenzenes + 2MN + 1MN + DMN / n-C5+
OWC at 3356.2 m MD-RKB
77 m
calcite-cemented zones
0 0.2 0.4 0.6 0.8 1
3290
3280
3270
3260
3250
3240
3230
3220d
ep
th (
m M
D-R
KB
)
aromaticityC1 – C2 alkylbenzenes + 2MN + 1MN + DMN / n-C5+
3220
3230
3240
3250
3260
3270
3280
3290
0.00 0.10 0.20 0.30 0.40 0.50aromaticty
C1-C2 alkylbenzenes + 2MN+1MN+DMN / nC5+
dep
th (
m M
D-R
KB
)
Tilje 3.4 Fm
Tilje 3.3 Fm
Tilje 3.2 Fm
Tilje 3.1 Fm
Tilje 2.5 Fm
calcite-cemented zone
Figure 48 Left: Geochemical depth profile for the aromaticity in well B and the calcite-cemented zones detected (dotted lines). The grey shaded areas show a first interpretation of the aromaticity trend. Right: The aromaticity of the single Tilje Fm. subunits is shown.
Aromatic hydrocarbons show significant changes in the 1-ring and 2-ring aromatic compound
ratio (3.39 ± 1.25) (Figure 47 B). The gas wetness (Figure 47 D) reveals a slight decrease with
increasing depth. Samples from the upper and lower part (Tilje Fm. 3.4, 3.3, 3.1 and 2.5)
present less differences and show relatively homogeneous gas wetness. In the middle part
(Tilje Fm. 3.2), located closely beneath the calcite-cemented zone at 3255 m MD-RKB,
reservoir rocks with lower methane contents were observed. Comparing gas wetness and
aromaticity a correlation was found, similar to the trend observed in well C (Figure 32).
Although it is less significant than in well C, the gas wetness decreases with increasing
aromaticity. Both parameters are inverse correlated (Figure 49).
0.00
0.10
0.20
0.30
0.40
0.50
0.50 0.60 0.70 0.80 0.90 1.00
gas wetness
aro
ma
tic
ity
Tilje Fm.
Figure 49 Inverse correlation of the aromaticity and gas wetness for all reservoir rocks of well B. The line mark the trend observed in the Tilje Formation.
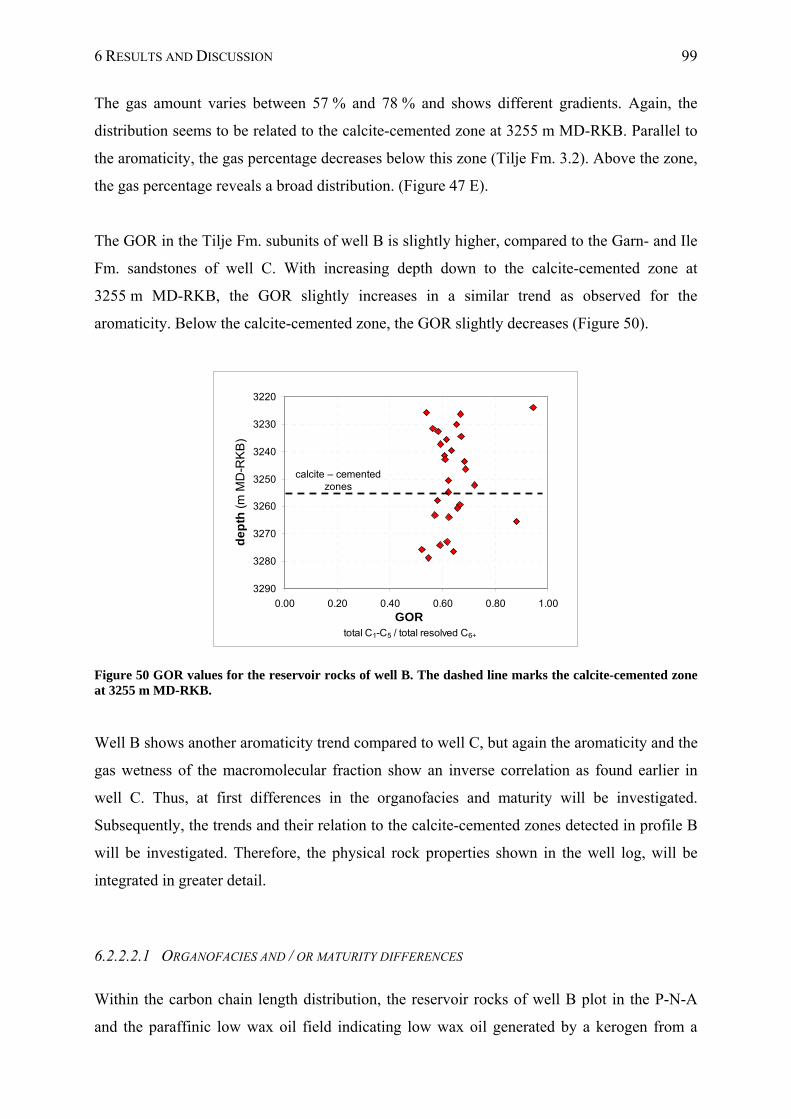
6 RESULTS AND DISCUSSION 99
The gas amount varies between 57 % and 78 % and shows different gradients. Again, the
distribution seems to be related to the calcite-cemented zone at 3255 m MD-RKB. Parallel to
the aromaticity, the gas percentage decreases below this zone (Tilje Fm. 3.2). Above the zone,
the gas percentage reveals a broad distribution. (Figure 47 E).
The GOR in the Tilje Fm. subunits of well B is slightly higher, compared to the Garn- and Ile
Fm. sandstones of well C. With increasing depth down to the calcite-cemented zone at
3255 m MD-RKB, the GOR slightly increases in a similar trend as observed for the
aromaticity. Below the calcite-cemented zone, the GOR slightly decreases (Figure 50).
3220
3230
3240
3250
3260
3270
3280
3290
0.00 0.20 0.40 0.60 0.80 1.00GOR
total C1-C5 / total resolved C6+
de
pth
(m
MD
-RK
B)
calcite – cemented zones
Figure 50 GOR values for the reservoir rocks of well B. The dashed line marks the calcite-cemented zone at 3255 m MD-RKB.
Well B shows another aromaticity trend compared to well C, but again the aromaticity and the
gas wetness of the macromolecular fraction show an inverse correlation as found earlier in
well C. Thus, at first differences in the organofacies and maturity will be investigated.
Subsequently, the trends and their relation to the calcite-cemented zones detected in profile B
will be investigated. Therefore, the physical rock properties shown in the well log, will be
integrated in greater detail.
6.2.2.2.1 ORGANOFACIES AND / OR MATURITY DIFFERENCES
Within the carbon chain length distribution, the reservoir rocks of well B plot in the P-N-A
and the paraffinic low wax oil field indicating low wax oil generated by a kerogen from a
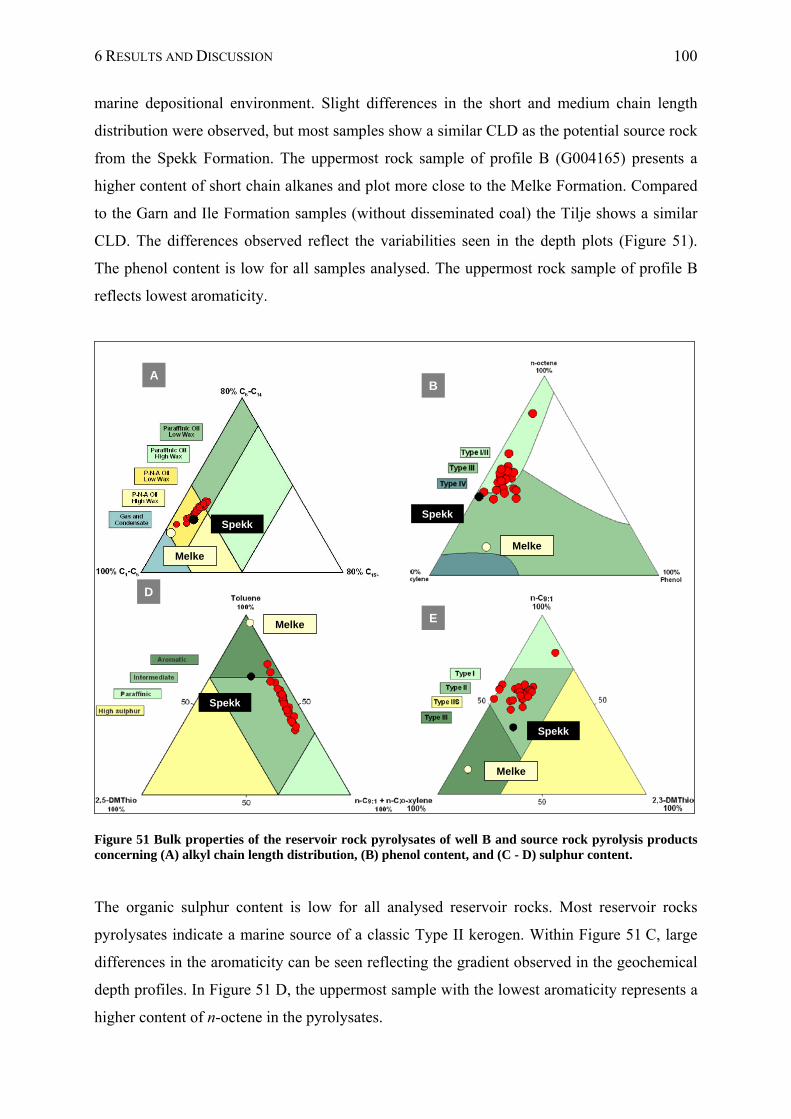
6 RESULTS AND DISCUSSION 100
marine depositional environment. Slight differences in the short and medium chain length
distribution were observed, but most samples show a similar CLD as the potential source rock
from the Spekk Formation. The uppermost rock sample of profile B (G004165) presents a
higher content of short chain alkanes and plot more close to the Melke Formation. Compared
to the Garn and Ile Formation samples (without disseminated coal) the Tilje shows a similar
CLD. The differences observed reflect the variabilities seen in the depth plots (Figure 51).
The phenol content is low for all samples analysed. The uppermost rock sample of profile B
reflects lowest aromaticity.
Spekk
Melke
Spekk
Melke
25Spekk
Melke
Spekk
Melke
AB
D
E
Figure 51 Bulk properties of the reservoir rock pyrolysates of well B and source rock pyrolysis products concerning (A) alkyl chain length distribution, (B) phenol content, and (C - D) sulphur content.
The organic sulphur content is low for all analysed reservoir rocks. Most reservoir rocks
pyrolysates indicate a marine source of a classic Type II kerogen. Within Figure 51 C, large
differences in the aromaticity can be seen reflecting the gradient observed in the geochemical
depth profiles. In Figure 51 D, the uppermost sample with the lowest aromaticity represents a
higher content of n-octene in the pyrolysates.
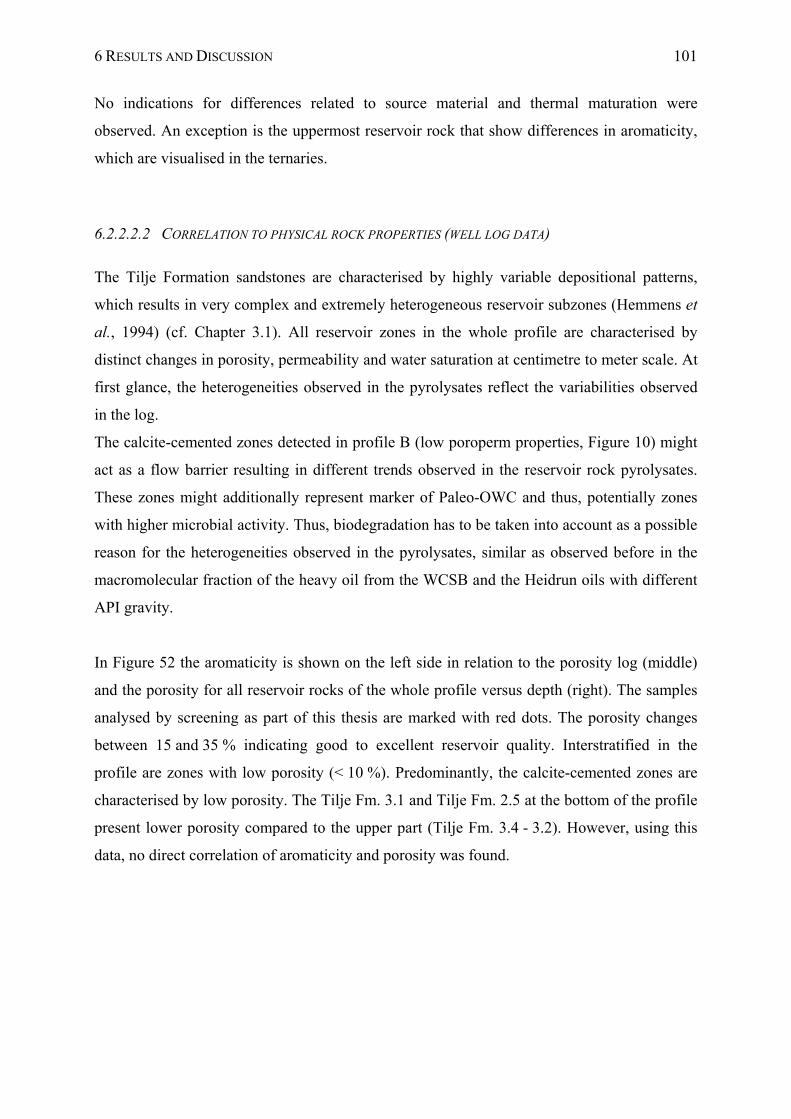
6 RESULTS AND DISCUSSION 101
No indications for differences related to source material and thermal maturation were
observed. An exception is the uppermost reservoir rock that show differences in aromaticity,
which are visualised in the ternaries.
6.2.2.2.2 CORRELATION TO PHYSICAL ROCK PROPERTIES (WELL LOG DATA)
The Tilje Formation sandstones are characterised by highly variable depositional patterns,
which results in very complex and extremely heterogeneous reservoir subzones (Hemmens et
al., 1994) (cf. Chapter 3.1). All reservoir zones in the whole profile are characterised by
distinct changes in porosity, permeability and water saturation at centimetre to meter scale. At
first glance, the heterogeneities observed in the pyrolysates reflect the variabilities observed
in the log.
The calcite-cemented zones detected in profile B (low poroperm properties, Figure 10) might
act as a flow barrier resulting in different trends observed in the reservoir rock pyrolysates.
These zones might additionally represent marker of Paleo-OWC and thus, potentially zones
with higher microbial activity. Thus, biodegradation has to be taken into account as a possible
reason for the heterogeneities observed in the pyrolysates, similar as observed before in the
macromolecular fraction of the heavy oil from the WCSB and the Heidrun oils with different
API gravity.
In Figure 52 the aromaticity is shown on the left side in relation to the porosity log (middle)
and the porosity for all reservoir rocks of the whole profile versus depth (right). The samples
analysed by screening as part of this thesis are marked with red dots. The porosity changes
between 15 and 35 % indicating good to excellent reservoir quality. Interstratified in the
profile are zones with low porosity (< 10 %). Predominantly, the calcite-cemented zones are
characterised by low porosity. The Tilje Fm. 3.1 and Tilje Fm. 2.5 at the bottom of the profile
present lower porosity compared to the upper part (Tilje Fm. 3.4 - 3.2). However, using this
data, no direct correlation of aromaticity and porosity was found.
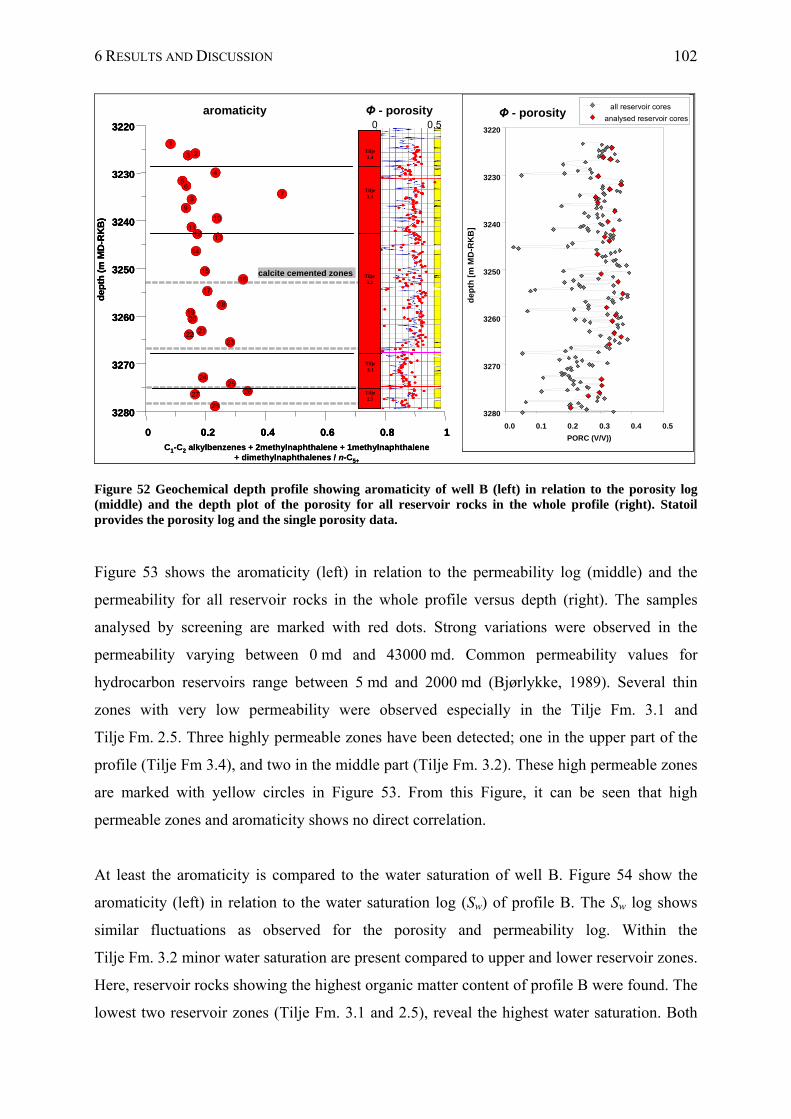
6 RESULTS AND DISCUSSION 102
Φ - porosity0 0.5
C1-C2 alkylbenzenes + 2methylnaphthalene + 1methylnaphthalene + dimethylnaphthalenes / n-C5+
aromaticity
calcite cemented zones
0 0.2 0.4 0.6 0.8 1
3280
3270
3260
3250
3240
3230
3220
dep
th (
m M
D-R
KB
)
1
23
456
78
9
1011
1213
14
1516
17
181920
212223
2425
2627
28
Tilje 3.4
Tilje3.3
Tilje3.2
Tilje3.1
Tilje2.5
aromaticity
calcite cemented zones
0 0.2 0.4 0.6 0.8 1
3280
3270
3260
3250
3240
3230
3220
dep
th (
m M
D-R
KB
)
1
23
456
78
9
1011
1213
14
1516
17
181920
212223
2425
2627
28
Tilje 3.4
Tilje3.3
Tilje3.2
Tilje3.1
Tilje2.5
Tilje 3.4
Tilje3.3
Tilje3.2
Tilje3.1
Tilje2.5
Tilje 3.4
Tilje3.3
Tilje3.2
Tilje3.1
Tilje2.5
Φ - porosity3220
3230
3240
3250
3260
3270
3280
0.0 0.1 0.2 0.3 0.4 0.5
PORC (V/V))
de
pth
[m
MD
-RK
B]
all reservoir cores
analysed reservoir cores
all reservoir cores
analysed reservoir cores
Figure 52 Geochemical depth profile showing aromaticity of well B (left) in relation to the porosity log (middle) and the depth plot of the porosity for all reservoir rocks in the whole profile (right). Statoil provides the porosity log and the single porosity data.
Figure 53 shows the aromaticity (left) in relation to the permeability log (middle) and the
permeability for all reservoir rocks in the whole profile versus depth (right). The samples
analysed by screening are marked with red dots. Strong variations were observed in the
permeability varying between 0 md and 43000 md. Common permeability values for
hydrocarbon reservoirs range between 5 md and 2000 md (Bjørlykke, 1989). Several thin
zones with very low permeability were observed especially in the Tilje Fm. 3.1 and
Tilje Fm. 2.5. Three highly permeable zones have been detected; one in the upper part of the
profile (Tilje Fm 3.4), and two in the middle part (Tilje Fm. 3.2). These high permeable zones
are marked with yellow circles in Figure 53. From this Figure, it can be seen that high
permeable zones and aromaticity shows no direct correlation.
At least the aromaticity is compared to the water saturation of well B. Figure 54 show the
aromaticity (left) in relation to the water saturation log (Sw) of profile B. The Sw log shows
similar fluctuations as observed for the porosity and permeability log. Within the
Tilje Fm. 3.2 minor water saturation are present compared to upper and lower reservoir zones.
Here, reservoir rocks showing the highest organic matter content of profile B were found. The
lowest two reservoir zones (Tilje Fm. 3.1 and 2.5), reveal the highest water saturation. Both
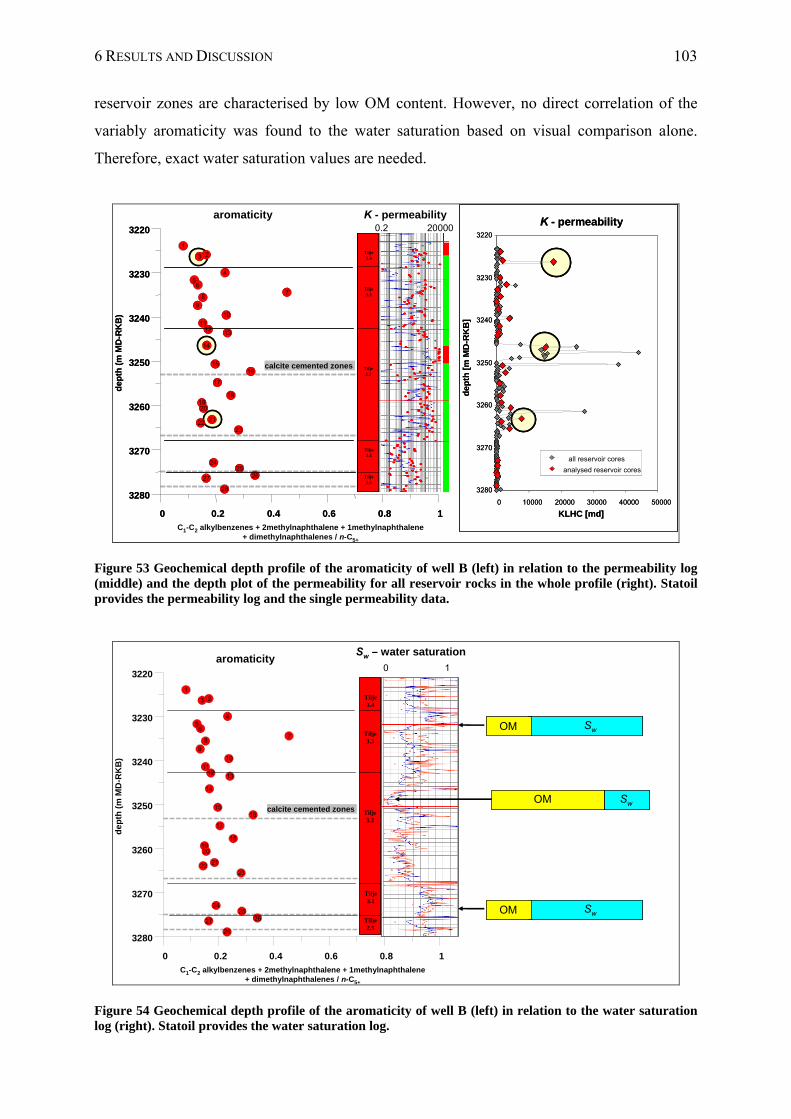
6 RESULTS AND DISCUSSION 103
reservoir zones are characterised by low OM content. However, no direct correlation of the
variably aromaticity was found to the water saturation based on visual comparison alone.
Therefore, exact water saturation values are needed.
0.2 20000Κ - permeability
C1-C2 alkylbenzenes + 2methylnaphthalene + 1methylnaphthalene + dimethylnaphthalenes / n-C5+
aromaticity
calcite cemented zones
0 0.2 0.4 0.6 0.8 1
3280
3270
3260
3250
3240
3230
3220
dep
th (
m M
D-R
KB
)
1
23
456
78
9
1011
12 13
14
1516
17
181920
212223
2425
2627
28
Tilje 3.4
Tilje3.3
Tilje3.2
Tilje3.1
Tilje2.5
aromaticity
calcite cemented zones
0 0.2 0.4 0.6 0.8 1
3280
3270
3260
3250
3240
3230
3220
dep
th (
m M
D-R
KB
)
1
23
456
78
9
1011
12 13
14
1516
17
181920
212223
2425
2627
28
Tilje 3.4
Tilje3.3
Tilje3.2
Tilje3.1
Tilje2.5
Tilje 3.4
Tilje3.3
Tilje3.2
Tilje3.1
Tilje2.5
Tilje 3.4
Tilje3.3
Tilje3.2
Tilje3.1
Tilje2.5
3220
3230
3240
3250
3260
3270
3280
0 10000 20000 30000 40000 50000
KLHC [md]
Κ - permeability
all reservoir cores
analysed reservoir cores d
ep
th [
m M
D-R
KB
]
3220
3230
3240
3250
3260
3270
3280
0 10000 20000 30000 40000 50000
KLHC [md]
Κ - permeability
all reservoir cores
analysed reservoir cores
all reservoir cores
analysed reservoir cores d
ep
th [
m M
D-R
KB
]
Figure 53 Geochemical depth profile of the aromaticity of well B (left) in relation to the permeability log (middle) and the depth plot of the permeability for all reservoir rocks in the whole profile (right). Statoil provides the permeability log and the single permeability data.
Sw – water saturation
0 1
OM SwOM Sw
OM SwOM Sw
C1-C2 alkylbenzenes + 2methylnaphthalene + 1methylnaphthalene + dimethylnaphthalenes / n-C5+
aromaticity
calcite cemented zones
0 0.2 0.4 0.6 0.8 1
3280
3270
3260
3250
3240
3230
3220
dep
th (
m M
D-R
KB
)
1
23
456
78
9
1011
12 13
14
1516
17
181920
212223
2425
2627
28
Tilje 3.4
Tilje3.3
Tilje3.2
Tilje3.1
Tilje2.5
OM SwOM Sw
Figure 54 Geochemical depth profile of the aromaticity of well B (left) in relation to the water saturation log (right). Statoil provides the water saturation log.
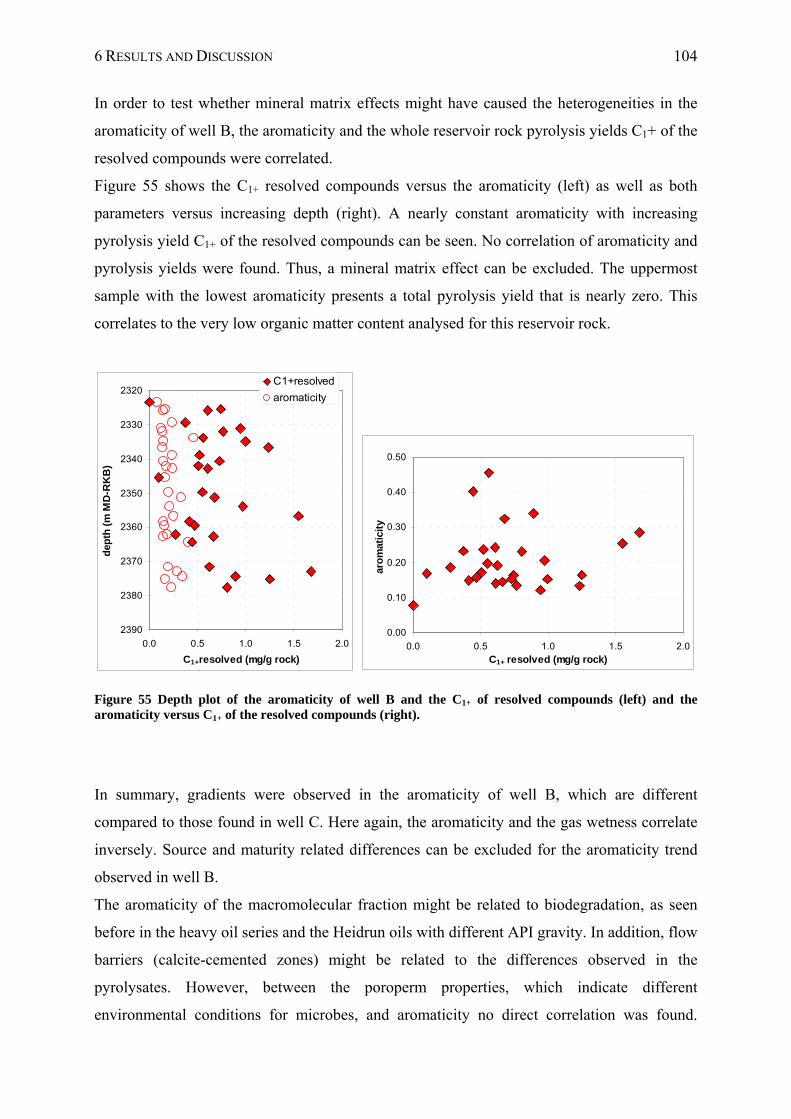
6 RESULTS AND DISCUSSION 104
In order to test whether mineral matrix effects might have caused the heterogeneities in the
aromaticity of well B, the aromaticity and the whole reservoir rock pyrolysis yields C1+ of the
resolved compounds were correlated.
Figure 55 shows the C1+ resolved compounds versus the aromaticity (left) as well as both
parameters versus increasing depth (right). A nearly constant aromaticity with increasing
pyrolysis yield C1+ of the resolved compounds can be seen. No correlation of aromaticity and
pyrolysis yields were found. Thus, a mineral matrix effect can be excluded. The uppermost
sample with the lowest aromaticity presents a total pyrolysis yield that is nearly zero. This
correlates to the very low organic matter content analysed for this reservoir rock.
2320
2330
2340
2350
2360
2370
2380
2390
0.0 0.5 1.0 1.5 2.0
C1+resolved (mg/g rock)
dep
th (
m M
D-R
KB
)
C1+resolved
aromaticity
0.00
0.10
0.20
0.30
0.40
0.50
0.0 0.5 1.0 1.5 2.0
C1+ resolved (mg/g rock)
aro
mat
icit
y
Figure 55 Depth plot of the aromaticity of well B and the C1+ of resolved compounds (left) and the aromaticity versus C1+ of the resolved compounds (right).
In summary, gradients were observed in the aromaticity of well B, which are different
compared to those found in well C. Here again, the aromaticity and the gas wetness correlate
inversely. Source and maturity related differences can be excluded for the aromaticity trend
observed in well B.
The aromaticity of the macromolecular fraction might be related to biodegradation, as seen
before in the heavy oil series and the Heidrun oils with different API gravity. In addition, flow
barriers (calcite-cemented zones) might be related to the differences observed in the
pyrolysates. However, between the poroperm properties, which indicate different
environmental conditions for microbes, and aromaticity no direct correlation was found.
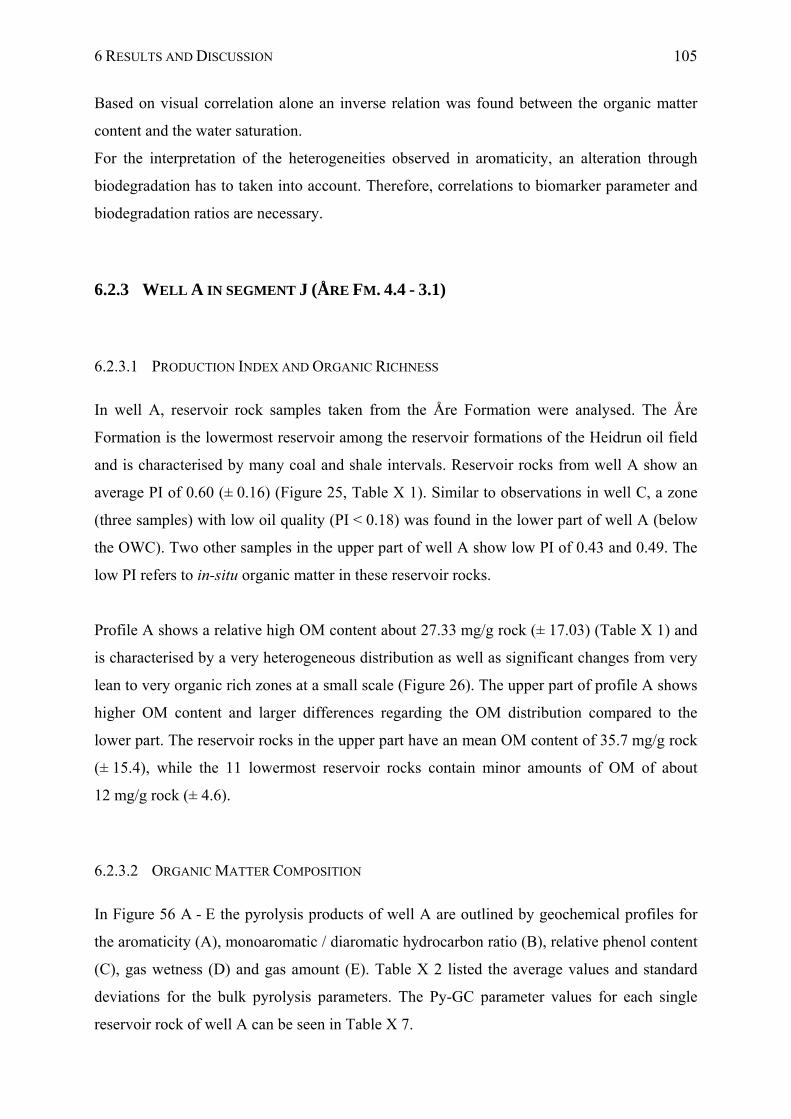
6 RESULTS AND DISCUSSION 105
Based on visual correlation alone an inverse relation was found between the organic matter
content and the water saturation.
For the interpretation of the heterogeneities observed in aromaticity, an alteration through
biodegradation has to taken into account. Therefore, correlations to biomarker parameter and
biodegradation ratios are necessary.
6.2.3 WELL A IN SEGMENT J (ÅRE FM. 4.4 - 3.1)
6.2.3.1 PRODUCTION INDEX AND ORGANIC RICHNESS
In well A, reservoir rock samples taken from the Åre Formation were analysed. The Åre
Formation is the lowermost reservoir among the reservoir formations of the Heidrun oil field
and is characterised by many coal and shale intervals. Reservoir rocks from well A show an
average PI of 0.60 (± 0.16) (Figure 25, Table X 1). Similar to observations in well C, a zone
(three samples) with low oil quality (PI < 0.18) was found in the lower part of well A (below
the OWC). Two other samples in the upper part of well A show low PI of 0.43 and 0.49. The
low PI refers to in-situ organic matter in these reservoir rocks.
Profile A shows a relative high OM content about 27.33 mg/g rock (± 17.03) (Table X 1) and
is characterised by a very heterogeneous distribution as well as significant changes from very
lean to very organic rich zones at a small scale (Figure 26). The upper part of profile A shows
higher OM content and larger differences regarding the OM distribution compared to the
lower part. The reservoir rocks in the upper part have an mean OM content of 35.7 mg/g rock
(± 15.4), while the 11 lowermost reservoir rocks contain minor amounts of OM of about
12 mg/g rock (± 4.6).
6.2.3.2 ORGANIC MATTER COMPOSITION
In Figure 56 A - E the pyrolysis products of well A are outlined by geochemical profiles for
the aromaticity (A), monoaromatic / diaromatic hydrocarbon ratio (B), relative phenol content
(C), gas wetness (D) and gas amount (E). Table X 2 listed the average values and standard
deviations for the bulk pyrolysis parameters. The Py-GC parameter values for each single
reservoir rock of well A can be seen in Table X 7.
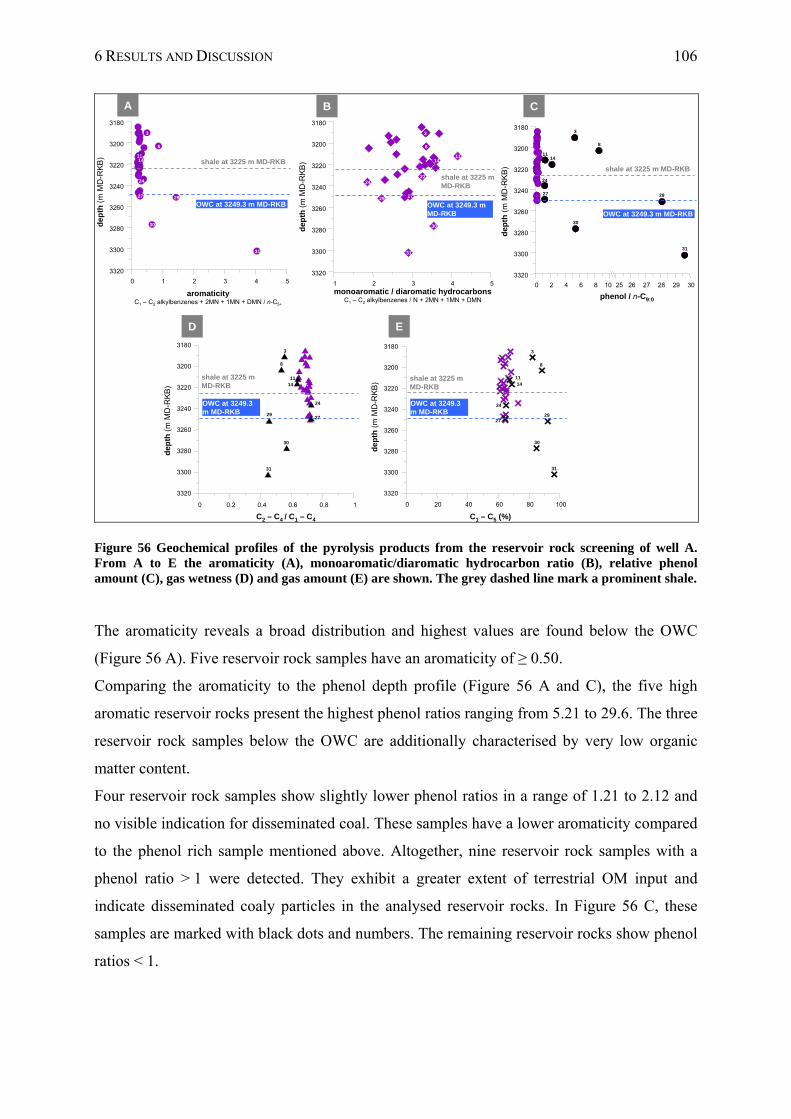
6 RESULTS AND DISCUSSION 106
0 1 2 3 4 5
3320
3300
3280
3260
3240
3220
3200
3180
3
8
1114
24
27 29
30
31
dep
th (
m M
D-R
KB
)
aromaticityC1 – C2 alkylbenzenes + 2MN + 1MN + DMN / n-C5+
0 0.2 0.4 0.6 0.8 1
3320
3300
3280
3260
3240
3220
3200
31803
8
1114
24
2729
30
31
OWC at 3249.3 m MD-RKB
1 2 3 4 5
3320
3300
3280
3260
3240
3220
3200
3180
3
8
1114
2224
2729
30
31
monoaromatic / diaromatic hydrocarbonsC1 – C2 alkylbenzenes / N + 2MN + 1MN + DMN
dep
th (
m M
D-R
KB
)
0 2 4 6 8 10 25 26 27 28 29 30
3320
3300
3280
3260
3240
3220
3200
31803
8
1114
24
27 29
30
31
de
pth
(m
MD
-RK
B)
phenol / n-C9:0
OWC at 3249.3 m MD-RKB OWC at 3249.3 m MD-RKB
0 20 40 60 80 100
3320
3300
3280
3260
3240
3220
3200
31803
8
1114
24
2729
30
31
dep
th (
m M
D-R
KB
)
dep
th (
m M
D-R
KB
)
C1 – C5 (%)C2 – C4 / C1 – C4
OWC at 3249.3 m MD-RKB
OWC at 3249.3 m MD-RKB
shale at 3225 m MD-RKB
shale at 3225 m MD-RKB
shale at 3225 m MD-RKB
shale at 3225 m MD-RKB
shale at 3225 m MD-RKB
A CB
D E
Figure 56 Geochemical profiles of the pyrolysis products from the reservoir rock screening of well A. From A to E the aromaticity (A), monoaromatic/diaromatic hydrocarbon ratio (B), relative phenol amount (C), gas wetness (D) and gas amount (E) are shown. The grey dashed line mark a prominent shale.
The aromaticity reveals a broad distribution and highest values are found below the OWC
(Figure 56 A). Five reservoir rock samples have an aromaticity of ≥ 0.50.
Comparing the aromaticity to the phenol depth profile (Figure 56 A and C), the five high
aromatic reservoir rocks present the highest phenol ratios ranging from 5.21 to 29.6. The three
reservoir rock samples below the OWC are additionally characterised by very low organic
matter content.
Four reservoir rock samples show slightly lower phenol ratios in a range of 1.21 to 2.12 and
no visible indication for disseminated coal. These samples have a lower aromaticity compared
to the phenol rich sample mentioned above. Altogether, nine reservoir rock samples with a
phenol ratio > 1 were detected. They exhibit a greater extent of terrestrial OM input and
indicate disseminated coaly particles in the analysed reservoir rocks. In Figure 56 C, these
samples are marked with black dots and numbers. The remaining reservoir rocks show phenol
ratios < 1.
6 RESULTS AND DISCUSSION 107
Ignoring the nine coaly samples, the aromaticity shows a distinct lower variability (Figure 57,
left). In contrast to the trend observed in well B and well C, the reservoir rocks of well A
don’t reveal any gradient in aromaticity down to the OWC. Additionally, they are not
influenced by the shale observed at 3225 m MD-RKB, which was detected using well log
signals. Most of the reservoir rock pyrolysates show aromaticity between 0.18 and 0.26
indicating minor differences with increasing depth. Independent from the shale at 3225 m MD
RKB, three samples present higher aromaticity but low phenol ratio. (reservoir rock no. 9 =
G004137, reservoir rock no. 10 = G004138, and reservoir rock no. 23 = G004153).
OWC at 3249.3 m MD-RKB
0 0.2 0.4 0.6 0.8 1
3320
3300
3280
3260
3240
3220
3200
31801
24 56
79
101213
15 16171819 202122
23
252628
de
pth
(m
MD
-RK
B)
aromaticityC1 – C2 alkylbenzenes + 2MN + 1MN + DMN / n-C5+
0 2 4 6 8 10 25 26 27 28 29 30
3320
3300
3280
3260
3240
3220
3200
31803
8
1114
24
27
30
31
phenol / n-C9:0
de
pth
(m
MD
-RK
B)
OWC at 3249.3 m MD-RKB29
shale at 3225 m MD-RKB shale at 3225 m MD-RKB
Figure 57 Left Geochemical profile for the aromaticity of well A without reservoir rocks containing disseminated coal. Right Phenol depth plot indicate the reservoir rocks with disseminated coals. The grey dashed line mark a prominent shale at 3225 m MD-RKB.
Regarding the type of aromatic hydrocarbon ratio, a broad distribution can be seen (Figure 56
B) indicating significant changes within the OM composition. Similar to the Garn Fm. in well
C, the ratio is inversely correlated to the aromaticity (not shown). Thus, an increase in
aromaticity correlates to the decrease in 1-ring aromatic hydrocarbons relative to the 2-ring
aromatic hydrocarbons.
The gas wetness (Figure 56 D) of the pyrolysates ranges between 0.44 and 0.72. The lowest
gas wetness was observed in reservoir rocks with disseminated coal. Excluding these samples,
the gas wetness show fewer differences with values between 0.64 and 0.74. The lower part of
the profile, below the shale a 3225 m MD-RKB, show slightly higher gas wetness.
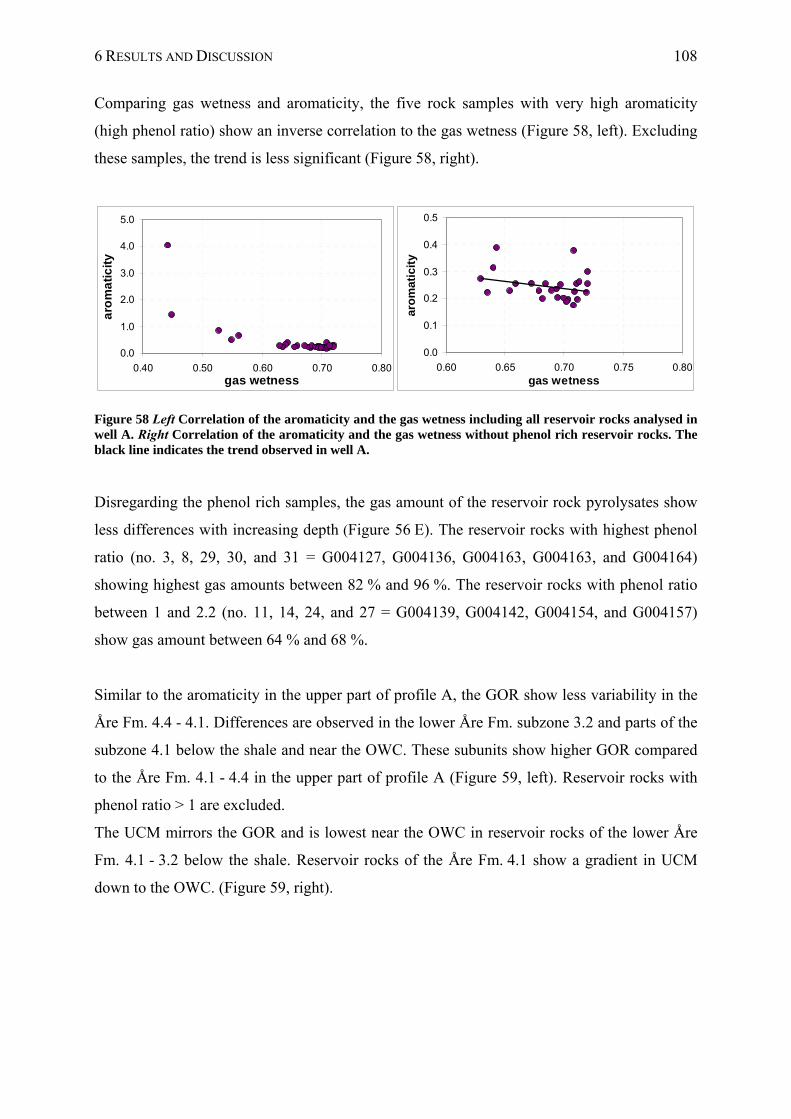
6 RESULTS AND DISCUSSION 108
Comparing gas wetness and aromaticity, the five rock samples with very high aromaticity
(high phenol ratio) show an inverse correlation to the gas wetness (Figure 58, left). Excluding
these samples, the trend is less significant (Figure 58, right).
0.0
1.0
2.0
3.0
4.0
5.0
0.40 0.50 0.60 0.70 0.80gas wetness
aro
ma
tic
ity
0.0
0.1
0.2
0.3
0.4
0.5
0.60 0.65 0.70 0.75 0.80gas wetness
aro
mat
icit
y
Figure 58 Left Correlation of the aromaticity and the gas wetness including all reservoir rocks analysed in well A. Right Correlation of the aromaticity and the gas wetness without phenol rich reservoir rocks. The black line indicates the trend observed in well A.
Disregarding the phenol rich samples, the gas amount of the reservoir rock pyrolysates show
less differences with increasing depth (Figure 56 E). The reservoir rocks with highest phenol
ratio (no. 3, 8, 29, 30, and 31 = G004127, G004136, G004163, G004163, and G004164)
showing highest gas amounts between 82 % and 96 %. The reservoir rocks with phenol ratio
between 1 and 2.2 (no. 11, 14, 24, and 27 = G004139, G004142, G004154, and G004157)
show gas amount between 64 % and 68 %.
Similar to the aromaticity in the upper part of profile A, the GOR show less variability in the
Åre Fm. 4.4 - 4.1. Differences are observed in the lower Åre Fm. subzone 3.2 and parts of the
subzone 4.1 below the shale and near the OWC. These subunits show higher GOR compared
to the Åre Fm. 4.1 - 4.4 in the upper part of profile A (Figure 59, left). Reservoir rocks with
phenol ratio > 1 are excluded.
The UCM mirrors the GOR and is lowest near the OWC in reservoir rocks of the lower Åre
Fm. 4.1 - 3.2 below the shale. Reservoir rocks of the Åre Fm. 4.1 show a gradient in UCM
down to the OWC. (Figure 59, right).
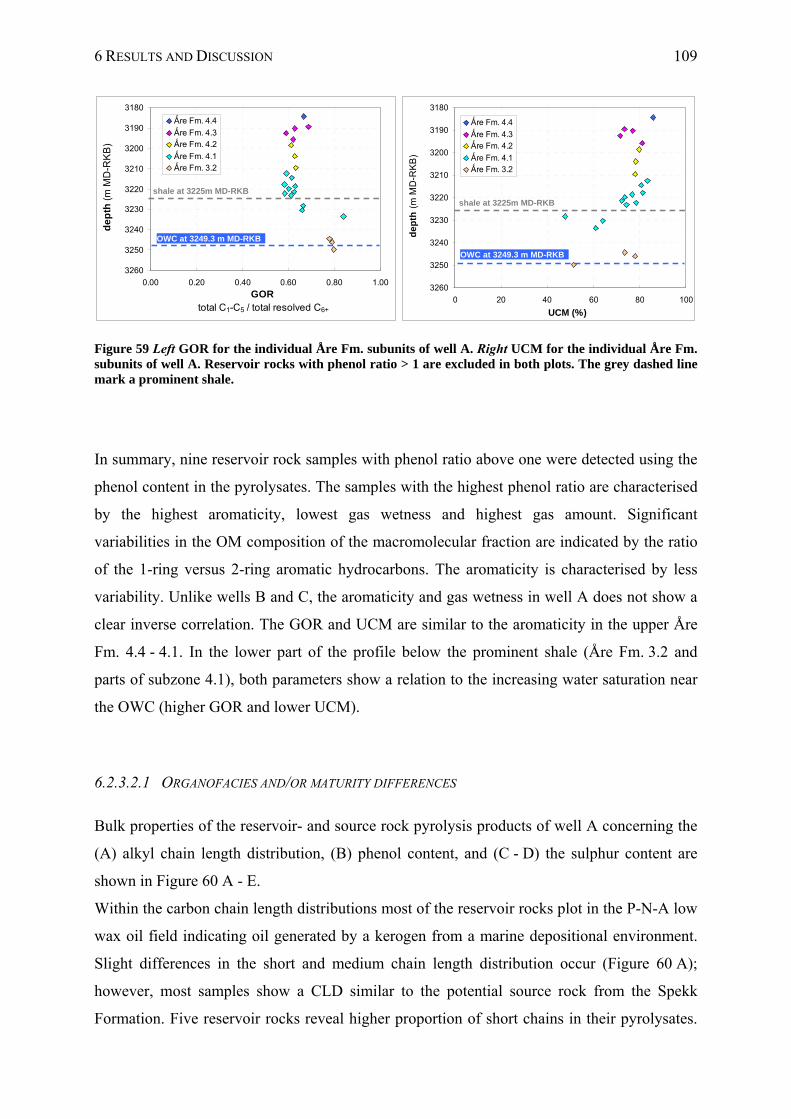
6 RESULTS AND DISCUSSION 109
3180
3190
3200
3210
3220
3230
3240
3250
3260
0.00 0.20 0.40 0.60 0.80 1.00
GOR total C1-C5 / total resolved C6+
de
pth
(m
MD
-RK
B)
Ǻre Fm. 4.4
Ǻre Fm. 4.3 Ǻre Fm. 4.2
Ǻre Fm. 4.1 Ǻre Fm. 3.2
OWC at 3249.3 m MD-RKB
3180
3190
3200
3210
3220
3230
3240
3250
3260
0 20 40 60 80 100
UCM (%)
dep
th (
m M
D-R
KB
)
Ǻre Fm. 4.4
Ǻre Fm. 4.3 Ǻre Fm. 4.2
Ǻre Fm. 4.1 Ǻre Fm. 3.2
OWC at 3249.3 m MD-RKB
shale at 3225m MD-RKB
shale at 3225m MD-RKB
Figure 59 Left GOR for the individual Åre Fm. subunits of well A. Right UCM for the individual Åre Fm. subunits of well A. Reservoir rocks with phenol ratio > 1 are excluded in both plots. The grey dashed line mark a prominent shale.
In summary, nine reservoir rock samples with phenol ratio above one were detected using the
phenol content in the pyrolysates. The samples with the highest phenol ratio are characterised
by the highest aromaticity, lowest gas wetness and highest gas amount. Significant
variabilities in the OM composition of the macromolecular fraction are indicated by the ratio
of the 1-ring versus 2-ring aromatic hydrocarbons. The aromaticity is characterised by less
variability. Unlike wells B and C, the aromaticity and gas wetness in well A does not show a
clear inverse correlation. The GOR and UCM are similar to the aromaticity in the upper Åre
Fm. 4.4 - 4.1. In the lower part of the profile below the prominent shale (Åre Fm. 3.2 and
parts of subzone 4.1), both parameters show a relation to the increasing water saturation near
the OWC (higher GOR and lower UCM).
6.2.3.2.1 ORGANOFACIES AND/OR MATURITY DIFFERENCES
Bulk properties of the reservoir- and source rock pyrolysis products of well A concerning the
(A) alkyl chain length distribution, (B) phenol content, and (C - D) the sulphur content are
shown in Figure 60 A - E.
Within the carbon chain length distributions most of the reservoir rocks plot in the P-N-A low
wax oil field indicating oil generated by a kerogen from a marine depositional environment.
Slight differences in the short and medium chain length distribution occur (Figure 60 A);
however, most samples show a CLD similar to the potential source rock from the Spekk
Formation. Five reservoir rocks reveal higher proportion of short chains in their pyrolysates.
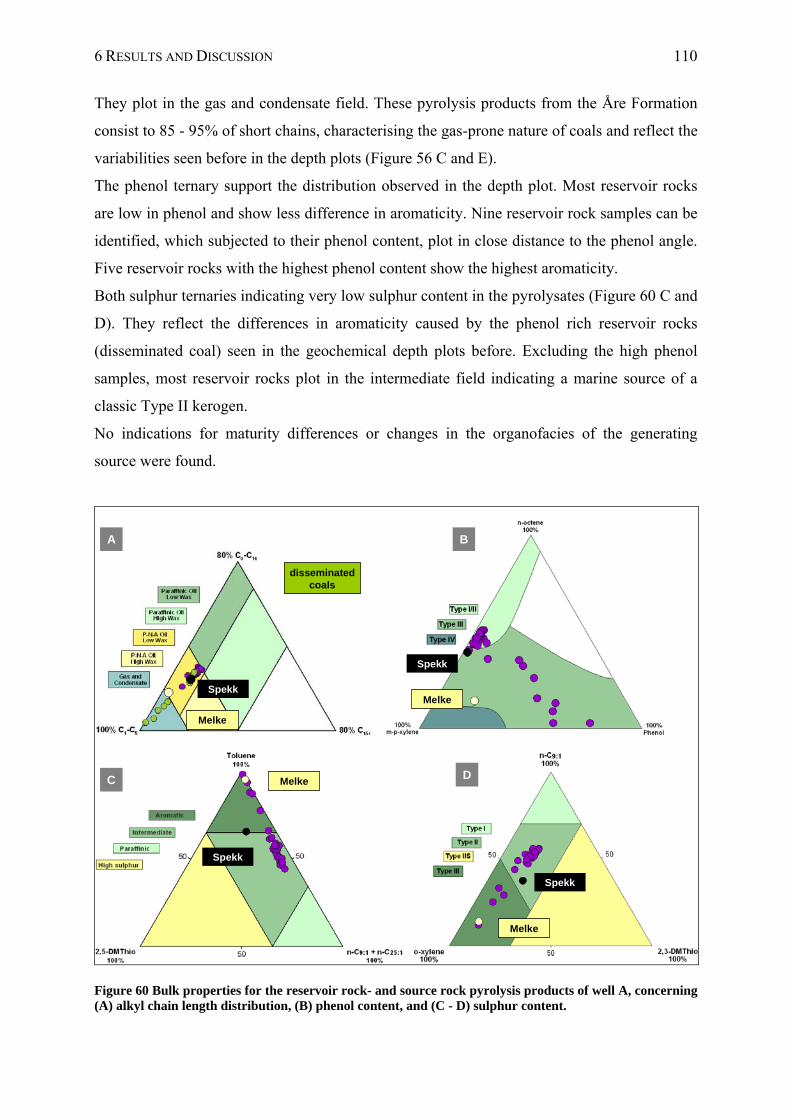
6 RESULTS AND DISCUSSION 110
They plot in the gas and condensate field. These pyrolysis products from the Åre Formation
consist to 85 - 95% of short chains, characterising the gas-prone nature of coals and reflect the
variabilities seen before in the depth plots (Figure 56 C and E).
The phenol ternary support the distribution observed in the depth plot. Most reservoir rocks
are low in phenol and show less difference in aromaticity. Nine reservoir rock samples can be
identified, which subjected to their phenol content, plot in close distance to the phenol angle.
Five reservoir rocks with the highest phenol content show the highest aromaticity.
Both sulphur ternaries indicating very low sulphur content in the pyrolysates (Figure 60 C and
D). They reflect the differences in aromaticity caused by the phenol rich reservoir rocks
(disseminated coal) seen in the geochemical depth plots before. Excluding the high phenol
samples, most reservoir rocks plot in the intermediate field indicating a marine source of a
classic Type II kerogen.
No indications for maturity differences or changes in the organofacies of the generating
source were found.
Spekk
Melke
Spekk
Melke
disseminated coals
A B
Spekk
Melke
Melke
Spekk
C D
Figure 60 Bulk properties for the reservoir rock- and source rock pyrolysis products of well A, concerning (A) alkyl chain length distribution, (B) phenol content, and (C - D) sulphur content.
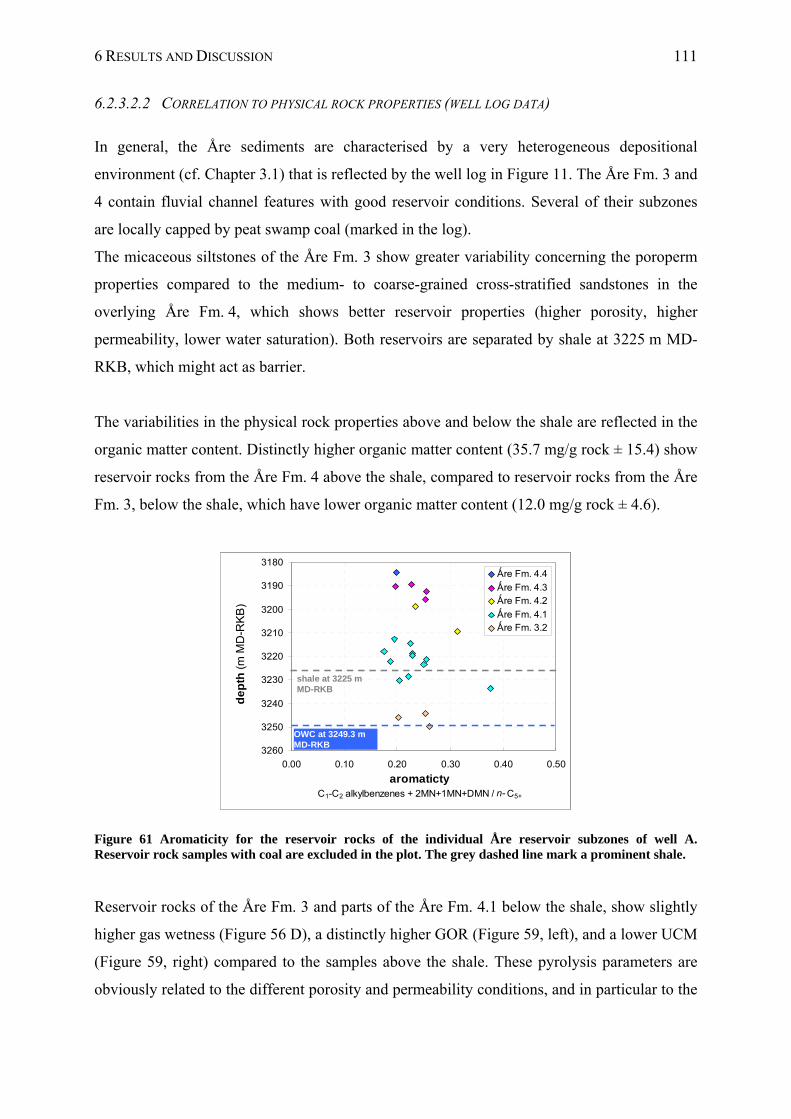
6 RESULTS AND DISCUSSION 111
6.2.3.2.2 CORRELATION TO PHYSICAL ROCK PROPERTIES (WELL LOG DATA)
In general, the Åre sediments are characterised by a very heterogeneous depositional
environment (cf. Chapter 3.1) that is reflected by the well log in Figure 11. The Åre Fm. 3 and
4 contain fluvial channel features with good reservoir conditions. Several of their subzones
are locally capped by peat swamp coal (marked in the log).
The micaceous siltstones of the Åre Fm. 3 show greater variability concerning the poroperm
properties compared to the medium- to coarse-grained cross-stratified sandstones in the
overlying Åre Fm. 4, which shows better reservoir properties (higher porosity, higher
permeability, lower water saturation). Both reservoirs are separated by shale at 3225 m MD-
RKB, which might act as barrier.
The variabilities in the physical rock properties above and below the shale are reflected in the
organic matter content. Distinctly higher organic matter content (35.7 mg/g rock ± 15.4) show
reservoir rocks from the Åre Fm. 4 above the shale, compared to reservoir rocks from the Åre
Fm. 3, below the shale, which have lower organic matter content (12.0 mg/g rock ± 4.6).
3180
3190
3200
3210
3220
3230
3240
3250
3260
0.00 0.10 0.20 0.30 0.40 0.50
aromatictyC1-C2 alkylbenzenes + 2MN+1MN+DMN / n- C5+
de
pth
(m
MD
-RK
B)
Ǻre Fm. 4.4
Ǻre Fm. 4.3 Ǻre Fm. 4.2
Ǻre Fm. 4.1 Ǻre Fm. 3.2
OWC at 3249.3 m MD-RKB
shale at 3225 m MD-RKB
3180
3190
3200
3210
3220
3230
3240
3250
3260
0.00 0.10 0.20 0.30 0.40 0.50
aromatictyC1-C2 alkylbenzenes + 2MN+1MN+DMN / n- C5+
de
pth
(m
MD
-RK
B)
Ǻre Fm. 4.4
Ǻre Fm. 4.3 Ǻre Fm. 4.2
Ǻre Fm. 4.1 Ǻre Fm. 3.2
OWC at 3249.3 m MD-RKB
shale at 3225 m MD-RKB
Figure 61 Aromaticity for the reservoir rocks of the individual Åre reservoir subzones of well A. Reservoir rock samples with coal are excluded in the plot. The grey dashed line mark a prominent shale.
Reservoir rocks of the Åre Fm. 3 and parts of the Åre Fm. 4.1 below the shale, show slightly
higher gas wetness (Figure 56 D), a distinctly higher GOR (Figure 59, left), and a lower UCM
(Figure 59, right) compared to the samples above the shale. These pyrolysis parameters are
obviously related to the different porosity and permeability conditions, and in particular to the
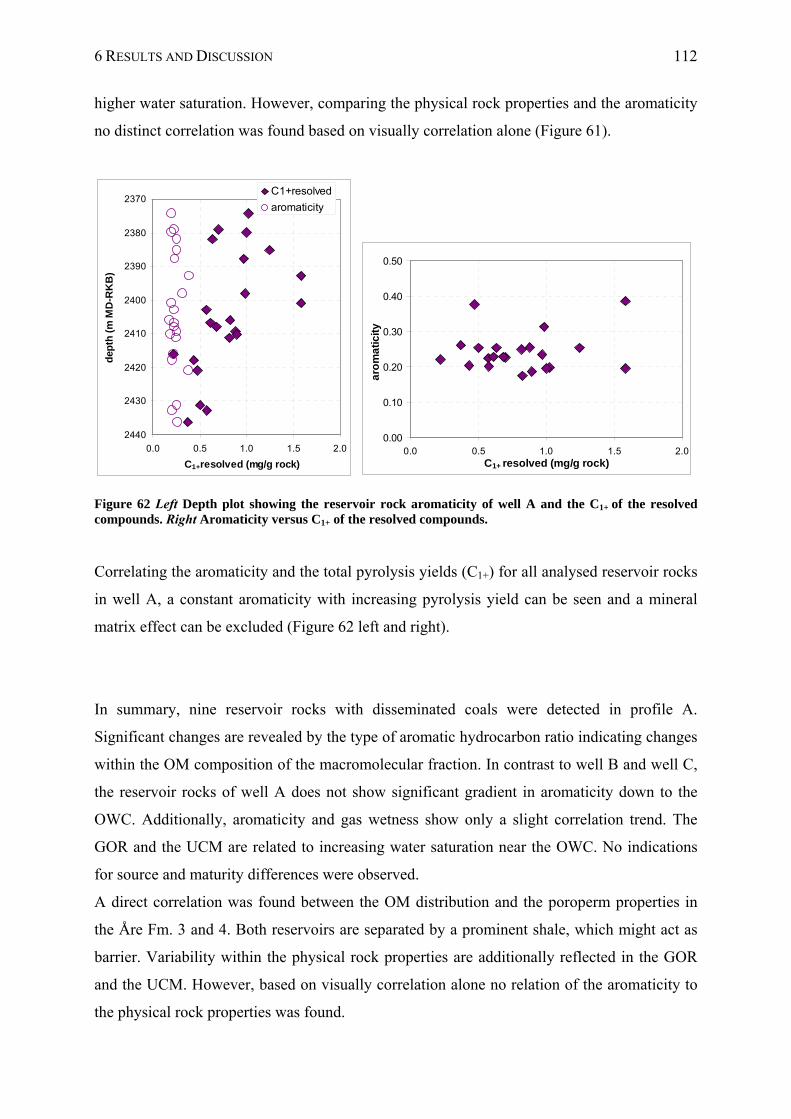
6 RESULTS AND DISCUSSION 112
higher water saturation. However, comparing the physical rock properties and the aromaticity
no distinct correlation was found based on visually correlation alone (Figure 61).
2370
2380
2390
2400
2410
2420
2430
2440
0.0 0.5 1.0 1.5 2.0
C1+resolved (mg/g rock)
dep
th (
m M
D-R
KB
)
C1+resolved
aromaticity
0.00
0.10
0.20
0.30
0.40
0.50
0.0 0.5 1.0 1.5 2.0C1+ resolved (mg/g rock)
aro
ma
tici
ty
Figure 62 Left Depth plot showing the reservoir rock aromaticity of well A and the C1+ of the resolved compounds. Right Aromaticity versus C1+ of the resolved compounds.
Correlating the aromaticity and the total pyrolysis yields (C1+) for all analysed reservoir rocks
in well A, a constant aromaticity with increasing pyrolysis yield can be seen and a mineral
matrix effect can be excluded (Figure 62 left and right).
In summary, nine reservoir rocks with disseminated coals were detected in profile A.
Significant changes are revealed by the type of aromatic hydrocarbon ratio indicating changes
within the OM composition of the macromolecular fraction. In contrast to well B and well C,
the reservoir rocks of well A does not show significant gradient in aromaticity down to the
OWC. Additionally, aromaticity and gas wetness show only a slight correlation trend. The
GOR and the UCM are related to increasing water saturation near the OWC. No indications
for source and maturity differences were observed.
A direct correlation was found between the OM distribution and the poroperm properties in
the Åre Fm. 3 and 4. Both reservoirs are separated by a prominent shale, which might act as
barrier. Variability within the physical rock properties are additionally reflected in the GOR
and the UCM. However, based on visually correlation alone no relation of the aromaticity to
the physical rock properties was found.
6 RESULTS AND DISCUSSION 113
6.3 CHARACTERISATION OF THE SINGLE PROFILES IN THE NORTHERN
PART OF THE HEIDRUN OIL FIELD
6.3.1 WELL E IN SEGMENT M (ÅRE FM. 4.1-3.2)
6.3.1.1 PRODUCTION INDEX AND ORGANIC RICHNES
The Åre Formation was sampled and evaluated in well E. Significant changes in the PI were
observed in well E representing an average PI of 0.56 ± 0.21 (Figure 25, Table X 1). While
most reservoir rocks show a PI between 0.65 and 0.70, three reservoir rocks in the upper part
and two in the lower part are characterised by distinct differences in the oil quality. In the
upper part the oil quality (PI) alternate at a small scale. The lowest PI were found in the two
reservoir rock samples at the bottom of profile E (0.09 and 0.07), consistent with the
observations made before in well C and A. The low oil quality indicates an elevated content
of high polar compounds and might refer to in-situ organic matter.
The OM content in well E is between 13.6 and 83.6 mg/g rock (Figure 26, Table X 1). The
lower part of well E is characterised by reservoir rocks with higher OM content and
significant changes in the OM distribution compared to the upper part. Especially two rock
samples show high organic matter content about 83.6 mg/g rock and 75.7 mg/g rock,
respectively. These are also the samples with the lowest PI. Two reservoir rocks in the upper
and the middle part show low OM content.
6.3.1.2 ORGANIC MATTER COMPOSITION
The reservoir rocks analysed in well E reveal compositional differences regarding their
pyrolysates. Bulk properties based on pyrolysis products are shown in geochemical profiles in
Figure 63 for the aromaticity (A), monoaromatic / diaromatic hydrocarbon ratio (B), relative
phenol content (C), gas wetness (D) and gas amount (E). Table X 2 listed the average values
and standard deviations for the bulk pyrolysis parameters. The Py-GC parameter values for
each single reservoir rock analysed are listed in Table X 8.
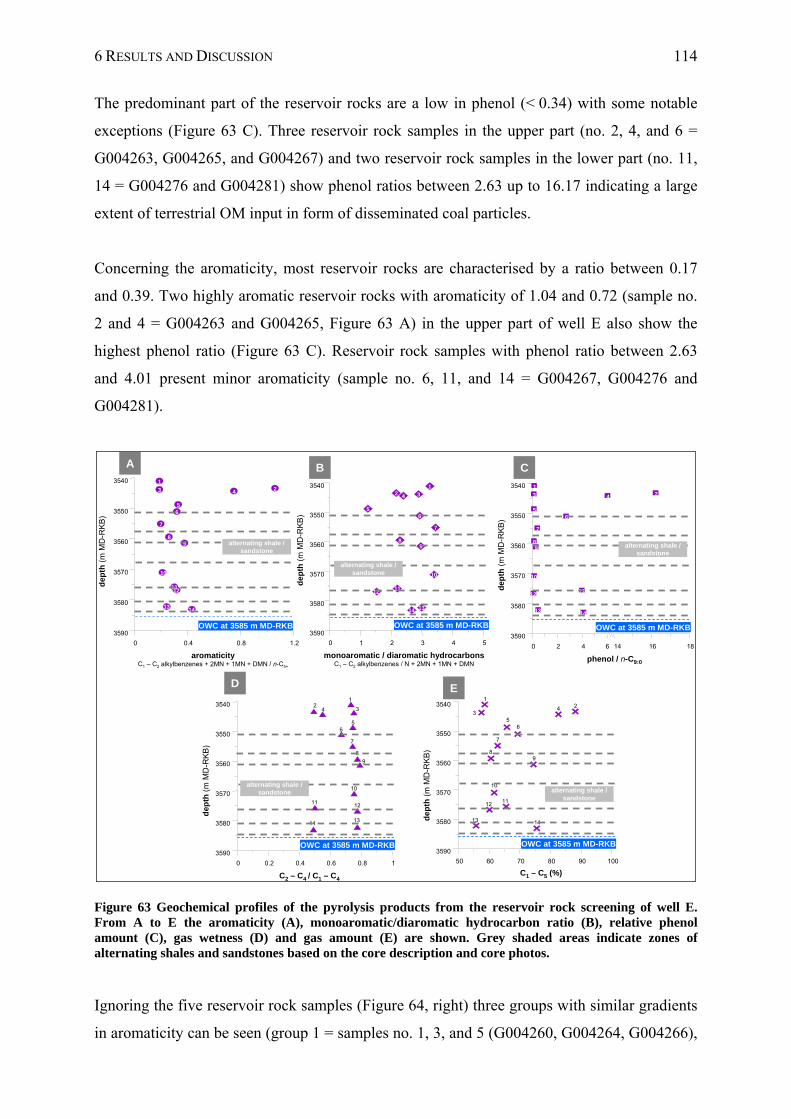
6 RESULTS AND DISCUSSION 114
The predominant part of the reservoir rocks are a low in phenol (< 0.34) with some notable
exceptions (Figure 63 C). Three reservoir rock samples in the upper part (no. 2, 4, and 6 =
G004263, G004265, and G004267) and two reservoir rock samples in the lower part (no. 11,
14 = G004276 and G004281) show phenol ratios between 2.63 up to 16.17 indicating a large
extent of terrestrial OM input in form of disseminated coal particles.
Concerning the aromaticity, most reservoir rocks are characterised by a ratio between 0.17
and 0.39. Two highly aromatic reservoir rocks with aromaticity of 1.04 and 0.72 (sample no.
2 and 4 = G004263 and G004265, Figure 63 A) in the upper part of well E also show the
highest phenol ratio (Figure 63 C). Reservoir rock samples with phenol ratio between 2.63
and 4.01 present minor aromaticity (sample no. 6, 11, and 14 = G004267, G004276 and
G004281).
0 0.4 0.8 1.2
3590
3580
3570
3560
3550
3540 123 4
56
7
89
10
1112
13 14
0 1 2 3 4 5
3590
3580
3570
3560
3550
3540 12 34
56
7
89
10
1112
1314
0 2 4 6 14 16 18
3590
3580
3570
3560
3550
3540 123 4
56
7
89
10
1112
13 14
0 0.2 0.4 0.6 0.8 1
3590
3580
3570
3560
3550
35401
234
56
7
8
9
10
11 12
1314
50 60 70 80 90 100
3590
3580
3570
3560
3550
35401
23
4
56
7
89
10
1112
13 14
aromaticityC1 – C2 alkylbenzenes + 2MN + 1MN + DMN / n-C5+
monoaromatic / diaromatic hydrocarbonsC1 – C2 alkylbenzenes / N + 2MN + 1MN + DMN
phenol / n-C9:0
C1 – C5 (%)C2 – C4 / C1 – C4
dep
th (
m M
D-R
KB
)
de
pth
(m
MD
-RK
B)
dep
th (
m M
D-R
KB
)
dep
th (
m M
D-R
KB
)
dep
th (
m M
D-R
KB
)
OWC at 3585 m MD-RKB OWC at 3585 m MD-RKBOWC at 3585 m MD-RKB OWC at 3585 m MD-RKBOWC at 3585 m MD-RKB
OWC at 3585 m MD-RKBOWC at 3585 m MD-RKBOWC at 3585 m MD-RKBOWC at 3585 m MD-RKB
A B C
D E
alternating shale / sandstone
alternating shale / sandstone
alternating shale / sandstone
alternating shale / sandstone
alternating shale / sandstone
Figure 63 Geochemical profiles of the pyrolysis products from the reservoir rock screening of well E. From A to E the aromaticity (A), monoaromatic/diaromatic hydrocarbon ratio (B), relative phenol amount (C), gas wetness (D) and gas amount (E) are shown. Grey shaded areas indicate zones of alternating shales and sandstones based on the core description and core photos.
Ignoring the five reservoir rock samples (Figure 64, right) three groups with similar gradients
in aromaticity can be seen (group 1 = samples no. 1, 3, and 5 (G004260, G004264, G004266),
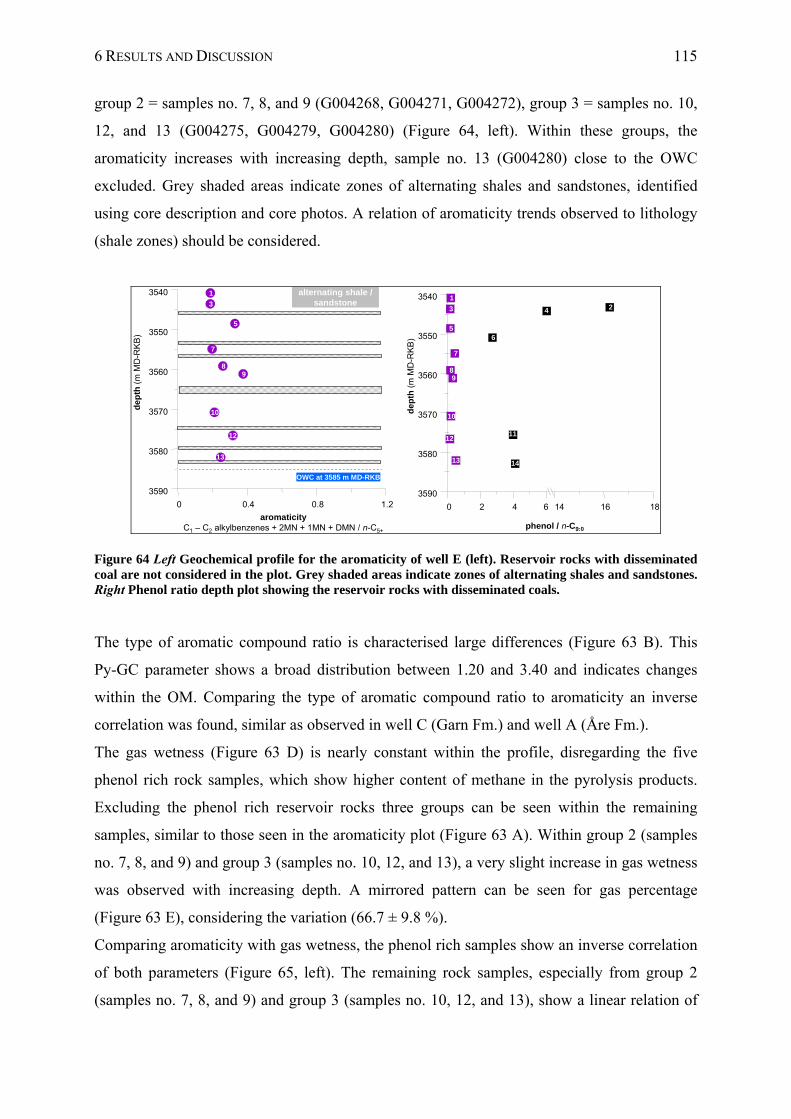
6 RESULTS AND DISCUSSION 115
group 2 = samples no. 7, 8, and 9 (G004268, G004271, G004272), group 3 = samples no. 10,
12, and 13 (G004275, G004279, G004280) (Figure 64, left). Within these groups, the
aromaticity increases with increasing depth, sample no. 13 (G004280) close to the OWC
excluded. Grey shaded areas indicate zones of alternating shales and sandstones, identified
using core description and core photos. A relation of aromaticity trends observed to lithology
(shale zones) should be considered.
alternating shale /
sandstone
0 2 4 6 14 16 18
3590
3580
3570
3560
3550
3540 123 4
56
7
89
10
1112
13 14
phenol / n-C9:0
dep
th (
m M
D-R
KB
)
0 0.4 0.8 1.2
3590
3580
3570
3560
3550
3540 1
3
5
7
89
10
12
aromaticityC1 – C2 alkylbenzenes + 2MN + 1MN + DMN / n-C5+
de
pth
(m
MD
-RK
B)
OWC at 3585 m MD-RKB
13
Figure 64 Left Geochemical profile for the aromaticity of well E (left). Reservoir rocks with disseminated coal are not considered in the plot. Grey shaded areas indicate zones of alternating shales and sandstones. Right Phenol ratio depth plot showing the reservoir rocks with disseminated coals.
The type of aromatic compound ratio is characterised large differences (Figure 63 B). This
Py-GC parameter shows a broad distribution between 1.20 and 3.40 and indicates changes
within the OM. Comparing the type of aromatic compound ratio to aromaticity an inverse
correlation was found, similar as observed in well C (Garn Fm.) and well A (Åre Fm.).
The gas wetness (Figure 63 D) is nearly constant within the profile, disregarding the five
phenol rich rock samples, which show higher content of methane in the pyrolysis products.
Excluding the phenol rich reservoir rocks three groups can be seen within the remaining
samples, similar to those seen in the aromaticity plot (Figure 63 A). Within group 2 (samples
no. 7, 8, and 9) and group 3 (samples no. 10, 12, and 13), a very slight increase in gas wetness
was observed with increasing depth. A mirrored pattern can be seen for gas percentage
(Figure 63 E), considering the variation (66.7 ± 9.8 %).
Comparing aromaticity with gas wetness, the phenol rich samples show an inverse correlation
of both parameters (Figure 65, left). The remaining rock samples, especially from group 2
(samples no. 7, 8, and 9) and group 3 (samples no. 10, 12, and 13), show a linear relation of
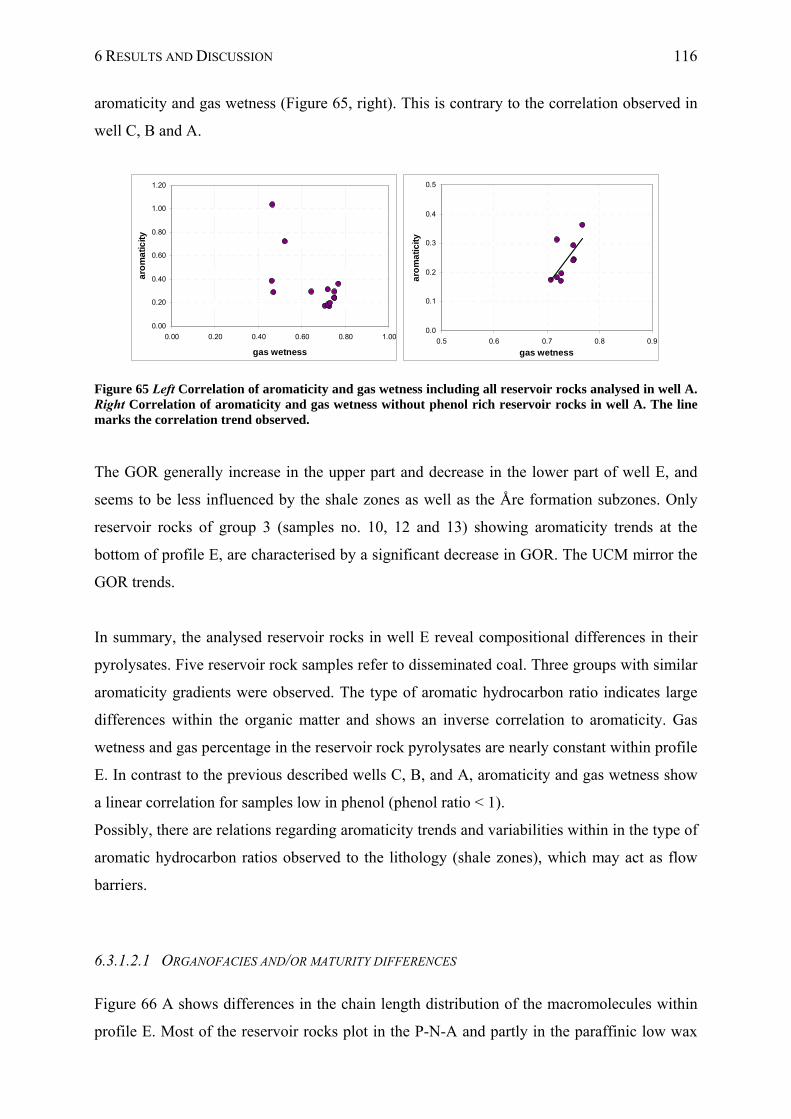
6 RESULTS AND DISCUSSION 116
aromaticity and gas wetness (Figure 65, right). This is contrary to the correlation observed in
well C, B and A.
0.00
0.20
0.40
0.60
0.80
1.00
1.20
0.00 0.20 0.40 0.60 0.80 1.00
gas wetness
aro
ma
tic
ity
0.0
0.1
0.2
0.3
0.4
0.5
0.5 0.6 0.7 0.8 0.9
gas wetness
aro
ma
tici
ty
Figure 65 Left Correlation of aromaticity and gas wetness including all reservoir rocks analysed in well A. Right Correlation of aromaticity and gas wetness without phenol rich reservoir rocks in well A. The line marks the correlation trend observed.
The GOR generally increase in the upper part and decrease in the lower part of well E, and
seems to be less influenced by the shale zones as well as the Åre formation subzones. Only
reservoir rocks of group 3 (samples no. 10, 12 and 13) showing aromaticity trends at the
bottom of profile E, are characterised by a significant decrease in GOR. The UCM mirror the
GOR trends.
In summary, the analysed reservoir rocks in well E reveal compositional differences in their
pyrolysates. Five reservoir rock samples refer to disseminated coal. Three groups with similar
aromaticity gradients were observed. The type of aromatic hydrocarbon ratio indicates large
differences within the organic matter and shows an inverse correlation to aromaticity. Gas
wetness and gas percentage in the reservoir rock pyrolysates are nearly constant within profile
E. In contrast to the previous described wells C, B, and A, aromaticity and gas wetness show
a linear correlation for samples low in phenol (phenol ratio < 1).
Possibly, there are relations regarding aromaticity trends and variabilities within in the type of
aromatic hydrocarbon ratios observed to the lithology (shale zones), which may act as flow
barriers.
6.3.1.2.1 ORGANOFACIES AND/OR MATURITY DIFFERENCES
Figure 66 A shows differences in the chain length distribution of the macromolecules within
profile E. Most of the reservoir rocks plot in the P-N-A and partly in the paraffinic low wax
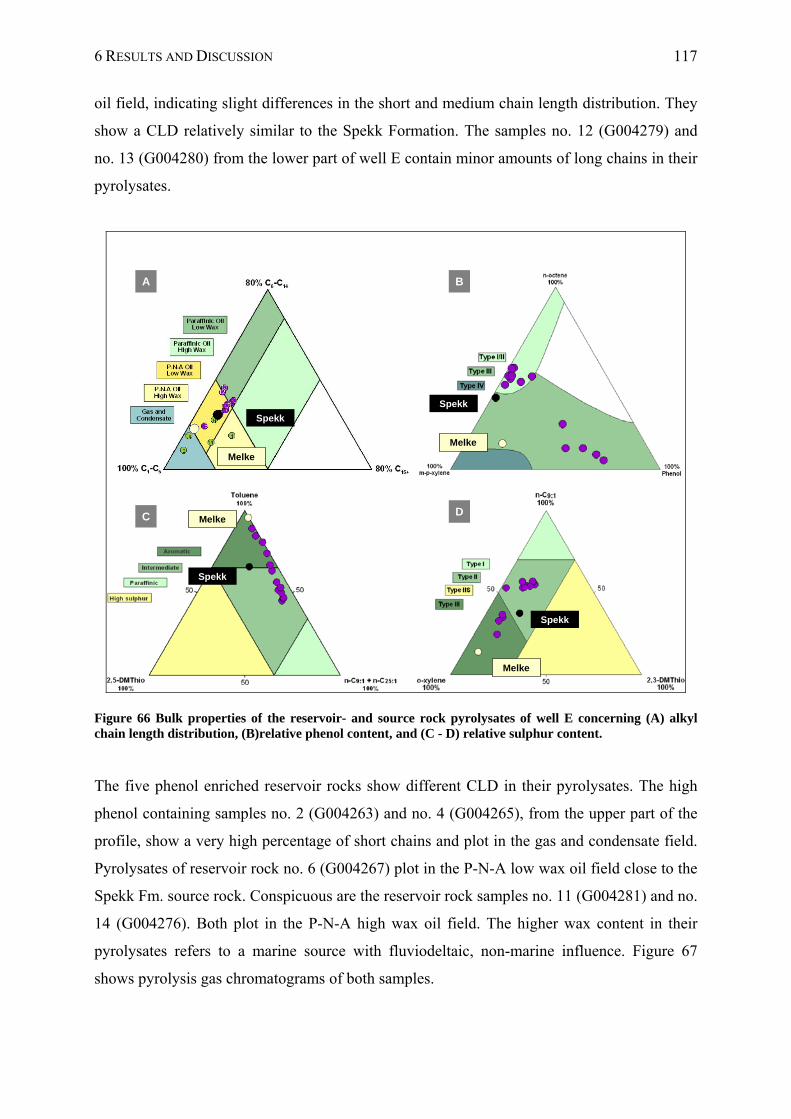
6 RESULTS AND DISCUSSION 117
oil field, indicating slight differences in the short and medium chain length distribution. They
show a CLD relatively similar to the Spekk Formation. The samples no. 12 (G004279) and
no. 13 (G004280) from the lower part of well E contain minor amounts of long chains in their
pyrolysates.
Spekk
Melke
Spekk
Melke
A B
Spekk
Melke
Spekk
MelkeC D
Figure 66 Bulk properties of the reservoir- and source rock pyrolysates of well E concerning (A) alkyl chain length distribution, (B)relative phenol content, and (C - D) relative sulphur content.
The five phenol enriched reservoir rocks show different CLD in their pyrolysates. The high
phenol containing samples no. 2 (G004263) and no. 4 (G004265), from the upper part of the
profile, show a very high percentage of short chains and plot in the gas and condensate field.
Pyrolysates of reservoir rock no. 6 (G004267) plot in the P-N-A low wax oil field close to the
Spekk Fm. source rock. Conspicuous are the reservoir rock samples no. 11 (G004281) and no.
14 (G004276). Both plot in the P-N-A high wax oil field. The higher wax content in their
pyrolysates refers to a marine source with fluviodeltaic, non-marine influence. Figure 67
shows pyrolysis gas chromatograms of both samples.
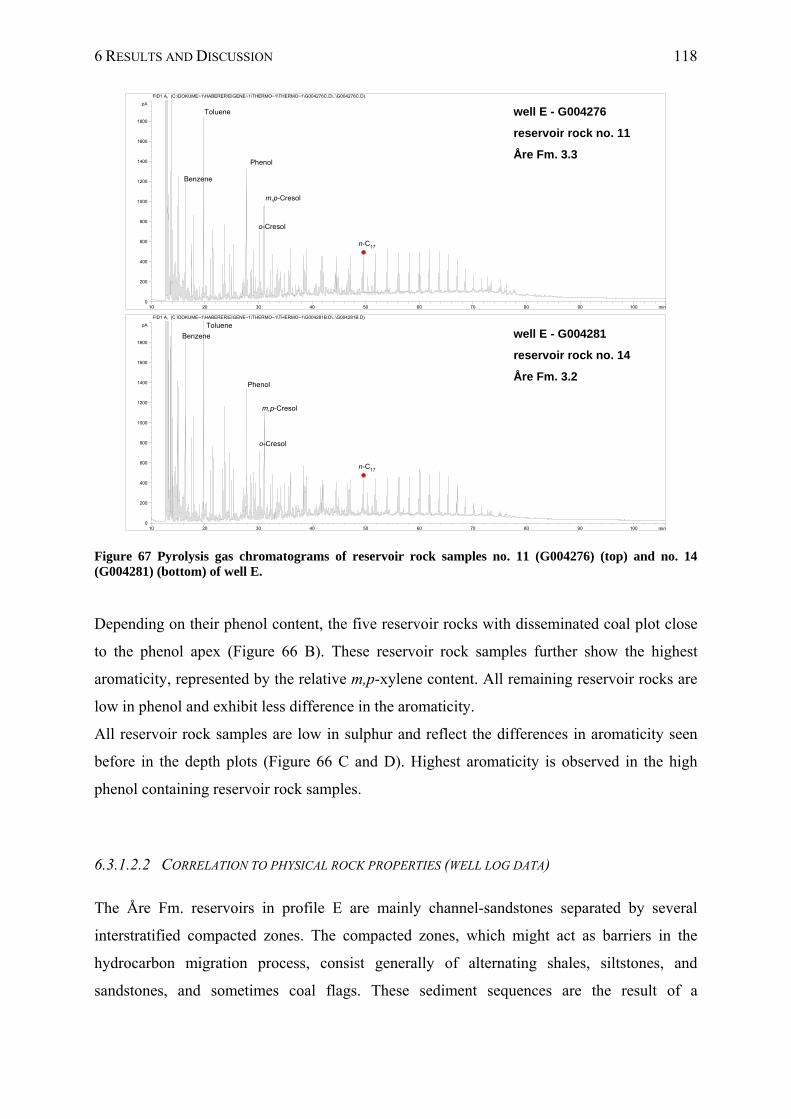
6 RESULTS AND DISCUSSION 118
min10 20 30 40 50 60 70 80 90 100
pA
0
200
400
600
800
1000
1200
1400
1600
1800
FID1 A, (C:\DOKUME~1\HABERER\EIGENE~1\THERMO~1\THERMO~1\G004276C.D\..\G004276C.D)
min10 20 30 40 50 60 70 80 90 100
pA
0
200
400
600
800
1000
1200
1400
1600
1800
FID1 A, (C:\DOKUME~1\HABERER\EIGENE~1\THERMO~1\THERMO~1\G004281B.D\..\G004281B.D)
well E - G004276
reservoir rock no. 11
Åre Fm. 3.3
well E - G004281
reservoir rock no. 14
Åre Fm. 3.2
Benzene
Toluene
Phenol
m,p-Cresol
o-Cresol
n-C17
Benzene
Toluene
Phenol
m,p-Cresol
o-Cresol
n-C17
Figure 67 Pyrolysis gas chromatograms of reservoir rock samples no. 11 (G004276) (top) and no. 14 (G004281) (bottom) of well E.
Depending on their phenol content, the five reservoir rocks with disseminated coal plot close
to the phenol apex (Figure 66 B). These reservoir rock samples further show the highest
aromaticity, represented by the relative m,p-xylene content. All remaining reservoir rocks are
low in phenol and exhibit less difference in the aromaticity.
All reservoir rock samples are low in sulphur and reflect the differences in aromaticity seen
before in the depth plots (Figure 66 C and D). Highest aromaticity is observed in the high
phenol containing reservoir rock samples.
6.3.1.2.2 CORRELATION TO PHYSICAL ROCK PROPERTIES (WELL LOG DATA)
The Åre Fm. reservoirs in profile E are mainly channel-sandstones separated by several
interstratified compacted zones. The compacted zones, which might act as barriers in the
hydrocarbon migration process, consist generally of alternating shales, siltstones, and
sandstones, and sometimes coal flags. These sediment sequences are the result of a
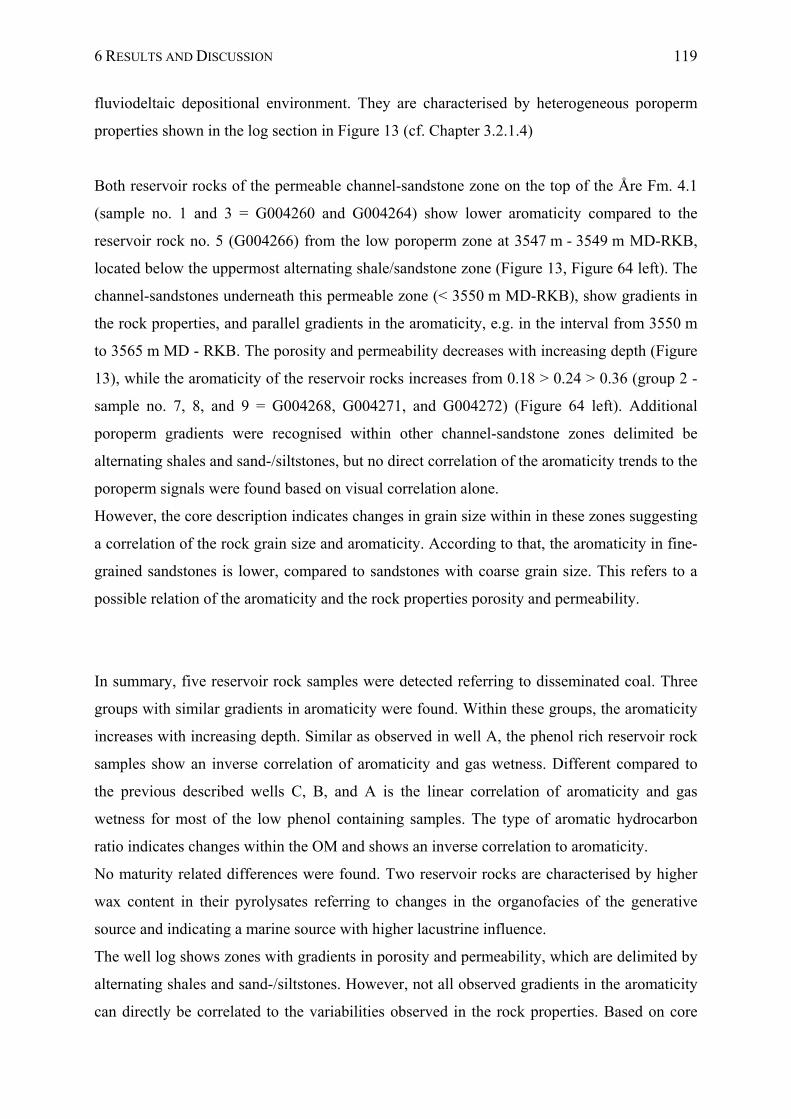
6 RESULTS AND DISCUSSION 119
fluviodeltaic depositional environment. They are characterised by heterogeneous poroperm
properties shown in the log section in Figure 13 (cf. Chapter 3.2.1.4)
Both reservoir rocks of the permeable channel-sandstone zone on the top of the Åre Fm. 4.1
(sample no. 1 and 3 = G004260 and G004264) show lower aromaticity compared to the
reservoir rock no. 5 (G004266) from the low poroperm zone at 3547 m - 3549 m MD-RKB,
located below the uppermost alternating shale/sandstone zone (Figure 13, Figure 64 left). The
channel-sandstones underneath this permeable zone (< 3550 m MD-RKB), show gradients in
the rock properties, and parallel gradients in the aromaticity, e.g. in the interval from 3550 m
to 3565 m MD - RKB. The porosity and permeability decreases with increasing depth (Figure
13), while the aromaticity of the reservoir rocks increases from 0.18 > 0.24 > 0.36 (group 2 -
sample no. 7, 8, and 9 = G004268, G004271, and G004272) (Figure 64 left). Additional
poroperm gradients were recognised within other channel-sandstone zones delimited be
alternating shales and sand-/siltstones, but no direct correlation of the aromaticity trends to the
poroperm signals were found based on visual correlation alone.
However, the core description indicates changes in grain size within in these zones suggesting
a correlation of the rock grain size and aromaticity. According to that, the aromaticity in fine-
grained sandstones is lower, compared to sandstones with coarse grain size. This refers to a
possible relation of the aromaticity and the rock properties porosity and permeability.
In summary, five reservoir rock samples were detected referring to disseminated coal. Three
groups with similar gradients in aromaticity were found. Within these groups, the aromaticity
increases with increasing depth. Similar as observed in well A, the phenol rich reservoir rock
samples show an inverse correlation of aromaticity and gas wetness. Different compared to
the previous described wells C, B, and A is the linear correlation of aromaticity and gas
wetness for most of the low phenol containing samples. The type of aromatic hydrocarbon
ratio indicates changes within the OM and shows an inverse correlation to aromaticity.
No maturity related differences were found. Two reservoir rocks are characterised by higher
wax content in their pyrolysates referring to changes in the organofacies of the generative
source and indicating a marine source with higher lacustrine influence.
The well log shows zones with gradients in porosity and permeability, which are delimited by
alternating shales and sand-/siltstones. However, not all observed gradients in the aromaticity
can directly be correlated to the variabilities observed in the rock properties. Based on core
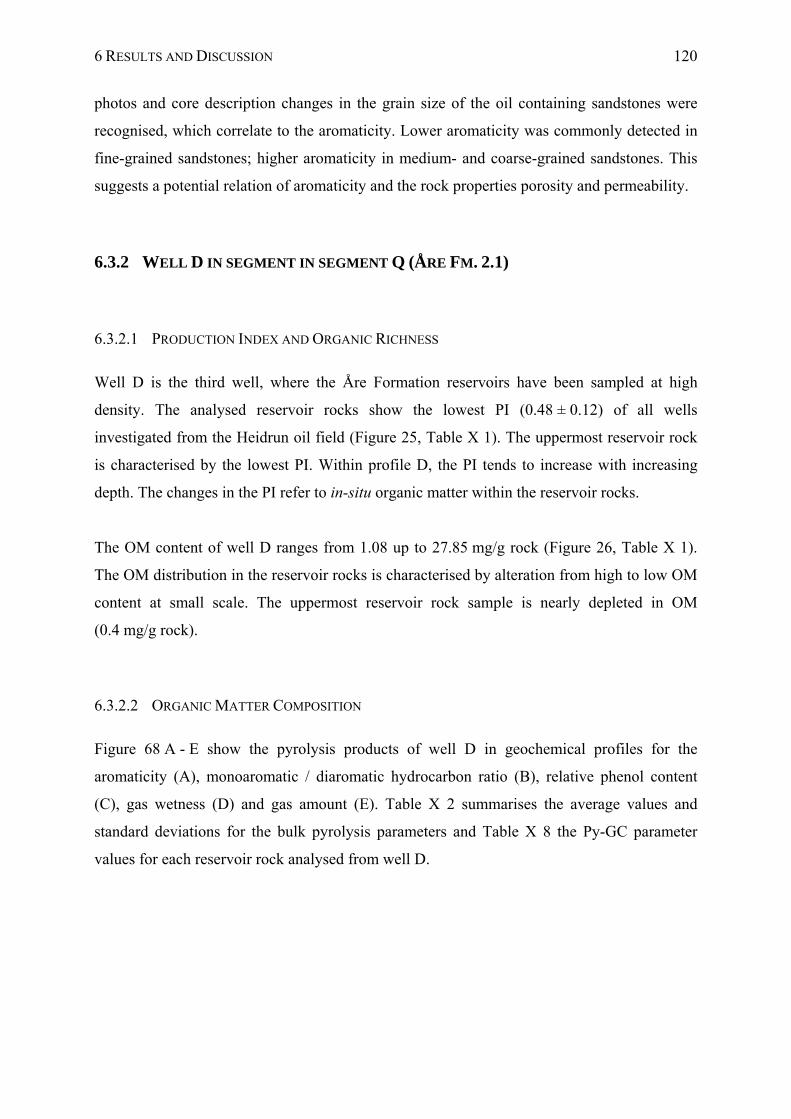
6 RESULTS AND DISCUSSION 120
photos and core description changes in the grain size of the oil containing sandstones were
recognised, which correlate to the aromaticity. Lower aromaticity was commonly detected in
fine-grained sandstones; higher aromaticity in medium- and coarse-grained sandstones. This
suggests a potential relation of aromaticity and the rock properties porosity and permeability.
6.3.2 WELL D IN SEGMENT IN SEGMENT Q (ÅRE FM. 2.1)
6.3.2.1 PRODUCTION INDEX AND ORGANIC RICHNESS
Well D is the third well, where the Åre Formation reservoirs have been sampled at high
density. The analysed reservoir rocks show the lowest PI (0.48 ± 0.12) of all wells
investigated from the Heidrun oil field (Figure 25, Table X 1). The uppermost reservoir rock
is characterised by the lowest PI. Within profile D, the PI tends to increase with increasing
depth. The changes in the PI refer to in-situ organic matter within the reservoir rocks.
The OM content of well D ranges from 1.08 up to 27.85 mg/g rock (Figure 26, Table X 1).
The OM distribution in the reservoir rocks is characterised by alteration from high to low OM
content at small scale. The uppermost reservoir rock sample is nearly depleted in OM
(0.4 mg/g rock).
6.3.2.2 ORGANIC MATTER COMPOSITION
Figure 68 A - E show the pyrolysis products of well D in geochemical profiles for the
aromaticity (A), monoaromatic / diaromatic hydrocarbon ratio (B), relative phenol content
(C), gas wetness (D) and gas amount (E). Table X 2 summarises the average values and
standard deviations for the bulk pyrolysis parameters and Table X 8 the Py-GC parameter
values for each reservoir rock analysed from well D.
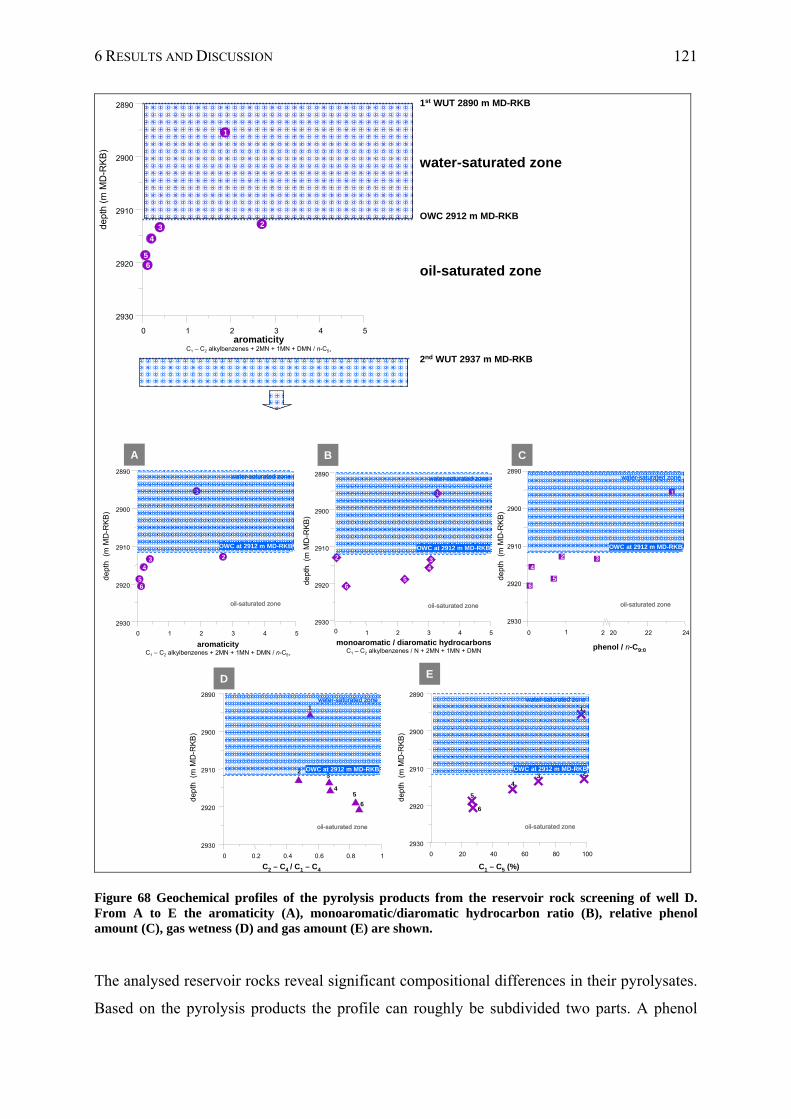
6 RESULTS AND DISCUSSION 121
0 1 2 3 4 5
2930
2920
2910
2900
2890
1
234
56
0 1 2 3 4 5
2930
2920
2910
2900
2890
1
2 34
56
0 2 20 22 24
2930
2920
2910
2900
2890
1
2 3
4
56
0 20 40 60 80 100
2930
2920
2910
2900
2890
1
234
5
6
0 0.2 0.4 0.6 0.8 1
2930
2920
2910
2900
2890
1
23
45
6
1
aromaticityC1 – C2 alkylbenzenes + 2MN + 1MN + DMN / n-C5+
monoaromatic / diaromatic hydrocarbonsC1 – C2 alkylbenzenes / N + 2MN + 1MN + DMN phenol / n-C9:0
C1 – C5 (%)C2 – C4 / C1 – C4
water-saturated zone
OWC at 2912 m MD-RKB
oil-saturated zone
water-saturated zone
OWC at 2912 m MD-RKB
oil-saturated zone
water-saturated zone
OWC at 2912 m MD-RKB
oil-saturated zone
water-saturated zone
OWC at 2912 m MD-RKB
oil-saturated zone
water-saturated zone
OWC at 2912 m MD-RKB
oil-saturated zone
water-saturated zone
OWC at 2912 m MD-RKB
oil-saturated zone
water-saturated zone
OWC at 2912 m MD-RKB
oil-saturated zone
water-saturated zone
OWC at 2912 m MD-RKB
oil-saturated zone
water-saturated zone
OWC at 2912 m MD-RKB
oil-saturated zone
water-saturated zone
OWC at 2912 m MD-RKB
oil-saturated zone
A B C
D E
dept
h(m
MD
-RK
B)
dept
h(m
MD
-RK
B)
dept
h(m
MD
-RK
B)
dep
th(m
MD
-RK
B)
dep
th(m
MD
-RK
B)
1st WUT 2890 m MD-RKB
OWC 2912 m MD-RKB
2nd WUT 2937 m MD-RKB
water-saturated zone
oil-saturated zone
0 1 2 3 4 5
2930
2920
2910
2900
2890
1
23
4
56
dep
th (
m M
D-R
KB
)
aromaticityC1 – C2 alkylbenzenes + 2MN + 1MN + DMN / n-C5+
Figure 68 Geochemical profiles of the pyrolysis products from the reservoir rock screening of well D. From A to E the aromaticity (A), monoaromatic/diaromatic hydrocarbon ratio (B), relative phenol amount (C), gas wetness (D) and gas amount (E) are shown.
The analysed reservoir rocks reveal significant compositional differences in their pyrolysates.
Based on the pyrolysis products the profile can roughly be subdivided two parts. A phenol
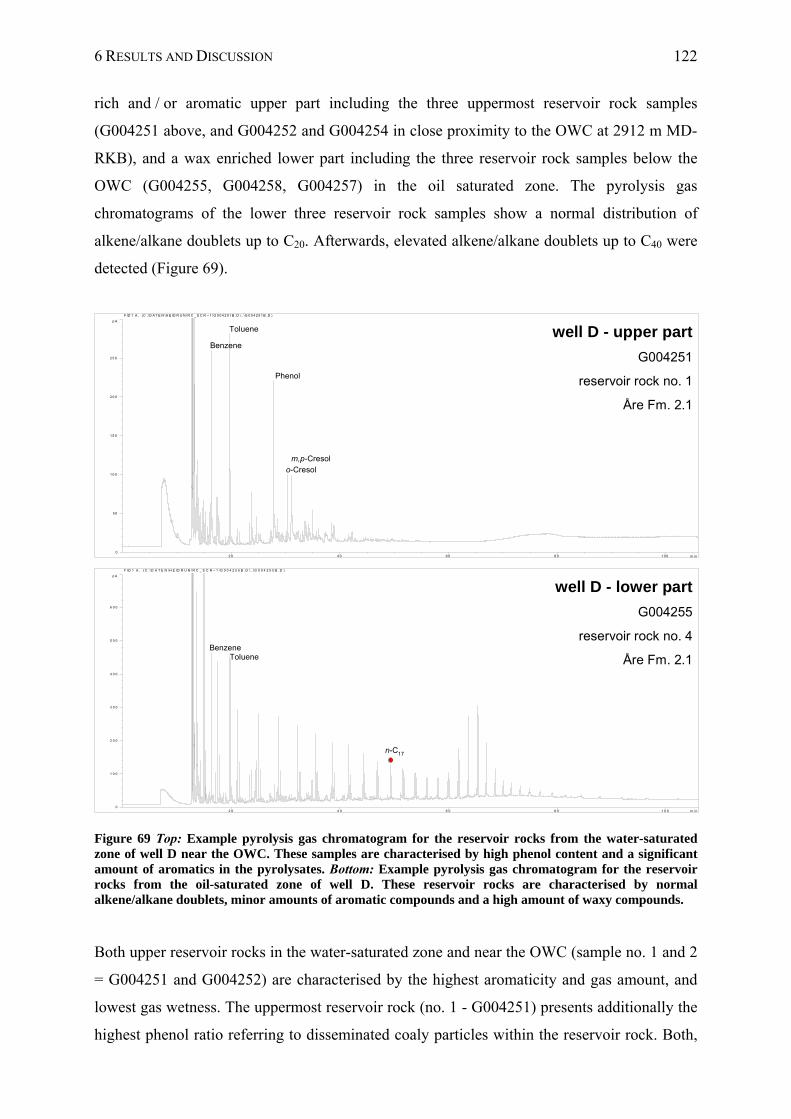
6 RESULTS AND DISCUSSION 122
rich and / or aromatic upper part including the three uppermost reservoir rock samples
(G004251 above, and G004252 and G004254 in close proximity to the OWC at 2912 m MD-
RKB), and a wax enriched lower part including the three reservoir rock samples below the
OWC (G004255, G004258, G004257) in the oil saturated zone. The pyrolysis gas
chromatograms of the lower three reservoir rock samples show a normal distribution of
alkene/alkane doublets up to C20. Afterwards, elevated alkene/alkane doublets up to C40 were
detected (Figure 69).
m in2 0 4 0 6 0 8 0 1 0 0
p A
0
5 0
1 0 0
1 5 0
2 0 0
2 5 0
F ID 1 A , (C :\D A T E N \H E ID R U N \R C _ S C R ~ 1 \G 0 0 4 2 5 1 B .D \. . \G 0 0 4 2 5 1 B .D )
m i n2 0 4 0 6 0 8 0 1 0 0
p A
0
1 0 0
2 0 0
3 0 0
4 0 0
5 0 0
6 0 0
F ID 1 A , ( C : \D A T E N \H E ID R U N \R C _ S C R ~ 1 \G 0 0 4 2 5 5 B .D \. . \G 0 0 4 2 5 5 B .D )
well D - lower part
G004255
reservoir rock no. 4
Åre Fm. 2.1
Benzene
Toluene
Phenol
m,p-Cresolo-Cresol
n-C17
BenzeneToluene
well D - upper part
G004251
reservoir rock no. 1
Åre Fm. 2.1
Figure 69 Top: Example pyrolysis gas chromatogram for the reservoir rocks from the water-saturated zone of well D near the OWC. These samples are characterised by high phenol content and a significant amount of aromatics in the pyrolysates. Bottom: Example pyrolysis gas chromatogram for the reservoir rocks from the oil-saturated zone of well D. These reservoir rocks are characterised by normal alkene/alkane doublets, minor amounts of aromatic compounds and a high amount of waxy compounds.
Both upper reservoir rocks in the water-saturated zone and near the OWC (sample no. 1 and 2
= G004251 and G004252) are characterised by the highest aromaticity and gas amount, and
lowest gas wetness. The uppermost reservoir rock (no. 1 - G004251) presents additionally the
highest phenol ratio referring to disseminated coaly particles within the reservoir rock. Both,
6 RESULTS AND DISCUSSION 123
especially the next to the topmost reservoir rock (no. 2, G004252), are highly aromatic and
nearly depleted in n-alkanes (Figure 69, top). This reservoir rock sample no. 2 is further
depleted in 2-ring aromatics and phenol compounds, which is reflected by a very low
monoaromatic / diaromatic hydrocarbon ratio and a low phenol ratio (Figure 68 B and C).
Below the OWC in the oil-saturated zone, significant gradients could be observed in the
pyrolysis products for all bulk properties (Figure 68 A - E). The aromaticity shows a clear
trend with increasing depth (Figure 68 A). Similar gradients are observed in the gas wetness
and the gas amount (Figure 68 D and E). The gas wetness increases with increasing depth
from 0.44 up to 0.84 and reflects the aromaticity trend. Both parameters show an inverse
correlation. The gas amount decreases with increasing depth proportional to the aromaticity
from 98 % to 26 %.
A similar trend was observed for the relative phenol content (Figure 68 C). The topmost
reservoir rock (G004251) is characterised by an extraordinary high phenol ratio of 23.3. This
is additionally observed for the third to top reservoir rock (G004254). Both samples indicate a
higher terrestrial input that points to disseminated coal particles. With increasing depth, the
phenol amount decreases to 0.02.
Regarding the type of aromatic hydrocarbon ratio, the reservoir rocks show a similar gradient
as observed for the aromaticity. Both ratios show a linear correlation. Excluding the heavy
depleted second to top reservoir rock sample (no.2, G004252) a decrease in 1-ring aromatic
compounds relative to 2-ring aromatic compounds is observed with decreasing depth,
indicating variabilities in the average aromatic ring number within the OM. This trend is
different from those observed in well C (Garn Fm., Figure 31), well A and well E (both Åre
Fm., not shown) indicating differences in the aromatic compounds between these wells as
well as within the reservoir formations.
In addition, the GOR decreases with increasing depth and reveal a linear correlation to the
aromaticity trend. Similar correlations are observed for the reservoir rocks of well C, A, and
E. The UCM mirror the GOR trend and increases with increasing depth.
6.3.2.2.1 ORGANOFACIES AND/OR MATURITY DIFFERENCES
Significant differences in the alkyl chain length distribution of the macromolecules can be
seen in Figure 70 A. Both highly aromatic and n-alkane depleted uppermost reservoir rocks
show a high percentage of short chains and plot in the gas and condensate field indicating
high terrestrial organic matter input. Only one reservoir rock, the third to top sample
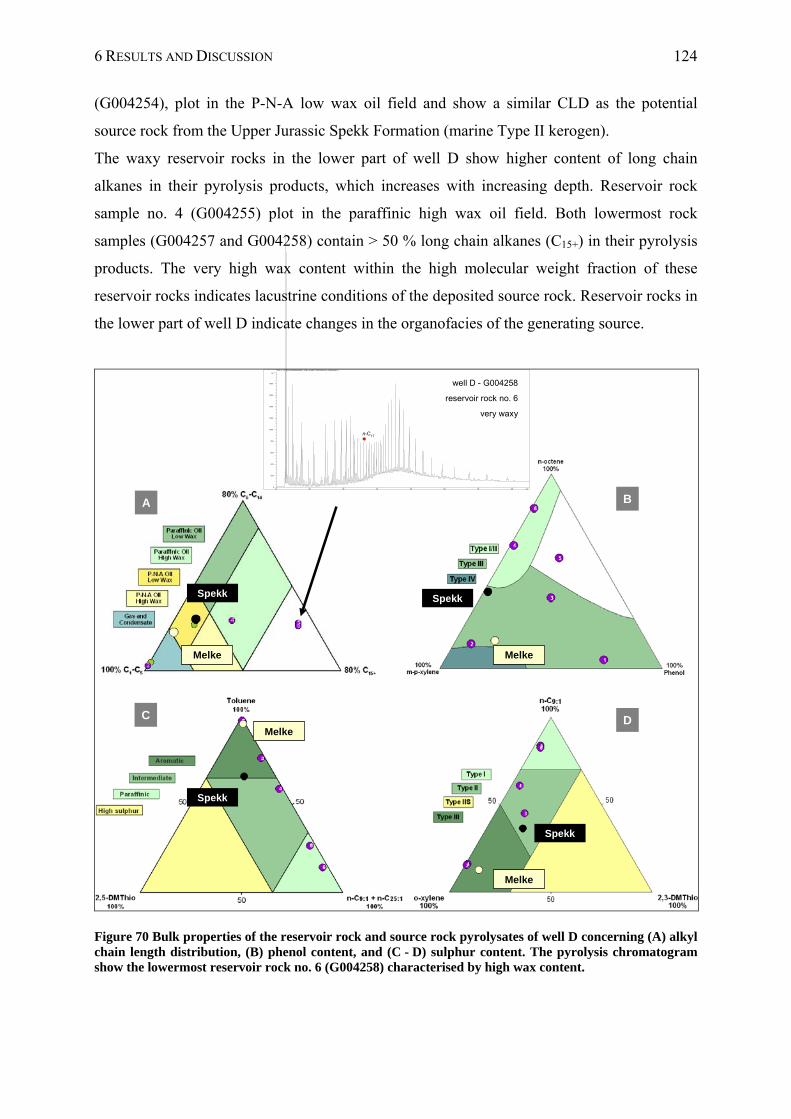
6 RESULTS AND DISCUSSION 124
(G004254), plot in the P-N-A low wax oil field and show a similar CLD as the potential
source rock from the Upper Jurassic Spekk Formation (marine Type II kerogen).
The waxy reservoir rocks in the lower part of well D show higher content of long chain
alkanes in their pyrolysis products, which increases with increasing depth. Reservoir rock
sample no. 4 (G004255) plot in the paraffinic high wax oil field. Both lowermost rock
samples (G004257 and G004258) contain > 50 % long chain alkanes (C15+) in their pyrolysis
products. The very high wax content within the high molecular weight fraction of these
reservoir rocks indicates lacustrine conditions of the deposited source rock. Reservoir rocks in
the lower part of well D indicate changes in the organofacies of the generating source.
min10 20 30 40 50 60 70 80
pA
0
200
400
600
800
1000
1200
1400
1600
1800
FID1 A, (C:\DATEN\HEIDRUN\RC_SCR~1\PART11\G004258A.D\..\G004258A.D)
well D - G004258
reservoir rock no. 6
very waxy
Spekk
Melke
Spekk
Melke
Spekk
Melke
Melke
Spekk
n-C17
A B
C D
Figure 70 Bulk properties of the reservoir rock and source rock pyrolysates of well D concerning (A) alkyl chain length distribution, (B) phenol content, and (C - D) sulphur content. The pyrolysis chromatogram show the lowermost reservoir rock no. 6 (G004258) characterised by high wax content.
6 RESULTS AND DISCUSSION 125
Depending on their phenol content, the reservoir rock samples no. 1 (G004251) and no. 3
(G004254) plot closest to the phenol apex indicating high amount of terrestrial material
(Figure 70 B). All reservoir rocks show differences in the aromaticity. As expected, both
uppermost rock samples show the highest aromaticity represented by m, p-xylene. With
increasing depth, the reservoir rock samples become more paraffinic represented by n-octene.
Both ternaries in Figure 70 (C and D) indicate low sulphur content for all reservoir rocks and
show large differences in aromaticity and paraffinicity.
6.3.2.2.2 CORRELATION TO PHYSICAL ROCK PROPERTIES (WELL LOG DATA)
The fluvial dominated Åre Fm. 2.1 comprises fluvial channel-sandstones (reservoirs) departed
by floodplain mudstones and numerous layer of peat swamp coal. The heterogeneous
succession of the alternating sediments is reflected by changes in the poroperm properties at
very small scale (Figure 14).
The highest aromaticity was observed in the upper water leg and near the OWC (Figure 14,
Figure 68 A). Both zones are characterised by different poroperm properties. However, higher
aromaticity might be correlated to higher water saturation. The gradient in aromaticity was
observed in the oil-saturated zone from 2912 m up to 2937 m MD-RKB. This zone is
characterised by generally low poroperm properties (Φ up to 10 % and Κ = 2 - 200 md),
which shows a strong alternation at very small scale. Thus, no direct correlation to the trend
observed in the pyrolysis products was found based on visual comparison alone.
In summary, concerning the pyrolysis products, profile D can roughly be subdivided in two
parts, a phenol rich and/or aromatic upper part including both uppermost reservoir rock
samples, one from the water leg and one near the OWC, and a wax enriched lower part,
including the four lowermost rock samples from the oil-saturated zone.
The reservoir rocks within and near the water-saturated zone are additionally characterised by
the highest gas amount, lowest gas wetness, a low PI and a low OM content. Both samples are
depleted in n-alkanes. The next to the top reservoir rock is further depleted in 2- ring aromatic
compounds and phenol.
Reservoir rocks in the oil-saturated zone show high proportions of long chain alkane/alkane
doublets in their pyrolysates, which are typical for high wax content. These reservoir rocks
6 RESULTS AND DISCUSSION 126
show gradients for all bulk properties in their pyrolysates. The aromaticity decreases with
increasing depth and shows an inverse correlation to the gas wetness. Additionally, the
aromaticity is linear correlated to the 1-ring aromatic / 2-ring aromatic hydrocarbon ratio and
the GOR. One reservoir rock refers to disseminated coal.
Reservoir rocks with wax enriched pyrolysis products in the lower part of well D indicate a
lacustrine influence of the generating source. No indications for maturity differences were
found. The high aromaticity in the reservoir rocks from the upper part might correlate to
higher water saturation. However, no direct correlation of the physical rock properties to the
trends observed in the pyrolysis products were found based on visual comparison alone.
6.3.3 WELL 6507/8-4 IN HEIDRUN NORTH (ÅRE FM. 2.1 - 1)
6.3.3.1 PRODUCTION INDEX AND ORGANIC RICHNESS
The average PI of the Åre Fm. reservoir rock samples is about 0.64 (± 0.02) (Figure 25, Table
X 1). A slight V-shaped gradient was observed in the oil quality within the profile. In the
upper part the PI decrease from 0.66 to 0.61; in the lower part the PI rises again up to 0.66 at
the OWC. The sample next to last, short below the OWC, present the highest PI, similar as
observed in well 6507/7-6 (Åre Fm.). Down to the lowermost reservoir rock, the PI slightly
decreases.
The mean organic matter content is about 22.36 mg/g rock (± 8.99) (Figure 26, Table X 1).
An inverse V-shaped gradient was observed within the OM distribution. In the upper part, the
OM content increases with increasing depth from 13.70 to 35.70 mg/g rock, while reservoir
rocks in the lower part of well 6507/8-4 near the OWC are characterised by a decrease in the
OM amount to 14.40 mg/g rock. However, the lowermost reservoir rock has a higher OM
content of 33.47 mg/g rock.
The organic matter distribution and the oil quality (PI) show an inverse correlation.
6.3.3.2 ORGANIC MATTER COMPOSITION
Figure 71 A - E shows the pyrolysis products of well 6507/8-4 in geochemical depth plots for
the aromaticity (A), monoaromatic / diaromatic hydrocarbon ratio (B), relative phenol content
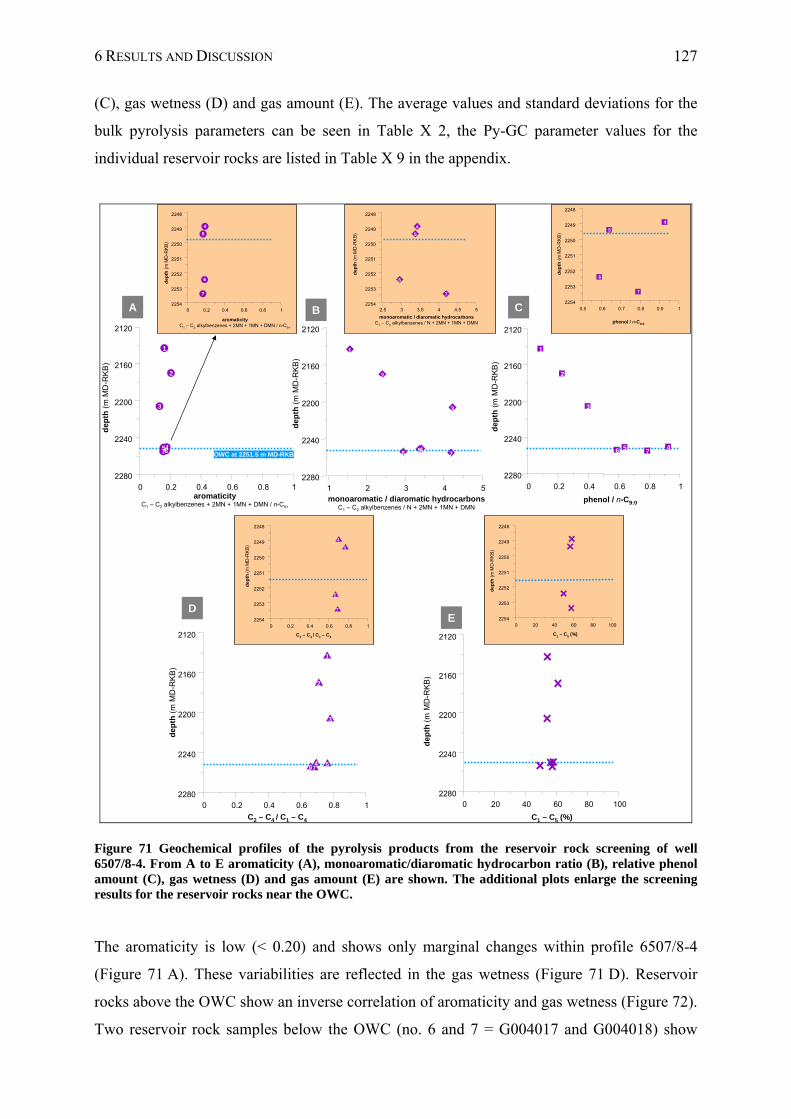
6 RESULTS AND DISCUSSION 127
(C), gas wetness (D) and gas amount (E). The average values and standard deviations for the
bulk pyrolysis parameters can be seen in Table X 2, the Py-GC parameter values for the
individual reservoir rocks are listed in Table X 9 in the appendix.
OWC at 2251.5 m MD-RKB
0 0.2 0.4 0.6 0.8 12280
2240
2200
2160
2120
1
2
3
4567
1 2 3 4 52280
2240
2200
2160
2120
1
2
3
456 7
aromaticityC1 – C2 alkylbenzenes + 2MN + 1MN + DMN / n-C5+
monoaromatic / diaromatic hydrocarbonsC1 – C2 alkylbenzenes / N + 2MN + 1MN + DMN
dep
th (
m M
D-R
KB
)
dep
th (
m M
D-R
KB
)
0 0.2 0.4 0.6 0.8 12254
2253
2252
2251
2250
2249
2248
4
5
6
7
2.5 3 3.5 4 4.5 52254
2253
2252
2251
2250
2249
2248
4
5
6
7
0.5 0.6 0.7 0.8 0.9 12254
2253
2252
2251
2250
2249
2248
4
5
6
7
aromaticityC1 – C2 alkylbenzenes + 2MN + 1MN + DMN / n-C5+
monoaromatic / diaromatic hydrocarbonsC1 – C2 alkylbenzenes / N + 2MN + 1MN + DMN
0 0.2 0.4 0.6 0.8 12280
2240
2200
2160
2120
1
2
3
456 7
phenol / n-C9:0
dep
th (
m M
D-R
KB
)
phenol / n-C9:0
dep
th (
m M
D-R
KB
)
de
pth
(m
MD
-RK
B)
dep
th (
m M
D-R
KB
)
0 0.2 0.4 0.6 0.8 12254
2253
2252
2251
2250
2249
2248
4
5
6
7
0 20 40 60 80 1002254
2253
2252
2251
2250
2249
2248
de
pth
(m
MD
-RK
B)
de
pth
(m
MD
-RK
B)
C2 – C4 / C1 – C4
C1 – C5 (%)
C1 – C5 (%)
0 20 40 60 80 1002280
2240
2200
2160
2120
dep
th (
m M
D-R
KB
)
C2 – C4 / C1 – C4
0 0.2 0.4 0.6 0.8 12280
2240
2200
2160
2120
1
2
3
4 567
dep
th (
m M
D-R
KB
)
A B C
DE
Figure 71 Geochemical profiles of the pyrolysis products from the reservoir rock screening of well 6507/8-4. From A to E aromaticity (A), monoaromatic/diaromatic hydrocarbon ratio (B), relative phenol amount (C), gas wetness (D) and gas amount (E) are shown. The additional plots enlarge the screening results for the reservoir rocks near the OWC.
The aromaticity is low (< 0.20) and shows only marginal changes within profile 6507/8-4
(Figure 71 A). These variabilities are reflected in the gas wetness (Figure 71 D). Reservoir
rocks above the OWC show an inverse correlation of aromaticity and gas wetness (Figure 72).
Two reservoir rock samples below the OWC (no. 6 and 7 = G004017 and G004018) show
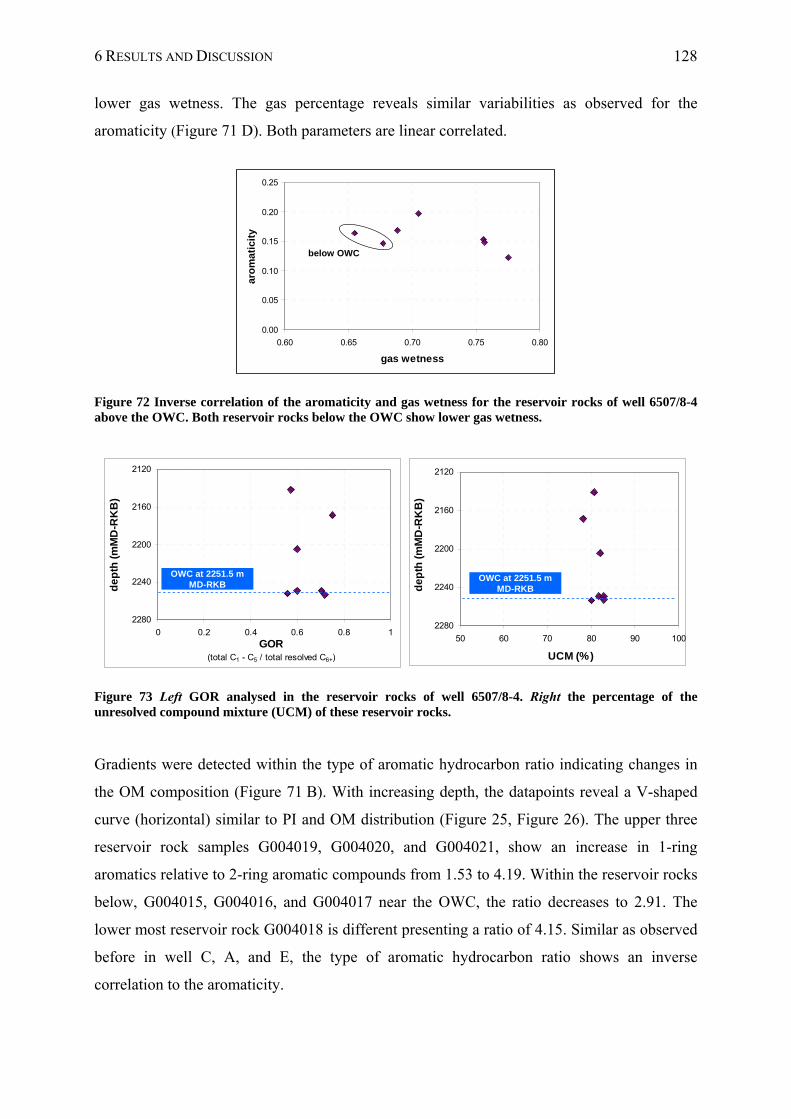
6 RESULTS AND DISCUSSION 128
lower gas wetness. The gas percentage reveals similar variabilities as observed for the
aromaticity (Figure 71 D). Both parameters are linear correlated.
0.00
0.05
0.10
0.15
0.20
0.25
0.60 0.65 0.70 0.75 0.80
gas wetness
aro
mati
city
below OWC
Figure 72 Inverse correlation of the aromaticity and gas wetness for the reservoir rocks of well 6507/8-4 above the OWC. Both reservoir rocks below the OWC show lower gas wetness.
2120
2160
2200
2240
2280
0 0.2 0.4 0.6 0.8 1GOR
(total C1 - C5 / total resolved C6+)
de
pth
(m
MD
-RK
B)
2120
2160
2200
2240
2280
50 60 70 80 90 100
UCM (%)
de
pth
(m
MD
-RK
B)
OWC at 2251.5 m MD-RKB
OWC at 2251.5 m MD-RKB
Figure 73 Left GOR analysed in the reservoir rocks of well 6507/8-4. Right the percentage of the unresolved compound mixture (UCM) of these reservoir rocks.
Gradients were detected within the type of aromatic hydrocarbon ratio indicating changes in
the OM composition (Figure 71 B). With increasing depth, the datapoints reveal a V-shaped
curve (horizontal) similar to PI and OM distribution (Figure 25, Figure 26). The upper three
reservoir rock samples G004019, G004020, and G004021, show an increase in 1-ring
aromatics relative to 2-ring aromatic compounds from 1.53 to 4.19. Within the reservoir rocks
below, G004015, G004016, and G004017 near the OWC, the ratio decreases to 2.91. The
lower most reservoir rock G004018 is different presenting a ratio of 4.15. Similar as observed
before in well C, A, and E, the type of aromatic hydrocarbon ratio shows an inverse
correlation to the aromaticity.
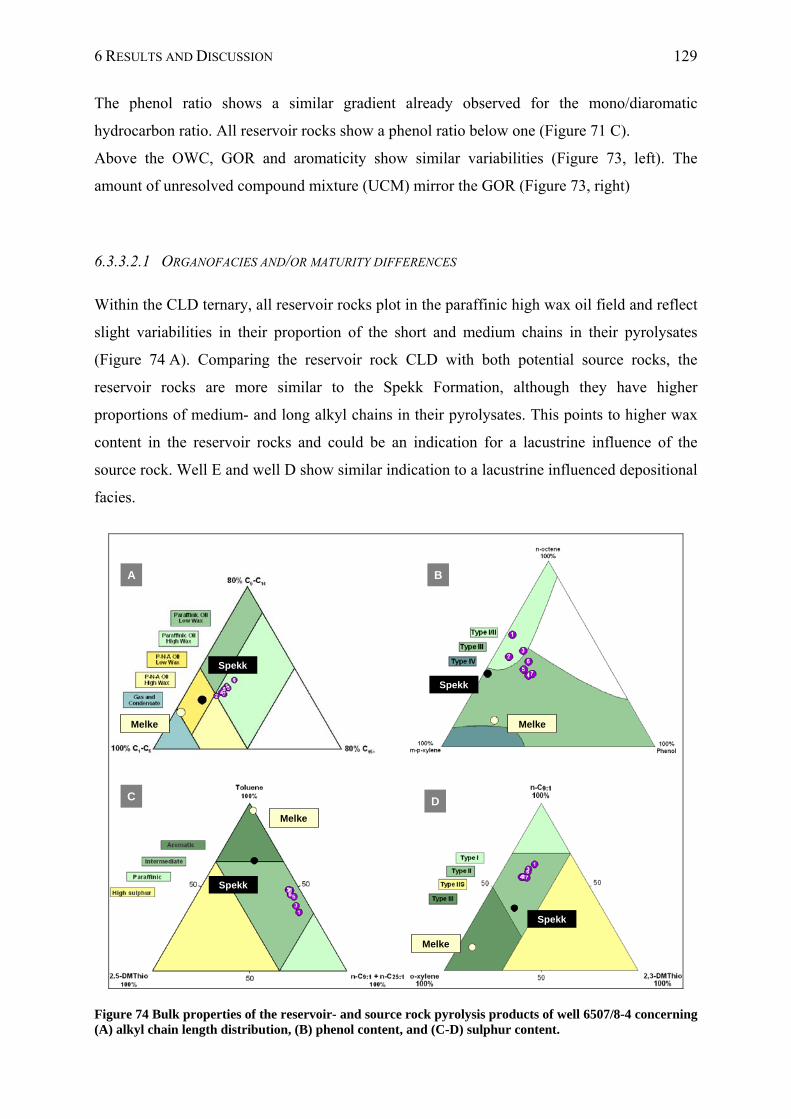
6 RESULTS AND DISCUSSION 129
The phenol ratio shows a similar gradient already observed for the mono/diaromatic
hydrocarbon ratio. All reservoir rocks show a phenol ratio below one (Figure 71 C).
Above the OWC, GOR and aromaticity show similar variabilities (Figure 73, left). The
amount of unresolved compound mixture (UCM) mirror the GOR (Figure 73, right)
6.3.3.2.1 ORGANOFACIES AND/OR MATURITY DIFFERENCES
Within the CLD ternary, all reservoir rocks plot in the paraffinic high wax oil field and reflect
slight variabilities in their proportion of the short and medium chains in their pyrolysates
(Figure 74 A). Comparing the reservoir rock CLD with both potential source rocks, the
reservoir rocks are more similar to the Spekk Formation, although they have higher
proportions of medium- and long alkyl chains in their pyrolysates. This points to higher wax
content in the reservoir rocks and could be an indication for a lacustrine influence of the
source rock. Well E and well D show similar indication to a lacustrine influenced depositional
facies.
Spekk
Melke
Spekk
Melke
Spekk
Melke
Spekk
Melke
A B
C D
Figure 74 Bulk properties of the reservoir- and source rock pyrolysis products of well 6507/8-4 concerning (A) alkyl chain length distribution, (B) phenol content, and (C-D) sulphur content.
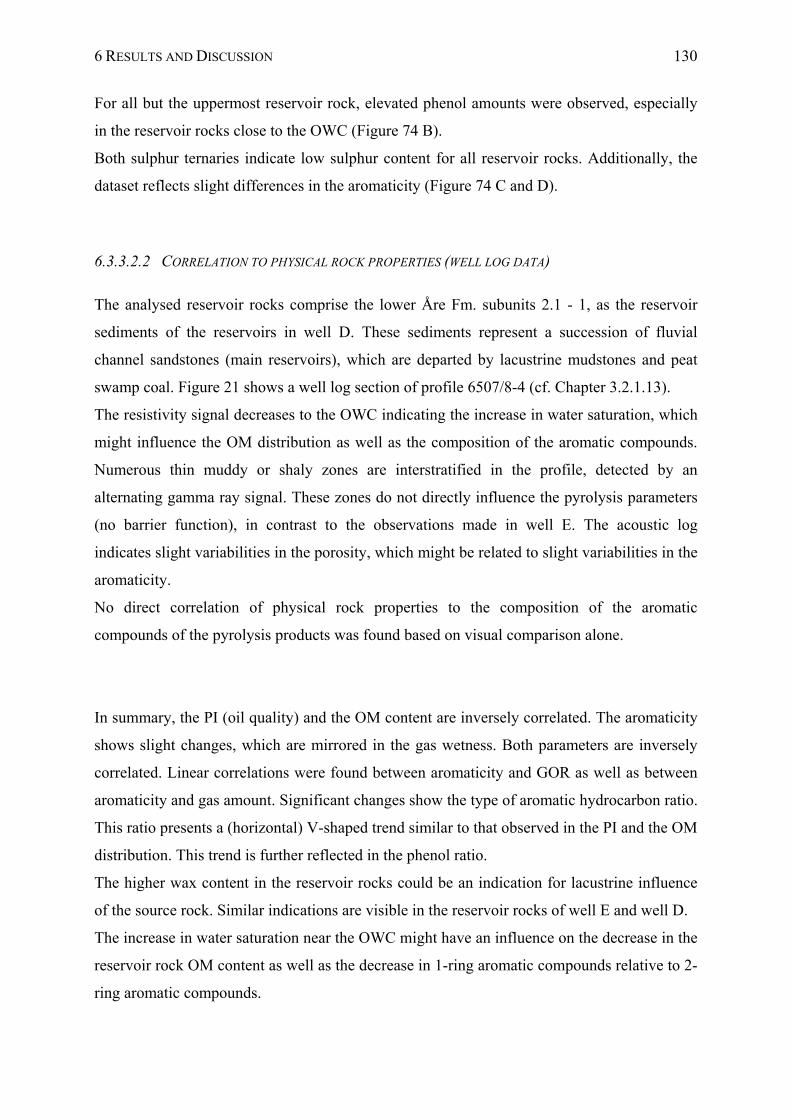
6 RESULTS AND DISCUSSION 130
For all but the uppermost reservoir rock, elevated phenol amounts were observed, especially
in the reservoir rocks close to the OWC (Figure 74 B).
Both sulphur ternaries indicate low sulphur content for all reservoir rocks. Additionally, the
dataset reflects slight differences in the aromaticity (Figure 74 C and D).
6.3.3.2.2 CORRELATION TO PHYSICAL ROCK PROPERTIES (WELL LOG DATA)
The analysed reservoir rocks comprise the lower Åre Fm. subunits 2.1 - 1, as the reservoir
sediments of the reservoirs in well D. These sediments represent a succession of fluvial
channel sandstones (main reservoirs), which are departed by lacustrine mudstones and peat
swamp coal. Figure 21 shows a well log section of profile 6507/8-4 (cf. Chapter 3.2.1.13).
The resistivity signal decreases to the OWC indicating the increase in water saturation, which
might influence the OM distribution as well as the composition of the aromatic compounds.
Numerous thin muddy or shaly zones are interstratified in the profile, detected by an
alternating gamma ray signal. These zones do not directly influence the pyrolysis parameters
(no barrier function), in contrast to the observations made in well E. The acoustic log
indicates slight variabilities in the porosity, which might be related to slight variabilities in the
aromaticity.
No direct correlation of physical rock properties to the composition of the aromatic
compounds of the pyrolysis products was found based on visual comparison alone.
In summary, the PI (oil quality) and the OM content are inversely correlated. The aromaticity
shows slight changes, which are mirrored in the gas wetness. Both parameters are inversely
correlated. Linear correlations were found between aromaticity and GOR as well as between
aromaticity and gas amount. Significant changes show the type of aromatic hydrocarbon ratio.
This ratio presents a (horizontal) V-shaped trend similar to that observed in the PI and the OM
distribution. This trend is further reflected in the phenol ratio.
The higher wax content in the reservoir rocks could be an indication for lacustrine influence
of the source rock. Similar indications are visible in the reservoir rocks of well E and well D.
The increase in water saturation near the OWC might have an influence on the decrease in the
reservoir rock OM content as well as the decrease in 1-ring aromatic compounds relative to 2-
ring aromatic compounds.
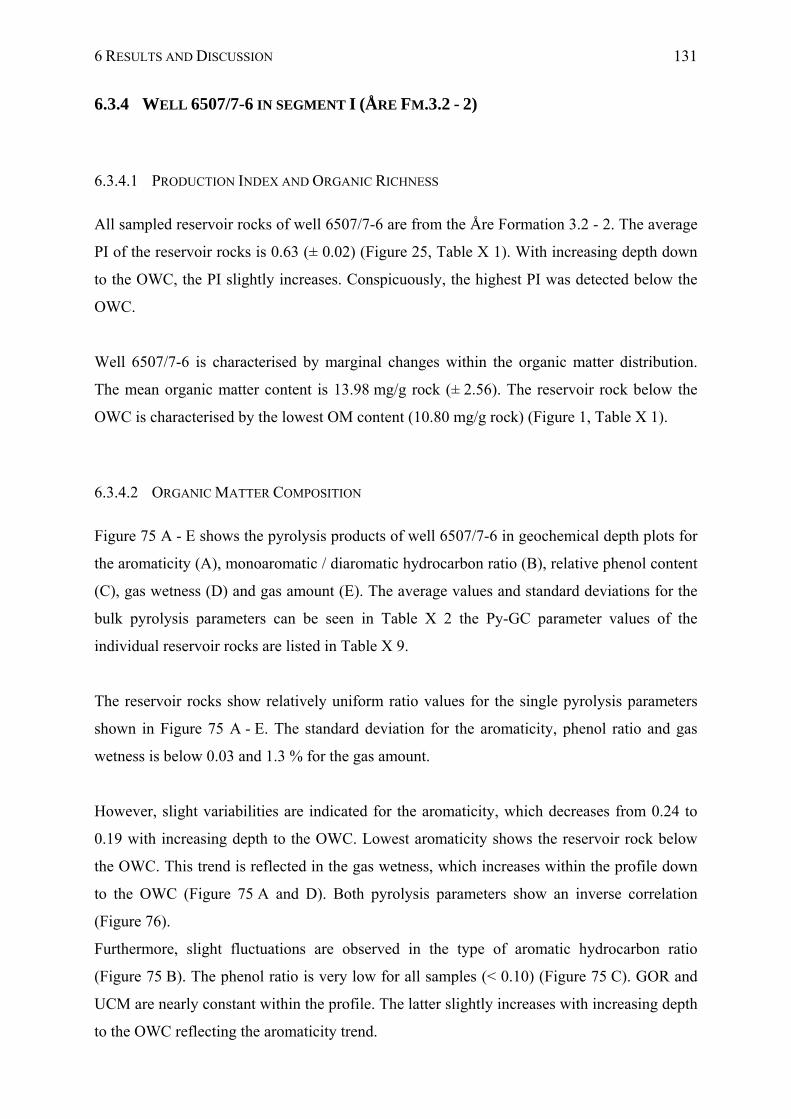
6 RESULTS AND DISCUSSION 131
6.3.4 WELL 6507/7-6 IN SEGMENT I (ÅRE FM.3.2 - 2)
6.3.4.1 PRODUCTION INDEX AND ORGANIC RICHNESS
All sampled reservoir rocks of well 6507/7-6 are from the Åre Formation 3.2 - 2. The average
PI of the reservoir rocks is 0.63 (± 0.02) (Figure 25, Table X 1). With increasing depth down
to the OWC, the PI slightly increases. Conspicuously, the highest PI was detected below the
OWC.
Well 6507/7-6 is characterised by marginal changes within the organic matter distribution.
The mean organic matter content is 13.98 mg/g rock (± 2.56). The reservoir rock below the
OWC is characterised by the lowest OM content (10.80 mg/g rock) (Figure 1, Table X 1).
6.3.4.2 ORGANIC MATTER COMPOSITION
Figure 75 A - E shows the pyrolysis products of well 6507/7-6 in geochemical depth plots for
the aromaticity (A), monoaromatic / diaromatic hydrocarbon ratio (B), relative phenol content
(C), gas wetness (D) and gas amount (E). The average values and standard deviations for the
bulk pyrolysis parameters can be seen in Table X 2 the Py-GC parameter values of the
individual reservoir rocks are listed in Table X 9.
The reservoir rocks show relatively uniform ratio values for the single pyrolysis parameters
shown in Figure 75 A - E. The standard deviation for the aromaticity, phenol ratio and gas
wetness is below 0.03 and 1.3 % for the gas amount.
However, slight variabilities are indicated for the aromaticity, which decreases from 0.24 to
0.19 with increasing depth to the OWC. Lowest aromaticity shows the reservoir rock below
the OWC. This trend is reflected in the gas wetness, which increases within the profile down
to the OWC (Figure 75 A and D). Both pyrolysis parameters show an inverse correlation
(Figure 76).
Furthermore, slight fluctuations are observed in the type of aromatic hydrocarbon ratio
(Figure 75 B). The phenol ratio is very low for all samples (< 0.10) (Figure 75 C). GOR and
UCM are nearly constant within the profile. The latter slightly increases with increasing depth
to the OWC reflecting the aromaticity trend.
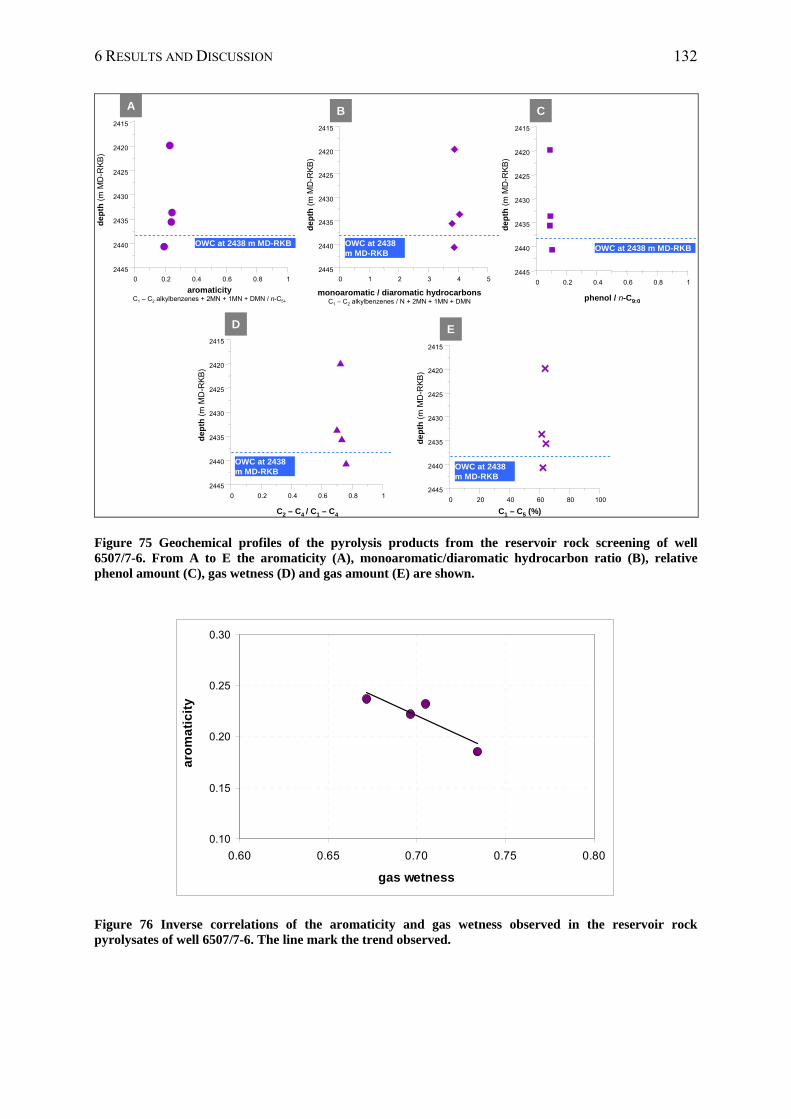
6 RESULTS AND DISCUSSION 132
OWC at 2438 m MD-RKB
0 0.2 0.4 0.6 0.8 1
2445
2440
2435
2430
2425
2420
2415
0 1 2 3 4 52445
2440
2435
2430
2425
2420
2415
0 0.2 0.4 0.6 0.8 1
2445
2440
2435
2430
2425
2420
2415
0 0.2 0.4 0.6 0.8 1
2445
2440
2435
2430
2425
2420
2415
0 20 40 60 80 100
2445
2440
2435
2430
2425
2420
2415
de
pth
(m
MD
-RK
B)
de
pth
(m
MD
-RK
B)
de
pth
(m
MD
-RK
B)
dep
th (
m M
D-R
KB
)
de
pth
(m
MD
-RK
B)
OWC at 2438 m MD-RKB
OWC at 2438 m MD-RKB
OWC at 2438 m MD-RKB
OWC at 2438 m MD-RKB
aromaticityC1 – C2 alkylbenzenes + 2MN + 1MN + DMN / n-C5+
monoaromatic / diaromatic hydrocarbonsC1 – C2 alkylbenzenes / N + 2MN + 1MN + DMN phenol / n-C9:0
C1 – C5 (%)C2 – C4 / C1 – C4
A B C
D E
Figure 75 Geochemical profiles of the pyrolysis products from the reservoir rock screening of well 6507/7-6. From A to E the aromaticity (A), monoaromatic/diaromatic hydrocarbon ratio (B), relative phenol amount (C), gas wetness (D) and gas amount (E) are shown.
0.10
0.15
0.20
0.25
0.30
0.60 0.65 0.70 0.75 0.80
gas wetness
aro
ma
tic
ity
Figure 76 Inverse correlations of the aromaticity and gas wetness observed in the reservoir rock pyrolysates of well 6507/7-6. The line mark the trend observed.
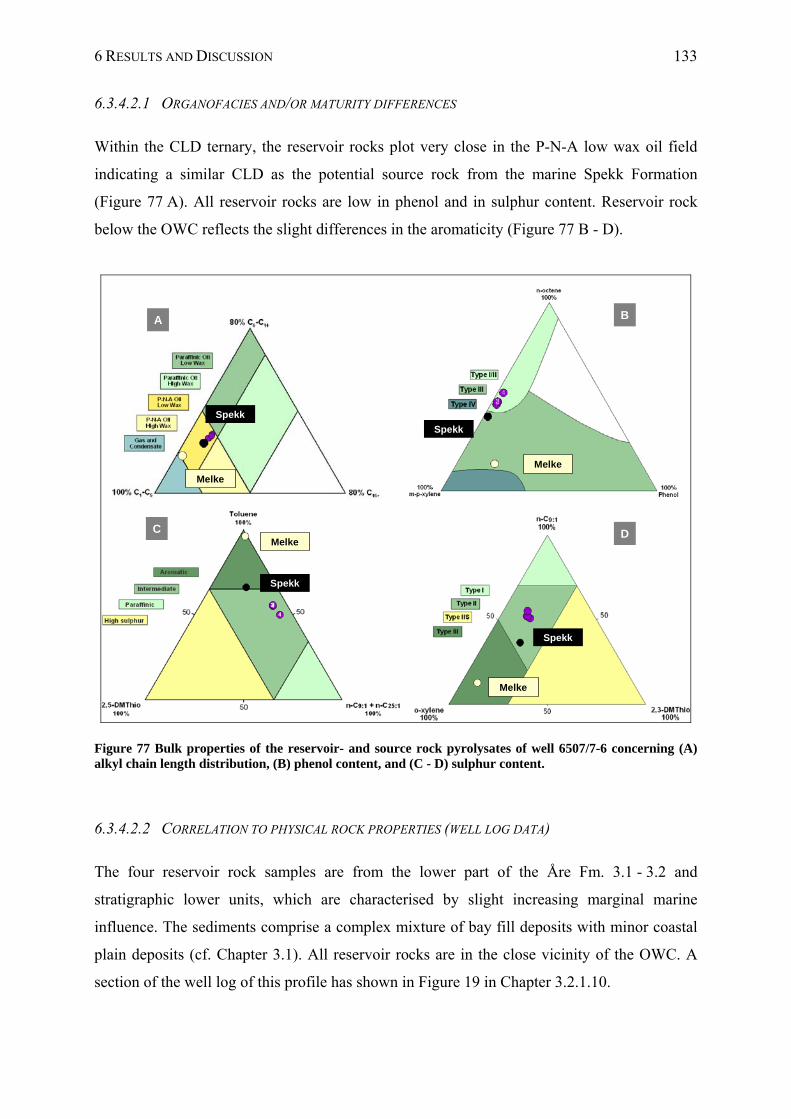
6 RESULTS AND DISCUSSION 133
6.3.4.2.1 ORGANOFACIES AND/OR MATURITY DIFFERENCES
Within the CLD ternary, the reservoir rocks plot very close in the P-N-A low wax oil field
indicating a similar CLD as the potential source rock from the marine Spekk Formation
(Figure 77 A). All reservoir rocks are low in phenol and in sulphur content. Reservoir rock
below the OWC reflects the slight differences in the aromaticity (Figure 77 B - D).
Spekk
Melke
Spekk
Melke
Spekk
Melke
Spekk
Melke
A B
C D
Figure 77 Bulk properties of the reservoir- and source rock pyrolysates of well 6507/7-6 concerning (A) alkyl chain length distribution, (B) phenol content, and (C - D) sulphur content.
6.3.4.2.2 CORRELATION TO PHYSICAL ROCK PROPERTIES (WELL LOG DATA)
The four reservoir rock samples are from the lower part of the Åre Fm. 3.1 - 3.2 and
stratigraphic lower units, which are characterised by slight increasing marginal marine
influence. The sediments comprise a complex mixture of bay fill deposits with minor coastal
plain deposits (cf. Chapter 3.1). All reservoir rocks are in the close vicinity of the OWC. A
section of the well log of this profile has shown in Figure 19 in Chapter 3.2.1.10.
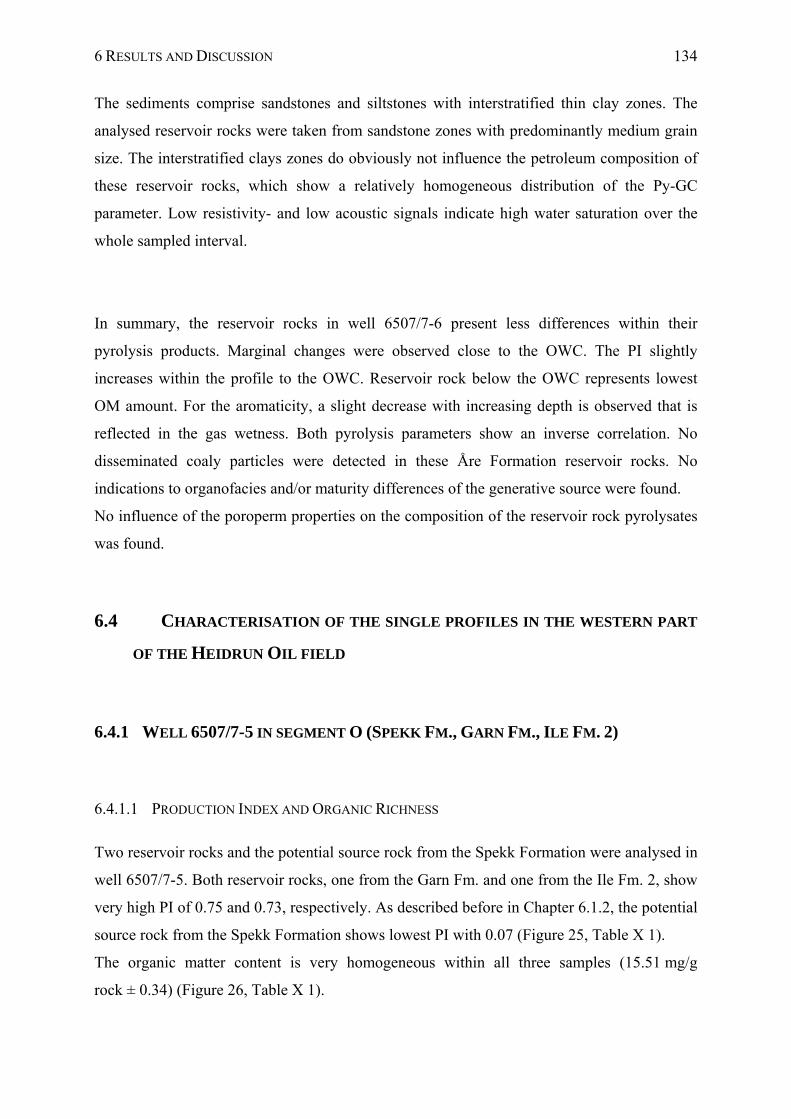
6 RESULTS AND DISCUSSION 134
The sediments comprise sandstones and siltstones with interstratified thin clay zones. The
analysed reservoir rocks were taken from sandstone zones with predominantly medium grain
size. The interstratified clays zones do obviously not influence the petroleum composition of
these reservoir rocks, which show a relatively homogeneous distribution of the Py-GC
parameter. Low resistivity- and low acoustic signals indicate high water saturation over the
whole sampled interval.
In summary, the reservoir rocks in well 6507/7-6 present less differences within their
pyrolysis products. Marginal changes were observed close to the OWC. The PI slightly
increases within the profile to the OWC. Reservoir rock below the OWC represents lowest
OM amount. For the aromaticity, a slight decrease with increasing depth is observed that is
reflected in the gas wetness. Both pyrolysis parameters show an inverse correlation. No
disseminated coaly particles were detected in these Åre Formation reservoir rocks. No
indications to organofacies and/or maturity differences of the generative source were found.
No influence of the poroperm properties on the composition of the reservoir rock pyrolysates
was found.
6.4 CHARACTERISATION OF THE SINGLE PROFILES IN THE WESTERN PART
OF THE HEIDRUN OIL FIELD
6.4.1 WELL 6507/7-5 IN SEGMENT O (SPEKK FM., GARN FM., ILE FM. 2)
6.4.1.1 PRODUCTION INDEX AND ORGANIC RICHNESS
Two reservoir rocks and the potential source rock from the Spekk Formation were analysed in
well 6507/7-5. Both reservoir rocks, one from the Garn Fm. and one from the Ile Fm. 2, show
very high PI of 0.75 and 0.73, respectively. As described before in Chapter 6.1.2, the potential
source rock from the Spekk Formation shows lowest PI with 0.07 (Figure 25, Table X 1).
The organic matter content is very homogeneous within all three samples (15.51 mg/g
rock ± 0.34) (Figure 26, Table X 1).
6 RESULTS AND DISCUSSION 135
6.4.1.2 ORGANIC MATTER COMPOSITION
The pyrolysis gas chromatograms of both reservoir rocks show a normal distribution of
alkene/alkane doublets up to C30. Towards higher retention times, alkanes between C30 and
C40 were detected in the pyrolysates. In Figure 78 A - E, the pyrolysis products of well
6507/7-5 are shown in geochemical depth plots for the aromaticity (A), monoaromatic /
diaromatic hydrocarbon ratio (B), relative phenol content (C), gas wetness (D) and gas
amount (E). The average values and standard deviations for the bulk pyrolysis parameters can
be seen in Table X 2, the Py-GC parameter values for the individual reservoir rocks are listed
in Table X 9 in the appendix.
OWC at 2661 M MD-RKB
250
m
Spekk Fm.Garn Fm.Ile Fm 2
Spekk Fm.Garn Fm.Ile Fm 2
0 0.2 0.4 0.6 0.8 1
2440
2400
2360
2320
2280
2 3 4 5
2440
2400
2360
2320
2280
0 0.2 0.4 0.6 0.8 1
2440
2400
2360
2320
2280
aromaticityC1 – C2 alkylbenzenes + 2MN + 1MN + DMN / n-C5+
monoaromatic / diaromatic hydrocarbonsC1 – C2 alkylbenzenes / N + 2MN + 1MN + DMN phenol / n-C9:0
dep
th (
m M
D-R
KB
)
de
pth
(m
MD
-RK
B)
de
pth
(m
MD
-RK
B)
A B C
0 0.2 0.4 0.6 0.8 1
2440
2400
2360
2320
2280
50 60 70 80 90 100
2440
2400
2360
2320
2280
dep
th (
m M
D-R
KB
)
de
pth
(m
MD
-RK
B)
D E
C1 – C5 (%)C2 – C4 / C1 – C4
Figure 78 Geochemical profiles of the pyrolysis products from the reservoir rock screening of well 6507/7-5. From A to D aromaticity (A), monoaromatic/diaromatic hydrocarbon ratio (B), relative phenol amount (C), gas wetness (D) and gas amount (E) are shown.
The potential source rock from the Spekk Fm. shows high aromaticity (0.38), lower gas
wetness (0.72) and a slightly higher gas amount (67.1 %) in the pyrolysates compared to both
reservoir rocks.
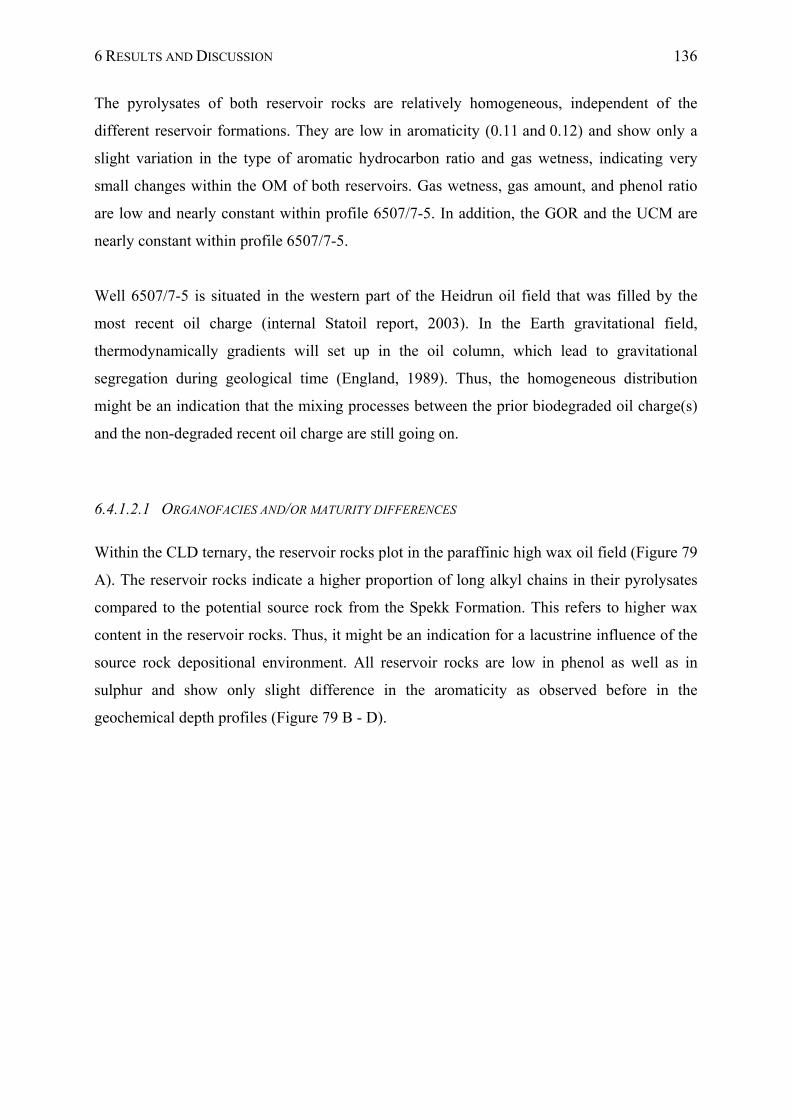
6 RESULTS AND DISCUSSION 136
The pyrolysates of both reservoir rocks are relatively homogeneous, independent of the
different reservoir formations. They are low in aromaticity (0.11 and 0.12) and show only a
slight variation in the type of aromatic hydrocarbon ratio and gas wetness, indicating very
small changes within the OM of both reservoirs. Gas wetness, gas amount, and phenol ratio
are low and nearly constant within profile 6507/7-5. In addition, the GOR and the UCM are
nearly constant within profile 6507/7-5.
Well 6507/7-5 is situated in the western part of the Heidrun oil field that was filled by the
most recent oil charge (internal Statoil report, 2003). In the Earth gravitational field,
thermodynamically gradients will set up in the oil column, which lead to gravitational
segregation during geological time (England, 1989). Thus, the homogeneous distribution
might be an indication that the mixing processes between the prior biodegraded oil charge(s)
and the non-degraded recent oil charge are still going on.
6.4.1.2.1 ORGANOFACIES AND/OR MATURITY DIFFERENCES
Within the CLD ternary, the reservoir rocks plot in the paraffinic high wax oil field (Figure 79
A). The reservoir rocks indicate a higher proportion of long alkyl chains in their pyrolysates
compared to the potential source rock from the Spekk Formation. This refers to higher wax
content in the reservoir rocks. Thus, it might be an indication for a lacustrine influence of the
source rock depositional environment. All reservoir rocks are low in phenol as well as in
sulphur and show only slight difference in the aromaticity as observed before in the
geochemical depth profiles (Figure 79 B - D).
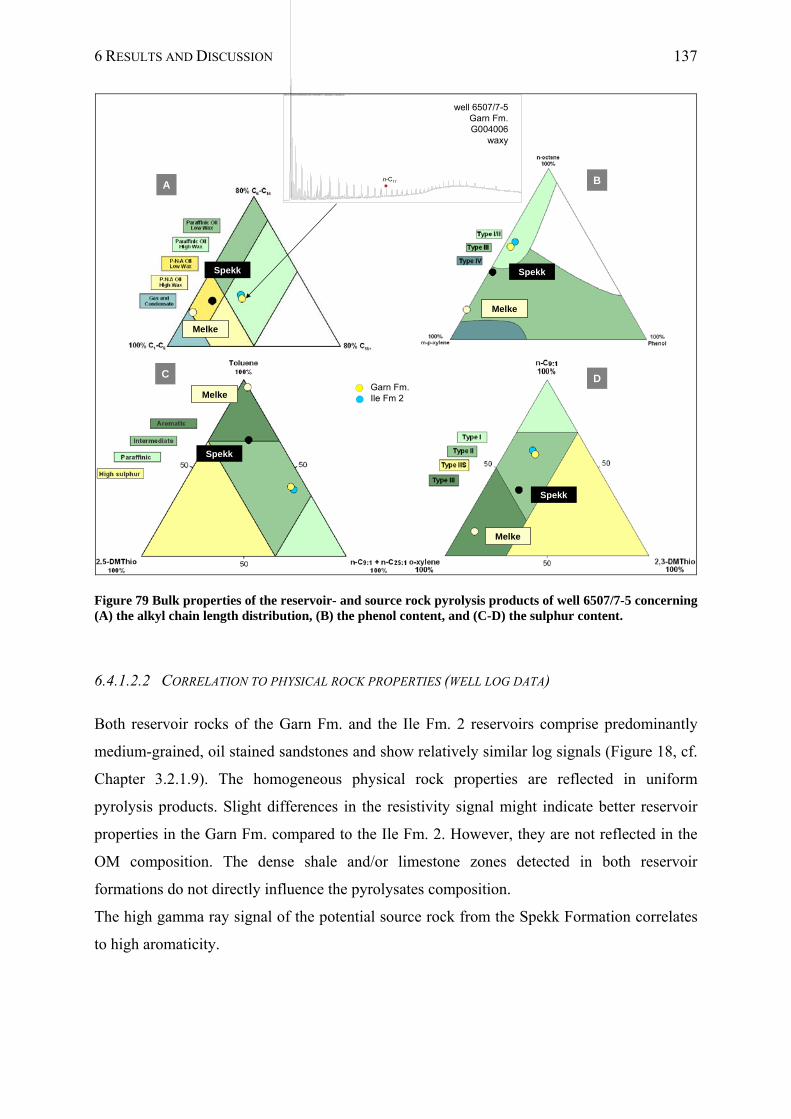
6 RESULTS AND DISCUSSION 137
Spekk
Melke
Spekk
Melke
Spekk
Melke
Spekk
Melke
A B
C DGarn Fm.Ile Fm 2
FID1 A, (C:\DATEN\HEIDRUN\RC_SCR~1\NPD\PART5_~1\G004006A.D\..\G004006A.D)
n-C17
well 6507/7-5Garn Fm.G004006
waxy
Figure 79 Bulk properties of the reservoir- and source rock pyrolysis products of well 6507/7-5 concerning (A) the alkyl chain length distribution, (B) the phenol content, and (C-D) the sulphur content.
6.4.1.2.2 CORRELATION TO PHYSICAL ROCK PROPERTIES (WELL LOG DATA)
Both reservoir rocks of the Garn Fm. and the Ile Fm. 2 reservoirs comprise predominantly
medium-grained, oil stained sandstones and show relatively similar log signals (Figure 18, cf.
Chapter 3.2.1.9). The homogeneous physical rock properties are reflected in uniform
pyrolysis products. Slight differences in the resistivity signal might indicate better reservoir
properties in the Garn Fm. compared to the Ile Fm. 2. However, they are not reflected in the
OM composition. The dense shale and/or limestone zones detected in both reservoir
formations do not directly influence the pyrolysates composition.
The high gamma ray signal of the potential source rock from the Spekk Formation correlates
to high aromaticity.
6 RESULTS AND DISCUSSION 138
In summary, both reservoir rocks show uniform bulk properties. They are characterised by
high oil quality and low aromaticity. The Spekk Formation shale show very low oil quality
(PI), high aromaticity, a lower gas wetness and a slightly higher gas amount in the pyrolysates
compared to the Garn and Ile Formation reservoir rock samples. The reservoir rock samples
are characterised by slightly higher proportion of medium- and long chains in their
pyrolysates compared to the potential source rock from the Spekk Formation. This refers to
waxy compounds in the reservoir rocks, which might be an indication to a lacustrine influence
of the generating source. Both, the Garn Fm. and the Ile Fm. reservoir rock samples, show
nearly similar physical rock properties.
This homogeneous distribution of the pyrolysis products in well 6507/7-5 might be an
indication that mixing processes between different oil charges are still going on, as
thermodynamically gradients have not yet set up in the oil column.
6.4.2 WELL 6507/7-2 IN SEGMENT G (TILJE FM. 3.2, 2.1, ÅRE FM. 7.2, 6.2)
6.4.2.1 PRODUCTION INDEX AND ORGANIC RICHNESS
The two upper reservoir rock samples from well 6507/7-2 are from the Tilje Formation 3.2
and 2.1, the two lowermost reservoir rock samples belong to the Åre Formation 7.2 and 6.2.
The average PI of the reservoir rocks is 0.67 ± 0.06 (Figure 25, Table X 1). The uppermost
sample shows higher PI with 0.73 compared to the reservoir rock samples below, which are
characterised by a relatively uniform oil quality with PI of 0.63 - 0.65.
The mean organic matter content of the reservoir rocks is 21.23 ± 6.59 (Figure 26, Table X 1).
With increasing depth the OM content increases, the lowermost sample G004001 from the
Åre Formation excluded.
6.4.2.2 ORGANIC MATTER COMPOSITION
Figure 80 A - E shows the pyrolysis products of well 6507/7-2 in geochemical depth plots for
the aromaticity (A), monoaromatic / diaromatic hydrocarbon ratio (B), relative phenol content
(C), gas wetness (D) and gas amount (E).. The average values and standard deviations for the
bulk pyrolysis parameters can be seen in Table X 2. The Py-GC parameter values for the
individual reservoir rocks are listed in Table X 9.
6 RESULTS AND DISCUSSION 139
OWC at 2451 m MD-RKB
0 0.2 0.4 0.6 0.8 1
2440
2400
2360
2320
2280
0 1 2 3 4 5
2440
2400
2360
2320
2280
0 0.2 0.4 0.6 0.8 1
2440
2400
2360
2320
2280
0 0.2 0.4 0.6 0.8 1
2440
2400
2360
2320
2280
0 20 40 60 80 100
2440
2400
2360
2320
2280
dep
th (
m M
D-R
KB
)
dep
th (
m M
D-R
KB
)
dep
th (
m M
D-R
KB
)
dep
th (
m M
D-R
KB
)
dep
th (
m M
D-R
KB
)
aromaticityC1 – C2 alkylbenzenes + 2MN + 1MN + DMN / n-C5+
monoaromatic / diaromatic hydrocarbonsC1 – C2 alkylbenzenes / N + 2MN + 1MN + DMN phenol / n-C9:0
C1 – C5 (%)C2 – C4 / C1 – C4
A B C
D E
Tilje Fm. 3.2 – 2.1Åre Fm. 7.2 – 6.2Tilje Fm. 3.2 – 2.1Åre Fm. 7.2 – 6.2
Figure 80 Geochemical profiles of the pyrolysis products from the reservoir rock screening of well 6507/7-2. From A to D the aromaticity (A), monoaromatic/diaromatic hydrocarbon ratio (B), relative phenol amount (C), gas wetness (D) and gas amount (E) are shown.
The uppermost reservoir rock show significant compositional differences in the pyrolysates.
This sample shows a normal alkene/alkane distribution up to C30. Afterwards, between C30
and C40, elevated alkane peaks were detected (Figure 81).
The aromaticity ranges between 0.11 and 0.20 and shows a slight increase with increasing
depth (Figure 80 A). The uppermost reservoir rock has the lowest aromaticity (0.11). This
aromaticity trend is reflected in the gas wetness, which shows a slight decrease with
increasing depth (Figure 80 D). The uppermost sample presents the highest gas wetness. Both
parameters are inverse correlated.
All reservoir rocks exhibit a low phenol content with 0.20 ± 0.06 (Figure 80 C), i.e. no
indications for disseminated coal were found. Within the type of aromatic hydrocarbon ratio,
a slight increase with increasing depth was observed (Figure 80 B). Excluding the uppermost
rock sample, the gas percentage in the pyrolysis products is nearly constant within the profile.
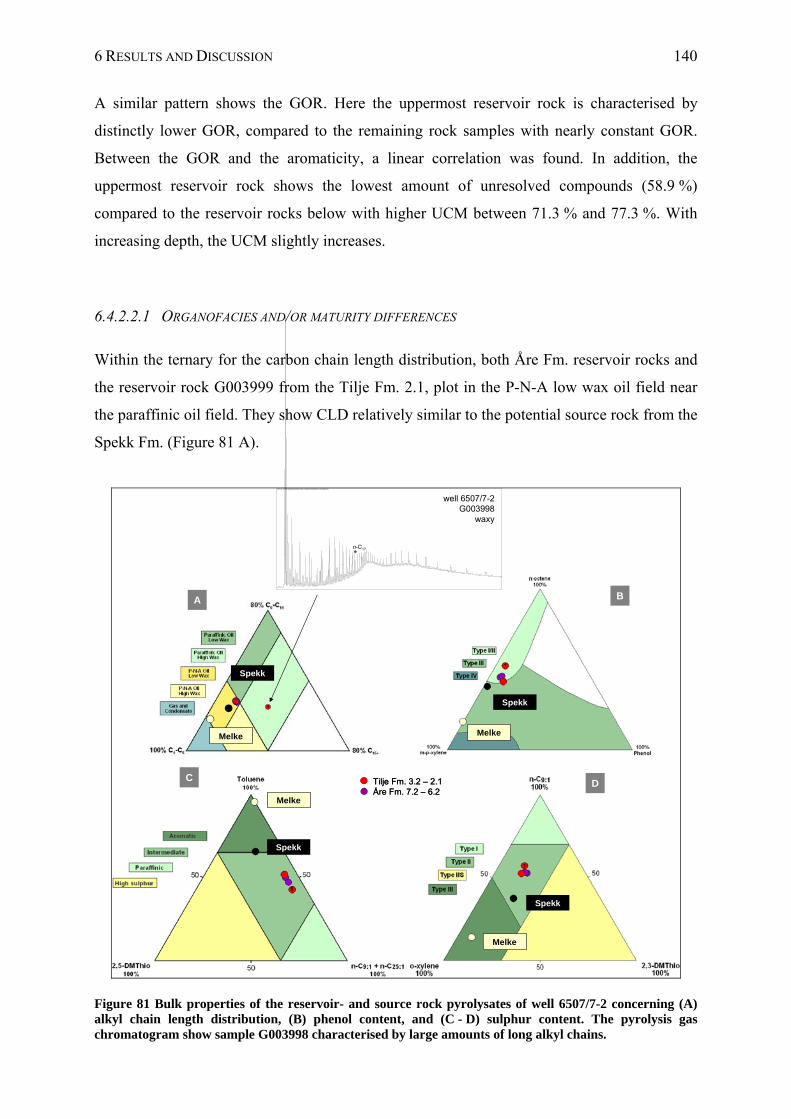
6 RESULTS AND DISCUSSION 140
A similar pattern shows the GOR. Here the uppermost reservoir rock is characterised by
distinctly lower GOR, compared to the remaining rock samples with nearly constant GOR.
Between the GOR and the aromaticity, a linear correlation was found. In addition, the
uppermost reservoir rock shows the lowest amount of unresolved compounds (58.9 %)
compared to the reservoir rocks below with higher UCM between 71.3 % and 77.3 %. With
increasing depth, the UCM slightly increases.
6.4.2.2.1 ORGANOFACIES AND/OR MATURITY DIFFERENCES
Within the ternary for the carbon chain length distribution, both Åre Fm. reservoir rocks and
the reservoir rock G003999 from the Tilje Fm. 2.1, plot in the P-N-A low wax oil field near
the paraffinic oil field. They show CLD relatively similar to the potential source rock from the
Spekk Fm. (Figure 81 A).
Spekk
Melke
Spekk
Melke
FID1 A, (C:\DATEN\HEIDRUN\RC_SCR~1\PART5\G003998A.D\..\G003998A.D)
well 6507/7-2G003998
waxy
n-C17
Spekk
Melke
Melke
Spekk
A B
CDTilje Fm. 3.2 – 2.1
Åre Fm. 7.2 – 6.2Tilje Fm. 3.2 – 2.1Åre Fm. 7.2 – 6.2
Figure 81 Bulk properties of the reservoir- and source rock pyrolysates of well 6507/7-2 concerning (A) alkyl chain length distribution, (B) phenol content, and (C - D) sulphur content. The pyrolysis gas chromatogram show sample G003998 characterised by large amounts of long alkyl chains.
6 RESULTS AND DISCUSSION 141
The uppermost reservoir rock G003998 from the Tilje Fm. 3.2 shows a higher proportion of
long chains in the pyrolysates and plot in the paraffinic high wax oil field. Its pyrolysis gas
chromatogram is shown beside the CLD ternary in Figure 81 A. The higher content of long
chain alkanes in the macromolecular fraction reflect higher wax content in the reservoir rock
and might refer to a lacustrine influence of the source rock.
Similar enrichment of waxy compounds show pyrolysates of the oil samples G003881 (DST
4A) and, slightly lesser pronounced, G003883 (DST 2) of well 65077-2 (cf. Chapter
6.2.1.2.3.2, Figure 46). Higher portions of long chains have been observed before in well
6507/7-5 in the western part and well 6507/8-4 as well as in well E and in particular in well D
from the northern part of the Heidrun oil field.
The phenol ternary (Figure 81 B) and the two sulphur ternaries (Figure 81 C - D) support the
distribution observed before in the depth plots. All reservoir rocks are low in phenol content
and in sulphur content, and show slight difference in the aromaticity.
6.4.2.2.2 CORRELATION TO PHYSICAL ROCK PROPERTIES (WELL LOG DATA)
The Tilje- and upper Åre Formation reservoirs are generally characterised by very complex
and heterogeneous sedimentology (cf. Chapter 3.1), which is reflected by strong alternating
rock properties in the well logs (Figure 15 in Chapter 3.2.1.6). The uppermost reservoir rock
from the Tilje Fm. 3.2 belongs to a unit with better reservoir properties (higher poroperm)
compared to remaining Tilje Fm. reservoir zones. Thus, the lower aromaticity and higher gas
wetness found in this sample might be correlated to better poroperm properties. Interstratified
barriers (mudstones) might additionally influence the pyrolysate compositions of the upper
reservoir rock and the remaining samples in the profile. However, the reservoir rocks show a
large sample distance up to 60 m, thus based on visual comparison alone no direct
correlations to the observed differences in the pyrolysis products were found.
In summary, the uppermost reservoir rock from the Tilje Fm. 3.2 indicates significant
compositional differences in the pyrolysis products compared to the remaining reservoir rock
samples. This sample shows the highest PI and the lowest OM content analysed in well
6507/7-2 as well as a low aromaticity and high gas wetness. The two Py-GC parameters
6 RESULTS AND DISCUSSION 142
aromaticity and gas wetness show an inverse correlation. The remaining samples are nearly
uniform in their pyrolysates composition. The enrichment in waxy compounds in the
uppermost reservoir rock from the Tilje Fm 3.2 indicates differences in the organofacies of
the source rock. Similar observations were made in two oil samples (DSTs) of well 6507/7-2.
The uppermost reservoir rock from the Tilje Fm 3.2 is characterised by better poroperm
properties and lower water saturation compared to the subunits of the remaining reservoir
rocks. An influence of interstratified mudstone barriers on the hydrocarbon distribution might
additionally be considered. However, no direct correlations to the observed differences in the
pyrolysis products were detected based on visual comparison alone.
6.4.3 WELL 6507/7-3 IN SEGMENT E (GARN FM., ILE FM. 4 - 6, ROR FM. 2)
6.4.3.1 PRODUCTION INDEX AND ORGANIC RICHNESS
The reservoir rocks from well 6507/7-3 are from the Garn- Ile- and Ror Formation (Table 7).
The PI is relatively uniform in this profile (0.70 - 0.72) independent of the reservoir formation
(Figure 25, Table X 1).
In addition, the OM distribution is relatively homogeneous. Both, the Garn Fm. and the Ile
Fm. reservoir rock samples, show a slightly higher OM content of 13.28 and 15.01 mg/g rock,
respectively, compared to the reservoir rock from the Ror Fm. presenting an OM content of
12.35 mg/g rock (Figure 26, Table X 1).
6.4.3.2 ORGANIC MATTER COMPOSITION
Independent of the reservoir formation, the analysed reservoir rock samples show relative
similar bulk properties with increasing depth regarding the aromaticity (A), monoaromatic /
diaromatic hydrocarbon ratio (B), relative phenol content (C), gas wetness (D) and gas
amount (E) (Figure 82 A - E). Table X 2 listed the average values and standard deviations for
the bulk pyrolysis parameters. The Py-GC parameter values for the individual reservoir rock
samples are listed in Table X 9 in the appendix.
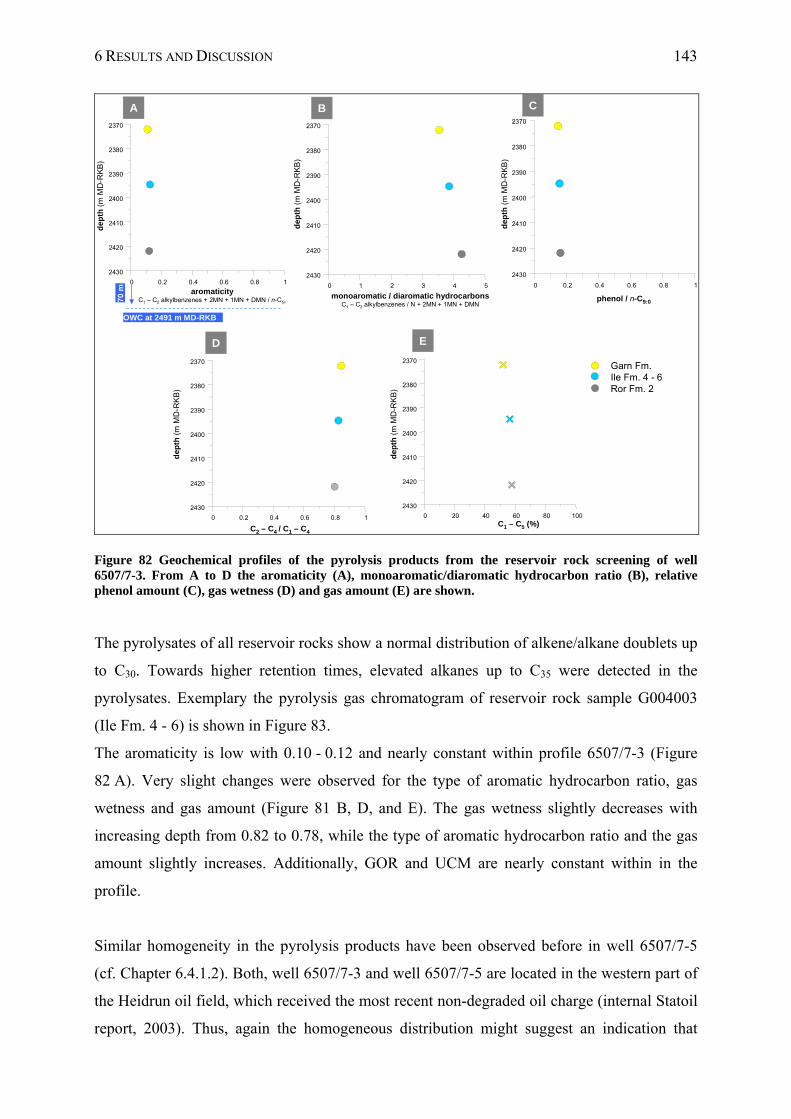
6 RESULTS AND DISCUSSION 143
OWC at 2491 m MD-RKB
0 0.2 0.4 0.6 0.8 1
2430
2420
2410
2400
2390
2380
2370
0 1 2 3 4 5
2430
2420
2410
2400
2390
2380
2370
0 0.2 0.4 0.6 0.8 1
2430
2420
2410
2400
2390
2380
2370
0 0.2 0.4 0.6 0.8 1
2430
2420
2410
2400
2390
2380
2370
0 20 40 60 80 100
2430
2420
2410
2400
2390
2380
2370Garn Fm.Ile Fm. 4 - 6Ror Fm. 2
aromaticityC1 – C2 alkylbenzenes + 2MN + 1MN + DMN / n-C5+
monoaromatic / diaromatic hydrocarbonsC1 – C2 alkylbenzenes / N + 2MN + 1MN + DMN
phenol / n-C9:0
C1 – C5 (%)C2 – C4 / C1 – C4
dep
th (
m M
D-R
KB
)
dep
th (
m M
D-R
KB
)
dep
th (
m M
D-R
KB
)
dep
th (
m M
D-R
KB
)
dep
th (
m M
D-R
KB
)
A B C
D E
70
m
Figure 82 Geochemical profiles of the pyrolysis products from the reservoir rock screening of well 6507/7-3. From A to D the aromaticity (A), monoaromatic/diaromatic hydrocarbon ratio (B), relative phenol amount (C), gas wetness (D) and gas amount (E) are shown.
The pyrolysates of all reservoir rocks show a normal distribution of alkene/alkane doublets up
to C30. Towards higher retention times, elevated alkanes up to C35 were detected in the
pyrolysates. Exemplary the pyrolysis gas chromatogram of reservoir rock sample G004003
(Ile Fm. 4 - 6) is shown in Figure 83.
The aromaticity is low with 0.10 - 0.12 and nearly constant within profile 6507/7-3 (Figure
82 A). Very slight changes were observed for the type of aromatic hydrocarbon ratio, gas
wetness and gas amount (Figure 81 B, D, and E). The gas wetness slightly decreases with
increasing depth from 0.82 to 0.78, while the type of aromatic hydrocarbon ratio and the gas
amount slightly increases. Additionally, GOR and UCM are nearly constant within in the
profile.
Similar homogeneity in the pyrolysis products have been observed before in well 6507/7-5
(cf. Chapter 6.4.1.2). Both, well 6507/7-3 and well 6507/7-5 are located in the western part of
the Heidrun oil field, which received the most recent non-degraded oil charge (internal Statoil
report, 2003). Thus, again the homogeneous distribution might suggest an indication that
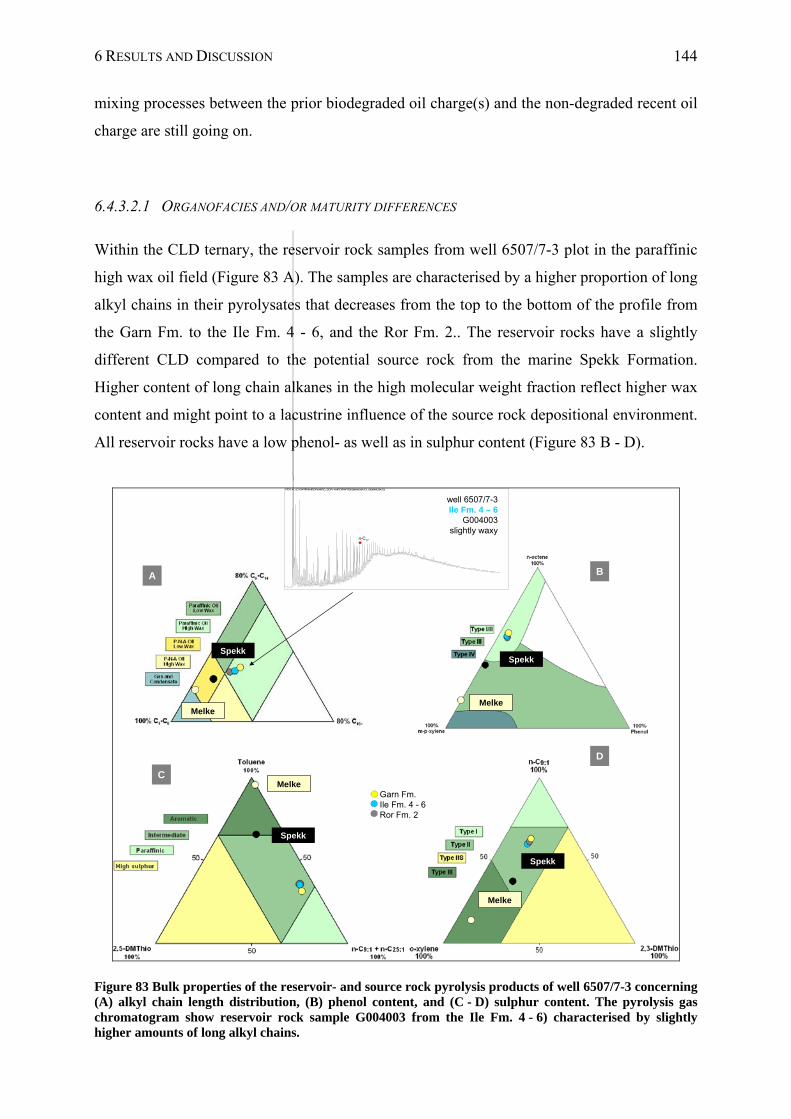
6 RESULTS AND DISCUSSION 144
mixing processes between the prior biodegraded oil charge(s) and the non-degraded recent oil
charge are still going on.
6.4.3.2.1 ORGANOFACIES AND/OR MATURITY DIFFERENCES
Within the CLD ternary, the reservoir rock samples from well 6507/7-3 plot in the paraffinic
high wax oil field (Figure 83 A). The samples are characterised by a higher proportion of long
alkyl chains in their pyrolysates that decreases from the top to the bottom of the profile from
the Garn Fm. to the Ile Fm. 4 - 6, and the Ror Fm. 2.. The reservoir rocks have a slightly
different CLD compared to the potential source rock from the marine Spekk Formation.
Higher content of long chain alkanes in the high molecular weight fraction reflect higher wax
content and might point to a lacustrine influence of the source rock depositional environment.
All reservoir rocks have a low phenol- as well as in sulphur content (Figure 83 B - D).
Spekk
Melke
Spekk
Melke
Spekk
Melke
Melke
Spekk
A B
C
D
Garn Fm.Ile Fm. 4 - 6Ror Fm. 2
FID1 A, (C:\DATEN\HEIDRUN\RC_SCR~1\NPD\PART9\G004003A.D\..\G004003A.D)
well 6507/7-3Ile Fm. 4 – 6
G004003slightly waxy
n-C17
Figure 83 Bulk properties of the reservoir- and source rock pyrolysis products of well 6507/7-3 concerning (A) alkyl chain length distribution, (B) phenol content, and (C - D) sulphur content. The pyrolysis gas chromatogram show reservoir rock sample G004003 from the Ile Fm. 4 - 6) characterised by slightly higher amounts of long alkyl chains.
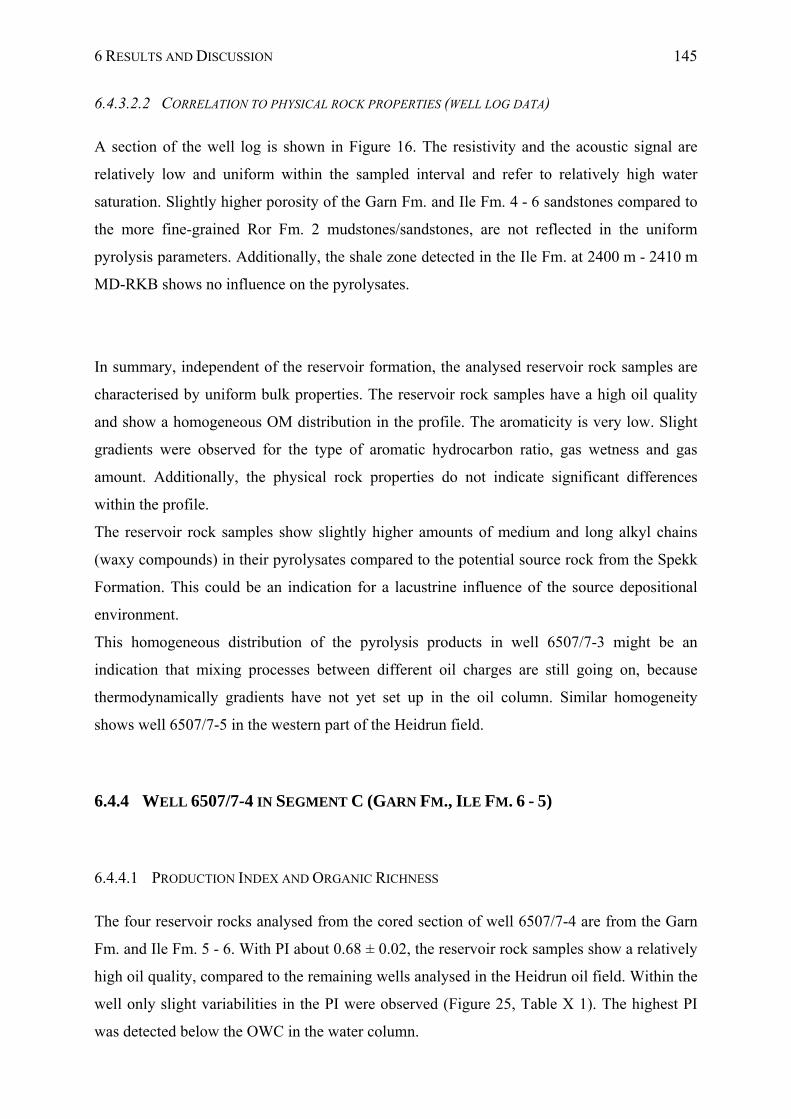
6 RESULTS AND DISCUSSION 145
6.4.3.2.2 CORRELATION TO PHYSICAL ROCK PROPERTIES (WELL LOG DATA)
A section of the well log is shown in Figure 16. The resistivity and the acoustic signal are
relatively low and uniform within the sampled interval and refer to relatively high water
saturation. Slightly higher porosity of the Garn Fm. and Ile Fm. 4 - 6 sandstones compared to
the more fine-grained Ror Fm. 2 mudstones/sandstones, are not reflected in the uniform
pyrolysis parameters. Additionally, the shale zone detected in the Ile Fm. at 2400 m - 2410 m
MD-RKB shows no influence on the pyrolysates.
In summary, independent of the reservoir formation, the analysed reservoir rock samples are
characterised by uniform bulk properties. The reservoir rock samples have a high oil quality
and show a homogeneous OM distribution in the profile. The aromaticity is very low. Slight
gradients were observed for the type of aromatic hydrocarbon ratio, gas wetness and gas
amount. Additionally, the physical rock properties do not indicate significant differences
within the profile.
The reservoir rock samples show slightly higher amounts of medium and long alkyl chains
(waxy compounds) in their pyrolysates compared to the potential source rock from the Spekk
Formation. This could be an indication for a lacustrine influence of the source depositional
environment.
This homogeneous distribution of the pyrolysis products in well 6507/7-3 might be an
indication that mixing processes between different oil charges are still going on, because
thermodynamically gradients have not yet set up in the oil column. Similar homogeneity
shows well 6507/7-5 in the western part of the Heidrun field.
6.4.4 WELL 6507/7-4 IN SEGMENT C (GARN FM., ILE FM. 6 - 5)
6.4.4.1 PRODUCTION INDEX AND ORGANIC RICHNESS
The four reservoir rocks analysed from the cored section of well 6507/7-4 are from the Garn
Fm. and Ile Fm. 5 - 6. With PI about 0.68 ± 0.02, the reservoir rock samples show a relatively
high oil quality, compared to the remaining wells analysed in the Heidrun oil field. Within the
well only slight variabilities in the PI were observed (Figure 25, Table X 1). The highest PI
was detected below the OWC in the water column.
6 RESULTS AND DISCUSSION 146
The OM content decreases stepwise with increasing depth towards the OWC from 15.7 mg/g
rock to 6.7 mg/g rock (Figure 26, Table X 1). The reservoir rock from the water column
shows lowest OM content.
6.4.4.2 ORGANIC MATTER COMPOSITION
The pyrolysis gas chromatograms of well 6507/7-4 are relatively uniform and present a
normal distribution of alkene/alkane doublets up to C28. Towards higher retention times,
alkane peaks up to C33 were detected in the pyrolysates. Figure 84 A - E show the pyrolysis
products of well 6507/7-4 in geochemical depth plots for the aromaticity (A), monoaromatic /
diaromatic hydrocarbon ratio (B), phenol content (C), gas wetness (D) and gas amount (E).
The average values and standard deviations for the bulk pyrolysis parameters can be seen in
Table X 2. The Py-GC parameter values for the individual reservoir rocks are listed in Table
X 9 in the appendix.
The aromatic compounds vary between both reservoir formations. The single Garn Fm.
reservoir rock show distinctly lower aromaticity with 0.13 and a higher amount of
monoaromatic hydrocarbons in its pyrolysates compared to the three Ile Fm. 5 - 6 reservoir
rocks located close to the OWC (Figure 84 A and B). In addition, the Garn Fm. reservoir rock
sample shows higher gas wetness, lower gas amount and lower amount of phenolic
compounds (Figure 84 C - E).
Reservoir rock pyrolysates of the Ile Fm. 5 - 6 present similar gradients for aromaticity,
monoaromatic/diaromatic hydrocarbon ratio, phenol compounds and gas wetness. These
ratios increase to the OWC and decrease below. They correlate linearly and are obviously
related to the increase in water saturation near the OWC.
The differences in aromatic compound composition between both reservoir formations are
reflected in the GOR and the UCM. Lowest GOR shows the Garn Fm. reservoir rock sample.
The Ile Fm. 5 - 6 reservoir rocks show higher GOR as well as UCM, and mirror the gradient
observed in the pyrolysis parameters mentioned above.
6 RESULTS AND DISCUSSION 147
OWC at 2496 m MD-RKB
0 0.2 0.4 0.6 0.8 1
2510
2500
2490
2480
2470
2460
1
2
3
4
0 0.2 0.4 0.6 0.8 1
2510
2500
2490
2480
2470
2460
1
2
3
4
0.5 0.6 0.7 0.8 0.9 1
2510
2500
2490
2480
2470
2460
0 20 40 60 80 100
2510
2500
2490
2480
2470
2460
11
2
3
4
2
3
4
OWC at 2496 m MD-RKB
OWC at 2496 m MD-RKB
OWC at 2496 m MD-RKB
OWC at 2496 m MD-RKB
alternating mudstones / sandstones of the Not Fm.
alternating mudstones / sandstones of the Not Fm.
alternating mudstones / sandstones of the Not Fm.
alternating mudstones / sandstones of the Not Fm.
alternating mudstones / sandstones of the Not Fm.
aromaticityC1 – C2 alkylbenzenes + 2MN + 1MN + DMN / n-C5+
phenol / n-C9:0
C1 – C5 (%)C2 – C4 / C1 – C4
dep
th (
m M
D-R
KB
)
dep
th (
m M
D-R
KB
)
dep
th (
m M
D-R
KB
)
dep
th (
m M
D-R
KB
)
Garn Fm.Ile Fm. 5-6
A B C
D E
0 2 4 6 8
2510
2500
2490
2480
2470
2460
1
2
3
4
dep
th (
m M
D-R
KB
)monoaromatic / diaromatic hydrocarbons
C1 – C2 alkylbenzenes / N + 2MN + 1MN + DMN
Figure 84 Geochemical profiles of the pyrolysis products from the reservoir rock screening of well 6507/7-4. From A to D the aromaticity (A), monoaromatic/diaromatic hydrocarbon ratio (B), relative phenol amount (C), gas wetness (D) and the gas amount (E) are shown.
6.4.4.2.1 ORGANOFACIES AND/OR MATURITY DIFFERENCES
Within the CLD, all reservoir rock samples plot close together at the transition from the
P-N-A to the paraffinic oil field (Figure 85 A). They show relatively similar proportions of
short, medium and long chains in their pyrolysates. However, for the Garn Fm. reservoir rock
sample the highest proportion of medium alkyl chains was observed. Compared to the
potential source rock from the Spekk Formation all reservoir rocks present a slightly higher
proportion of medium and long chains in their pyrolysates. This is exemplary shown in the
pyrolysis gas chromatogram of sample G004023 from the Garn Fm. (Figure 85 A). All
reservoir rocks have additionally a low phenol as well as in sulphur content, and show slight
differences regarding the aromaticity (Figure 85 B - D).
The higher content of medium and long alkyl chains in the high molecular weight fraction
reflect higher wax content in the reservoir rock pyrolysates and suggest a lacustrine
influenced depositional environment of the generative source.
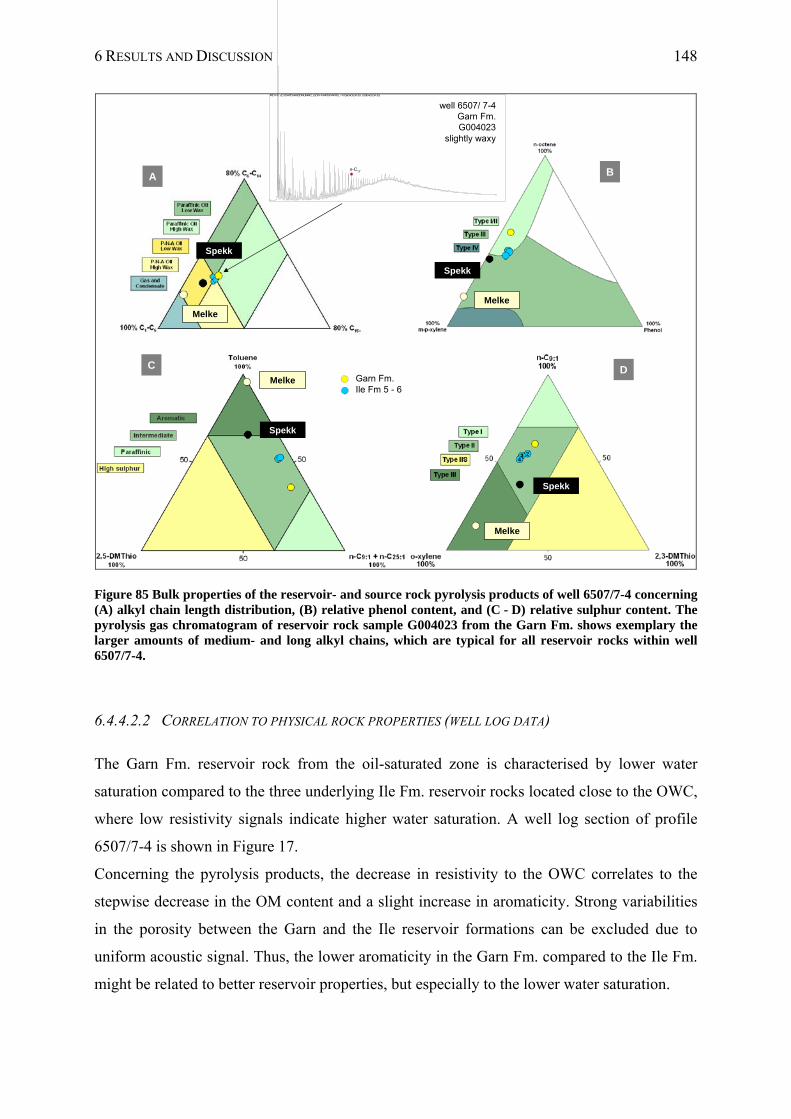
6 RESULTS AND DISCUSSION 148
Spekk
Melke
Spekk
Melke
61
Spekk
Melke
Spekk
Melke
A B
C DGarn Fm.Ile Fm 5 - 6
FID1 A, (C:\DATEN\HEIDRUN\RC_SCR~1\NPD\PART5_~1\G004023A.D\..\G004023A.D)
n-C17
well 6507/ 7-4Garn Fm.G004023
slightly waxy
Figure 85 Bulk properties of the reservoir- and source rock pyrolysis products of well 6507/7-4 concerning (A) alkyl chain length distribution, (B) relative phenol content, and (C - D) relative sulphur content. The pyrolysis gas chromatogram of reservoir rock sample G004023 from the Garn Fm. shows exemplary the larger amounts of medium- and long alkyl chains, which are typical for all reservoir rocks within well 6507/7-4.
6.4.4.2.2 CORRELATION TO PHYSICAL ROCK PROPERTIES (WELL LOG DATA)
The Garn Fm. reservoir rock from the oil-saturated zone is characterised by lower water
saturation compared to the three underlying Ile Fm. reservoir rocks located close to the OWC,
where low resistivity signals indicate higher water saturation. A well log section of profile
6507/7-4 is shown in Figure 17.
Concerning the pyrolysis products, the decrease in resistivity to the OWC correlates to the
stepwise decrease in the OM content and a slight increase in aromaticity. Strong variabilities
in the porosity between the Garn and the Ile reservoir formations can be excluded due to
uniform acoustic signal. Thus, the lower aromaticity in the Garn Fm. compared to the Ile Fm.
might be related to better reservoir properties, but especially to the lower water saturation.
6 RESULTS AND DISCUSSION 149
The combination of high water saturation, diminishing OM content and increase in
aromaticity in the Ile Fm. 5-6 might be an indication for higher microbial activity near the
OWC. Similar observations were made in the Ile Fm. of well C.
The zone of alternating shales and sandstones of the Not Fm. may additionally act as barrier
between the Garn- and the Ile Formation.
In summary, the reservoir rock samples show slight variabilities in the oil quality (PI) and a
stepwise decrease in the OM content with increasing depth. Within the aromatic compounds,
gradients and differences between the Garn Fm. and the Ile Fm. 5 - 6 were observed. The
Garn Fm. reservoir rocks show lower aromaticity and higher gas wetness compared to the Ile
Fm. 5 - 6. Reservoir rocks of the Ile Fm. show similar gradients for all pyrolysis parameters,
the gas amount excluded, which is less variable in the profile. The aromaticity and the
remaining Py-GC parameters increase down to the OWC and show a slight decrease below
the OWC. The differences in the pyrolysis products of the Garn and the Ile Fm. are reflected
by the water saturation within the profile (lower aromaticity = lower Sw). Additionally, an
influence of the shaly Not Fm. as potential barrier between the Garn- and the Ile Formation
has to be considered.
All reservoir rock samples contain slightly higher proportions of medium- and long chains in
their pyrolysates compared to the potential source rock from the Spekk Formation. This refers
to higher content of waxy compounds in the reservoir rocks, which might be an indication to a
lacustrine influence of the generating source.
6.5 CHARACTERISATION OF THE SINGLE PROFILES IN THE SOUTHERN
PART OF THE HEIDRUN OIL FIELD
6.5.1 WELL 6507/7-8 IN SEGMENT F (MELKE FM., GARN FM., ILE FM.)
6.5.1.1 PRODUCTION INDEX AND ORGANIC RICHNESS
One reservoir rock from the Garn Fm., three reservoir rocks from the Ile Fm., and the
potential source rock form the Melke Fm. were sampled from well 6507/7-8.
6 RESULTS AND DISCUSSION 150
The lowest PI with 0.47 and thus the lowest oil quality shows the Melke Fm. source rock
sample on top of the profile (Figure 25, Table X 1). The two reservoir Formations Garn and
Ile show differences in the oil quality. The Garn Fm. reservoir rock sample shows a PI of
0.75, whereas the Ile Fm. samples presents lower mean PI of 0.63 ± 0.10 and a decreasing
gradient to the OWC from 0.73 to 0.53. The very low oil quality of the lowermost Ile Fm.
reservoir rock suggests in-situ organic matter within in this sample.
The OM distribution is very heterogeneous (Figure 26, Table X 1). The potential source rock
from the Melke FM. and the lowermost Ile Fm. reservoir rock show lowest OM contents of
0.09 and 0.07 mg/g rock, respectively. Within the Ile Fm., a gradient was observed. Here, the
OM amount decreases with increasing depth from 15.06 mg/g to 0.07 mg/g rock. The Garn
Fm. reservoir rock shows organic matter content of 10.28 mg/g rock.
6.5.1.2 ORGANIC MATTER COMPOSITION
The reservoir rocks show compositional differences in their pyrolysates. Profile 6507/7-8 is
characterised by a high aromatic layer on the top (G004008, Melke Fm.) and at the base
(G004013, Ile Fm.). The remaining reservoir rocks show a normal alkene/alkane distribution
pattern up to C28. Between C28 and C33, elevated alkane peaks were observed.
In Figure 86 A - E, the pyrolysis products of well 6507/7-8 are shown in geochemical depth
plots for the aromaticity (A), monoaromatic / diaromatic hydrocarbon ratio (B), relative
phenol content (C), gas wetness (D) and gas amount (E). The average values and standard
deviations for the bulk pyrolysis parameters can be seen in Table X 2 and the Py-GC
parameter values for the individual reservoir rocks are listed in Table X 9 in the appendix.
The aromatic compounds vary in the Ile Fm. with increasing depth to the OWC. An increase
in aromaticity from 0.14 to 1.58 was observed (Figure 86 A), which is similar to the curve
like shape seen before in well C (Figure 30 A). Additionally, the type of aromatic
hydrocarbon ratio increases from 3.83 up to 6.11 (Figure 86 B). Similar to the observations
made before in the Ile Fm. of well C (Figure 31), the aromaticity show a linear correlation to
the monoaromatic hydrocarbons, which increase relative to the diaromatic hydrocarbons (not
shown). In addition, the gas amount increases with increasing depth parallel to the aromaticity
(Figure 86 D). The gas wetness (Figure 86 D) is variable within the Ile Formation. However,
the two upper Ile Fm. reservoir rock samples show an inverse correlation to aromaticity.
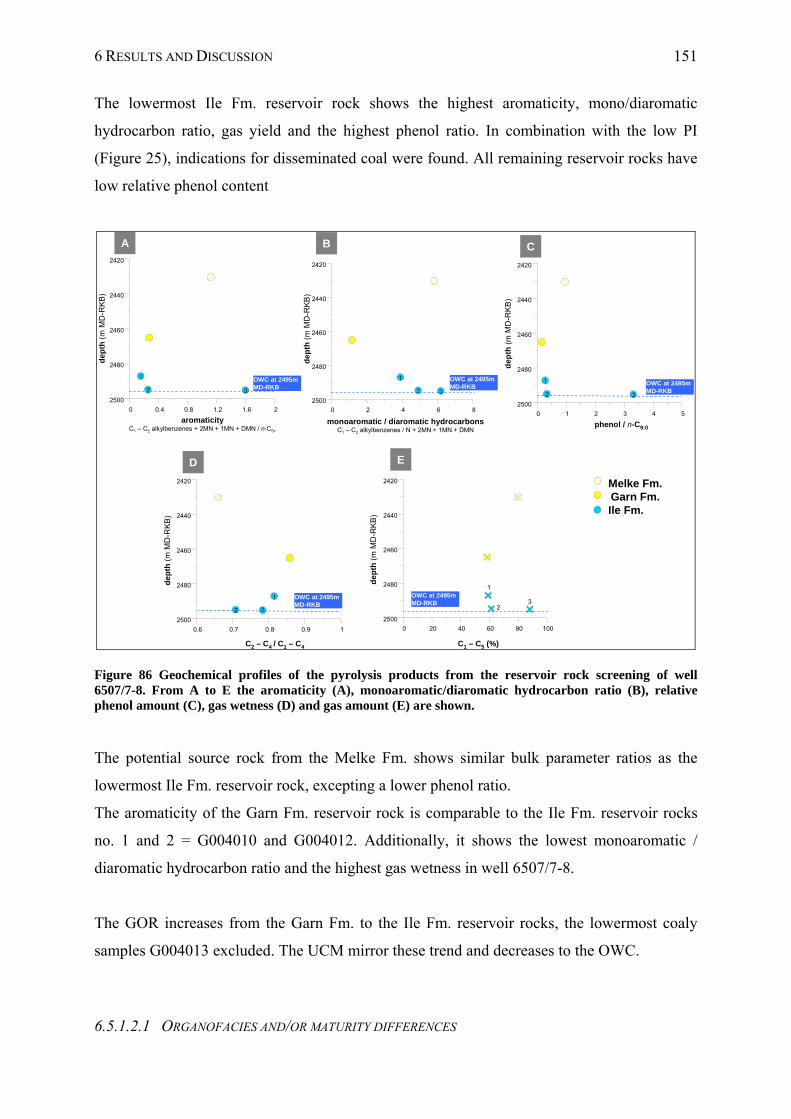
6 RESULTS AND DISCUSSION 151
The lowermost Ile Fm. reservoir rock shows the highest aromaticity, mono/diaromatic
hydrocarbon ratio, gas yield and the highest phenol ratio. In combination with the low PI
(Figure 25), indications for disseminated coal were found. All remaining reservoir rocks have
low relative phenol content
OWC at 2495m MD-RKB
0 0.4 0.8 1.2 1.6 2
2500
2480
2460
2440
2420
1
2 3
0 2 4 6 8
2500
2480
2460
2440
2420
1
2 3
Melke Fm.Garn Fm.Ile Fm.
0 1 2 3 4 5
2500
2480
2460
2440
2420
1
2 3
0.6 0.7 0.8 0.9 1
2500
2480
2460
2440
2420
1
2 3
0 20 40 60 80 100
2500
2480
2460
2440
2420
1
23
OWC at 2495m MD-RKB
OWC at 2495m MD-RKB
OWC at 2495m MD-RKB
OWC at 2495m MD-RKB
aromaticityC1 – C2 alkylbenzenes + 2MN + 1MN + DMN / n-C5+
monoaromatic / diaromatic hydrocarbonsC1 – C2 alkylbenzenes / N + 2MN + 1MN + DMN
phenol / n-C9:0
dep
th (
m M
D-R
KB
)
dep
th (
m M
D-R
KB
)
dep
th (
m M
D-R
KB
)
C1 – C5 (%)C2 – C4 / C1 – C4
dep
th (
m M
D-R
KB
)
dep
th (
m M
D-R
KB
)
A B C
D E
Figure 86 Geochemical profiles of the pyrolysis products from the reservoir rock screening of well 6507/7-8. From A to E the aromaticity (A), monoaromatic/diaromatic hydrocarbon ratio (B), relative phenol amount (C), gas wetness (D) and gas amount (E) are shown.
The potential source rock from the Melke Fm. shows similar bulk parameter ratios as the
lowermost Ile Fm. reservoir rock, excepting a lower phenol ratio.
The aromaticity of the Garn Fm. reservoir rock is comparable to the Ile Fm. reservoir rocks
no. 1 and 2 = G004010 and G004012. Additionally, it shows the lowest monoaromatic /
diaromatic hydrocarbon ratio and the highest gas wetness in well 6507/7-8.
The GOR increases from the Garn Fm. to the Ile Fm. reservoir rocks, the lowermost coaly
samples G004013 excluded. The UCM mirror these trend and decreases to the OWC.
6.5.1.2.1 ORGANOFACIES AND/OR MATURITY DIFFERENCES
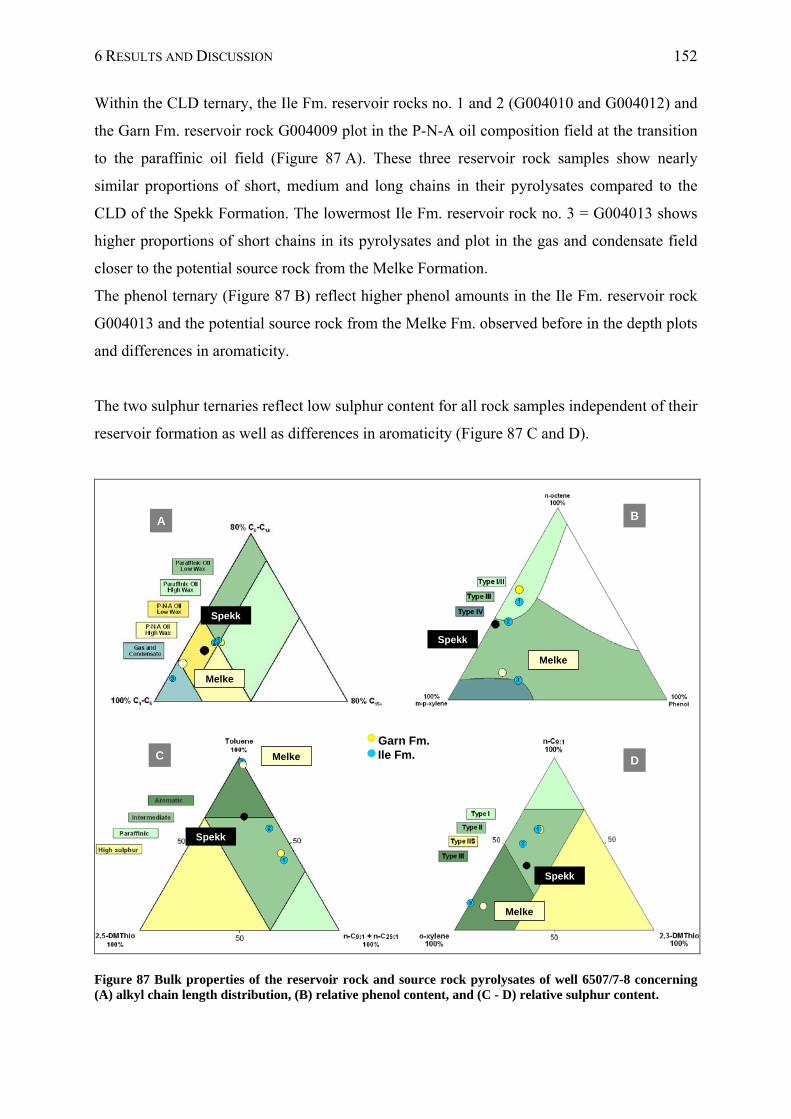
6 RESULTS AND DISCUSSION 152
Within the CLD ternary, the Ile Fm. reservoir rocks no. 1 and 2 (G004010 and G004012) and
the Garn Fm. reservoir rock G004009 plot in the P-N-A oil composition field at the transition
to the paraffinic oil field (Figure 87 A). These three reservoir rock samples show nearly
similar proportions of short, medium and long chains in their pyrolysates compared to the
CLD of the Spekk Formation. The lowermost Ile Fm. reservoir rock no. 3 = G004013 shows
higher proportions of short chains in its pyrolysates and plot in the gas and condensate field
closer to the potential source rock from the Melke Formation.
The phenol ternary (Figure 87 B) reflect higher phenol amounts in the Ile Fm. reservoir rock
G004013 and the potential source rock from the Melke Fm. observed before in the depth plots
and differences in aromaticity.
The two sulphur ternaries reflect low sulphur content for all rock samples independent of their
reservoir formation as well as differences in aromaticity (Figure 87 C and D).
Spekk
Melke
Spekk
Melke
71
Spekk
Melke
Spekk
Melke
A B
C D
Garn Fm.Ile Fm.
Figure 87 Bulk properties of the reservoir rock and source rock pyrolysates of well 6507/7-8 concerning (A) alkyl chain length distribution, (B) relative phenol content, and (C - D) relative sulphur content.
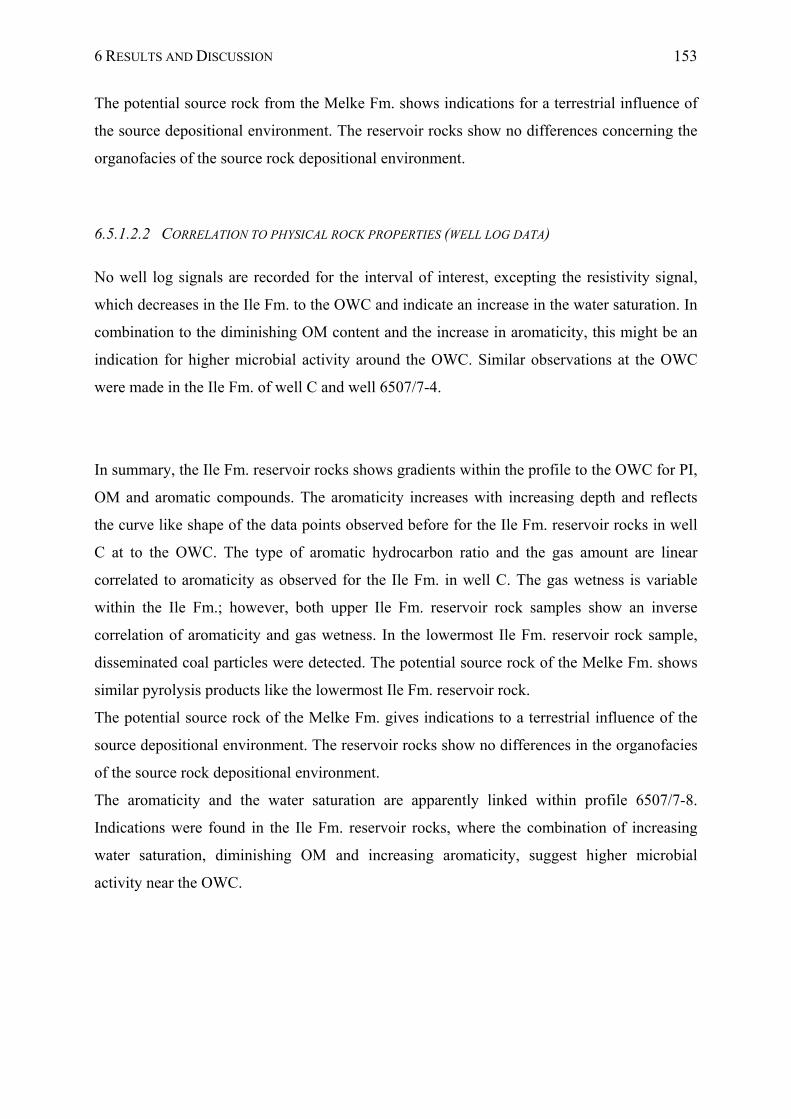
6 RESULTS AND DISCUSSION 153
The potential source rock from the Melke Fm. shows indications for a terrestrial influence of
the source depositional environment. The reservoir rocks show no differences concerning the
organofacies of the source rock depositional environment.
6.5.1.2.2 CORRELATION TO PHYSICAL ROCK PROPERTIES (WELL LOG DATA)
No well log signals are recorded for the interval of interest, excepting the resistivity signal,
which decreases in the Ile Fm. to the OWC and indicate an increase in the water saturation. In
combination to the diminishing OM content and the increase in aromaticity, this might be an
indication for higher microbial activity around the OWC. Similar observations at the OWC
were made in the Ile Fm. of well C and well 6507/7-4.
In summary, the Ile Fm. reservoir rocks shows gradients within the profile to the OWC for PI,
OM and aromatic compounds. The aromaticity increases with increasing depth and reflects
the curve like shape of the data points observed before for the Ile Fm. reservoir rocks in well
C at to the OWC. The type of aromatic hydrocarbon ratio and the gas amount are linear
correlated to aromaticity as observed for the Ile Fm. in well C. The gas wetness is variable
within the Ile Fm.; however, both upper Ile Fm. reservoir rock samples show an inverse
correlation of aromaticity and gas wetness. In the lowermost Ile Fm. reservoir rock sample,
disseminated coal particles were detected. The potential source rock of the Melke Fm. shows
similar pyrolysis products like the lowermost Ile Fm. reservoir rock.
The potential source rock of the Melke Fm. gives indications to a terrestrial influence of the
source depositional environment. The reservoir rocks show no differences in the organofacies
of the source rock depositional environment.
The aromaticity and the water saturation are apparently linked within profile 6507/7-8.
Indications were found in the Ile Fm. reservoir rocks, where the combination of increasing
water saturation, diminishing OM and increasing aromaticity, suggest higher microbial
activity near the OWC.
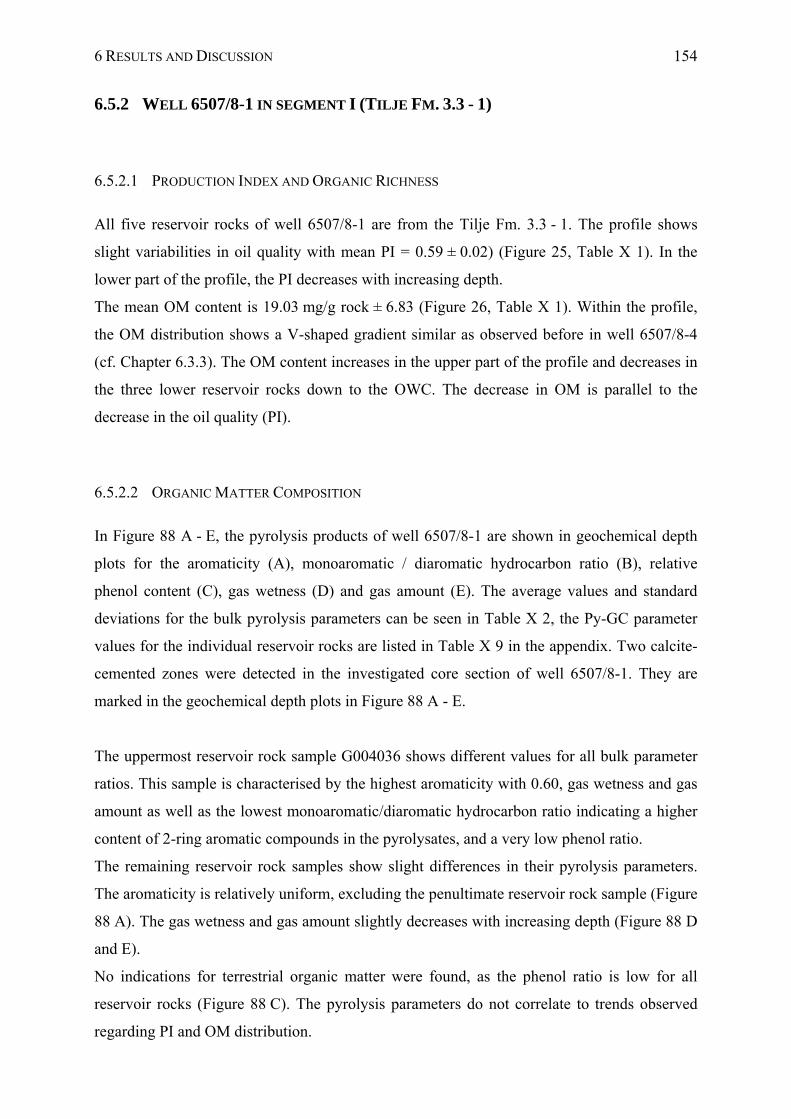
6 RESULTS AND DISCUSSION 154
6.5.2 WELL 6507/8-1 IN SEGMENT I (TILJE FM. 3.3 - 1)
6.5.2.1 PRODUCTION INDEX AND ORGANIC RICHNESS
All five reservoir rocks of well 6507/8-1 are from the Tilje Fm. 3.3 - 1. The profile shows
slight variabilities in oil quality with mean PI = 0.59 ± 0.02) (Figure 25, Table X 1). In the
lower part of the profile, the PI decreases with increasing depth.
The mean OM content is 19.03 mg/g rock ± 6.83 (Figure 26, Table X 1). Within the profile,
the OM distribution shows a V-shaped gradient similar as observed before in well 6507/8-4
(cf. Chapter 6.3.3). The OM content increases in the upper part of the profile and decreases in
the three lower reservoir rocks down to the OWC. The decrease in OM is parallel to the
decrease in the oil quality (PI).
6.5.2.2 ORGANIC MATTER COMPOSITION
In Figure 88 A - E, the pyrolysis products of well 6507/8-1 are shown in geochemical depth
plots for the aromaticity (A), monoaromatic / diaromatic hydrocarbon ratio (B), relative
phenol content (C), gas wetness (D) and gas amount (E). The average values and standard
deviations for the bulk pyrolysis parameters can be seen in Table X 2, the Py-GC parameter
values for the individual reservoir rocks are listed in Table X 9 in the appendix. Two calcite-
cemented zones were detected in the investigated core section of well 6507/8-1. They are
marked in the geochemical depth plots in Figure 88 A - E.
The uppermost reservoir rock sample G004036 shows different values for all bulk parameter
ratios. This sample is characterised by the highest aromaticity with 0.60, gas wetness and gas
amount as well as the lowest monoaromatic/diaromatic hydrocarbon ratio indicating a higher
content of 2-ring aromatic compounds in the pyrolysates, and a very low phenol ratio.
The remaining reservoir rock samples show slight differences in their pyrolysis parameters.
The aromaticity is relatively uniform, excluding the penultimate reservoir rock sample (Figure
88 A). The gas wetness and gas amount slightly decreases with increasing depth (Figure 88 D
and E).
No indications for terrestrial organic matter were found, as the phenol ratio is low for all
reservoir rocks (Figure 88 C). The pyrolysis parameters do not correlate to trends observed
regarding PI and OM distribution.
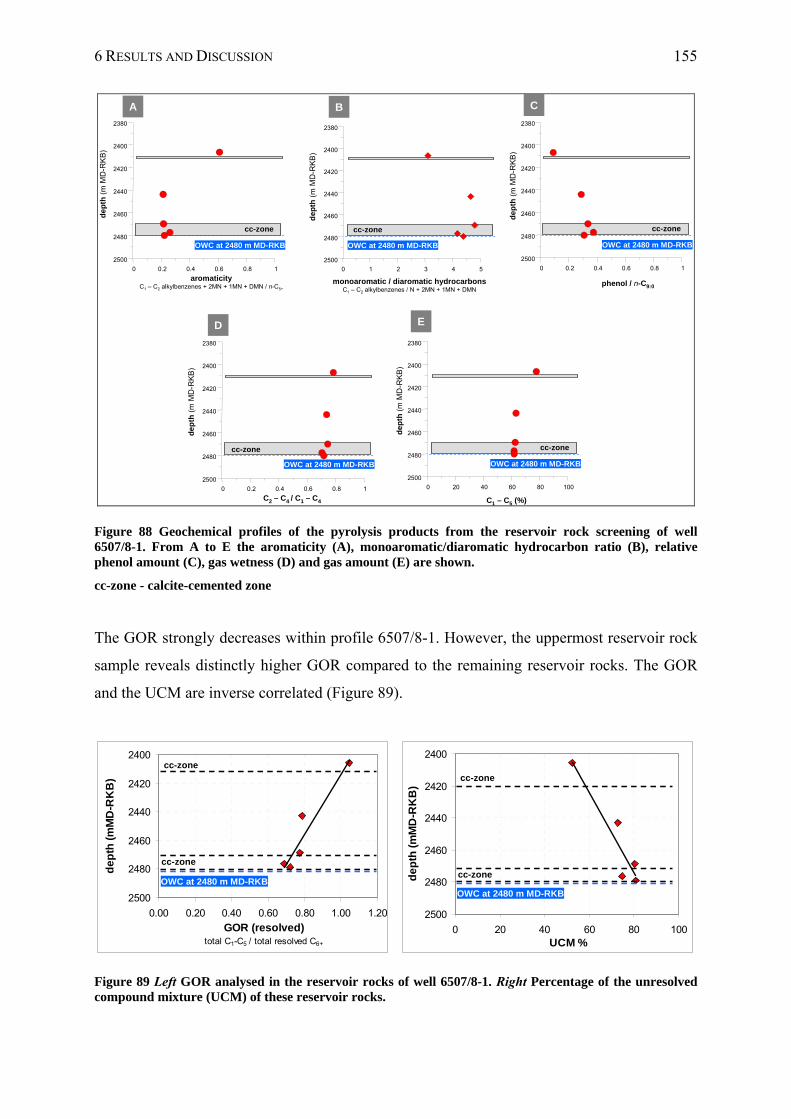
6 RESULTS AND DISCUSSION 155
cc-zone
0 0.2 0.4 0.6 0.8 1
2500
2480
2460
2440
2420
2400
2380
0 1 2 3 4 5
2500
2480
2460
2440
2420
2400
2380
0 0.2 0.4 0.6 0.8 1
2500
2480
2460
2440
2420
2400
2380
0 20 40 60 80 100
2500
2480
2460
2440
2420
2400
2380
0 0.2 0.4 0.6 0.8 1
2500
2480
2460
2440
2420
2400
2380
OWC at 2480 m MD-RKB
cc-zone
OWC at 2480 m MD-RKB
cc-zone
OWC at 2480 m MD-RKB
cc-zone
OWC at 2480 m MD-RKB
cc-zone
OWC at 2480 m MD-RKB
aromaticityC1 – C2 alkylbenzenes + 2MN + 1MN + DMN / n-C5+
monoaromatic / diaromatic hydrocarbonsC1 – C2 alkylbenzenes / N + 2MN + 1MN + DMN
phenol / n-C9:0
C1 – C5 (%)C2 – C4 / C1 – C4
dep
th (
m M
D-R
KB
)
dep
th (
m M
D-R
KB
)
dep
th (
m M
D-R
KB
)
dep
th (
m M
D-R
KB
)
dep
th (
m M
D-R
KB
)
A B C
D E
Figure 88 Geochemical profiles of the pyrolysis products from the reservoir rock screening of well 6507/8-1. From A to E the aromaticity (A), monoaromatic/diaromatic hydrocarbon ratio (B), relative phenol amount (C), gas wetness (D) and gas amount (E) are shown.
cc-zone - calcite-cemented zone
The GOR strongly decreases within profile 6507/8-1. However, the uppermost reservoir rock
sample reveals distinctly higher GOR compared to the remaining reservoir rocks. The GOR
and the UCM are inverse correlated (Figure 89).
2400
2420
2440
2460
2480
2500
0.00 0.20 0.40 0.60 0.80 1.00 1.20
GOR (resolved)total C1-C5 / total resolved C6+
de
pth
(m
MD
-RK
B)
2400
2420
2440
2460
2480
2500
0 20 40 60 80 100UCM %
de
pth
(m
MD
-RK
B)
OWC at 2480 m MD-RKB
cc-zone
cc-zone
cc-zone
cc-zone
OWC at 2480 m MD-RKB
Figure 89 Left GOR analysed in the reservoir rocks of well 6507/8-1. Right Percentage of the unresolved compound mixture (UCM) of these reservoir rocks.
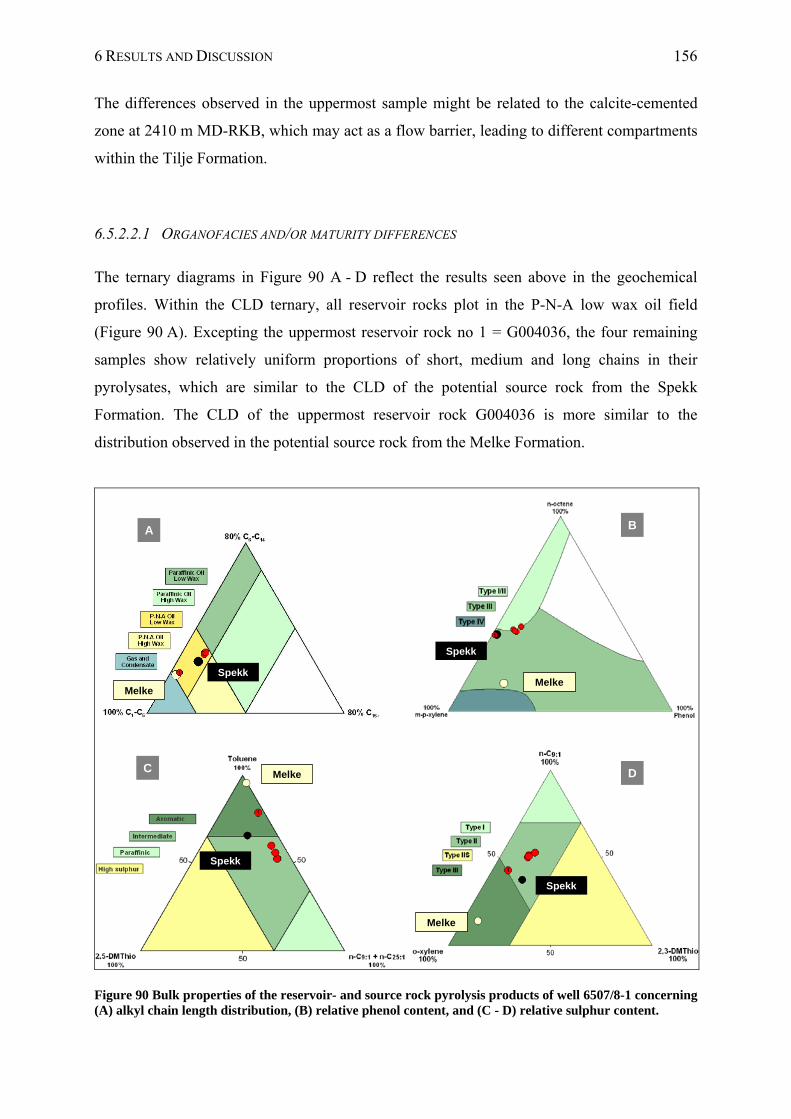
6 RESULTS AND DISCUSSION 156
The differences observed in the uppermost sample might be related to the calcite-cemented
zone at 2410 m MD-RKB, which may act as a flow barrier, leading to different compartments
within the Tilje Formation.
6.5.2.2.1 ORGANOFACIES AND/OR MATURITY DIFFERENCES
The ternary diagrams in Figure 90 A - D reflect the results seen above in the geochemical
profiles. Within the CLD ternary, all reservoir rocks plot in the P-N-A low wax oil field
(Figure 90 A). Excepting the uppermost reservoir rock no 1 = G004036, the four remaining
samples show relatively uniform proportions of short, medium and long chains in their
pyrolysates, which are similar to the CLD of the potential source rock from the Spekk
Formation. The CLD of the uppermost reservoir rock G004036 is more similar to the
distribution observed in the potential source rock from the Melke Formation.
Spekk
Melke
Spekk
Melke
Spekk
Melke
Spekk
Melke
A B
C D
Figure 90 Bulk properties of the reservoir- and source rock pyrolysis products of well 6507/8-1 concerning (A) alkyl chain length distribution, (B) relative phenol content, and (C - D) relative sulphur content.
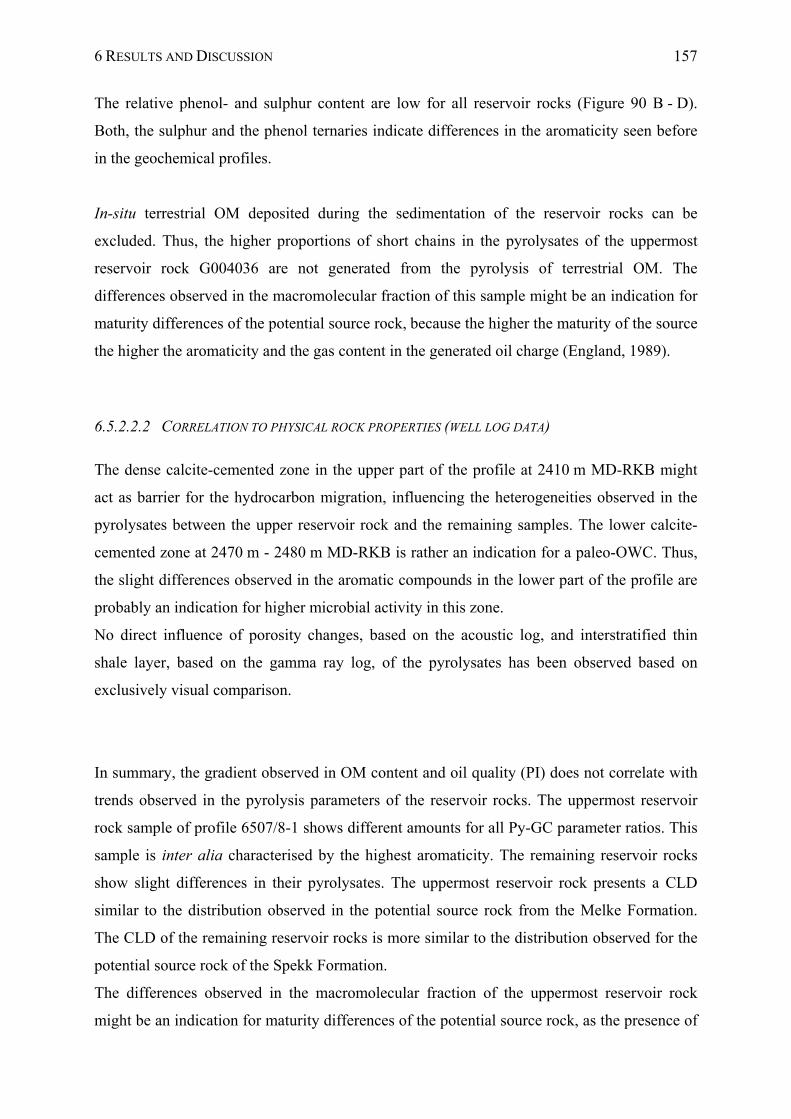
6 RESULTS AND DISCUSSION 157
The relative phenol- and sulphur content are low for all reservoir rocks (Figure 90 B - D).
Both, the sulphur and the phenol ternaries indicate differences in the aromaticity seen before
in the geochemical profiles.
In-situ terrestrial OM deposited during the sedimentation of the reservoir rocks can be
excluded. Thus, the higher proportions of short chains in the pyrolysates of the uppermost
reservoir rock G004036 are not generated from the pyrolysis of terrestrial OM. The
differences observed in the macromolecular fraction of this sample might be an indication for
maturity differences of the potential source rock, because the higher the maturity of the source
the higher the aromaticity and the gas content in the generated oil charge (England, 1989).
6.5.2.2.2 CORRELATION TO PHYSICAL ROCK PROPERTIES (WELL LOG DATA)
The dense calcite-cemented zone in the upper part of the profile at 2410 m MD-RKB might
act as barrier for the hydrocarbon migration, influencing the heterogeneities observed in the
pyrolysates between the upper reservoir rock and the remaining samples. The lower calcite-
cemented zone at 2470 m - 2480 m MD-RKB is rather an indication for a paleo-OWC. Thus,
the slight differences observed in the aromatic compounds in the lower part of the profile are
probably an indication for higher microbial activity in this zone.
No direct influence of porosity changes, based on the acoustic log, and interstratified thin
shale layer, based on the gamma ray log, of the pyrolysates has been observed based on
exclusively visual comparison.
In summary, the gradient observed in OM content and oil quality (PI) does not correlate with
trends observed in the pyrolysis parameters of the reservoir rocks. The uppermost reservoir
rock sample of profile 6507/8-1 shows different amounts for all Py-GC parameter ratios. This
sample is inter alia characterised by the highest aromaticity. The remaining reservoir rocks
show slight differences in their pyrolysates. The uppermost reservoir rock presents a CLD
similar to the distribution observed in the potential source rock from the Melke Formation.
The CLD of the remaining reservoir rocks is more similar to the distribution observed for the
potential source rock of the Spekk Formation.
The differences observed in the macromolecular fraction of the uppermost reservoir rock
might be an indication for maturity differences of the potential source rock, as the presence of
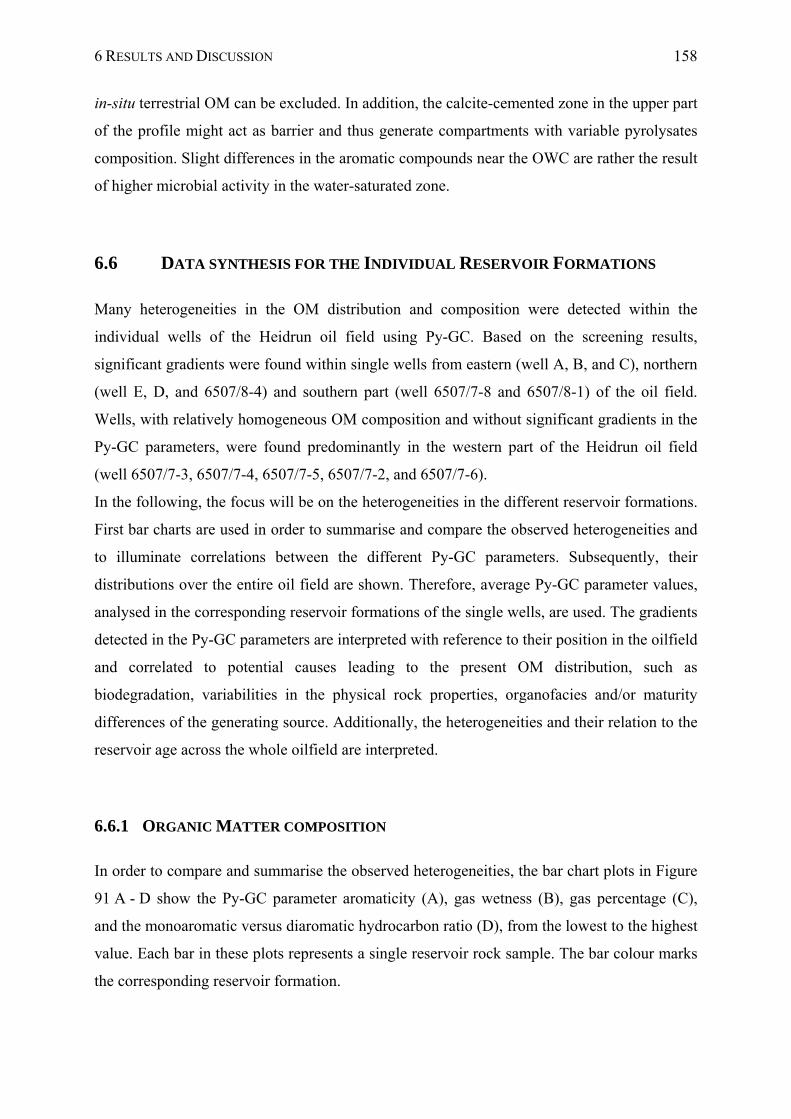
6 RESULTS AND DISCUSSION 158
in-situ terrestrial OM can be excluded. In addition, the calcite-cemented zone in the upper part
of the profile might act as barrier and thus generate compartments with variable pyrolysates
composition. Slight differences in the aromatic compounds near the OWC are rather the result
of higher microbial activity in the water-saturated zone.
6.6 DATA SYNTHESIS FOR THE INDIVIDUAL RESERVOIR FORMATIONS
Many heterogeneities in the OM distribution and composition were detected within the
individual wells of the Heidrun oil field using Py-GC. Based on the screening results,
significant gradients were found within single wells from eastern (well A, B, and C), northern
(well E, D, and 6507/8-4) and southern part (well 6507/7-8 and 6507/8-1) of the oil field.
Wells, with relatively homogeneous OM composition and without significant gradients in the
Py-GC parameters, were found predominantly in the western part of the Heidrun oil field
(well 6507/7-3, 6507/7-4, 6507/7-5, 6507/7-2, and 6507/7-6).
In the following, the focus will be on the heterogeneities in the different reservoir formations.
First bar charts are used in order to summarise and compare the observed heterogeneities and
to illuminate correlations between the different Py-GC parameters. Subsequently, their
distributions over the entire oil field are shown. Therefore, average Py-GC parameter values,
analysed in the corresponding reservoir formations of the single wells, are used. The gradients
detected in the Py-GC parameters are interpreted with reference to their position in the oilfield
and correlated to potential causes leading to the present OM distribution, such as
biodegradation, variabilities in the physical rock properties, organofacies and/or maturity
differences of the generating source. Additionally, the heterogeneities and their relation to the
reservoir age across the whole oilfield are interpreted.
6.6.1 ORGANIC MATTER COMPOSITION
In order to compare and summarise the observed heterogeneities, the bar chart plots in Figure
91 A - D show the Py-GC parameter aromaticity (A), gas wetness (B), gas percentage (C),
and the monoaromatic versus diaromatic hydrocarbon ratio (D), from the lowest to the highest
value. Each bar in these plots represents a single reservoir rock sample. The bar colour marks
the corresponding reservoir formation.
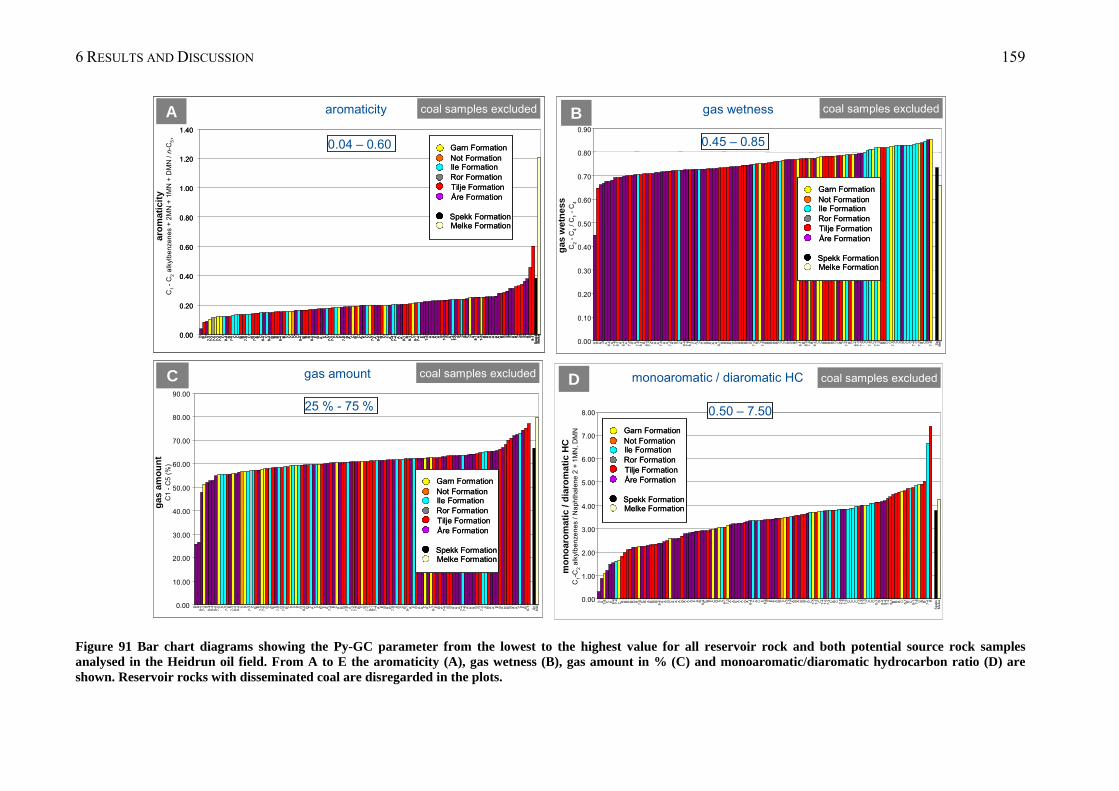
6 RESULTS AND DISCUSSION 159
D
0.00
0.20
0.40
0.60
0.80
1.00
1.20
1.40
D B D7
-37-
37-
57-
37-
5 C8
-4 B7-
4 C C B B7-
8 C B7-
2 B C8-
4 C8-
4 B B B8-
4 B C C C D C8-
4 B B B8-
4 E B A E C7-
27-
2 C C E7
-6 B A C B C A E C C7
-2 A8-
4 B C C A7
-47-
4 A A8-
1 B8
-1 C8-
17-
4 E A7
-6 A A A A B7-
6 B A7
-8 7-6 B C B E C A
8-1 A
7-8 B A A A A A B B E E A B C B E A B
8-1
Spe
kkM
elk
e
aro
mat
icit
yC
1 -
C2
alky
lbe
nzen
es +
2M
N +
1M
N +
DM
N /
n-C
5+
coal samples excluded
0.00
0.20
0.40
0.60
0.80
1.00
1.20
1.40
D B D7
-37-
37-
57-
37-
5 C8
-4 B7-
4 C C B B7-
8 C B7-
2 B C8-
4 C8-
4 B B B8-
4 B C C C D C8-
4 B B B8-
4 E B A E C7-
27-
2 C C E7
-6 B A C B C A E C C7
-2 A8-
4 B C C A7
-47-
4 A A8-
1 B8
-1 C8-
17-
4 E A7
-6 A A A A B7-
6 B A7
-8 7-6 B C B E C A
8-1 A
7-8 B A A A A A B B E E A B C B E A B
8-1
Spe
kkM
elk
e
aromaticity
0.04 – 0.60 Garn Formation
Ile Formation Ror Formation
Åre Formation
Melke Formation
Not Formation
Tilje Formation
Spekk Formation
Garn Formation
Ile Formation Ror Formation
Åre Formation
Melke Formation
Not Formation
Tilje Formation
Spekk Formation
0.00
0.10
0.20
0.30
0.40
0.50
0.60
0.70
0.80
0.90
A B A D A 8-4 A
7-6
8-1 A
8-4 A 7-2 A A
7-8
8-1 B
8-4
7-2 A A A 7-6 A A
7-2 A B C A
8-4
7-6
8-1 E A C A A B A A A
8-1 B B B A E E B B B E E
7-4 B C
7-6 B B B B B C C E E E B C
8-1 B
8-4
7-5 B
8-4 C C B B B B C E B C
7-4 B C
8-4
7-3
7-2 C C
7-8 C
7-4
7-3 B B C C
7-5 C C D C C C
7-4 C
7-3 B C D
7-8 Sp
Me
l
gas
wet
nes
sC
2-
C4
/ C
1-
C4
gas wetness coal samples excluded
0.45 – 0.85
Garn Formation
Ile Formation Ror Formation
Åre Formation
Melke Formation
Not Formation
Tilje Formation
Spekk Formation
Garn Formation
Ile Formation Ror Formation
Åre Formation
Melke Formation
Not Formation
Tilje Formation
Spekk Formation
0.00
10.00
20.00
30.00
40.00
50.00
60.00
70.00
80.00
90.00
D D8-
47-
3 D8
-48
-48-
47-
5 C C7
-2 E7-
38-
48-
4 C C C7-
3 C B E7
-57-
8 B C B E7
-8 B7-
4 B C C C C B8-
4 B C A C C B E A7
-2 E C A B B7-
8 A7-
27-
6 B C B7-
28-
18-
17
-4 A E B A B7
-6 C B C B8-
1 A C B A A C A C8-
1 E B A7
-6 B B A A A7-
47-
6 A A A B B7-
4 C B A A E B A B B B A A C E B8
-1 Sp
Me
l
gas
am
ou
nt
C1
-C
5 (
%)
gas amount
25 % - 75 %
coal samples excluded
Garn Formation
Ile Formation Ror Formation
Åre Formation
Melke Formation
Not Formation
Tilje Formation
Spekk Formation
Garn Formation
Ile Formation Ror Formation
Åre Formation
Melke Formation
Not Formation
Tilje Formation
Spekk Formation
0.00
1.00
2.00
3.00
4.00
5.00
6.00
7.00
8.00
mo
no
aro
mat
ic /
dia
rom
atic
HC
C1-C
2al
kylb
enze
nes
/ N
aph
thal
ene
2 +
1M
N,
DM
N
D A 7-8 E E 8-4
7-4
C B B B B D B 7-5 E B A B B B
8-4 A A B C A A A B A A A E A B
8-4 E B E C D C
8-1
7-3 A A E A A B A
8-4 C A C E 8-4 B E AC A B C C 7-2
7-4 A B A B B A C 7-5
7-2 C 7-4
7-6
7-3 C B C 7-8
7-6
7-6 C C C C 7-2
7-6
7-3 C C C
8-1 B
8-4
8-4
7-2 8-1 B B B C 8-1 B C 8-1
7-8 C B B
Spe
kkB
Me
lke
7-4
coal samples excludedmonoaromatic / diaromatic HC
0.50 – 7.50
Garn Formation
Ile Formation Ror Formation
Åre Formation
Melke Formation
Not Formation
Tilje Formation
Spekk Formation
Garn Formation
Ile Formation Ror Formation
Åre Formation
Melke Formation
Not Formation
Tilje Formation
Spekk Formation
A B
C
Figure 91 Bar chart diagrams showing the Py-GC parameter from the lowest to the highest value for all reservoir rock and both potential source rock samples analysed in the Heidrun oil field. From A to E the aromaticity (A), gas wetness (B), gas amount in % (C) and monoaromatic/diaromatic hydrocarbon ratio (D) are shown. Reservoir rocks with disseminated coal are disregarded in the plots.
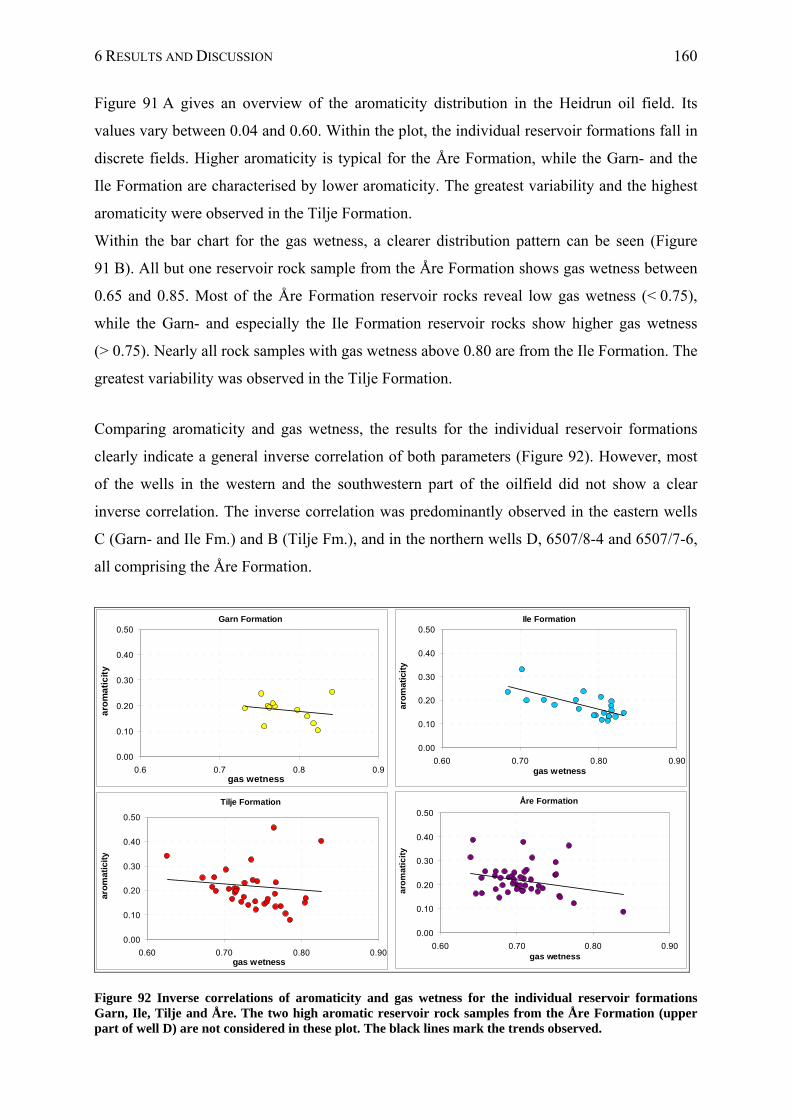
6 RESULTS AND DISCUSSION 160
Figure 91 A gives an overview of the aromaticity distribution in the Heidrun oil field. Its
values vary between 0.04 and 0.60. Within the plot, the individual reservoir formations fall in
discrete fields. Higher aromaticity is typical for the Åre Formation, while the Garn- and the
Ile Formation are characterised by lower aromaticity. The greatest variability and the highest
aromaticity were observed in the Tilje Formation.
Within the bar chart for the gas wetness, a clearer distribution pattern can be seen (Figure
91 B). All but one reservoir rock sample from the Åre Formation shows gas wetness between
0.65 and 0.85. Most of the Åre Formation reservoir rocks reveal low gas wetness (< 0.75),
while the Garn- and especially the Ile Formation reservoir rocks show higher gas wetness
(> 0.75). Nearly all rock samples with gas wetness above 0.80 are from the Ile Formation. The
greatest variability was observed in the Tilje Formation.
Comparing aromaticity and gas wetness, the results for the individual reservoir formations
clearly indicate a general inverse correlation of both parameters (Figure 92). However, most
of the wells in the western and the southwestern part of the oilfield did not show a clear
inverse correlation. The inverse correlation was predominantly observed in the eastern wells
C (Garn- and Ile Fm.) and B (Tilje Fm.), and in the northern wells D, 6507/8-4 and 6507/7-6,
all comprising the Åre Formation.
Garn Formation
0.00
0.10
0.20
0.30
0.40
0.50
0.6 0.7 0.8 0.9gas wetness
aro
ma
tic
ity
Ile Formation
0.00
0.10
0.20
0.30
0.40
0.50
0.60 0.70 0.80 0.90gas wetness
aro
mat
icit
y
Tilje Formation
0.00
0.10
0.20
0.30
0.40
0.50
0.60 0.70 0.80 0.90gas wetness
aro
mat
icit
y
Åre Formation
0.00
0.10
0.20
0.30
0.40
0.50
0.60 0.70 0.80 0.90gas wetness
aro
ma
tic
ity
Figure 92 Inverse correlations of aromaticity and gas wetness for the individual reservoir formations Garn, Ile, Tilje and Åre. The two high aromatic reservoir rock samples from the Åre Formation (upper part of well D) are not considered in these plot. The black lines mark the trends observed.
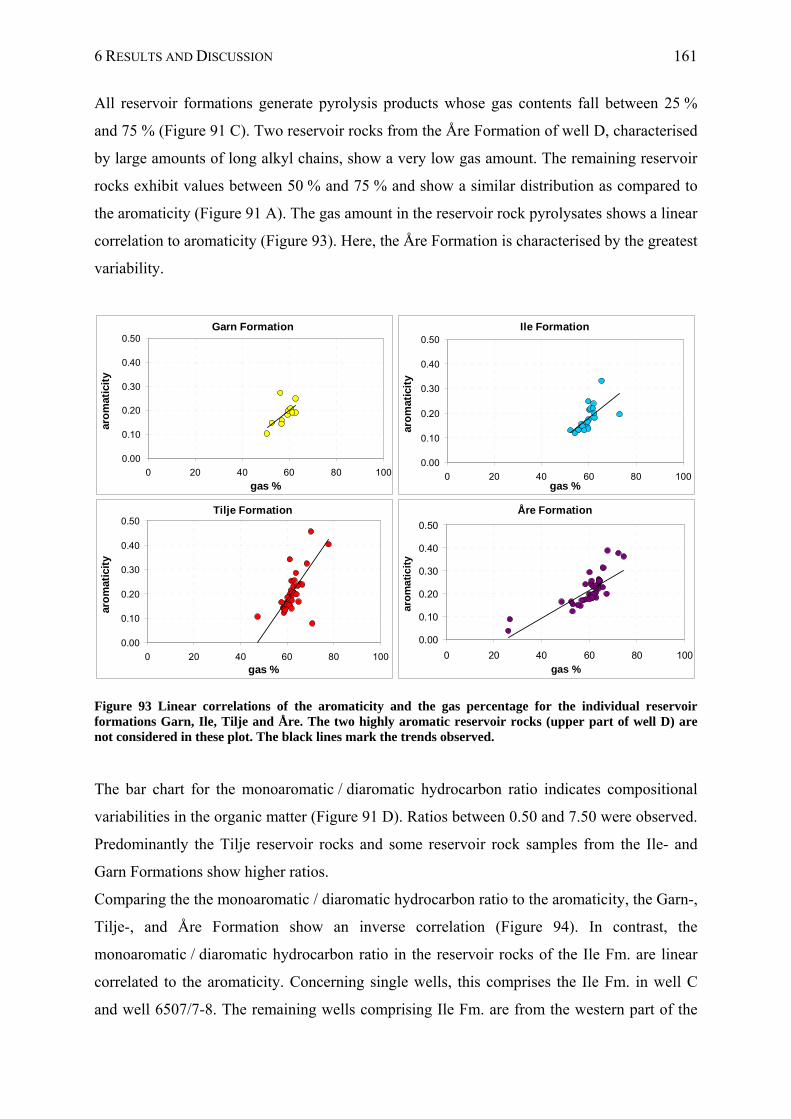
6 RESULTS AND DISCUSSION 161
All reservoir formations generate pyrolysis products whose gas contents fall between 25 %
and 75 % (Figure 91 C). Two reservoir rocks from the Åre Formation of well D, characterised
by large amounts of long alkyl chains, show a very low gas amount. The remaining reservoir
rocks exhibit values between 50 % and 75 % and show a similar distribution as compared to
the aromaticity (Figure 91 A). The gas amount in the reservoir rock pyrolysates shows a linear
correlation to aromaticity (Figure 93). Here, the Åre Formation is characterised by the greatest
variability.
Garn Formation
0.00
0.10
0.20
0.30
0.40
0.50
0 20 40 60 80 100
gas %
aro
mat
icit
y
Ile Formation
0.00
0.10
0.20
0.30
0.40
0.50
0 20 40 60 80 100gas %
aro
mat
icit
y
Tilje Formation
0.00
0.10
0.20
0.30
0.40
0.50
0 20 40 60 80 100gas %
aro
mat
icit
y
Åre Formation
0.00
0.10
0.20
0.30
0.40
0.50
0 20 40 60 80 100
gas %
aro
ma
tic
ity
Figure 93 Linear correlations of the aromaticity and the gas percentage for the individual reservoir formations Garn, Ile, Tilje and Åre. The two highly aromatic reservoir rocks (upper part of well D) are not considered in these plot. The black lines mark the trends observed.
The bar chart for the monoaromatic / diaromatic hydrocarbon ratio indicates compositional
variabilities in the organic matter (Figure 91 D). Ratios between 0.50 and 7.50 were observed.
Predominantly the Tilje reservoir rocks and some reservoir rock samples from the Ile- and
Garn Formations show higher ratios.
Comparing the the monoaromatic / diaromatic hydrocarbon ratio to the aromaticity, the Garn-,
Tilje-, and Åre Formation show an inverse correlation (Figure 94). In contrast, the
monoaromatic / diaromatic hydrocarbon ratio in the reservoir rocks of the Ile Fm. are linear
correlated to the aromaticity. Concerning single wells, this comprises the Ile Fm. in well C
and well 6507/7-8. The remaining wells comprising Ile Fm. are from the western part of the
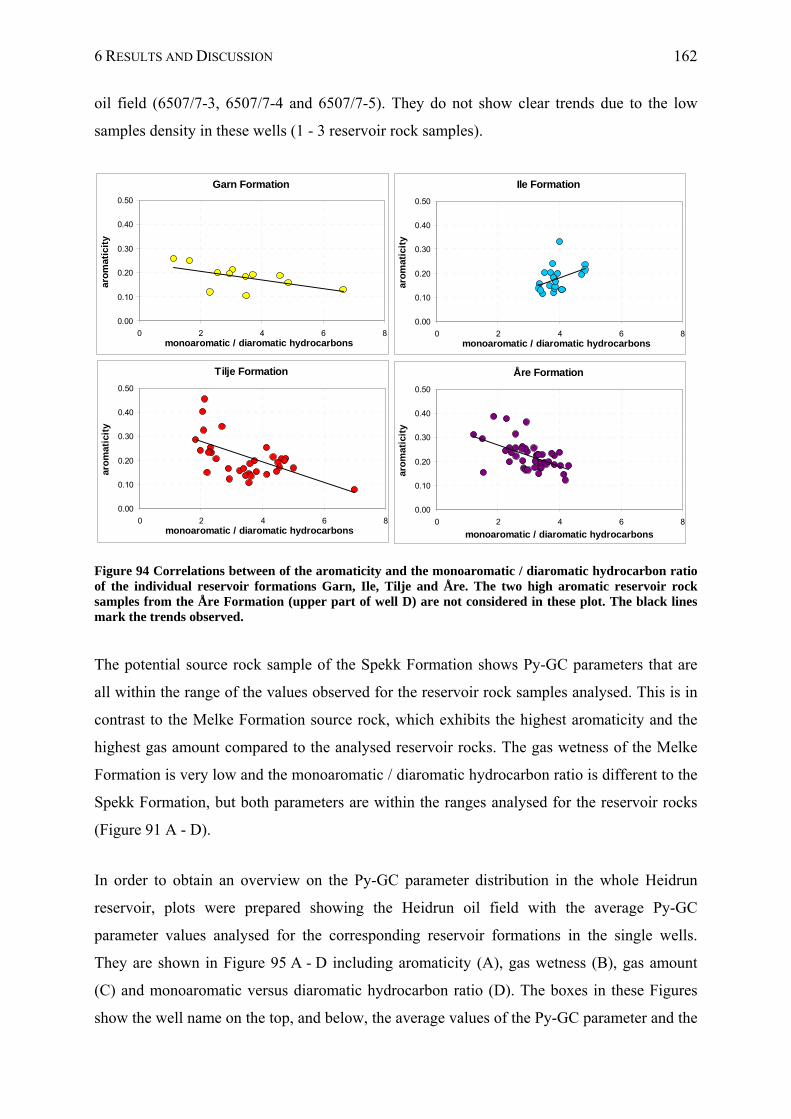
6 RESULTS AND DISCUSSION 162
oil field (6507/7-3, 6507/7-4 and 6507/7-5). They do not show clear trends due to the low
samples density in these wells (1 - 3 reservoir rock samples).
Garn Formation
0.00
0.10
0.20
0.30
0.40
0.50
0 2 4 6 8monoaromatic / diaromatic hydrocarbons
aro
mat
icit
y
Ile Formation
0.00
0.10
0.20
0.30
0.40
0.50
0 2 4 6 8monoaromatic / diaromatic hydrocarbons
aro
mat
icit
y
Tilje Formation
0.00
0.10
0.20
0.30
0.40
0.50
0 2 4 6 8monoaromatic / diaromatic hydrocarbons
aro
mat
icit
y
Åre Formation
0.00
0.10
0.20
0.30
0.40
0.50
0 2 4 6 8
monoaromatic / diaromatic hydrocarbons
aro
mat
icit
y
Figure 94 Correlations between of the aromaticity and the monoaromatic / diaromatic hydrocarbon ratio of the individual reservoir formations Garn, Ile, Tilje and Åre. The two high aromatic reservoir rock samples from the Åre Formation (upper part of well D) are not considered in these plot. The black lines mark the trends observed.
The potential source rock sample of the Spekk Formation shows Py-GC parameters that are
all within the range of the values observed for the reservoir rock samples analysed. This is in
contrast to the Melke Formation source rock, which exhibits the highest aromaticity and the
highest gas amount compared to the analysed reservoir rocks. The gas wetness of the Melke
Formation is very low and the monoaromatic / diaromatic hydrocarbon ratio is different to the
Spekk Formation, but both parameters are within the ranges analysed for the reservoir rocks
(Figure 91 A - D).
In order to obtain an overview on the Py-GC parameter distribution in the whole Heidrun
reservoir, plots were prepared showing the Heidrun oil field with the average Py-GC
parameter values analysed for the corresponding reservoir formations in the single wells.
They are shown in Figure 95 A - D including aromaticity (A), gas wetness (B), gas amount
(C) and monoaromatic versus diaromatic hydrocarbon ratio (D). The boxes in these Figures
show the well name on the top, and below, the average values of the Py-GC parameter and the
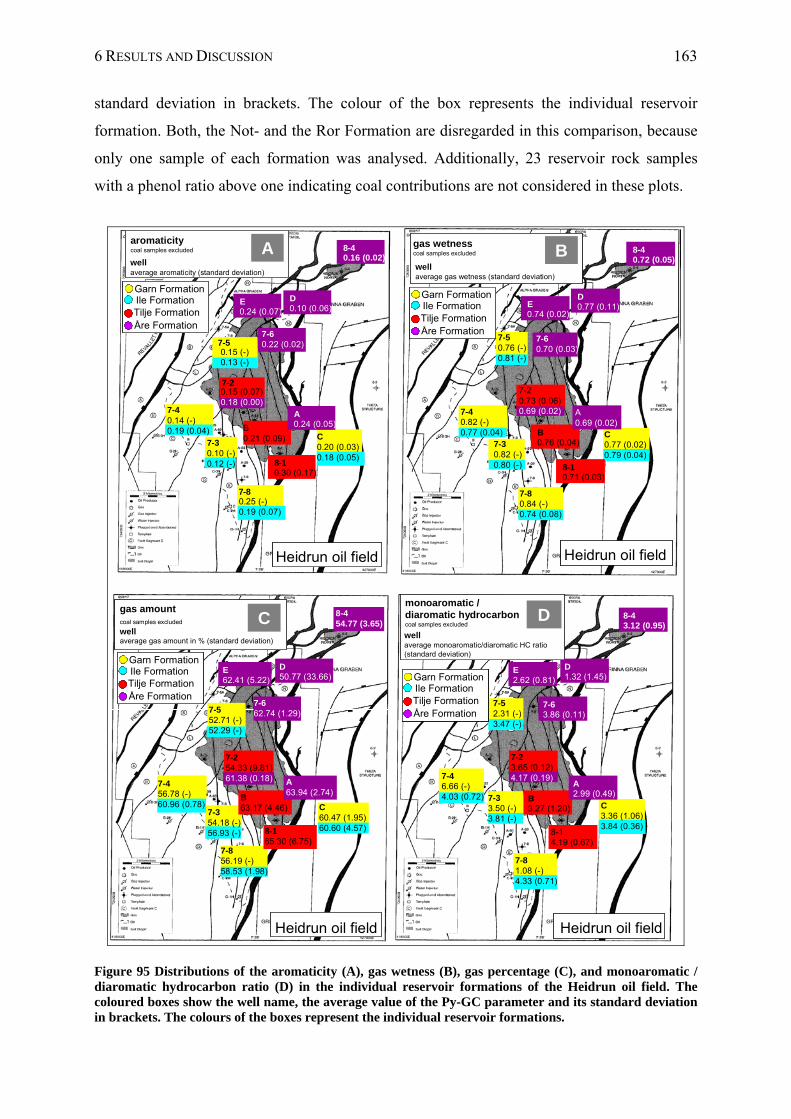
6 RESULTS AND DISCUSSION 163
standard deviation in brackets. The colour of the box represents the individual reservoir
formation. Both, the Not- and the Ror Formation are disregarded in this comparison, because
only one sample of each formation was analysed. Additionally, 23 reservoir rock samples
with a phenol ratio above one indicating coal contributions are not considered in these plots.
7-5
7-8
aromaticitycoal samples excluded
wellaverage aromaticity (standard deviation)
7-2
8-10.30 (0.17)
B0.21 (0.09)
7-60.22 (0.02)
8-40.16 (0.02)
A0.24 (0.05)
E0.24 (0.07)
D0.10 (0.06)
Heidrun oil field
Tilje Formation
Garn FormationIle Formation
Åre Formation
0.15 (0.07)0.18 (0.00)
0.15 (-)0.13 (-)
7-40.14 (-)0.19 (0.04)
7-30.10 (-)0.12 (-)
0.25 (-)0.19 (0.07)
C0.20 (0.03)0.18 (0.05)
7-30.83 (0.01)
7-5
0.80 (0.04)
7-80.85 (-)
Gas wetness
well average gas wetness (standard deviation)
C
0.79 (0.02)
7-40.80 (0.04)
0.80 (0.04)
0.73 (0.02)
8-10.73 (0.03)
B0.76 (0.04)
7-60.72 (0.02)
8-40.74 (0.04)
A0.70 (0.06)
E0.75 (0.02)
D0.78 (0.10)
Heidrun Field
gas wetnesscoal samples excluded
wellaverage gas wetness (standard deviation)
8-10.71 (0.03)
B0.76 (0.04)
7-60.70 (0.03)
8-40.72 (0.05)
A0.69 (0.02)
E0.74 (0.02)
D0.77 (0.11)
Heidrun oil field
Tilje Formation
Garn FormationIle Formation
Åre Formation7-50.76 (-)0.81 (-)
7-30.82 (-)0.80 (-)
7-40.82 (-)0.77 (0.04)
7-80.84 (-)0.74 (0.08)
C0.77 (0.02)0.79 (0.04)
7-20.73 (0.06)0.69 (0.02)
8-14.19 (0.67)
B3.27 (1.20)
7-63.86 (0.11)
8-43.12 (0.95)
A2.99 (0.49)
E2.62 (0.81)
D1.32 (1.45)
Heidrun oil field
well
monoaromatic /diaromatic hydrocarboncoal samples excluded
wellaverage monoaromatic/diaromatic HC ratio (standard deviation)
Tilje Formation
Garn FormationIle Formation
Åre FormationTilje Formation
Garn FormationIle Formation
Åre Formation
7-81.08 (-)4.33 (0.71)
7-52.31 (-)3.47 (-)
7-23.65 (0.12)4.17 (0.19)
7-33.50 (-)3.81 (-)
7-46.66 (-)4.03 (0.72)
C3.36 (1.06)3.84 (0.36)8-1
65.30 (6.75)
7-662.74 (1.29)
8-454.77 (3.65)
E62.41 (5.22)
D50.77 (33.66)
Heidrun oil field
gas amountcoal samples excluded
well average gas amount in % (standard deviation)
C60.47 (1.95)60.60 (4.57)
B63.17 (4.46)
A63.94 (2.74)
7-254.33 (9.81)61.38 (0.18)
7-354.18 (-)56.93 (-)
7-456.78 (-)60.96 (0.78)
7-552.71 (-)52.29 (-)
7-856.19 (-)58.53 (1.98)
Tilje Formation
Garn FormationIle Formation
Åre FormationTilje Formation
Garn FormationIle Formation
Åre Formation
C
A B
D
Figure 95 Distributions of the aromaticity (A), gas wetness (B), gas percentage (C), and monoaromatic / diaromatic hydrocarbon ratio (D) in the individual reservoir formations of the Heidrun oil field. The coloured boxes show the well name, the average value of the Py-GC parameter and its standard deviation in brackets. The colours of the boxes represent the individual reservoir formations.
6 RESULTS AND DISCUSSION 164
The most prominent parameter for the organic matter composition analysed in this study is the
aromaticity. Significant gradients in the aromaticity were found in wells from the eastern and
the northern part of the Heidrun oil field (C, B, E and D). Wells in the western part of the oil
field are more homogeneous in terms of aromaticity. An overview of the aromaticity
distribution in the whole oil field is shown in Figure 95 A.
Two areas can roughly be subdivided, departing the Heidrun oil field along an imaginary
N - S axis. One with a higher aromaticity > 0.2 (average values) including wells
predominantly found in the eastern part of the field, and one in the western part of Heidrun
with average aromaticity < 0.2. Aromaticity above 0.2 was found in the eastern wells A, B,
and C, the northern wells E and 6507/7-6, and the southern well 6507/8-1. Lower aromaticity
below 0.2 was found in the western and southwestern wells 6507/7-5, 6507/7-4, 6507/7-3,
and 6507/7-8 (Ile Fm.), and in the northern wells D and 6507/8-4.
The western and southwestern wells with low aromaticity and a relatively homogeneous
aromaticity distribution are closest to the source kitchen or in other words, nearest the present
day general filling point at the southwestern margin of the oil field. As with increasing
maturity level the aromaticity in the source rock kerogen increases, the oil from the latest
charge should be characterised by higher aromaticity and should be found closest to the
source (England, 1989). However, no source maturity related variabilities in the oil charges
were found in the screening results, one sample in well 6507/8-1 excluded (cf. Chapter 6.2 -
6.5). Thus, maturity related reasons could be disregarded to be responsible for the differences
observed in the aromaticity between the western and the eastern part of the oil field. It is
known that the western wells achieved the most recent oil charge, comprising fresh and
undegraded oil, while wells in the eastern part did not (internal Statoil report, 2003,
Chapter 3.1). The recent oil charge composition is distinctly reflected by a better oil quality
(PI) in the western wells.
A direct correlation of increasing aromaticity and increasing biodegradation level was found
in the pyrolysates of the biodegradation series of the WCSB (heavy oils) and selected Heidrun
oils (cf. Chapter 6.2.1.2.3.1 and 6.2.1.2.3.2). Thus, the lower aromaticity in the reservoir rocks
of the western Heidrun wells might be an indication to a lower biodegradation level compared
to the remaining wells. The homogeneous aromaticity distribution (less or no trends) in the
western wells could be an indication for mixing processes.
6 RESULTS AND DISCUSSION 165
Additionally, all reservoir rocks in the western wells are Fangst group sandstones comprising
the reservoir units Garn- and Ile Formation characterised by the distinctly better poroperm
properties compared to Båt group sediments (Tilje- and Åre Formation). However, a direct
correlation between the aromaticity and the porosity and permeability was not found in this
study. Nevertheless, the aromaticity is apparently linked to higher water saturation. An
increase in water saturation accompanied by increasing aromaticity was observed near the
OWC in the Ile Fm. of well C and well 6507/7-8.
Both northern wells D and 6507/8-4, and partly well E are different as they show distinctly
lower aromaticity compared to the remaining Åre Formation containing wells. In combination
with the high wax content found in well D reservoir rocks, here a different source can be
assumed.
The Tilje Formation shows an increase in aromaticity from well 6507/7-2 to well B and well
6507/8-1 and indicate so an increase in biodegradation level from the centre of the oilfield to
the south. Note that the standard deviation of the average aromaticity increases too.
The gas wetness distribution in the whole oil field shows an inverse distribution pattern to the
aromaticity (Figure 95 B). Gas wetness (average values) below 0.80 were predominantly
found in the eastern part of the field, while the western (and the northern part) represent
higher gas wetness above 0.80. The aromaticity and the gas wetness are inversely correlated,
thus lower gas wetness is apparently linked to higher biodegradation.
The following wells, predominantly from the eastern part, show gas wetness below 0.80: well
A, B, C, E, 6507/7 2, 6507/7 6 and 6507/8 1. Gas wetness above 0.80 was predominantly
found in the western wells 6507/7 3, 6507/7 4, 6507/7 5, and 6507/7 8 (Garn Fm.) and in the
northern part in the wells D and 6507/8 4. The wells D and 6507/8-4, both Åre Formation
show higher gas wetness compared to the remaining Åre Formation containing wells.
Examining the distribution of the average gas content, higher gas amounts between
60 % - 65 % were predominantly found in the eastern part, while most wells in the western
and in the northern part are lower in gas (53 % - 60 %), (Figure 95 C). The gas amount
distribution follows the same pattern as the distribution observed in the aromaticity. The
aromaticity and the gas percentage are linear correlated, thus, higher gas amount is apparently
linked to higher degree of biodegradation.
The Tilje Formation wells show, similar as observed for the aromaticity, an increase in the
gas amount from north to south from well 6507/7-2 to well B and well 6507/8-1, and indicate
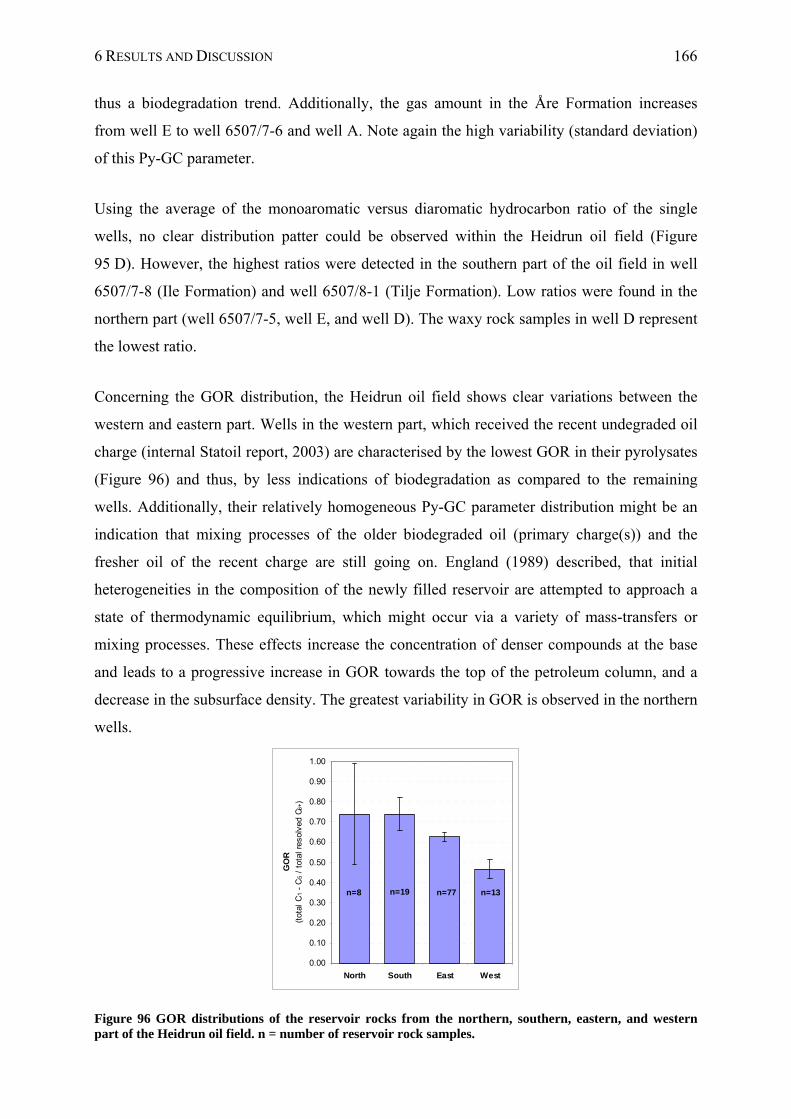
6 RESULTS AND DISCUSSION 166
thus a biodegradation trend. Additionally, the gas amount in the Åre Formation increases
from well E to well 6507/7-6 and well A. Note again the high variability (standard deviation)
of this Py-GC parameter.
Using the average of the monoaromatic versus diaromatic hydrocarbon ratio of the single
wells, no clear distribution patter could be observed within the Heidrun oil field (Figure
95 D). However, the highest ratios were detected in the southern part of the oil field in well
6507/7-8 (Ile Formation) and well 6507/8-1 (Tilje Formation). Low ratios were found in the
northern part (well 6507/7-5, well E, and well D). The waxy rock samples in well D represent
the lowest ratio.
Concerning the GOR distribution, the Heidrun oil field shows clear variations between the
western and eastern part. Wells in the western part, which received the recent undegraded oil
charge (internal Statoil report, 2003) are characterised by the lowest GOR in their pyrolysates
(Figure 96) and thus, by less indications of biodegradation as compared to the remaining
wells. Additionally, their relatively homogeneous Py-GC parameter distribution might be an
indication that mixing processes of the older biodegraded oil (primary charge(s)) and the
fresher oil of the recent charge are still going on. England (1989) described, that initial
heterogeneities in the composition of the newly filled reservoir are attempted to approach a
state of thermodynamic equilibrium, which might occur via a variety of mass-transfers or
mixing processes. These effects increase the concentration of denser compounds at the base
and leads to a progressive increase in GOR towards the top of the petroleum column, and a
decrease in the subsurface density. The greatest variability in GOR is observed in the northern
wells.
n=19n=8 n=77 n=13
0.00
0.10
0.20
0.30
0.40
0.50
0.60
0.70
0.80
0.90
1.00
North South East West
GO
R
(tot
al C
1 -
C5 /
tot
al r
esol
ved
C 6+)
Figure 96 GOR distributions of the reservoir rocks from the northern, southern, eastern, and western part of the Heidrun oil field. n = number of reservoir rock samples.
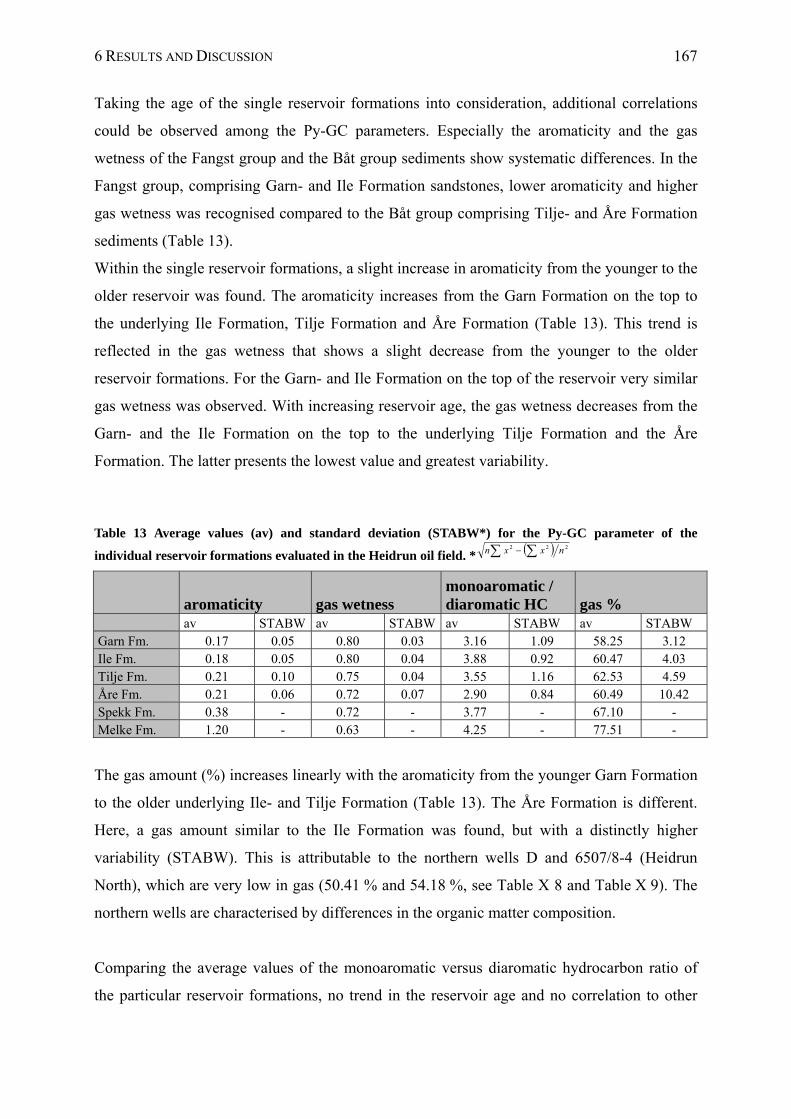
6 RESULTS AND DISCUSSION 167
Taking the age of the single reservoir formations into consideration, additional correlations
could be observed among the Py-GC parameters. Especially the aromaticity and the gas
wetness of the Fangst group and the Båt group sediments show systematic differences. In the
Fangst group, comprising Garn- and Ile Formation sandstones, lower aromaticity and higher
gas wetness was recognised compared to the Båt group comprising Tilje- and Åre Formation
sediments (Table 13).
Within the single reservoir formations, a slight increase in aromaticity from the younger to the
older reservoir was found. The aromaticity increases from the Garn Formation on the top to
the underlying Ile Formation, Tilje Formation and Åre Formation (Table 13). This trend is
reflected in the gas wetness that shows a slight decrease from the younger to the older
reservoir formations. For the Garn- and Ile Formation on the top of the reservoir very similar
gas wetness was observed. With increasing reservoir age, the gas wetness decreases from the
Garn- and the Ile Formation on the top to the underlying Tilje Formation and the Åre
Formation. The latter presents the lowest value and greatest variability.
Table 13 Average values (av) and standard deviation (STABW*) for the Py-GC parameter of the
individual reservoir formations evaluated in the Heidrun oil field. * 222 nxxn
aromaticity gas wetness monoaromatic / diaromatic HC gas %
av STABW av STABW av STABW av STABW Garn Fm. 0.17 0.05 0.80 0.03 3.16 1.09 58.25 3.12 Ile Fm. 0.18 0.05 0.80 0.04 3.88 0.92 60.47 4.03 Tilje Fm. 0.21 0.10 0.75 0.04 3.55 1.16 62.53 4.59 Åre Fm. 0.21 0.06 0.72 0.07 2.90 0.84 60.49 10.42 Spekk Fm. 0.38 - 0.72 - 3.77 - 67.10 - Melke Fm. 1.20 - 0.63 - 4.25 - 77.51 -
The gas amount (%) increases linearly with the aromaticity from the younger Garn Formation
to the older underlying Ile- and Tilje Formation (Table 13). The Åre Formation is different.
Here, a gas amount similar to the Ile Formation was found, but with a distinctly higher
variability (STABW). This is attributable to the northern wells D and 6507/8-4 (Heidrun
North), which are very low in gas (50.41 % and 54.18 %, see Table X 8 and Table X 9). The
northern wells are characterised by differences in the organic matter composition.
Comparing the average values of the monoaromatic versus diaromatic hydrocarbon ratio of
the particular reservoir formations, no trend in the reservoir age and no correlation to other
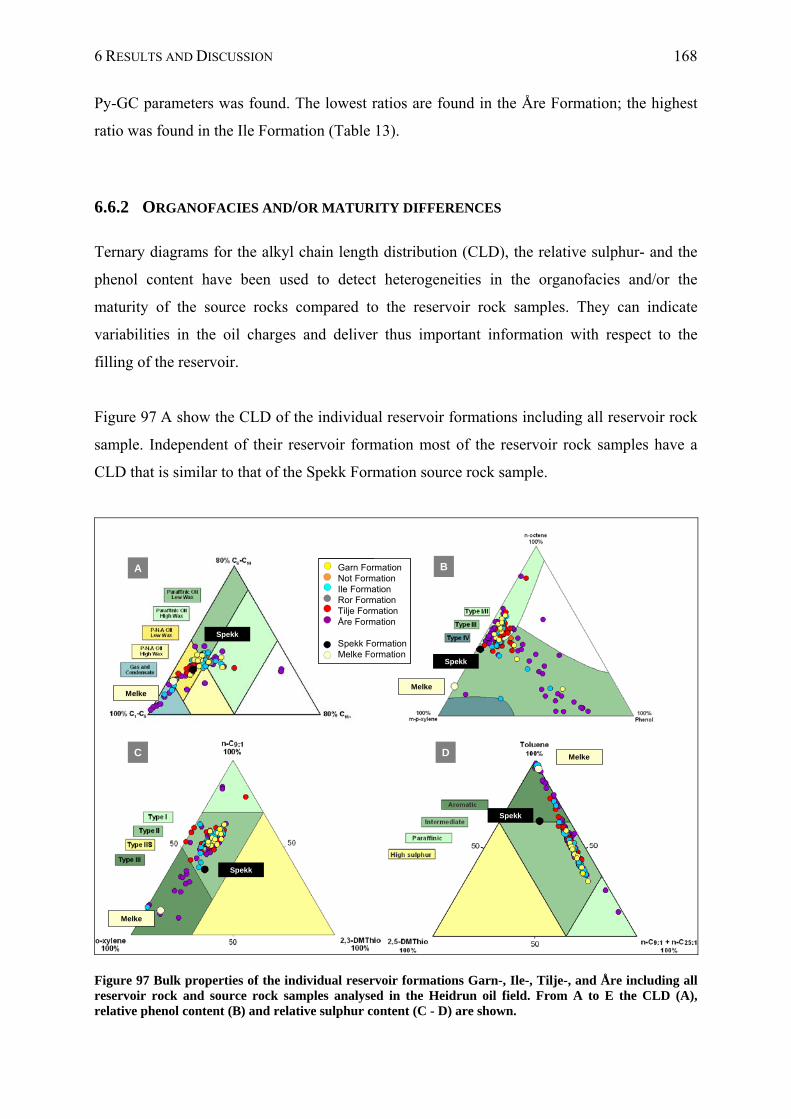
6 RESULTS AND DISCUSSION 168
Py-GC parameters was found. The lowest ratios are found in the Åre Formation; the highest
ratio was found in the Ile Formation (Table 13).
6.6.2 ORGANOFACIES AND/OR MATURITY DIFFERENCES
Ternary diagrams for the alkyl chain length distribution (CLD), the relative sulphur- and the
phenol content have been used to detect heterogeneities in the organofacies and/or the
maturity of the source rocks compared to the reservoir rock samples. They can indicate
variabilities in the oil charges and deliver thus important information with respect to the
filling of the reservoir.
Figure 97 A show the CLD of the individual reservoir formations including all reservoir rock
sample. Independent of their reservoir formation most of the reservoir rock samples have a
CLD that is similar to that of the Spekk Formation source rock sample.
Melke
Melke
Spekk
Melke
Melke
Spekk
Spekk
Spekk
GarnNotIleRorTiljeÅreSpekkMelke
GarnNotIleRorTiljeÅreSpekkMelke
GarnNotIleRorTiljeÅreSpekkMelke
Garn FormationNot FormationIle FormationRor FormationTilje FormationÅre Formation
Spekk FormationMelke Formation
GarnNotIleRorTiljeÅreSpekkMelke
GarnNotIleRorTiljeÅreSpekkMelke
GarnNotIleRorTiljeÅreSpekkMelke
GarnNotIleRorTiljeÅreSpekkMelke
GarnNotIleRorTiljeÅreSpekkMelke
GarnNotIleRorTiljeÅreSpekkMelke
Garn FormationNot FormationIle FormationRor FormationTilje FormationÅre Formation
Spekk FormationMelke Formation
A B
C D
Figure 97 Bulk properties of the individual reservoir formations Garn-, Ile-, Tilje-, and Åre including all reservoir rock and source rock samples analysed in the Heidrun oil field. From A to E the CLD (A), relative phenol content (B) and relative sulphur content (C - D) are shown.
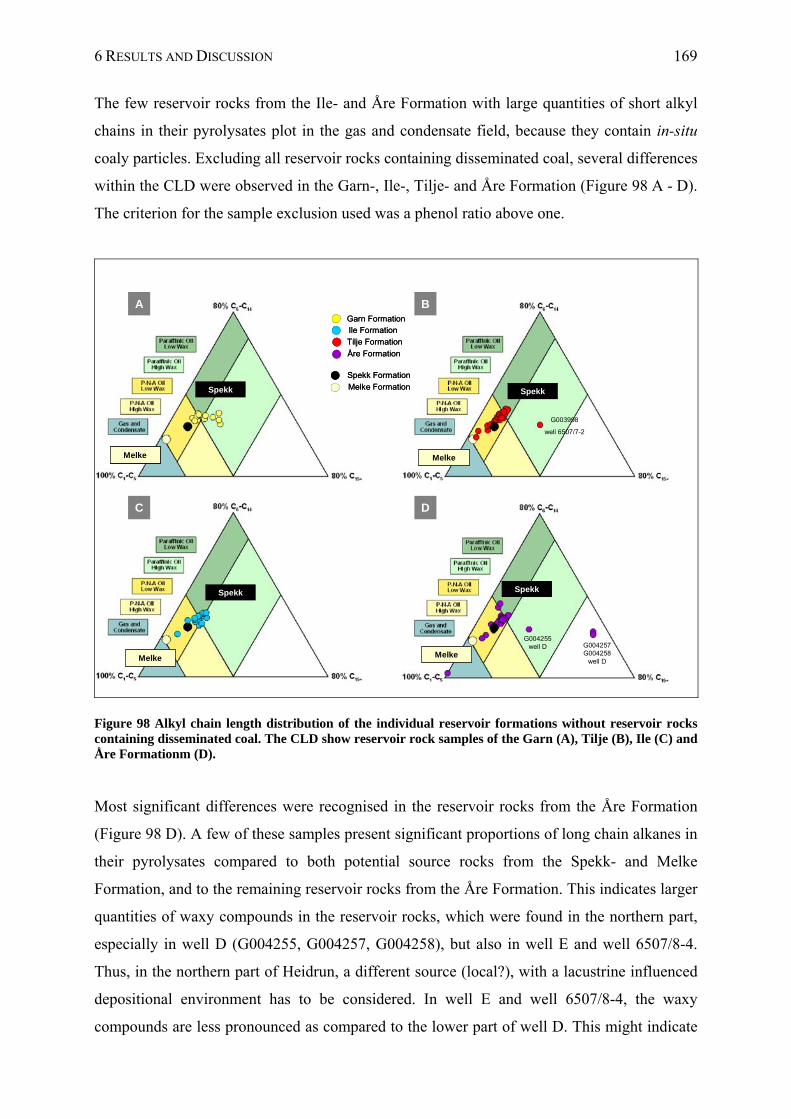
6 RESULTS AND DISCUSSION 169
The few reservoir rocks from the Ile- and Åre Formation with large quantities of short alkyl
chains in their pyrolysates plot in the gas and condensate field, because they contain in-situ
coaly particles. Excluding all reservoir rocks containing disseminated coal, several differences
within the CLD were observed in the Garn-, Ile-, Tilje- and Åre Formation (Figure 98 A - D).
The criterion for the sample exclusion used was a phenol ratio above one.
Garn FormationIle Formation
Tilje Formation
Åre Formation
Spekk Formation
Melke Formation
Garn FormationIle Formation
Tilje Formation
Åre Formation
Spekk Formation
Melke FormationSpekk
MelkeMelke
Spekk
Melke
Spekk
Melke
Spekk
Melke
C D
A B
G004257G004258
well D
G004255 well D
G003998
well 6507/7-2
Figure 98 Alkyl chain length distribution of the individual reservoir formations without reservoir rocks containing disseminated coal. The CLD show reservoir rock samples of the Garn (A), Tilje (B), Ile (C) and Åre Formationm (D).
Most significant differences were recognised in the reservoir rocks from the Åre Formation
(Figure 98 D). A few of these samples present significant proportions of long chain alkanes in
their pyrolysates compared to both potential source rocks from the Spekk- and Melke
Formation, and to the remaining reservoir rocks from the Åre Formation. This indicates larger
quantities of waxy compounds in the reservoir rocks, which were found in the northern part,
especially in well D (G004255, G004257, G004258), but also in well E and well 6507/8-4.
Thus, in the northern part of Heidrun, a different source (local?), with a lacustrine influenced
depositional environment has to be considered. In well E and well 6507/8-4, the waxy
compounds are less pronounced as compared to the lower part of well D. This might indicate
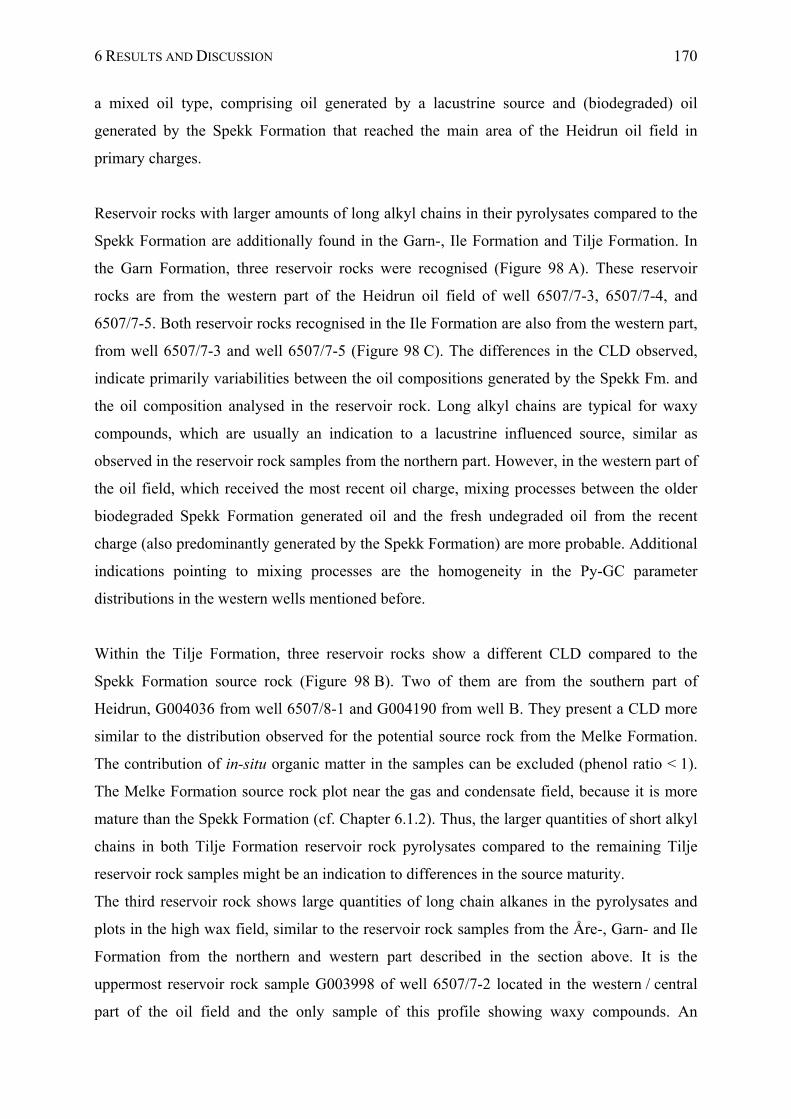
6 RESULTS AND DISCUSSION 170
a mixed oil type, comprising oil generated by a lacustrine source and (biodegraded) oil
generated by the Spekk Formation that reached the main area of the Heidrun oil field in
primary charges.
Reservoir rocks with larger amounts of long alkyl chains in their pyrolysates compared to the
Spekk Formation are additionally found in the Garn-, Ile Formation and Tilje Formation. In
the Garn Formation, three reservoir rocks were recognised (Figure 98 A). These reservoir
rocks are from the western part of the Heidrun oil field of well 6507/7-3, 6507/7-4, and
6507/7-5. Both reservoir rocks recognised in the Ile Formation are also from the western part,
from well 6507/7-3 and well 6507/7-5 (Figure 98 C). The differences in the CLD observed,
indicate primarily variabilities between the oil compositions generated by the Spekk Fm. and
the oil composition analysed in the reservoir rock. Long alkyl chains are typical for waxy
compounds, which are usually an indication to a lacustrine influenced source, similar as
observed in the reservoir rock samples from the northern part. However, in the western part of
the oil field, which received the most recent oil charge, mixing processes between the older
biodegraded Spekk Formation generated oil and the fresh undegraded oil from the recent
charge (also predominantly generated by the Spekk Formation) are more probable. Additional
indications pointing to mixing processes are the homogeneity in the Py-GC parameter
distributions in the western wells mentioned before.
Within the Tilje Formation, three reservoir rocks show a different CLD compared to the
Spekk Formation source rock (Figure 98 B). Two of them are from the southern part of
Heidrun, G004036 from well 6507/8-1 and G004190 from well B. They present a CLD more
similar to the distribution observed for the potential source rock from the Melke Formation.
The contribution of in-situ organic matter in the samples can be excluded (phenol ratio < 1).
The Melke Formation source rock plot near the gas and condensate field, because it is more
mature than the Spekk Formation (cf. Chapter 6.1.2). Thus, the larger quantities of short alkyl
chains in both Tilje Formation reservoir rock pyrolysates compared to the remaining Tilje
reservoir rock samples might be an indication to differences in the source maturity.
The third reservoir rock shows large quantities of long chain alkanes in the pyrolysates and
plots in the high wax field, similar to the reservoir rock samples from the Åre-, Garn- and Ile
Formation from the northern and western part described in the section above. It is the
uppermost reservoir rock sample G003998 of well 6507/7-2 located in the western / central
part of the oil field and the only sample of this profile showing waxy compounds. An
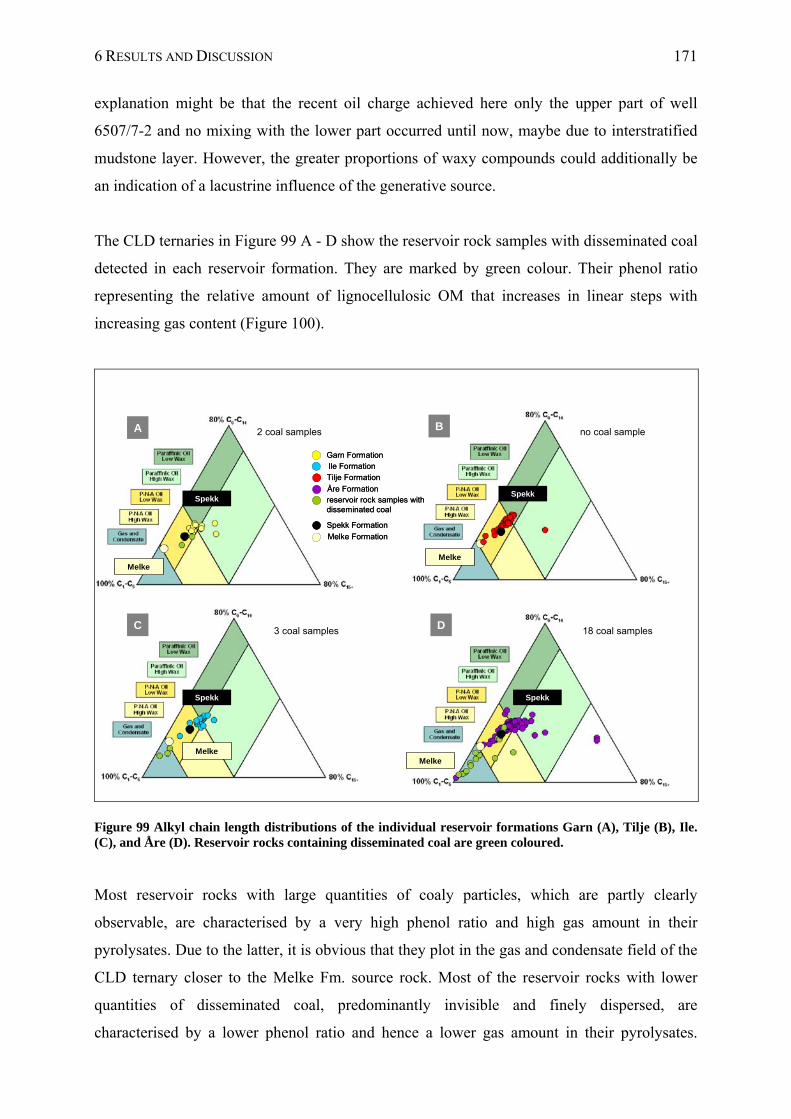
6 RESULTS AND DISCUSSION 171
explanation might be that the recent oil charge achieved here only the upper part of well
6507/7-2 and no mixing with the lower part occurred until now, maybe due to interstratified
mudstone layer. However, the greater proportions of waxy compounds could additionally be
an indication of a lacustrine influence of the generative source.
The CLD ternaries in Figure 99 A - D show the reservoir rock samples with disseminated coal
detected in each reservoir formation. They are marked by green colour. Their phenol ratio
representing the relative amount of lignocellulosic OM that increases in linear steps with
increasing gas content (Figure 100).
Melke
SpekkSpekk
Melke
Spekk
Melke
Spekk
Melke
no coal sample2 coal samples
3 coal samples 18 coal samples
A B
C D
Garn FormationIle Formation
Tilje Formation
Åre Formation
Spekk Formation
Melke Formation
reservoir rock samples withdisseminated coal
Garn FormationIle Formation
Tilje Formation
Åre Formation
Spekk Formation
Melke Formation
reservoir rock samples withdisseminated coal
Figure 99 Alkyl chain length distributions of the individual reservoir formations Garn (A), Tilje (B), Ile. (C), and Åre (D). Reservoir rocks containing disseminated coal are green coloured.
Most reservoir rocks with large quantities of coaly particles, which are partly clearly
observable, are characterised by a very high phenol ratio and high gas amount in their
pyrolysates. Due to the latter, it is obvious that they plot in the gas and condensate field of the
CLD ternary closer to the Melke Fm. source rock. Most of the reservoir rocks with lower
quantities of disseminated coal, predominantly invisible and finely dispersed, are
characterised by a lower phenol ratio and hence a lower gas amount in their pyrolysates.
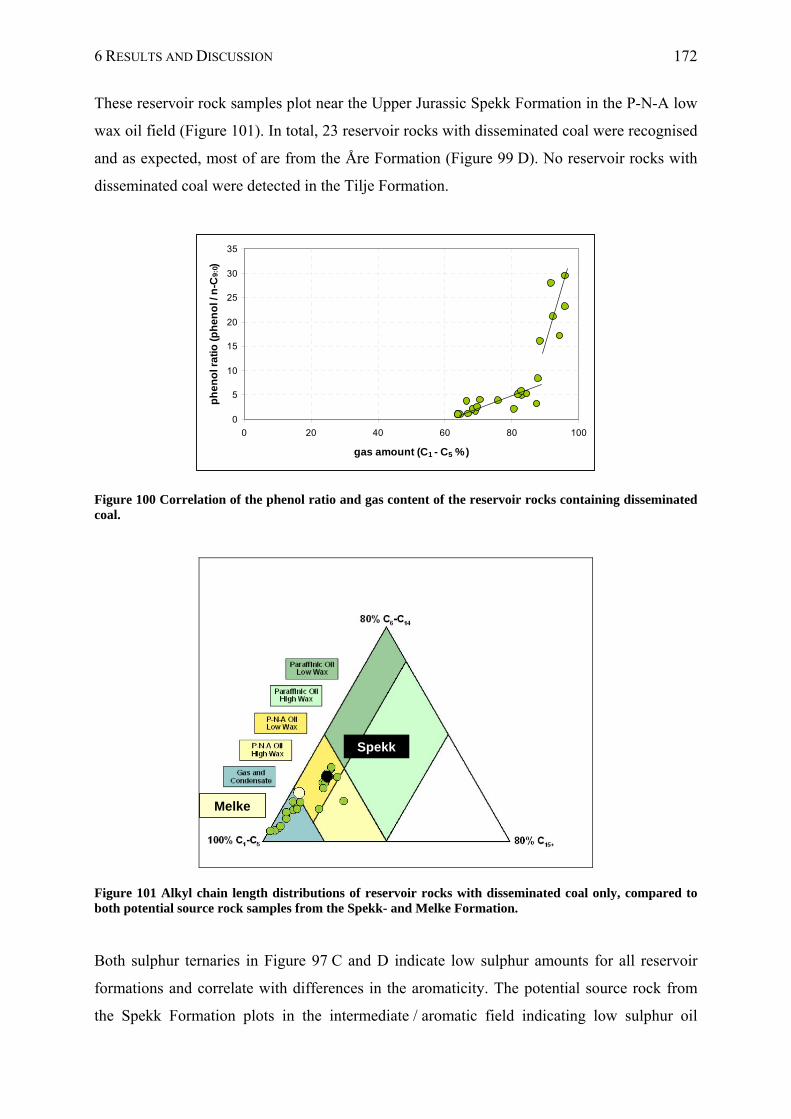
6 RESULTS AND DISCUSSION 172
These reservoir rock samples plot near the Upper Jurassic Spekk Formation in the P-N-A low
wax oil field (Figure 101). In total, 23 reservoir rocks with disseminated coal were recognised
and as expected, most of are from the Åre Formation (Figure 99 D). No reservoir rocks with
disseminated coal were detected in the Tilje Formation.
0
5
10
15
20
25
30
35
0 20 40 60 80 100
gas amount (C1 - C5 %)
ph
en
ol r
ati
o (
ph
en
ol /
n-C
9:0)
Figure 100 Correlation of the phenol ratio and gas content of the reservoir rocks containing disseminated coal.
Spekk
Melke
Figure 101 Alkyl chain length distributions of reservoir rocks with disseminated coal only, compared to both potential source rock samples from the Spekk- and Melke Formation.
Both sulphur ternaries in Figure 97 C and D indicate low sulphur amounts for all reservoir
formations and correlate with differences in the aromaticity. The potential source rock from
the Spekk Formation plots in the intermediate / aromatic field indicating low sulphur oil
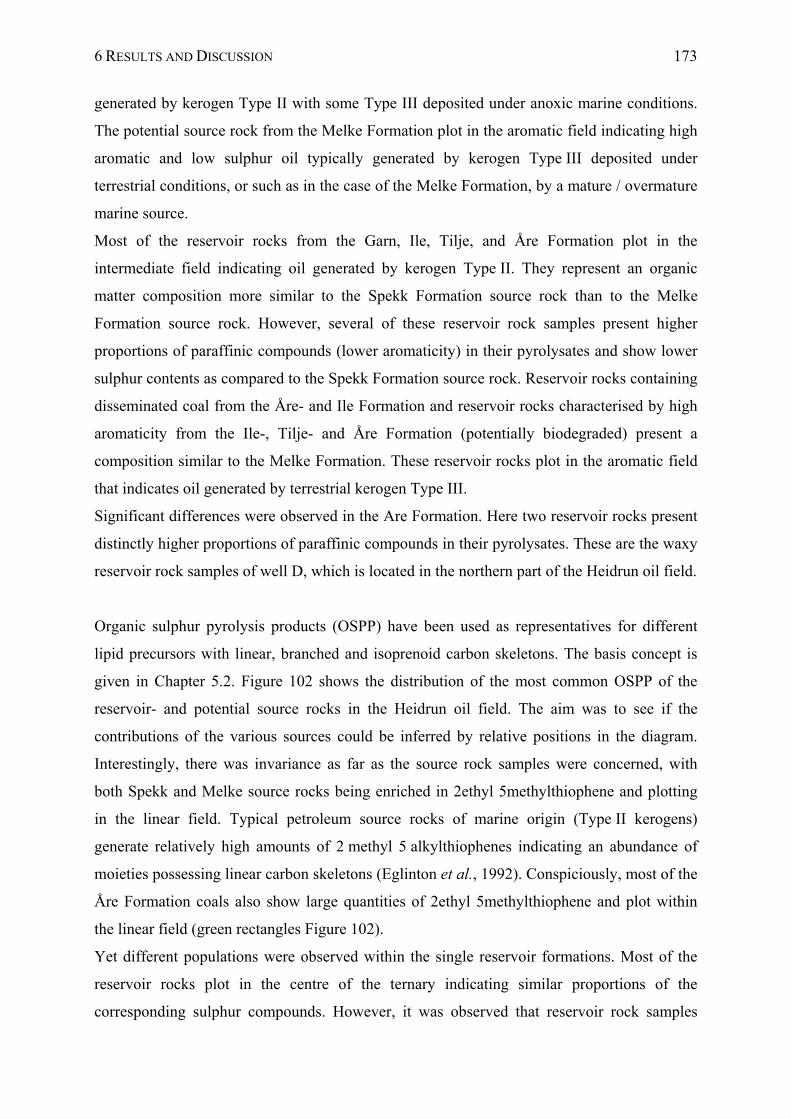
6 RESULTS AND DISCUSSION 173
generated by kerogen Type II with some Type III deposited under anoxic marine conditions.
The potential source rock from the Melke Formation plot in the aromatic field indicating high
aromatic and low sulphur oil typically generated by kerogen Type III deposited under
terrestrial conditions, or such as in the case of the Melke Formation, by a mature / overmature
marine source.
Most of the reservoir rocks from the Garn, Ile, Tilje, and Åre Formation plot in the
intermediate field indicating oil generated by kerogen Type II. They represent an organic
matter composition more similar to the Spekk Formation source rock than to the Melke
Formation source rock. However, several of these reservoir rock samples present higher
proportions of paraffinic compounds (lower aromaticity) in their pyrolysates and show lower
sulphur contents as compared to the Spekk Formation source rock. Reservoir rocks containing
disseminated coal from the Åre- and Ile Formation and reservoir rocks characterised by high
aromaticity from the Ile-, Tilje- and Åre Formation (potentially biodegraded) present a
composition similar to the Melke Formation. These reservoir rocks plot in the aromatic field
that indicates oil generated by terrestrial kerogen Type III.
Significant differences were observed in the Are Formation. Here two reservoir rocks present
distinctly higher proportions of paraffinic compounds in their pyrolysates. These are the waxy
reservoir rock samples of well D, which is located in the northern part of the Heidrun oil field.
Organic sulphur pyrolysis products (OSPP) have been used as representatives for different
lipid precursors with linear, branched and isoprenoid carbon skeletons. The basis concept is
given in Chapter 5.2. Figure 102 shows the distribution of the most common OSPP of the
reservoir- and potential source rocks in the Heidrun oil field. The aim was to see if the
contributions of the various sources could be inferred by relative positions in the diagram.
Interestingly, there was invariance as far as the source rock samples were concerned, with
both Spekk and Melke source rocks being enriched in 2ethyl 5methylthiophene and plotting
in the linear field. Typical petroleum source rocks of marine origin (Type II kerogens)
generate relatively high amounts of 2 methyl 5 alkylthiophenes indicating an abundance of
moieties possessing linear carbon skeletons (Eglinton et al., 1992). Conspiciously, most of the
Åre Formation coals also show large quantities of 2ethyl 5methylthiophene and plot within
the linear field (green rectangles Figure 102).
Yet different populations were observed within the single reservoir formations. Most of the
reservoir rocks plot in the centre of the ternary indicating similar proportions of the
corresponding sulphur compounds. However, it was observed that reservoir rock samples
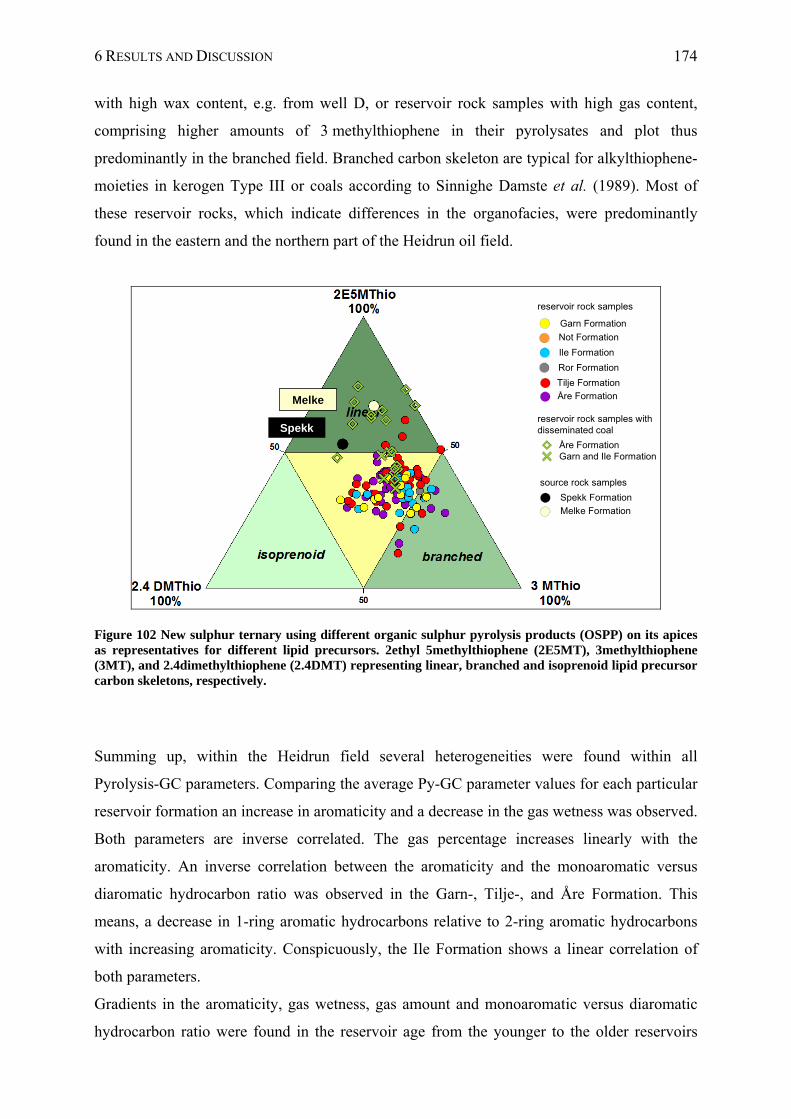
6 RESULTS AND DISCUSSION 174
with high wax content, e.g. from well D, or reservoir rock samples with high gas content,
comprising higher amounts of 3 methylthiophene in their pyrolysates and plot thus
predominantly in the branched field. Branched carbon skeleton are typical for alkylthiophene-
moieties in kerogen Type III or coals according to Sinnighe Damste et al. (1989). Most of
these reservoir rocks, which indicate differences in the organofacies, were predominantly
found in the eastern and the northern part of the Heidrun oil field.
Spekk
Melke
Garn Formation
Ile Formation
Tilje Formation
Åre Formation
Spekk Formation
Melke Formation
reservoir rock samples withdisseminated coal
Not Formation
Ror Formation
Åre FormationGarn and Ile Formation
reservoir rock samples
source rock samples
Figure 102 New sulphur ternary using different organic sulphur pyrolysis products (OSPP) on its apices as representatives for different lipid precursors. 2ethyl 5methylthiophene (2E5MT), 3methylthiophene (3MT), and 2.4dimethylthiophene (2.4DMT) representing linear, branched and isoprenoid lipid precursor carbon skeletons, respectively.
Summing up, within the Heidrun field several heterogeneities were found within all
Pyrolysis-GC parameters. Comparing the average Py-GC parameter values for each particular
reservoir formation an increase in aromaticity and a decrease in the gas wetness was observed.
Both parameters are inverse correlated. The gas percentage increases linearly with the
aromaticity. An inverse correlation between the aromaticity and the monoaromatic versus
diaromatic hydrocarbon ratio was observed in the Garn-, Tilje-, and Åre Formation. This
means, a decrease in 1-ring aromatic hydrocarbons relative to 2-ring aromatic hydrocarbons
with increasing aromaticity. Conspicuously, the Ile Formation shows a linear correlation of
both parameters.
Gradients in the aromaticity, gas wetness, gas amount and monoaromatic versus diaromatic
hydrocarbon ratio were found in the reservoir age from the younger to the older reservoirs
6 RESULTS AND DISCUSSION 175
(Garn Formation Ile Formation Tilje Formation Åre Formation). An increase in
aromaticity and gas content from the north to the south was observed in the Tilje Formation
(well 6507/7-2 well B well 6507/8-1). Furthermore, in the Åre Formation, the gas
content in the pyrolysates increases from the north to the south (well E well 6507/7-6
well A).
Based on the screening results, the Heidrun oil field can roughly be separated into an eastern
and a western part. The wells in the eastern part (A, B, C, D, E, 6507/8-4, 6507/7-8, and
6507/8-1) show higher aromaticity and gas contents, and lower gas wetness compared to
wells in the western part of the oil field. They show additionally significant gradients in the
Py-GC parameters. Wells with relatively homogeneous organic matter composition without
significant gradients in the Py-GC parameters were predominantly found in the western part
of the Heidrun oil field (6507/7-3, 6507/7-4, 6507/7-5, 6507/7-2, and 6507/7-6).
Significant differences in aromaticity and/or the gas compound ratios were found in the
northern part, especially in well D, compared to the remaining Åre Formation wells evaluated
in the Heidrun oil field.
A direct relation of aromaticity and biodegradation was observed within the pyrolysis
products of the heavy oils (biodegradation series) of the WCSB and Heidrun oils. It was
shown that with increasing biodegradation level the aromaticity of the macromolecular
compounds increases. Thus, variabilities in aromaticity of the reservoir rock pyrolysates are
obviously linked to differences in biodegradation. Transferred to the Heidrun oil field, this
means in concrete terms a lower level of biodegradation in the western wells, of which one
knows that they received the recent undegraded oil charge, and in contrast a higher level of
biodegradation in wells of the eastern part.
Comparing the single reservoir formations, the Garn- and the Ile Formation show lower
aromaticity compared to the Tilje- and the Åre Formation. Wells comprising Garn- and Ile
Formation sediments are predominantly found in the western part of the Heidrun oil field.
Higher aromaticity was additionally observed in zones with higher water saturation, e.g. near
the OWC. The presence of water is an essential prerequisite for alteration processes such as
biodegradation and/or water washing, as both are initiated at the oil-water interface. Thus, the
link between aromaticity and water saturation might inter alias refer to higher microbial
activity in water saturated zones, and thus additionally to a relationship between aromaticity
and biodegradation.
6 RESULTS AND DISCUSSION 176
A direct correlation of the Py-GC parameters to the physical rock properties porosity and
permeability was not observed based on visual comparison alone using well logs and
geochemical depth plots. However, reservoir formations with better rock properties namely
higher porosity and higher permeability, such as the Garn- and the Ile Formation, show
generally lower aromaticity and higher gas wetness compared to reservoir formations with
less well reservoir conditions, such as the Tilje- and the Åre Formation.
In total, 23 reservoir rocks with disseminated coal (phenol ratio > 1) were found. They are
generally characterised by low oil quality, high aromaticity and gas percentage, low gas
wetness and the presence of more diaromatic hydrocarbons compared to monoaromatic
hydrocarbons.
Excluding reservoir rocks with disseminated coal, the alkyl chain length distribution of the
majority of the remaining reservoir rocks indicate an identical source rock. They present a
CLD comparable to that of the potential source rock from the marine Spekk Formation.
Indications regarding differences in the organofacies of the generative source were observed
in several reservoir rocks from the Åre Formation in the northern part (well D, well E, and
well 6507/8-4), from the Garn and Ile Formation in the western part (well 6507/7-2, well
6507/7-3, and well 6507/7-4), and in one reservoir rock from the Tilje Formation (well
6507/7-2). Reservoir rocks in these wells show larger quantities of waxy compounds. In the
northern part of Heidrun, indications with respect to a different source with a lacustrine
influenced depositional environment were found. In well E and well 6507/8-4, the waxy
compounds are less pronounced as compared to well D thus, a mixed oil comprising products
from a lacustrine source and oil generated by the marine Spekk Formation (biodegraded) are
more probable.In the western part, which received the most recent oil charge, mixing
processes between the primary Spekk Formation oil (biodegraded) and the recent undegraded
oil charge (predominantly also generated by the Spekk Formation) are more probable.
Additional indications pointing to mixing processes are the homogeneity in the Py-GC
parameter distribution in the western wells.
Potential indications to differences in the source maturity were found in the Tilje Formation in
the southern part of the Heidrun oil field. Here two reservoir rocks, one of well 6507/8-1 and
one of well B, show a CLD that is similar to the distribution observed for the potential source
rock from the Melke Formation, the more mature source rock.
7 SEPARATED ASPHALTENE FRACTIONS – DO THEY YIELD MORE INFORMATION? 177
7 SEPARATED ASPHALTENE FRACTIONS – DO THEY YIELD MORE
INFORMATION?
Here, the results using single asphaltenes are presented starting with the asphaltene separation
method developed and modified to detect small-scale heterogeneities in compartmentalised
reservoirs. The article as published in Theuerkorn et al. (2008) will be presented followed by
some potential problems with contaminations we had using asphaltenes, the screening results
based on single asphaltene analysis and finally the compositional kinetic model.
7.1 A REPRODUCIBLE AND LINEAR METHOD FOR SEPARATING
ASPHALTENES FROM CRUDE OIL
7.1.1 ABSTRACT
Petroleum asphaltenes exhibit strong structural similarities to their parent kerogen. Thus they
can be used to help determine the source rock characteristics of active kitchen areas and to
reconstruct the filling histories of reservoirs. The analysis of asphaltenes from
compartmentalised reservoirs with complex charging and alteration histories presents a
particularly difficult challenge because the in-situ compositional variations are sometimes
subtle. It is therefore of paramount importance that asphaltene separation methods be utilised,
which are highly reproducible and linear, thereby minimising experimental uncertainty and
providing high-resolution interpretative capabilities. The asphaltene separation method
described here is built on many that have gone before. Different parameters of asphaltene
separation were investigated, which influence the asphaltene amount and properties, whereby
the focus lay on reproducibility and linearity. Gravimetric and thermal analysis techniques
were used to evaluate yields and quality. The developed asphaltene separation method
described in detail in this contribution has four sequential steps, first dissolution of the oil in
dichloromethane / 1 vol. % methanol, second addition of an excess of n-hexane, third settling
time and finally filtration, purging and weighing; this sequence of steps is repeated three
times. Within this study the results concerning the reproducibility depending on solvent type,
7 SEPARATED ASPHALTENE FRACTIONS – DO THEY YIELD MORE INFORMATION? 178
solvent amount, and aging time as well as the linearity depending on sample amount are
presented.
7.1.2 INTRODUCTION
Asphaltenes are defined as that part of solvent-extractable organic matter, which precipitates
upon the addition of excess light hydrocarbon (Hirschberg, 1984; Kawanaka, 1989; Leontaris,
1988; Mitchell & Speight, 1973; Speight et al., 1984). Because they exhibit structural
similarities to the parent kerogen (di Primio et al., 2000; Muscio & Horsfield, 1996; Pelet et
al., 1986), petroleum asphaltenes can provide crucial insights into the organofacies and
maturity of undrilled generative source rocks (Horsfield & Dueppenbecker, 1991; Keym et
al., 2006; Lehne & Dieckmann, 2007). Unravelling the history of compartmentalised
reservoirs with a complex charge and alteration history presents a particularly difficult
challenge, because subtle in-situ compositional variations have to be recognised, and artefacts
associated with separation and analytical procedures have to be minimised. Here we present
the detailed description of an asphaltene separation method, which, because it is both highly
reproducible and linear, is ideally suited to the task.
Our method was developed with close reference to several standard methods (IP143,
NFT60115 and ASTM D3279), employing the Norwegian Geochemical Standard North Sea
Oil-1 (NGS NSO-1; 32,9° API gravity, (Dahlgren, 1998). It is already known that precipitant
type, precipitant/crude oil ratio, solvent type, solvent/crude oil ratio, aging time, temperature
and pressure all influence asphaltene composition (Agrawala & Yarranton, 2001;
Alboudwarej et al., 2002; Ancheyta et al., 2002; Gürgey, 1998; Hotier, 1983; Hu & Guo,
2001; Ignasiak et al., 1977; Jones et al., 1988; Parra-Barraza et al., 2003; Rubinstein et al.,
1979; Speight, 1999; Speight et al., 1984). Therefore, in a first step, we tested the influence of
these parameters on asphaltene composition in the same sequence as mentioned above (which
represents the sequence of the analytical steps involved) and then in a second step optimised
the linearity of the method. For each investigated parameter a minimum of three asphaltene
concentrates were prepared, using identical experimental conditions and analysed by open-
system-pyrolysis-GC and thermo vaporisation-GC. In order to evaluate the best separation
method, we studied changes in asphaltene properties and compositional variations of their
pyrolysates. Standard deviations (STDV) of results from parallel measurements were
calculated.
7 SEPARATED ASPHALTENE FRACTIONS – DO THEY YIELD MORE INFORMATION? 179
7.1.3 EXPERIMENTAL
7.1.3.1 PRECIPITATION OF ASPHALTENES
In order to assess the influence of solvent type, oil/solvent ratio and aging time on the
chemical composition of asphaltenes only one given parameter was changed within each
individual set of experiments. A total of 57 asphaltene samples from the NSO-1 oil were
isolated. The asphaltene separation method consists of four sequential steps; first, the
dissolution of the oil in a minimum amount of polar solvent to etch the resins; second the
addition of an excess of short chain alkanes to precipitate the asphaltenes; third allow settling
to take place for a fixed time; fourth, vacuum filtration followed by washing in hydrocarbon
solvent and drying. All four steps were repeated three times to ensure the removal of
entrapped material (Dahlgren, 1998; Gürgey, 1998; Lehne, 2007; Parra-Barraza et al., 2003;
Speight et al., 1984). A detailed description is as follows:
For the reproducibility studies, 4ml of the NSO-1 oil were weighed in a pre-weighed 250 ml
Erlenmeyer flask. Then a known amount (1, 2 or 4 ml) of dichloromethane (DCM) or
dichloromethane with 1 vol. % methanol (DCM/MeOH 1vol %) was added to provide a
complete dissolution of the entire oil. Subsequently the solution was stirred for 10min in an
ultrasonic bath and a 20-, 40- or 60-fold excess of the total sample volume of n-pentane, n-
hexane or n-heptane was added. Then the flask was wrapped with aluminium foil and put
aside at ambient temperature for 2, 4, 6, 12, 24 or 48 hours. Thereafter the asphaltenes were
separated by filtration through a 0.5 µm Millipore filter. The remaining asphaltenes were
transferred into a 11ml cell of an Accelerated Solvent Extraction System (ASE, Dionex
GmbH, Idstein, Germany), firstly washed with the same type of solvent used in the
precipitation (ASE method: 80°C/100bar, heat 5min, static 4min, 1cycle), and subsequently
extracted with DCM/MeOH (1vol%) (ASE method: 80°C/100bar, heat 5min, static 5min, 3
cycles). The asphaltene extracts were concentrated using a Turbovap evaporator, transferred
into a 10ml brown glass vial and subsequently dried under a gentle stream of nitrogen.
Finally, their weight was recorded when constant. For the linearity test, the NSO-1 oil sample
amount was reduced stepwise.
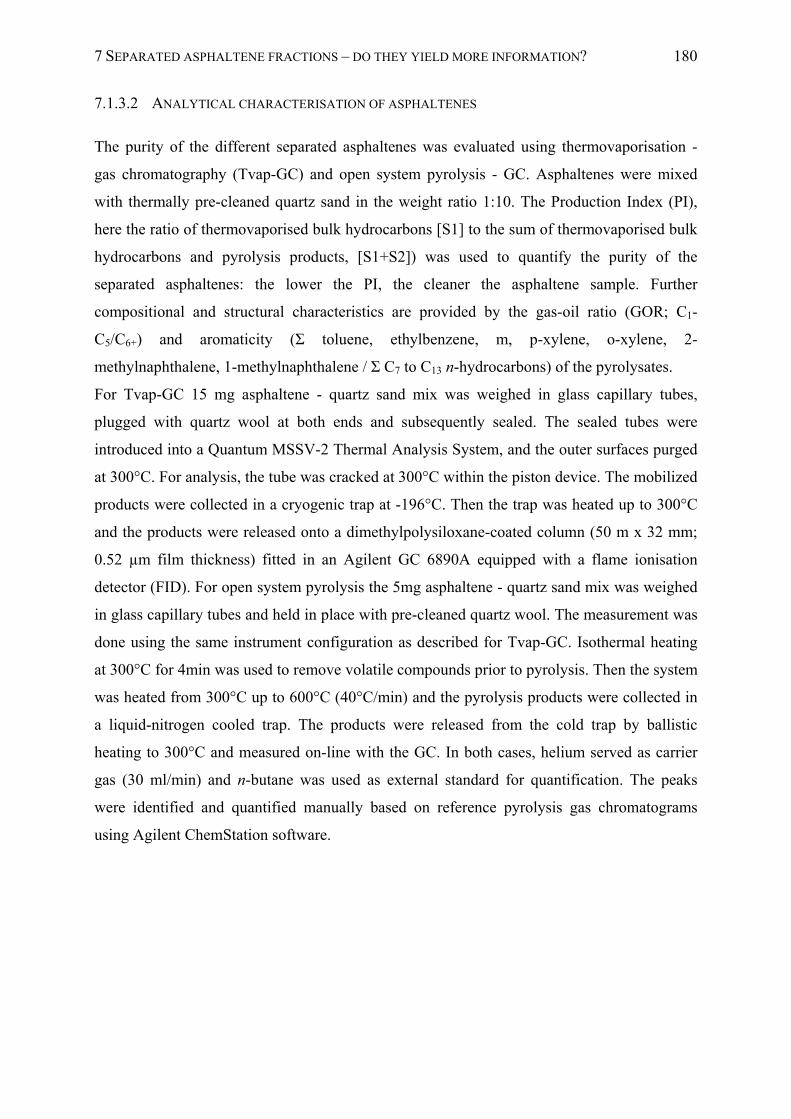
7 SEPARATED ASPHALTENE FRACTIONS – DO THEY YIELD MORE INFORMATION? 180
7.1.3.2 ANALYTICAL CHARACTERISATION OF ASPHALTENES
The purity of the different separated asphaltenes was evaluated using thermovaporisation -
gas chromatography (Tvap-GC) and open system pyrolysis - GC. Asphaltenes were mixed
with thermally pre-cleaned quartz sand in the weight ratio 1:10. The Production Index (PI),
here the ratio of thermovaporised bulk hydrocarbons [S1] to the sum of thermovaporised bulk
hydrocarbons and pyrolysis products, [S1+S2]) was used to quantify the purity of the
separated asphaltenes: the lower the PI, the cleaner the asphaltene sample. Further
compositional and structural characteristics are provided by the gas-oil ratio (GOR; C1-
C5/C6+) and aromaticity (Σ toluene, ethylbenzene, m, p-xylene, o-xylene, 2-
methylnaphthalene, 1-methylnaphthalene / Σ C7 to C13 n-hydrocarbons) of the pyrolysates.
For Tvap-GC 15 mg asphaltene - quartz sand mix was weighed in glass capillary tubes,
plugged with quartz wool at both ends and subsequently sealed. The sealed tubes were
introduced into a Quantum MSSV-2 Thermal Analysis System, and the outer surfaces purged
at 300°C. For analysis, the tube was cracked at 300°C within the piston device. The mobilized
products were collected in a cryogenic trap at -196°C. Then the trap was heated up to 300°C
and the products were released onto a dimethylpolysiloxane-coated column (50 m x 32 mm;
0.52 µm film thickness) fitted in an Agilent GC 6890A equipped with a flame ionisation
detector (FID). For open system pyrolysis the 5mg asphaltene - quartz sand mix was weighed
in glass capillary tubes and held in place with pre-cleaned quartz wool. The measurement was
done using the same instrument configuration as described for Tvap-GC. Isothermal heating
at 300°C for 4min was used to remove volatile compounds prior to pyrolysis. Then the system
was heated from 300°C up to 600°C (40°C/min) and the pyrolysis products were collected in
a liquid-nitrogen cooled trap. The products were released from the cold trap by ballistic
heating to 300°C and measured on-line with the GC. In both cases, helium served as carrier
gas (30 ml/min) and n-butane was used as external standard for quantification. The peaks
were identified and quantified manually based on reference pyrolysis gas chromatograms
using Agilent ChemStation software.
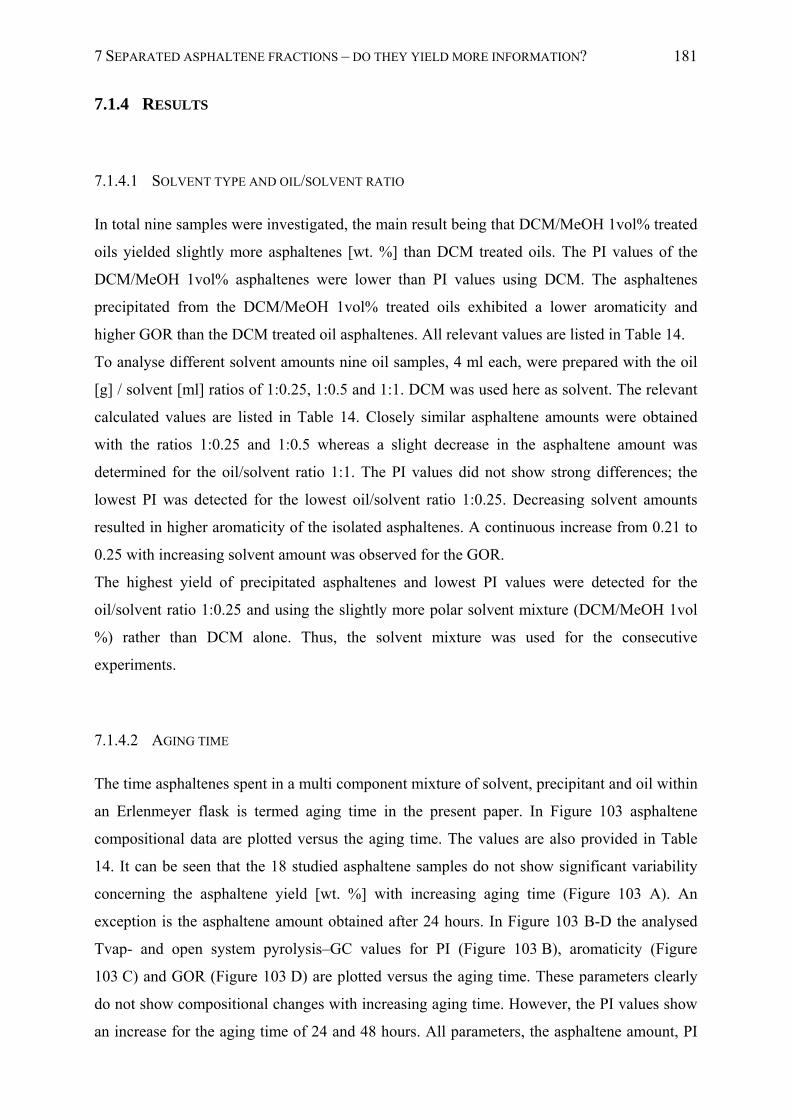
7 SEPARATED ASPHALTENE FRACTIONS – DO THEY YIELD MORE INFORMATION? 181
7.1.4 RESULTS
7.1.4.1 SOLVENT TYPE AND OIL/SOLVENT RATIO
In total nine samples were investigated, the main result being that DCM/MeOH 1vol% treated
oils yielded slightly more asphaltenes [wt. %] than DCM treated oils. The PI values of the
DCM/MeOH 1vol% asphaltenes were lower than PI values using DCM. The asphaltenes
precipitated from the DCM/MeOH 1vol% treated oils exhibited a lower aromaticity and
higher GOR than the DCM treated oil asphaltenes. All relevant values are listed in Table 14.
To analyse different solvent amounts nine oil samples, 4 ml each, were prepared with the oil
[g] / solvent [ml] ratios of 1:0.25, 1:0.5 and 1:1. DCM was used here as solvent. The relevant
calculated values are listed in Table 14. Closely similar asphaltene amounts were obtained
with the ratios 1:0.25 and 1:0.5 whereas a slight decrease in the asphaltene amount was
determined for the oil/solvent ratio 1:1. The PI values did not show strong differences; the
lowest PI was detected for the lowest oil/solvent ratio 1:0.25. Decreasing solvent amounts
resulted in higher aromaticity of the isolated asphaltenes. A continuous increase from 0.21 to
0.25 with increasing solvent amount was observed for the GOR.
The highest yield of precipitated asphaltenes and lowest PI values were detected for the
oil/solvent ratio 1:0.25 and using the slightly more polar solvent mixture (DCM/MeOH 1vol
%) rather than DCM alone. Thus, the solvent mixture was used for the consecutive
experiments.
7.1.4.2 AGING TIME
The time asphaltenes spent in a multi component mixture of solvent, precipitant and oil within
an Erlenmeyer flask is termed aging time in the present paper. In Figure 103 asphaltene
compositional data are plotted versus the aging time. The values are also provided in Table
14. It can be seen that the 18 studied asphaltene samples do not show significant variability
concerning the asphaltene yield [wt. %] with increasing aging time (Figure 103 A). An
exception is the asphaltene amount obtained after 24 hours. In Figure 103 B-D the analysed
Tvap- and open system pyrolysis–GC values for PI (Figure 103 B), aromaticity (Figure
103 C) and GOR (Figure 103 D) are plotted versus the aging time. These parameters clearly
do not show compositional changes with increasing aging time. However, the PI values show
an increase for the aging time of 24 and 48 hours. All parameters, the asphaltene amount, PI
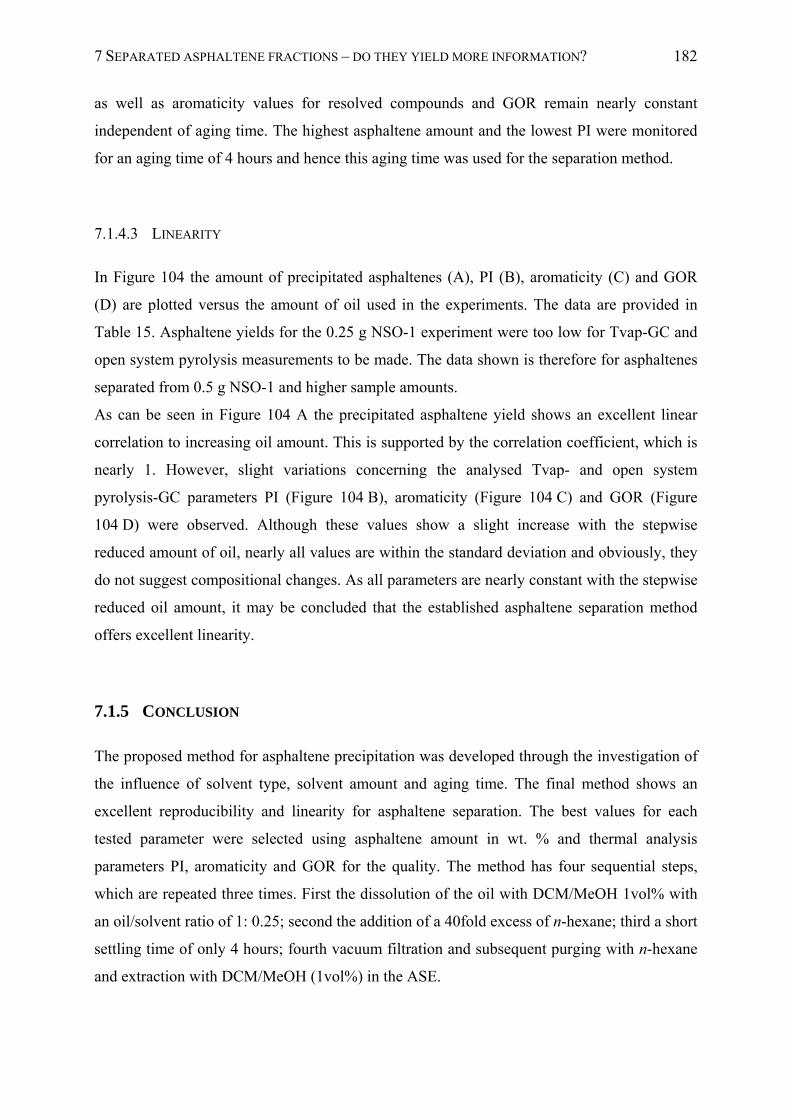
7 SEPARATED ASPHALTENE FRACTIONS – DO THEY YIELD MORE INFORMATION? 182
as well as aromaticity values for resolved compounds and GOR remain nearly constant
independent of aging time. The highest asphaltene amount and the lowest PI were monitored
for an aging time of 4 hours and hence this aging time was used for the separation method.
7.1.4.3 LINEARITY
In Figure 104 the amount of precipitated asphaltenes (A), PI (B), aromaticity (C) and GOR
(D) are plotted versus the amount of oil used in the experiments. The data are provided in
Table 15. Asphaltene yields for the 0.25 g NSO-1 experiment were too low for Tvap-GC and
open system pyrolysis measurements to be made. The data shown is therefore for asphaltenes
separated from 0.5 g NSO-1 and higher sample amounts.
As can be seen in Figure 104 A the precipitated asphaltene yield shows an excellent linear
correlation to increasing oil amount. This is supported by the correlation coefficient, which is
nearly 1. However, slight variations concerning the analysed Tvap- and open system
pyrolysis-GC parameters PI (Figure 104 B), aromaticity (Figure 104 C) and GOR (Figure
104 D) were observed. Although these values show a slight increase with the stepwise
reduced amount of oil, nearly all values are within the standard deviation and obviously, they
do not suggest compositional changes. As all parameters are nearly constant with the stepwise
reduced oil amount, it may be concluded that the established asphaltene separation method
offers excellent linearity.
7.1.5 CONCLUSION
The proposed method for asphaltene precipitation was developed through the investigation of
the influence of solvent type, solvent amount and aging time. The final method shows an
excellent reproducibility and linearity for asphaltene separation. The best values for each
tested parameter were selected using asphaltene amount in wt. % and thermal analysis
parameters PI, aromaticity and GOR for the quality. The method has four sequential steps,
which are repeated three times. First the dissolution of the oil with DCM/MeOH 1vol% with
an oil/solvent ratio of 1: 0.25; second the addition of a 40fold excess of n-hexane; third a short
settling time of only 4 hours; fourth vacuum filtration and subsequent purging with n-hexane
and extraction with DCM/MeOH (1vol%) in the ASE.
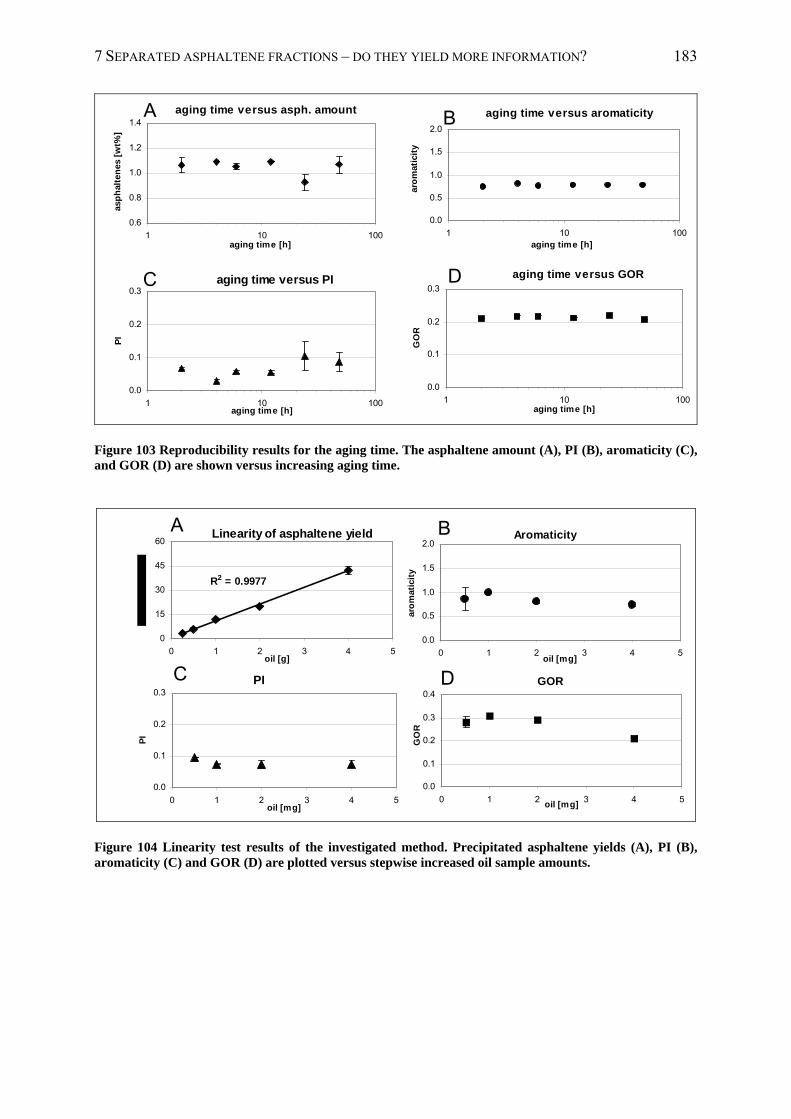
7 SEPARATED ASPHALTENE FRACTIONS – DO THEY YIELD MORE INFORMATION? 183
aging time versus asph. amount
0.6
0.8
1.0
1.2
1.4
1 10 100aging time [h]
asp
hal
ten
es [
wt%
]
aging time versus PI
0.0
0.1
0.2
0.3
1 10 100aging time [h]
PI
aging time versus GOR
0.0
0.1
0.2
0.3
1 10 100aging time [h]
GO
R
aging time versus aromaticity
0.0
0.5
1.0
1.5
2.0
1 10 100aging time [h]
aro
mat
icit
y
A B
C D
Figure 103 Reproducibility results for the aging time. The asphaltene amount (A), PI (B), aromaticity (C), and GOR (D) are shown versus increasing aging time.
Linearity of asphaltene yield
R2 = 0.9977
0
15
30
45
60
0 1 2 3 4 5oil [g]
PI
0.0
0.1
0.2
0.3
0 1 2 3 4 5oil [mg]
PI
GOR
0.0
0.1
0.2
0.3
0.4
0 1 2 3 4 5oil [mg]
GO
R
Aromaticity
0.0
0.5
1.0
1.5
2.0
0 1 2 3 4 5oil [mg]
aro
mat
icit
y
A B
C D
Figure 104 Linearity test results of the investigated method. Precipitated asphaltene yields (A), PI (B), aromaticity (C) and GOR (D) are plotted versus stepwise increased oil sample amounts.
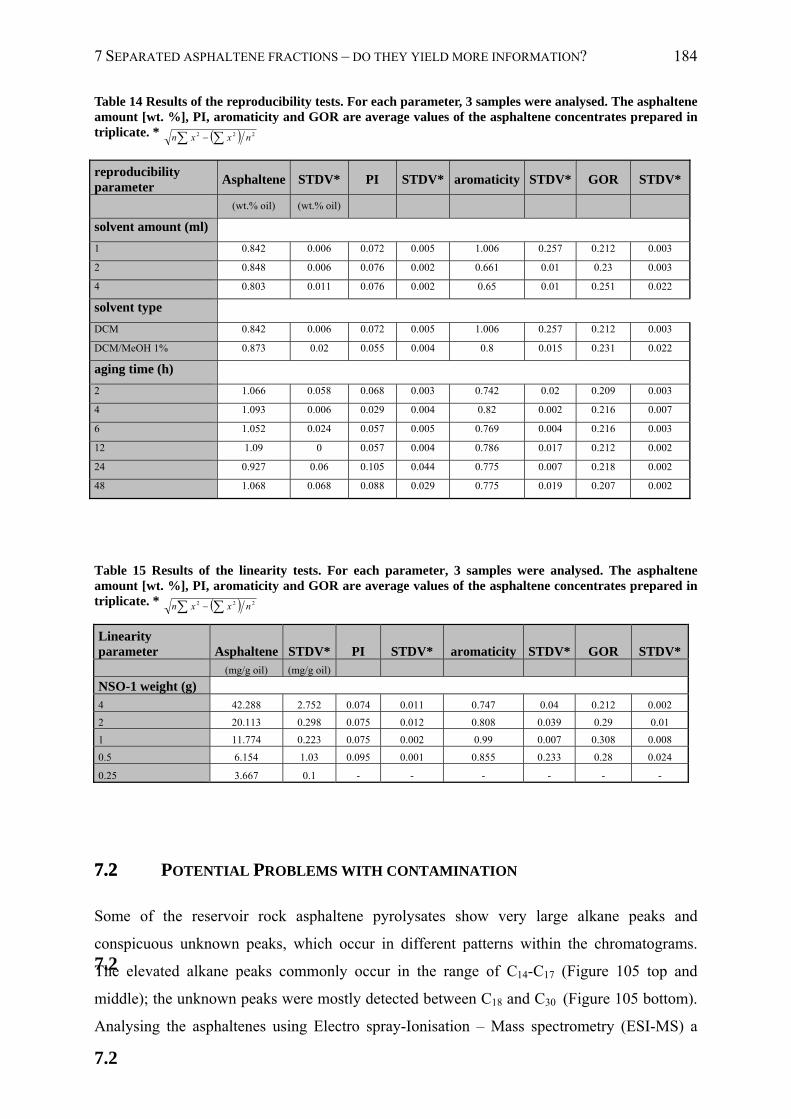
7 SEPARATED ASPHALTENE FRACTIONS – DO THEY YIELD MORE INFORMATION? 184
Table 14 Results of the reproducibility tests. For each parameter, 3 samples were analysed. The asphaltene amount [wt. %], PI, aromaticity and GOR are average values of the asphaltene concentrates prepared in triplicate. * 222 nxxn
Table 15 Results of the linearity tests. For each parameter, 3 samples were analysed. The asphaltene amount [wt. %], PI, aromaticity and GOR are average values of the asphaltene concentrates prepared in triplicate. * 222 nxxn
Linearity parameter Asphaltene STDV* PI STDV* aromaticity STDV* GOR STDV* (mg/g oil) (mg/g oil) NSO-1 weight (g) 4 42.288 2.752 0.074 0.011 0.747 0.04 0.212 0.002
2 20.113 0.298 0.075 0.012 0.808 0.039 0.29 0.01
1 11.774 0.223 0.075 0.002 0.99 0.007 0.308 0.008
0.5 6.154 1.03 0.095 0.001 0.855 0.233 0.28 0.024
0.25 3.667 0.1 - - - - - -
7.2
7.2
7.2
7.2 POTENTIAL PROBLEMS WITH CONTAMINATION
Some of the reservoir rock asphaltene pyrolysates show very large alkane peaks and
conspicuous unknown peaks, which occur in different patterns within the chromatograms.
The elevated alkane peaks commonly occur in the range of C14-C17 (Figure 105 top and
middle); the unknown peaks were mostly detected between C18 and C30 (Figure 105 bottom).
Analysing the asphaltenes using Electro spray-Ionisation – Mass spectrometry (ESI-MS) a
reproducibility parameter
Asphaltene STDV* PI STDV* aromaticity STDV* GOR STDV*
(wt.% oil) (wt.% oil)
solvent amount (ml)
1 0.842 0.006 0.072 0.005 1.006 0.257 0.212 0.003
2 0.848 0.006 0.076 0.002 0.661 0.01 0.23 0.003
4 0.803 0.011 0.076 0.002 0.65 0.01 0.251 0.022
solvent type
DCM 0.842 0.006 0.072 0.005 1.006 0.257 0.212 0.003
DCM/MeOH 1% 0.873 0.02 0.055 0.004 0.8 0.015 0.231 0.022
aging time (h)
2 1.066 0.058 0.068 0.003 0.742 0.02 0.209 0.003
4 1.093 0.006 0.029 0.004 0.82 0.002 0.216 0.007
6 1.052 0.024 0.057 0.005 0.769 0.004 0.216 0.003
12 1.09 0 0.057 0.004 0.786 0.017 0.212 0.002
24 0.927 0.06 0.105 0.044 0.775 0.007 0.218 0.002
48 1.068 0.068 0.088 0.029 0.775 0.019 0.207 0.002
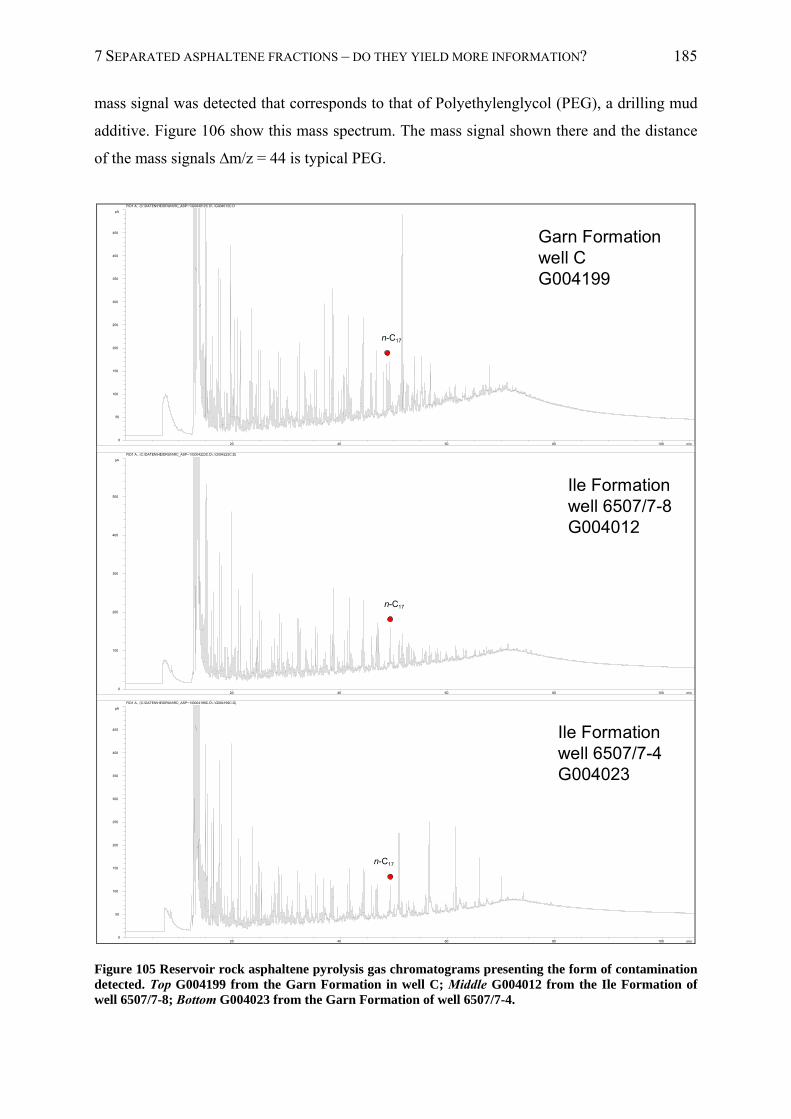
7 SEPARATED ASPHALTENE FRACTIONS – DO THEY YIELD MORE INFORMATION? 185
mass signal was detected that corresponds to that of Polyethylenglycol (PEG), a drilling mud
additive. Figure 106 show this mass spectrum. The mass signal shown there and the distance
of the mass signals ∆m/z = 44 is typical PEG.
min20 40 60 80 100
pA
0
50
100
150
200
250
300
350
400
450
FID1 A, (C:\DATEN\HEIDRUN\RC_ASP~1\G004012C.D\..\G004012C.D)
min20 40 60 80 100
pA
0
100
200
300
400
500
FID1 A, (C:\DATEN\HEIDRUN\RC_ASP~1\G004223C.D\..\G004223C.D)
min20 40 60 80 100
pA
0
50
100
150
200
250
300
350
400
450
FID1 A, (C:\DATEN\HEIDRUN\RC_ASP~1\G004199C.D\..\G004199C.D)
Garn Formationwell CG004199
Ile Formationwell 6507/7-8G004012
Ile Formationwell 6507/7-4G004023
n-C17
n-C17
n-C17
Figure 105 Reservoir rock asphaltene pyrolysis gas chromatograms presenting the form of contamination detected. Top G004199 from the Garn Formation in well C; Middle G004012 from the Ile Formation of well 6507/7-8; Bottom G004023 from the Garn Formation of well 6507/7-4.
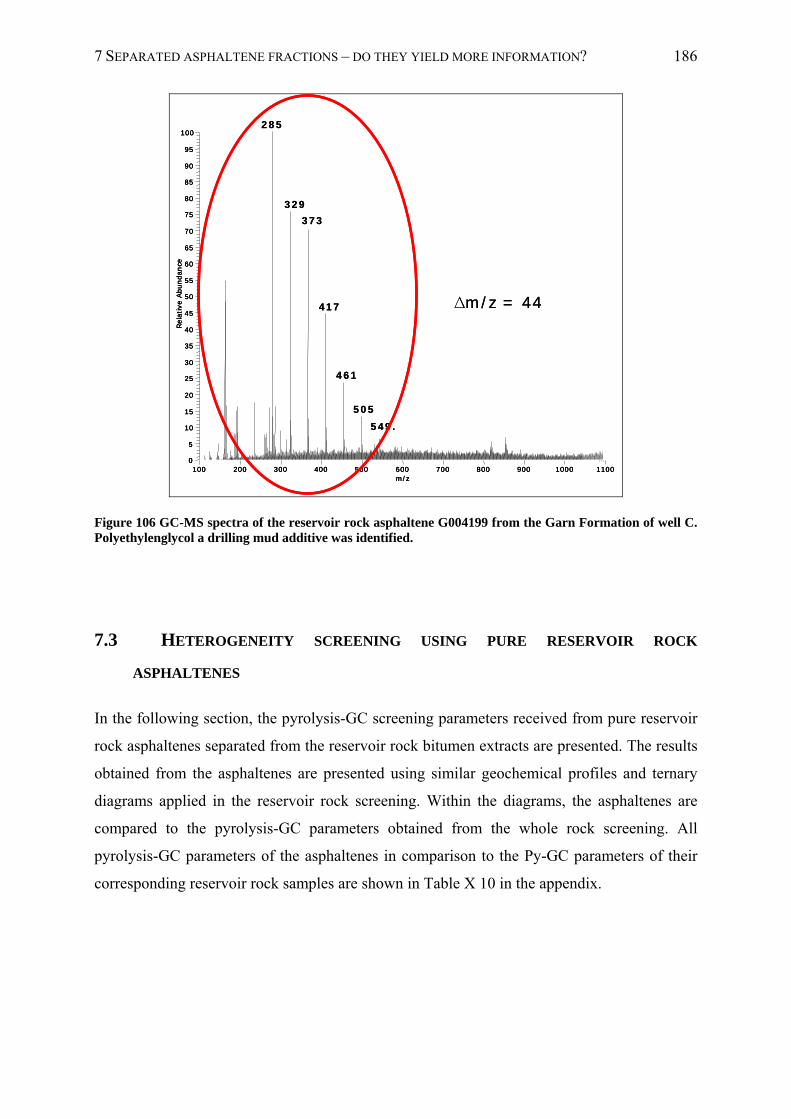
7 SEPARATED ASPHALTENE FRACTIONS – DO THEY YIELD MORE INFORMATION? 186
∆m/z = 44
100 200 300 400 500 600 700 800 900 1000 1100m/z
0
5
10
15
20
25
30
35
40
45
50
55
60
65
70
75
80
85
90
95
100
Rel
ativ
e Abu
ndan
ce
285
329373
417
461
505549.
∆m/z = 44
100 200 300 400 500 600 700 800 900 1000 1100m/z
0
5
10
15
20
25
30
35
40
45
50
55
60
65
70
75
80
85
90
95
100
Rel
ativ
e Abu
ndan
ce
100 200 300 400 500 600 700 800 900 1000 1100m/z
0
5
10
15
20
25
30
35
40
45
50
55
60
65
70
75
80
85
90
95
100
Rel
ativ
e Abu
ndan
ce
285
329373
417
461
505549.
Figure 106 GC-MS spectra of the reservoir rock asphaltene G004199 from the Garn Formation of well C. Polyethylenglycol a drilling mud additive was identified.
7.3 HETEROGENEITY SCREENING USING PURE RESERVOIR ROCK
ASPHALTENES
In the following section, the pyrolysis-GC screening parameters received from pure reservoir
rock asphaltenes separated from the reservoir rock bitumen extracts are presented. The results
obtained from the asphaltenes are presented using similar geochemical profiles and ternary
diagrams applied in the reservoir rock screening. Within the diagrams, the asphaltenes are
compared to the pyrolysis-GC parameters obtained from the whole rock screening. All
pyrolysis-GC parameters of the asphaltenes in comparison to the Py-GC parameters of their
corresponding reservoir rock samples are shown in Table X 10 in the appendix.
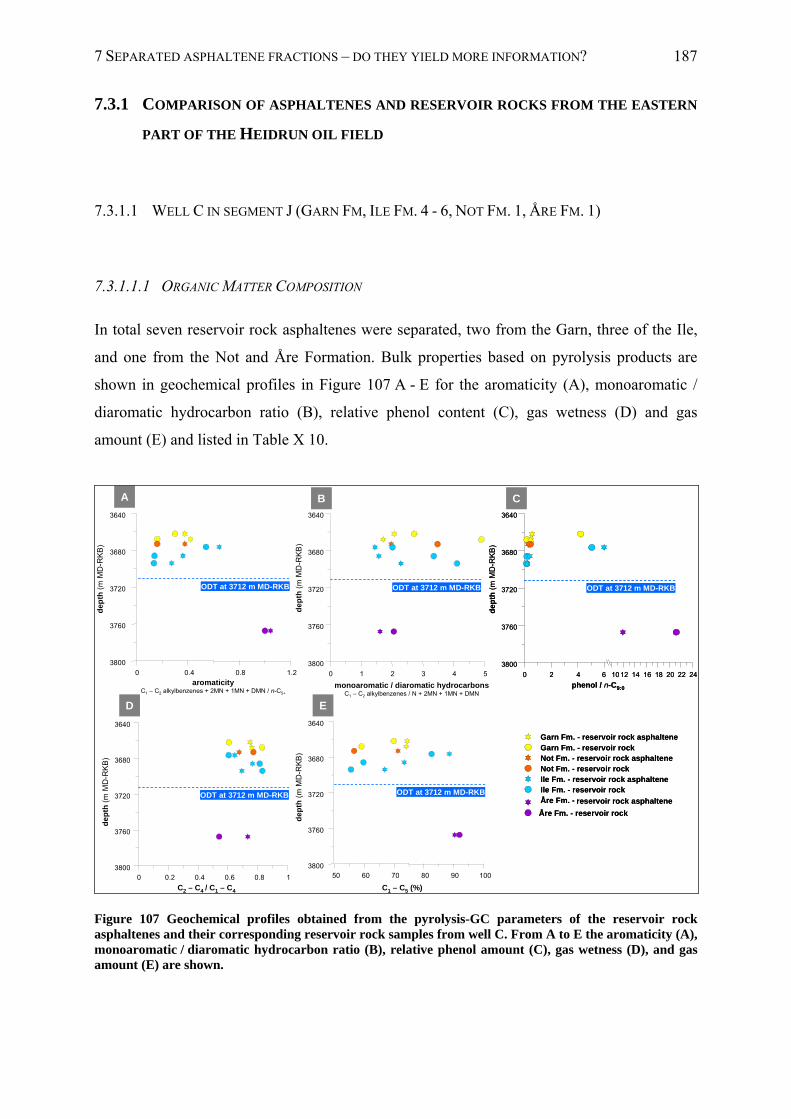
7 SEPARATED ASPHALTENE FRACTIONS – DO THEY YIELD MORE INFORMATION? 187
7.3.1 COMPARISON OF ASPHALTENES AND RESERVOIR ROCKS FROM THE EASTERN
PART OF THE HEIDRUN OIL FIELD
7.3.1.1 WELL C IN SEGMENT J (GARN FM, ILE FM. 4 - 6, NOT FM. 1, ÅRE FM. 1)
7.3.1.1.1 ORGANIC MATTER COMPOSITION
In total seven reservoir rock asphaltenes were separated, two from the Garn, three of the Ile,
and one from the Not and Åre Formation. Bulk properties based on pyrolysis products are
shown in geochemical profiles in Figure 107 A - E for the aromaticity (A), monoaromatic /
diaromatic hydrocarbon ratio (B), relative phenol content (C), gas wetness (D) and gas
amount (E) and listed in Table X 10.
0 0.4 0.8 1.2
3800
3760
3720
3680
3640
0 1 2 3 4 5
3800
3760
3720
3680
3640
0 0.2 0.4 0.6 0.8 13800
3760
3720
3680
3640
50 60 70 80 90 1003800
3760
3720
3680
3640
aromaticityC1 – C2 alkylbenzenes + 2MN + 1MN + DMN / n-C5+
monoaromatic / diaromatic hydrocarbonsC1 – C2 alkylbenzenes / N + 2MN + 1MN + DMN
C1 – C5 (%)C2 – C4 / C1 – C4
dep
th (
m M
D-R
KB
)
dep
th (
m M
D-R
KB
)
de
pth
(m
MD
-RK
B)
de
pth
(m
MD
-RK
B)
ODT at 3712 m MD-RKBODT at 3712 m MD-RKB ODT at 3712 m MD-RKBODT at 3712 m MD-RKB
0 2 4 6 10 12 14 16 18 20 22 24
3800
3760
3720
3680
3640
phenol / n-C9:0
dep
th (
m M
D-R
KB
)
ODT at 3712 m MD-RKB
0 2 4 6 10 12 14 16 18 20 22 24
3800
3760
3720
3680
3640
phenol / n-C9:0
dep
th (
m M
D-R
KB
)
ODT at 3712 m MD-RKBODT at 3712 m MD-RKB
ODT at 3712 m MD-RKBODT at 3712 m MD-RKBODT at 3712 m MD-RKBODT at 3712 m MD-RKB
A B C
D E
Garn Fm. - reservoir rock asphalteneGarn Fm. - reservoir rockNot Fm. - reservoir rock asphalteneNot Fm. - reservoir rockIle Fm. - reservoir rock asphalteneIle Fm. - reservoir rockÅre Fm. -
Åre Fm. - reservoir rock
reservoir rock asphaltene
Garn Fm. - reservoir rock asphalteneGarn Fm. - reservoir rockNot Fm. - reservoir rock asphalteneNot Fm. - reservoir rockIle Fm. - reservoir rock asphalteneIle Fm. - reservoir rockÅre Fm. -
Åre Fm. - reservoir rock
reservoir rock asphaltene
Figure 107 Geochemical profiles obtained from the pyrolysis-GC parameters of the reservoir rock asphaltenes and their corresponding reservoir rock samples from well C. From A to E the aromaticity (A), monoaromatic / diaromatic hydrocarbon ratio (B), relative phenol amount (C), gas wetness (D), and gas amount (E) are shown.
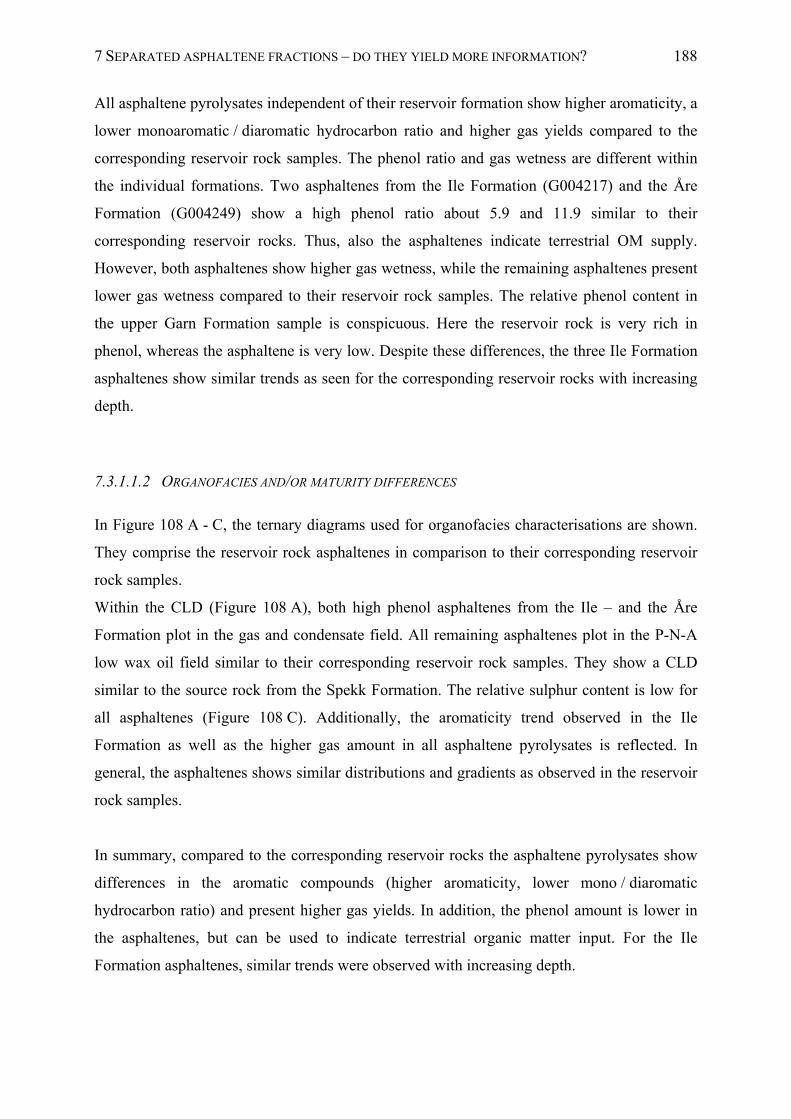
7 SEPARATED ASPHALTENE FRACTIONS – DO THEY YIELD MORE INFORMATION? 188
All asphaltene pyrolysates independent of their reservoir formation show higher aromaticity, a
lower monoaromatic / diaromatic hydrocarbon ratio and higher gas yields compared to the
corresponding reservoir rock samples. The phenol ratio and gas wetness are different within
the individual formations. Two asphaltenes from the Ile Formation (G004217) and the Åre
Formation (G004249) show a high phenol ratio about 5.9 and 11.9 similar to their
corresponding reservoir rocks. Thus, also the asphaltenes indicate terrestrial OM supply.
However, both asphaltenes show higher gas wetness, while the remaining asphaltenes present
lower gas wetness compared to their reservoir rock samples. The relative phenol content in
the upper Garn Formation sample is conspicuous. Here the reservoir rock is very rich in
phenol, whereas the asphaltene is very low. Despite these differences, the three Ile Formation
asphaltenes show similar trends as seen for the corresponding reservoir rocks with increasing
depth.
7.3.1.1.2 ORGANOFACIES AND/OR MATURITY DIFFERENCES
In Figure 108 A - C, the ternary diagrams used for organofacies characterisations are shown.
They comprise the reservoir rock asphaltenes in comparison to their corresponding reservoir
rock samples.
Within the CLD (Figure 108 A), both high phenol asphaltenes from the Ile – and the Åre
Formation plot in the gas and condensate field. All remaining asphaltenes plot in the P-N-A
low wax oil field similar to their corresponding reservoir rock samples. They show a CLD
similar to the source rock from the Spekk Formation. The relative sulphur content is low for
all asphaltenes (Figure 108 C). Additionally, the aromaticity trend observed in the Ile
Formation as well as the higher gas amount in all asphaltene pyrolysates is reflected. In
general, the asphaltenes shows similar distributions and gradients as observed in the reservoir
rock samples.
In summary, compared to the corresponding reservoir rocks the asphaltene pyrolysates show
differences in the aromatic compounds (higher aromaticity, lower mono / diaromatic
hydrocarbon ratio) and present higher gas yields. In addition, the phenol amount is lower in
the asphaltenes, but can be used to indicate terrestrial organic matter input. For the Ile
Formation asphaltenes, similar trends were observed with increasing depth.
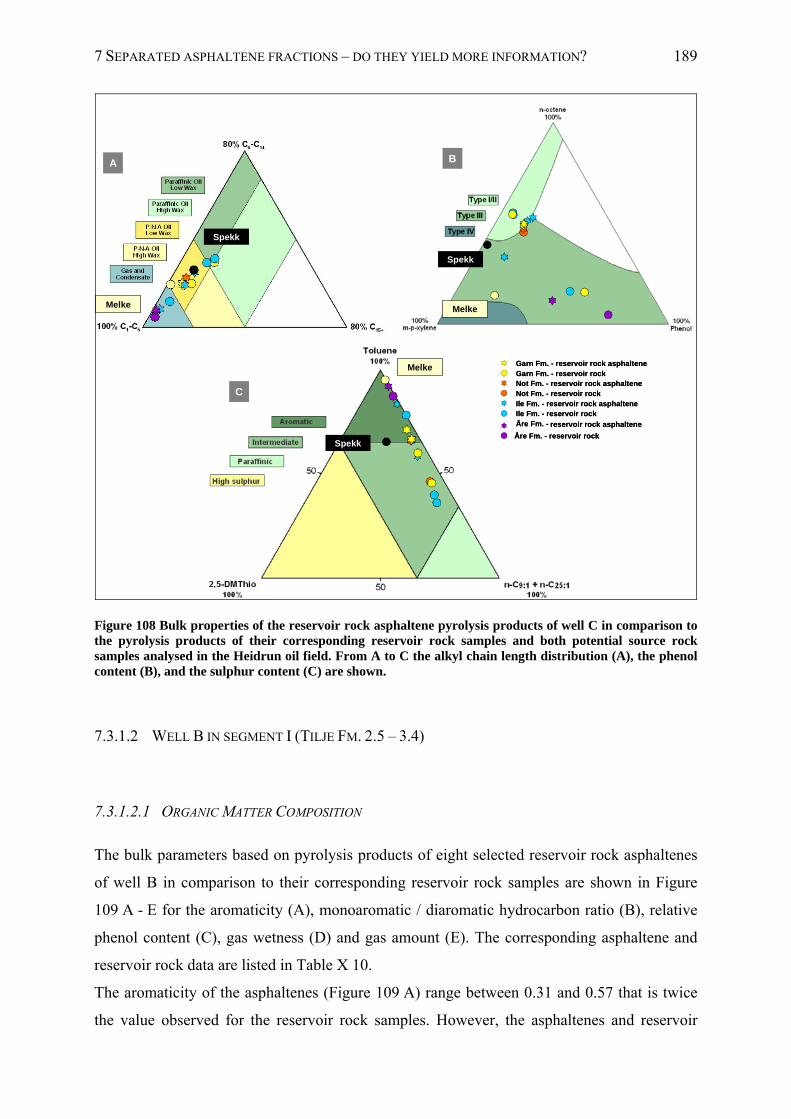
7 SEPARATED ASPHALTENE FRACTIONS – DO THEY YIELD MORE INFORMATION? 189
Spekk
Melke
Spekk
Melke
Spekk
Melke
A B
C
Garn Fm. - reservoir rock asphalteneGarn Fm. - reservoir rockNot Fm. - reservoir rock asphalteneNot Fm. - reservoir rockIle Fm. - reservoir rock asphalteneIle Fm. - reservoir rockÅre Fm. -
Åre Fm. - reservoir rock
reservoir rock asphaltene
Garn Fm. - reservoir rock asphalteneGarn Fm. - reservoir rockNot Fm. - reservoir rock asphalteneNot Fm. - reservoir rockIle Fm. - reservoir rock asphalteneIle Fm. - reservoir rockÅre Fm. -
Åre Fm. - reservoir rock
reservoir rock asphaltene
Figure 108 Bulk properties of the reservoir rock asphaltene pyrolysis products of well C in comparison to the pyrolysis products of their corresponding reservoir rock samples and both potential source rock samples analysed in the Heidrun oil field. From A to C the alkyl chain length distribution (A), the phenol content (B), and the sulphur content (C) are shown.
7.3.1.2 WELL B IN SEGMENT I (TILJE FM. 2.5 – 3.4)
7.3.1.2.1 ORGANIC MATTER COMPOSITION
The bulk parameters based on pyrolysis products of eight selected reservoir rock asphaltenes
of well B in comparison to their corresponding reservoir rock samples are shown in Figure
109 A - E for the aromaticity (A), monoaromatic / diaromatic hydrocarbon ratio (B), relative
phenol content (C), gas wetness (D) and gas amount (E). The corresponding asphaltene and
reservoir rock data are listed in Table X 10.
The aromaticity of the asphaltenes (Figure 109 A) range between 0.31 and 0.57 that is twice
the value observed for the reservoir rock samples. However, the asphaltenes and reservoir
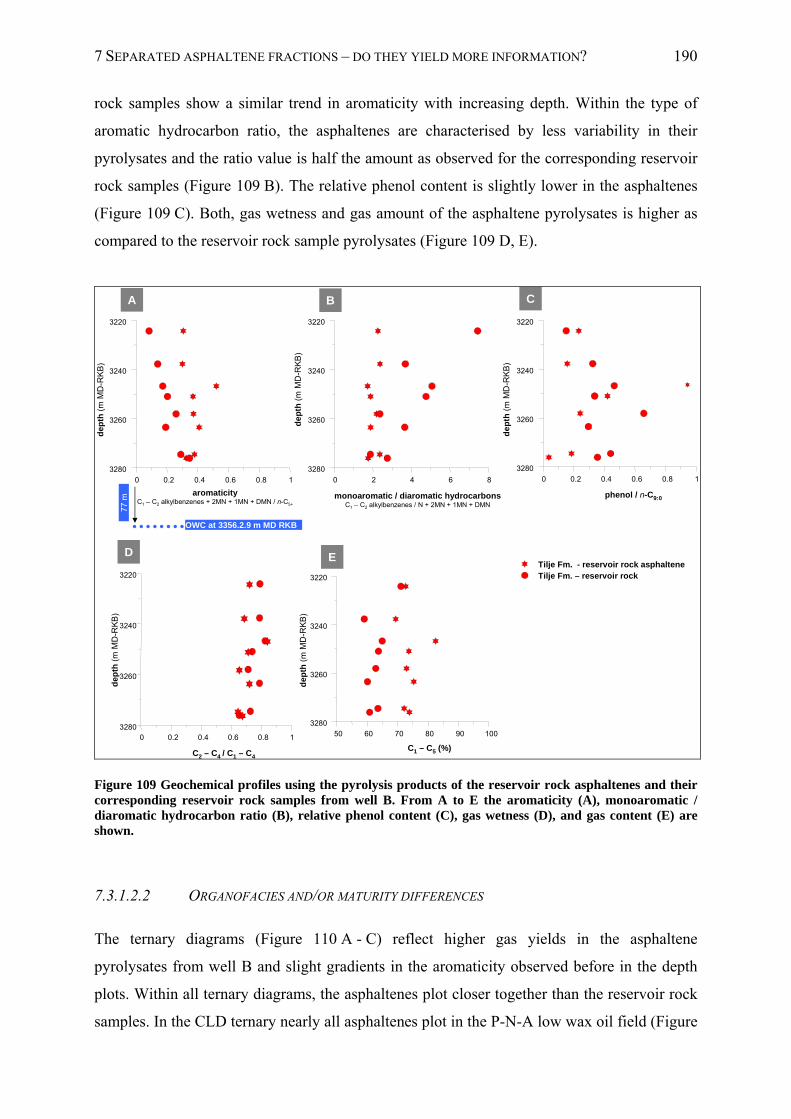
7 SEPARATED ASPHALTENE FRACTIONS – DO THEY YIELD MORE INFORMATION? 190
rock samples show a similar trend in aromaticity with increasing depth. Within the type of
aromatic hydrocarbon ratio, the asphaltenes are characterised by less variability in their
pyrolysates and the ratio value is half the amount as observed for the corresponding reservoir
rock samples (Figure 109 B). The relative phenol content is slightly lower in the asphaltenes
(Figure 109 C). Both, gas wetness and gas amount of the asphaltene pyrolysates is higher as
compared to the reservoir rock sample pyrolysates (Figure 109 D, E).
0 0.2 0.4 0.6 0.8 1
3280
3260
3240
3220
0 2 4 6 8
3280
3260
3240
3220
0 0.2 0.4 0.6 0.8 1
3280
3260
3240
3220
50 60 70 80 90 1003280
3260
3240
3220
aromaticityC1 – C2 alkylbenzenes + 2MN + 1MN + DMN / n-C5+
monoaromatic / diaromatic hydrocarbonsC1 – C2 alkylbenzenes / N + 2MN + 1MN + DMN
phenol / n-C9:0
dep
th (
m M
D-R
KB
)
de
pth
(m
MD
-RK
B)
de
pth
(m
MD
-RK
B)
dep
th (
m M
D-R
KB
)
C1 – C5 (%)
A B C
D E
OWC at 3356.2.9 m MD RKB
77 m
Tilje Fm. - reservoir rock asphalteneTilje Fm. – reservoir rock
0 0.2 0.4 0.6 0.8 13280
3260
3240
3220
dep
th (
m M
D-R
KB
)
C2 – C4 / C1 – C4
Figure 109 Geochemical profiles using the pyrolysis products of the reservoir rock asphaltenes and their corresponding reservoir rock samples from well B. From A to E the aromaticity (A), monoaromatic / diaromatic hydrocarbon ratio (B), relative phenol content (C), gas wetness (D), and gas content (E) are shown.
7.3.1.2.2 ORGANOFACIES AND/OR MATURITY DIFFERENCES
The ternary diagrams (Figure 110 A - C) reflect higher gas yields in the asphaltene
pyrolysates from well B and slight gradients in the aromaticity observed before in the depth
plots. Within all ternary diagrams, the asphaltenes plot closer together than the reservoir rock
samples. In the CLD ternary nearly all asphaltenes plot in the P-N-A low wax oil field (Figure
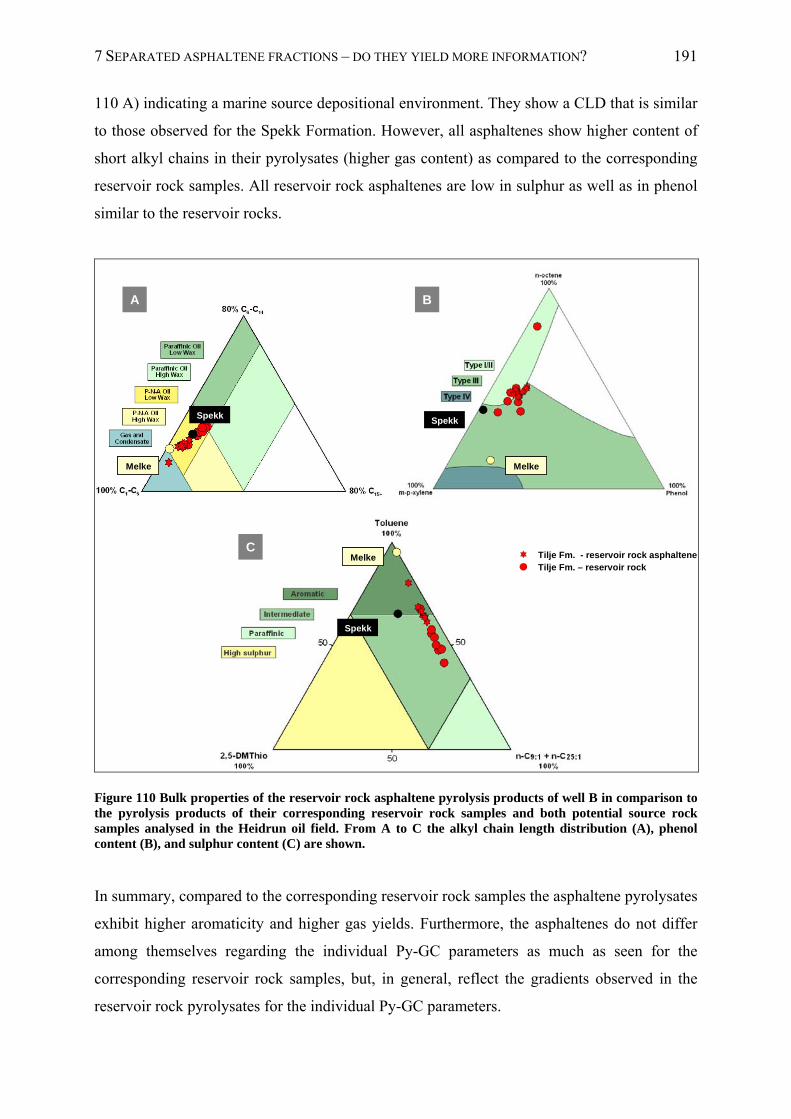
7 SEPARATED ASPHALTENE FRACTIONS – DO THEY YIELD MORE INFORMATION? 191
110 A) indicating a marine source depositional environment. They show a CLD that is similar
to those observed for the Spekk Formation. However, all asphaltenes show higher content of
short alkyl chains in their pyrolysates (higher gas content) as compared to the corresponding
reservoir rock samples. All reservoir rock asphaltenes are low in sulphur as well as in phenol
similar to the reservoir rocks.
Spekk
Melke
Spekk
Melke
Spekk
Melke Tilje Fm. - reservoir rock asphalteneTilje Fm. – reservoir rock
A B
C
Figure 110 Bulk properties of the reservoir rock asphaltene pyrolysis products of well B in comparison to the pyrolysis products of their corresponding reservoir rock samples and both potential source rock samples analysed in the Heidrun oil field. From A to C the alkyl chain length distribution (A), phenol content (B), and sulphur content (C) are shown.
In summary, compared to the corresponding reservoir rock samples the asphaltene pyrolysates
exhibit higher aromaticity and higher gas yields. Furthermore, the asphaltenes do not differ
among themselves regarding the individual Py-GC parameters as much as seen for the
corresponding reservoir rock samples, but, in general, reflect the gradients observed in the
reservoir rock pyrolysates for the individual Py-GC parameters.
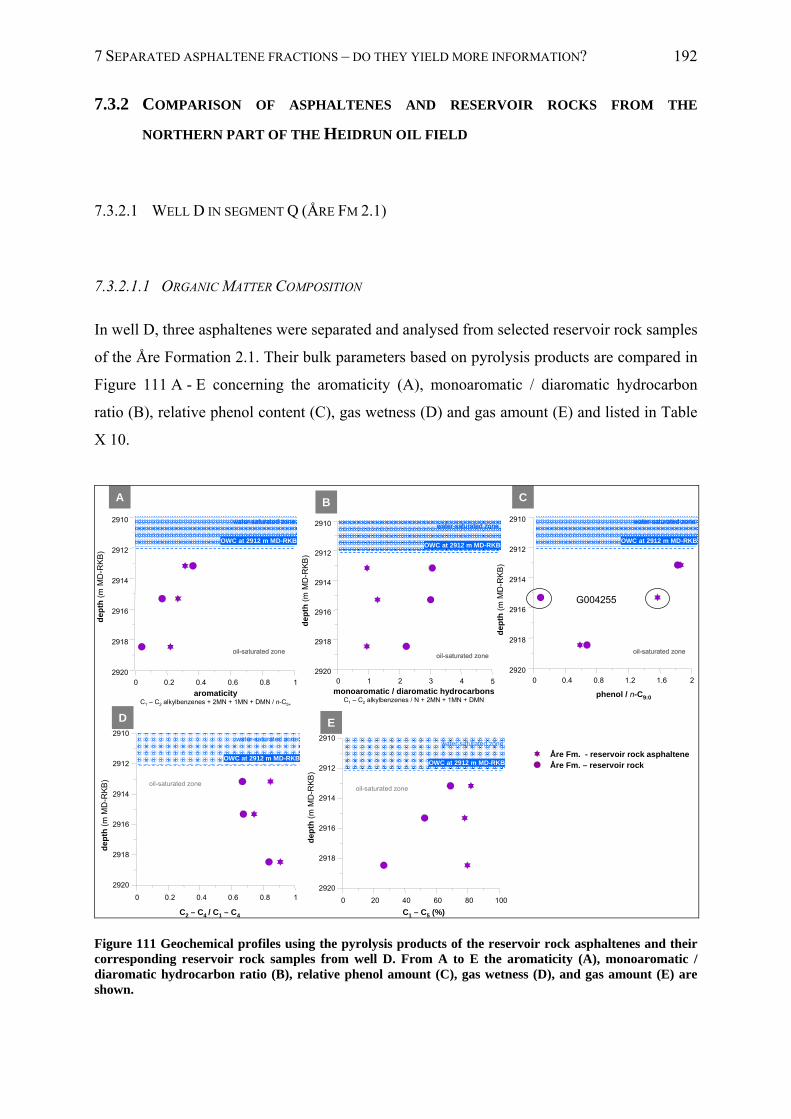
7 SEPARATED ASPHALTENE FRACTIONS – DO THEY YIELD MORE INFORMATION? 192
7.3.2 COMPARISON OF ASPHALTENES AND RESERVOIR ROCKS FROM THE
NORTHERN PART OF THE HEIDRUN OIL FIELD
7.3.2.1 WELL D IN SEGMENT Q (ÅRE FM 2.1)
7.3.2.1.1 ORGANIC MATTER COMPOSITION
In well D, three asphaltenes were separated and analysed from selected reservoir rock samples
of the Åre Formation 2.1. Their bulk parameters based on pyrolysis products are compared in
Figure 111 A - E concerning the aromaticity (A), monoaromatic / diaromatic hydrocarbon
ratio (B), relative phenol content (C), gas wetness (D) and gas amount (E) and listed in Table
X 10.
0 0.2 0.4 0.6 0.8 12920
2918
2916
2914
2912
2910
0 0.2 0.4 0.6 0.8 1
2920
2918
2916
2914
2912
2910
0 20 40 60 80 100
2920
2918
2916
2914
2912
2910
0 1 2 3 4 52920
2918
2916
2914
2912
2910
0 0.4 0.8 1.2 1.6 22920
2918
2916
2914
2912
2910
Åre Fm. - reservoir rock asphalteneÅre Fm. – reservoir rock
aromaticityC1 – C2 alkylbenzenes + 2MN + 1MN + DMN / n-C5+
monoaromatic / diaromatic hydrocarbonsC1 – C2 alkylbenzenes / N + 2MN + 1MN + DMN
phenol / n-C9:0
C1 – C5 (%)C2 – C4 / C1 – C4
dep
th (
m M
D-R
KB
)
de
pth
(m
MD
-RK
B)
de
pth
(m
MD
-RK
B)
de
pth
(m
MD
-RK
B)
de
pth
(m
MD
-RK
B)
water-saturated zone
OWC at 2912 m MD-RKB
oil-saturated zone
water-saturated zone
OWC at 2912 m MD-RKB
oil-saturated zone
water-saturated zone
OWC at 2912 m MD-RKB
oil-saturated zone
water-saturated zone
OWC at 2912 m MD-RKB
oil-saturated zone
water-saturated zone
OWC at 2912 m MD-RKB
oil-saturated zone
water-saturated zone
OWC at 2912 m MD-RKB
oil-saturated zone
water-saturated zone
OWC at 2912 m MD-RKB
oil-saturated zone
water-saturated zone
OWC at 2912 m MD-RKB
oil-saturated zone
A B C
D E
G004255
Figure 111 Geochemical profiles using the pyrolysis products of the reservoir rock asphaltenes and their corresponding reservoir rock samples from well D. From A to E the aromaticity (A), monoaromatic / diaromatic hydrocarbon ratio (B), relative phenol amount (C), gas wetness (D), and gas amount (E) are shown.
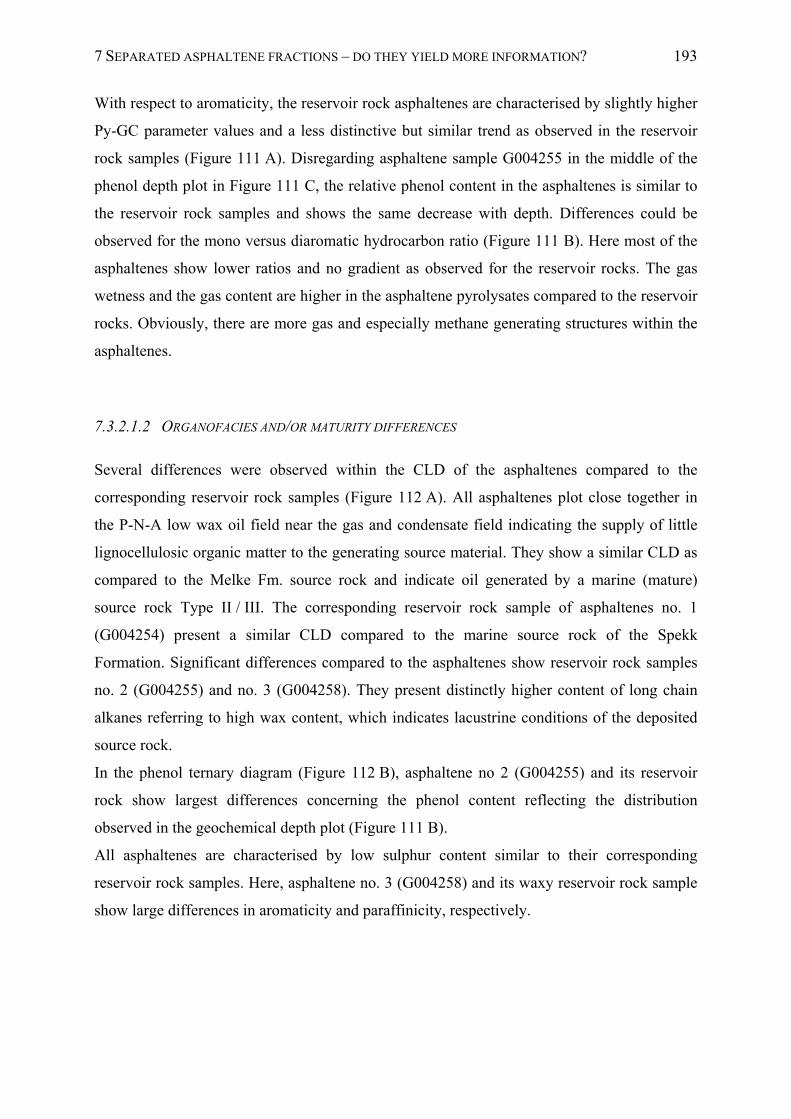
7 SEPARATED ASPHALTENE FRACTIONS – DO THEY YIELD MORE INFORMATION? 193
With respect to aromaticity, the reservoir rock asphaltenes are characterised by slightly higher
Py-GC parameter values and a less distinctive but similar trend as observed in the reservoir
rock samples (Figure 111 A). Disregarding asphaltene sample G004255 in the middle of the
phenol depth plot in Figure 111 C, the relative phenol content in the asphaltenes is similar to
the reservoir rock samples and shows the same decrease with depth. Differences could be
observed for the mono versus diaromatic hydrocarbon ratio (Figure 111 B). Here most of the
asphaltenes show lower ratios and no gradient as observed for the reservoir rocks. The gas
wetness and the gas content are higher in the asphaltene pyrolysates compared to the reservoir
rocks. Obviously, there are more gas and especially methane generating structures within the
asphaltenes.
7.3.2.1.2 ORGANOFACIES AND/OR MATURITY DIFFERENCES
Several differences were observed within the CLD of the asphaltenes compared to the
corresponding reservoir rock samples (Figure 112 A). All asphaltenes plot close together in
the P-N-A low wax oil field near the gas and condensate field indicating the supply of little
lignocellulosic organic matter to the generating source material. They show a similar CLD as
compared to the Melke Fm. source rock and indicate oil generated by a marine (mature)
source rock Type II / III. The corresponding reservoir rock sample of asphaltenes no. 1
(G004254) present a similar CLD compared to the marine source rock of the Spekk
Formation. Significant differences compared to the asphaltenes show reservoir rock samples
no. 2 (G004255) and no. 3 (G004258). They present distinctly higher content of long chain
alkanes referring to high wax content, which indicates lacustrine conditions of the deposited
source rock.
In the phenol ternary diagram (Figure 112 B), asphaltene no 2 (G004255) and its reservoir
rock show largest differences concerning the phenol content reflecting the distribution
observed in the geochemical depth plot (Figure 111 B).
All asphaltenes are characterised by low sulphur content similar to their corresponding
reservoir rock samples. Here, asphaltene no. 3 (G004258) and its waxy reservoir rock sample
show large differences in aromaticity and paraffinicity, respectively.
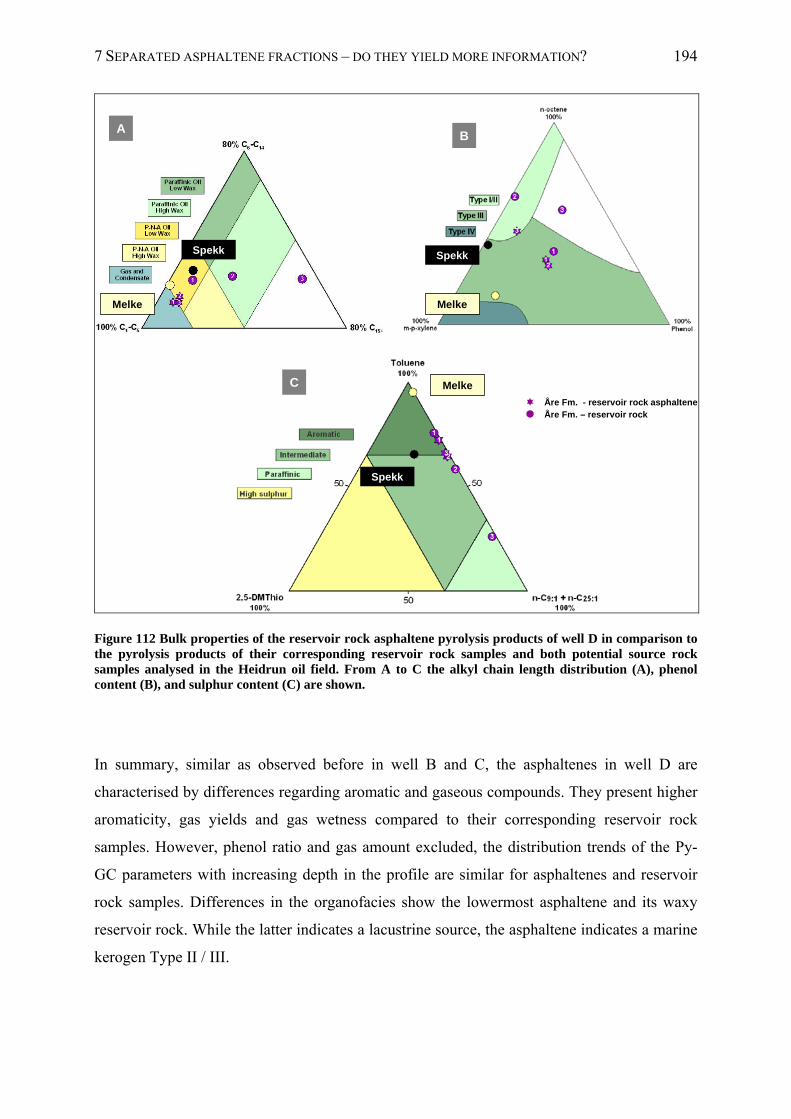
7 SEPARATED ASPHALTENE FRACTIONS – DO THEY YIELD MORE INFORMATION? 194
AB
C
Spekk
Melke
Spekk
Melke
Spekk
Melke
Åre Fm. - reservoir rock asphalteneÅre Fm. – reservoir rock
Figure 112 Bulk properties of the reservoir rock asphaltene pyrolysis products of well D in comparison to the pyrolysis products of their corresponding reservoir rock samples and both potential source rock samples analysed in the Heidrun oil field. From A to C the alkyl chain length distribution (A), phenol content (B), and sulphur content (C) are shown.
In summary, similar as observed before in well B and C, the asphaltenes in well D are
characterised by differences regarding aromatic and gaseous compounds. They present higher
aromaticity, gas yields and gas wetness compared to their corresponding reservoir rock
samples. However, phenol ratio and gas amount excluded, the distribution trends of the Py-
GC parameters with increasing depth in the profile are similar for asphaltenes and reservoir
rock samples. Differences in the organofacies show the lowermost asphaltene and its waxy
reservoir rock. While the latter indicates a lacustrine source, the asphaltene indicates a marine
kerogen Type II / III.
7 SEPARATED ASPHALTENE FRACTIONS – DO THEY YIELD MORE INFORMATION? 195
7.3.2.2 WELL E IN SEGMENT IN SEGMENT M (ÅRE FM 4.1)
7.3.2.2.1 ORGANIC MATTER COMPOSITION
In total, four reservoir rock samples were selected of well E (Åre Formation 4.1) for the
asphaltenes separation. The asphaltene and the corresponding reservoir rock bulk Py-GC
parameters are shown in Figure 113 A - E for the aromaticity (A), monoaromatic / diaromatic
hydrocarbon ratio (B), relative phenol content (C), gas wetness (D) and gas amount (E) and
listed in Table X 10.
0 0.4 0.8 1.2
3560
3555
3550
3545
3540
0 1 2 3 4 5
3560
3555
3550
3545
3540
0 2 4 6 14 16 18
3560
3555
3550
3545
3540
0 0.2 0.4 0.6 0.8 1
3560
3555
3550
3545
3540
50 60 70 80 90 100
3560
3555
3550
3545
3540
aromaticityC1 – C2 alkylbenzenes + 2MN + 1MN + DMN / n-C5+
monoaromatic / diaromatic hydrocarbonsC1 – C2 alkylbenzenes / N + 2MN + 1MN + DMN
phenol / n-C9:0
C1 – C5 (%)C2 – C4 / C1 – C4
dep
th (
m M
D-R
KB
)
dep
th (
m M
D-R
KB
)
dep
th (
m M
D-R
KB
)
dep
th (
m M
D-R
KB
)
dep
th (
m M
D-R
KB
)
A B C
D E
OWC at 3585 m MD-RKB
Åre Fm. - reservoir rock asphalteneÅre Fm. – reservoir rock
Figure 113 Geochemical profiles using the pyrolysis products of the reservoir rock asphaltenes and their corresponding reservoir rock samples of well E. From A to E the aromaticity (A), monoaromatic / diaromatic hydrocarbon ratio (B), relative phenol amount (C), gas wetness (D), and gas amount (E) are shown.
Both asphaltenes and reservoir rock samples show different distribution pattern concerning
the Py-GC parameters. The asphaltenes aromaticity is relatively uniform within the profile in
contrast to the corresponding reservoir rock samples presenting a decrease in aromaticity with
increasing depth (Figure 113 A). The asphaltenes have a relatively high phenol ratio as they
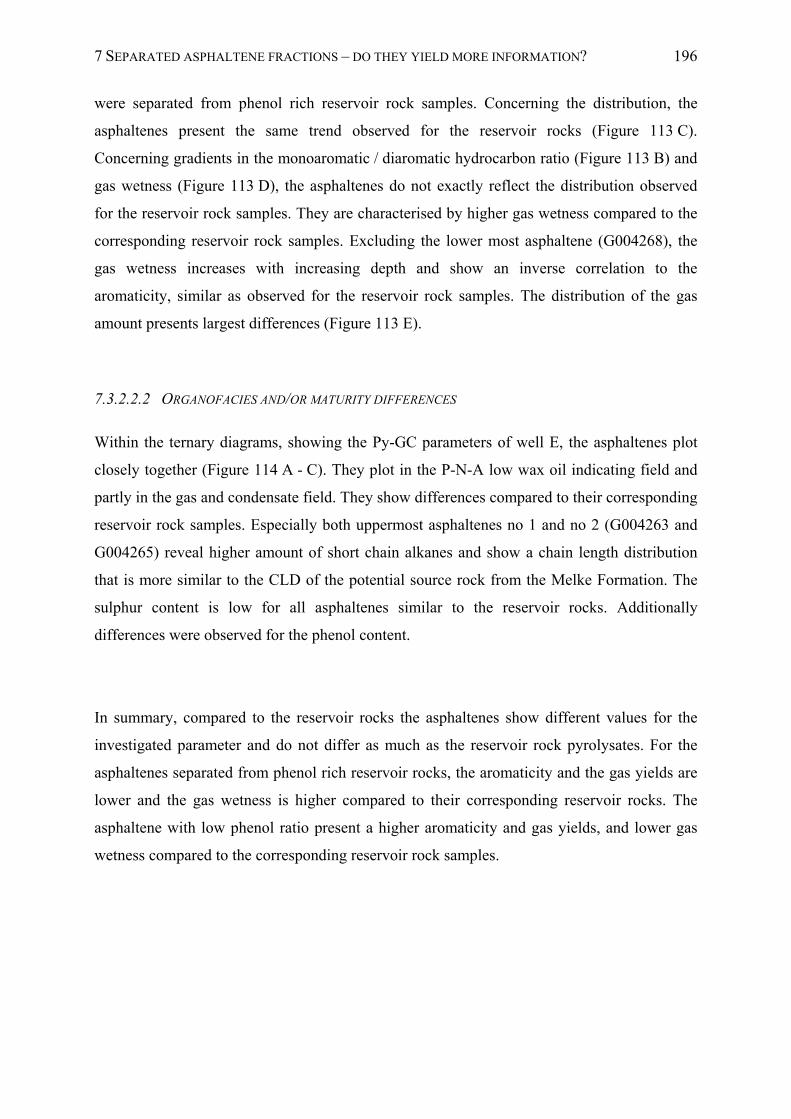
7 SEPARATED ASPHALTENE FRACTIONS – DO THEY YIELD MORE INFORMATION? 196
were separated from phenol rich reservoir rock samples. Concerning the distribution, the
asphaltenes present the same trend observed for the reservoir rocks (Figure 113 C).
Concerning gradients in the monoaromatic / diaromatic hydrocarbon ratio (Figure 113 B) and
gas wetness (Figure 113 D), the asphaltenes do not exactly reflect the distribution observed
for the reservoir rock samples. They are characterised by higher gas wetness compared to the
corresponding reservoir rock samples. Excluding the lower most asphaltene (G004268), the
gas wetness increases with increasing depth and show an inverse correlation to the
aromaticity, similar as observed for the reservoir rock samples. The distribution of the gas
amount presents largest differences (Figure 113 E).
7.3.2.2.2 ORGANOFACIES AND/OR MATURITY DIFFERENCES
Within the ternary diagrams, showing the Py-GC parameters of well E, the asphaltenes plot
closely together (Figure 114 A - C). They plot in the P-N-A low wax oil indicating field and
partly in the gas and condensate field. They show differences compared to their corresponding
reservoir rock samples. Especially both uppermost asphaltenes no 1 and no 2 (G004263 and
G004265) reveal higher amount of short chain alkanes and show a chain length distribution
that is more similar to the CLD of the potential source rock from the Melke Formation. The
sulphur content is low for all asphaltenes similar to the reservoir rocks. Additionally
differences were observed for the phenol content.
In summary, compared to the reservoir rocks the asphaltenes show different values for the
investigated parameter and do not differ as much as the reservoir rock pyrolysates. For the
asphaltenes separated from phenol rich reservoir rocks, the aromaticity and the gas yields are
lower and the gas wetness is higher compared to their corresponding reservoir rocks. The
asphaltene with low phenol ratio present a higher aromaticity and gas yields, and lower gas
wetness compared to the corresponding reservoir rock samples.
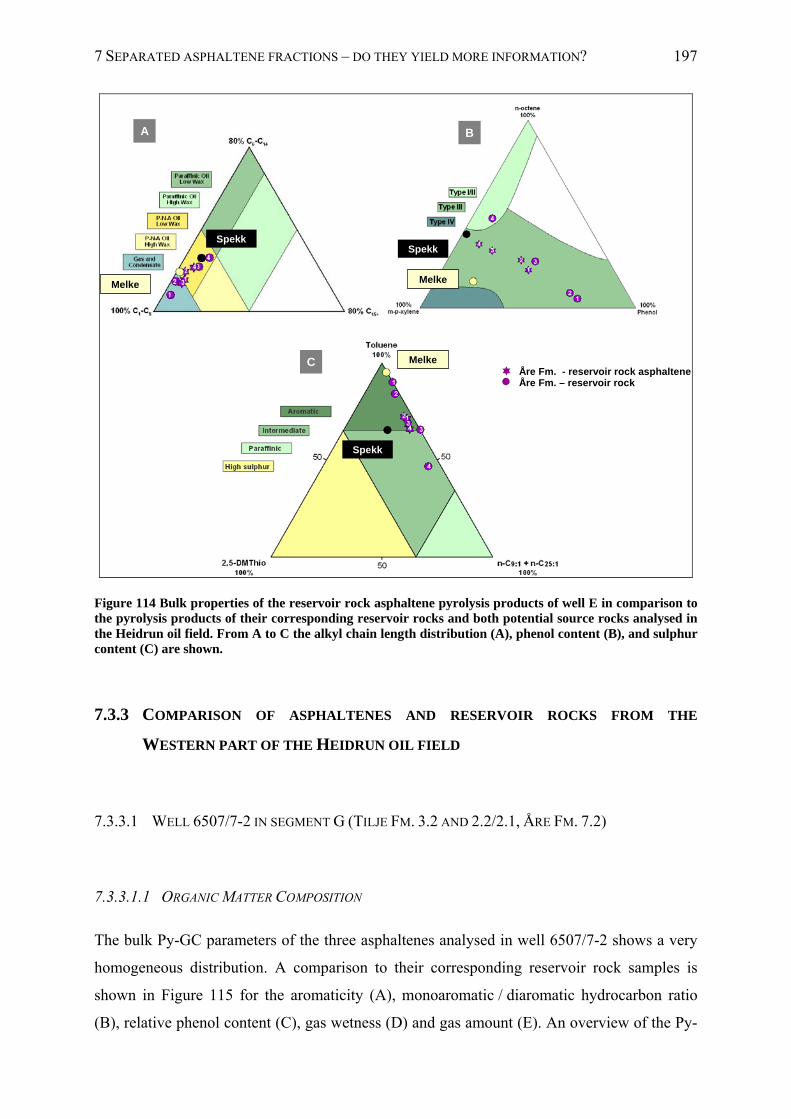
7 SEPARATED ASPHALTENE FRACTIONS – DO THEY YIELD MORE INFORMATION? 197
Åre Fm. - reservoir rock asphalteneÅre Fm. – reservoir rock
B
C
Spekk
Melke
Spekk
Melke
A
Melke
Spekk
Figure 114 Bulk properties of the reservoir rock asphaltene pyrolysis products of well E in comparison to the pyrolysis products of their corresponding reservoir rocks and both potential source rocks analysed in the Heidrun oil field. From A to C the alkyl chain length distribution (A), phenol content (B), and sulphur content (C) are shown.
7.3.3 COMPARISON OF ASPHALTENES AND RESERVOIR ROCKS FROM THE
WESTERN PART OF THE HEIDRUN OIL FIELD
7.3.3.1 WELL 6507/7-2 IN SEGMENT G (TILJE FM. 3.2 AND 2.2/2.1, ÅRE FM. 7.2)
7.3.3.1.1 ORGANIC MATTER COMPOSITION
The bulk Py-GC parameters of the three asphaltenes analysed in well 6507/7-2 shows a very
homogeneous distribution. A comparison to their corresponding reservoir rock samples is
shown in Figure 115 for the aromaticity (A), monoaromatic / diaromatic hydrocarbon ratio
(B), relative phenol content (C), gas wetness (D) and gas amount (E). An overview of the Py-
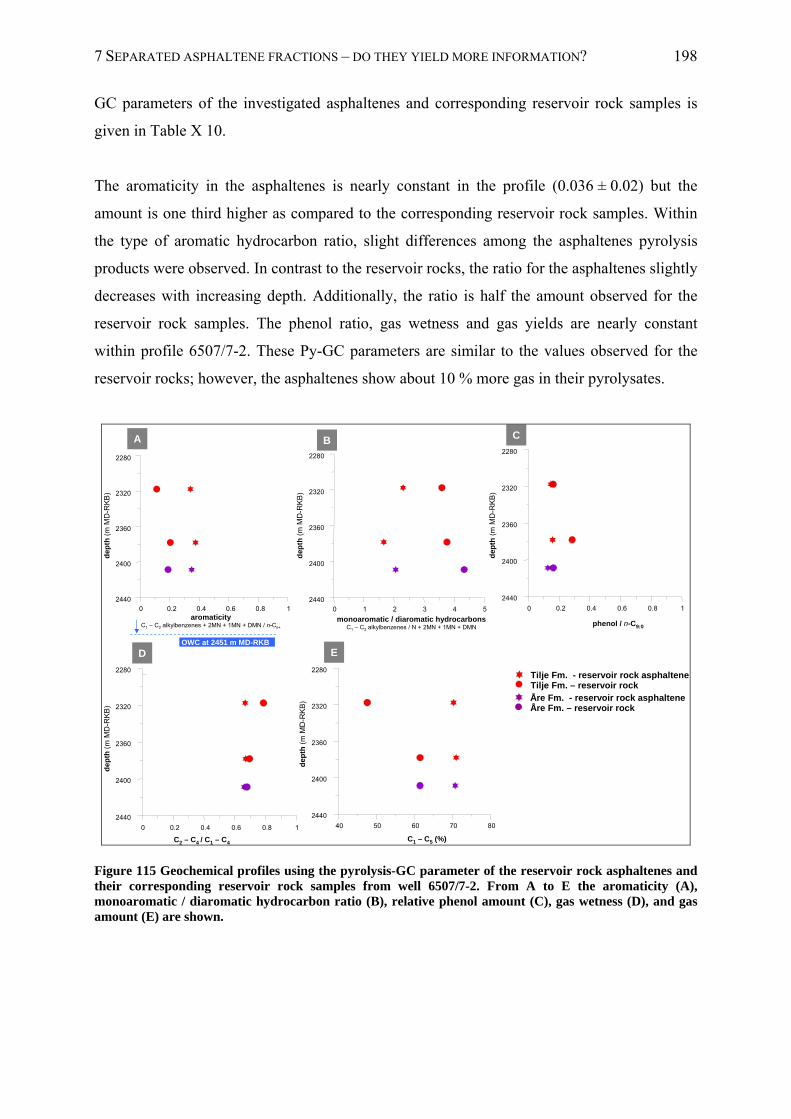
7 SEPARATED ASPHALTENE FRACTIONS – DO THEY YIELD MORE INFORMATION? 198
GC parameters of the investigated asphaltenes and corresponding reservoir rock samples is
given in Table X 10.
The aromaticity in the asphaltenes is nearly constant in the profile (0.036 ± 0.02) but the
amount is one third higher as compared to the corresponding reservoir rock samples. Within
the type of aromatic hydrocarbon ratio, slight differences among the asphaltenes pyrolysis
products were observed. In contrast to the reservoir rocks, the ratio for the asphaltenes slightly
decreases with increasing depth. Additionally, the ratio is half the amount observed for the
reservoir rock samples. The phenol ratio, gas wetness and gas yields are nearly constant
within profile 6507/7-2. These Py-GC parameters are similar to the values observed for the
reservoir rocks; however, the asphaltenes show about 10 % more gas in their pyrolysates.
0 0.2 0.4 0.6 0.8 12440
2400
2360
2320
2280
0 1 2 3 4 5
2440
2400
2360
2320
2280
0 0.2 0.4 0.6 0.8 1
2440
2400
2360
2320
2280
0 0.2 0.4 0.6 0.8 1
2440
2400
2360
2320
2280
40 50 60 70 80
2440
2400
2360
2320
2280
dep
th (
m M
D-R
KB
)
dep
th (
m M
D-R
KB
)
dep
th (
m M
D-R
KB
)
de
pth
(m
MD
-RK
B)
dep
th (
m M
D-R
KB
)
aromaticityC1 – C2 alkylbenzenes + 2MN + 1MN + DMN / n-C5+
monoaromatic / diaromatic hydrocarbonsC1 – C2 alkylbenzenes / N + 2MN + 1MN + DMN phenol / n-C9:0
C1 – C5 (%)C2 – C4 / C1 – C4
OWC at 2451 m MD-RKB
A B C
D E
Tilje Fm. - reservoir rock asphalteneTilje Fm. – reservoir rockÅre Fm. - reservoir rock asphalteneÅre Fm. – reservoir rock
Figure 115 Geochemical profiles using the pyrolysis-GC parameter of the reservoir rock asphaltenes and their corresponding reservoir rock samples from well 6507/7-2. From A to E the aromaticity (A), monoaromatic / diaromatic hydrocarbon ratio (B), relative phenol amount (C), gas wetness (D), and gas amount (E) are shown.
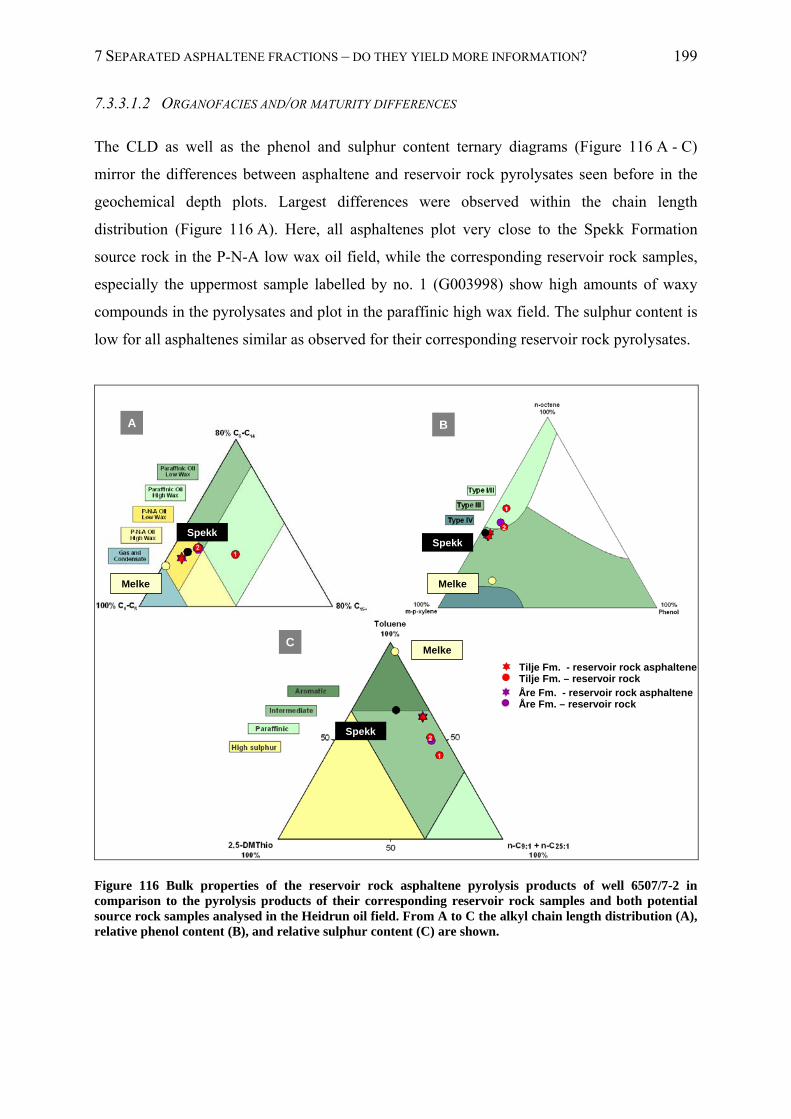
7 SEPARATED ASPHALTENE FRACTIONS – DO THEY YIELD MORE INFORMATION? 199
7.3.3.1.2 ORGANOFACIES AND/OR MATURITY DIFFERENCES
The CLD as well as the phenol and sulphur content ternary diagrams (Figure 116 A - C)
mirror the differences between asphaltene and reservoir rock pyrolysates seen before in the
geochemical depth plots. Largest differences were observed within the chain length
distribution (Figure 116 A). Here, all asphaltenes plot very close to the Spekk Formation
source rock in the P-N-A low wax oil field, while the corresponding reservoir rock samples,
especially the uppermost sample labelled by no. 1 (G003998) show high amounts of waxy
compounds in the pyrolysates and plot in the paraffinic high wax field. The sulphur content is
low for all asphaltenes similar as observed for their corresponding reservoir rock pyrolysates.
Tilje Fm. - reservoir rock asphalteneTilje Fm. – reservoir rock
B
C
Spekk
Melke
Spekk
Melke
A
Melke
Spekk
Åre Fm. - reservoir rock asphalteneÅre Fm. – reservoir rock
Figure 116 Bulk properties of the reservoir rock asphaltene pyrolysis products of well 6507/7-2 in comparison to the pyrolysis products of their corresponding reservoir rock samples and both potential source rock samples analysed in the Heidrun oil field. From A to C the alkyl chain length distribution (A), relative phenol content (B), and relative sulphur content (C) are shown.
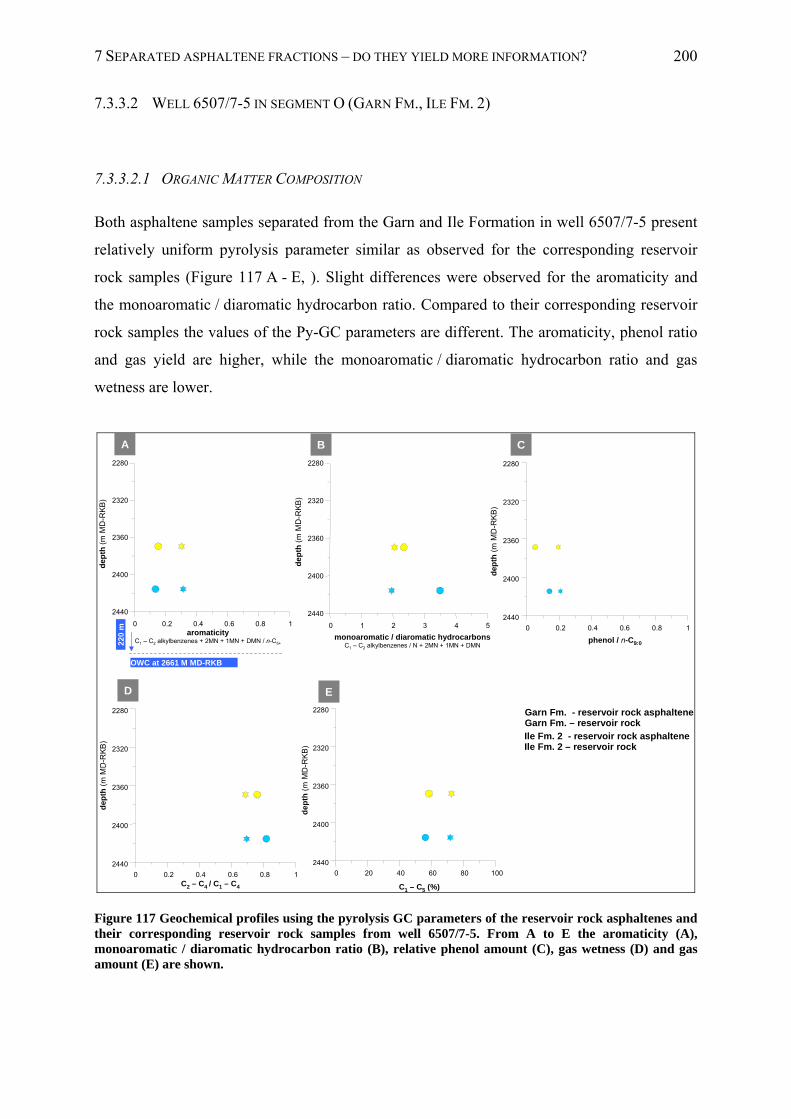
7 SEPARATED ASPHALTENE FRACTIONS – DO THEY YIELD MORE INFORMATION? 200
7.3.3.2 WELL 6507/7-5 IN SEGMENT O (GARN FM., ILE FM. 2)
7.3.3.2.1 ORGANIC MATTER COMPOSITION
Both asphaltene samples separated from the Garn and Ile Formation in well 6507/7-5 present
relatively uniform pyrolysis parameter similar as observed for the corresponding reservoir
rock samples (Figure 117 A - E, ). Slight differences were observed for the aromaticity and
the monoaromatic / diaromatic hydrocarbon ratio. Compared to their corresponding reservoir
rock samples the values of the Py-GC parameters are different. The aromaticity, phenol ratio
and gas yield are higher, while the monoaromatic / diaromatic hydrocarbon ratio and gas
wetness are lower.
0 0.2 0.4 0.6 0.8 1
2440
2400
2360
2320
2280
0 1 2 3 4 5
2440
2400
2360
2320
2280
aromaticityC1 – C2 alkylbenzenes + 2MN + 1MN + DMN / n-C5+
monoaromatic / diaromatic hydrocarbonsC1 – C2 alkylbenzenes / N + 2MN + 1MN + DMN
C1 – C5 (%)C2 – C4 / C1 – C4
A B C
D E
dep
th (
m M
D-R
KB
)
dep
th (
m M
D-R
KB
)d
epth
(m
MD
-RK
B)
dep
th (
m M
D-R
KB
)
OWC at 2661 M MD-RKB
22
0 m
Garn Fm. - reservoir rock asphalteneGarn Fm. – reservoir rockIle Fm. 2 - reservoir rock asphalteneIle Fm. 2 – reservoir rock
0 0.2 0.4 0.6 0.8 1
2440
2400
2360
2320
2280
phenol / n-C9:0
dep
th (
m M
D-R
KB
)
0 20 40 60 80 100
2440
2400
2360
2320
2280
0 0.2 0.4 0.6 0.8 1
2440
2400
2360
2320
2280
Figure 117 Geochemical profiles using the pyrolysis GC parameters of the reservoir rock asphaltenes and their corresponding reservoir rock samples from well 6507/7-5. From A to E the aromaticity (A), monoaromatic / diaromatic hydrocarbon ratio (B), relative phenol amount (C), gas wetness (D) and gas amount (E) are shown.
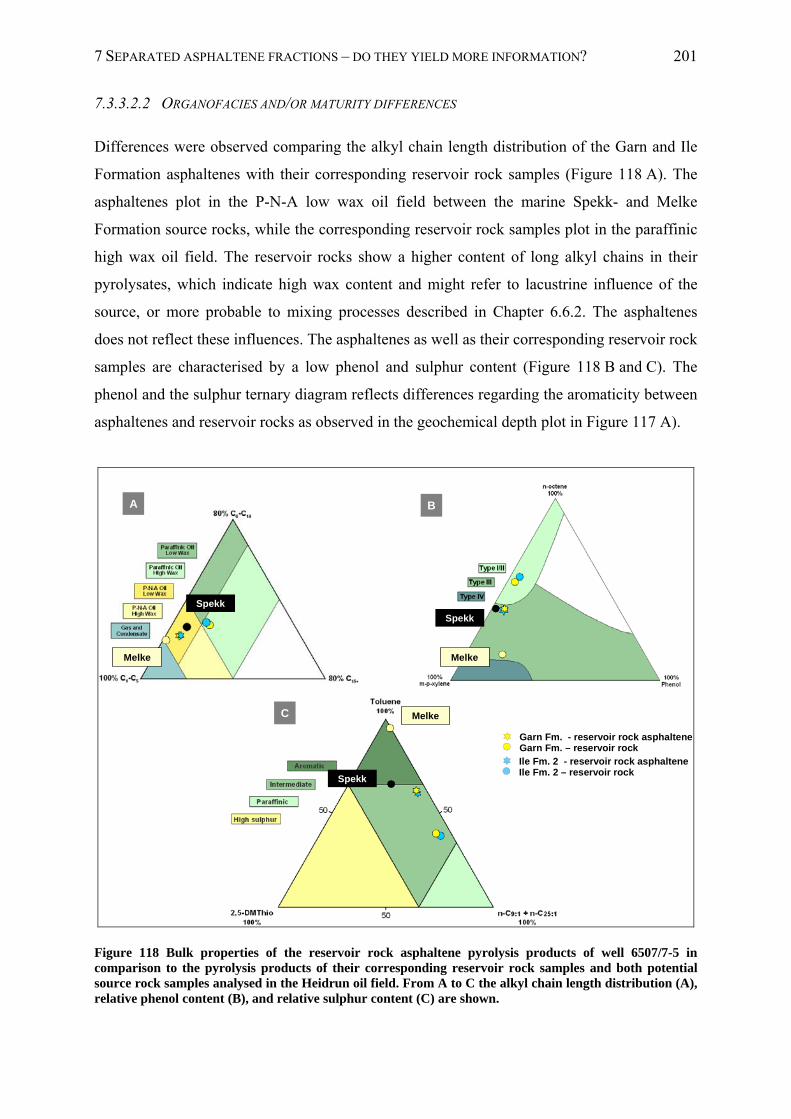
7 SEPARATED ASPHALTENE FRACTIONS – DO THEY YIELD MORE INFORMATION? 201
7.3.3.2.2 ORGANOFACIES AND/OR MATURITY DIFFERENCES
Differences were observed comparing the alkyl chain length distribution of the Garn and Ile
Formation asphaltenes with their corresponding reservoir rock samples (Figure 118 A). The
asphaltenes plot in the P-N-A low wax oil field between the marine Spekk- and Melke
Formation source rocks, while the corresponding reservoir rock samples plot in the paraffinic
high wax oil field. The reservoir rocks show a higher content of long alkyl chains in their
pyrolysates, which indicate high wax content and might refer to lacustrine influence of the
source, or more probable to mixing processes described in Chapter 6.6.2. The asphaltenes
does not reflect these influences. The asphaltenes as well as their corresponding reservoir rock
samples are characterised by a low phenol and sulphur content (Figure 118 B and C). The
phenol and the sulphur ternary diagram reflects differences regarding the aromaticity between
asphaltenes and reservoir rocks as observed in the geochemical depth plot in Figure 117 A).
B
C
Spekk
Melke
Spekk
Melke
A
Melke
Spekk
Garn Fm. - reservoir rock asphalteneGarn Fm. – reservoir rockIle Fm. 2 - reservoir rock asphalteneIle Fm. 2 – reservoir rock
Figure 118 Bulk properties of the reservoir rock asphaltene pyrolysis products of well 6507/7-5 in comparison to the pyrolysis products of their corresponding reservoir rock samples and both potential source rock samples analysed in the Heidrun oil field. From A to C the alkyl chain length distribution (A), relative phenol content (B), and relative sulphur content (C) are shown.
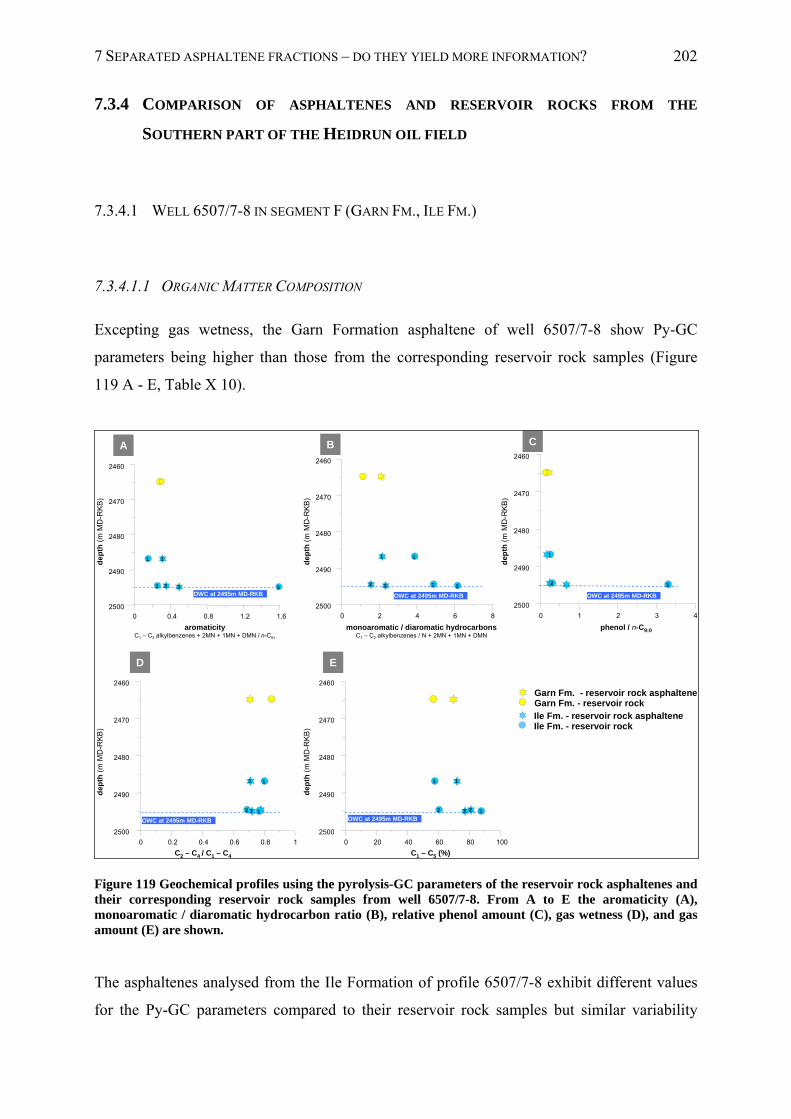
7 SEPARATED ASPHALTENE FRACTIONS – DO THEY YIELD MORE INFORMATION? 202
7.3.4 COMPARISON OF ASPHALTENES AND RESERVOIR ROCKS FROM THE
SOUTHERN PART OF THE HEIDRUN OIL FIELD
7.3.4.1 WELL 6507/7-8 IN SEGMENT F (GARN FM., ILE FM.)
7.3.4.1.1 ORGANIC MATTER COMPOSITION
Excepting gas wetness, the Garn Formation asphaltene of well 6507/7-8 show Py-GC
parameters being higher than those from the corresponding reservoir rock samples (Figure
119 A - E, Table X 10).
0 0.4 0.8 1.2 1.62500
2490
2480
2470
2460
1
2 3
1
2 3
0 2 4 6 8
2500
2490
2480
2470
2460
1
2 3
1
2 3
0 1 2 3 4
2500
2490
2480
2470
2460
1
2 3
0 0.2 0.4 0.6 0.8 1
2500
2490
2480
2470
2460
1
23
1
2 3
0 20 40 60 80 100
2500
2490
2480
2470
2460
1
23
1
2 3
Garn Fm. - reservoir rock asphalteneGarn Fm. - reservoir rockIle Fm. - reservoir rock asphalteneIle Fm. - reservoir rock
A B C
D E
aromaticityC1 – C2 alkylbenzenes + 2MN + 1MN + DMN / n-C5+
monoaromatic / diaromatic hydrocarbonsC1 – C2 alkylbenzenes / N + 2MN + 1MN + DMN
phenol / n-C9:0
C1 – C5 (%)C2 – C4 / C1 – C4
dep
th (
m M
D-R
KB
)
dep
th (
m M
D-R
KB
)
dep
th (
m M
D-R
KB
)
dep
th (
m M
D-R
KB
)
dep
th (
m M
D-R
KB
)
OWC at 2495m MD-RKB OWC at 2495m MD-RKB OWC at 2495m MD-RKB
OWC at 2495m MD-RKB OWC at 2495m MD-RKB
Figure 119 Geochemical profiles using the pyrolysis-GC parameters of the reservoir rock asphaltenes and their corresponding reservoir rock samples from well 6507/7-8. From A to E the aromaticity (A), monoaromatic / diaromatic hydrocarbon ratio (B), relative phenol amount (C), gas wetness (D), and gas amount (E) are shown.
The asphaltenes analysed from the Ile Formation of profile 6507/7-8 exhibit different values
for the Py-GC parameters compared to their reservoir rock samples but similar variability
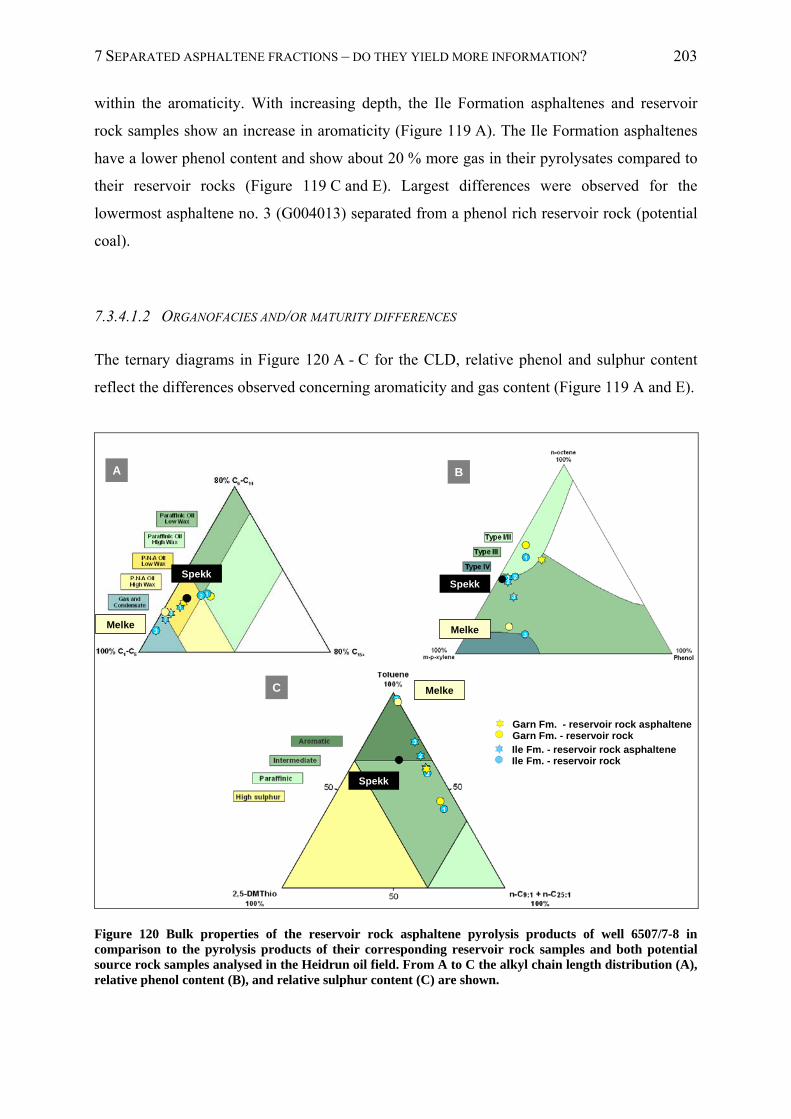
7 SEPARATED ASPHALTENE FRACTIONS – DO THEY YIELD MORE INFORMATION? 203
within the aromaticity. With increasing depth, the Ile Formation asphaltenes and reservoir
rock samples show an increase in aromaticity (Figure 119 A). The Ile Formation asphaltenes
have a lower phenol content and show about 20 % more gas in their pyrolysates compared to
their reservoir rocks (Figure 119 C and E). Largest differences were observed for the
lowermost asphaltene no. 3 (G004013) separated from a phenol rich reservoir rock (potential
coal).
7.3.4.1.2 ORGANOFACIES AND/OR MATURITY DIFFERENCES
The ternary diagrams in Figure 120 A - C for the CLD, relative phenol and sulphur content
reflect the differences observed concerning aromaticity and gas content (Figure 119 A and E).
B
C
Spekk
Melke
Spekk
Melke
A
Melke
Spekk
Garn Fm. - reservoir rock asphalteneGarn Fm. - reservoir rockIle Fm. - reservoir rock asphalteneIle Fm. - reservoir rock
Figure 120 Bulk properties of the reservoir rock asphaltene pyrolysis products of well 6507/7-8 in comparison to the pyrolysis products of their corresponding reservoir rock samples and both potential source rock samples analysed in the Heidrun oil field. From A to C the alkyl chain length distribution (A), relative phenol content (B), and relative sulphur content (C) are shown.
7 SEPARATED ASPHALTENE FRACTIONS – DO THEY YIELD MORE INFORMATION? 204
Within the CLD ternary diagram, the Garn- and the uppermost Ile Formation asphaltenes
no. 1 (G004010) plot in the P-N-A low wax oil field close to the Spekk Formation source rock
shale. The two lower Ile Formation asphaltenes no. 2 and no. 3 (G004012 and G004013)
present slightly higher content of short chain alkanes in their pyrolysates and plot close to the
Melke Formation source rock sample. Excluding the reservoir rock sample no. 3 (G004013),
the reservoir rocks reveal lower amounts regarding short chain alkanes in their pyrolysates
than their asphaltenes. All asphaltene and reservoir rock samples are low in sulphur.
7.3.5 SUMMARY
Compared to the reservoir rock samples the corresponding asphaltenes commonly reflect the
distribution pattern and gradients observed, but often show different values for the Py-GC
parameters. The asphaltenes show differences in the aromatic and gas compounds. Generally,
they have a higher aromaticity, lower monoaromatic / diaromatic hydrocarbon ratio, lower gas
wetness and a gas yield that is up to 20 % higher as compared to the corresponding reservoir
rock samples.
Differences were observed for asphaltenes separated from phenol rich reservoir rocks. These
asphaltenes are characterised by higher gas wetness and lower gas content compared to their
corresponding reservoir rock samples.
In addition, differences were observed using the organofacies characterising parameters.
Within the CLD ternary diagram, most asphaltenes present larger quantities of short chain
alkanes in their pyrolysates than their corresponding reservoir rocks. Excluding phenol rich
asphaltenes plotting in the gas and condensate field, most of the asphaltenes plot in the P-N-A
low wax oil field and partly in the gas condensate field between both potential source rocks
from the Spekk- and Melke Formation. This is in contrast to the results obtained from the
reservoir rock pyrolysates, where most of the samples present higher quantities of medium
and long chain alkanes in their pyrolysates. Most of the reservoir rock samples reveal a CLD
that is more similar to the Spekk Formation source rock.
Based on reservoir rock pyrolysis, indications for differences in the organofacies of the source
were observed in individual reservoir rock samples from the Garn- and Ile Formation (well
6507/7-2, 6507/7-3, 6507/7-4) from the western part and in reservoir rock samples from the
Åre Formation (well D and 6507/8-4) from the northern part of the Heidrun oil field. Within
these formations, larger quantities of waxy compounds were found which refer to a lacustrine

7 SEPARATED ASPHALTENE FRACTIONS – DO THEY YIELD MORE INFORMATION? 205
influence of the generative source rock or to mixing of oil with different level of
biodegradation. Thus, in both the western and especially the northern part of the Heidrun oil
field indications to different oil charges were found. In contrast, in the reservoir rock
asphaltene pyrolysates no indications for differences in the organofacies are found.
These results indicate that whole reservoir rock analysis provides the most effective means of
recognising compositional differences in the macromolecular fraction within reservoirs
because of the high sampling densities required. Asphaltene pyrolysates yield similar
information on source and maturity, but can only be applied at low resolution because of the
time required for the precipitation procedure.
8 COMPOSITIONAL KINETIC MODELS 206
8 COMPOSITIONAL KINETIC MODELS
8.1 INTRODUCTION
It is well established that kinetic parameters from asphaltenes can be used as proxies for the
kinetics of the original source rock kerogen (di Primio et al., 2000; Keym & Dieckmann,
2006; Lehne & Dieckmann, 2007). To date bulk or compositional kinetic analysis has been
applied to produced oil and tar mat asphaltenes in order to determine source rock
characteristics of active kitchen areas (di Primio et al. 2000; Keym & Dieckmann, 2006;
Lehne & Dieckmann, 2007), but never within the context of source profiling or the
delineation of reservoir heterogeneities. Here especially reservoir rock asphaltenes have a
great potential.
The basic principle of using asphaltenes from reservoired oils or reservoir rock extracts for
source rock characterisation is the fact that these highly functionalized complex molecules
bear close structural similarities to their parent kerogen, and that they are assumed to be not
affected by low temperature alteration processes such as biodegradation or water washing as
discussed before in detail (cf. Chapter 1.2). Asphaltenes contain the compositional
information of the first oil migrated into the reservoir, i.e. they include organofacies and
maturity fingerprints of the generating source. Thus, they are useful markers for source rock
characterisation as well as for correlation purposes. Obtaining such information from the
reservoir is important, because mature source rocks are usually at great depth and thus cannot
be drilled, and oil accumulations in petroleum reservoirs are often situated in structural highs
where potential source rocks are immature and might be of a different organofacies.
The application of compositional kinetics on asphaltenes is potentially useful for petroleum
reservoir characterisation especially when the oil has been altered or biodegraded. Petroleum
entering the reservoir carries asphaltenes, which contain fingerprints of the original oil
composition and molecular structure of these individual oil charges. In combination with the
present day state of alteration, asphaltenes could thus be used as markers for alteration and
migration processes.
Within compartmentalized reservoirs, characterised by a complex charge and alteration
history, the delineation of vertical and horizontal heterogeneities presents a particularly
8 COMPOSITIONAL KINETIC MODELS 207
difficult challenge, because subtle in-situ variabilities have to be recognised. Compared to
produced-oil samples, presenting the average product of a thick reservoir interval, reservoir
rock samples are useful to identify small scale variations within the reservoir, as they can be
sampled at high resolution. Thus, reservoir rock asphaltenes can potentially be used to
reconstruct the gross compositional characteristics of the original unaltered petroleum charge
at any place within the individual compartments of a reservoir.
The PhaseKinetic approach, which is a well established method using immature source rock
samples for the prediction of petroleum compositions generated and expelled (di Primio and
Horsfield, 2006) was applied in this study. As kerogen abundance and composition is
relatable to depositional settings, kerogen characteristics control the petroleum type and hence
the petroleum composition generated, which in turn directly controls the physical behaviour
of expelled fluids concerning pressure and temperature dependant changes in phase behaviour
and fluid physical properties during secondary migration. With the use of different pyrolysis
techniques, it is possible to reconstruct the composition of the oil, which originally was or
would be generated. The PhaseKinetic approach uses a combination of bulk kinetic
compositional information for characterisation of the reactions leading from kerogen to
petroleum and open and closed system pyrolysis techniques for determination of fluid
compositions. While liquid compositional evolution is determined directly from closed
system pyrolysis results, gas compositions are corrected empirically and finally total fluid
corrected compositions integrated with the bulk kinetic results into a compositional kinetic
model. The result is a model which allows the prediction of hydrocarbon physical properties
such as the GOR (gas : oil ratio), Psat (saturation pressure) and bo (formation volume factor).
The calculation of petroleum phase behaviour under the subsurface conditions of hydrocarbon
migration and entrapment is possible using these models in combination with modern basin
modelling software, however, no modelling is presented within this thesis.
In order to investigate whether PhaseKinetic parameters calculated on kerogen and
asphaltenes are comparable, the approach was first tested on selected source rock kerogens,
source rock asphaltenes and reservoir rock asphaltenes from two well-studied areas in
Western Canada and the Central Graben. Kerogens of extracted source rocks were analysed
and their structural characteristics and PhaseKinetic parameters were compared to these
obtained from the source rock asphaltenes and reservoir asphaltenes of genetically related
fluids. The main results discussed in the following clearly show that the compositional
8 COMPOSITIONAL KINETIC MODELS 208
information obtained from reservoir asphaltenes are remarkably similar to that obtained from
the source rock kerogen at 50 % transformation ratio (TR), and similar bulk fluid properties
could be predicted. In contrast to that, source rock asphaltenes present different compositional
information at 50 % TR and different bulk property predictions compared to source rock
kerogen and reservoir asphaltenes.
Based on these initial test results the PhaseKinetic approach was subsequently applied to the
main study area, the Heidrun oilfield, in order to compare and correlate the heterogeneities
observed in the residual reservoir rock petroleum composition (cf. Chapter 6.2 - 6.6) with
compositional characteristics of an potential source rock, and to improve the understanding of
post-filling alteration processes, which have taken place in the oilfield as well as of processes
leading to compartmentalisation.
8.2 STUDY AREAS - GEOLOGICAL BACKGROUND AND SAMPLES
8.2.1 TEST I - DUVERNAY FORMATION
The first study area selected to test the PhaseKinetic approach, was the Upper Devonian
Duvernay Formation located in the Western Canadian Sedimentary Basin (WCSB). It
comprises primarily Type II kerogen and can be regarded as one of the most prolific marine
source rocks in this basin (Stoaks & Creaney, 1984; Creaney & Allan, 1990; Chow et al.,
1995). The Duvernay Formation was chosen, as it is a homogeneous marine source rock
(Dieckmann, 1998, Lehne, 2007). Here four source rocks and the corresponding source rock
asphaltenes as well as one oil asphaltene were analysed.
The sample set of the Duvernay Formation comprises 17 source rocks. Rock-Eval data of the
whole sample set demonstrates that the Duvernay Formation represents a typical Type II
marine source rock (Figure 121). The samples cover a broad maturity range; however, most of
them are immature with Tmax values between 414 °C up to 429 °C. The four representative
samples selected for further investigations are marked with orange dots (Figure 121). The
Rock-Eval data of these selected source rock samples (Lehne, 2007) are shown in Table 16.
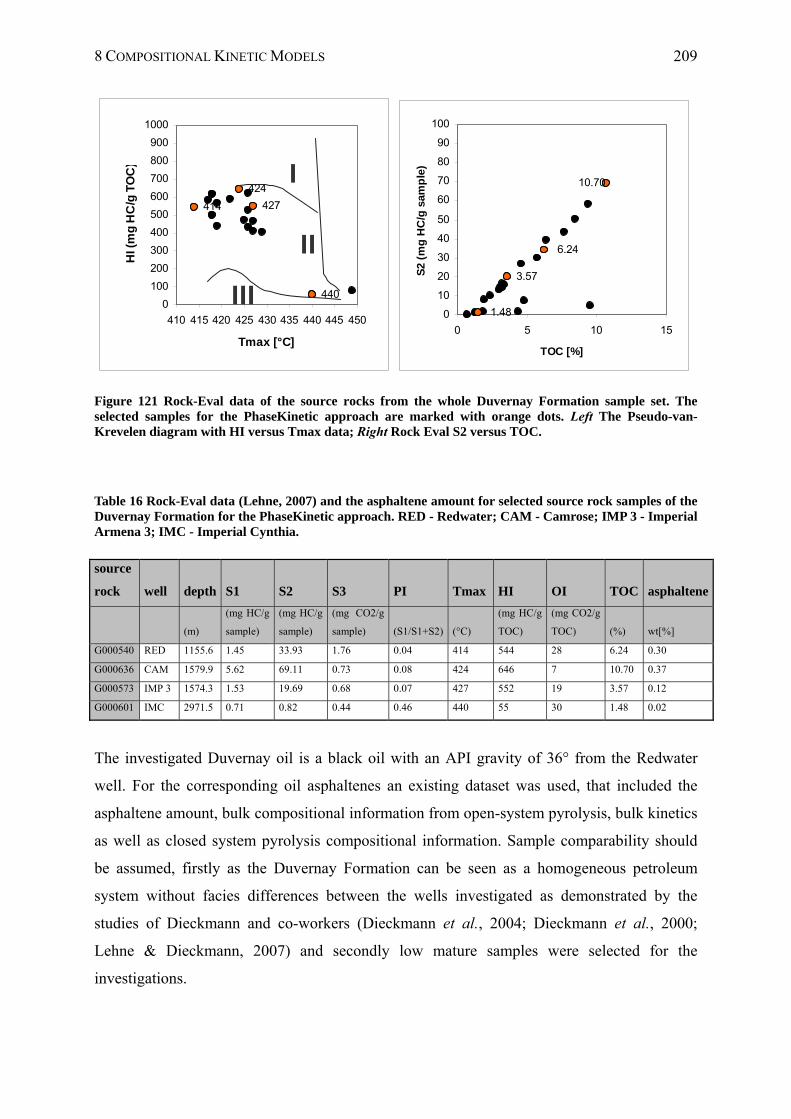
8 COMPOSITIONAL KINETIC MODELS 209
424
427
440
414
0
100
200
300
400
500
600
700
800
900
1000
410 415 420 425 430 435 440 445 450
Tmax [°C]
HI (
mg
HC
/g T
OC
)
III
I
II3.57
1.48
6.24
10.70
0
10
20
30
40
50
60
70
80
90
100
0 5 10 15
TOC [%]
S2
(mg
HC
/g s
amp
le)
Figure 121 Rock-Eval data of the source rocks from the whole Duvernay Formation sample set. The selected samples for the PhaseKinetic approach are marked with orange dots. Left The Pseudo-van-Krevelen diagram with HI versus Tmax data; Right Rock Eval S2 versus TOC.
Table 16 Rock-Eval data (Lehne, 2007) and the asphaltene amount for selected source rock samples of the Duvernay Formation for the PhaseKinetic approach. RED - Redwater; CAM - Camrose; IMP 3 - Imperial Armena 3; IMC - Imperial Cynthia.
The investigated Duvernay oil is a black oil with an API gravity of 36° from the Redwater
well. For the corresponding oil asphaltenes an existing dataset was used, that included the
asphaltene amount, bulk compositional information from open-system pyrolysis, bulk kinetics
as well as closed system pyrolysis compositional information. Sample comparability should
be assumed, firstly as the Duvernay Formation can be seen as a homogeneous petroleum
system without facies differences between the wells investigated as demonstrated by the
studies of Dieckmann and co-workers (Dieckmann et al., 2004; Dieckmann et al., 2000;
Lehne & Dieckmann, 2007) and secondly low mature samples were selected for the
investigations.
source
rock well depth S1 S2 S3 PI Tmax HI OI TOC asphaltene
(m)
(mg HC/g
sample)
(mg HC/g
sample)
(mg CO2/g
sample) (S1/S1+S2) (°C)
(mg HC/g
TOC)
(mg CO2/g
TOC) (%) wt[%]
G000540 RED 1155.6 1.45 33.93 1.76 0.04 414 544 28 6.24 0.30
G000636 CAM 1579.9 5.62 69.11 0.73 0.08 424 646 7 10.70 0.37
G000573 IMP 3 1574.3 1.53 19.69 0.68 0.07 427 552 19 3.57 0.12
G000601 IMC 2971.5 0.71 0.82 0.44 0.46 440 55 30 1.48 0.02
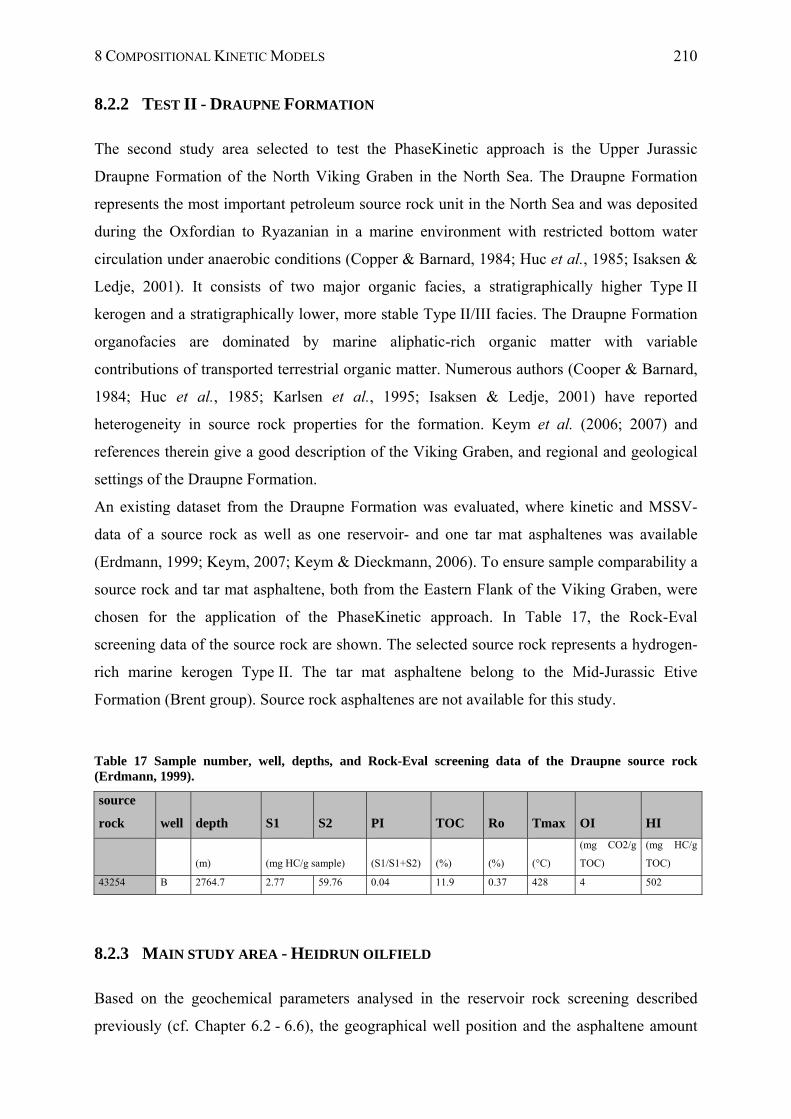
8 COMPOSITIONAL KINETIC MODELS 210
8.2.2 TEST II - DRAUPNE FORMATION
The second study area selected to test the PhaseKinetic approach is the Upper Jurassic
Draupne Formation of the North Viking Graben in the North Sea. The Draupne Formation
represents the most important petroleum source rock unit in the North Sea and was deposited
during the Oxfordian to Ryazanian in a marine environment with restricted bottom water
circulation under anaerobic conditions (Copper & Barnard, 1984; Huc et al., 1985; Isaksen &
Ledje, 2001). It consists of two major organic facies, a stratigraphically higher Type II
kerogen and a stratigraphically lower, more stable Type II/III facies. The Draupne Formation
organofacies are dominated by marine aliphatic-rich organic matter with variable
contributions of transported terrestrial organic matter. Numerous authors (Cooper & Barnard,
1984; Huc et al., 1985; Karlsen et al., 1995; Isaksen & Ledje, 2001) have reported
heterogeneity in source rock properties for the formation. Keym et al. (2006; 2007) and
references therein give a good description of the Viking Graben, and regional and geological
settings of the Draupne Formation.
An existing dataset from the Draupne Formation was evaluated, where kinetic and MSSV-
data of a source rock as well as one reservoir- and one tar mat asphaltenes was available
(Erdmann, 1999; Keym, 2007; Keym & Dieckmann, 2006). To ensure sample comparability a
source rock and tar mat asphaltene, both from the Eastern Flank of the Viking Graben, were
chosen for the application of the PhaseKinetic approach. In Table 17, the Rock-Eval
screening data of the source rock are shown. The selected source rock represents a hydrogen-
rich marine kerogen Type II. The tar mat asphaltene belong to the Mid-Jurassic Etive
Formation (Brent group). Source rock asphaltenes are not available for this study.
Table 17 Sample number, well, depths, and Rock-Eval screening data of the Draupne source rock (Erdmann, 1999).
source
rock well depth S1 S2 PI TOC Ro Tmax OI HI
(m) (mg HC/g sample) (S1/S1+S2) (%) (%) (°C)
(mg CO2/g
TOC)
(mg HC/g
TOC)
43254 B 2764.7 2.77 59.76 0.04 11.9 0.37 428 4 502
8.2.3 MAIN STUDY AREA - HEIDRUN OILFIELD
Based on the geochemical parameters analysed in the reservoir rock screening described
previously (cf. Chapter 6.2 - 6.6), the geographical well position and the asphaltene amount
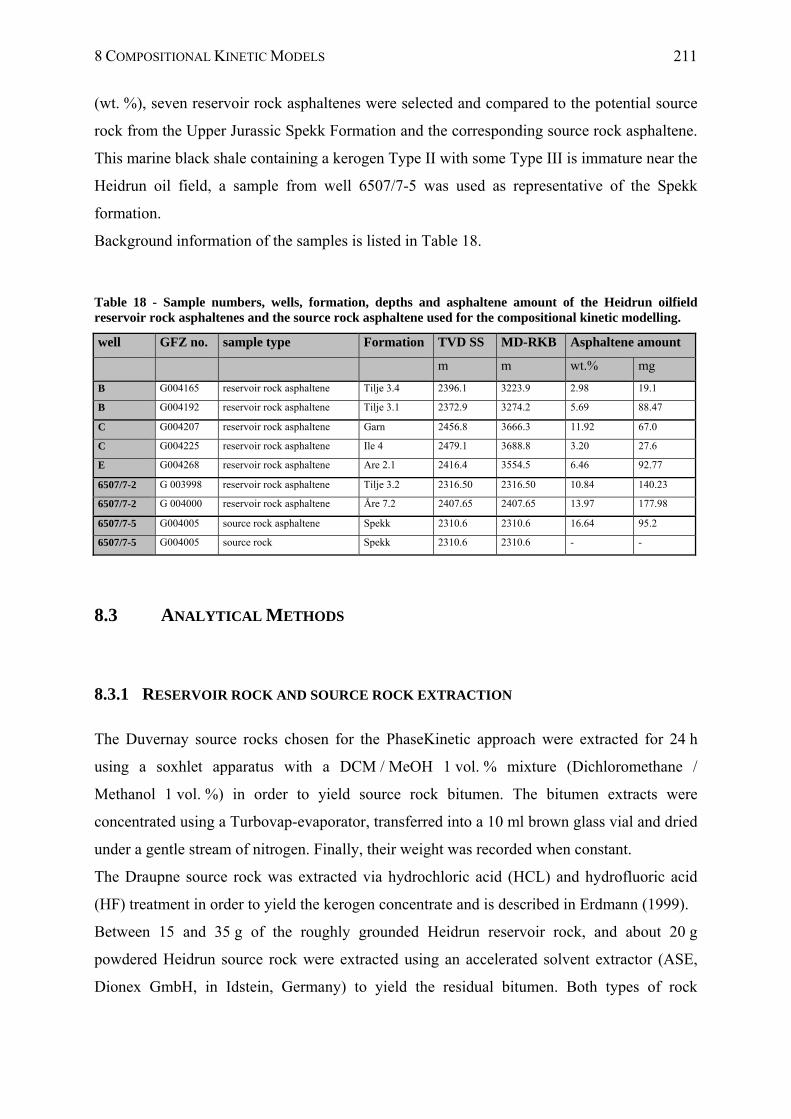
8 COMPOSITIONAL KINETIC MODELS 211
(wt. %), seven reservoir rock asphaltenes were selected and compared to the potential source
rock from the Upper Jurassic Spekk Formation and the corresponding source rock asphaltene.
This marine black shale containing a kerogen Type II with some Type III is immature near the
Heidrun oil field, a sample from well 6507/7-5 was used as representative of the Spekk
formation.
Background information of the samples is listed in Table 18.
Table 18 - Sample numbers, wells, formation, depths and asphaltene amount of the Heidrun oilfield reservoir rock asphaltenes and the source rock asphaltene used for the compositional kinetic modelling.
well GFZ no. sample type Formation TVD SS MD-RKB Asphaltene amount
m m wt.% mg
B G004165 reservoir rock asphaltene Tilje 3.4 2396.1 3223.9 2.98 19.1
B G004192 reservoir rock asphaltene Tilje 3.1 2372.9 3274.2 5.69 88.47
C G004207 reservoir rock asphaltene Garn 2456.8 3666.3 11.92 67.0
C G004225 reservoir rock asphaltene Ile 4 2479.1 3688.8 3.20 27.6
E G004268 reservoir rock asphaltene Are 2.1 2416.4 3554.5 6.46 92.77
6507/7-2 G 003998 reservoir rock asphaltene Tilje 3.2 2316.50 2316.50 10.84 140.23
6507/7-2 G 004000 reservoir rock asphaltene Åre 7.2 2407.65 2407.65 13.97 177.98
6507/7-5 G004005 source rock asphaltene Spekk 2310.6 2310.6 16.64 95.2
6507/7-5 G004005 source rock Spekk 2310.6 2310.6 - -
8.3 ANALYTICAL METHODS
8.3.1 RESERVOIR ROCK AND SOURCE ROCK EXTRACTION
The Duvernay source rocks chosen for the PhaseKinetic approach were extracted for 24 h
using a soxhlet apparatus with a DCM / MeOH 1 vol. % mixture (Dichloromethane /
Methanol 1 vol. %) in order to yield source rock bitumen. The bitumen extracts were
concentrated using a Turbovap-evaporator, transferred into a 10 ml brown glass vial and dried
under a gentle stream of nitrogen. Finally, their weight was recorded when constant.
The Draupne source rock was extracted via hydrochloric acid (HCL) and hydrofluoric acid
(HF) treatment in order to yield the kerogen concentrate and is described in Erdmann (1999).
Between 15 and 35 g of the roughly grounded Heidrun reservoir rock, and about 20 g
powdered Heidrun source rock were extracted using an accelerated solvent extractor (ASE,
Dionex GmbH, in Idstein, Germany) to yield the residual bitumen. Both types of rock
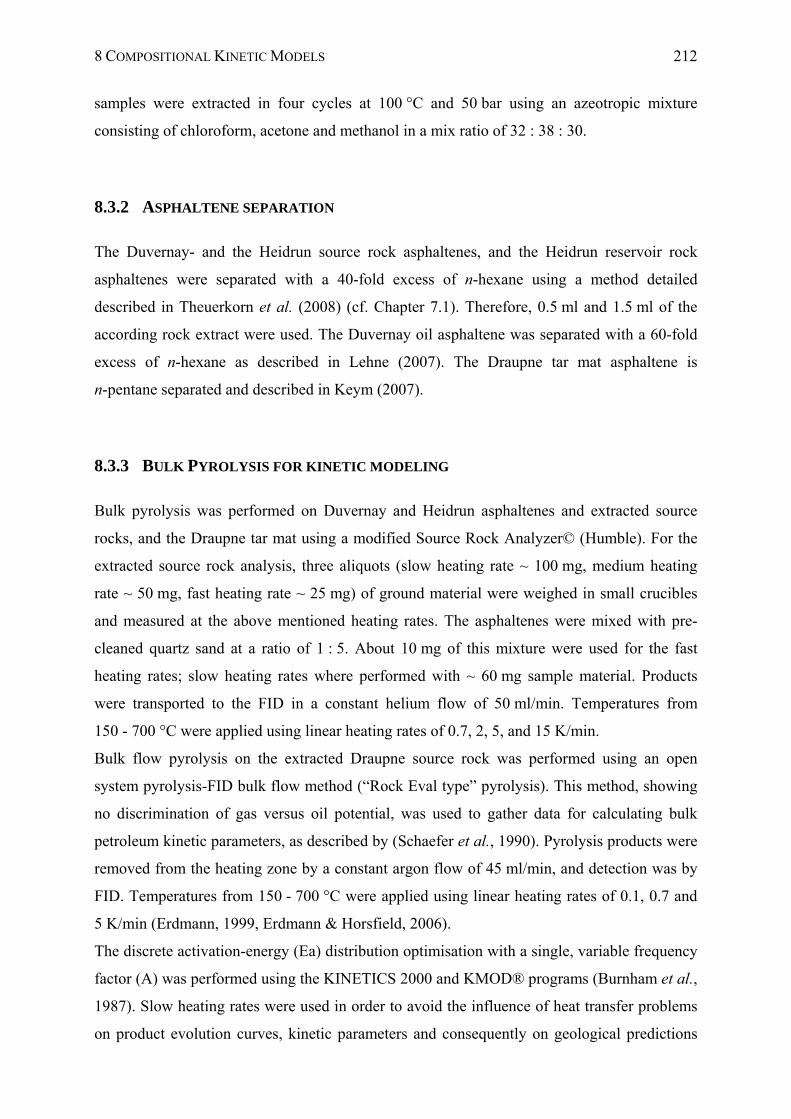
8 COMPOSITIONAL KINETIC MODELS 212
samples were extracted in four cycles at 100 °C and 50 bar using an azeotropic mixture
consisting of chloroform, acetone and methanol in a mix ratio of 32 : 38 : 30.
8.3.2 ASPHALTENE SEPARATION
The Duvernay- and the Heidrun source rock asphaltenes, and the Heidrun reservoir rock
asphaltenes were separated with a 40-fold excess of n-hexane using a method detailed
described in Theuerkorn et al. (2008) (cf. Chapter 7.1). Therefore, 0.5 ml and 1.5 ml of the
according rock extract were used. The Duvernay oil asphaltene was separated with a 60-fold
excess of n-hexane as described in Lehne (2007). The Draupne tar mat asphaltene is
n-pentane separated and described in Keym (2007).
8.3.3 BULK PYROLYSIS FOR KINETIC MODELING
Bulk pyrolysis was performed on Duvernay and Heidrun asphaltenes and extracted source
rocks, and the Draupne tar mat using a modified Source Rock Analyzer© (Humble). For the
extracted source rock analysis, three aliquots (slow heating rate ~ 100 mg, medium heating
rate ~ 50 mg, fast heating rate ~ 25 mg) of ground material were weighed in small crucibles
and measured at the above mentioned heating rates. The asphaltenes were mixed with pre-
cleaned quartz sand at a ratio of 1 : 5. About 10 mg of this mixture were used for the fast
heating rates; slow heating rates where performed with ~ 60 mg sample material. Products
were transported to the FID in a constant helium flow of 50 ml/min. Temperatures from
150 - 700 °C were applied using linear heating rates of 0.7, 2, 5, and 15 K/min.
Bulk flow pyrolysis on the extracted Draupne source rock was performed using an open
system pyrolysis-FID bulk flow method (“Rock Eval type” pyrolysis). This method, showing
no discrimination of gas versus oil potential, was used to gather data for calculating bulk
petroleum kinetic parameters, as described by (Schaefer et al., 1990). Pyrolysis products were
removed from the heating zone by a constant argon flow of 45 ml/min, and detection was by
FID. Temperatures from 150 - 700 °C were applied using linear heating rates of 0.1, 0.7 and
5 K/min (Erdmann, 1999, Erdmann & Horsfield, 2006).
The discrete activation-energy (Ea) distribution optimisation with a single, variable frequency
factor (A) was performed using the KINETICS 2000 and KMOD® programs (Burnham et al.,
1987). Slow heating rates were used in order to avoid the influence of heat transfer problems
on product evolution curves, kinetic parameters and consequently on geological predictions
8 COMPOSITIONAL KINETIC MODELS 213
(Schenk & Dieckmann, 2004). However, the used heating rates varied enough to ensure a
correct iteration of the mathematical model and correctly calculate the frequency factor.
8.3.4 CLOSED SYSTEM PYROLYSIS – MICRO SCALE SEALED VESSEL PYROLYSIS
(MSSV)
Artificial maturation experiments were carried out to obtain detailed information regarding
the fluid composition generated by the source rock kerogen and the asphaltene fractions at
different temperatures. Therefore the micro scale sealed vessel (MSSV) technique developed
by Horsfield (1989) was used. Temperatures resulting in 10, 30, 50, 70 and 90 %
transformation were determined based on the bulk kinetic data for a heating rate of 0.7 K/min.
Aliquots of the source rock and the asphaltenes were weighed into 40 µl seized and 120° bent
glass tubes. For the asphaltenes between 5 - 20 mg asphaltene - pre-cleaned quartz sand
mixture (ratio 1 : 10) were used. Source rock aliquots of 5 - 8 mg immature extracted kerogen
concentrates and because of lower concentration of organic matter, about 20 - 25 mg of finely
grounded extracted source rock sample material, was used throughout the MSSV
measurement. Both tube ends were filled with quartz sand and quartz wool to keep the sample
that is situated in the middle of the tube in place and to reduce the remaining volume in the
tube. The tubes were sealed with a hydrogen-oxygen flame. MSSV pyrolysis was conducted
at a heating rate of 0.7 K/min using an external GC-oven. The samples were heated using a
temperature program that started at 200 °C up to the temperature of the corresponding TR.
Subsequently the tubes were removed from the oven, cooled down and finally cracked within
a piston device of a Quantum MSSV thermal system to enable the analysis of the maturation
products. The products (total and resolved) were quantified using an external n-butane
standard. Identification of peaks based on reference pyrolysis gas chromatograms was done
manually with Agilent ChemStation® software.
8.3.5 METHODOLOGY AND BACKGROUND ON THE PHASEKINETIC APPROACH
(PKW TUNING)
The phase behaviour of migrating petroleum fluids is controlled by the fluids composition and
the pressure and temperature conditions at which the fluid is found. The geological conditions
upon which migrating oil separates into oil and gas are strongly controlled by the gas
8 COMPOSITIONAL KINETIC MODELS 214
(C1 - C5) composition of the fluid (di Primio et al., 1998). For petroleum phase behaviour, gas
composition plays the dominant role with respect to the fluids saturation pressure and
shrinkage behaviour; however, influence of the liquid fraction composition should not be
neglected.
The gross description of oil and gas generation from closed system pyrolysis results, and the
surface GOR derived there from, are very similar to the GOR distributions observed in nature
(di Primio, 2004; di Primio & Horsfield, 2006). Hence, it appears that the relative gas and oil
proportions generated as a function of maturity can be estimated based on laboratory
experiments.
Compositional predictions are, however, not as straight forward. High methane contents
generally result in phase separation at relatively high pressures, i.e. at great depth. A very wet
gas composition results in a much lower saturation pressure (Psat) for a given fluid. The
sensitivity of gas composition on phase behaviour of migrating hydrocarbons has severe
implications for the prediction of petroleum phase behaviour during petroleum generation and
migration. As discussed by Mango (1996; 1997) natural fluids display a much stronger
predominance of methane in their gas fractions than observed in source rock pyrolysates.
It is commonly known that for genetically related natural fluids saturation pressure correlates
linearly to GOR and formation volume factor (Bo). As discussed above the methane content of
a fluid is the most important factor controlling its saturation pressure (Psat). Hence, a
correction of the gas compositions generated by pyrolysis is possible assuming a linear
relationship between the methane proportion of the gas phase (C1 - C5) and the fluids GOR.
The equation used for methane correction in this study is based on linear regression using a
natural dataset from the North Sea representative of the black oil to gas-condensate range
(correlation coefficient for the relationship between GOR and C1 / C2-5 r
2 = 0.98). The original
GOR used as a starting point for the methane correction is that determined on the MSSV
pyrolysates and converted to volumetric data by single stage flash using PVT simulation
software.
The characterisation of the generated fluids oil composition (C6+) for phase behaviour
assessment is based on the compositional information from MSSV analysis as described by di
Primio and Horsfield (2006). The resolved compounds from C6 onwards were quantified,
their proportions converted to molar amounts and these were summed to a total description of
the liquid phase which consisted of a pseudo compound C6 (containing all resolved
compounds in the range eluting after pentane until and including hexane) and a C7+ fraction
(containing the rest of the resolved compounds). The C7+ fraction was further characterised by
8 COMPOSITIONAL KINETIC MODELS 215
a molecular weight and density. The molecular weight of the C7+ fraction was determined by
subdividing the GC hump (MSSV total minus MSSV resolved compounds) into boiling
ranges according to the resolved n-alkanes, and using the average molecular weights of the
resolved compounds as representative of the respective hump range. Quantification of the
subdivisions led thus to an averaged molecular weight of the entire hump. The density of the
C7+ fraction was determined using a C7+ molecular weight – density correlation for natural
petroleum’s from the North Sea. Subsequently the definition of the C7+ fraction is used to
calculate a distribution of components representing the total liquid phase using a PVT
simulator. The determined PVT descriptions of the fluids at different transformation ratios are
used for the definition of the compositional kinetic models. The individual potentials per
activation energy derived from the bulk kinetic analysis of the samples are subdivided into 14
sub-potentials, one for each compound described.
8.4 RESULTS AND DISCUSSION
In order to show how far PhaseKinetic parameters calculated on kerogen, source rock
asphaltenes and reservoir asphaltenes are comparable, all selected samples were characterised
in four sequential steps as follows. In a first step the characterisation of structural moieties
with open system Py-GC and Tvap-GC was done. This was followed by the analysis of bulk
kinetic parameters to predict hydrocarbon generation rates at different temperatures. The
heating rates used for this analysis are 0.7, 2.0, 5.0 and 15 K/min. In the third step
experimental temperatures were determined, which represent transformation ratios (TR) of
10, 30, 50, 70 and 90 % at 0.7 K/min in order to analyse the oil composition generated at
these temperatures via closed system MSSV pyrolysis (Horsfield, 1989). Finally the mol % of
particular components was calculated as described by di Primio and Horsfield (2006) in order
to predict the hydrocarbon composition under different reservoir conditions. The results of
these single characterisation steps will be shown in the following section.
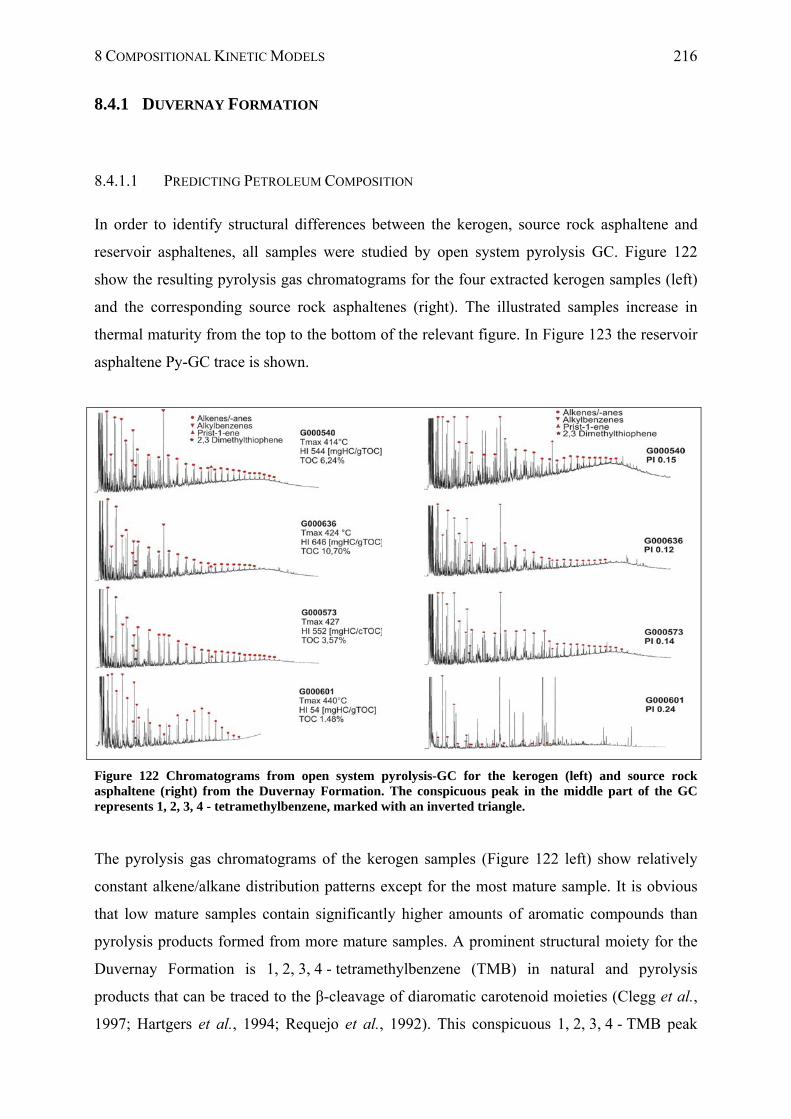
8 COMPOSITIONAL KINETIC MODELS 216
8.4.1 DUVERNAY FORMATION
8.4.1.1 PREDICTING PETROLEUM COMPOSITION
In order to identify structural differences between the kerogen, source rock asphaltene and
reservoir asphaltenes, all samples were studied by open system pyrolysis GC. Figure 122
show the resulting pyrolysis gas chromatograms for the four extracted kerogen samples (left)
and the corresponding source rock asphaltenes (right). The illustrated samples increase in
thermal maturity from the top to the bottom of the relevant figure. In Figure 123 the reservoir
asphaltene Py-GC trace is shown.
Figure 122 Chromatograms from open system pyrolysis-GC for the kerogen (left) and source rock asphaltene (right) from the Duvernay Formation. The conspicuous peak in the middle part of the GC represents 1, 2, 3, 4 - tetramethylbenzene, marked with an inverted triangle.
The pyrolysis gas chromatograms of the kerogen samples (Figure 122 left) show relatively
constant alkene/alkane distribution patterns except for the most mature sample. It is obvious
that low mature samples contain significantly higher amounts of aromatic compounds than
pyrolysis products formed from more mature samples. A prominent structural moiety for the
Duvernay Formation is 1, 2, 3, 4 - tetramethylbenzene (TMB) in natural and pyrolysis
products that can be traced to the β-cleavage of diaromatic carotenoid moieties (Clegg et al.,
1997; Hartgers et al., 1994; Requejo et al., 1992). This conspicuous 1, 2, 3, 4 - TMB peak
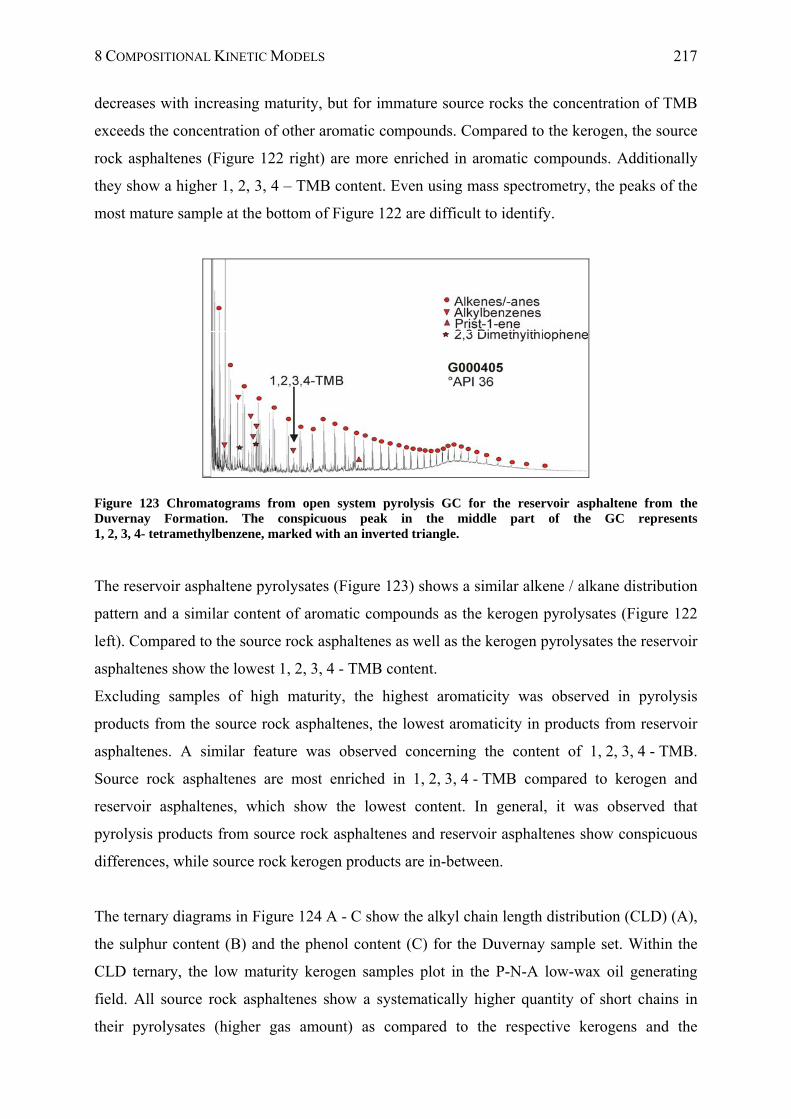
8 COMPOSITIONAL KINETIC MODELS 217
decreases with increasing maturity, but for immature source rocks the concentration of TMB
exceeds the concentration of other aromatic compounds. Compared to the kerogen, the source
rock asphaltenes (Figure 122 right) are more enriched in aromatic compounds. Additionally
they show a higher 1, 2, 3, 4 – TMB content. Even using mass spectrometry, the peaks of the
most mature sample at the bottom of Figure 122 are difficult to identify.
Figure 123 Chromatograms from open system pyrolysis GC for the reservoir asphaltene from the Duvernay Formation. The conspicuous peak in the middle part of the GC represents 1, 2, 3, 4- tetramethylbenzene, marked with an inverted triangle.
The reservoir asphaltene pyrolysates (Figure 123) shows a similar alkene / alkane distribution
pattern and a similar content of aromatic compounds as the kerogen pyrolysates (Figure 122
left). Compared to the source rock asphaltenes as well as the kerogen pyrolysates the reservoir
asphaltenes show the lowest 1, 2, 3, 4 - TMB content.
Excluding samples of high maturity, the highest aromaticity was observed in pyrolysis
products from the source rock asphaltenes, the lowest aromaticity in products from reservoir
asphaltenes. A similar feature was observed concerning the content of 1, 2, 3, 4 - TMB.
Source rock asphaltenes are most enriched in 1, 2, 3, 4 - TMB compared to kerogen and
reservoir asphaltenes, which show the lowest content. In general, it was observed that
pyrolysis products from source rock asphaltenes and reservoir asphaltenes show conspicuous
differences, while source rock kerogen products are in-between.
The ternary diagrams in Figure 124 A - C show the alkyl chain length distribution (CLD) (A),
the sulphur content (B) and the phenol content (C) for the Duvernay sample set. Within the
CLD ternary, the low maturity kerogen samples plot in the P-N-A low-wax oil generating
field. All source rock asphaltenes show a systematically higher quantity of short chains in
their pyrolysates (higher gas amount) as compared to the respective kerogens and the
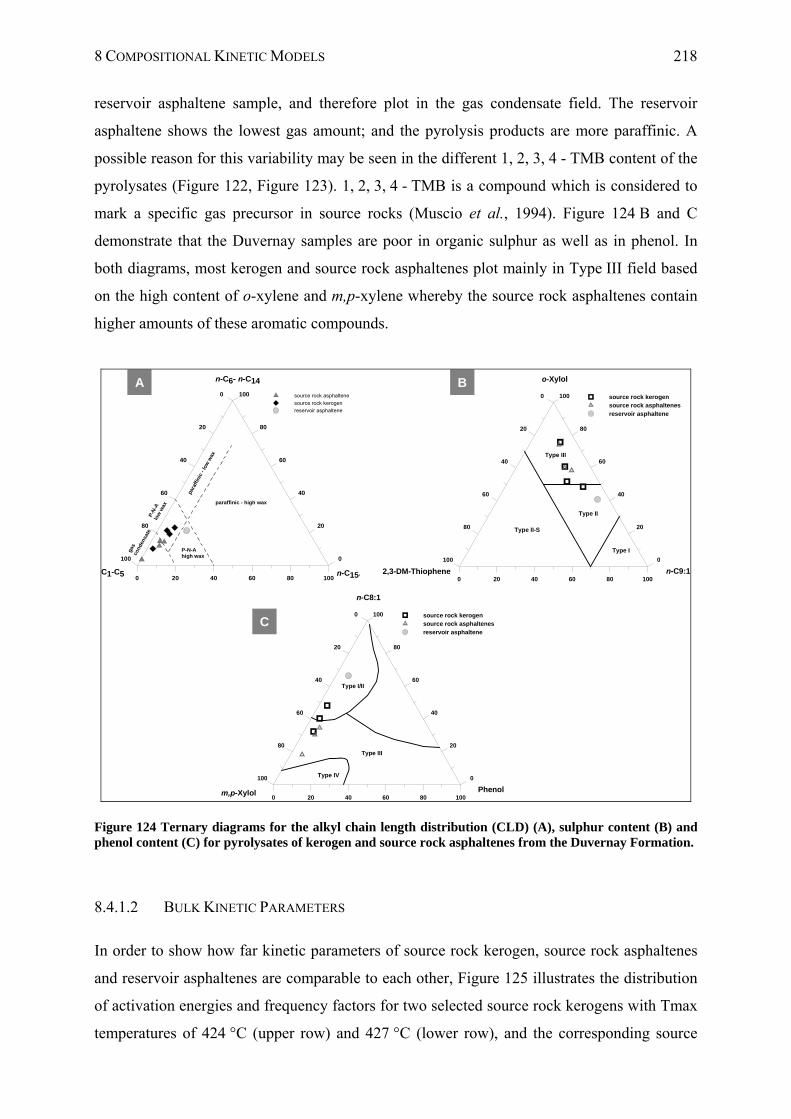
8 COMPOSITIONAL KINETIC MODELS 218
reservoir asphaltene sample, and therefore plot in the gas condensate field. The reservoir
asphaltene shows the lowest gas amount; and the pyrolysis products are more paraffinic. A
possible reason for this variability may be seen in the different 1, 2, 3, 4 - TMB content of the
pyrolysates (Figure 122, Figure 123). 1, 2, 3, 4 - TMB is a compound which is considered to
mark a specific gas precursor in source rocks (Muscio et al., 1994). Figure 124 B and C
demonstrate that the Duvernay samples are poor in organic sulphur as well as in phenol. In
both diagrams, most kerogen and source rock asphaltenes plot mainly in Type III field based
on the high content of o-xylene and m,p-xylene whereby the source rock asphaltenes contain
higher amounts of these aromatic compounds.
0 20 40 60 80 100n-C15+
100
80
60
40
20
0
n-C6- n-C14
100
80
60
40
20
0
C1-C5
source rock asphaltene
source rock kerogen
reservoir asphaltene
paraffinic - high wax
para
ffin
ic -
low
wax
P-N
-Alo
w w
ax
P-N-Ahigh wax
gas
cond
ensa
te
0 20 40 60 80 100n-C9:1
100
80
60
40
20
0
o-Xylol
100
80
60
40
20
0
2,3-DM-Thiophene
source rock kerogensource rock asphaltenesreservoir asphaltene
Type I
Type II
Type III
Type II-S
0 20 40 60 80 100Phenol
100
80
60
40
20
0
n-C8:1
100
80
60
40
20
0
m,p-Xylol
source rock kerogensource rock asphaltenesreservoir asphaltene
Type III
Type IV
Type I/II
A B
C
Figure 124 Ternary diagrams for the alkyl chain length distribution (CLD) (A), sulphur content (B) and phenol content (C) for pyrolysates of kerogen and source rock asphaltenes from the Duvernay Formation.
8.4.1.2 BULK KINETIC PARAMETERS
In order to show how far kinetic parameters of source rock kerogen, source rock asphaltenes
and reservoir asphaltenes are comparable to each other, Figure 125 illustrates the distribution
of activation energies and frequency factors for two selected source rock kerogens with Tmax
temperatures of 424 °C (upper row) and 427 °C (lower row), and the corresponding source
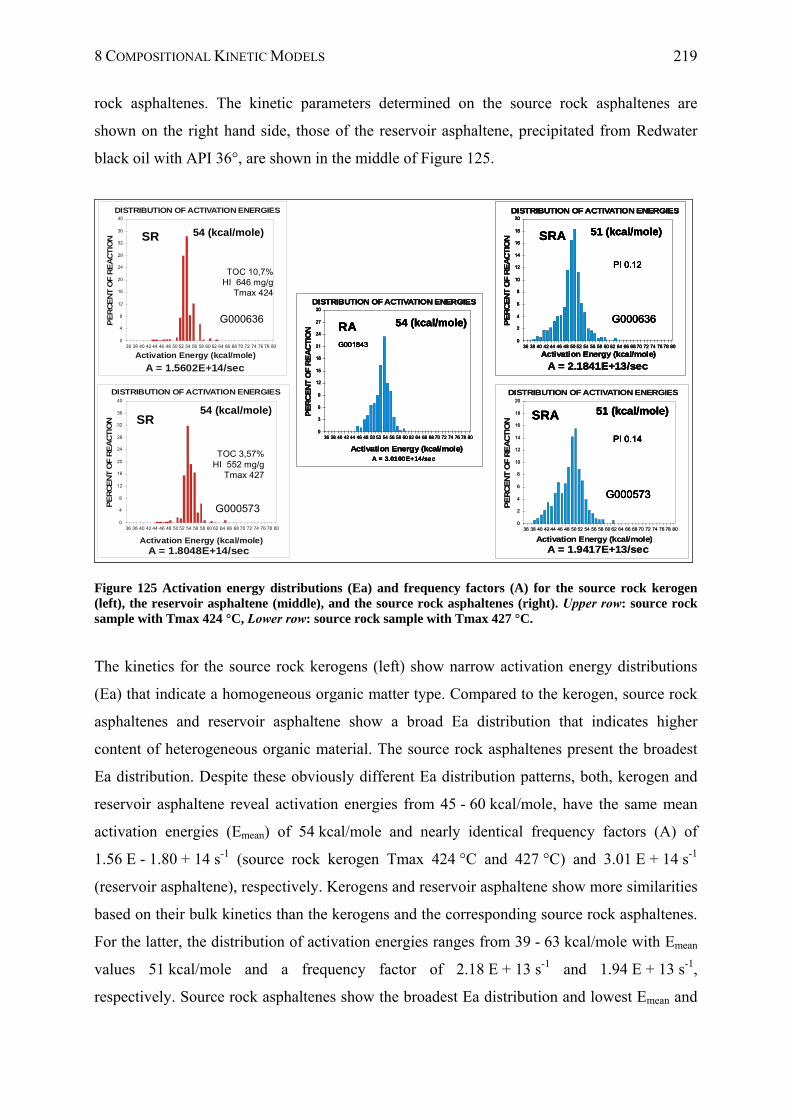
8 COMPOSITIONAL KINETIC MODELS 219
rock asphaltenes. The kinetic parameters determined on the source rock asphaltenes are
shown on the right hand side, those of the reservoir asphaltene, precipitated from Redwater
black oil with API 36°, are shown in the middle of Figure 125.
36 38 40 42 44 46 48 50 52 54 56 58 60 62 64 66 68 70 72 74 76 78 80
PE
RC
EN
TO
FR
EA
CTIO
N
Activation Energy (kcal/mole)
A = 1.5602E+14/sec
DISTRIBUTION OF ACTIVATION ENERGIES
0
4
8
12
16
20
24
28
32
36
40
54 (kcal/mole)
TOC 10,7%HI 646 mg/g
Tmax 424
SR
G000636
36 38 40 42 44 46 48 50 52 54 56 58 60 62 64 66 68 70 72 74 76 78 80
PE
RC
EN
TO
FR
EA
CTIO
N
Activation Energy (kcal/mole)
A = 1.5602E+14/sec
DISTRIBUTION OF ACTIVATION ENERGIES
0
4
8
12
16
20
24
28
32
36
40
54 (kcal/mole)
TOC 10,7%HI 646 mg/g
Tmax 424
SR
G000636
36 38 40 42 44 46 48 50 52 54 56 58 60 62 64 66 68 70 72 74 76 78 80
PE
RC
EN
TO
FR
EA
CTIO
N
Activation Energy (kcal/mole)
A = 2.1841E+13/sec
DISTRIBUTION OF ACTIVATION ENERGIES
0
2
4
6
8
10
12
14
16
18
20
51 (kcal/mole)
PI 0.12
SRA
G000636
36 38 40 42 44 46 48 50 52 54 56 58 60 62 64 66 68 70 72 74 76 78 80
PE
RC
EN
TO
FR
EA
CTIO
N
Activation Energy (kcal/mole)
A = 2.1841E+13/sec
DISTRIBUTION OF ACTIVATION ENERGIES
0
2
4
6
8
10
12
14
16
18
20
51 (kcal/mole)
PI 0.12
SRA
G000636
36 38 40 42 44 46 48 50 52 54 56 58 60 62 64 66 68 70 72 74 76 78 80
PE
RC
EN
TO
FR
EA
CTIO
N
Activation Energy (kcal/mole)A = 1.8048E+14/sec
DISTRIBUTION OF ACTIVATION ENERGIES
0
4
8
12
16
20
24
28
32
36
40
54 (kcal/mole)
TOC 3,57%HI 552 mg/g
Tmax 427
SR
G000573
36 38 40 42 44 46 48 50 52 54 56 58 60 62 64 66 68 70 72 74 76 78 80
PE
RC
EN
TO
FR
EA
CTIO
N
Activation Energy (kcal/mole)A = 1.8048E+14/sec
DISTRIBUTION OF ACTIVATION ENERGIES
0
4
8
12
16
20
24
28
32
36
40
54 (kcal/mole)
TOC 3,57%HI 552 mg/g
Tmax 427
SR
G000573
36 38 40 42 44 46 48 50 52 54 56 58 60 62 64 66 68 70 72 74 76 78 80
PE
RC
EN
TO
FR
EA
CTIO
N
Activation Energy (kcal/mole)A = 3.0100E+14/sec
DISTRIBUTION OF ACTIVATION ENERGIES
0
3
6
9
12
15
18
21
24
27
30
54 (kcal/mole)
G001843
RA
36 38 40 42 44 46 48 50 52 54 56 58 60 62 64 66 68 70 72 74 76 78 80
PE
RC
EN
TO
FR
EA
CTIO
N
Activation Energy (kcal/mole)A = 3.0100E+14/sec
DISTRIBUTION OF ACTIVATION ENERGIES
0
3
6
9
12
15
18
21
24
27
30
54 (kcal/mole)
G001843
RA
36 38 40 42 44 46 48 50 52 54 56 58 60 62 64 66 68 70 72 74 76 78 80
PE
RC
EN
TO
FR
EA
CTIO
N
Activation Energy (kcal/mole)
A = 1.9417E+13/sec
DISTRIBUTION OF ACTIVATION ENERGIES
0
2
4
6
8
10
12
14
16
18
20
51 (kcal/mole)
PI 0.14
G000573
SRA 51 (kcal/mole)
PI 0.14
G000573
SRA
36 38 40 42 44 46 48 50 52 54 56 58 60 62 64 66 68 70 72 74 76 78 80
PE
RC
EN
TO
FR
EA
CTIO
N
Activation Energy (kcal/mole)
A = 1.5602E+14/sec
DISTRIBUTION OF ACTIVATION ENERGIES
0
4
8
12
16
20
24
28
32
36
40
54 (kcal/mole)
TOC 10,7%HI 646 mg/g
Tmax 424
SR
G000636
36 38 40 42 44 46 48 50 52 54 56 58 60 62 64 66 68 70 72 74 76 78 80
PE
RC
EN
TO
FR
EA
CTIO
N
Activation Energy (kcal/mole)
A = 1.5602E+14/sec
DISTRIBUTION OF ACTIVATION ENERGIES
0
4
8
12
16
20
24
28
32
36
40
54 (kcal/mole)
TOC 10,7%HI 646 mg/g
Tmax 424
SR
G000636
36 38 40 42 44 46 48 50 52 54 56 58 60 62 64 66 68 70 72 74 76 78 80
PE
RC
EN
TO
FR
EA
CTIO
N
Activation Energy (kcal/mole)
A = 2.1841E+13/sec
DISTRIBUTION OF ACTIVATION ENERGIES
0
2
4
6
8
10
12
14
16
18
20
51 (kcal/mole)
PI 0.12
SRA
G000636
36 38 40 42 44 46 48 50 52 54 56 58 60 62 64 66 68 70 72 74 76 78 80
PE
RC
EN
TO
FR
EA
CTIO
N
Activation Energy (kcal/mole)
A = 2.1841E+13/sec
DISTRIBUTION OF ACTIVATION ENERGIES
0
2
4
6
8
10
12
14
16
18
20
51 (kcal/mole)
PI 0.12
SRA
G000636
36 38 40 42 44 46 48 50 52 54 56 58 60 62 64 66 68 70 72 74 76 78 80
PE
RC
EN
TO
FR
EA
CTIO
N
Activation Energy (kcal/mole)A = 1.8048E+14/sec
DISTRIBUTION OF ACTIVATION ENERGIES
0
4
8
12
16
20
24
28
32
36
40
54 (kcal/mole)
TOC 3,57%HI 552 mg/g
Tmax 427
SR
G000573
36 38 40 42 44 46 48 50 52 54 56 58 60 62 64 66 68 70 72 74 76 78 80
PE
RC
EN
TO
FR
EA
CTIO
N
Activation Energy (kcal/mole)A = 1.8048E+14/sec
DISTRIBUTION OF ACTIVATION ENERGIES
0
4
8
12
16
20
24
28
32
36
40
54 (kcal/mole)
TOC 3,57%HI 552 mg/g
Tmax 427
SR
G000573
36 38 40 42 44 46 48 50 52 54 56 58 60 62 64 66 68 70 72 74 76 78 80
PE
RC
EN
TO
FR
EA
CTIO
N
Activation Energy (kcal/mole)A = 3.0100E+14/sec
DISTRIBUTION OF ACTIVATION ENERGIES
0
3
6
9
12
15
18
21
24
27
30
54 (kcal/mole)
G001843
RA
36 38 40 42 44 46 48 50 52 54 56 58 60 62 64 66 68 70 72 74 76 78 80
PE
RC
EN
TO
FR
EA
CTIO
N
Activation Energy (kcal/mole)A = 3.0100E+14/sec
DISTRIBUTION OF ACTIVATION ENERGIES
0
3
6
9
12
15
18
21
24
27
30
54 (kcal/mole)
G001843
RA
36 38 40 42 44 46 48 50 52 54 56 58 60 62 64 66 68 70 72 74 76 78 80
PE
RC
EN
TO
FR
EA
CTIO
N
Activation Energy (kcal/mole)
A = 1.9417E+13/sec
DISTRIBUTION OF ACTIVATION ENERGIES
0
2
4
6
8
10
12
14
16
18
20
51 (kcal/mole)
PI 0.14
G000573
SRA 51 (kcal/mole)
PI 0.14
G000573
SRA
Figure 125 Activation energy distributions (Ea) and frequency factors (A) for the source rock kerogen (left), the reservoir asphaltene (middle), and the source rock asphaltenes (right). Upper row: source rock sample with Tmax 424 °C, Lower row: source rock sample with Tmax 427 °C.
The kinetics for the source rock kerogens (left) show narrow activation energy distributions
(Ea) that indicate a homogeneous organic matter type. Compared to the kerogen, source rock
asphaltenes and reservoir asphaltene show a broad Ea distribution that indicates higher
content of heterogeneous organic material. The source rock asphaltenes present the broadest
Ea distribution. Despite these obviously different Ea distribution patterns, both, kerogen and
reservoir asphaltene reveal activation energies from 45 - 60 kcal/mole, have the same mean
activation energies (Emean) of 54 kcal/mole and nearly identical frequency factors (A) of
1.56 E - 1.80 + 14 s-1 (source rock kerogen Tmax 424 °C and 427 °C) and 3.01 E + 14 s-1
(reservoir asphaltene), respectively. Kerogens and reservoir asphaltene show more similarities
based on their bulk kinetics than the kerogens and the corresponding source rock asphaltenes.
For the latter, the distribution of activation energies ranges from 39 - 63 kcal/mole with Emean
values 51 kcal/mole and a frequency factor of 2.18 E + 13 s-1 and 1.94 E + 13 s-1,
respectively. Source rock asphaltenes show the broadest Ea distribution and lowest Emean and
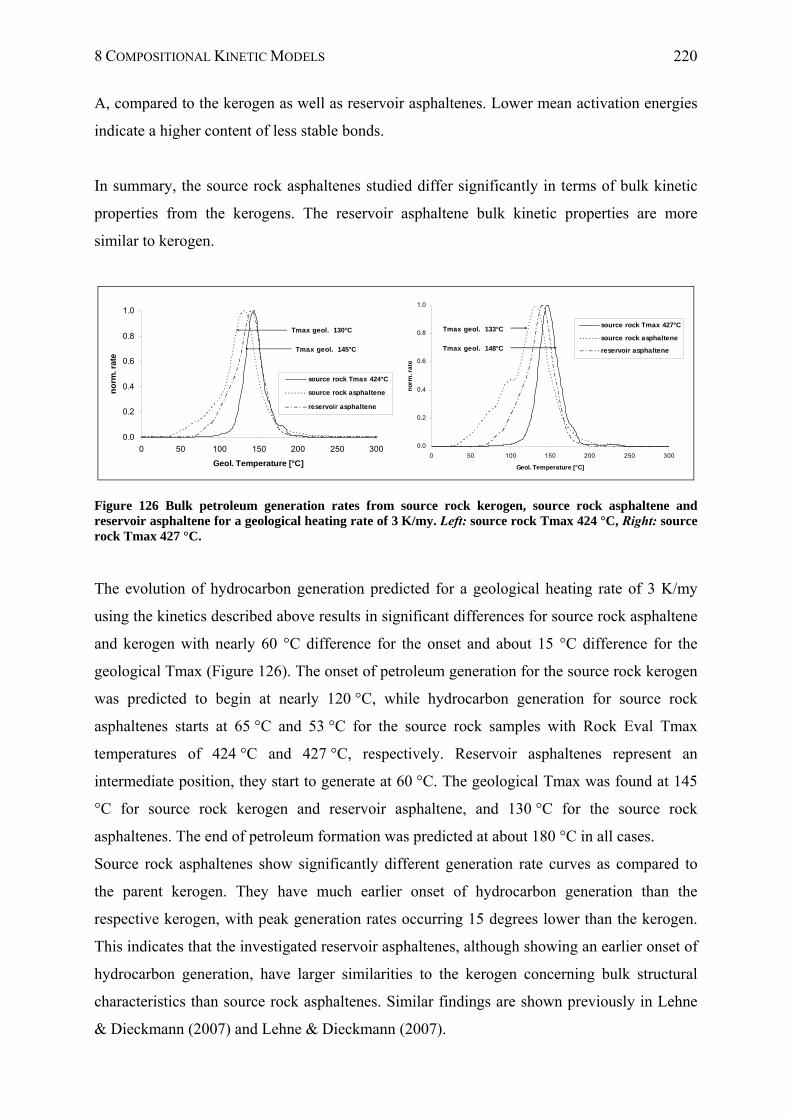
8 COMPOSITIONAL KINETIC MODELS 220
A, compared to the kerogen as well as reservoir asphaltenes. Lower mean activation energies
indicate a higher content of less stable bonds.
In summary, the source rock asphaltenes studied differ significantly in terms of bulk kinetic
properties from the kerogens. The reservoir asphaltene bulk kinetic properties are more
similar to kerogen.
0.0
0.2
0.4
0.6
0.8
1.0
0 50 100 150 200 250 300
Geol. Temperature [°C]
no
rm. r
ate
source rock Tmax 424°C
source rock asphaltene
reservoir asphaltene
Tmax geol. 145°C
Tmax geol. 130°C
0.0
0.2
0.4
0.6
0.8
1.0
0 50 100 150 200 250 300
Geol. Temperature [°C]
no
rm. r
ate
source rock Tmax 427°C
source rock asphaltene
reservoir asphalteneTmax geol. 148°C
Tmax geol. 133°C
Figure 126 Bulk petroleum generation rates from source rock kerogen, source rock asphaltene and reservoir asphaltene for a geological heating rate of 3 K/my. Left: source rock Tmax 424 °C, Right: source rock Tmax 427 °C.
The evolution of hydrocarbon generation predicted for a geological heating rate of 3 K/my
using the kinetics described above results in significant differences for source rock asphaltene
and kerogen with nearly 60 °C difference for the onset and about 15 °C difference for the
geological Tmax (Figure 126). The onset of petroleum generation for the source rock kerogen
was predicted to begin at nearly 120 °C, while hydrocarbon generation for source rock
asphaltenes starts at 65 °C and 53 °C for the source rock samples with Rock Eval Tmax
temperatures of 424 °C and 427 °C, respectively. Reservoir asphaltenes represent an
intermediate position, they start to generate at 60 °C. The geological Tmax was found at 145
°C for source rock kerogen and reservoir asphaltene, and 130 °C for the source rock
asphaltenes. The end of petroleum formation was predicted at about 180 °C in all cases.
Source rock asphaltenes show significantly different generation rate curves as compared to
the parent kerogen. They have much earlier onset of hydrocarbon generation than the
respective kerogen, with peak generation rates occurring 15 degrees lower than the kerogen.
This indicates that the investigated reservoir asphaltenes, although showing an earlier onset of
hydrocarbon generation, have larger similarities to the kerogen concerning bulk structural
characteristics than source rock asphaltenes. Similar findings are shown previously in Lehne
& Dieckmann (2007) and Lehne & Dieckmann (2007).
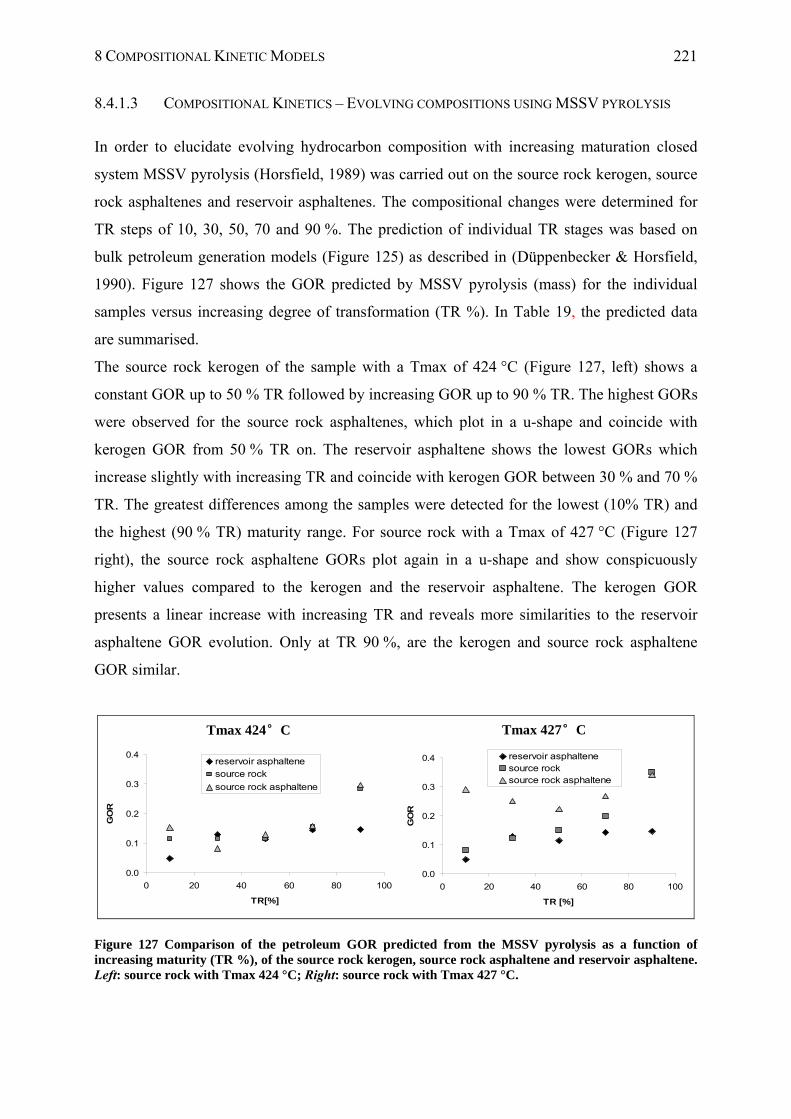
8 COMPOSITIONAL KINETIC MODELS 221
8.4.1.3 COMPOSITIONAL KINETICS – EVOLVING COMPOSITIONS USING MSSV PYROLYSIS
In order to elucidate evolving hydrocarbon composition with increasing maturation closed
system MSSV pyrolysis (Horsfield, 1989) was carried out on the source rock kerogen, source
rock asphaltenes and reservoir asphaltenes. The compositional changes were determined for
TR steps of 10, 30, 50, 70 and 90 %. The prediction of individual TR stages was based on
bulk petroleum generation models (Figure 125) as described in (Düppenbecker & Horsfield,
1990). Figure 127 shows the GOR predicted by MSSV pyrolysis (mass) for the individual
samples versus increasing degree of transformation (TR %). In Table 19, the predicted data
are summarised.
The source rock kerogen of the sample with a Tmax of 424 °C (Figure 127, left) shows a
constant GOR up to 50 % TR followed by increasing GOR up to 90 % TR. The highest GORs
were observed for the source rock asphaltenes, which plot in a u-shape and coincide with
kerogen GOR from 50 % TR on. The reservoir asphaltene shows the lowest GORs which
increase slightly with increasing TR and coincide with kerogen GOR between 30 % and 70 %
TR. The greatest differences among the samples were detected for the lowest (10% TR) and
the highest (90 % TR) maturity range. For source rock with a Tmax of 427 °C (Figure 127
right), the source rock asphaltene GORs plot again in a u-shape and show conspicuously
higher values compared to the kerogen and the reservoir asphaltene. The kerogen GOR
presents a linear increase with increasing TR and reveals more similarities to the reservoir
asphaltene GOR evolution. Only at TR 90 %, are the kerogen and source rock asphaltene
GOR similar.
0.0
0.1
0.2
0.3
0.4
0 20 40 60 80 100
TR[%]
GO
R
reservoir asphaltenesource rock
source rock asphaltene
0.0
0.1
0.2
0.3
0.4
0 20 40 60 80 100
TR [%]
GO
R
reservoir asphaltenesource rocksource rock asphaltene
Tmax 424°C Tmax 427°C
Figure 127 Comparison of the petroleum GOR predicted from the MSSV pyrolysis as a function of increasing maturity (TR %), of the source rock kerogen, source rock asphaltene and reservoir asphaltene. Left: source rock with Tmax 424 °C; Right: source rock with Tmax 427 °C.
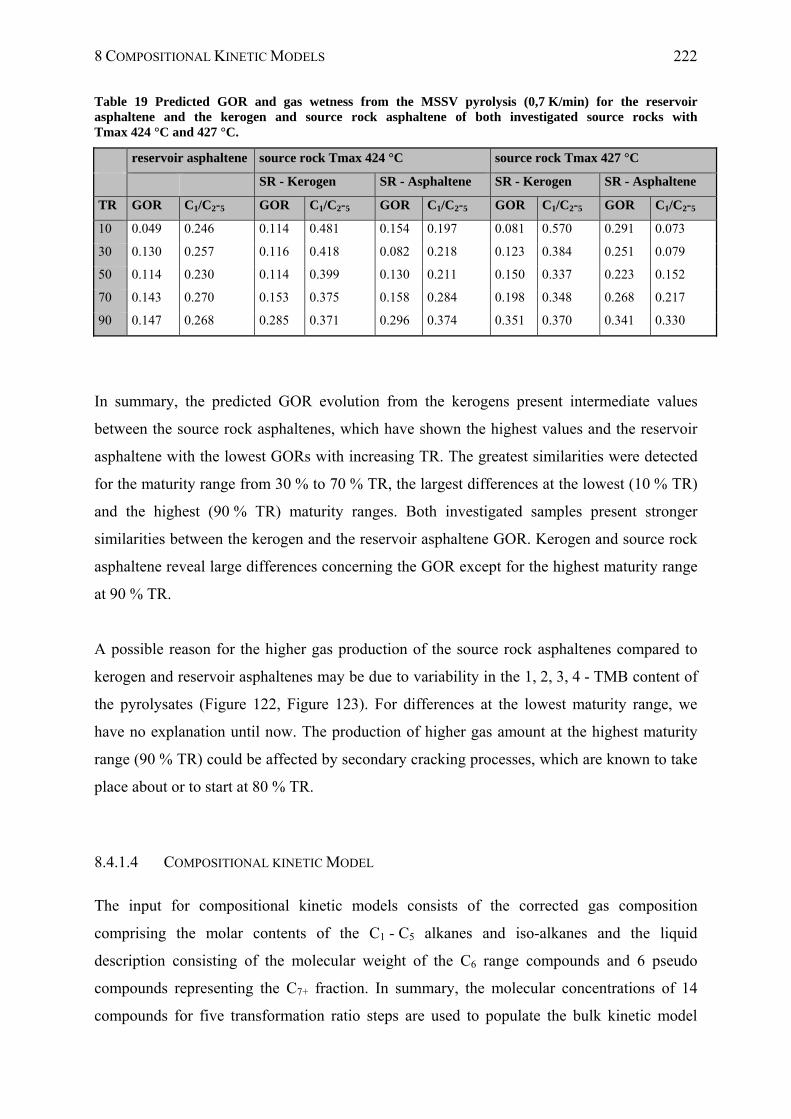
8 COMPOSITIONAL KINETIC MODELS 222
Table 19 Predicted GOR and gas wetness from the MSSV pyrolysis (0,7 K/min) for the reservoir asphaltene and the kerogen and source rock asphaltene of both investigated source rocks with Tmax 424 °C and 427 °C.
reservoir asphaltene source rock Tmax 424 °C source rock Tmax 427 °C
SR - Kerogen SR - Asphaltene SR - Kerogen SR - Asphaltene
TR GOR C1/C2-5 GOR C1/C2-5 GOR C1/C2-5 GOR C1/C2-5 GOR C1/C2-5
10 0.049 0.246 0.114 0.481 0.154 0.197 0.081 0.570 0.291 0.073
30 0.130 0.257 0.116 0.418 0.082 0.218 0.123 0.384 0.251 0.079
50 0.114 0.230 0.114 0.399 0.130 0.211 0.150 0.337 0.223 0.152
70 0.143 0.270 0.153 0.375 0.158 0.284 0.198 0.348 0.268 0.217
90 0.147 0.268 0.285 0.371 0.296 0.374 0.351 0.370 0.341 0.330
In summary, the predicted GOR evolution from the kerogens present intermediate values
between the source rock asphaltenes, which have shown the highest values and the reservoir
asphaltene with the lowest GORs with increasing TR. The greatest similarities were detected
for the maturity range from 30 % to 70 % TR, the largest differences at the lowest (10 % TR)
and the highest (90 % TR) maturity ranges. Both investigated samples present stronger
similarities between the kerogen and the reservoir asphaltene GOR. Kerogen and source rock
asphaltene reveal large differences concerning the GOR except for the highest maturity range
at 90 % TR.
A possible reason for the higher gas production of the source rock asphaltenes compared to
kerogen and reservoir asphaltenes may be due to variability in the 1, 2, 3, 4 - TMB content of
the pyrolysates (Figure 122, Figure 123). For differences at the lowest maturity range, we
have no explanation until now. The production of higher gas amount at the highest maturity
range (90 % TR) could be affected by secondary cracking processes, which are known to take
place about or to start at 80 % TR.
8.4.1.4 COMPOSITIONAL KINETIC MODEL
The input for compositional kinetic models consists of the corrected gas composition
comprising the molar contents of the C1 - C5 alkanes and iso-alkanes and the liquid
description consisting of the molecular weight of the C6 range compounds and 6 pseudo
compounds representing the C7+ fraction. In summary, the molecular concentrations of 14
compounds for five transformation ratio steps are used to populate the bulk kinetic model

8 COMPOSITIONAL KINETIC MODELS 223
with compositional information (method described in detail in di Primio and Horsfield
(2006)).
Figure 128 Compositional kinetic models from the PVT simulation of the sample from the Duvernay Formation. Left: kerogen (top) and source rock asphaltene (bottom) of the source rock Tmax 424 °C. Middle: kerogen (top) and source rock asphaltene (bottom) of the source rock Tmax 427 °C. Right: reservoir asphaltene with API 36°.
In the results for the calculated compositional kinetic models for the kerogen, source rock
asphaltene of the source rocks with Tmax temperatures of 424 °C and 427 °C, respectively,
and the reservoir asphaltene of the oil with an API gravity of 36° are shown. The physical
properties of fluids generated from each of the samples studied can be calculated using
equation of state based PVT simulators. The predicted GOR, Psat and bo for the Duvernay
Formation samples at the different degrees of transformation studied are shown in Table 20.
Table 20 Predicted GOR, bo and Psat from the PVT simulation. The range cover the predicted values from 10% - 90% TR.
Predicted data Tmax 424 °C Tmax 427 °C GOR bo Psat GOR bo Psat Sm³/Sm³ m³/Sm³ MPa Sm³/Sm³ m³/Sm³ MPa
SR - kerogen 141-236 1.54-1.83 137-207 111-253 1.56-2.12 191-259 SR - asphaltene 164-336 1.39-1.95 160-180 276-366 1.98-2.16 205-298 reservoir asphaltene 46-169 1.22-1.56 70-218 46-169 1.22-1.56 70-218
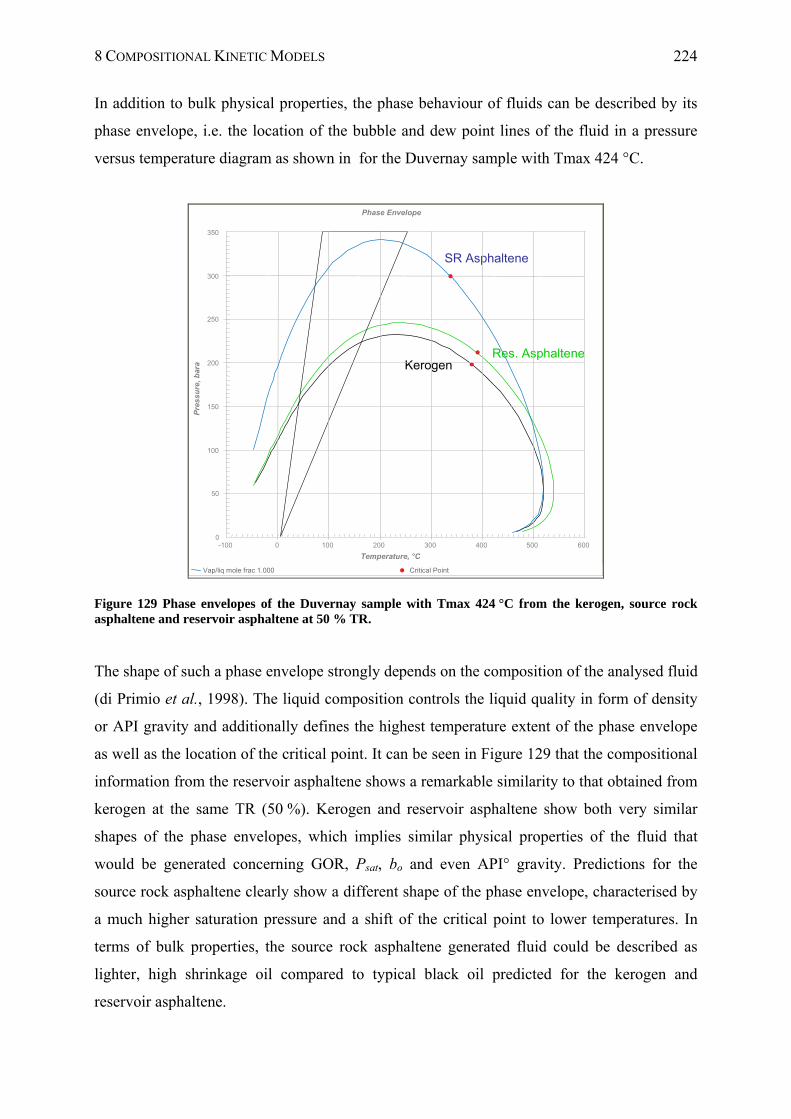
8 COMPOSITIONAL KINETIC MODELS 224
In addition to bulk physical properties, the phase behaviour of fluids can be described by its
phase envelope, i.e. the location of the bubble and dew point lines of the fluid in a pressure
versus temperature diagram as shown in for the Duvernay sample with Tmax 424 °C.
KerogenRes. Asphaltene
SR Asphaltene
Vap/liq mole frac 1.000 Critical Point
0
50
100
150
200
250
300
350
-100 0 100 200 300 400 500 600
Pre
ss
ure
, bar
a
Phase EnvelopePhase Envelope
Temperature, °C
KerogenRes. Asphaltene
SR Asphaltene
Vap/liq mole frac 1.000 Critical Point
0
50
100
150
200
250
300
350
-100 0 100 200 300 400 500 600
Pre
ss
ure
, bar
a
Phase EnvelopePhase Envelope
Temperature, °C
Figure 129 Phase envelopes of the Duvernay sample with Tmax 424 °C from the kerogen, source rock asphaltene and reservoir asphaltene at 50 % TR.
The shape of such a phase envelope strongly depends on the composition of the analysed fluid
(di Primio et al., 1998). The liquid composition controls the liquid quality in form of density
or API gravity and additionally defines the highest temperature extent of the phase envelope
as well as the location of the critical point. It can be seen in Figure 129 that the compositional
information from the reservoir asphaltene shows a remarkable similarity to that obtained from
kerogen at the same TR (50 %). Kerogen and reservoir asphaltene show both very similar
shapes of the phase envelopes, which implies similar physical properties of the fluid that
would be generated concerning GOR, Psat, bo and even API° gravity. Predictions for the
source rock asphaltene clearly show a different shape of the phase envelope, characterised by
a much higher saturation pressure and a shift of the critical point to lower temperatures. In
terms of bulk properties, the source rock asphaltene generated fluid could be described as
lighter, high shrinkage oil compared to typical black oil predicted for the kerogen and
reservoir asphaltene.
8 COMPOSITIONAL KINETIC MODELS 225
The black triangle in represents roughly the extent of natural pressure and temperature ranges
encountered in sedimentary basins.
8.4.2 DRAUPNE FORMATION
In order to show how far PhaseKinetic parameters calculated on kerogen and tar mat
asphaltenes are comparable data sets of Erdmann (1999) and Keym (2007) were used. These
set comprising data from the open system pyrolysis-GC, bulk kinetic parameters and MSSV
pyrolysis data. The same characterisation steps as described for the Duvernay Formation will
be presented in this section in a shorter form.
8.4.2.1 PREDICTING PETROLEUM COMPOSITION
Pyrolysis-GC analysis of the tar mat asphaltenes indicates a continuous series of n-alkenes/n-
alkanes and shows a similar pattern as that observed in the Draupne source rock pyrolysate
(Keym, 2007). The Draupne source rock kerogen is characterised by the abundance of
saturated and monounsaturated aliphatic hydrocarbons and shows the most prominent
components in the C1 - C7 range. Further a large variety of monoaromatic and diaromatic
components and their sulphur-containing counterparts are present (Erdmann, 1999).
The CLD ternary of (Horsfield, 1989) was used to show the composition of hydrocarbons
generated in Py-GC based on the alkyl chain length distribution. Here the tar mat as well as
the source rock kerogen plot in the P-N-A low wax oil field. The source rock kerogen shows a
higher potential for gas and condensate generation as compared to the tar mat asphaltenes.
Keym (2007) observed that the investigated tar mat asphaltenes show a very good fit to the
source rock kerogen and to the related oil asphaltenes.
8.4.2.2 BULK KINETIC PARAMETERS
In Figure 130 the distribution of activation energies and frequency factors for the source rock
kerogen (Tmax 428 °C, left) and the tar mat asphaltene (right) are shown. The narrow Ea
distribution of the source rock kerogen kinetics indicates a homogeneous organic matter type.
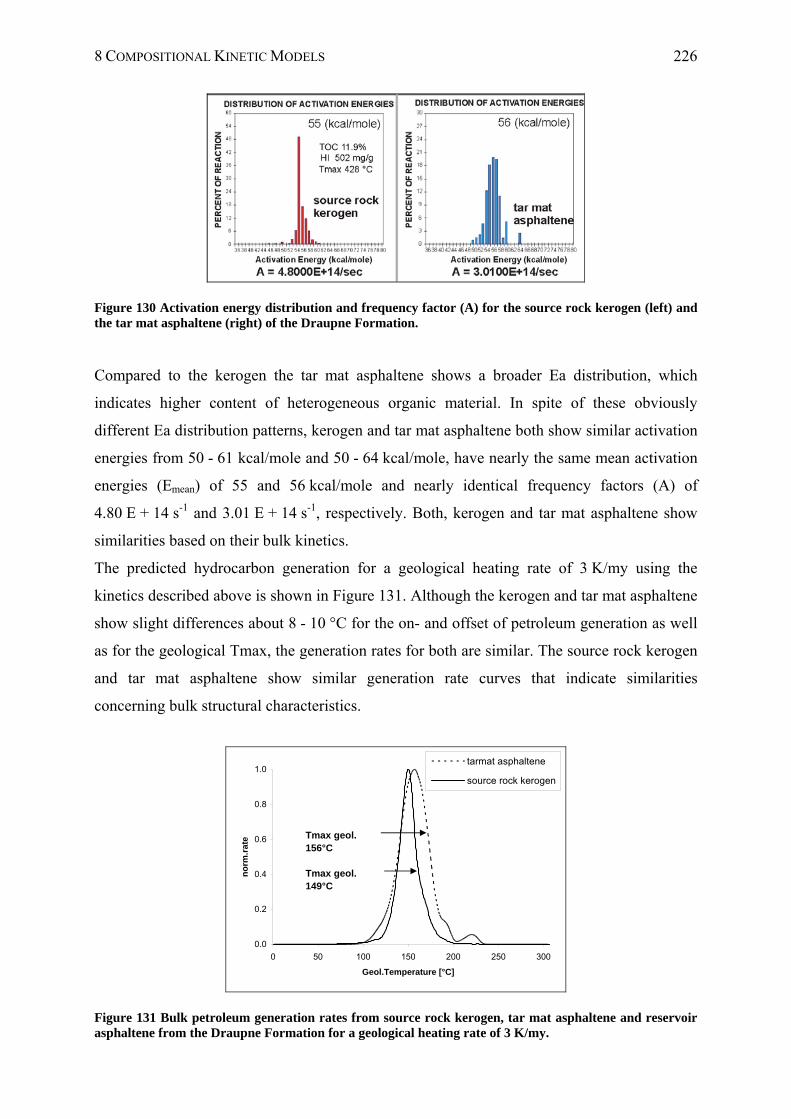
8 COMPOSITIONAL KINETIC MODELS 226
Figure 130 Activation energy distribution and frequency factor (A) for the source rock kerogen (left) and the tar mat asphaltene (right) of the Draupne Formation.
Compared to the kerogen the tar mat asphaltene shows a broader Ea distribution, which
indicates higher content of heterogeneous organic material. In spite of these obviously
different Ea distribution patterns, kerogen and tar mat asphaltene both show similar activation
energies from 50 - 61 kcal/mole and 50 - 64 kcal/mole, have nearly the same mean activation
energies (Emean) of 55 and 56 kcal/mole and nearly identical frequency factors (A) of
4.80 E + 14 s-1 and 3.01 E + 14 s-1, respectively. Both, kerogen and tar mat asphaltene show
similarities based on their bulk kinetics.
The predicted hydrocarbon generation for a geological heating rate of 3 K/my using the
kinetics described above is shown in Figure 131. Although the kerogen and tar mat asphaltene
show slight differences about 8 - 10 °C for the on- and offset of petroleum generation as well
as for the geological Tmax, the generation rates for both are similar. The source rock kerogen
and tar mat asphaltene show similar generation rate curves that indicate similarities
concerning bulk structural characteristics.
0.0
0.2
0.4
0.6
0.8
1.0
0 50 100 150 200 250 300
Geol.Temperature [°C]
no
rm.r
ate
tarmat asphaltene
source rock kerogen
Tmax geol. 149°C
Tmax geol. 156°C
Figure 131 Bulk petroleum generation rates from source rock kerogen, tar mat asphaltene and reservoir asphaltene from the Draupne Formation for a geological heating rate of 3 K/my.
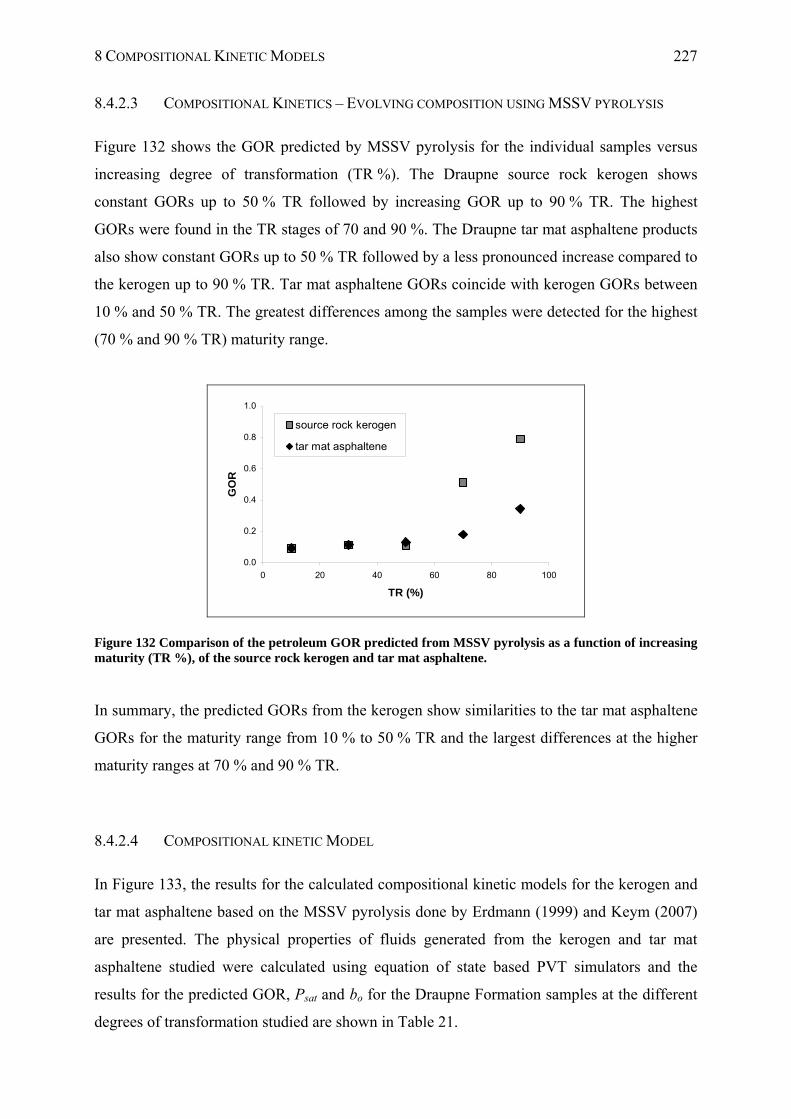
8 COMPOSITIONAL KINETIC MODELS 227
8.4.2.3 COMPOSITIONAL KINETICS – EVOLVING COMPOSITION USING MSSV PYROLYSIS
Figure 132 shows the GOR predicted by MSSV pyrolysis for the individual samples versus
increasing degree of transformation (TR %). The Draupne source rock kerogen shows
constant GORs up to 50 % TR followed by increasing GOR up to 90 % TR. The highest
GORs were found in the TR stages of 70 and 90 %. The Draupne tar mat asphaltene products
also show constant GORs up to 50 % TR followed by a less pronounced increase compared to
the kerogen up to 90 % TR. Tar mat asphaltene GORs coincide with kerogen GORs between
10 % and 50 % TR. The greatest differences among the samples were detected for the highest
(70 % and 90 % TR) maturity range.
0.0
0.2
0.4
0.6
0.8
1.0
0 20 40 60 80 100
TR (%)
GO
R
source rock kerogen
tar mat asphaltene
Figure 132 Comparison of the petroleum GOR predicted from MSSV pyrolysis as a function of increasing maturity (TR %), of the source rock kerogen and tar mat asphaltene.
In summary, the predicted GORs from the kerogen show similarities to the tar mat asphaltene
GORs for the maturity range from 10 % to 50 % TR and the largest differences at the higher
maturity ranges at 70 % and 90 % TR.
8.4.2.4 COMPOSITIONAL KINETIC MODEL
In Figure 133, the results for the calculated compositional kinetic models for the kerogen and
tar mat asphaltene based on the MSSV pyrolysis done by Erdmann (1999) and Keym (2007)
are presented. The physical properties of fluids generated from the kerogen and tar mat
asphaltene studied were calculated using equation of state based PVT simulators and the
results for the predicted GOR, Psat and bo for the Draupne Formation samples at the different
degrees of transformation studied are shown in Table 21.
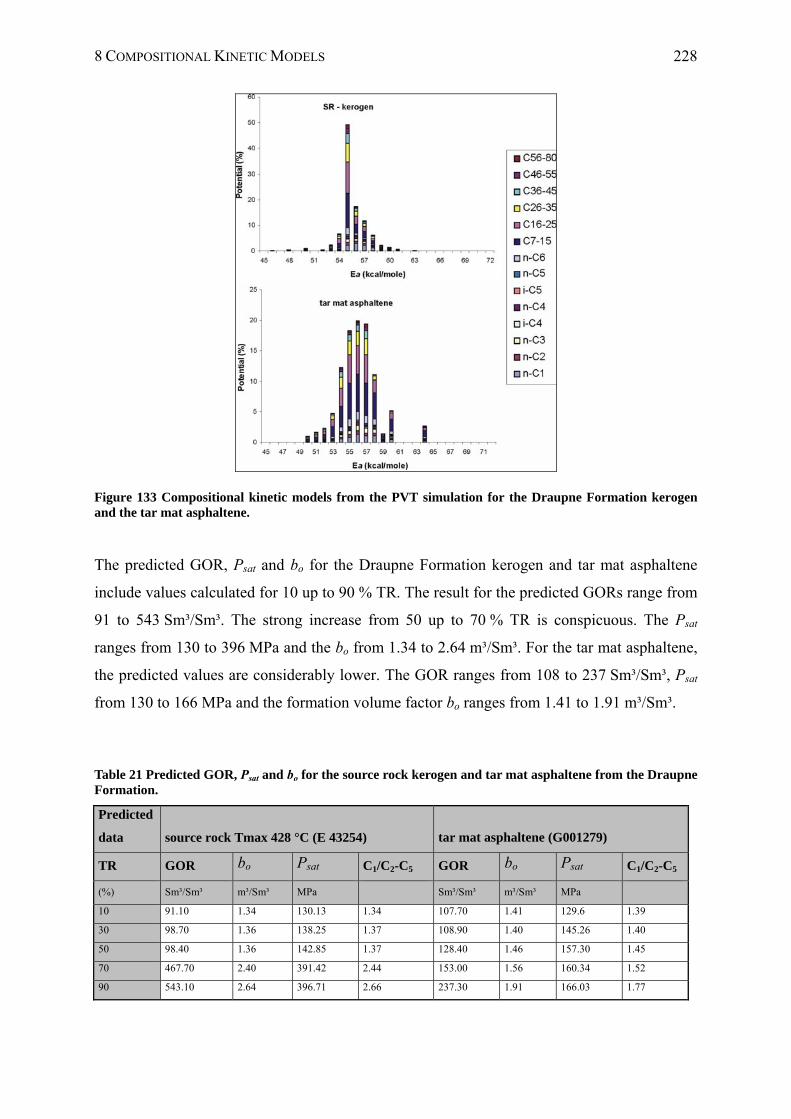
8 COMPOSITIONAL KINETIC MODELS 228
Figure 133 Compositional kinetic models from the PVT simulation for the Draupne Formation kerogen and the tar mat asphaltene.
The predicted GOR, Psat and bo for the Draupne Formation kerogen and tar mat asphaltene
include values calculated for 10 up to 90 % TR. The result for the predicted GORs range from
91 to 543 Sm³/Sm³. The strong increase from 50 up to 70 % TR is conspicuous. The Psat
ranges from 130 to 396 MPa and the bo from 1.34 to 2.64 m³/Sm³. For the tar mat asphaltene,
the predicted values are considerably lower. The GOR ranges from 108 to 237 Sm³/Sm³, Psat
from 130 to 166 MPa and the formation volume factor bo ranges from 1.41 to 1.91 m³/Sm³.
Table 21 Predicted GOR, Psat and bo for the source rock kerogen and tar mat asphaltene from the Draupne Formation.
Predicted
data source rock Tmax 428 °C (E 43254) tar mat asphaltene (G001279)
TR GOR bo Psat C1/C2-C5 GOR bo Psat C1/C2-C5
(%) Sm³/Sm³ m³/Sm³ MPa Sm³/Sm³ m³/Sm³ MPa
10 91.10 1.34 130.13 1.34 107.70 1.41 129.6 1.39
30 98.70 1.36 138.25 1.37 108.90 1.40 145.26 1.40
50 98.40 1.36 142.85 1.37 128.40 1.46 157.30 1.45
70 467.70 2.40 391.42 2.44 153.00 1.56 160.34 1.52
90 543.10 2.64 396.71 2.66 237.30 1.91 166.03 1.77
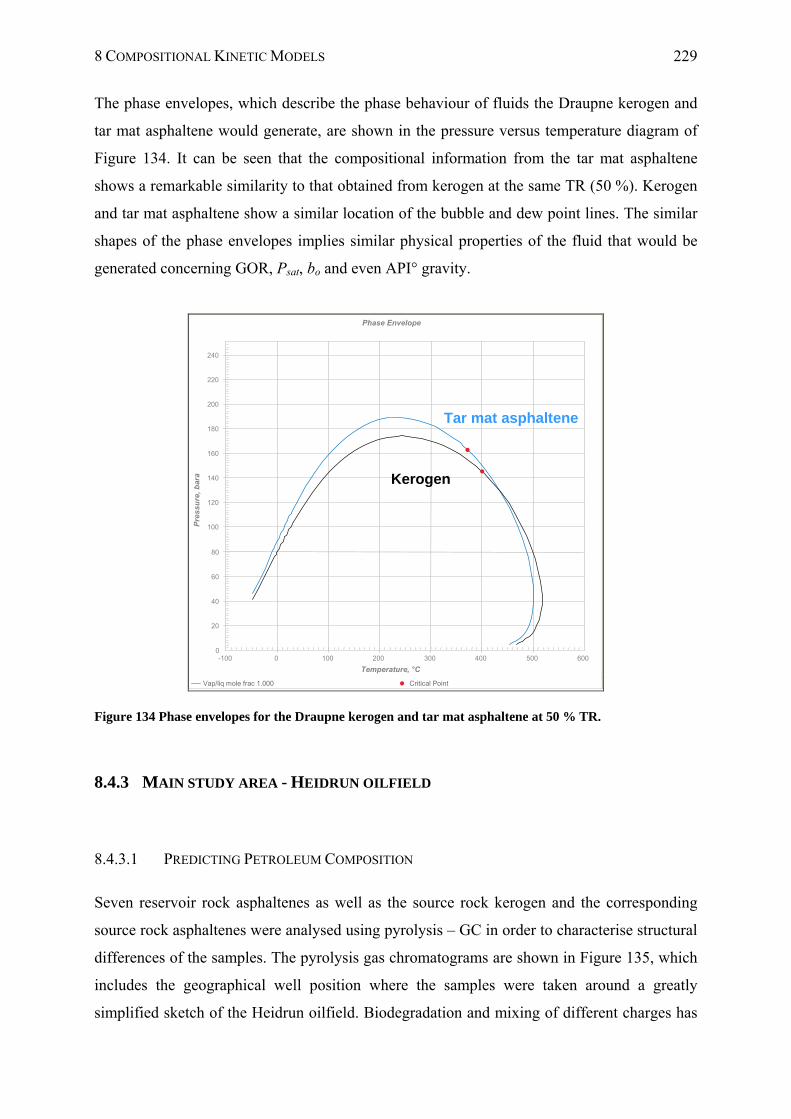
8 COMPOSITIONAL KINETIC MODELS 229
The phase envelopes, which describe the phase behaviour of fluids the Draupne kerogen and
tar mat asphaltene would generate, are shown in the pressure versus temperature diagram of
Figure 134. It can be seen that the compositional information from the tar mat asphaltene
shows a remarkable similarity to that obtained from kerogen at the same TR (50 %). Kerogen
and tar mat asphaltene show a similar location of the bubble and dew point lines. The similar
shapes of the phase envelopes implies similar physical properties of the fluid that would be
generated concerning GOR, Psat, bo and even API° gravity.
Vap/liq mole frac 1.000 Critical Point
0
20
40
60
80
100
120
140
160
180
200
220
240
-100 0 100 200 300 400 500 600
Pre
ssu
re,
bar
a
Phase EnvelopePhase EnvelopeDraupneResA 50 EOS = SRK Peneloux
Temperature, °C
Vap/liq mole frac 1.000 Critical Point
0
20
40
60
80
100
120
140
160
180
200
220
240
-100 0 100 200 300 400 500 600
Pre
ssu
re,
bar
a
Phase EnvelopePhase EnvelopeDraupneResA 50 EOS = SRK Peneloux
Temperature, °C
Vap/liq mole frac 1.000 Critical Point
0
20
40
60
80
100
120
140
160
180
200
220
240
Vap/liq mole frac 1.000 Critical Point
0
20
40
60
80
100
120
140
160
180
200
220
240
-100 0 100 200 300 400 500 600
Pre
ssu
re,
bar
a
Phase EnvelopePhase EnvelopeDraupneResA 50 EOS = SRK Peneloux
Temperature, °C
Kerogen
Tar mat asphaltene
Figure 134 Phase envelopes for the Draupne kerogen and tar mat asphaltene at 50 % TR.
8.4.3 MAIN STUDY AREA - HEIDRUN OILFIELD
8.4.3.1 PREDICTING PETROLEUM COMPOSITION
Seven reservoir rock asphaltenes as well as the source rock kerogen and the corresponding
source rock asphaltenes were analysed using pyrolysis – GC in order to characterise structural
differences of the samples. The pyrolysis gas chromatograms are shown in Figure 135, which
includes the geographical well position where the samples were taken around a greatly
simplified sketch of the Heidrun oilfield. Biodegradation and mixing of different charges has
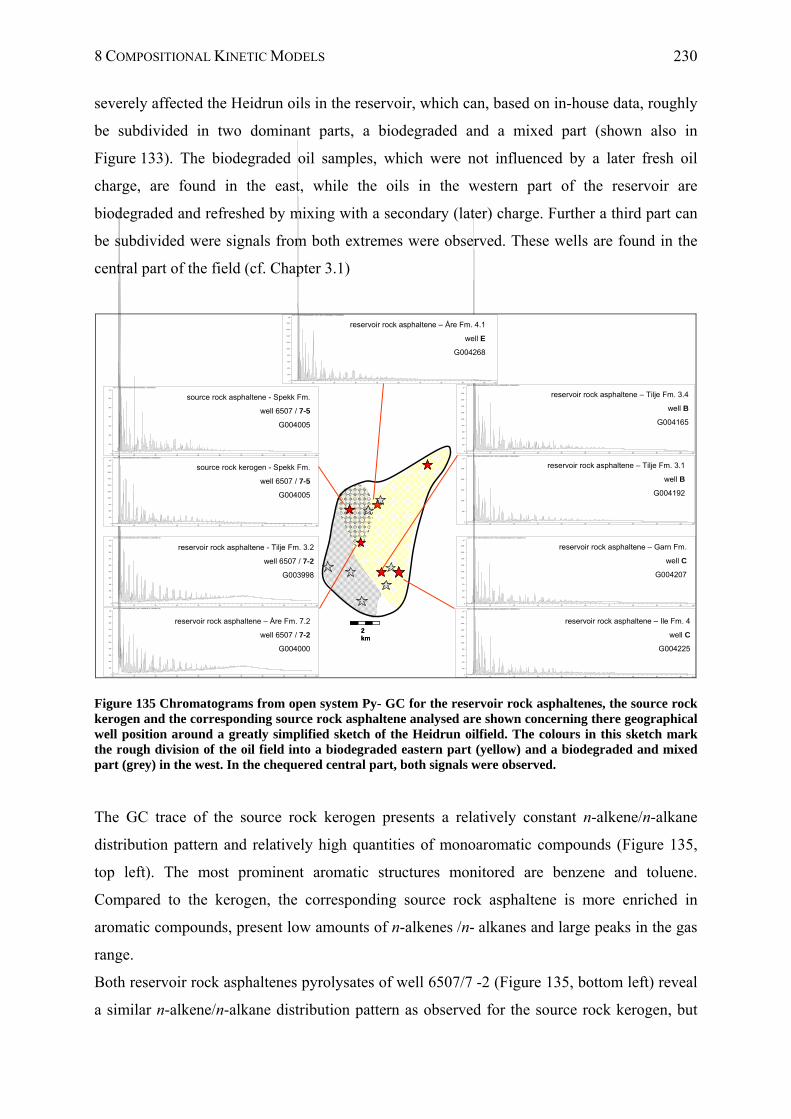
8 COMPOSITIONAL KINETIC MODELS 230
severely affected the Heidrun oils in the reservoir, which can, based on in-house data, roughly
be subdivided in two dominant parts, a biodegraded and a mixed part (shown also in
Figure 133). The biodegraded oil samples, which were not influenced by a later fresh oil
charge, are found in the east, while the oils in the western part of the reservoir are
biodegraded and refreshed by mixing with a secondary (later) charge. Further a third part can
be subdivided were signals from both extremes were observed. These wells are found in the
central part of the field (cf. Chapter 3.1)
min10 20 30 40 50 60 70 80 90 100
pA
0
500
1000
1500
2000
2500
FID1 A, (C:\DATEN\HEIDRUN\RC_ASP~1\RCA_II\G004192B.D\..\G004192B.D)
reservoir rock asphaltene – Tilje Fm. 3.1
well B
G004192
min10 20 30 40 50 60 70 80 90 100
pA
0
200
400
600
800
1000
1200
1400
1600
1800
FID1 A, (C:\DATEN\HEIDRUN\RC_ASP~1\RCA_II\G004165B.D\..\G004165B.D)
reservoir rock asphaltene – Tilje Fm. 3.4
well B
G004165
min10 20 30 40 50 60 70 80 90 100
pA
0
250
500
750
1000
1250
1500
1750
2000
2250
FID1 A, (C:\DATEN\HEIDRUN\RC_ASP~1\RCA_II\G004207\G004207C.D\..\G004207C.D)
reservoir rock asphaltene – Garn Fm.
well C
G004207
min10 20 30 40 50 60 70 80 90 100
pA
0
200
400
600
800
1000
1200
1400
1600
1800
FID1 A, (C:\DATEN\HEIDRUN\RC_ASP~1\RCA_II\G004225C.D\..\G004225C.D)
reservoir rock asphaltene – Ile Fm. 4
well C
G004225
min10 20 30 40 50 60 70 80 90 100
pA
0
200
400
600
800
1000
1200
1400
1600
1800
FID1 A, (C:\DATEN\HEIDRUN\RC_ASP~1\RCA_II\G004268B.D\..\G004268B.D)
reservoir rock asphaltene – Åre Fm. 4.1
well E
G004268
min10 20 30 40 50 60 70 80 90 100
pA
0
100
200
300
400
500
600
700
800
900
FID1 A, (C:\DATEN\HEIDRUN\RC_ASP~1\G003998C.D\..\G003998C.D)
reservoir rock asphaltene - Tilje Fm. 3.2
well 6507 / 7-2
G003998
min10 20 30 40 50 60 70 80 90 100
pA
0
100
200
300
400
500
600
700
800
900
FID1 A, (C:\DATEN\HEIDRUN\RC_ASP~1\G004000C.D\..\G004000C.D)
reservoir rock asphaltene – Åre Fm. 7.2
well 6507 / 7-2
G004000
min10 20 30 40 50 60 70 80 90 100
pA
0
100
200
300
400
500
600
FID1 A, (C:\DATEN\HEIDRUN\SRA\G004005B.D\..\G004005B.D)
source rock asphaltene - Spekk Fm.
well 6507 / 7-5
G004005
min10 20 30 40 50 60 70 80 90 100
pA
0
250
500
750
1000
1250
1500
1750
2000
2250
FID1 A, (C:\DATEN\HEIDRUN\RC_SCR~1\G004005B.D\..\G004005B.D)
source rock kerogen - Spekk Fm.
well 6507 / 7-5
G004005
2 km2 km
Figure 135 Chromatograms from open system Py- GC for the reservoir rock asphaltenes, the source rock kerogen and the corresponding source rock asphaltene analysed are shown concerning there geographical well position around a greatly simplified sketch of the Heidrun oilfield. The colours in this sketch mark the rough division of the oil field into a biodegraded eastern part (yellow) and a biodegraded and mixed part (grey) in the west. In the chequered central part, both signals were observed.
The GC trace of the source rock kerogen presents a relatively constant n-alkene/n-alkane
distribution pattern and relatively high quantities of monoaromatic compounds (Figure 135,
top left). The most prominent aromatic structures monitored are benzene and toluene.
Compared to the kerogen, the corresponding source rock asphaltene is more enriched in
aromatic compounds, present low amounts of n-alkenes /n- alkanes and large peaks in the gas
range.
Both reservoir rock asphaltenes pyrolysates of well 6507/7 -2 (Figure 135, bottom left) reveal
a similar n-alkene/n-alkane distribution pattern as observed for the source rock kerogen, but
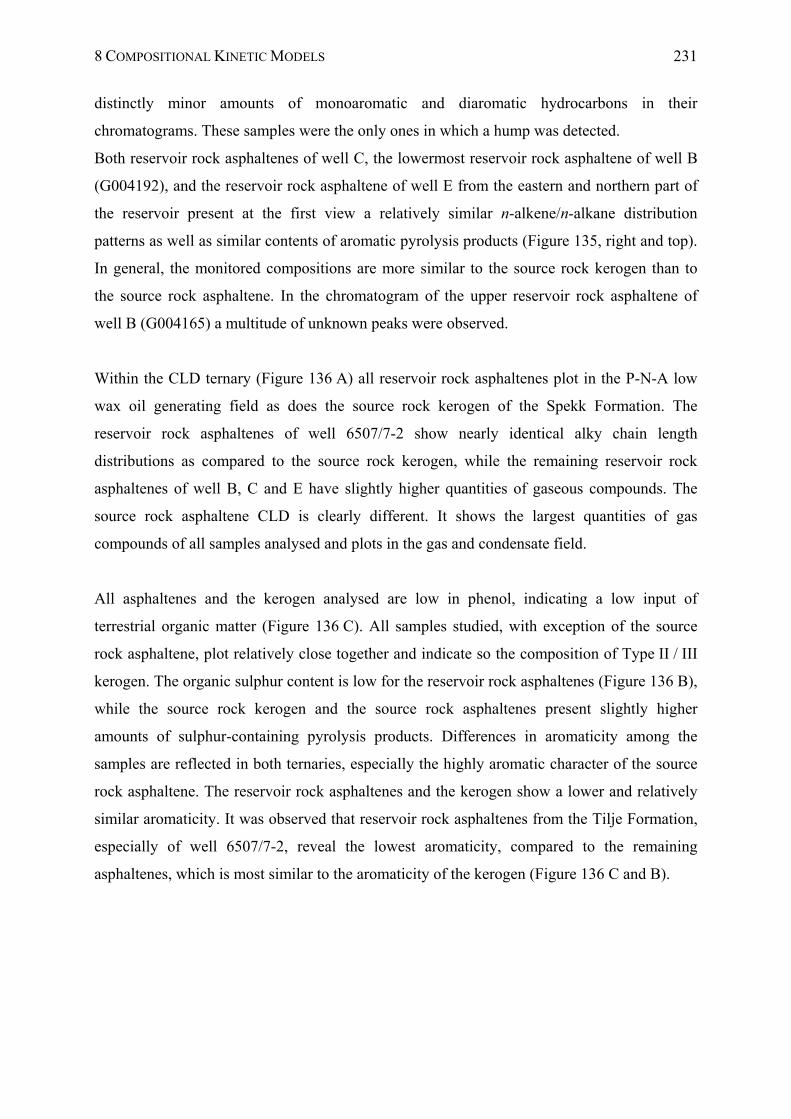
8 COMPOSITIONAL KINETIC MODELS 231
distinctly minor amounts of monoaromatic and diaromatic hydrocarbons in their
chromatograms. These samples were the only ones in which a hump was detected.
Both reservoir rock asphaltenes of well C, the lowermost reservoir rock asphaltene of well B
(G004192), and the reservoir rock asphaltene of well E from the eastern and northern part of
the reservoir present at the first view a relatively similar n-alkene/n-alkane distribution
patterns as well as similar contents of aromatic pyrolysis products (Figure 135, right and top).
In general, the monitored compositions are more similar to the source rock kerogen than to
the source rock asphaltene. In the chromatogram of the upper reservoir rock asphaltene of
well B (G004165) a multitude of unknown peaks were observed.
Within the CLD ternary (Figure 136 A) all reservoir rock asphaltenes plot in the P-N-A low
wax oil generating field as does the source rock kerogen of the Spekk Formation. The
reservoir rock asphaltenes of well 6507/7-2 show nearly identical alky chain length
distributions as compared to the source rock kerogen, while the remaining reservoir rock
asphaltenes of well B, C and E have slightly higher quantities of gaseous compounds. The
source rock asphaltene CLD is clearly different. It shows the largest quantities of gas
compounds of all samples analysed and plots in the gas and condensate field.
All asphaltenes and the kerogen analysed are low in phenol, indicating a low input of
terrestrial organic matter (Figure 136 C). All samples studied, with exception of the source
rock asphaltene, plot relatively close together and indicate so the composition of Type II / III
kerogen. The organic sulphur content is low for the reservoir rock asphaltenes (Figure 136 B),
while the source rock kerogen and the source rock asphaltenes present slightly higher
amounts of sulphur-containing pyrolysis products. Differences in aromaticity among the
samples are reflected in both ternaries, especially the highly aromatic character of the source
rock asphaltene. The reservoir rock asphaltenes and the kerogen show a lower and relatively
similar aromaticity. It was observed that reservoir rock asphaltenes from the Tilje Formation,
especially of well 6507/7-2, reveal the lowest aromaticity, compared to the remaining
asphaltenes, which is most similar to the aromaticity of the kerogen (Figure 136 C and B).
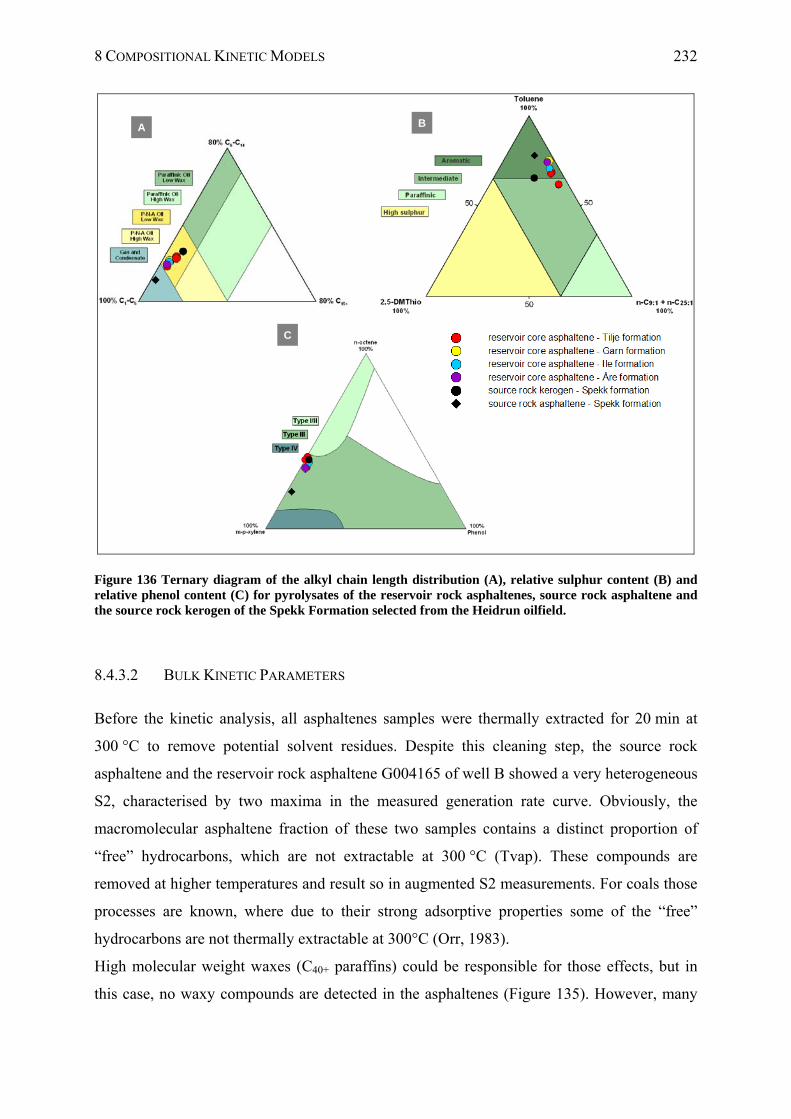
8 COMPOSITIONAL KINETIC MODELS 232
A B
C
Figure 136 Ternary diagram of the alkyl chain length distribution (A), relative sulphur content (B) and relative phenol content (C) for pyrolysates of the reservoir rock asphaltenes, source rock asphaltene and the source rock kerogen of the Spekk Formation selected from the Heidrun oilfield.
8.4.3.2 BULK KINETIC PARAMETERS
Before the kinetic analysis, all asphaltenes samples were thermally extracted for 20 min at
300 °C to remove potential solvent residues. Despite this cleaning step, the source rock
asphaltene and the reservoir rock asphaltene G004165 of well B showed a very heterogeneous
S2, characterised by two maxima in the measured generation rate curve. Obviously, the
macromolecular asphaltene fraction of these two samples contains a distinct proportion of
“free” hydrocarbons, which are not extractable at 300 °C (Tvap). These compounds are
removed at higher temperatures and result so in augmented S2 measurements. For coals those
processes are known, where due to their strong adsorptive properties some of the “free”
hydrocarbons are not thermally extractable at 300°C (Orr, 1983).
High molecular weight waxes (C40+ paraffins) could be responsible for those effects, but in
this case, no waxy compounds are detected in the asphaltenes (Figure 135). However, many
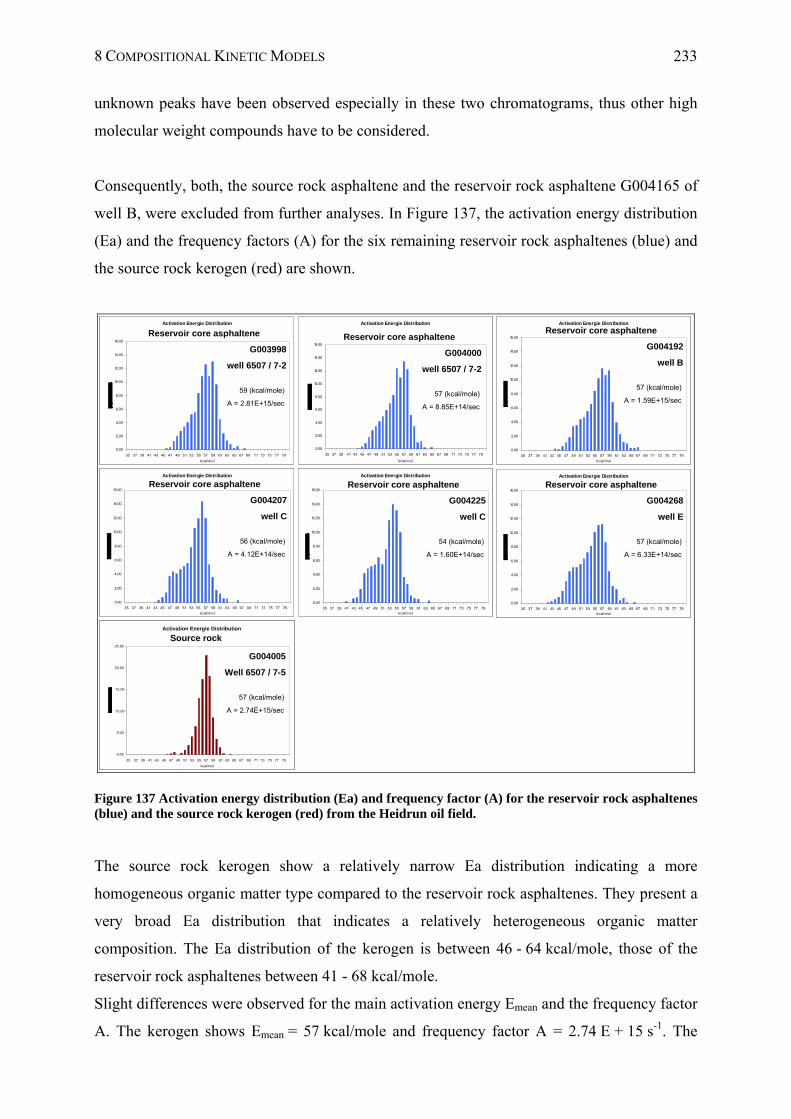
8 COMPOSITIONAL KINETIC MODELS 233
unknown peaks have been observed especially in these two chromatograms, thus other high
molecular weight compounds have to be considered.
Consequently, both, the source rock asphaltene and the reservoir rock asphaltene G004165 of
well B, were excluded from further analyses. In Figure 137, the activation energy distribution
(Ea) and the frequency factors (A) for the six remaining reservoir rock asphaltenes (blue) and
the source rock kerogen (red) are shown.
Activation Energie Distribution
0.00
5.00
10.00
15.00
20.00
25.00
35 37 39 41 43 45 47 49 51 53 55 57 59 61 63 65 67 69 71 73 75 77 79
kcal/mol
Activation Energie Distribution
0.00
5.00
10.00
15.00
20.00
25.00
35 37 39 41 43 45 47 49 51 53 55 57 59 61 63 65 67 69 71 73 75 77 79
kcal/mol
Activation Energie Distribution
0.00
2.00
4.00
6.00
8.00
10.00
12.00
14.00
16.00
35 37 39 41 43 45 47 49 51 53 55 57 59 61 63 65 67 69 71 73 75 77 79
kcal/mol
Reservoir core asphaltene
G003998
well 6507 / 7-2
59 (kcal/mole)
A = 2.81E+15/sec
Activation Energie Distribution
0.00
2.00
4.00
6.00
8.00
10.00
12.00
14.00
16.00
35 37 39 41 43 45 47 49 51 53 55 57 59 61 63 65 67 69 71 73 75 77 79
kcal/mol
Reservoir core asphaltene
G003998
well 6507 / 7-2
59 (kcal/mole)
A = 2.81E+15/sec
Activation Energie Distribution
0.00
2.00
4.00
6.00
8.00
10.00
12.00
14.00
16.00
35 37 39 41 43 45 47 49 51 53 55 57 59 61 63 65 67 69 71 73 75 77 79
kcal/mol
Reservoir core asphaltene
G004000
well 6507 / 7-2
57 (kcal/mole)
A = 8.85E+14/sec
Activation Energie Distribution
0.00
2.00
4.00
6.00
8.00
10.00
12.00
14.00
16.00
35 37 39 41 43 45 47 49 51 53 55 57 59 61 63 65 67 69 71 73 75 77 79
kcal/mol
Reservoir core asphaltene
G004000
well 6507 / 7-2
57 (kcal/mole)
A = 8.85E+14/sec
Activation Energie Distribution
0.00
2.00
4.00
6.00
8.00
10.00
12.00
14.00
16.00
35 37 39 41 43 45 47 49 51 53 55 57 59 61 63 65 67 69 71 73 75 77 79
kcal/mol
Reservoir core asphaltene
G004192
well B
57 (kcal/mole)
A = 1.59E+15/sec
Activation Energie Distribution
0.00
2.00
4.00
6.00
8.00
10.00
12.00
14.00
16.00
35 37 39 41 43 45 47 49 51 53 55 57 59 61 63 65 67 69 71 73 75 77 79
kcal/mol
Reservoir core asphaltene
G004192
well B
57 (kcal/mole)
A = 1.59E+15/sec
Activation Energie Distribution
0.00
2.00
4.00
6.00
8.00
10.00
12.00
14.00
16.00
35 37 39 41 43 45 47 49 51 53 55 57 59 61 63 65 67 69 71 73 75 77 79
kcal/mol
Reservoir core asphaltene
G004207
well C
56 (kcal/mole)
A = 4.12E+14/sec
Activation Energie Distribution
0.00
2.00
4.00
6.00
8.00
10.00
12.00
14.00
16.00
35 37 39 41 43 45 47 49 51 53 55 57 59 61 63 65 67 69 71 73 75 77 79
kcal/mol
Reservoir core asphaltene
G004207
well C
56 (kcal/mole)
A = 4.12E+14/sec
Activation Energie Distribution
0.00
2.00
4.00
6.00
8.00
10.00
12.00
14.00
16.00
35 37 39 41 43 45 47 49 51 53 55 57 59 61 63 65 67 69 71 73 75 77 79kcal/mol
Reservoir core asphaltene
G004225
well C
54 (kcal/mole)
A = 1.60E+14/sec
Activation Energie Distribution
0.00
2.00
4.00
6.00
8.00
10.00
12.00
14.00
16.00
35 37 39 41 43 45 47 49 51 53 55 57 59 61 63 65 67 69 71 73 75 77 79kcal/mol
Reservoir core asphaltene
G004225
well C
54 (kcal/mole)
A = 1.60E+14/sec
Activation Energie Distribution
0.00
2.00
4.00
6.00
8.00
10.00
12.00
14.00
16.00
35 37 39 41 43 45 47 49 51 53 55 57 59 61 63 65 67 69 71 73 75 77 79kcal/mol
Reservoir core asphaltene
G004268
well E
57 (kcal/mole)
A = 6.33E+14/sec
Activation Energie Distribution
0.00
2.00
4.00
6.00
8.00
10.00
12.00
14.00
16.00
35 37 39 41 43 45 47 49 51 53 55 57 59 61 63 65 67 69 71 73 75 77 79kcal/mol
Reservoir core asphaltene
G004268
well E
57 (kcal/mole)
A = 6.33E+14/sec
Source rock
G004005
Well 6507 / 7-5
57 (kcal/mole)
A = 2.74E+15/sec
Figure 137 Activation energy distribution (Ea) and frequency factor (A) for the reservoir rock asphaltenes (blue) and the source rock kerogen (red) from the Heidrun oil field.
The source rock kerogen show a relatively narrow Ea distribution indicating a more
homogeneous organic matter type compared to the reservoir rock asphaltenes. They present a
very broad Ea distribution that indicates a relatively heterogeneous organic matter
composition. The Ea distribution of the kerogen is between 46 - 64 kcal/mole, those of the
reservoir rock asphaltenes between 41 - 68 kcal/mole.
Slight differences were observed for the main activation energy Emean and the frequency factor
A. The kerogen shows Emean = 57 kcal/mole and frequency factor A = 2.74 E + 15 s-1. The
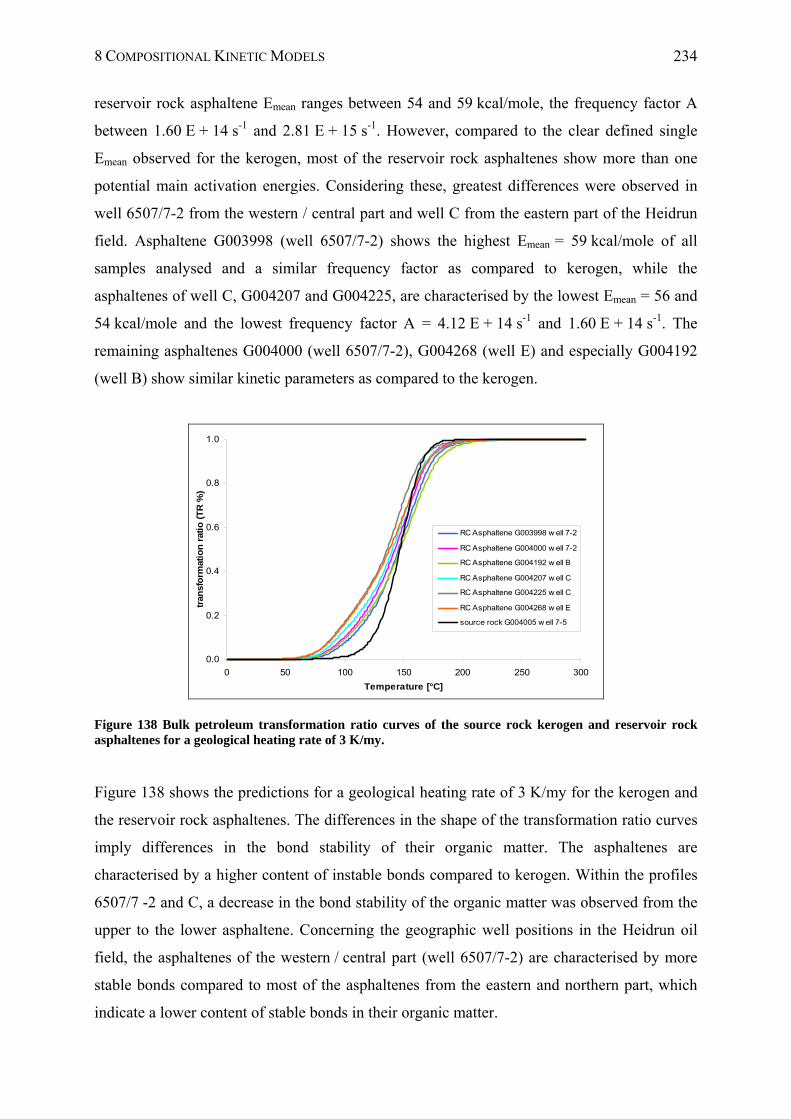
8 COMPOSITIONAL KINETIC MODELS 234
reservoir rock asphaltene Emean ranges between 54 and 59 kcal/mole, the frequency factor A
between 1.60 E + 14 s-1 and 2.81 E + 15 s-1. However, compared to the clear defined single
Emean observed for the kerogen, most of the reservoir rock asphaltenes show more than one
potential main activation energies. Considering these, greatest differences were observed in
well 6507/7-2 from the western / central part and well C from the eastern part of the Heidrun
field. Asphaltene G003998 (well 6507/7-2) shows the highest Emean = 59 kcal/mole of all
samples analysed and a similar frequency factor as compared to kerogen, while the
asphaltenes of well C, G004207 and G004225, are characterised by the lowest Emean = 56 and
54 kcal/mole and the lowest frequency factor A = 4.12 E + 14 s-1 and 1.60 E + 14 s-1. The
remaining asphaltenes G004000 (well 6507/7-2), G004268 (well E) and especially G004192
(well B) show similar kinetic parameters as compared to the kerogen.
0.0
0.2
0.4
0.6
0.8
1.0
0 50 100 150 200 250 300
Temperature [°C]
tran
sfo
rmat
ion
rat
io (
TR
%)
RC Asphaltene G003998 w ell 7-2
RC Asphaltene G004000 w ell 7-2
RC Asphaltene G004192 w ell B
RC Asphaltene G004207 w ell C
RC Asphaltene G004225 w ell C
RC Asphaltene G004268 w ell E
source rock G004005 w ell 7-5
Figure 138 Bulk petroleum transformation ratio curves of the source rock kerogen and reservoir rock asphaltenes for a geological heating rate of 3 K/my.
Figure 138 shows the predictions for a geological heating rate of 3 K/my for the kerogen and
the reservoir rock asphaltenes. The differences in the shape of the transformation ratio curves
imply differences in the bond stability of their organic matter. The asphaltenes are
characterised by a higher content of instable bonds compared to kerogen. Within the profiles
6507/7 -2 and C, a decrease in the bond stability of the organic matter was observed from the
upper to the lower asphaltene. Concerning the geographic well positions in the Heidrun oil
field, the asphaltenes of the western / central part (well 6507/7-2) are characterised by more
stable bonds compared to most of the asphaltenes from the eastern and northern part, which
indicate a lower content of stable bonds in their organic matter.
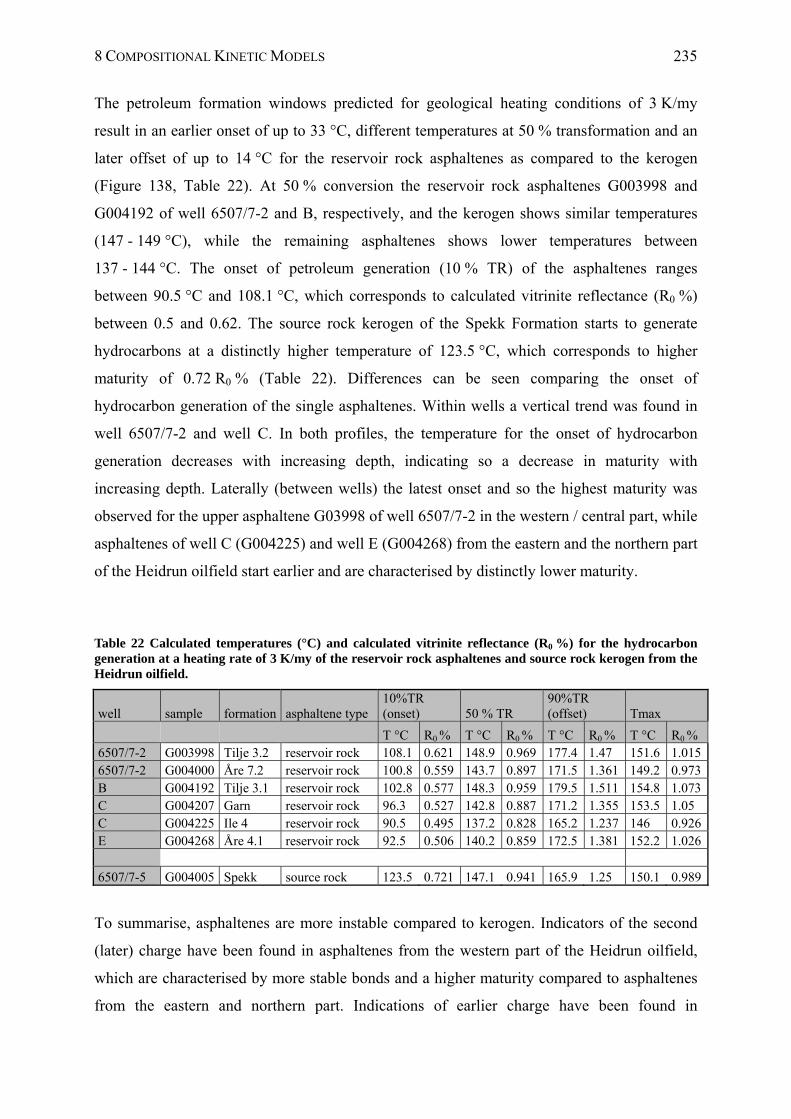
8 COMPOSITIONAL KINETIC MODELS 235
The petroleum formation windows predicted for geological heating conditions of 3 K/my
result in an earlier onset of up to 33 °C, different temperatures at 50 % transformation and an
later offset of up to 14 °C for the reservoir rock asphaltenes as compared to the kerogen
(Figure 138, Table 22). At 50 % conversion the reservoir rock asphaltenes G003998 and
G004192 of well 6507/7-2 and B, respectively, and the kerogen shows similar temperatures
(147 - 149 °C), while the remaining asphaltenes shows lower temperatures between
137 - 144 °C. The onset of petroleum generation (10 % TR) of the asphaltenes ranges
between 90.5 °C and 108.1 °C, which corresponds to calculated vitrinite reflectance (R0 %)
between 0.5 and 0.62. The source rock kerogen of the Spekk Formation starts to generate
hydrocarbons at a distinctly higher temperature of 123.5 °C, which corresponds to higher
maturity of 0.72 R0 % (Table 22). Differences can be seen comparing the onset of
hydrocarbon generation of the single asphaltenes. Within wells a vertical trend was found in
well 6507/7-2 and well C. In both profiles, the temperature for the onset of hydrocarbon
generation decreases with increasing depth, indicating so a decrease in maturity with
increasing depth. Laterally (between wells) the latest onset and so the highest maturity was
observed for the upper asphaltene G03998 of well 6507/7-2 in the western / central part, while
asphaltenes of well C (G004225) and well E (G004268) from the eastern and the northern part
of the Heidrun oilfield start earlier and are characterised by distinctly lower maturity.
Table 22 Calculated temperatures (°C) and calculated vitrinite reflectance (R0 %) for the hydrocarbon generation at a heating rate of 3 K/my of the reservoir rock asphaltenes and source rock kerogen from the Heidrun oilfield.
well sample formation asphaltene type 10%TR (onset) 50 % TR
90%TR (offset) Tmax
T °C R0 % T °C R0 % T °C R0 % T °C R0 % 6507/7-2 G003998 Tilje 3.2 reservoir rock 108.1 0.621 148.9 0.969 177.4 1.47 151.6 1.0156507/7-2 G004000 Åre 7.2 reservoir rock 100.8 0.559 143.7 0.897 171.5 1.361 149.2 0.973B G004192 Tilje 3.1 reservoir rock 102.8 0.577 148.3 0.959 179.5 1.511 154.8 1.073C G004207 Garn reservoir rock 96.3 0.527 142.8 0.887 171.2 1.355 153.5 1.05 C G004225 Ile 4 reservoir rock 90.5 0.495 137.2 0.828 165.2 1.237 146 0.926E G004268 Åre 4.1 reservoir rock 92.5 0.506 140.2 0.859 172.5 1.381 152.2 1.026
6507/7-5 G004005 Spekk source rock 123.5 0.721 147.1 0.941 165.9 1.25 150.1 0.989
To summarise, asphaltenes are more instable compared to kerogen. Indicators of the second
(later) charge have been found in asphaltenes from the western part of the Heidrun oilfield,
which are characterised by more stable bonds and a higher maturity compared to asphaltenes
from the eastern and northern part. Indications of earlier charge have been found in
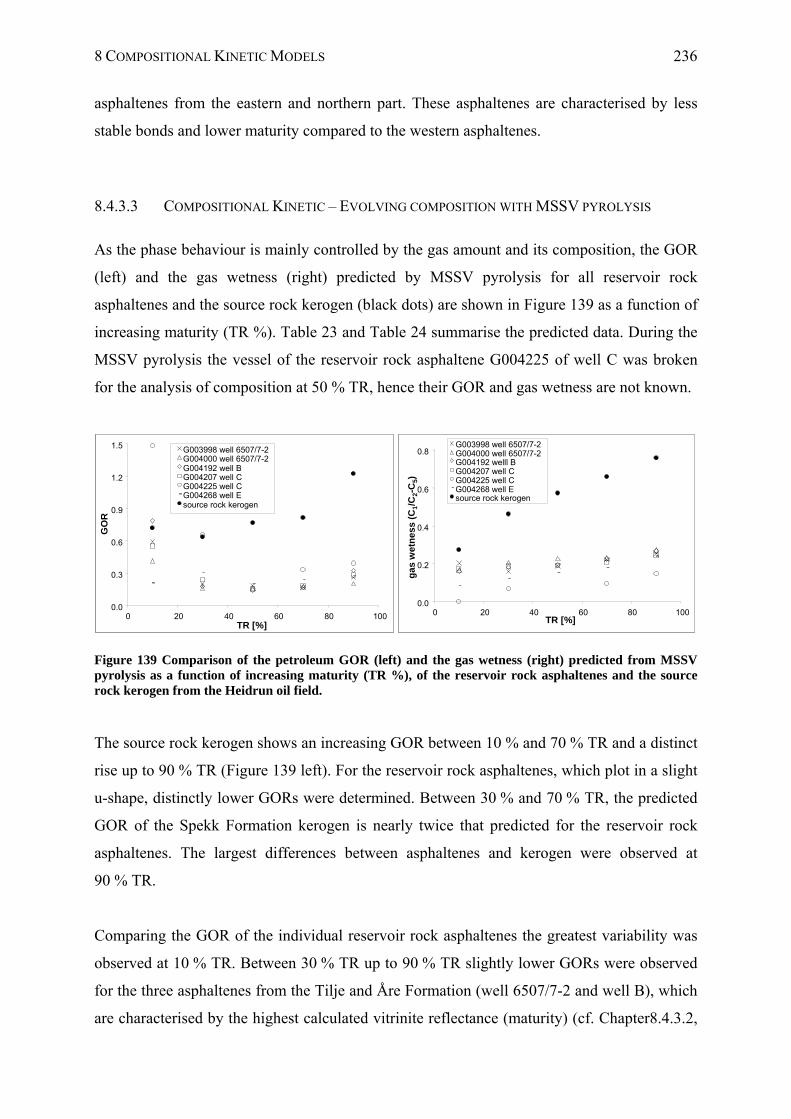
8 COMPOSITIONAL KINETIC MODELS 236
asphaltenes from the eastern and northern part. These asphaltenes are characterised by less
stable bonds and lower maturity compared to the western asphaltenes.
8.4.3.3 COMPOSITIONAL KINETIC – EVOLVING COMPOSITION WITH MSSV PYROLYSIS
As the phase behaviour is mainly controlled by the gas amount and its composition, the GOR
(left) and the gas wetness (right) predicted by MSSV pyrolysis for all reservoir rock
asphaltenes and the source rock kerogen (black dots) are shown in Figure 139 as a function of
increasing maturity (TR %). Table 23 and Table 24 summarise the predicted data. During the
MSSV pyrolysis the vessel of the reservoir rock asphaltene G004225 of well C was broken
for the analysis of composition at 50 % TR, hence their GOR and gas wetness are not known.
0.0
0.2
0.4
0.6
0.8
0 20 40 60 80 100TR [%]
gas
wet
nes
s (C
1/C
2-C
5)
G003998 well 6507/7-2
G004000 well 6507/7-2
G004192 welll B
G004207 well C
G004225 well C
G004268 well E
source rock kerogen
0.0
0.3
0.6
0.9
1.2
1.5
0 20 40 60 80 100
TR [%]
GO
R
G003998 well 6507/7-2
G004000 well 6507/7-2
G004192 well B
G004207 well C
G004225 well C
G004268 well E
source rock kerogen
0.0
0.3
0.6
0.9
1.2
1.5
0 20 40 60 80 100TR [%]
GO
R
G003998 well 6507/7-2G004000 well 6507/7-2G004192 well BG004207 well CG004225 well CG004268 well Esource rock kerogen
0.0
0.2
0.4
0.6
0.8
0 20 40 60 80 100TR [%]
gas
wet
nes
s(C
1/C
2-C
5)
G003998 well 6507/7-2G004000 well 6507/7-2G004192 welll BG004207 well CG004225 well CG004268 well Esource rock kerogen
Figure 139 Comparison of the petroleum GOR (left) and the gas wetness (right) predicted from MSSV pyrolysis as a function of increasing maturity (TR %), of the reservoir rock asphaltenes and the source rock kerogen from the Heidrun oil field.
The source rock kerogen shows an increasing GOR between 10 % and 70 % TR and a distinct
rise up to 90 % TR (Figure 139 left). For the reservoir rock asphaltenes, which plot in a slight
u-shape, distinctly lower GORs were determined. Between 30 % and 70 % TR, the predicted
GOR of the Spekk Formation kerogen is nearly twice that predicted for the reservoir rock
asphaltenes. The largest differences between asphaltenes and kerogen were observed at
90 % TR.
Comparing the GOR of the individual reservoir rock asphaltenes the greatest variability was
observed at 10 % TR. Between 30 % TR up to 90 % TR slightly lower GORs were observed
for the three asphaltenes from the Tilje and Åre Formation (well 6507/7-2 and well B), which
are characterised by the highest calculated vitrinite reflectance (maturity) (cf. Chapter8.4.3.2,
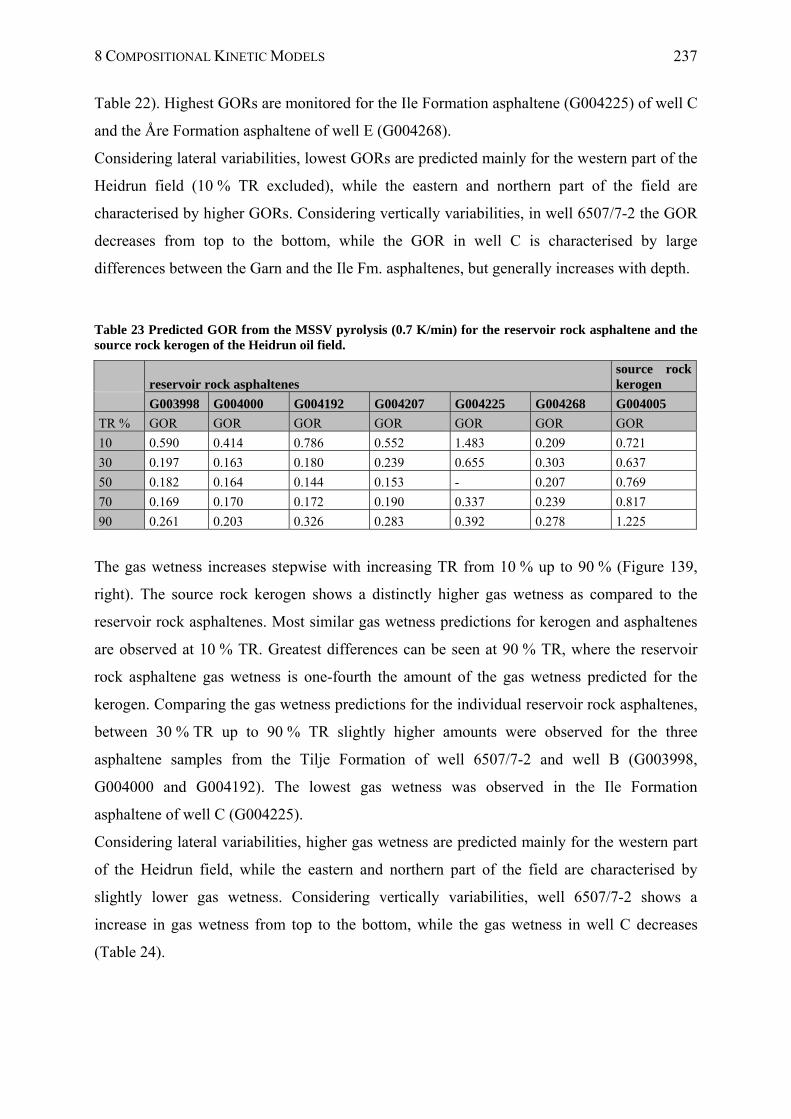
8 COMPOSITIONAL KINETIC MODELS 237
Table 22). Highest GORs are monitored for the Ile Formation asphaltene (G004225) of well C
and the Åre Formation asphaltene of well E (G004268).
Considering lateral variabilities, lowest GORs are predicted mainly for the western part of the
Heidrun field (10 % TR excluded), while the eastern and northern part of the field are
characterised by higher GORs. Considering vertically variabilities, in well 6507/7-2 the GOR
decreases from top to the bottom, while the GOR in well C is characterised by large
differences between the Garn and the Ile Fm. asphaltenes, but generally increases with depth.
Table 23 Predicted GOR from the MSSV pyrolysis (0.7 K/min) for the reservoir rock asphaltene and the source rock kerogen of the Heidrun oil field.
reservoir rock asphaltenes source rock kerogen
G003998 G004000 G004192 G004207 G004225 G004268 G004005
TR % GOR GOR GOR GOR GOR GOR GOR
10 0.590 0.414 0.786 0.552 1.483 0.209 0.721
30 0.197 0.163 0.180 0.239 0.655 0.303 0.637
50 0.182 0.164 0.144 0.153 - 0.207 0.769
70 0.169 0.170 0.172 0.190 0.337 0.239 0.817
90 0.261 0.203 0.326 0.283 0.392 0.278 1.225
The gas wetness increases stepwise with increasing TR from 10 % up to 90 % (Figure 139,
right). The source rock kerogen shows a distinctly higher gas wetness as compared to the
reservoir rock asphaltenes. Most similar gas wetness predictions for kerogen and asphaltenes
are observed at 10 % TR. Greatest differences can be seen at 90 % TR, where the reservoir
rock asphaltene gas wetness is one-fourth the amount of the gas wetness predicted for the
kerogen. Comparing the gas wetness predictions for the individual reservoir rock asphaltenes,
between 30 % TR up to 90 % TR slightly higher amounts were observed for the three
asphaltene samples from the Tilje Formation of well 6507/7-2 and well B (G003998,
G004000 and G004192). The lowest gas wetness was observed in the Ile Formation
asphaltene of well C (G004225).
Considering lateral variabilities, higher gas wetness are predicted mainly for the western part
of the Heidrun field, while the eastern and northern part of the field are characterised by
slightly lower gas wetness. Considering vertically variabilities, well 6507/7-2 shows a
increase in gas wetness from top to the bottom, while the gas wetness in well C decreases
(Table 24).
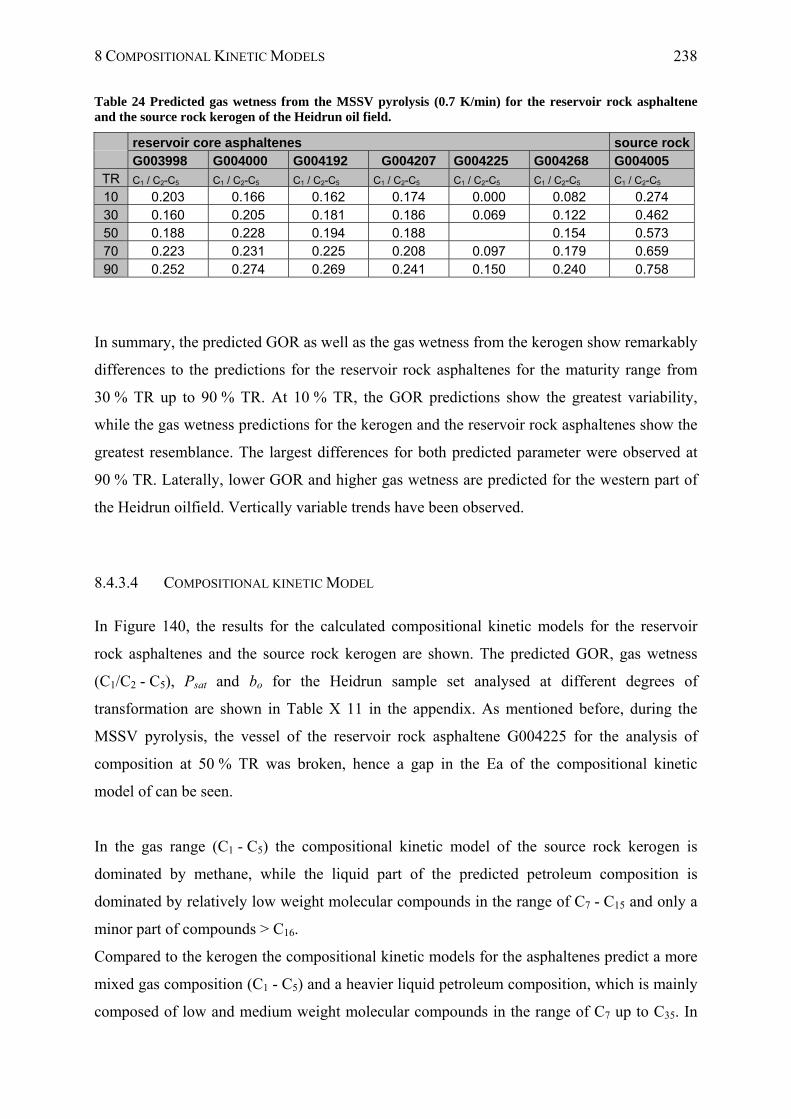
8 COMPOSITIONAL KINETIC MODELS 238
Table 24 Predicted gas wetness from the MSSV pyrolysis (0.7 K/min) for the reservoir rock asphaltene and the source rock kerogen of the Heidrun oil field.
reservoir core asphaltenes source rock G003998 G004000 G004192 G004207 G004225 G004268 G004005
TR C1 / C2-C5 C1 / C2-C5 C1 / C2-C5 C1 / C2-C5 C1 / C2-C5 C1 / C2-C5 C1 / C2-C5
10 0.203 0.166 0.162 0.174 0.000 0.082 0.274 30 0.160 0.205 0.181 0.186 0.069 0.122 0.462 50 0.188 0.228 0.194 0.188 0.154 0.573 70 0.223 0.231 0.225 0.208 0.097 0.179 0.659 90 0.252 0.274 0.269 0.241 0.150 0.240 0.758
In summary, the predicted GOR as well as the gas wetness from the kerogen show remarkably
differences to the predictions for the reservoir rock asphaltenes for the maturity range from
30 % TR up to 90 % TR. At 10 % TR, the GOR predictions show the greatest variability,
while the gas wetness predictions for the kerogen and the reservoir rock asphaltenes show the
greatest resemblance. The largest differences for both predicted parameter were observed at
90 % TR. Laterally, lower GOR and higher gas wetness are predicted for the western part of
the Heidrun oilfield. Vertically variable trends have been observed.
8.4.3.4 COMPOSITIONAL KINETIC MODEL
In Figure 140, the results for the calculated compositional kinetic models for the reservoir
rock asphaltenes and the source rock kerogen are shown. The predicted GOR, gas wetness
(C1/C2 - C5), Psat and bo for the Heidrun sample set analysed at different degrees of
transformation are shown in Table X 11 in the appendix. As mentioned before, during the
MSSV pyrolysis, the vessel of the reservoir rock asphaltene G004225 for the analysis of
composition at 50 % TR was broken, hence a gap in the Ea of the compositional kinetic
model of can be seen.
In the gas range (C1 - C5) the compositional kinetic model of the source rock kerogen is
dominated by methane, while the liquid part of the predicted petroleum composition is
dominated by relatively low weight molecular compounds in the range of C7 - C15 and only a
minor part of compounds > C16.
Compared to the kerogen the compositional kinetic models for the asphaltenes predict a more
mixed gas composition (C1 - C5) and a heavier liquid petroleum composition, which is mainly
composed of low and medium weight molecular compounds in the range of C7 up to C35. In
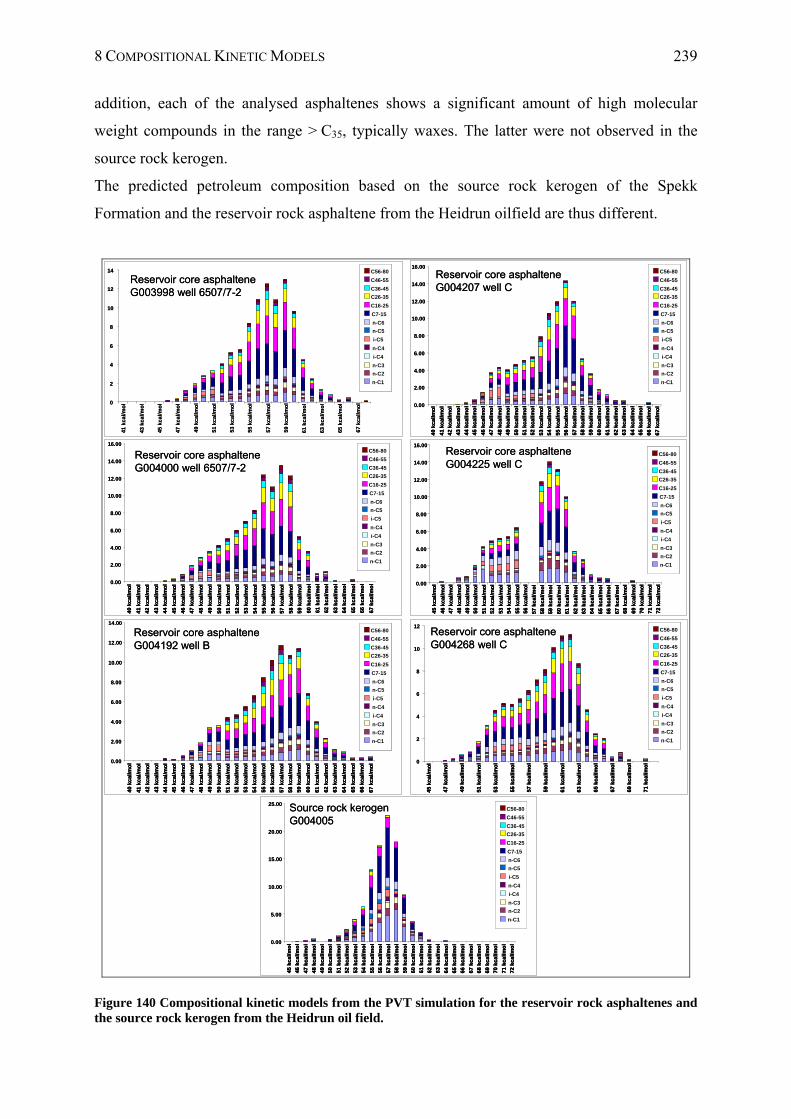
8 COMPOSITIONAL KINETIC MODELS 239
addition, each of the analysed asphaltenes shows a significant amount of high molecular
weight compounds in the range > C35, typically waxes. The latter were not observed in the
source rock kerogen.
The predicted petroleum composition based on the source rock kerogen of the Spekk
Formation and the reservoir rock asphaltene from the Heidrun oilfield are thus different.
Reservoir core asphaltene G003998 well 6507/7-2
0
2
4
6
8
10
12
14
41
kc
al/
mo
l
43
kc
al/
mo
l
45
kc
al/
mo
l
47
kc
al/
mo
l
49
kc
al/
mo
l
51
kc
al/
mo
l
53
kc
al/
mo
l
55
kc
al/
mo
l
57
kc
al/
mo
l
59
kc
al/
mo
l
61
kc
al/
mo
l
63
kc
al/
mo
l
65
kc
al/
mo
l
67
kc
al/
mo
l
C56-80
C46-55
C36-45
C26-35
C16-25
C7-15
n-C6
n-C5
i-C5
n-C4
i-C4
n-C3
n-C2
n-C1
C56-80
C46-55
C36-45
C26-35
C16-25
C7-15
n-C6
n-C5
i-C5
n-C4
i-C4
n-C3
n-C2
n-C1
Reservoir core asphaltene G004207 well C
0.00
2.00
4.00
6.00
8.00
10.00
12.00
14.00
16.00
40
kc
al/
mo
l
41
kc
al/
mo
l
42
kc
al/
mo
l
43
kc
al/
mo
l
44
kc
al/
mo
l
45
kc
al/
mo
l
46
kc
al/
mo
l
47
kc
al/
mo
l
48
kc
al/
mo
l
49
kc
al/
mo
l
50
kc
al/
mo
l
51
kc
al/
mo
l
52
kc
al/
mo
l
53
kc
al/
mo
l
54
kc
al/
mo
l
55
kc
al/
mo
l
56
kc
al/
mo
l
57
kc
al/
mo
l
58
kc
al/
mo
l
59
kc
al/
mo
l
60
kc
al/
mo
l
61
kc
al/
mo
l
62
kc
al/
mo
l
63
kc
al/
mo
l
64
kc
al/
mo
l
65
kc
al/
mo
l
66
kc
al/
mo
l
67
kc
al/
mo
l
C56-80
C46-55
C36-45
C26-35
C16-25
C7-15
n-C6
n-C5
i-C5
n-C4
i-C4
n-C3
n-C2
n-C1
Reservoir core asphaltene G004207 well C
0.00
2.00
4.00
6.00
8.00
10.00
12.00
14.00
16.00
40
kc
al/
mo
l
41
kc
al/
mo
l
42
kc
al/
mo
l
43
kc
al/
mo
l
44
kc
al/
mo
l
45
kc
al/
mo
l
46
kc
al/
mo
l
47
kc
al/
mo
l
48
kc
al/
mo
l
49
kc
al/
mo
l
50
kc
al/
mo
l
51
kc
al/
mo
l
52
kc
al/
mo
l
53
kc
al/
mo
l
54
kc
al/
mo
l
55
kc
al/
mo
l
56
kc
al/
mo
l
57
kc
al/
mo
l
58
kc
al/
mo
l
59
kc
al/
mo
l
60
kc
al/
mo
l
61
kc
al/
mo
l
62
kc
al/
mo
l
63
kc
al/
mo
l
64
kc
al/
mo
l
65
kc
al/
mo
l
66
kc
al/
mo
l
67
kc
al/
mo
l
C56-80
C46-55
C36-45
C26-35
C16-25
C7-15
n-C6
n-C5
i-C5
n-C4
i-C4
n-C3
n-C2
n-C1
C56-80
C46-55
C36-45
C26-35
C16-25
C7-15
n-C6
n-C5
i-C5
n-C4
i-C4
n-C3
n-C2
n-C1
45
kc
al/
mo
l
46
kc
al/
mo
l
47
kc
al/
mo
l
48
kc
al/
mo
l
49
kc
al/
mo
l
50
kc
al/
mo
l
51
kc
al/
mo
l
52
kc
al/
mo
l
53
kc
al/
mo
l
54
kc
al/
mo
l
55
kc
al/
mo
l
56
kc
al/
mo
l
57
kc
al/
mo
l
58
kc
al/
mo
l
59
kc
al/
mo
l
60
kc
al/
mo
l
61
kc
al/
mo
l
62
kc
al/
mo
l
63
kc
al/
mo
l
64
kc
al/
mo
l
65
kc
al/
mo
l
66
kc
al/
mo
l
67
kc
al/
mo
l
68
kc
al/
mo
l
69
kc
al/
mo
l
70
kc
al/
mo
l
71
kc
al/
mo
l
72
kc
al/
mo
l
Reservoir core asphaltene G004225 well C
0.00
2.00
4.00
6.00
8.00
10.00
12.00
14.00
16.00
C56-80
C46-55
C36-45
C26-35
C16-25
C7-15
n-C6
n-C5
i-C5
n-C4
i-C4
n-C3
n-C2
n-C1
45
kc
al/
mo
l
46
kc
al/
mo
l
47
kc
al/
mo
l
48
kc
al/
mo
l
49
kc
al/
mo
l
50
kc
al/
mo
l
51
kc
al/
mo
l
52
kc
al/
mo
l
53
kc
al/
mo
l
54
kc
al/
mo
l
55
kc
al/
mo
l
56
kc
al/
mo
l
57
kc
al/
mo
l
58
kc
al/
mo
l
59
kc
al/
mo
l
60
kc
al/
mo
l
61
kc
al/
mo
l
62
kc
al/
mo
l
63
kc
al/
mo
l
64
kc
al/
mo
l
65
kc
al/
mo
l
66
kc
al/
mo
l
67
kc
al/
mo
l
68
kc
al/
mo
l
69
kc
al/
mo
l
70
kc
al/
mo
l
71
kc
al/
mo
l
72
kc
al/
mo
l
Reservoir core asphaltene G004225 well C
0.00
2.00
4.00
6.00
8.00
10.00
12.00
14.00
16.00
C56-80
C46-55
C36-45
C26-35
C16-25
C7-15
n-C6
n-C5
i-C5
n-C4
i-C4
n-C3
n-C2
n-C1
C56-80
C46-55
C36-45
C26-35
C16-25
C7-15
n-C6
n-C5
i-C5
n-C4
i-C4
n-C3
n-C2
n-C1
Reservoir core asphaltene G004000 well 6507/7-2
C56-80
C46-55
C36-45
C26-35
C16-25
C7-15
n-C6
n-C5
i-C5
n-C4
i-C4
n-C3
n-C2
n-C1
0.00
2.00
4.00
6.00
8.00
10.00
12.00
14.00
16.00
40
kc
al/
mo
l
41
kc
al/
mo
l
42
kc
al/
mo
l
43
kc
al/
mo
l
44
kc
al/
mo
l
45
kc
al/
mo
l
46
kc
al/
mo
l
47
kc
al/
mo
l
48
kc
al/
mo
l
49
kc
al/
mo
l
50
kc
al/
mo
l
51
kc
al/
mo
l
52
kc
al/
mo
l
53
kc
al/
mo
l
54
kc
al/
mo
l
55
kc
al/
mo
l
56
kc
al/
mo
l
57
kc
al/
mo
l
58
kc
al/
mo
l
59
kc
al/
mo
l
60
kc
al/
mo
l
61
kc
al/
mo
l
62
kc
al/
mo
l
63
kc
al/
mo
l
64
kc
al/
mo
l
65
kc
al/
mo
l
66
kc
al/
mo
l
67
kc
al/
mo
l
Reservoir core asphaltene G004000 well 6507/7-2
C56-80
C46-55
C36-45
C26-35
C16-25
C7-15
n-C6
n-C5
i-C5
n-C4
i-C4
n-C3
n-C2
n-C1
C56-80
C46-55
C36-45
C26-35
C16-25
C7-15
n-C6
n-C5
i-C5
n-C4
i-C4
n-C3
n-C2
n-C1
0.00
2.00
4.00
6.00
8.00
10.00
12.00
14.00
16.00
40
kc
al/
mo
l
41
kc
al/
mo
l
42
kc
al/
mo
l
43
kc
al/
mo
l
44
kc
al/
mo
l
45
kc
al/
mo
l
46
kc
al/
mo
l
47
kc
al/
mo
l
48
kc
al/
mo
l
49
kc
al/
mo
l
50
kc
al/
mo
l
51
kc
al/
mo
l
52
kc
al/
mo
l
53
kc
al/
mo
l
54
kc
al/
mo
l
55
kc
al/
mo
l
56
kc
al/
mo
l
57
kc
al/
mo
l
58
kc
al/
mo
l
59
kc
al/
mo
l
60
kc
al/
mo
l
61
kc
al/
mo
l
62
kc
al/
mo
l
63
kc
al/
mo
l
64
kc
al/
mo
l
65
kc
al/
mo
l
66
kc
al/
mo
l
67
kc
al/
mo
l
C56-80
C46-55
C36-45
C26-35
C16-25
C7-15
n-C6
n-C5
i-C5
n-C4
i-C4
n-C3
n-C2
n-C1
0.00
2.00
4.00
6.00
40
kc
al/
mo
l
41
kc
al/
mo
l
42
kc
al/
mo
l
43
kc
al/
mo
l
44
kc
al/
mo
l
45
kc
al/
mo
l
46
kc
al/
mo
l
47
kc
al/
mo
l
48
kc
al/
mo
l
49
kc
al/
mo
l
50
kc
al/
mo
l
51
kc
al/
mo
l
52
kc
al/
mo
l
53
kc
al/
mo
l
54
kc
al/
mo
l
55
kc
al/
mo
l
56
kc
al/
mo
l
57
kc
al/
mo
l
58
kc
al/
mo
l
59
kc
al/
mo
l
60
kc
al/
mo
l
61
kc
al/
mo
l
62
kc
al/
mo
l
63
kc
al/
mo
l
64
kc
al/
mo
l
65
kc
al/
mo
l
66
kc
al/
mo
l
67
kc
al/
mo
l
Reservoir core asphaltene G004192 well B
8.00
10.00
12.00
14.00C56-80
C46-55
C36-45
C26-35
C16-25
C7-15
n-C6
n-C5
i-C5
n-C4
i-C4
n-C3
n-C2
n-C1
C56-80
C46-55
C36-45
C26-35
C16-25
C7-15
n-C6
n-C5
i-C5
n-C4
i-C4
n-C3
n-C2
n-C1
0.00
2.00
4.00
6.00
40
kc
al/
mo
l
41
kc
al/
mo
l
42
kc
al/
mo
l
43
kc
al/
mo
l
44
kc
al/
mo
l
45
kc
al/
mo
l
46
kc
al/
mo
l
47
kc
al/
mo
l
48
kc
al/
mo
l
49
kc
al/
mo
l
50
kc
al/
mo
l
51
kc
al/
mo
l
52
kc
al/
mo
l
53
kc
al/
mo
l
54
kc
al/
mo
l
55
kc
al/
mo
l
56
kc
al/
mo
l
57
kc
al/
mo
l
58
kc
al/
mo
l
59
kc
al/
mo
l
60
kc
al/
mo
l
61
kc
al/
mo
l
62
kc
al/
mo
l
63
kc
al/
mo
l
64
kc
al/
mo
l
65
kc
al/
mo
l
66
kc
al/
mo
l
67
kc
al/
mo
l
Reservoir core asphaltene G004192 well B
8.00
10.00
12.00
14.00
Reservoir core asphaltene G004268 well C
C56-80
C46-55
C36-45
C26-35
C16-25
C7-15
n-C6
n-C5
i-C5
n-C4
i-C4
n-C3
n-C2
n-C1
0
2
4
6
8
10
12
45
kc
al/
mo
l
47
kc
al/
mo
l
49
kc
al/
mo
l
51
kc
al/
mo
l
53
kc
al/
mo
l
55
kc
al/
mo
l
57
kc
al/
mo
l
59
kc
al/
mo
l
61
kc
al/
mo
l
63
kc
al/
mo
l
65
kc
al/
mo
l
67
kc
al/
mo
l
69
kc
al/
mo
l
71
kc
al/
mo
l
Reservoir core asphaltene G004268 well C
C56-80
C46-55
C36-45
C26-35
C16-25
C7-15
n-C6
n-C5
i-C5
n-C4
i-C4
n-C3
n-C2
n-C1
C56-80
C46-55
C36-45
C26-35
C16-25
C7-15
n-C6
n-C5
i-C5
n-C4
i-C4
n-C3
n-C2
n-C1
0
2
4
6
8
10
12
45
kc
al/
mo
l
47
kc
al/
mo
l
49
kc
al/
mo
l
51
kc
al/
mo
l
53
kc
al/
mo
l
55
kc
al/
mo
l
57
kc
al/
mo
l
59
kc
al/
mo
l
61
kc
al/
mo
l
63
kc
al/
mo
l
65
kc
al/
mo
l
67
kc
al/
mo
l
69
kc
al/
mo
l
71
kc
al/
mo
l
45
kc
al/
mo
l
47
kc
al/
mo
l
49
kc
al/
mo
l
51
kc
al/
mo
l
53
kc
al/
mo
l
55
kc
al/
mo
l
57
kc
al/
mo
l
59
kc
al/
mo
l
61
kc
al/
mo
l
63
kc
al/
mo
l
65
kc
al/
mo
l
67
kc
al/
mo
l
69
kc
al/
mo
l
71
kc
al/
mo
l
Source rock kerogen G004005
C56-80
C46-55
C36-45
C26-35
C16-25
C7-15
n-C6
n-C5
i-C5
n-C4
i-C4
n-C3
n-C2
n-C1
0.00
5.00
10.00
15.00
20.00
25.00
45
kc
al/
mo
l
46
kc
al/
mo
l
47
kc
al/
mo
l
48
kc
al/
mo
l
49
kc
al/
mo
l
50
kc
al/
mo
l
51
kc
al/
mo
l
52
kc
al/
mo
l
53
kc
al/
mo
l
54
kc
al/
mo
l
55
kc
al/
mo
l
56
kc
al/
mo
l
57
kc
al/
mo
l
58
kc
al/
mo
l
59
kc
al/
mo
l
60
kc
al/
mo
l
61
kc
al/
mo
l
62
kc
al/
mo
l
63
kc
al/
mo
l
64
kc
al/
mo
l
65
kc
al/
mo
l
66
kc
al/
mo
l
67
kc
al/
mo
l
68
kc
al/
mo
l
69
kc
al/
mo
l
70
kc
al/
mo
l
71
kc
al/
mo
l
72
kc
al/
mo
l
Source rock kerogen G004005
C56-80
C46-55
C36-45
C26-35
C16-25
C7-15
n-C6
n-C5
i-C5
n-C4
i-C4
n-C3
n-C2
n-C1
C56-80
C46-55
C36-45
C26-35
C16-25
C7-15
n-C6
n-C5
i-C5
n-C4
i-C4
n-C3
n-C2
n-C1
0.00
5.00
10.00
15.00
20.00
25.00
45
kc
al/
mo
l
46
kc
al/
mo
l
47
kc
al/
mo
l
48
kc
al/
mo
l
49
kc
al/
mo
l
50
kc
al/
mo
l
51
kc
al/
mo
l
52
kc
al/
mo
l
53
kc
al/
mo
l
54
kc
al/
mo
l
55
kc
al/
mo
l
56
kc
al/
mo
l
57
kc
al/
mo
l
58
kc
al/
mo
l
59
kc
al/
mo
l
60
kc
al/
mo
l
61
kc
al/
mo
l
62
kc
al/
mo
l
63
kc
al/
mo
l
64
kc
al/
mo
l
65
kc
al/
mo
l
66
kc
al/
mo
l
67
kc
al/
mo
l
68
kc
al/
mo
l
69
kc
al/
mo
l
70
kc
al/
mo
l
71
kc
al/
mo
l
72
kc
al/
mo
l
Figure 140 Compositional kinetic models from the PVT simulation for the reservoir rock asphaltenes and the source rock kerogen from the Heidrun oil field.
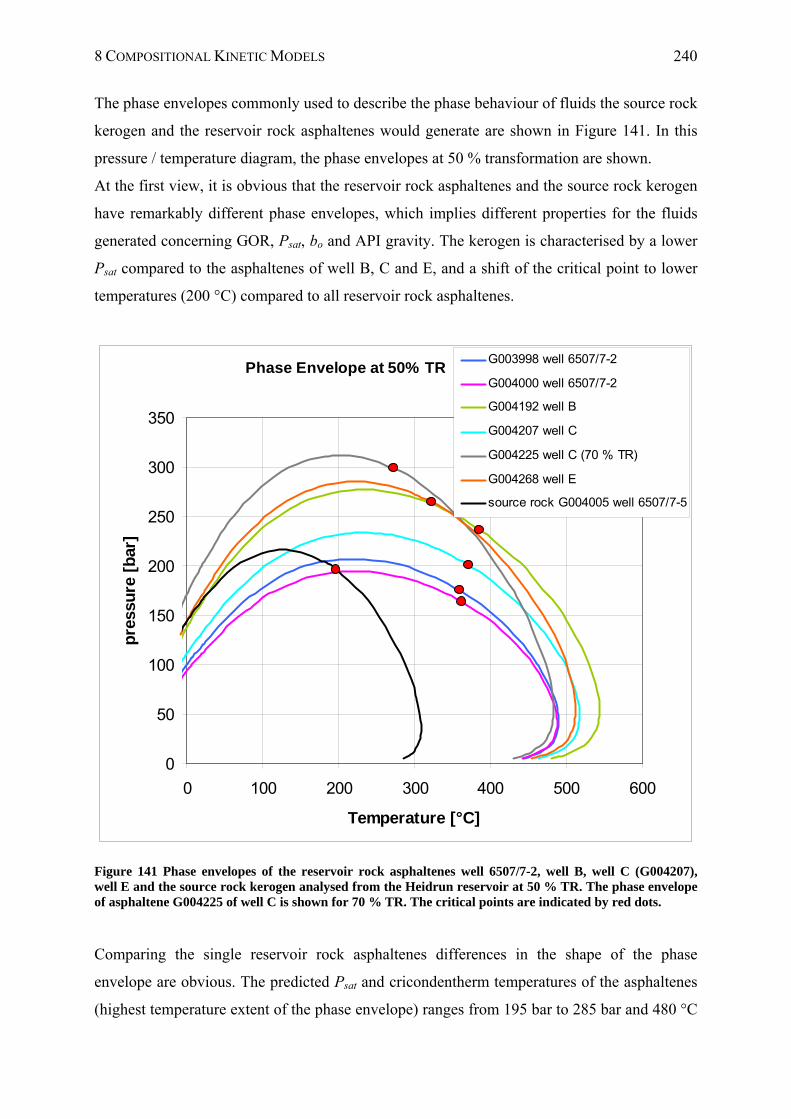
8 COMPOSITIONAL KINETIC MODELS 240
The phase envelopes commonly used to describe the phase behaviour of fluids the source rock
kerogen and the reservoir rock asphaltenes would generate are shown in Figure 141. In this
pressure / temperature diagram, the phase envelopes at 50 % transformation are shown.
At the first view, it is obvious that the reservoir rock asphaltenes and the source rock kerogen
have remarkably different phase envelopes, which implies different properties for the fluids
generated concerning GOR, Psat, bo and API gravity. The kerogen is characterised by a lower
Psat compared to the asphaltenes of well B, C and E, and a shift of the critical point to lower
temperatures (200 °C) compared to all reservoir rock asphaltenes.
Phase Envelope at 50% TR
0
50
100
150
200
250
300
350
0 100 200 300 400 500 600
Temperature [°C]
pre
ssu
re [
bar
]
G003998 well 6507/7-2
G004000 well 6507/7-2
G004192 well B
G004207 well C
G004225 well C (70 % TR)
G004268 well E
source rock G004005 well 6507/7-5
Figure 141 Phase envelopes of the reservoir rock asphaltenes well 6507/7-2, well B, well C (G004207), well E and the source rock kerogen analysed from the Heidrun reservoir at 50 % TR. The phase envelope of asphaltene G004225 of well C is shown for 70 % TR. The critical points are indicated by red dots.
Comparing the single reservoir rock asphaltenes differences in the shape of the phase
envelope are obvious. The predicted Psat and cricondentherm temperatures of the asphaltenes
(highest temperature extent of the phase envelope) ranges from 195 bar to 285 bar and 480 °C
8 COMPOSITIONAL KINETIC MODELS 241
to 545 °C, respectively. Lowest Psat and cricondentherm temperatures were predicted for both
asphaltenes of well 6507/7-2 in the western / central part of the Heidrun oilfield. Although
both show relatively similar phase envelopes, slightly higher Psat and a shift of the critical
point to lower temperatures was observed for the upper reservoir asphaltene of well 6507/7-2.
Relatively high Psat and cricondentherm temperatures were observed for the asphaltenes of
well B and well E, from the eastern and northern part of the reservoir. Both show relatively
similar predictions, however, the well E asphaltene G004268 has slightly higher Psat but a
lower cricondentherm temperature compared to well B and shows the lowest temperature of
the critical point.
The most significant differences regarding fluid composition are those predicted for the
asphaltenes of well C from the eastern part of the oilfield. This is caused by the difference in
the TR of the shown phase envelopes, 70 % TR for this sample as compared to 50 % TR for
the other sample. Thus, these two asphaltenes present a variability in Psat predictions of nearly
100 bar, which corresponds to a difference in reservoir depth of circa 1 km (10 m water
column ~1 bar). The asphaltene of the Ile Fm. (G004225) shows the highest predicted Psat and
will not be considered for further analysis. The pressure / temperature predictions for the Garn
Fm. asphaltene (G004207) are in between the remaining asphaltene predictions.
The amount and composition of gas in the fluid strongly influence its Psat and GOR, whereby
a methane-rich gas composition results commonly in a higher Psat than a comparably "wetter"
gas composition (di Primio et al., 1998). Beside the Ile Fm. asphaltene G004225 of well C,
the lowest gas wetness was observed in the asphaltene of well E, characterised by the highest
Psat. at 50 % TR. The highest gas wetness was observed in well 6507/7-2 presenting the
lowest Psat.
Concerning the critical point the asphaltenes of well 6507/7-2, well C and well B show
relatively similar temperatures. A distinct shift of the critical point to lower temperatures was
observed for the asphaltenes of well E (and the lower asphaltene of well C albeit representing
a higher TR than the other samples). Phase envelopes of samples with increasing maturity
show a systematic decrease in their cricondentherms with increasing cricondenbars, and the
locations of the critical points move systematically towards lower temperatures and higher
pressures (di Primio et al., 1998). Thus the high Psat of the well E asphaltene and the distinctly
lower temperature of the critical point compared to the remaining asphaltene samples could be
8 COMPOSITIONAL KINETIC MODELS 242
an indication of higher maturity of the source which generated the petroleum in well E
(Heidrun north).
In terms of bulk properties, the fluid that would be generated by the reservoir rock asphaltenes
of well 6507/7-2 could be described as petroleum with higher proportions of high molecular
weight material and densities compared to the lighter oil predicted by the source rock
kerogen. Within well 6507/7-2, the slight shift of Psat and the critical point temperature
between both asphaltenes might indicate changes in the source maturity.
The critical points of the asphaltene samples of well 6507/7-2, well B and well C seem to
remain at nearly constant temperatures independent of the shift of the bubble point curves to
higher pressures. A similar behaviour was observed in natural fluids where the observed
vertical shift in critical point temperatures was attributed to mixing of fluids from two
different sources in the reservoir (di Primio et al., 1998). Thus, the different physical
properties of petroleum fluids observed are possibly not only controlled by maturity, but may
reflect also reservoir charging and mixing dynamics.
The large difference in predicted source rock fluid properties as compared to the asphaltenes
may additionally indicate that the source rock present on the Heidrun structure, which is
thermally immature, is likely not a good representative of the deep and mature generating
kitchen.
The compositional information derived from the reservoir rock asphaltenes indicate
differences in the maturity of the source and could further be influenced by mixing of oils
from sources of different maturity or organofacies.
9 CONCLUSION 243
9 CONCLUSION
Vertical and lateral variabilities in the organic matter composition and distribution were
delineated in the Heidrun reservoir screening applying known and new pyrolysis parameter to
the macromolecular polar fraction in reservoir rocks.
Using the phenol content in the reservoir rock pyrolysates in 23 reservoir rock sample in-situ
organic matter was found in form of finely dispersed coaly particles.
Great variabilities were observed for aromatics and gas compounds in the macromolecular
fraction. The 1-ring versus 2-ring aromatic hydrocarbon compound ratio indicates differences
in the organic matter composition in all wells and individual reservoir formations.
Different gradients were found in the aromaticity with increasing depth. Similar trends were
observed in the gas amount. The enrichment in aromatic compounds relative to the n-C5+ in
reservoir rock pyrolysis products is accompanied by depletion in the gas wetness. In most of
the wells, we observed an inverse correlation of aromaticity and gas wetness. Both parameters
are apparently linked.
A direct correlation of aromaticity and biodegradation was observed within the pyrolysis
products from the heavy oil series (WCSB) and the Heidrun oils, which show an increase in
aromaticity with increasing viscosity and decreasing API gravity. Both fluid physical
properties appear to be related to different biodegradation levels. However, the range is much
less pronounced for these samples than for the Heidrun cores.
Based on visual comparison a correlation of the aromaticity and the water saturation was
observed in a few wells, especially near the OWC. The water saturation of in the reservoir
zones is important as biodegradation occurs in water-saturated zones.
In a lateral direction higher aromaticity, higher gas amount, and lower gas wetness
predominantly in the eastern part of the Heidrun reservoir compared to the western part were
found. These findings correlate to the biodegradation pattern based on the oil analysis in the
Heidrun field that already exists. The Heidrun field can be subdivided in two dominant parts,
a biodegraded eastern and a mixed western part.
9 CONCLUSION 244
Furthermore, we observed a trend in the reservoir age. From the younger to the older reservoir
formation (Garn Fm. - Ile Fm. - Tilje Fm. - Åre Fm.) the aromaticity and gas content in the
pyrolysates increase, and the gas wetness decreases.
Differences in the alkyl chain length distribution within the reservoir rocks have been used in
order to detect heterogeneities in the organofacies and/or the maturity of the source rock,
which in turn can indicate variabilities in the oil charges and deliver thus information for the
filling history reconstruction.
Both potential source rocks show differences in the source organofacies and indications to
different maturity. The Spekk Formation indicates a low maturity and a marine depositional
environment; the Melke Formation show higher maturity and indicates a marine depositional
environment with terrestrial influence.
Independent of their reservoir formation most of the reservoir rocks shows an alkyl chain
length distribution that is broadest the same as that of the Spekk Formation. A few reservoir
rocks predominantly from the western part of the Heidrun reservoir were detected showing
slightly higher amount of long alkyl chains compared to the potential source rock from the
Spekk. They show greater proportions of waxy compounds that could be an indication to a
lacustrine influence of the generative source. Great quantities of waxy compounds were found
in reservoir rocks from Heidrun north. Here a lacustrine influence of the generative source has
to be considered.
A new asphaltene separation method was developed in order to evaluate small-scale
heterogeneities in the Heidrun reservoir based on single asphaltene fractions. The proposed
method for asphaltene precipitation was developed through the investigation of the influence
of solvent type, solvent amount and aging time. The final method shows an excellent
reproducibility and linearity for asphaltene separation.
As far as the screening is concerned, it could be concluded that asphaltenes do not yield
noticeably more information on the geochemical parameter used. Compared to the
corresponding reservoir rocks the asphaltene pyrolysates exhibit higher aromaticity and
higher gas yields. They further do not differ among themselves as much as seen for the
corresponding reservoir rock samples, but reflect the gradients observed in the reservoir rock
pyrolysates for the individual parameter.
9 CONCLUSION 245
The analysis is additionally time consuming, and thus not appropriate for screening of large
sample sets. The best results for heterogeneity screening were obtained using whole reservoir
rock Py-GC.
However, it is well established that kinetic parameters from asphaltenes can be used as
proxies for kinetics for source rock kerogen. To date such compositional kinetics has been
applied to produced oils and tar mats, but never within the context of source profiling and the
delineation of reservoir heterogeneities. Here we use compositional kinetics for that purpose.
In both test study areas, the Duvernay and the Draupne Formation, it was observed that
kerogen and reservoir asphaltene show both very similar shapes of the phase envelopes,
which implies similar physical properties of the fluid that would be generated concerning
GOR, Psat, bo and even API gravity. Predictions for the source rock asphaltenes clearly show
different shapes of the phase envelopes, characterised by a much higher Psat and a shift of the
critical point to lower temperatures.
Within the main study area, the Heidrun reservoir, reservoir rock asphaltenes and source rock
kerogen show different compositional information. They show different shapes of the phase
envelope that imply different physical properties of the fluid generated. The kerogen is
characterised by a lower Psat compared to most of the reservoir rock asphaltenes analysed and
a shift of the critical point to lower temperatures compared to all reservoir rock asphaltenes.
The large difference in predicted source rock fluid properties as compared to the asphaltenes
indicate that the source rock present on the Heidrun structure, which is thermally immature, is
likely not a good representative of the deep and mature generating kitchen.
The compositional information of individual reservoir rock asphaltene samples indicate
differences in the maturity of the source and / or mixing effects of oils generated from
different sources.
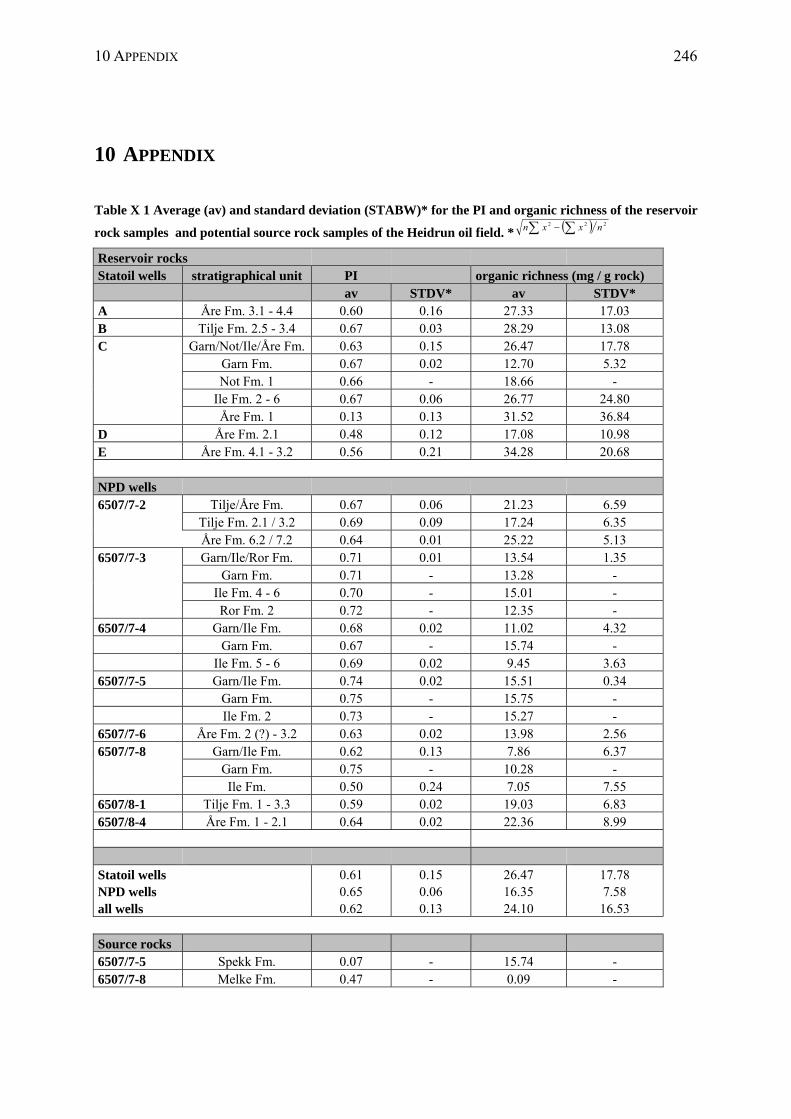
10 APPENDIX 246
10 APPENDIX
Table X 1 Average (av) and standard deviation (STABW)* for the PI and organic richness of the reservoir
rock samples and potential source rock samples of the Heidrun oil field. * 222 nxxn
Reservoir rocks Statoil wells stratigraphical unit PI organic richness (mg / g rock) av STDV* av STDV* A Åre Fm. 3.1 - 4.4 0.60 0.16 27.33 17.03 B Tilje Fm. 2.5 - 3.4 0.67 0.03 28.29 13.08 C Garn/Not/Ile/Åre Fm. 0.63 0.15 26.47 17.78 Garn Fm. 0.67 0.02 12.70 5.32 Not Fm. 1 0.66 - 18.66 - Ile Fm. 2 - 6 0.67 0.06 26.77 24.80 Åre Fm. 1 0.13 0.13 31.52 36.84 D Åre Fm. 2.1 0.48 0.12 17.08 10.98 E Åre Fm. 4.1 - 3.2 0.56 0.21 34.28 20.68 NPD wells 6507/7-2 Tilje/Åre Fm. 0.67 0.06 21.23 6.59 Tilje Fm. 2.1 / 3.2 0.69 0.09 17.24 6.35 Åre Fm. 6.2 / 7.2 0.64 0.01 25.22 5.13 6507/7-3 Garn/Ile/Ror Fm. 0.71 0.01 13.54 1.35 Garn Fm. 0.71 - 13.28 - Ile Fm. 4 - 6 0.70 - 15.01 - Ror Fm. 2 0.72 - 12.35 - 6507/7-4 Garn/Ile Fm. 0.68 0.02 11.02 4.32 Garn Fm. 0.67 - 15.74 - Ile Fm. 5 - 6 0.69 0.02 9.45 3.63 6507/7-5 Garn/Ile Fm. 0.74 0.02 15.51 0.34 Garn Fm. 0.75 - 15.75 - Ile Fm. 2 0.73 - 15.27 - 6507/7-6 Åre Fm. 2 (?) - 3.2 0.63 0.02 13.98 2.56 6507/7-8 Garn/Ile Fm. 0.62 0.13 7.86 6.37 Garn Fm. 0.75 - 10.28 - Ile Fm. 0.50 0.24 7.05 7.55 6507/8-1 Tilje Fm. 1 - 3.3 0.59 0.02 19.03 6.83 6507/8-4 Åre Fm. 1 - 2.1 0.64 0.02 22.36 8.99 Statoil wells 0.61 0.15 26.47 17.78 NPD wells 0.65 0.06 16.35 7.58 all wells 0.62 0.13 24.10 16.53 Source rocks 6507/7-5 Spekk Fm. 0.07 - 15.74 - 6507/7-8 Melke Fm. 0.47 - 0.09 -
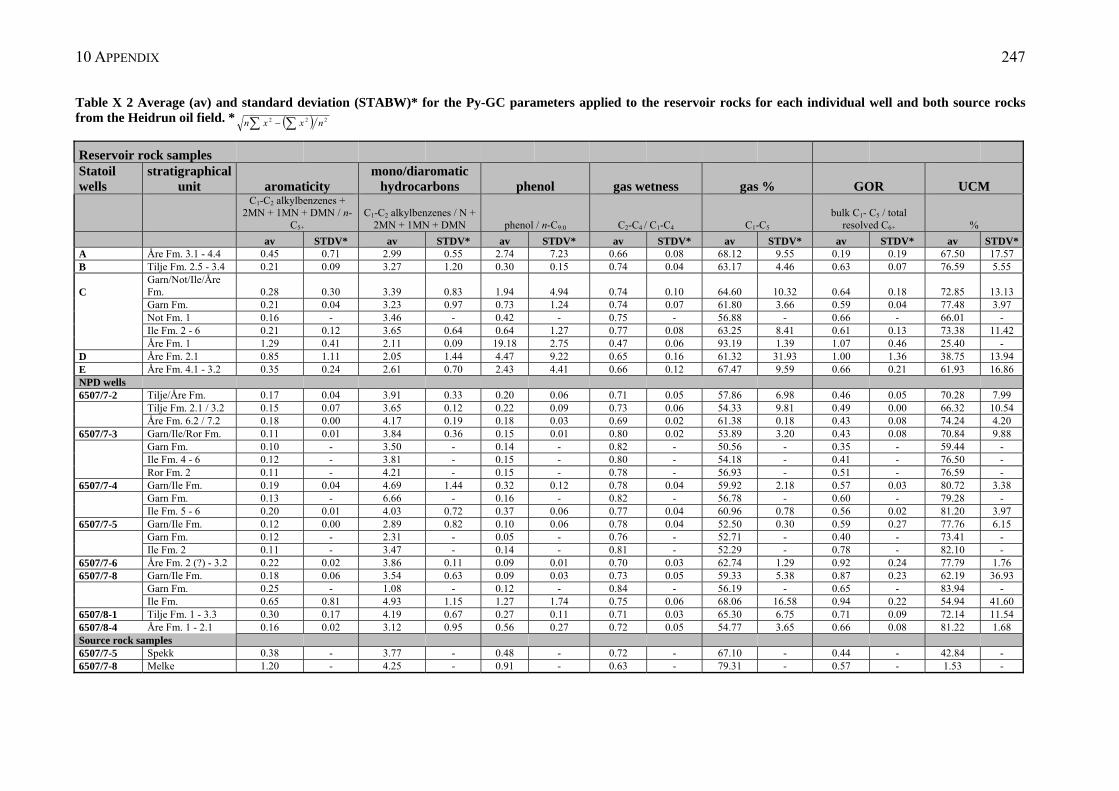
10 APPENDIX 247
Table X 2 Average (av) and standard deviation (STABW)* for the Py-GC parameters applied to the reservoir rocks for each individual well and both source rocks from the Heidrun oil field. * 222 nxxn
Reservoir rock samples Statoil wells
stratigraphical unit aromaticity
mono/diaromatic hydrocarbons phenol gas wetness gas % GOR UCM
C1-C2 alkylbenzenes + 2MN + 1MN + DMN / n-
C5+ C1-C2 alkylbenzenes / N +
2MN + 1MN + DMN phenol / n-C9:0 C2-C4 / C1-C4 C1-C5 bulk C1- C5 / total
resolved C6+ %
av STDV* av STDV* av STDV* av STDV* av STDV* av STDV* av STDV* A Åre Fm. 3.1 - 4.4 0.45 0.71 2.99 0.55 2.74 7.23 0.66 0.08 68.12 9.55 0.19 0.19 67.50 17.57 B Tilje Fm. 2.5 - 3.4 0.21 0.09 3.27 1.20 0.30 0.15 0.74 0.04 63.17 4.46 0.63 0.07 76.59 5.55
C Garn/Not/Ile/Åre Fm. 0.28 0.30 3.39 0.83 1.94 4.94 0.74 0.10 64.60 10.32 0.64 0.18 72.85 13.13
Garn Fm. 0.21 0.04 3.23 0.97 0.73 1.24 0.74 0.07 61.80 3.66 0.59 0.04 77.48 3.97 Not Fm. 1 0.16 - 3.46 - 0.42 - 0.75 - 56.88 - 0.66 - 66.01 - Ile Fm. 2 - 6 0.21 0.12 3.65 0.64 0.64 1.27 0.77 0.08 63.25 8.41 0.61 0.13 73.38 11.42 Åre Fm. 1 1.29 0.41 2.11 0.09 19.18 2.75 0.47 0.06 93.19 1.39 1.07 0.46 25.40 - D Åre Fm. 2.1 0.85 1.11 2.05 1.44 4.47 9.22 0.65 0.16 61.32 31.93 1.00 1.36 38.75 13.94 E Åre Fm. 4.1 - 3.2 0.35 0.24 2.61 0.70 2.43 4.41 0.66 0.12 67.47 9.59 0.66 0.21 61.93 16.86 NPD wells 6507/7-2 Tilje/Åre Fm. 0.17 0.04 3.91 0.33 0.20 0.06 0.71 0.05 57.86 6.98 0.46 0.05 70.28 7.99 Tilje Fm. 2.1 / 3.2 0.15 0.07 3.65 0.12 0.22 0.09 0.73 0.06 54.33 9.81 0.49 0.00 66.32 10.54 Åre Fm. 6.2 / 7.2 0.18 0.00 4.17 0.19 0.18 0.03 0.69 0.02 61.38 0.18 0.43 0.08 74.24 4.20 6507/7-3 Garn/Ile/Ror Fm. 0.11 0.01 3.84 0.36 0.15 0.01 0.80 0.02 53.89 3.20 0.43 0.08 70.84 9.88 Garn Fm. 0.10 - 3.50 - 0.14 - 0.82 - 50.56 - 0.35 - 59.44 - Ile Fm. 4 - 6 0.12 - 3.81 - 0.15 - 0.80 - 54.18 - 0.41 - 76.50 - Ror Fm. 2 0.11 - 4.21 - 0.15 - 0.78 - 56.93 - 0.51 - 76.59 - 6507/7-4 Garn/Ile Fm. 0.19 0.04 4.69 1.44 0.32 0.12 0.78 0.04 59.92 2.18 0.57 0.03 80.72 3.38 Garn Fm. 0.13 - 6.66 - 0.16 - 0.82 - 56.78 - 0.60 - 79.28 - Ile Fm. 5 - 6 0.20 0.01 4.03 0.72 0.37 0.06 0.77 0.04 60.96 0.78 0.56 0.02 81.20 3.97 6507/7-5 Garn/Ile Fm. 0.12 0.00 2.89 0.82 0.10 0.06 0.78 0.04 52.50 0.30 0.59 0.27 77.76 6.15 Garn Fm. 0.12 - 2.31 - 0.05 - 0.76 - 52.71 - 0.40 - 73.41 - Ile Fm. 2 0.11 - 3.47 - 0.14 - 0.81 - 52.29 - 0.78 - 82.10 - 6507/7-6 Åre Fm. 2 (?) - 3.2 0.22 0.02 3.86 0.11 0.09 0.01 0.70 0.03 62.74 1.29 0.92 0.24 77.79 1.76 6507/7-8 Garn/Ile Fm. 0.18 0.06 3.54 0.63 0.09 0.03 0.73 0.05 59.33 5.38 0.87 0.23 62.19 36.93 Garn Fm. 0.25 - 1.08 - 0.12 - 0.84 - 56.19 - 0.65 - 83.94 - Ile Fm. 0.65 0.81 4.93 1.15 1.27 1.74 0.75 0.06 68.06 16.58 0.94 0.22 54.94 41.60 6507/8-1 Tilje Fm. 1 - 3.3 0.30 0.17 4.19 0.67 0.27 0.11 0.71 0.03 65.30 6.75 0.71 0.09 72.14 11.54 6507/8-4 Åre Fm. 1 - 2.1 0.16 0.02 3.12 0.95 0.56 0.27 0.72 0.05 54.77 3.65 0.66 0.08 81.22 1.68 Source rock samples 6507/7-5 Spekk 0.38 - 3.77 - 0.48 - 0.72 - 67.10 - 0.44 - 42.84 - 6507/7-8 Melke 1.20 - 4.25 - 0.91 - 0.63 - 79.31 - 0.57 - 1.53 -
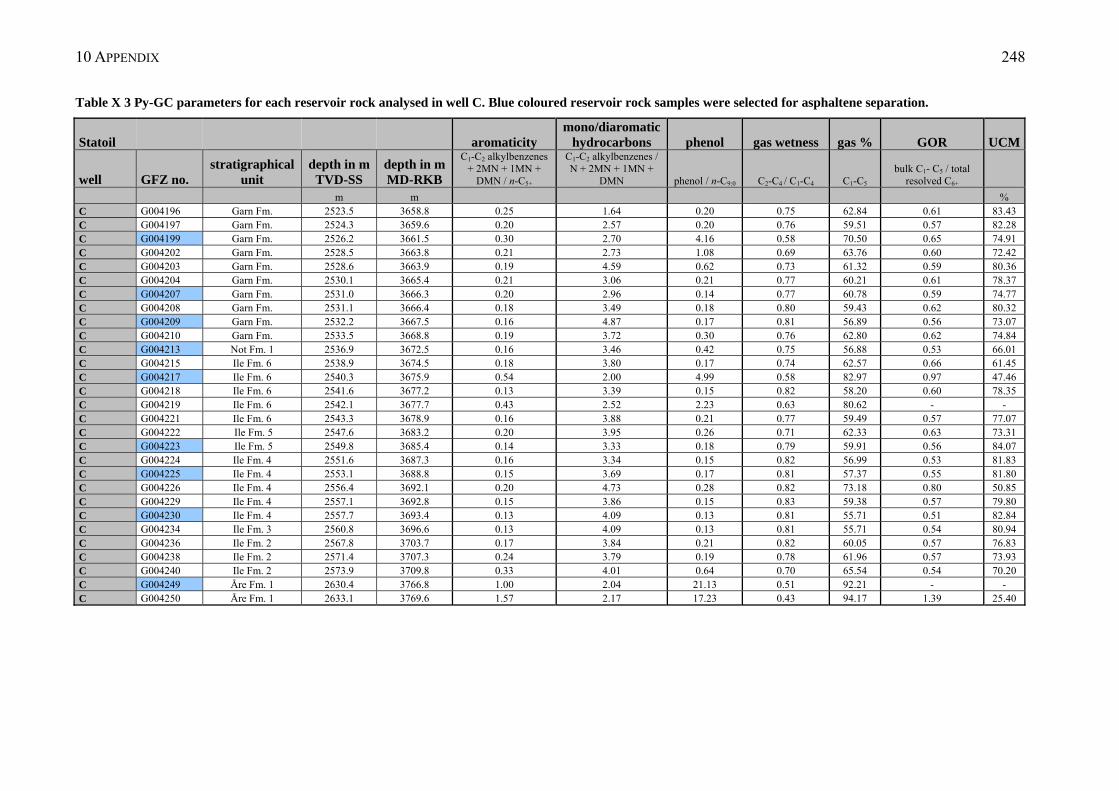
10 APPENDIX 248
Table X 3 Py-GC parameters for each reservoir rock analysed in well C. Blue coloured reservoir rock samples were selected for asphaltene separation.
Statoil aromaticity mono/diaromatic
hydrocarbons phenol gas wetness gas % GOR UCM
well GFZ no. stratigraphical
unit depth in m
TVD-SS depth in m MD-RKB
C1-C2 alkylbenzenes + 2MN + 1MN +
DMN / n-C5+
C1-C2 alkylbenzenes / N + 2MN + 1MN +
DMN phenol / n-C9:0 C2-C4 / C1-C4 C1-C5 bulk C1- C5 / total
resolved C6+
m m % C G004196 Garn Fm. 2523.5 3658.8 0.25 1.64 0.20 0.75 62.84 0.61 83.43 C G004197 Garn Fm. 2524.3 3659.6 0.20 2.57 0.20 0.76 59.51 0.57 82.28 C G004199 Garn Fm. 2526.2 3661.5 0.30 2.70 4.16 0.58 70.50 0.65 74.91 C G004202 Garn Fm. 2528.5 3663.8 0.21 2.73 1.08 0.69 63.76 0.60 72.42 C G004203 Garn Fm. 2528.6 3663.9 0.19 4.59 0.62 0.73 61.32 0.59 80.36 C G004204 Garn Fm. 2530.1 3665.4 0.21 3.06 0.21 0.77 60.21 0.61 78.37 C G004207 Garn Fm. 2531.0 3666.3 0.20 2.96 0.14 0.77 60.78 0.59 74.77 C G004208 Garn Fm. 2531.1 3666.4 0.18 3.49 0.18 0.80 59.43 0.62 80.32 C G004209 Garn Fm. 2532.2 3667.5 0.16 4.87 0.17 0.81 56.89 0.56 73.07 C G004210 Garn Fm. 2533.5 3668.8 0.19 3.72 0.30 0.76 62.80 0.62 74.84 C G004213 Not Fm. 1 2536.9 3672.5 0.16 3.46 0.42 0.75 56.88 0.53 66.01 C G004215 Ile Fm. 6 2538.9 3674.5 0.18 3.80 0.17 0.74 62.57 0.66 61.45 C G004217 Ile Fm. 6 2540.3 3675.9 0.54 2.00 4.99 0.58 82.97 0.97 47.46 C G004218 Ile Fm. 6 2541.6 3677.2 0.13 3.39 0.15 0.82 58.20 0.60 78.35 C G004219 Ile Fm. 6 2542.1 3677.7 0.43 2.52 2.23 0.63 80.62 - - C G004221 Ile Fm. 6 2543.3 3678.9 0.16 3.88 0.21 0.77 59.49 0.57 77.07 C G004222 Ile Fm. 5 2547.6 3683.2 0.20 3.95 0.26 0.71 62.33 0.63 73.31 C G004223 Ile Fm. 5 2549.8 3685.4 0.14 3.33 0.18 0.79 59.91 0.56 84.07 C G004224 Ile Fm. 4 2551.6 3687.3 0.16 3.34 0.15 0.82 56.99 0.53 81.83 C G004225 Ile Fm. 4 2553.1 3688.8 0.15 3.69 0.17 0.81 57.37 0.55 81.80 C G004226 Ile Fm. 4 2556.4 3692.1 0.20 4.73 0.28 0.82 73.18 0.80 50.85 C G004229 Ile Fm. 4 2557.1 3692.8 0.15 3.86 0.15 0.83 59.38 0.57 79.80 C G004230 Ile Fm. 4 2557.7 3693.4 0.13 4.09 0.13 0.81 55.71 0.51 82.84 C G004234 Ile Fm. 3 2560.8 3696.6 0.13 4.09 0.13 0.81 55.71 0.54 80.94 C G004236 Ile Fm. 2 2567.8 3703.7 0.17 3.84 0.21 0.82 60.05 0.57 76.83 C G004238 Ile Fm. 2 2571.4 3707.3 0.24 3.79 0.19 0.78 61.96 0.57 73.93 C G004240 Ile Fm. 2 2573.9 3709.8 0.33 4.01 0.64 0.70 65.54 0.54 70.20 C G004249 Åre Fm. 1 2630.4 3766.8 1.00 2.04 21.13 0.51 92.21 - - C G004250 Åre Fm. 1 2633.1 3769.6 1.57 2.17 17.23 0.43 94.17 1.39 25.40
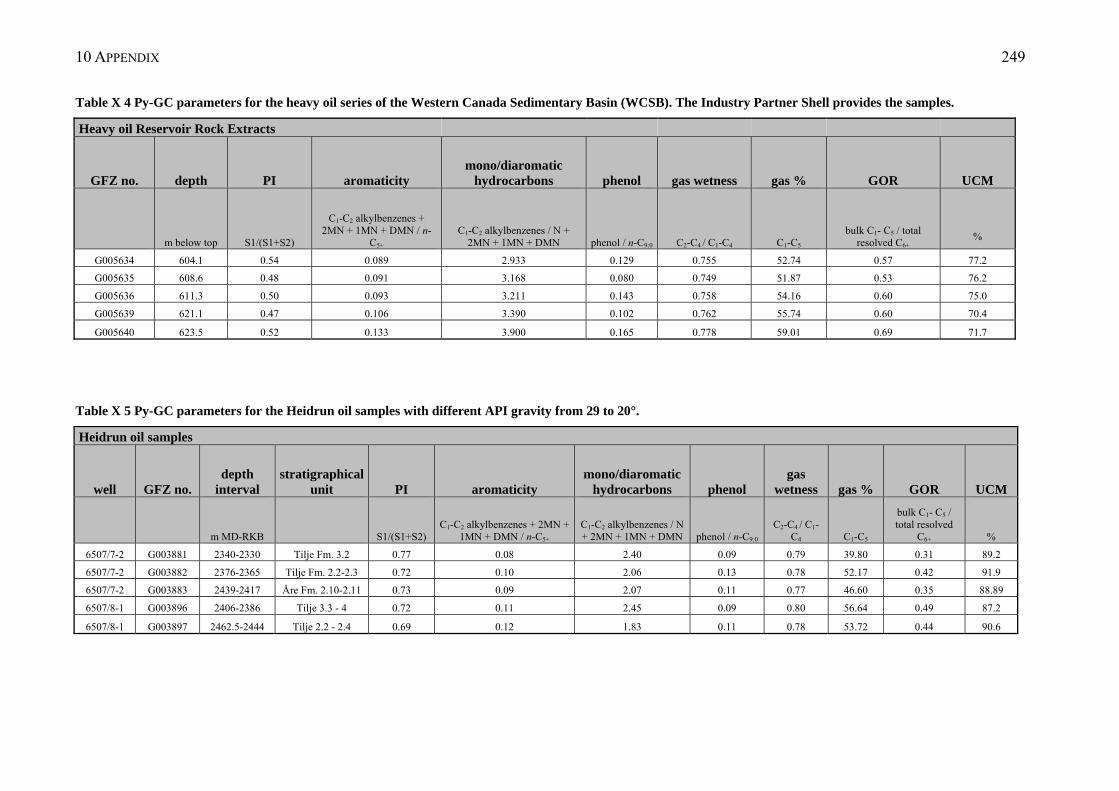
10 APPENDIX 249
Table X 4 Py-GC parameters for the heavy oil series of the Western Canada Sedimentary Basin (WCSB). The Industry Partner Shell provides the samples.
Heavy oil Reservoir Rock Extracts
GFZ no. depth PI aromaticity mono/diaromatic
hydrocarbons phenol gas wetness gas % GOR UCM
m below top S1/(S1+S2)
C1-C2 alkylbenzenes + 2MN + 1MN + DMN / n-
C5+ C1-C2 alkylbenzenes / N +
2MN + 1MN + DMN phenol / n-C9:0 C2-C4 / C1-C4 C1-C5 bulk C1- C5 / total
resolved C6+ %
G005634 604.1 0.54 0.089 2.933 0.129 0.755 52.74 0.57 77.2
G005635 608.6 0.48 0.091 3.168 0.080 0.749 51.87 0.53 76.2
G005636 611.3 0.50 0.093 3.211 0.143 0.758 54.16 0.60 75.0
G005639 621.1 0.47 0.106 3.390 0.102 0.762 55.74 0.60 70.4
G005640 623.5 0.52 0.133 3.900 0.165 0.778 59.01 0.69 71.7
Table X 5 Py-GC parameters for the Heidrun oil samples with different API gravity from 29 to 20°.
Heidrun oil samples
well GFZ no. depth
interval stratigraphical
unit PI aromaticity mono/diaromatic
hydrocarbons phenol gas
wetness gas % GOR UCM
m MD-RKB S1/(S1+S2) C1-C2 alkylbenzenes + 2MN +
1MN + DMN / n-C5+ C1-C2 alkylbenzenes / N + 2MN + 1MN + DMN phenol / n-C9:0
C2-C4 / C1-C4 C1-C5
bulk C1- C5 / total resolved
C6+ %
6507/7-2 G003881 2340-2330 Tilje Fm. 3.2 0.77 0.08 2.40 0.09 0.79 39.80 0.31 89.2
6507/7-2 G003882 2376-2365 Tilje Fm. 2.2-2.3 0.72 0.10 2.06 0.13 0.78 52.17 0.42 91.9
6507/7-2 G003883 2439-2417 Åre Fm. 2.10-2.11 0.73 0.09 2.07 0.11 0.77 46.60 0.35 88.89
6507/8-1 G003896 2406-2386 Tilje 3.3 - 4 0.72 0.11 2.45 0.09 0.80 56.64 0.49 87.2
6507/8-1 G003897 2462.5-2444 Tilje 2.2 - 2.4 0.69 0.12 1.83 0.11 0.78 53.72 0.44 90.6
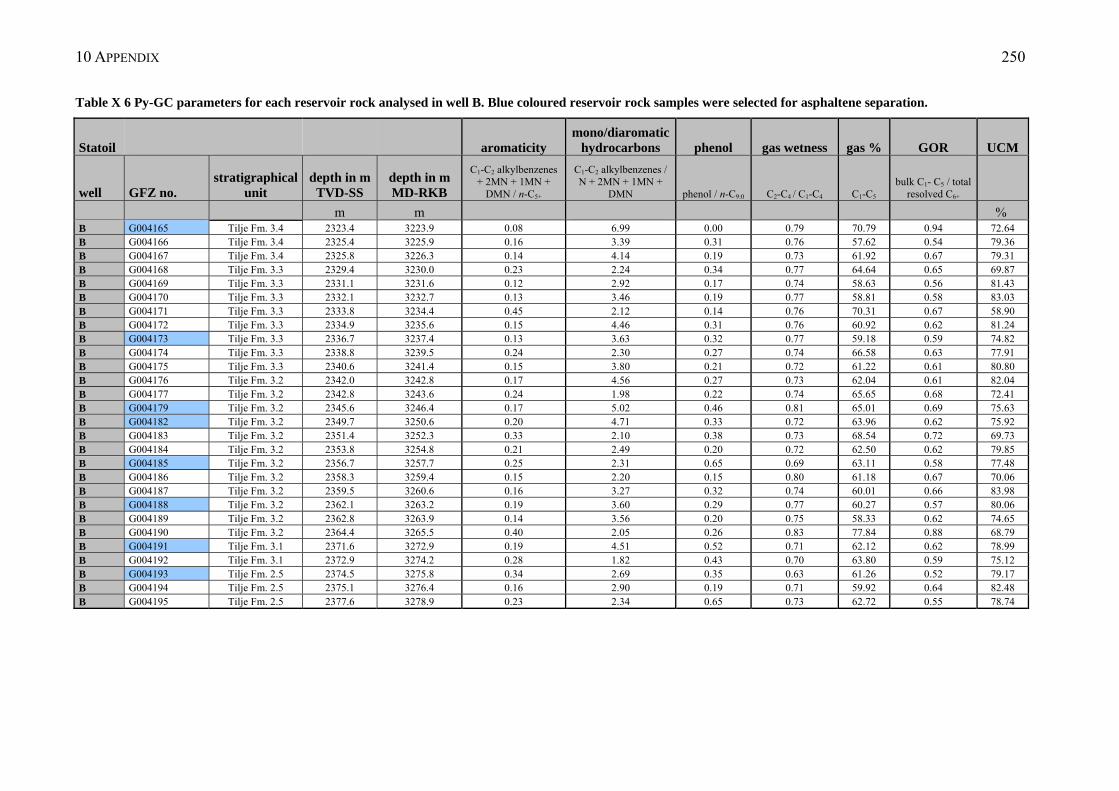
10 APPENDIX 250
Table X 6 Py-GC parameters for each reservoir rock analysed in well B. Blue coloured reservoir rock samples were selected for asphaltene separation.
Statoil aromaticity mono/diaromatic
hydrocarbons phenol gas wetness gas % GOR UCM
well GFZ no. stratigraphical
unit depth in m
TVD-SS depth in m MD-RKB
C1-C2 alkylbenzenes + 2MN + 1MN +
DMN / n-C5+
C1-C2 alkylbenzenes / N + 2MN + 1MN +
DMN phenol / n-C9:0 C2-C4 / C1-C4 C1-C5 bulk C1- C5 / total
resolved C6+
m m % B G004165 Tilje Fm. 3.4 2323.4 3223.9 0.08 6.99 0.00 0.79 70.79 0.94 72.64 B G004166 Tilje Fm. 3.4 2325.4 3225.9 0.16 3.39 0.31 0.76 57.62 0.54 79.36 B G004167 Tilje Fm. 3.4 2325.8 3226.3 0.14 4.14 0.19 0.73 61.92 0.67 79.31 B G004168 Tilje Fm. 3.3 2329.4 3230.0 0.23 2.24 0.34 0.77 64.64 0.65 69.87 B G004169 Tilje Fm. 3.3 2331.1 3231.6 0.12 2.92 0.17 0.74 58.63 0.56 81.43 B G004170 Tilje Fm. 3.3 2332.1 3232.7 0.13 3.46 0.19 0.77 58.81 0.58 83.03 B G004171 Tilje Fm. 3.3 2333.8 3234.4 0.45 2.12 0.14 0.76 70.31 0.67 58.90 B G004172 Tilje Fm. 3.3 2334.9 3235.6 0.15 4.46 0.31 0.76 60.92 0.62 81.24 B G004173 Tilje Fm. 3.3 2336.7 3237.4 0.13 3.63 0.32 0.77 59.18 0.59 74.82 B G004174 Tilje Fm. 3.3 2338.8 3239.5 0.24 2.30 0.27 0.74 66.58 0.63 77.91 B G004175 Tilje Fm. 3.3 2340.6 3241.4 0.15 3.80 0.21 0.72 61.22 0.61 80.80 B G004176 Tilje Fm. 3.2 2342.0 3242.8 0.17 4.56 0.27 0.73 62.04 0.61 82.04 B G004177 Tilje Fm. 3.2 2342.8 3243.6 0.24 1.98 0.22 0.74 65.65 0.68 72.41 B G004179 Tilje Fm. 3.2 2345.6 3246.4 0.17 5.02 0.46 0.81 65.01 0.69 75.63 B G004182 Tilje Fm. 3.2 2349.7 3250.6 0.20 4.71 0.33 0.72 63.96 0.62 75.92 B G004183 Tilje Fm. 3.2 2351.4 3252.3 0.33 2.10 0.38 0.73 68.54 0.72 69.73 B G004184 Tilje Fm. 3.2 2353.8 3254.8 0.21 2.49 0.20 0.72 62.50 0.62 79.85 B G004185 Tilje Fm. 3.2 2356.7 3257.7 0.25 2.31 0.65 0.69 63.11 0.58 77.48 B G004186 Tilje Fm. 3.2 2358.3 3259.4 0.15 2.20 0.15 0.80 61.18 0.67 70.06 B G004187 Tilje Fm. 3.2 2359.5 3260.6 0.16 3.27 0.32 0.74 60.01 0.66 83.98 B G004188 Tilje Fm. 3.2 2362.1 3263.2 0.19 3.60 0.29 0.77 60.27 0.57 80.06 B G004189 Tilje Fm. 3.2 2362.8 3263.9 0.14 3.56 0.20 0.75 58.33 0.62 74.65 B G004190 Tilje Fm. 3.2 2364.4 3265.5 0.40 2.05 0.26 0.83 77.84 0.88 68.79 B G004191 Tilje Fm. 3.1 2371.6 3272.9 0.19 4.51 0.52 0.71 62.12 0.62 78.99 B G004192 Tilje Fm. 3.1 2372.9 3274.2 0.28 1.82 0.43 0.70 63.80 0.59 75.12 B G004193 Tilje Fm. 2.5 2374.5 3275.8 0.34 2.69 0.35 0.63 61.26 0.52 79.17 B G004194 Tilje Fm. 2.5 2375.1 3276.4 0.16 2.90 0.19 0.71 59.92 0.64 82.48 B G004195 Tilje Fm. 2.5 2377.6 3278.9 0.23 2.34 0.65 0.73 62.72 0.55 78.74
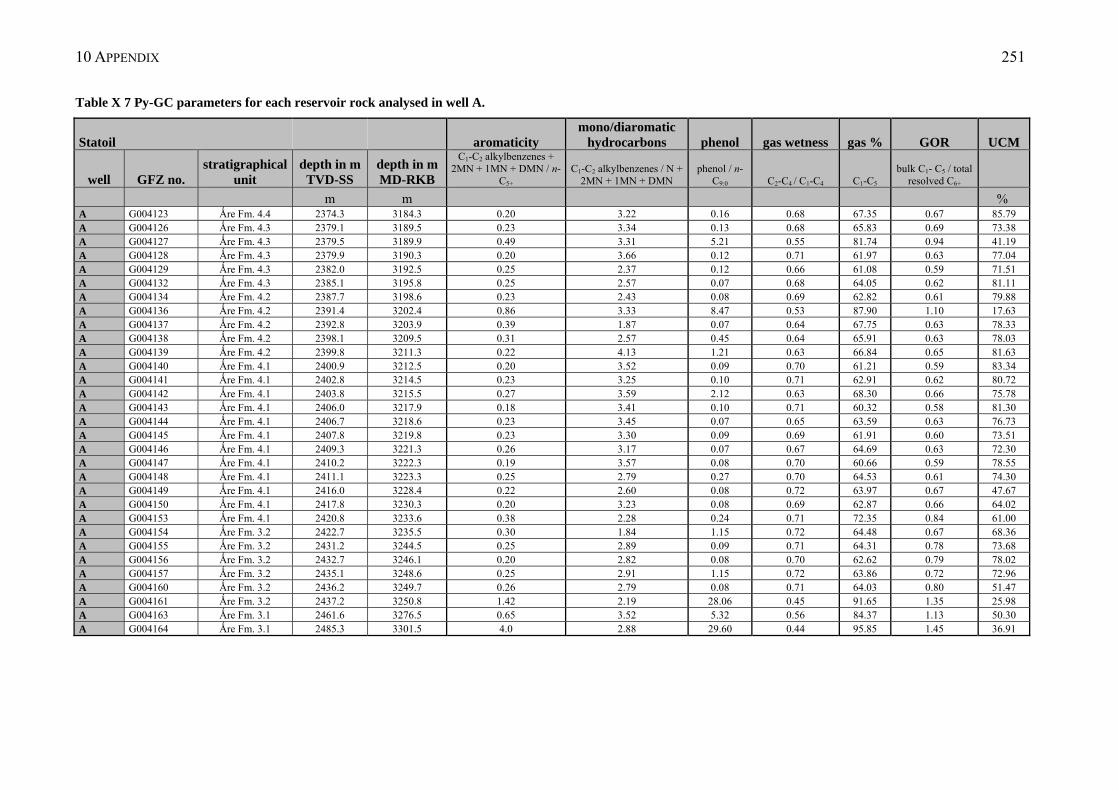
10 APPENDIX 251
Table X 7 Py-GC parameters for each reservoir rock analysed in well A.
Statoil aromaticity mono/diaromatic
hydrocarbons phenol gas wetness gas % GOR UCM
well GFZ no. stratigraphical
unit depth in m
TVD-SS depth in m MD-RKB
C1-C2 alkylbenzenes + 2MN + 1MN + DMN / n-
C5+ C1-C2 alkylbenzenes / N +
2MN + 1MN + DMN phenol / n-
C9:0 C2-C4 / C1-C4 C1-C5 bulk C1- C5 / total
resolved C6+
m m % A G004123 Ǻre Fm. 4.4 2374.3 3184.3 0.20 3.22 0.16 0.68 67.35 0.67 85.79 A G004126 Ǻre Fm. 4.3 2379.1 3189.5 0.23 3.34 0.13 0.68 65.83 0.69 73.38 A G004127 Ǻre Fm. 4.3 2379.5 3189.9 0.49 3.31 5.21 0.55 81.74 0.94 41.19 A G004128 Ǻre Fm. 4.3 2379.9 3190.3 0.20 3.66 0.12 0.71 61.97 0.63 77.04 A G004129 Ǻre Fm. 4.3 2382.0 3192.5 0.25 2.37 0.12 0.66 61.08 0.59 71.51 A G004132 Ǻre Fm. 4.3 2385.1 3195.8 0.25 2.57 0.07 0.68 64.05 0.62 81.11 A G004134 Ǻre Fm. 4.2 2387.7 3198.6 0.23 2.43 0.08 0.69 62.82 0.61 79.88 A G004136 Ǻre Fm. 4.2 2391.4 3202.4 0.86 3.33 8.47 0.53 87.90 1.10 17.63 A G004137 Ǻre Fm. 4.2 2392.8 3203.9 0.39 1.87 0.07 0.64 67.75 0.63 78.33 A G004138 Ǻre Fm. 4.2 2398.1 3209.5 0.31 2.57 0.45 0.64 65.91 0.63 78.03 A G004139 Ǻre Fm. 4.2 2399.8 3211.3 0.22 4.13 1.21 0.63 66.84 0.65 81.63 A G004140 Ǻre Fm. 4.1 2400.9 3212.5 0.20 3.52 0.09 0.70 61.21 0.59 83.34 A G004141 Ǻre Fm. 4.1 2402.8 3214.5 0.23 3.25 0.10 0.71 62.91 0.62 80.72 A G004142 Ǻre Fm. 4.1 2403.8 3215.5 0.27 3.59 2.12 0.63 68.30 0.66 75.78 A G004143 Ǻre Fm. 4.1 2406.0 3217.9 0.18 3.41 0.10 0.71 60.32 0.58 81.30 A G004144 Ǻre Fm. 4.1 2406.7 3218.6 0.23 3.45 0.07 0.65 63.59 0.63 76.73 A G004145 Ǻre Fm. 4.1 2407.8 3219.8 0.23 3.30 0.09 0.69 61.91 0.60 73.51 A G004146 Ǻre Fm. 4.1 2409.3 3221.3 0.26 3.17 0.07 0.67 64.69 0.63 72.30 A G004147 Ǻre Fm. 4.1 2410.2 3222.3 0.19 3.57 0.08 0.70 60.66 0.59 78.55 A G004148 Ǻre Fm. 4.1 2411.1 3223.3 0.25 2.79 0.27 0.70 64.53 0.61 74.30 A G004149 Ǻre Fm. 4.1 2416.0 3228.4 0.22 2.60 0.08 0.72 63.97 0.67 47.67 A G004150 Ǻre Fm. 4.1 2417.8 3230.3 0.20 3.23 0.08 0.69 62.87 0.66 64.02 A G004153 Ǻre Fm. 4.1 2420.8 3233.6 0.38 2.28 0.24 0.71 72.35 0.84 61.00 A G004154 Ǻre Fm. 3.2 2422.7 3235.5 0.30 1.84 1.15 0.72 64.48 0.67 68.36 A G004155 Ǻre Fm. 3.2 2431.2 3244.5 0.25 2.89 0.09 0.71 64.31 0.78 73.68 A G004156 Ǻre Fm. 3.2 2432.7 3246.1 0.20 2.82 0.08 0.70 62.62 0.79 78.02 A G004157 Ǻre Fm. 3.2 2435.1 3248.6 0.25 2.91 1.15 0.72 63.86 0.72 72.96 A G004160 Ǻre Fm. 3.2 2436.2 3249.7 0.26 2.79 0.08 0.71 64.03 0.80 51.47 A G004161 Ǻre Fm. 3.2 2437.2 3250.8 1.42 2.19 28.06 0.45 91.65 1.35 25.98 A G004163 Ǻre Fm. 3.1 2461.6 3276.5 0.65 3.52 5.32 0.56 84.37 1.13 50.30 A G004164 Ǻre Fm. 3.1 2485.3 3301.5 4.0 2.88 29.60 0.44 95.85 1.45 36.91
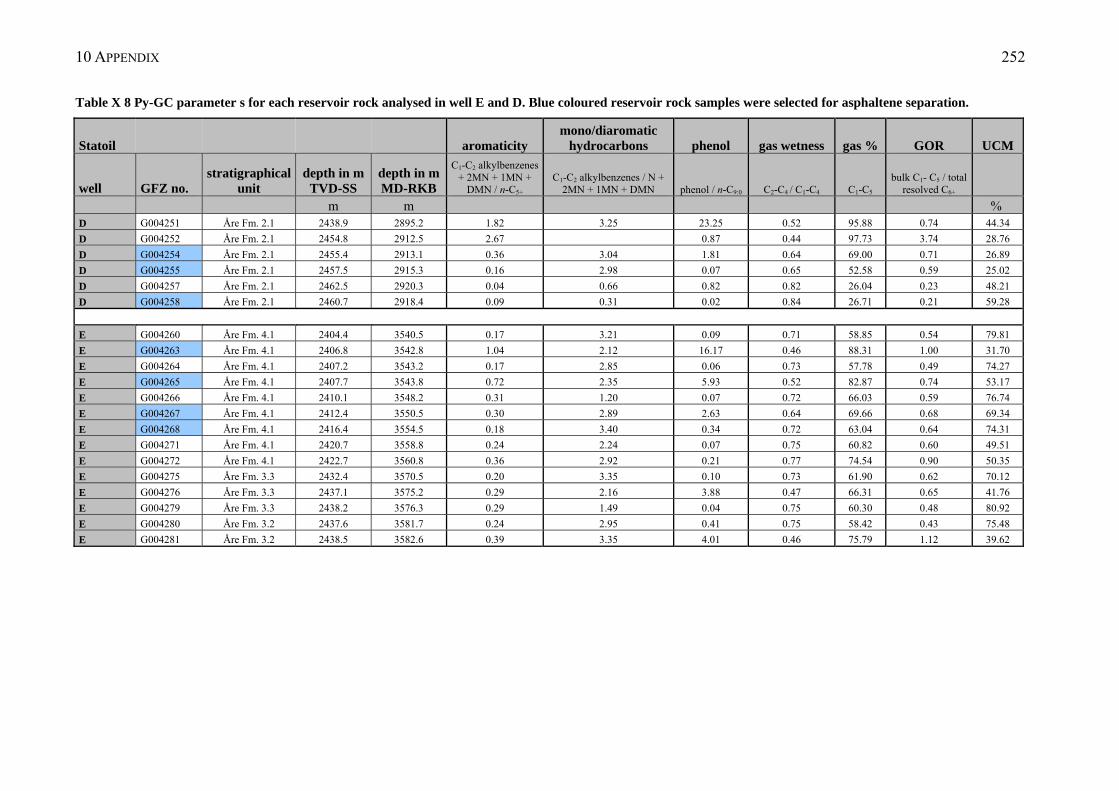
10 APPENDIX 252
Table X 8 Py-GC parameter s for each reservoir rock analysed in well E and D. Blue coloured reservoir rock samples were selected for asphaltene separation.
Statoil aromaticity mono/diaromatic
hydrocarbons phenol gas wetness gas % GOR UCM
well GFZ no. stratigraphical
unit depth in m
TVD-SS depth in m MD-RKB
C1-C2 alkylbenzenes + 2MN + 1MN +
DMN / n-C5+ C1-C2 alkylbenzenes / N +
2MN + 1MN + DMN phenol / n-C9:0 C2-C4 / C1-C4 C1-C5 bulk C1- C5 / total
resolved C6+
m m % D G004251 Åre Fm. 2.1 2438.9 2895.2 1.82 3.25 23.25 0.52 95.88 0.74 44.34
D G004252 Åre Fm. 2.1 2454.8 2912.5 2.67 0.87 0.44 97.73 3.74 28.76
D G004254 Åre Fm. 2.1 2455.4 2913.1 0.36 3.04 1.81 0.64 69.00 0.71 26.89
D G004255 Åre Fm. 2.1 2457.5 2915.3 0.16 2.98 0.07 0.65 52.58 0.59 25.02
D G004257 Åre Fm. 2.1 2462.5 2920.3 0.04 0.66 0.82 0.82 26.04 0.23 48.21
D G004258 Åre Fm. 2.1 2460.7 2918.4 0.09 0.31 0.02 0.84 26.71 0.21 59.28
E G004260 Åre Fm. 4.1 2404.4 3540.5 0.17 3.21 0.09 0.71 58.85 0.54 79.81
E G004263 Åre Fm. 4.1 2406.8 3542.8 1.04 2.12 16.17 0.46 88.31 1.00 31.70
E G004264 Åre Fm. 4.1 2407.2 3543.2 0.17 2.85 0.06 0.73 57.78 0.49 74.27
E G004265 Åre Fm. 4.1 2407.7 3543.8 0.72 2.35 5.93 0.52 82.87 0.74 53.17
E G004266 Åre Fm. 4.1 2410.1 3548.2 0.31 1.20 0.07 0.72 66.03 0.59 76.74
E G004267 Åre Fm. 4.1 2412.4 3550.5 0.30 2.89 2.63 0.64 69.66 0.68 69.34
E G004268 Åre Fm. 4.1 2416.4 3554.5 0.18 3.40 0.34 0.72 63.04 0.64 74.31
E G004271 Åre Fm. 4.1 2420.7 3558.8 0.24 2.24 0.07 0.75 60.82 0.60 49.51
E G004272 Åre Fm. 4.1 2422.7 3560.8 0.36 2.92 0.21 0.77 74.54 0.90 50.35
E G004275 Åre Fm. 3.3 2432.4 3570.5 0.20 3.35 0.10 0.73 61.90 0.62 70.12
E G004276 Åre Fm. 3.3 2437.1 3575.2 0.29 2.16 3.88 0.47 66.31 0.65 41.76
E G004279 Åre Fm. 3.3 2438.2 3576.3 0.29 1.49 0.04 0.75 60.30 0.48 80.92
E G004280 Åre Fm. 3.2 2437.6 3581.7 0.24 2.95 0.41 0.75 58.42 0.43 75.48
E G004281 Åre Fm. 3.2 2438.5 3582.6 0.39 3.35 4.01 0.46 75.79 1.12 39.62
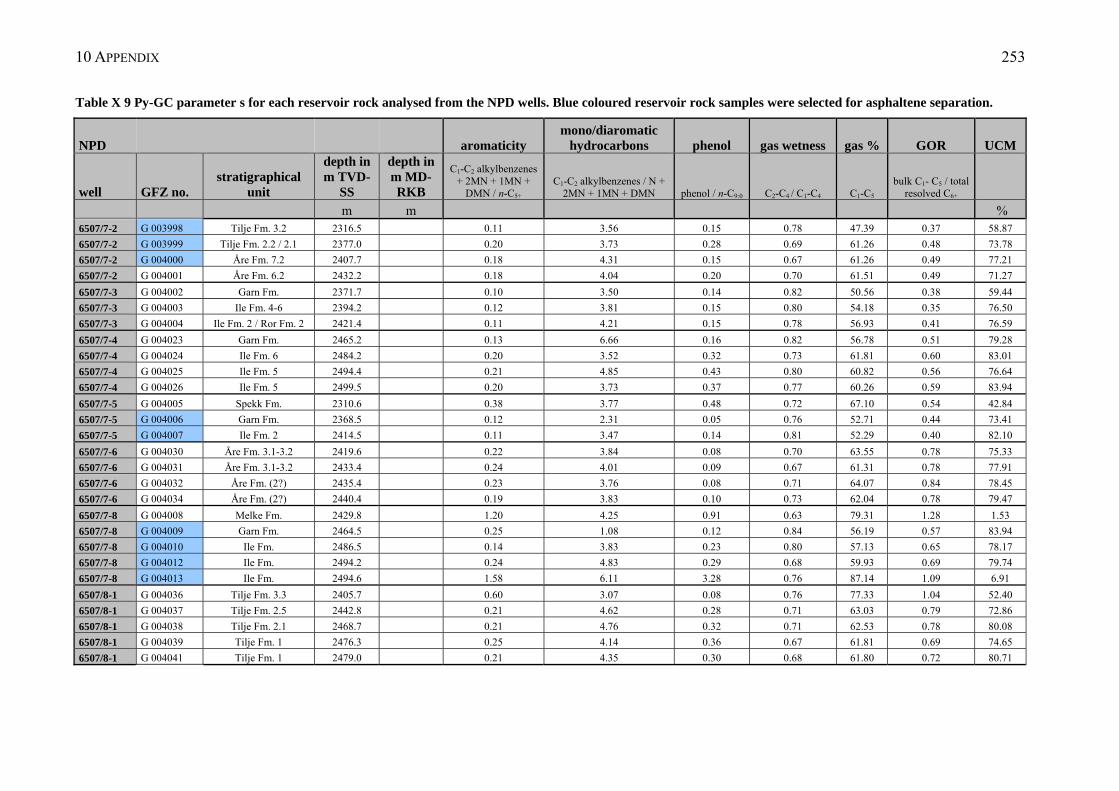
10 APPENDIX 253
Table X 9 Py-GC parameter s for each reservoir rock analysed from the NPD wells. Blue coloured reservoir rock samples were selected for asphaltene separation.
NPD aromaticity mono/diaromatic
hydrocarbons phenol gas wetness gas % GOR UCM
well GFZ no. stratigraphical
unit
depth in m TVD-
SS
depth in m MD-RKB
C1-C2 alkylbenzenes + 2MN + 1MN +
DMN / n-C5+ C1-C2 alkylbenzenes / N +
2MN + 1MN + DMN phenol / n-C9:0 C2-C4 / C1-C4 C1-C5 bulk C1- C5 / total
resolved C6+
m m % 6507/7-2 G 003998 Tilje Fm. 3.2 2316.5 0.11 3.56 0.15 0.78 47.39 0.37 58.87
6507/7-2 G 003999 Tilje Fm. 2.2 / 2.1 2377.0 0.20 3.73 0.28 0.69 61.26 0.48 73.78
6507/7-2 G 004000 Åre Fm. 7.2 2407.7 0.18 4.31 0.15 0.67 61.26 0.49 77.21
6507/7-2 G 004001 Åre Fm. 6.2 2432.2 0.18 4.04 0.20 0.70 61.51 0.49 71.27
6507/7-3 G 004002 Garn Fm. 2371.7 0.10 3.50 0.14 0.82 50.56 0.38 59.44
6507/7-3 G 004003 Ile Fm. 4-6 2394.2 0.12 3.81 0.15 0.80 54.18 0.35 76.50
6507/7-3 G 004004 Ile Fm. 2 / Ror Fm. 2 2421.4 0.11 4.21 0.15 0.78 56.93 0.41 76.59
6507/7-4 G 004023 Garn Fm. 2465.2 0.13 6.66 0.16 0.82 56.78 0.51 79.28
6507/7-4 G 004024 Ile Fm. 6 2484.2 0.20 3.52 0.32 0.73 61.81 0.60 83.01
6507/7-4 G 004025 Ile Fm. 5 2494.4 0.21 4.85 0.43 0.80 60.82 0.56 76.64
6507/7-4 G 004026 Ile Fm. 5 2499.5 0.20 3.73 0.37 0.77 60.26 0.59 83.94
6507/7-5 G 004005 Spekk Fm. 2310.6 0.38 3.77 0.48 0.72 67.10 0.54 42.84
6507/7-5 G 004006 Garn Fm. 2368.5 0.12 2.31 0.05 0.76 52.71 0.44 73.41
6507/7-5 G 004007 Ile Fm. 2 2414.5 0.11 3.47 0.14 0.81 52.29 0.40 82.10
6507/7-6 G 004030 Åre Fm. 3.1-3.2 2419.6 0.22 3.84 0.08 0.70 63.55 0.78 75.33
6507/7-6 G 004031 Åre Fm. 3.1-3.2 2433.4 0.24 4.01 0.09 0.67 61.31 0.78 77.91
6507/7-6 G 004032 Åre Fm. (2?) 2435.4 0.23 3.76 0.08 0.71 64.07 0.84 78.45
6507/7-6 G 004034 Åre Fm. (2?) 2440.4 0.19 3.83 0.10 0.73 62.04 0.78 79.47
6507/7-8 G 004008 Melke Fm. 2429.8 1.20 4.25 0.91 0.63 79.31 1.28 1.53
6507/7-8 G 004009 Garn Fm. 2464.5 0.25 1.08 0.12 0.84 56.19 0.57 83.94
6507/7-8 G 004010 Ile Fm. 2486.5 0.14 3.83 0.23 0.80 57.13 0.65 78.17
6507/7-8 G 004012 Ile Fm. 2494.2 0.24 4.83 0.29 0.68 59.93 0.69 79.74
6507/7-8 G 004013 Ile Fm. 2494.6 1.58 6.11 3.28 0.76 87.14 1.09 6.91
6507/8-1 G 004036 Tilje Fm. 3.3 2405.7 0.60 3.07 0.08 0.76 77.33 1.04 52.40
6507/8-1 G 004037 Tilje Fm. 2.5 2442.8 0.21 4.62 0.28 0.71 63.03 0.79 72.86
6507/8-1 G 004038 Tilje Fm. 2.1 2468.7 0.21 4.76 0.32 0.71 62.53 0.78 80.08
6507/8-1 G 004039 Tilje Fm. 1 2476.3 0.25 4.14 0.36 0.67 61.81 0.69 74.65
6507/8-1 G 004041 Tilje Fm. 1 2479.0 0.21 4.35 0.30 0.68 61.80 0.72 80.71
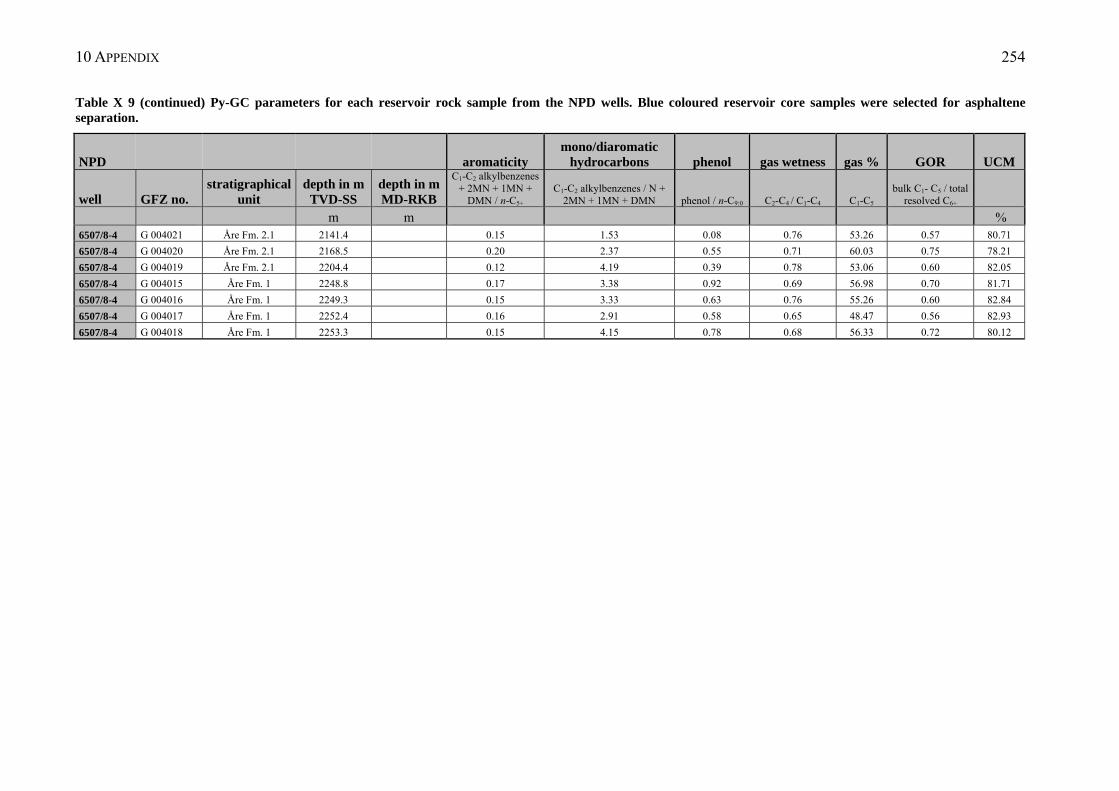
10 APPENDIX 254
Table X 9 (continued) Py-GC parameters for each reservoir rock sample from the NPD wells. Blue coloured reservoir core samples were selected for asphaltene separation.
NPD aromaticity mono/diaromatic
hydrocarbons phenol gas wetness gas % GOR UCM
well GFZ no. stratigraphical
unit depth in m
TVD-SS depth in m MD-RKB
C1-C2 alkylbenzenes + 2MN + 1MN +
DMN / n-C5+ C1-C2 alkylbenzenes / N +
2MN + 1MN + DMN phenol / n-C9:0 C2-C4 / C1-C4 C1-C5 bulk C1- C5 / total
resolved C6+
m m % 6507/8-4 G 004021 Åre Fm. 2.1 2141.4 0.15 1.53 0.08 0.76 53.26 0.57 80.71
6507/8-4 G 004020 Åre Fm. 2.1 2168.5 0.20 2.37 0.55 0.71 60.03 0.75 78.21
6507/8-4 G 004019 Åre Fm. 2.1 2204.4 0.12 4.19 0.39 0.78 53.06 0.60 82.05
6507/8-4 G 004015 Åre Fm. 1 2248.8 0.17 3.38 0.92 0.69 56.98 0.70 81.71
6507/8-4 G 004016 Åre Fm. 1 2249.3 0.15 3.33 0.63 0.76 55.26 0.60 82.84
6507/8-4 G 004017 Åre Fm. 1 2252.4 0.16 2.91 0.58 0.65 48.47 0.56 82.93
6507/8-4 G 004018 Åre Fm. 1 2253.3 0.15 4.15 0.78 0.68 56.33 0.72 80.12
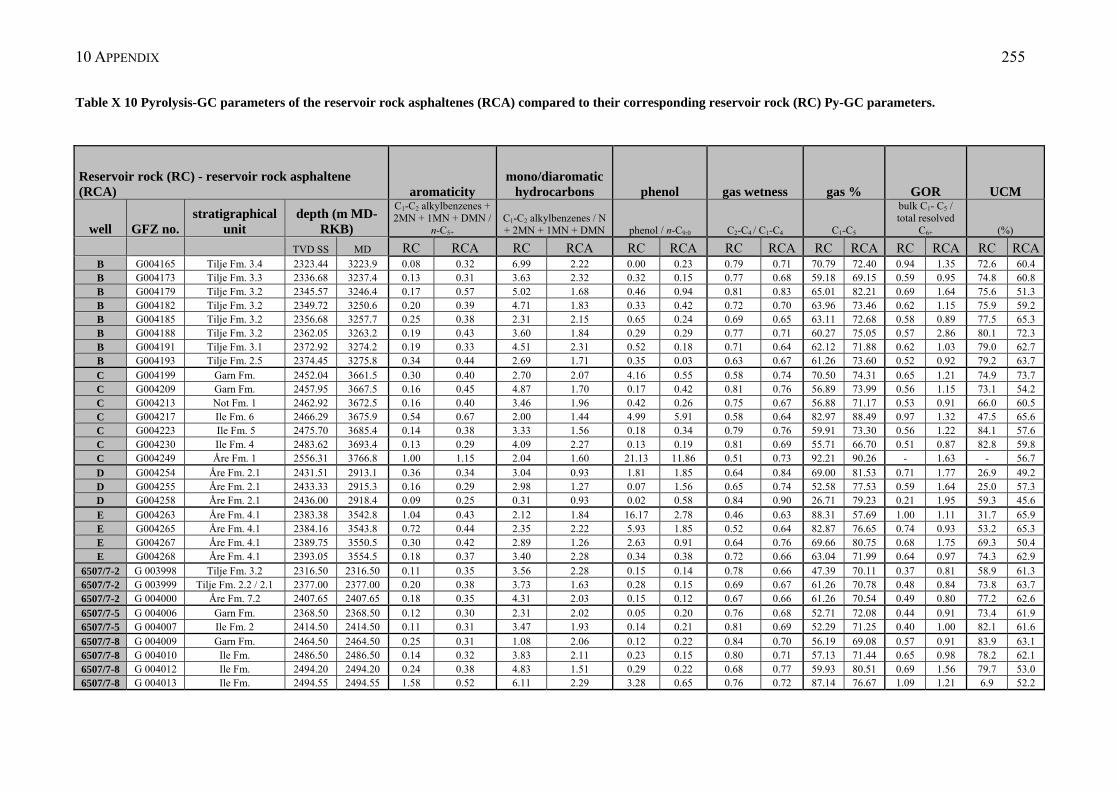
10 APPENDIX 255
Table X 10 Pyrolysis-GC parameters of the reservoir rock asphaltenes (RCA) compared to their corresponding reservoir rock (RC) Py-GC parameters.
Reservoir rock (RC) - reservoir rock asphaltene (RCA) aromaticity
mono/diaromatic hydrocarbons phenol gas wetness gas % GOR UCM
well GFZ no.stratigraphical
unit depth (m MD-
RKB)
C1-C2 alkylbenzenes + 2MN + 1MN + DMN /
n-C5+ C1-C2 alkylbenzenes / N + 2MN + 1MN + DMN phenol / n-C9:0 C2-C4 / C1-C4 C1-C5
bulk C1- C5 / total resolved
C6+ (%)
TVD SS MD RC RCA RC RCA RC RCA RC RCA RC RCA RC RCA RC RCA B G004165 Tilje Fm. 3.4 2323.44 3223.9 0.08 0.32 6.99 2.22 0.00 0.23 0.79 0.71 70.79 72.40 0.94 1.35 72.6 60.4 B G004173 Tilje Fm. 3.3 2336.68 3237.4 0.13 0.31 3.63 2.32 0.32 0.15 0.77 0.68 59.18 69.15 0.59 0.95 74.8 60.8 B G004179 Tilje Fm. 3.2 2345.57 3246.4 0.17 0.57 5.02 1.68 0.46 0.94 0.81 0.83 65.01 82.21 0.69 1.64 75.6 51.3 B G004182 Tilje Fm. 3.2 2349.72 3250.6 0.20 0.39 4.71 1.83 0.33 0.42 0.72 0.70 63.96 73.46 0.62 1.15 75.9 59.2 B G004185 Tilje Fm. 3.2 2356.68 3257.7 0.25 0.38 2.31 2.15 0.65 0.24 0.69 0.65 63.11 72.68 0.58 0.89 77.5 65.3 B G004188 Tilje Fm. 3.2 2362.05 3263.2 0.19 0.43 3.60 1.84 0.29 0.29 0.77 0.71 60.27 75.05 0.57 2.86 80.1 72.3 B G004191 Tilje Fm. 3.1 2372.92 3274.2 0.19 0.33 4.51 2.31 0.52 0.18 0.71 0.64 62.12 71.88 0.62 1.03 79.0 62.7 B G004193 Tilje Fm. 2.5 2374.45 3275.8 0.34 0.44 2.69 1.71 0.35 0.03 0.63 0.67 61.26 73.60 0.52 0.92 79.2 63.7
C G004199 Garn Fm. 2452.04 3661.5 0.30 0.40 2.70 2.07 4.16 0.55 0.58 0.74 70.50 74.31 0.65 1.21 74.9 73.7 C G004209 Garn Fm. 2457.95 3667.5 0.16 0.45 4.87 1.70 0.17 0.42 0.81 0.76 56.89 73.99 0.56 1.15 73.1 54.2 C G004213 Not Fm. 1 2462.92 3672.5 0.16 0.40 3.46 1.96 0.42 0.26 0.75 0.67 56.88 71.17 0.53 0.91 66.0 60.5 C G004217 Ile Fm. 6 2466.29 3675.9 0.54 0.67 2.00 1.44 4.99 5.91 0.58 0.64 82.97 88.49 0.97 1.32 47.5 65.6 C G004223 Ile Fm. 5 2475.70 3685.4 0.14 0.38 3.33 1.56 0.18 0.34 0.79 0.76 59.91 73.30 0.56 1.22 84.1 57.6 C G004230 Ile Fm. 4 2483.62 3693.4 0.13 0.29 4.09 2.27 0.13 0.19 0.81 0.69 55.71 66.70 0.51 0.87 82.8 59.8 C G004249 Åre Fm. 1 2556.31 3766.8 1.00 1.15 2.04 1.60 21.13 11.86 0.51 0.73 92.21 90.26 - 1.63 - 56.7
D G004254 Åre Fm. 2.1 2431.51 2913.1 0.36 0.34 3.04 0.93 1.81 1.85 0.64 0.84 69.00 81.53 0.71 1.77 26.9 49.2 D G004255 Åre Fm. 2.1 2433.33 2915.3 0.16 0.29 2.98 1.27 0.07 1.56 0.65 0.74 52.58 77.53 0.59 1.64 25.0 57.3 D G004258 Åre Fm. 2.1 2436.00 2918.4 0.09 0.25 0.31 0.93 0.02 0.58 0.84 0.90 26.71 79.23 0.21 1.95 59.3 45.6
E G004263 Åre Fm. 4.1 2383.38 3542.8 1.04 0.43 2.12 1.84 16.17 2.78 0.46 0.63 88.31 57.69 1.00 1.11 31.7 65.9 E G004265 Åre Fm. 4.1 2384.16 3543.8 0.72 0.44 2.35 2.22 5.93 1.85 0.52 0.64 82.87 76.65 0.74 0.93 53.2 65.3 E G004267 Åre Fm. 4.1 2389.75 3550.5 0.30 0.42 2.89 1.26 2.63 0.91 0.64 0.76 69.66 80.75 0.68 1.75 69.3 50.4 E G004268 Åre Fm. 4.1 2393.05 3554.5 0.18 0.37 3.40 2.28 0.34 0.38 0.72 0.66 63.04 71.99 0.64 0.97 74.3 62.9
6507/7-2 G 003998 Tilje Fm. 3.2 2316.50 2316.50 0.11 0.35 3.56 2.28 0.15 0.14 0.78 0.66 47.39 70.11 0.37 0.81 58.9 61.3 6507/7-2 G 003999 Tilje Fm. 2.2 / 2.1 2377.00 2377.00 0.20 0.38 3.73 1.63 0.28 0.15 0.69 0.67 61.26 70.78 0.48 0.84 73.8 63.7 6507/7-2 G 004000 Åre Fm. 7.2 2407.65 2407.65 0.18 0.35 4.31 2.03 0.15 0.12 0.67 0.66 61.26 70.54 0.49 0.80 77.2 62.6
6507/7-5 G 004006 Garn Fm. 2368.50 2368.50 0.12 0.30 2.31 2.02 0.05 0.20 0.76 0.68 52.71 72.08 0.44 0.91 73.4 61.9 6507/7-5 G 004007 Ile Fm. 2 2414.50 2414.50 0.11 0.31 3.47 1.93 0.14 0.21 0.81 0.69 52.29 71.25 0.40 1.00 82.1 61.6
6507/7-8 G 004009 Garn Fm. 2464.50 2464.50 0.25 0.31 1.08 2.06 0.12 0.22 0.84 0.70 56.19 69.08 0.57 0.91 83.9 63.1 6507/7-8 G 004010 Ile Fm. 2486.50 2486.50 0.14 0.32 3.83 2.11 0.23 0.15 0.80 0.71 57.13 71.44 0.65 0.98 78.2 62.1 6507/7-8 G 004012 Ile Fm. 2494.20 2494.20 0.24 0.38 4.83 1.51 0.29 0.22 0.68 0.77 59.93 80.51 0.69 1.56 79.7 53.0 6507/7-8 G 004013 Ile Fm. 2494.55 2494.55 1.58 0.52 6.11 2.29 3.28 0.65 0.76 0.72 87.14 76.67 1.09 1.21 6.9 52.2
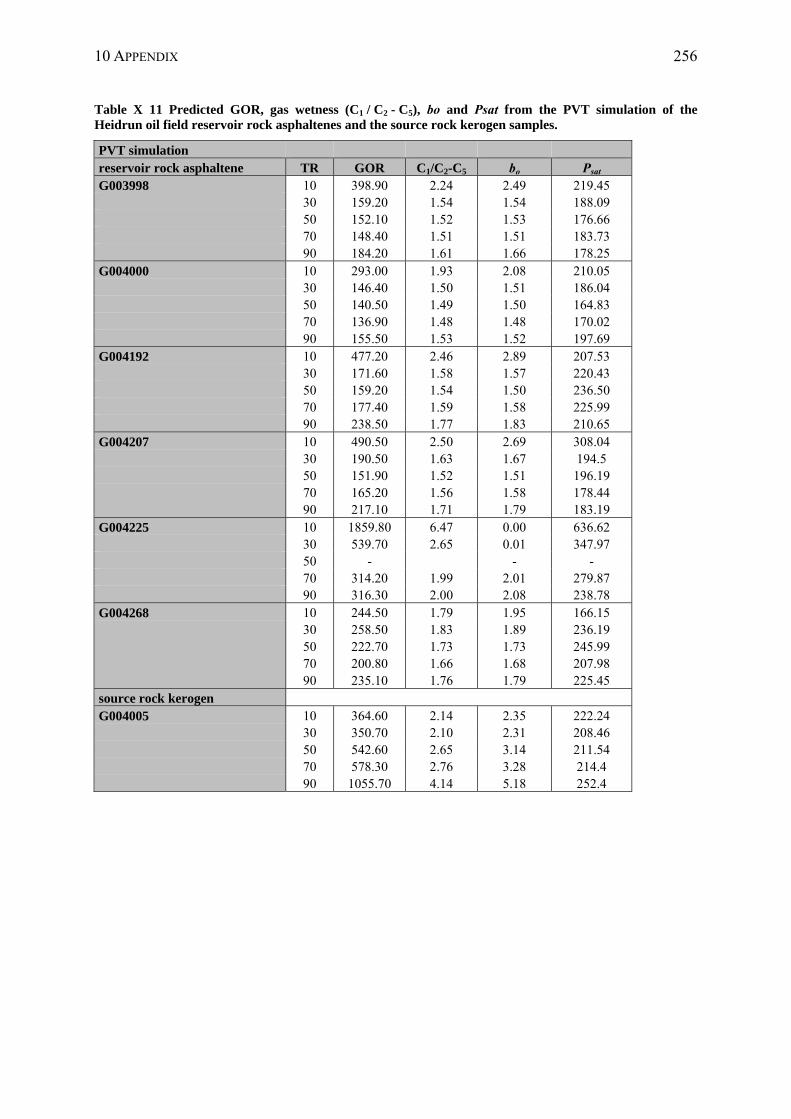
10 APPENDIX 256
Table X 11 Predicted GOR, gas wetness (C1 / C2 - C5), bo and Psat from the PVT simulation of the Heidrun oil field reservoir rock asphaltenes and the source rock kerogen samples.
PVT simulation reservoir rock asphaltene TR GOR C1/C2-C5 bo Psat G003998 10 398.90 2.24 2.49 219.45 30 159.20 1.54 1.54 188.09 50 152.10 1.52 1.53 176.66 70 148.40 1.51 1.51 183.73 90 184.20 1.61 1.66 178.25 G004000 10 293.00 1.93 2.08 210.05 30 146.40 1.50 1.51 186.04 50 140.50 1.49 1.50 164.83 70 136.90 1.48 1.48 170.02 90 155.50 1.53 1.52 197.69 G004192 10 477.20 2.46 2.89 207.53 30 171.60 1.58 1.57 220.43 50 159.20 1.54 1.50 236.50 70 177.40 1.59 1.58 225.99 90 238.50 1.77 1.83 210.65 G004207 10 490.50 2.50 2.69 308.04 30 190.50 1.63 1.67 194.5 50 151.90 1.52 1.51 196.19 70 165.20 1.56 1.58 178.44 90 217.10 1.71 1.79 183.19 G004225 10 1859.80 6.47 0.00 636.62 30 539.70 2.65 0.01 347.97 50 - - - 70 314.20 1.99 2.01 279.87 90 316.30 2.00 2.08 238.78 G004268 10 244.50 1.79 1.95 166.15 30 258.50 1.83 1.89 236.19 50 222.70 1.73 1.73 245.99 70 200.80 1.66 1.68 207.98 90 235.10 1.76 1.79 225.45 source rock kerogen G004005 10 364.60 2.14 2.35 222.24 30 350.70 2.10 2.31 208.46 50 542.60 2.65 3.14 211.54 70 578.30 2.76 3.28 214.4 90 1055.70 4.14 5.18 252.4
11 REFERENCES 257
11 REFERENCES
Agrawala, M., Yarranton, H.W., (2001) An asphaltene association model analogous to linear polymerization. Industrial & Engineering Chemistry Research, 40(21), 4664-4672.
Alboudwarej, H., Beck, J., Svrcek, W.Y., Yarranton, H.W., Akbarzadeh, K., (2002) Sensitivity of Asphaltene Properties to Separation Techniques. Energy Fuels, 16(2), 462-469.
Ancheyta, J., Betancourt, G., Centeno, G., Marroquin, G., Alonso, F., Garciafigueroa, E., (2002) Catalyst deactivation during hydro processing of Maya heavy crude oil. 1. Evaluation at constant operating conditions. Energy & Fuels, 16(6), 1438-1443.
Behar, F., Pelet, R., (1985) Pyrolysis-gas chromatography applied to organic geochemistry; Structural similarities between kerogens and asphaltenes from related rock extracts and oils. Journal of Analytical and Applied Pyrolysis, 8, 173-187.
Behar, F., & Vandenbroucke, M., (1987) Chemical modelling of kerogens. Organic Geochemistry, 11(1), 15-24.
Bhullar, A.G., Karlsen , D.A., Holm, K., Backer-Owe, K., Le Tran, K., (1998) Petroleum Geochemistry of the Frøy field and Rind discovery, Norwegian Continental Shelf. Implications for reservoir characterisation, compartmentalisation and basin scale hydrocarbon migration patterns in the region. Organic Geochemistry, 29(1-3), 735-768.
Bjørlykke, K., (1989) Sedimentology and Petroleum Geology. Springer-Verlag, Berlin Heidelberg New York
Blumer, M., Ehrhardt, M., Jones, D.M., (1973) The environmental fate of stranded oil. Deep-See Res, 20, 239-250.
Burnham, A.K., Braun, R.L., Gregg, H.R., Samoun, A.M., (1987) Comparison of methods for measuring kerogen pyrolysis rates and fitting kinetic parameters. Energy Fuels, 1(6), 452-458.
Calemma, V., Rausa, R., (1997) Thermal decomposition behaviour and structural characteristics of asphaltenes. Journal of Analytical and Applied Pyrolysis(40-41), 569-584.
Clegg, H., Horsfield, B., Stasiuk, L., Fowler, M., Vliex, M., (1997) Geochemical characterisation of organic matter in Keg River Formation (Elk point group, Middle Devonian), La Crete Basin, western Canada. . Organic Geochemistry, 26, 627-643.
Connan, J., (1984) Biodegradation of crude oils in reservoirs. In: J. Brooks, D.H. Welte (Eds.), Advances in Petroleum Geochemistry (Ed. by J. Brooks, D.H. Welte), pp. 299-335. Academic Press, London.
Cornford, C., (1998) Source rocks and hydrocarbons of the North Sea. In: K.W. Glennie (Ed.), Petroleum Geology of the North Sea, Basic Concepts and recent advances. (Ed. by K.W. Glennie), pp. 376-462. Blackwell Science.
Curry, D.J., Simpler, T.K., (1988) Isoprenoid constituents in kerogens as a function of depositional environment and catagenesis. Organic Geochemistry, 13(4-6), 995-1001.
Dahlgren, S., Hanesand, T., Mills, N., Patience, R., Brekke, T., Sinding-Larsen, R., (1998) NIGOGA - Norwegian Geochemical Standard samples: North Sea Oil - 1 (NGS NSO-1). Norwegian Geochemical Standard Newsletter, vol.3.
di Primio, R., (2004) Surface Exploration Case Histories. Applications of Geochemistry, Magnetics, and Remote Sensing: Dietmar Schumacher and Leonard A. LeSchack (Eds.); AAPG Studies in Geology No. 48, Tulsa, OK, USA, 2002, 486 pages, soft
11 REFERENCES 258
back, ISBN 0-89181-055-2, US$98 ($79 for AAPG members). Organic Geochemistry, 35(2), 215-216.
di Primio, R., Dieckmann, V., Mills, N., (1998) PVT and phase behaviour analysis in petroleum exploration. Organic Geochemistry, 29(1-3), 207-222.
di Primio, R., Horsfield, B., (1996) Predicting the generation of heavy oils in carbonate/evaporitic environments using pyrolysis methods. Organic Geochemistry - Proceedings of the 17th International Meeting on Organic Geochemistry, 24(10-11), 999-1016.
di Primio, R., Horsfield, B., (2006) From petroleum type organofacies to hydrocarbon phase prediction. AAPG Bulletin, 90(7), 1031-1058.
di Primio, R., Horsfield, B., Guzman-Vega, M.A., (2000) Determining the temperature of petroleum formation from the kinetic properties of petroleum asphaltenes. Nature, 406(6792), 173-176.
Düppenbecker, S., Horsfield, B., (1990) Compositional information for kinetic modelling and petroleum type prediction. Organic Geochemistry, 16, 259-266.
Eglinton, T.I., Larter, S.R., Boon, J.J., (1991) Characterisation of kerogens, coals and asphaltenes by quantitative pyrolysis--mass spectrometry. Journal of Analytical and Applied Pyrolysis, 20, 25-45.
Eglinton, T.I., Sinninghe Damsté, J.S., Kohnen, M.E.L., de Leeuw, J.W., (1990) Rapid estimation of the organic sulphur content of kerogens, coals and asphaltenes by pyrolysis-gas chromatography. Fuel, 69(11), 1394-1404.
Eglinton, T.I., Sinninghe Damsté, J.S., Pool, W., de Leeuw, J.W., Eijk, G., Boon, J.J., (1992) Organic sulphur in macromolecular sedimentary organic matter. II. Analysis of distributions of sulphur-containing pyrolysis products using multivariate techniques. Geochimica et Cosmochimica Acta, 56(4), 1545-1560.
Ehrenberg, S.N., Gjerstad, H.M., Hadler-Jacobsen, F., (1992) Smørbukk Field—A Gas Condensate Fault Trap in the Haltenbanken Province, Offshore Mid-Norway. In: M.T. Halbouty (Ed.), Giant Oil and Gas Fields of the Decade 1978–1988 (Ed. by M.T. Halbouty). AAPG, Tulsa.
Ehrenberg, S.N., Skjevrak, I., Gilje, A.E., (1995) Asphaltene-rich residues in sandstone reservoirs of Haltenbanken province, mid-Norwegian continental shelf. Marine and Petroleum Geology, 12(1), 53-69.
Elias, R., Vieth, A., Riva, A., Horsfield, B., Wilkes, H., (2007) Improved assessment of biodegradation extent and prediction of petroleum quality. Organic Geochemistry, 38, 2111-2130.
England, W.A., (1989) The organic geochemistry of petroleum reservoirs. Organic Geochemistry, 16(1-3), 415-425.
England, W.A., (2007) Reservoir geochemistry -- A reservoir engineering perspective. Journal of Petroleum Science and Engineering, 58(3-4), 344-354.
England, W.A., Mackenzie, A.S., (1989) The geochemistry of petroleum. Geologische Rundschau, Special Volume: Evolution of Sedimentary Basins. 78 (1).
England, W.A., Mackenzie, A.S., Mann, D.U., Quigley, T.M., (1987) The movement and entrapment of petroleum fluids in the subsurface. Journal of Geological Society, London, 144, 327-347.
Erdmann, M., (1999) Gas generation from over mature Upper Jurassic source rocks, Northern Viking Graben. In: Berichte4 des Forschungszentrum Jülich, pp. 198. Forschungszentrum Jülich, Jülich.
Espitalié, J., Laporte, J.L., Madec, M., Marquis, F., Leplat, P., Paulet, J., Boutefeu, A., (1977) Méthode rapide de caractérisation des roches mères de leur potentiel pétrolier et de leur degré d`évolution. Rev. Inst. Fr. Pétrole, 32, 23-42.
11 REFERENCES 259
Forbes, P.L., Ungerer, P.M., Kuhfuss, A.B., Riis, F., Eggen, S., (1991) Compositional modelling of petroleum generation and expulsion: Trial application to a local mass balance in the Smørbukk Sør Field, Haltenbanken Area, Norway. AAPG Bulletin, 75(5), 873-893.
Gürgey, K., (1998) Geochemical effects of asphaltene separation procedures: changes in sterane, terpane, and methylalkane distributions in maltenes and asphaltene co-precipitates. Organic Geochemistry, 29(5-7), 1139-1147.
Hartgers, W.A., Damste, J.S.S., de Leeuw, J.W., (1994) Geochemical significance of alkylbenzene distributions in flash pyrolysates of kerogens, coals, and asphaltenes. Geochimica et Cosmochimica Acta, 58(7), 1759-1775.
Head, I., Jones, D.M., Larter, S.R., (2003) Biological activity in the deep subsurface and the origin of heavy oil. Nature, 426, 344-352.
Hemmens, P.D., Hole, A., Reid, B.E., Leach, P.R.L., Landrum, W.R., (1994) The Heidrun oil field. In: J.O. Aasen, E. Berg, A.T. Buller, O. Hjelmeland (Eds.), North Sea Oil and Gas Reservoirs, III (Ed. by J.O. Aasen, E. Berg, A.T. Buller, O. Hjelmeland), pp. 1-23. Kluwer Academic publishers, Dordrecht.
Heum, O.R., (1996) A fluid dynamic classification of hydrocarbon entrapment. Petroleum Geoscience, 2, 145-158.
Hirschberg, A., de Jong, L.N.J., Schipper, B.A., Meijer, J.G., (1984) Influence of temperature and pressure on asphaltene flocculation. Society of Petroleum Engineers Journal, 283-293.
Holba, A.G., Dzou, L.I.P., Hickey, J.J., Franks, S.G., May, S.J., Lenney, T., (1996) Reservoir Geochemistry of South Pass 61 Field, Gulf of Mexico: compositional heterogeneities reflecting filling history and biodegradation. Organic Geochemistry, 24(12), 1179-1198.
Horsfield, B., (1989) Practical criteria for classifying kerogens: Some observations from pyrolysis-gas chromatography. Geochimica et Cosmochimica Acta, 53(4), 891-901.
Horsfield, B., (1997) The bulk composition of the first formed petroleum in source rocks. In: D.H. Welte, B. Horsfield, D.R. Baker (Eds.), Petroleum and Basin Evolution. Insights from Petroleum Geochemistry, Geology and Basin Modelling (Ed. by D.H. Welte, B. Horsfield, D.R. Baker), pp. 535. Springer, Berlin Heidelberg.
Horsfield, B., Dueppenbecker, S.J., (1991) The decomposition of Posidonia Shale and Green River Shale kerogens using microsclae sealed vessel (MSSV) pyrolysis. . Journal of Analytical and Applied Pyrolysis, 20, 107-123.
Horsfield, B., Dueppenbecker, S.J., Schenk, H.J., Schaefer, R.G., (1993) Kerogen typing concepts designed for the quantitative geochemical evaluation of petroleum potential concepts designed for the quantitative geochemical evaluation of petroleum potential. Basin modelling; advances and applications; proceedings of the Norwegian Petroleum Society conference, 3, 243-249.
Horsfield, B., Heckers, J., Leythaeuser, D., Littke, R., Mann, U., (1991) A study of the Holzener Asphaltkalk, northern Germany: observations regarding the distribution, composition and origin of organic matter in an exhumed petroleum reservoir. Marine and Petroleum Geology, 8(2), 198-211.
Horstad, I., Larter, S.R., Dypvik, H., Aagaard, P., Bjørnvik, A.M., Johansen, P.E., Eriksen, S., (1990) Degradation and maturity controls on oil field petroleum column heterogeneity in the Gullfaks field, Norwegian North Sea. Organic Geochemistry, 16(1-3), 497-510.
Horstad, I., Larter, S.R., Mills, N., (1995) Migration of hydrocarbons in the Tampen Spur area, Norwegian North Sea: a reservoir geochemical evaluation. In: J.M. Cubitt, W.A. England (Eds.), The geochemistry of reservoirs, Special Publication 86 (Ed. by J.M. Cubitt, W.A. England), pp. 159-183. The Geological Society, London.
11 REFERENCES 260
Hotier, G., Robin, M., (1983) Action de divers diluants sur les produits pétroliers lourds: mesure interprétation et prévision de la floculation des asphaltenès. Revue de l`Institut Français du Pétrole, 38(1), 101-120.
Hu, Y.F., Guo, T.M., (2001) Effect of temperature and molecular weight of n-alkane precipitants on asphaltene precipitation. Fluid Phase Equilibria, 192(1-2), 13-25.
Hvoslef, S., Larter, S.R., Leythaeuser, D., (1988) Aspects of generation and migration of hydrocarbons from coal-bearing strata of the Hitra formation, Haltenbanken area, offshore Norway. Organic Geochemistry, 13(1-3), 525-536.
Ignasiak, T., Kemp-Jones, A.V., Strausz, O.P., (1977) The molecular structure of Athabasca asphaltene. Cleavage of the carbon-sulphur bonds by radical ion electron transfer reactions. J. Org. Chem., 42(2), 312-320.
Jarvie, D.M., Morelos, A., Han, Z., (2001) Detection of pay zones and pay quality, Gulf of Mexico: Application of Geochemical Techniques. Golf Coast Association of Geological Society Transactions, 151-160.
Jones, D.M., Douglas, A.G., Connan, J., (1988) Hydrous pyrolysis of asphaltenes and polar fractions of biodegraded oils. Organic Geochemistry
Proceedings of the 13th International Meeting on Organic Geochemistry, 13(4-6), 981-993. Karlsen, D.A., Larter, S.R., (1989) A rapid correlation method for petroleum population
mapping within individual petroleum reservoirs - application to petroleum reservoir description. In: J. Haresnape (Ed.), Correlation in Hydrocarbon Exploration (Ed. by J. Haresnape), pp. 77-85. Graham and Trotman.
Karlsen, D.A., Nyland, B., Flood, B., Ohm, S.E., Brekke, T., Olsen, S., Backer-Owe, K., (1995) Petroleum geochemistry of the Haltenbanken, Norwegian continental shelf. In: J.M. Cubitt, W.A. England (Eds.), The Geochemistry of Reservoir, 86 (Ed. by J.M. Cubitt, W.A. England), pp. 203-256. Geological Society Special publication, London.
Karlsen, D.A., Skeie, J.E., Backer-Owe, K., Bjørlykke, K., Olstad, R., Berge, K., Cecchi, M., Vik, E., Schaefer, R.G., (2004) Petroleum migration, faults and overpressure; Part II, Case history; the Haltenbanken petroleum province, offshore Norway. In: J.M. Cubitt, W.A. England, S.R. Larter (Eds.), Understanding petroleum reservoirs; towards an integrated reservoir engineering and geochemical approach., 237, Geological Society Special Publications (Ed. by J.M. Cubitt, W.A. England, S.R. Larter), pp. 305-372. Geological Society of London, London.
Kawanaka, S., Leontaris, K.J., Park, S.J., Mansoori, G.A., (1989) Thermodynamic and colloidal models of asphaltene flocculation. In: American Chemical Society, Symposium Series 396 Oil-Field Chemistry, Enhanced Recovery and Production Stimulation, pp. 442-458, Washington, DC.
Keym, M., (2007) Asphaltenes as geochemical markers: A case study in the Norwegian North Sea. In: GFZ-Potsdam. TU-Berlin, Potsdam.
Keym, M., Dieckmann, V., (2006) Predicting the timing and characteristics of petroleum formation using tar mats and petroleum asphaltenes: A case study from the Northern North Sea. Journal of Petroleum Geology, 29(3), 273-296.
Keym, M., Dieckmann, V., Horsfield, B., Erdmann, M., Galimberti, R., Kua, L.C., Leith, L., Podlaha, O., (2006) Source rock heterogeneity of the Upper Jurassic Draupne Formation, North Viking Graben, and its relevance to petroleum generation studies. Organic Geochemistry, 37(2), 220-243.
Killops, S.D., Al-Jiboori, M.A.H.A., (1990) Characterisation of the unresolved complex mixture UCM in the gas chromatograms of biodegraded petroleum. Organic Geochemistry, 15, 147-160.
Killops, S.D., Killops, V.J., (2005) An introduction to organic geochemistry -2nd ed. Blackwell Publishing.
11 REFERENCES 261
Knai, T.A., Knipe, R.J., (1998) The impact of faults on fluid flow in the Heidrun oil field - 10.1144/GSL.SP.1998.147.01.18. Geological Society, London, Special Publications, 147(1), 269-282.
Larter, S.R., (1984) Application of analytical pyrolysis techniques to kerogen characterisation and fossil fuel exploration/exploitation. In: K.J. Vorhees (Ed.), Analytical pyrolysis (Ed. by K.J. Vorhees), pp. 212-275, Colorado.
Larter, S.R., Senftle, J.T., (1985) Improved kerogen typing for petroleum source rock analysis. Nature, 318, 277-280.
Lehne, E., (2007) Geochemical study on reservoir and source rock asphaltenes and their significance for hydrocarbon generation. In: GFZ-Potsdam, pp. 361.
Lehne, E., Dieckmann, V., (2007) The significance of kinetic parameters and structural markers in source rock asphaltenes, reservoir asphaltenes and related source rock kerogens, the Duvernay Formation (WCSB). Fuel, 86(5-6), 887-901.
Leontaris, K.J., (1989) Asphaltene deposition: a comprehensive description of problem manifestation and modelling approaches Soc. Petrol. Engin. AIME, SPE Pap. No. 18892.
Leontaris, K.J., Mansoori, G.A., (1988) Asphaltene deposition: a survey of field experiences and research approaches. Journal of Petroleum Science and Engineering, 3(1), 229-239.
Leythaeuser, D., Keuser, C., Schwark, L., (2007) Molecular memory effects recording the accumulation history of petroleum reservoirs: A case study of the Heidrun oil field, offshore Norway. Marine and Petroleum Geology, 24(4), 199-220.
Mango, F.D., (1996) Transition metal catalysis in the generation of natural gas. Organic Geochemistry, 24(10-11), 977-984.
Mango, F.D., (1997) The light hydrocarbons in petroleum: a critical review. Organic Geochemistry, 26(7-8), 417-440.
Meredith, W., Kelland, S.-J., Jones, D.M., (2000) Influence of biodegradation on crude oil acidity and carboxylic acid composition. Organic Geochemistry, 21, 1059-1073.
Mitchell, D.L., Speight, J.G., (1973) The solubility of asphaltenes in hydrocarbon solvents. Fuel, 52(2), 149-152.
Mo, E.S., Throndsen, T., Andresen, P., Backstrom, S.A., Forsberg, A., Haug, S., Torudbakken, B., (1989) A dynamic deterministic model of hydrocarbon generation in the Midgard Field drainage area offshore Mid-Norway. Geologische Rundschau, 78(1), 305-317.
Muscio, G.P.A., Horsfield, B., (1996) Neoformation of Inert Carbon during the Natural Maturation of a Marine Source Rock: Bakken Shale, Williston Basin. Energy & Fuels, 10(1), 10-18.
Muscio, G.P.A., Horsfield, B., Welte, D.H., (1994) Occurrence of thermogenic gas in the immature zone--implications from the Bakken in-source reservoir system. Organic Geochemistry, 22, 461-476.
Muscio, G.P.A., Horsfield, B., Welte, D.H., (1991) Compositional changes in the macromolecular organic matter (kerogens, asphaltenes, and resins) of a naturally matured source rock sequence from northern Germany as revealed by pyrolysis methods. In: D. Manning (Ed.), Organic geochemistry advances and applications in energy and the natural environment (Ed. by D. Manning), pp. 447-449. Manchester University Press, Manchester.
Odden, W., Patience, R.L., van Graas, G., (1998) Application of light hydrocarbons (C4-C13) to oil/source rock correlations; a study of the light hydrocarbon compositions of source rocks and test fluids from offshore Mid-Norway. Organic Geochemistry, 28, 823-847.
11 REFERENCES 262
Palmer, S.E., (1993) Effects of biodegradation and water washing on crude oil composition. In: M.H. Engel, S.A. Macko (Eds.), Organic Geochemistry (Ed. by M.H. Engel, S.A. Macko), pp. 511-533. Plenum Press, New York.
Parra-Barraza, H., Hernandez-Montiel, D., Lizardi, J., Hernandez, J., Herrera Urbina, R., Valdez, M.A., (2003) The zeta potential and surface properties of asphaltenes obtained with different crude oil/n-heptane proportions. Fuel, 82(8), 869-874.
Patience, R.L., (2003) Where did all the gas go? Organic Geochemistry, 34, 375-387. Pedersen, T., Harms, J.C., Harris, N.B., Mitchell, R.W., Tooby, K.M., (1989) The role of
correlation in generating the Heidrun oil field geological model. In: J.D. Collison (Ed.), Correlation in Hydrocarbon Exploration (Ed. by J.D. Collison), pp. 327-338. Graham & Trotman.
Pelet, R., Behar, F., Monin, J.C., (1986) Resins and asphaltenes in the generation and migration of petroleum. Organic Geochemistry, 10(1-3), 481-498.
Peters, K.E., Moldowan, J.M., (1993) The biomarker guide: Interpreting molecular fossils in petroleum and ancient sediments. Englewood Cliffs, Prentice Hall, NJ (United States).
Peters, K.E., Walters, C.C., Moldowan, J.M., (2005) The Biomarker Guide - 2nd ed. Cambridge University Press.
Requejo, A.G., Allan, J., Creaney, S., Gray, N.R., Cole, K.S., (1992) Aryl isoprenoids and diaromatic carotenoids in Palaeozoic source rocks and oils from the Western Canada and Williston Basins. Organic Geochemistry, 19(1-3), 245-264.
Rovere, C.E., Crisp, P.T., Ellis, J., Bolton, P.D., (1983) Chemical characterisation of shale oil from Condor, Australia. Fuel, 62, 1274-1282.
Rubinstein, I., Spyckerelle, C., Strausz, O.P., (1979) Pyrolysis of asphaltenes: a source of geochemical information. Geochimica et Cosmochimica Acta, 43(1), 1-6.
Rullkötter, J., Michaelis, W., (1990) The structure of kerogens and related materials. A review of recent progress and future trends. In: B. Durand, F. Behar (Eds.), Advances in Organic Geochemistry (Ed. by B. Durand, F. Behar), pp. 829-852. Pergamon Press, Oxford.
Santamaria-Orozco, D., Horsfield, B., di Primio, R., Welte, D.H., (1998) Influence of maturity on distributions of benzo- and dibenzothiophenes in Tithonian source rocks and crude oils, Sonda de Campeche, Mexico. Organic Geochemistry, 28(7-8), 423-439.
Schenk, H.J., Dieckmann, V., (2004) Prediction of petroleum formation: the influence of laboratory heating rates on kinetic parameters and geological extrapolations. Marine and Petroleum Geology., 21, 79-95.
Schenk, H.J., Horsfield, B., (1998) Using natural maturation series to evaluate the utility of parallel reaction kinetics models: an investigation of Toarcian shales and Carboniferous coals, Germany. Organic Geochemistry, 29(1-3), 137-154.
Selley, R.C., (1997) Elements of Petroleum Geology. Academic Press, New York. Senftle, J.T., Larter, S.R., Bromley, B.W., Brown, J.H., (1986) Quantitative chemical
characterisation of vitrinite concentrates using pyrolysis-gas chromatography. Rank variation of pyrolysis products. Organic Geochemistry, 9(6), 345-350.
Sinninghe Damste, J.S., Eglinton, T.I., De Leeuw, J.W., Schenck, P.A., (1989) Organic sulphur in macromolecular sedimentary organic matter: I. Structure and origin of sulphur-containing moieties in kerogen, asphaltenes and coal as revealed by flash pyrolysis. Geochimica et Cosmochimica Acta, 53(4), 873-889.
Sinninghe Damsté, J.S., Rijpstra, W.I.C., De Leeuw, J.W., Schenck, P.A., (1990) The occurrence and identification of series of organic sulphur compounds in oils and sediment extracts: II. Their presence in samples from hypersaline and non-hypersaline palaeoenvironments and possible application as source, palaeoenvironmental and maturity indicators. Geochimica et Cosmochimica Acta, 53(6), 1323-1341.
11 REFERENCES 263
Speight, J.G., (1999) The chemistry and technology of petroleum, Marcel Dekker, New York. Speight, J.G., Long, R.B., Trowbridge, T.D., (1984) Factors influencing the separation of
asphaltenes from heavy petroleum feedstocks. Fuel, 63(5), 616-620. Theuerkorn, K., Horsfield, B., Wilkes, H., di Primio, R., Lehne, E., (2008) A reproducible
and linear method for separating asphaltenes from crude oil. Organic Geochemistry Advances in Organic Geochemistry 2007 - Proceedings of the 23rd International
Meeting on Organic Geochemistry, 39(8), 929-934. Tissot, B.P., Welte, D.H., (1984) Petroleum formation and occurrence. Springer-Verlag. Ungerer, P., (1990) State of the art of research in kinetic modelling of oil formation and
expulsion. Organic Geochemistry, 16(1-3), 1-25. van Graas, G., de Leeuw, J.W., Schenck, P.A., Haverkamp, J., (1981) Kerogen of Toarcian
shales of the Paris Basin. A study of its maturation by flash pyrolysis techniques. Geochimica et Cosmochimica Acta, 45(12), 2465-2474.
Volkman, J.K., Alexander, R., Kagi, R.I., Rowland, S.J., Sheppard, P.N., (1984) Biodegradation of aromatic hydrocarbons in crude oils from the Barow Sub-basin of West Australia. Organic Geochemistry, 6, 619-632.
Welbon, A.L., Beach, A., Brockbank, P.J., Fjield, O., Knorr, S.D., Pederson, T., Thomas, S., (1997) Fault seal analysis in hydrocarbon exploration and appraisal: examples from offshore mid-Norway. In: P. Møller-Peddersen, A.G. Koestler (Eds.), Hydrocarbon seals - Importance for Exploration and Production, 7 (Ed. by P. Møller-Peddersen, A.G. Koestler), pp. 125-138. Norsk Petroleumsforening/NPF (Norwegian Petroleum Society) Special publications
Whitley, P.K., (1992) The geology of Heidrun; A giant oil and gas field on the mid-Norwegian shelf. In: M.T. Halbouty (Ed.), Giant oil and gas fields of the decade 1978-1988, Memoir 54 (Ed. by M.T. Halbouty), pp. 383-406. AAPG, Tulsa.
Wilhelms, A., Larter, S.R., (1994a) Origin of tar mats in petroleum reservoirs. Part I: introduction and case studies. Marine and Petroleum Geology, 11(4), 418-441.
Wilhelms, A., Larter, S.R., (1994b) Origin of tar mats in petroleum reservoirs. Part II: formation mechanisms for tar mats. Marine and Petroleum Geology, 11(4), 442-456.
Wilson, M.A., Philp, R.P., Gillam, A.H., Gilbert, T.D., Tate, K.R., (1983) Comparison of the structures of humic substances from aquatic and terrestrial sources by pyrolysis gas chromatography-mass spectrometry. Geochim. Cosmochim. Acta 47, 497-502.