Embed Size (px)
Citation preview


On the cover: The climate change “puzzle” includes pieces from science and engineering fi elds including ecology, glaciology, atmospheric science, behavioral science, and economics. The photos in this puzzle collage represent the various fi elds that contribute to our full understanding of Earth’s climate. The missing puzzle piece symbolizes the need for continued basic research on global climate change and variability.
Cover design: Adrian Apodaca, National Science Foundation
Cover photo credits: © 2009 JupiterImages Corporation (background) Sphere: top row, left to right: David Cappaert, Bugwood.org, © University Corporation for Atmospheric Research; © 2009 JupiterImages Corporation. Second row: Eva Horne, Konza Prairie Biological Station; © 2009 JupiterImages Corporation (2). Third row: © 2009 JupiterImages Corporation; Jeffrey Kietzmann, National Science Foundation; © Forrest Brem, courtesy of NatureServe; Digital Vision, Getty Images. Fourth row: Jim Laundre, Arctic LTER; © 2009 JupiterImages Corporation; Lynn Betts, USDA Natural Resources Conservation Service; Peter West, National Science Foundation. Bottom row: David Gochis © University Corporation for Atmospheric Research; © University Corporation for Atmospheric Research

SOLVING THE PUZZLE:Researching the Impacts of Climate Change Around the World

TABLE OF CONTENTS
Introduction
Sky
Sky Research Highlights
Sea
Sea Research Highlights
Ice
Ice Research Highlights
Land
Land Research Highlights
Life
Life Research Highlights
People
People Research Highlights
1
8
16
27
33
43
52
62
66
74
79
90
98

1
INTRODUCTIONEarth’s Changing ClimateTo explain the diff erence between weather and climate, scientists often say, “Climate is what you expect, weather is what you get.” Climate is the weather of a particular region, averaged over a long period of time.1 Climate is a fundamental factor in ecosystem health—while most species can survive a sudden change in the weather, such as a heat wave, fl ood, or cold snap—they often cannot survive a long-term change in climate. Global climate is the average of all regional trends, and researchers have concluded that Earth’s climate, as a whole, is warming.
Researchers know that human activities including fossil fuel use, agriculture, and land use have been the dominant causes of increased concentrations of greenhouse gases in the atmosphere over the past 250 years. In addition, aerosols and land surface changes are altering Earth’s climate, making it extremely likely2 that human activities have had a net warming eff ect since 1750.3 Th ese human-caused changes to the climate system, and their consequences, provide much of the impetus for the National Science Foundation’s (NSF) climate change research.
Researchers funded by NSF have discovered signs of a changing climate in nearly every corner of the globe, from the icy expanses of the polar regions of Earth to its equatorial ecosystems. Our planet’s climate aff ects—and is aff ected by—the sky, land, ice, sea, life, and the people found on Earth. To
1 More rigorously, climate is defined as the mean and variability of relevant quantities over a period ranging from months to thousands or millions of years. A 30-year period is frequently used for averaging these variables. Appendix I: Glossary. Fourth Assessment Report of the Intergovernmental Panel on Climate Change, 2007.
2 According to the Treatment of Uncertainties in the Working Group I Assessment of the Intergovernmental Panel on Climate Change, ‘extremely likely’ corresponds to a likelihood of >95% probability. Solomon, S., et al. Technical Summary, in Climate Change 2007: The Physical Science Basis. Contribution of Working Group I to the Fourth Assessment Report of the Intergovernmental Panel on Climate Change, 2007 Cambridge University Press. Box TS.1
3 Solomon, S., et al. Technical Summary, in Climate Change 2007: The Physical Science Basis. Contribution of Working Group I to the Fourth Assess-ment Report of the Intergovernmental Panel on Climate Change, 2007. Cambridge University Press. pp. 81
Top image credit: © University Corporation for Atmospheric Research

2
piece together the entire puzzle of climate change—what we know, what we still have to learn and what humankind can do to prepare for the future—we must study all of the physical, natural, and human systems that contribute to, and interact with, Earth’s climate system.
As researchers work together to solve the climate puzzle, they are revolutionizing the way we understand the Earth system as a whole. Researchers have realized that they must reach across disciplinary boundaries to study questions that extend beyond any one fi eld of science or engineering. In fact, because of the complexity of Earth’s climate, this research involves contributions from nearly every fi eld of science, math, and engineering.
In no area is NSF’s contribution more important—or more infl uential—than in interdisciplinary research. NSF responds to the needs of research communities by supporting teams that include experts from multiple disciplines. NSF is unique among other government agencies with a science mission because NSF funds research, infrastructure, and education across all disciplines of science and engineering.
With its emphasis on supporting pioneering research, NSF is well positioned to support the broad federal agency response to climate change. Th e basic research NSF funds is essential to creating a vibrant and strong foundation for the important work of the mission agencies that are responsible for the U.S. government’s monitoring of, and response to, climate change and variability. Basic research underpins what we currently know about Earth’s changing climate, and will continue to play a vital role in the discovery of new knowledge and the development of tools to help humankind respond to the eff ects of global climate change. NSF must maintain its steadfast support of the American academic system’s groundbreaking research and world-class educational programs in order to continue providing the next-generation of people and ideas that will help the United States and the world meet the challenges imposed by global climate change.
NSF personnel and awardees regularly work with each other, other government agencies, and international organizations to strengthen the goals of climate change research and to identify the unanswered scientifi c questions. Th ey participate in the U.S. Climate Change Science Program (CCSP) and have served as authors for its numerous Synthesis Assessment Product reports. NSF—the lead U.S. agency in Antarctic research—coordinates and facilitates the activities of NSF- and mission agency-supported research near both poles, areas where some of the most important observational data on global climate change are gathered.4
Scores of NSF-supported researchers, including over 40 researchers from the National Center for Atmospheric Research (NCAR)—an NSF-supported research facility and one of the nation’s most important assets in climate research—have participated in the United Nations’ Intergovernmental Panel on Climate Change (IPCC). Numerous NSF-funded researchers served in leadership roles in the latest IPCC assessment report, and they continue to make signifi cant progress on the research goals identifi ed in the report.
Basic research on the frontiers of mitigation and adaptation strategies, including geoengineering, is an NSF investment area that will become increasingly important in the coming years. NSF’s emphasis on exploratory, potentially transformative, basic research makes the agency a natural leader in identifying the most promising strategies for mission agencies, corporations or other organizations to adopt and pursue. NSF’s support of economic research, including emissions trading scenarios and the incorporation of economic theory into climate modeling, will help to inform government climate policy decisions.
4 NSF FY 2009 Budget Request to Congress
Don Juan Pond, located in the Wright Valley of the Transantarctic Mountains of Antarctica. The McMurdo Dry Valleys are very sensitive to small variations in solar radiation and temperature. For this reason, the dry valleys area may well be an important natural regional-scale laboratory for studying responses to human alterations of climate. Credit: Jenny Baeseman, University of Colorado; National Science Foundation

3
NSF investments have played a crucial role in our understanding of Earth’s climate past, present, and potential future. From its inception, NSF has funded the research of climatologists including Charles David Keeling, whose data on increasing carbon dioxide concentrations in the atmosphere are considered pivotal early evidence in support of the hypothesis of anthropogenic climate change.5 NSF funding through the decades has led to many of the most fundamental discoveries and advances in human knowledge about the causes and consequences of global climate change and variability. Paleoclimate records, computational climate models, and economic models of climate change are just some examples of the major contributions of NSF’s investments in this area. In the future, as the world’s human population turns its attention to managing and coping with the eff ects of climate change, NSF-funded basic research will continue to provide the necessary platform for technological advances, in areas including energy and geoengineering.
Putting the Pieces TogetherTh e evidence we have for a changing planet goes well beyond any one fi eld of science or engineering.
Ecologists have noted marked changes in the habitats of the species they study—changes in the places where they fi nd a particular species, changes in the dates plants fi rst sprout and bloom, changes in plant growth rates, and even signs of evolutionary adaptation brought on by a warming climate.6
Ocean scientists have recorded higher temperatures and rising ocean acidity, which alter the characteristics of the most fundamental organisms of the ocean food chain.7 Coral reefs—some of which have thrived for centuries—have died off suddenly as a result of ocean temperatures that exceed the corals’ ability to survive.8
Polar scientists have watched vast tracts of Arctic sea ice melt away, leaving behind more open water than anyone can remember seeing during any previous Northern Hemisphere summer.9 Glaciologists have witnessed ice shelves—once thought too large to be infl uenced by anything short of cataclysmic environmental change—break up into a churning sea of icebergs in a matter of days.10
Social scientists have recorded the bewilderment of indigenous people. Th eir cultural knowledge, which stretches back in time through numerous generations, holds no record of the kinds of environmental changes they are encountering today.11
5 Weart, Spencer. The Discovery of Climate Change. www.aip.org/history/climate/Kfunds.htm
6 E.g. www.nsf.gov/news/news_summ.jsp?cntn_id=112093; www.nsf.gov/news/news_summ.jsp?cntn_id=105707; NSF Highlight 13082: Genetic Consequences of Climate Change; NSF Highlight 16828: Is There a Relationship between Global Climate Change and Flowering?
7 NSF Highlight 13239: Rising Ocean CO2 Levels May Stimulate Nitrogen Fixation and Alter Ocean Biogeochemistry
8 www.nsf.gov/news/news_summ.jsp?cntn_id=108801
9 www.nsf.gov/pubs/2008/nsf0842/nsf0842_4.pdf
10 www.nsf.gov/od/lpa/news/02/pr0222.htm
11 ACIA, Impacts of a Warming Arctic: Arctic Climate Impact Assessment. Cambridge University Press, 2004
NSF-funded researchers are studying the impacts of climate change on the well-known annual cycle of the monarch butterfl y. (e.g. NSF awards 0710343 and 0415340) Credit: David Cappaert, Bugwood.org
This image shows houses in Uummannaq, Greenland. According to Inuit hunter and town resident Pavia Nielsen, “Narwhal come two weeks later than past years because of global warming. The force of nature which always gives us a hard time in the form of a stronger and stronger wind is getting even harder because of the global warming. When the wind is so strong, it means less hunting.” Credit: Joseph Meehan and Narwhal Tusk Research

4
Paleoclimatologists have discovered—through tree ring data, ice cores, and other corroborating records—that the concentration of carbon dioxide, and Earth’s average temperature, are nearing levels that haven’t been reached for hundreds of thousands of years.12
Innovative scientists and engineers have responded to the call for alternative energy sources that reduce the amount of carbon dioxide we put into the atmosphere. Computer scientists are creating new tools for geoscientists, decisionmakers, and the public to understand Earth’s changing climate. Social scientists are studying human decisions and behaviors that infl uence the environment. By studying such issues as land use, urban planning, building design, and economic factors that are linked to anthropogenic climate change, researchers are beginning to tackle some of the more nuanced, but essential, questions regarding the human impact on, and response to, Earth’s changing climate.
Th is report addresses some of the major questions facing climate change researchers, and how those puzzles are being addressed by NSF-funded activities. Complex computer models are being developed and refi ned to predict Earth’s future climate. Observations of climate conditions from observatory networks distributed in Earth’s oceans, polar regions, land masses, and near-Earth orbit improve the accuracy of the climate models. Records of Earth’s past climate provide important insights into the mechanisms involved in climate cycles of the past, and can help to refi ne computational models by allowing researchers to simulate past climate. But understanding climate is only part of the story—as we improve our knowledge of how Earth’s climate is changing, we also improve our ability to cope with the impacts of global climate change and variability. Th rough social, economic, and behavioral science, researchers are learning how human behavior factors into climate change—and how human behavior can be modifi ed to ameliorate our impact on Earth’s climate. Physical scientists and engineers are developing alternative ways of creating, storing, and using energy to reduce the amount of carbon that human activities contribute to the atmosphere. Researchers are also building the scientifi c foundation for the tools that humanity may need in the future to counteract the eff ects of global climate change.
Computational ToolsPredicting Earth’s future climate depends on advanced computational hardware, software, and networking capabilities. Increasing demands on computational resources result from the increasing sophistication of the models, which are advancing to include an ever-expanding number of physical parameters of Earth’s climate system. To keep up with the demand, computational hardware must involve not only bigger and faster supercomputers, but entirely new computer architectures—e.g. data centers that can process massive amounts of data in parallel—and new devices, including smart sensors, smart phones and robots to acquire data. To make the most eff ective use of the progress in hardware, reliable, advanced, and intelligent software will be essential. Increasingly sophisticated algorithms, new representations of data, and new programming models and languages are a handful of the types of software advances that will be required. New networking tools will not only connect computers and scientists, they will also be essential to acquiring data from remote sensors and instruments, such as satellites, buoys, and environmental sensor stations. As discussed in the following section, networked observational tools are vital to increasing our understanding of climate. Th ey present computer scientists and engineers with the challenges of integrating vast quantities of data gathered across diff erent platforms and network types.
Observational NetworksNew observing, networking, and computational capabilities have expanded the horizons of what we can study and understand about our environment and world. Observational networks allow researchers to gather the data needed to create the climate models of the future and to learn more about how climate change is infl uencing Earth’s plants and animals.
12 e.g. NSF Highlight 14727: Ancient Glaciers in Antarctica Key to Understanding Climate Change; NSF Highlight 16360: A Warming Climate Can Support Glacial Ice; NSF Highlight 14040: A Global Trigger for the Termination of the Last Glacial Maximum

5
In response to the growing demand for data from the research community, NSF is expanding its observational network infrastructure. Some of these networks, including the National Ecological Observatory Network (NEON) and the Ocean Observatories Initiative (OOI), are new, state-of-the-art eff orts in collaboration with international partners. Th ese networks take advantage of the latest in cyberinfrastructure and computational linking technologies, one of NSF’s core strengths. Other observatories, such as the Critical Zone Observatories, are in their infancy, but provide crucial testing grounds for the observational methods of the future.
NSF works in partnership with other government agencies and international organizations on observational infrastructure, including systems that monitor the planet as a whole. Th e Global Earth Observation System of Systems (GEOSS) is one example of an interagency and international eff ort to enable coordinated observations, better data management, and increased data sharing.13 By providing ground-based observations that complement satellite data, NSF participates in National Aeronautics and Space Administration (NASA), National Oceanic and Atmospheric Administration (NOAA), and U.S. Geological Survey (USGS) satellite-based observation programs.
Climate change knows no national boundaries, and its earliest devastating impacts may occur in developing regions of the world. Th e science of climate change is inherently an international endeavor; the size and scope of the scientifi c challenge it presents requires a global eff ort. NSF actively encourages international cooperation between U.S. researchers and their colleagues abroad.
Solving the PuzzleWe are currently experiencing perhaps the most rapid acceleration in humanity’s understanding of our planet. Th e knowledge gained from the frontiers of basic research—particularly crosscutting, interdisciplinary research—will be essential to creating the decision support systems needed to manage society in the future.
Th is report will discuss Earth’s systems piecewise, beginning with the physical systems of Earth’s atmosphere, sea, land, and ice, then focusing on life on Earth, and ending with, perhaps, the most challenging and dynamic piece of all—people. It’s important to realize that all of the pieces of the climate puzzle are interconnected, and all of the pieces are necessary to gain a full understanding of climate variability and change. Several key programs and research areas are featured in the main body of the text and a selection of research highlights are included in each section. Th ese highlights are meant to give an idea of the breadth and depth of NSF’s portfolio of climate change research investments, but are far from being an exhaustive list. Each year, NSF funds thousands of research projects, from short-term, single investigator, exploratory grants to large centers and facilities dedicated to long-
13 National Science Board, International Science and Engineering Partnerships NSB 08-4, pp. 23
NSF-funded researchers are studying the impact that warming temperatures have on Arctic watersheds such as the Lena River. The Lena River Delta is a breeding ground for many species of Siberian wildlife. Credit: USGS EROS Data Center Satellite Systems Branch
Rice paddy, Bali, Indonesia. Agricultural practices have a signifi cant impact on the global carbon balance. Credit: © 2009 JupiterImages Corporation

6
term research and environmental observation. Many of these projects touch on some aspect of Earth’s climate system, and still others are building the foundation for entirely new ideas that will transform the climate change research of the future.
Just as Vannevar Bush and the other visionaries who turned the idea of a National Science Foundation into reality in 1950 could not have predicted the specifi c impact of computers and networking on science and engineering, we cannot know exactly what future technologies will bring to climate change research and mitigation and adaptation strategies. But we know we’re following a proven model for success.

7

8
SKYTh e sea, land, ice, life, and people of Earth are all connected by the atmosphere. Climate and weather are the result of atmospheric conditions, which are in a constant state of fl ux. Atmospheric variables—including air density, temperature, moisture content, wind, chemical composition, and aerosol content, to name a few—combine to determine weather and climate. Th e interplay among all the components of the climate system makes forecasting future weather and climate no easy task. It’s no coincidence that many of the world’s leading researchers in climate and atmospheric science are experts in chaos theory.
NSF funds atmospheric research at all levels—from single-investigator projects to major centers devoted to research and education. NSF-funded “sky” research spans the entire atmosphere
and beyond, from the troposphere (lower atmosphere) to the Sun (upper atmosphere and Sun-Earth processes). One of NSF’s major investments in atmospheric research is the National Center for Atmospheric Research (NCAR). Located in Boulder, Colorado, NCAR houses a number of important research activities in atmospheric science, including the Community Climate System Model (CCSM) and the high-resolution Weather Research and Forecasting (WRF) Model. Th e CCSM is the foremost U.S. academic global climate model and an important contributor to the fi ndings presented in the reports of the Intergovernmental Panel on Climate Change (IPCC). WRF is used with the global CCSM
Aerial view of the National Center for Atmospheric Research (NCAR) Mesa Laboratory. NCAR provides the university research and teaching community with tools such as aircraft and radar to observe the atmosphere and with the technology and assistance to interpret and use these observations, including supercomputer access, computer models, and user support. Credit: © University Corporation for Atmospheric Research
Top image credit: © 2009 JupiterImages Corporation

9
to simulate and predict climate change at regional and fi ner scales. With its collection of advanced tools and techniques—including models, radar, weather-balloon observations, and satellite data—NCAR climate researchers are working to understand the impacts of global and regional climate variability and change.14
Observing the Sun Th e Sun is the predominant source of heat and energy in the climate system and, therefore, is an important factor in modeling Earth’s past, present, and future climate. Th e Sun’s radiation is not constant; an 11-year oscillation of sunspot activity is one source of variation. Th ough slight compared to the total irradiance from the Sun, the intensity of oscillations caused by sunspots and other solar phenomena must be taken into consideration by climate scientists, who need to know precisely how much energy Earth’s climate system receives.
National Solar ObservatoryTh e mission of the National Solar Observatory (NSO) is to advance knowledge of the Sun, both as an astronomical object and as the dominant external infl uence on Earth, by providing observational opportunities to the research community.15 NSO has observing facilities atop Kitt Peak, Arizona, and Sacramento Peak, New Mexico. Th ese facilities off er the world’s largest collection of optical and infrared solar telescopes and auxiliary instrumentation for observing diff erent features of the Sun, as well as a coordinated worldwide network of six telescopes specifi cally designed to study solar oscillations (the Global Oscillations Network Group).16
ModelingClimate researchers develop climate models to simulate the interactions of the many factors
that infl uence Earth’s atmosphere. Th ese can include inputs from Earth’s oceans, ecosystems, landmasses, snow, and ice. Th e individual pieces of the climate system are highly complex and interrelated, and must be modeled simultaneously. Using complex mathematical descriptions of real-world phenomena, climate simulation allows scientists to test hypotheses, make predictions, and assess environmental mitigation strategies.17 Models are essential tools for climate scientists, because it is not possible to recreate the atmosphere and its interactions with Earth’s systems in a laboratory setting.
As researchers learn more about the complexity of the climate system, they seek to incorporate this complexity into climate models. To do so requires increasingly powerful supercomputing capabilities. Since the 1950s, when the fi rst
14 NCAR Climate Research Web site: www.ncar.ucar.edu/research/climate.
15 National Solar Observatory Web site: www.nso.edu.
16 NSF-Supported Research Infrastructure: Enabling Discovery, Innovation, and Learning, 2008.
17 NCAR Modeling Web site: www.ncar.ucar.edu/tools/models.
Kitt Peak National Observatory’s McMath-Pierce solar facility, the largest solar telescope in the world. Credit: NOAO/AURA/NSF
This illustration shows how the amount of detail in climate models has increased in recent years, largely because of the calculation power provided by newer supercomputers. The image in the upper left (T42) represents the resolution of the 1990s, with grid boxes measuring roughly 200 by 300 kilometers. Enhancements in computing power will help scientists explore the use of higher resolutions, such as T170 (lower left) and T340 (lower right). Better resolution allows for more realistic topography, which improves the accuracy of regional climate projections. Credit: Illustration courtesy Warren Washington, NCAR; © University Corporation for Atmospheric Research

10
vacuum-tube computers became available, researchers have used the latest computing technology to boost the power of climate modeling. Today’s models are staggeringly complex, simulating natural fl uctuations and cycles in climate that occur hourly (large frontal systems), monthly (changes in the jet stream), or even on timescales of decades or centuries (ocean circulation, glacial patterns).18
As climate models have matured, their spatial resolution has improved. Th is dramatically increases computational demand. Increased computational complexity can result in better overall model accuracy, but it requires increasingly intricate software and signifi cantly greater computational resources. Th e software—the algorithms and data structures for analysis, visualization, and prediction—must keep up with the increasing complexity of the physical concepts, which presents a signifi cant challenge to the computer scientists and engineers who design the models.
Climate modelers can check the fi delity of their models’ predictions of the future climate by testing them against the record of Earth’s climatic past, gleaned from ice and sediment cores, and from tree ring data and other proxy sources of data. (See the Ice and Land sections for more on these data sources.) Modelers also test their models by simulating the annual cycle of seasonal variations and by comparing their predictions to the actual climate on a year-by-year basis.19
Constellation Observing System for Meteorology, Ionosphere, and Climate Th e Constellation Observing System for Meteorology, Ionosphere, and Climate (COSMIC) is a constellation of six satellites in low-Earth orbits. COSMIC, a joint project between Taiwan’s National Space Organization and the U.S. Government, takes advantage of the military’s sophisticated global positioning system (GPS) satellites, which emit radio wave signals that GPS receivers use to determine positions on Earth, to examine Earth’s atmosphere. Th e COSMIC satellites’ GPS receivers detect delays in the propagation of GPS signals when the signals pass through the atmosphere to reach the satellites. Temperature, humidity, and, in the ionosphere, electron density can be obtained from these measurements. COSMIC provides 2,000 vertical profi les of the atmosphere per day, distributed nearly uniformly over the globe. Th ese data are being used for weather research and prediction, and climate research and monitoring, and are providing unprecedented information about Earth’s atmosphere in a monitoring system that is as revolutionary as it is straightforward.
Community Climate System ModelTh e Community Climate System Model (CCSM) is one of the world’s premier general-circulation climate models. CCSM is unique among comprehensive climate models because it belongs to the entire community of climate scientists rather than to a single institution. Hundreds of specialists at various institutions around the globe collaborate on improvements to CCSM. NCAR makes the model’s underlying computer code freely available on the Web. As a result, scientists throughout the world can use CCSM for their climate experiments.20
Funded by NSF in partnership with the Department of Energy, CCSM will evolve and adapt to answer the questions of the research community and incorporate the complex processes needed for
18 Community Climate System Model Brochure: www.ucar.edu/communications/CCSM/history.html.
19 Climate FAQ: Climate Model Shortcomings: www.cgd.ucar.edu/research/faqs/models.html.
20 CCSM Brochure Web site (Overview): www.ucar.edu/communications/CCSM/overview.html.
In this artist’s illustration, six microsatellites are entering low-Earth orbit to form COSMIC, the Constellation Observing System for Meteorology, Ionosphere, and Climate. COSMIC is providing a major boost in the quality and quantity of data needed to improve climate modeling. Credit: Courtesy Orbital Sciences Corporation

11
next-generation modeling. CCSM users have the ultimate goal of incorporating the interaction between global climate and all of Earth’s natural and human processes, capturing even subtle feedback loops. A future model, for example, might be able to estimate the health and geographic range of northern-latitude forests in times of higher temperatures, and monitor the ability of those altered forests to absorb carbon dioxide from the atmosphere.21 Predicting the frequency and intensity of extreme weather events, such as hurricanes and severe local storms, in a warming world is also a priority goal for climate models.
Bluefi re On April 24, 2008, NCAR took delivery of a Power 575 Hydro-Cluster, the fi rst in a highly energy-effi cient class of supercomputers to be shipped anywhere in the world. Bluefi re houses a microprocessor with a clock speed of 4.7 gigahertz. Th e system consists of 4,064 processors, 12 terabytes of memory, and 150 terabytes of disk storage. With a peak speed of more than 76 terafl ops (76 trillion fl oating-point operations per second), Bluefi re is expected to rank among the 25 most powerful supercomputers in the world and will more than triple NCAR’s sustained computing capacity. Bluefi re is being put to use improving climate and weather simulations, studying solar processes, and refi ning oceanic and atmospheric circulation models.22
Researchers hope to use CCSM for credible prediction of global climate as well as the climate of specifi c regions. Useful regional climate predictions will help policymakers tackle such issues as where certain crops can be grown and how much sea ice will exist in the Arctic Ocean. CCSM predictions can also help business leaders anticipate future conditions, such as changing energy demands for home heating and cooling or modifi cations in crop production schedules due to changing growing seasons.
A near-term, high-priority goal for the CCSM, and for many global-scale climate models, is to develop the capability to predict future climate and its impacts on a 10- to 20-year timescale, with a spatial scale that can be useful to people making decisions about the future. For climate models to reach this goal, more information, observational infrastructure, and computational resources will be needed.
Th e following section describes some of the critical frontiers of atmospheric research that pertain to climate modeling.
21 CCSM Brochure Web site (Future): www.ucar.edu/communications/CCSM/future.html.
22 NCAR press release: www.ucar.edu/news/releases/2008/bluefire.jsp.
The Community Climate System Model (CCSM) simulates global cloud cover (shown in white) and precipitation (in orange). Composed of four separate models simultaneously simulating Earth’s atmosphere, ocean, land surface, and sea ice, and one central coupler component, the CCSM allows researchers to conduct fundamental research into Earth’s past, present, and future climate states. Credit: © University Corporation for Atmospheric Research
NCAR’s new IBM supercomputer—Bluefi re—has a peak speed of more than 76 terafl ops (76 trillion fl oating-point operations per second). When fully operational, it is expected to rank among the world’s 25 most powerful supercomputers and will more than triple NCAR’s sustained computing capacity. Credit: Brian Bevirt, National Center for Atmospheric Research

12
Frontiers of Atmospheric ResearchNSF funds many investigators who seek to improve our understanding of Earth’s atmosphere—its physics, chemistry, and dynamics. NSF also funds studies to understand the natural global cycles of gases and particles in the atmosphere. In exploring these areas, researchers will provide invaluable information for climate model development and testing.
AerosolsDetermining the composition of the atmosphere is vital to climate research. Th e molecules present in the atmosphere, the reactions they undergo, and their eff ects on the amount of energy in the climate system are central to NSF’s atmospheric research portfolio, including the role anthropogenic pollutants play in the chemical breakdown of stratospheric ozone.
In recent years, researchers have paid increasing attention to the role of aerosols in the physical and chemical makeup of the atmosphere. Aerosols are fi ne particles or droplets suspended in the atmosphere; they can be emitted by natural systems or by human activities, such as the burning of fuels. Larger than molecules, aerosols can either scatter or absorb sunlight, depending on their size and physical properties. Aerosols also participate in chemical reactions in the atmosphere and can serve as seed particles for the formation of clouds.23
For these reasons, climate modelers are eager to know more about aerosols—how they aff ect the energy that enters and leaves the atmosphere, and how they infl uence the overall chemical content of the atmosphere. Researchers are especially interested in fully understanding how aerosols from air pollution aff ect Earth’s climate, including the properties and distribution patterns of increasing aerosol production from the rise of industrial and transportation activities in developing countries.
Atmospheric brown clouds (ABCs)—composed of a mix of chemicals and aerosols—are a special focus of NSF-supported researchers. Th ese visible brown plumes of pollution prevalent in Southeast Asia result from the burning of fuels, tailpipe exhaust, factory emissions, and other human activities.24 Researchers have found strong evidence that ABCs from Asian pollution are intensifying winter storms over the Pacifi c Ocean.25
CloudsColorado State University’s Center for Multiscale Modeling of Atmospheric Processes (CMMAP), a recently established NSF Science and Technology Center, focuses on atmospheric phenomena that are as familiar to us as they are elusive to climate modelers: clouds. Clouds are hard to depict in models because they change shape and move on a variety of time and space scales. Clouds exist in horizontal and vertical scales ranging from a few hundred meters to a few kilometers.26
Clouds are extremely important in climate modeling, because they refl ect sunlight and absorb heat radiated from the ground below. According to the Fourth Assessment of the IPCC, “cloud feedbacks remain the largest source of uncertainty” in climate models.27 CMMAP seeks to improve the representation of
23 NSF Highlight 16735: Enhancing Studies of Aerosol-Cloud Interactions.
24 NSF press release 07-087: “Brown Cloud” Particulate Pollution Amplifies Global Warming: www.nsf.gov/news/news_summ.jsp?cntn_id=109712.
25 NSF Highlight 16232: Intensification of Pacific Storm Track Linked to Asian Pollution.
26 Strategic and Implementation Plan: Center for Multiscale Mapping of Atmospheric Processes: http://cmmap.colostate.edu/research/docs/CM-MAP_SPlan_v2c.pdf.
27 IPCC, 2007: Summary for Policymakers. In: Climate Change 2007: Synthesis Report. Contribution of Working Groups I, II, and III to the Fourth Assessment Report of the Intergovernmental Panel on Climate Change.
Photograph of South Asian brown cloud pollution hanging over the Nepalese town of Phaplu (bottom panel), on March 25, 2001. The photo was taken from a fl ight altitude of about 3 kilometers, approximately 30 kilometers south of Mount Everest (seen in the top panel). Both photographs were taken from the same location—one looking north (top) and the other looking south (bottom). The brown cloud pollution is primarily caused by the presence of anthropogenic aerosols—particles such as soot suspended in the atmosphere. Credit: V. Ramanathan

13
clouds in climate models. Th is approach, called the “multiscale modeling framework” (MMF), could serve as an example for modeling other complex climate variables. Th e MMF approach allows researchers to embed their cloud model, which deals with the relatively small spatial scale of clouds, into a broader climate model that deals with larger scales. With this “model-within-a-model” approach, the simulated physical processes occurring on diff erent scales can interact with one another, increasing the sophistication and accuracy of the combined model. Th e model-within-a-model approach is a promising template for the incorporation of other small-scale phenomena in global-scale climate models.
StormsWarmer sea surface temperatures are likely to increase the strength of storms forming over Earth’s oceans. At present, hurricanes cannot be resolved in climate models, and the complex relationships between climate and hurricane frequency, intensity, and location are not well understood. With further improvements in global system models, researchers may one day be able to link aspects of hurricane behavior to anthropogenic climate change.28 In addition, high-powered computers, such as the University of Texas TeraGrid Ranger system, will be able to model storm behavior more accurately, thereby helping coastal communities along the Gulf Coast plan their responses to hurricanes.29
In addition to hurricanes, NSF-funded researchers—using climate models to study the large-scale meteorological conditions that foster the formation of severe weather in the United States—have found that, as a result of climate change, we can expect to see an increase in the number of days when the conditions are present for the formation of severe thunderstorms.30
Earth System Interactions Th e physical and chemical interactions between the atmosphere and each of the other climate system pieces are important areas of continued research.
OceansPerhaps no other Earth system component has more opportunity to infl uence the atmosphere than the ocean, which covers 71 percent of Earth’s surface. Th e sea serves as a “sink” for carbon dioxide by dissolving a portion of the gas at the air-water interface. Th e ocean is also home to phytoplankton and other biological species that incorporate carbon in their tissue, taking it with them to the seafl oor when they die.
28 National Science Board Task Force on Hurricane Science and Engineering, Hurricane Warning: The Critical Need for a National Hurricane Research Initiative, NSB-06-115, 2007, p. 14.
29 NSF Highlight 16882: New Computer Model Helps Coastlines Prepare for Storm Surges.
30 NSF Highlight 15879: Will There Be an Increase in Severe Thunderstorms Due to Climate Change?
Clouds refl ect sunlight and absorb heat from the ground below, and are a major source of uncertainty in climate models. Researchers are working on models that better account for the behavior of clouds. Credit: © University Corporation for Atmospheric Research
Climate models may one day enable scientists to predict the large-scale meteorological conditions that support the formation of severe thunderstorms. Credit: © University Corporation for Atmospheric Research
The ocean has a profound effect on weather and climate. Credit: © 2009 JupiterImages Corporation

14
Th e exchange of water between ocean and atmosphere, along with the exchange of energy, drives the weather and climate worldwide. Th e ocean is a major source of aerosol precursors—the chemical starting points for the formation of airborne particles or droplets that enter the atmosphere at the air-water interface. Th is complicated give-and-take between sky and sea is vital to climate modelers, who need to know how to account for the ocean in their calculations. (See the Sea section for more on the ocean’s role in climate.)
High-Performance Instrumented Airborne Platform for Environmental ResearchTh e best way to access remote areas of the atmosphere is with an aircraft. Th e NSF-funded High-Performance Instrumented Airborne Platform for Environmental Research (HIAPER)—a medium-altitude, long-duration jet—has become the premier plane for scientifi c discovery. Th e modifi ed Gulfstream V jet can reach an altitude of 15,500 meters (51,000 feet) and can
cruise for 11,265 kilometers (7,000 miles). It is equipped with advanced instrumentation for environmental research, including instruments to sample the chemical and aerosol composition of the atmosphere. Managed by NCAR through a cooperative agreement from NSF, HIAPER began operational science missions in 2006. HIAPER has already been involved in several missions that have furthered our understanding of the dynamic composition of the atmosphere, including a survey of particle formation in the upper troposphere.31 HIAPER was also instrumental in a large-scale fi eld project called PACDEX (Pacifi c Dust Experiment) to study the pollution plumes that originate in Asia and spread over the Pacifi c Ocean.32 Th e HIAPER Pole-to-Pole Observations (HIPPO) study, begun in January 2009, is expected to improve our understanding of the carbon cycle and greenhouse gas distributions through cross-sectional concentration measurements in pole-to-pole fl ight paths during diff erent seasons in a two-year-period.33
Snow and IceAnother important Earth system component is what researchers refer to as the “cryosphere”—the regions of Earth covered in snow and ice, especially the polar regions. Bright white ice is an excellent solar refl ector, sending 75–95 percent of the Sun’s rays back into space. Th e fraction of refl ected solar radiation is called “albedo.” By contrast, land and open water refl ect less than 30 percent of the sunlight that falls on them.34 (See the Ice section for more on albedo.)
Sunlight that is not refl ected back into space is absorbed by the surface, which warms as a result. Th us, it is important for climate modelers to know how much ice covers Earth and where it’s located, including polar ice, the winter snow that covers much of the Northern Hemisphere, and the year-round snow and ice accumulated in the mountainous glaciers of the world.35 Because ice is susceptible to positive feedback (melting ice exposes heat-absorbing ground or open sea, increasing surface warming, which in turn causes more ice to melt), researchers must accurately capture the eff ects of snow and ice in their climate models. (See the Ice section for more on the climate eff ects of Earth’s ice and snow.)
31 NSF Highlight 12713: New NSF-Sponsored Research Aircraft Studies Atmospheric Particle Formation.
32 NSF press release 07-042: Scientists Track Impact of Asian Dust and Pollution on Clouds, Climate Change: www.nsf.gov/news/news_summ.jsp?cntn_id=108742.
33 NCAR Earth Observing Laboratory Field Project Web site: www.eol.ucar.edu/deployment/field-deployments/field-projects/hippo_global_1
34 www.ncar.ucar.edu/research/earth_system/cryosphere.php
35 NSF Highlight 15790: Improving Climate Model Predictions Through a Surprising Link to Snow Cover Simulations.
HIAPER (High-Performance Instrumented Airborne Platform for Environmental Research) aircraft in fl ight. HIAPER, modifi ed Gulfstream V jet, can fl y at an altitude of 51,000 feet and has a range of 7,000 miles. The aircraft’s range enables scientists to survey remote ocean regions in a single fl ight to learn more about interactions between the oceans and the atmosphere. Credit: © University Corporation for Atmospheric Research

15
Life and LandWithout life on Earth, the composition of this planet’s atmosphere would be radically diff erent. Th e amount of vegetation covering land surfaces is directly tied to the amount of carbon the land can “fi x” or remove from the atmosphere. Microorganisms living in the soil of a particular region can also have a signifi cant cumulative eff ect on the amount of carbon and other chemical compounds given off by the land. Vegetation infl uences the amount of solar energy absorbed. For example, dark forests absorb more sunlight than dried prairie grasses.
Plants also infl uence the cycling of water between land and atmosphere. In terms of land use, the conversion of forest to agricultural fi elds can have a signifi cant eff ect on how that patch of land cycles carbon, heat, and water with the atmosphere. In the past, climate models have tended to oversimplify the eff ects of land cover and use; future climate models will need to account for these eff ects to improve climate predictions. (See the Land and Life sections for more on the interactions of these systems with the atmosphere.)
Observational NetworksAtmospheric science is, at its core, an observational science. While much of the day-to-day work of atmospheric scientists is performed on a computer, the input values they use must come from the real world. Accurate, continuous measurements of atmospheric conditions from strategic locations lead to improved climate models. Modelers need to know land cover changes in a given region, such as changes in ice or vegetation cover. Ocean-observing equipment can help modelers keep track of ocean currents and trends in temperature, salinity, and other parameters that are tied to climate conditions. (See the Sea section.) Observational satellites are of vital importance to modelers, as they monitor everything from ice sheet mass in Greenland and Antarctica to large-scale trends in land usage in the tropics.
ConclusionWhile we’ve come a tremendous way in our understanding of the changes in Earth’s atmosphere in the 50 years since Charles David Keeling, under the direction of Roger Revelle, began recording carbon dioxide levels on Mauna Loa, much work remains for scientists to understand and predict the atmospheric processes that are responsible for global and regional climate. In the research highlights below, individual NSF-funded research projects in “sky” research are described. Th ese projects vary in size and scope, but all have contributed to advancing human knowledge about the atmosphere and to training the next generation of researchers who will continue this important work.

16
Enhancing Studies of Aerosol-Cloud InteractionsRecent studies have suggested that exposure to air pollution generated by transportation sources is linked to increased health risks in populations living near roadways. Th e factors responsible for increased health risks remain unclear but are likely to include elevated particulate matter concentrations. In this study, Colorado State University researchers deployed an Aerodyne Research, Inc., Aerosol Mass Spectrometer (AMS), acquired with support from an NSF Major Research Instrumentation Grant, to measure near-roadway particulate matter on the grounds of an elementary school located immediately adjacent to US-95 in Las Vegas,
Nevada, in January 2008. Th e AMS measures, with high-time resolution, the mass concentrations of particles smaller than 1 micron in diameter, a size class strongly linked to adverse health eff ects. Th is technology, in combination with measurements of pollutant gases and meteorological variables, off ers an unprecedented look at the short-term variations in airborne particulate loadings and composition, and new ways to link these to pollutant sources. Excursions in concentrations of particles rich in organic carbon were associated with increases in traffi c during the morning rush hour, but unexpectedly large transient increases in this particle type were also observed in the late evening and early morning hours. Highlight ID: 16735 GEO/ATM
Intensifi cation of Pacifi c Storm Track Linked to Asian PollutionA thick, gray blanket of haze hangs over eastern China in this image from Moderate Resolution Imaging Spectroradiometer (MODIS) on the Aqua satellite on February 19, 2004. Th e haze pools in the gullies and valleys of the mountain ranges along the left edge of the scene; in many places, it completely hides the coastal plain from view. Unfortunately for the residents of the region, such events are not rare, especially in winter, when people need to burn additional coal and wood. In this case, numerous fi res burning in southeastern China may be contributing to the haze as well.
Renyi Zhang of Texas A&M University has discovered an increasing trend in deep convective clouds over the Pacifi c Ocean that is likely due to increased pollution coming from the Asian continent. In this NSF-sponsored project, Zhang and colleagues used data from the International
Satellite Cloud Climatology Project to analyze two decades’ worth of Pacifi c Ocean cloud statistics. Th ey found a considerable increase in the amount of deep convective clouds over the North Pacifi c, especially in the winter months.
Pollution increases the aerosols in the atmosphere. Previous studies have shown that additional aerosols lead to smaller cloud droplets, which delay precipitation events and allow clouds to become more
Heavy traffi c jams a California freeway. Credit: © University Corporation for Atmospheric Research
A thick, gray blanket of haze hangs over eastern China in this image from Moderate Resolution Imaging Spectroradiometer (MODIS) on the Aqua satellite on February 19, 2004. The haze pools in the gullies and valleys of the mountain ranges along the left edge of the scene; in many places, it completely hides the coastal plain from view. Unfortunately for the residents of the region, such events are not rare, especially in winter, when people need to burn additional coal and wood. In this case, numerous fi res burning in southeastern China may be contributing to the haze as well. Credit: Jacques Descloitres, MODIS Rapid Response Team, NASA/GSFC
Sky Research Highlights

17
invigorated. To be certain that the increased intensifi cation that the researchers were seeing was due to pollution, they had to rule out natural eff ects, such as sea surface temperature, monsoons, and El Niño events. It was determined that none of these eff ects could explain the observed change in cloud cover. To further study the hypothesis, Zhang used a special version of the Weather Research and Forecasting computer model tailored to incorporate the eff ects of pollution on clouds. He found that the observed trend in deep convective clouds could be reproduced in model simulations that account for the infl uence of the Asian pollution outfl ow. Highlight ID: 16232 GEO/ATM
New Computer Model Helps Coastlines Prepare for Storm SurgesRecent events in the Gulf of Mexico and around the world have demonstrated the vulnerability of coastal populations and infrastructure to storm surges. In response, researchers from the University of Texas at Austin, using the TeraGrid Ranger computing system, are developing the Advanced Circulation Storm Surge Model. Th e model has been used in its design and planning mode before the hurricane season, in forecasting mode as storms approach land, and in hindcasting mode after the event. Th e researchers are developing a new computationally intensive model of the Gulf of Mexico that includes highly refi ned details of the Texas coast. Th is new model
will be used to perform hundreds of hurricane scenarios for the State of Texas, to develop fl ood risk maps and study potential inundation in high-risk areas, such as the Houston-Galveston corridor and the Brownsville region. Highlight ID: 16882 OD/OCI
Will Climate Change Cause an Increase in Severe Th understorms?Robert Trapp of Purdue University and colleagues have recently used global and high-resolution regional climate models to study the large-scale meteorological conditions that foster severe weather formation in the United States. Th e researchers determined that, as a result of climate change, there is likely to be an increase during the late 21st century in the number of days in which severe thunderstorm conditions occur.
Current climate models cannot simulate phenomena as small as thunderstorms, but they can simulate the larger scale distributions of temperature, moisture, and winds that infl uence
severe convective storms. Th e researchers found that in a scenario with increased temperatures from greenhouse emissions, there was an increase in one factor for severe thunderstorms (convective available potential energy) and a decrease in the other factor (wind shear). It was determined that the increase in potential energy more than made up for the decrease in wind shear, leading to more days in which meteorological conditions would support the formation of severe thunderstorms. Th e largest future increases are projected to be during the summer months, especially in the southern and eastern United States.
Insurance industry planners will have to take trends in the frequency of damaging severe weather into account because of the potential impacts of severe weather on built structures, automobiles, and cropland. Highlight ID: 15879 GEO/ATM
NSF-funded researchers are developing a model to create storm surge fl ood risk maps along the U.S. Gulf Coast. Credit: © 2009 JupiterImages Corporation
A severe thunderstorm cumulonimbus cloud moves across the plains east of Denver, Colorado, on June 10, 2004. The dark blue or blue-green area is heavy rain and large hail falling in the background. Credit: © University Corporation for Atmospheric Research

18
New NSF-Sponsored Research Aircraft Studies Atmospheric Particle FormationTh e NSF-sponsored HIAPER (High-Performance Instrumented Airborne Platform for Environmental Research) sampled particle formation in the upper troposphere and lower stratosphere on one of its fi rst science missions. Researchers are very interested in this region because it has a high number concentration of new particles with diameters from 4 to 8 nanometers, and their subsequent growth to cloud condensation nuclei has important implications for cloud formation. Th e scientists found that elevated numbers of new particle formation events were observed near tropopause folding, where the mixing of stratospheric
and tropospheric air masses occurs. Th ey also observed enhanced new particle formation shortly after sunrise. Th ese events continued even after sunset without the presence of sunlight. Th e sunrise and sunset experiments allowed the researchers to calculate aerosol nucleation and grow rates. Th e estimated nucleation and growth rates suggest that an additional species may be involved in particle formation in the upper troposphere. In addition, wintertime measurements with HIAPER showed that new particle formation was higher in the tropics than at the middle latitudes. Highlight ID: 12713 GEO/ATM
Improving Climate Model Predictions Th rough a Surprising Link to Snow Cover Simulation
Snow cover on land during the winter months may be a more signifi cant factor in climate modeling than previously thought. Faculty Early Career Development (CAREER) Program grant recipient Alex Hall of UCLA and colleagues discovered an unexpected link between snow-albedo feedback and climate model predictions of summer climate change in the continental United States. Albedo refers to the amount of solar radiation refl ected away from Earth’s surface; in this case, from snow cover. Hall, in an NSF-funded project, found that various climate models handle snow albedo diff erently, causing major diff erences in the simulation of snowpack.
In models with strong snow-albedo feedback, the winter and early spring snowpack is signifi cantly reduced, which leads to water shortages. In turn, these water defi cits persist in the modeled soil moisture and allow for more evapotranspiration and warmer temperatures. Hall has determined that by incorporating a more realistic snow-albedo feedback into the climate models, the prediction of U.S. climate could be substantially improved on the decadal to centennial timescale.
Before this work, snow-albedo feedback was not considered a signifi cant factor aff ecting the sensitivity of climate models. Rather, attention has been on moist-convective processes and cloud parameterizations. Th is new work will force climate modelers to address the snow-albedo problem, which will likely result in new measurements of snow albedo, and a new interest in eff orts to model snow cover and snow albedo. Current projections from global climate models are of limited use to policymakers and businesses. Regional climate change modeling in particular is in need of dramatic improvements, and improving climate change predictions on a regional scale will lead to much better data for decisionmaking than are currently available. Highlight ID: 15790 GEO/ATM
HIAPER takes to the skies for its fi rst science mission on March 2, 2006. Credit: NCAR
An image of global snow cover for the month of January 2004.Credit: NASA images by Reto Stöckli

19
Following the Asian-Pacifi c Pollution PlumeScientists are looking at the transport of aerosols, such as dust and soot, which regularly travel in a plume from Eurasia across the Pacifi c Ocean and into North America. Th is Eurasian-Pacifi c-North American dust plume is one of the most widespread pollution events on the planet. To study this phenomenon, National Center for Atmospheric Research (NCAR) deployed the NSF/NCAR Gulfstream V (G-V) in support of the Pacifi c Dust Experiment (PACDEX) in April and May 2007.
Until recently, scientists lacked an airborne platform capable of taking in situ samples throughout the plume’s evolution across the Pacifi c Ocean. Th e G-V fi lls this observational gap and opens new doors for observing this remarkable natural/human-made plume as it
passes through the Pacifi c Ocean’s extratropical cloud systems. PACDEX scientists were not only able to observe these systems close up, they also had an opportunity to study the evolution of aerosols’ physical and chemical characteristics from the lower to the upper troposphere while examining vertical and horizontal gradients in cloud condensation and ice nuclei across the Pacifi c, and investigating cloud size spectra and liquid and ice water content.
PACDEX data are opening new frontiers of science through the observation of human impacts on the mixed-phase and ice-phase cirrus cloud systems. As well as monitoring the Eurasian-Pacifi c-North American dust plume’s characteristics, this pilot experiment was designed to further test and take full advantage of the unique capabilities of the G-V. PACDEX showcased the sophisticated research infrastructure available to the U.S. science community. Th e G-V is the most advanced airborne platform in the world, and NCAR’s logistical, technical, and data support services allow the U.S. scientifi c community to mount complex observational campaigns that provide unprecedented insight into complex atmospheric systems. Highlight ID: 15901 GEO/ATM
Human Activities Are Boosting Ocean Temperatures in Areas Where Hurricanes Form, New Study FindsRising ocean temperatures in key hurricane breeding grounds of the Atlantic and Pacifi c Oceans are due primarily to human-caused increases in greenhouse gas concentrations, according to a study published in September 2006. Using 22 diff erent computer models of the climate system, a team of scientists from the Lawrence Livermore National Laboratory, the National Center for Atmospheric Research (NCAR), and eight other research centers showed that the warming sea surface temperatures (SSTs) of the tropical Atlantic and Pacifi c Oceans over the past century are linked to human activities.
Previous eff orts to understand the causes of changes in SSTs have focused on temperature changes averaged over very large ocean areas, such as the entire Atlantic or Pacifi c basin. Th e new research specifi cally targets SST changes in much smaller hurricane formation regions. For the period 1906–2005, the researchers found an 84 percent probability that human-induced factors—primarily an increase in greenhouse gas emissions—accounted for most of the observed rise in SSTs in the Atlantic and Pacifi c hurricane formation regions.
Hurricanes are complex phenomena that are infl uenced by a variety of physical factors, such as SSTs, wind shear, water vapor, and atmospheric stability. Th e increasing SSTs in the Atlantic and Pacifi c hurricane formation regions are not the sole determinant of hurricane intensity, but they are likely to be one of the most signifi cant infl uences. Highlight ID: 14135 GEO/ATM
This illustration shows a hypothetical plume and possible series of fl ight patterns during the PACDEX (Pacifi c Dust Experiment) fi eld project. When a major plume of dust and pollutants begins blowing off Asia, the G-V would fl y from Boulder, Colorado, to Anchorage, Alaska, where it would refuel then fl y on to Yokota Air Base, Japan. It would then conduct a series of fl ights for about a week in and around the plume as the plume moves over the ocean to North America. Credit: Steve Deyo, © University Corporation for Atmospheric Research

20
Expect a Warmer, Wetter World Th is Century, Computer Models AgreeRecent episodes of deadly heat in the United States and Europe, long dry spells across the U.S. West, and heavy rainfall and snowfall across much of North America and Eurasia hint at longer term changes to come, according to a new study based on several of the world’s most advanced climate models. Much of the world will face an enhanced risk of heat waves, intense precipitation, and other weather extremes, conclude scientists from the National Center for Atmospheric Research (NCAR), Texas Tech University, and Australia’s Bureau of Meteorology Research Centre.
Many previous studies have looked at how average temperature or rainfall might change in the next century as greenhouse gases increase.
However, the new research looks more specifi cally at weather extremes, such as heat waves and intense rains, because these extremes cause the most damage to society and ecosystems. Th is study is one of the fi rst analyses to draw on extensive and sophisticated computer modeling recently carried out for the Intergovernmental Panel on Climate Change. Th e team based its work on simulations from nine diff erent climate models for the periods 1980–1999 and 2080–2099. Th e simulations were created on supercomputers at research centers in France, Japan, Russia, and the United States. Each model simulated the 2080–2099 interval three times, varying the extent to which greenhouse gases accumulate in the atmosphere. Th ese three scenarios were used to account for uncertainty about how fast society will act to reduce emissions of carbon dioxide and other greenhouse gases over the coming decades. For all three greenhouse gas scenarios, the models agreed that, by 2080–2099,
Th e number of extremely warm nights and the length of heat waves will increase signifi cantly • over nearly all land areas around the globe. During heat waves, very warm nights are often associated with fatalities, because people and buildings have less chance to cool down overnight.Most areas above about 40 degrees north latitude will see a signifi cant jump in the number • of days with heavy precipitation. Th is includes the northern tier of U.S. States, Canada, and most of Europe.Dry spells could lengthen signifi cantly across the western United States, southern Europe, • eastern Brazil, and several other areas. Dry spells are one of several factors in producing and intensifying droughts.
Th e eff ects were least severe for the lowest emission scenario. Th e research was supported by NSF, which is NCAR’s primary sponsor, as well as by the U.S. Department of Energy and the Environmental Protection Agency. Highlight ID: 14121 GEO/ATM
Th e Eff ects of Climate Change on Ozone DistributionScientists are increasingly turning their attention to the study of the possible eff ects of a CO2-warmed world. In work sponsored by NSF, researchers at the University of Washington and the California Institute of Technology used computer models to simulate circulation in the mid-levels of the atmosphere that is important for ozone concentrations. Th e models indicate that this circulation intensifi es when the temperature of the lower levels of the atmosphere increases, as is the case when the carbon dioxide level is doubled in the computer models. As a result of this stronger circulation, there is an increase in total ozone in the high latitudes of both hemispheres of Earth and a decrease in the ozone levels in the tropics. Th is is an important result to be considered in the modeling of ozone recovery. Highlight ID: 13434 GEO/ATM
A cumulonimbus, or thunderstorm, cloud passes over the plains east of Denver, Colorado. Thunderstorms form as the moisture in updrafts—rapidly rising warm air—condenses into raindrops or hailstones, which begin to fall when the updrafts no longer have the energy to carry the heavy precipitation. If an updraft is extremely intense, the rain may be held in the cloud for an hour or more. Credit: © University Corporation for Atmospheric Research

21
Fossil Fuel Burning Interrupts Natural Carbon CycleCarbon has always been present in the atmosphere, but in natural amounts it can be absorbed by plants during photosynthesis and returned to the atmosphere by decomposition. Carbon is also absorbed by the ocean, where it rides the ocean conveyor belt for centuries before returning to the atmosphere. Th e burning of fossil fuels has interrupted the natural balance of these systems. Researchers have recently developed a computer simulation of the global carbon cycle using a specialized version of the Community Climate System Model (CCSM). Th e models show that excess carbon in the atmosphere leads to warmer temperatures. Th e increased temperatures dry out land and hinder growth of plants in tropical areas, reducing photosynthesis rates. Th ey also warm ocean surface temperatures and slow the conveyor belt, making it harder for carbon to mix downward into the ocean. Th ese changes result in a positive feedback between the carbon and climate systems, so that climate warming acts to increase the airborne fraction of anthropogenic carbon dioxide and amplify the climate change. Highlight ID: 12620 GEO/ATM
Future Heat Waves: More Severe, More Frequent, Longer LastingHeat waves in North America and Europe will become more intense, more frequent, and longer lasting in the 21st century, according to a study by scientists at National Center for Atmospheric Research (NCAR). Model results showed that an increase in heat-absorbing greenhouse gases intensifi es an unusual atmospheric circulation pattern already observed during heat waves in Europe and North America. As the pattern becomes more pronounced, severe heat waves occur in the Mediterranean region and the southern and western United States. Other parts of Europe also become more susceptible to severe heat waves. Th ese results are highly signifi cant,
because heat waves can kill more people in a shorter time than almost any other climate event. Th e Chicago heat wave in 1995 resulted in an estimated 739 deaths, and approximately 15,000 people are believed to have died in the 2003 Paris heat wave.
Th e scientists compared present (1961–1990) and future (2080–2099) decades to determine how greenhouse gases and sulfate aerosols might aff ect climate in Europe and the United States. Th ey assumed little in the way of policy intervention to slow the buildup of greenhouse gases. During the Paris and Chicago heat waves, changes in atmospheric pressure produced clear skies and prolonged hot conditions at the surface. In the model, similar atmospheric pressure changes are enhanced during heat waves in both regions as carbon dioxide accumulates in the atmosphere.
Th e model showed heat waves that were longer and more frequent. In parts of the United States and Europe, minimum nighttime temperatures increased by as much as 3 degrees Celsius (5.4 degrees Fahrenheit). Th e implications are serious: In the Chicago heat wave, health experts reported that the most severe health impacts resulted from the lack of cooling relief several nights in a row. Highlight ID: 11252 GEO/ATM
Urban Trace-Gas Emissions Study: Interactions Among Canopy Processes, Anthropogenic Emissions, and Social Institutions in the Salt Lake Valley, UtahAn interdisciplinary team of investigators will study the multiple and interacting infl uences of urban land cover on air quality and greenhouse gas emissions in the Salt Lake Valley. Th e goal is to signifi cantly contribute to our understanding of the complexity of urban airshed processes and provide a framework for evaluating the social, physical, chemical, and biological factors that infl uence the urban atmosphere. Th e Salt Lake Valley is a good model system for studying these issues because of
An aerial view of Chicago. The Chicago heat wave of 1995 resulted in an estimated 739 deaths. Credit: © 2009 JupiterImages Corporation

22
excellent historical records, an extensive urban forest relative to the surrounding desert ecosystem, and a characteristic rapid rate of urban growth. Decisionmakers from the city, county, and State governments have agreed to participate in this project by attending workshops, providing input into model development, and discussing policy implications of project results. A systems dynamics model will be developed with a user-friendly interface, so that decisionmakers can use the model as a tool to explore the factors that strongly infl uence local air quality and greenhouse gas emissions. Th e model will also be used to evaluate the impact of future scenarios of urban growth. Th e social science team will provide questionnaires to decisionmakers at the beginning and end of the project to evaluate the eff ectiveness of the partnership between university researchers and decisionmakers.
Th e majority of greenhouse gases and other atmospheric pollutants originate in cities, so we must improve our understanding of key aspects of the complexity of the urban airshed. Th e investigators will focus on complex factors aff ecting emissions of carbon dioxide (CO2), water vapor, and volatile organic compounds (VOCs) in the Salt Lake Valley through atmospheric measurements, traffi c monitoring, modeling, remote sensing, and compilation of energy use statistics. Water vapor and CO2 are important greenhouse gases that aff ect local, regional, and global climate. VOCs are precursors to the formation of urban smog. All these trace gases are emitted from human activities and by vegetation in the urban environment. Interdisciplinary collaboration among atmospheric scientists, social scientists, urban planners, engineers, and ecologists is required to measure the concentrations and emissions of these gases, trace their origins, and evaluate the implications for eff ective management of the urban airshed. By applying scientifi c measurement techniques to a quantitative model and collaborating with local policymakers, this project will evaluate feasible and eff ective ways to reduce greenhouse gas emissions, maintain high air quality standards, and improve the quality of life of urban residents. Highlight ID: 1346 GEO/ATM
Individual-Particle Investigations of East Asian Aerosols From the Aerosol Characterization ExperimentTo fully understand and model the eff ects of pollution on climate, researchers must learn more about what, exactly, is contained in the pollution. James Anderson and colleagues collected samples of atmospheric aerosols during the Aerosol Characterization Experiment (ACE-Asia) in spring 2001. Th e objective of this major international fi eld project was to characterize aerosols in the Northwest Pacifi c region and to understand their impact on the radiative budget in the region. Th e researchers collected aerosols from both air- and ground-based collection sites, then analyzed the samples using automated scanning electron microscopy and manual transmission electron microscopy. Th e analysis provided detailed information about particle composition, size distribution, shapes, and state of mixing. Information on shapes and mixing state is very diffi cult to obtain by any other method, yet it is crucially important to correctly determine the role of aerosols in the regional climate.
Perhaps the most important fi nding is the variety of the East Asian pollution particles, even from samples not mixed with urban pollution. Th e dust mineralogy and size and shape distributions have a variability that is probably due to the pollution originating in diff erent regions and having diff erent transport histories. Aggregation of mineral particles is common, and the variable degree of aggregation aff ects both size and shape distributions. A very wide range of shape distributions means that simplifying assumptions in lieu of observations used in modeling optical properties are not valid. Once the dust mixes with urban pollution, several additional consequences ensue. Perhaps the most important consequence for climate change is the common aggregation of black carbon with mineral dust, as this causes the aggregate to absorb light (most aerosol particles only scatter sunlight). Th e investigators also observed a number of other complex particle interactions that must be taken into account to adequately understand the pollution’s interaction with sunlight. Highlight ID: 1361 GEO/ATM

23
Climate Change Is Aff ecting Earth’s Outermost AtmosphereCarbon dioxide (CO2) emissions from the burning of fossil fuels will produce a 3 percent reduction in the density of Earth’s outermost atmosphere by 2017, according to a team of scientists from the National Center for Atmospheric Research (NCAR) and Pennsylvania State University. Th e study showed that climate change will aff ect the upper as well as the lower atmosphere; it confi rms recent satellite observations showing that the thermosphere (the highest layer of the atmosphere) is becoming less dense. Lower density in the thermosphere reduces the drag on satellites in low-Earth orbit, allowing them to stay airborne longer. Forecasts of upper level air density could help NASA and other
agencies plan the fuel needs and timing of satellite launches more precisely, potentially saving millions of dollars.
Carbon dioxide cools the thermosphere but warms the atmosphere near Earth’s surface (the troposphere). Th is paradox occurs because the atmosphere thins with height. Near Earth’s surface, CO2 absorbs radiation escaping Earth, but before the gas molecules can radiate the energy to space, collisions with other molecules in the dense lower atmosphere force the CO2 molecule to release energy as heat, thus warming the air. In the much thinner thermosphere, a CO2 molecule absorbs energy when it collides with an oxygen molecule, but there is ample time for it to radiate energy to space before another collision occurs. Th e result is a cooling eff ect. As it cools, the thermosphere settles, so that the density at a given height is reduced. Also aff ecting the thermosphere is the 11-year cycle of solar activity. During the active phase of the cycle, ultraviolet light and energetic particles from the Sun increase, producing a warming and expansion of the upper atmosphere. When solar activity wanes, the thermosphere settles and cools.
To analyze recent solar cycles and peer into the future, the researchers used a computer model of the upper atmosphere that incorporates the solar cycle, as well as a gradual increase of CO2 due to human activities. Th e team used a prediction that calls for a stronger than usual solar cycle over the next decade. Th e model showed a decrease in thermospheric density from 1970 to 2000 of 1.7 percent per decade, or about 5 percent overall, which agrees with observations. Th e team found that the decrease was about three to four times more rapid during solar minimum than solar maximum. Highlight ID: 14119
Identifying Clouds Using Statistical ToolsScientists from the University of California-Berkeley, and Pennsylvania State University are collaborating with the Jet Propulsion Laboratory at NASA to create new technology for detecting and modeling cloud formation. Understanding weather patterns via cloud formation and movement is one of the key features necessary in climate modeling. Cloud monitoring via satellite technology is underdeveloped, but has the potential to provide more accurate information that could lead to greater predictability in climate modeling.
Th e research performed through this project aims to improve detection of clouds from space, specifi cally in the Arctic, through multiangle imaging technology housed in NASA’s Earth Observing System Terra satellite. Initial fi ndings suggest at least a 20 percent improvement in accuracy for satellite imaging. If successful, the technology will greatly improve meteorological precision and lead to improved software and modeling techniques. Highlight ID: 12359 MPS/DMS
Illustration of the thermosphere. New research shows that the outermost layer of the atmosphere will lose 3 percent of its density over the coming decade, a sign of the far-reaching impacts of greenhouse gas emissions. As the density declines, orbiting satellites experience less drag. Credit: © University Corporation for Atmospheric Research

24
Why Is This Cloud Raining on Me?A team of multidisciplinary scientists wants to know more about cumulus clouds, the simplest and “puffi est” clouds that fl oat across the sky. To do so, they are developing new visualization and analysis techniques to gain insight into the factors that control precipitation development in cumulus clouds found in trade winds. Th ese clouds are present over much of the globe; they aff ect heat and moisture budgets; and they have an impact on the amount of radiation that enters and leaves Earth’s atmosphere. Th ey are poorly represented in global climate models, and this research should improve their portion of the models. Because cumulus clouds are relatively simple clouds that contain no ice, they can be used to investigate long-standing, fundamental questions about precipitation development by the warm rain processes that are relevant to other types of clouds. Th is knowledge could inform precipitation-fl ood-drought forecasts and benefi t agriculture. Highlight ID: 15937 CISE/IIS
Project Atmospheric Brown Clouds Advances U.S. Leadership in Climate Research and Education
Atmospheric brown clouds (ABCs) are caused by air pollution emissions containing aerosol particulates. Project ABC is a concerted eff ort among an international group of distinguished atmospheric scientists and researchers, governments in Asia, and research institutions in Asia, Europe, and the United States to address the causes and impacts of ABCs, which are a major environmental challenge facing the Asia-Pacifi c region. Th e project is guided by a science team led by V. Ramanathan of the Scripps Institution of Oceanography and a United Nations Environmental Programme steering committee. Unlike issues such
as greenhouse gases and global warming, the eff ects on climate from pollution aerosols are universally accepted throughout Asia. Project ABC provides high visibility for the United States in its leadership role on climate research and education in the South Asia and Asia-Pacifi c region, which is home to more than half of the world’s population.
Project ABC aims to develop the physical infrastructure, human resources, and networks of experts and institutions in the South Asia and Asia-Pacifi c region. Central to its mission is the development of surface observatories and ABC training schools. Over the past 4 years, 14 climate observatories have been established in the Maldives (2), Nepal (2), India (2), Pakistan (1), Th ailand (1), China (3), Korea (1), Japan (1), and the United States (1). Local scientists and technicians maintain the stations and carry out measurements using instruments deployed at those sites for radiation, aerosol species, gas-phase species, precipitation chemistry, and meteorology. Th e fi rst training school was held in October 2004 in Th ailand and a second in December 2006 in the Maldives. Highlight ID: 13675 OD/OISE
In Search of the North American MonsoonA group of undergraduate and graduate students in the Department of Earth and Environmental Science (EES) of New Mexico Institute of Mining and Technology (New Mexico Tech) spent nearly 3 weeks in Sonora, Mexico, as part of a large international fi eld campaign to study the North American Monsoon (NAM). Th e NAM is an annual regional atmospheric phenomenon that controls hydrological and ecological conditions during the summer season in the southwestern U.S. and northwestern Mexico. Given its wide eff ect, ecohydrological studies of the NAM require coordinated research eff orts between U.S. and Mexican scientists.
V. Ramanathan of Project Atmospheric Brown Clouds with several autonomous unmanned aerial vehicles. Credit: Scripps Institution of Oceanography, UC San Diego

25
New Mexico Tech’s EES Department is playing a key role in these binational studies through several projects sponsored by NSF and the National Oceanographic and Atmospheric Administration. Th e eff orts have been carried out in collaboration with scientists from the Universidad de Sonora, Instituto Tecnológico de Sonora, University of Arizona, University of New Mexico, and the National Center for Atmospheric Research. In 2007, 21 students and researchers from the United States and Mexico participated in the Sonora Field Campaign, engaging in scientifi c and cultural exchanges.
Th e students helped plan, organize, and carry out a series of ecohydrological experiments in a remote, mountainous region in northern Sonora. Predicting the NAM should prove very useful to communities aff ected by its weather patterns. Highlight ID: 15269 OD/OISE

26

27
Ocean covers roughly 71 percent of Earth’s surface and hosts some of its most productive ecosystems. Sea currents and surface temperature drive weather patterns and create the climate. Evaporation from the sea surface accounts for most of the precipitation that falls on Earth. Th e ocean’s ability to absorb and store energy allows it to serve as a buff er against extreme climatic swings. And, importantly, the ocean has an enormous capacity to remove carbon dioxide (CO2) from the atmosphere; researchers estimate that the oceans have absorbed roughly one-third of the anthropogenic carbon released into the air.
NSF-supported researchers have long sought accurate models of the properties and circulation of Earth’s ocean because of the important role ocean circulation plays in our planet’s climate. Researchers now know that the sea is as essential to a global climate model (such as the NSF-supported Community Climate System Model (CCSM)) as the atmosphere itself. In recent decades, researchers have demonstrated that the ocean plays a critical role in transporting energy around the world, so much so that some have called it the “global heat engine.”1
Heat stored in the ocean warms the atmosphere, as evidenced by the temperate climates of coastal regions compared with the larger temperature swings of inland areas at the same latitudes. Th e temperature gradients in the atmosphere caused by heat transfer from the ocean infl uence wind patterns. Wind-driven waves, which transfer energy from the atmosphere to the ocean, are a driving
1 NASA Facts: The Roles of the Ocean in Climate Change, 1999: http://earthobservatory.nasa.gov/Newsroom/MediaResources/Roles_Ocean.htm
SEA
Top image credit: © 2009 Digital Vision, Gety Images
The global ocean circulation system, often called the “ocean conveyor,” transports heat throughout the planet. Light sections represent warm surface currents. Dark sections represent deep, cold currents. Credit: Illustration by Jayne Doucette, Woods Hole Oceanographic Institution

28
force behind ocean current patterns. Temperature and salinity are the key variables aff ecting seawater density and drive vertical ocean circulation; density increases with increasing salinity or decreasing temperature. Colder, saltier water is denser than warmer, fresher water, and sinks to lower depths.1
Th e warming or cooling of the ocean’s surface can have far-reaching eff ects on the atmosphere. For example, the El Niño phenomenon is associated with warmer water extending farther than normal across the tropical Pacifi c Ocean.2 Researchers use the CCSM and other global climate models to predict El Niño events, which can have profound impacts on human activities.
Unraveling the role of the ocean in the cycling of carbon in the Earth system has been a challenge for NSF researchers. Th e ocean contains about 50 times as much CO2 as the atmosphere. Even slight changes in the marine carbon cycle can substantially infl uence the amount of CO2 contributing to the greenhouse eff ect in the atmosphere. Researchers have found evidence
that the marine carbon cycle was a signifi cant factor in transitions to and from past ice ages.3 Modelers need to know how much anthropogenic carbon the ocean can absorb. Ecologists and oceanographers seek to understand how this absorption will aff ect ocean ecosystems and chemistry, and the sustainability of essential ecosystem services of the sea.
As the amount of dissolved CO2 increases in the ocean, its acidity also increases.4 NSF-funded researchers have found that increased acidity changes the chemical balance of the ocean, causing potentially signifi cant disruptions in ecosystems, particularly for species that build shells or exoskeletons, such as phytoplankton, shellfi sh, and coral. Because phytoplankton form the foundation of the food chain and coral reefs provide important habitats, ocean acidifi cation could have a dramatic eff ect on the entire ocean system. Colder seas, including polar ecosystems, which host some of the most economically important fi sheries in the world, are particularly vulnerable to ocean acidifi cation because cold water can dissolve more CO2 than warmer water.5 Ocean ModelingOcean currents have the ability to transfer large amounts of heat over great distances. Understanding the relationship between ocean currents and atmospheric and ocean temperatures is critical, especially because scientists have found evidence to suggest that past episodes of global warming have dramatically altered ocean circulation patterns.6 Shifting currents could have a profound impact on global weather, including the location and timing of major weather patterns, such as seasonal monsoon rains. Ocean ecosystems and commercially important fi sheries would also be severely aff ected, because so many organisms of the ocean have life cycles that depend on ocean circulation patterns. For these reasons, climate modelers must include as many details as possible about the sea in global climate models to improve climate predictions.
2 NCAR Research, Oceans and Our Atmosphere: www.ncar.ucar.edu/research/earth_system/oceans.php.
3 The Academic Research Fleet: A Report to the Assistant Director for Geosciences, 1999.
4 Solomon, S., et al., Technical Summary, in Climate Change 2007: The Physical Science Basis. Contribution of Working Group I to the Fourth Assess-ment Report of the Intergovernmental Panel on Climate Change, Cambridge University Press, 2007, p. 48.
5 NSF Highlight 16601: Ocean Acidification and Polar Ecosystems.
6 NSF Highlight 12174: Reversing Course: Changes in Ocean Currents During Global Warming.
The 1997–1998 El Niño event affected weather patterns around the world. El Niño years are characterized by an unusual extension of warm water across the Pacifi c Ocean, illustrated in shades of red in the image above. Credit: NASA/Goddard Space Flight Center; The SeaWiFS Project; ORBIMAGE Science Visualization Studio
The fi rst buoy to monitor ocean acidifi cation, a result of carbon dioxide absorbed by the ocean, has been launched in the Gulf of Alaska, and is a new tool for researchers to examine how ocean circulation and ecosystems interact to determine how much CO2 the North Pacifi c Ocean absorbs each year. Credit: NOAA

29
Air-Sea ExchangeNSF-sponsored investigators have deployed instrumentation to characterize the gas fl uxes between the ocean and the atmosphere, with the aim of improving air-sea exchange simulations in global climate models. Th e instruments used for these measurements include shipboard sensors and buoys. Shipboard instruments enable researchers to study the geographic distribution of climatically relevant gas species, including marine-derived aerosol precursors.7 Buoys allow researchers to characterize the air-sea exchange of gases such as CO2 at a particular location over an extended period.8 Both types of measurements provide critical information for increasing our understanding of ocean acidifi cation and air-sea interactions under varying conditions.
Ocean Observatories InitiativeTh e Ocean Observatories Initiative (OOI) has the potential to revolutionize ocean science by providing the means to collect sustained, detailed, time-series data sets using state-of-the-art data maintenance and analysis tools. OOI was created in response to community demand for long-term and adaptive measurements in the world’s oceans. OOI is envisioned as an international, integrated network of ocean-observing equipment that will enable researchers to study complex, interlinked physical, chemical, biological, and geological processes throughout the world’s oceans. As planned, the observatory system would have three elements: a global component consisting of deep-sea buoys equipped with instrumentation; a regional electro-optical cabled network of interconnected sites around the seafl oor; and new coastal observatory stations.9 Th e scientifi c goals of OOI include gaining a greater understanding of carbon transfer to the oceans, the ecosystem consequences of ocean acidifi cation, and the eff ects of climate change on coastal habitats.
7 NSF Highlight 10407: Air-Sea Exchange Measurements by Eddy Correlation.
8 NSF press release 07-067: First Buoy to Monitor Ocean Acidification Launched: www.nsf.gov/news/news_summ.jsp?cntn_id=109619&org=GEO&from=news.
9 NSF-Supported Research Infrastructure: Enabling Discovery, Innovation, and Learning, 2008.
Cold, relatively fresh water from the Pacifi c Ocean enters the Arctic Ocean through the Bering Strait. It is swept into the Beaufort Gyre and exits into the North Atlantic Ocean through three gateways (Fram, Davis, and Hudson Straits). Warmer, saltier waters from the Atlantic penetrate the Arctic Ocean beneath layers of colder water, which lie atop the warmer waters and act as a barrier, preventing them from melting sea ice. Once in the Arctic, this water is cooled as it travels cyclonically (counterclockwise) around the perimeter as a boundary current, fi nally exiting Fram Strait as a colder, fresher water mass. This warm-to-cold conversion is a crucial component of the global ocean’s overturning circulation that helps maintain Earth’s climate. Credit: Illustration by Jack Cook, Woods Hole Oceanographic Institution
The Ocean Observatories Initiative (OOI) promises to provide the ocean science research community with sustained, long-term, and adaptive measurements in the oceans via a fully operational research observatory system. Credit: John Orcutt, Scripps Institute of Oceanography
The exchange of carbon dioxide and other gases at the air-sea interface is one of the most important interactions in the global climate system. Increased CO2 concentrations in the world’s oceans have led to increases in ocean acidity. Credit: © University Corporation for Atmospheric Research

30
Academic Research FleetTh e researchers who study the biological, chemical, and physical processes of the ocean rely heavily on research vessels. Th e Academic Research Fleet consists of 23 vessels in the University-National Oceanographic Laboratory System. Th ese vessels vary in size, endurance, and capabilities, and enable scientists supported by NSF and other Federal agencies to conduct marine research from coastal regions to the distant and deep seas. Funding for the Academic Research Fleet includes investments in ship operations, shipboard scientifi c support equipment, oceanographic instrumentation and technical services, and submersible support. NSF owns seven of the fl eet’s ships.10
Alaska Regional Research VesselTh e Alaska Regional Research Vessel (ARRV) will be the newest addition to NSF’s complement of research ships. Th is technologically advanced, highly capable 242-foot ship is designed to operate in both seasonal ice and the harsh open waters surrounding Alaska. Th e ARRV will be able to accommodate 24 researchers on missions lasting up to 45 days, and the ship will be able to spend up to 300 days per year at sea. It will provide a crucial support platform to enhance scientifi c understanding of the polar regions and how they are aff ected by global climate change. Th e project is approaching the fi nal design review, and ship construction is projected to get under way in early 2010. Scientifi c operations could begin in late 2013, following extensive sea trials and equipment testing.11
Ocean Climate RecordsTh e depths of the ocean provide researchers with some of the best locations to seek evidence of Earth’s climatic past. Th e anaerobic environment found in many deep seafl oor locations prohibits marine organisms from disrupting the buildup of organic material, allowing millennia of ocean sediments to accumulate undisturbed. Th e ocean sediments contain the remains of living things, including foraminifera—microscopic single-celled organisms that build shells from minerals dissolved in seawater.
Foraminifera have played a pivotal role in revealing Earth’s climatic past. Researchers can measure the ratio of oxygen isotopes contained in their shells to determine the temperature of the ocean at the time they were alive.12 Seafl oor core samples, including the remains of foraminifera and other sediments, provide scientists with a window into past climate conditions at a particular site. Arctic seafl oor cores have revealed a subtropical past over 50 million years ago, when warmer global temperatures led to an abundance of living things near the North Pole.13
NSF’s premier ocean core drilling project, the Integrated Ocean Drilling Project (IODP), is operated jointly with Japan’s Ministry of Education, Culture, Sports, Science and Technology. IODP is an international marine research program that explores Earth’s history and structure, as recorded in seafl oor sediments and rocks. Japan’s vessel, the Chikyu (Earth), was launched in January 2002, underwent outfi tting and testing in 2003–2006, and began IODP operations in 2007.14 (See the JOIDES Resolution sidebar for a description of the U.S. drilling vessel.)
10 NSF-Supported Research Infrastructure: Enabling Discovery, Innovation, and Learning, 2008.
11 NSF-Supported Research Infrastructure: Enabling Discovery, Innovation, and Learning, 2008.
12 NSF Highlight 12938: Evolution of the Eastern Tropical Pacific Through Plio-Pleistocene Glaciation.
13 NSF Highlight 10350: First Arctic Ocean Drilling Reveals Subtropical Past.
14 NSF-Supported Research Infrastructure: Enabling Discovery, Innovation, and Learning, 2008.
The Integrated Ocean Drilling Program recovers rock and sediment samples, including drill cores like these, from the deep seafl oor to the surface, allowing researchers to examine fossils and other clues about Earth’s climatic past. Credit: Integrated Ocean Drilling Program
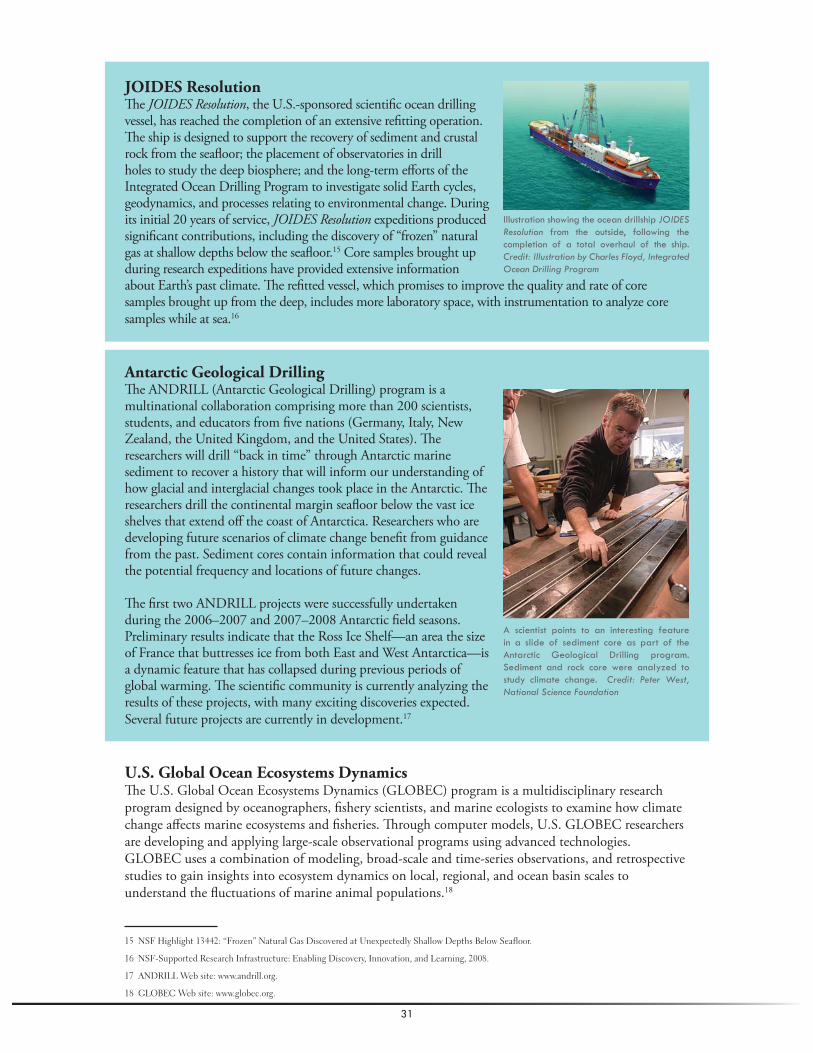
31
JOIDES ResolutionTh e JOIDES Resolution, the U.S.-sponsored scientifi c ocean drilling vessel, has reached the completion of an extensive refi tting operation. Th e ship is designed to support the recovery of sediment and crustal rock from the seafl oor; the placement of observatories in drill holes to study the deep biosphere; and the long-term eff orts of the Integrated Ocean Drilling Program to investigate solid Earth cycles, geodynamics, and processes relating to environmental change. During its initial 20 years of service, JOIDES Resolution expeditions produced signifi cant contributions, including the discovery of “frozen” natural gas at shallow depths below the seafl oor.15 Core samples brought up during research expeditions have provided extensive information about Earth’s past climate. Th e refi tted vessel, which promises to improve the quality and rate of core samples brought up from the deep, includes more laboratory space, with instrumentation to analyze core samples while at sea.16
Antarctic Geological DrillingTh e ANDRILL (Antarctic Geological Drilling) program is a multinational collaboration comprising more than 200 scientists, students, and educators from fi ve nations (Germany, Italy, New Zealand, the United Kingdom, and the United States). Th e researchers will drill “back in time” through Antarctic marine sediment to recover a history that will inform our understanding of how glacial and interglacial changes took place in the Antarctic. Th e researchers drill the continental margin seafl oor below the vast ice shelves that extend off the coast of Antarctica. Researchers who are developing future scenarios of climate change benefi t from guidance from the past. Sediment cores contain information that could reveal the potential frequency and locations of future changes.
Th e fi rst two ANDRILL projects were successfully undertaken during the 2006–2007 and 2007–2008 Antarctic fi eld seasons. Preliminary results indicate that the Ross Ice Shelf—an area the size of France that buttresses ice from both East and West Antarctica—is a dynamic feature that has collapsed during previous periods of global warming. Th e scientifi c community is currently analyzing the results of these projects, with many exciting discoveries expected. Several future projects are currently in development.17
U.S. Global Ocean Ecosystems Dynamics Th e U.S. Global Ocean Ecosystems Dynamics (GLOBEC) program is a multidisciplinary research program designed by oceanographers, fi shery scientists, and marine ecologists to examine how climate change aff ects marine ecosystems and fi sheries. Th rough computer models, U.S. GLOBEC researchers are developing and applying large-scale observational programs using advanced technologies. GLOBEC uses a combination of modeling, broad-scale and time-series observations, and retrospective studies to gain insights into ecosystem dynamics on local, regional, and ocean basin scales to understand the fl uctuations of marine animal populations.18
15 NSF Highlight 13442: “Frozen” Natural Gas Discovered at Unexpectedly Shallow Depths Below Seafloor.
16 NSF-Supported Research Infrastructure: Enabling Discovery, Innovation, and Learning, 2008.
17 ANDRILL Web site: www.andrill.org.
18 GLOBEC Web site: www.globec.org.
Illustration showing the ocean drillship JOIDES Resolution from the outside, following the completion of a total overhaul of the ship. Credit: Illustration by Charles Floyd, Integrated Ocean Drilling Program
A scientist points to an interesting feature in a slide of sediment core as part of the Antarctic Geological Drilling program. Sediment and rock core were analyzed to study climate change. Credit: Peter West, National Science Foundation

32
Marine ecosystems rely on the tiniest microorganisms that form the foundation of the food chain; these are phytoplankton—microscopic drifting plants that absorb CO2 and convert it into organic matter. Th e abundance of life on the higher stages of the marine food chain depends on the amount of phytoplankton, which in turn depends on the amount of dissolved nutrients in the seawater. Climate change aff ects circulation currents, which are responsible for the distribution of dissolved nutrients around the ocean. Th e GLOBEC program seeks to understand how climate change will alter the distribution and abundance of the entire marine ecosystem, including economically important fi sh species.
ConclusionEarth’s oceans hold some of its most varied and biologically rich ecosystems. In the decades since NSF-funded researchers began exploring the sea and its physical, chemical, and biological processes, they have uncovered evidence of change brought on by increasing temperatures and acidity. Th eir work is critical to the climate models and to improving our understanding of what will happen to the sea as a result of increasing carbon emissions and rising temperatures. Th e research highlights below describe some of the numerous NSF-funded projects that have contributed to our fundamental knowledge of the sea. Th e training these research projects provide to students ensures that we will continue to build our knowledge base about the world’s oceans.
The Global Ocean Ecosystems Dynamics program was developed to study how climate change affects marine ecosystems and fi sheries. Credit: NOAA

33
Reversing Course: Changes in Ocean Currents During Global WarmingOcean currents are considered the engine that drives Earth’s climate because of their capacity to effi ciently transport heat over great distances. At the same time, scientists have long suspected that global climate change may radically alter ocean circulation patterns. Now, researchers at the Scripps Institution of Oceanography have analyzed seafl oor cores collected by the NSF Ocean Drilling Program (ODP) to provide the fi rst direct evidence of sudden changes in ocean circulation patterns in response to global warming in Earth’s distant past.
In a study published in the journal Nature, scientists Flavia Nunes and Richard Norris analyzed carbon trapped in the shells of microscopic, deep-sea fossil organisms called foraminifera to reconstruct past
oceanic circulation patterns. Carbon is a good tracer for ocean currents because deepwater masses carry a diff erent carbon signature at formation than they do as they age. Using foraminifera recovered in deep-sea cores from 14 sites in the Atlantic, Pacifi c, Indian, and Southern Oceans during the ODP (the predecessor to the current Integrated Ocean Drilling Program), the researchers examined the period bracketing a major global warming event that occurred 55 million years ago. Th e carbon analyses indicate that before and after this period, most deepwater formation occurred in the Southern Hemisphere. At the onset of global warming, though, deepwater formation switched from the Southern to the Northern Hemisphere over a period shorter than 5,000 years—a mere instant in geologic time. Th e hemispheric reversal in deepwater formation endured for approximately 40,000 years, but another 100,000 or more years was required for reversion to the ocean circulation patterns that predominated before global warming.
Th is study has revealed new details about an important, well-studied ancient global warming event and confi rmed that global warming can lead to a rapid hemispheric switch in the locus of oceanic deepwater formation. In light of mounting evidence for contemporary global warming, the study suggests the possibility of future changes in ocean circulation. Highlight ID: 12174 GEO/OCE
Air-Sea Exchange Measurements by Eddy CorrelationTh is project is an innovative step toward a better understanding of air-sea interaction, in particular, gas fl uxes between the ocean and atmosphere. Th e investigators have modifi ed the newly developed atmospheric pressure ionization mass spectrometer (APIMS) for shipboard applications for measuring air-sea exchange of trace gas species important to global climate. Initial results for direct measurements of the sea-to-air fl ux of dimethyl sulfi de (DMS), an important biogenic trace gas and natural secondary aerosol precursor, have been extremely successful. In a recent research article, the investigators report DMS exchange fl uxes acquired over the open ocean on the NOAA research vessel Seward Johnson with
Phase-contrast photomicrograph of a live Ammonia tepida benthic foraminiferan collected from San Francisco Bay. The remains of ancient foraminifera from ocean sediment cores provide scientists with detailed information about ocean circulation patterns in the past. Credit: Scott Fay, University of California, Berkeley, 2005
Project co-investigator Byron Blomquist mounts inlets and a sonic anemometer on the jackstaff of the National Oceanic and Atmospheric Administration Research Vessel Seward Johnson. The atmospheric pressure ionization mass spectrometer laboratory container is in the foreground. Credit: Barry Huebert, University of Hawaii
Sea Research Highlights

34
unprecedented accuracy, and they plan to extend APIMS target species to include a number of other climatically relevant marine boundary-layer trace gas species. Th is tool will enable the measurement of DMS and other species with suffi cient temporal resolution and accuracy to conduct critical process studies and improve parameterizations of air-sea exchange in global climate models. Highlight ID: 10407 GEO/ATM
Evolution of the Eastern Tropical Pacifi c Th rough Plio-Pleistocene GlaciationA research team at Brown University recently produced the fi rst continuous look at the evolution of sea surface conditions (past temperature and biological productivity) in the climatically sensitive Eastern Equatorial Pacifi c (EEP) over the past 5 million years. Th eir study monitored crucial aspects of the modern El Niño region as they evolved over the time when large ice sheets fi rst began to wax and wane in the Northern Hemisphere.
Th e Brown team took advantage of new organic geochemical methods to determine past sea surface temperatures. Th ey extracted alkenones—molecules synthesized by a class of marine algae—from a long deep-sea core recovered by the Ocean Drilling Program just south of the equator in the Eastern Pacifi c. Quantifying the ratio of two dominant alkenones allowed the investigators to determine past temperatures at the sea surface with high precision. Th e same sediment core also held clues to past ice ages, in the form of oxygen isotope ratios of bottom-dwelling foraminifera (single-celled organisms that make a carbonate shell). Because the bottom waters of the Pacifi c ultimately come from the high latitudes of the Northern and Southern Hemispheres, comparing the alkenone data (surface conditions) with the benthic isotope data allowed the Brown group to directly compare the response of an important tropical zone to the evolution of the ice ages at high latitudes. A principal fi nding of the Brown study is that the EEP has cooled rather steadily over the past 5 million years, at a rate of about 1 degree Celsius (1.8 degrees Fahrenheit) per million years. Highlight ID: 12938 GEO/OCE
First Arctic Ocean Drilling Reveals Subtropical PastTh e Integrated Ocean Drilling Program (IODP)—which is jointly sponsored by the National Science Foundation; the Japanese Ministry of Education, Culture, Sports, Science, and Technology; the European Consortium for Ocean Research Drilling; and the Chinese Ministry of Science and Technology—inaugurated a new era of drilling from specialized platforms with the 6-week Arctic Coring Expedition (ACEX), completed in summer 2004. Since the 1960s, international consortia have conducted scientifi c drilling in the world’s oceans, but never before at such a high latitude, within a mere 250 kilometers of the North Pole. Constant vigilance by two icebreakers kept ice as thick as 4 meters from damaging the Vidar Viking, a specially modifi ed vessel on which the British Geological Survey had installed its drilling equipment.
Th e cores recovered by ACEX comprise nearly 300 meters of sediments representing about 55 million years of Earth’s history. Already, these samples have yielded results that revise our understanding of Arctic climate and the history of the Arctic Ocean. Th e oldest sediments recovered are from the Paleocene-Eocene Th ermal Maximum, when Earth was signifi cantly warmer than at present. Earlier models had suggested that the North Pole enjoyed a subtropical climate during this period; this has been confi rmed by carbon isotopic analyses of ACEX sediment cores. Th e cores also challenge conventional wisdom about the opening of the Arctic Ocean basin, suggesting that the basin is older than predicted by plate tectonic reconstructions. A surprising discovery was more than 140 meters of laminated, organic-rich sediment that could indicate conditions conducive to oil formation in adjacent,
The Integrated Ocean Drilling Program completed the fi rst-ever program of scientifi c drilling in the high Arctic with assistance from two icebreakers (background) that were used to protect the drillship (foreground). The results of the study are already revising our understanding of Arctic paleoclimate and the history of the Arctic Ocean basin. Credit: Martin Jakobsson © ECORD/IODP
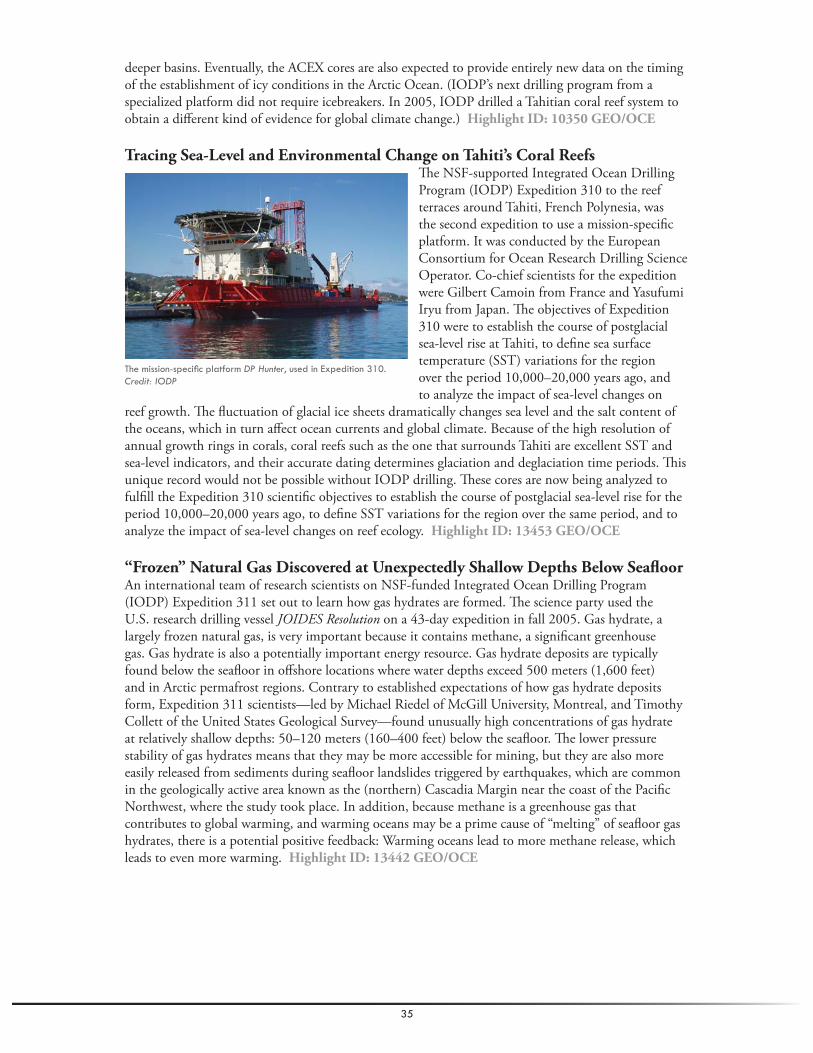
35
deeper basins. Eventually, the ACEX cores are also expected to provide entirely new data on the timing of the establishment of icy conditions in the Arctic Ocean. (IODP’s next drilling program from a specialized platform did not require icebreakers. In 2005, IODP drilled a Tahitian coral reef system to obtain a diff erent kind of evidence for global climate change.) Highlight ID: 10350 GEO/OCE
Tracing Sea-Level and Environmental Change on Tahiti’s Coral ReefsTh e NSF-supported Integrated Ocean Drilling Program (IODP) Expedition 310 to the reef terraces around Tahiti, French Polynesia, was the second expedition to use a mission-specifi c platform. It was conducted by the European Consortium for Ocean Research Drilling Science Operator. Co-chief scientists for the expedition were Gilbert Camoin from France and Yasufumi Iryu from Japan. Th e objectives of Expedition 310 were to establish the course of postglacial sea-level rise at Tahiti, to defi ne sea surface temperature (SST) variations for the region over the period 10,000–20,000 years ago, and to analyze the impact of sea-level changes on
reef growth. Th e fl uctuation of glacial ice sheets dramatically changes sea level and the salt content of the oceans, which in turn aff ect ocean currents and global climate. Because of the high resolution of annual growth rings in corals, coral reefs such as the one that surrounds Tahiti are excellent SST and sea-level indicators, and their accurate dating determines glaciation and deglaciation time periods. Th is unique record would not be possible without IODP drilling. Th ese cores are now being analyzed to fulfi ll the Expedition 310 scientifi c objectives to establish the course of postglacial sea-level rise for the period 10,000–20,000 years ago, to defi ne SST variations for the region over the same period, and to analyze the impact of sea-level changes on reef ecology. Highlight ID: 13453 GEO/OCE
“Frozen” Natural Gas Discovered at Unexpectedly Shallow Depths Below Seafl oorAn international team of research scientists on NSF-funded Integrated Ocean Drilling Program (IODP) Expedition 311 set out to learn how gas hydrates are formed. Th e science party used the U.S. research drilling vessel JOIDES Resolution on a 43-day expedition in fall 2005. Gas hydrate, a largely frozen natural gas, is very important because it contains methane, a signifi cant greenhouse gas. Gas hydrate is also a potentially important energy resource. Gas hydrate deposits are typically found below the seafl oor in off shore locations where water depths exceed 500 meters (1,600 feet) and in Arctic permafrost regions. Contrary to established expectations of how gas hydrate deposits form, Expedition 311 scientists—led by Michael Riedel of McGill University, Montreal, and Timothy Collett of the United States Geological Survey—found unusually high concentrations of gas hydrate at relatively shallow depths: 50–120 meters (160–400 feet) below the seafl oor. Th e lower pressure stability of gas hydrates means that they may be more accessible for mining, but they are also more easily released from sediments during seafl oor landslides triggered by earthquakes, which are common in the geologically active area known as the (northern) Cascadia Margin near the coast of the Pacifi c Northwest, where the study took place. In addition, because methane is a greenhouse gas that contributes to global warming, and warming oceans may be a prime cause of “melting” of seafl oor gas hydrates, there is a potential positive feedback: Warming oceans lead to more methane release, which leads to even more warming. Highlight ID: 13442 GEO/OCE
The mission-specifi c platform DP Hunter, used in Expedition 310. Credit: IODP

36
New Climate Mode of Variability, the North Pacifi c Gyre Oscillation, Links Ocean Climate and Ecosystem Change
Decadal fl uctuations in ocean salinity, nutrients, chlorophyll, a variety of zooplankton species, and fi sh stocks in the Northeast Pacifi c have been unexplained for many years. Th ey are often poorly correlated with the most widely used indicator of large-scale climate variability in the region: the Pacifi c Decadal Oscillation (PDO). Researchers Emanuele Di Lorenzo of the Georgia Institute of Technology and Niklas Schneider of the University of Hawaii recently defi ned a new pattern of climate change—the North Pacifi c Gyre Oscillation (NPGO)—and showed that its variability is signifi cantly correlated with the previously unexplained fl uctuations of salinity, nutrients, and chlorophyll.
Fluctuations in the NPGO are driven by the same fundamental processes that control salinity and nutrient concentrations. In the California Current System, the NPGO particularly refl ects changes in the winds that cause coastal upwelling, the process by which subsurface cold water that is rich in nutrients is brought up to the surface. Th ese results strongly support the use of the NPGO as the primary indicator of upwelling strength and nutrient fl uxes, and, therefore, the potential for ecosystem change in the California Current System region. Changes in nutrient fl uxes drive fl uctuations in modeled chlorophyll concentration—an indicator of phytoplankton concentration—that are highly correlated to observed chlorophyll. Th e model simulations support the hypothesis that variations in phytoplankton biomass in the California Current System region are primarily driven by changes in wind-driven upwelling correlated with the NPGO. Th e NPGO thus provides a strong indicator of changes in the mechanisms driving oceanic ecosystem dynamics.
Th is “bottom-up” forcing is consistent with previous fi sh catch data and satellite-derived chlorophyll concentration, and underscores the need to better understand the infl uences of physically forced nutrient fl uxes on higher food-chain levels in the ocean. Th e researchers have also shown that the NPGO pattern extends beyond the North Pacifi c and is part of a global mode of climate variability that is evident in global sea-level trends and sea surface temperature. Th e amplifi cation of the NPGO variability found in observations and in model simulations of global warming scenarios implies that the NPGO may play an increasingly important role in forcing global-scale decadal changes in marine ecosystems. Highlight ID: 16644 GEO/OCE
The North Pacifi c Gyre Oscillation (NPGO) is a pattern of climate variability that refl ects changes in the strength of the North Pacifi c gyre’s circulation (e.g., the North Pacifi c Current and the Kuroshio-Oyashio Extension Current). Changes in the NPGO are linked to previously unexplained climatic fl uctuations of salinity and nutrients recorded in a long-term observational program in the California Current and the Gulf of Alaska. Credit: Emanuele Di Lorenzo, Georgia Institute of Technology

37
Ocean Acidifi cation and Polar EcosystemsOcean acidifi cation arises as a result of the ocean’s absorption of carbon dioxide (CO2), followed by a series of naturally occurring equilibrium reactions involving carbonate, bicarbonate, and the hydrogen ion, which together constitute the carbonate cycle. One outcome of these equilibrium reactions is an increase in hydrogen ion concentration (i.e., lower pH) and a decrease in the carbonate ion available for the formation of calcium carbonate. Calcium carbonate is an important skeletal component for many marine organisms, including coral and shell-bearing invertebrates. Undersaturation of oceanic waters with respect to carbonate could promote shell dissolution or inhibit shell formation.
Th e implications for marine organisms, ecosystems, and biogeochemistry of ocean acidifi cation are potentially profound. If shell-bearing species cannot form skeletons or if organisms with shells encounter undersaturated waters, marine biodiversity, food web structure, and biogeochemical function are potentially aff ected. Non-shell-bearing organisms also may be at risk, because pH infl uences physiological processes and metabolic reactions in other organisms, as well as sorption-desorption reactions of metals and toxins.
Polar ecosystems are particularly vulnerable to ocean acidifi cation because cold water holds more CO2; therefore, surface waters in the polar oceans are closer to the tipping point of undersaturation. Models predict that the Southern Ocean could become undersaturated with respect to aragonite, a fragile biogenic form of calcium carbonate, by the year 2100. Polar ecosystems include critical members (e.g., pteropods, coccoliths) that depend on calcium carbonate formation for skeletal or protective components. Food web structure and carbon burial may be substantially altered.
Researchers Vicky Fabry of California State University, San Marcos, Brad Seibel of the University of Rhode Island, and Gretchen Hofmann of the University of California-Santa Barbara are taking a multipronged approach to determining the response of Southern Ocean pteropods, an important group of zooplankton, to ocean acidifi cation. Fabry and Seibel are quantifying the impact of elevated CO2 and carbonate-undersaturated seawater on rates of shell formation and sublethal eff ects on organism energetics. Hofmann is investigating the response of pteropods at the genetic level to calcifi cation stress. Her research on sea urchin larvae shows that shell-forming genes have highly elevated activity and larval skeletons are less developed when the larvae are subjected to undersaturated seawater; this is consistent with Intergovernmental Panel on Climate Change scenarios of ocean conditions in the future. Hofmann is now using gene microarrays to examine the genomic response of Antarctic pteropods to elevated atmospheric CO2 and undersaturated seawater, in concert with Fabry and Seibel’s calcifi cation and energetic studies. Highlight ID: 16601 OPP/ANT
The Antarctic pteropod Limacina helicina antarctica, seen here under the microscope, is about the size of a pepper grain and is a notable component of the zooplankton around McMurdo Station, Antarctica. Increased atmospheric carbon dioxide may inhibit this animal’s ability to grow its calcium carbonate shell. Credit: Gretchen Hoffman, University of California, Santa Barbara

38
Marine Radiocarbon Evidence for the Mechanism of Deglacial Atmospheric Carbon Dioxide Rise
Before humans infl uenced the climate system, natural processes controlled atmospheric greenhouse gas concentrations. One of the great mysteries surrounding Earth’s emergence from the last ice age, which occurred between 19,000 and 11,000 years ago, is the rapid increase in atmospheric carbon dioxide (CO2) that occurred as the glacial ice sheets melted. Scientists have known that during this time, the carbon-14 (14C, an unstable isotope of carbon) content of the atmosphere fell by approximately 35 percent. Th e current hypothesis for this radiocarbon conundrum—the rapid rise in the level of atmospheric CO2 as the 14C content of the atmosphere fell—is that a large reservoir of deep ocean water with accumulated CO2 suddenly reached the surface and released CO2. Th e stored CO2 molecules would have been isolated from the atmosphere for thousands of years (which would decrease its 14C level), thereby giving CO2 in the postglacial atmosphere the appearance of being older (because it contained less 14C).
Th e search for this “old” water has fi nally revealed its fi rst clue. By analyzing the 14C content of fossilized, bottom-dwelling foraminifera (single-celled amoeba-like organisms with shells) from a core collected from a depth of 700 meters off the coast of Baja California, a team of NSF-funded scientists led by Th omas Marchitto of the University
of Colorado has located the missing water mass: 14C data from these samples show two periods during the deglaciation when these intermediate water-depth sediments were in contact with old 14C-depleted waters. Th e researchers propose that during the deglaciation, a deep reservoir of old water spread northward from the Southern Ocean via the Antarctic Intermediate Water Current. When this old, CO2-rich, 14C-depleted water surfaced along the Baja coast and elsewhere, the excess dissolved CO2 in the water left the ocean. Th is had the eff ect of reducing the atmosphere’s radiocarbon content and contributed to the rapid CO2 rise in the atmosphere, as documented in high-latitude ice cores. Th ese fi ndings have provided the fi rst direct evidence for a deep ocean deglacial CO2 source and a testable hypothesis to resolve this fundamental mystery. Highlight ID: 16475 GEO/OCE
Tracking the Ocean’s Motion, Temperature, and MoreTh e vast size and heat capacity of the world’s oceans give them a pivotal role in Earth’s climate. Other important ocean issues include biodiversity, fi sheries dynamics, shipping, and international policy. But the sheer magnitude and remoteness of the oceans, which cover 70 percent of Earth’s surface, also make them diffi cult and expensive to observe. With the help of researchers at the NSF-funded San Diego Supercomputer Center (SDSC), climate scientist Carl Wunsch and other scientists in the Estimating the Circulation and Climate of the Ocean Consortium are working to better estimate the physical conditions in the world’s oceans—velocity, temperature, salinity,
and other factors. By harnessing the power of SDSC’s supercomputers to create a vast simulation or “virtual ocean,” the scientists can tease out accurate estimates of the ocean’s state by fi lling in the gaps between the relatively tiny number of ocean measurements made. To help climate scientists and others, the team is producing the most accurate information ever available about conditions in the ocean. More information on this research can be found at www.ecco-group.org. Highlight ID: 14385 OD/OCI
Species Angulogerina earlandi, a benthic (lives on the bottom of the ocean) Antarctic foraminifera. This organism produces a shell made of calcium carbonate. Credit: Scott McCallum and Scott Ishman
NSF-funded researchers are creating sophisticated computer models to simulate the role the world’s oceans play in global climate. Credit: © 2009 JupiterImages Corporation

39
Interactions Between the Wind and Oceanic Eddies Stimulate Higher Biological Productivity in Subtropical Ocean Surface Waters
Oceanographers participating in the NSF-funded Eddies Dynamics, Mixing, Export, and Species composition (EDDIES) study have demonstrated that episodic, eddy-driven upwelling—in which ocean surface waters are replaced by water that comes up from below—may supply a signifi cant fraction of the nutrients required to sustain primary productivity in the subtropical ocean. Th e importance of ocean eddies (circular, rotating bodies of ocean water with warm or cold water cores) in stimulating ocean productivity through the enhanced upwelling of cold, nutrient-rich water to the surface had been speculated for over a decade. Large areas of the ocean, such as the central subtropical North Atlantic, are characterized by low productivity, largely because phytoplankton growth is limited by the delivery of plant nutrients to the sunlit surface zone. Nevertheless,
productivity in these regions is higher than expected based on current knowledge of ocean mixing processes. In 2004 and 2005, EDDIES researchers sampled 10 diff erent ocean eddies in the Northern Atlantic Ocean. Two diff erent types—a “cyclone” eddy (counterclockwise rotating with density surfaces pushed up in the center in a dome shape) and a “mode-water” eddy (clockwise rotating with a thick lens of constant density water below the surface)—were sampled repeatedly. Th e diff erent types have distinct surface signatures that allow researchers to use remote sensing techniques to locate them, then tag and track them by releasing surface drifters in their core. Th is sophisticated approach allowed the researchers to sample the eddies and their evolution in great detail over 2 months, tracking them using two research vessels and employing high-tech instrumentation, such as a video plankton recorder, acoustic doppler current profi ler, conductivity, temperature, depth recorders, and a tracer that directly measured the horizontal and vertical dispersion of water properties such as temperature, salinity, and plankton concentration.
Th e main result of this study is that the interactions of cyclone and mode-water eddies with the wind result in very diff erent biological responses. Th e eddy-wind interactions enhance the vertical supply of nutrients in mode-water eddies by moving surface water away from the center of the eddy. Th e result is sustained primary biological production at the surface and the creation of subsurface maxima in phytoplankton and zooplankton communities. In contrast, the biological production in cyclones is more ephemeral because of a reverse eff ect of the wind interacting with cyclones. Th ese results explain how higher than expected production can be achieved in mid-ocean regions and points to the need to include explicit representations of eddy-wind interactions and response in future ocean and climate models. Highlight ID: 16578 GEO/OCE
Data from satellite altimeters (lower inset), which measure sea surface heights, show depressions (blue) and bumps (red) that mark cold- and warm-water eddies in the ocean on June 17, 2005. Researchers tracked the southwestward motion of eddy A4 (light-blue in the upper inset) by ship from June 24 to September 12. They released several drifters and a buoy (colored tracks) to capture the swirling motion of the eddy’s currents. Credit: This fi gure was drafted by Jim Canavan and provided as a courtesy by Dennis McGillicuddy, Woods Hole Oceanographic Institution, and the Colorado Center for Astrodynamics Research.

40
How Much Excess Freshwater Was Added to the North Atlantic in Recent Decades?Large regions of the North Atlantic Ocean have become fresher since the late 1960s as melting glaciers and increased precipitation, both associated with greenhouse warming, have enhanced continental runoff into the Arctic and sub-Arctic seas. Over the same time, salinity records show that large pulses of extra sea ice and freshwater from the Arctic have fl owed into the North Atlantic. However, until now, the actual amounts and rates of freshwater accumulated have not been explicitly known. According to climate models, excessive amounts of freshwater could alter the ocean density that drives a portion of the circulation system, diminish the amount of heat that is transported northward, and signifi cantly cool areas of the Northern Hemisphere.
Ruth Curry at Woods Hole Oceanographic Institution and Cecilie Mauritzen at the Norwegian Meteorological Institution have analyzed data collected in the North Atlantic over the past 55 years to estimate how much freshwater had to have been added to the North Atlantic to account for the observed changes in salinity. In an average year, about 5,000 cubic kilometers of freshwater fl ows from the Arctic into the North Atlantic. Th is is approximately 10 times more water than the Mississippi River outfl ow. However, between 1965 and 1995, an extra 19,000 cubic kilometers of freshwater has diluted the northern seas. Highlight ID: 11593 GEO/OCE
Science and Technology Center for Coastal Margin Observation and PredictionCoastal margins are among the most densely populated and developed regions in the United States. Th ey sustain highly productive ecosystems and resources, are sensitive to many scales of variability, and play a key role in global elemental cycles. Natural events and human activities place stresses on coastal margins, making the development of sustainable coastal resources and ecosystems diffi cult and contentious, with many policy decisions historically based on insuffi cient scientifi c input. Science as usual will not suffi ce; sustained advances at the interfaces of disciplines, technologies, and scales are required to an extent unprecedented even in interdisciplinary oceanography.
In 2006, NSF awarded a grant to support a new Science and Technology Center for Coastal Margin Observation and Prediction (CMOP). Th e mission of the CMOP is to study coastal margins using observation and prediction technologies to facilitate long-term integrated descriptions and analyses of coastal margin physics, chemistry, and biology. CMOP will enable researchers to focus on novel technological and scientifi c opportunities to answer major questions about the impact of climate on coastal margins, the role of coastal margins on global elemental cycles, and the seaward extent of human impacts. Th is work, focused on the Columbia River, will lead to transformative understanding of critical yet vulnerable river-to-ocean ecosystems.
Th e CMOP partnership is anchored in complementary expertise from Oregon Health and Science University, Oregon State University, and the Applied Physics Laboratory at the University of Washington. All three institutions have strong research, education, and outreach assets in the Pacifi c Northwest. Essential elements of the Science and Technology Center are educational partners and industry partners initially focused on advanced computing and visualization technology, oceanographic instrumentation, and molecular sensors.
Integral to CMOP is a river-to-ocean testbed observatory for the Pacifi c Northwest, consisting of modeling systems, observation networks, and information systems—all aimed at fundamental advancements in science and the delivery of more reliable information to scientists, educators, resource managers, and interested citizens. Highlight ID: 14056 GEO/OCE
Map of the Nordic Seas with ocean circulation. Surface currents are shown as solid pathways; deep currents are dashed. Color depicts temperature of water. Credit: Ruth Curry, Woods Hole Oceanographic Institution

41
Coral Reef Bleaching: A Novel Strategy for SurvivalOf the many documented eff ects of global climate change, the bleaching of corals—a stress response caused by elevated seawater temperature in which corals lose their nutrient-providing symbiotic algae (called zooxanthellae)—continues to attract the interest of coral reef biologists around the world. Recent research conducted by Andrea Grottoli from Ohio State University at the Hawaii Institute for Marine Biology has revealed that when certain corals bleach, they can continue to survive by consuming zooplankton from the surrounding seawater.
While corals have long been known to consume zooplankton, some species of coral appear to be able to survive bleaching by increasing their rates of feeding to compensate for the loss of food normally supplied by the zooxanthellae when these cells reside safely in their coral host. Grottoli and her group made this discovery by conducting feeding and physiological studies on three species of coral found on reefs in Hawaii. An often-noted eff ect of coral bleaching is that corals with a mounding shape or morphology are more likely to survive a bleaching event than those with a branching morphology. Th e study found that one of these species, the branching coral Montipora capitata, exhibited the greatest increase in feeding on zooplankton after bleaching and recovered faster as well, but another branching species, Porites compressa, did not.
Th e implications of these results are that predicting coral survival or recovery on the basis of morphology does have exceptions, and many species of coral may be able to survive the repeated eff ects of thermal stress and bleaching by increasing their feeding rates. Increased feeding in the face of continuing environmental stress depends on the availability of zooplankton in the water, which may also be aff ected by the very same thermal stress events that cause corals to bleach. Highlight ID: 13490 GEO/OCE
Saltier Tropical Oceans and Fresher Ocean Waters Near the Poles: More Signs of Global Climate ChangeTropical ocean waters have become dramatically saltier over the past 40 years, while oceans closer to Earth’s poles have become fresher. Th ese large-scale, relatively rapid oceanic changes suggest that recent climate changes, including global warming, may be altering the fundamental planetary system that regulates evaporation and precipitation and cycles freshwater around the globe. Th e study, led by Ruth Curry of the Woods Hole Oceanographic Institution (WHOI), provides direct evidence that the global water cycle is intensifying. Th is result is consistent with global warming hypotheses that suggest ocean evaporation will increase as Earth’s temperature does. By comparing recent and historical salinity observations, the investigators observed that surface waters in tropical and subtropical Atlantic Ocean regions have become markedly saltier. Simultaneously, much of the water column in the high latitudes of the North and South Atlantic became fresher. Th is trend appears to have accelerated in the years since 1990, when 10 of the warmest years occurred since records began in 1861. Th e scientists estimated that net evaporation rates over the tropical Atlantic have increased by 5 percent to 10 percent over the past four decades. Th ese fi ndings are particularly signifi cant as pressure on freshwater resources has become critical in many areas around the world. An acceleration of Earth’s global water cycle can potentially aff ect global precipitation patterns that govern the distribution, severity, and frequency of droughts, fl oods, and storms. It would also exacerbate global warming by rapidly adding more water vapor—itself a potent, heat-trapping greenhouse gas—to the atmosphere. And it could continue to freshen North Atlantic Ocean waters to a point that could disrupt ocean circulation and trigger further climate changes. Highlight ID: 8053/ Press Release 03-145 GEO/OCE
The polyps in this coral colony are partially bleached. Polyps on the top are completely clear, while those on the sides of the branched colony still have some coloration from their zooxanthellae. Credit: Mark Eakin, NOAA Coral Reef Watch

42

43
Ice has a signifi cant impact on global climate, infl uencing the amount of solar radiation refl ected back into space; the exchange of heat between the polar oceans and the atmosphere; the amount of freshwater entering the sea; and, indirectly, the strength of the global ocean’s overturning circulation.1 Snow and ice cover about 10 percent of the land surface of Earth, including virtually all the landmasses of Greenland and Antarctica, and seasonal sea ice spans much of the Arctic and Antarctic Circles during winter in each hemisphere.
Snow and ice factor into Earth’s climate in a number of important ways. Th e amount of land-based ice determines global sea level—the geological record shows that higher sea levels occurred during “greenhouse Earth” periods in the past. Th e refl ectivity, or albedo, of snow and ice introduces climate sensitivity, particularly in Earth’s polar regions; as ice disappears, less solar energy is refl ected away and more is absorbed, heating the surface, which causes the remaining ice to become more susceptible to melting. Ice also plays an important role in the circulation and currents of the world’s ocean, because the formation and melting of sea ice aff ects the temperature and salinity of the surrounding seawater, which are important factors driving global ocean circulation (see Sea section). Snow and ice at high elevations at temperate and even tropical latitudes aff ect local ecosystems and regulate local climate. Th roughout the world, human drinking water supplies depend on reliable and predictable patterns of glacial accumulation and thaw, which are threatened by alterations in global temperature and weather patterns. High-altitude glaciers around the world face uncertain futures. Th ey also serve as powerful visual illustrations of a changing climate, as historical photographs reveal the dramatic extent to which many of them have receded. In some cases, they’ve already disappeared.
1 NSF Highlight 1992: Understanding the Structure of Sea Ice.
ICE
Top image credit: Jeffrey Kietzmann, National Science Foundation
On September 14, 2007, Arctic sea ice reached a record minimum in recorded history. The 2001 sea ice minimum is shown on the right, for comparison. Credit: NASA/Goddard Space Flight Center Scientifi c Visualization Studio

44
Ice is disappearing around Earth’s poles as well. In 2007, satellite images confi rmed what was plain enough to the researchers and indigenous people on the ground: Arctic sea ice cover shrank to a record new low.
Because of the importance of ice to Earth’s climate, and because of its sensitivity to climate feedbacks, constant monitoring and observation is critical—both on the ground and from satellites. NSF’s contribution to ice research, particularly in the polar regions, has led to substantial advances in what we know about Earth’s changing ice and snow, and how those changes may lead to further changes.
Polar ResearchAntarcticaIn 2002, a sheet of ice equivalent in area to the state of Rhode Island caught scientists off guard as it broke off the Antarctic Peninsula and rapidly disintegrated into the Weddell Sea.2 Th e possibility of this type of event taking place on an even larger scale at other ice shelves around the continent is currently a topic of much study, and scientists are racing to understand the stability of land- and sea-based ice masses, in the hopes of better predicting their behavior.
Th e ecosystems of the Antarctic, particularly the marine ecosystems, provide us with compelling examples of the climatic changes already taking place.3 Some of the best evidence comes from the Adélie penguin, a species whose bones are preserved by the cold, dry climate characteristic of high-latitude Antarctica. Researchers are exploring this detailed record of the species’ response to habitat and environmental changes over the past 35,000 years to understand how the Adélies, and the ecosystem they inhabit, will respond to future climate changes.4
GreenlandUnderstanding the Greenland ice sheet is essential to predicting sea-level rise. Th ree main factors contribute to the amount of freshwater in the form of ice and snow that Greenland holds: precipitation, melting, and the fl ow of ice into the sea. In the past, Greenland’s ice sheet was in an equilibrium state in which the amount of annual accumulation of snow roughly equaled the amount of snow and ice lost to melting and ice fl ow. Th us, Greenland’s ice mass neither contributed to nor took away from the global sea level. In recent years, however, the amounts of melt water and frozen ice fl owing into the sea have increased substantially. Warmer temperatures have also led to increased precipitation (as warm air holds more moisture), but the increase in precipitation does not off set the amount now lost each year to melting and ice fl ow. Th us, the Greenland ice sheet is no longer in equilibrium, and it contributes annually to global sea-level rise, currently at a rate of about 0.5
2 http://nsidc.org/iceshelves/larsenb2002.html
3 See, for example, www.nsf.gov/od/opp/antarct/treaty/opp07001/organisms.jsp#Geographic.
4 Penguin Science Web site: www.penguinscience.com/clim_change.php.
A series of satellite images of the Antarctic Peninsula record the catastrophic breakup of a massive portion of the Larsen B Ice Shelf—an area larger than the state of Rhode Island—in 2002. The fi rst scene, from January 31, 2002, shows the shelf in late austral summer, with dark bluish melt ponds dotting its surface. In the next two scenes, minor retreat takes place, amounting to about 800 square kilometers (300 square miles), during which several of the melt ponds well away from the ice-front drain through new cracks in the shelf. The main collapse is seen in the last two scenes, on March 7 and 17th, with thousands of sliver icebergs and a large area of very fi nely divided icebergs where the shelf formerly lay. Brownish streaks within the fl oating chunks mark areas where rocks and morainal debris are exposed from the former underside and interior of the shelf. The last phases of the retreat totaled about 2,600 square kilometers (1,000 square miles). Credit: MODIS images from NASA’s Terra satellite supplied by Dr. Ted Scambos; National Snow and Ice Data Center, University of Colorado, Boulder

45
millimeters per year.5 In 2007, the melt area exceeded the previously set record by 10 percent. Th e edges of Greenland are experiencing the greatest amount of change, with record amounts of pooled melt water appearing in recent years.6
Earth’s polar regions are key to our understanding of the global climate system. As evidence continues to point to the poles as both drivers and harbingers of global climate change, NSF-funded researchers are accelerating their eff orts to collect data and perform research in these often inhospitable and remote areas. Polar regions off er unusual opportunities for environmental research because the polar ecosystem is sensitive to small changes in climate, rendering them important bellwethers for potential change, and because the polar regions provide information about how organisms—and the people whose livelihood and culture rely on them—adapt to environmental change.7 In the Arctic, average temperatures have risen at almost twice the rate as the rest of the world in the past few decades. Widespread melting of sea ice, glaciers, and permafrost provide dramatic evidence of the eff ects of rising temperatures across this region.8 Meanwhile, Antarctica contains some of the most poorly understood glaciers on the planet, and fi eld research in the Antarctic is vital to improving our ability to predict how rising temperatures will aff ect Earth’s most massive ice sheet.
NSF plays a central leadership role in coordinating U.S. Government research eff orts in the areas surrounding both poles. Th ese eff orts include some the most important climate change research currently being conducted. NSF provides interagency leadership for research planning, as directed by the Arctic Research Policy Act of 1984. Th e NSF director chairs the Interagency Arctic Research Policy Committee. In addition, per Presidential Decision Directive, NSF manages all U.S. activities in the Antarctic as a single, integrated program, making research in Antarctica possible for scientists supported by NSF and other U.S. mission agencies, including the National Aeronautics and Space Administration, the National Oceanic and Atmospheric Administration, the U.S. Geological Survey (USGS), and the Department of Energy.9 Th e U.S. Antarctic Program operates two icebreaking research ships—Laurence M. Gould and Nathaniel B. Palmer— between South America and the Antarctic Peninsula, in the Antarctic Peninsula region, and in the Ross Sea near McMurdo Station.10
International Polar YearTh e International Polar Year (IPY) 2007–2008, a worldwide scientifi c eff ort in which participating government agencies sponsor heightened activities in their polar research programs, aims to increase the public’s knowledge of and benefi t from research conducted at Earth’s northern and southernmost extremities. Th e “year” (which actually runs from March 1, 2007, to March 1, 2009) models three previous international science years.11 Th e fi rst IPY was held in 1882, with a follow-up 50 years later in 1932. Th e International Geophysical Year of 1957–1958 was modeled on the previous IPY programs.12 Each international year provided researchers with access to new scientifi c and
5 NSF FY 2008 Budget Request to Congress.
6 Steffen, Konrad, Briefing to Congress on Greenland ice sheet, September 2008.
7 NSF FY 2009 Budget Request to Congress.
8 ACIA, Impacts of a Warming Arctic: Arctic Climate Impact Assessment, Cambridge University Press, 2004, p. 8.
9 NSF FY 2008 Budget Request to Congress.
10 NSF Office of Polar Programs Antarctic Infrastructure and Logistics Web site: www.nsf.gov/od/opp/ail/index.jsp.
11 U.S. International Polar Year, History of International Polar Year: www.us-ipy.gov/history.shtml
12 National Academy of Sciences, The International Geophysical Year: www.nas.edu/history/igy.
Desert Research Institute scientist Kendrick Taylor stands in front of the snow pit wall at the West Antarctic Ice Sheet (WAIS) Divide Ice Core Project in Antarctica. The wall is part of a study of layers of ice thousands of years old. Credit: Desert Research Institute

46
physical frontiers, and added to human knowledge about the physical nature of the planet and its atmosphere. Polar year discoveries are not limited to the polar regions, but have also led to new insights into global climate, the amount of ice covering the planet, and many other physical processes. IPY projects include LARISSA (Larsen Ice Shelf System, Antarctica), an initiative to study the sudden environmental changes in the ice shelf system, and a fi eldwork project to increase understanding of Pine Island Glacier, the fastest fl owing glacier in Antarctica.
Polar Earth Observatory Network When it comes to massive ice sheets, one of the most diffi cult questions to answer is one of the most basic: How much ice is being lost? Th e loss rate is critical to modeling sea-level rise in the coming century. Obtaining an accurate number is complicated because the underlying crust is rising, making even the most precise satellite altimetry and gravity measurements unreliable. To correct this problem, scientists are deploying a network of global positioning system (GPS) receivers on exposed rock outcroppings across Antarctica and Greenland. Th ese devices will measure uplift directly and allow for corrections to the satellite results. In addition, the great sensitivity of the GPS devices will allow them to measure the tiny, springlike compressions and expansions of Earth’s crust that accompany yearly snowfall and ice loss. Overall, this project will allow researchers to measure interannual variations in ice sheet mass and develop more accurate models of ice accumulation and loss.
NSF-supported researchers are part of the international Polar Earth Observatory Network (POLENET) project, a consortium involving researchers from 28 nations who are engaging in fi eldwork to improve the collection of geophysical data around Earth’s poles. Th e project is a core activity of IPY 2007–2008. In the south, researchers are constructing a network of GPS and seismic stations in West Antarctica to understand how the mass of the West Antarctic ice sheet changes over time. Th e information will be used to predict sea-level rise accompanying global warming and to interpret climate change records. In the Arctic, another NSF-funded research team is constructing a network of 38 GPS stations in Greenland (GNET) to collect better data on ice sheets.13
Permanent NSF Antarctic Research Facilities Amundsen-Scott South Pole StationIn January 2008, NSF dedicated the Amundsen-Scott South Pole Station. Th e new elevated structure, a state-of-the-art research station, is larger and more sophisticated than any previous structure built at the bottom of the world. Th e station’s size and capabilities are a response to the ever-growing requirement for logistical support to carry out the range and quantity of research taking place at the South Pole, which includes some of the most sophisticated astronomical observations in the world. Th e remote location of the station makes it an ideal, pristine setting for researchers to study the atmosphere, with virtually no local emissions to obscure atmospheric readings. Atmospheric monitoring has taken place at the South Pole since the International Geophysical Year of 1957–1958, making it one of the longest continuous atmospheric records.14
13 POLENET Web site: www.polenet.org.
14 South Pole Station Special Report: www.nsf.gov/news/special_reports/livingsouthpole/sciencegoals.jsp.
Locations of POLENET seismic and GPS stations around the edge of Greenland.Key:Red Circle: Installed in year 1Orange circle: Installed in year 2Yellow circle: Installed in year 3Purple triangle: Existing site part of GNET (Greenland GPS sites)Credit: Terry Wilson and Mike Willis, The Ohio State University
The exterior of the newly completed Amundsen-Scott South Pole Station. Antarctica is the coldest, highest, driest, and windiest of the continents—and the least hospitable to human life. The South Pole Station provides shelter and lab facilities to researchers, including up to 48 who overwinter during the dark austral winter, with an additional 104 berths for summer researchers. Credit: National Science Foundation
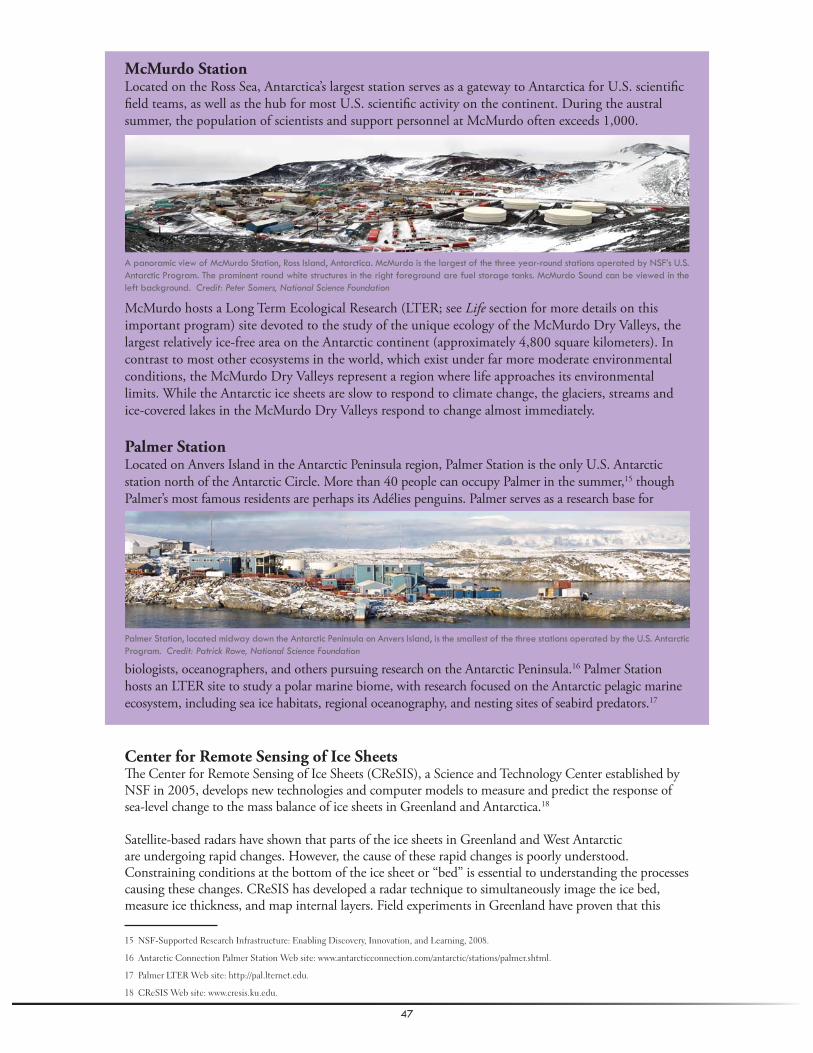
47
McMurdo StationLocated on the Ross Sea, Antarctica’s largest station serves as a gateway to Antarctica for U.S. scientifi c fi eld teams, as well as the hub for most U.S. scientifi c activity on the continent. During the austral summer, the population of scientists and support personnel at McMurdo often exceeds 1,000.
McMurdo hosts a Long Term Ecological Research (LTER; see Life section for more details on this important program) site devoted to the study of the unique ecology of the McMurdo Dry Valleys, the largest relatively ice-free area on the Antarctic continent (approximately 4,800 square kilometers). In contrast to most other ecosystems in the world, which exist under far more moderate environmental conditions, the McMurdo Dry Valleys represent a region where life approaches its environmental limits. While the Antarctic ice sheets are slow to respond to climate change, the glaciers, streams and ice-covered lakes in the McMurdo Dry Valleys respond to change almost immediately.
Palmer StationLocated on Anvers Island in the Antarctic Peninsula region, Palmer Station is the only U.S. Antarctic station north of the Antarctic Circle. More than 40 people can occupy Palmer in the summer,15 though Palmer’s most famous residents are perhaps its Adélies penguins. Palmer serves as a research base for
biologists, oceanographers, and others pursuing research on the Antarctic Peninsula.16 Palmer Station hosts an LTER site to study a polar marine biome, with research focused on the Antarctic pelagic marine ecosystem, including sea ice habitats, regional oceanography, and nesting sites of seabird predators.17
Center for Remote Sensing of Ice Sheets Th e Center for Remote Sensing of Ice Sheets (CReSIS), a Science and Technology Center established by NSF in 2005, develops new technologies and computer models to measure and predict the response of sea-level change to the mass balance of ice sheets in Greenland and Antarctica.18
Satellite-based radars have shown that parts of the ice sheets in Greenland and West Antarctic are undergoing rapid changes. However, the cause of these rapid changes is poorly understood. Constraining conditions at the bottom of the ice sheet or “bed” is essential to understanding the processes causing these changes. CReSIS has developed a radar technique to simultaneously image the ice bed, measure ice thickness, and map internal layers. Field experiments in Greenland have proven that this
15 NSF-Supported Research Infrastructure: Enabling Discovery, Innovation, and Learning, 2008.
16 Antarctic Connection Palmer Station Web site: www.antarcticconnection.com/antarctic/stations/palmer.shtml.
17 Palmer LTER Web site: http://pal.lternet.edu.
18 CReSIS Web site: www.cresis.ku.edu.
A panoramic view of McMurdo Station, Ross Island, Antarctica. McMurdo is the largest of the three year-round stations operated by NSF’s U.S. Antarctic Program. The prominent round white structures in the right foreground are fuel storage tanks. McMurdo Sound can be viewed in the left background. Credit: Peter Somers, National Science Foundation
Palmer Station, located midway down the Antarctic Peninsula on Anvers Island, is the smallest of the three stations operated by the U.S. Antarctic Program. Credit: Patrick Rowe, National Science Foundation

48
method can be used to measure ice thickness and characterize the underlying topography.19 CReSIS will continue to make detailed measurements of ice sheets in both Greenland and Antarctica to improve ice sheet models and allow glaciologists to make better forecasts of glacier behavior.
Earth’s snow and ice deposits have proven to be rich sources of climate information from our planet’s past. Glaciologists drill vertical cores deep into pristine ice layered like a birthday cake, the result of hard-packed snowfall accumulated over thousands of years. Th ese layers preserve a wealth of information about the atmospheric composition and temperature when the snow fi rst fell. In the polar regions, summer temperatures rarely exceed the freezing point of water, so the layers of snow are unperturbed by melting. Pockets of air among the snowfl akes are buried below new layers; they become tiny atmospheric time capsules, preserved as microscopic bubbles in the compressed ice. Researchers are continuing to fi nd new ways of extracting data about atmospheric composition, temperature, solar activity, volcanic eruptions, and other types of information from ice cores. In some regions of Antarctica and Greenland, ice has accumulated continuously for many millennia. Th e farther down scientists drill, the farther into the past they stretch the climate record. In one current NSF research project, researchers from Greenland and Antarctica are teamed up to drill ice cores from regions that experience similar snow accumulation.20 In Antarctica in particular, annual precipitation rates are generally low, limiting the amount of ice, and therefore climate information, contained in an annual layer. In West Antarctica, however, precipitation rates are higher than the continental average, and scientists have already drilled cores containing more detailed information about past climate from this area. Th e scientists hope not only to develop a higher resolution climate record for Antarctica, but to compare this climate record to similar Greenland cores in an eff ort to reveal the climate relationship of the opposite ends of Earth over the millennia.
International Trans AntarcticScientifi c Expedition Th e International Trans Antarctic Scientifi c Expedition (ITASE) collects and interprets a continent-wide array of environmental parameters assembled through the coordinated eff orts of scientists from 20 nations. Because of its
19 NSF Highlight 13663: Center for Remote Sensing of Ice Sheets.
20 WAIS Divide Science: www.waisdivide.unh.edu/science.
Rebecca Anderson of the Desert Research Institute examines a section of West Antarctic Ice Sheet (WAIS) Divide ice core recovered from a depth of 500 meters. The WAIS Divide, located near West Antarctica’s “ice divide” between the Amundsen and Ross seas, was chosen as a site for an ice core because of its smooth topography, ancient ice deposits, and relatively high accumulation rate. The WAIS Divide project will provide the Southern Hemisphere equivalent to a series of ice cores drilled in Greenland beginning in 1989 and will give researchers the opportunity to compare up to 80,000 years of regional climate trends between the two polar regions. Credit: Courtesy of Kendrick Taylor
When a glacier with its “toe in the water” thins, a larger fraction of its weight is supported by water, causing it to slide faster, calving more ice into the sea at the glacier terminus. Credit: Nicolle Rager Fuller, National Science Foundation
U.S. International Trans Antarctic Scientifi c Expedition (ITASE) crewmembers Steve Arcone and James Laatsch return from a snow-penetrating radar test mission around Byrd Surface Camp. Arcone pilots the snowmobile while Laatsch rides the Nansen sled. ITASE researchers overcome the remoteness of the Antarctic continent to collect important information on environmental and climate change. Credit: Dan Dixon, National Science Foundation

49
remoteness, Antarctica is an ideal location to monitor biogeochemical cycles and climate change at the local and global scales.21 ITASE is developing annually resolved, instrumentally calibrated records of climate over the past 200–1,000 years, including temperature, net ice mass balance, and atmospheric circulation and chemistry. Th e goal of ITASE is to develop a basis for understanding past, present, and future climate change over Antarctica and the adjacent Southern Ocean.22
National Ice Core Laboratory Th e U.S. National Ice Core Laboratory (NICL) is a facility—jointly supported by NSF, USGS, and the Department of the Interior—for storing, curating, and studying ice cores recovered from the polar regions. NICL provides scientists with the capability to conduct examinations and measurements on ice cores, and it preserves the integrity of these ice cores in a long-term repository for current and future investigations.23
Glaciologists study not only the climate record contained in glaciers but the movement and behavior of the glaciers themselves. In a warming world, the complex interactions among atmosphere, sea, land, and ice may have profound implications for the amount of ice that will exist in the future. Th e vast reserves of water frozen above sea level on Antarctica and Greenland have grown and shrunk during previous episodes of climate change. Researchers are intently focused on the behavior of the ice sheets in both regions, particularly because of unexpected recent accelerations in melting and ice sheet collapse events.
Arctic Observing NetworkTh e Arctic Observing Network (AON) is a new NSF-supported program that will encompass a system of atmospheric, land-based, and ocean-based observational capabilities, from ocean buoys to satellites. AON will enhance and expand our ability to monitor Arctic environmental conditions.
Data from AON will enable the U.S. Government initiative—the Study of Environmental Arctic Change (SEARCH)—to get a handle on the wide-ranging series of signifi cant and rapid changes occurring in the Arctic.
21 http://www2.umaine.edu/itase
22 NSF Highlight 11564: ITASE (International Trans Antarctic Scientific Expedition).
23 http://nicl.usgs.gov
Eric Cravens, assistant curator at the National Ice Core Lab (NICL), holds up a piece of ice taken from above Lake Vostok, a remote region of Antarctica. The NICL is a facility for storing, curating, and studying ice cores. The facility currently houses more than 14,000 meters of ice cores from 34 drill sites in Greenland, Antarctica, and high mountain glaciers in the western United States. Credit: Melanie Conner, National Science Foundation
The Arctic Observing Network (AON) encompasses a system of atmospheric, land-based, and ocean-based environmental monitoring capabilities—from ocean buoys to satellites—that will signifi cantly advance our observations of Arctic environmental conditions. Data from the AON will enable the interagency U.S. Government initiative—the Study of Environmental Arctic Change (SEARCH)—to gain an in-depth understanding of the wide-ranging and rapid changes that are occurring in the Arctic. Credit: Nicolle Rager Fuller, National Science Foundation

50
Th ese changes include, for example, increasing average annual surface air temperatures, decreasing summer sea ice extent and sea ice mass, changing ocean circulation, migrating tree lines and vegetation zones, thawing glacial ice masses and permafrost, and changing socioeconomic dynamics.
Permanent NSF Arctic Research Facilities:
Toolik Field StationTh e Toolik Field Station is part of the NSF-sponsored LTER network. Th e Toolik site enables researchers to study the ecology of one of Earth’s important ecosystems—the frozen tundra landscapes of the far north. Toolik recently opened for continuous winter fi eld study operations. While Arctic winters present signifi cant logistical challenges, winter operations are essential to enable new observations such as the overwinter carbon dioxide fl ux of the surrounding tundra ecosystem.24
Summit CampNSF supports Summit Camp, a scientifi c research station in Greenland. Th e camp, located at the peak of the Greenland ice sheet (the largest ice sheet in the Northern Hemisphere) enables year-round operations to study air-snow interactions, which are crucial for interpreting data from ice cores drilled in the area and elsewhere. Th e site has proven to be a nearly ideal location for studies of climate change and snow chemistry.25
BarrowIn Barrow, Alaska, NSF-funded researchers can take advantage of the laboratory facilities, researcher accommodations, and other research infrastructure of North America’s northernmost community. Research conducted in Barrow includes studies of atmospheric composition, Bering Sea marine environment changes, terrestrial-atmospheric fl uxes of greenhouse gases, permafrost melting, and many other topics. Th e scientifi c activities in Barrow also enrich the local economy and education system; researchers organize outreach programs for local students and include local people, including native Alaskans with cultural knowledge of the local ecosystems, in their research projects.
24 NSF Highlight 14637: Winter Research Capability at Toolik Field Station, Alaska.
25 NSF-Supported Research Infrastructure: Enabling Discovery, Innovation, and Learning, 2008.
Toolik Field Station in an April 2002 snowstorm. The station is located in the northern foothills of the Brooks Range in northern Alaska, on the southeast shore of Toolik Lake. This location affords access to three major geographic regions in Alaska: the Brooks Range, the Arctic Foothills, and the Arctic Coastal Plain. Credit: © 2002 James H. Barker and the Institute of Arctic Biology
The late evening Arctic summer sun illuminates Summit Greenland Environmental Observatory, NSF’s primary scientifi c station in Greenland. Credit: Peter West, National Science Foundation
A “Welcome to Barrow” sign in Point Barrow, Alaska (“America’s Northernmost City”). The Barrow Arctic Science Consortium is a nonprofi t group that coordinates the research activities of a variety of NSF-funded researchers studying climate change and other areas of research in and around Barrow. Credit: Anne M. Jensen, UIC Science

51
Continental Ice and Snow In addition to ice at the poles, seasonal snow cover and high-altitude ice and glaciers fi gure in global and regional climate. Ice cores drilled in glaciers outside the Arctic and Antarctic Circles can be compared with other climate proxy data to show how the climates of diff erent regions have correlated in the past. Researchers have determined that continental glaciers have been primarily involved in sea-level changes in the past, and much of the present rise in sea level may be attributable to glacial melt.26,27
And what about the climate eff ects of snow? In one example from an NSF-funded study, researchers found that seasonal snow cover can signifi cantly change the amount of solar energy absorbed by the ground. Th e researchers discovered an important link between the albedo of North American winter snow cover and climate model forecasts. Th rough the incorporation of a realistic snow albedo feedback into climate models, the researchers found that they could substantially improve the accuracy of long-timescale predictions.28
ConclusionSnow and ice are important infl uences in global climate. Earth’s polar regions are experiencing swift and dramatic changes as a result of global climate change, with melting permafrost and rapidly shrinking sea- and land-based ice sheets being some of the most visible changes. Th e ancient ice reserves on Antarctica and Greenland store accumulated climate data that can help us forecast Earth’s climate future; ironically, these stored records may be in danger of being lost because of the rapid warming, particularly in Greenland. Th e highlights that follow contain descriptions of some of the many research projects funded by NSF on snow and ice research. Many of the projects are connected with the IPY program and involve partnerships with researchers from around the world. Th ese research eff orts not only contribute to our current understanding of Earth’s ice and snow, they also provide critical fi eld experience and training for the next generation of glaciologists, paleoclimatologists, and geoscientists who will continue to monitor the cryosphere.
26 Solomon, S., et al., Technical Summary, in Climate Change 2007: The Physical Science Basis. Contribution of Working Group I to the Fourth Assess-ment Report of the Intergovernmental Panel on Climate Change, Cambridge University Press, 2007, p. 50.
27 News from the Field, “Glaciers and Ice Caps to Dominate Sea Level Rise This Century, Says CU-Boulder Study”: www.nsf.gov/news/news_summ.jsp?cntn_id=109810.
28 NSF Highlight 15790: Improving Climate Model Predictions Through a Surprising Link to Snow Cover Simulations.


53
International Trans Antarctic Scientifi c ExpeditionTh e International Trans Antarctic Scientifi c Expedition (ITASE) is a basis for understanding past, present, and future climate change over Antarctica and the adjacent Southern Ocean. ITASE, a 20-nation consortium, is developing a continent-wide array of annually resolved, instrumentally calibrated records of past climates (temperature, net mass-balance, atmospheric circulation, chemistry of the atmosphere, and forcing) covering the past 200–1,000 years. Th e initial phase of the U.S. contribution to ITASE (US ITASE) concentrated on West Antarctica. During the 2006–2008 austral fi eld seasons, US ITASE planned to extend its traverses into East Antarctica. Several key results have emerged from the West Antarctic phase of US ITASE.
Temperatures are still within the range of natural variability of the past 200 years, exclusive of the Antarctic Peninsula, and are closely associated with changes in major atmospheric circulation patterns. Mass balance variability is primarily controlled by surface/bed topography, with signifi cant variability in regions displaying large gradients in topography. Initial phases of the inland migration of marine air masses can be detected along the Amundsen Sea coast. A signifi cant portion of the natural variability in the strength of the westerlies surrounding Antarctica is attributed to decadal and longer scales of solar variability that aff ect the production of ozone and, as a consequence, the thermal gradient over Antarctica and the Southern Ocean. Highlight ID: 11564 OPP/ANT
Winter Research Capability at Toolik Field Station, AlaskaWinter lasts nearly three-quarters of the year in the Arctic, yet relatively few scientifi c studies have been carried out in the Arctic winter because of the signifi cant challenges of conducting scientifi c research in the extreme cold and dark. Even access to automated measures of environmental parameters has been limited owing to a lack of continuous power and communications at major fi eld sites. Recently, scientists have increasingly recognized the compelling need for winter studies, despite the logistical challenges. Important issues that can only be addressed by winter studies include (1) understanding the radiation balance in the winter and how it is changing, which is essential to understanding climate change in
the Arctic; (2) understanding the role of snow and ground temperatures in overwinter carbon and nitrogen cycling, which aff ects summer growth of vegetation and feedback of greenhouse gases to the atmosphere (one of the principal ways that the Arctic aff ects global climate); and (3) understanding how animals and plants survive extreme winter conditions and how these adaptations may constrain their response to changing environmental conditions. Although many biological processes are slower in the winter because of low temperatures, microbes, plants, and animals continue to be active through the long winter night, and their activities establish a legacy that aff ects summer processes. For example, overwinter decomposition by soil microbes sets the conditions for summer uptake of nutrients and growth by plants.
Crew member Betsy Youngman reels in the balloon while helping Markus Frey conduct atmospheric sampling experiments. The International Trans Antarctic Scientifi c Expedition (ITASE), under the leadership of Paul Mayewski, studies environmental change over the past 200 years. Credit: Dan Dixon, National Science Foundation
In early June, the covers for the Arctic Long Term Ecological Research (ARC LTER) greenhouse in the tall willow and birch shrub plot are rolled down. The greenhouses are used to increase the summer temperature for several ecosystems in near Toolik Field Station. The covers are rolled up again in mid-August. Credit: Jim Laundre, Arctic LTER

54
Th e University of Alaska’s Toolik Field Station (TFS) was open for continuous winter operations for the fi rst time in 2006–2007. Science conducted there the fi rst winter included studies of overwintering insects; studies of the patterns of snow accumulation and density behind snow fences and the eff ects on shrub mortality and overwinter carbon dioxide fl ux; winter meteorological measurements at a variety of newly established locations across the north slope; establishment of a snow-cover observation camera for long-term records of snow arrival and snowmelt; and studies of stream community ecology overwinter in unfrozen springs. Continuous relay and monitoring of existing meteorological stations operated by the Arctic Long Term Ecological Research Program were carried out. Baseline environmental observations were collected by TFS staff throughout the winter. Th ese studies will advance our understanding of winter processes and their legacies for the summer. Highlight ID: 14637 OPP/ARC
Improving Climate Model Predictions Th rough a Surprising Linkto Snow-Cover SimulationSee Atmosphere section.Highlight ID: 15790 GEO/ATM
Loss of Arctic Sea Ice Observed in 2007In September 2007, the extent of sea ice in the Arctic Ocean was 23 percent less than the previous record set in 2005. Results from an array of buoys, deployed as part of the Arctic Observing Network, showed an extraordinarily large amount of bottom melting in the Beaufort Sea associated with this retreat. Th is observation indicates that local melting of sea ice was largely the result of excess heat in the ocean’s surface waters, not excess heat in the atmosphere. A synthesis of satellite observations and weather forecast data is consistent with this conclusion. Th e conditions in the Beaufort Sea—more open water leading to more solar heat
absorbed, resulting in more melting and more open water—is a classic ice-albedo feedback signature. Understanding the nature of changes in the Arctic sea ice cover is vital, since it is an indicator and amplifi er of global climate change. Highlight ID: 15844 OPP/ARC
What Is Happening to the Antarctic Sea Ice Cover?We know that the area and thickness of the Arctic sea ice cover has been decreasing over the past few decades. What about the Antarctic? Th e media have been confused about why the Antarctic ice cover is not retreating in the same way as it is in the Arctic. Some reports have even suggested that increases of ice in areas of the Antarctic signal that global warming is a hoax. As in the Arctic, the Antarctic sea ice cover is aff ected by a complex combination of solar heating and atmospheric pressure patterns and ocean currents. Unlike the Arctic, until now at least, Antarctic sea ice largely disappears on a seasonal basis. Th e total amount of Antarctic
sea ice in a given year doesn’t seem to be changing dramatically, but there have been big changes in particular regions. Previous studies have shown pronounced contrasting trends in annual sea duration and monthly concentration in two regions of the Southern Ocean: decreases in the western
This image illustrates the record minimum sea ice in the Arctic Ocean, which occurred on September 14, 2007. Credit: NASA/Goddard Space Flight Center Scientifi c Visualization Studio
The Landsat Image Mosaic of Antarctica (LIMA). More than 1,000 Landsat satellite images were pieced together to construct LIMA. Credit: USGS/ NASA
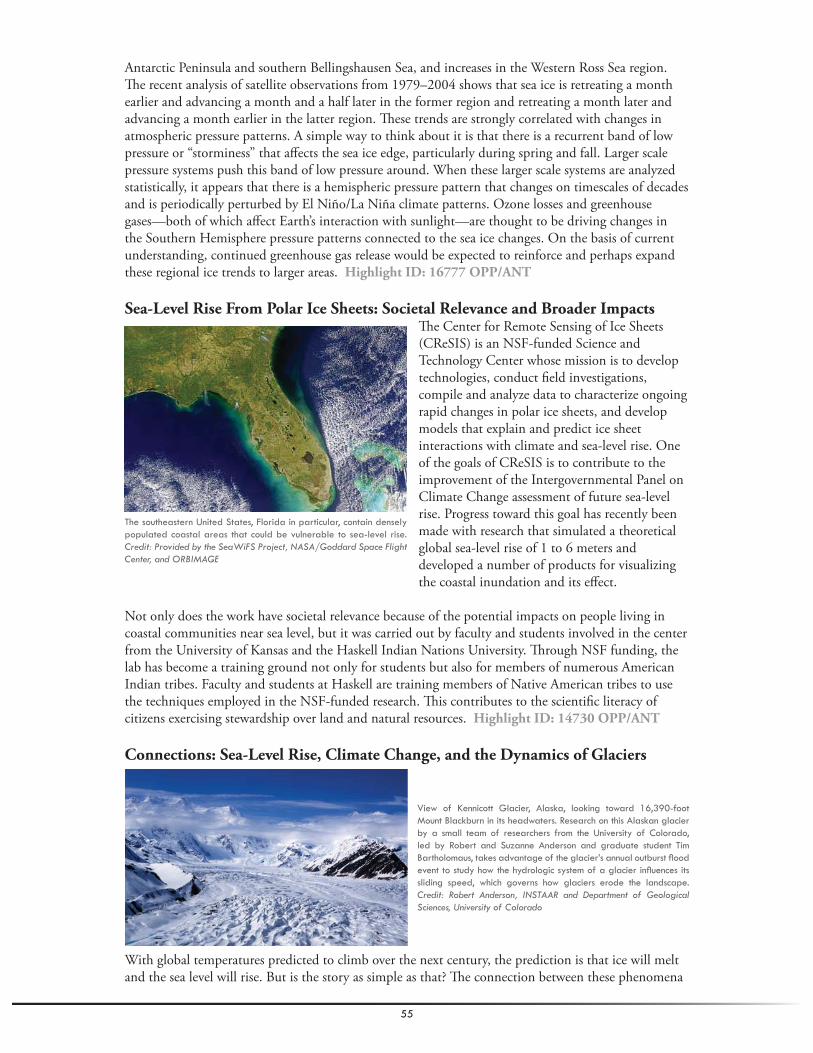
55
Antarctic Peninsula and southern Bellingshausen Sea, and increases in the Western Ross Sea region. Th e recent analysis of satellite observations from 1979–2004 shows that sea ice is retreating a month earlier and advancing a month and a half later in the former region and retreating a month later and advancing a month earlier in the latter region. Th ese trends are strongly correlated with changes in atmospheric pressure patterns. A simple way to think about it is that there is a recurrent band of low pressure or “storminess” that aff ects the sea ice edge, particularly during spring and fall. Larger scale pressure systems push this band of low pressure around. When these larger scale systems are analyzed statistically, it appears that there is a hemispheric pressure pattern that changes on timescales of decades and is periodically perturbed by El Niño/La Niña climate patterns. Ozone losses and greenhouse gases—both of which aff ect Earth’s interaction with sunlight—are thought to be driving changes in the Southern Hemisphere pressure patterns connected to the sea ice changes. On the basis of current understanding, continued greenhouse gas release would be expected to reinforce and perhaps expand these regional ice trends to larger areas. Highlight ID: 16777 OPP/ANT
Sea-Level Rise From Polar Ice Sheets: Societal Relevance and Broader ImpactsTh e Center for Remote Sensing of Ice Sheets (CReSIS) is an NSF-funded Science and Technology Center whose mission is to develop technologies, conduct fi eld investigations, compile and analyze data to characterize ongoing rapid changes in polar ice sheets, and develop models that explain and predict ice sheet interactions with climate and sea-level rise. One of the goals of CReSIS is to contribute to the improvement of the Intergovernmental Panel on Climate Change assessment of future sea-level rise. Progress toward this goal has recently been made with research that simulated a theoretical global sea-level rise of 1 to 6 meters and developed a number of products for visualizing the coastal inundation and its eff ect.
Not only does the work have societal relevance because of the potential impacts on people living in coastal communities near sea level, but it was carried out by faculty and students involved in the center from the University of Kansas and the Haskell Indian Nations University. Th rough NSF funding, the lab has become a training ground not only for students but also for members of numerous American Indian tribes. Faculty and students at Haskell are training members of Native American tribes to use the techniques employed in the NSF-funded research. Th is contributes to the scientifi c literacy of citizens exercising stewardship over land and natural resources. Highlight ID: 14730 OPP/ANT
Connections: Sea-Level Rise, Climate Change, and the Dynamics of Glaciers
With global temperatures predicted to climb over the next century, the prediction is that ice will melt and the sea level will rise. But is the story as simple as that? Th e connection between these phenomena
The southeastern United States, Florida in particular, contain densely populated coastal areas that could be vulnerable to sea-level rise. Credit: Provided by the SeaWiFS Project, NASA/Goddard Space Flight Center, and ORBIMAGE
View of Kennicott Glacier, Alaska, looking toward 16,390-foot Mount Blackburn in its headwaters. Research on this Alaskan glacier by a small team of researchers from the University of Colorado, led by Robert and Suzanne Anderson and graduate student Tim Bartholomaus, takes advantage of the glacier’s annual outburst fl ood event to study how the hydrologic system of a glacier infl uences its sliding speed, which governs how glaciers erode the landscape. Credit: Robert Anderson, INSTAAR and Department of Geological Sciences, University of Colorado
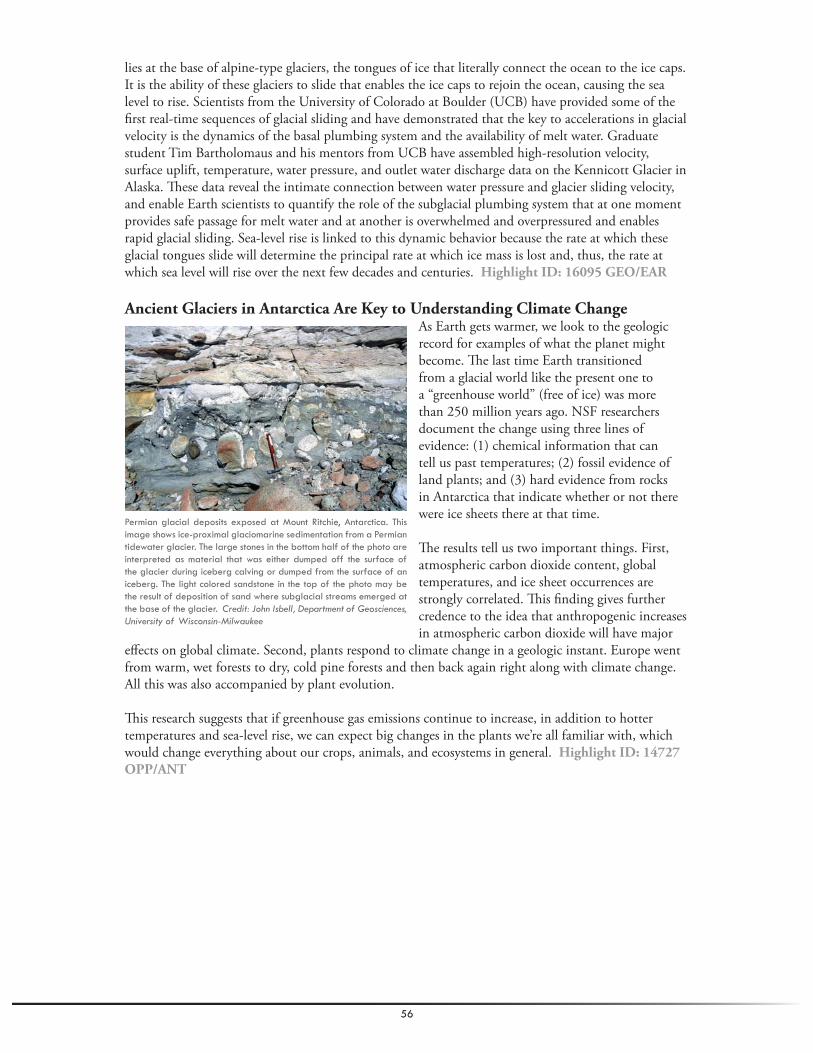
56
lies at the base of alpine-type glaciers, the tongues of ice that literally connect the ocean to the ice caps. It is the ability of these glaciers to slide that enables the ice caps to rejoin the ocean, causing the sea level to rise. Scientists from the University of Colorado at Boulder (UCB) have provided some of the fi rst real-time sequences of glacial sliding and have demonstrated that the key to accelerations in glacial velocity is the dynamics of the basal plumbing system and the availability of melt water. Graduate student Tim Bartholomaus and his mentors from UCB have assembled high-resolution velocity, surface uplift, temperature, water pressure, and outlet water discharge data on the Kennicott Glacier in Alaska. Th ese data reveal the intimate connection between water pressure and glacier sliding velocity, and enable Earth scientists to quantify the role of the subglacial plumbing system that at one moment provides safe passage for melt water and at another is overwhelmed and overpressured and enables rapid glacial sliding. Sea-level rise is linked to this dynamic behavior because the rate at which these glacial tongues slide will determine the principal rate at which ice mass is lost and, thus, the rate at which sea level will rise over the next few decades and centuries. Highlight ID: 16095 GEO/EAR
Ancient Glaciers in Antarctica Are Key to Understanding Climate ChangeAs Earth gets warmer, we look to the geologic record for examples of what the planet might become. Th e last time Earth transitioned from a glacial world like the present one to a “greenhouse world” (free of ice) was more than 250 million years ago. NSF researchers document the change using three lines of evidence: (1) chemical information that can tell us past temperatures; (2) fossil evidence of land plants; and (3) hard evidence from rocks in Antarctica that indicate whether or not there were ice sheets there at that time.
Th e results tell us two important things. First, atmospheric carbon dioxide content, global temperatures, and ice sheet occurrences are strongly correlated. Th is fi nding gives further credence to the idea that anthropogenic increases in atmospheric carbon dioxide will have major
eff ects on global climate. Second, plants respond to climate change in a geologic instant. Europe went from warm, wet forests to dry, cold pine forests and then back again right along with climate change. All this was also accompanied by plant evolution.
Th is research suggests that if greenhouse gas emissions continue to increase, in addition to hotter temperatures and sea-level rise, we can expect big changes in the plants we’re all familiar with, which would change everything about our crops, animals, and ecosystems in general. Highlight ID: 14727 OPP/ANT
Permian glacial deposits exposed at Mount Ritchie, Antarctica. This image shows ice-proximal glaciomarine sedimentation from a Permian tidewater glacier. The large stones in the bottom half of the photo are interpreted as material that was either dumped off the surface of the glacier during iceberg calving or dumped from the surface of an iceberg. The light colored sandstone in the top of the photo may be the result of deposition of sand where subglacial streams emerged at the base of the glacier. Credit: John Isbell, Department of Geosciences, University of Wisconsin-Milwaukee
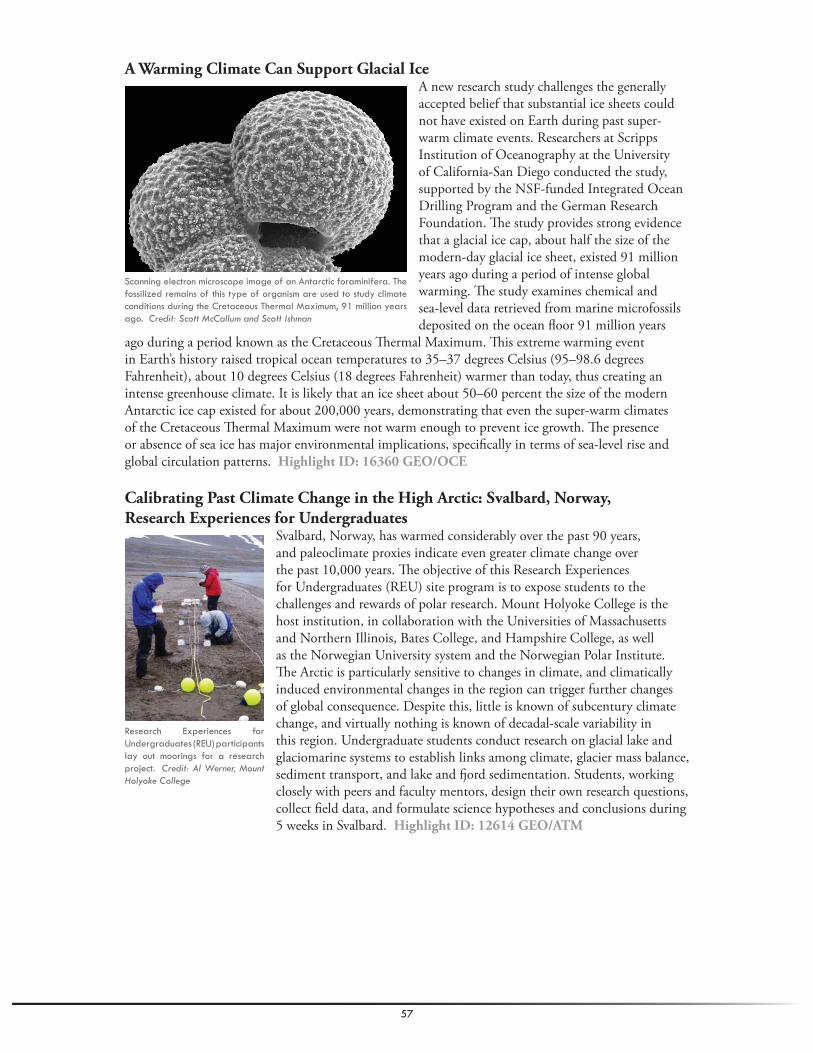
57
A Warming Climate Can Support Glacial IceA new research study challenges the generally accepted belief that substantial ice sheets could not have existed on Earth during past super-warm climate events. Researchers at Scripps Institution of Oceanography at the University of California-San Diego conducted the study, supported by the NSF-funded Integrated Ocean Drilling Program and the German Research Foundation. Th e study provides strong evidence that a glacial ice cap, about half the size of the modern-day glacial ice sheet, existed 91 million years ago during a period of intense global warming. Th e study examines chemical and sea-level data retrieved from marine microfossils deposited on the ocean fl oor 91 million years
ago during a period known as the Cretaceous Th ermal Maximum. Th is extreme warming event in Earth’s history raised tropical ocean temperatures to 35–37 degrees Celsius (95–98.6 degrees Fahrenheit), about 10 degrees Celsius (18 degrees Fahrenheit) warmer than today, thus creating an intense greenhouse climate. It is likely that an ice sheet about 50–60 percent the size of the modern Antarctic ice cap existed for about 200,000 years, demonstrating that even the super-warm climates of the Cretaceous Th ermal Maximum were not warm enough to prevent ice growth. Th e presence or absence of sea ice has major environmental implications, specifi cally in terms of sea-level rise and global circulation patterns. Highlight ID: 16360 GEO/OCE
Calibrating Past Climate Change in the High Arctic: Svalbard, Norway,Research Experiences for Undergraduates
Svalbard, Norway, has warmed considerably over the past 90 years, and paleoclimate proxies indicate even greater climate change over the past 10,000 years. Th e objective of this Research Experiences for Undergraduates (REU) site program is to expose students to the challenges and rewards of polar research. Mount Holyoke College is the host institution, in collaboration with the Universities of Massachusetts and Northern Illinois, Bates College, and Hampshire College, as well as the Norwegian University system and the Norwegian Polar Institute. Th e Arctic is particularly sensitive to changes in climate, and climatically induced environmental changes in the region can trigger further changes of global consequence. Despite this, little is known of subcentury climate change, and virtually nothing is known of decadal-scale variability in this region. Undergraduate students conduct research on glacial lake and glaciomarine systems to establish links among climate, glacier mass balance, sediment transport, and lake and fj ord sedimentation. Students, working closely with peers and faculty mentors, design their own research questions, collect fi eld data, and formulate science hypotheses and conclusions during 5 weeks in Svalbard. Highlight ID: 12614 GEO/ATM
Scanning electron microscope image of an Antarctic foraminifera. The fossilized remains of this type of organism are used to study climate conditions during the Cretaceous Thermal Maximum, 91 million years ago. Credit: Scott McCallum and Scott Ishman
Research Experiences for Undergraduates (REU) participants lay out moorings for a research project. Credit: Al Werner, Mount Holyoke College

58
Novel Ice Core Drill Reveals Pacifi c Northwest’s Climate PastSome of the glaciers that hold the most promise for revealing Earth’s climatic past are found in the most remote places. Eric Steig and Doug Clark took advantage of NSF’s Small Grants for Exploratory Research program to develop an ice drill that is lighter and thus more portable than current drilling equipment. Th e team used this novel ice drill to recover an unprecedented ice core from an alpine glacier atop Mt. Waddington in the British Columbia Coast Range. Th e ice core revealed a record of the region’s climate stretching more than 1,000 years into the past. Th e record included annual layers of atmospheric aerosols, such as soot and dust, preserved in the ice.
Annual snow accumulation records are useful quantitative indicators of large-scale atmospheric circulation patterns. Snow accumulation records from the North Pacifi c region are of particular interest because of their potential to contribute to the documentation and reconstruction of multidecadal climate variability.
Paleoclimate research is cross-disciplinary by nature and requires a multidisciplinary scientifi c strategy that integrates geology, biology, oceanography, chemistry, physics, and engineering to collect data and solve complex problems. Interpreting paleoclimatic data encourages a holistic approach to thinking about natural systems. At present, much paleoclimate research from ice cores is conducted from large base stations in polar regions. Th is new equipment and the recovered ice core help open up a new archive of paleoclimate data for use by climate researchers. Highlight ID: 16324 GEO/ATM
Studying Past Changes in Arctic FossilsTo understand the modern Arctic system, its current unprecedented change, and its future requires a long-term perspective on the natural variability intrinsic to the system. Because observational records of the Arctic are relatively brief, we must depend on proxy records for this perspective. Th is work is part of a larger NSF-sponsored project to obtain and synthesize climatic data from the Arctic over the past 2,000 years. Researchers are currently using assemblages of aquatic insect fossils from lake sediments to reconstruct past temperatures on Baffi n Island, in the eastern Canadian Arctic, that will eventually be combined with many other similar records from across the Arctic to generate a broad understanding of past temperatures. Th is work contributes to understanding the Arctic system by placing 20th century climate change into a long-term context of interdecadal climatic variability spanning 2,000 years. Highlight ID: 13785 OD/OCI
Driller Bella Bergeron (left, Ice Coring and Drilling Services) and Eric Steig (right, University of Washington) prepare to lower a 3-inch thermal core barrel into the glacier at Combatant Col, British Columbia Coast Range (July 22, 2006). The mountain in the background is Mount Waddington, the tallest peak in the Coast Range. Combatant Col is fi lled with a large, fl at glacier that is about 200 meters (around 650 feet) deep. Because of its unusual thickness and altitude, Combatant Col is one of the best sites in western Canada to collect a deep ice core that records past climate changes in the region. Credit: Douglas H. Clark, Geology Department, Western Washington University

59
Abrupt Ice Retreat Could Produce Ice-Free Arctic Summers by 2040Th e recent retreat of Arctic sea ice is likely to accelerate so rapidly that the Arctic Ocean could become nearly devoid of ice during summertime as early as 2040, according to a study by a team of scientists from the National Center for Atmospheric Research (NCAR), the University of Washington, and McGill University. Th e team analyzed the impact of greenhouse gas emissions on the Arctic. Scenarios run on supercomputers showed that the extent of sea ice each September could be reduced so abruptly that, within about 20 years, it may begin retreating four times faster than at any time in the observed record.
Arctic sea ice has retreated in recent years, especially in the late summer, when ice thickness and area are at a minimum. To analyze how global warming will aff ect the ice in coming decades, the team studied a series of seven simulations run on the NCAR-based Community Climate System Model (CCSM), one of the world’s leading tools for studying climate change. Having fi rst tested the model to show that it closely matched observations of ice cover since 1870, the team simulated future conditions. Th e model results indicated that if greenhouse gases continue to build up in the atmosphere at the current rate, the Arctic’s future ice cover will go through periods of relative stability followed by abrupt retreat. Th e research pointed to several reasons for the abrupt loss of ice in a gradually warming world. Open water absorbs more sunlight than does ice, meaning that the growing regions of ice-free water will accelerate the warming trend. In addition, global climate change is expected to infl uence ocean circulations and drive warmer ocean currents into the Arctic. Highlight ID: 14113 GEO/ATM
Antarctic Temperature Changes, 1958–2002Th is project is the fi rst to make a realistic estimate of Antarctic climate change through a quantitative trend assessment of observed surface temperatures in Antarctica since the International Geophysical Year in 1957. While Antarctic temperature changes have potentially major consequences for the global system, the large area and the highly heterogeneous network of surface stations in Antarctica had previously limited quantitative studies and had led to a mix of results reported to the public.
Using temperature time series from 21 Antarctic manned observing sites and 73 automated weather stations for which the record exceeded 2 years, together with cooperative ship reports from the surrounding oceans, the investigators produced an Antarctic temperature trend assessment that makes optimum use of the available information and is technically justifi ed by the demonstrable statistical properties of the data.
Th e most prominent feature in the linear trends of annual surface air temperature for the period 1958–2002 is the signifi cant warming over the Antarctic Peninsula. Other characteristics are slight warming in coastal Antarctica and actual cooling over regions of central Antarctica and parts of the Southern Ocean. Th e Antarctic Peninsula warming is strongest in autumn and winter but is apparent in all seasons. Results of the research are available at http://igloo.atmos.uiuc.edu/ANTARCTIC. Highlight ID: 12271 OPP/ANT
Arctic Cetaceans: Indicators of Climate ChangeKristin Laidre was supported for 22 months by a fellowship under the International Research Fellowship Program (IRFP) at the Greenland Institute of Natural Resources in Nuuk, Greenland. Th e IRFP is designed to launch young U.S. postdoctoral scientists and engineers into global engagement.
By about 2040, the Arctic may be nearly devoid of sea ice during the late summer unless greenhouse gas emissions are signifi cantly curtailed. Credit: © University Corporation for Atmospheric Research

60
Laidre’s research addresses questions concerning the vulnerability of Arctic cetaceans to climate change. Th e Arctic is currently experiencing dramatic changes in sea ice characteristics and marine productivity, which will have cascading eff ects on Arctic food webs. Th ree species of cetaceans (narwhal, beluga, and bowhead whale) inhabit the Arctic waters of West Greenland and are ideal indicator organisms for monitoring ongoing biophysical changes aff ected by a warming climate. Arctic cetaceans’ seasonal movements, distribution, resource selection, and life history parameters are tightly linked with changes in the Arctic environment, making them both vulnerable to climate alterations and good indicators of cumulative changes.
Th e main purpose of the project has been to contrast Arctic species inhabiting diff erent ecological niches with diff erent life history strategies to support broader inferences regarding the eff ects of climate change in diff erent habitats of the High Arctic. Laidre has quantifi ed the trends in sea ice and primary production in focal areas using satellite telemetry data on whale movements and diving behavior and remotely sensed environmental data. Th is information has been used to examine resource selection and diff erential vulnerability using quantitative spatial modeling techniques. Results of this work have facilitated the understanding of the potential eff ects of climate change on High Arctic top predators and the sustainability of their exploitation by Inuit communities, linking scientifi c discovery to societal benefi t.
Th e host institute—the Greenland Institute of Natural Resources (GINR) in Nuuk, Greenland—is the Greenland Home Rule Government’s center for nature research focusing on conservation, climate change and human impacts, biological diversity, and sustainable use of living resources. Laidre has collaborated with senior scientist Mads Peter Heide-Jørgensen at GINR.
In addition to several peer-reviewed scientifi c manuscripts and a popular book published during the fellowship, Laidre’s research has extended into an international review paper and a quantitative index developed by several top Arctic ecologists to rank the vulnerability of Arctic marine mammals to climate change. Th e international collaborative relationships Laidre formed in Denmark, Greenland, and elsewhere in Europe while on fellowship there, have been critical in her professional development and scientifi c progress. Her work has elucidated broad cetacean resource selection relationships and documented biocomplexity associated with changing climate. Highlight ID: 12092 OD/OISE

61
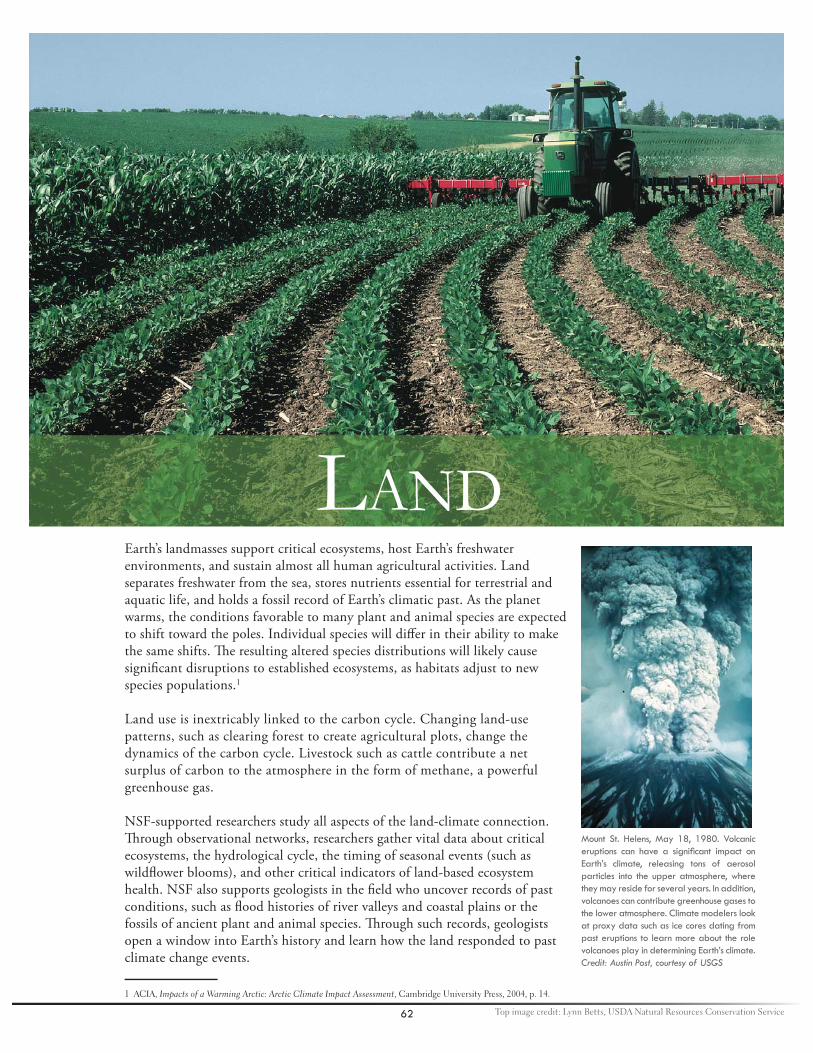
62
Earth’s landmasses support critical ecosystems, host Earth’s freshwater environments, and sustain almost all human agricultural activities. Land separates freshwater from the sea, stores nutrients essential for terrestrial and aquatic life, and holds a fossil record of Earth’s climatic past. As the planet warms, the conditions favorable to many plant and animal species are expected to shift toward the poles. Individual species will diff er in their ability to make the same shifts. Th e resulting altered species distributions will likely cause signifi cant disruptions to established ecosystems, as habitats adjust to new species populations.1
Land use is inextricably linked to the carbon cycle. Changing land-use patterns, such as clearing forest to create agricultural plots, change the dynamics of the carbon cycle. Livestock such as cattle contribute a net surplus of carbon to the atmosphere in the form of methane, a powerful greenhouse gas.
NSF-supported researchers study all aspects of the land-climate connection. Th rough observational networks, researchers gather vital data about critical ecosystems, the hydrological cycle, the timing of seasonal events (such as wildfl ower blooms), and other critical indicators of land-based ecosystem health. NSF also supports geologists in the fi eld who uncover records of past conditions, such as fl ood histories of river valleys and coastal plains or the fossils of ancient plant and animal species. Th rough such records, geologists open a window into Earth’s history and learn how the land responded to past climate change events.
1 ACIA, Impacts of a Warming Arctic: Arctic Climate Impact Assessment, Cambridge University Press, 2004, p. 14.
LAND
Top image credit: Lynn Betts, USDA Natural Resources Conservation Service
Mount St. Helens, May 18, 1980. Volcanic eruptions can have a signifi cant impact on Earth’s climate, releasing tons of aerosol particles into the upper atmosphere, where they may reside for several years. In addition, volcanoes can contribute greenhouse gases to the lower atmosphere. Climate modelers look at proxy data such as ice cores dating from past eruptions to learn more about the role volcanoes play in determining Earth’s climate. Credit: Austin Post, courtesy of USGS

63
Sea LevelTh e volume of the ocean depends on its temperature (an increase in temperature causes water to expand) and the amount of liquid water on Earth. Warming resulting from the greenhouse eff ect causes sea-level rise because of thermal expansion and melting of land-based ice pack. Melting sea ice does not change sea level, because fl oating ice displaces the same volume of water that it contains.
Sea level is particularly relevant to land-based life and the people living near land’s end. From 1961 to 2003, the average rate of global mean sea-level rise is estimated to be about 1.8 millimeters per year.2 By looking at the geological record of past sea level and comparing that record to tree ring data and ice and sediment cores, researchers are learning what events trigger changes in global sea level. In one NSF-funded study, geologists found that in the last 100 million years, sea-level changes have been dominated by growth and melting of continental ice (glaciers).3
Climate Change in the Geological RecordTh e fossil record contains evidence of how Earth responded to past climate changes. Th e locations of fossils show where particular species were found during what era, giving scientists an idea of how modern species might adapt to present-day global warming. NSF-funded researchers have uncovered evidence of rapid changes in the geographic distribution of plant species in response to past periods of rapid global warming. Fossil evidence reveals patterns of intra- and intercontinental migration of both plants and animals during the Palocene-Eocene Th ermal Maximum, one of Earth’s most signifi cant periods of climate change, which occurred 55 million years ago.4
Th e fossilized leaves of plants from previous periods of global warming discovered in Wyoming suggest that insect damage to plants increases with rising temperature, which researchers attribute to the northward migration of voracious tropical insect species. Th is past migratory pattern provides important evidence about the behavior of insects during climate warming, which could have important implications for modern-day agricultural crops and ecosystems.5
Center for Sustainability of Semi-Arid Hydrology and Riparian AreasTh e Center for Sustainability of Semi-Arid Hydrology and Riparian Areas (SAHRA), an NSF Science and Technology Center (STC), furnishes new knowledge to elected offi cials, water managers, and policy experts to augment their ability to improve the sustainability of water resources in the United States and around the world. Two river basins—the Rio Grande/Rio Bravo river basin and Arizona’s Upper San Pedro river basin—are the primary geographic focus of center researchers. Center scientists are working to understand the impacts of human population centers and agricultural activities, as well as emerging issues such as water markets and water banking.6 Th e team has developed a model for a water-trading market by coupling a hydrological model that forecasts total water availability in a given year with an economic model that forecasts water demand by the various users. Th e model supports an open-market trading system, in which buyers and sellers declare bids and off ers and make trades.7
2 Solomon, S., et al., Technical Summary, in Climate Change 2007: The Physical Science Basis. Contribution of Working Group I to the Fourth Assess-ment Report of the Intergovernmental Panel on Climate Change, Cambridge University Press, 2007, p. 48.
3 NSF Highlight 11873: Global Sea Level Changes in the Last 500 Million Years.
4 NSF Highlight 11451: Mississippi to Montana: Plants Danced to Climate’s Quick Tune.
5 NSF Highlight 16576: Fossil Record Suggests Insect Assaults on Foliage May Increase with Warming Globe.
6 NSF-Supported Research Infrastructure: Enabling Discovery, Innovation, and Learning, 2008.
7 NSF Highlight 13962: Water Trading.
Students participating in the NSF-sponsored Science and Technology Center for Sustainability of Semi-Arid Hydrology and Riparian Areas (SAHRA) measure evaporation rates in Patagonia, Arizona. SAHRA was established to develop an integrated, multidisciplinary understanding of the hydrology of semi-arid regions and to build partnerships with a broad spectrum of stakeholders, both public agencies and private organizations. Credit: Jonathan Petti, SAHRA, University of Arizona, Tucson

64
Caves hold some of the highest-resolution climate records available. Cave formations called speleothems are formed from minerals dissolved in water that seeps into caves from the surrounding bedrock. Often, speleothems grow continuously over time, with annual layers of mineral deposits similar to tree rings. Recently, NSF-supported research uncovered a pristine 130,000-year-old record from cave formations in Crevice Cave, Missouri. Th e cave recorded changes in mid-continent climate, global climate variability, and vegetation changes during interglacial-glacial cycles. Th e researchers are presently analyzing samples from the cave to produce a climate record that will improve our knowledge of climate variability in North America. Th is climate record will be a valuable companion to other paleoclimate records.8
FreshwaterEarth’s landmasses host the vast majority of the world’s freshwater, most of which is locked away in the vast ice sheets of Antarctica and Greenland. Th e remaining freshwater—in lakes, ponds, streams, rivers, groundwater, and glaciers—is the primary source of human drinking water.
Warming temperatures cause glacial water reserves to melt, precipitation patterns to change, and water in lakes and reservoirs to evaporate at a higher rate. Hence, climate change has the potential to cause serious disruptions to the drinking water supply. Th e ecosystems that rely on these water sources will also be aff ected. NSF-funded researchers study the eff ects a changing hydrological cycle will have on the human and natural systems that rely on freshwater systems.
Arctic TundraArctic tundra accounts for approximately 5 million square kilometers of Earth’s surface. Because its frozen temperatures largely prevent the decomposition process of organic matter, the Arctic tundra is a major storage sink of carbon. NSF-funded researchers are working to understand how tundra will respond to warming temperatures, including how much methane and carbon dioxide (CO2) a thawing tundra will release.
ForestsRoughly 42 million square kilometers of forest cover Earth, encompassing nearly a third of the planet’s total land area. Th e expansion of forests removes CO2 from the atmosphere, lowering greenhouse gas concentrations. Forests also absorb solar energy, which can increase local temperatures, particularly in boreal (northern) forests, where warming may have a greater eff ect on climate than the removal of CO2.
9 All vegetation pumps moisture into the atmosphere, cooling the local land but at the same time contributing to complex atmospheric processes. Th e teeming life of forests and the physical structures containing it are in continuous fl ux with incoming solar energy, the atmosphere, the water cycle, and the carbon cycle in addition to the infl uences of human activities. Th ese complex relationships both add to and subtract from the equations that dictate the warming of the planet.10
Boreal forests are expected to advance northward, and more productive vegetation will add to carbon uptake, although it is still unclear how much carbon could be released through the thawing of tundra and subsequent decay of previously frozen organic material. Where suitable soils are present, agriculture is expected to expand northward in response to a longer, warmer growing season.11
8 NSF Highlight 12612: Cave Deposits As Archives of Earth’s Past Climate.
9 Bonan, G. B., Science 320 (2008): 1444.
10 NSF press release 08-102: www.nsf.gov/news/news_summ.jsp?cntn_id=111694.
11 ACIA, Impacts of a Warming Arctic: Arctic Climate Impact Assessment, Cambridge University Press, 2004, p.10
Forests play an integral role in Earth’s climate. Tropical, temperate, and boreal forests contribute both cooling and warming effects to the local climate in varying degrees that depend on the forest’s characteristics. Forests absorb carbon dioxide through photosynthesis and cool the atmosphere through evaporation and transpiration. Some forests, such as boreal forests found at northern latitudes, are darker than the surrounding terrain and absorb more of the Sun’s energy, which can lead to increased warming. Credit: Nicolle Rager Fuller, National Science Foundation
Melting of the Arctic permafrost appears to threaten Siberian lakes. Credit: Karen Frey, University of California, Los Angeles

65
Critical Zone ObservatoriesTo better understand land’s “critical zone”—the region between the top of the forest canopy and the base of unweathered rock—and its response to climate and land-use changes, NSF created a Critical Zone Observatory (CZO) network. Th e CZO network represents the fi rst set of systems-based observatories dedicated to land surface processes, which include the water cycle, the breakdown of rocks and formation of soil, the geochemical and physical erosion of that soil, the evolution of rivers and valleys, and patterns of vegetation. CZO scientists are investigating the integration and coupling of these processes and how they are aff ected by the presence and fl ux of freshwater. Th e CZOs will use fi eld and analytical research methods, space-based remote sensing, and theoretical techniques.
Th e three CZOs are located in watersheds in the Sierra Nevada, the Front Range of the Colorado Rockies, and the Appalachian Uplands. Th ese projects add to the environmental sensor networks in place or planned by NSF, including the National Ecological Observatory Network and the Ocean Observatories Initiative network.12
Global Lake Ecological Observatory NetworkTh e Global Lake Ecological Observatory Network (GLEON), an international ecological collaboration, is advancing our understanding of lakes’ roles in the global carbon balance. Researchers from the United States are collaborating with international scientists to form a network of sensors deployed on lakes to gather data on metabolism and nutrient cycling. Using advanced cyberinfrastructure, data from this international observatory will provide information on key lake processes and functions that are aff ected by climate and land-use change.
Th e GLEON collaboration now has 22 members from nine participating countries, with plans to further extend the network. Th e expanded version will further test data delivery procedures that bring information from sensors to publicly accessible databases.13
ConclusionEarth’s landmasses host some of the planet’s most important habitats, including our own. Researchers are working to understand how global climate change will aff ect land-based precipitation patterns and ecosystems, particularly in areas where water is already scarce and in areas of high human population density. Land-based climate records, such as those found in freshwater pond and lake sediments and in caves, give researchers information about how climate has changed at diff erent locations over the ages. Th e land also contains information about sea levels during past periods of global warming; these data points can help climate modelers create more accurate projections of future sea levels. Th e following research highlights describe some of the many projects funded by NSF on land research. Th is research not only contributes to our understanding of Earth’s past and present climate, it also provides the opportunity for the next generation of paleoclimatologists, ecologists, and climate modelers to gain valuable hands-on training.
12 NSF press release 07-178: www.nsf.gov/news/news_summ.jsp?cntn_id=110586.
13 NSF Highlight 16514: Global Lake Ecological Observatory Network (GLEON) Expands Partnerships Both in the U.S. and Abroad to Advance the Scale of Lake Research.
NSF has awarded grants to three Critical Zone Observatories to allow scientists to gain a greater understanding of environmental processes at Earth’s surface. With sophisticated monitoring equipment—including satellite transceivers, stream and air chemical sensors, and weather stations—researchers are learning more about watersheds and their environments. Credit: Roger Bales, University of California, Merced
Jim Coloso, an undergraduate researcher from the University of Wisconsin, Madison, positions a buoy in Trout Bog Lake, one of the monitoring sites of the Global Lake Ecological Observing Network (GLEON). GLEON is an international effort aimed at improving our understanding of ecological processes in the world’s freshwater lakes. Credit: Tim Kratz

66
Global Sea-Level Changes in the Last 500 Million YearsChanges in global sea level can be a consequence of changes in the volume of water in the ocean or changes in the volume of the ocean basins themselves. Changes in seawater volume are primarily caused by a change in water temperature or the growth or melting of glaciers. Changes in volume of ocean basins are caused by changes in the amount of sediments carried to the oceans and underwater volcanic activity.
Recently, researchers from Rutgers University reviewed global sea-level changes from the past 543 million years using oxygen isotopes, a sensitive indicator of temperature, and ice volume changes. Th ey found that the highest sea level (about 100 ± 50 meters above present sea level) was during the Late Cretaceous, between 80 and 65 million years ago. Th e scientists also concluded that in the past 100 million years, sea-level changes were dominated by growth and melting of continental ice (glaciers). Highlight ID: 11873 GEO/EAR
Mississippi to Montana: Plants Danced to Climate’s Quick TuneScientists have found that a period of rapid global warming 55 million years ago, called the Paleocene-Eocene Th ermal Maximum (PETM), caused major changes in where plants grew. Th e PETM was caused by a massive release of carbon into the atmosphere and ocean, making it an analog for the global warming that is expected as humans continue to add carbon dioxide (CO2) to the atmosphere, primarily by burning fossil fuels. Th e PETM raised global temperatures by as much as 10 degrees Celsius (18 degrees Fahrenheit). Plant fossils dating to the PETM in Wyoming are the same as plant fossils that have long been known from rocks of similar age in Mississippi, Louisiana, and Texas. Th ese southern plants spread from the Gulf Coast to Wyoming, a distance of some 1,000 miles, within 10,000 years or less.
Th e southern plants grew throughout the PETM in Wyoming, then disappeared, presumably unable to survive there as the global climate cooled at the end of the event. Th e return to a cooler climate brought a diff erent set of plant invaders to Wyoming. Relatives of linden and wingnut emigrated from Europe to North America across Arctic land bridges during periods of peak warmth, then established themselves in Wyoming forests after the global heat wave had passed. A similar pattern of intra- and intercontinental migration can be found in animals that lived during the PETM, suggesting that they, too, moved in concert with rapid climate change.
Scott Wing, of the Department of Paleobiology at the Smithsonian Institution, led an international team of researchers in a study of fossilized leaves and pollen found in the Bighorn Basin of northwestern Wyoming. Th e Bighorn Basin is a well-known treasure trove for fossils because enormous amounts of sediment were deposited there as the Rocky Mountains rose. Th ese sediments and the fossils they contain are now exposed in spectacularly eroded badlands. Fossilized mammals and chemical analysis of rocks were key in determining the age of the leaf fossils, which are the fi rst discovered from the PETM period. Highlight ID: 11451 GEO/EAR
Fossil leaf from the Bighorn Basin, Wyoming. Credit: Scott Wing, Smithsonian Institution
Land Research Highlights

67
Fossil Record Suggests Insect Assaults on Foliage May Increase with Warming GlobeA sudden global warming 55 million years ago, called the Paleocene-Eocene Th ermal Maximum (PETM), was caused by a massive release of carbon into the atmosphere and oceans, making it an analog for the global warming that is expected as humans add carbon dioxide (CO2) to the atmosphere. Th e PETM event raised global temperatures as much as 10 degrees Celsius (18 degrees Fahrenheit). Previous research linked the PETM with mass extinctions of bottom-dwelling marine organisms and the migration of mammals across Arctic land bridges. Th e plants alive during that time have also indicated a fast-changing climate, allowing southern-dwelling trees and shrubs to move north in a hurry.
New results of a study by a team of researchers from Pennsylvania State University, the Smithsonian Institution, the University of Maryland, the University of California-Santa Barbara, and Wesleyan University indicate a link between temperature and insect feeding on leaves. Study researcher Ellen Currano of Penn State and the Smithsonian Institution, says, “When temperature increases, the diversity of insect feeding damage on plant species also increases.”
Currano collected the study fossils from the badlands of Wyoming, gathering leaves from fi ve sites representing time zones before, during, and after the roughly 100,000-year temperature spike called the PETM. Researchers found that the PETM plants were noticeably more damaged than fossil plants before and after that period. Th e PETM plants, many of which are legumes (the family that now includes beans and peas), show damage with greater frequency, greater variety, and a more destructive character than plants from the surrounding geologic time periods.
Biologists are already aware that insects in the tropics consume more plants and that warming temperatures are causing organisms to widen their ranges. In addition, research has shown that plants grown under higher concentrations of CO2 are less nutritious, so insects must eat more plant tissue to get the same sustenance. Th ese earlier studies support the recent fi ndings about the PETM. Because food webs that involve plant-eating insects aff ect as much as three-quarters of organisms on Earth, the researchers believe that the current increase in temperature could have a profound impact on present ecosystems, and potentially on crops, if the pattern holds true in modern times. Highlight ID: 16576 GEO/EAR
Cave Deposits as Archives of Earth’s Past ClimateResearchers have obtained a 130,000-year high-resolution record of climate from speleothems (cave formations) in the mid-continent of North America. Th e primary fi eld site—Crevice Cave, Missouri—was located south of the former Laurentide Ice Sheet during the past interglacial-glacial cycle. Th e researchers hypothesize that the site is well situated to record changes in mid-continent climate, global climate variability, and vegetation changes during interglacial-glacial cycles. Previous studies by the researchers indicate that speleothems from Crevice Cave have grown continuously over tens of
thousands of years. Th e researchers expect to produce a high-resolution stable isotope record, dated by the thorium-230 technique, from the North American mid-continent covering most of the last interglacial-glacial cycle. Th is research will improve our knowledge of Holocene climate variability of North America from a new paleoclimate data archive. Highlight ID: 12612 GEO/ATM
Ellen Currano collecting fossil leaves from a site that is 57 million years old in the Bighorn Basin, Wyoming. Credit: Ellen Currano
Speleothems (cave formations) can provide valuable information to researchers seeking clues about Earth’s climate past. Speleothems are slow-growing deposits of minerals dissolved in groundwater. Paleoclimatologists can obtain climate proxy information from the thickness of the deposited layers and the presence of isotopes of certain elements within the layers. Credit: © 2009 JupiterImages Corporation

68
Water TradingEconomists and hydrologists are working together at the Sustainability of Semi-Arid Hydrology and Riparian Areas (SAHRA) Center, an NSF Science and Technology Center, for and with water managers to explore lease/market-based water allocation in New Mexico. Th ey have coupled a hydrological model that forecasts total water availability in a given year with an economic model that forecasts water demand by the various users to support a market for water trading among the users. Th e model supports an open market trading system in which buyers and sellers declare bids and off ers and make trades.
Th e model is updated as new information becomes available on water availability, and it tracks impacts on river fl ows downstream. Th e current evaluation is that the model supports a robust market with the potential to save signifi cant amounts of water through more eff ective management. Based on successes with a prototype model for the Middle Rio Grande in guiding farmers’ choices on crops and the amount of land to irrigate, the SAHRA researchers were asked by the New Mexico state engineer to develop a pilot water-leasing project for the Mimbres Basin, an agricultural area that presents many challenges in microcosm. Th ere, the project is successfully providing real-time tools for choosing crops, setting fl ow rates, and allocating water as fl ows recede in dry periods. Highlight ID: 13962 GEO/EAR
Global Lake Ecological Observatory Network Expands Partnerships in the United States and Abroad to Advance the Scale of Lake ResearchAn international collaboration called GLEON (Global Lake Ecological Observatory Network) is advancing ecological understanding of the role of lakes in the global carbon balance and helping researchers understand lake metabolism and lake response to dramatic weather events, such as hurricanes. With funding from the National Ecological Observatory Network (NEON), a group of researchers from the United States is collaborating with international scientists to form a network of sensors deployed on lakes to gather data on lake metabolism and nutrient cycling. Data from this international observatory will provide information on key lake processes and functions that are aff ected by climate and land-use changes, and will develop processes that will be useful in developing NEON.
A recent supplemental grant to GLEON has allowed for the expansion of this network in the United States and internationally. Th e GLEON collaboration now has 22 members from nine countries participating, with more in the planning stages. Several sites in northern Europe were added; students and researchers from Sweden and Finland joined the project; and lakes in northern Scandinavia were instrumented with sensors and linked to the network. Argentina and Chile are expected to participate in the future. In addition, Lake Sunapee in New Hampshire has been set up to automatically download, archive, and publish sensor network data using technologies that conform to emerging GLEON standards. Th e expanded network will test the datafl ow procedures developed to bring information from sensors to publicly accessible databases, as well as the event detection schema developed to help electronically distinguish between biological and physical events such as lake inversion after a storm and sensor failure. As more sensors come online and are linked to the network, it will become necessary to automate processes as data from thousands of sensors stream into the database.
Th e addition of European lakes will provide a new set of environments to understand lake metabolism and the local and regional phenomena that drive changes in metabolism. In addition, it will provide the opportunity to explore adding existing sensor systems to the current cyberinfrastructure framework. Th is addition will permit testing of the robustness of the cyberinfrastructure design and the development of plug-and-play technology, and exploration of the challenges that arise from integrating diff erent sensors and protocols. Highlight ID: 16514 BIO/DBI
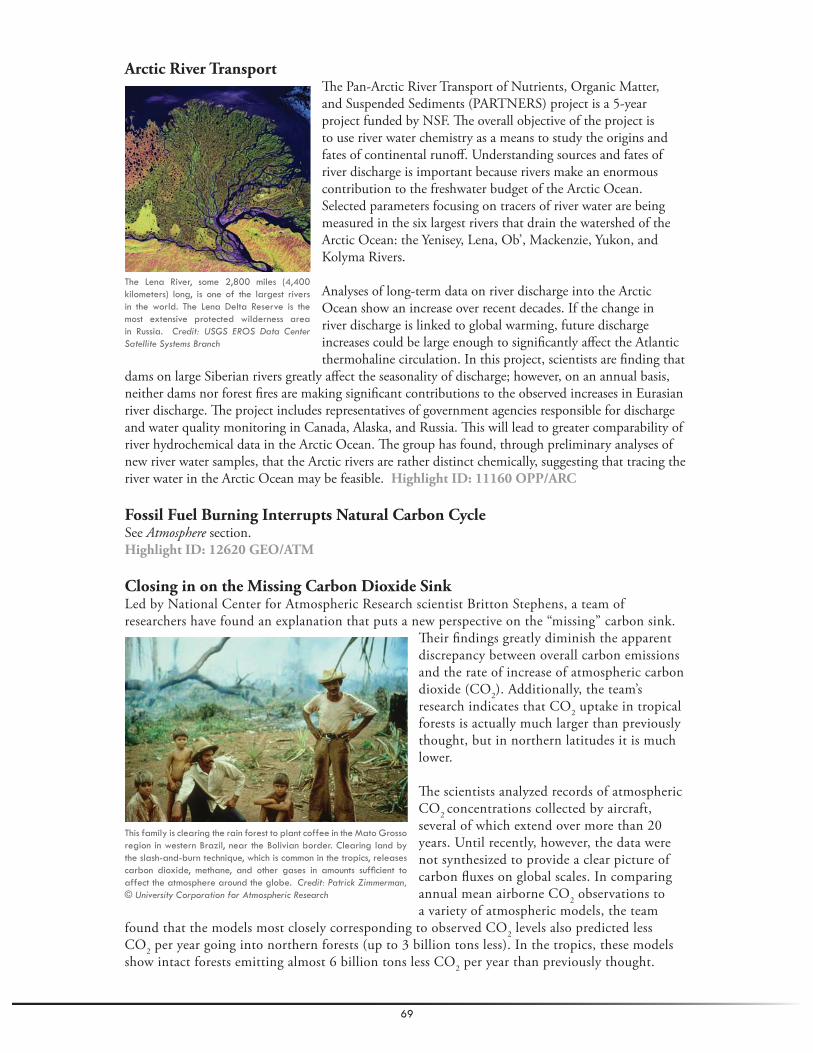
69
Arctic River TransportTh e Pan-Arctic River Transport of Nutrients, Organic Matter, and Suspended Sediments (PARTNERS) project is a 5-year project funded by NSF. Th e overall objective of the project is to use river water chemistry as a means to study the origins and fates of continental runoff . Understanding sources and fates of river discharge is important because rivers make an enormous contribution to the freshwater budget of the Arctic Ocean. Selected parameters focusing on tracers of river water are being measured in the six largest rivers that drain the watershed of the Arctic Ocean: the Yenisey, Lena, Ob’, Mackenzie, Yukon, and Kolyma Rivers.
Analyses of long-term data on river discharge into the Arctic Ocean show an increase over recent decades. If the change in river discharge is linked to global warming, future discharge increases could be large enough to signifi cantly aff ect the Atlantic thermohaline circulation. In this project, scientists are fi nding that
dams on large Siberian rivers greatly aff ect the seasonality of discharge; however, on an annual basis, neither dams nor forest fi res are making signifi cant contributions to the observed increases in Eurasian river discharge. Th e project includes representatives of government agencies responsible for discharge and water quality monitoring in Canada, Alaska, and Russia. Th is will lead to greater comparability of river hydrochemical data in the Arctic Ocean. Th e group has found, through preliminary analyses of new river water samples, that the Arctic rivers are rather distinct chemically, suggesting that tracing the river water in the Arctic Ocean may be feasible. Highlight ID: 11160 OPP/ARC
Fossil Fuel Burning Interrupts Natural Carbon CycleSee Atmosphere section.Highlight ID: 12620 GEO/ATM
Closing in on the Missing Carbon Dioxide SinkLed by National Center for Atmospheric Research scientist Britton Stephens, a team of researchers have found an explanation that puts a new perspective on the “missing” carbon sink.
Th eir fi ndings greatly diminish the apparent discrepancy between overall carbon emissions and the rate of increase of atmospheric carbon dioxide (CO2). Additionally, the team’s research indicates that CO2 uptake in tropical forests is actually much larger than previously thought, but in northern latitudes it is much lower.
Th e scientists analyzed records of atmospheric CO2 concentrations collected by aircraft, several of which extend over more than 20 years. Until recently, however, the data were not synthesized to provide a clear picture of carbon fl uxes on global scales. In comparing annual mean airborne CO2 observations to a variety of atmospheric models, the team
found that the models most closely corresponding to observed CO2 levels also predicted less CO2 per year going into northern forests (up to 3 billion tons less). In the tropics, these models show intact forests emitting almost 6 billion tons less CO2 per year than previously thought.
The Lena River, some 2,800 miles (4,400 kilometers) long, is one of the largest rivers in the world. The Lena Delta Reserve is the most extensive protected wilderness area in Russia. Credit: USGS EROS Data Center Satellite Systems Branch
This family is clearing the rain forest to plant coffee in the Mato Grosso region in western Brazil, near the Bolivian border. Clearing land by the slash-and-burn technique, which is common in the tropics, releases carbon dioxide, methane, and other gases in amounts suffi cient to affect the atmosphere around the globe. Credit: Patrick Zimmerman, © University Corporation for Atmospheric Research

70
Th ese results suggest that northern countries cannot rely on their forests to help off set their CO2 emissions as much as they might have hoped and that the tropical countries can help slow down global warming by preserving their forests.
Tropical deforestation is still considered a signifi cant source of atmospheric CO2, so these results imply strong uptake in intact tropical forests. While previous local-scale studies suggested strong uptake in intact tropical forests, such results disagreed with the atmospheric model predictions. Uptake of human-generated CO2 by forests over the next few decades can slow warming and possibly give us more time to fi nd solutions. Highlight ID: 15904 GEO/ATM
Climate-Induced Floods in the Upper Mississippi RiverIn the past, warm climate episodes favored an increased likelihood of widespread early spring rainfall on melting snow, leading to more frequent large fl oods on the Upper Mississippi River (UMR). James Knox at the University of Wisconsin-Madison examined layered deposits of sediments along the Mississippi River and correlated fl ood deposits with average annual temperatures. An unusually high frequency of large overbank fl oods took place in the UMR valley during the relatively warm Medieval Period, between about A.D. 1000 and A.D. 1400. Th e UMR fl oods were highly sensitive to an atmospheric circulation that favors an
infl ow of warm, moist air masses to the UMR valley. When these moist air masses collide along frontal boundaries with cooler air masses from high latitudes, widespread heavy rains fall in the upper Midwest, followed by UMR fl ooding.
Th is research led to the hypothesis that climate warming favors increased variance in fl ood magnitudes, including an increased incidence of relatively large, extreme fl oods. Although this hypothesis may seem at odds with the common idea that warming favors droughts and reduced runoff , the hypothesis recognizes that most large fl oods on the UMR involve snowmelt, especially when coupled with widespread rainfall. Warm winters and early springs favor the occurrence of rain on melting snow in the UMR watershed. Since about 1950, there have been nearly twice as many large fl oods as would be expected as a result of statistical chance. Most of these post-1950 large fl oods involved snowmelt, but they also increased the potential for occasional heavy summer rains, because warm air masses typically contain larger quantities of precipitable water vapor than cool air masses. Highlight ID: 16447 GEO/ATM
Social Scientist Tackles Deforestation in MaineDeforestation is a widespread problem, with implications for forest products, erosion, water quality, biodiversity, tourism, recreation, and climate change. To understand the processes at work and what might stem the tide, James Acheson, professor of anthropology and marine sciences at the University of Maine, used NSF funding to investigate the forest harvesting and conservation decisions of small forestland owners (less than 5,000 acres) in Maine, the most heavily forested state. Th e research bears directly on the eff ects of human behavior on the future of forested land in the United States.
Acheson’s research revealed four diff erent types of forestland owners: (1) contractors, who buy land, harvest the wood, and resell the land; (2) local business owners, who develop land for houses; (3) large forest products fi rms; and (4) small landowners, many of whom live or vacation on their forest parcels. Satellite photos revealed that 40 percent of the parcels harvested between 2000 and 2005 were converted to housing. Large-scale clear-cutting has ceased, but heavy harvesting persists as contractors, corporations, and other private owners respond to market opportunities. Only a small
Researchers hypothesize that climate warming favors more frequent fl ooding events in areas such as the Upper Mississippi River valley. Credit: Susie Shapira, Federal Emergency Management Agency

71
subset of small landowners—those who are better off , are more educated, and do not expect to receive an income from their land—are doing a good job of forest conservation.
If Maine and the United States are going to keep their forests and all the benefi ts that come with them, action will be needed, and soon. Otherwise, forest acreage and quality will diminish rapidly as a result of a tidal wave of development sprawl. Private ownership is not necessarily detrimental to forest conservation, but forest landowners need incentives to save their trees. Highlight ID: 15772 SBE/BCS
Climate Change Eff ects on Water SupplyTo answer the question “How is global climate change aff ecting water supply in the western United States?” climate scientists from the Scripps Institution of Oceanography and the Lawrence Livermore National Laboratory are collaborating with researchers from the San Diego Supercomputer Center (SDSC). Th e scientists fi rst run a model of the global climate on supercomputers, then zoom in to see the impact on the western U.S. region, then analyze the results and verify the model’s accuracy by comparing the results with real-world observations. An important challenge facing the scientists is how to handle the large amounts of data generated, which can reach many terabytes (a terabyte is 1,000 gigabytes). To manage the data, move it between institutions, and share it, they are using a special tool called the Storage Resource Broker, developed by data experts at SDSC. Highlight ID: 14379 OD/OCI
A Stormy PastEstimates of past storm strengths and frequencies are extremely valuable to researchers trying to tease out the infl uence of human activities on climate. Jeff rey Donnelly of the Woods Hole Oceanographic Institution (WHOI) examined the mess left by hurricane storm surges—not Katrina on the Gulf Coast, but those in the New York City area. He found at least 10 layers of sand left behind by likely hurricanes in the past 700 years. Donnelly hopes to reconstruct the history of intense storms in southern New England and Long Island by looking at the deposits left by land-falling hurricanes and storm surges in backbarrier salt marshes and kettle ponds found at diff erent heights throughout the area. So far, his group has found sand layers that correspond to the known great storms of 1991,
1954, 1938, 1893, 1788, and 1693. Many additional layers indicate storms that date back to 1642–1477, 1434–1347, 1316–1257, and even to 1190–1034 and earlier.
While considered rare in the New York City area, land-falling hurricanes have likely occurred many times throughout the past 3,500 years. With six severe storms, likely hurricanes, in the past 700 years, the frequency of land-falling hurricanes in the New York City area is equal to that in southern Rhode Island and higher than that in southern New Jersey. Initial fi ndings suggest that alternating periods of frequent and infrequent hurricane activity have occurred in the past, possibly tied to changes in climate. Donnelly’s group identifi ed the time periods of high hurricane activity in western Long Island to be 3500–3050 years before present (BP) and 2200–900 BP, nearly synchronous with evidence of high activity found in the Caribbean and northern Gulf Coast. Highlight ID: 14009 GEO/EAR
Interdisciplinary Project Explores Interactions Between Land Use and Climate Change at Regional and Local Scales in Eastern AfricaWhat is the impact of human use of land on the local and regional climate? Land-use conversions like deforestation and the expansion of agriculture alter soil moisture, surface refl ectance, and other land conditions, which greatly aff ects local and regional climates. Similarly, changes in the local climate—
Jeffrey Donnelly (right) of the Woods Hole Oceanographic Institution (WHOI), and his colleague, prepare to extract a sediment core from Oyster Pond, Massachusetts. Donnelly is studying climate change by looking for evidence of major hurricanes over centuries recorded in the sediments of coastal areas. Credit: Tom Kleindinst, Woods Hole Oceanographic Institution

72
such as rising temperatures and rainfall variability—can aff ect agriculture, forestry, and other land uses, leading to changes in land-use patterns. Th ese processes are being addressed by the NSF-supported Climate-Land Interaction Project (CLIP), which involves researchers at Michigan State University, Purdue University, the National Oceanic and Atmospheric Administration, and other collaborating institutions, such as the University of Dar es Salaam and Makerere University in Africa, and the University of East Anglia in the United Kingdom.
Th e core question addressed by CLIP scientists is “What is the magnitude and nature of the interaction between land use and climate change at regional and local scales?” Th is question is being examined in eastern Africa, a region that is undergoing extremely rapid land-use change, including expansion of cropping into savanna lands, increasing irrigation, deforestation, and urbanization. Th e region straddles the equator and is characterized by a heterogeneous landscape that ranges from glaciated volcanoes and montane forests to coff ee, corn, and banana farms, and wide expanses of semi-arid savanna grasslands.
CLIP links climate models, crop-climate models, meteorological and satellite image data, and models of land-use change to assess how climate changes aff ect land use and vice versa. Th e land-use change models are informed by socioeconomic and biophysical spatial data and by the results of expert systems workshops and role-playing scenarios. Th e expert systems provide reality-based initial model parameterization and, later, evaluation of the land-use change models. Th ey are central to understanding the human dynamics that respond to economic and other forces, and that lead individuals, groups, and organizations to change land-use practices. Th e land-use changes aff ect surface-atmosphere fl uxes and alter regional climates, and the expert systems also contribute to the understanding of how people respond to altered climatic conditions. Participants in the expert systems and the role-playing scenarios bring their personal experiences from growing up on farms and their professional insights as government offi cials and scientists in their fi elds of environment, fi nance, and planning. By assessing future scenarios under diff erent resource opportunities and constraints, they provide critical information on the decisionmaking processes that diff erent actors employ. Highlight ID: 11085 SBE/BCS
Calibration of Earth HistoryAccurate dates are essential for understanding a vast array of geological and evolutionary processes, from the causes of mass extinctions to the rates of past climate perturbations to rates of evolution and the timing and causes of mountain building. Although long recognized by paleontologists and others, only recently have geochronologic techniques been refi ned to produce dates with uncertainties of much less than a million years. In the coming decade, precise geochronology will revolutionize our understanding of Earth history and the rich record of geological, biological, and climate processes. Th e goal of the EARTHTIME project is to foster an unprecedented national and international collaboration among geochronologists, paleontologists, evolutionary biologists, and stratigraphers, with the goal of producing a high-resolution timescale against which the record of biological evolution, climate change, and oceanic chemistry can be calibrated for at least the past 550 million years. Among other things, the project will require the development of analytical protocols and standards so that geochronologic data from diff erent labs are comparable and can provide dates with uncertainties that approach 0.1 percent. Highlight ID: 7844 GEO/EAR

73

74
If climate had no signifi cant impact on Earth’s ecosystems and living things, climate change would be a mere curiosity of planetary science. Instead, we know that ecosystems evolved in concert with predictable annual weather patterns for survival. Changing weather patterns aff ect where plants can grow and where animals can thrive. Even small changes in climate can tip the delicate balance of competition and cooperation among the residents of an ecosystem. Th e potential for climate change to disrupt life on Earth makes studying it essential.
Earth’s ecosystems are not only aff ected by climate, they also play a major role in infl uencing global climate. Living things regulate the composition of the atmosphere. Plants use carbon dioxide (CO2) to grow and produce oxygen; when plants die, microbes break them down into the organic matter of soil, methane gas, CO2, and other byproducts. Changes in land use or average temperature can disrupt an ecosystem’s cycling and storage of carbon, creating the potential for large amounts of CO2 or methane to be released into the atmosphere. Earth’s forests, marine
LIFE
Top image credit: © Forrest Brem, courtesy of NatureServe
Several male narwhals in Inglefi eld Bredning, West Greenland, 2002. Narwhals rely on Arctic sea ice cover for their hunting behaviors, and may not be able to adapt to an ice-free Arctic Ocean. Credit: Courtesy of Mads Peter Heide Jørgensen, NOAA
This diagram shows the carbon cycle. All life is based on the carbon atom, which can exist in solid, liquid, or gas form. Carbon constantly moves through all living things, as well as through the oceans, atmosphere, and Earth’s crust. Carbon dioxide in the atmosphere plays a vital role in regulating air temperature on Earth. Credit: © University Corporation for Atmospheric Research

75
environments, wetlands, tundra, and other habitats store vast amounts of carbon. Land cover and the choices humans make about determining where plants will grow can have a profound impact on both regional and global climate. Understanding the biological processes involved in the carbon cycle is essential to predicting future climate, and eff orts are currently under way to incorporate living systems into global climate models.
NSF supports biologists as they seek a greater understanding of what a warmer global climate means to life on Earth. NSF supports 63 percent of the fundamental environmental biology research at U.S. academic institutions, fostering advances in the biological sciences through research grants and providing the infrastructure to enable those advances.1
Th e urgency of this research comes sharply into focus when we realize that our own species is highly dependent on Earth’s ecosystems. Living organisms do much more for us than provide food, clothing, and shelter. Plants are not only responsible for the very oxygen we breathe; they help regulate the temperature and moisture of the places we call home. Plant roots prevent topsoil from eroding away or burying our houses. Forests of swaying trees and acres of wetlands literally calm storms by dissipating wind and wave energy. Microorganisms decompose our garbage and help us digest our food. Without the ecosystems of the world, big and small, our existence would be impossible.
Long-Term Ecological ResearchTo understand how climate change aff ects an ecosystem, continuous observational records of that ecosystem are necessary. For more than 25 years, NSF has steadfastly supported the Long-Term Ecological Research (LTER) Network, a collaborative eff ort currently involving more than 1,800 scientists and students studying ecological processes at sites strategically located around the United States, Puerto Rico, Tahiti, and Antarctica. Th e 26 LTER sites are windows to global change.
As observatories, they document long-term changes in plants, animals, microbes, and soils in relation to short-term weather and long-term climate changes. LTER sites illuminate interactions among the physical, chemical, and biological components of ecosystems through controlled experiments and long-term observations. Th ese sites allow comparisons of the relative sensitivity of populations, communities, and ecosystems to environmental change. Th e synthesis and modeling of data from LTER sites enable predictions of feedbacks, both positive and negative, on global change. Research at LTER sites spans the range from relatively less managed landscapes, such as Arctic tundra, to intensively managed cities and farmlands.2
National Ecological Observing NetworkIn response to the ecology research community’s recommendations for a new approach to studying the biosphere, NSF implemented the planning phase of an ecological observing network with the unprecedented ability to study the complex phenomena driving ecological change. Th e National Ecological Observatory Network (NEON), a regional-to-continental scale network, will help us understand the impacts of climate change, land-use change, and invasive species on ecology. NEON will gather data on ecological responses of the biosphere to changes in land use and climate, and on feedbacks with the atmosphere, water cycle, and other natural and human systems.
1 NSF FY 2009 Budget Request to Congress: www.nsf.gov/bio/budget/fy09/neon09.pdf.
2 Global Change Research, LTER Net: www.lternet.edu/global_change.
Autumn colors, with the Brooks Range in the background, near the Sagavanirktok River, Alaska. This area is part of the Arctic Long-Term Ecological Research (Arctic LTER) site. Credit: Jim Laundre, Arctic LTER

76
NEON is a single national observatory, not a collection of regional observatories. It will consist of a seamlessly linked, distributed network of sensors and experiments, connected by advanced cyberinfrastructure. Using standardized protocols and an open data policy, NEON will record and archive essential data for developing the scientifi c understanding and theory required to manage the nation’s ecological challenges.3
NEON infrastructure will include instrumented towers and sensor arrays, remote sensing capabilities, cutting-edge laboratory instrumentation, natural history archives, and facilities for data analysis, modeling, visualization, and forecasting—all networked onto a cyberinfrastructure backbone. Th e information gathered from NEON will be the best and most complete picture we have of the ecological changes taking place across the continent and will prove invaluable to climate modelers and policymakers.4
Species AdaptationIn fi eld studies, biologists are encountering change in nearly every ecosystem they study, and some species seem especially susceptible to the eff ects of a warmer climate. Polar bears are one famous example of a species that seems particularly vulnerable to warming. Th e sea ice they require to access Arctic ringed seals (a primary source of food) is melting, diminishing their hunting range. Even if polar bears are able to adapt to a warmer, land-based lifestyle, competition, potential hybridization with grizzly bears, and increased human interactions would present signifi cant challenges to the species’ survival.5
NSF-supported researchers have documented other species at risk, including many of the world’s amphibians. Results from an NSF-funded study provide the fi rst evidence of a link between climate change and outbreaks of an infectious disease that has wiped out dozens of tropical frog populations.6 Other NSF-funded researchers have compiled the latest information on the distribution and diversity of more than 4,000 mammal species to analyze the risk of extinction owing to threats including global climate change.7 Th is type of information can identify “hotspots” of endangered species, helping conservationists decide how to best allocate their resources.
While some species seem destined for extinction because of rapid climate change, other species are providing researchers with unprecedented examples of evolutionary biology in action. Numerous NSF-funded researchers have
3 NEON overview: www.neoninc.org/about-neon/overview.html.
4 NSF-Supported Research Infrastructure: Enabling Discovery, Innovation, and Learning, 2008.
5 ACIA, Impacts of a Warming Arctic: Arctic Climate Impact Assessment, Cambridge University Press, 2004, p. 58.
6 NSF Highlight 15975: Climate Change Driving Amphibian Extinctions.
7 NSF Highlight 13166: Predicting the Next Mammals at Risk.
Illustration of the National Ecological Observatory Network (NEON). NEON will incorporate a variety of land-, air-, and satellite-based sensors and monitoring equipment, linked by an extensive network of cyberinfrastructure. Credit: Nicolle Rager Fuller, National Science Foundation
Polar bears depend on the presence of sea ice in the Arctic for access to their main prey, seals. Scientists are concerned that diminished summer sea ice in the Arctic threatens polar bears’ survival. Credit: © 2009 JupiterImages Corporation
Recent studies show that Earth’s warming climate is contributing to the increase of chytrid disease, a fungus infection that is responsible for the extinction of many tropical frog species. The fungus, Batrachochytrium dendrobatidis, infects tadpoles and eventually attacks the skin of adults and kills them. Scientists know the spore stage can swim through water to infect other frogs, but there is still much to know about how the disease spreads and whether it can survive in other animals. Credit: Nicolle Rager Fuller, National Science Foundation

77
documented genetic shifts in natural populations resulting from climate change. Th ese studies suggest that extreme variation in temperature and rainfall are selecting for genetic shifts in organisms with life spans short enough to allow some adaptation at the current rate of climate change. In one example, the rise of drought conditions in southern California selected for a genetic shift in populations of fi eld mustard plants (a common weed). Plant populations exposed to several years of drought bloomed sooner, increasing their chances of reproducing before drying out from a lack of rain.
In another example, researchers found genetic shifts in fruit fl ies that correspond to temperature increases. Researchers compared genetic evidence collected almost 30 years ago from wild fruit fl ies with the genetic profi les of present-day fruit fl ies. Th ey found that fl ies at higher latitudes have the chromosomal characteristics associated with the low-latitude fl ies in the original study. Th e low-latitude chromosome changes are thought to protect the fl ies from warmer temperatures; thus, the fl ies appear to have undergone genetic adaptation to warmer temperatures.8 Genetic changes attributed to global warming-related seasonal changes have also been observed in populations of migrating birds, mosquitoes, and other species.9
In addition to genetic adaptation, rising temperatures and CO2 levels can infl uence gene expression. In a recent study, NSF-supported researchers demonstrated that fl owering plants grown in the elevated CO2 levels projected by current climate models bloomed signifi cantly later than equivalent plants grown at modern atmospheric CO2 levels. Th is research has important implications for predicting the future behavior of plant and crop species.10
National Center for Ecological Analysis and SynthesisTh e NSF-funded National Center for Ecological Analysis and Synthesis (NCEAS) at the University of California-Santa Barbara is a leading example of the kind of interdisciplinary collaboration we can expect to see much more of in the years ahead. Ecologists work with specialists in allied fi elds to address
major fundamental issues in ecology and their application to management and policy. Th e center focuses on developing and testing important ecological ideas and theories using existing data. Working in teams, NCEAS researchers focus on analyzing ecological information with cutting-edge approaches, accessing and using data, promoting the use of sound science in policy and management decisions, investigating sociological issues that pertain to the science of ecology, and educating with sound ecological principles.11
NCEAS projects examine issues such as climate change and forest pathogens, global climate change and adaptation of conservation priorities,
biodiversity, and many other topics relevant to ecosystems and climate change.12 Th is research has provided insight into a variety of complex ecosystem issues.
In examining the eff ects of human activities on the sea, researchers at the NCEAS produced a detailed map of the world’s oceans, providing policymakers with a clear and unmistakable view of the dramatic eff ects of climate change, overfi shing, and pollution on the world’s oceans. Th e research team found that more than 40 percent of the world’s oceans are heavily aff ected by human activities, and virtually no marine region remains untouched by humans.13
8 NSF Highlight 13082: Genetic Consequences of Climate Change.
9 NSF Highlight 15953: Climate Change: A Driver of Evolution.
10 NSF Highlight 16828: Is There a Relationship Between Global Climate Change and Flowering?
11 NCEAS Web site: www.nceas.ucsb.edu/overview.
12 NCEAS Working Groups: www.nceas.ucsb.edu/research/wg.
13 NSF Highlight 16039: First-Ever Global Map of the Influence of Total Anthropogenic Activities on the Marine Ecosystem.
According to a study conducted by the National Center for Ecological Analysis and Synthesis (NCEAS) at the University of California-Santa Barbara, more than 40 percent of the world’s oceans are heavily affected by human activities, and few, if any, areas remain untouched. Credit: NCEAS

78
Life in the SeaOne of the ocean’s most important and diverse ecosystems may be one of the most sensitive to changes in temperature and ocean chemistry. Coral reefs provide habitats for a large variety of plant and animal species. As physical structures, they reduce the destructive impact of ocean surges during storms. NSF researchers are studying corals to learn how resilient they may be to changing ocean conditions. In a recent study, scientists found that bleaching events occur when rising ocean temperatures cause the coral to expel the symbiotic algae that give coral their distinctive colors. Th e researchers discovered that this is a coping strategy for the stressed animals. Coral can survive periods of bleaching by consuming zooplankton from the surrounding water, indicating that some coral may be able to survive future periods of elevated sea temperatures.14
Bering Ecosystem StudyTh e Bering Sea hosts one of the most ecologically rich and economically productive food chains in the world, producing more than 50 percent of the U.S. fi sh and shellfi sh catch.15 Its location
in the climate-sensitive Arctic region means that the eff ects of global warming may have a signifi cant impact on the organisms that call the Bering Sea home. In partnership with the North Pacifi c Research Board, NSF launched the Bering Ecosystem Study (BEST) to improve our understanding of the eff ects of climate variability on the Bering Sea marine ecosystems, including the social implications of climate change and the role of human activities in the system. BEST will examine such factors as diminishing sea ice, decreasing ocean salinity, and shifting plankton availability in the Bering Sea.16
ConclusionLife on Earth has a direct and profound eff ect on global climate; it is a vital link in the carbon chain. Ecosystems such as forests regulate the fl ow of heat and moisture in a region, contributing to local climate patterns. Th e climate models of the future will have to account for the eff ects of living things to produce accurate climate forecasts. Living things are vulnerable to climate change; in a warming world, plants and animals will face signifi cant changes in their habitats. Some species have already demonstrated the ability to adapt to a changing climate, but we do not yet have a full understanding of the implications of anthropogenic climate change on the planet’s plant and animal species. Long-term environmental observations, fi eldwork, and statistical analyses of ecosystem data have yielded important information about the eff ects of climate change on the biosphere. In the research highlights below, numerous NSF-funded life research projects are described. Th ese projects have all contributed to our understanding of how life on Earth is both infl uencing and infl uenced by climate change. Th is research also provides invaluable experience and training to the next generation of life scientists.
14 NSF Highlight 13490: Coral Reef Bleaching: A Novel Strategy for Survival.
15 Bering Ecosystem Study Science Plan, Fairbanks, Alaska: Arctic Research Consortium of the United States, 2004, p. 9.
16 ARCUS BEST Web site: www.arcus.org/bering/index.html.
Corals like these on the undersea Stetson Bank in the Gulf of Mexico are affected by the increasing acidity of the oceans. Credit: Frank and Joyce Burek
Steller’s Sea Lions, Amak Island, Alaska. Large Arctic marine mammals are an important part of the Bering Sea ecosystem. Credit: Kevin Bell, U.S Fish and Wildlife Service

79
Global Warming Linked to Amphibian ExtinctionGlobal warming is causing outbreaks of an infectious disease that is wiping out entire frog populations and driving many species to extinction, according to results from an NSF-funded study. Th e study reveals how warming may alter the dynamics of a skin fungus that is fatal to amphibians. Th e climate-driven fungal disease, the authors say, has hundreds of species around the world teetering on the brink of extinction, or has already pushed them into the abyss.
In the remote mountainous areas of Costa Rica, the Monteverde harlequin frog (Atelopus sp.) and the golden toad (Bufo periglenes) have not been seen since the 1980s, and are considered extinct by authorities. Th e loss of these tropical species
sent alarm and suspicion throughout the scientifi c community. Today, almost 70 percent of the 110 species of the colorful Atelopus frogs endemic to the Americas have gone extinct as a result of a lethal fungus (Batrachochytrium dendrobatidis). Using records of sea surface and air temperatures, researchers have provided evidence that harlequin frogs are disappearing in near lockstep with changing climate. According to the scientists’ hypothesis, Earth’s rising temperatures enhance cloud cover on tropical mountains, leading to cooler days and warmer nights, both of which favor the chytrid fungus.
Th e study results come at a time of growing concern about the future of amphibians. Th e Global Amphibian Assessment, published in 2004, found that nearly one-third of the world’s 6,000 or so species of frogs, toads, and salamanders face extinction from a variety of causes—a fi gure far greater than that for any other group of animals. Highlight ID: 12013 BIO/DEB
Predicting the Next Mammals at RiskAlthough news of rising temperatures and disappearing ice sheets has foreshadowed the recent addition of the polar bear to lists of vulnerable species, not all species are associated with such dramatic warning signs that they are in danger. A new database is allowing researchers to use detailed data to determine optimal strategies for conserving species that are threatened now and to predict those that may be at risk in the future.
Th is novel NSF-funded work, led by John Gittleman of the University of Virginia, combined the latest information on the distribution and diversity of more than 4,000 mammal species with
exceptionally fi ne-scaled maps of their ranges. Aggregating such large amounts of geographic information required collaboration with mammalian experts worldwide and the development of new computer software that permitted an overlay of thousands of maps. Th rough this synthesis, researchers were able to elucidate how range size could combine with certain ecological, morphological, and life-history traits (e.g., large body size, long gestation) to increase the risk of extinction for particular species. Th ey
Life Research Highlights
The Panamanian golden frog (Atelopus zekeki) is a member of the harlequin frogs (Genus: Atelopus). Scientists estimate that about 67 species of harlequin frogs have gone extinct due to fungus outbreaks. Evidence links these outbreaks with climate change. Credit: © Forrest Brem, courtesy of NatureServe
Polar Bears were recently listed as “vulnerable” by the World Conservation Union (IUCN). Credit: © 2009 JupiterImages Corporation

80
used information on current risk factors combined with predictive models to identify geographic areas that currently have the highest potential for future species losses. Although regional patterns of species richness became apparent when the mammalian ranges were compared with those of other vertebrates, local hotspots of rarity for mammals were largely nonoverlapping with areas that were important for birds and amphibians. Highlight ID: 13166 BIO/DEB
Genetic Consequences of Climate ChangeRecently, multiple NSF-funded researchers have documented genetic changes resulting from climate change. Th ese studies suggest that extreme variation in temperature and rainfall are causing genetic shifts in organisms with short life spans.
At the University of California-Irvine, Arthur Weis is studying how a 5-year California drought caused genetic changes in fi eld mustard, a weedy plant that is common throughout the United States. Weis collected seeds from wild plants before and after the drought, then raised them under identical conditions to observe diff erences between the two samples. Even when provided with suffi cient amounts of water, plants grown from postdrought seeds bloomed sooner. During the drought, natural selection favored this particular trait because it allowed the plants to seed successfully before conditions became fatally dry. Building on this study, Weis is organizing an NSF-funded workshop to stimulate a concerted scientifi c eff ort to collect and preserve seeds across North America. Called Project Baseline, this undertaking will provide scientists with an important resource for studying future climate change–induced evolutionary events.
On a global scale, Raymond Huey of the University of Washington and George Gilchrist of the College of William and Mary have found genetic changes in fruit fl ies that correspond to temperature increases. In their study, they examined a certain type of genetic change known as a chromosomal inversion. More than 40 years ago, scientists documented these genetic rearrangements in wild populations of the fruit fl y species Drosophila subobscura and noted that the frequency of the inversions correlated with the fl ies’ latitude. Although the exact purpose of the inversion is unknown, it appears to protect the fl ies against warm temperatures. Huey and Gilchrist used the past data and added information on present-day fruit fl ies on three continents. Th eir analysis shows genetic diff erences between contemporary fruit fl ies and 1981 populations: Flies at higher latitudes have more of the low-latitude chromosomal inversions. In other words, these fl ies have undergone genetic adaptation to warmer temperatures. Highlight ID: 13082 BIO/DEB
Climate Change: A Driver of EvolutionClimate change has resulted in heritable genetic changes in species as diverse as birds, squirrels, and mosquitoes, and in traits such as range limits, reproductive patterns, dormancy, and migration. Because the most obvious facet of climate change is increasing temperatures, it is tempting to simply attribute these genetic changes to higher temperatures. However, many species use day length as a critical cue, and changing temperatures can lead to a mismatch between those cues and environmental conditions. As discussed by William E. Bradshaw and Christina M. Holzapfel of the University of Oregon in a recent publication, scientists are discovering that adaptation to changes in day length and the timing of growing seasons can be important when species adapt to climate change. In a study involving the pitcher-plant mosquito, Bradshaw and colleagues experimentally raised mosquitoes from a northern population in a simulated southern climate with shorter days. Th e mosquitoes laid fewer eggs— 88 percent of the loss was due to transplanted mosquitoes experiencing the incorrect day length relative to temperature. As climate change occurs, many species in the Northern Hemisphere will migrate northward to avoid increasing heat stress. However, species for which day length is an important determinant of development and reproduction will have to adapt to the new day length to avoid a mismatch. Th is study emphasizes the complex nature of global change and the need to understand how many aspects of that change will interact with organisms and their evolution.

81
Bradshaw and Holzapfel note that evolutionary adaptation to rapid, human-caused climate change is only likely to occur in small animals with short life cycles and large population sizes, because those are conditions that allow fairly rapid evolution. Large animals with long life cycles and smaller population sizes may have no options but to migrate to cooler climates, suff er declines in population size, or simply be replaced by species from historically warmer climates. Th ough researchers are still examining exact mechanisms and rates of evolutionary change, it is widely recognized that climate change will dramatically modify our natural communities. Highlight ID: 15953 BIO/DEB
Is Th ere a Relationship Between Global Climate Change and Flowering?From a survey of past studies, researchers at the University of Kansas knew that rising carbon dioxide (CO2) exerts a strong eff ect on fl owering time in the majority of plant species, although the mechanisms for this response are not yet well understood. Using Arabidopsis thaliana—a small fl owering plant with a relatively short life cycle—the researchers have, for the fi rst time, demonstrated that elevated CO2 can infl uence the expression of genes involved in the initiation of fl owering. Specifi cally, they found that the gene Flowering locus C plays a large role in determining delayed fl owering in plants grown at elevated CO2 levels. By describing these specifi c mechanisms, scientists are in a better position to predict the future responses of plants to a changing environment and to determine the best approach for improving crop responses to increasing CO2 concentrations of the future. Highlight ID: 16828 BIO/IOSz
First-Ever Global Map of the Infl uence of Total Anthropogenic Activities on the Marine Ecosystem
More than 40 percent of the world’s oceans are heavily aff ected by human activities, according to the fi rst-ever global scale study of anthropogenic impact on marine ecosystems. Research conducted by Fiorenza Micheli of Stanford University and John Bruno of the University of North Carolina-Chapel Hill, and analyzed at the National Center for Ecological Analysis and Synthesis (NCEAS) at the University of California- Santa Barbara (along with several other researchers from a broad range of universities, nongovernmental organizations, and government agencies), describes the gravity of the global human impact of marine ecosystem
changes. Th e researchers overlaid maps of 17 diff erent factors of human activity, such as fi shing, pollution, and commercial shipping, to produce a composite map of the toll that humans have exacted on the oceans. Th ey also included eff ects of anthropogenic climate change such as ocean acidifi cation, increased ultraviolet radiation, and ocean temperature. Th ey found that no region is unaff ected by human activity but that large regions with relatively little human impact remain, particularly near the poles. Th ey also found that diff erent ecosystems were aff ected diff erently. Hard- and soft-bottom continental shelves and rocky reefs have the highest predicted cumulative impact scores, while open oceans and deep waters have the lowest. Analyses of this type will provide valuable tools for regional and global eff orts to allocate conservation resources and for informing ecosystem-based management. Highlight ID: 16039/ Press release 08-024 GEO/OCE
Coral Reef Bleaching: A Novel Strategy for SurvivalSee Sea sectionHighlight ID: 13490 GEO/OCE
Germ Bath Helps Amphibians Fight Off FungusBatrachochytrium dendrobatidis, a deadly pathogenic fungus, is causing population declines and extinctions in many amphibian species around the world. NSF-funded researchers may have discovered a potential solution: Inoculating amphibians with certain bacteria helps the amphibians fi ght the infection.
Marine ecosystems worldwide have been widely affected by human activities. Credit: NCEAS

82
Scientists believe that amphibians are becoming more susceptible to B. dendrobatidis because of increased stress caused by pollution and climate change. Reid Harris of James Madison University and his colleagues isolated diff erent bacterial species from the skin of a common salamander and placed each species on B. dendrobatidis growing in a Petri dish. Harris and his colleagues then allowed red-backed salamanders to swim in a bath of these bacteria for 2 hours, then infected them with the lethal fungus. When investigated 18 days later, the salamanders given the bacterial bath were nearly 30 percent more likely to have rid themselves of the fungal infection than those that were not treated.
Harris suggests that adding fungus-fi ghting bacteria to ponds or sites frequented by threatened amphibians might reverse some of the population decline. Th e population decline of amphibians worldwide has baffl ed scientists for decades. Th is study off ers a glimmer of hope for dealing with the crisis. DEB Climate Change Report highlight
Long-Term Ecological Research Program to Examine Eff ects of Sea-Level Rise on South Florida
In the Everglades, climate change manifests primarily through sea-level rise and hurricanes. Sea-level rise, coupled with dramatically reduced freshwater infl ows to Everglade estuaries in the past century, has led to the landward retreat of mangrove wetlands. Hurricane storm surges across this very fl at landscape accelerate the landward transgression.
Sea-level rise also leads to saltwater intrusion of the shallow Biscayne Aquifer that supplies more than 6 million people with freshwater. Th us, both sea-level rise and changes in the frequency and intensity of storms threaten the long-term sustainability of freshwater supply to a growing
human population. In the face of these threats, restoration projects are seeking ways to increase freshwater fl ows to the coastal Everglades. Restoration may temporarily slow the landward encroachment of sea-level rise and enhance recharge of the critical Biscayne Aquifer; however, long-term consequences of climate change owing to sea-level rise confound the potential outcome of restoration.
New research at the Florida Coastal Everglades Long-Term Ecological Research Program is integrating social and natural science to assess the complex interactions of Everglades restoration, land-use changes driven by a growing human population, and water supply issues. Th e importance of this integrated research approach is addressed regularly in the news by increasing reports of hurricane landfalls, with Hurricanes Katrina and Rita as the most recent and dramatic examples. DEB Climate Change Report highlight
Sea-Level Rise Th reatens Mangrove ForestsSea-level rise threatens a host of coastal ecosystems, including mangrove forests. Th roughout the tropics, these ecosystems are situated between land and sea, and off er key ecological and societal benefi ts, including providing nursery and refuge habitat for
One of the Florida Coastal Everglades Long-Term Ecological Research sampling stations is located on the edge of the forest (center of photo). Credit: Victor H. Rivera-Monroy and Robert R. Twilley, FCE LTER Program and LSU
Ground view of Twin Cays, Belize, showing dwarf red mangroves (Rhizophora mangle) that are estimated to be more than 100 years old. These pygmy stands are common in the interior of oceanic islands in the Caribbean and are an important habitat for a variety of organisms. However, such areas are commonly targeted for development. Credit: K.L. McKee
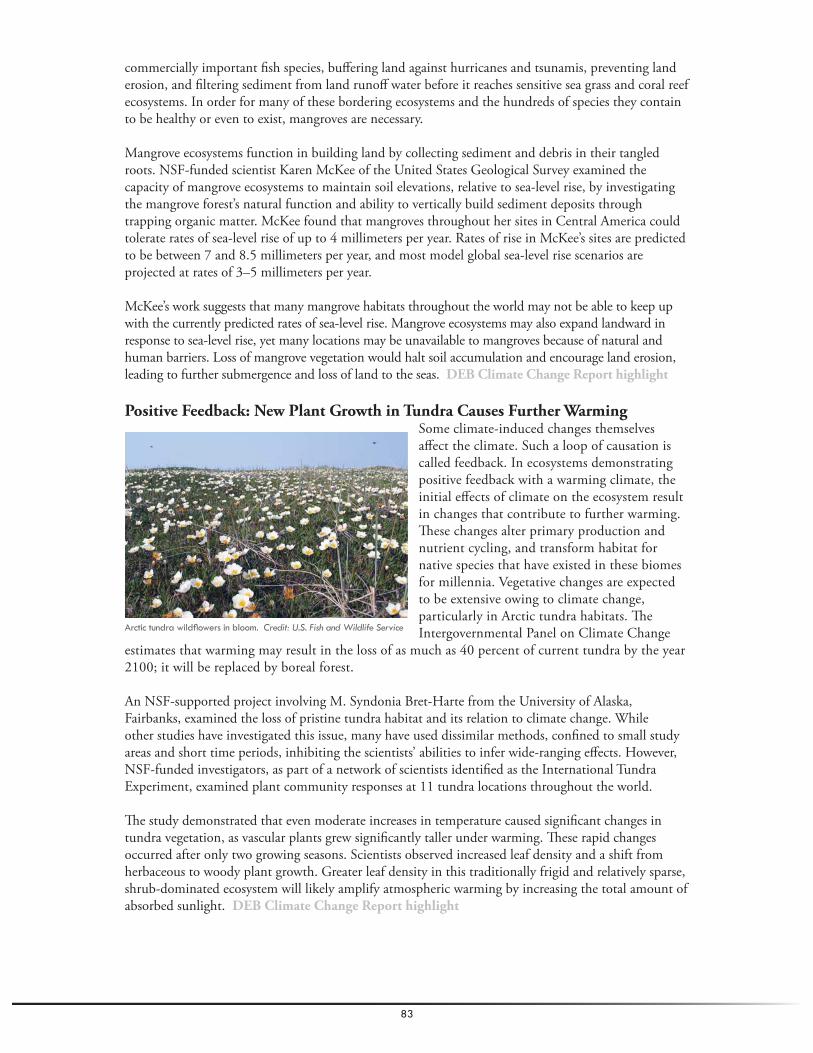
83
commercially important fi sh species, buff ering land against hurricanes and tsunamis, preventing land erosion, and fi ltering sediment from land runoff water before it reaches sensitive sea grass and coral reef ecosystems. In order for many of these bordering ecosystems and the hundreds of species they contain to be healthy or even to exist, mangroves are necessary.
Mangrove ecosystems function in building land by collecting sediment and debris in their tangled roots. NSF-funded scientist Karen McKee of the United States Geological Survey examined the capacity of mangrove ecosystems to maintain soil elevations, relative to sea-level rise, by investigating the mangrove forest’s natural function and ability to vertically build sediment deposits through trapping organic matter. McKee found that mangroves throughout her sites in Central America could tolerate rates of sea-level rise of up to 4 millimeters per year. Rates of rise in McKee’s sites are predicted to be between 7 and 8.5 millimeters per year, and most model global sea-level rise scenarios are projected at rates of 3–5 millimeters per year.
McKee’s work suggests that many mangrove habitats throughout the world may not be able to keep up with the currently predicted rates of sea-level rise. Mangrove ecosystems may also expand landward in response to sea-level rise, yet many locations may be unavailable to mangroves because of natural and human barriers. Loss of mangrove vegetation would halt soil accumulation and encourage land erosion, leading to further submergence and loss of land to the seas. DEB Climate Change Report highlight
Positive Feedback: New Plant Growth in Tundra Causes Further WarmingSome climate-induced changes themselves aff ect the climate. Such a loop of causation is called feedback. In ecosystems demonstrating positive feedback with a warming climate, the initial eff ects of climate on the ecosystem result in changes that contribute to further warming. Th ese changes alter primary production and nutrient cycling, and transform habitat for native species that have existed in these biomes for millennia. Vegetative changes are expected to be extensive owing to climate change, particularly in Arctic tundra habitats. Th e Intergovernmental Panel on Climate Change
estimates that warming may result in the loss of as much as 40 percent of current tundra by the year 2100; it will be replaced by boreal forest.
An NSF-supported project involving M. Syndonia Bret-Harte from the University of Alaska, Fairbanks, examined the loss of pristine tundra habitat and its relation to climate change. While other studies have investigated this issue, many have used dissimilar methods, confi ned to small study areas and short time periods, inhibiting the scientists’ abilities to infer wide-ranging eff ects. However, NSF-funded investigators, as part of a network of scientists identifi ed as the International Tundra Experiment, examined plant community responses at 11 tundra locations throughout the world.
Th e study demonstrated that even moderate increases in temperature caused signifi cant changes in tundra vegetation, as vascular plants grew signifi cantly taller under warming. Th ese rapid changes occurred after only two growing seasons. Scientists observed increased leaf density and a shift from herbaceous to woody plant growth. Greater leaf density in this traditionally frigid and relatively sparse, shrub-dominated ecosystem will likely amplify atmospheric warming by increasing the total amount of absorbed sunlight. DEB Climate Change Report highlight
Arctic tundra wildfl owers in bloom. Credit: U.S. Fish and Wildlife Service

84
Poison Ivy to Become More Toxic and Abundant Owing to Rising CO2 LevelsAn NSF-funded study points out that 80 percent of all humans develop symptoms of dermatitis upon exposure to poison ivy (Toxicodendron radicans). It is one of the most widely reported ailments at poison centers in the United States. Abundant in North America, the plant has been introduced in Europe and South Africa, and is invasive in Australia and New Zealand. Because of its wide distribution and response to increased global atmospheric carbon dioxide (CO2) levels, poison ivy presents a global public health concern.
NSF-funded researcher Jacqueline Mohan of the Ecosystems Center at the Marine Biological Laboratory conducted a 6-year study at the
Duke University Free-Air CO2 Enrichment experiment in which she assessed the impacts of elevated atmospheric CO2 on growth and survivorship of poison ivy in an intact forest. Mohan also examined the eff ect of CO2 levels on urushiol, the irritating chemical produced by poison ivy.
Mohan demonstrated that CO2 enrichment increased photosynthesis and the effi ciency of plant water-usage, and stimulated growth of poison ivy during the fi ve growing seasons. Increased CO2 levels increased the concentration of unsaturated urushiol by 153 percent, making the plant much more potent. Increased abundance of woody vines such as poison ivy is “choking” forests, causing tree mortality and slowing tree regeneration. Th ese fi ndings indicate that under projected levels of atmospheric CO2, poison ivy may grow larger, more abundant, and more noxious than it is today.DEB Climate Change Report highlight
Tropical Forests Aff ected by Climate ChangeClimate change poses a considerable threat to tropical forests throughout the world. NSF-funded scientists have studied the eff ects of climate change on small plants growing directly on trees in tropical cloud forests. Th ese plants, called epiphytes, act as “capacitors” to regulate seasonal precipitation because they absorb water and nutrients captured from rain and fog. Th e projection of reduced cloud water in tropical montane forests threatens these plants.
As a result of climate change, cloud water is predicted to decline in tropical montane forests. Nalini Nadkarni of Evergreen State College investigated the consequences of this reduction on
epiphytes. In her work, Nadkarni transplanted epiphytes to lower elevations with less cloud cover, thereby simulating the unfavorable conditions that are predicted. Her results suggest that climate change will cause decreased epiphyte growth and leaf production, as well as increased mortality.
Th e loss of epiphytes will have consequences for ecosystem biodiversity, productivity, and resilience, because these plants provide the habitat and resources to support a rich assortment of species within the forest canopy. Because so many species rely on epiphytes, their loss would have a cascading aff ect that would threaten many of the plants and animals that inhabit the canopy. Th e reduced cloud cover will reduce the amount of canopy-held soil, which could make the ecosystem changes permanent. DEB Climate Change Report highlight
Upon exposure to poison ivy (Toxicodendron radicans), 80 percent of humans develop symptoms of dermatitis. Abundant in North America, this plant has been introduced in Europe and South Africa, and is invasive in Australia and New Zealand. Credit: Courtesy of Jacqueline Mohan
This image shows cloud forest vegetation immersed in fog, which is a relatively frequent and persistent climatic phenomenon in these ecosystems. Credit: Martin Gomez-Cardenas, Iowa State University

85
Long-Term Study Leads to Elegant Understanding: Nitrogen CyclingNSF researchers have simplifi ed a previously complicated understanding of nitrogen release from decaying plants into the soil, making important contributions to global modeling of nitrogen and carbon cycles. Th e Long-Term Intersite Decomposition Experiment Team (LIDET), led by William Parton of Colorado State University, found that the amount of nitrogen released by bacteria as they decompose fallen leaves and dead roots is controlled universally by two factors: the initial concentration of nitrogen in the organic matter and the mass of the organic matter remaining. Th is information was used by LIDET to develop simple equations to model nitrogen release.
Because the controls for nitrogen release are the same at nearly every biome, modelers can use Parton’s equations to improve global climate change models. Understanding global nitrogen cycling is important, because the release of nitrogen from decaying matter by bacteria and fungi in the soil provides ammonium and nitrate to plants. Ammonium and nitrate, inorganic forms of nitrogen that are essential to plant growth, are often in short supply to plants and therefore limit plant growth. An improved understanding of the role of nitrogen release in decaying matter will help scientists understand plant growth, and therefore carbon uptake, in global climate models.
Th e researchers were able to develop a global understanding of nitrogen release as they repeated the same decomposition study at 21 sites encompassing diverse ecosystems ranging from tropical forests to tundra. After 10 years of measurements, the researchers synthesized their data using resources at the National Center for Ecological Analysis and Synthesis (NCEAS), a center funded by NSF that develops and tests important ecological ideas and theories using existing data. Th rough the work at NCEAS, LIDET found that the release of nitrogen was controlled by the same factors at nearly all of their sites. Th ey were able to use this information to develop a simple and elegant set of equations of nitrogen release. Highlight ID: 14053 BIO/DEB
Nitrogen: Th e Fertilizer of Climate Change ModelingPredictions about the eff ects on climate from increases in atmospheric carbon dioxide concentrations have been hampered by our inability to quantify how much carbon will be sequestered by the terrestrial biosphere. Carbon sequestration—the removal of carbon from the atmosphere and storage via biological or geological processes—has the potential to slow the rate of global warming. Scientists are seeking to understand how terrestrial ecosystems will respond to the increased availability of carbon and warmer conditions forecast by current models.
In a recent study, NSF-funded scientist Edward Rastetter and his colleagues linked carbon sequestration to the forms of nitrogen in an ecosystem. Th is enabled them to identify the availability of organic versus inorganic nitrogen for the chemical reactions driving biological processes such as plant growth. Using a simple model of carbon-nitrogen interactions in terrestrial ecosystems, they found that the available form of nitrogen was not important for short timescales (less than 60 years); however, over longer timescales (more than 60 years), rates of carbon sequestration were linked to the amount and form of nitrogen that had accumulated in the ecosystem. Specifi cally, they determined that losing organic nitrogen from the system works against carbon sequestration in the long term. Highlight ID: 11655 BIO/DEB
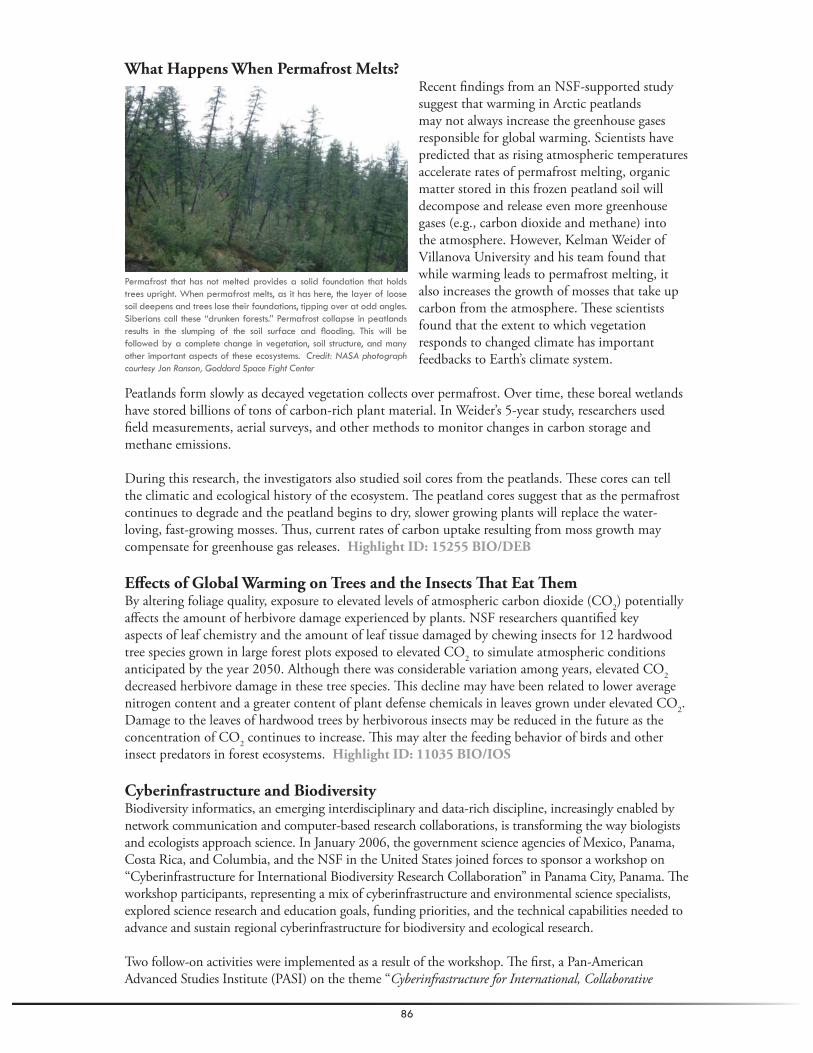
86
What Happens When Permafrost Melts?Recent fi ndings from an NSF-supported study suggest that warming in Arctic peatlands may not always increase the greenhouse gases responsible for global warming. Scientists have predicted that as rising atmospheric temperatures accelerate rates of permafrost melting, organic matter stored in this frozen peatland soil will decompose and release even more greenhouse gases (e.g., carbon dioxide and methane) into the atmosphere. However, Kelman Weider of Villanova University and his team found that while warming leads to permafrost melting, it also increases the growth of mosses that take up carbon from the atmosphere. Th ese scientists found that the extent to which vegetation responds to changed climate has important feedbacks to Earth’s climate system.
Peatlands form slowly as decayed vegetation collects over permafrost. Over time, these boreal wetlands have stored billions of tons of carbon-rich plant material. In Weider’s 5-year study, researchers used fi eld measurements, aerial surveys, and other methods to monitor changes in carbon storage and methane emissions.
During this research, the investigators also studied soil cores from the peatlands. Th ese cores can tell the climatic and ecological history of the ecosystem. Th e peatland cores suggest that as the permafrost continues to degrade and the peatland begins to dry, slower growing plants will replace the water-loving, fast-growing mosses. Th us, current rates of carbon uptake resulting from moss growth may compensate for greenhouse gas releases. Highlight ID: 15255 BIO/DEB
Eff ects of Global Warming on Trees and the Insects Th at Eat Th emBy altering foliage quality, exposure to elevated levels of atmospheric carbon dioxide (CO2) potentially aff ects the amount of herbivore damage experienced by plants. NSF researchers quantifi ed key aspects of leaf chemistry and the amount of leaf tissue damaged by chewing insects for 12 hardwood tree species grown in large forest plots exposed to elevated CO2 to simulate atmospheric conditions anticipated by the year 2050. Although there was considerable variation among years, elevated CO2 decreased herbivore damage in these tree species. Th is decline may have been related to lower average nitrogen content and a greater content of plant defense chemicals in leaves grown under elevated CO2. Damage to the leaves of hardwood trees by herbivorous insects may be reduced in the future as the concentration of CO2 continues to increase. Th is may alter the feeding behavior of birds and other insect predators in forest ecosystems. Highlight ID: 11035 BIO/IOS
Cyberinfrastructure and BiodiversityBiodiversity informatics, an emerging interdisciplinary and data-rich discipline, increasingly enabled by network communication and computer-based research collaborations, is transforming the way biologists and ecologists approach science. In January 2006, the government science agencies of Mexico, Panama, Costa Rica, and Columbia, and the NSF in the United States joined forces to sponsor a workshop on “Cyberinfrastructure for International Biodiversity Research Collaboration” in Panama City, Panama. Th e workshop participants, representing a mix of cyberinfrastructure and environmental science specialists, explored science research and education goals, funding priorities, and the technical capabilities needed to advance and sustain regional cyberinfrastructure for biodiversity and ecological research.
Two follow-on activities were implemented as a result of the workshop. Th e fi rst, a Pan-American Advanced Studies Institute (PASI) on the theme “Cyberinfrastructure for International, Collaborative
Permafrost that has not melted provides a solid foundation that holds trees upright. When permafrost melts, as it has here, the layer of loose soil deepens and trees lose their foundations, tipping over at odd angles. Siberians call these “drunken forests.” Permafrost collapse in peatlands results in the slumping of the soil surface and fl ooding. This will be followed by a complete change in vegetation, soil structure, and many other important aspects of these ecosystems. Credit: NASA photograph courtesy Jon Ranson, Goddard Space Fight Center

87
Biodiversity and Ecological Informatics,” took place at the University of Costa Rica and the Organization for Tropical Studies (OTS) La Selva Biological Research Station in late 2007. (PASIs are short training courses/workshops on a current research topic, supported by NSF and the Department of Energy.) Th e two-week PASI emphasized the development and application of Internet-based cyberinfrastructure tools for environmental research collaboration. Th e geographical focus for the PASI was the United States, Mexico, Colombia, Costa Rica, and the other countries of Central America.
Second, an NSF Small Grant for Exploratory Research (SGER) award will create a working group of environmental and network researchers from the United States and Latin America. Th is working group will evaluate networking and software requirements for an environmental sensor network in the rainforest at the OTS La Selva Biological Research Station. Th e output of this study will feed into a regional, open-source software collaboration for environmental monitoring and sensing.
Together, these activities represent strong, focused steps in collaborative research community-building and student training, with a particular emphasis on cyberinfrastructure and computational methodologies needed to advance regional-scale environmental research. Biodiversity researchers, who have long worked across political boundaries on biological systems, will see their collaborative eff orts enabled and transformed using international network communication and services. Highlight ID: 13683 OD/OISE
How Climate Change Is Choking Marine EcosystemsWhile investigating the eff ects of climate change on nitrogen cycling in temperate coastal systems, Rhode Island researchers made the fi rst scientifi c link between warming and fundamental changes in nutrient cycles. Researchers found that the observed estuary shifted from acting as a nitrogen fi lter to acting as a nitrogen source—which has a profoundly negative impact on marine ecological systems. Previously, when denitrifi cation (removal of nitrogen) dominated the cycle, coastal marine sediments cleansed the water of excess nitrogen. When nitrogen fi xation, the process of converting nitrogen into a biologically usable form of nitrogen (such as ammonium or nitrate), dominated the cycle, more nitrogen was brought into the system. Researchers discovered that the sediments added more than 1.5 times the amount of nitrogen from the land and atmosphere combined. If this process is happening in other places, the sediments can produce large amounts of nitrogen, which could have signifi cant consequences for off shore systems. Th e investigator who led the research is now examining nitrogen cycling in the Louisiana wetlands to determine whether similar conditions exist. Highlight ID: 16943, OD/OIA
EcoPod: An Electronic Field Guide for Informed Amateurs and ProfessionalsEcoPod is a PDA-based mobile capture and access system that enhances the value of observations made by researchers and citizen-scientists—trained volunteers who work on real-world questions—around the globe by increasing both the effi ciency of the identifi cation process and its reliability. Biological studies rely heavily on large collections of observations of species. For example, changes in the abundance of certain species or the timing of life events, such as fl owering time, are critical to understand the eff ects of urbanization and climate change or the invasion of foreign animal species on local crops. Professional eff orts are limited by geography and time. Th us, expanded access to easy-to-use tools can allow amateurs to make important scientifi c contributions. Communities of amateurs have yielded key insights, for example, in identifying critical habitat for the Monarch butterfl y or changes in bird migration patterns and abundance. Th e challenge with such contributions is their questionable quality.
Identifi cation is done by decision trees (graphs of decisions with branches showing alternatives), which are called “keys” in biology. EcoPod technology saves time by soliciting as little information from the user as possible to identify a species. Th is optimization of minimization is accomplished by continuously analyzing the most discriminating questions to ask the user about the specimen at hand and selecting only the characteristics that can be observed in the fi eld at a given time and location; that is, the system has context awareness. At the same time, EcoPod places no restrictions on the order in which its users enter characteristics they observe. Th e tool records the results of identifi cations and

88
creates a step-by-step record of the identifi cation process, thereby providing an audit trail for quality assurance. Th e system also has rapid recovery from mistakes and terminates the process when no additional steps are necessary to make an identifi cation. Users may create and attach written notes and photos to decision points along the way. All of this can be uploaded to large databases, such as eBirds or “Butterfl ies I’ve Seen,” without additional transcription to Web-forms.
While designed with ecologists and other fi eld researchers in mind, the technology can be generalized to other observation-based decision processes, such as systematics, medicine, design, and other evidence-based professions. Highlight ID: 12200 CISE/IIS
Nature Versus Nurture: How Does Genetic Structure Aff ect Plant Response to Environmental Cues?Why did daff odils and cherry trees bloom in the middle of January in Washington, D.C., in 2007? Will such unseasonable fl owering be common in the future as global warming leads to milder winters? If so, how will this seasonal mismatch aff ect crop yields or the persistence of wild plant populations? To answer such questions, it is important to understand how plants combine information from multiple environmental cues—such as day length, growth temperature and past winter chilling—to fl ower in favorable seasonal conditions, and how natural genetic diff erences in responses to these cues allow plants to inhabit diverse geographic regions and respond to ongoing climate change. An interdisciplinary research team, headed by Johanna Schmitt, is studying natural genetic variation in fl owering responses in the tiny weed Arabidopsis thaliana (mouse ear cress). Th is plant—a close relative of crops such as canola, broccoli, and cabbage—is the principal model used in molecular plant genetics research.
Arabidopsis is native to Eurasia and present throughout most of North America. Across the native range, the species inhabits a wide range of climates, from Mediterranean to subarctic. To investigate the genetic mechanisms underlying this broad climatic range, the research team is collecting molecular, genetic, and ecological data for sets of plants derived from the diff erent ecological and environmental settings (ecotypes) of A. thaliana across the native geographic ranges. Th ey are testing whether observed DNA variation of the ecotypes is associated with natural geographic diff erences in fl owering responses. At the same time, the team is growing the ecotypes under natural fi eld conditions in diff erent sites in Spain, eastern and western Germany, England, and Finland, in collaboration with seven leading European Arabidopsis researchers, to determine how natural genetic variation in the fl owering mechanisms aff ects performance across the climatic range of the species.
Preliminary fi ndings suggest that a natural variant of a single gene can change the entire life cycle of the plant from one that requires winter chilling for fl owering and has one generation per year to one that does not require chilling to fl ower and has several generations per year in regions where the growing season is long and mild. As in the United States, recent winter weather has been unusually warm in Europe, so the team has also had an unexpected opportunity to examine its eff ects on the fl owering and reproductive success of Arabidopsis plants under fi eld conditions, taking detailed measurements of the environmental cues the plants experience in each site. Just like the cherry trees in Washington, many of the experimental plants fl owered unexpectedly and unseasonably early, which allowed the team to examine the genetic basis of fl owering responses to a warming climate.
Understanding how natural genetic diff erences aff ect fl owering patterns in response to environmental cues is an important step in recognizing the overall interplay of environmental infl uences on genetics. Th is groundbreaking research could not only advance the understanding of plant genetics and development, but could potentially lead to advances in crop engineering and other pioneering fi elds. Highlight ID: 16938, BIO/EF

89

90
Th e last piece of the climate puzzle is perhaps the most complicated and dynamic of all: people. Th e overwhelming majority of climate researchers have reached the understanding—based on decades of evidence, modeling, and debate—that it is extremely likely1 that human activities are responsible for rising temperatures on Earth. Human behavior will continue to be a major factor in climate change research, and understanding the feedbacks between human behavior and climate variability is critical.2 Humans can adopt social and commercial practices and implement government policies and laws that signifi cantly aff ect greenhouse gas emissions. We can increase our energy effi ciency and invent alternative fuel sources for our energy-intensive activities. And human ingenuity might even provide geoengineering technologies capable of reversing some of the eff ects of anthropogenic climate change.
NSF supports research in all non-health-related human sciences. Some academic fi elds, such as sociology, rely almost exclusively on NSF for government research funding in the United States. Overall, NSF provides approximately 61 percent of federal support for basic research in the social sciences at U.S. academic institutions.3 NSF’s tradition in the social, behavioral, and economic sciences has emerged as a key strength for climate change research. Not only must human systems be factored into climate projections, but an understanding of human science provides the entire research community with the opportunity to learn how to eff ectively communicate research fi ndings to society. At NSF, we see the transformative research of the future emerging at the boundaries between the traditional scientifi c and engineering disciplines, and climate change is no exception. Some of the most compelling and paradigm-changing research results have come from multidisciplinary teams that include the human science aspect.
1 “From new estimates of the combined anthropogenic forcing due to greenhouse gases, aerosols and land surface changes, it is extremely likely that human activities have exerted a substantial net warming influence on climate since 1750.” Solomon, S., et al., Technical Summary, in Climate Change 2007: The Physical Science Basis. Contribution of Working Group I to the Fourth Assessment Report of the Intergovernmental Panel on Climate Change, Cambridge University Press, 2007, p. 81.
2 Pfirman, S., and the AC-ERE, Complex Environmental Systems: Synthesis for Earth, Life, and Society in the 21st Century, 2003.
3 NSF FY2009 Budget Request to Congress, SBE-2.
PEOPLE
Top image credit: © 2009 JupiterImages Corporation

91
In addition to supporting the social, behavioral, and economic sciences, NSF addresses the human aspect of climate change through education. NSF research grants to academic institutions not only provide funds for research equipment, overhead costs, and infrastructure, they also enable principal investigators (PIs) to off er fi nancial support to undergraduate and graduate students and postdoctoral researchers training to become the next generation of scientists and engineers dedicated to studying climate change and addressing its impacts. NSF PIs frequently share their time and resources through educational outreach activities involving undergraduate and K–12 students, and members of the community at large. Th ese outreach activities, along with NSF-supported formal and informal education programs (including classroom materials, television programs, and Web sites), engage and educate students and members of the public about scientifi c and technological issues, including climate change.
Engineering and the physical sciences hold the potential to provide breakthrough technologies in energy, transportation, construction, and other human endeavors that aff ect the climate. Progress in these hard sciences infl uences human-factors research as we strive to understand the emergence, dissemination, and adoption of new knowledge and advanced technologies. Th ese tools have the potential to help us adapt to climate change, as well as reduce—and perhaps one day reverse—anthropomorphic greenhouse gas accumulation in the atmosphere.
Modeling Human BehaviorHuman behavior may be the most mercurial of all the variables confronting climate modelers. While other parameters follow the laws of physics, human behavior depends on social norms and values, economic forces, technological advances, government policies, and other factors that are all but impossible to account for in physical models. In the latest Intergovernmental Panel on Climate Change (IPCC) report, human behavior was factored into future projections by assuming diff erent levels of greenhouse gas emissions. Th ese scenarios depend on varying levels of economic growth, the adoption of various energy-effi cient practices and technologies, and more or less stringent cultural and government infl uences on energy systems. Th e integrated climate models of the future will need to account for the critical human factor, including the behavior of groups of humans. Humans may represent the most complex and dynamic of systems to model. Computational models will allow us to begin to understand the phenomena of emergent behavior and tipping points in human interactions.
Computer science and engineering continue to have a profound impact on humanity’s ability to track and predict climate change and to manage our response to it. Advances in computational tools must involve advances in the human interface. Computational methods provide visualization tools that help people process and handle complex information. One example of an advanced visualization tool is the Highly Interactive Parallelized Display Wall (HIPerWall) project, a facility aimed at advancing Earth science modeling and visualization. HIPerWall is being used to analyze IPCC data sets.4 Other human interface advances will come in the form of intelligent software that makes results accessible and useful to policymakers, and networking tools to promote collaboration among research groups around the world.
4 NSF Highlight 12691: HIPerWall: Development of a High-Performance Visualization System for Collaborative Earth System Sciences.
In this graphic from the Intergovernmental Panel on Climate Change (IPCC) Assessment Report 4 (Figure SPM.5), colored lines represent projections from six different emission scenarios developed in the IPCC’s 2000 Special Report on Emission Scenarios (SRES). Each scenario represents emissions resulting from a set of assumptions about world economic and population growth rates, and the adoption of varying degrees of resource-effi cient technologies. The panel on the left shows greenhouse gas emissions in the absence of climate policies: six SRES scenarios and the 80th percentile range of recent scenarios published since the SRES (gray shaded area). The panel on the right shows the surface warming projections for the SRES scenarios. The pink line is not a scenario, but represents simulations where atmospheric concentrations of greenhouse gases are held constant at year 2000 values. The bars at the right indicate the likely range of the SRES scenarios for 2090–2099. All temperatures are relative to the period 1980–1999. Credit: Intergovernmental Panel on Climate Change (IPCC) Assessment Report 4 (Figure SPM.5), www.ipcc.ch/index.htm
Collaboration and concurrent visualization of 20 simulation runs performed by the International Panel on Climate Change (IPCC). The Highly Interactive Parallelized Display Wall (HIPerWall) project provides unprecedented high-capacity visualization capabilities to experimental and theoretical researchers. Credit: Falko Kuester, California Institute for Telecommunications and Information Technology, University of California-San Diego

92
As climate models improve, researchers will continue to provide more accurate and detailed predictions of climate on temporal and spatial scales of great signifi cance to policymakers. Regional climate predictions that integrate the region’s biological, social, and economic characteristics and trends will make the projections all the more useful.5
Decisionmaking In the complex, multifaceted area of climate change, uncertainties abound. Climate modeling attempts to take into account every variable researchers can quantify, but there will always be unknowns. Given that the uncertainties in the projections of future temperature, precipitation patterns, species adaptation, and
many other variables cannot be fully resolved; and given that government offi cials, business owners, and the public at large will have to make decisions on the basis of uncertain science, NSF funds three Decision Making Under Uncertainty (DMUU) Centers and two interdisciplinary research teams to tackle these issues.
Th e Decision Center for a Desert City (DCDC) at Arizona State University uses nearby Phoenix as a laboratory for studying adaptation strategies, especially those related to water management in an arid climate. Th e city’s past successes in managing its water supply are being challenged by current drought conditions. A multidisciplinary team of researchers and local water managers are confronting the question of whether this
desert city has enough water to sustain growth, given that many climate models predict that the western United States will be warmer and drier in future decades.6 DCDC has led to the development of practical computational models used by decisionmakers in the Phoenix area, and the center will serve as a model for other Western cities facing similar water problems as a result of the changing climate.
At Carnegie Mellon University’s Climate Decision Making Center, researchers focus on how to deal with “irreducible uncertainties”—the limits of our understanding of climate change and its impacts. Th e center has developed methods for policymakers to rank ecological risks, incorporating the informed judgments of ordinary citizens along with input from experts. Th is combined approach to risk analysis can be used as a model for other risk-management decisions.7
At Columbia University, the Center for Research on Environmental Decisions (CRED) studies individual and group decisionmaking under climate uncertainty. CRED seeks to improve risk communication and increase the use of scientifi c information on climate variability and change.8
Two research teams were also funded under the fi rst DMUU solicitation. Th e University of Colorado at Boulder’s Science Policy Assessment and Research on Climate (SPARC) team examines many issues relating to policy informed by science, including the economic implications of more frequent and intense disaster events such as storms and fl oods.9 A research team from the RAND Corporation focuses on water management issues in California and the design of observational systems to provide warning of abrupt climate change.10
5 Pfirman, S., and the AC-ERE, Complex Environmental Systems: Synthesis for Earth, Life, and Society in the 21st Century, 2003, p. 26.
6 NSF Highlight 16008: Water-Related Decision Making for a Desert City.
7 NSF Highlight 10357: Ecological Risk Ranking: A Method for Improving Public Participation.
8 Center for Research on Environmental Decisions Web site: www.cred.columbia.edu/about.
9 NSF Highlight 16006: Science Policy Assessment and Research on Climate (SPARC) for Decision Making Under Uncertainty.
10 NSF press release 04-132: Climate Change a Focus of New NSF-Supported Research on How Decisions Are Made in a World of Uncertainty: www.nsf.gov/news/news_summ.jsp?cntn_id=100447.
The Phoenix, Arizona, skyline. The Decision Center for a Desert City at Arizona State University uses nearby Phoenix as a laboratory to study water management and other climate change adaptation strategies. The fi ndings could have implications for other cities in the American West and beyond. Credit: Tim Trumble/ASU-CAP LTER
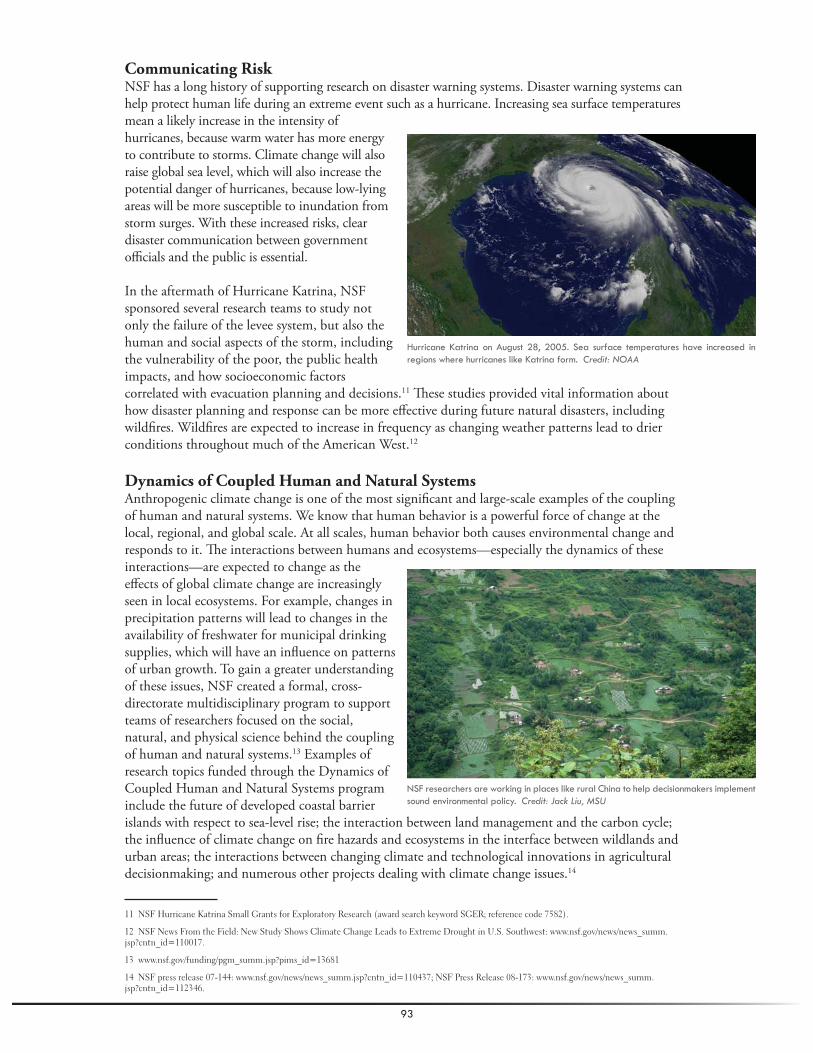
93
Communicating RiskNSF has a long history of supporting research on disaster warning systems. Disaster warning systems can help protect human life during an extreme event such as a hurricane. Increasing sea surface temperatures mean a likely increase in the intensity of hurricanes, because warm water has more energy to contribute to storms. Climate change will also raise global sea level, which will also increase the potential danger of hurricanes, because low-lying areas will be more susceptible to inundation from storm surges. With these increased risks, clear disaster communication between government offi cials and the public is essential.
In the aftermath of Hurricane Katrina, NSF sponsored several research teams to study not only the failure of the levee system, but also the human and social aspects of the storm, including the vulnerability of the poor, the public health impacts, and how socioeconomic factors correlated with evacuation planning and decisions.11 Th ese studies provided vital information about how disaster planning and response can be more eff ective during future natural disasters, including wildfi res. Wildfi res are expected to increase in frequency as changing weather patterns lead to drier conditions throughout much of the American West.12
Dynamics of Coupled Human and Natural SystemsAnthropogenic climate change is one of the most signifi cant and large-scale examples of the coupling of human and natural systems. We know that human behavior is a powerful force of change at the local, regional, and global scale. At all scales, human behavior both causes environmental change and responds to it. Th e interactions between humans and ecosystems—especially the dynamics of these interactions—are expected to change as the eff ects of global climate change are increasingly seen in local ecosystems. For example, changes in precipitation patterns will lead to changes in the availability of freshwater for municipal drinking supplies, which will have an infl uence on patterns of urban growth. To gain a greater understanding of these issues, NSF created a formal, cross-directorate multidisciplinary program to support teams of researchers focused on the social, natural, and physical science behind the coupling of human and natural systems.13 Examples of research topics funded through the Dynamics of Coupled Human and Natural Systems program include the future of developed coastal barrier islands with respect to sea-level rise; the interaction between land management and the carbon cycle; the infl uence of climate change on fi re hazards and ecosystems in the interface between wildlands and urban areas; the interactions between changing climate and technological innovations in agricultural decisionmaking; and numerous other projects dealing with climate change issues.14
11 NSF Hurricane Katrina Small Grants for Exploratory Research (award search keyword SGER; reference code 7582).
12 NSF News From the Field: New Study Shows Climate Change Leads to Extreme Drought in U.S. Southwest: www.nsf.gov/news/news_summ.jsp?cntn_id=110017.
13 www.nsf.gov/funding/pgm_summ.jsp?pims_id=13681
14 NSF press release 07-144: www.nsf.gov/news/news_summ.jsp?cntn_id=110437; NSF Press Release 08-173: www.nsf.gov/news/news_summ.jsp?cntn_id=112346.
Hurricane Katrina on August 28, 2005. Sea surface temperatures have increased in regions where hurricanes like Katrina form. Credit: NOAA
NSF researchers are working in places like rural China to help decisionmakers implement sound environmental policy. Credit: Jack Liu, MSU

94
Arctic Social SciencesEarth’s Arctic region has experienced more signifi cant climate change than perhaps any other area on Earth. Th e intact native cultures spread around the Arctic Circle present a unique opportunity for social scientists to study and document cultures in fl ux. Many indigenous people depend on hunting the native species of the Arctic, not only for food, but also as the basis for cultural identity. More unpredictable weather and diminishing sea ice are reducing access to cultural hunting grounds.15
With their cultural sensitivity to changing environmental conditions, native people may see patterns and changes that researchers might miss. To capture native knowledge and involve native people in the study of their own environment, NSF-funded researchers have enlisted the input of native people in environmental observation, while at the same time helping the people document and preserve their cultural heritage for future generations. Th e knowledge and observations passed on to indigenous people from their ancestors provide researchers with an invaluable source of information about climate change.
Th e Exchange for Local Observations and Knowledge of the Arctic ProjectThe Exchange for Local Observations and Knowledge of the Arctic (ELOKA) project is an International Polar Year–related activity supported by NSF. The data management and networking project helps collect, preserve, exchange, and use the knowledge of local Arctic residents and indigenous people. Through local and traditional knowledge, research, and community-based monitoring, Arctic communities are making significant contributions to understanding their changing environment.
EducationOne of NSF’s strategic goals is a public that is engaged and well informed about science and technology. To achieve this goal, NSF funds science and engineering programs and activities in both formal and informal settings. Formal settings include classrooms, while informal education can take place through informative television programs, Web sites, museum exhibits, and other settings where people of all ages and backgrounds can be reached. By communicating the science behind climate change, NSF is committed to ensuring that the public will be prepared to make choices about how to handle the eff ects of climate change. An informed citizenry will be able to make sound decisions about local issues such as coastal development, municipal water supplies, and agricultural land use.
Th e International Polar Year created worldwide interest in polar science and provided researchers with the opportunity to share their stories through videos on the Web, television reports and documentaries, and interviews with journalists.16 On Web sites hosted by scientifi c programs such as
15 ACIA, Impacts of a Warming Arctic: Arctic Climate Impact Assessment, Cambridge University Press, 2004, p. 11.
16 For example, www.ipy.org/Default.aspx?tabid=67; www.waisdivide.unh.edu/multimedia; http://neptune.gsfc.nasa.gov/wais/waisFlash/index.htm; www.polenet.org/polenet_schools.htm; www.andrill.org/flexhibit/index.html.
A new study of living conditions in the Arctic indicates that traditional ways of life are important to indigenous people and that wages earned in the cash economy often are used to support traditional folkways. Credit: Glenn Williams and Narwhal Tusk Research
NSF funds educational organizations, including San Francisco’s Exploratorium science museum, to produce materials that engage and educate the public, such as the Exploratorium’s award-winning Global Climate Change Research Explorer Web site. Credit: © 2002 The Exploratorium

95
the West Antarctic Ice Sheet Initiative, POLENET (Polar Earth Observatory Network), ANDRILL (Antarctic Geological Drilling), and others, teachers and students can fi nd a wealth of age-appropriate information, animations, videos, and other interactive and educational materials. One polar science–related Web site, www.penguinscience.com, draws on the public’s love for penguins to educate people about the eff ects of climate change on penguin habitats.
Another NSF-funded, Web-based climate change research education tool is the Exploratorium’s award-winning Global Climate Change Web site, a colorful, fact-fi lled site where people of all ages can explore the various aspects of climate change research and even submit questions on particular topics.17
Alaska Lake Ice and Snow Observatory NetworkTh e NSF-supported Alaska Lake Ice and Snow Observatory Network (ALISON) program is a science education and scientifi c research partnership between the University of Alaska, Fairbanks, and the K–12 education community in Alaska. Th e project blends science and science education in rural and urban classrooms throughout Alaska.18 ALISON participants monitor Alaska lake ice thickness and duration, which are sensitive indicators of climate variability and change. ALISON involves the Alaskan community in this research, supporting teacher professional development and student learning in the local context. ALISON serves the dual purpose of collecting valuable environmental observational data and alleviating some of the physical and professional isolation that causes high teacher turnover rates in Alaska at the expense of student performance in science and mathematics.19
Developing Ocean LiteracyTh e often-devastating consequences of global climate change, ocean acidifi cation, and the collapse of commercial fi sheries illustrate the powerful role that ocean processes play in shaping the human condition. Preventing or mitigating these consequences requires that ocean scientists, educators, and policymakers work together so that informed choices are made for the common good.
NSF’s Centers for Ocean Sciences Education Excellence have been instrumental in promoting the development of ocean literacy concepts on a national scale. In June 2006, NSF co-sponsored the Conference on Ocean Literacy, which brought together representatives from federal agencies, experts in formal and informal education, nongovernmental organizations, and industry representatives to lay the groundwork for developing a national strategy for an ocean-literate society. Th e recommendations from the conference include revamping curricular standards; improving links among research communities, educators, and government agencies; and fostering regional and national networks. Th e collective recommendations represent a major advance in meeting the challenge of increasing public understanding of ocean processes.20
17 Global Climate Change: Research Explorer: www.exploratorium.edu/climate/index.html.
18 NSF Highlight 8705: The Alaska Lake Ice and Snow Observatory Network (ALISON): A Statewide K–12 and University Science Education and Research Partnership.
19 ALISON Web site: www.gi.alaska.edu/alison.
20 NSF FY 2009 Budget Request to Congress: www.nsf.gov/about/budget/fy2009/pdf/20_fy2009.pdf.
Eighth-grade students from Anvil City Science Academy (ACSA) in Nome, Alaska, drill a hole in the ice on the ACSA Pond before measuring the ice thickness. The site is part of the ALISON (Alaska Lake Ice and Snow Observatory Network) program, a science education and scientifi c research partnership between the University of Alaska, Fairbanks, and the K–12 education community in Alaska. Credit: Martin Jeffries, Geophysical Institute, University of Alaska, Fairbanks
Geologist Tracy Jones gives high school students a hands-on opportunity to learn about their local marine environment. NSF’s Centers for Ocean Science Education Excellence integrates ocean science research into high-quality education programs, promoting a deeper public understanding of the oceans and their infl uence on our quality of life and national prosperity. Credit: John Dindo, Dauphin Island Sea Lab

96
TechnologiesNSF-funded researchers are working on innovative technologies that can reduce the eff ects of humans on Earth’s climate. NSF-funded basic research is the feedstock that engineers and entrepreneurs will use to create these technologies.
NSF-funded engineers are rethinking everything from how computer chips are powered21 to how new buildings are constructed to fi nd new ways to make human activities more energy-effi cient, thus reducing carbon emissions. For example, researchers are developing a thin-fi lm technology that adheres both solar cells and heat pumps onto surfaces, ultimately turning a building’s walls and windows into a climate-control system that harvests the Sun’s energy to heat and cool.
Innovative energy solutions will not only lead to reductions in greenhouse gas emissions, they also have the potential to fuel the American economy. NSF funds alternative energy research focused on next-generation solar cell materials,22,23,24,25 biofuel production,26,27 strategies for matching alternative energy production to consumer demand,28 new fuel cell designs and materials,29,30 and novel methods of converting mechanical energy into electrical energy,31 among others. NSF’s Small Business Innovation Research (SBIR) and Small Business Technology Transfer (STTR) programs fund small companies that are seeking new ways to power the planet.
In addition, numerous NSF-funded centers and research projects focus in whole or in part on alternative energy, environmental, and other forward-thinking green technologies. For example, NSF-funded researchers are pursuing catalytic methods for producing high-octane fuels from biomass.32 With alternative energy sources such as wind turbines already joining the electric grid, and with emerging alternative energies on the horizon, NSF-funded engineers have turned their attention to the nation’s aging electric grid. Th e grid in its current confi guration was not designed for distributed generation sources such as wind and solar farms, and cannot accommodate large numbers of these systems. NSF-supported researchers are redesigning the methods used to control
21 NSF Highlight 14470: Saving Power and Energy in Computer Systems.
22 NSF 07-43, Benchmarks of NSF Innovation: www.nsf.gov/news/reports/nsf0743/7plastic.jsp.
23 ANTEOS, Inc.: www.nsf.gov/awardsearch/showAward.do?AwardNumber=0822652.
24 NetCrystal, Inc.: www.nsf.gov/awardsearch/showAward.do?AwardNumber=0810717.
25 NanoGreen Solutions Corporation: www.nsf.gov/awardsearch/showAward.do?AwardNumber=0810026.
26 Cortright, Randy, Virent Technologies, Inc, briefing to U.S. Congress, September 2008.
27 Edenspace Systems Corp.: www.nsf.gov/awardsearch/showAward.do?AwardNumber=0810640.
28 Dixon Ladd LLC: www.nsf.gov/awardsearch/showAward.do?AwardNumber=0740001.
29 Faraday Technologies, Inc.: www.nsf.gov/awardsearch/showAward.do?AwardNumber=0740077.
30 Energetics Incorporated: www.nsf.gov/awardsearch/showAward.do?AwardNumber=0750325.
31 Tetramer Technologies LLC: www.nsf.gov/awardsearch/showAward.do?AwardNumber=0739814.
32 NSF press release 08-056: www.nsf.gov/news/news_summ.jsp?cntn_id=111392.
Wind farms like this one near Lamar, Colorado, provide electricity without producing carbon dioxide emissions. NSF researchers are exploring new ways to incorporate alternative energy sources, such as wind farms, into the national power grid. Credit: Bob Henson
Konarka Technologies, Inc., a recipient of several NSF Small Business Innovation Research grants, is working to bring fl exible solar cells based on specialized plastic materials to the marketplace. Credit: Konarka Technologies, Inc.

97
distributed generation sources to enable more alternative energy installations to be incorporated into the power grid.33 NSF’s Energy for Sustainability program has made dozens of awards to researchers studying topics including improving the storage capacity of batteries, new types of fuel cells, harnessing microbes to produce electricity, and new materials for hydrogen storage, to name a few.34
Strategies for the FutureScience and engineering not only have the potential to reduce the amount of greenhouse gases humans put into the atmosphere, they also have the potential to one day help reduce the impact of anthropogenic climate change. A recent NSF-sponsored workshop focused on the use of carbon dioxide (CO2) as a feedstock for the manufacture of transportation fuels and other products. Using CO2 in this manner has the potential to “recycle” carbon that would otherwise end up in the atmosphere.35 Other NSF-funded researchers are exploring ways to stimulate the growth of foraminifera and other carbon-fi xing plankton in the ocean to allow more of these organisms to live, die, and sink to the bottom of the sea, removing carbon from the atmosphere in the process. Still other NSF-supported researchers are exploring methods for removing CO2 from the exhaust of industrial processes36 and underground containment strategies for sequestering carbon.37
ConclusionTh e human contribution to global climate change is nearly indisputable. But so, too, is the human ability to innovate and to change course. NSF funds research in the many aspects of “people science,” from social, behavioral, and economic science to high-tech physical science and engineering. Th e common link is research relating in one way or another to people and their behavior. None of the climate change research funded by NSF, or by any organization, would be meaningful without human beings to learn from it and apply the knowledge to some endeavor, such as building a better climate model, planning a strategy to save a species or ecosystem, creating a law to cap carbon emissions, or designing a new set of experiments to address the next unanswered question. Th e research highlights that follow describe a variety of research projects aimed at the human aspect of climate change. Social, behavioral, and economic science; education; and green technologies are some of the featured research areas. Th ese research projects have not only contributed to our understanding of the role of people in climate change, they have also provided learning opportunities for the students who will become the next generation of scientists and engineers.
33 NSF Highlight 15233: Improving Grid Reliability with Distributed Energy and Storage.
34 www.nsf.gov/awardsearch/tab.do?dispatch=4 (search element code 7644).
35 Reversing Global Warming: Chemical Recycling and Utilization of CO2. NSF-sponsored workshop, July 2008.
36 NSF Highlight 12867: Carbon Dioxide Removal—Microscopic Chemical Membrane Versus Cumbersome Gas Plant.
37 NSF Highlight 15796: International Workshop Explores Bio-Geo Engineering Research Opportunities.
NSF-funded researchers are exploring catalytic methods for converting corn stover (the plant material left over after the grain is harvested) into biofuels, including biogasoline and biodiesel. Credit: National Renewable Energy Laboratory

98
Water-Related Decisionmaking for a Desert CityTh e Decision Center for a Desert City (DCDC) at Arizona State University focuses on water-related decisionmaking in the arid Phoenix metropolitan area. A transdisciplinary team of scientists led by Patricia Gober and local water managers is confronting the pertinent question of whether this desert city has enough water to sustain growth, given that the western United States is expected to be warmer and drier in future decades. Center researchers have built a new model of science and policy engagement that allows water managers and scientists to collaborate on important research questions and
experiment with new methods, visualizations, and decision tools so that policymakers can make better decisions for their cities, states, and regions.
DCDC’s signature product, WaterSim, integrates a number of quantitative models that represent water consumption and availability in central Arizona under varying scenarios of population growth, climate change, individual behavior, and policy choices. WaterSim links the results of the center’s research projects into an interactive tool that allows users to explore the landscape of plausible futures and consider the strategies for avoiding unacceptable scenarios. DCDC’s knowledge, tools, and visualizations are jointly produced, as scientists mine new insights for model development and water managers ensure that the model itself is consistent with the decision context in which it will be used. Model results support scenario planning at the municipal level, highlight the need for water conservation, and demand management at the regional level to avoid the deleterious consequences of worst-case climate change conditions.
WaterSim currently characterizes only the metro Phoenix water situation. Once refi ned, the model’s methods will be transferable to cities around the globe. Beyond the obvious application to regional water supplies in other cities challenged by the uncertainties of climate change and growth, this approach also can be used to support decisions about entire river basins or watersheds. Center researchers plan to integrate regional data to properly assess the vulnerabilities in the water supply from the Lower Colorado River Basin, with Las Vegas, Los Angeles, and Tucson as the potential partners. WaterSim is available to the general public on the Web (http://watersim.asu.edu). Local high schools are testing WaterSim with an eye toward linking new scientifi c knowledge and student learning, with societal needs and policy choices. Highlight ID: 16008 SBE/SES
Ecological Risk Ranking: A Method for Improving Public ParticipationTo improve public participation in environmental decisionmaking, regulators and risk managers report that they need judgments from average citizens who have taken the time to develop thoughtful, informed views about a set of risks. Granger Morgan, Michael DeKay, Paul Fischbeck, and others at Carnegie Mellon University extended their risk-ranking method to incorporate ecological risks and their attributes. Th e method combines input from experts with judgments from ordinary citizens in a deliberative process. Th e experts identify relevant risks, categorize them, and organize the discussions, and the citizens provide judgments and ratings. Results were consistent with those from previous studies involving only health and safety hazards, providing additional evidence for the validity of the method. Participants reported that they were satisfi ed with the procedures and results, and indicated their support for using the method to advise real-world risk-
People Research Highlights
Lake Mead National Recreation Area, Nevada. Credit: National Park Service

99
management decisions. Although groups placed more weight on health and safety attributes than on environmental attributes, they considered attributes refl ecting signifi cant environmental impacts to be important. Highlight ID: 10357 SBE/SES
Science Policy Assessment and Research on Climate for DecisionmakingUnder UncertaintyScientists have warned that the costs of future disasters likely will increase because of more frequent and intense extreme events, such as storms and fl oods. Disaster losses also are expected to increase over time because more people, property and wealth will occupy locations exposed to extreme events. Th e destructive potential for hurricanes in Miami Beach, for example, is much greater because of dramatic increases in development over recent decades.
Working together on the Science Policy Assessment and Research on Climate (SPARC) project, Roger Pielke, Jr. of the University of Colorado-Boulder and Daniel Sarewitz of Arizona State University have sought to quantify the sensitivity of future losses to possible changes in climate and possible patterns of future development. Th ey have identifi ed the factors that are likely to be most responsible for future costs of disasters across a wide range of climate change scenarios so decisionmakers can identify policy actions robust to uncertainties.
Pielke and Sarewitz found that the most important factors contributing to the growing costs of disasters through 2050 are patterns of development under any climate change scenario. In one scenario examining possible hurricane damage, they concluded that for every dollar in damages in 2000, $4.60 in damages would be expected in 2050. Half of this $3.60 increase would be due to development, while only one-sixth would be directly related to changes in climate. Th e overwhelming importance of societal change in driving future losses is robust across all scenarios of climate change, development, and damage projections. In other scenarios, the role of development is much greater.
Because any changes to energy policies resulting in lower emissions of greenhouse gases will take many decades to have a discernible eff ect on the climate system, and because the exact relationship of greenhouse gases and patterns of extreme events remains uncertain and contested, these fi ndings mean that decisionmakers have considerable ability to infl uence the nature of future economic losses from disasters by infl uencing development patterns in regions exposed to extreme events. Th us, eff orts to reduce the growing rate of disaster losses around the world can proceed while scientifi c research continues to reduce uncertainty about the pace and magnitude of climate change. Highlight ID: 16006 SBE/SES
Th e Alaska Lake Ice and Snow Observatory Network: A Statewide K–12 and University Science Education and Research Partnership
Th e Alaska Lake Ice and Snow Observatory Network (ALISON) is a science education and scientifi c research partnership between the University of Alaska, Fairbanks, and the K–12 education community in Alaska. Th e project is a blending of science and science education in rural and urban classrooms throughout Alaska. Using a planning grant from NSF, Martin Jeff ries has created a network of classroom observatories in seven Alaskan communities, four in rural regions serving primarily Alaskan native students. Th e results of the pilot network can be reviewed at the ALISON Web site (www.gi.alaska.edu/alison). Th is project continues and expands the innovative concept of research scientists partnering with science and math teachers and
Eighth-grade students from Anvil City Science Academy (ACSA) in Nome, Alaska, drill a hole in the ice on the ACSA Pond before measuring the ice thickness. The site is part of the ALISON (Alaska Lake Ice and Snow Observatory Network) program, a science education and scientifi c research partnership between the University of Alaska, Fairbanks, and the K–12 education community in Alaska. Credit: Martin Jeffries, Geophysical Institute, University of Alaska, Fairbanks

100
their students by facilitating the students in collecting, analyzing, and interpreting data that are used in the principal investigator’s (PI’s) research project on ice, snow, and water. Th e PI’s research is to determine variability and change of ice, snow, and water over the course of one winter and multiple winters. In this way, students and their teachers learn about the nature of scientifi c inquiry involving questions, simple investigation, data gathering, data analysis, explanation, and communication of investigations and explanations. Highlight ID: 8705 OD/OPP
Saving Power and Energy in Computer SystemsAn NSF-funded researcher has investigated the potential of computer compiler optimizations for power and energy savings. Several optimizations were identifi ed that resulted in signifi cant power and energy savings over existing state-of-the-art technologies. Th ese optimizations are dynamic voltage and frequency scaling, resource hibernation, and remote program execution.
Dynamic voltage scaling (DVS) is recognized as one of the most eff ective power reduction techniques. It exploits the fact that a major portion of power of CMOS (complementary
metal–oxide–semiconductor) circuitry scales quadratically with the supply voltage. As a result, lowering the supply voltage can signifi cantly reduce the power dissipation.
As part of this research project, the principal investigator developed a compiler-supported DVS optimization strategy, implemented the compiler, and evaluated its performance. Th e evaluations were based on physical power and energy measurements. On a high-performance AMD laptop (Compaq Presario), total system energy savings of up to 28 percent were achieved with a performance degradation of less than 5 percent. On average, the system energy and energy-delay product were reduced by 11 percent and 9 percent, respectively, with an average performance slowdown of 2 percent. Highlight ID: 14470 CSE/CCF
HIPerWall: Development of a High-Performance Visualization System for Collaborative Earth System SciencesTh e Highly Interactive Parallelized Display Wall (HIPerWall) project provides unprecedented high-capacity visualization capabilities to experimental and theoretical researchers. Th e primary focus is on Earth science visualization, but collaborating researchers in fi elds including biomedical science and engineering also benefi t from HIPerWall’s capabilities. Earth science data sets often cover large areas of the planet at high resolution and depth, with many values at each grid point that vary over time, resulting in many gigabytes or terabytes of data. Visualizing these multidimensional, time-varying data sets is a challenge to computational/storage infrastructure and current display technologies. With HIPerWall, researchers can see the broad view of the data and details concurrently, enabling collaboration and shared viewing of complex results. A visualization cluster of high-performance commodity computers transfers and manipulates data displayed on HIPerWall’s 50 display tiles, which operate at a combined resolution of more than 200 megapixels. Th e visualization cluster receives simulation data from the University of California-Irvine’s (UCI’s) Earth System Modeling Facility, an IBM supercomputer (funded by NSF in 2003); connects to UCI’s digital workspace of the future project, VizClass (funded by NSF in 2001); and communicates over the Calit2 OptIPuter network (funded by NSF in 2003). HIPerWall’s ability to display extremely high-resolution data sets drives and provides focus for ongoing research into management, transfer, and visualization of terabyte-scale data, establishing a cyberinfrastructure test bed.
Visual Analytics’ HIPerWall supports simultaneous display of raw, processed, and fused data. For example, 20 simulation runs performed by the International Panel on Climate Change (IPCC) are currently being analyzed on HIPerWall, allowing climate predictions, which diff er in resolution, to be
Laptop computer. Credit: © 2009 JupiterImages Corporation
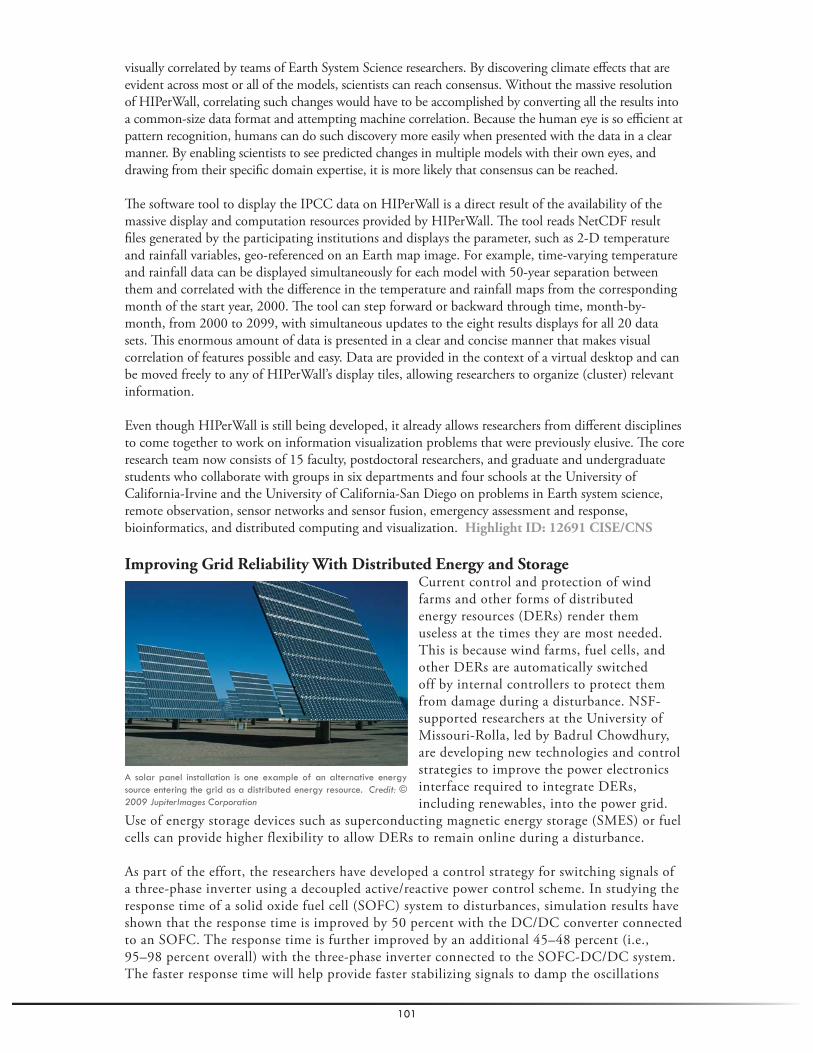
101
visually correlated by teams of Earth System Science researchers. By discovering climate eff ects that are evident across most or all of the models, scientists can reach consensus. Without the massive resolution of HIPerWall, correlating such changes would have to be accomplished by converting all the results into a common-size data format and attempting machine correlation. Because the human eye is so effi cient at pattern recognition, humans can do such discovery more easily when presented with the data in a clear manner. By enabling scientists to see predicted changes in multiple models with their own eyes, and drawing from their specifi c domain expertise, it is more likely that consensus can be reached.
Th e software tool to display the IPCC data on HIPerWall is a direct result of the availability of the massive display and computation resources provided by HIPerWall. Th e tool reads NetCDF result fi les generated by the participating institutions and displays the parameter, such as 2-D temperature and rainfall variables, geo-referenced on an Earth map image. For example, time-varying temperature and rainfall data can be displayed simultaneously for each model with 50-year separation between them and correlated with the diff erence in the temperature and rainfall maps from the corresponding month of the start year, 2000. Th e tool can step forward or backward through time, month-by-month, from 2000 to 2099, with simultaneous updates to the eight results displays for all 20 data sets. Th is enormous amount of data is presented in a clear and concise manner that makes visual correlation of features possible and easy. Data are provided in the context of a virtual desktop and can be moved freely to any of HIPerWall’s display tiles, allowing researchers to organize (cluster) relevant information.
Even though HIPerWall is still being developed, it already allows researchers from diff erent disciplines to come together to work on information visualization problems that were previously elusive. Th e core research team now consists of 15 faculty, postdoctoral researchers, and graduate and undergraduate students who collaborate with groups in six departments and four schools at the University of California-Irvine and the University of California-San Diego on problems in Earth system science, remote observation, sensor networks and sensor fusion, emergency assessment and response, bioinformatics, and distributed computing and visualization. Highlight ID: 12691 CISE/CNS
Improving Grid Reliability With Distributed Energy and StorageCurrent control and protection of wind farms and other forms of distributed energy resources (DERs) render them useless at the times they are most needed. This is because wind farms, fuel cells, and other DERs are automatically switched off by internal controllers to protect them from damage during a disturbance. NSF-supported researchers at the University of Missouri-Rolla, led by Badrul Chowdhury, are developing new technologies and control strategies to improve the power electronics interface required to integrate DERs, including renewables, into the power grid.
Use of energy storage devices such as superconducting magnetic energy storage (SMES) or fuel cells can provide higher flexibility to allow DERs to remain online during a disturbance.
As part of the effort, the researchers have developed a control strategy for switching signals of a three-phase inverter using a decoupled active/reactive power control scheme. In studying the response time of a solid oxide fuel cell (SOFC) system to disturbances, simulation results have shown that the response time is improved by 50 percent with the DC/DC converter connected to an SOFC. The response time is further improved by an additional 45–48 percent (i.e., 95–98 percent overall) with the three-phase inverter connected to the SOFC-DC/DC system. The faster response time will help provide faster stabilizing signals to damp the oscillations
A solar panel installation is one example of an alternative energy source entering the grid as a distributed energy resource. Credit: © 2009 JupiterImages Corporation

102
caused by system disturbances. Such an operating paradigm can be vital in preventing cascading outages that lead to wide-area blackouts, such as the one in the northeastern United States on August 14, 2003. Highlight ID: 15233 ENG/ECCS
Carbon Dioxide Removal: Microscopic Chemical Membrane Versus Cumbersome Gas PlantCarbon dioxide (CO2) removal from gases that require refi nement prior to use can be an expensive enterprise. After CO2 removal, certain gases have many commercial uses. For example, CO2 is removed during hydrogen and ammonia production and in natural gas purifi cation. Th e current commercial process for the removal of CO2 from gases involves cumbersome, large-size manufacturing gas plant operations using aqueous amine solutions. Th is expensive, capital- and energy-intensive process includes the pumping of vast amounts of both loaded and regenerated amine solutions, the consumption of great amounts of energy in heating the loaded amine solution via steam for solution regeneration, and the use of expensive equipment to process the solutions. Furthermore, the thermodynamic equilibrium limits the solubility of CO2 in the amine solution, which increases the size of the absorber, regenerator, and associated equipment (i.e., a bigger gas plant).
In view of the defi ciencies of current gas plants, the Ho Group at Ohio State University is researching and developing an eff ective process with both capital and energy savings. Th e Ho Group uses a novel approach through a CO2-selective membrane. Th is new approach combines the absorption and stripping of CO2—which is carried out in two separate steps in the commercial technology—into a one-step membrane process. Th is one-step process not only simplifi es the separation process, but eliminates the expensive equipment used in the commercial technology and results in a smaller environmental footprint. Th e one-step process also overcomes the thermodynamic solubility limit of aqueous amine solution.
Th e Ho Group’s research uses a novel CO2-selective membrane approach to overcome many of the defi ciencies of the commercial gas-treating technology. Th is membrane approach will have both signifi cant capital and energy savings. Th e membranes have many potential applications, including the purifi cation of synthesis gas to produce high-purity hydrogen for fuel cells, CO2 capture from fl ue gas for its sequestration, and CO2 removal from biogas, natural gas, confi ned space air, and ambient air. Highlight ID: 12867 ENG/CBET
International Workshop Explores Bio-Geo Engineering Research OpportunitiesTh e convergence of advances in molecular biology, nanoscience, microbiology, imaging and visualization techniques, and engineering simulation off ers an enormous opportunity for geotechnical engineers, together with bio-geo scientists, to provide society with solutions to problems created by rapid global and regional change. Th ese solutions include sustainable approaches to the regeneration of cities, carbon sequestration, rehabilitation of infrastructure, cleanup of brownfi elds, disposal of hazardous waste, protection of water resources, and maintenance of ecosystems for food. Solutions to these challenges require interdisciplinary research at the interfaces between traditional science and engineering disciplines, including geotechnical engineering, geosciences, microbiology, geochemistry, molecular biology, soil science, and geoenvironmental engineering.
Exploration of this emerging interdisciplinary fi eld occurred in April 2007 at an international workshop jointly funded by NSF and the Engineering and Physical Sciences Research Council of the United Kingdom. Interdisciplinary teams identifi ed applications by considering Earth’s subsurface as a living open reactor system whose mechanical, biological, and chemical processes are dynamic and changing. Th e applications were broadly categorized into the areas of mechanical control of the subsurface, hydraulic control of the subsurface, remediation and waste treatment, energy production and carbon sequestration, and soil-plant interactions. Among the applications identifi ed were microbes cementing loose sand to prevent building collapse during earthquakes; biological and chemical processes to increase soil water retention capacity and plant growth in drought-prone areas; creation

103
of subsurface containment facilities for clean water, sequestered carbon, and fuel; and national and international initiatives such as Kyoto Targets, Water Framework Directive, and Soil Framework Directive. Fundamental science and engineering research priorities were identifi ed for all application areas, with several priorities having universal relevance. Highlight ID: 15796 ENG/CMMI
Climate Changes in a Tribal CollegeClimate change takes on a whole new meaning at Haskell Indian Nations University, where departmental changes for the better are occurring. Th e Tribal Colleges and Universities Program (TCUP)-supported program, in an eff ort to extend beyond mathematics and science, has collaborated with the faculty of Haskell’s American Indian Studies program to address educational and societal needs. Last summer, Haskell hosted a symposium on the Impact of Climate Change on Indigenous Peoples. Native environmental professionals from agencies and tribal colleges met to discuss how science and technology might help in planning for the future as the environment changes. Oscar Kawagley, an Alaskan native and professor at the University of Alaska, Fairbanks, described how his village had to move because of sea-level rise. Haskell students assisted at the meetings. Josh Meisel, Jr. made a presentation on sea-level rise. Highlight ID: 14463 EHR/DGE
Cultivating the Next Generation of Computer ScientistsTo tackle complex, real-life problems like climate change, we need sophisticated computing and data systems and the people who can run them. Currently, the United States faces a shortage of scientists and engineers trained to use and maintain high-performance computer and data systems. Th e National Center for Atmospheric Research and its Computing and Information Systems Laboratory are striving to make inroads into this issue. In 2007, the laboratory launched its Summer Internships in Parallel Computational Science program. Th e program allows students to gain practical experience with a wide variety of parallel computational science problems. Th e students work with the high-performance computing systems on applications relevant to the center’s Earth science mission, while being mentored by computational experts. Seven interns from Colorado, Wyoming, and North Carolina universities participated in the program. Highlight ID: 15881 GEO/ATM
Experiencing Climate Change: Assessing Knowledge, Resilience, and Adaptation Among the Viliui SakhaGeorge Mason University researchers are investigating the resilience of Arctic peoples to changes in their local environments due to global climate change. In particular, they want to see what information the Viliui Sakha—native people in northeastern Siberia—need to gain a more holistic understanding of global climate change to bolster their ability to adapt. Viliui Sakha are native horse and cattle breeders inhabiting the Viliui River regions of northwestern Sakha Republic in Russia. Th e 3-year, four-village study is a collaborative eff ort involving the active participation of the targeted communities, fi eld assistants, native specialists, an in-country research team, and an international collaborator. In a 2004 survey of inhabitants of four villages, the principal investigator found that 90 percent of them expressed concern about local climate change, that it was causing unprecedented change in local areas, and that it threatened to undermine subsistence. Highlight ID: 16486 OPP/ARC
Summer Internships in Parallel Computational Science (SIParCS) interns, from left to right: Ryan O’Kuinghttons (Colorado School of Mines, or CSM), Victor Snyder (CSM), Kenny Gruchalla (University of Colorado at Boulder, or CU), Michael Levy (CU), Arunasalam Rahuynanthan (University of Wyoming), Matthew Norman (North Carolina State University), and Robert House (CU). The 2007 inaugural SIParCS program generated publication-quality research, improvements in grid coupling and visualization applications, and collaborative relationships with other research institutions. Credit: Courtesy Computational and Information Systems Laboratory (CISL), NCAR

104
Synthetic Photosynthesis? Inventing Alternative Sources of EnergyResearchers at the University of Akron are studying the chemistry and physics of photosynthesis via synthetic energy models. Th is research, funded through the Chemistry Division at the National Science Foundation, will give scientists insight into eff ective manipulation of light absorption technologies and may lead to more advanced tools for energy conversion from light.
Photosynthesis is an elegant and complex series of effi cient, photo-initiated events that involve energy and electron transport over long distances. Th e net result of these processes is the conversion of light into chemical energy. Investigators use macromolecular systems to manipulate electrons and study mechanisms of energy transfer through light absorption, eff ectively mimicking photosynthesis.
If successful, this research could lead to new methods of converting solar energy to chemical energy, which can be used to generate electricity. Th is technology has the potential of providing alternative sources of energy to combat global warming. Highlight ID: 911 MPS/CHE
Fighting Pollution, One Molecule at a TimeChemists at Spellman College, a predominately African-American women’s college, have developed and are testing a multidimensional spectrometer to study the structure and behavior of harmful atmospheric molecules. Techniques developed using this tool may increase the accuracy in dynamic models of atmospheric pollution movement.
Atmospheric pollution in the form of nitrogen oxides and halogens has been shown to deplete the ozone and cause respiratory damage to plants and animals. Mainly released from vehicles and industrial production, these pollutants have spread over large parts of Earth and aff ect the ozone content of the atmosphere worldwide. Th e structure and behavior of damaging molecules such as bromine (Br2) and nitrogen dioxide (NO2) have been diffi cult to study using conventional forms of spectroscopy. Th e new technology developed through this NSF-funded project has been shown to eff ectively image these atmospheric pollutants. Highlight ID: 14498 MPS/DMS
South American Climate Change Linked to Fall of Mayan Civilization A project currently under way in the Cariaco Basin of the tropical North Atlantic has produced some interesting results regarding past climate change and its implications. Sediment cores from the Cariaco Basin provide an excellent record of climate change, down to the annual scale, through the use of proxies. Th ese records have been compared with records from Greenland ice cores to determine whether climate change is consistent throughout the low and high latitudes. Th e Cariaco records show climate shifts analogous to those indicated by the ice core records, including the Younger Dryas cooling event of the North Atlantic. Overall,
there is an excellent correlation between the Cariaco and Greenland records, indicating that abrupt climate shifts fi rst identifi ed in Greenland were experienced in the tropics as well. However, there are also diff erences that may provide clues to the nature of climate forcing. For example, iron and titanium concentrations in the sediment samples are being used as a proxy for changes in regional precipitation and hydrology over northern South America. Th e results to date suggest that these changes are not clearly linked to high-latitude temperature but are instead responses to the forcing caused by Earth’s rotational precession that dominates solar radiation at low latitudes.
Th e investigators have been able to link their results with the collapse of the Mayan civilization. Th ey were able to achieve multiple measurements from each annual sediment layer and to distinguish annual
Mayan Temple of Inscriptions, Palenque, Mexico. Credit: © 2009 JupiterImages Corporation

105
wet and dry seasons. Previous studies have suggested that a mega-drought lasting a century caused the end of the Mayan empire, but the detailed records from this study show a series of shorter droughts of 4–9 years, superimposed on the prolonged dry period. Th e timing of these droughts seems to correlate with recorded abandonments of Mayan settlements. Th e relationship between the droughts and larger climate change in the region and the termination of a major human civilization is a reminder of how important it is to understand climate change on a regional and global scale. Highlight ID: 11973 GEO/OCE
Acquisition of Shipboard Instrumentation by the EAGLE Consortiumfor Interdisciplinary Geosciences Research and Research Training Aboard Explorer of the SeasExplorer of the Seas represents a unique partnership among academia (University of Miami), the Federal Government (NSF, NOAA, NASA), and private industry (Royal Caribbean Cruise Lines). Explorer of the Seas, a passenger cruise ship, was equipped with scientifi c instrumentation to take oceanic and atmospheric measurements for climate, pollution, and societal research during routine cruises. In addition to collecting data for researchers during cruises, passengers can participate and learn about the ongoing scientifi c activities through interactive displays in laboratories set up on board the vessel and through lectures given by visiting scientists. Public tours of the atmospheric and oceanographic laboratories draw 200–300 passengers of diverse ages and cultural backgrounds each week. During 2002, visiting scientists made 52 original science presentations on topics such as coral reef fi sh and health, global warming, El Niño, hurricane research, hydrothermal vents, whales, atmospheric aerosols, and marine archaeology.
Th e exchange of waters between the tropical Atlantic and the Caribbean infl uences such things as the formation of the Gulf Stream and the circulation and distribution of planktonic organisms throughout the Caribbean. Using data collected from the instrumentation on board the Explorer of the Seas, scientists have learned much about topics such as the impact of atmospheric aerosol mass loads on Earth’s solar energy budget and the infl uence of non-sea-salt sulfate, mineral dust, and sea salt on aerosol properties. At least 27 researchers have used the data collected by the Explorer of the Seas for their research.
In 2003, the University of Miami led a pilot undergraduate course focused on data analysis techniques using the Explorer of the Seas data set. Th e course included a weeklong intensive laboratory internship on board the vessel, during which students experimented with salinity calibrations, alkalinity titrations, and plankton sizing using the fl owing seawater system. Th e students presented a summary lecture of their results to passengers. Highlight ID: 8096 GEO/OCE
Agricultural Decisionmaking in Indonesia: Integrating Climate Science, Risk Assessment, and Policy Analysis
Rosamond Naylor and a team of colleagues in economics and climate science from Stanford, the University of Washington, and the University of Wisconsin have made signifi cant progress in understanding the eff ects of climate variability and climate change on Indonesian agriculture. Indonesia is the world’s fourth most populous country, and roughly half of its population is directly involved in agricultural production. Such production is very sensitive to short- and long-term changes in rainfall, changes that directly aff ect the welfare of tens of millions of poor Indonesians.
Th rough NSF-funded work, Naylor and her colleagues have developed forecasting models that anticipate both year-to-year changes in
Indonesia is the world’s fourth most populous country, and roughly half of its population is directly involved in agriculture. Changing rainfall patterns resulting from global climate change could have a profound effect on Indonesian farming, particularly rice cultivation. Credit: © 2009 JupiterImages Corporation

106
Indonesian rainfall (related to El Niño events in the Pacifi c) and longer term changes in rainfall under conditions of global warming. Th e team then links these changes to agricultural decisionmaking in Indonesia. Th e fi ndings suggest that changes in the timing of the monsoon rains explain much of the observed variation in agricultural productivity, and that these rains will come later and later as the planet warms—with negative implications for poor farmers in Indonesia’s main rice-growing regions, Java and Bali.
Th e team’s models are now being used by policymakers in the Indonesian Ministry of Agriculture to anticipate immediate and potential future needs with respect to the agricultural sector. Under a new NSF grant, this work is being replicated and extended in China, with the hope of aiding hundreds of millions of Chinese farmers who are facing similar climate fl uctuations. Th e scientifi c research in China will be incorporated into the policymaking process via colleagues at the Chinese Center for Agricultural Policy and the Center for Global Forecasting at the Chinese Academy of Sciences. Highlight ID: 13579 SBE/SES
Teaching Teachers About Climate ChangeTh e development of the Global Climate Change Teacher Institute by Kurt Pregitzer of the Michigan Technological University has resulted in the training of dozens of middle and high school teachers from around the country in physical, chemical, and biological research on global change. Pregitzer’s NSF-funded research is showing how continual, long-term atmospheric nitrogen deposition aff ects nitrogen and carbon cycling in northern hardwood forests. Th roughout his project, Pregitzer has made eff orts to increase the involvement of teachers and students in science. Every summer, the weeklong Teacher Institute brings teachers to the fi eld sites and laboratories connected to Pregitzer’s project. Th ere, teachers learn about the impact of elevated carbon dioxide and ozone levels, nitrogen saturation, acid rain, and invasive species on forest ecosystems while earning graduate course credit. By the end of this intensive week, each teacher develops a “citizen science” project that he or she can use in the classroom. Th e Teacher Institute multiplies the impact of the instruction by providing teachers with educational tools they can use in the classroom and equips the teachers with the knowledge and confi dence to seek out further research opportunities between their classes and professional scientists. For instance, one teacher used her experience at the course to develop a collaborative project with a government agency to test acid deposition around a local power plant. Pregitzer’s course has received national attention—both the U.S. Forest Service and the National Park Service are looking at ways to develop programs similar to the Global Climate Change Teacher Institute around the country. Highlight ID: 13518 BIO/DEB
Workshop to Spur U.S.-China Cooperation in Bioenergy DevelopmentAs the top two countries in carbon dioxide emissions, China and the United States have a unique opportunity to develop solutions to pressing energy and environmental problems. Researchers at the Institute for a Secure and Sustainable Environment (ISSE) at the University of Tennessee-Knoxville (UTK), together with Chinese partners at the Institute of Geographical Sciences and Natural Resources Research (IGSNRR), Chinese Academy of Sciences convened a fall 2008 workshop focused on the multidisciplinary themes of sustainable production of bioenergy crops, land-use change, carbon sequestration, water resources, and ecological restoration. Th e joint workshop is expected to catalyze new research on critical U.S.-China topics important for meeting global energy demand and protecting the environment. Participants discussed ecosystem processes and management, environmental sustainability of bioenergy production, and ecological foundations of water resources. An important outcome expected from this meeting is planning for testing and development of new technologies that mitigate the negative impact on eco-environmental systems. Th e meeting allowed fi ve U.S. graduate students to explore the issues and develop research relationships that may help drive future U.S.-China research priorities. In addition to research, the workshop is expected to spur the establishment of a mechanism to bring students and junior researchers into cross-cultural, international research addressing bioenergy and environmental change. Highlight ID: 14956 OD/OISE

107
Computational Sustainability: Computational Methods for a Sustainable Environment, Economy, and SocietyBalancing environmental, economic, and societal needs for a sustainable future encompasses problems of unprecedented size and complexity. With naturally occurring settings, global scale, dynamic and uncertain behavior, a mixture of discrete and continuous eff ects, and highly interactive components, problems associated with sustaining Earth’s resources can greatly benefi t from computational methods and thinking. Th ere is a key role to be played by computing and information sciences in increasing the effi ciency and eff ectiveness of the way humanity manages and allocates natural resources. Th is project aims to establish and nurture a new fi eld of study—computational sustainability—driven by a wide range of hard computational problems and critical challenges in the area of sustainability. Th e applied theoretical expedition will pursue interdisciplinary research across three computational sustainability themes: conservation and biodiversity; balancing socioeconomic demands and the environment; and renewable energy. With the view that natural problems may have a special structure discoverable by machine learning techniques that allow them to be solved, this research attempts to stimulate synergies that cross boundaries and merge ideas from combinatorial optimization, dynamical systems, machine learning, and constraint reasoning. An Institute for Computational Sustainability, based at Cornell University, will be the nexus of foundational science advancements and practical applications in sustainability. Part of its mission is to establish a vibrant and diverse research community in the area of computational sustainability, drawing new students into the fi eld from all backgrounds, including students from underrepresented groups, via summer research experiences and other proactive activities. Press Release 08-141 CISE
Improving Biomass Conversion to Ethanol for Renewable EnergyTh e National Renewable Energy Laboratory (NREL) is striving to develop the effi cient large-scale conversion of biomass into ethanol to provide a clean-burning and renewable fuel source. Th is will reduce dependence on fossil fuels and imported oil, and protect the climate. A key bottleneck in making this process economically viable is the slow breakdown of cellulose by the enzyme cellulase; scientists want to understand this process at the molecular level so they can target further research to speed up the reaction.
To explore the intricate molecular dynamics of this process, the researchers have used the CHARMM (Chemistry at Harvard Molecular Mechanics) code, a versatile community code for simulating biological reactions. However, the
size of the simulations needed is so large (more than a million atoms) and the simulation times so long (more than 5,000 time steps for a 10 or more nanosecond simulation) that they exceed the current capabilities of CHARMM.
Researchers at the San Diego Supercomputer Center (SDSC) are working with colleagues at NREL, Cornell, the Scripps Research Institute, and the Colorado School of Mines to enhance CHARMM so that the simulations can scale up to millions of atoms and run on hundreds of processors on the largest supercomputers, including SDSC’s DataStar and the TeraGrid. Th is will make it feasible to simulate this key reaction. Th e research is enabling the largest simulations ever of an important scientifi c problem that will yield economic and environmental benefi ts. In addition, the improvements to the CHARMM code will be available for the scientifi c community to apply to a wide range of other problems. Highlight ID: 10859, Version: AC/GPA
To improve the conversion of biomass into ethanol, NREL researchers simulated the action of the enzyme cellulase on cellulose using the CHARMM community code. The binding domain is on the left in blue, the glycosylated linker in green, and the catalyst domain on the left in orange and yellow. Credit: James Matthews, Linghao Zhong and John Brady, Cornell University; Mike Himmel and Mark Nimlos, NREL; Tauna Rignall, Colorado School of Mines; Mike Crowley, The Scripps Research Institute

108
Antarctic Penguins: Teaching the Science of Climate ChangeAn NSF-funded eff ort to translate the Adélie penguin “Bellwether of Climate Change” research to the K–12 community has produced tangible results. More than 9,000 individual, kid-designed postcards showing children’s love and concern for penguins have been received from 450 K–8 classrooms in 30 states. Many postcards contained questions and indicated classroom connections to the project. Each was answered and sent back, stamped from Antarctica.
Th e interactive Web site (www.penguinscience.com) was expected to reach a million hits by January 2008. It off ers a daily look into the process by which penguins raise their chicks. Six nests are showcased to off er students a chance to collect data and keep their own fi eld journals.
Banded adults allow children to record which parent is on the nest, how long it takes the egg(s) to hatch, and how much each mate has contributed to the eff ort, as well as weather conditions and their eff ects. Th e children can follow the transformation of chicks from fl uff balls to strapping fl edglings ready to take on the sea. Th e Web site also contains information geared toward teachers about global climate change and how penguins are coping with the changes in their environment.
Th e message is reaching a broad audience. Th is classroom-ready material, which complements a DVD, provides teachers with quality lesson plans, pictures, graphics, and activities about penguins, the polar regions, and global climate change, as well as a feature showing how scientists work. An educational DVD targeting grades 4–8 was produced and distributed through the Web site and at teachers’ workshops in major cities around the country. An embellished version of the DVD aired on national television (Animal Planet) in March 2008. Highlight ID: 14971
Adélie penguins resting on an icefl ow in front of the Mt. Bird Ice Cap. Mt. Bird is one of four volcanoes that together have formed Ross Island. The retreating Ice Cap left Cape Bird bare and covered with moraines beginning about 7,000 years ago, the oldest age of penguin remains found there. The penguins make nests of the pebbles left by the glacier. Credit: Melanie Massaro, School of Biological Sciences, University of Canterbury

Published by the National Science Foundation Offi ce of Legislative and Public Affairs
Jeff Nesbit, Director
Editor: Melissa Summers
Photo Research: Marnie Briggs and Gwendolyn Morgan
Design: Adrian Apodaca
Review Coordinator: Pamela Stephens
Content and review provided by the following NSF organizations:• Offi ce of the Director • Geosciences Directorate • Offi ce of Polar Programs • Biological Sciences Directorate • Social, Behavioral, and Economics Directorate • Engineering Directorate
• Offi ce of International Science and Engineering • Math and Physical Sciences Directorate • Education and Human Resources Directorate • Offi ce of Cyberinfrastructure• Computer and Information Science and Technology Directorate
NSF 09-202