Embed Size (px)
Citation preview
RESEARCH ARTICLE
Characterisation of the Whole Blood mRNATranscriptome in Holstein-Friesian and JerseyCalves in Response to Gradual WeaningD. Johnston1,2, B. Earley1, P. Cormican1, D. A. Kenny1, M. S. McCabe1, A. K. Kelly2,M. McGee3, S. M. Waters1*
1 Animal and Bioscience Research Department, Animal & Grassland Research and Innovation Centre,Teagasc, Dunsany, Co. Meath, Ireland, 2 University College Dublin, School of Agriculture Food Science andVeterinary Medicine, Dublin, Belfield, Dublin, 4, Ireland, 3 Livestock Systems Research Department, Animal& Grassland Research and Innovation Centre, Teagasc, Dunsany, Co. Meath, Ireland
AbstractWeaning of dairy calves is an early life husbandry management practice which involves the
changeover from a liquid to a solid feed based diet. The objectives of the study were to use
RNA-seq technology to examine the effect of (i) breed and (ii) gradual weaning, on the
whole blood mRNA transcriptome of artificially reared Holstein-Friesian and Jersey calves.
The calves were gradually weaned over 14 days (day (d) -13 to d 0) and mRNA transcription
was examined one day before gradual weaning was initiated (d -14), one day after weaning
(d 1), and 8 days after weaning (d 8). On d -14, 550 genes were differentially expressed
between Holstein-Friesian and Jersey calves, while there were 490 differentially expressed
genes (DEG) identified on d 1, and 411 DEG detected eight days after weaning (P < 0.05;
FDR < 0.1). No genes were differentially expressed within breed, in response to gradual
weaning (P > 0.05). The pathways, gene ontology terms, and biological functions consis-
tently over-represented among the DEG between Holstein-Friesian and Jersey were asso-
ciated with the immune response and immune cell signalling, specifically chemotaxis.
Decreased transcription of several cytokines, chemokines, immunoglobulin-like genes,
phagocytosis-promoting receptors and g-protein coupled receptors suggests decreased
monocyte, natural killer cell, and T lymphocyte, chemotaxis and activation in Jersey com-
pared to Holstein-Friesian calves. Knowledge of breed-specific immune responses could
facilitate health management practices better tailored towards specific disease sensitivities
of Holstein-Friesian and Jersey calves. Gradual weaning did not compromise the welfare of
artificially-reared dairy calves, evidenced by the lack of alterations in the expression of any
genes in response to gradual weaning.
PLOS ONE | DOI:10.1371/journal.pone.0159707 August 1, 2016 1 / 22
a11111
OPEN ACCESS
Citation: Johnston D, Earley B, Cormican P, KennyDA, McCabe MS, Kelly AK, et al. (2016)Characterisation of the Whole Blood mRNATranscriptome in Holstein-Friesian and Jersey Calvesin Response to Gradual Weaning. PLoS ONE 11(8):e0159707. doi:10.1371/journal.pone.0159707
Editor: Gordon Langsley, Institut national de la santéet de la recherche médicale - Institut Cochin,FRANCE
Received: March 14, 2016
Accepted: July 7, 2016
Published: August 1, 2016
Copyright: © 2016 Johnston et al. This is an openaccess article distributed under the terms of theCreative Commons Attribution License, which permitsunrestricted use, distribution, and reproduction in anymedium, provided the original author and source arecredited.
Data Availability Statement: All sequence dataproduced in this study has been deposited to NCBIGEO repository and are available through seriesaccession number GSE76841.
Funding: This research was made possible byfunding, provided by the Department of Agricultureand Food Stimulus Fund 11/S/16 and EU PLF (RMIS6311) project 311825. DJ was in receipt of a TeagascWalsh Fellowship funded scholarship (WF2013216).
IntroductionWeaning of dairy calves is an early life husbandry management practice whereby milk isremoved from the calves’ diet and subsequently they derive their nutrient and energy require-ments from solid feed alone. Abrupt weaning can act as a multi-factorial stressor in single-suckled beef calves [1–5]. It has been reported to produce an acute pro-inflammatory stressresponse determined by changes in haematological profiles [4–6], increases in serum concen-trations of acute phase proteins [6], up-regulation in expression of genes involved in the pro-inflammatory response [4] and transcriptional alterations in cytokines, chemokines, g-protein-coupled receptors and integrins [2]. However, there is limited published research detailing theimmune response to gradual weaning from a liquid based diet in the artificially reared dairycalf. As dairy calves are removed from their dams at birth, gradual weaning of dairy calves maynot produce the same stress response associated with abrupt weaning of beef calves. However,gradual weaning of dairy calves takes place months before beef calves are typically weanedfrom their dams. Consequently, the change-over from a liquid to a solid-feed based diet at suchan early stage in rumen development may induce a stress response. One study has reportedincreases in serum concentrations of both acute phase proteins and cortisol, along with alter-ations in concentrations of serum inflammatory cytokines (tumour necrosis factor-alpha(TNFα) and interferon-gamma) and an increase in the neutrophil:lymphocyte ratio, demon-strative of a pro-inflammatory response, following gradual weaning in dairy Holstein calves[7]. Furthermore, we have observed differences in haematological profiles and whole bloodgene expression of the pro-apoptotic gene Fas, in dairy calves in response to gradual weaning[8].
Holstein-Friesian (H-F) and Jersey (J) are the two most predominant dairy breeds used inIreland [9] and indeed internationally [10]. Body characteristics including birth weight [10]and subsequent growth rate [11] vary greatly between these two breeds. Evidence also exists fortranscriptional differences in pooled whole blood between Holstein and J [12]. However, onlylimited literature suggesting differences in immune responses between H-F and J breeds is cur-rently available. Two studies have reported breed differences in immune responses to infectionchallenges in cows. Bannerman and co-authors [13] found differences in the onset, magnitude,duration and cessation of acute phase responses and pro-inflammatory cytokine expressionbetween Holstein and J cows after intramammary infection with Escherichia coli. Additionally,genes involved in the immune response and antigen presentation and processing differedbetween Holstein and J cows sub-clinically infected withMycobacterium avium spp. Paratuber-culosis (MAP) [14].
Alterations in immune responses between calves of these two breeds have also beenreported. Serum TNFα was secreted in greater quantities from stimulated mononuclear cellsisolated from post-weaned Holstein compared with J calves [15]. Greater bacterial killing andneutrophil oxidative burst activity, were also observed in the whole blood from the post-weaned Holstein calves, following incubation with Escherichia coli [15]. Furthermore, calvesfrom J sires had lower total anti-foot-and-mouth disease virus serum antibody titres, inresponse to three different vaccine strains, than calves from Holstein sires suggesting that thegenetic background of calves influences humeral immune responses [16].
RNA-seq has revolutionized transcriptomic studies by providing an efficient approach fortranscript discovery, expression analyses, and identification of sequence polymorphisms [17,18]. It is now being used widely for uncovering multiple facets of the transcriptome to facilitatebiological applications [18]. Indeed, alterations in the leukocyte mRNA transcriptome follow-ing abrupt weaning in single-suckled beef calves, have been identified using RNA-seq [2].However, no information is currently available regarding global changes in the mRNA
Global Gene Expression Changes in Holstein-Friesian and Jersey Calves in Response to Gradual Weaning
PLOS ONE | DOI:10.1371/journal.pone.0159707 August 1, 2016 2 / 22
Competing Interests: The authors have declaredthat no competing interests exist.
transcriptome in dairy calves, due to gradual weaning. Given that we have previously reportedbreed differences in haematological profiles and in whole blood expression of several immunegenes, during the peri-weaning period [8], the objectives of the current study was to employ anRNA-seq approach to examine differences in global gene expression in whole blood, betweenartificially reared H-F and J calves, in response to gradual weaning.
Materials and MethodsAll animal procedures performed in this study were conducted under experimental licencefrom the Irish Department of Health and Children (licence number B100/2869). Protocolswere in accordance with the Cruelty to Animals Act (Ireland 1876, as amended by EuropeanCommunities regulations 2002 and 2005) and the European Community Directive 86/609/EC.
Animal managementThis experiment was conducted as part of a larger study designed to examine changes in hae-matological profiles and gene expression in response to gradual weaning. The animal modeland management has previously been described by Johnston et al. [8] and is briefly outlinedhere. Eight H-F and eight J clinically healthy bull calves with a mean ± s.d. age (days (d)) andbodyweight of 23 ± 7 d, 46 ± 6 kg and 37 ± 8 d, 34 ± 5 kg, respectively, were group housedindoors on sawdust bedded pens at Teagasc, Grange Beef Research Centre from d -56 to d 8 ofthe study (weaning occurred on d 0). The H-F calves were all sourced from a single farm andthe J calves originated from two different farms. Data was missing for the sire of one H-F andone J calf. Six different bulls sired the remaining seven H-F calves. The remaining seven J calveshad five different bulls recorded as their sires. At arrival, calves were immunised against infec-tious bovine rhinotracheitis, parainfluenza-3 virus, bovine respiratory syncytial virus,Man-nheimia haemolytica serotypes A1 and A6 and Salmonella dublin and Salmonella typhimuriumusing Rispoval IBR-Marker live (Pfizer; Co. Cork, Ireland), Bovipast RSP (Intervet; Dublin, Ire-land) and Bovivac S (Intervet; Dublin, Ireland) vaccines, respectively.
Calves were individually fed using automatic milk (Vario Powder; Förster-Technik GmbH,Engen, Germany) and concentrate (KFA3-MA3; Förster-Technik GmbH) feeders. The dietoffered consisted of a 23% crude protein (CP), 18% lipid milk replacer (Blossom Easymix;Volac, Co. Cavan, Ireland) and concentrate feed (26.5% barley, 25% soya, 15% maize, 12.5%beet pulp, 12.5% soya hulls, 5% molasses, 2.5% minerals, 1% vegetable oil (18.8% CP, 22.4%neutral detergent fibre, 11.06 MJ ME/kg DM)). The pre-weaning, weaning and post-weaningperiods were defined as d -56 to d -14, d -13 to d 0 (milk feeding ceased), and d 1 to d 8 respec-tively. During the pre-weaning period calves were offered 0.8 kg milk replacer (6 litres (l) at133.33 g/l). The H-F and J calves were offered 1.5 kg and ad libitum concentrate pre-weaning,respectively. All calves were offered approximately 400 g straw daily, from a rack within thegroup pen, throughout the study period. Calves were weaned when consuming 1 kg of concen-trate daily for three consecutive days. During the weaning phase milk replacer was graduallyreduced from 6 l to 0 l over a 14 d period (d -13 to d 0). The concentrate allocation for the H-Fcalves was increased to 2 kg/day following gradual weaning. However, as the H-F calves neverconsumed their maximum allowance of concentrate, they were essentially offered the sameamount of concentrate as the J calves.
Serum sample collection for the zinc sulphate turbidity testBlood samples were collected via jugular venepuncture into 8.5 ml BD Serum Separator TubeII Advance tubes (BD Vacutainer; Unitech, Dublin, Ireland) on the day of arrival of the calvesto Teagasc, Grange Beef Research Centre. Serum was harvested from these samples and stored
Global Gene Expression Changes in Holstein-Friesian and Jersey Calves in Response to Gradual Weaning
PLOS ONE | DOI:10.1371/journal.pone.0159707 August 1, 2016 3 / 22
at -20°C. The zinc sulphate turbidity (ZST) (proxy for immunoglobulin status) analysis wassubsequently performed at 20°C and turbidity measurements were obtained at 520 nm using aspectrophotometer [19].
Statistical analysis of zinc sulphate turbidity test dataThe data were examined for adherence to a normal distribution (PROC UNIVARIARTE, SASv 9.3). Zinc sulphate turbidity data were analysed using mixed models ANOVA (PROCMIXED, SAS v 9.3). Differences between the means were tested using the PDIFF option withinthe MIXED procedure of SAS. Means were considered statistically significantly different at aprobability level of P< 0.05.
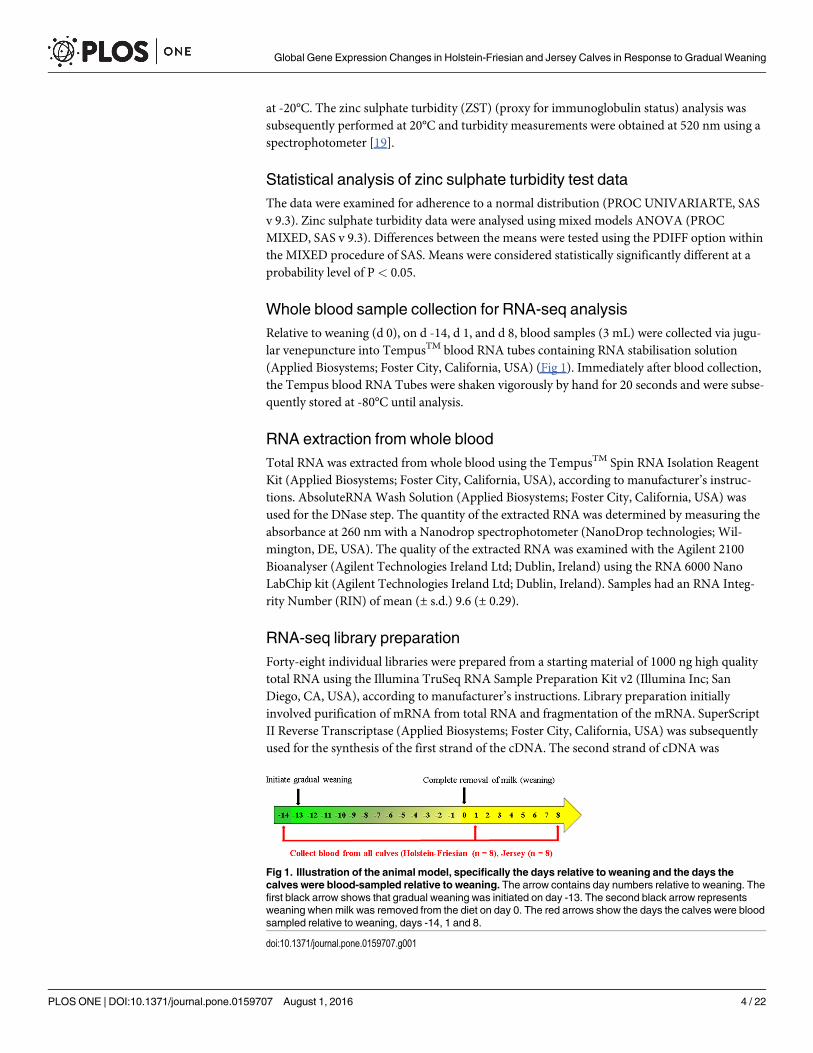
Whole blood sample collection for RNA-seq analysisRelative to weaning (d 0), on d -14, d 1, and d 8, blood samples (3 mL) were collected via jugu-lar venepuncture into TempusTM blood RNA tubes containing RNA stabilisation solution(Applied Biosystems; Foster City, California, USA) (Fig 1). Immediately after blood collection,the Tempus blood RNA Tubes were shaken vigorously by hand for 20 seconds and were subse-quently stored at -80°C until analysis.
RNA extraction from whole bloodTotal RNA was extracted from whole blood using the TempusTM Spin RNA Isolation ReagentKit (Applied Biosystems; Foster City, California, USA), according to manufacturer’s instruc-tions. AbsoluteRNAWash Solution (Applied Biosystems; Foster City, California, USA) wasused for the DNase step. The quantity of the extracted RNA was determined by measuring theabsorbance at 260 nm with a Nanodrop spectrophotometer (NanoDrop technologies; Wil-mington, DE, USA). The quality of the extracted RNA was examined with the Agilent 2100Bioanalyser (Agilent Technologies Ireland Ltd; Dublin, Ireland) using the RNA 6000 NanoLabChip kit (Agilent Technologies Ireland Ltd; Dublin, Ireland). Samples had an RNA Integ-rity Number (RIN) of mean (± s.d.) 9.6 (± 0.29).
RNA-seq library preparationForty-eight individual libraries were prepared from a starting material of 1000 ng high qualitytotal RNA using the Illumina TruSeq RNA Sample Preparation Kit v2 (Illumina Inc; SanDiego, CA, USA), according to manufacturer’s instructions. Library preparation initiallyinvolved purification of mRNA from total RNA and fragmentation of the mRNA. SuperScriptII Reverse Transcriptase (Applied Biosystems; Foster City, California, USA) was subsequentlyused for the synthesis of the first strand of the cDNA. The second strand of cDNA was
Fig 1. Illustration of the animal model, specifically the days relative to weaning and the days thecalves were blood-sampled relative to weaning. The arrow contains day numbers relative to weaning. Thefirst black arrow shows that gradual weaning was initiated on day -13. The second black arrow representsweaning when milk was removed from the diet on day 0. The red arrows show the days the calves were bloodsampled relative to weaning, days -14, 1 and 8.
doi:10.1371/journal.pone.0159707.g001
Global Gene Expression Changes in Holstein-Friesian and Jersey Calves in Response to Gradual Weaning
PLOS ONE | DOI:10.1371/journal.pone.0159707 August 1, 2016 4 / 22
synthesised using components of the Illumina TruSeq RNA Sample Preparation Kit v2. Adap-tors were ligated to the cDNA samples in a manner which allowed random pooling of librariesand limited technical variation in the experiment. The cDNA fragments containing the adapt-ers were enriched by PCR. Validation of individual libraries was performed with the AgilentBioanalyser 2100 using the DNA 1000 Nano LapChip kit (Agilent Technologies Ireland Ltd;Dublin, Ireland). It confirmed that library fragment sizes were ~260 base pairs (bp). Librarieswere quantified with a Qubit Fluorometer. Equal quantities of individual libraries were pooledbased on their respective sample-specific-6 bp adaptors and sent to Clinical Genomics(Toronto, Canada), for RNA sequencing on an Illumina HiSeq 2500 with four libraries perlane. Forty million 76 bp paired end reads were sequenced per library.
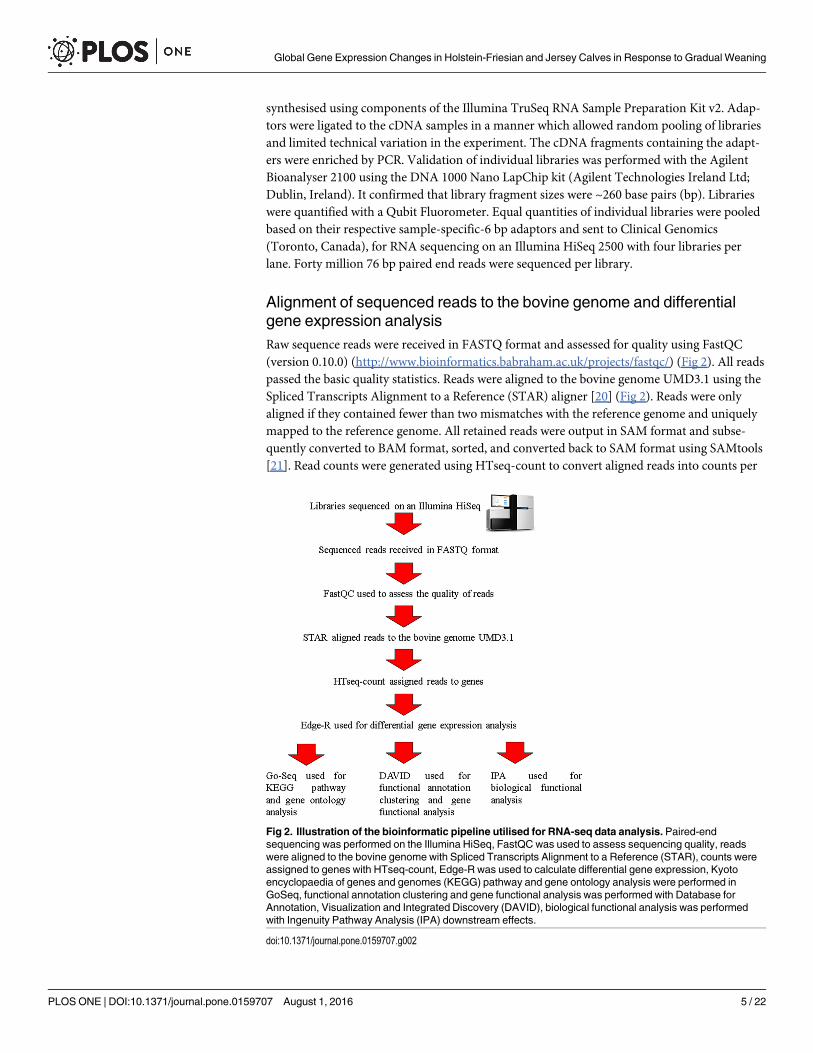
Alignment of sequenced reads to the bovine genome and differentialgene expression analysisRaw sequence reads were received in FASTQ format and assessed for quality using FastQC(version 0.10.0) (http://www.bioinformatics.babraham.ac.uk/projects/fastqc/) (Fig 2). All readspassed the basic quality statistics. Reads were aligned to the bovine genome UMD3.1 using theSpliced Transcripts Alignment to a Reference (STAR) aligner [20] (Fig 2). Reads were onlyaligned if they contained fewer than two mismatches with the reference genome and uniquelymapped to the reference genome. All retained reads were output in SAM format and subse-quently converted to BAM format, sorted, and converted back to SAM format using SAMtools[21]. Read counts were generated using HTseq-count to convert aligned reads into counts per
Fig 2. Illustration of the bioinformatic pipeline utilised for RNA-seq data analysis. Paired-endsequencing was performed on the Illumina HiSeq, FastQC was used to assess sequencing quality, readswere aligned to the bovine genome with Spliced Transcripts Alignment to a Reference (STAR), counts wereassigned to genes with HTseq-count, Edge-R was used to calculate differential gene expression, Kyotoencyclopaedia of genes and genomes (KEGG) pathway and gene ontology analysis were performed inGoSeq, functional annotation clustering and gene functional analysis was performed with Database forAnnotation, Visualization and Integrated Discovery (DAVID), biological functional analysis was performedwith Ingenuity Pathway Analysis (IPA) downstream effects.
doi:10.1371/journal.pone.0159707.g002
Global Gene Expression Changes in Holstein-Friesian and Jersey Calves in Response to Gradual Weaning
PLOS ONE | DOI:10.1371/journal.pone.0159707 August 1, 2016 5 / 22
gene using the union model and the Ensembl UMD3.1 annotation of the bovine genome [22](Fig 2). Differential gene expression was determined using the R (version 3.0.1 (2013-05-16))Bioconductor package EdgeR (version 3.2.4) [23] (Fig 2), which accounts for biological andtechnical variation by modelled data as a negative binomial distribution using a generalisationof the Poisson distribution model. To filter out lowly expressed genes, genes with less than onecount per million in at least eight samples, were discarded from the analysis. Data were normal-ised across libraries using the trimmed mean of M-values normalization method [24]. Thequantile-adjusted conditional maximum likelihood (qCML) common dispersion and theqCML tagwise dispersions were used to estimate dispersion. Exact tests were used for the detec-tion of differentially expressed genes (DEG) between time-points within breed and betweenbreeds at each time-point. Genes with a Benjamini-Hochberg false discovery rate (FDR) of10% and a fold change of� 1.5 were considered differentially expressed. All sequence data pro-duced in this study has been deposited to NCBI GEO repository and are available throughseries accession number GSE76841.
Pathway analysisPathway analysis was performed using GOSeq (version 1.12.0) [25], with the Kyoto encyclo-paedia of genes and genomes (KEGG) database [26] (Fig 2), on statistically significant(P< 0.05) DEG between breeds, at each time-point, with a FDR of 10% and a fold changeof> 1.5. Differences in gene length can bias pathway and functional analyses. There is morepower to detect longer genes as differentially expressed in RNA-seq experiments as the totalnumber of reads for a gene is proportional to its expression multiplied by its length [25].GOSeq took gene length into account as it calculated the Probability Weighting Function foreach gene and used it to quantify the likelihood of a gene being differentially expressed basedon its length alone, and subsequently corrected the analysis for gene length bias. Pathwayswhich were represented significantly more among the DEG, than would be expected due torandom chance, were identified using the GoSeq default method “Wallenius” by the Walleniusnon-central hypergeometric distribution. A 10% FDR cut-off was implemented on the resultsof the pathway analysis using Bioconductor’s qvalue package (version 1.34.0) [27].
Gene ontology analysisGene ontology analysis was performed using GOSeq (version 1.12.0) [25] (Fig 2), on statisti-cally significant (P< 0.05) DEG between breeds, at each time-point, with an FDR of 10% and afold change of> 1.5. As in GOSeq/KEGG pathway analysis, GoSeq corrected for gene lengthbias and identified ontological terms which were represented significantly more than would beexpected due to random chance. Gene ontological terms were identified as over-representedwhen they had a P value of less than 0.05 and an FDR of 10%.
Functional annotation clustering and gene grouping analysisThe DEG between breeds, at each time-point, with an FDR of 10% and a fold change of> 1.5,were analysed for functional annotation clustering and gene functional classification using theDatabase for Annotation, Visualization and Integrated Discovery (DAVID) (http://david.abcc.ncifcrf.gov/tools.jsp) [28, 29] (Fig 2). The background genes consisted of all the expressedgenes for the specific time-point being analysed. The annotation categories for DAVID analysiswere set to have: a Kappa similarity of 4; a similarity threshold of 0.35; an initial group mem-bership of 4; a final group membership of 4 and a multiple linkage threshold of 0.5. The enrich-ment P-values of each annotation term were derived from a modified Fisher’s exact test calledEASE score. The group enrichment score of each functional annotation cluster or gene
Global Gene Expression Changes in Holstein-Friesian and Jersey Calves in Response to Gradual Weaning
PLOS ONE | DOI:10.1371/journal.pone.0159707 August 1, 2016 6 / 22
functional classification group was calculated from the geometric mean (in -log scale) of all theenrichment P-values in each annotation term within each cluster and was used to determinethe significance of results from the functional annotation clustering and gene functional classi-fication analyses. A group enrichment score cut-off of 1.3 (EASE = 0.05) was applied in thepresent study.
Biological functional analysisTo examine the cellular and molecular functions, the RNA-seq data were further analysedusing Ingenuity Pathway Analysis (IPA) downstream effects (v. 21249400, Ingenuity Systems,Mountain View, CA; http://www.ingenuity.com), according to the manufacturer’s instructions(Fig 2). Within IPA, the Fisher’s exact test corrected by the Benjamini-Hochberg test was usedfor the identification of over-represented molecular and cellular functions with a FDR of 10%,from DEG between breeds, at each time-point, with an FDR of 10% and a fold change of> 1.5.Additionally, IPA’s regulation z-score algorithm, which predicts increases or decreases in func-tions based on directional changes in the DEG and expectations derived from the literature,was used to predict differences in the over-represented cellular and molecular functions. IPAsoftware considered cellular and molecular functions with a regulation z-score value of� 2.0to be significantly increased and cellular and molecular functions with a regulation z-scorevalue of� -2.0 to be significantly decreased.
Results
Passive immunityThe J calves had greater maternally derived passive immunity (Lsmeans (s.e.m.)) (19.1 (0.97)units) than H-F calves (15.9 (0.97) units) (P< 0.05).
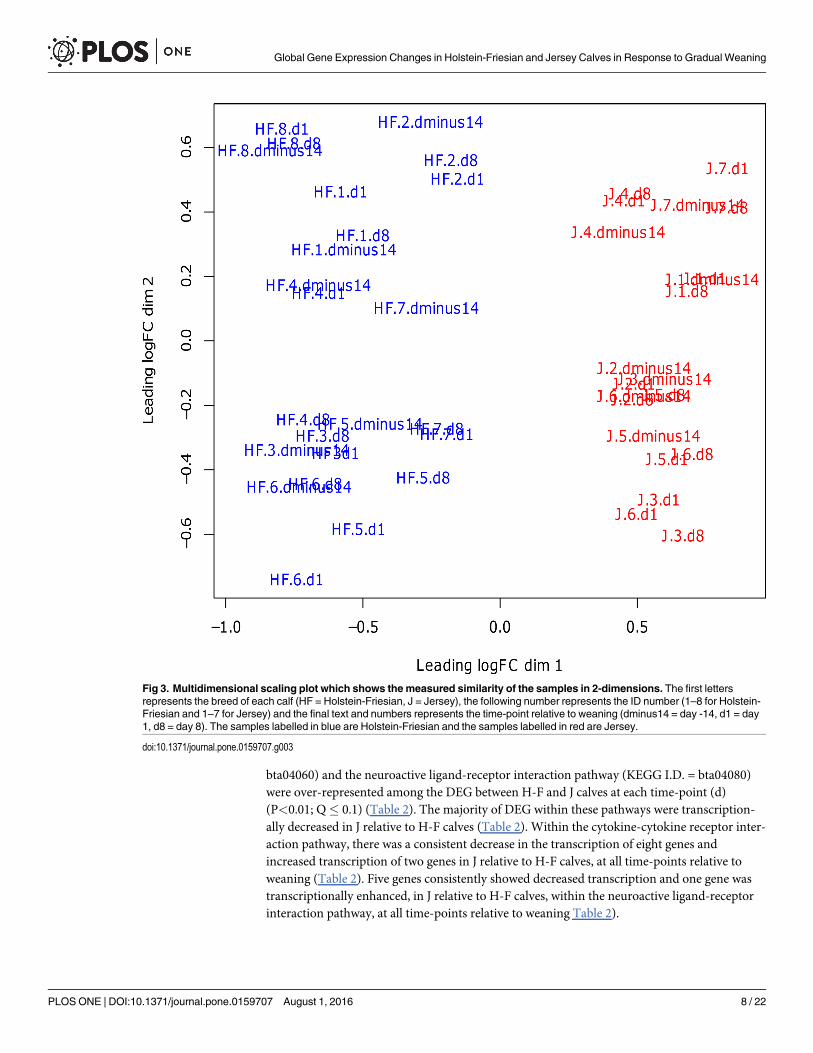
Differentially expressed genesThe samples from one J calf contained outliers, and consequently, this calf was removed fromall analyses. Using Edge-R, a multi-dimensional scaling (MDS) plot was produced which mea-sured the similarity of the samples and projected this measure into 2-dimensions. It illustrateda separation between the two breeds but no separation occurring between time-points (Fig 3).
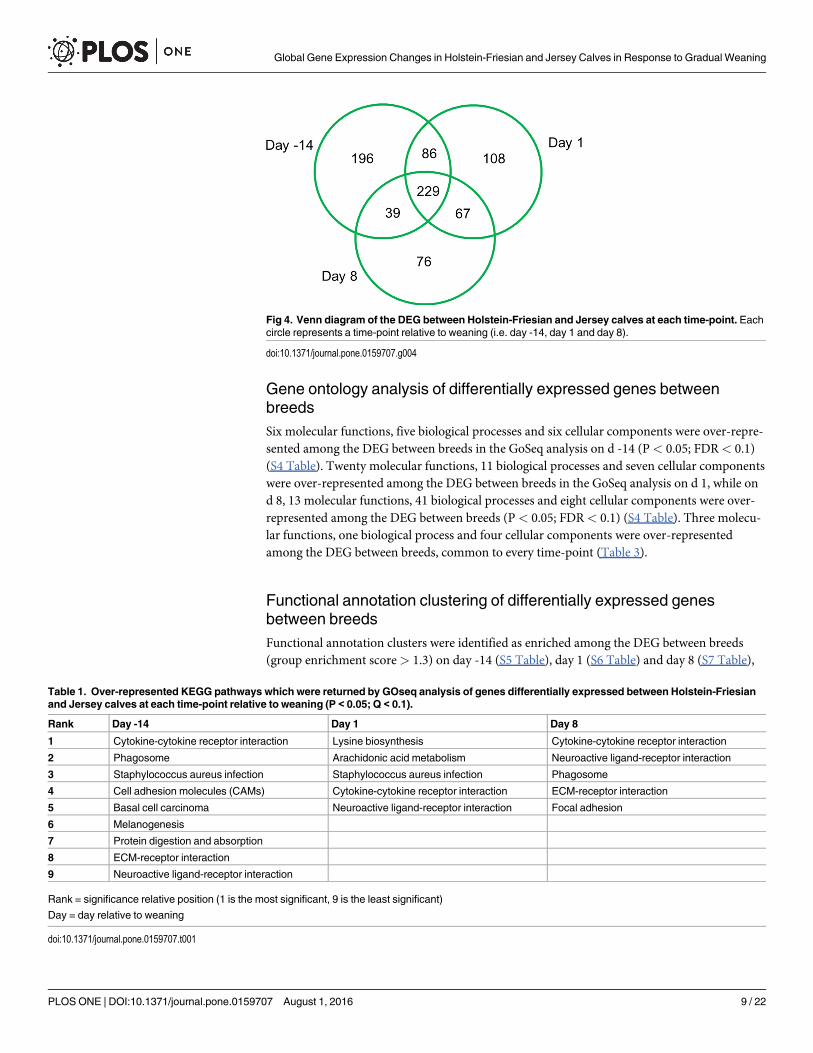
Gradual weaning had no effect on gene expression as there were no DEG within breedbetween time-points (P> 0.05). However, gene expression differed between the two breeds ateach time-point (P< 0.05). There were 550 DEG (P< 0.05; FDR< 0.1; fold change> 1.0)between H-F and J at d -14 (S1 Table). Two hundred and fourteen of these genes had increasedtranscription while 337 genes were transcriptionally decreased, in J relative to H-F calves.Additionally, there were 490 DEG (P< 0.05; FDR< 0.1; fold change> 1.5) between H-F and Jat d 1 (S2 Table) with 242 of these genes transcriptionally increased and 248 transcriptionallydecreased in J compared with H-F. There were 411 DEG (P< 0.05; FDR< 0.1; foldchange> 1.5) between H-F and J at d 8 (S3 Table). One hundred and fifty four of the geneshad increased expression and 257 of the genes had decreased expression in J relative to H-F.The majority of the DEG (229) between breeds were common to all time-points (Fig 4).
Pathway analysis of differentially expressed genes between breedsResults of KEGG pathway analysis using GoSeq, after the implementation of an FDR of 10%using qvalue, indicated that nine KEGG pathways were over-represented among the DEGbetween H-F and J calves on d -14, five on d 1 and five on d 8 (P< 0.01; Q� 0.1) (Table 1).Two KEGG pathways, the cytokine-cytokine receptor interaction pathway (KEGG I.D. =
Global Gene Expression Changes in Holstein-Friesian and Jersey Calves in Response to Gradual Weaning
PLOS ONE | DOI:10.1371/journal.pone.0159707 August 1, 2016 7 / 22
bta04060) and the neuroactive ligand-receptor interaction pathway (KEGG I.D. = bta04080)were over-represented among the DEG between H-F and J calves at each time-point (d)(P<0.01; Q� 0.1) (Table 2). The majority of DEG within these pathways were transcription-ally decreased in J relative to H-F calves (Table 2). Within the cytokine-cytokine receptor inter-action pathway, there was a consistent decrease in the transcription of eight genes andincreased transcription of two genes in J relative to H-F calves, at all time-points relative toweaning (Table 2). Five genes consistently showed decreased transcription and one gene wastranscriptionally enhanced, in J relative to H-F calves, within the neuroactive ligand-receptorinteraction pathway, at all time-points relative to weaning Table 2).
Fig 3. Multidimensional scaling plot which shows the measured similarity of the samples in 2-dimensions. The first lettersrepresents the breed of each calf (HF = Holstein-Friesian, J = Jersey), the following number represents the ID number (1–8 for Holstein-Friesian and 1–7 for Jersey) and the final text and numbers represents the time-point relative to weaning (dminus14 = day -14, d1 = day1, d8 = day 8). The samples labelled in blue are Holstein-Friesian and the samples labelled in red are Jersey.
doi:10.1371/journal.pone.0159707.g003
Global Gene Expression Changes in Holstein-Friesian and Jersey Calves in Response to Gradual Weaning
PLOS ONE | DOI:10.1371/journal.pone.0159707 August 1, 2016 8 / 22
Gene ontology analysis of differentially expressed genes betweenbreedsSix molecular functions, five biological processes and six cellular components were over-repre-sented among the DEG between breeds in the GoSeq analysis on d -14 (P< 0.05; FDR< 0.1)(S4 Table). Twenty molecular functions, 11 biological processes and seven cellular componentswere over-represented among the DEG between breeds in the GoSeq analysis on d 1, while ond 8, 13 molecular functions, 41 biological processes and eight cellular components were over-represented among the DEG between breeds (P< 0.05; FDR< 0.1) (S4 Table). Three molecu-lar functions, one biological process and four cellular components were over-representedamong the DEG between breeds, common to every time-point (Table 3).
Functional annotation clustering of differentially expressed genesbetween breedsFunctional annotation clusters were identified as enriched among the DEG between breeds(group enrichment score> 1.3) on day -14 (S5 Table), day 1 (S6 Table) and day 8 (S7 Table),
Fig 4. Venn diagram of the DEG between Holstein-Friesian and Jersey calves at each time-point. Eachcircle represents a time-point relative to weaning (i.e. day -14, day 1 and day 8).
doi:10.1371/journal.pone.0159707.g004
Table 1. Over-represented KEGG pathways which were returned by GOseq analysis of genes differentially expressed between Holstein-Friesianand Jersey calves at each time-point relative to weaning (P < 0.05; Q < 0.1).
Rank Day -14 Day 1 Day 8
1 Cytokine-cytokine receptor interaction Lysine biosynthesis Cytokine-cytokine receptor interaction
2 Phagosome Arachidonic acid metabolism Neuroactive ligand-receptor interaction
3 Staphylococcus aureus infection Staphylococcus aureus infection Phagosome
4 Cell adhesion molecules (CAMs) Cytokine-cytokine receptor interaction ECM-receptor interaction
5 Basal cell carcinoma Neuroactive ligand-receptor interaction Focal adhesion
6 Melanogenesis
7 Protein digestion and absorption
8 ECM-receptor interaction
9 Neuroactive ligand-receptor interaction
Rank = significance relative position (1 is the most significant, 9 is the least significant)
Day = day relative to weaning
doi:10.1371/journal.pone.0159707.t001
Global Gene Expression Changes in Holstein-Friesian and Jersey Calves in Response to Gradual Weaning
PLOS ONE | DOI:10.1371/journal.pone.0159707 August 1, 2016 9 / 22
relative to weaning. Overall, the clustered functions which were enriched among the DEGbetween breeds at all time-points relative to weaning were related to cell signalling and immuneresponses. Clustered functions included cytokine and chemokine activity, C-type lectin activ-ity, immunoglobulin like and MH1 class receptor activity, g-protein coupled signalling and cellmembrane and extracellular signalling.
Gene functional classification grouping of differentially expressed genesbetween breedsGene functional classification groups were identified as enriched among the DEG betweenbreeds (group enrichment score> 1.3) on d -14 (S8 Table), d 1 (S9 Table) and d 8 (S10 Table),relative to weaning.
The gene groups which were consistently enriched among the DEG between breeds at alltime-points relative to weaning, included: g-protein coupled receptors; chemokines; lectinreceptors; complement receptors and interleukin receptor accessary proteins.
Table 2. Over-represented KEGG pathways returned by GOseq analysis of genes differentially expressed between Holstein-Friesian and Jersey atall three different time points relative to weaning.
KEGG Pathway Time-points
Transcription increased Transcription decreased
Cytokine-cytokine receptorinteraction (bta04060)
d -14 TNFRSF13C, CXCR5,TNFRSF13C, PDGFA, IFNB1
CXCL10,MPL, IL1R2, PDGFRA, CCL5, CXCL4, IL23R, IL13RA1, CCL3(ensemble ID = ENSBTAG00000025250), TNFSF12, CXCL16, IL18RAP,TNFSF13B, TNFSF9, IL15RA, uncharacterised protein (ensembleID = ENSBTAG00000011563)
d 1 TNFRSF13C, PDGFA, IFNB1 CXCL10, KIT,MPL, IL1R2, PDGFRA, CCL5, CXCL4, TNFSF12, PPBP, IL18RAP,two genes annotated CCL3 (ensemble IDs = ENSBTAG00000025250 andENSBTAG00000003289)
d 8 MET, PDGFA, IFNB1 IL1B,MPL, IL1R2, PDGFRA, CCL5, CXCL4, FLT3, TNFSF12, IL18RAP, CXCR2,two genes annotated CCL3 (ensemble IDs = ENSBTAG00000025250 andENSBTAG00000003289)
Neuroactive ligand-receptor interaction(bta04080)
d -14 HTR6, GH1 F2RL2, CALCRL, LTB4R, C3AR1, P2RY14, PRSS2, GZMA, ADORA3, P2RX1
d 1 GIPR, HTR6 CALCRL, LTB4R, C3AR1, HRH4, C5AR1, P2RY14, PRSS2, GZMA
d 8 S1PR3, HTR6 ADRB1, S1PR5, CALCRL, LTB4R, C5AR1, P2RY14, PRSS2, GZMA
Time-points = days relative to weaning; Transcription increased = increased transcription in Jersey relative to Holstein-Friesian calves; Transcription
decreased = decreased transcription in Jersey relative to Holstein-Friesian calves
doi:10.1371/journal.pone.0159707.t002
Table 3. Over-represented ontological terms returned by GOseq analysis of genes differentially expressed between Holstein-Friesian and Jerseycalves at all three different time points relative to weaning.
Molecular Function Biological Process Cellular Component
GO ID Term GO ID Term GO ID Term
GO:0008009 chemokine activity GO:0033002 muscle cell proliferation GO:0005576 extracellular region
GO:0042379 chemokine receptor binding GO:0005615 extracellular space
GO:0005125 cytokine activity GO:0044421 extracellular region part
GO:0032994 protein-lipid complex
GO:0034358 plasma lipoprotein particle
GO = gene ontology
doi:10.1371/journal.pone.0159707.t003
Global Gene Expression Changes in Holstein-Friesian and Jersey Calves in Response to Gradual Weaning
PLOS ONE | DOI:10.1371/journal.pone.0159707 August 1, 2016 10 / 22
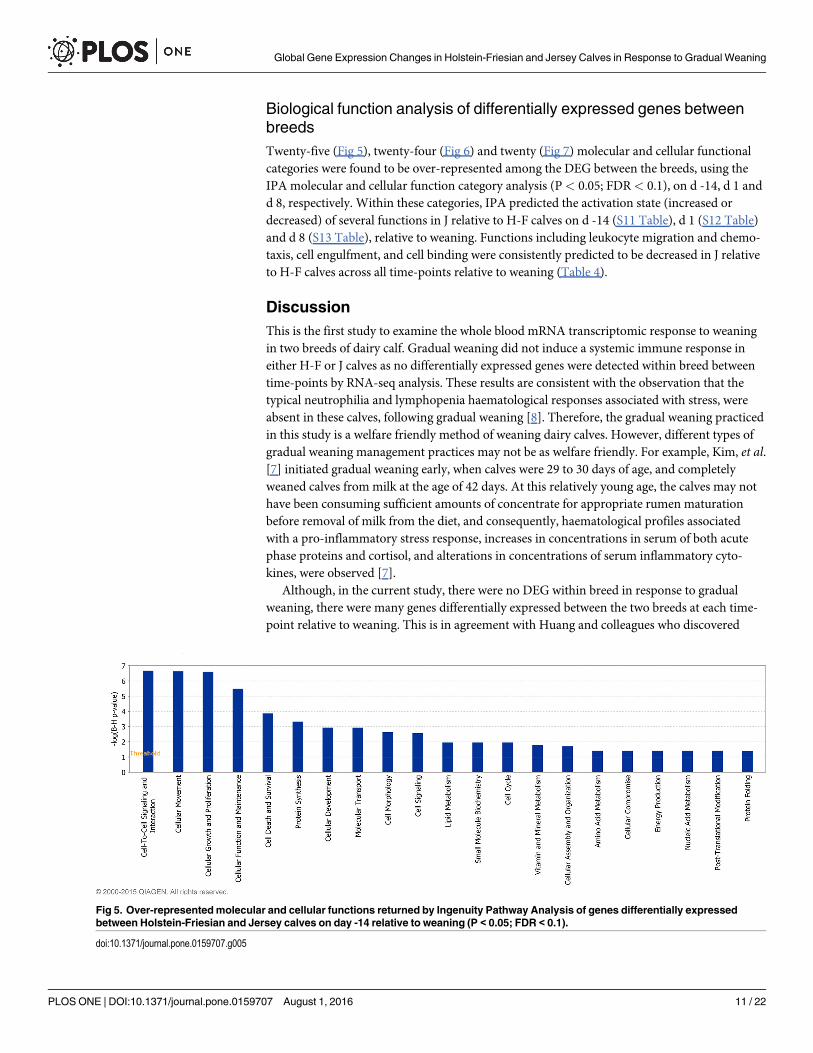
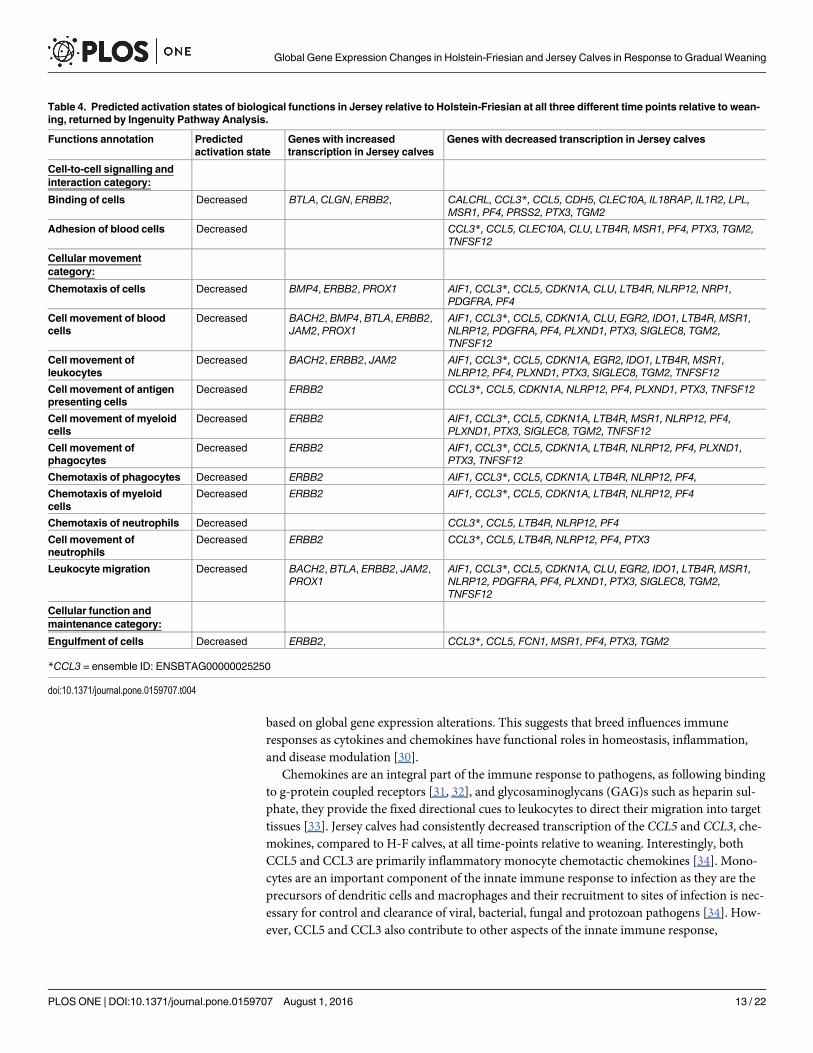
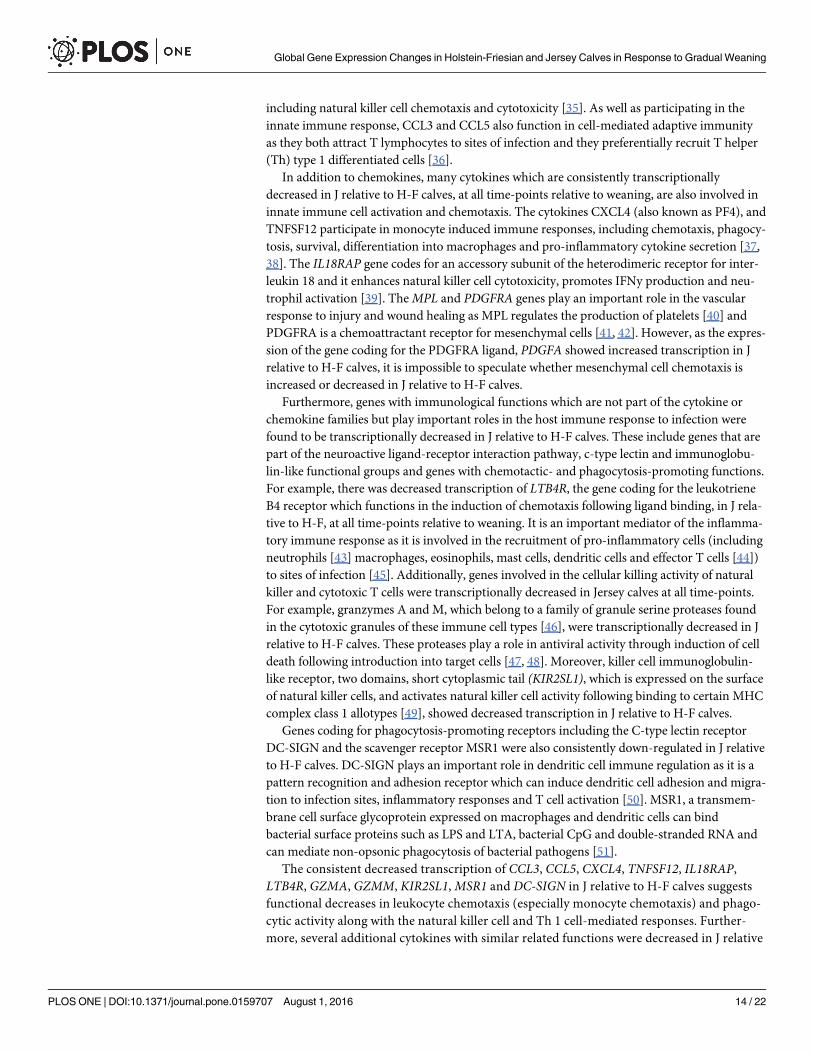
Biological function analysis of differentially expressed genes betweenbreedsTwenty-five (Fig 5), twenty-four (Fig 6) and twenty (Fig 7) molecular and cellular functionalcategories were found to be over-represented among the DEG between the breeds, using theIPA molecular and cellular function category analysis (P< 0.05; FDR< 0.1), on d -14, d 1 andd 8, respectively. Within these categories, IPA predicted the activation state (increased ordecreased) of several functions in J relative to H-F calves on d -14 (S11 Table), d 1 (S12 Table)and d 8 (S13 Table), relative to weaning. Functions including leukocyte migration and chemo-taxis, cell engulfment, and cell binding were consistently predicted to be decreased in J relativeto H-F calves across all time-points relative to weaning (Table 4).
DiscussionThis is the first study to examine the whole blood mRNA transcriptomic response to weaningin two breeds of dairy calf. Gradual weaning did not induce a systemic immune response ineither H-F or J calves as no differentially expressed genes were detected within breed betweentime-points by RNA-seq analysis. These results are consistent with the observation that thetypical neutrophilia and lymphopenia haematological responses associated with stress, wereabsent in these calves, following gradual weaning [8]. Therefore, the gradual weaning practicedin this study is a welfare friendly method of weaning dairy calves. However, different types ofgradual weaning management practices may not be as welfare friendly. For example, Kim, et al.[7] initiated gradual weaning early, when calves were 29 to 30 days of age, and completelyweaned calves from milk at the age of 42 days. At this relatively young age, the calves may nothave been consuming sufficient amounts of concentrate for appropriate rumen maturationbefore removal of milk from the diet, and consequently, haematological profiles associatedwith a pro-inflammatory stress response, increases in concentrations in serum of both acutephase proteins and cortisol, and alterations in concentrations of serum inflammatory cyto-kines, were observed [7].
Although, in the current study, there were no DEG within breed in response to gradualweaning, there were many genes differentially expressed between the two breeds at each time-point relative to weaning. This is in agreement with Huang and colleagues who discovered
Fig 5. Over-representedmolecular and cellular functions returned by Ingenuity Pathway Analysis of genes differentially expressedbetween Holstein-Friesian and Jersey calves on day -14 relative to weaning (P < 0.05; FDR < 0.1).
doi:10.1371/journal.pone.0159707.g005
Global Gene Expression Changes in Holstein-Friesian and Jersey Calves in Response to Gradual Weaning
PLOS ONE | DOI:10.1371/journal.pone.0159707 August 1, 2016 11 / 22
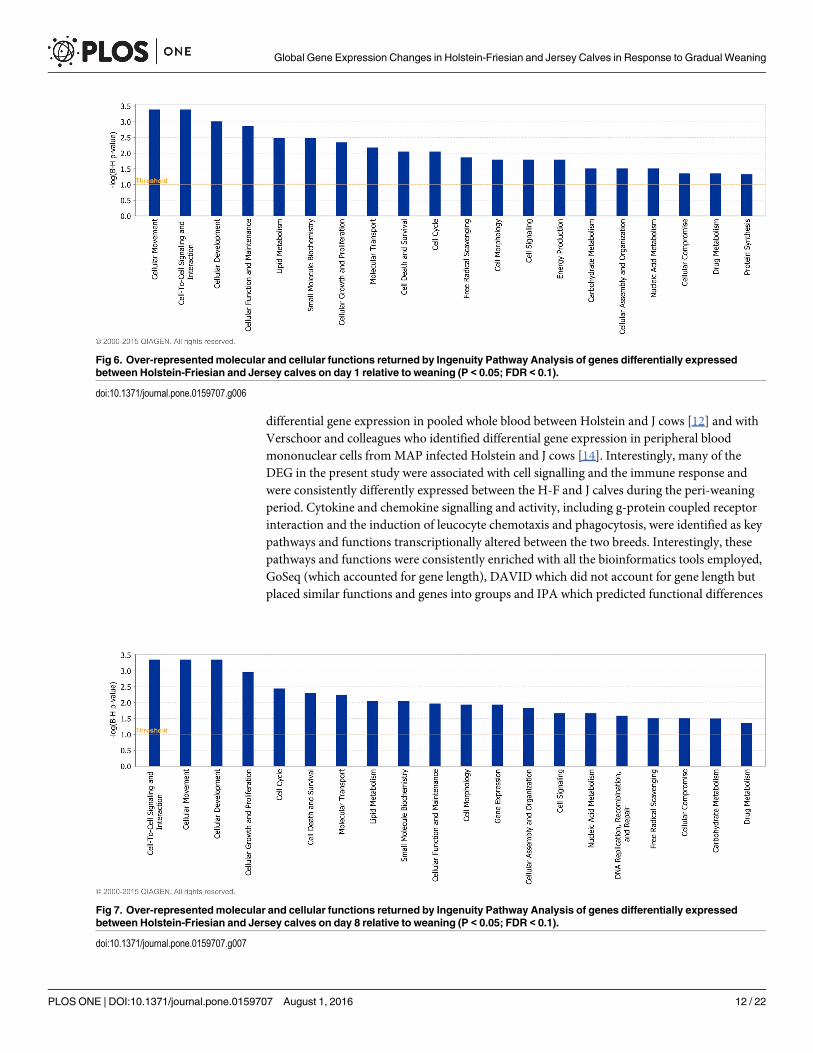
differential gene expression in pooled whole blood between Holstein and J cows [12] and withVerschoor and colleagues who identified differential gene expression in peripheral bloodmononuclear cells from MAP infected Holstein and J cows [14]. Interestingly, many of theDEG in the present study were associated with cell signalling and the immune response andwere consistently differently expressed between the H-F and J calves during the peri-weaningperiod. Cytokine and chemokine signalling and activity, including g-protein coupled receptorinteraction and the induction of leucocyte chemotaxis and phagocytosis, were identified as keypathways and functions transcriptionally altered between the two breeds. Interestingly, thesepathways and functions were consistently enriched with all the bioinformatics tools employed,GoSeq (which accounted for gene length), DAVID which did not account for gene length butplaced similar functions and genes into groups and IPA which predicted functional differences
Fig 6. Over-representedmolecular and cellular functions returned by Ingenuity Pathway Analysis of genes differentially expressedbetween Holstein-Friesian and Jersey calves on day 1 relative to weaning (P < 0.05; FDR < 0.1).
doi:10.1371/journal.pone.0159707.g006
Fig 7. Over-representedmolecular and cellular functions returned by Ingenuity Pathway Analysis of genes differentially expressedbetween Holstein-Friesian and Jersey calves on day 8 relative to weaning (P < 0.05; FDR < 0.1).
doi:10.1371/journal.pone.0159707.g007
Global Gene Expression Changes in Holstein-Friesian and Jersey Calves in Response to Gradual Weaning
PLOS ONE | DOI:10.1371/journal.pone.0159707 August 1, 2016 12 / 22
based on global gene expression alterations. This suggests that breed influences immuneresponses as cytokines and chemokines have functional roles in homeostasis, inflammation,and disease modulation [30].
Chemokines are an integral part of the immune response to pathogens, as following bindingto g-protein coupled receptors [31, 32], and glycosaminoglycans (GAG)s such as heparin sul-phate, they provide the fixed directional cues to leukocytes to direct their migration into targettissues [33]. Jersey calves had consistently decreased transcription of the CCL5 and CCL3, che-mokines, compared to H-F calves, at all time-points relative to weaning. Interestingly, bothCCL5 and CCL3 are primarily inflammatory monocyte chemotactic chemokines [34]. Mono-cytes are an important component of the innate immune response to infection as they are theprecursors of dendritic cells and macrophages and their recruitment to sites of infection is nec-essary for control and clearance of viral, bacterial, fungal and protozoan pathogens [34]. How-ever, CCL5 and CCL3 also contribute to other aspects of the innate immune response,
Table 4. Predicted activation states of biological functions in Jersey relative to Holstein-Friesian at all three different time points relative to wean-ing, returned by Ingenuity Pathway Analysis.
Functions annotation Predictedactivation state
Genes with increasedtranscription in Jersey calves
Genes with decreased transcription in Jersey calves
Cell-to-cell signalling andinteraction category:
Binding of cells Decreased BTLA, CLGN, ERBB2, CALCRL, CCL3*, CCL5, CDH5, CLEC10A, IL18RAP, IL1R2, LPL,MSR1, PF4, PRSS2, PTX3, TGM2
Adhesion of blood cells Decreased CCL3*, CCL5, CLEC10A, CLU, LTB4R, MSR1, PF4, PTX3, TGM2,TNFSF12
Cellular movementcategory:
Chemotaxis of cells Decreased BMP4, ERBB2, PROX1 AIF1, CCL3*, CCL5, CDKN1A, CLU, LTB4R, NLRP12, NRP1,PDGFRA, PF4
Cell movement of bloodcells
Decreased BACH2, BMP4, BTLA, ERBB2,JAM2, PROX1
AIF1, CCL3*, CCL5, CDKN1A, CLU, EGR2, IDO1, LTB4R, MSR1,NLRP12, PDGFRA, PF4, PLXND1, PTX3, SIGLEC8, TGM2,TNFSF12
Cell movement ofleukocytes
Decreased BACH2, ERBB2, JAM2 AIF1, CCL3*, CCL5, CDKN1A, EGR2, IDO1, LTB4R, MSR1,NLRP12, PF4, PLXND1, PTX3, SIGLEC8, TGM2, TNFSF12
Cell movement of antigenpresenting cells
Decreased ERBB2 CCL3*, CCL5, CDKN1A, NLRP12, PF4, PLXND1, PTX3, TNFSF12
Cell movement of myeloidcells
Decreased ERBB2 AIF1, CCL3*, CCL5, CDKN1A, LTB4R, MSR1, NLRP12, PF4,PLXND1, PTX3, SIGLEC8, TGM2, TNFSF12
Cell movement ofphagocytes
Decreased ERBB2 AIF1, CCL3*, CCL5, CDKN1A, LTB4R, NLRP12, PF4, PLXND1,PTX3, TNFSF12
Chemotaxis of phagocytes Decreased ERBB2 AIF1, CCL3*, CCL5, CDKN1A, LTB4R, NLRP12, PF4,
Chemotaxis of myeloidcells
Decreased ERBB2 AIF1, CCL3*, CCL5, CDKN1A, LTB4R, NLRP12, PF4
Chemotaxis of neutrophils Decreased CCL3*, CCL5, LTB4R, NLRP12, PF4
Cell movement ofneutrophils
Decreased ERBB2 CCL3*, CCL5, LTB4R, NLRP12, PF4, PTX3
Leukocyte migration Decreased BACH2, BTLA, ERBB2, JAM2,PROX1
AIF1, CCL3*, CCL5, CDKN1A, CLU, EGR2, IDO1, LTB4R, MSR1,NLRP12, PDGFRA, PF4, PLXND1, PTX3, SIGLEC8, TGM2,TNFSF12
Cellular function andmaintenance category:
Engulfment of cells Decreased ERBB2, CCL3*, CCL5, FCN1, MSR1, PF4, PTX3, TGM2
*CCL3 = ensemble ID: ENSBTAG00000025250
doi:10.1371/journal.pone.0159707.t004
Global Gene Expression Changes in Holstein-Friesian and Jersey Calves in Response to Gradual Weaning
PLOS ONE | DOI:10.1371/journal.pone.0159707 August 1, 2016 13 / 22
including natural killer cell chemotaxis and cytotoxicity [35]. As well as participating in theinnate immune response, CCL3 and CCL5 also function in cell-mediated adaptive immunityas they both attract T lymphocytes to sites of infection and they preferentially recruit T helper(Th) type 1 differentiated cells [36].
In addition to chemokines, many cytokines which are consistently transcriptionallydecreased in J relative to H-F calves, at all time-points relative to weaning, are also involved ininnate immune cell activation and chemotaxis. The cytokines CXCL4 (also known as PF4), andTNFSF12 participate in monocyte induced immune responses, including chemotaxis, phagocy-tosis, survival, differentiation into macrophages and pro-inflammatory cytokine secretion [37,38]. The IL18RAP gene codes for an accessory subunit of the heterodimeric receptor for inter-leukin 18 and it enhances natural killer cell cytotoxicity, promotes IFNy production and neu-trophil activation [39]. TheMPL and PDGFRA genes play an important role in the vascularresponse to injury and wound healing as MPL regulates the production of platelets [40] andPDGFRA is a chemoattractant receptor for mesenchymal cells [41, 42]. However, as the expres-sion of the gene coding for the PDGFRA ligand, PDGFA showed increased transcription in Jrelative to H-F calves, it is impossible to speculate whether mesenchymal cell chemotaxis isincreased or decreased in J relative to H-F calves.
Furthermore, genes with immunological functions which are not part of the cytokine orchemokine families but play important roles in the host immune response to infection werefound to be transcriptionally decreased in J relative to H-F calves. These include genes that arepart of the neuroactive ligand-receptor interaction pathway, c-type lectin and immunoglobu-lin-like functional groups and genes with chemotactic- and phagocytosis-promoting functions.For example, there was decreased transcription of LTB4R, the gene coding for the leukotrieneB4 receptor which functions in the induction of chemotaxis following ligand binding, in J rela-tive to H-F, at all time-points relative to weaning. It is an important mediator of the inflamma-tory immune response as it is involved in the recruitment of pro-inflammatory cells (includingneutrophils [43] macrophages, eosinophils, mast cells, dendritic cells and effector T cells [44])to sites of infection [45]. Additionally, genes involved in the cellular killing activity of naturalkiller and cytotoxic T cells were transcriptionally decreased in Jersey calves at all time-points.For example, granzymes A and M, which belong to a family of granule serine proteases foundin the cytotoxic granules of these immune cell types [46], were transcriptionally decreased in Jrelative to H-F calves. These proteases play a role in antiviral activity through induction of celldeath following introduction into target cells [47, 48]. Moreover, killer cell immunoglobulin-like receptor, two domains, short cytoplasmic tail (KIR2SL1), which is expressed on the surfaceof natural killer cells, and activates natural killer cell activity following binding to certain MHCcomplex class 1 allotypes [49], showed decreased transcription in J relative to H-F calves.
Genes coding for phagocytosis-promoting receptors including the C-type lectin receptorDC-SIGN and the scavenger receptor MSR1 were also consistently down-regulated in J relativeto H-F calves. DC-SIGN plays an important role in dendritic cell immune regulation as it is apattern recognition and adhesion receptor which can induce dendritic cell adhesion and migra-tion to infection sites, inflammatory responses and T cell activation [50]. MSR1, a transmem-brane cell surface glycoprotein expressed on macrophages and dendritic cells can bindbacterial surface proteins such as LPS and LTA, bacterial CpG and double-stranded RNA andcan mediate non-opsonic phagocytosis of bacterial pathogens [51].
The consistent decreased transcription of CCL3, CCL5, CXCL4, TNFSF12, IL18RAP,LTB4R, GZMA, GZMM, KIR2SL1,MSR1 and DC-SIGN in J relative to H-F calves suggestsfunctional decreases in leukocyte chemotaxis (especially monocyte chemotaxis) and phago-cytic activity along with the natural killer cell and Th 1 cell-mediated responses. Further-more, several additional cytokines with similar related functions were decreased in J relative
Global Gene Expression Changes in Holstein-Friesian and Jersey Calves in Response to Gradual Weaning
PLOS ONE | DOI:10.1371/journal.pone.0159707 August 1, 2016 14 / 22
to H-F calves on at least one day relative to weaning. Jersey calves had reduced transcriptionof CXCL10 (also known as IP-10) compared with H-F calves, on days -14 and 1, relative toweaning. The CXCL10 protein is an IFNγ inducible inflammatory chemokine associatedwith a Th 1 phenotype and it plays an important role in leukocyte recruitment (especiallymonocytes and T lymphocytes) to inflammatory sites [52]. Expression of IL23R was alsoreduced in J relative to H-F calves on d -14. It codes for a receptor subunit for IL-23 whichpromotes proliferation of T cells, stimulates IFNγ production by T cells and promotes Th 1differentiation [53, 54]. Additionally, transcription of IL1B was decreased in J relative toH-F calves on d 8. It codes for a pro-inflammatory cytokine produced mainly by monocytesand macrophages and is involved in the enhancement of secretion of other pro-inflamma-tory cytokines, fever induction, histamine release from basophils, macrophage phagocytosisand neutrophil survival, adhesion and oxidative burst activation and survival, differentiationand proliferation of T cells [55].
Interestingly, the expression of two genes involved in the pro-inflammatory immuneresponse was consistently increased in J relative to H-F calves, at all time-points relative toweaning. Jersey calves had increased levels of transcription of IL1R2 which codes for a decoyreceptor for IL1 and modulates pro-inflammatory immune responses [56] and of IFNB1 whichis involved in the bovine protective immune response against specific viruses including RNAviruses [57]. Therefore, both breeds have different levels of transcription for important genesfunctioning in immune responses and likely have divergent susceptibilities and immuneresponses for specific pathogen types. Indeed many of the genes which are differentiallyexpressed between these two breeds have been implicated in the immune response to severalbovine diseases. The CCL5 chemokine has been shown to play a role in the inflammatoryresponse to bovine respiratory syncytial virus [58], Alcelaphine herpesvirus 1 [59], mastitis[60–63], bovine tuberculosis [64] and parasitic protozoan infections with Toxoplasma gondii[65], Neospora canium [65] and Eimera bovis [65]. Up-regulation of CCL3 has previously beenassociated with the inflammatory response to mastitis [62], bovine tuberculosis [64, 66], virusesincluding bovine respiratory syncytial virus [58], Alcelaphine herpesvirus 1 [59], resistance tobovine nematode infections [67] and a protective response from vaccinated cattle to bovinetuberculosis [68]. Furthermore, CXCL10 has previously been reported to be up-regulated in thebovine immune response to several pathogenic species [30] including Eimera bovis [69, 70],Toxoplasma gondii [65], Neospora canium [65], Alcelaphine herpesvirus 1 [59], bovine respira-tory syncytial virus [71] andMycobacterium bovis [66]. The GZMA gene has been observed tobe transcriptionally increased in response to viral challenge with both bovine herpesvirus 1 andbovine respiratory syncytial virus [71]. Furthermore, PDGFRA transcription has increased inresponse to viral challenges with both bovine respiratory syncytial virus and bovine viral diar-rhoea virus and in response to bacterial challenge withMannheimia haemolytica and Pasteur-ella multocida [71]. Increased expression of TNFSF12 was observed following infection withboth bovine herpesvirus 1 and bovine viral diarrhoea virus [71]. The CXCL4 cytokine has beenup-regulated in response to a challenge infection withMannheimia haemolytica [71]. Tran-scription of CALCRL has been increased in response to viral challenge with bovine viral diar-rhoea virus and bacterial challenge withMannheimia haemolytica [71]. Finally, LTB4Rtranscription increased following challenge infections with bovine viral diarrhoea virus, bovineherpesvirus 1 and Pasteurella multocida [71].
This study has demonstrated that H-F calves have consistently higher basal levels of tran-scription of many cytokines, chemokines and immune response effector genes, than J calves,under artificial-rearing conditions. Higher basal levels of pro-inflammatory cytokines may alsoinfer better resistance to pathogens in the environment as Li and colleagues [67] have shownthat heifers resistant to nematode infections are better able to produce inflammatory cytokines
Global Gene Expression Changes in Holstein-Friesian and Jersey Calves in Response to Gradual Weaning
PLOS ONE | DOI:10.1371/journal.pone.0159707 August 1, 2016 15 / 22
at the site of nematode infection than susceptible heifers. Therefore, the increased levels oftranscription of many immune response associated genes in H-F calves suggests that this breedmay be better equipped to fight pathogen invasion more rapidly before pathogens can causedisease. Indeed, we have observed J calves to succumb to greater numbers of incidents ofbovine respiratory disease, than H-F calves (unpublished data). Furthermore, as the many ofthe DEG which were decreased in J relative to H-F calves were involved in natural killer celland Th 1 cell activity which primarily function in the clearance of intracellular bacteria andvirus infected cells [35, 72], J calves may specifically be more susceptible than H-F calves toinfection with intracellular bacteria and some viruses. Indeed, J have been reported to developinfections withMycobacterium paratuberculosismore often than H-F [73, 74] and J calves havebeen found to be more susceptible to Salmonella typhimurium infection than Friesian calves[75].
The decreased transcription of genes involved in immune responses in J relative to H-Fcalves was, however, surprizing as the J calves in the present study, along with J calves in otherstudies [15, 76], have higher maternally derived serum immunoglobulin G concentrations. Itappears that despite J calves receiving enhanced immunological protection from disease fromtheir dams, they still may have reduced immune capacity. Although greater transcription ofpro-inflammatory cytokines in H-F relative to J calves may improve efficiency of both theimmune responses to pathogens and resistance to infection, it is also possible that they maycause pathogenesis. When unregulated excess pro-inflammatory chemokines are produced,they can cause tissue damage and exuberate many inflammatory diseases such as allergic reac-tions, arthritis and arteriosclerosis [31, 34, 77].
Differential gene expression between MAP experimentally challenged Holstein and J cowshas been already demonstrated in a microarray experiment [14] and we have shown in thepresent study, differential gene expression between experimentally unchallenged H-F and Jcalves. Furthermore, using pathway analysis tools, we have predicted differences in functionalimmune responses, including leukocyte chemotaxis and phagocytosis. Interestingly, wholeblood killing of bacteria and neutrophil oxidative burst, following incubation of blood withenteropathogenic Escherichia coli, have previously been demonstrated to be decreased in J rela-tive to Holstein calves [15] and this is in agreement with predicted immune function differ-ences between the breeds using the DEG in our study. Despite these observations, onlyminimal breed differences between the innate immune responses of Holstein and J cows toexperimental challenge intramammary infection with both Staphylococcus aureus [78] andEscherichia coli [13] have been reported. However, we have discovered decreased transcriptionin J relative to H-F calves, in genes which promote cytotoxic activity in natural killer cells andT lymphocytes. Consequently, future experimental challenge studies comparing H-F and Jimmune responses to disease could be designed using either an intracellular bacterium or avirus and subsequently, immune functional tests could be carried out on blood collected fromthese animals during the experimental challenge.
The H-F and J calves in this study were, by necessity, sourced from different herds. Conse-quently, there was in a difference in age at study enrolment between the H-F and J calves. How-ever, both age at allocation to treatment and serum ZST at arrival on site, were included as co-variants in the statistical models in the larger study, Johnston, et al. [8], and both were found tobe statistically non-significant. Therefore, it is our contention that the initial minor variation inage between the breeds at the start of the study did not have any confounding effect on theinterpretation of our results.
Global Gene Expression Changes in Holstein-Friesian and Jersey Calves in Response to Gradual Weaning
PLOS ONE | DOI:10.1371/journal.pone.0159707 August 1, 2016 16 / 22
ConclusionsThese results demonstrate that gradual weaning is welfare friendly as it does not induce tran-scriptional alterations during the peri-weaning period. Therefore, the necessary husbandrypractice of weaning potentially has minimal negative effects on the welfare and health of dairycalves if it is carried out gradually when calves are consuming sufficient concentrate feed andconsequently have rumens which are sufficiently developed to derive adequate nutrients fromsolid feed alone. Additionally, these data also demonstrate differences in transcriptional activityof genes involved in immune responses and cell signalling activity between the two breeds.They suggest decreased cellular movement, chemotaxis and phagocytic functionality in J rela-tive to H-F calves. Knowledge of breed-specific immune responses could enable improvedhealth management practices tailored towards H-F and J specific disease sensitivities. Thisknowledge could also promote and enable development of cost effective breed targeted prophy-lactic and therapeutic veterinary interventions.
Supporting InformationS1 Table. Differentially expressed genes between Holstein-Friesian and Jersey calves at day-14, relative to weaning (P< 0.05; FDR< 0.1; fold change> 0.05).(XLSX)
S2 Table. Differentially expressed genes between Holstein-Friesian and Jersey calves at day1, relative to weaning (P< 0.05; FDR< 0.1; fold change> 0.05).(XLSX)
S3 Table. Differentially expressed genes between Holstein-Friesian and Jersey calves at day8, relative to weaning (P< 0.05; FDR< 0.1; fold change> 0.05).(XLSX)
S4 Table. The molecular functions, biological processes and cellular components whichwere over-represented among the DEG between Holstein-Friesian and Jersey calves, at eachtime-point relative to weaning, using the GoSeq analysis.(XLSX)
S5 Table. Functional annotation clusters identified among the DEG between Holstein-Frie-sian and Jersey calves at day -14, relative to weaning. Enriched functional annotation clusters(group enrichment score> 1.3) are highlighted in yellow. Functional annotations within theclusters which had a benjamini hochberg false discovery rate< 0.1 are highlighted in blue.(XLSX)
S6 Table. Functional annotation clusters identified among the DEG between Holstein-Frie-sian and Jersey calves at day 1, relative to weaning. Enriched functional annotation clusters(group enrichment score> 1.3) are highlighted in yellow. Functional annotations within theclusters which had a benjamini hochberg false discovery rate< 0.1 are highlighted in blue.(XLSX)
S7 Table. Functional annotation clusters identified among the DEG between Holstein-Frie-sian and Jersey calves at day 8, relative to weaning. Enriched functional annotation clusters(group enrichment score> 1.3) are highlighted in yellow. Functional annotations within theclusters which had a benjamini hochberg false discovery rate< 0.1 are highlighted in blue.(XLSX)
S8 Table. Gene functional classification groups identified among the DEG between Hol-stein-Friesian and Jersey calves at day -14, relative to weaning. Enriched gene functional
Global Gene Expression Changes in Holstein-Friesian and Jersey Calves in Response to Gradual Weaning
PLOS ONE | DOI:10.1371/journal.pone.0159707 August 1, 2016 17 / 22
classification groups (group enrichment score> 1.3) are highlighted in yellow.(XLSX)
S9 Table. Gene functional classification groups identified among the DEG between Hol-stein-Friesian and Jersey calves at day 1, relative to weaning. Enriched gene functional classi-fication groups (group enrichment score> 1.3) are highlighted in yellow.(XLSX)
S10 Table. Gene functional classification groups identified among the DEG between Hol-stein-Friesian and Jersey calves at day 8, relative to weaning. Enriched gene functional classi-fication groups (group enrichment score> 1.3) are highlighted in yellow.(XLSX)
S11 Table. Predicted activation states (increased or decreased) of biological functions iden-tified by Ingenuity Pathway Analysis as enriched among the DEG between Holstein-Frie-sian and Jersey calves at day -14, relative to weaning. Genes coloured in red have increasedexpression in Jersey relative to Holstein-Friesian calves. Genes coloured in green havedecreased expression in Jersey relative to Holstein-Friesian calves.(XLSX)
S12 Table. Predicted activation states (increased or decreased) of biological functions iden-tified by Ingenuity Pathway Analysis as enriched among the DEG between Holstein-Frie-sian and Jersey calves at day 1, relative to weaning. Genes coloured in red have increasedexpression in Jersey relative to Holstein-Friesian calves. Genes coloured in green havedecreased expression in Jersey relative to Holstein-Friesian calves.(XLSX)
S13 Table. Predicted activation states (increased or decreased) of biological functions iden-tified by Ingenuity Pathway Analysis as enriched among the DEG between Holstein-Frie-sian and Jersey calves at day 8, relative to weaning. Genes coloured in red have increasedexpression in Jersey relative to Holstein-Friesian calves. Genes coloured in green havedecreased expression in Jersey relative to Holstein-Friesian calves.(XLSX)
Author ContributionsConceived and designed the experiments: BE DAK SMW. Performed the experiments: DJMSM. Analyzed the data: DJ PC. Contributed reagents/materials/analysis tools: BE DAK.Wrote the paper: DJ BE SMW. Read and approved the final version of the manuscript: DJ BEPCMSM SMWMMDAK AAK.
References1. Weary DM, Jasper J, Hötzel MJ. Understanding weaning distress. Applied Animal Behaviour Science.
2008; 110(1–2):24–41.
2. O'Loughlin A, Lynn D, McGee M, Doyle S, McCabe M, Earley B. Transcriptomic analysis of the stressresponse to weaning at housing in bovine leukocytes using RNA-seq technology. BMCGenomics.2012; 13(1):250.
3. O'Loughlin A, McGee M, Doyle S, Earley B. Biomarker responses to weaning stress in beef calves.Research in Veterinary Science. 2014; 97(2):458–63. doi: 10.1016/j.rvsc.2014.06.003 PMID:24992823
4. O'Loughlin A, McGee M, Waters S, Doyle S, Earley B. Examination of the bovine leukocyte environ-ment using immunogenetic biomarkers to assess immunocompetence following exposure to weaningstress. BMC Veterinary Research. 2011; 7(1):45.
Global Gene Expression Changes in Holstein-Friesian and Jersey Calves in Response to Gradual Weaning
PLOS ONE | DOI:10.1371/journal.pone.0159707 August 1, 2016 18 / 22
5. Lynch E, Earley B, McGee M, Doyle S. Effect of abrupt weaning at housing on leukocyte distribution,functional activity of neutrophils, and acute phase protein response of beef calves. BMC VeterinaryResearch. 2010; 6(1):39.
6. Hickey M, Drennan M, Earley B. The effect of abrupt weaning of suckler calves on the plasma concen-trations of cortisol, catecholamines, leukocytes, acute-phase proteins and in vitro interferon-gammaproduction. Journal of Animal Science. 2003; 81(11):2847–55. PMID: 14601889
7. Kim MH, Yang JY, Upadhaya SD, Lee HJ, Yun CH, Ha JK. The stress of weaning influences serum lev-els of acute-phase proteins, iron-binding proteins, inflammatory cytokines, cortisol, and leukocyte sub-sets in Holstein calves. Journal of Veterinary Science. 2011; 12(2):151–7. PMID: 21586874
8. Johnston D, Kenny DA, Kelly AK, McCabe MS, McGeeM, Waters SM, et al. Characterisation of hae-matological profiles and whole blood relative gene expression levels in Holstein-Friesian and Jerseybull calves undergoing gradual weaning. Animal. 2015;FirstView:1–10.
9. DAFM. AIM bovine statistics report 2013 2013 [1 November 2014, from https://www.agriculture.gov.ie/media/migration/animalhealthwelfare/animalidentificationandmovement/cattlemovementmonitoringsystem/AIMBOVINESTATISTICS2013050614.pdf].
10. Dhakal K, Maltecca C, Cassady JP, Baloche G, Williams CM, Washburn SP. Calf birth weight, gesta-tion length, calving ease, and neonatal calf mortality in Holstein, Jersey, and crossbred cows in a pas-ture system. Journal of Dairy Science. 2013; 96(1):690–8. doi: 10.3168/jds.2012-5817 PMID:23084888
11. Ballou MA, Cobb CJ, Earleywine TJ, Obeidat BS. Breed and plane of milk-replacer nutrition influencethe performance of pre- and postweaned dairy calves. The Professional Animal Scientist. 2013; 29(2):116–23.
12. HuangW, Nadeem A, Zhang B, Babar M, Soller M, Khatib H. Characterization and comparison of theleukocyte transcriptomes of three cattle breeds. PLoS One. 2012; 7(1).
13. Bannerman DD, Kauf AC, Paape MJ, Springer HR, Goff JP. Comparison of Holstein and Jersey innateimmune responses to Escherichia coli intramammary infection. Journal of Dairy Science. 2008; 91(6):2225–35. doi: 10.3168/jds.2008-1013 PMID: 18487645
14. Verschoor CP, Pant SD, You Q, Kelton DF, Karrow NA. Gene expression profiling of PBMCs from Hol-stein and Jersey cows sub-clinically infected with Mycobacterium avium ssp. paratuberculosis. Veteri-nary Immunology and Immunopathology. 2010; 137(1–2):1–11. doi: 10.1016/j.vetimm.2010.03.026PMID: 20447698
15. Ballou MA. Immune responses of Holstein and Jersey calves during the preweaning and immediatepostweaned periods when fed varying planes of milk replacer. Journal of Dairy Science. 2012; 95(12):7319–30. doi: 10.3168/jds.2012-5970 PMID: 23063147
16. Di Giacomo S, Brito BP, Perez AM, Bucafusco D, Pega J, Rodríguez L, et al. Heterogeneity in the anti-body response to foot-and-mouth disease primo-vaccinated calves. Transboundary and Emerging Dis-eases. 2015; 62(3):280–7. doi: 10.1111/tbed.12130 PMID: 23895140
17. Wang Z, Gerstein M, Snyder M. RNA-Seq: a revolutionary tool for transcriptomics. Nature ReviewsGenetics. 2009; 10(1):57–63. doi: 10.1038/nrg2484 PMID: 19015660
18. Conesa A, Madrigal P, Tarazona S, Gomez-Cabrero D, Cervera A, McPherson A, et al. A survey ofbest practices for RNA-seq data analysis. Genome Biology. 2016; 17:13. doi: 10.1186/s13059-016-0881-8 PMID: 26813401
19. McEwan AD, Fisher EW, Selman IE, PenhaleWJ. A turbidity test for the estimation of immune globulinlevels in neonatal calf serum. Clinica Chimica Acta. 1970; 27(1):155–63.
20. Dobin A, Davis CA, Schlesinger F, Drenkow J, Zaleski C, Jha S, et al. STAR: ultrafast universal RNA-seq aligner. Bioinformatics. 2013; 29(1):15–21. doi: 10.1093/bioinformatics/bts635 PMID: 23104886
21. Li H, Handsaker B, Wysoker A, Fennell T, Ruan J, Homer N, et al. The Sequence Alignment/Map for-mat and SAMtools. Bioinformatics. 2009; 25(16):2078–9. doi: 10.1093/bioinformatics/btp352 PMID:19505943
22. Anders S, Pyl PT, Huber W. HTSeq–A Python framework to work with high-throughput sequencingdata. Bioinformatics. 2014.
23. Robinson MD, McCarthy DJ, Smyth GK. edgeR: a Bioconductor package for differential expressionanalysis of digital gene expression data. Bioinformatics. 2010; 26(1):139–40. doi: 10.1093/bioinformatics/btp616 PMID: 19910308
24. Robinson M, Oshlack A. A scaling normalization method for differential expression analysis of RNA-seq data. Genome Biology. 2010; 11(3):R25. doi: 10.1186/gb-2010-11-3-r25 PMID: 20196867
25. Young MD, Wakefield MJ, Smyth GK, Oshlack A. Gene ontology analysis for RNA-seq: accounting forselection bias. Genome Biology. 2010; 11(2):2010–11.
Global Gene Expression Changes in Holstein-Friesian and Jersey Calves in Response to Gradual Weaning
PLOS ONE | DOI:10.1371/journal.pone.0159707 August 1, 2016 19 / 22
26. Kanehisa M, Goto S. KEGG: Kyoto Encyclopedia of Genes and Genomes. Nucleic Acids Research.2000; 28(1):27–30. PMID: 10592173
27. Storey JD, Tibshirani R. Statistical significance for genomewide studies. Proceedings of the NationalAcademy of Sciences. 2003; 100(16):9440–5.
28. Huang DW, Sherman BT, Lempicki RA. Systematic and integrative analysis of large gene lists usingDAVID bioinformatics resources. Nat Protocols. 2008; 4(1):44–57.
29. Huang DW, Sherman BT, Lempicki RA. Bioinformatics enrichment tools: paths toward the comprehen-sive functional analysis of large gene lists. Nucleic Acids Research. 2009; 37(1):1–13. doi: 10.1093/nar/gkn923 PMID: 19033363
30. Widdison S, Coffey TJ. Cattle and chemokines: evidence for species-specific evolution of the bovinechemokine system. Animal Genetics. 2011; 42(4):341–53. doi: 10.1111/j.1365-2052.2011.02200.xPMID: 21749416
31. Gangur V, Birmingham NP, Thanesvorakul S. Chemokines in health and disease. Veterinary Immunol-ogy and Immunopathology. 2002; 86(3–4):127–36. PMID: 12007879
32. Thelen M. Dancing to the tune of chemokines. Nature immunology. 2001; 2(2):129–34. PMID:11175805
33. Johnson Z, Kosco-Vilbois MH, Herren S, Cirillo R, Muzio V, Zaratin P, et al. Interference with heparinbinding and oligomerization creates a novel anti-inflammatory strategy targeting the chemokine sys-tem. The Journal of Immunology. 2004; 173(9):5776–85. PMID: 15494530
34. Shi C, Pamer EG. Monocyte recruitment during infection and inflammation. Nature Reviews Immunol-ogy. 2011; 11(11):762–74. doi: 10.1038/nri3070 PMID: 21984070
35. Robertson MJ. Role of chemokines in the biology of natural killer cells. Journal of Leukocyte Biology.2002; 71(2):173–83. PMID: 11818437
36. Siveke JT, Hamann A. Cutting Edge: T helper 1 and T helper 2 cells respond differentially to chemo-kines. The Journal of Immunology. 1998; 160(2):550–4. PMID: 9551886
37. Kasper B, Brandt E, Brandau S, Petersen F. Platelet factor 4 (CXC chemokine ligand 4) differentiallyregulates respiratory burst, survival, and cytokine expression of humanmonocytes by using distinct sig-naling pathways. The Journal of Immunology. 2007; 179(4):2584–91. PMID: 17675521
38. NakayamaM, Kayagaki N, Yamaguchi N, Okumura K, Yagita H. Involvement of tweak in interferon γ–stimulated monocyte cytotoxicity. The Journal of Experimental Medicine. 2000; 192(9):1373–80. PMID:11067885
39. Cheung H, Chen N-J, Cao Z, Ono N, Ohashi PS, YehW-C. Accessory protein-like is essential for IL-18-mediated signaling. The Journal of Immunology. 2005; 174(9):5351–7. PMID: 15843532
40. Ng AP, Kauppi M, Metcalf D, Hyland CD, Josefsson EC, Lebois M, et al. Mpl expression on megakaryo-cytes and platelets is dispensable for thrombopoiesis but essential to prevent myeloproliferation. ProcNatl Acad Sci U S A. 2014; 111(16):5884–9. doi: 10.1073/pnas.1404354111 PMID: 24711413
41. Floege J, Hudkins KL, Davis CL, Schwartz SM, Alpers CE. Expression of PDGF alpha-receptor in renalarteriosclerosis and rejecting renal transplants. Journal of the American Society of Nephrology. 1998; 9(2):211–23. PMID: 9527397
42. Andrae J, Gallini R, Betsholtz C. Role of platelet-derived growth factors in physiology and medicine.Genes & Development. 2008; 22(10):1276–312.
43. Kim ND, Chou RC, Seung E, Tager AM, Luster AD. A unique requirement for the leukotriene B4 recep-tor BLT1 for neutrophil recruitment in inflammatory arthritis. The Journal of Experimental Medicine.2006; 203(4):829–35. PMID: 16567386
44. Ohnishi H, Miyahara N, Gelfand EW. The role of leukotriene B(4) in allergic diseases. Allergology Inter-national. 2008; 57(4):291–8. doi: 10.2332/allergolint.08-RAI-0019 PMID: 18797182
45. Admyre C, Axelsson LG, von Stein O, Zargari A. Immunomodulatory oligonucleotides inhibit neutrophilmigration by decreasing the surface expression of IL-8 and LTB4 receptors. Immunology. 2014; 144(2):206–17.
46. Smyth MJ, O'Connor MD, Trapani JA. Granzymes: a variety of serine protease specificities encoded bygenetically distinct subfamilies. Journal of leukocyte biology. 1996; 60(5):555–62. PMID: 8929545
47. Zhu P, Martinvalet D, Chowdhury D, Zhang D, Schlesinger A, Lieberman J. The cytotoxic T lymphocyteprotease granzyme A cleaves and inactivates poly(adenosine 50-diphosphate-ribose) polymerase-1.Blood. 2009; 114(6):1205–16. doi: 10.1182/blood-2008-12-195768 PMID: 19506301
48. Pao LI, Sumaria N, Kelly JM, Dommelen Sv, Cretney E, Wallace ME, et al. Functional analysis of gran-zymeM and its role in immunity to infection. The Journal of Immunology. 2005; 175(5):3235–43. PMID:16116214
Global Gene Expression Changes in Holstein-Friesian and Jersey Calves in Response to Gradual Weaning
PLOS ONE | DOI:10.1371/journal.pone.0159707 August 1, 2016 20 / 22
49. Bashirova AA, Martin MP, McVicar DW, Carrington M. The killer immunoglobulin-like receptor genecluster: tuning the genome for defense. Annual Review of Genomics and Human Genetics. 2006; 7(1):277–300.
50. Zhou T, Chen Y, Hao L, Zhang Y. DC-SIGN and immunoregulation. Cellular & Molecular Immunology.2006; 3(4):279–83.
51. Areschoug T, Gordon S. Scavenger receptors: role in innate immunity and microbial pathogenesis. Cel-lular Microbiology. 2009; 11(8):1160–9. doi: 10.1111/j.1462-5822.2009.01326.x PMID: 19388903
52. Neville LF, Mathiak G, Bagasra O. The immunobiology of interferon-gamma inducible protein 10 kD(IP-10): A novel, pleiotropic member of the C-X-C chemokine superfamily. Cytokine & Growth FactorReviews. 1997; 8(3):207–19.
53. Oppmann B, Lesley R, Blom B, Timans JC, Xu Y, Hunte B, et al. Novel p19 protein engages IL-12p40to form a cytokine, IL-23, with biological activities similar as well as distinct from IL-12. Immunity. 2000;13(5):715–25. PMID: 11114383
54. van deWetering D, de Paus RA, van Dissel JT, van de Vosse E. IL-23 modulates CD56+/CD3− NKCell and CD56+/CD3+ NK-like T Cell function differentially from IL-12. International Immunology. 2009;21(2):145–53. doi: 10.1093/intimm/dxn132 PMID: 19088061
55. Sims JE, Smith DE. The IL-1 family: regulators of immunity. Nature Reviews Immunology. 2010; 10(2):89–102. doi: 10.1038/nri2691 PMID: 20081871
56. Peters VA, Joesting JJ, Freund GG. IL-1 receptor 2 (IL-1R2) and its role in immune regulation. Brain,Behavior, and Immunity. 2013; 32:1–8. doi: 10.1016/j.bbi.2012.11.006 PMID: 23195532
57. da Silva LF, Jones C. Infection of cultured bovine cells with bovine herpesvirus 1 (BHV-1) or Sendaivirus induces different beta interferon subtypes. Virus research. 2011; 157(1):54–60. doi: 10.1016/j.virusres.2011.02.004 PMID: 21316405
58. Werling D, Koss M, Howard CJ, Taylor G, LanghansW, Hope JC. Role of bovine chemokines producedby dendritic cells in respiratory syncytial virus-induced T cell proliferation. Veterinary Immunology andImmunopathology. 2002; 87(3–4):225–33. PMID: 12072239
59. Russell GC, Benavides J, Grant DM, Todd H, Thomson J, Puri V, et al. Host gene expression changesin cattle infected with Alcelaphine herpesvirus 1. Virus Research. 2012; 169(1):246–54. doi: 10.1016/j.virusres.2012.08.011 PMID: 22925730
60. Pareek R, Wellnitz O, Van Dorp R, Burton J, Kerr D. Immunorelevant gene expression in LPS-chal-lenged bovine mammary epithelial cells. Journal of Applied Genetics. 2005; 46(2):171–7. PMID:15876684
61. Griesbeck-Zilch B, Meyer HHD, Kühn C, Schwerin M, Wellnitz O. Staphylococcus aureus and Escheri-chia coli Cause Deviating Expression Profiles of Cytokines and Lactoferrin Messenger RibonucleicAcid in Mammary Epithelial Cells. Journal of Dairy Science. 2008; 91(6):2215–24. doi: 10.3168/jds.2007-0752 PMID: 18487644
62. Buitenhuis B, Rontved C, Edwards S, Ingvartsen K, Sorensen P. In depth analysis of genes and path-ways of the mammary gland involved in the pathogenesis of bovine Escherichia coli-mastitis. BMCGenomics. 2011; 12(1):130.
63. Gilbert F, Cunha P, Jensen K, Glass E, Foucras G, Robert-Granie C, et al. Differential response ofbovine mammary epithelial cells to Staphylococcus aureus or Escherichia coli agonists of the innateimmune system. Veterinary Research. 2013; 44(1):40.
64. Widdison S, Watson M, Piercy J, Howard C, Coffey TJ. Granulocyte chemotactic properties of M. tuber-culosis versus M. bovis-infected bovine alveolar macrophages. Molecular Immunology. 2008; 45(3):740–9. PMID: 17698194
65. Taubert A, Zahner H, Hermosilla C. Dynamics of transcription of immunomodulatory genes in endothe-lial cells infected with different coccidian parasites. Veterinary Parasitology. 2006; 142(3–4):214–22.PMID: 16930845
66. Widdison S, Watson M, Coffey TJ. Correlation between lymph node pathology and chemokine expres-sion during bovine tuberculosis. Tuberculosis. 2009; 89(6):417–22. doi: 10.1016/j.tube.2009.09.003PMID: 19926028
67. Li RW, Sonstegard TS, Van Tassell CP, Gasbarre LC. Local inflammation as a possible mechanism ofresistance to gastrointestinal nematodes in Angus heifers. Veterinary Parasitology. 2007; 145(1–2):100–7. PMID: 17182188
68. Bhuju S, Aranday-Cortes E, Villarreal-Ramos B, Xing Z, Singh M, Vordermeier HM. Global gene tran-scriptome analysis in vaccinated cattle revealed a dominant role of IL-22 for protection against bovinetuberculosis. PLoS pathogens. 2012; 8(12).
69. Behrendt JH, Hermosilla C, Hardt M, Failing K, Zahner H, Taubert A. PMN-mediated immune reactionsagainst Eimeria bovis. Veterinary Parasitology. 2008; 151(2–4):97–109. PMID: 18155359
Global Gene Expression Changes in Holstein-Friesian and Jersey Calves in Response to Gradual Weaning
PLOS ONE | DOI:10.1371/journal.pone.0159707 August 1, 2016 21 / 22
70. Taubert A, Behrendt JH, Sühwold A, Zahner H, Hermosilla C. Monocyte- and macrophage-mediatedimmune reactions against Eimeria bovis. Veterinary Parasitology. 2009; 164(2–4):141–53. doi: 10.1016/j.vetpar.2009.06.003 PMID: 19559532
71. Tizioto PC, Kim J, Seabury CM, Schnabel RD, Gershwin LJ, Van Eenennaam AL, et al. Immunologicalresponse to single pathogen challenge with agents of the bovine respiratory disease complex: an RNA-sequence analysis of the bronchial lymph node transcriptome. PLoS ONE. 2015; 10(6):e0131459. doi:10.1371/journal.pone.0131459 PMID: 26121276
72. O’Garra A, Arai N. The molecular basis of T helper 1 and T helper 2 cell differentiation. Trends in CellBiology. 2000; 10(12):542–50. PMID: 11121747
73. Çetinkaya B, Erdogan HM, Morgan KL. Relationships between the presence of Johne's disease andfarm and management factors in dairy cattle in England. Preventive Veterinary Medicine. 1997; 32(3–4):253–66. PMID: 9443332
74. Jakobsen MB, Alban L, Nielsen SS. A cross-sectional study of paratuberculosis in 1155 Danish dairycows. Preventive Veterinary Medicine. 2000; 46(1):15–27. PMID: 10854933
75. Wray C, SojkaWJ. Experimental Salmonella typhimurium infection in calves. Research in VeterinaryScience. 1978; 25(2):139–43. PMID: 364573
76. Villarroel A, Miller TB, Johnson ED, Noyes KR, Ward JK. Factors affecting serum total protein andimmunoglobulin G concentration in replacement dairy calves. Advances in Dairy Research. 2013; 1(2):106.
77. Lee EY, Lee ZH, Song YW. The interaction between CXCL10 and cytokines in chronic inflammatoryarthritis. Autoimmunity Reviews. 2013; 12(5):554–7. doi: 10.1016/j.autrev.2012.10.001 PMID:23092582
78. Bannerman DD, Springer HR, Paape MJ, Kauf ACW, Goff JP. Evaluation of breed-dependent differ-ences in the innate immune responses of Holstein and Jersey cows to Staphylococcus aureus intra-mammary infection. Journal of Dairy Research. 2008; 75(3):291–301. doi: 10.1017/S0022029908003427 PMID: 18680613
Global Gene Expression Changes in Holstein-Friesian and Jersey Calves in Response to Gradual Weaning
PLOS ONE | DOI:10.1371/journal.pone.0159707 August 1, 2016 22 / 22