Embed Size (px)
Citation preview
C E N T E R O N L A B O R , H U M A N S E R V I C E S , A N D P O P U L A T I O N
R E S E A R CH R E PO R T
Wildfires in the United States A Primer
Vera Brusentsev Wayne Vroman SWARTHMORE COLLEGE URBAN INSTITUTE
January 2016
A BO U T THE U RBA N IN S T ITU TE
The nonprofit Urban Institute is dedicated to elevating the debate on social and economic policy. For nearly five
decades, Urban scholars have conducted research and offered evidence-based solutions that improve lives and
strengthen communities across a rapidly urbanizing world. Their objective research helps expand opportunities for
all, reduce hardship among the most vulnerable, and strengthen the effectiveness of the public sector.
Copyright © January 2016. Urban Institute. Permission is granted for reproduction of this file, with attribution to the
Urban Institute. Cover image by Tim Meko.
Contents Acknowledgments iv
Wildfires in the United States 1
Statistics on Wildfires 1
The Direct Costs of Wildfires 6
The Frequency of Large Wildfires 7
Wildfire Management in the Federal Budget 11
Conclusion 12
Notes 14
References 15
About the Authors 16
Statement of Independence 17
Acknowledgments This report was funded by the Urban Institute and the W. E. Upjohn Institute. We are grateful to our
funders, who make it possible for Urban to advance its mission.
The views expressed are those of the authors and should not be attributed to the Urban Institute,
its trustees, or its funders. Funders do not determine our research findings or the insights and
recommendations of our experts. Further information on the Urban Institute’s funding principles is
available at www.urban.org/support.
The views expressed also should not be attributed to Swarthmore College or the W.E. Upjohn
Institute, their trustees, or their funders. The authors thank Rob Santos for helpful comments on an
earlier draft of this paper.
Wildfires in the United States On August 20, 2015, 93 uncontained large wildfires were burning in the United States including 33 in
the Pacific Northwest, 29 in Northern California, and 18 in the northern Rockies, according to a
National Interagency Fire Center (NIFC) situation report.1 A wildfire is defined by the NIFC as the
unplanned ignition of a wildland fire (such as fire caused by lightning, volcanoes, unauthorized and
accidental human-caused fires) and escaped prescribed fires.2 As of September 25, 2015, wildfires had
burned 9.0 million acres nationwide, far above the annual average of 6.2 million acres. The forecast for
the Northwest into the fall is for above-normal temperatures, below-normal precipitation, and
continuing drought in many areas. This weather, accompanied by the long-term drought in Southern
California and continued periodic acreage growth from established fires in Alaska, is expected to lead to
above-normal fire potential throughout the region.
Wildfires have always been an integral and natural part of wildland ecosystems. Two main factors,
however, are changing these ecosystems. First, climatic conditions are changing the scale of wildfires
and the length of the fire season. Second, human development is intensifying in wildfire-prone areas. As
more people build homes in and near wildfire-prone areas, individuals and families are exposed to
greater risks from wildfires. As a result, fire suppression and recovery costs increase.
Information on the incidence and frequency of wildfires can help stakeholders assess the risk from
wildfires and further a discussion of the mitigation and firewise practices landowners can use. It can also
help shape the organization of fire suppression in the federal government as well as state and federal
funding for wildland fire management.
Statistics on Wildfires
According to statistics published by the NIFC starting in 1960, more than 60,000 wildfires occur in the
United States each year. More than 3.0 million acres have burned every year since 1999, and the
acreage burned each year is increasing. Wildland acreage nationwide has been relatively constant since
1910: it decreases whenever population growth expands urban development and increases whenever
former farmland reverts to wildland.3 While the annual number of wildfires has not been increasing in
recent years, the acres burned per fire have been trending strongly upward since about 1990.
2 W I L D F I R E S I N T H E U N I T E D S T A T E S
Annual NIFC data show that the United States experienced 5.6 million wildfires between 1960 and
2013.4 Over these 54 years, the burned area totaled 235.8 million acres, or 362,849 square miles. The
cumulative acreage burned between 1960 and 2013 is 9.6 percent of the total land area of the nation
(3.8 million square miles).
Each year fires are deliberately set by the various agencies responsible for forest and wildfire
management. Federal and state agencies work together through the National Cohesive Wildland Fire
Management Strategy. The main federal agencies are the US Department of Agriculture (USDA),
specifically the Forest Service, and the US Department of the Interior (DOI).5 On nonfederal lands,
states also manage forests and fight wildfires together with county and local jurisdictions.6 While state
foresters are responsible for managing wildfires, they pay for only a modest share of firefighting costs.
The primary cause of nonprescribed wildfires is human activity: leaving campfires unattended,
burning debris, negligently discarding cigarettes, and setting fires intentionally (also called arson).7 The
primary natural cause of wildfires is lightning: it is responsible for 14 percent of the 823,032 wildfires
between 2002 and 2012. Lightning-caused fires, however, are much larger on average; they are
responsible for 62 percent of total acres burned during the same 11 years.8 Prescribed fires (also called
controlled burns) that escape their boundaries constitute 18 percent of all US wildfires and 25 percent
of US acres burned from 2002 to 2012.9
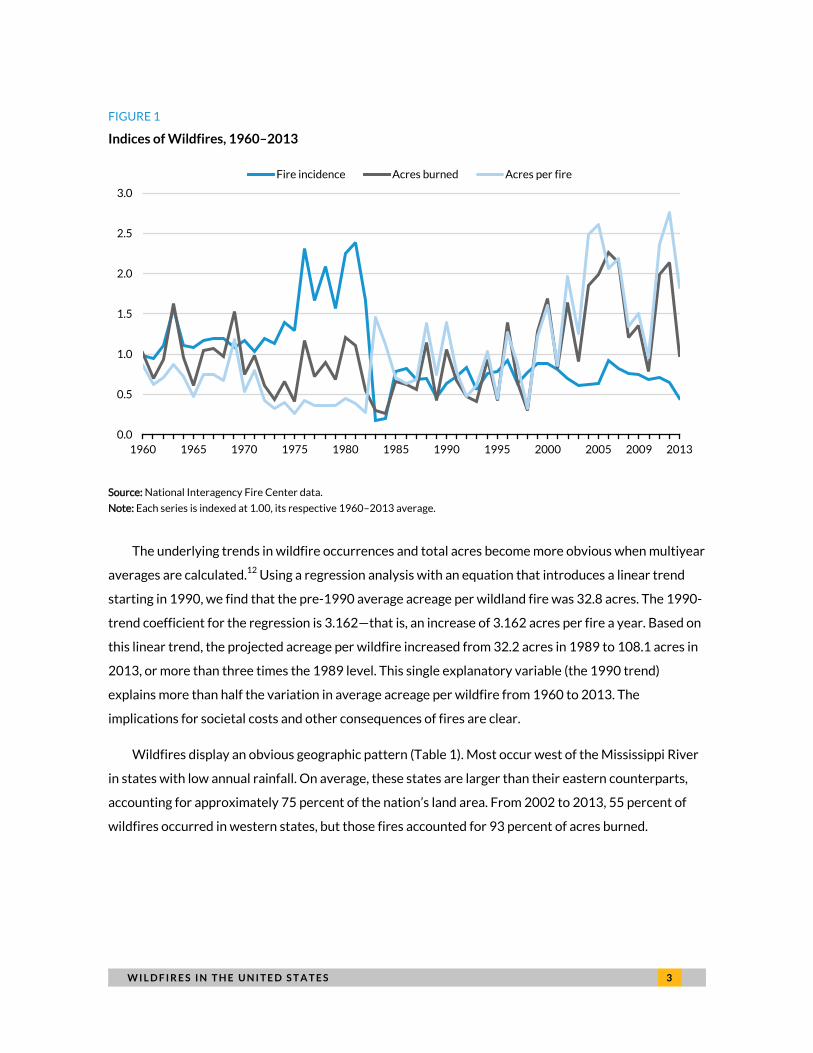
Figure 1 displays data from 1960 to 2013 for three indices: the incidence of wildfires, total acres
burned, and the average acreage per fire.10 Each series shows the ratio of annual data to its respective
1960–2013 average.
Three important trends are evident over these 54 years.
First, the incidence of wildfires has not increased over time. In fact, it is lower from the mid-1980s
through 2013 than from the 1960s through the mid-1980s. The index of fire incidence has been below
1.00 since 1983, while all but two pre-1983 indices exceed 1.00. Wildfire occurrences were especially
numerous between 1976 and 1982.
Second, both total acres burned and average acres per fire have increased since the early to mid-
1990s. Recently the indices for both measures have often exceeded 2.00—that is, twice the 54-year
average.
Third, the annual data for all three series vary sharply year to year. The coefficient of variation for
each series is approximately 0.50 or larger, indicating a high degree of variability from one year to the
next.11
W I L D F I R E S I N T H E U N I T E D S T A T E S 3
FIGURE 1
Indices of Wildfires, 1960–2013
Source: National Interagency Fire Center data.
Note: Each series is indexed at 1.00, its respective 1960–2013 average.
The underlying trends in wildfire occurrences and total acres become more obvious when multiyear
averages are calculated.12 Using a regression analysis with an equation that introduces a linear trend
starting in 1990, we find that the pre-1990 average acreage per wildland fire was 32.8 acres. The 1990-
trend coefficient for the regression is 3.162—that is, an increase of 3.162 acres per fire a year. Based on
this linear trend, the projected acreage per wildfire increased from 32.2 acres in 1989 to 108.1 acres in
2013, or more than three times the 1989 level. This single explanatory variable (the 1990 trend)
explains more than half the variation in average acreage per wildfire from 1960 to 2013. The
implications for societal costs and other consequences of fires are clear.
Wildfires display an obvious geographic pattern (Table 1). Most occur west of the Mississippi River
in states with low annual rainfall. On average, these states are larger than their eastern counterparts,
accounting for approximately 75 percent of the nation’s land area. From 2002 to 2013, 55 percent of
wildfires occurred in western states, but those fires accounted for 93 percent of acres burned.
0.0
0.5
1.0
1.5
2.0
2.5
3.0
1960 1965 1970 1975 1980 1985 1990 1995 2000 2005 2009 2013
Fire incidence Acres burned Acres per fire
4 W I L D F I R E S I N T H E U N I T E D S T A T E S
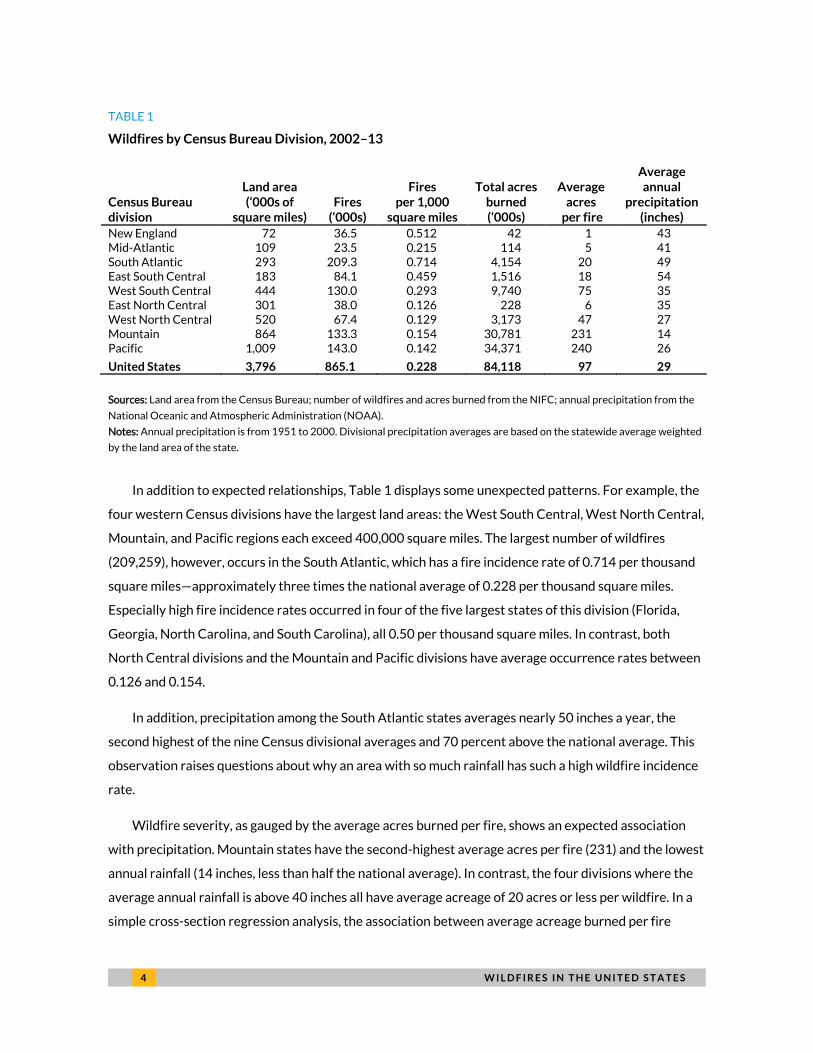
TABLE 1
Wildfires by Census Bureau Division, 2002–13
Census Bureau division
Land area (‘000s of
square miles) Fires
(‘000s)
Fires per 1,000
square miles
Total acres burned (‘000s)
Average acres
per fire
Average annual
precipitation (inches)
New England 72 36.5 0.512 42 1 43 Mid-Atlantic 109 23.5 0.215 114 5 41 South Atlantic 293 209.3 0.714 4,154 20 49 East South Central 183 84.1 0.459 1,516 18 54 West South Central 444 130.0 0.293 9,740 75 35 East North Central 301 38.0 0.126 228 6 35 West North Central 520 67.4 0.129 3,173 47 27 Mountain 864 133.3 0.154 30,781 231 14 Pacific 1,009 143.0 0.142 34,371 240 26
United States 3,796 865.1 0.228 84,118 97 29
Sources: Land area from the Census Bureau; number of wildfires and acres burned from the NIFC; annual precipitation from the
National Oceanic and Atmospheric Administration (NOAA).
Notes: Annual precipitation is from 1951 to 2000. Divisional precipitation averages are based on the statewide average weighted
by the land area of the state.
In addition to expected relationships, Table 1 displays some unexpected patterns. For example, the
four western Census divisions have the largest land areas: the West South Central, West North Central,
Mountain, and Pacific regions each exceed 400,000 square miles. The largest number of wildfires
(209,259), however, occurs in the South Atlantic, which has a fire incidence rate of 0.714 per thousand
square miles—approximately three times the national average of 0.228 per thousand square miles.
Especially high fire incidence rates occurred in four of the five largest states of this division (Florida,
Georgia, North Carolina, and South Carolina), all 0.50 per thousand square miles. In contrast, both
North Central divisions and the Mountain and Pacific divisions have average occurrence rates between
0.126 and 0.154.
In addition, precipitation among the South Atlantic states averages nearly 50 inches a year, the
second highest of the nine Census divisional averages and 70 percent above the national average. This
observation raises questions about why an area with so much rainfall has such a high wildfire incidence
rate.
Wildfire severity, as gauged by the average acres burned per fire, shows an expected association
with precipitation. Mountain states have the second-highest average acres per fire (231) and the lowest
annual rainfall (14 inches, less than half the national average). In contrast, the four divisions where the
average annual rainfall is above 40 inches all have average acreage of 20 acres or less per wildfire. In a
simple cross-section regression analysis, the association between average acreage burned per fire
W I L D F I R E S I N T H E U N I T E D S T A T E S 5
(during 2002–13 for the 48 contiguous states) and annual precipitation is negative and statistically
significant.13 At the state level, however, the results are more varied; only about half the interstate
variation is associated with differences in annual rainfall.
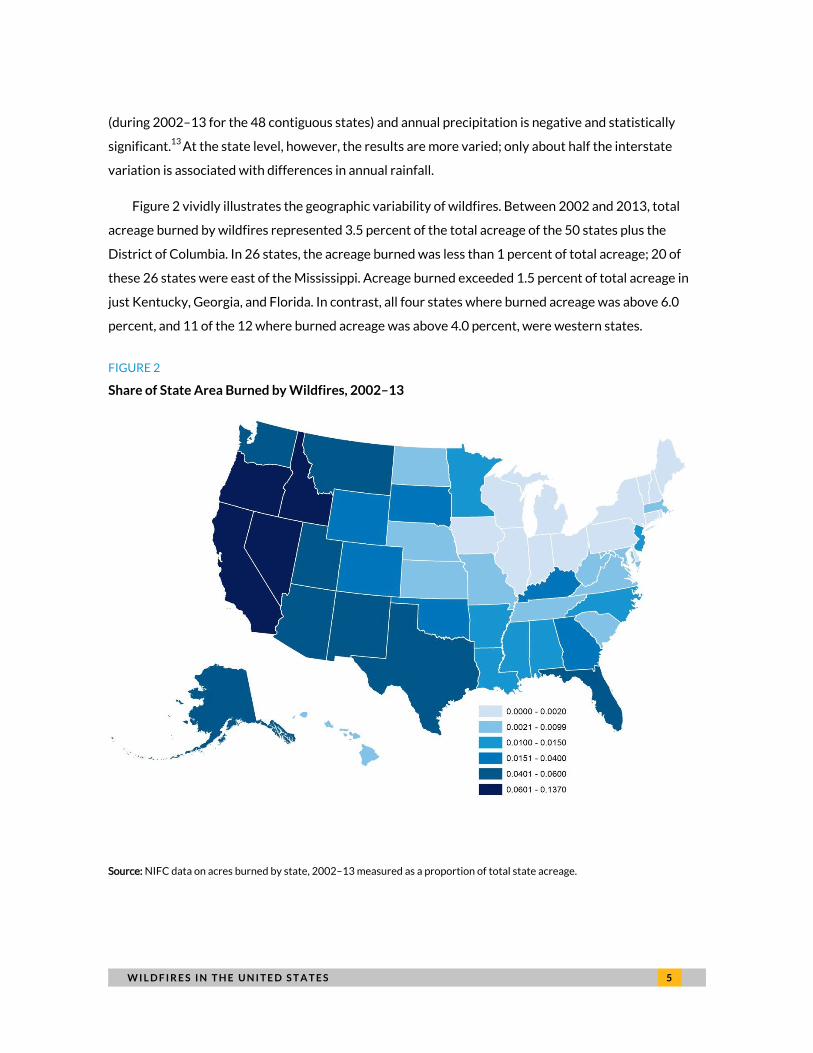
Figure 2 vividly illustrates the geographic variability of wildfires. Between 2002 and 2013, total
acreage burned by wildfires represented 3.5 percent of the total acreage of the 50 states plus the
District of Columbia. In 26 states, the acreage burned was less than 1 percent of total acreage; 20 of
these 26 states were east of the Mississippi. Acreage burned exceeded 1.5 percent of total acreage in
just Kentucky, Georgia, and Florida. In contrast, all four states where burned acreage was above 6.0
percent, and 11 of the 12 where burned acreage was above 4.0 percent, were western states.
FIGURE 2
Share of State Area Burned by Wildfires, 2002–13
Source: NIFC data on acres burned by state, 2002–13 measured as a proportion of total state acreage.

6 W I L D F I R E S I N T H E U N I T E D S T A T E S
The Direct Costs of Wildfires
The many wildfires and the acreage they burn entail substantial costs. Fire management expenditures
include the costs associated with preparedness ahead of the fire season, suppression or firefighting
during the fire season, measures to reduce vegetation fuel (either through removal or prescribed
burns), and post-fire rehabilitation (Bracmort 2013).
The NIFC has published estimates of annual fire suppression costs incurred by federal agencies
since 1985. Federal fire suppression costs averaged $371 million a year during 1985–89 but $1,548
million a year during 2009–13. Of the total federal costs in 2013, the Forest Service was responsible for
almost 77 percent; the DOI was responsible for the remaining 23 percent.
Most of the fourfold cost increase was the result of increased acreage burned and inflation. The real
cost per acre in prices of 2009 purchasing power increased 17 percent, from $222 in 1985–89 to $260
in 2009–13. Though federal firefighting costs have increased, the increase in real terms is mainly the
result of an increase in acreage burned since the late 1980s.
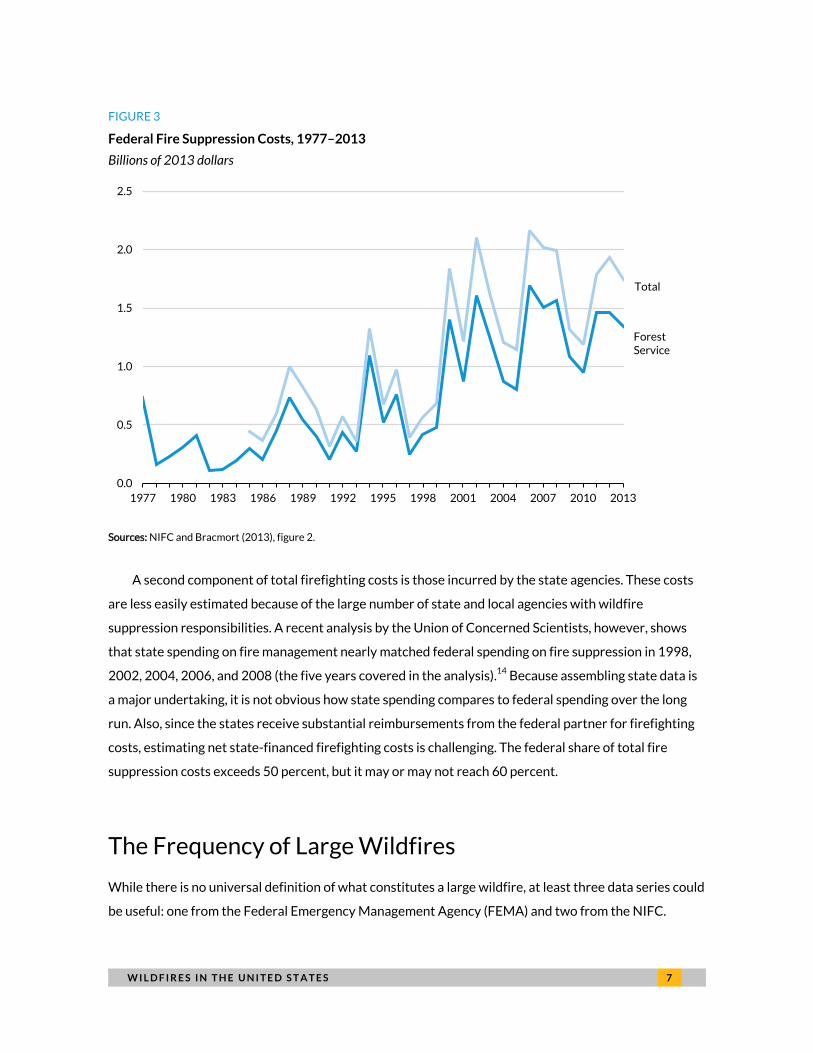
Figure 3 summarizes the annual costs of fire suppression for the two lead federal agencies in real
terms. Fire suppression costs for the Forest Service are displayed from 1977 while the combined costs
for DOI and the Forest Service are shown from 1985. Two patterns are obvious: the large increase since
2000 and the wide year-to-year variability. Note also that total federal costs exceeded $1.5 billion in 9
of the 14 years since 2000 but not once in the years before 2000.
W I L D F I R E S I N T H E U N I T E D S T A T E S 7
FIGURE 3
Federal Fire Suppression Costs, 1977–2013
Billions of 2013 dollars
Sources: NIFC and Bracmort (2013), figure 2.
A second component of total firefighting costs is those incurred by the state agencies. These costs
are less easily estimated because of the large number of state and local agencies with wildfire
suppression responsibilities. A recent analysis by the Union of Concerned Scientists, however, shows
that state spending on fire management nearly matched federal spending on fire suppression in 1998,
2002, 2004, 2006, and 2008 (the five years covered in the analysis).14 Because assembling state data is
a major undertaking, it is not obvious how state spending compares to federal spending over the long
run. Also, since the states receive substantial reimbursements from the federal partner for firefighting
costs, estimating net state-financed firefighting costs is challenging. The federal share of total fire
suppression costs exceeds 50 percent, but it may or may not reach 60 percent.
The Frequency of Large Wildfires
While there is no universal definition of what constitutes a large wildfire, at least three data series could
be useful: one from the Federal Emergency Management Agency (FEMA) and two from the NIFC.
0.0
0.5
1.0
1.5
2.0
2.5
1977 1980 1983 1986 1989 1992 1995 1998 2001 2004 2007 2010 2013
Total
Forest Service
8 W I L D F I R E S I N T H E U N I T E D S T A T E S
FEMA makes fire management assistance declarations after a state submits a request because a
single fire (or a group of fires) is large enough to pose a “threat of major disaster.” FEMA responds to
these requests expeditiously; a decision is often rendered within hours of the appeal. The fire
management assistance grant program provides a federal cost-share of 75 percent of the allowable
costs of firefighting. Allowable costs include the costs of field camps; equipment use, repair, and
replacement; tools, materials, and supplies; and mobilization and demobilization activities.
The FEMA data on fire management assistance declarations commence in 1970. In the 44 years
between 1970 and 2013, FEMA made 1,049 fire management declarations. The declarations fall into
two broad periods. Between 1970 and 1993, FEMA consistently made fewer than 10 declarations a
year. Starting in 1994, the agency averaged 48 declarations a year. These declarations refer to major
fire events that involve large costs of suppression and other factors, such as the value of lost timber and
crops. FEMA does not however, estimate the total costs of its fire-related declarations.
On occasions a wildfire grows and becomes large enough to be classified by FEMA as a major
disaster. Between 1970 and 2013, FEMA declared 35 wildfires major disasters. In addition, FEMA
classified 15 wildfires as emergency declarations. Emergency declarations are smaller than major
disasters but of sufficient scale that states are reimbursed for certain fire suppression costs. These
declarations can be considered large fires. Note that the 1,099 FEMA declarations between 1970 and
2013 represent 0.025 percent of the 4,443,165 wildfires reported by NIFC over the same period.
Two measures of large wildfires are available from NIFC data. Between 1950 and 2013, there were
52 “historically significant wildland fires.” Only four of these fires occurred before 1970. Among
historically significant fires, 9 were classified as major disasters and 15 were classified as fire
management assistance declarations by FEMA. The NIFC also identified 154 wildfires since 1997 that
have burned 100,000 or more acres. Of that group, 58 had burned more than 200,000 acres.
The three groupings of large fires show similar patterns in both their timing and their geographic
locus (table 2). The table reinforces points made earlier, but now with specific reference to large
wildfires as recorded by both FEMA and NIFC.
W I L D F I R E S I N T H E U N I T E D S T A T E S 9
TABLE 2
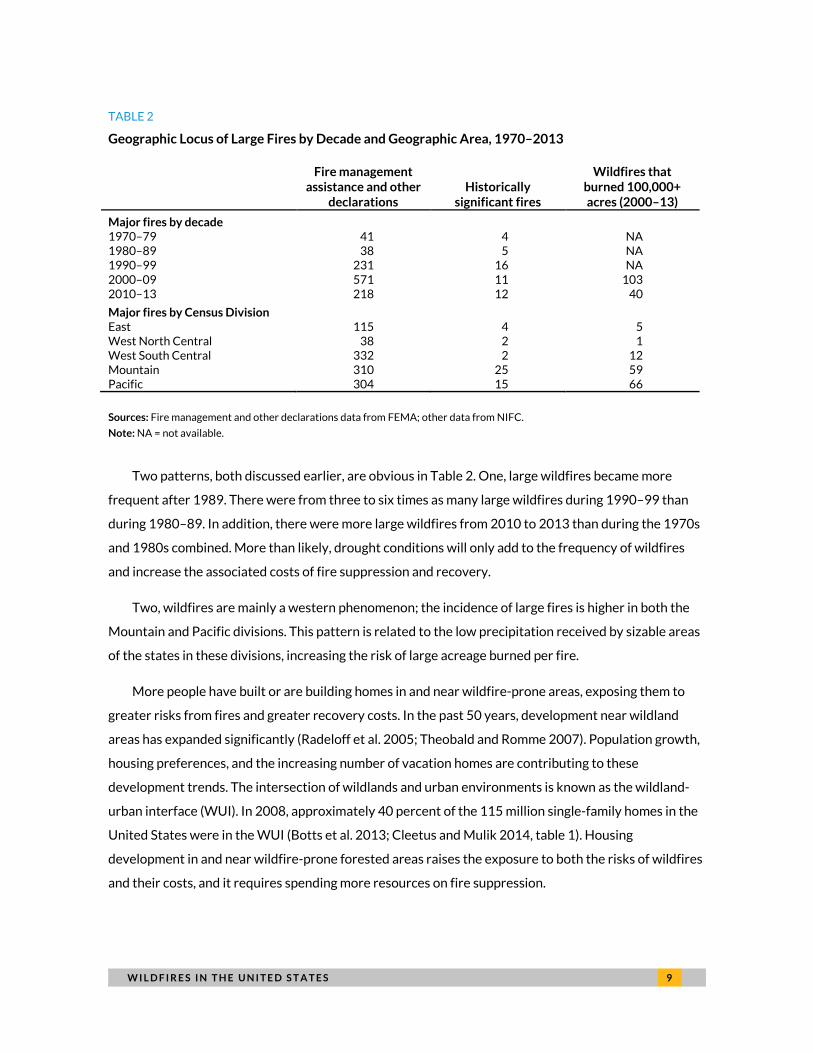
Geographic Locus of Large Fires by Decade and Geographic Area, 1970–2013
Fire management assistance and other
declarations Historically
significant fires
Wildfires that burned 100,000+ acres (2000–13)
Major fires by decade 1970–79 41 4 NA 1980–89 38 5 NA 1990–99 231 16 NA 2000–09 571 11 103 2010–13 218 12 40
Major fires by Census Division East 115 4 5 West North Central 38 2 1 West South Central 332 2 12 Mountain 310 25 59 Pacific 304 15 66
Sources: Fire management and other declarations data from FEMA; other data from NIFC.
Note: NA = not available.
Two patterns, both discussed earlier, are obvious in Table 2. One, large wildfires became more
frequent after 1989. There were from three to six times as many large wildfires during 1990–99 than
during 1980–89. In addition, there were more large wildfires from 2010 to 2013 than during the 1970s
and 1980s combined. More than likely, drought conditions will only add to the frequency of wildfires
and increase the associated costs of fire suppression and recovery.
Two, wildfires are mainly a western phenomenon; the incidence of large fires is higher in both the
Mountain and Pacific divisions. This pattern is related to the low precipitation received by sizable areas
of the states in these divisions, increasing the risk of large acreage burned per fire.
More people have built or are building homes in and near wildfire-prone areas, exposing them to
greater risks from fires and greater recovery costs. In the past 50 years, development near wildland
areas has expanded significantly (Radeloff et al. 2005; Theobald and Romme 2007). Population growth,
housing preferences, and the increasing number of vacation homes are contributing to these
development trends. The intersection of wildlands and urban environments is known as the wildland-
urban interface (WUI). In 2008, approximately 40 percent of the 115 million single-family homes in the
United States were in the WUI (Botts et al. 2013; Cleetus and Mulik 2014, table 1). Housing
development in and near wildfire-prone forested areas raises the exposure to both the risks of wildfires
and their costs, and it requires spending more resources on fire suppression.
1 0 W I L D F I R E S I N T H E U N I T E D S T A T E S
Nearly 90 percent of the developed areas located in or near forests are privately owned; nearly
two-thirds of that private land is at high risk of wildfires (Theobald and Romme 2007). Development in
and near the WUI increases the costs for federal agencies that help provide financial and technical
assistance to state and local agencies for wildfire protection.
The costs associated with wildfires are substantial. Two main factors affect those costs: the size of a
wildfire and how much private property is damaged. Direct fire suppression costs, however,
significantly underestimate the total costs of a wildfire. Other costs, such as pre-suppression costs,
disaster relief expenditures, timber losses, tourism-related losses, human health effects, and damage to
ecosystems can greatly exceed the direct costs of fire suppression. In some cases, these other
categories of costs may not be fully evident until years after the suppression of a fire (Butry et al. 2001).
Wildfire protection efforts are weighted toward fire suppression, which takes up a major share of
agency budgets. While the protection of natural resources and property is important, the overarching
priority in wildfire management is human safety. According to the Office of the Inspector General, an
audit of Forest Service expenditures found that the majority of the costs of putting out large fires are
“directly linked to protecting private property in the WUI” (2006, ii). Moreover, one response to the
worsening wildfire situation has been a shift of financial resources from investment in long-term forest
management and forest health that would lower the risk of future wildfires to fire suppression. With the
cost of fire suppression often exceeding actual budget allocations in recent severe wildfire seasons, the
Forest Service has borrowed from nonsuppression or even non–fire management budget lines (Tidwell
2013). In addition, budget constraints have delayed the acquisition of lands for conservation and
reduced the expenditure on other maintenance programs. The reallocation of resources to fire
suppression activities from other intended uses is commonly termed “fire borrowing.”
Another response to the worsening wildfire situation has been an increased reliance on
supplemental emergency appropriations from Congress. In 2012 and 2013, the Obama administration
removed more than $1 billion from other program accounts and transferred the funds to fire
suppression (Cleetus and Mulik 2014). Recent legislative proposals, as well as the Obama
administration’s 2014 budget, would change how federal wildfire costs are funded and create a
separate emergency fund for fire suppression. Senators Ron Wyden and Mike Crapo proposed
legislation in 2013 to increase funding for fire suppression (S. 1875, or the Wildfire Disaster Funding
Act of 2013) and Senators John McCain, John Barrasso, and Jeff Flake proposed similar legislation in
2014 (S. 2593, or the FLAME Act Amendments of 2014). In an environment of tight budgets, however,
rising wildfire costs will continue to pose a major fiscal challenge.
W I L D F I R E S I N T H E U N I T E D S T A T E S 1 1
Wildfire Management in the Federal Budget
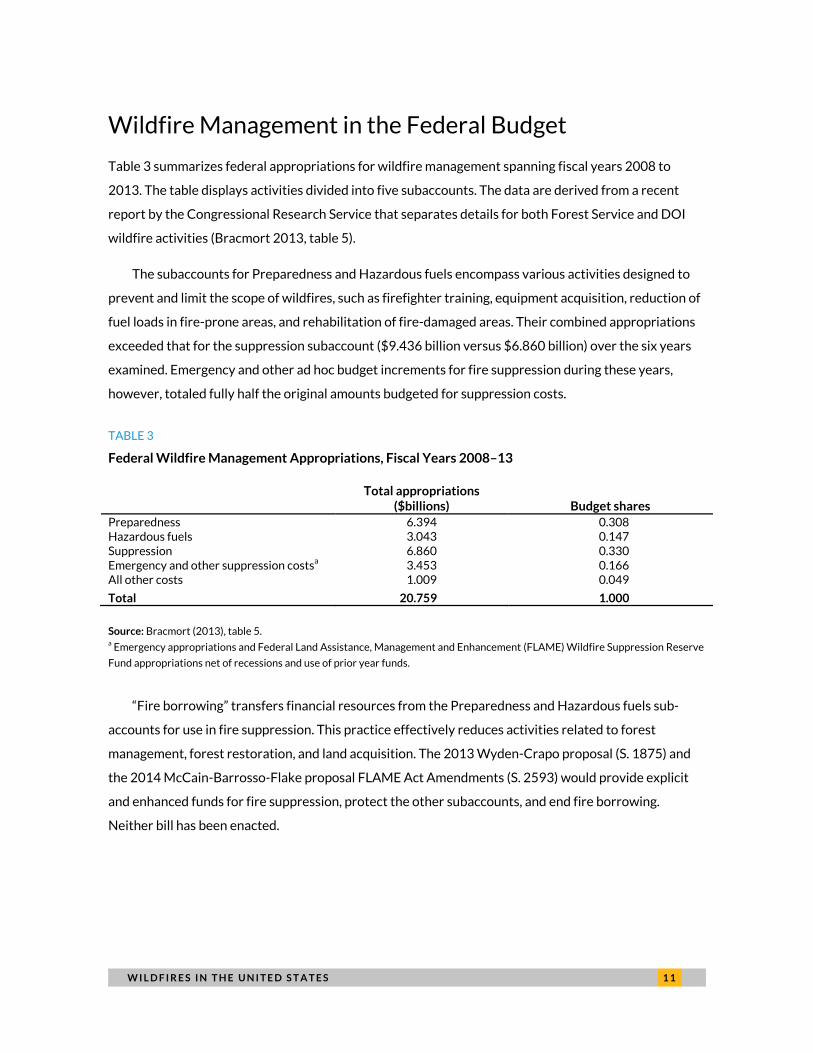
Table 3 summarizes federal appropriations for wildfire management spanning fiscal years 2008 to
2013. The table displays activities divided into five subaccounts. The data are derived from a recent
report by the Congressional Research Service that separates details for both Forest Service and DOI
wildfire activities (Bracmort 2013, table 5).
The subaccounts for Preparedness and Hazardous fuels encompass various activities designed to
prevent and limit the scope of wildfires, such as firefighter training, equipment acquisition, reduction of
fuel loads in fire-prone areas, and rehabilitation of fire-damaged areas. Their combined appropriations
exceeded that for the suppression subaccount ($9.436 billion versus $6.860 billion) over the six years
examined. Emergency and other ad hoc budget increments for fire suppression during these years,
however, totaled fully half the original amounts budgeted for suppression costs.
TABLE 3
Federal Wildfire Management Appropriations, Fiscal Years 2008–13
Total appropriations
($billions) Budget shares
Preparedness 6.394 0.308 Hazardous fuels 3.043 0.147 Suppression 6.860 0.330 Emergency and other suppression costsa 3.453 0.166 All other costs 1.009 0.049
Total 20.759 1.000
Source: Bracmort (2013), table 5. a Emergency appropriations and Federal Land Assistance, Management and Enhancement (FLAME) Wildfire Suppression Reserve
Fund appropriations net of recessions and use of prior year funds.
“Fire borrowing” transfers financial resources from the Preparedness and Hazardous fuels sub-
accounts for use in fire suppression. This practice effectively reduces activities related to forest
management, forest restoration, and land acquisition. The 2013 Wyden-Crapo proposal (S. 1875) and
the 2014 McCain-Barrosso-Flake proposal FLAME Act Amendments (S. 2593) would provide explicit
and enhanced funds for fire suppression, protect the other subaccounts, and end fire borrowing.
Neither bill has been enacted.
1 2 W I L D F I R E S I N T H E U N I T E D S T A T E S
Conclusion
Private local development complicates decisions about how to manage our wildland in many ways.
Urban development not only eliminates some trees and forests, it also increases population density,
human activities, and urban infrastructure. State and local zoning policies continue to allow
development in the WUI. The fact that most firefighting costs are borne by the federal government,
while local authorities and developers decide where and how much to build in wildfire-prone areas,
creates a misalignment of incentives. Indeed, local zoning policies may encourage development in high-
risk areas, reduce the incentive for homeowners to fireproof their homes and properties, increase
firefighting costs, and exacerbate the physical risk to firefighters. As a result, federal taxpayer funds are
not being used to manage wildlands and build resilience to wildfires because they are heavily directed at
fire suppression.
Risk is defined as the probability of an adverse event (or hazard) occurring that causes physical
harm or monetary losses. In the context of wildfires, risk is increasing in part because of climate change.
The risk is compounded by a moral hazard problem: local decisionmakers (governments and
homeowners) may make choices that result in a greater exposure to risk because they do not pay the
full costs of those choices.
Mitigating the risks from wildfires requires a combination of active measures. A key element in
reducing threats to the WUI and restoring fire to its natural role in the environment is community
education and involvement. Active measures include actions that reduce the risk itself (such as limiting
the chances of wildfire damage through fuels management or fireproofing measures in homes and
communities), limit exposure to risk (such as limiting development in wildfire-prone areas or buying
insurance protection), or providing financial resources to help people recover from fires (such as
disaster assistance or insurance payouts; see Bracmort 2013, table 5).
Homeowners share responsibility for protecting themselves and their property. In many states,
however, this responsibility is voluntary and not enforced by statewide law or insurance company
practices. California is one of the few states in the nation with strict statewide building regulations and
fire codes that apply to communities in wildfire-prone areas.
Why encourage mitigation in building regulations? Adherence to model building codes can mean
the difference between life and death or whether homes remain standing or are completely destroyed
by fire. The evidence that mitigation can saves lives and reduce costs is more than anecdotal. Model
building codes can offer enhanced protection against the threats of natural disasters and terrorism to
W I L D F I R E S I N T H E U N I T E D S T A T E S 1 3
make communities more resilient, sustainable, and livable for generations to come (Vaughan and Turner
2013). Such codes lower the price of mitigation for building owners. Other states, particularly western
states, should follow California’s lead.
1 4 N O T E S
Notes 1. “Incident Situation Management Report,” National Interagency Fire Center,
http://www.nifc.gov/nicc/sitreprt.pdf.
2. A wildland is defined as land that is not cultivated or not suitable for cultivation. Wildlands include forests, shrublands, grasslands, and other types of natural ecosystems. A prescribed fire is a wildland fire originating from a planned ignition to meet the objectives specified in a preapproved, written prescribed fire plan.
3. Forest area has been relatively stable since 1910, although the population has more than tripled since then (Oswalt and Smith 2014).
4. “Total Wildland Fires and Acres” (1960–2014), NIFC, accessed September 18, 2015, http://www.nifc.gov/fireInfo/fireInfo_stats_totalFires.html.
5. To be specific, five federal agencies manage and have primary fire program responsibilities: the Bureau of Land Management, the National Park Service, the US Fish and Wildlife Service, and the Bureau of Indian Affairs in the Department of the Interior; and the Forest Service in the Department of Agriculture.
6. The US Fire Administration works with county and local fire departments; the National Association of State Foresters represents the states. The state, county, and local jurisdictions provide primary fire protection on nonfederal public and private lands across all 50 states.
7. See Theobald and Romme (2007).
8. The NIFC recently changed its nomenclature. What was previously termed human-caused fires is now nonlightning fires.
9. Statistical information from the NIFC on prescribed fires in the United States has only been published since 2002.
10. The National Interagency Coordination Center at NIFC compiles annual wildland fire statistics for federal and state agencies. As the statistics before 1983 were not derived from the current reporting process, information before 1983 should not be compared to subsequent data.
11. The coefficient of variation is the ratio of the standard deviation to the mean.
12. For example, acres per wildland fire averaged 39.8 during 1980–89 but 96.6 during 2002–13.
13. Alaska, the District of Columbia, and Hawaii are not included in the analysis because of the lack of long-term average precipitation data.
14. Expressed in 2013 dollars, state spending totaled $7.7 billion, while federal spending totaled $8.0 billion. See Cleetus and Mulik (2014), figure 7.
R E F E R E N C E S 1 5
References Botts, Howard, Thomas Jeffery, Steven Kolk, Sheila McCabe, Bryan Stueck, and Logan Suhr. 2013. CoreLogic
Wildfire Hazard Risk Report: Residential Wildfire Exposure Estimates for the Western United States. Irvine, CA: CoreLogic.
Bracmort, Kelsi. 2013. “Wildfire Management: Federal Funding and Related Statistics.” Report R43077. Washington, DC: Congressional Research Service.
Butry, David T., D. Evan Mercer, Jeffrey P. Prestemon, John M. Pye, and Thomas P. Holmes. 2001. “What Is the Price of Catastrophic Wildfire?” Journal of Forestry 99 (11): 9–17.
Cleetus, Rachel, and Kranti Mulik. 2014. Playing with Fire: How Climate Change and Development Patterns Are Contributing to the Soaring Costs of Western Wildfires. Cambridge, MA: Union of Concerned Scientists.
Office of the Inspector General. 2006. “Audit Report: Forest Service Large Fire Suppression Costs.” Report 08601-44-SF. Washington, DC: US Department of Agriculture, Office of the Inspector General. http://www.usda.gov/oig/webdocs/08601-44-SF.pdf.
Oswalt, Sonya N., and W. Brad Smith, eds. 2014. “U.S. Forest Resource Facts and Historical Trends.” Washington, DC: US Department of Agriculture, Forest Service. http://www.fia.fs.fed.us/library/brochures/docs/2012/ForestFacts_1952-2012_English.pdf.
Radeloff, V. C., R. B. Hammer, S. I. Stewart, J. S. Fried, S. S. Holcomb, and J. F. McKeefry. 2005. “The Wildland-Urban Interface in the United States.” Ecological Applications 15 (3): 799–805.
Theobald, David M., and William H. Romme. 2007. “Expansion of the US Wildland-Urban Interface.” Landscape and Urban Planning 83 (4): 340–54.
Tidwell, Tom. 2013. “Wildland Fire Management.” Statement before the US Senate Committee on Energy and Natural Resources, Washington, DC, June 4.
Vaughan, Ellen, and Jim Turner. 2013. “The Value and Impact of Building Codes.” White paper. Washington, DC: Environmental and Energy Study Institute. http://www.eesi.org/files/Value-and-Impact-of-Building-Codes.pdf.
1 6 A B O U T T H E A U T H O R S
About the Authors Vera Brusentsev is an economist in the department of economics at Swarthmore College. Her
experience is broad in terms of range and international scope, teaching in Australia, Canada, Nepal and
Latvia. She has conducted research on labor force participation and unemployment protection
programs. Before her time at Swarthmore College, she spent six years teaching at the University of
Delaware and two years at Lafayette College. She received her PhD in economics from Dalhousie
University in Nova Scotia, Canada.
Wayne Vroman is an economist with the Center on Labor, Human Services, and Population at the
Urban Institute. He has conducted wide-ranging research on unemployment compensation and other
social insurance programs. Committed to assisting the development of unemployment insurance
systems, Vroman has provided significant technical assistance on funding, benefits, and program
administration to states and foreign governments. He is a founding member of the National Academy of
Social Insurance. Before his time at the Urban Institute, Vroman held positions in the economics
departments at Oberlin College and the University of Maryland. Vroman received his PhD in economics
from the University of Michigan.
Brusentsev and Vroman’s related work on natural disasters includes “A Flood in a Small Community: A
Test of the National Planning Frameworks,” published by Urban in June 2015.
S T A T E M E N T O F I N D E P E N D E N C E
The Urban Institute strives to meet the highest standards of integrity and quality in its research and analyses and in
the evidence-based policy recommendations offered by its researchers and experts. We believe that operating
consistent with the values of independence, rigor, and transparency is essential to maintaining those standards. As
an organization, the Urban Institute does not take positions on issues, but it does empower and support its experts
in sharing their own evidence-based views and policy recommendations that have been shaped by scholarship.
Funders do not determine our research findings or the insights and recommendations of our experts. Urban
scholars and experts are expected to be objective and follow the evidence wherever it may lead.
2100 M Street NW
Washington, DC 20037
www.urban.org