Embed Size (px)
Citation preview
Research Methods: Thinking Critically with Psychological Science
The Need for Psychology Science

Do Now• Fact or Falsehood
• Before attempting the quiz, predict how many you will get correct.
• Complete Handouts 2-2 / 2-5
4
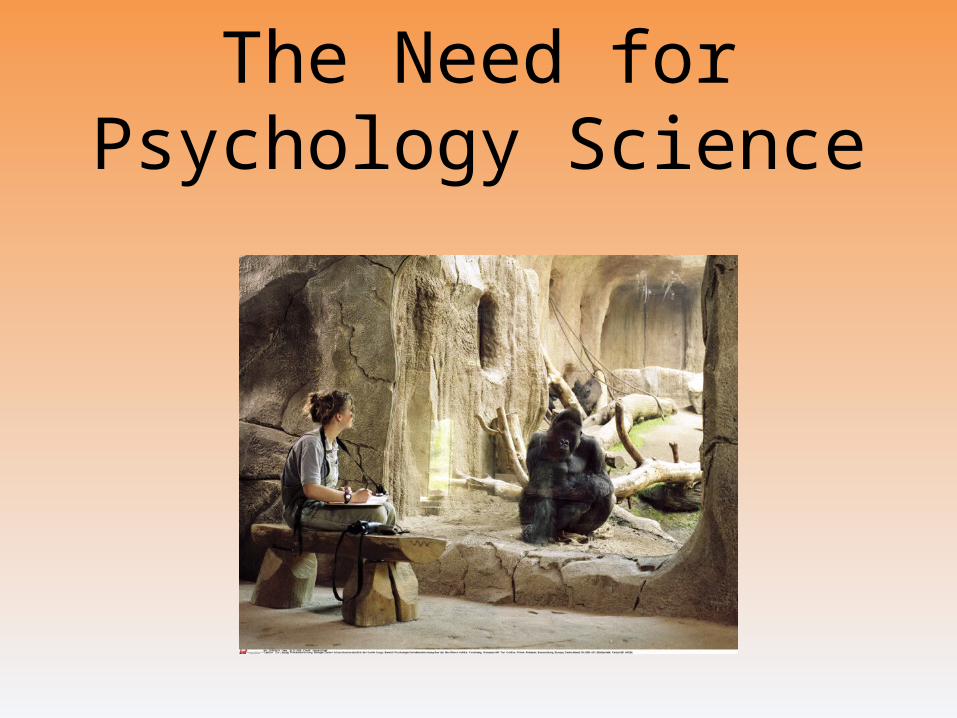
The Need for Psychological Science
Intuition & Common Sense
Many people believe that intuition and common sense are enough to bring forth answers
regarding human nature.
Intuition and common sense may aid queries, but they are not free of error.
A bullet is fired from a gun across an open field.
A bullet is dropped from a person’s hand.
Which hits the ground first?Which hits the ground first?
A bullet is fired from a gun across an open field.
A bullet is dropped from a person’s hand.
Which hits the ground first?Which hits the ground first?
5
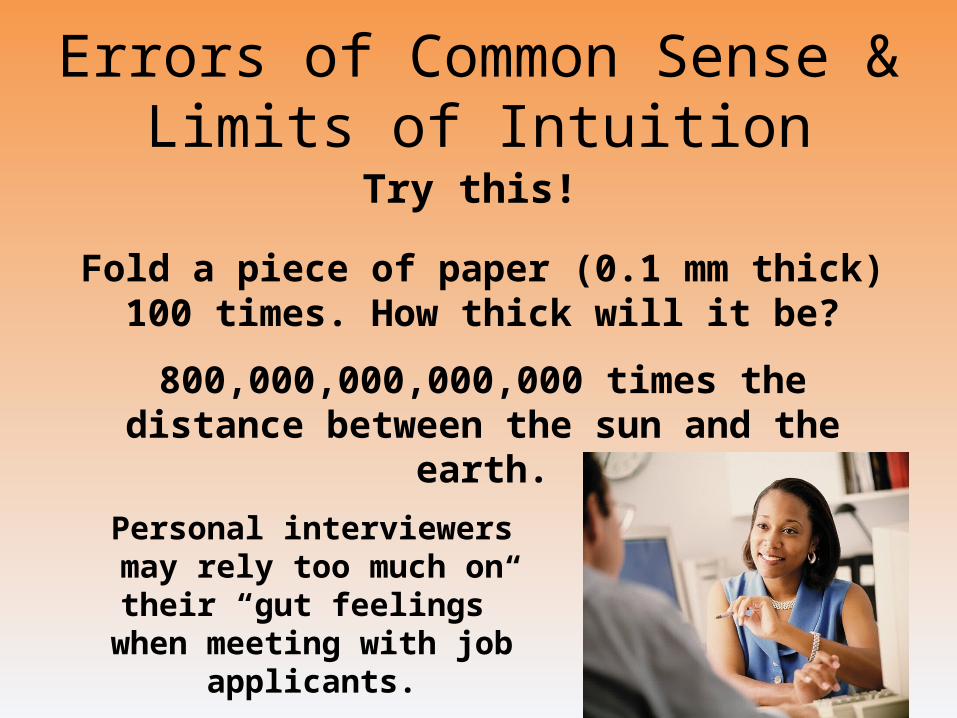
Errors of Common Sense & Limits of Intuition
Try this!
Fold a piece of paper (0.1 mm thick) 100 times. How thick will it be?
800,000,000,000,000 times the distance between the sun and the earth.
Personal interviewers may rely too much on their “gut
feelings” when meeting with job applicants.
Did We Know It All Along? Hindsight Bias
• Hindsight Bias– “I knew it all along”
– “Out of sight, out of mind”
– “Absence makes the heart grow fonder”• Examples:
– Jurors told to ignore information by the judge– Vick is obviously a better quarterback than Kolb– Handout 2-2

7
OverconfidenceSometimes we think we know more than we actually know.
Anagram
BARGEGRABE
ENTRYETYRN
WATERWREATHow long do you think it
would take to unscramble these anagrams?
People said it would take about 10 seconds, yet on average they took about 3
minutes (Goranson 1978).
Overconfidence, together with hindsight bias, can lead to overestimate
our intuition
-Do Now Quiz-Handout 2-3
Overconfidence, together with hindsight bias, can lead to overestimate
our intuition
-Do Now Quiz-Handout 2-3
8
Psychological Science
• How can we differentiate between uniformed opinions and examined conclusions?• The science of psychology helps make
these examined conclusions, which leads to our understanding of how people feel, think, and act as they do!
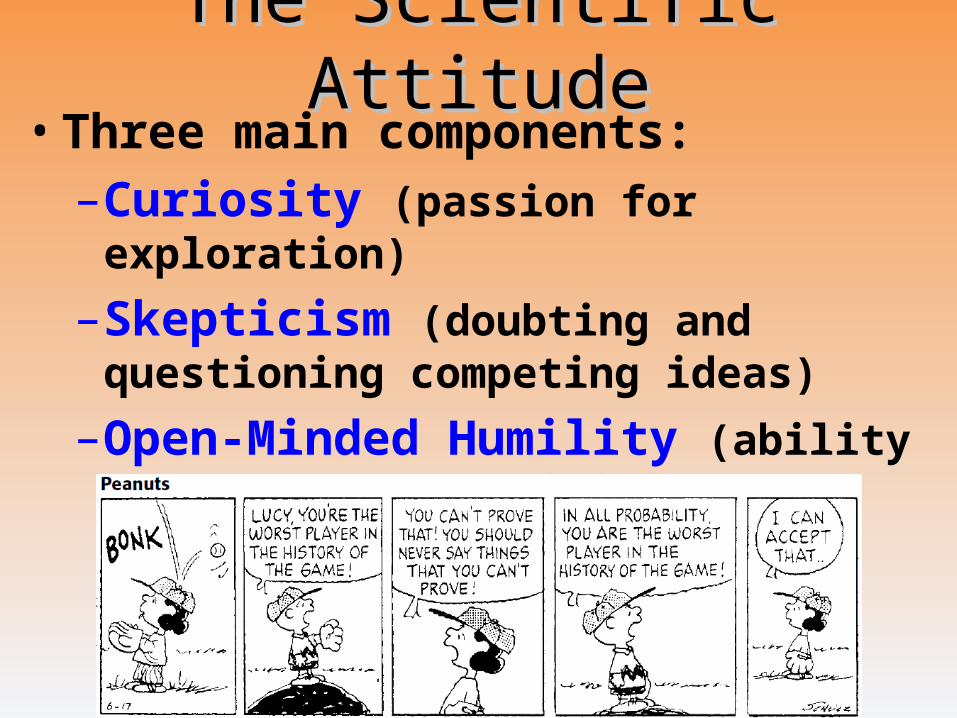
The Scientific AttitudeThe Scientific Attitude• Three main components:
–Curiosity (passion for exploration)
–Skepticism (doubting and questioning competing ideas)
–Open-Minded Humility (ability to accept responsibility when wrong).

Critical Thinking• Critical Thinking
–“Smart thinking” • does not accept arguments and
conclusions blindly.
–Asks:• What’s Your Evidence?
• Do Your Conclusions Match Your Evidence?
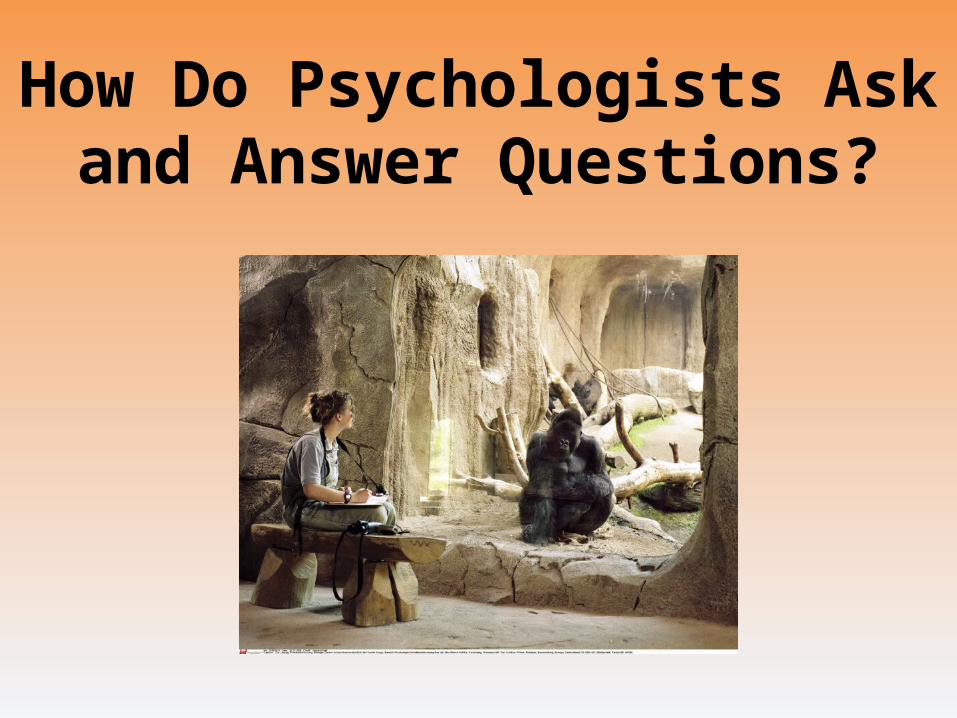
How Do Psychologists Ask and Answer Questions?

The Scientific Method

The Scientific Method
explanation that integrates principles and organizes and predicts
behavior or events.
explanation that integrates principles and organizes and predicts
behavior or events.

The Scientific Method
explanation that integrates principles and organizes and predicts
behavior or events.
explanation that integrates principles and organizes and predicts
behavior or events.
A testable prediction of a relationship among variables
A testable prediction of a relationship among variables
16
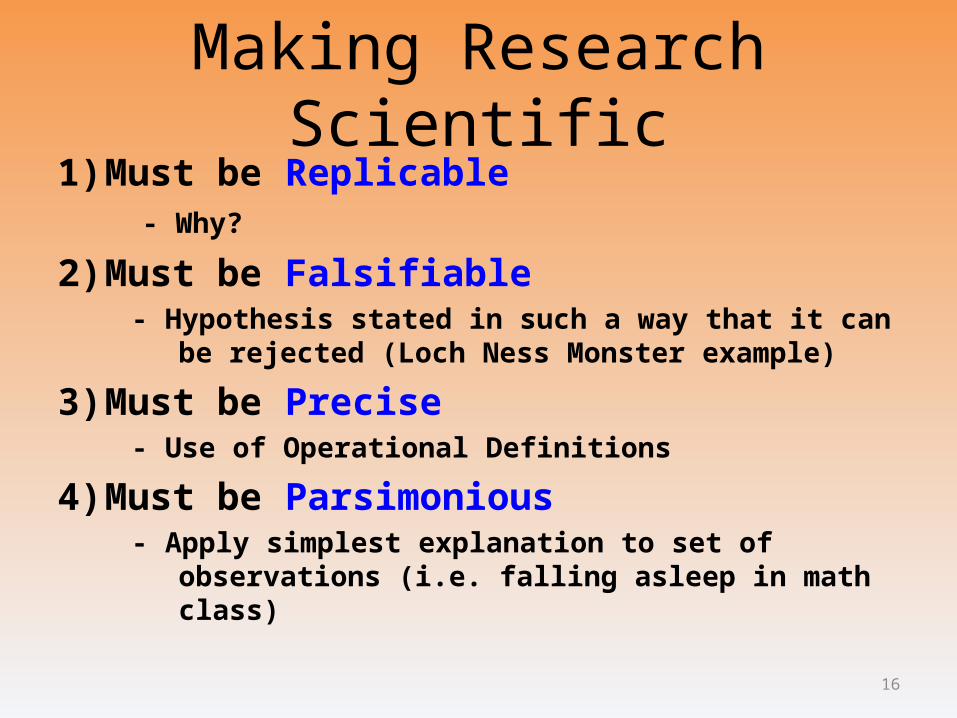
1) Must be Replicable- Why?
2) Must be Falsifiable - Hypothesis stated in such a way that it can be
rejected (Loch Ness Monster example)
3) Must be Precise- Use of Operational Definitions
4) Must be Parsimonious- Apply simplest explanation to set of
observations (i.e. falling asleep in math class)
Making Research Scientific
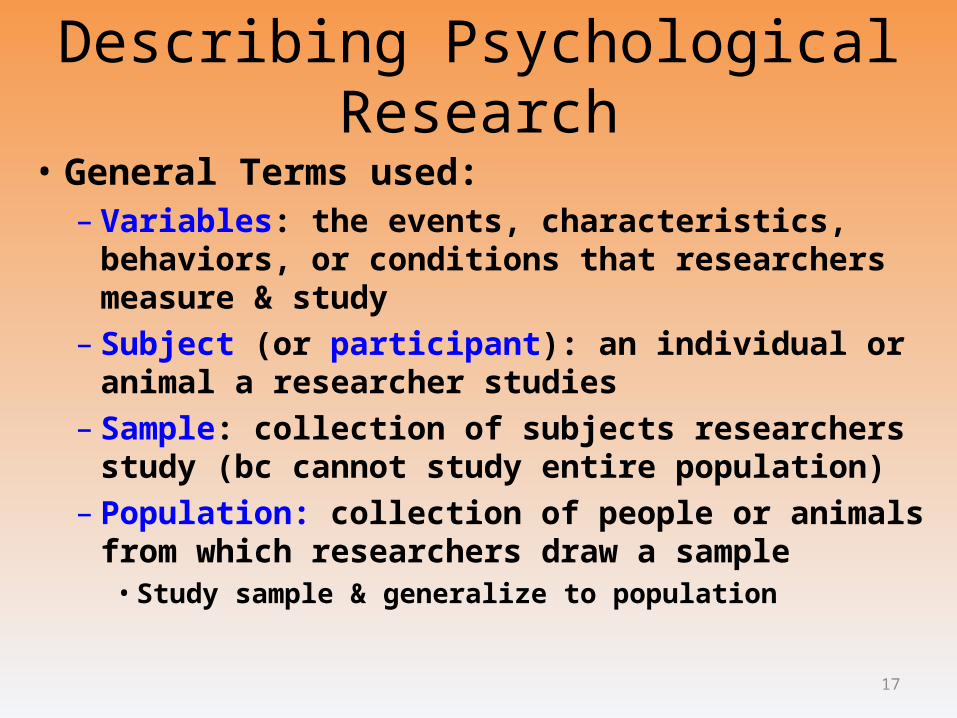
Describing Psychological Research
• General Terms used:– Variables: the events, characteristics, behaviors,
or conditions that researchers measure & study– Subject (or participant): an individual or animal a
researcher studies– Sample: collection of subjects researchers study
(bc cannot study entire population)– Population: collection of people or animals from
which researchers draw a sample• Study sample & generalize to population
17
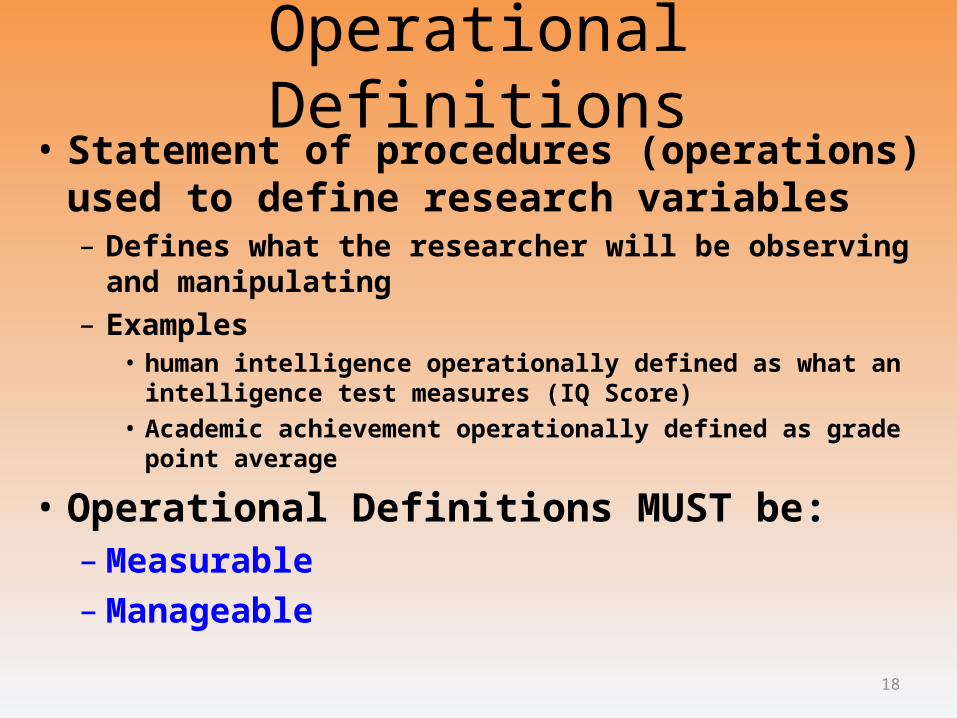
Operational Definitions• Statement of procedures (operations) used
to define research variables– Defines what the researcher will be observing and
manipulating
– Examples • human intelligence operationally defined as what an
intelligence test measures (IQ Score)
• Academic achievement operationally defined as grade point average
• Operational Definitions MUST be:– Measurable– Manageable
18
Operational Definitions
• With a partner, attempt to operationally define the following:1) Happiness2) Aggression 3) Popularity4) Good Behavior
19
20
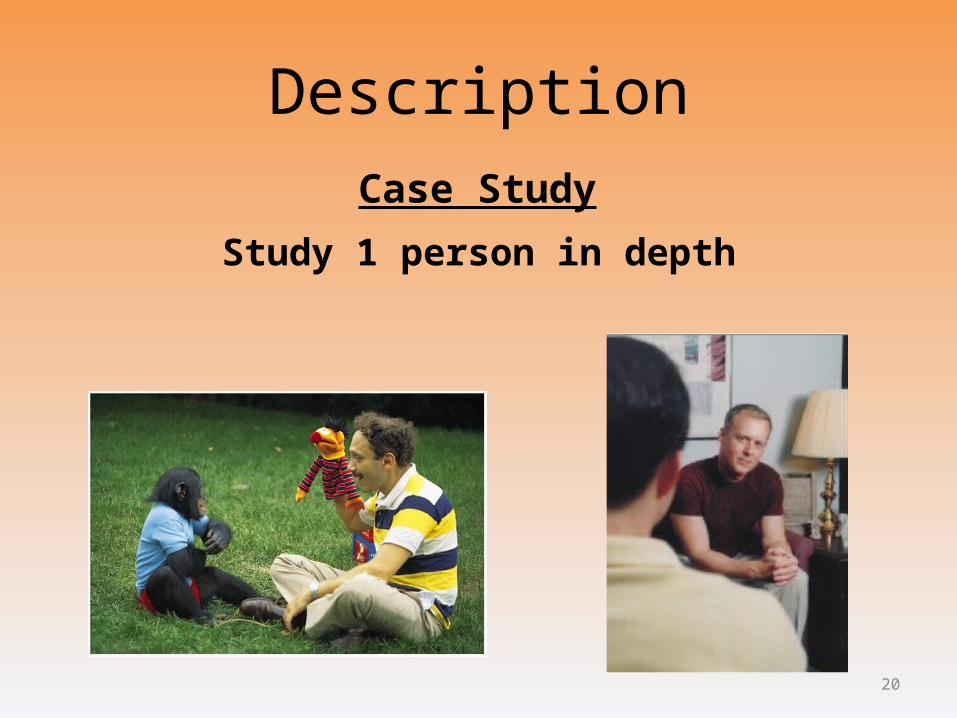
DescriptionCase Study
Study 1 person in depth
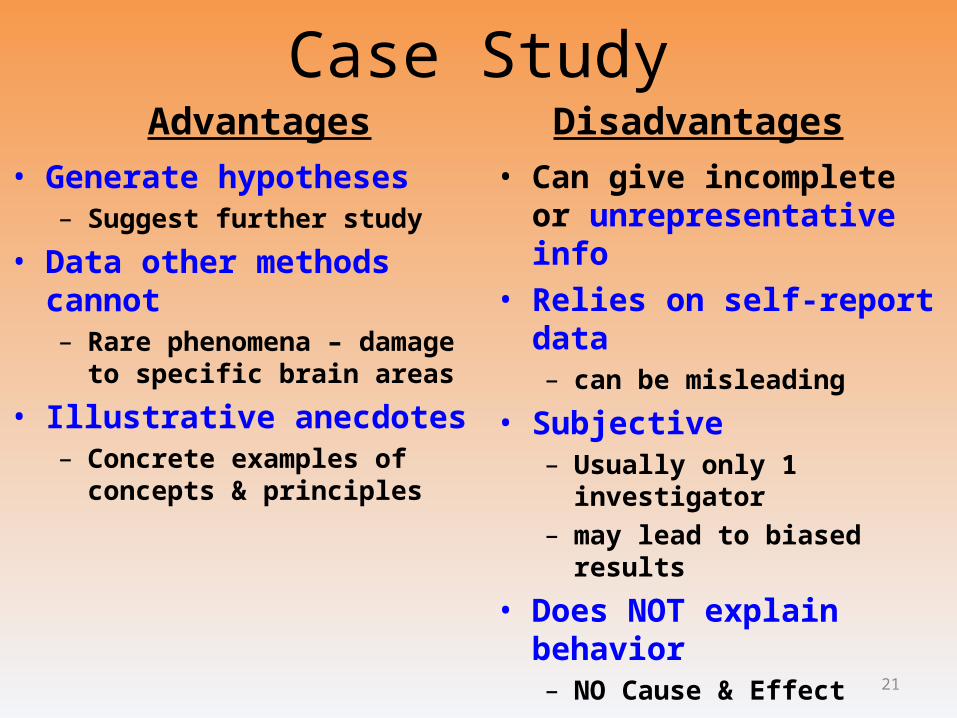
Case StudyAdvantages Disadvantages
• Can give incomplete or unrepresentative info
• Relies on self-report data – can be misleading
• Subjective– Usually only 1 investigator – may lead to biased results
• Does NOT explain behavior– NO Cause & Effect
21
• Generate hypotheses– Suggest further study
• Data other methods cannot– Rare phenomena – damage to
specific brain areas
• Illustrative anecdotes– Concrete examples of
concepts & principles

22
SurveyDetermining many people’s attitudes, opinions or
behaviors (Study many people superficially)- usually done by questioning a representative, random
sample of people.
Handout 2-5 & Discuss examplesEffects of:WordingRange of ResponsesOrder
How long is the Mississippi River? What is the population of Argentina? Form A Form B Form A Form B

23
Survey
A tendency to overestimate the extent to which others share our beliefs and
behaviors.
False Consensus EffectPresident Obama is a good president.
Yes or No?
Estimate the % of people in class that you think agree with you
President Obama is a good president.
Yes or No?
Estimate the % of people in class that you think agree with you
24
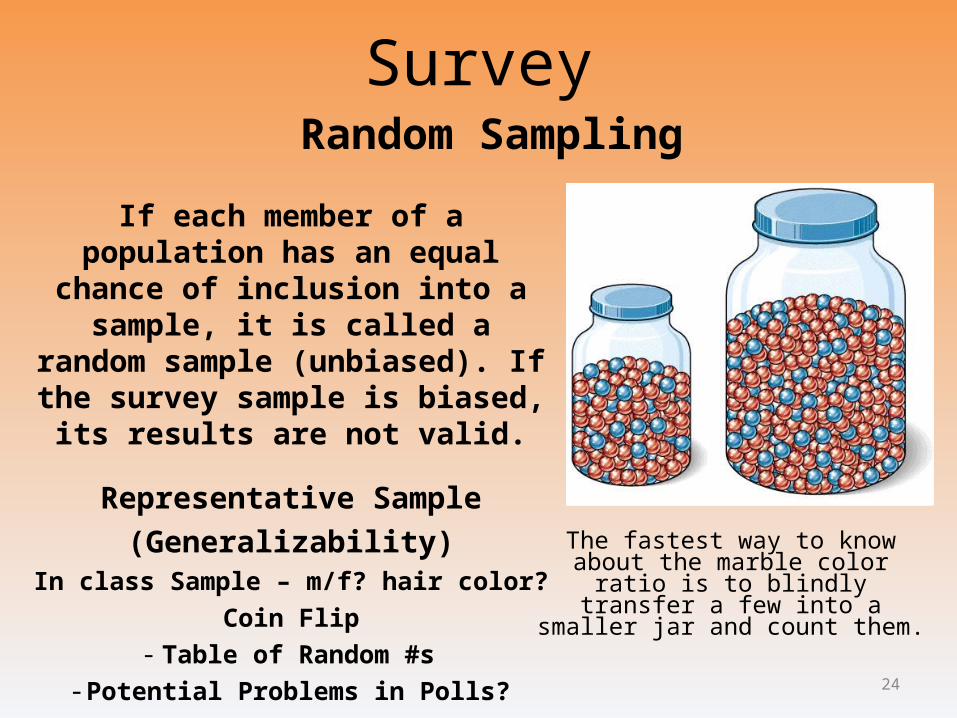
Survey Random Sampling
If each member of a population has an equal chance of inclusion
into a sample, it is called a random sample (unbiased). If the
survey sample is biased, its results are not valid.
Representative Sample
(Generalizability)In class Sample – m/f? hair color?
Coin Flip-Table of Random #s
-Potential Problems in Polls?
The fastest way to know about the marble color ratio is to blindly transfer a few into a smaller jar and count them.

SurveyAdvantages Disadvantages
• Self-Report Data– Can be misleading– Saying vs. Doing – behavior
can’t be observed directly
• Subjective– May lead to Bias– Wording? Sample?
• Does NOT explain behavior– NO Cause & Effect conclusions
25
• Generate hypotheses• Information about many
people at once– Cheap & relatively easy
26
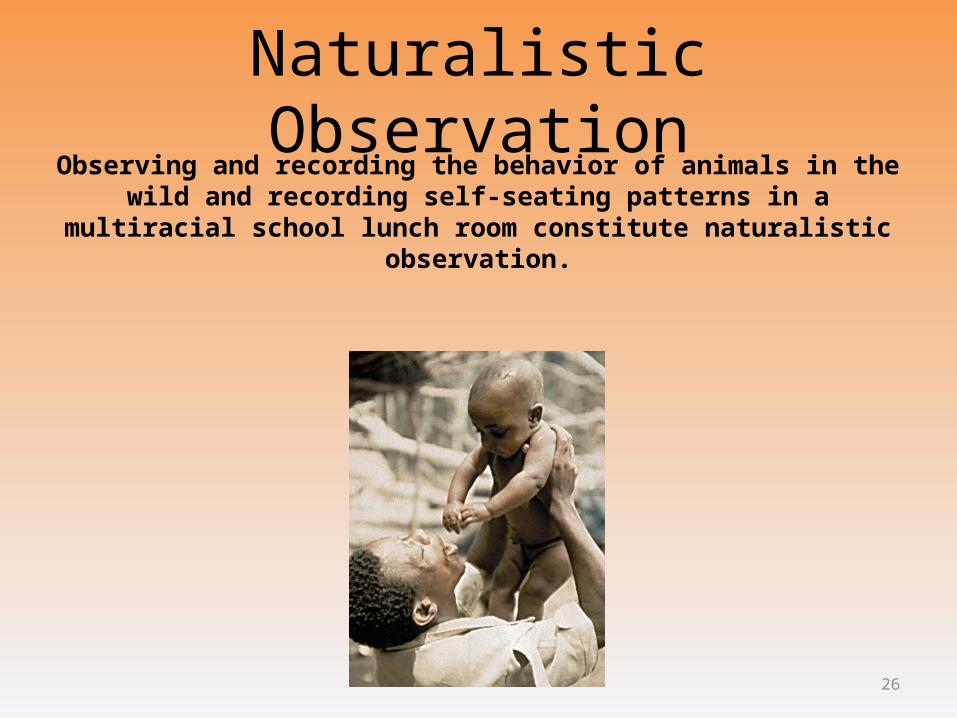
Naturalistic ObservationObserving and recording the behavior of animals in the wild and recording self-seating patterns in a multiracial school lunch room constitute naturalistic observation.
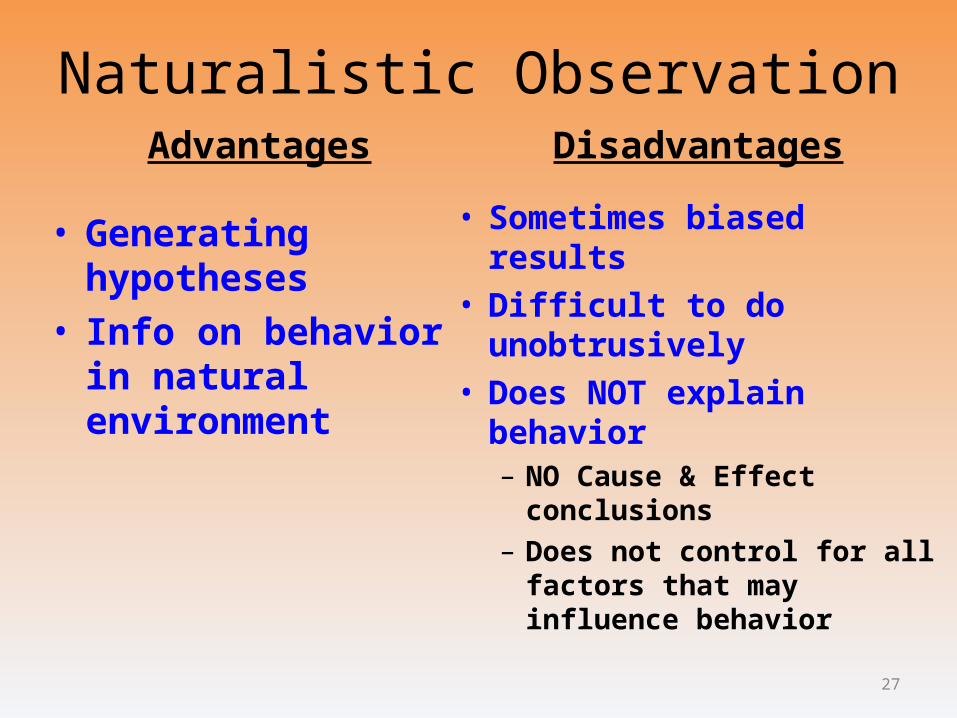
Naturalistic ObservationAdvantages Disadvantages
• Sometimes biased results• Difficult to do
unobtrusively• Does NOT explain behavior
– NO Cause & Effect conclusions
– Does not control for all factors that may influence behavior
27
• Generating hypotheses• Info on behavior in
natural environment

Correlation• Correlation Does NOT mean Causation
– Can be used to predict
• How is information obtained– Surveys– Quasi-experiments– Examples
• GPA related to Test Scores?• People w/ store credit cards spend more on clothes?
• Independent Variables that aren’t Independent (can’t be manipulated)– i.e. gender, age, height, weight– More likely to be used in correlational research
Correlation
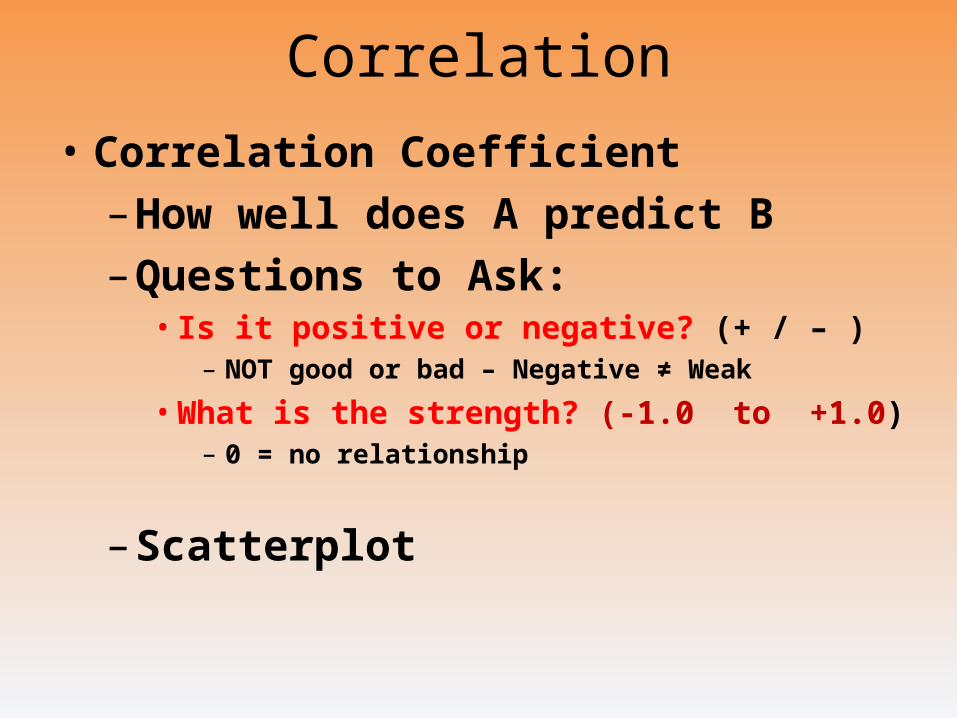
• Correlation Coefficient
– How well does A predict B
– Questions to Ask:• Is it positive or negative? (+ / – )
– NOT good or bad – Negative ≠ Weak
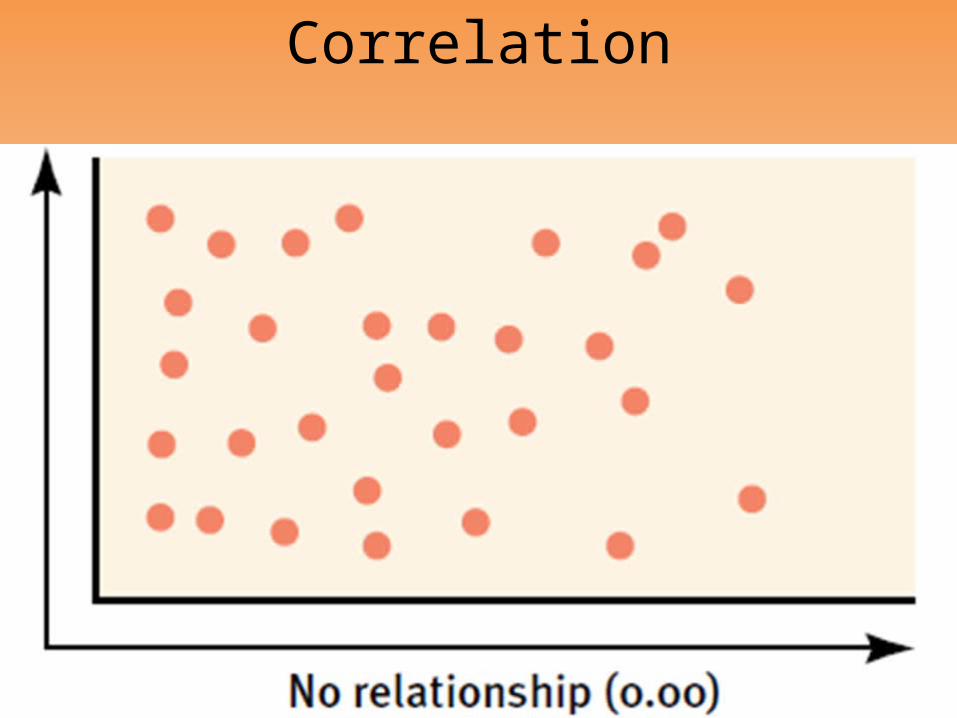
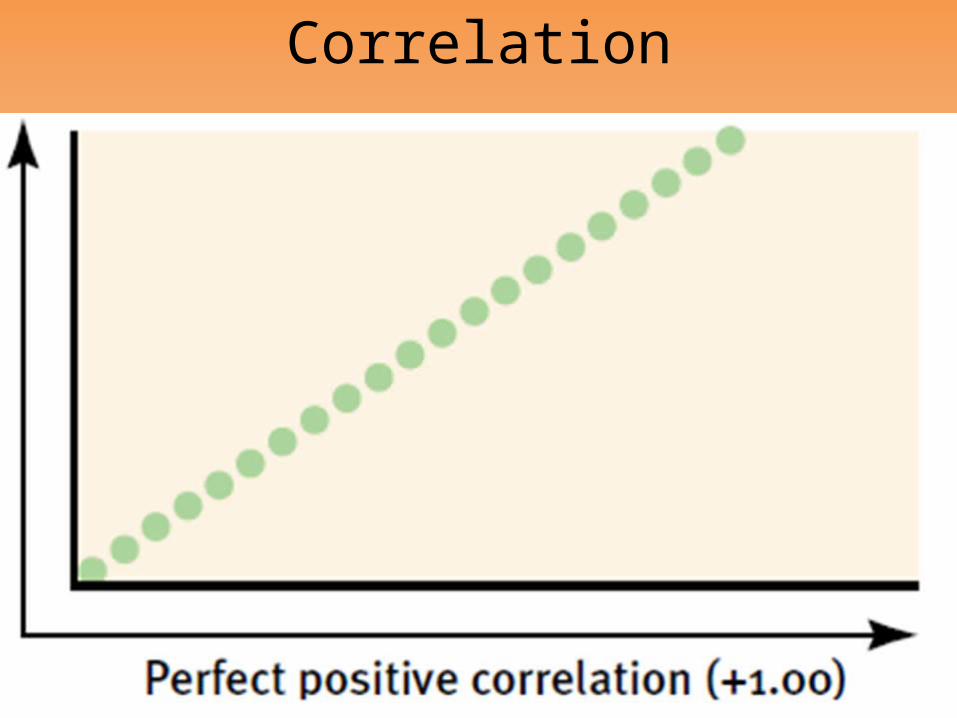
• What is the strength? (-1.0 to +1.0)– 0 = no relationship
– Scatterplot
Correlation

Correlation

Correlation

Correlation
Correlation

Correlation
Correlation

Correlation

Correlation

CorrelationCorrelation and Causation
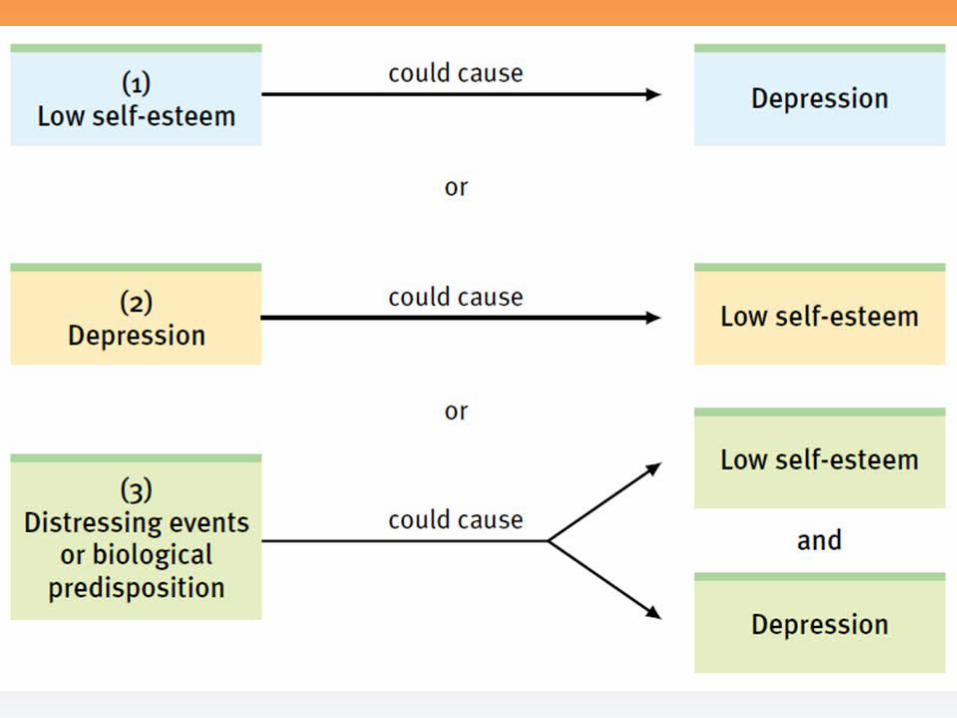
• Correlation helps predict–Does not imply cause and effect
–Does not imply directionality
CorrelationDirectionality
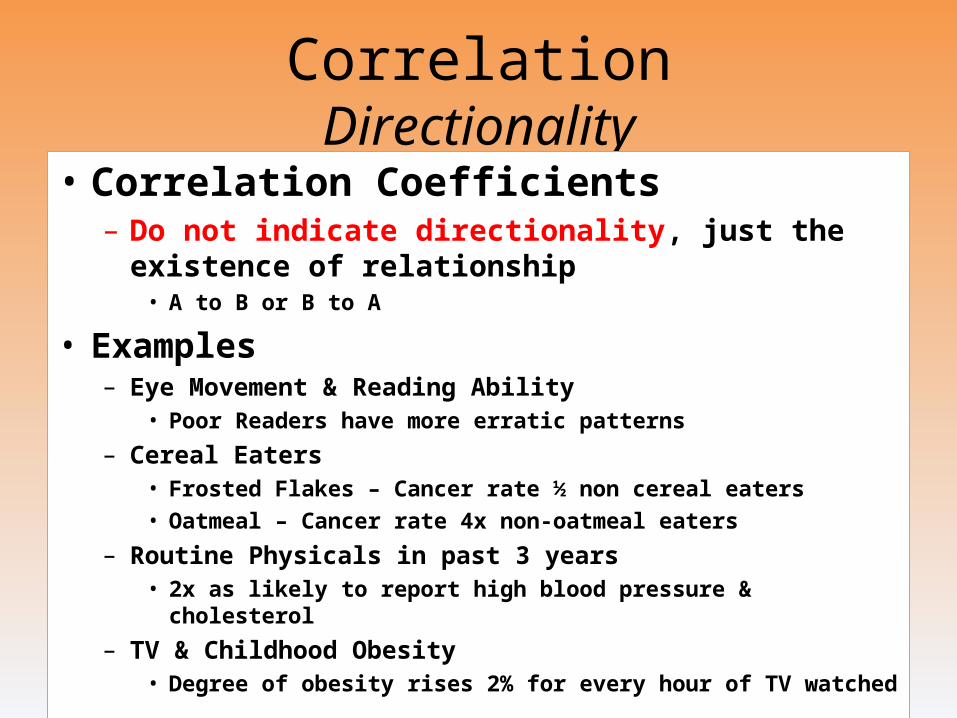
• Correlation Coefficients– Do not indicate directionality, just the existence of
relationship• A to B or B to A
• Examples– Eye Movement & Reading Ability
• Poor Readers have more erratic patterns
– Cereal Eaters• Frosted Flakes – Cancer rate ½ non cereal eaters
• Oatmeal – Cancer rate 4x non-oatmeal eaters
– Routine Physicals in past 3 years• 2x as likely to report high blood pressure & cholesterol
– TV & Childhood Obesity• Degree of obesity rises 2% for every hour of TV watched


CorrelationIllusory Correlations
• Illusory Correlation– Perceived non-existent correlation
– A random coincidence
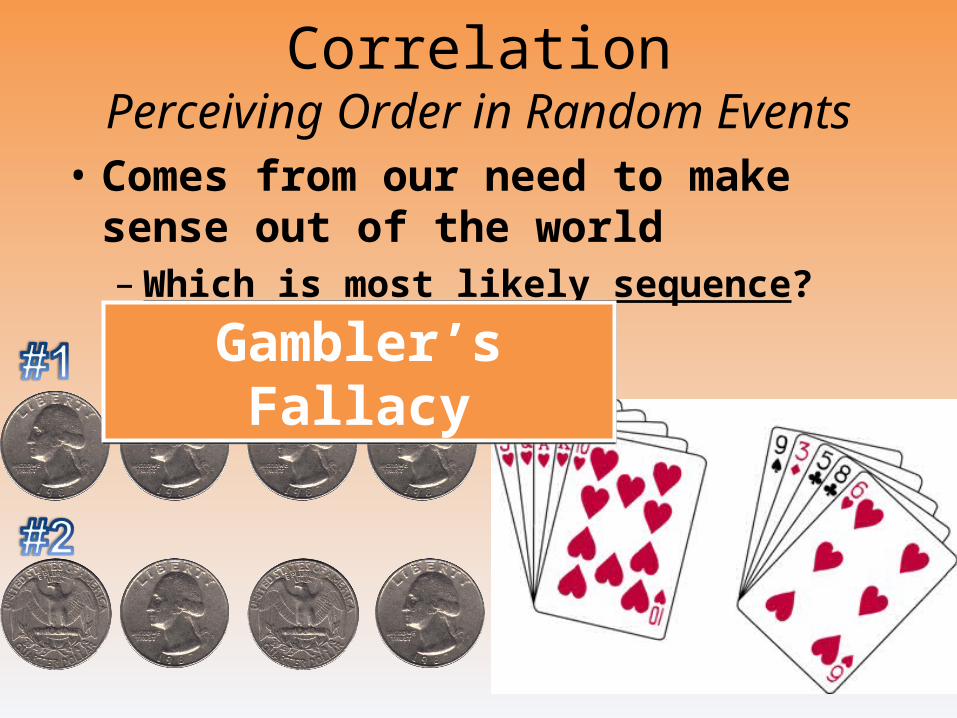
CorrelationPerceiving Order in Random Events• Comes from our need to make sense
out of the world– Which is most likely sequence?
• Coin flip Poker handGambler’s FallacyGambler’s Fallacy
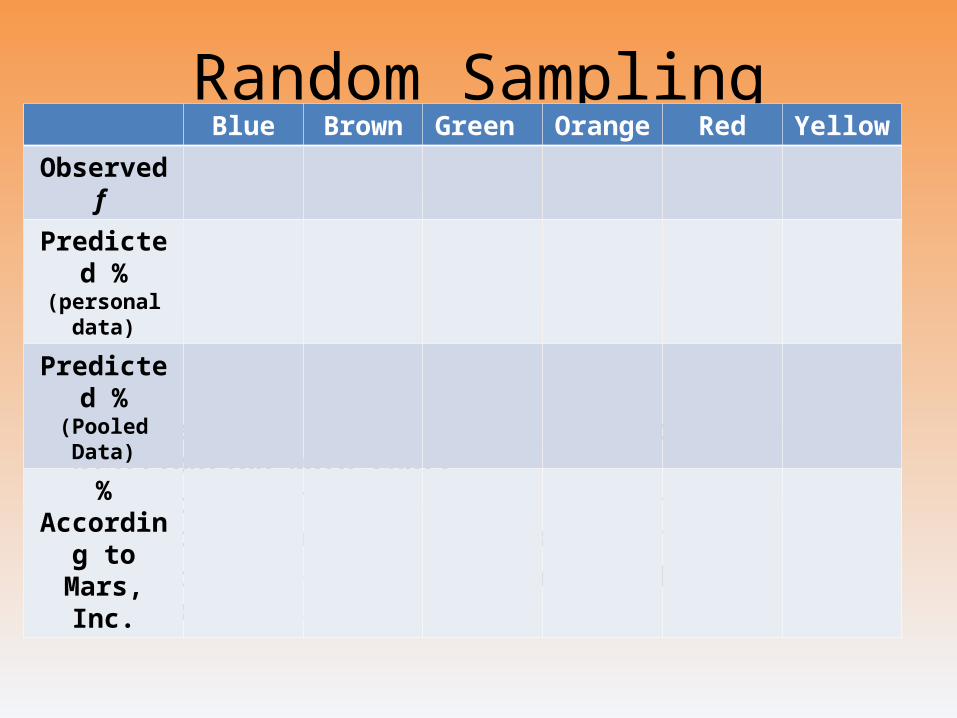
Random Sampling
• On a separate sheet of paper, set up the above Distribution Data Chart
• Count the # of each color of M&Ms in your personal “intact random sample” and convert numbers to %
• Attempt to predict the % of each color for all M&Ms (population)
Blue Brown Green Orange Red Yellow
Observed f
Predicted %(personal data)
Predicted %(Pooled Data)
% According to Mars, Inc.

Experimental Design
• Task – Unscramble the anagrams on the paper provided as FAST as you possibly can!
• http://www.online-stopwatch.com/

Experimentation
• Experiment–Can isolate cause and effect
–Control of factors• Manipulates one factor(s)
• “Controls” other factors

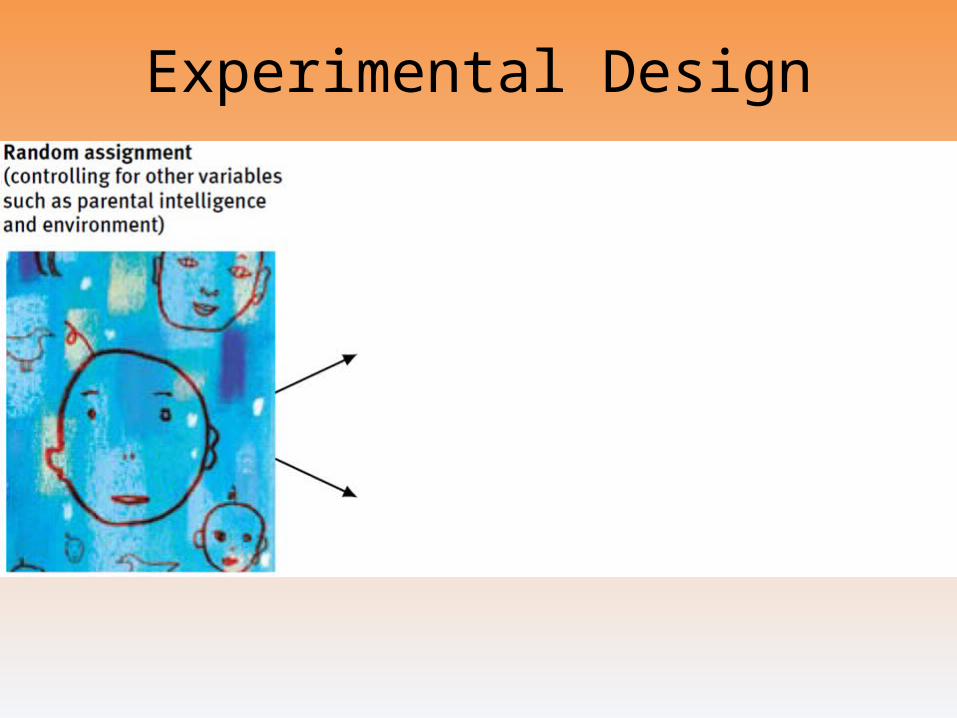
ExperimentationRandom Assignment
• Random assignment –Assigning to groups by chance
–Eliminates alternative explanations• How?
–Different from random sample• How?
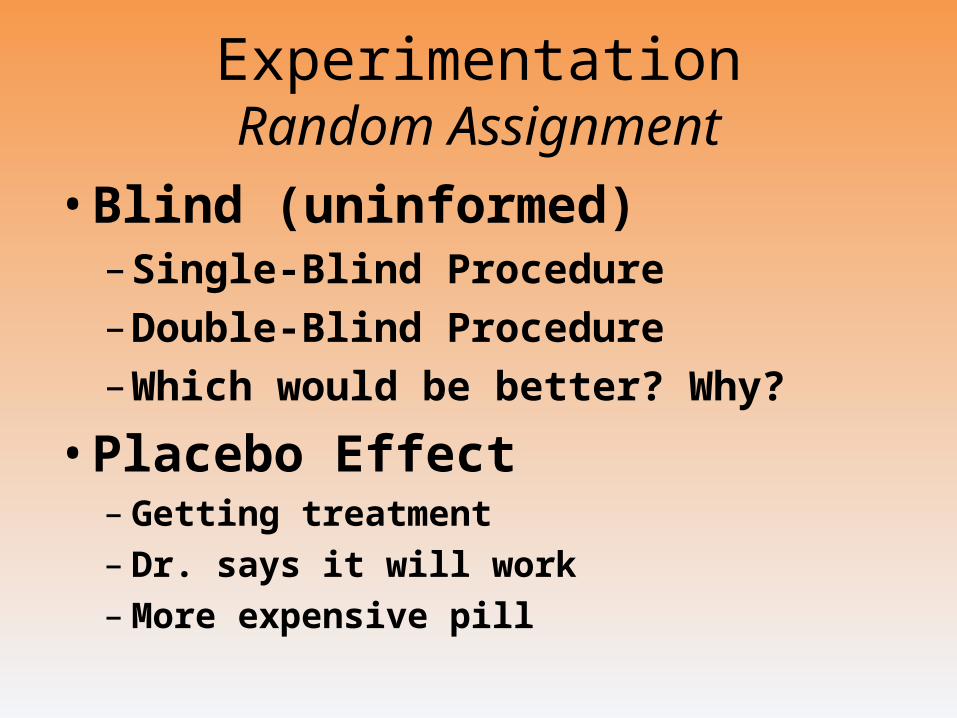
ExperimentationRandom Assignment
• Blind (uninformed)– Single-Blind Procedure– Double-Blind Procedure– Which would be better? Why?
• Placebo Effect– Getting treatment– Dr. says it will work– More expensive pill
ExperimentationPlacebo Effect

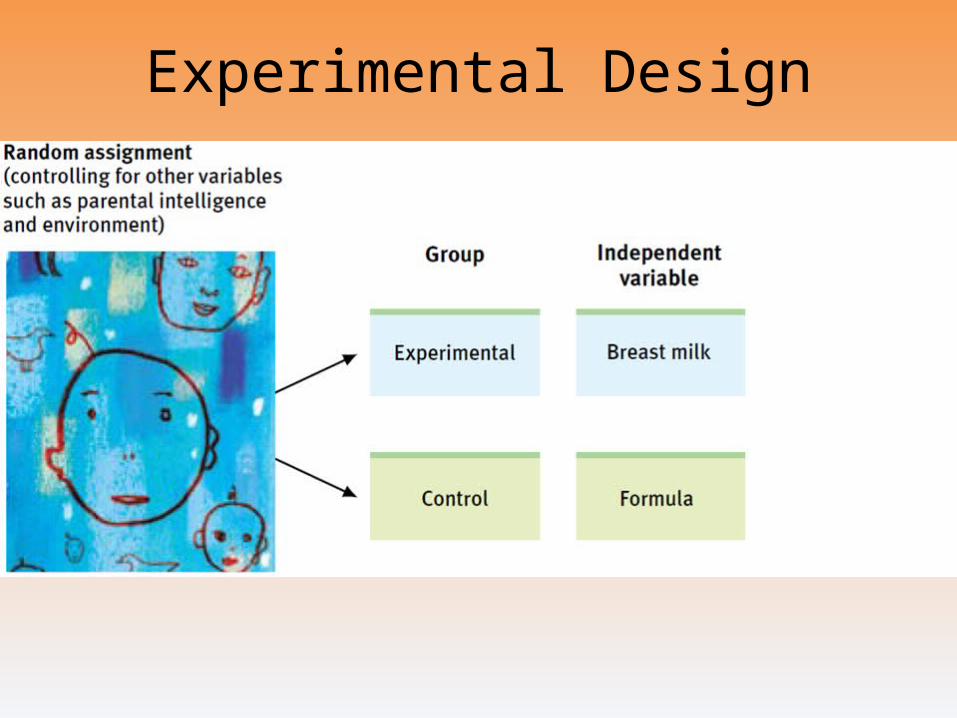
ExperimentationRandom Assignment
• Groups– Experimental Group
• Receives the treatment (IV)
– Control Group• Does not receive the treatment
– Need for 2 Groups - comparison (Capital Punishment)
• Within-subjects vs. Between- Subjects– Comparing to selves– Own control group (pre/post-test)– Which is most efficient? More resistant to individual differences?
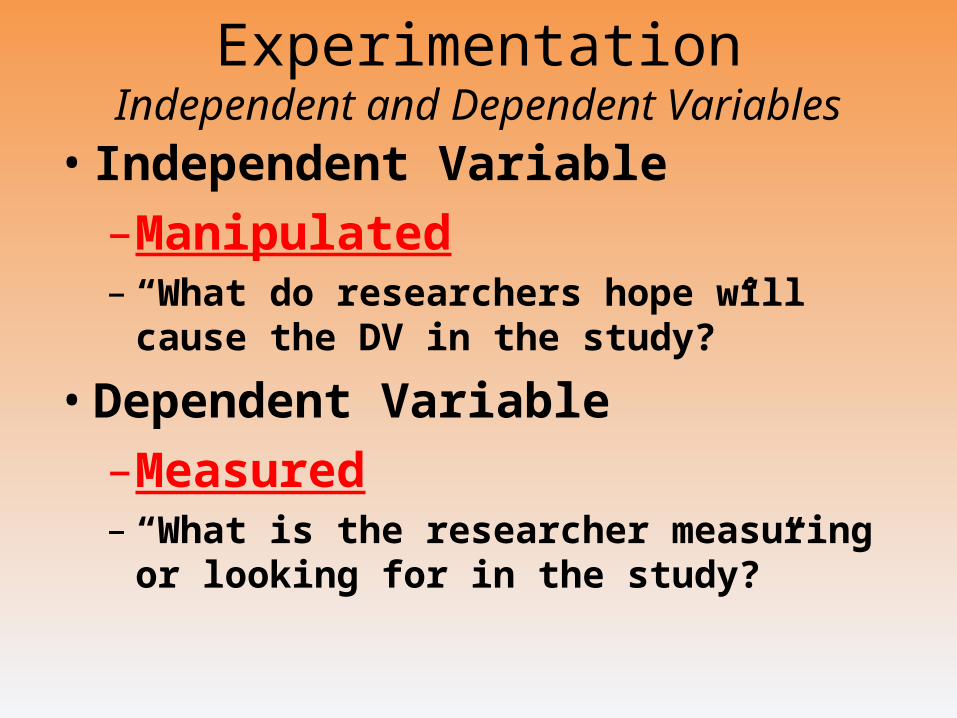
ExperimentationIndependent and Dependent Variables• Independent Variable
–Manipulated– “What do researchers hope will cause the
DV in the study?”
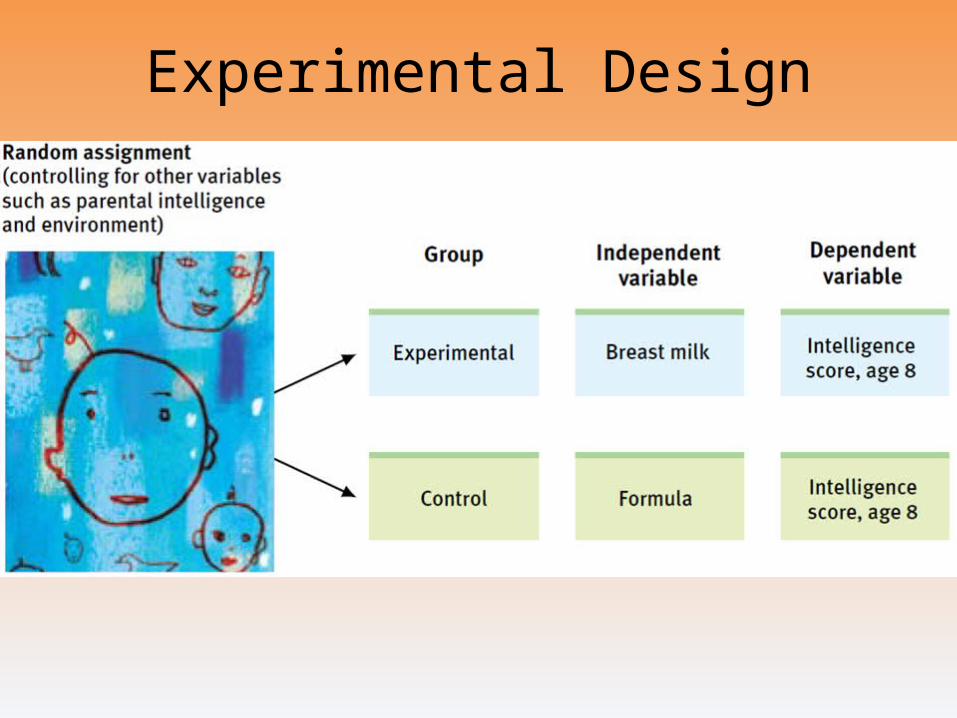
• Dependent Variable
–Measured– “What is the researcher measuring or
looking for in the study?”
Experimental Design

Experimental Design
Experimental Design
Experimental Design
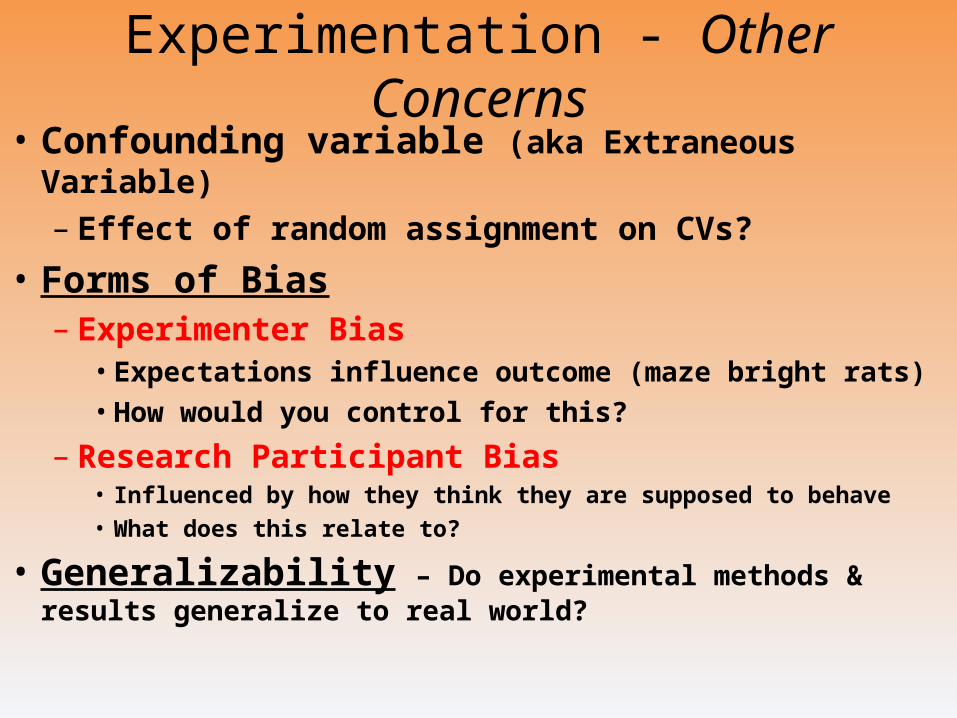
Experimentation - Other Concerns• Confounding variable (aka Extraneous Variable)
– Effect of random assignment on CVs?
• Forms of Bias– Experimenter Bias
• Expectations influence outcome (maze bright rats)
• How would you control for this?
– Research Participant Bias• Influenced by how they think they are supposed to behave
• What does this relate to?
• Generalizability – Do experimental methods & results generalize to real world?
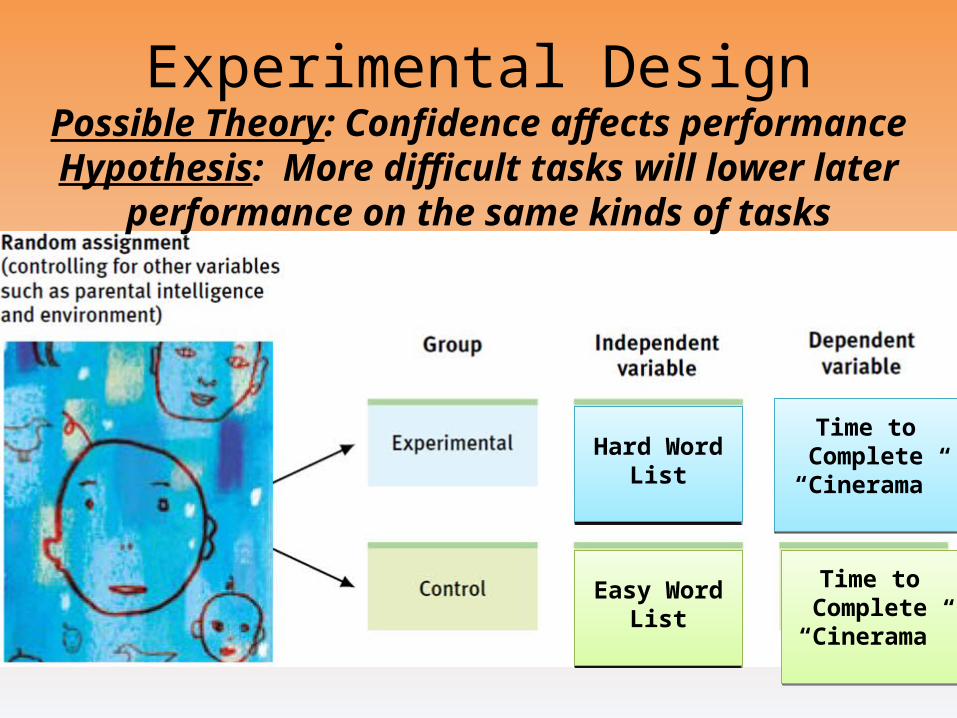
Experimental DesignPossible Theory: Confidence affects performanceHypothesis: More difficult tasks will lower later
performance on the same kinds of tasks
Hard Word ListHard Word List
Easy Word ListEasy Word List
Time to Complete
“Cinerama”
Time to Complete
“Cinerama”
Time to Complete
“Cinerama”
Time to Complete
“Cinerama”

Experimental DesignABC NEWS – Curly or Straight?
• Can you identify each of the following for the study:– Hypothesis:– Independent Variable:– Dependent Variable:– Controls?– Possible Problems with the study?
• Asch Experiment
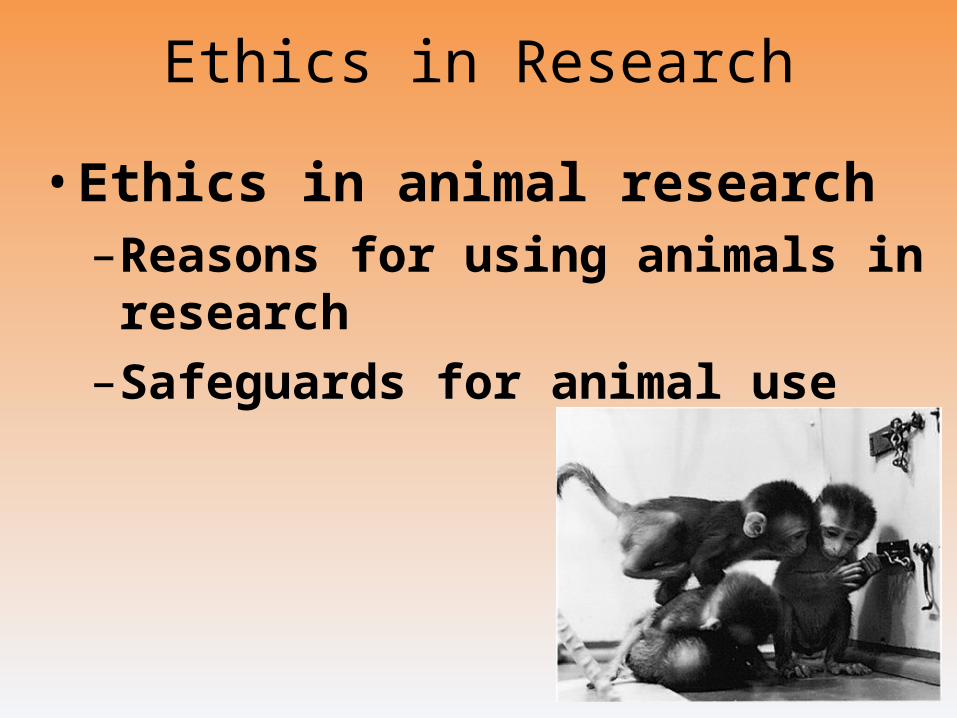
Ethics in Research
• Ethics in animal research–Reasons for using animals in
research
–Safeguards for animal use
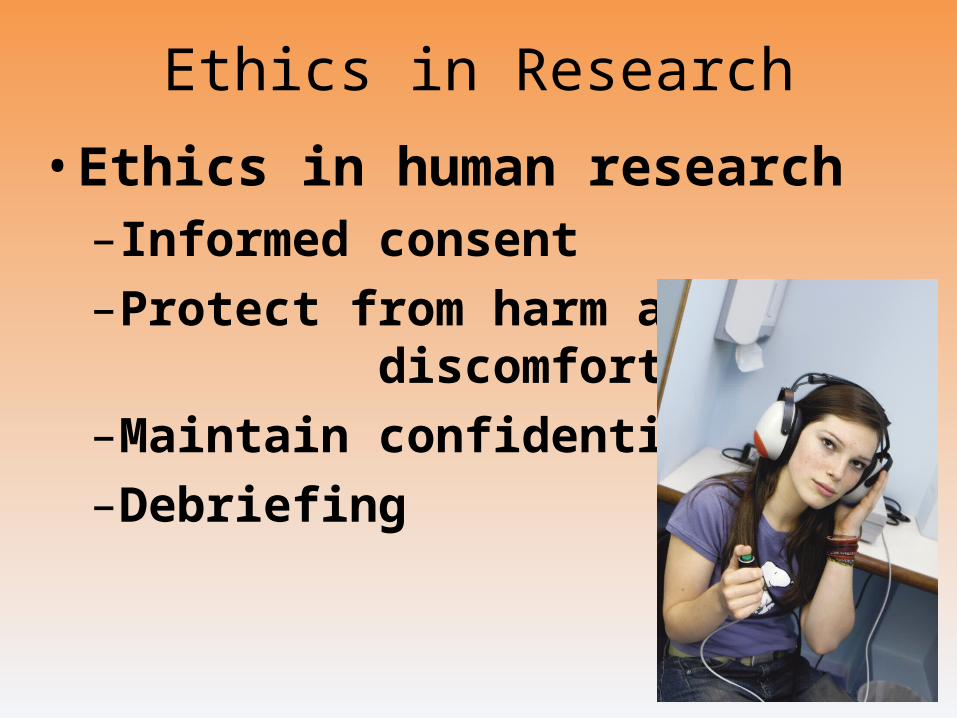
Ethics in Research
• Ethics in human research–Informed consent
–Protect from harm and discomfort
–Maintain confidentiality
–Debriefing

Comparing Research Methods

Comparing Research Methods
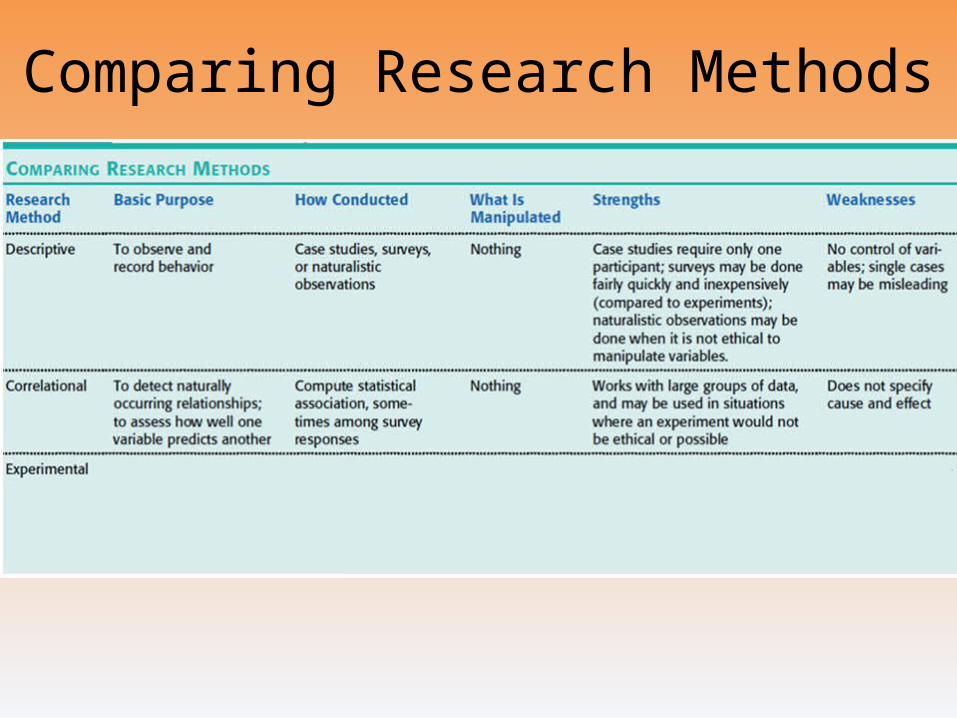
Comparing Research Methods
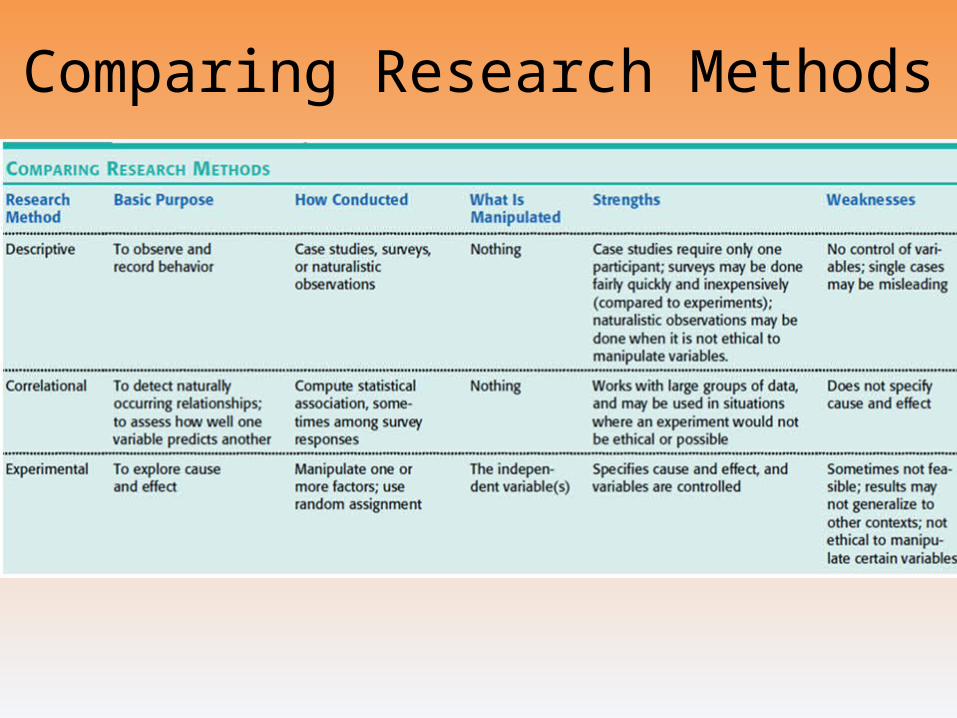
Comparing Research Methods
The End
Definition Slides
Hindsight Bias
= the tendency to believe, after learning an outcome, that one would have foreseen it.
• Also known as the “I knew it all along” phenomenon.
Critical Thinking
= thinking that does not blindly accept arguments and conclusions. Rather, it examines assumptions, discerns hidden values, evaluates evidence, and assesses conclusions.
Theory
= an explanation using an integrated set of principles that organizes observations and predicts behaviors or events.

Hypothesis
= a testable prediction, often implied by a theory.

Operational Definition
= a statement of the procedures (operations) used to define research variables.
• i.e. Human intelligence may be operationally defined as what an intelligence test measures.

Replication
= repeating the essence of a research study, usually with different participants in different situations, to see whether the basic finding extends to other participants and circumstances.
Case Study
= an observation technique in which one person is studied in depth in the hope of revealing universal principles.

Survey
= a technique for ascertaining the self-reported attitudes or behaviors of a particular group, usually by questioning a representative, random sample of the group.
Population
= all the cases in a group being studied, from which samples may be drawn.
• Note: Except for national studies, this does NOT refer to a country’s whole population.
Random Sample
= a sample that fairly represents a population because each member has an equal chance of inclusion.
Naturalistic Observation
= observing and recording behavior in naturally occurring situations without trying to manipulate and control the situation.
Correlation
= a measure of the extent to which two factors vary together, and thus of how well either factor predicts the other.
Correlation Coefficient
= a statistical index of the relationship between two things (from -1 to +1).
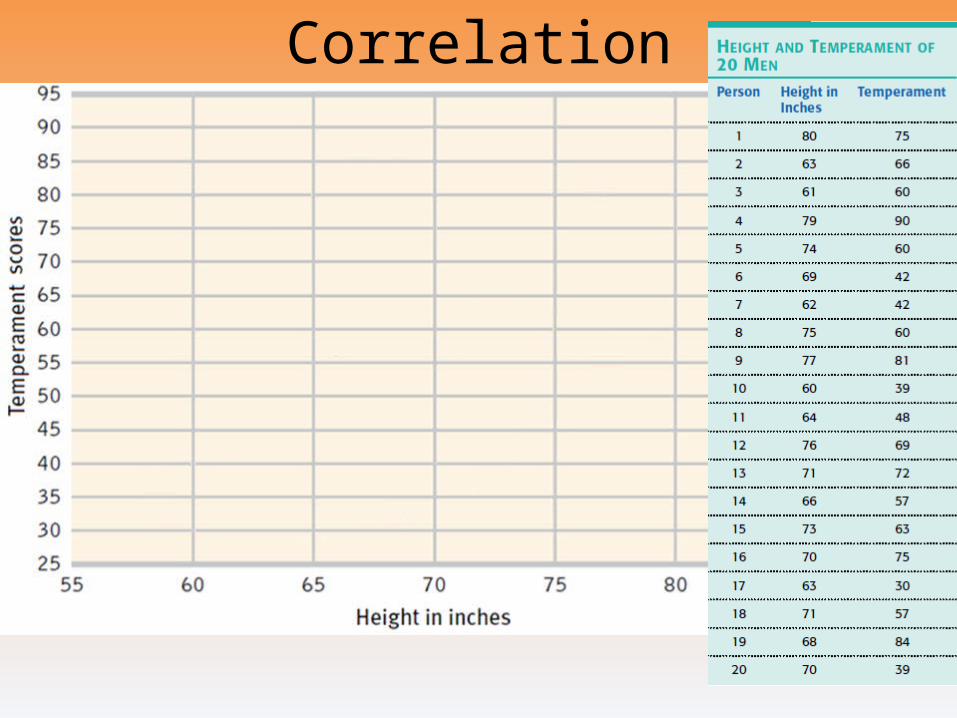
Scatterplot
= a graphed cluster of dots, each of which represents the values of two variables. The slope of the points suggests the direction of the relationship between the two variables. The amount of scatter suggests the strength of the correlation (little scatter indicates high correlation).
Illusory Correlation
= the perception of a relationship where none exists.
Experiment
= a research method in which an investigator manipulates one or more factors (independent variables) to observe the effect on some behavior or mental process (the dependent variable). By random assignment of participants, the experimenter aims to control other relevant factors.
Random Assigment
= assigning participants to experimental and control groups by chance, thus minimizing preexisting differences between those assigned to the different groups.
Double-Blind Procedure
= an experimental procedure in which both the research participants and the research staff are ignorant (blind) about whether the research participants have received the treatment or the placebo. Commonly used in drug-evaluation studies.
Placebo Effect
= experimental results caused by expectation alone; any effect on behavior caused by the administration of an inert substance or condition, which the recipient assumes is an active agent.
Experimental Group
= in an experiment, the group that is exposed to the treatment, that is, to one version of the independent variable.
Control Group
= in an experiment, the group that is NOT exposed to the treatment; contrasts with the experimental group and serves as a comparison for evaluating the effect of treatment.
Independent Variable
= the experimental factor that is manipulated; the variable whose effect is being studied.

Confounding Variable
= a factor other than the independent variable that might produce an effect in an experiment.

Dependent Variable
= the outcome factor; the variable that may change in response to manipulations of the independent variable.
Mode
= the most frequently occurring score(s) in a distribution.
Mean
= the arithmetic average of a distribution, obtained by adding the scores and then dividing by the number of scores.

Median
= the middle score in a distribution, half the scores are above it and half are below it.

Range
= the difference between the highest and lowest score in a distribution.
Standard Deviation
= a computed measure of how much scores vary around the mean score.
Normal Curve
= a symmetrical, bell-shaped curve that describes the distribution of many types of data; most scored fall near the mean (68 percent fall within one standard deviation of it) and fewer and fewer near the extremes.

Statistical Significance
= a statistical statement of how likely it is that an obtained result occurred by chance.
Culture
= the enduring behavior, ideas, attitudes, and traditions shared by a group of people and transmitted from one generation to the next.
Informed Consent
= an ethical principle that research participants be told enough to enable them to choose whether they wish to participate.
Debriefing
= the postexperimental explanation of a study, including its purpose and any deceptions, to its participants.