Embed Size (px)
Citation preview
Research Management Mechanisms: Good practices from Greek Public Universities
Antigoni PapadimitriouKaterina GotzamaniPantelis Loginides
Ilias NtinasGeorge Tsiotras
31st Annual EAIR Forum in Vilnius, Lithuania
23 to 26 August 2009
Contents
Objectives of the Study Background information and RC Methodology Findings Best Practices Conclusions

Study's’ Objective
To describe findings of a research project that conducted with the purpose of identifying good practices in Research Committees in Greek Public Universities.

Background information
Higher Education Institutions in Greece are legal entities under the public law, with full self-administration under the supervision of the Minister of National Education and Religious Affairs (YPEPTH), in accordance with article 16 of the Constitution.
the Greek Constitution refers also to the state control upon the universities, which is carried out by the YPEPTH
The initial planning and application of government policy as well as the responsibility for administrating the education system in all its sectors, services and levels, is held by the YPEPTH

Financial management mechanism can be carried out by 3 different mechanisms with the possibility to existing in each university
The first is the independent system of financial management as regards research funding coming from external funding. This system operates through the so-called Research Committee of each university, with responsibility areas extending to activities often wider than research ones.
The second mechanism is the Company for the Management of the Property of the University. This is a business-type institution, which belongs to the university and operates under the control of the senate. This company operates in free-market terms and it aims to the better use and the increase of the institution's property and other resources and
The third mechanism refers to the possibility of the universities to establish Research Institutes associated with one or more of their faculties. The development of research institutes provides universities with the ability for better organizing their research activities principally in multidisciplinary or interdisciplinary scientific areas

The budget of the Research Committee
consists of the amounts withheld from the total budgets of the funded research projects, is divided in two parts:
a) operational expenses of the Research Committee; b) research and development expenses. First, the operational expenses are estimated and subtracted from
the total budget and then the Research Committee proposes the allocation of the remaining funds among three categories of research and development expenses:
I) research infrastructure–capital, II) research infrastructure–human resources, III) university development. As each Department has a representative in the Research
Committee, there is a lot of negotiation in the development of the budget

Research design
Investigation of current application
Identification of Best Practices
Design and Implementation of a database of Best Practices
Development of evaluation Criteria
Defining the evaluation criteria
Education Criteria for Performance Excellence
by the Baldrige National Quality Program (2004) EFQM Excellence Model – Higher Education Version
by Sheffield Hallam University in collaboration with EFQM (2003)
Academic Scorecard
evaluation of academic organizations (“balanced scorecard”)

EVALUATION CRITERIA
QUANTITATIVE QUALITATIVE
Financial and other resources
Leadership
Customers-Users Strategy
Personnel Resources
Processes (function-specific)
Personnel
Society Processes
Other data (not included in previous categories)
Users

BEST PRACTICES
Quantitatively high performing practices
High score achievements in qualitative factors

Pilot study
Problems:- reluctance by most functions’ head officers to
participate in the project in the form of evaluation so as to record best practices was observed
- questionnaire related comprehension difficulties during completion by the representatives

Solutions
Development of second qualitative questionnaire which accompanies the interviews
The scope of the interview was twofold: to help directors identify and describe possible good practices that might apply, and to examine which evaluation processes – if any at all – they adopt
identify and record best, good, or effective practices
Looking for best practices
These practices are not directly associated with the terminology (definition) of best practices, as these are found in the literature, but they are based on the personal experience of the participants and the experience and subjective judgement of the research team

Data analysis
Leadership 12 indicators
Strategic planning 9 ”
Personnel 13 ”
Processes 9 ”
Resources 9 ”
Users 8 ”
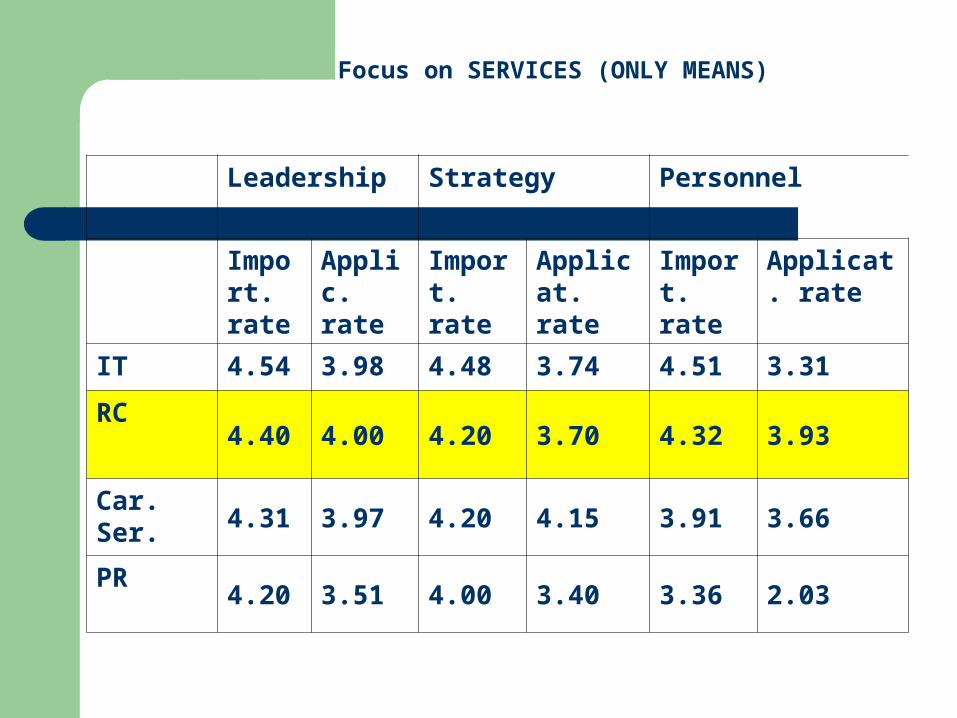
Focus on SERVICES (ONLY MEANS)
Leadership Strategy Personnel
Import. rate
Applic. rate
Import. rate
Applicat. rate
Import. rate
Applicat. rate
IT 4.54 3.98 4.48 3.74 4.51 3.31
RC4.40 4.00 4.20 3.70 4.32 3.93
Car. Ser.4.31 3.97 4.20 4.15 3.91 3.66
PR4.20 3.51 4.00 3.40 3.36 2.03

Users Recourses Processes
Import. rate
Applic. rate
Import. rate
Applicat. rate
Import. rate
Applicat. rate
IT 4.14 2.68 4.12 2.55 4.53 3.31
RC3.97 3.33 4.39 3.53 4.20 3.31
Career Serv. 3.81 3.37 4.30 4.04 4.17 3.81
PR3.46 2.50 3.28 2.61 3.33 2.06

00,5
11,5
22,5
33,5
44,5
5
1 2 3 4
IT - RC - CS - PR
Leadership
Importance Rate
Application Rate
0
0,5
1
1,5
2
2,5
3
3,5
4
4,5
1 2 3 4
IT - RC - CS - PR
Strategy
Importance Rate
Application Rate
00,5
11,5
22,5
33,5
44,5
5
1 2 3 4
IT - RC - CS - PR
Personnel
Importance Rate
Application Rate
0
0,5
1
1,5
2
2,5
3
3,5
4
4,5
1 2 3 4
IT - RC - CS - PR
Users' satisfaction
Importance Rate
Application Rate
0
0,5
1
1,5
2
2,5
3
3,5
4
4,5
1 2 3 4
IT - RC - CS - PR
Recourses
Importance Rate
Application Rate
00,5
11,5
22,5
33,5
44,5
5
1 2 3 4
IT - RC - CS - PR
Processes
Importance Rate
Application Rate

00,5
11,5
22,5
33,5
44,5
5
1 2 3 4 5 6
A - B - C - D - E - Mean
Leadership differences among universities
Importance Rate
Application Rate
00,5
11,5
22,5
33,5
44,5
5
1 2 3 4 5 6
A - B - C - D - E - Mean
Strategy differences among universities
Importance Rate
Application Rate
00,5
11,5
22,5
33,5
44,5
5
1 2 3 4 5 6
A - B - C - D - E - Mean
Personnel Differences among Universities
Importance Rate
Application Rate
00,5
11,5
22,5
33,5
44,5
5
1 2 3 4 5 6
A - B - C - D - E - Mean
Differences in Recourses
Importance Rate
Application Rate
00,5
11,5
22,5
33,5
44,5
5
1 2 3 4 5 6
A - B - C - D - E - Mean
Processes differences among Universities
Importance Rate
Application Rate
00,5
11,5
22,5
33,5
44,5
1 2 3 4 5 6
A - B - C - D - E - Mean
Differences in users' satisfaction
Importanca Rate
Application Rate
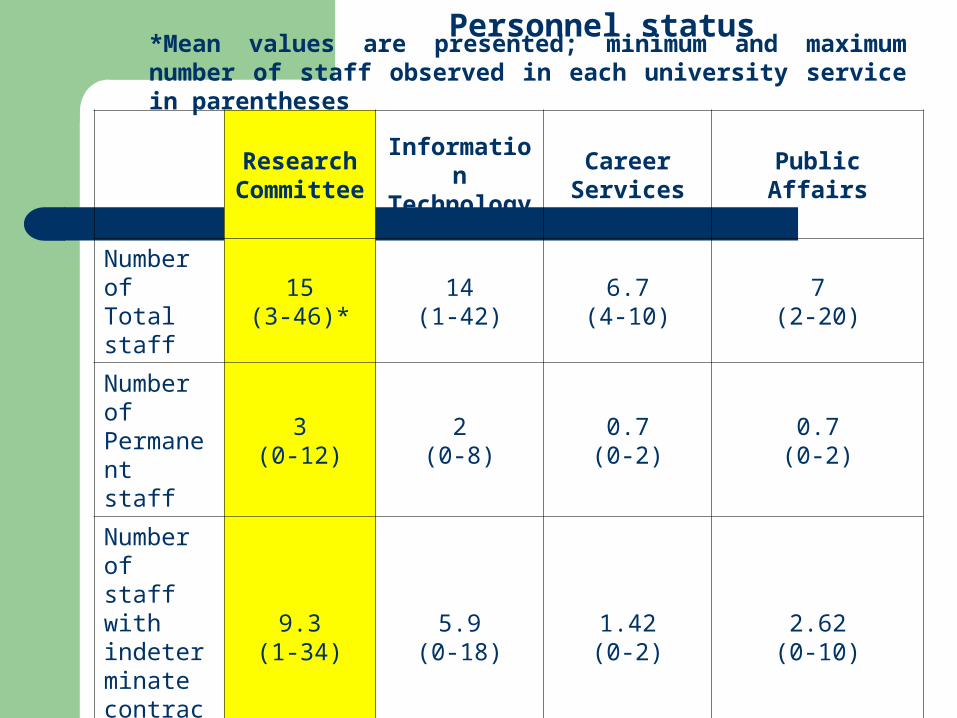
Personnel status
Research Committee
Information Technology
Career Services
Public Affairs
Number of Total staff
15(3-46)*
14(1-42)
6.7(4-10)
7(2-20)
Number of Permanent staff
3(0-12)
2(0-8)
0.7(0-2)
0.7(0-2)
Number of staff with indeterminate contract
9.3(1-34)
5.9(0-18)
1.42(0-2)
2.62(0-10)
Sum of Rows 2 & 3
12.3(1-46)
7.9(1-60)
2.12(4-14)
3.32(2-30)
Ratio (permanent /total staff)
.82 .56 .31 .47
*Mean values are presented; minimum and maximum number of staff observed in each university service in parentheses
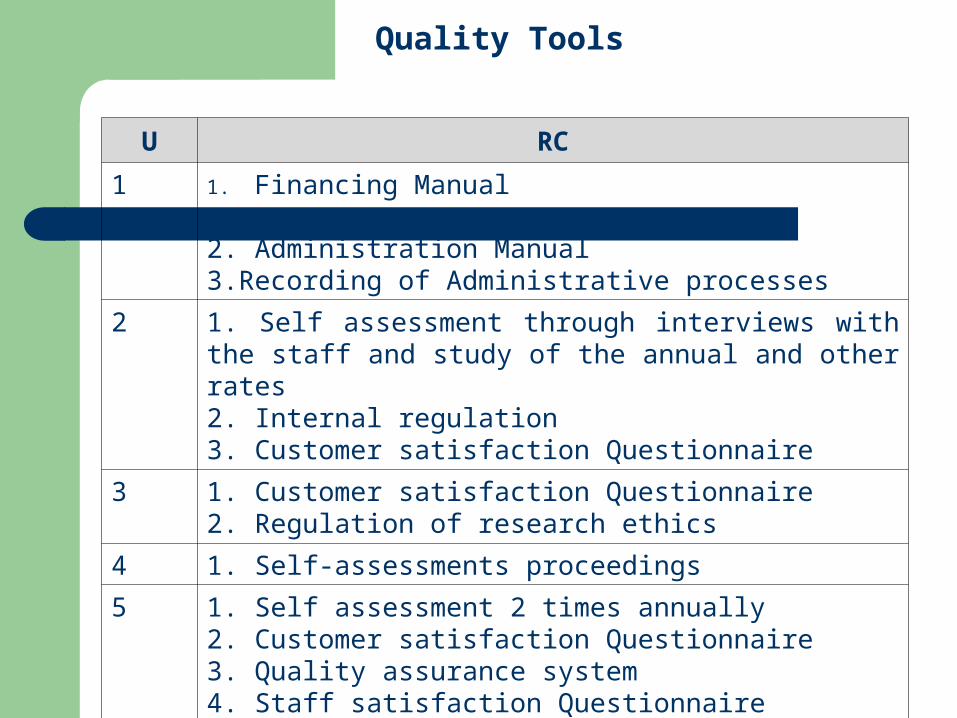
Quality Tools
U RC
1 1. Financing Manual
2. Administration Manual3.Recording of Administrative processes
2 1. Self assessment through interviews with the staff and study of the annual and other rates 2. Internal regulation3. Customer satisfaction Questionnaire
3 1. Customer satisfaction Questionnaire2. Regulation of research ethics
4 1. Self-assessments proceedings
5 1. Self assessment 2 times annually 2. Customer satisfaction Questionnaire3. Quality assurance system4. Staff satisfaction Questionnaire

Users’ satisfaction
UNIV.RC
1 1. yes empirical (orally)2. Employs’ satisfaction3. Suppliers’ satisfaction4. Quality assurance systems with special process for problem solving
2 1. Users satisfaction questionnaires (temporary)
3 1. Faculty satisfaction questionnaires (temporary)
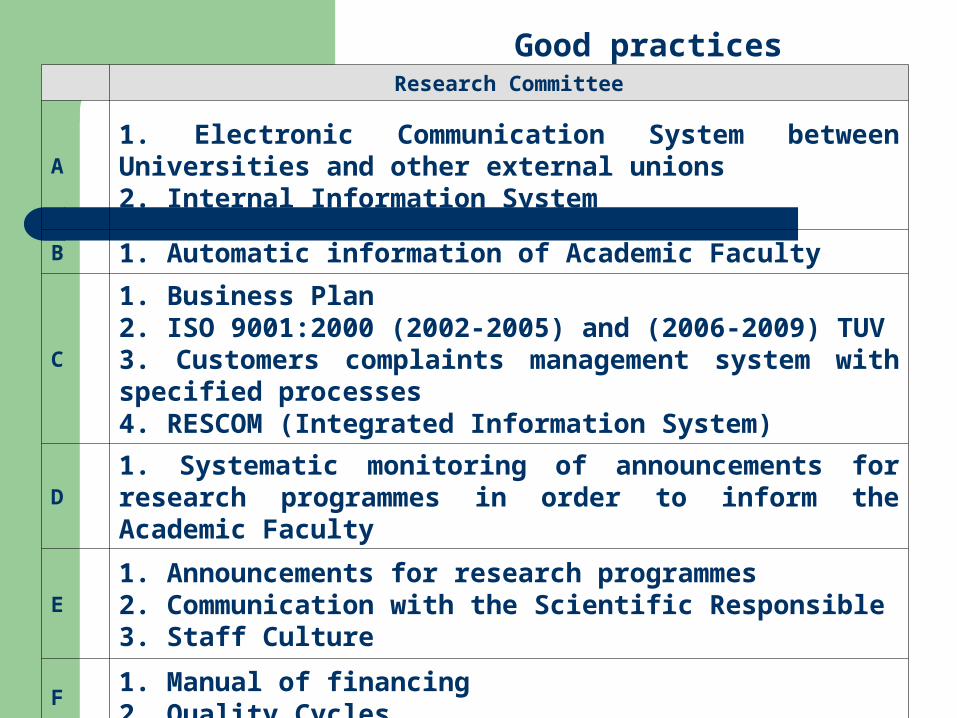
Research Committee
A
1. Electronic Communication System between Universities and other external unions 2. Internal Information System
B 1. Automatic information of Academic Faculty
C
1. Business Plan2. ISO 9001:2000 (2002-2005) and (2006-2009) TUV3. Customers complaints management system with specified processes4. RESCOM (Integrated Information System)
D1. Systematic monitoring of announcements for research programmes in order to inform the Academic Faculty
E
1. Announcements for research programmes2. Communication with the Scientific Responsible3. Staff Culture
F1. Manual of financing2. Quality Cycles
Good practices

Presentation of good practices

Conclusions
Quality Assurance is in its early phases the responses of GRPUs to this research was very positive.
Administrators from academic support services are not well experienced with quality and evaluation issues and need time in order to response accordingly.
The university activities often permeate the local economic, social and cultural environment.

-2-
the results of this research project and especially the presentation of effective practices (CD) and the ways that these practices can adapt and transfer (Jarrar & Zairi, 2000) will contribute to the improvement of the practices
beneficial in order to create a healthy communication system, exchange of knowledge and collaboration, aimed at improving these procedures.