Embed Size (px)
Citation preview

Research & Innovations for Development of Pharmaceuticals
Faculty of Pharmacy & Medical Sciences
University of Petra
Amman-Jordan
April, 19th 2017
Adnan Badran

* Pharmaceutical Research and Manufacturers of America (PhRMA). PhRMA annual membership survey. Washington, DC: PhRMA; 2016
Previous research by the same author estimated average R&D costs in the early 2000s at $1.2 billion in constant 2000 dollars (see DiMasi JA, Grabowski HG. The cost of biopharmaceutical R&D: Is biotech different? Managerial and Decision Economics.2007;28:469-479). That estimate was based on the same underlying survey as the author’s estimates for the 1990s to early 2000s reported here ($800 million in constant 2000 dollars), but updated for changes in the cost of capital.
**Note: First-in-class medicines are those that use a different mechanism of action from any other already approved medicine.
In United States2

3

Global Spending on Research & Development in Pharmaceuticals
from 2006-2022 (in billion U.S. Dollar)
4Source: Statista , The Statistics Portal - http://www.statista.com
5Source: EFPIA Key Data 2016- The Pharmaceutical Industry in Figures, page 10
Research and Development Spending of total revenue 2016, by industrial sector*

R&D spending for drug discoveryPharma R&D spend from 1992-2004
6
Pharmaceutical industry is a research-based knowledge economy in the
development of vaccines and medicines. Global pharmaceutical sale is
$856 billion in 2010, and billions of dollars are invested by thousands of
scientists in R&D technology and innovations. Nowadays, the cost of
developing a single drug amounts to $1.5 billion, as compared to $138
million in 1975.

Pharmaceutical spend per capita in selected countries in 2016(in US dollars)
Source: Statista , The Statistics Portal - http://www.statista.com 7
This Statistic describes the pharmaceutical spending per capita in selected countries as of 2016.
Pharmaceutical spending per capita in Japan stood at around 783 U.S. dollars. In comparison, the
United States reported per capita spending of more than 1,100 U.S. dollars.

Global growth in total pharmaceutical R&D spending from 2008 to 2022
Source: Statista , The Statistics Portal - http://www.statista.com 8
This statistic depicts the growth in global pharmaceutical research and development spendingfrom 2008 to 2022. The pharmaceutical industry expenditure on research and developmentdecreased 1.2 percent, between 2011 and 2012.
0
-3
0.9
5.7
-0.7
1.2
3.6
4.7
2.6
3.42.8
2.5
2.9 2.72.8
0 0 0 0 0 0 0 0 0 0 0 0 0 0 0
-4
-3
-2
-1
0
1
2
3
4
5
6
7
2008 2009 2010 2011 2012 2013 2014 2015 2016* 2017* 2018* 2019* 2020* 2021* 2022*
data

Allocation of research and development investments in pharmaceutical industry in 2014, by function
Source: Statista , The Statistics Portal - http://www.statista.com 9
This statistic displays the pharmaceutical industry's research and development investment allocation by select
functions in 2014 The pharmaceutical industry spent 23.8 percent of research and development investments in the
pre-human or pre-clinical stages.
0.00% 5.00% 10.00% 15.00% 20.00% 25.00% 30.00% 35.00% 40.00% 45.00% 50.00%
Pre-human/pre-clinical
Clinical trials
Phase I*
Phase II*
Phase III*
Approval
Pharmacovigiliance (Phase IV)
Uncategorized
0.21%
48.30%
8.90%
10.70%
28.70%
5.10%
16.60%
8.90%
Data

Source: Food and Drug Administration; ID 262320
10
Number of FDA approvals for new molecular entities (NMEs)in the period 2009-2011
77
15 1310 8 7 5 5 3 1 1
9
0
10
20
30
40
50
60
70
80
90
Nu
mb
er o
f a
pp
rov
als
2009-2011

11

Spending and Costs
12

13Source: Tufts CSDD10
Drug Development Costs Have Increased
According to a 2014 study, it costs an average of $2.6 billion in U.S.A to develop onenew drug. Less than 12% of the candidate that make it into phase I clinical trialswill be approved by the FDA.
The average cost to develop one new approved drug- including the cost of failures
(Constant 2013 Dollars)

14
The Research and Development ProcessDevelopment a new medicine takes an average of 10 – 15 years.

15
The innovation gap crises in pharma R&D is growing. New molecular entities (NMEs)
approved drugs remained flat in the past decade. In the 1990’s, eleven new drugs had
reached the “top 100 drugs” while in 2000-2004 only two new drugs approved made it to the
top 100 revenue generation. R&D cost is on the rise due to a lengthy clinical trials by FDA
for safety. Only one drug candidate out of 13 preclinical candidates is passed (8%). It takes
10-15 yrs for the FDA to pass a new drug.
Innovation crisis in New Drug discovery
Source: The Innovation Gap, HIMT 455, Prof. Hughes, March, 2007

Health expenditure as a percentage of gross domestic product inOECD countries in 2012 - 2013
Source: https://www.statista.com/statistics/268826/health-expenditure-as-gdp-percentage-in-oecd-countries/Source: World Bank 16
17.9
12.4
11.3
9.6
11.3 11.711.2
10.110.8 10.9
11.5
9.6 9.29.1
9.4
8.1
6.3
16.4
11.1
11.1
11 11 10.910.4
10.2
10.210.2
10.1
8.8 8.8 8.6 8.58.1
5.1
2012
2013

OTC* Medicines as a % of the Total Pharmaceutical Market 2010
*OTC: Over the counter
Source: AESGP Economic and legal Framework for Non-Prescription Medicines 2011 17

Declining R&D Success Rates
Source: The Innovation Gap, HIMT 455, Prof. Hughes, March, 2007
According to the Bain study [7], during 2000-2002, it took 13 candidates coming out of pre-clinical trials to push 1 product to final launch whereas between 1995 and 2002, only 8preclinical candidates were required on average to yield one successful drug. Thecumulative success rate (probability) of making it successfully across the clinical trialshave decreased from the historical 14% to 8% in 2000 2002. Moreover, since the analysiswas, Failure rates in clinical trials have increased. (Bain model 2003)
18

Roots Causes of the Innovation Gap
Source: The Innovation Gap, HIMT 455, Prof. Hughes, March, 2007 19
1. Saturation of low hanging fruits.
Most of pharmaceutical research efforts have focused largely on four
major disease areas: central nervous system, cancer, cardiovascular and
infectious disease. Increasingly, it will have to search for products in
poorly understood and more complex therapeutic areas such as
autoimmune diseases and genitourinary conditions.
“Most of the easy wins have already been made…Now we are into moreindirect ways of treating diseases: stopping tumours from growing bypreventing their ability to get blood supply … These are much morecomplicated.”
Lars Rebien Sorenson, CEO of Norvo Nordisk, BusinessWorld 2004

Source: The Innovation Gap, HIMT 455, Prof. Hughes, March, 2007 20
2. Pharma Industry is in crises.
Aggregate industry portfolio is much riskier than in the previousdecade. They estimate that in 1990 a typical target indevelopment had ~100 scientific citations while in 1999, anaverage drug candidate had only 8 scientific citations.
3. Pharma growth.
Pharma companies show that larger firms enjoyed betterproductivity overall due to economies of scope.
Roots Causes of the Innovation Gap – continued

Innovation Models for Pharma Industry
Source: The Innovation Gap, HIMT 455, Prof. Hughes, March, 2007 21
Diagrammatic depiction of the different models of innovation; the three inthe red box are emerging models at the horizon while the others have alreadybeen adopted by the industry.

Innovation Models for Pharma Industry
Source: The Innovation Gap, HIMT 455, Prof. Hughes, March, 2007 22
• Increased R&D spending: This strategy was implicit in the increasingR&D costs associated with each drug brought to market.
• Horizontal consolidation:1. economies of scale across the entire value chain, from R&D discovery
to sales.2. Expiring patents and enervated pipelines.
• Biotech In-licensing:i) There is no evidence that biotech can live up to the challenge.ii) Even if biotechnology firms can fill pharm’s pipelines, this will shift
the bargaining power and thus the value capture lever to thebiotechnology sector1.
New Innovation Models for Improving R&D Productivity
Source: The Innovation Gap, HIMT 455, Prof. Hughes, March, 2007 23
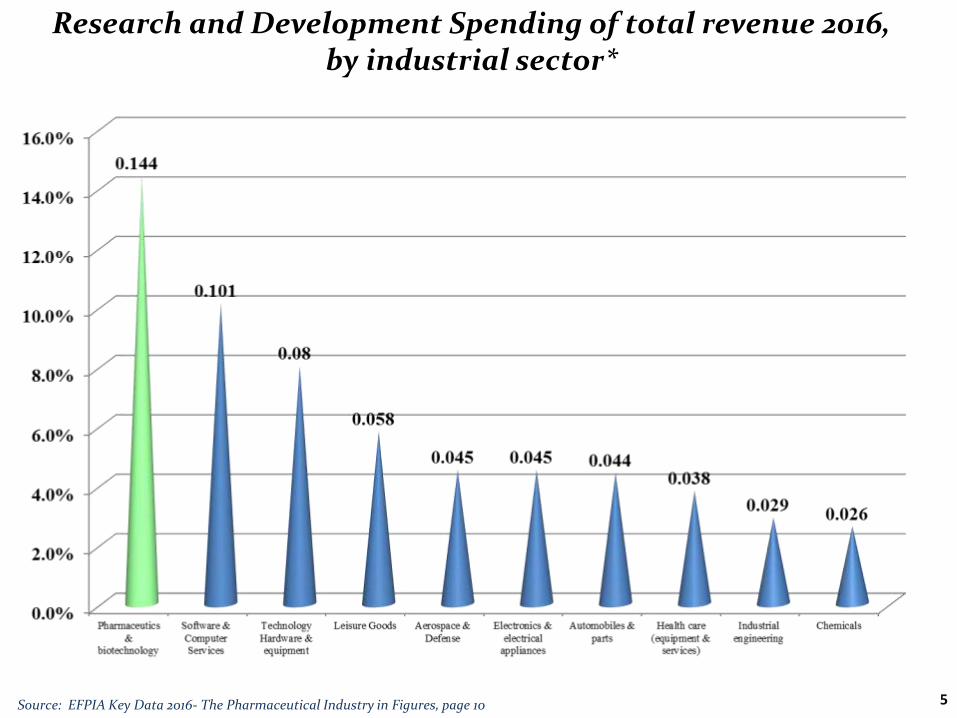
• Outsourcing
There are (4) major market segments in drug discovery: Chemistry, Biology, Screening, andlead-optimization.
The two areas growing fastest are: Lead-optimization and Biology (over 20%/year), andchemistry is growing 10%/year, Screening at 6%/year.
The overall market for outsourced drug discovery in 2005 was $4.1 billion, and is growing ata 15% rate to reach $7.2 billion in 2009.
Spending (in billion Dollar)
Year Discovery Clinical Total % Outsourced
1997 0 2 2 10 %
2001 2 5 7 24 %
2005 4 9 13 33 %
2009 7 17 24 41 %
Outsourced Drug Discovery & Development Expenditures by TypeDiscovery vs. Clinical Trials) 1997, 20012 2005, 2009

Cost of Developing an Innovative Medicine
https://www.forbes.com/sites/theapothecary/2014/11/26/crisis-in-pharma-rd-it-costs-2-6-billion-to-develop-a-new-medicine-2-5-times-more-than-in-2003/#7cad025d321c 24

Life Cycle of an Innovative Medicine
25

Evolution of Innovative Medicines
26

Origin of the 25 new chemical and biological entities in the world pharmaceutical market in 2011 - 2015
27Source: Statista , The Statistics Portal - http://www.statista.com
Number of new chemical or biological entities developed between 2011 and 2015, by
region of origin
nationally of mother company
0
10
20
30
40
50
60
70
80
90
Europe United States Japan Other
75
89
31 31

28
More than 7,000 Medicines in Development Globally - 2016
Biopharmaceutical researchers are working on new medicines for many diseases.
Source: Adis R&D Insight DatabaseDefined as single products which are counted exactly once regardless of the number of indicators pursued.http://chartpack.phrma.org/2016-perspective/chapter-2/more-than-7-000-medicines-in-development-globally

29
More than 900 Biologic Medicines in Development in 2013
Biologic medicines-large, complex molecules derived from living cells-frequently represent novel strategies that have the potential to transform the clinical treatment of disease.
Source: Chart Pack - Biopharmaceuticals in Perspective (2015

New Innovation Models for Improving R&D Productivity
Source: The Innovation Gap, HIMT 455, Prof. Hughes, March, 2007 30
• Open Source Innovation
The key attributes of open-source are sharing of information in a an incremental,cumulative fashion across companies, institutions, areas of expertise, andplatforms of research.
BENEFITS OF OPEN-
SOURCE
CREATIVITY
SPEED
RISK SHARING
IMPACT
AGILITY
AFFORDABILITY

Medicines exist (R&D to improve their utility for patients)
Medicines exist (R&D to overcome emerging challenges e.g. drug resistance)
No medicines (R&D to bridge the gap)
Source: IFPMA, The Value of Innovation 2008
Need for Continued Medicines Innovation
31
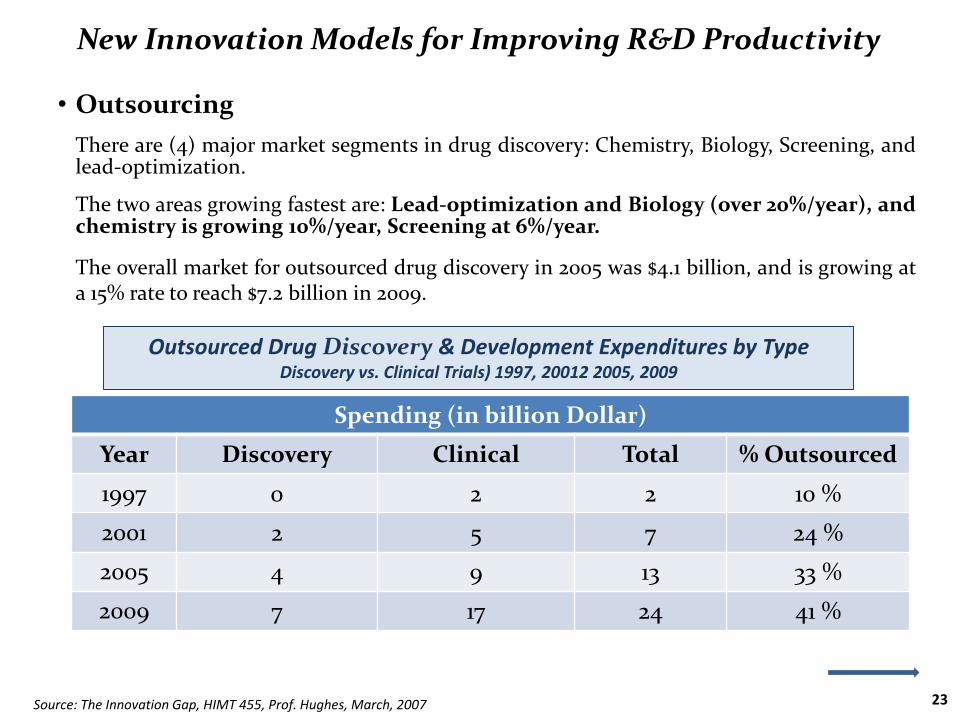
Barriers and Potential Solutions
Source: The Innovation Gap, HIMT 455, Prof. Hughes, March, 2007 32
1. Economic Barriers.
2.Coordination and Leadership Barriers
3. Regulation and Intellectual Property
4. Motivation and Availability of Talent

Open-source’s Potential for the Future
Source: The Innovation Gap, HIMT 455, Prof. Hughes, March, 2007 33
Certain areas such as tropical diseases have benefited from open-source initiatives,
but to apply the model more broadly would require substantial changes to how
healthcare is funded and perceived. It is not clear that open-source would be
substantially better than the innovation produced by traditional pharma, and
working outside of IP protection would do little to motivate investment in the
projects.

Source: Adapted from an ABPI Report (2004), The Human and Economic Value of Pharmaceutical Innovation and Opportunities for theNHS: Blood Pressure lowering treatment Trialists’ collaboration (2000) The Lancet. See also IFPMA: The Value of Innovation (2008) 34
Benefits of Innovative Medicines

35
Top five Pharma Companies (Rx Sales comparison 2013-2014)
Source: Evaluate Pharma, Evaluate Ltd. www.evaluate.com
2014

36Source: igeahub.com/2016

37

38
Top five Pharma Companies (R&D spend comparison 2013-2014)
Source: Evaluate Pharma, Evaluate Ltd. www.evaluate.com
39
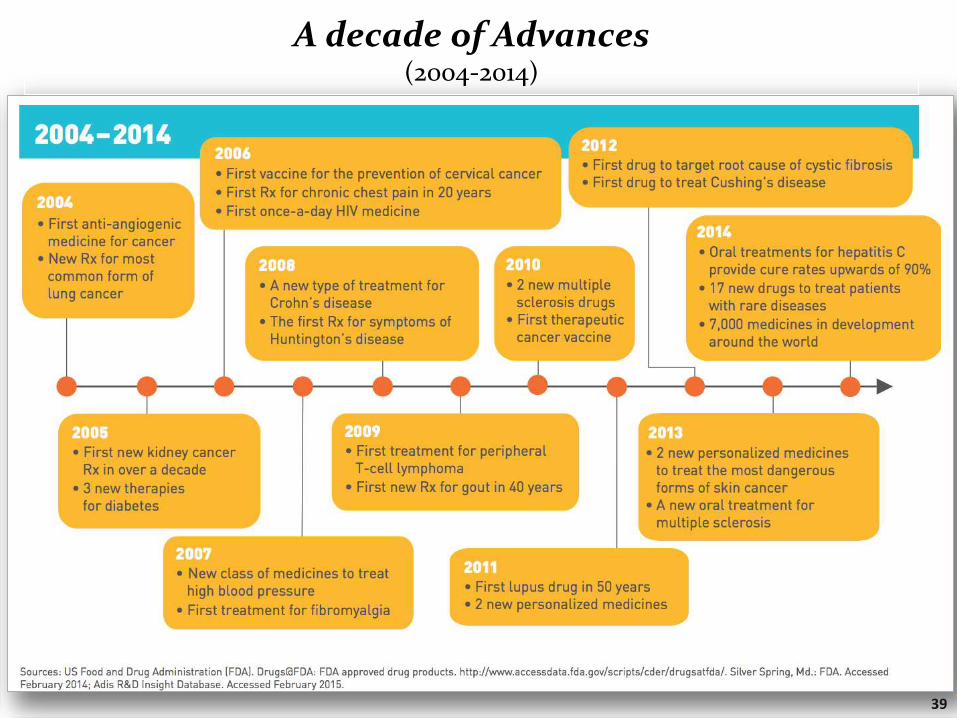
A decade of Advances(2004-2014)

40

41
HIV/AIDS: Treatment Advances Build Over Time
Dramatic declines in death rates did not occur with one single breakthrough, but ratherthrough a series of advances providing important treatment options for patients overtime.
Source: Boston HealthCare
1981AIDS first
reported
1984HIV identified as the cause of
AIDS
1991AZT labeling expanded for
dosing (IV) earlier use. & pediatric use
1995First protease
inhibitors approved
2001First
nucleotide analog
approved
2006Rates of
transmission from mother to
infant have dropped to less
than 2%.First one-pill-once-a-day treatment approved
2011US HHS
recommends earlier
irritation of treatment to control
immunologic response
2014US death rate has
dropped by nearly 85%
1987First treatment
(AZT) introduced (a nucleoside
analog reverse transcriptase
inhibitor)
1994(AZT) found to reduce the risk of transmission from mother to
infant
1996HAART
combinations introduced
2003First fusion inhibitors approved
2007First CCR-5 co-receptor
agonist approved
2012First approval of a medicine for exposure prophylaxis
(PrEP)
42
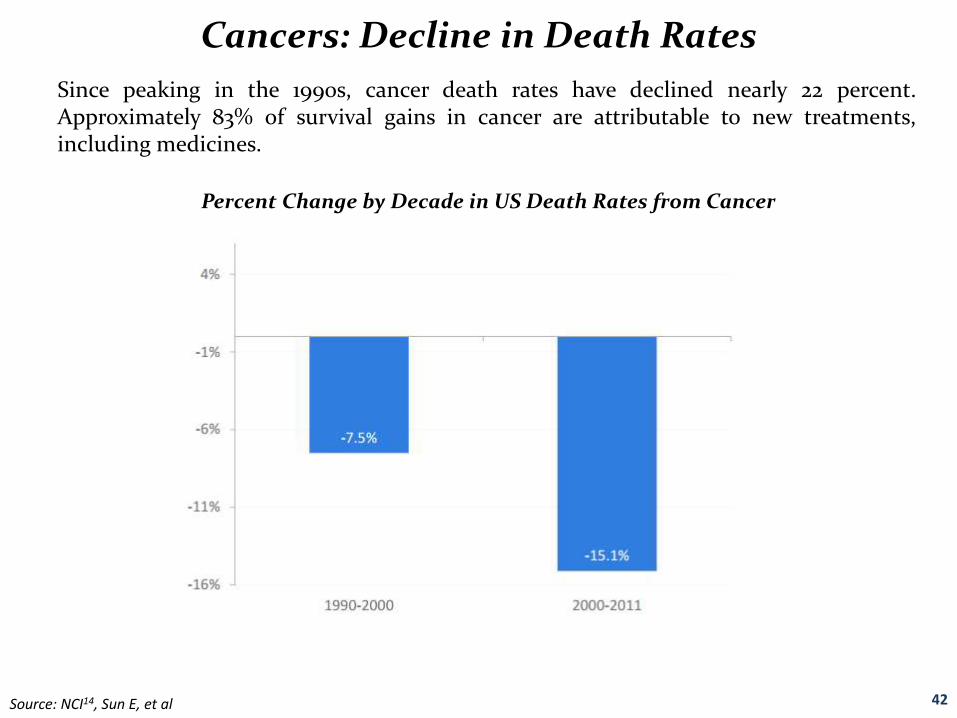
Cancers: Decline in Death Rates
Since peaking in the 1990s, cancer death rates have declined nearly 22 percent.Approximately 83% of survival gains in cancer are attributable to new treatments,including medicines.
Percent Change by Decade in US Death Rates from Cancer
Source: NCI14, Sun E, et al

43
Rare Diseases: Drug Approvals for Rare Diseases Have Increased
Rare diseases are those that affect 200,000 or fewer people in the United States.22 The FDAhas approved more than 500 orphan drugs since the passage of the Orphan Drug Act in 1983.
PhRMA Chart Packs 2016 ,http://chartpack.phrma.org/2016-perspective/chapter-1/rare-diseases-drug-approvals-for-rare-diseases-have-increased

44
Potential First – in – Class Medicines in the Pipeline
An average of 70% of drugs across the pipeline are potential first – in – class medicines.
Source: Analysis Group

45
Average lifetime Returns from Newly Introduced Medicines Have Declined in Recent Years
The R&D investments required to bring medicines to patients in the future rely on revenuesfrom existing approved innovative medicines. Continued declines in average lifetimerevenues from new medicines could reduce companies ability to maintain their historicallyhigh levels of innovation.
A medicine is defined as a novel active substance, ie, a molecular or biologic entity or combination product in which at least one element had not previously been approved by the Food and Drug Administration. Sales are global sales net of rebates and discounts.
Source: Berndt E, et al
Average Present Value of life time Sales of Medicines, by when they were introduced
46
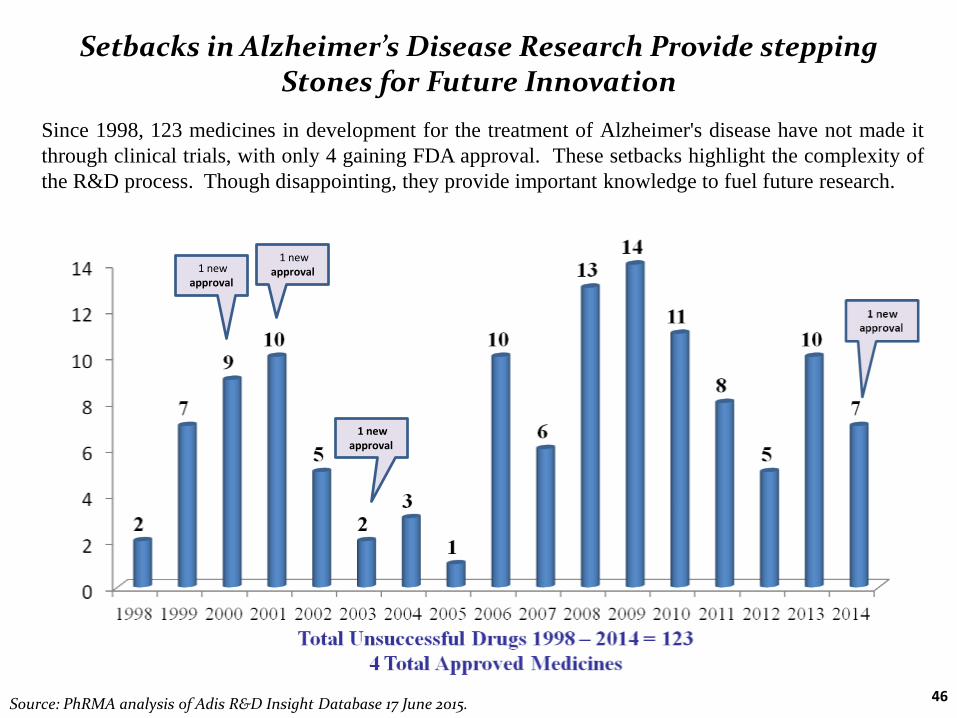
Setbacks in Alzheimer’s Disease Research Provide stepping Stones for Future Innovation
Since 1998, 123 medicines in development for the treatment of Alzheimer's disease have not made it
through clinical trials, with only 4 gaining FDA approval. These setbacks highlight the complexity of
the R&D process. Though disappointing, they provide important knowledge to fuel future research.
Source: PhRMA analysis of Adis R&D Insight Database 17 June 2015.
1 new approval1 new
approval
1 new approval

47
MELANOMA*
96 unsuccessful attempts
7 new drugs
BRAIN CANCER*
75 unsuccessful attempts
3 new drugs
LUNG CANCER*
167 unsuccessful attempts
10 new drugs
*Setbacks and advances from 1998-2014Source: PhRMA

Total Pharmaceutical Market in the Arab World 2009
Country Total Market (US$ million) Share of local companies % No. of Manufacturers
KSA 3,130 25% 17
Egypt 2,550 94% 85
Iraq 1,400 10% 10
UAE 762 20% 7
Algeria 1,345 48% 34
Morocco 1,174 93% 31
Syria 930 93% 62
Tunisia 655 48% 27
Yemen 626 15% 7
Libya 563 3.66% 1
Lebanon 470 12% 6
Sudan 406 49% 16
Jordan 386 29% 16
Kuwait 315 0% 1
Oman 235 10.50% 2
Qatar 170 0.0% 0
Bahrain 170 0.0% 0
Palestine 95 21% 5
Total 15,382 327
Source: AUPAM 48
49

Average consumption per Capita in the Arab World ($)
Source: AUPAM/2009 49

Average consumption per Capita in the Whole World ($) in 2009
Source: AUPAM 50
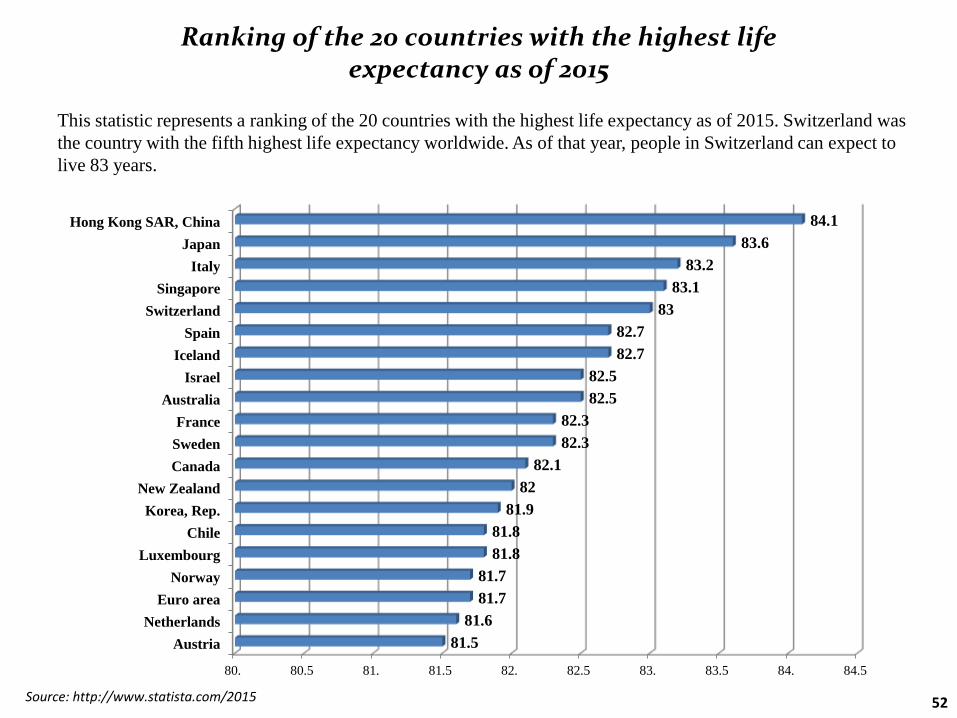
Ranking of the 20 countries with the highest life expectancy as of 2015
This statistic represents a ranking of the 20 countries with the highest life expectancy as of 2015. Switzerland was
the country with the fifth highest life expectancy worldwide. As of that year, people in Switzerland can expect to
live 83 years.
Source: http://www.statista.com/2015 52
80. 80.5 81. 81.5 82. 82.5 83. 83.5 84. 84.5
Austria
Netherlands
Euro area
Norway
Luxembourg
Chile
Korea, Rep.
New Zealand
Canada
Sweden
France
Australia
Israel
Iceland
Spain
Switzerland
Singapore
Italy
Japan
Hong Kong SAR, China
81.5
81.6
81.7
81.7
81.8
81.8
81.9
82
82.1
82.3
82.3
82.5
82.5
82.7
82.7
83
83.1
83.2
83.6
84.1

Ranking of the 20 countries with the lowest life expectancy as of 2015
This statistic shows a ranking of 20 countries with the lowest life expectancy for people born as of 2015. People who were born in Guinea-Bissau that year had a life expectancy of about 55.5 years. As it can be seen, Africa includes the countries with the shortest life expectancy worldwide.
Source: http://www.statista.com/2015 53
48.9
50
51.3
51.4
51.9
51.9
52.7
53
55.4
55.5
55.7
55.9
56.1
57.1
57.4
58
58.5
58.9
59
59.2
0. 10. 20. 30. 40. 50. 60. 70.
Swaziland
Lesotho
Sierra Leone
Central African Republic
Chad
Cote d'Ivoire
Angola
Nigeria
Mozambique
Guinea-Bissau
Somalia
Cameroon
South Sudan
Burundi
South Africa
Equatorial Guinea
Mali
Burkina Faso
DR Congo
Zimbabwe
data

Life Expectancy for Countries in the arab world, 2014 - 2015
https://www.infoplease.com/world/health-and-social-statistics/life-expectancy-countries-2015 54
65.18
73.7
74.35
74.69
74.85
74.87
75.05
75.21
75.89
76.26
76.59
76.71
77.29
77.4
77.82
78.59
78.73
0 10 20 30 40 50 60 70 80 90
Yemen
Egypt
Jordan
Syria
Iraq
Gaza Strip
Saudi Arabia
Oman
Tunisia
Libya
Algeria
Morocco
United Arab Emirates
Lebanon
Kuwait
Qatar
Bahrain

Source: the Impact of ageing on public expenditure: projections for the EU25 Member States on pensions, health care, long term care, education and unemployment transfers (2004-2050), European Commission 2006
Source: http://www.statista.com/ 55
Impact of Ageing on Public Expenditure

Healthcare Tomorrow: Summary
• Research and development of new medicines offers an ageing population hope ofa longer healthy life, well beyond that of previous generations. For example,there are currently nearly 900 medicines in development to combat cancer, 300for two of the leading causes of death heart disease and stroke, and 235 fordiabetes and related conditions.
• Research based pharmaceutical companies are the engines of medicinesinnovation. They have discovered and developed over 90% of all new medicinesmade available to patients worldwide over the last twenty years.
• The discovery, development, testing and gaining of regulatory approval for newmedicines has become an even more highly complex, lengthy, risky andexpensive process. Each success is built on many, many prior failures. On averageonly one or two of every 10,000 promising molecules will successfully passextensive tests and stringent regulatory requirements and go on to be approvedas medicines, which are suitable for use in patients. The cost of researching anddeveloping a new medicine has gone from €149 million in 1975 to almost €1.4billion today.
56

• It takes an average of 12 to 15 years to develop a new medicine from the time it isdiscovered to when it passes the regulatory standards of safety, quality andefficacy and is available to patients. Once on the market the average medicinehas only 8 to 10 years of effective patent protection remaining before facinggeneric competition. Only three out of ten marketed medicines producerevenues that match or exceed their R&D costs before they lose patentprotection.
• The European pharmaceutical industry employs over 115,000 people in R&D at atotal cost of over €27.4 billion3.
• Innovation is central to the creation of the knowledge based economy of the 21stcentury. In Ireland pharmaceutical industry R&D is responsible for 20% of allbusiness R&D.
• If innovation is to flourish then it must be rewarded. In addition to escalatingR&D costs and regulatory issues, the austerity measures introduced by EUcountries is impacting on the sector.
• Emerging economies such as Brazil, China and India are experiencing rapidgrowth in both the market and research environments, which is leading to anincreasing number of pharmaceutical companies, including European ones,deciding to locate new R&D facilities outside Europe
Healthcare Tomorrow: Summary
57

58

59

ICIDInitiate, Create
Innovate, Disseminate
For Listening
my motto :


![[XLS] · Web viewABB CH Healthcare Pharmaceuticals & Biotechnology Pharmaceuticals Abbott Laboratories ES Construction & Materials Heavy Construction ABERCROMBIE & FITCH 'A' Apparel](https://img.dokumen.tips/doc/110x75/5aa532b17f8b9a185d8d0034/xls-viewabb-ch-healthcare-pharmaceuticals-biotechnology-pharmaceuticals-abbott.jpg)