Embed Size (px)
Citation preview

Research ArticleUtilization of Crude Glycerol as a Substrate for the Productionof Rhamnolipid by Pseudomonas aeruginosa
Walaa A. Eraqi,1 Aymen S. Yassin,1 Amal E. Ali,1,2 and Magdy A. Amin1
1Department of Microbiology and Immunology, Faculty of Pharmacy, Cairo University, Cairo 11562, Egypt2Department of Pharmaceutical Microbiology, Faculty of Pharmaceutical Sciences and Pharmaceutical Industries,Future University, Cairo 11787, Egypt
Correspondence should be addressed to Aymen S. Yassin; [email protected]
Received 2 November 2015; Revised 13 December 2015; Accepted 15 December 2015
Academic Editor: Manuel Canovas
Copyright © 2016 Walaa A. Eraqi et al.This is an open access article distributed under the Creative Commons Attribution License,which permits unrestricted use, distribution, and reproduction in any medium, provided the original work is properly cited.
Biosurfactants are produced by bacteria or yeast utilizing different substrates as sugars, glycerol, or oils. They have importantapplications in the detergent, oil, and pharmaceutical industries. Glycerol is the product of biodiesel industry and the existingglycerol market cannot accommodate the excess amounts generated; consequently, new markets for refined glycerol need to bedeveloped.The aim of present work is to optimize the production ofmicrobial rhamnolipid usingwaste glycerol.We have developeda process for the production of rhamnolipid biosurfactants using glycerol as the sole carbon source by a local Pseudomonasaeruginosa isolate that was obtained from an extensive screening program.A factorial designwas appliedwith the goal of optimizingthe rhamnolipid production. The highest production yield was obtained after 2 days when cells were grown in minimal salt mediaat pH 6, containing 1% (v/v) glycerol and 2% (w/v) sodium nitrate as nitrogen source, at 37∘C and at 180 rpm, and reached2.164 g/L after 54 hours (0.04 g/L h). Analysis of the produced rhamnolipids by TLC, HPLC, and FTIR confirmed the nature ofthe biosurfactant as monorhamnolipid. Glycerol can serve as a source for the production of rhamnolipid from microbial isolatesproviding a cheap and reliable substrate.
1. Introduction
Biosurfactants are surface active compounds produced bymicroorganisms. They are also known as microbial surfaceactive compounds (SACs). There are many types of biosur-factants based on their chemical composition such as gly-colipids, lipopolysaccharides, oligosaccharides, and lipopep-tides that have been reported to be produced by diversebacterial genera [1, 2]. The best-studied biosurfactants areglycolipids, such as rhamnolipids produced by Pseudomonas,sophorolipids produced by different species of the yeastCandida (formerly Torulopsis), cell-bound trehalose lipidsproduced by Rhodococcus and other Actinomycetes, and avariety of structurally different lipopeptides produced byseveral Bacillus species [3–5].
Biosurfactants are receiving an increasing attention dueto their potential commercial and environmental applicationsas substitutes for synthetic surfactants. They exhibit highsurfactant and emulsifying activities and they are stable under
extreme chemicophysical conditions. Biosurfactants possessenvironmentally friendly characteristics such as low toxicityand high biodegradability [6–8]. Accordingly, public accep-tance is higher for microbial SACs than synthetic surfactants[9]. Biosurfactants have been used to enhance contaminantremoval in soil and water [10, 11]. They have also beenused in chemicophysical processes designed to remediatehydrocarbon or heavy metal contaminated sites [12]. Due totheir heterogeneity, microbial SACs display a broad range ofpotential applications in oil, agricultural, cosmetic, and foodindustries [9].
Despite the advantages and potential applicability of thesebiological compounds, the success of biosurfactants dependson the economy of the production process and the use oflow cost raw materials which account for the 10–30% ofthe overall costs [13, 14]. The utilization of waste glycerolis becoming very important, because the amount of wastehas been increasing year by year through the increasingproduction of biodiesel and other oleochemicals [15]. On
Hindawi Publishing CorporationBiotechnology Research InternationalVolume 2016, Article ID 3464509, 9 pageshttp://dx.doi.org/10.1155/2016/3464509

2 Biotechnology Research International
the other hand, glycerol is successfully used as the water-soluble carbon source for different microbial productions[16, 17].
The aim of the present work is to optimize the productionof rhamnolipids by Pseudomonas aeruginosa grown on wasteglycerol as a substrate, by studying the effects of contributingfactors individually and collectively and identifying the mostappropriate production conditions, and to characterize theproduced rhamnolipids.
2. Material and Methods
2.1. Enrichment and Isolation Procedure. A total of 20 dif-ferent strains were tested for rhamnolipid production afterbeing isolated from different samples obtained from oilpolluted surfaces andmachines at different gas stations (Giza,Egypt). Enrichment cultures were prepared in minimal saltmedium (MSM) supplemented with hydrophobic source assole carbon source (olive oil). Each sample was incubated for15 days with agitation 180 rpm at 30∘C; an aliquot of eachculture was serially diluted and streaked on brain heart agarplates. Colonies with different morphologies were isolated byrepeated streaking on the samemedium.Bacterial suspensionfor each isolate was prepared in 50mL MSM and incubatedovernight at 37∘C with shaking at 180 rpm. After adjustingthe OD to 0.5 McFarland, 1mL was inoculated in 250mLflasks containing 100mL MSM and left at 180 rpm at 30∘Cfor 5 days. An aliquot of 10mL was taken from each flask,centrifuged at 6,800×g rpm for 15min to remove bacterialcells, and the supernatant was screened for surface activitythrough three different tests. In addition, 20 previouslyidentified environmental isolates of P. aeruginosa were usedfor comparison.
2.2. Testing for Surface Activity
2.2.1. Oil Displacement Test. A volume of 15 𝜇L of crude oilwas placed on the surface of 40mL of distilled water placedin a petri dish, and a supernatant of 10𝜇L of each culture wasgently placed on the surface of the oil film. Diameter of theclear halo viewed under visible light was measured after 30 s[18].
2.2.2. EmulsificationActivity. Avolume of 3mLof xylenewasvortexed with 3mL of supernatant for 2min and allowed tosettle for 24 h, and then the emulsification index (𝐸
24) was
estimated as follows:
𝐸24=
ℎemulsionℎtotal× 100%, (1)
where ℎemulsion is the height of emulsion layer and ℎtotal is theheight of total liquid column.
2.2.3. Mineral Salt-CTAB-Methylene Blue Agar Plate Method.Shallow wells were cut into the surface of the indicator plateswith the heated point of a 10mL glass pipette. Ten microlitersof the appropriate culture was placed into each well. Theplates were then incubated at the proper temperature and
checked periodically over a 24 to 48 h time period. A positivereaction for rhamnolipid was the formation of a purple-bluehaze with a sharply defined edge around the culture well.After incubation, plates were placed at 4∘C for a few days.Thiscaused positive reactions to darken significantly and madeit possible to visualize weak positive reactions that were notapparent upon initial inspection [19].
2.3. Time Course of Rhamnolipid Production Using Glucoseand/or Glycerol as Sole Carbon Source. Fermentation wascarried out in MSM at 37∘C with shaking at 180 rpm fordifferent periods: 1, 2, 3, 4, and 5 days. Crude glycerol usedcontained 50% to 60% standard glycerol and was originallyobtained from biodiesel production (Tagadod Company,Egypt). Glycerol content in fermentation media was calcu-lated in terms of standard glycerol equivalent.
2.4. Optimization of Rhamnolipid Production from Glycerol.Optimization of various conditions for rhamnolipid produc-tion from glycerol was carried out for the promising isolate.Different factors were studied including nitrogen source(inorganic sources: sodium nitrate, ammonium nitrate andammonium sulphate, and organic source: urea), differentglycerol concentrations (0.5%, 1%, 2%, 3%, and 4%), pHvalues (4, 6, 7, 8, and 10), incubation temperature (30∘C,37∘C, and 42∘C), and effect of shaking rate (static condition:100 rpm, 180 rpm, and 250 rpm).
2.5. Quantitative Determination of Rhamnolipid. A volumeof 0.5mL of culture supernatant was extracted twice with1mL of diethyl ether. The ether fractions were pooled andevaporated to dryness and reconstituted in 0.5mL H
2O.
Samples were diluted 1/10 in a solution containing 0.19%orcinol in 53% H
2SO4. The sample was then placed in
boiling water for 30min and cooled at room temperature for15min, and the absorbance (𝐴
421) was measured [20]. The
rhamnolipid concentrations were calculated from standardcurves prepared with l-rhamnose and expressed as rhamnoseequivalents (RE) (mg/L).
2.6. Experimental Factorial Design. Full factorial two-leveldesign (24) was done with a total of 16 runs to evaluate theinfluence of independent factors and the possible interactionsbetween them against the dependent variable of the rhamno-lipid concentration. The statistical software package Minitab16, USA, was used to design the experiment and regressionanalysis of experimental data and in plotting relationshipbetween variables. The chosen variables in the two-levelforms were temperature (42∘C or 37∘C), rpm (100 or 180),pH value (6 or 7), and glycerol concentration (1% or 0.5%).High and low level of each factor were selected accordingto the results of the previous experiments based on theconventional change of one factor at a time. The main effectsof parameters on rhamnolipid production were estimated bysubtracting the mean responses of variables at their lowerlevels from their corresponding higher levels and dividingby the total number of experimental runs. The quality of fitof the first-order model was tested and the parameters with

Biotechnology Research International 3
statistically significant effects and interactions were identifiedusing Fisher’s test for the analysis of variance (ANOVA).
2.7. Isolation and Partial Purification of the Crude Rham-nolipid. Bacterial cells were first removed from the culturebroth by centrifugation at 6,800×g for 15min and then thesupernatant was acidified using conc. HCl to pH 2.0 andkept at 4∘C overnight. Rhamnolipids were then pelleted bycentrifugation at 12,000×g for 20min and transferred to aseparating funnel, extracted three times with a chloroform-ethanol (2 : 1 v/v) mixture with vigorous shaking, leaving thetwo layers to be separated in the funnel. The organic layerwas then evaporated in air leaving behind relatively purerhamnolipids having oil-like appearance [21].
2.8. Characterization of Partially Purified Rhamnolipid
2.8.1.Thin Layer Chromatography. Previously purified rham-nolipids were dissolved in chloroform and 10 𝜇L was appliedonto a TLC plate (silica gel 60, Sigma, USA) at a point oforigin near the bottom of the plate. Once dried, the plate wasdeveloped in solvent system of chloroform :methanol : aceticacid (6.5 : 1.5 : 0.2, v/v/v) [22]. When developed, the platewas removed and allowed to air-dry and then it was evenlysprayed with anthrone reagent, prepared by mixing 63mLof sulfuric acid, 25mL of water, and 0.125 g of anthroneunder ice conditions, and placed in an oven at 110∘C for20min.Upon visualization, the spot nearer the point of origincorresponded to the dirhamnolipids, while the spot furtherfrom the point of origin represented the monorhamnolipids.
2.8.2. Fourier Transform Infrared (FTIR) Spectrophotometer.The partially purified pellet was dissolved in water and theIR spectra were recorded on a FTIR spectrometer in the4000–400 cm−1 spectral region at a resolution of 2 cm−1.Comparisonwasmade to standard rhamnolipid R-95 (Sigma,USA).
2.8.3. High Performance Liquid Chromatography (HPLC).The partially purified pellet was redissolved in 1.5mL of ace-tonitrile (a content of approximately 0.1–1mM was achievedby appropriate dilution), 1mL of this solution was mixedwith 200𝜇L of the derivatization agent (1 : 1 (v/v) solutionof 40mM 4-bromophenacyl bromide and 20mM triethy-lamine in acetonitrile), and derivatization reaction took placeat 60∘C for 90min. Subsequently, the rhamnolipids wereseparated in a reverse phase C18 column (Supelcosil LC-18,Supelco/Sigma-Aldrich cooperation, Bellefonte, PA, USA) onan HPLC device (Young Lin Y9100, Korea) with a lineargradient of acetonitrile-water and finally detected by a UV-detector at 265 nm [23].
3. Results
3.1. Isolation and Testing of Strains. A total of 20 micro-bial strains were isolated that showed positive biosurfactantactivity using OST, 𝐸
24, and blood hemolysis tests. Prelim-
inary identification of the isolates indicated the diversity
of the biosurfactant producing strains as they includedgram negative rods of Pseudomonas and Klebsiella speciesand Bacillus and Candida. The isolate used in this studydisplayed the highest emulsification index and oil spreadingactivity among the whole collection and was identified asP. aeruginosa by 20 NE API system and was labeled as P.aeruginosa WAE. Accordingly, biosurfactant production ofthis isolate was compared with that of a collection of 20previously identified environmental isolates of P. aeruginosausing CTAB and the results showed that it still had thehighest activity. Therefore, the strain was selected for furtherinvestigations. The 16S rDNA gene sequencing showed thehighest similarity (89%) with P. aeruginosa DSM50071 16SrDNA sequence available at the NCBI database using BLASTserver (http://blast.ncbi.nlm.nih.gov/).
3.2. Examining the Role of Different Carbon Source. The pro-duction of rhamnolipid by P. aeruginosaWAE was comparedusing glucose or glycerol as the sole carbon source. Theproduced concentration of rhamnolipid was 1700mg/L and1400mg/L when using glucose or glycerol, respectively, indi-cating that glycerol can provide the fermentation mediumwith an adequate carbon source (Figure 1).
3.3. Optimization of Rhamnolipid Production fromGlycerol by P. aeruginosa WAE
3.3.1. Effect of Glycerol Concentration. The effect of differentglycerol concentration (0.5%, 1%, 2%, 3%, and 4%) on rham-nolipid production was evaluated; fermentation was done inMSM supplemented with 2% NaNO
3, pH 7, 180 rpm, and
37∘C.The results show that the highest levels of rhamnolipids(1350–1400mg/L) were achieved when using 0.5% or 1% glyc-erol after approximately 48 hours. Raising the concentrationof glycerol to 2%-3% led to a slight increase in the yield up to1450mg/L but after 96 hours. Additional increase in glycerolconcentration had an inhibitory effect as the production ofrhamnolipid diminished.
3.3.2. Effect of Nitrogen Source. The effects of different nitro-gen sources including sodium nitrate, ammonium nitrate,ammonium sulphate (inorganic nitrogen sources), and urea(organic nitrogen source) on rhamnolipid production weretested inMSMof pH 7with 1% glycerol incubated at 37∘C and180 rpm.Thehighest levelswere observedwhenusing sodiumnitrate after 48 hours (1359mg/L), followed by ammoniumnitrate after 4 days (792mg/L) and then urea in case of ureaafter 54 hours (630mg/L). The lowest production levels wereobserved when using ammonium sulphate even if after 96hours (Figure 2).
3.3.3. Effect of Temperature. Fermentation was done inMSM pH 7 supplemented with 1% glycerol and 2% NaNO
3
at 180 rpm and different temperatures (30∘C, 37∘C, and42∘C) were tested. The highest rhamnolipid concentration1892mg/mL was reached when fermentation was done at42∘C; lower values of 1402mg/L and 1015mg/L were obtainedat 37∘C and 30∘C, respectively (Figure 3).

4 Biotechnology Research International
10 20 30 40 50 60 70 80 90 100 110 1200Time (hrs)
0
500
1000
1500
2000
RE (m
g/L)
0
0.5
1
1.5
2
OD (0.1M glucose)RE (0.1M glycerol)
OD (0.1M glycerol)RE (0.1M glucose)
OD600
nm
Figure 1: Comparison between using 0.1M glycerol and 0.1Mglucose as the sole carbon source and their effects on OD andrhamnolipid production expressed as rhamnose equivalent (RE).
0
500
1000
1500
2000
RE (m
g/L)
24 48 72 96 1200Time (hrs)
UreaNa·NO3
AMM·NO3AMM·SO4
Figure 2: Effect of different nitrogen sources on rhamnolipidproduction expressed as rhamnose equivalent (RE).
3.3.4. Shaking Rate (Aeration). Fermentation was done inMSM pH 7 supplemented with 1% glycerol and 2% NaNO
3
at 37∘C and different shaking rates (100, 180, and 250) weretested and fermentation under static condition was tested.The results showed that fermentation at either 180 or 250 rpmgave almost relatively comparable productivity (1514mg/mLand 1406mg/mL, resp.) after 48 hours, while there wassignificant decrease in the rhamnolipid concentration to800mg/mL by decreasing the shaking rate to 100 rpm and71mg/mL at static condition (Figure 4).
3.3.5. Effect of pH. Fermentation was done in MSM sup-plemented with 1% glycerol and 2% NaNO
3at 180 rpm and
37∘C and different pH values (4, 6, 8, and 10) were tested.
1014.9
1406
1892.1
0
500
1000
1500
2000
RE (m
g/L)
30∘C
37∘C
Temp.Temp.Temp. 42∘C
24 48 72 96 1200Time (hrs)
Figure 3: Effect of different temperatures on rhamnolipid produc-tion expressed as rhamnose equivalent (RE).
Static condrpm 100
rpm 180rpm 250
0
500
1000
1500
2000
RE (m
g/L)
12 24 36 48 60 72 84 96 108 1200Time (hrs)
Figure 4: Effect of different shaking conditions on rhamnolipidproduction expressed as rhamnose equivalent (RE).
The highest yield was obtained when fermentation was doneat initial pH of 6 to reach rhamnolipid concentration of1977mg/L at 48 hours. Lower concentration was obtainedat pH 7 and pH 8 (1406mg/L and 818mg/L, resp.). Theconcentration of rhamnolipids was undetectable at both pH10 and pH 4.
3.3.6. Experimental Factorial Design. The effect of four vari-ables (glycerol conc., temperature, rate of agitation, and pH)and the possible interactions between themwere investigated
Biotechnology Research International 5
Table 1: The experimental conditions for all experiments and the corresponding rhamnolipid yield.
Run pH Glycerol conc. rpm Temp. RL. conc. mg/L1 −1 −1 −1 −1 430.12 −1 −1 −1 1 510.03 −1 −1 1 −1 1295.44 −1 −1 1 1 1108.45 −1 1 −1 −1 428.46 −1 1 −1 1 402.97 −1 1 1 −1 1722.18 −1 1 1 1 1912.49 1 −1 −1 −1 853.410 1 −1 −1 1 700.411 1 −1 1 −1 2075.712 1 −1 1 1 1822.413 1 1 −1 −1 302.614 1 1 −1 1 725.915 1 1 1 −1 2164.116 1 1 1 1 2023.0
by constructing a factorial design set of experiments usingMinitab version 16 and two values for each variable, a higherone and a lower one.The higher level and lower level for eachvariable were temperature (42∘C or 37∘C), rpm (100 or 180),pH value (6 or 7), and glycerol concentration (1% or 0.5%).The different combinations of variables for all experimentsand the corresponding rhamnolipid concentration are shownin Table 1. All runs were done at 54-hour interval. Highestrhamnolipid concentration was obtained in the 15th run atpH 6, 180 rpm, glycerol conc. 1%, and temp. 37∘C where allvariables were in their higher level except the temperaturewhich was in the lower level and reached 2164mg/L after 54hours.
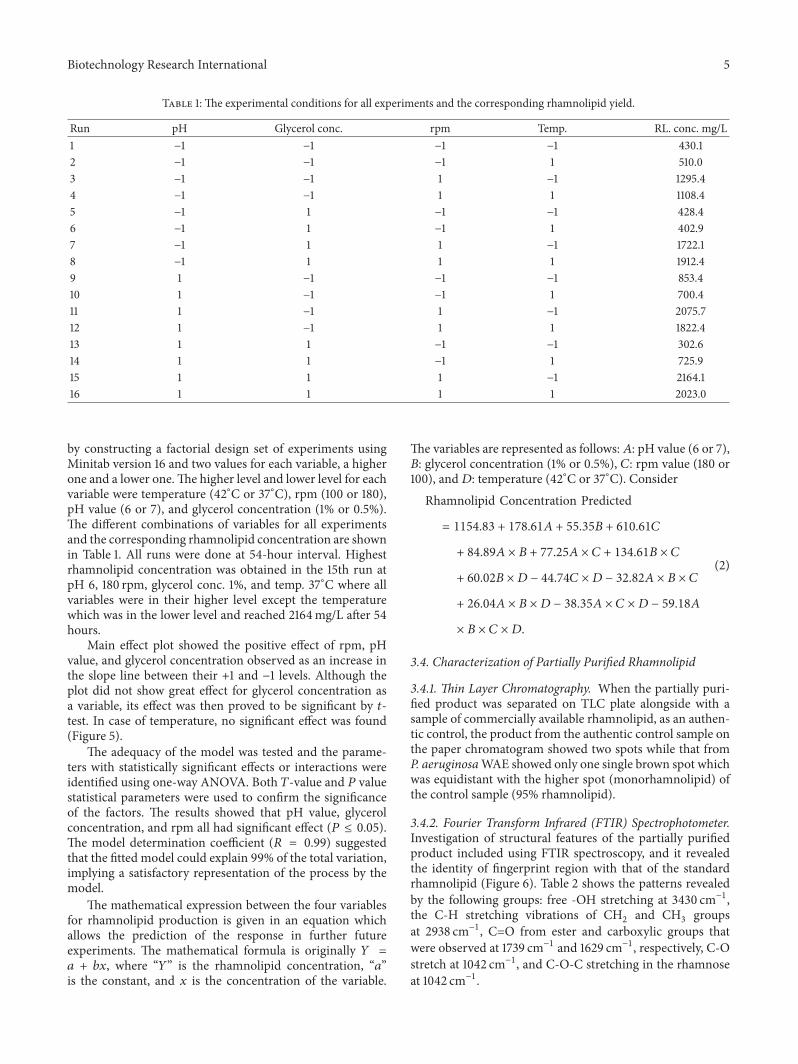
Main effect plot showed the positive effect of rpm, pHvalue, and glycerol concentration observed as an increase inthe slope line between their +1 and −1 levels. Although theplot did not show great effect for glycerol concentration asa variable, its effect was then proved to be significant by 𝑡-test. In case of temperature, no significant effect was found(Figure 5).
The adequacy of the model was tested and the parame-ters with statistically significant effects or interactions wereidentified using one-way ANOVA. Both 𝑇-value and 𝑃 valuestatistical parameters were used to confirm the significanceof the factors. The results showed that pH value, glycerolconcentration, and rpm all had significant effect (𝑃 ≤ 0.05).The model determination coefficient (𝑅 = 0.99) suggestedthat the fitted model could explain 99% of the total variation,implying a satisfactory representation of the process by themodel.
The mathematical expression between the four variablesfor rhamnolipid production is given in an equation whichallows the prediction of the response in further futureexperiments. The mathematical formula is originally 𝑌 =𝑎 + 𝑏𝑥, where “𝑌” is the rhamnolipid concentration, “𝑎”is the constant, and 𝑥 is the concentration of the variable.
The variables are represented as follows:𝐴: pH value (6 or 7),𝐵: glycerol concentration (1% or 0.5%), 𝐶: rpm value (180 or100), and𝐷: temperature (42∘C or 37∘C). Consider
Rhamnolipid Concentration Predicted
= 1154.83 + 178.61𝐴 + 55.35𝐵 + 610.61𝐶
+ 84.89𝐴 × 𝐵 + 77.25𝐴 × 𝐶 + 134.61𝐵 × 𝐶
+ 60.02𝐵 × 𝐷 − 44.74𝐶 × 𝐷 − 32.82𝐴 × 𝐵 × 𝐶
+ 26.04𝐴 × 𝐵 × 𝐷 − 38.35𝐴 × 𝐶 × 𝐷 − 59.18𝐴
× 𝐵 × 𝐶 × 𝐷.
(2)
3.4. Characterization of Partially Purified Rhamnolipid
3.4.1. Thin Layer Chromatography. When the partially puri-fied product was separated on TLC plate alongside with asample of commercially available rhamnolipid, as an authen-tic control, the product from the authentic control sample onthe paper chromatogram showed two spots while that fromP. aeruginosaWAE showed only one single brown spot whichwas equidistant with the higher spot (monorhamnolipid) ofthe control sample (95% rhamnolipid).
3.4.2. Fourier Transform Infrared (FTIR) Spectrophotometer.Investigation of structural features of the partially purifiedproduct included using FTIR spectroscopy, and it revealedthe identity of fingerprint region with that of the standardrhamnolipid (Figure 6). Table 2 shows the patterns revealedby the following groups: free -OH stretching at 3430 cm−1,the C-H stretching vibrations of CH
2and CH
3groups
at 2938 cm−1, C=O from ester and carboxylic groups thatwere observed at 1739 cm−1 and 1629 cm−1, respectively, C-Ostretch at 1042 cm−1, and C-O-C stretching in the rhamnoseat 1042 cm−1.

6 Biotechnology Research International
Data means
600
900
1200
1500
1800
Mea
n
1−1
(a)
Data means
600
900
1200
1500
1800
Mea
n
1.0−1.0
(b)Data means
600
900
1200
1500
1800
Mea
n
1−1
(c)
Data means
600
900
1200
1500
1800
Mea
n
1−1
(d)
Figure 5: Main effect of variables: (a) pH value, (b) glycerol concentration, (c) rpm value (180 or 100), and (d) temperature (42∘C or 37∘C).
4002000 100030004000
Wavenumber (cm−1)
103
94
96
98
100
102
T(%
)
1
2
3
45
67
8
9
10
11
(a)
400
1
2
34
5
67
8
9
1011
12
95
96
98
100
102
104
T(%
)
2000 100030004000
Wavenumber (cm−1)
(b)
Figure 6: FTIR spectrum of (a) standard rhamnolipid and (b) rhamnolipid produced by Pseudomonas aeruginosa.
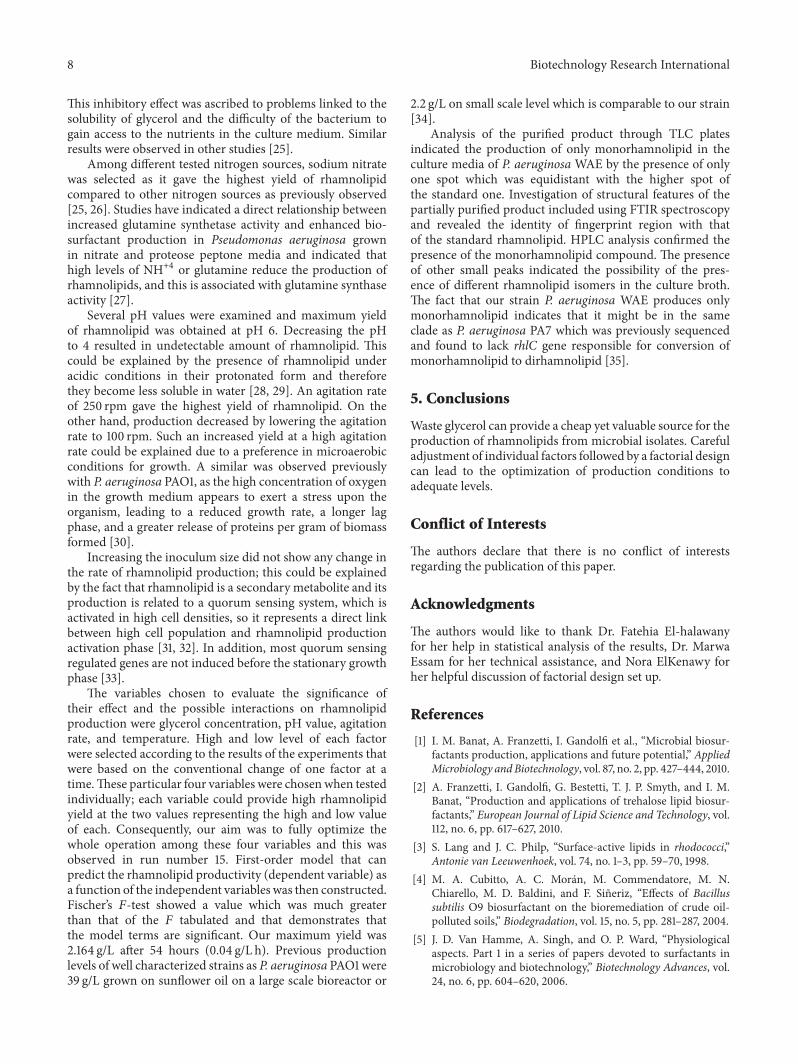
3.4.3. High Performance Liquid Chromatography. Two peaksin the chromatogram of the standard rhamnolipid at reten-tion time (9.38 and 12.12min) were assigned to monorham-nolipids and one peak at 20.02min was assigned to dirham-nolipid (Figure 7). The chromatogram of the tested samplealso had the two peaks at (9.52 and 12.32min), confirmingthe presence of monorhamnolipid compound and no peaksequivalent to dirhamnolipids were present. The presence ofother small peaks at 11.4, 13.3, and 20.2min showed thepossibility of the presence of different rhamnolipid isomers in
the culture broth.The two sharp peaks appearing at retentiontimes (1.3 and 2.9min) in the chromatograms of the standardand the sample were assigned to the derivatizing agents 2-bromoacetophenone and triethylamine as both appeared ina blank control with no sample or standard (data not shown).
4. Discussion
Microbial SACs are receiving an increasing attention dueto their potential commercial applications as substitutes for

Biotechnology Research International 7
Table 2: Characteristic absorption of rhamnolipid functional groups in infrared analysis.
Peak number Characteristic absorption(cm−1) Functional group
1 3430 Strong and broad bands of the hydroxyl group free (-OH) stretch due to hydrogenbonding
2 2938 The aliphatic bonds CH3
, CH2
, and C-H stretching3 2254 Unresolved4 1736 Carbonyl (C=O) stretching (ester)5 1629 Carbonyl (C=O) stretching (acidic)6 1462 The aliphatic C-H bending
7 1421 The presence of carboxylic acid functional group in the molecule was confirmed by thebending of the hydroxyl (O-H) at 1421 cm−1
8 1042 C-O-C stretching in the rhamnose9 915
Fingerprint region and it is identical with that of the standard rhamnolipid10 70311 61412 450
12.1
2 rh
amno
lipid
14.8
15.7
16.9
317
.32
17.9
818
.82
19.0
319
.58
20.0
2
21.4
8
23.0
8
25.8
3
27.1
3
7.85
8.15
8.70
9.38
11.4
8
13.1
013
.38
15.8
3
5.88 6.
23
1.28
–1.38
1.53
1.97
2.72
2.88
3.22
4.53
0
20
40
60
80
Com
pone
nts (
%)
5 10 15 20 25 300Time (min)
0.0
0.2
0.4
0.6
0.8
Volta
ge (m
V)
(a)
4.84 5.82
5.84
6.32
6.87
7.66 7.99 19
.21
19.4
720
.54
21.5
9
23.9
4
27.2
6 28.1
4
8.67
8.86 11
.69
13.3
113
.61
14.3
615
.12
15.9
916
.62
17.8
418
.59
9.52
1.39
2.92
1.79 1
.94
2.31 2.
74 3.57
12.3
2 rh
amno
lipid
0
20
40
60
80
Com
pone
nts (
%)
5 10 15 20 25 300Time (min)
0
100
200
300
400
Volta
ge (m
V)
(b)
Figure 7: Chromatograms of (a) standard rhamnolipid and (b) rhamnolipid produced by Pseudomonas aeruginosa WAE. The arrows referto monorhamnolipid (9.38, 12.12, in the standard sample, and 9.52, 12.32 in Pseudomonas aeruginosa WAE) and dirhamnolipids (20.02, instandard sample).
synthetic surfactants. Our goal in this work is to optimizethe production of rhamnolipids from a local strain grown onwaste glycerol obtained frombiodiesel industry as a substrate.
For the screening of biosurfactant producing microbes,enrichment cultures utilizing hydrophobic compounds as thesole carbon source are usually applied. Enrichment was doneusing minimal salt media supplemented with 2% olive oil.Isolates were collected from air, oil polluted surfaces, andhydrocarbon polluted soil.
For efficient detection of potential biosurfactant pro-ducers, combinations of various screening methods wererequired. Oil spreading test was recommended to be the sec-ondmost suitable method after surface tensionmeasurementin primary screening [24]. The oil spreading technique had alarger dynamic range than surface tension. It was also easyto perform and to standardize and was less time-consumingthan surface tension measurements. One of the isolates, lateridentified as P. aeruginosa WAE, had the most potent emul-sification activity and was chosen for further investigation.The high productivity of rhamnolipid by the selected isolate
compared to all other isolates was further confirmed by theCTAB assay.
Substitution of glucose in the culture medium by glycerolas a sole carbon source had no dramatic effect on the growthas well as rhamnolipid productivity.There was a little delay inthe growth in case of using glycerol and since rhamnolipidsare typical secondary metabolites, a corresponding delay inthe rhamnolipid production was also observed. Adjustmentof culture aeration, temperature, and pH increased the rham-nolipid production from glycerol to reach about 2 g/L whichexceeded the level of production from glucose, providingstrong evidence that waste glycerol from biodiesel industrycould be economically utilized as a substrate for rhamnolipidproduction.
Upon studying the effect of variable concentrations ofglycerol, as a sole carbon source, our results showed thatthe maximum yield of rhamnolipid (g/L) was reached usingglycerol concentrations from 1 to 3%. Increasing glycerol con-centration above 3% was accompanied by an inhibitory effecton microbial growth and the production of biosurfactants.
8 Biotechnology Research International
This inhibitory effect was ascribed to problems linked to thesolubility of glycerol and the difficulty of the bacterium togain access to the nutrients in the culture medium. Similarresults were observed in other studies [25].
Among different tested nitrogen sources, sodium nitratewas selected as it gave the highest yield of rhamnolipidcompared to other nitrogen sources as previously observed[25, 26]. Studies have indicated a direct relationship betweenincreased glutamine synthetase activity and enhanced bio-surfactant production in Pseudomonas aeruginosa grownin nitrate and proteose peptone media and indicated thathigh levels of NH+4 or glutamine reduce the production ofrhamnolipids, and this is associated with glutamine synthaseactivity [27].
Several pH values were examined and maximum yieldof rhamnolipid was obtained at pH 6. Decreasing the pHto 4 resulted in undetectable amount of rhamnolipid. Thiscould be explained by the presence of rhamnolipid underacidic conditions in their protonated form and thereforethey become less soluble in water [28, 29]. An agitation rateof 250 rpm gave the highest yield of rhamnolipid. On theother hand, production decreased by lowering the agitationrate to 100 rpm. Such an increased yield at a high agitationrate could be explained due to a preference in microaerobicconditions for growth. A similar was observed previouslywith P. aeruginosa PAO1, as the high concentration of oxygenin the growth medium appears to exert a stress upon theorganism, leading to a reduced growth rate, a longer lagphase, and a greater release of proteins per gram of biomassformed [30].
Increasing the inoculum size did not show any change inthe rate of rhamnolipid production; this could be explainedby the fact that rhamnolipid is a secondary metabolite and itsproduction is related to a quorum sensing system, which isactivated in high cell densities, so it represents a direct linkbetween high cell population and rhamnolipid productionactivation phase [31, 32]. In addition, most quorum sensingregulated genes are not induced before the stationary growthphase [33].
The variables chosen to evaluate the significance oftheir effect and the possible interactions on rhamnolipidproduction were glycerol concentration, pH value, agitationrate, and temperature. High and low level of each factorwere selected according to the results of the experiments thatwere based on the conventional change of one factor at atime.These particular four variables were chosenwhen testedindividually; each variable could provide high rhamnolipidyield at the two values representing the high and low valueof each. Consequently, our aim was to fully optimize thewhole operation among these four variables and this wasobserved in run number 15. First-order model that canpredict the rhamnolipid productivity (dependent variable) asa function of the independent variables was then constructed.Fischer’s 𝐹-test showed a value which was much greaterthan that of the 𝐹 tabulated and that demonstrates thatthe model terms are significant. Our maximum yield was2.164 g/L after 54 hours (0.04 g/L h). Previous productionlevels of well characterized strains as P. aeruginosa PAO1 were39 g/L grown on sunflower oil on a large scale bioreactor or
2.2 g/L on small scale level which is comparable to our strain[34].
Analysis of the purified product through TLC platesindicated the production of only monorhamnolipid in theculture media of P. aeruginosa WAE by the presence of onlyone spot which was equidistant with the higher spot ofthe standard one. Investigation of structural features of thepartially purified product included using FTIR spectroscopyand revealed the identity of fingerprint region with thatof the standard rhamnolipid. HPLC analysis confirmed thepresence of the monorhamnolipid compound. The presenceof other small peaks indicated the possibility of the pres-ence of different rhamnolipid isomers in the culture broth.The fact that our strain P. aeruginosa WAE produces onlymonorhamnolipid indicates that it might be in the sameclade as P. aeruginosa PA7 which was previously sequencedand found to lack rhlC gene responsible for conversion ofmonorhamnolipid to dirhamnolipid [35].
5. Conclusions
Waste glycerol can provide a cheap yet valuable source for theproduction of rhamnolipids from microbial isolates. Carefuladjustment of individual factors followed by a factorial designcan lead to the optimization of production conditions toadequate levels.
Conflict of Interests
The authors declare that there is no conflict of interestsregarding the publication of this paper.
Acknowledgments
The authors would like to thank Dr. Fatehia El-halawanyfor her help in statistical analysis of the results, Dr. MarwaEssam for her technical assistance, and Nora ElKenawy forher helpful discussion of factorial design set up.
References
[1] I. M. Banat, A. Franzetti, I. Gandolfi et al., “Microbial biosur-factants production, applications and future potential,” AppliedMicrobiology andBiotechnology, vol. 87, no. 2, pp. 427–444, 2010.
[2] A. Franzetti, I. Gandolfi, G. Bestetti, T. J. P. Smyth, and I. M.Banat, “Production and applications of trehalose lipid biosur-factants,” European Journal of Lipid Science and Technology, vol.112, no. 6, pp. 617–627, 2010.
[3] S. Lang and J. C. Philp, “Surface-active lipids in rhodococci,”Antonie van Leeuwenhoek, vol. 74, no. 1–3, pp. 59–70, 1998.
[4] M. A. Cubitto, A. C. Moran, M. Commendatore, M. N.Chiarello, M. D. Baldini, and F. Sineriz, “Effects of Bacillussubtilis O9 biosurfactant on the bioremediation of crude oil-polluted soils,” Biodegradation, vol. 15, no. 5, pp. 281–287, 2004.
[5] J. D. Van Hamme, A. Singh, and O. P. Ward, “Physiologicalaspects. Part 1 in a series of papers devoted to surfactants inmicrobiology and biotechnology,” Biotechnology Advances, vol.24, no. 6, pp. 604–620, 2006.

Biotechnology Research International 9
[6] S. G. Kiran, A. T. Thomas, J. Selvin, B. Sabarathnam, andA. P. Lipton, “Optimization and characterization of a newlipopeptide biosurfactant produced by marine Brevibacteriumaureum MSA13 in solid state culture,” Bioresource Technology,vol. 101, no. 7, pp. 2389–2396, 2010.
[7] C. Sivapathasekaran, S. Mukherjee, A. Ray, A. Gupta, and R.Sen, “Artificial neural network modeling and genetic algorithmbased medium optimization for the improved production ofmarine biosurfactant,”Bioresource Technology, vol. 101, no. 8, pp.2884–2887, 2010.
[8] S. K. Satpute, I. M. Banat, P. K. Dhakephalkar, A. G. Ban-purkar, and B. A. Chopade, “Biosurfactants, bioemulsifiers andexopolysaccharides from marine microorganisms,” Biotechnol-ogy Advances, vol. 28, no. 4, pp. 436–450, 2010.
[9] I. M. Banat, R. S. Makkar, and S. S. Cameotra, “Potentialcommercial applications of microbial surfactants,” AppliedMicrobiology and Biotechnology, vol. 53, no. 5, pp. 495–508,2000.
[10] E. Z. Ron and E. Rosenberg, “Biosurfactants and oil bioremedi-ation,” Current Opinion in Biotechnology, vol. 13, no. 3, pp. 249–252, 2002.
[11] A. Franzetti, E. Tamburini, and I. M. Banat, “Applicationsof biological surface active compounds in remediation tech-nologies,” in Biosurfactants, R. Sen, Ed., vol. 672 of Advancesin Experimental Medicine and Biology, pp. 121–134, Springer,Berlin, Germany, 2010.
[12] C. N. Mulligan, “Environmental applications for biosurfac-tants,”Environmental Pollution, vol. 133, no. 2, pp. 183–198, 2005.
[13] J. P. Parra, J. Guinea, M. A. Manresa et al., “Effect of the carbonsource on biosurfactant production byPseudomonas aeruginosa44T1,” Journal of the American Chemical Society, vol. 66, pp. 141–145, 1989.
[14] S. Lang and D. Wullbrandt, “Rhamnose lipids—biosynthesis,microbial production and application potential,”AppliedMicro-biology and Biotechnology, vol. 51, no. 1, pp. 22–32, 1999.
[15] E. R. Easterling,W. T. French, R.Hernandez, andM. Licha, “Theeffect of glycerol as a sole and secondary substrate on the growthand fatty acid composition of Rhodotorula glutinis,”BioresourceTechnology, vol. 100, no. 1, pp. 356–361, 2009.
[16] Y. C. Sharma, B. Singh, and S. N. Upadhyay, “Advancements indevelopment and characterization of biodiesel: a review,” Fuel,vol. 87, no. 12, pp. 2355–2373, 2008.
[17] G. P. da Silva, M. Mack, and J. Contiero, “Glycerol: a promis-ing and abundant carbon source for industrial microbiology,”Biotechnology Advances, vol. 27, no. 1, pp. 30–39, 2009.
[18] M. Morikawa, H. Daido, T. Takao, S. Murata, Y. Shimonishi,and T. Imanaka, “A new lipopeptide biosurfactant produced byArthrobacter sp. strain MIS38,” Journal of Bacteriology, vol. 175,no. 20, pp. 6459–6466, 1993.
[19] I. Siegmund and F. Wagner, “New method for detecting rham-nolipids excreted by Pseudomonas species during growth onmineral agar,” Biotechnology Techniques, vol. 5, no. 4, pp. 265–268, 1991.
[20] A. K. Koch, O. Kappeli, A. Fiechter, and J. Reiser, “Hydrocarbonassimilation and biosurfactant production in Pseudomonasaeruginosamutants,” Journal of Bacteriology, vol. 173, no. 13, pp.4212–4219, 1991.
[21] Y.M. Zhang andR.M.Miller, “Enhanced octadecane dispersionand biodegradation by a Pseudomonas rhamnolipid surfactant(biosurfactant),” Applied and Environmental Microbiology, vol.58, no. 10, pp. 3276–3282, 1992.
[22] E. Deziel, F. Lepine, S. Milot, and R. Villemur, “Mass spec-trometrymonitoring of rhamnolipids from a growing culture ofPseudomonas aeruginosa strain 57RP,” Biochimica et BiophysicaActa (BBA)—Molecular and Cell Biology of Lipids, vol. 1485, no.2-3, pp. 145–152, 2000.
[23] F. Leitermann, C. Syldatk, and R. Hausmann, “Fast quantita-tive determination of microbial rhamnolipids from cultivationbroths by ATR-FTIR Spectroscopy,” Journal of Biological Engi-neering, vol. 2, article 13, 2008.
[24] R. S. Thavasi, S. Sharm, and S. Jayalakshmi, “Evaluation ofscreening methods for the isolation of biosurfactant producingmarine bacteria,” Journal of Petroleum&Environmental Biotech-nology, supplement 1, article 1, 2011.
[25] L. M. Santa-Anna, G. V. Sebastian, E. P. Menezes et al.,“Production of biosurfactants from Pseudomonas aeruginosaPA1 isolated in oil environments,” Brazilian Journal of ChemicalEngineering, vol. 19, no. 2, pp. 159–166, 2002.
[26] L. M. Prieto, M. Michelon, J. F. M. Burkert, S. J. Kalil, and C. A.V. Burkert, “The production of rhamnolipid by a Pseudomonasaeruginosa strain isolated from a southern coastal zone inBrazil,” Chemosphere, vol. 71, no. 9, pp. 1781–1785, 2008.
[27] C. N. Mulligan and B. F. Gibbs, “Correlation of nitrogenmetabolism with biosurfactant production by Pseudomonasaeruginosa,” Applied and Environmental Microbiology, vol. 55,no. 11, pp. 3016–3019, 1989.
[28] Y. Ishigami, Y. Gama, H. Nagahora, M. Yamaguchi, H. Naka-hara, andT. Kamata, “ThepH-sensitive conversion ofmolecularaggregates of rhamnolipid biosurfactant,”Chemistry Letters, vol.16, no. 5, pp. 763–766, 1987.
[29] T. Schenk, I. Schuphan, and B. Schmidt, “High-performanceliquid-chromatographic determination of the rhamnolipidsproduced by Pseudomonas aeruginosa,” Journal of Chromatog-raphy A, vol. 693, no. 1, pp. 7–13, 1995.
[30] W. Sabra, E.-J. Kim, and A.-P. Zeng, “Physiological responses ofPseudomonas aeruginosa PAO1 to oxidative stress in controlledmicroaerobic and aerobic cultures,” Microbiology, vol. 148, no.10, pp. 3195–3202, 2002.
[31] G. Medina, K. Juarez, B. Valderrama, and G. Soberon-Chavez,“Mechanism of Pseudomonas aeruginosa RhlR transcriptionalregulation of the rhlAB promoter,” Journal of Bacteriology, vol.185, no. 20, pp. 5976–5983, 2003.
[32] M. Aguirre-Ramırez, G. Medina, A. Gonzalez-Valdez, V.Grosso-Becerra, and G. Soberon-Chavez, “The Pseudomonasaeruginosa rmlBDAC operon, encoding dTDP-L-rhamnosebiosynthetic enzymes, is regulated by the quorum-sensingtranscriptional regulator RhlR and the alternative sigma factor𝜎𝑆,”Microbiology, vol. 158, no. 4, pp. 908–916, 2012.
[33] M. Schuster, C. P. Lostroh, T. Ogi, and E. P. Greenberg,“Identification, timing, and signal specificity of Pseudomonasaeruginosa quorum-controlled genes: a transcriptome analysis,”Journal of Bacteriology, vol. 185, no. 7, pp. 2066–2079, 2003.
[34] M. M. Muller, B. Hormann, C. Syldatk, and R. Hausmann,“Pseudomonas aeruginosa PAO1 as a model for rhamnolipidproduction in bioreactor systems,” Applied Microbiology andBiotechnology, vol. 87, no. 1, pp. 167–174, 2010.
[35] P. H. Roy, S. G. Tetu, A. Larouche et al., “Complete genomesequence of the multiresistant taxonomic outlier Pseudomonasaeruginosa PA7,” PLoS ONE, vol. 5, no. 1, Article ID e8842, 2010.

Submit your manuscripts athttp://www.hindawi.com
Hindawi Publishing Corporationhttp://www.hindawi.com Volume 2014
Anatomy Research International
PeptidesInternational Journal of
Hindawi Publishing Corporationhttp://www.hindawi.com Volume 2014
Hindawi Publishing Corporation http://www.hindawi.com
International Journal of
Volume 2014
Zoology
Hindawi Publishing Corporationhttp://www.hindawi.com Volume 2014
Molecular Biology International
GenomicsInternational Journal of
Hindawi Publishing Corporationhttp://www.hindawi.com Volume 2014
The Scientific World JournalHindawi Publishing Corporation http://www.hindawi.com Volume 2014
Hindawi Publishing Corporationhttp://www.hindawi.com Volume 2014
BioinformaticsAdvances in
Marine BiologyJournal of
Hindawi Publishing Corporationhttp://www.hindawi.com Volume 2014
Hindawi Publishing Corporationhttp://www.hindawi.com Volume 2014
Signal TransductionJournal of
Hindawi Publishing Corporationhttp://www.hindawi.com Volume 2014
BioMed Research International
Evolutionary BiologyInternational Journal of
Hindawi Publishing Corporationhttp://www.hindawi.com Volume 2014
Hindawi Publishing Corporationhttp://www.hindawi.com Volume 2014
Biochemistry Research International
ArchaeaHindawi Publishing Corporationhttp://www.hindawi.com Volume 2014
Hindawi Publishing Corporationhttp://www.hindawi.com Volume 2014
Genetics Research International
Hindawi Publishing Corporationhttp://www.hindawi.com Volume 2014
Advances in
Virolog y
Hindawi Publishing Corporationhttp://www.hindawi.com
Nucleic AcidsJournal of
Volume 2014
Stem CellsInternational
Hindawi Publishing Corporationhttp://www.hindawi.com Volume 2014
Hindawi Publishing Corporationhttp://www.hindawi.com Volume 2014
Enzyme Research
Hindawi Publishing Corporationhttp://www.hindawi.com Volume 2014
International Journal of
Microbiology