Embed Size (px)
Citation preview

Hindawi Publishing CorporationEvidence-Based Complementary and Alternative MedicineVolume 2013, Article ID 137871, 10 pageshttp://dx.doi.org/10.1155/2013/137871
Research ArticleInsoluble Fiber in Young Barley Leaf Suppressesthe Increment of Postprandial Blood Glucose Level byIncreasing the Digesta Viscosity
Akira Takano,1 Tomoyasu Kamiya,1 Hiroshi Tomozawa,1 Shiori Ueno,1
Masahito Tsubata,1 Motoya Ikeguchi,1 Kinya Takagaki,1 Ayaka Okushima,2 Yu Miyata,3
Shizuka Tamaru,3 Kazunari Tanaka,2 and Toru Takahashi4
1 Research and Development Division, Toyo Shinyaku Co. Ltd., 7-28 Yayoigaoka, Tosu-shi, Saga 841-0005, Japan2Graduate School of Human Health Science, University of Nagasaki, 1-1-1 Manabino, Nagayo-cho, Nishisonogi-gun,Nagasaki 851-2195, Japan
3Department of Nutritional Science, Faculty of Nursing and Nutrition, University of Nagasaki, 1-1-1 Manabino,Nagayo-cho, Nishisonogi-gun, Nagasaki 851-2195, Japan
4Graduate School of Human Environment Science, Fukuoka Women’s University, 1-1-1 Kasumigaoka, Higashi-ku,Fukuoka 813-0003, Japan
Correspondence should be addressed to Akira Takano; [email protected]
Received 26 July 2013; Revised 27 September 2013; Accepted 7 October 2013
Academic Editor: Anwarul Hassan Gilani
Copyright © 2013 Akira Takano et al. This is an open access article distributed under the Creative Commons Attribution License,which permits unrestricted use, distribution, and reproduction in any medium, provided the original work is properly cited.
Barley (Hordeum vulgare L.) is a well-known cereal plant. Young barley leaf is consumed as a popular green-colored drink, which isnamed “Aojiru” in Japan.We examined the effects of barley leaf powder (BLP) and insoluble fibers derived fromBLPonpostprandialblood glucose in rats and healthy Japanese volunteers. BLP and insoluble fibers derived from BLP suppressed the increment ofpostprandial blood glucose levels in rats (𝑃 < 0.01), and increased the viscosity of their digesta. The insoluble fibers present inBLP might play a role in controlling blood glucose level by increasing digesta viscosity. In human, BLP suppressed the incrementof postprandial blood glucose level only in those which exhibited higher blood glucose levels after meals (𝑃 < 0.01). BLP mightsuppress the increment of postprandial blood glucose level by increasing digesta viscosity in both of rats and humans who requireblood glucose monitoring.
1. Introduction
Barley (Hordeum vulgare L.) is a well-known cereal plant,which has been cultivated since ancient times as feed for live-stock [1, 2]. In Japan, Korea, andChina, barley is used in foodssuch as bread and cakes [3]. The consumption of a green-colored drink made from the powder of young barley leavesnamed “Aojiru” is also prevalent in Japan [1]. Recently, severalanimal studies have reported salutary effects accompanyingthe intake of barley leaves, including antiulcer, antioxidant,hypolipidemic, antidepressant, and antidiabetic effects [4–8]. Thus, young barley leaves or derivatives such as “Aojiru”
might serve as functional foods or supplements to supporthuman health.
Young barley leaf is rich in dietary insoluble fiber. Insol-uble fibers have various functions [9–11] and are known toincrease digesta viscosity in rats [9]. Previously, high digestaviscosity due to insoluble fibers was observed to suppressthe increment of postprandial blood glucose level in rats,by decreasing the self-diffusion of glucose in digesta in thelumen [11]. Hence, the insoluble fibers in young barley leavesmight serve to control blood glucose levels, as indicated inthat study [11]. However, young barley leaves also possesspolyphenols, including flavonoids, which are well-known

2 Evidence-Based Complementary and Alternative Medicine
antioxidants that prevent various diseases [2, 12]. Notably,lutonarin is the major compound in water extracts of youngbarley leaves [1].Thewater soluble substances in young barleyleaves may also possess functions regarding blood glucose.
In the present study, we used barley leaf powder (BLP),which is composed of young barley leaves via the harvestingof young barley leaves, followed by washing, drying, andpowdering, and examined the effects of BLP and the insolublefibers in BLP on postprandial blood glucose in rats andhealthy Japanese volunteers.
2. Materials and Methods
2.1. Materials. Barley leaf powder (BLP) was supplied byToyo Shinyaku Co., Ltd. (Saga, Japan). BLP is produced fromthe young leaf ofHordeum vulgare L. harvested before sprout-ing (the height: between 300 and 600mm), by washing,drying, and powdering.The color of BLP ranges from light todark-green. Unless otherwise noted, all employed chemicalswere of the purest grade and were obtained fromWako PureChemical Industries, Ltd. (Osaka, Japan).
2.2. Preparation of Soluble and Insoluble Fractions. Youngbarley leaves are rich in insoluble fiber and flavonoids, suchas saponarin and lutonarin, which are soluble in water andEtOH. In order to separate insoluble fiber from flavonoids,insoluble and soluble fractions were prepared from BLP viawater and ethanol extraction, with sonication and immersion(Figure 1 shows a detailed process flow). Twenty grams ofBLPwas suspended in 200mLof distilledwater. Sonication ofthis suspension followed by overnight immersion of the BLPat 4∘C was performed to extract the water-soluble fractionin water. After centrifugation (10,000 g, 10min, 4∘C), theprecipitant was resuspended in 200mL of distilled water.Thissuspension was then sonicated for 10 minutes and immersedfor 1 hour at room temperature. This sonication followed by1 hour immersion was repeated 4 times. After centrifugation,the precipitant was resuspended in 200mL of 60% ethanol.This ethanol suspension was then sonicated for 10 minutesand the precipitant was immersed overnight at 4∘C. Aftercentrifugation, the precipitant was resuspended in 200mL of60% ethanol, sonicated, and immersed for 1 hour at roomtemperature. This sonication followed by 1 hour immersionwas repeated 4 times, using a 60% ethanol solvent. Allsupernatants were concentrated via evaporation. After 60%ethanol extraction, the precipitant was freeze dried using vac-uum freeze-drying equipment (FDU-2100, Tokyo RikakikaiCo., Ltd.) and employed as the BLP insoluble fraction.The evaporated samples from the water and 60% ethanolextractions were mixed. This mixture was freeze dried usingvacuum freeze-drying equipment and employed as the BLPsoluble fraction. These fractions were used to elucidate theeffect of BLP on postprandial blood glucose, yielding theresults shown in Figure 3. The dietary fiber composition ofBLP and these fractions are described in Table 1.
2.3. Determination of Total Polyphenols. Total polyphenolsin 0.5 grams of BLP, the insoluble fraction, and the solublefraction were analyzed by Folin-Denis methods (reference
Water extraction (4 times)
60% EtOH extraction (4 times)
BLP
Soluble Insoluble
Soluble fraction Insoluble fraction
Soluble Insoluble
Figure 1: Preparation flow for the water-EtOH soluble and insolublefractions of BLP.
Table 1: Dietary fiber composition of BLP, soluble, and insolublefractions.
BLP Solublefraction
Insolublefraction
Soluble fiber (g/kg) 11 30 14Cellulose (g/kg) 209 6 278Hemicellulose (g/kg) 141 22 198Lignin (g/kg) 37 ND 47Total dietary fiber(g/kg) 398 58 537
ND: nondetected.
standard; chlorogenic acid, Sigma-Aldrich Co. LLC.) afterultrasound extraction for 15 minutes using 70% methanol.
2.4. Preparation of the Insoluble Fiber Rich Fraction. Unfor-tunately, the content of the insoluble fiber in the “insolublefraction” (see Section 2.2) was not particularly high (Table 1).Accordingly, we prepared a new fraction, named “insolublefiber rich fraction in BLP”, from BLP to increase the insolublefiber content. The insoluble fiber rich fraction in BLP wasprepared using modified EFRF methods [13]. Fifty grams ofBLP was suspended in 500mL of 0.1 N HCl containing 5 g ofpepsin. This suspension was incubated for 3 hours at 37∘C,followed by neutralization and heating for 10 minutes in aboiling water bath. After cooling, 20mL of a 1M phosphatebuffer (pH 7.0), 5 g of pancreatin, and 50mg of thymolcrystals, included to prevent microbial growth, were added tothe suspension.Thismixture was incubated at 37∘Covernightwith occasional stirring. The precipitate was collected viacentrifugation (10,000 g, 10min, 20∘C), washed twice with500mL of distilled water, and dried overnight at 105∘C. Thesamples were powdered using a mill mixer and filtratedthrough a 140mesh sieve.The resulting powderwas employedas the insoluble fiber rich fraction in BLP. The insolublefiber rich fraction was used to obtain the results shown inFigures 4, 5, and 6. The total dietary fiber contents of BLPand the insoluble fiber rich fraction are described in Table 2.
2.5. Determination of Dietary Fiber Content. The total dietaryfiber (TDF) content was analyzed, based on AOAC methods
Evidence-Based Complementary and Alternative Medicine 3
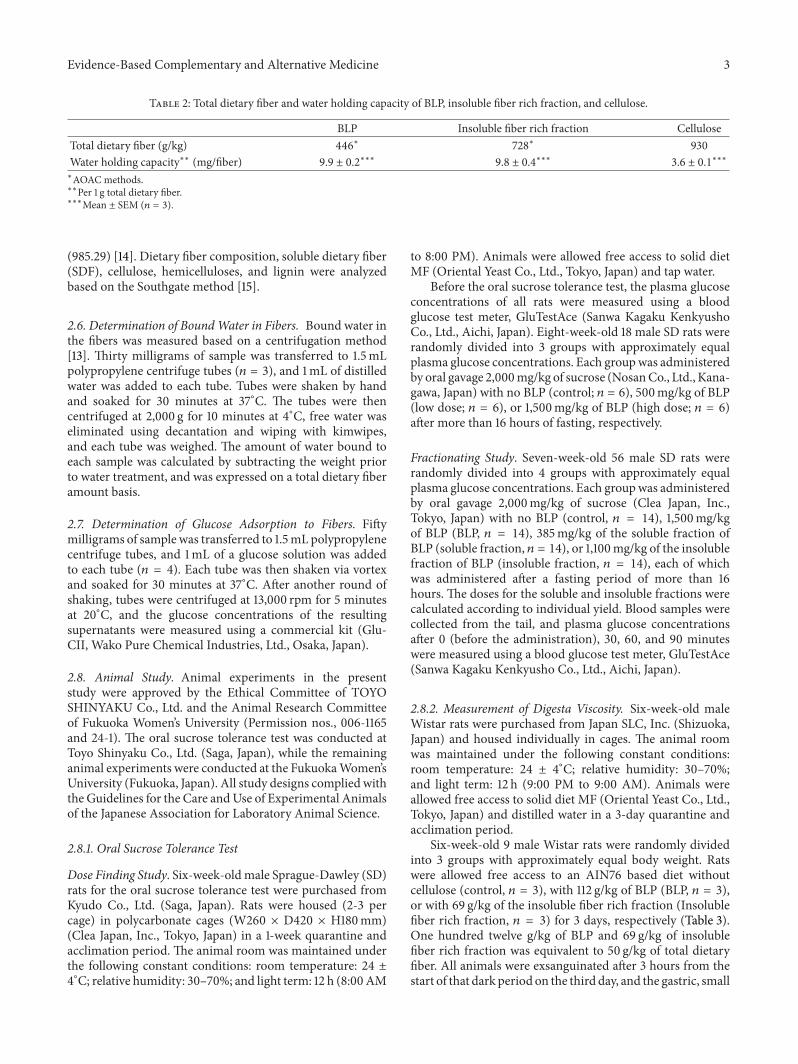
Table 2: Total dietary fiber and water holding capacity of BLP, insoluble fiber rich fraction, and cellulose.
BLP Insoluble fiber rich fraction CelluloseTotal dietary fiber (g/kg) 446∗ 728∗ 930Water holding capacity∗∗ (mg/fiber) 9.9 ± 0.2
∗∗∗
9.8 ± 0.4∗∗∗
3.6 ± 0.1∗∗∗
∗AOAC methods.∗∗Per 1 g total dietary fiber.∗∗∗Mean ± SEM (𝑛 = 3).
(985.29) [14]. Dietary fiber composition, soluble dietary fiber(SDF), cellulose, hemicelluloses, and lignin were analyzedbased on the Southgate method [15].
2.6. Determination of BoundWater in Fibers. Bound water inthe fibers was measured based on a centrifugation method[13]. Thirty milligrams of sample was transferred to 1.5mLpolypropylene centrifuge tubes (𝑛 = 3), and 1mL of distilledwater was added to each tube. Tubes were shaken by handand soaked for 30 minutes at 37∘C. The tubes were thencentrifuged at 2,000 g for 10 minutes at 4∘C, free water waseliminated using decantation and wiping with kimwipes,and each tube was weighed. The amount of water bound toeach sample was calculated by subtracting the weight priorto water treatment, and was expressed on a total dietary fiberamount basis.
2.7. Determination of Glucose Adsorption to Fibers. Fiftymilligrams of sample was transferred to 1.5mL polypropylenecentrifuge tubes, and 1mL of a glucose solution was addedto each tube (𝑛 = 4). Each tube was then shaken via vortexand soaked for 30 minutes at 37∘C. After another round ofshaking, tubes were centrifuged at 13,000 rpm for 5 minutesat 20∘C, and the glucose concentrations of the resultingsupernatants were measured using a commercial kit (Glu-CII, Wako Pure Chemical Industries, Ltd., Osaka, Japan).
2.8. Animal Study. Animal experiments in the presentstudy were approved by the Ethical Committee of TOYOSHINYAKU Co., Ltd. and the Animal Research Committeeof Fukuoka Women’s University (Permission nos., 006-1165and 24-1). The oral sucrose tolerance test was conducted atToyo Shinyaku Co., Ltd. (Saga, Japan), while the remaininganimal experiments were conducted at the FukuokaWomen’sUniversity (Fukuoka, Japan). All study designs complied withthe Guidelines for the Care andUse of Experimental Animalsof the Japanese Association for Laboratory Animal Science.
2.8.1. Oral Sucrose Tolerance Test
Dose Finding Study. Six-week-oldmale Sprague-Dawley (SD)rats for the oral sucrose tolerance test were purchased fromKyudo Co., Ltd. (Saga, Japan). Rats were housed (2-3 percage) in polycarbonate cages (W260 × D420 × H180mm)(Clea Japan, Inc., Tokyo, Japan) in a 1-week quarantine andacclimation period. The animal room was maintained underthe following constant conditions: room temperature: 24 ±4∘C; relative humidity: 30–70%; and light term: 12 h (8:00 AM
to 8:00 PM). Animals were allowed free access to solid dietMF (Oriental Yeast Co., Ltd., Tokyo, Japan) and tap water.
Before the oral sucrose tolerance test, the plasma glucoseconcentrations of all rats were measured using a bloodglucose test meter, GluTestAce (Sanwa Kagaku KenkyushoCo., Ltd., Aichi, Japan). Eight-week-old 18 male SD rats wererandomly divided into 3 groups with approximately equalplasma glucose concentrations. Each groupwas administeredby oral gavage 2,000mg/kg of sucrose (NosanCo., Ltd., Kana-gawa, Japan) with no BLP (control; 𝑛 = 6), 500mg/kg of BLP(low dose; 𝑛 = 6), or 1,500mg/kg of BLP (high dose; 𝑛 = 6)after more than 16 hours of fasting, respectively.
Fractionating Study. Seven-week-old 56 male SD rats wererandomly divided into 4 groups with approximately equalplasma glucose concentrations. Each groupwas administeredby oral gavage 2,000mg/kg of sucrose (Clea Japan, Inc.,Tokyo, Japan) with no BLP (control, 𝑛 = 14), 1,500mg/kgof BLP (BLP, 𝑛 = 14), 385mg/kg of the soluble fraction ofBLP (soluble fraction, 𝑛 = 14), or 1,100mg/kg of the insolublefraction of BLP (insoluble fraction, 𝑛 = 14), each of whichwas administered after a fasting period of more than 16hours. The doses for the soluble and insoluble fractions werecalculated according to individual yield. Blood samples werecollected from the tail, and plasma glucose concentrationsafter 0 (before the administration), 30, 60, and 90 minuteswere measured using a blood glucose test meter, GluTestAce(Sanwa Kagaku Kenkyusho Co., Ltd., Aichi, Japan).
2.8.2. Measurement of Digesta Viscosity. Six-week-old maleWistar rats were purchased from Japan SLC, Inc. (Shizuoka,Japan) and housed individually in cages. The animal roomwas maintained under the following constant conditions:room temperature: 24 ± 4∘C; relative humidity: 30–70%;and light term: 12 h (9:00 PM to 9:00 AM). Animals wereallowed free access to solid diet MF (Oriental Yeast Co., Ltd.,Tokyo, Japan) and distilled water in a 3-day quarantine andacclimation period.
Six-week-old 9 male Wistar rats were randomly dividedinto 3 groups with approximately equal body weight. Ratswere allowed free access to an AIN76 based diet withoutcellulose (control, 𝑛 = 3), with 112 g/kg of BLP (BLP, 𝑛 = 3),or with 69 g/kg of the insoluble fiber rich fraction (Insolublefiber rich fraction, 𝑛 = 3) for 3 days, respectively (Table 3).One hundred twelve g/kg of BLP and 69 g/kg of insolublefiber rich fraction was equivalent to 50 g/kg of total dietaryfiber. All animals were exsanguinated after 3 hours from thestart of that dark period on the third day, and the gastric, small

4 Evidence-Based Complementary and Alternative Medicine
Table 3: Diet composition of measurement of digesta viscositystudy.
Control BLP Insoluble fiber richfraction
Casein (g/kg) 200 200 200Cornstarch (g/kg) 150 150 150Sucrose (g/kg) 550 438 481DL-methionine (g/kg) 3.0 3.0 3.0Corn oil (g/kg) 50 50 50Choline bitartrate (g/kg) 2.0 2.0 2.0AIN mineral mixture(g/kg) 35 35 35
AIN vitamin mixture(g/kg) 10 10 10
BLP (g/kg) — 112 —Insoluble fiber rich fraction(g/kg) — — 69
intestinal, and cecal contents were collected. The coefficientsof viscosity of the gastric, small intestinal, and cecal contentsweremeasured using a digital cone-plate viscometer (HBDV-1 Prime) with a CPE-51 spindle cone (Brookfield EngineeringLaboratories, Massachusetts, USA).
2.8.3. Artificial Digesta for Infusion into the Small Intestine.We prepared 3 types of artificial digesta containing car-boxymethyl cellulose (Nacalai Tesque, Inc., Kyoto, Japan) and46 g/L of D-glucose in distilled water either containing noadditives (control group), or supplemented with BLP (BLPgroup) or the insoluble fiber rich fraction (insoluble fiber richfraction group). The total amount of D-glucose was com-pensated according to the density of each artificial digesta(control group, 1.017 g/mL; BLP group, 1.028 g/mL; insolublefiber rich fraction group, 1.038 g/mL) to yield the sameconcentration in all artificial digesta. Specific details of thecompounding ratio for each of the artificial digesta are asfollows: control: 43 g/L carboxymethyl cellulose and 46 g/LD-glucose; BLP: 38 g/L carboxymethyl cellulose, 46 g/L D-glucose, and 123 g/L BLP; and insoluble fiber: 40 g/L car-boxymethyl cellulose, 46 g/L D-glucose, and 79 g/L of theinsoluble fiber rich fraction.The viscosity of the small intesti-nal digesta of rats on AIN-76 based diets without cellulosewas in accord with that of the artificial digesta containing nofiber (control group).
2.8.4. Catheterization of the Small Intestine. Eleven six-week-old male Wistar rats were randomly divided into 3 groupswith approximately equal plasma glucose concentrations.Three types of artificial digestawere, respectively, infused intothe duodenum via an intestinal catheter, in order to eliminatethe effects of gastric emptying (control and insoluble fiberrich fraction, 𝑛 = 4; BLP, 𝑛 = 3). The rats were anesthetizedvia isoflurane inhalation through spontaneous respirationandmaintained under anesthesia throughout the experiment,after 24 hours of food deprivation. Via midline laparo-tomy, a 5mm incision was made on the greater curvature
of the stomach after ensuring hemostasis by ligation of theblood vessels on the stomachwall. A 40mm-long, small-boresilicon tube (i.d., 1.5mm; o.d., 2.5mm) was connected to a1.2m silicon tube with a slightly larger bore (i.d., 2.0mm;o.d., 4.0mm). The free end of the small-bore silicon tubewas inserted through the incision in the stomach wall andinto the duodenum through the pyloric sphincter, so thatroughly 10mm of the tube was placed in the duodenum. Toeliminate regurgitation of the artificial digesta, the tube wasthen fastened in the pylorus using 6–0 nylon monofilamenton a curved atraumatic needle (1/2-circle, 14mm; NatsumeSeisakusyo Co. Ltd.) and avoiding the larger blood vesselsof the stomach wall. The other end of the silicone tube wasexteriorized through the laparotomy. The incisions in thestomach and abdominal wall were closed with interrupted4–0 nylon monofilament sutures (Natsume Seisakusyo Co.Ltd.).
We infused the artificial digesta into the duodenum for5min at a rate of 0.4mL/min using a syringe pump (MSP-DT2, As One). The amounts of artificial digesta infused inthe control, BLP, and insoluble fiber rich fraction groups didnot differ between groups (𝑃 = 0.2; control: 2.19 ± 0.06mL;BLP: 1.96 ± 0.06mL; and insoluble fiber rich fraction: 1.83 ±0.17mL).
2.8.5. Catheterization Test. Blood was collected from thecaudal vein at 0, 15, 30, 45, 60, 90, and 120min after the startof artificial digesta infusion (postinfusion), using a heparin-treated capillary tube. The capillary tube was centrifugedto obtain plasma for measurement of the plasma glucoseconcentration (1,500 g, 15min). The plasma glucose concen-trations were measured using a commercial kit (Glu-CII,WakoPureChemical Industries, Ltd.,Osaka, Japan). For 0, 15,30, 45, and 60min, plasma insulin concentrations were alsomeasured using a Rat Insulin ELISA Kit (Morinaga Instituteof Biological Science, Inc.).
2.9. Clinical Study. The clinical study was approved by theInstitutional Review Board of the University of Nagasaki, inaccordance with ethical standards established in the HelsinkiDeclaration, and informed consent was obtained from allsubjects. This study was conducted at the University ofNagasaki (Nagasaki, Japan).
2.9.1. Subjects. Candidate subjects were male and femalehealthy volunteers, aged from 20 to 65 years, in theUniversityof Nagasaki (Nagasaki, Japan), who met the following selec-tion criteria:
(1) are in good health;(2) are able to abstain from drinking from the day prior
to the examination;(3) show a stable increase in blood glucose concentration
after a meal.Regarding criterion number 3, a preliminary examination(screening) was performed on all candidates. The studyenrolled 36 candidates as test subjects, none of whom fellunder any of the following exclusion criteria:

Evidence-Based Complementary and Alternative Medicine 5
(1) have no custom of eating breakfast;(2) are taking drugs that might affect blood glucose con-
centration;(3) are taking supplements or functional foods thatmight
affect blood glucose concentration;(4) are diabetic or undergoing diabetes treatment;(5) have serious complications, or have contracted a
disease that requires urgent remedy;(6) have a chronic sickness and is taking drugs for that
sickness;(7) have a disease or history of operations in the digestive
system;(8) have drug or alcohol dependency in the history of a
present disease or in their medical history;(9) are in pregnancy or lactation, or have plans to become
pregnant during the study;(10) are participating in other clinical studies, taking
drugs, or applying cosmetics or drugs to the skin;(11) are judged to be unsuitable test subjects by the study
director.
No subject was dropped during the study period.Three of36 subjects were excluded due to not taking uniform dinner.The general characteristics of the 33 subjects were as follows:age (24.6 ± 8.9 y.o.), height (160.6 ± 6.8 cm), body weight(52.7 ± 7.7 kg), BMI (20.3 ± 2.1), and gender (4 males, 29females).
2.9.2. Test Foods. We used 1.5 g of BLP (TDF; 669mg) anda placebo food which had texture, color, and taste similarto water-suspended BLP. BLP and the placebo food were,respectively, suspended in 100mL of distilled water justbefore testing.
2.9.3. Study Design. A randomized, double-blind, placebo-controlled crossover trial was conducted to investigate theeffects of BLP on postprandial blood glucose level. Subjectswere randomly assigned to an active/placebo sequence (𝑛 =18) or a placebo/active sequence (𝑛 = 18). BLP and placebowere administrated in the morning with an administrationinterval of at least 1 week, as a washout period. Uniformdinner was prepared for all subjects, who were instructed totake the dinner before 21:00 on the day before administration(for a 12 hour overnight fast) and were also restricted fromconsuming alcohol on the day prior to administration. Allsubjects arrived at the university in the morning and com-pleted a small questionnaire regarding their last dinner,amount of alcohol, and physical condition. Each test foodwasserved with 200 g of warmed steamed rice (carbohydrates,68.0 g). The subjects were required to finish consumptionwithin 10min, at a comfortable pace.
2.9.4. Blood Glucose Measurements. After resting for 15min,fasting blood glucose was measured just before consumptionof the test food with rice. Further blood samples were taken
at 30, 60, and 120min after the subjects had begun eating. Forthis purpose, a blood droplet from a subject finger was drawninto a heparinized hematocrit capillary tube (Terumo Co.,Tokyo, Japan) via capillary action. Glucose was measured bya commercial kit (Glu-CII, Wako Pure Chemical Industries,Ltd., Osaka, Japan).
2.10. Statistics. Results were expressed asmean ± SEM. In theoral sucrose tolerance test and the artificial digesta infusiontest, analysis was undertaken regarding differences in thedelta blood glucose levels among the groups and over the timecourse of the experiment (0–120min) via 2-wayANOVA [16].When the interaction between the effects of the dose of BLPor a different fraction and the time course was significant,either Fisher’s PLSD (for 3 groups) or Tukey’s multiplecomparison test (for 4 groups) was used to test differences indelta blood glucose levels observed among the groups at eachtime [16]. For glucose adsorption to fiber, 1-way ANOVA wasused to test the differences in the glucose concentrations inthe supernatants of the plain glucose solution and those in thecellulose and insoluble fiber rich fraction suspensions [16].For the infusion of artificial digesta into the duodenum, 1-wayANOVA was used to test differences in the amounts of arti-ficial digesta infused in the control, BLP, and insoluble fiberrich fraction groups [16]. Regarding measurements of digestaviscosity, as there were no interactions between the shear rateand the coefficient of viscosity of the digesta, we analyzeddifferences in the coefficients of viscosity of the digesta amongthe control, BLP, and insoluble fiber groups using ANCOVA(as a covariate: shear rate), with subsequent use of Fisher’sPLSD [16]. For the clinical study, we analyzed the differencesin the delta blood glucose levels among groups, and over thetime course of the experiment (0–120min), and the glucoselevels (high or low reactivity; identification of subjects withhigher or lower blood glucose increment between 0 and 30minutes after rice consumption with placebo) using 3-wayANOVA [16]. When interactions among the effects of BLP,time after administration, and difference between glucoselevels in subjects were significant, Tukeymultiple comparisontest was used to test the differences the delta blood glucoselevels among groups, at each time. In all experiments,differences were considered significant when the 𝑃-value was<0.05.
3. Result
3.1. Oral Sucrose Tolerance Test (Dose Finding Study). Therewas a significant interaction between the effects of BLP doseand time after sucrose administration on the blood glucoseincrement (Figure 2, 𝑃 < 0.01, 2-way ANOVA). There wasno significant difference in the blood glucose levels betweenlow BLP dose (500mg/kg) group and control group at 30, 60,and 120min after administration (Figure 2; 30min, 𝑃 = 0.5;60min, 𝑃 = 0.2; 120min, 𝑃 = 0.3; Fisher’s PLSD). Bloodglucose level in the high BLP dose (1,500mg/kg) group waslower than that of the control group and the low BLP dose(500mg/kg) group at 30min after administration (Figure 2;30min, 𝑃 < 0.05; Fisher’s PLSD).

6 Evidence-Based Complementary and Alternative Medicine
0
1
2
3
4
5
0 30 60 120Time after administration (min)
aa
b
Control500mg/kg BLP
Δbl
ood
gluc
ose (
mm
ol/L
)
1,500mg/kg BLP
Figure 2: Oral sucrose tolerance test for dose finding of BLP.The delta blood glucose levels in rats at 0–120 minutes after oraladministration of 2,000mg/kg of sucrose with no BLP (control),500mg/kg, and 1,500mg/kg of BLP were measured. Each data pointrepresents mean ± SEM (𝑛 = 6). A significant interaction was foundbetween the effect of dose and time after administration (𝑃 < 0.01,2-wayANOVA). Delta blood glucose levels without a common letterdiffer (𝑃 < 0.05, multiple comparisons).
0
2
4
6
8
0 30 60 120Time after administration (min)
ControlBLP
Soluble fractionInsoluble fraction
aabb a
aab
Δbl
ood
gluc
ose (
mm
ol/L
)
Figure 3: Oral sucrose tolerance test with the water-EtOH solubleand insoluble fractions of BLP.The delta blood glucose levels in ratsat 0–120minutes after oral administration of 2,000mg/kg of sucrosewith no BLP (control), 1,500mg/kg of BLP, 384mg/kg of the solublefraction, and 1,100mg/kg of the insoluble fraction were measured.Each data point represents mean ± SEM, for 𝑛 = 14 (control, BLP,and soluble fraction) and 𝑛 = 13 (insoluble fraction). A significantinteraction was found between the effects of the different fractionsand the time after administration (𝑃 < 0.001, 2-way ANOVA). Deltablood glucose levels without a common letter differ (𝑃 < 0.05,multiple comparisons).
3.2. Oral Sucrose Tolerance Test Using Rough FractionatedBLP. BLP is mainly composed of cellulose, hemicellulose,and lignin, which are categorized as insoluble fiber but notas soluble fiber (Table 1). The amounts of total dietary fiberof BLP, the insoluble fraction, and the soluble fraction are
described in Table 1. The yields of the insoluble and solublefractions were 73.3% and 25.6%, respectively. As estimatedfrom the yield, the insoluble fiber contained in 1,000 g ofBLP (387 g) was mainly separated into the insoluble fraction(383 g, 73.3% of 537 g of insoluble fiber included in 1,000 g ofthe insoluble fraction).
A significant interaction was found between the effects ofdifferent fractions and the time after sucrose administrationon the blood glucose increment (Figure 3, 𝑃 < 0.001, 2-way ANOVA). Blood glucose levels in the BLP group werelower than those in the control group at 30 and 60min afteradministration (Figure 3, 30min; 𝑃 < 0.001, 60min; 𝑃 <0.05, Tukey multiple comparison test). There was no signifi-cant difference in the blood glucose level between the solublefraction group and control group at 30, 60, and 120min afteradministration (Figure 3: 30min, 𝑃 = 0.2; 60min, 𝑃 = 0.7;120min, 𝑃 = 1.0; Tukey multiple comparison test). Theblood glucose level in the insoluble fraction group was lowerthan that of the control group at 30min after administration(Figure 3; 30min, 𝑃 < 0.01; Tukeymultiple comparison test).
3.3. Total Polyphenols in the Rough Fractionated BLP. Thetotal polyphenols of BLP and the soluble fraction were 4.6and 20.1mg/g, respectively, whereas, total polyphenols of theinsoluble fraction were not detected.
3.4. Preparation of the Insoluble Fiber Rich Fraction from BLP.The amounts of total dietary fiber and water holding capacityof BLP, the insoluble fiber rich fraction prepared via the EFRFmethod, and cellulose as a control are shown in Table 2.
3.5. Glucose Adsorption to Fiber. The glucose concentrationsin the supernatants of the glucose samples incubated with nofiber, cellulose, and the insoluble fiber rich fraction of BLP didnot differ (𝑃 = 0.9).
3.6. Measurement of Digesta Viscosity. There was no signif-icant 2-way interaction between the effect of fiber additionand the shear rate in the gastric, small intestinal, and cecalcontents (gastric contents, 𝑃 = 0.9; small intestinal contents,𝑃 = 0.07; cecal contents,𝑃 = 0.2; 2-wayANOVA).Therewereno significant differences in the coefficients of viscosity of thegastric contents among groups (Figure 4(a), gastric contents,𝑃 = 0.7, ANCOVA). In contrast, significant differenceswere found between the coefficients of viscosity of the smallintestinal and cecal contents among the groups (Figures 4(b)and 4(c); small intestinal contents, 𝑃 < 0.001; cecal contents,𝑃 < 0.05; ANCOVA). The coefficients of viscosity of thesmall intestinal and cecal contents in the BLP and insolublefiber groups were higher than those of the control group(Figures 4(b) and 4(c); small intestinal contents, 𝑃 < 0.01;cecal contents, 𝑃 < 0.05; Fisher’s PLSD).
3.7. Catheterization Test of Artificial Digesta with InsolubleFiber. The coefficients of viscosity of the 3 types of artifi-cial digesta are described in Figure 5.There was no significant2-way interaction between the effect of fiber addition and theshear rate (Figure 5, 𝑃 = 0.1, 2-way ANOVA). There were

Evidence-Based Complementary and Alternative Medicine 7
0
1
10
100
1000
1 10 100 1000
ControlBLPInsoluble fiber rich fraction
Gastric contents
Share rate (s−1)
Coe
ffici
ent o
f visc
osity
(Pa·
s)
(a)
0
1
10
100
1000
1 10 100 1000
Control aBLP bInsoluble fiber rich fraction b
Small intestinal contents
Share rate (s−1)
Coe
ffici
ent o
f visc
osity
(Pa·
s)
(b)
Control aBLP bInsoluble fiber rich fraction b
0
1
10
100
1000
1 10 100 1000
Cecal contents
Share rate (s−1)
Coe
ffici
ent o
f visc
osity
(Pa·
s)
(c)
Figure 4:The coefficient of viscosity of (a) gastric contents, (b) small intestinal contents, and (c) cecal contents in rats after administration ofno fiber diet (control in the panel), BLP containing diet (BLP in the panel), and BLP-derived insoluble fiber-containing diet (insoluble fiberin the panel). Each data point represents the mean for 𝑛 = 3. Significant differences were found between the coefficients of viscosity of thesmall intestinal and cecal contents among the groups (𝑃 < 0.05, ANCOVA). Coefficients of viscosity for gastrointestinal digesta without acommon letter differ (𝑃 < 0.05, multiple comparisons).
significant differences in the coefficients of viscosity ofthe artificial digesta among groups (Figure 5, 𝑃 < 0.01,ANCOVA). The coefficients of viscosities of the artificialdigesta in the BLP and insoluble fiber rich fraction groupswere higher than those of the control group (Figure 5, 𝑃 <0.05, Fisher’s PLSD). There was no significant difference inthe coefficients of viscosity of the artificial digesta, betweenthe BLP and insoluble fiber rich fraction groups (Figure 5,𝑃 = 0.2, Fisher’s PLSD).
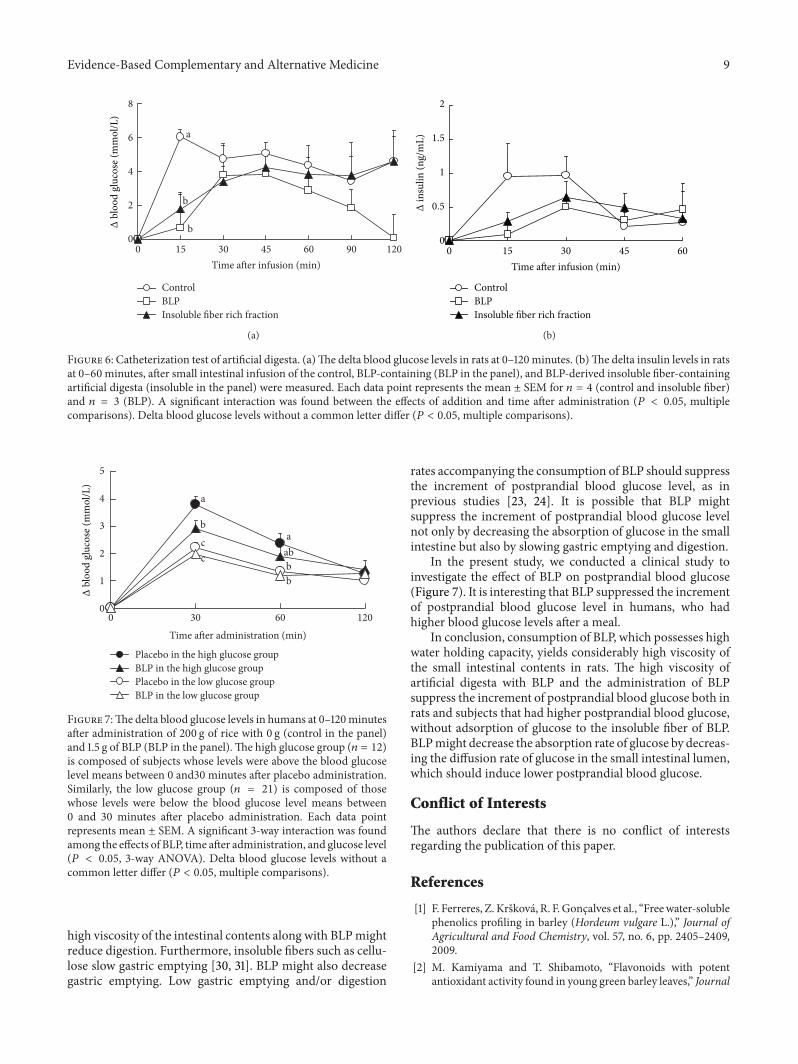
A significant 2-way interaction was found between theeffects of addition and time after infusion on the blood glu-cose increment (Figure 6(a), 𝑃 < 0.05, 2-way ANOVA). Theblood glucose levels at 15 minutes after infusion in both theBLP and insoluble fiber groups were lower than those ofthe control group (Figure 6(a), 𝑃 < 0.05, Fisher’s PLSD).Whereas the time to the peak blood glucose level in the
control was 15min, those of the BLP and insoluble fibergroups were later than 15min. There were no significantdifferences in the insulin levels (Figure 6(b), 𝑃 = 0.4). Oneinsulin level datum in the BLP group was classified as outlierby the Smirnov-Grubbs test and removed from data analysis.
3.8. Clinical Study. A significant 3-way interaction was foundamong the effects of BLP, time after administration anddifference in glucose level in subjects (Figure 7, 𝑃 < 0.05,3-way ANOVA). In the high blood glucose group (𝑛 = 12),blood glucose level at 30 minutes after administration of BLPwas lower than that of placebo (Figure 7, 𝑃 < 0.01, Tukeymultiple comparison test).Therewas no significant differencebetween BLP and placebo in the low blood glucose group(𝑛 = 21) at 30min after administration (Figure 7, 𝑃 = 0.6,Tukey multiple comparison test).

8 Evidence-Based Complementary and Alternative Medicine
1
10
100
1000
1 10 100Share rate (s−1)
Control aBLP bInsoluble fiber rich fraction b
Coe
ffici
ent o
f visc
osity
(Pa·
s)
Figure 5: The coefficient of viscosity of control artificial digesta(control), artificial digesta containing BLP (BLP in the panel), andinsoluble fiber derived from BLP (insoluble fiber in the panel),before infusion into the small intestine in rats. Significant differenceswere found between the coefficients of viscosity of the artificialdigesta among groups (𝑃 < 0.01, ANCOVA). The coefficients ofviscosity of artificial digesta without a common letter differ (𝑃 <0.05, multiple comparisons).
4. Discussion
In Japan, the consumption of powdered young barley leaf,known as “Aojiru”, is prevalent. In the present study, we inves-tigated the effects of BLP on postprandial blood glucose, inorder to clarify the function of barley leaf powder (BLP). First,we performed an oral sucrose tolerance test to determine theadequate dosage of BLP in rats. BLP, administered at a doseof 1,500mg/kg, showed lower increment of the postprandialblood glucose level in rats (Figure 2). Next, we performed anoral sucrose tolerance test with flavonoids rich in the roughfraction (soluble fraction) and the insoluble fiber rich roughfraction (insoluble fraction). The insoluble fraction but notthe soluble fraction suppressed the increment of the post-prandial blood glucose level (Figure 3). Total polyphenols ininsoluble fraction of BLP were not detected (see Section 3.3).Effects of polyphenols on the postprandial blood glucoseshould be ignored in this study. Therefore, we focused on theinsoluble fiber component of BLP, in the present study.
To date, insoluble fibers had not been noted to affectthe viscosity of the intestinal contents [17, 18], which shouldbe a suppressor of the increment of the postprandial bloodglucose level [19]. Accordingly, previous studies have focusedon the suppressive effect of soluble fibers on postprandialblood glucose [20]. However, our previous studies showthat insoluble fibers such as cellulose increased the viscosityof the intestinal contents and suppressed the increment ofpostprandial blood glucose level [9, 11].Thepresence of a highviscosity of the intestinal contents due to BLP, which is rich ininsoluble fibers (Table 1), might suppress the increment of thepostprandial blood glucose level, as noted in previous studies[11].
In this study, both BLP and the insoluble fiber richfractions were found to increase the viscosity of the smallintestinal contents of rats (Figure 4). The higher viscosityobtained with BLP might be due to the higher water holdingcapacity of BLP fibers (Table 2), as the water holding capacityof insoluble fibers is positively correlated with the viscosity ofthe intestinal contents [10]. Figure 6 shows that such a highviscosity of the small intestinal contents, as observed withthe addition of BLP which has a high water holding capacity,suppressed the increment of the postprandial blood glucoselevel in rats. Generally, crystalline cellulose, which exhibitsa low water holding capacity, suppresses the incrementof the blood glucose levels by increasing the viscosity ofthe small intestinal contents [11]. BLP and the insolublefiber rich fractions exhibited a much higher water holdingcapacity than cellulose (Table 2). The suppressive effect ofthe insoluble fiber in BLP on the increment of blood glucoselevels might be much higher than that of cellulose.
Insoluble fibers had been regarded to have the functionof binding glucose, referred to as glucose adsorption [21].We also measured the adsorption of glucose to the insolublefibers of BLP (see Section 3.5). The adsorption of glucose tocellulose and the insoluble fibers of BLP was not observedin the present study, as in the previous study [11]. Celluloseexhibits high viscosity and suppresses the increment ofpostprandial blood glucose level and shows no adsorptionof glucose [11]. Accordingly, the adsorption of glucose mightnot be an important function for the suppressive effect ofinsoluble fibers on postprandial blood glucose.
In the animal experiment involving Figure 6, we elimi-nated the dilution effect of fibers (see Section 2.8.3). Withoutthe dilution and adsorption (binding) effect, insoluble fiberssuppressed the increment of postprandial blood glucoselevel (Figure 6). The function of the insoluble fibers in BLPinvolving postprandial blood glucose might be primarily dueto high digesta viscosity.
The postprandial blood glucose should depend negativelyon the diffusion of glucose in the intestinal contents in theintestinal lumen [19]. Glucose in the intestinal lumen has tobe translocated to the epithelium by self-diffusion in the poormixing environment in the lumen [19]. Such translocationof glucose into the lumen is a rate-limiting factor in theabsorption rate of glucose [19]. The lower absorption rateof glucose accompanying high viscosity of the intestinalcontents should suppress the increment of the postprandialblood glucose level [22]. We confirmed the lower coefficientof diffusion for glucose in artificial digesta with insolublefibers (Takahashi et al., unpublished data).Thus, BLP and theinsoluble fibers of BLP might decrease the diffusion rate ofglucose in the intestinal contents, due to the higher digestaviscosity with BLP and the insoluble fibers of BLP, which thenmight induce suppression of the increment of postprandialblood glucose level.
Our designwas intended to eliminate the effects of gastricemptying and digestion on the postprandial blood glucosein the animal experiment (Figure 6). Gastric emptying anddigestion also affect the postprandial blood glucose [23, 24].Generally, the yield of enzyme products depends negativelyon the viscosity of the suspension [25–29]. The presence of a
Evidence-Based Complementary and Alternative Medicine 9
0
2
4
6
8
0 15 30 45 60 90 120Time after infusion (min)
ControlBLPInsoluble fiber rich fraction
b
b
a
Δbl
ood
gluc
ose (
mm
ol/L
)
(a)
ControlBLPInsoluble fiber rich fraction
0
0.5
1
1.5
2
0 15 30 45 60Time after infusion (min)
Δin
sulin
(ng/
mL)
(b)
Figure 6: Catheterization test of artificial digesta. (a)The delta blood glucose levels in rats at 0–120minutes. (b)The delta insulin levels in ratsat 0–60minutes, after small intestinal infusion of the control, BLP-containing (BLP in the panel), and BLP-derived insoluble fiber-containingartificial digesta (insoluble in the panel) were measured. Each data point represents the mean ± SEM for 𝑛 = 4 (control and insoluble fiber)and 𝑛 = 3 (BLP). A significant interaction was found between the effects of addition and time after administration (𝑃 < 0.05, multiplecomparisons). Delta blood glucose levels without a common letter differ (𝑃 < 0.05, multiple comparisons).
0
1
2
3
4
5
0 30 60 120Time after administration (min)
Placebo in the high glucose groupBLP in the high glucose groupPlacebo in the low glucose groupBLP in the low glucose group
a
b
cc
a
bb
ab
Δbl
ood
gluc
ose (
mm
ol/L
)
Figure 7:The delta blood glucose levels in humans at 0–120minutesafter administration of 200 g of rice with 0 g (control in the panel)and 1.5 g of BLP (BLP in the panel).The high glucose group (𝑛 = 12)is composed of subjects whose levels were above the blood glucoselevel means between 0 and30 minutes after placebo administration.Similarly, the low glucose group (𝑛 = 21) is composed of thosewhose levels were below the blood glucose level means between0 and 30 minutes after placebo administration. Each data pointrepresents mean ± SEM. A significant 3-way interaction was foundamong the effects of BLP, time after administration, and glucose level(𝑃 < 0.05, 3-way ANOVA). Delta blood glucose levels without acommon letter differ (𝑃 < 0.05, multiple comparisons).
high viscosity of the intestinal contents along with BLPmightreduce digestion. Furthermore, insoluble fibers such as cellu-lose slow gastric emptying [30, 31]. BLP might also decreasegastric emptying. Low gastric emptying and/or digestion
rates accompanying the consumption of BLP should suppressthe increment of postprandial blood glucose level, as inprevious studies [23, 24]. It is possible that BLP mightsuppress the increment of postprandial blood glucose levelnot only by decreasing the absorption of glucose in the smallintestine but also by slowing gastric emptying and digestion.
In the present study, we conducted a clinical study toinvestigate the effect of BLP on postprandial blood glucose(Figure 7). It is interesting that BLP suppressed the incrementof postprandial blood glucose level in humans, who hadhigher blood glucose levels after a meal.
In conclusion, consumption of BLP, which possesses highwater holding capacity, yields considerably high viscosity ofthe small intestinal contents in rats. The high viscosity ofartificial digesta with BLP and the administration of BLPsuppress the increment of postprandial blood glucose both inrats and subjects that had higher postprandial blood glucose,without adsorption of glucose to the insoluble fiber of BLP.BLPmight decrease the absorption rate of glucose by decreas-ing the diffusion rate of glucose in the small intestinal lumen,which should induce lower postprandial blood glucose.
Conflict of Interests
The authors declare that there is no conflict of interestsregarding the publication of this paper.
References
[1] F. Ferreres, Z. Krskova, R. F.Goncalves et al., “Freewater-solublephenolics profiling in barley (Hordeum vulgare L.),” Journal ofAgricultural and Food Chemistry, vol. 57, no. 6, pp. 2405–2409,2009.
[2] M. Kamiyama and T. Shibamoto, “Flavonoids with potentantioxidant activity found in young green barley leaves,” Journal

10 Evidence-Based Complementary and Alternative Medicine
of Agricultural and Food Chemistry, vol. 60, no. 25, pp. 6260–6267, 2012.
[3] N. Kohyama, H. Ono, and T. Yanagisawa, “Changes in antho-cyanins in the grains of purple waxy hull-less barley during seedmaturation and after harvest,” Journal of Agricultural and FoodChemistry, vol. 56, no. 14, pp. 5770–5774, 2008.
[4] H. Ohtake, S. Nonaka, and Y. Sawada, “Studies on the con-stituents of green juice from young barley leaves. Effect ondietarily induced hypercholesterolemia in rats,” Yakugaku Zass-hi, vol. 105, no. 11, pp. 1052–1057, 1985.
[5] Y.-M. Yu, C.-H. Wu, Y.-H. Tseng, C. E. Tsai, and W.-C.Chang, “Antioxidative and hypolipidemic effects of barley leafessence in a rabbit model of atherosclerosis,” Japanese Journalof Pharmacology, vol. 89, no. 2, pp. 142–148, 2002.
[6] S. Muetzel, E. M. Hoffmann, and K. Becker, “Supplementationof barley straw with Sesbania pachycarpa leaves in vitro: effectson fermentation variables and rumen microbial populationstructure quantified by ribosomal RNA-targeted probes,”BritishJournal of Nutrition, vol. 89, no. 4, pp. 445–453, 2003.
[7] K. Yamaura, N. Nakayama, M. Shimada et al., “Antidepressant-like effects of young green barley leaf (Hordeum vulgare L.) inthemouse forced swimming test,”Pharmacognosy Research, vol.4, no. 1, pp. 22–26, 2012.
[8] Y.-M. Yu,W.-C. Chang, C.-T. Chang, C.-L. Hsieh, andC. E. Tsai,“Effects of young barley leaf extract and antioxidative vitaminson LDL oxidation and free radical scavenging activities in type2 diabetes,” Diabetes and Metabolism, vol. 28, no. 2, pp. 107–114,2002.
[9] T. Takahashi, N. Yamanaka, T. Sakata, andN.Ogawa, “Influenceof solid particles on the viscous properties of intestinal contentsand intestinal tissue weight in rats,” Journal of the JapaneseSociety of Food and Nutrition, vol. 56, no. 4, pp. 199–206, 2003.
[10] T. Takahashi, Y. Furuichi, T. Mizuno et al., “Water-holdingcapacity of insoluble fibre decreases free water and elevatesdigesta viscosity in the rat,” Journal of the Science of Food andAgriculture, vol. 89, no. 2, pp. 245–250, 2009.
[11] T. Takahashi, S. Karita, N. Ogawa, and M. Goto, “Crystallinecellulose reduces plasma glucose concentrations and stimulateswater absorption by increasing the digesta viscosity in rats,”Journal of Nutrition, vol. 135, no. 10, pp. 2405–2410, 2005.
[12] F. Visioli, C. A. De La Lastra, C. Andres-Lacueva et al., “Pol-yphenols and human health: a prospectus,” Critical Reviews inFood Science and Nutrition, vol. 51, no. 6, pp. 524–546, 2011.
[13] E. Yamazaki, K. Murakami, and O. Kurita, “Easy preparationof dietary fiber with the high water-holding capacity from foodsources,” Plant Foods for Human Nutrition, vol. 60, no. 1, pp. 17–23, 2005.
[14] AOAC, Official Methods of Analysis of AOAC INTERNA-TIONAL, AOAC International, Arlington, Va, USA, 16th edi-tion, 1995.
[15] D. A. Southgate, “Determination of carbohydrates in foods. II.Unavailable carbohydrates,” Journal of the Science of Food andAgriculture, vol. 20, no. 6, pp. 331–335, 1969.
[16] R. R. Sokal and F. J. Rohlf, Biometry:The Principles and Practicesof Statistics in Biological Research,W.H. Freeman andCompany,New York, NY, USA, 4th edition, 2012.
[17] C. L. Dikeman and G. C. Fahey Jr., “Viscosity as related todietary fiber: a review,” Critical Reviews in Food Science andNutrition, vol. 46, no. 8, pp. 649–663, 2006.
[18] D. A. Brockman, X. Chen, and D. D. Gallaher, “Hydroxypropylmethylcellulose, a viscous soluble fiber, reduces insulin resis-tance and decreases fatty liver in Zucker diabetic fatty rats,”Nutrition & Metabolism, vol. 9, no. 1, article 100, 2012.
[19] T. Takahashi, “Flow behavior of digesta and the absorption ofnutrients in the gastrointestine,” Journal of Nutritional Scienceand Vitaminology, vol. 57, no. 4, pp. 265–273, 2011.
[20] I. T. Johnson and J. M. Gee, “Inhibitory effect of guar gum onthe intestinal absorption of glucose in vitro,” Proceedings of theNutrition Society, vol. 39, no. 2, article 52A, 1980.
[21] S. Ou, K.-C. Kwok, Y. Li, and L. Fu, “In vitro study of possiblerole of dietary fiber in lowering postprandial serum glucose,”Journal of Agricultural and Food Chemistry, vol. 49, no. 2, pp.1026–1029, 2001.
[22] F. Sjostrand and R. G. Hahn, “Volume kinetics of glucose 2.5%solutionduring laparoscopic cholecystectomy,”British Journal ofAnaesthesia, vol. 92, no. 4, pp. 485–492, 2004.
[23] D. DiBattista, “Food consumption, plasma glucose and stom-ach-emptying in insulin-injected hamsters,” Physiology andBehavior, vol. 33, no. 1, pp. 13–20, 1984.
[24] P. S. Thondre and C. J. K. Henry, “Effect of a low molecularweight, high-purity beta-glucan on in vitro digestion andglycemic response,” International Journal of Food Sciences andNutrition, vol. 62, no. 7, pp. 678–684, 2011.
[25] A. C. Brouwer and J. F. Kirsch, “Investigation of diffusion-limited rates of chymotrypsin reactions by viscosity variation,”Biochemistry, vol. 21, no. 6, pp. 1302–1307, 1982.
[26] G. Dunaif and B. O. Schneeman, “The effect of dietary fiberon human pancreatic enzyme activity in vitro,” The AmericanJournal of Clinical Nutrition, vol. 34, no. 6, pp. 1034–1035, 1981.
[27] D. Lairon, H. Lafont, and J.-L. Vigne, “Effect of dietary fibersand cholestyramine on the activity of pancreatic lipase in vitro,”The American Journal of Clinical Nutrition, vol. 42, no. 4, pp.629–638, 1985.
[28] W. E. Hansen, “Effect of dietary fiber on pancreatic lipaseactivity in vitro,” Pancreas, vol. 2, no. 2, pp. 195–198, 1987.
[29] G. Isaksson, I. Lundquist, and I. Ihse, “Effect of dietary fiber onpancreatic enyzme in vitro,” Gastroenterology, vol. 82, no. 5, pp.918–924, 1982.
[30] H.N. Johansen andK. E. BachKnudsen, “Effects of reducing thestarch content in oat-based diets with cellulose on jejunal flowand absorption of glucose over an isolated loop of jejunum inpigs,”The British Journal of Nutrition, vol. 72, no. 5, pp. 717–729,1994.
[31] T. Oku, R. Hongo, and S. Nakamura, “Suppressive effect of cel-lulose on osmotic diarrhea caused by maltitol in healthy femalesubjects,” Journal of Nutritional Science and Vitaminology, vol.54, no. 4, pp. 309–314, 2008.

Submit your manuscripts athttp://www.hindawi.com
Stem CellsInternational
Hindawi Publishing Corporationhttp://www.hindawi.com Volume 2014
Hindawi Publishing Corporationhttp://www.hindawi.com Volume 2014
MEDIATORSINFLAMMATION
of
Hindawi Publishing Corporationhttp://www.hindawi.com Volume 2014
Behavioural Neurology
EndocrinologyInternational Journal of
Hindawi Publishing Corporationhttp://www.hindawi.com Volume 2014
Hindawi Publishing Corporationhttp://www.hindawi.com Volume 2014
Disease Markers
Hindawi Publishing Corporationhttp://www.hindawi.com Volume 2014
BioMed Research International
OncologyJournal of
Hindawi Publishing Corporationhttp://www.hindawi.com Volume 2014
Hindawi Publishing Corporationhttp://www.hindawi.com Volume 2014
Oxidative Medicine and Cellular Longevity
Hindawi Publishing Corporationhttp://www.hindawi.com Volume 2014
PPAR Research
The Scientific World JournalHindawi Publishing Corporation http://www.hindawi.com Volume 2014
Immunology ResearchHindawi Publishing Corporationhttp://www.hindawi.com Volume 2014
Journal of
ObesityJournal of
Hindawi Publishing Corporationhttp://www.hindawi.com Volume 2014
Hindawi Publishing Corporationhttp://www.hindawi.com Volume 2014
Computational and Mathematical Methods in Medicine
OphthalmologyJournal of
Hindawi Publishing Corporationhttp://www.hindawi.com Volume 2014
Diabetes ResearchJournal of
Hindawi Publishing Corporationhttp://www.hindawi.com Volume 2014
Hindawi Publishing Corporationhttp://www.hindawi.com Volume 2014
Research and TreatmentAIDS
Hindawi Publishing Corporationhttp://www.hindawi.com Volume 2014
Gastroenterology Research and Practice
Hindawi Publishing Corporationhttp://www.hindawi.com Volume 2014
Parkinson’s Disease
Evidence-Based Complementary and Alternative Medicine
Volume 2014Hindawi Publishing Corporationhttp://www.hindawi.com


![The Barley Uniculme4 Gene Encodes a BLADE-ON- PETIOLE-Like ... · The Barley Uniculme4 Gene Encodes a BLADE-ON-PETIOLE-Like Protein That Controls Tillering and Leaf Patterning1[OPEN]](https://img.dokumen.tips/doc/110x75/5ed141dccd86a73bbf4f388b/the-barley-uniculme4-gene-encodes-a-blade-on-petiole-like-the-barley-uniculme4.jpg)