Embed Size (px)
Citation preview
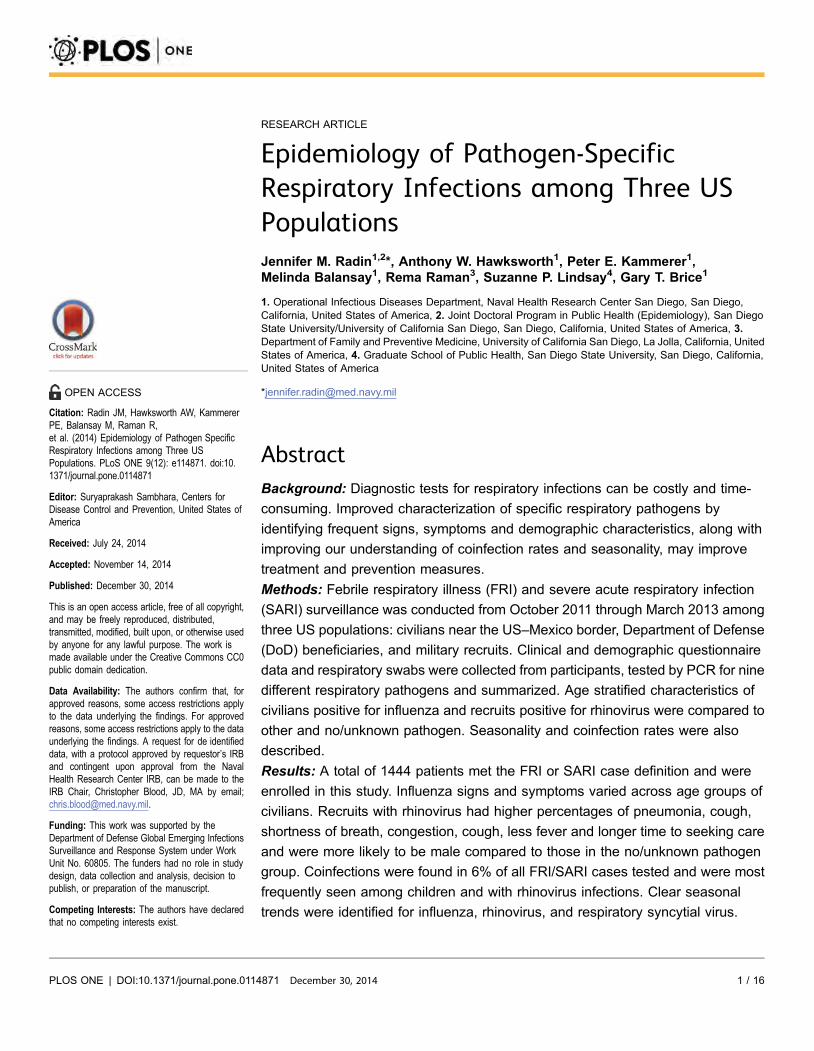
RESEARCH ARTICLE
Epidemiology of Pathogen-SpecificRespiratory Infections among Three USPopulationsJennifer M. Radin1,2*, Anthony W. Hawksworth1, Peter E. Kammerer1,Melinda Balansay1, Rema Raman3, Suzanne P. Lindsay4, Gary T. Brice1
1. Operational Infectious Diseases Department, Naval Health Research Center San Diego, San Diego,California, United States of America, 2. Joint Doctoral Program in Public Health (Epidemiology), San DiegoState University/University of California San Diego, San Diego, California, United States of America, 3.Department of Family and Preventive Medicine, University of California San Diego, La Jolla, California, UnitedStates of America, 4. Graduate School of Public Health, San Diego State University, San Diego, California,United States of America
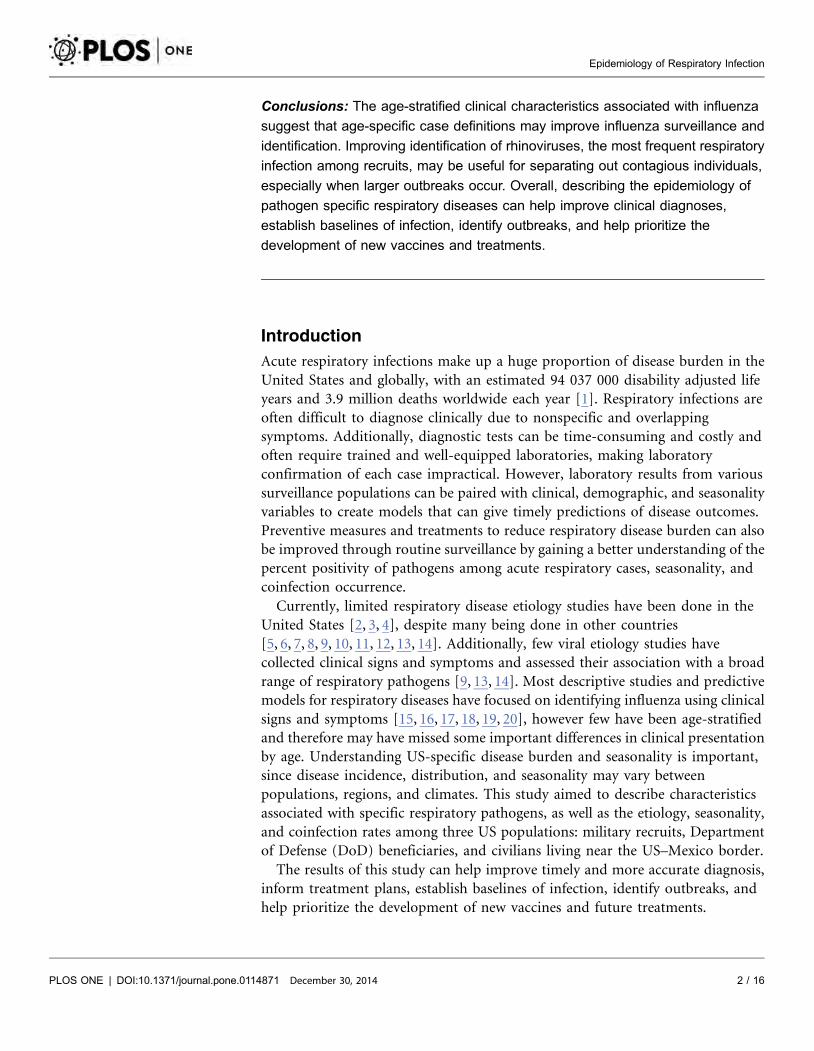
Abstract
Background: Diagnostic tests for respiratory infections can be costly and time-
consuming. Improved characterization of specific respiratory pathogens by
identifying frequent signs, symptoms and demographic characteristics, along with
improving our understanding of coinfection rates and seasonality, may improve
treatment and prevention measures.
Methods: Febrile respiratory illness (FRI) and severe acute respiratory infection
(SARI) surveillance was conducted from October 2011 through March 2013 among
three US populations: civilians near the US–Mexico border, Department of Defense
(DoD) beneficiaries, and military recruits. Clinical and demographic questionnaire
data and respiratory swabs were collected from participants, tested by PCR for nine
different respiratory pathogens and summarized. Age stratified characteristics of
civilians positive for influenza and recruits positive for rhinovirus were compared to
other and no/unknown pathogen. Seasonality and coinfection rates were also
described.
Results: A total of 1444 patients met the FRI or SARI case definition and were
enrolled in this study. Influenza signs and symptoms varied across age groups of
civilians. Recruits with rhinovirus had higher percentages of pneumonia, cough,
shortness of breath, congestion, cough, less fever and longer time to seeking care
and were more likely to be male compared to those in the no/unknown pathogen
group. Coinfections were found in 6% of all FRI/SARI cases tested and were most
frequently seen among children and with rhinovirus infections. Clear seasonal
trends were identified for influenza, rhinovirus, and respiratory syncytial virus.
OPEN ACCESS
Citation: Radin JM, Hawksworth AW, KammererPE, Balansay M, Raman R,et al. (2014) Epidemiology of Pathogen SpecificRespiratory Infections among Three USPopulations. PLoS ONE 9(12): e114871. doi:10.1371/journal.pone.0114871
Editor: Suryaprakash Sambhara, Centers forDisease Control and Prevention, United States ofAmerica
Received: July 24, 2014
Accepted: November 14, 2014
Published: December 30, 2014
This is an open access article, free of all copyright,and may be freely reproduced, distributed,transmitted, modified, built upon, or otherwise usedby anyone for any lawful purpose. The work ismade available under the Creative Commons CC0public domain dedication.
Data Availability: The authors confirm that, forapproved reasons, some access restrictions applyto the data underlying the findings. For approvedreasons, some access restrictions apply to the dataunderlying the findings. A request for de identifieddata, with a protocol approved by requestor’s IRBand contingent upon approval from the NavalHealth Research Center IRB, can be made to theIRB Chair, Christopher Blood, JD, MA by email;[email protected].
Funding: This work was supported by theDepartment of Defense Global Emerging InfectionsSurveillance and Response System under WorkUnit No. 60805. The funders had no role in studydesign, data collection and analysis, decision topublish, or preparation of the manuscript.
Competing Interests: The authors have declaredthat no competing interests exist.
PLOS ONE | DOI:10.1371/journal.pone.0114871 December 30, 2014 1 / 16
Conclusions: The age-stratified clinical characteristics associated with influenza
suggest that age-specific case definitions may improve influenza surveillance and
identification. Improving identification of rhinoviruses, the most frequent respiratory
infection among recruits, may be useful for separating out contagious individuals,
especially when larger outbreaks occur. Overall, describing the epidemiology of
pathogen specific respiratory diseases can help improve clinical diagnoses,
establish baselines of infection, identify outbreaks, and help prioritize the
development of new vaccines and treatments.
Introduction
Acute respiratory infections make up a huge proportion of disease burden in the
United States and globally, with an estimated 94 037 000 disability adjusted life
years and 3.9 million deaths worldwide each year [1]. Respiratory infections are
often difficult to diagnose clinically due to nonspecific and overlapping
symptoms. Additionally, diagnostic tests can be time-consuming and costly and
often require trained and well-equipped laboratories, making laboratory
confirmation of each case impractical. However, laboratory results from various
surveillance populations can be paired with clinical, demographic, and seasonality
variables to create models that can give timely predictions of disease outcomes.
Preventive measures and treatments to reduce respiratory disease burden can also
be improved through routine surveillance by gaining a better understanding of the
percent positivity of pathogens among acute respiratory cases, seasonality, and
coinfection occurrence.
Currently, limited respiratory disease etiology studies have been done in the
United States [2, 3, 4], despite many being done in other countries
[5, 6, 7, 8, 9, 10, 11, 12, 13, 14]. Additionally, few viral etiology studies have
collected clinical signs and symptoms and assessed their association with a broad
range of respiratory pathogens [9, 13, 14]. Most descriptive studies and predictive
models for respiratory diseases have focused on identifying influenza using clinical
signs and symptoms [15, 16, 17, 18, 19, 20], however few have been age-stratified
and therefore may have missed some important differences in clinical presentation
by age. Understanding US-specific disease burden and seasonality is important,
since disease incidence, distribution, and seasonality may vary between
populations, regions, and climates. This study aimed to describe characteristics
associated with specific respiratory pathogens, as well as the etiology, seasonality,
and coinfection rates among three US populations: military recruits, Department
of Defense (DoD) beneficiaries, and civilians living near the US–Mexico border.
The results of this study can help improve timely and more accurate diagnosis,
inform treatment plans, establish baselines of infection, identify outbreaks, and
help prioritize the development of new vaccines and future treatments.
Epidemiology of Respiratory Infection
PLOS ONE | DOI:10.1371/journal.pone.0114871 December 30, 2014 2 / 16
Methods
Participants
FRI and SARI surveillance was conducted between October 2011 and March 2013
among three surveillance groups in the United States: civilians near the US–
Mexico border, DoD dependents, and military recruits. Separate seasonality data
from the same populations was available for January 2012 through December
2013. Recruits are typically young and healthy adults who enter into an 8–12 week
‘‘boot camp’’ training program, which involves strenuous, and physically
demanding activities and living in high-density barracks. During the first week of
training, recruits receive a series of vaccinations, including influenza (seasonally)
and adenovirus. Most training centers also administer at least one dose of bicillin
to incoming trainees as prophylaxis against Streptococcus bacteria. The DoD
dependent population is made up of the families of active duty and retired
military personnel. This population consists of all ages and has good access to
health care through the TRICARE health care program. The border sites are not
associated with the military and typically capture underserved populations living
near the US–Mexico border in California and Arizona. The border sites are part of
a broader Border Infectious Disease surveillance program run by the US Centers
for Disease Control and Prevention and San Diego and Imperial counties, for
which the Naval Health Research Center (NHRC) serves as the testing laboratory.
The FRI recruit sites included Marine Corps Recruit Depot (MCRD) San
Diego, California; Air Force Basic Military Training center, Lackland Air Force
Base, Texas; Naval Training Command, Great Lakes, Illinois; US Army Training
Center (USATC) Fort Leonard Wood, Missouri; USATC Fort Jackson, South
Carolina; USATC Fort Benning, Georgia; MCRD Parris Island, South Carolina;
and Coast Guard Training Center, Cape May, New Jersey. The DoD beneficiaries
sites included Naval Medical Center San Diego, California; TRICARE Clairemont
Mesa, San Diego, California; and TRICARE Great Lakes, Illinois. FRI and SARI
border sites included clinics and hospitals in San Ysidro, California; Calexico,
California; Brawley, California; El Centro, California; Chula Vista, California;
Selles, Arizona; and Tucson, Arizona.
Ethics Statement
This research was conducted in compliance with all applicable federal and
international regulations governing the protection of human subjects in research.
The research conducted in the recruit and DoD beneficiary populations
underwent NHRC IRB approval (NHRC protocols 31230 and NHRC.1999.0002)
and written consent or parental guardian consent for minors was obtained for all
participants. The data collected from the border population was part of a
surveillance program run by the US Centers for Disease Control and Prevention
(CDC) and was considered non-research by the NHRC IRB. NHRC staff members
only provided diagnostic support and only received non-personally identifiable
data.
Epidemiology of Respiratory Infection
PLOS ONE | DOI:10.1371/journal.pone.0114871 December 30, 2014 3 / 16
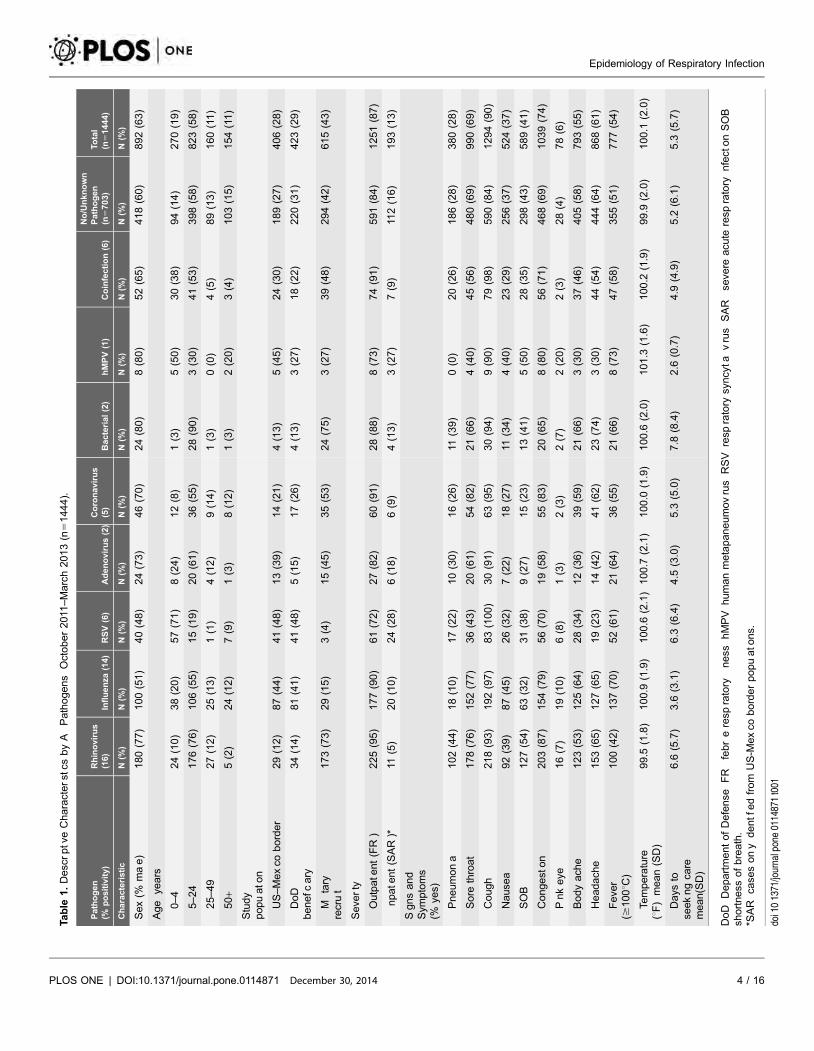
Table
1.DescrptveCharacterstcs
byA
Pathogens
October2011
–March2013(n
51444).
Pathogen
(%positivity)
Rhinovirus
(16)
Influenza
(14)
RSV(6)
Adenovirus(2)
Coronavirus
(5)
Bacterial(2)
hMPV(1)
Coinfection(6)
No/Unknown
Pathogen
(n5703)
Total
(n51444)
Characteristic
N(%
)N
(%)
N(%
)N
(%)
N(%
)N
(%)
N(%
)N
(%)
N(%
)N
(%)
Sex(%
mae)
180(77)
100(51)
40(48)
24(73)
46(70)
24(80)
8(80)
52(65)
418(60)
892(63)
Age
years
0–4
24(10)
38(20)
57(71)
8(24)
12(8)
1(3)
5(50)
30(38)
94(14)
270(19)
5–24
176(76)
106(55)
15(19)
20(61)
36(55)
28(90)
3(30)
41(53)
398(58)
823(58)
25–49
27(12)
25(13)
1(1)
4(12)
9(14)
1(3)
0(0)
4(5)
89(13)
160(11)
50
+5(2)
24(12)
7(9)
1(3)
8(12)
1(3)
2(20)
3(4)
103(15)
154(11)
Study
popuato
n
US–Mexco
border
29(12)
87(44)
41(48)
13(39)
14(21)
4(13)
5(45)
24(30)
189(27)
406(28)
DoD
benefc
ary
34(14)
81(41)
41(48)
5(15)
17(26)
4(13)
3(27)
18(22)
220(31)
423(29)
Mtary
recrut
173(73)
29(15)
3(4)
15(45)
35(53)
24(75)
3(27)
39(48)
294(42)
615(43)
Seve
rty
Outpate
nt(FR)
225(95)
177(90)
61(72)
27(82)
60(91)
28(88)
8(73)
74(91)
591(84)
1251(87)
npate
nt(SAR)*
11(5)
20(10)
24(28)
6(18)
6(9)
4(13)
3(27)
7(9)
112(16)
193(13)
Sgnsand
Sym
ptoms
(%ye
s)
Pneumona
102(44)
18(10)
17(22)
10(30)
16(26)
11(39)
0(0)
20(26)
186(28)
380(28)
Sore
throat
178(76)
152(77)
36(43)
20(61)
54(82)
21(66)
4(40)
45(56)
480(69)
990(69)
Cough
218(93)
192(97)
83(100)
30(91)
63(95)
30(94)
9(90)
79(98)
590(84)
1294(90)
Nause
a92(39)
87(45)
26(32)
7(22)
18(27)
11(34)
4(40)
23(29)
256(37)
524(37)
SOB
127(54)
63(32)
31(38)
9(27)
15(23)
13(41)
5(50)
28(35)
298(43)
589(41)
Congeston
203(87)
154(79)
56(70)
19(58)
55(83)
20(65)
8(80)
56(71)
468(69)
1039(74)
Pnkeye
16(7)
19(10)
6(8)
1(3)
2(3)
2(7)
2(20)
2(3)
28(4)
78(6)
Bodyach
e123(53)
125(64)
28(34)
12(36)
39(59)
21(66)
3(30)
37(46)
405(58)
793(55)
Headach
e153(65)
127(65)
19(23)
14(42)
41(62)
23(74)
3(30)
44(54)
444(64)
868(61)
Feve
r($
100uC
)100(42)
137(70)
52(61)
21(64)
36(55)
21(66)
8(73)
47(58)
355(51)
777(54)
Temperature
(uF)mean(SD)
99.5
(1.8)
100.9
(1.9)
100.6
(2.1)
100.7
(2.1)
100.0
(1.9)
100.6
(2.0)
101.3
(1.6)
100.2
(1.9)
99.9
(2.0)
100.1
(2.0)
Days
tose
ekngca
remean(SD)
6.6
(5.7)
3.6
(3.1)
6.3
(6.4)
4.5
(3.0)
5.3
(5.0)
7.8
(8.4)
2.6
(0.7)
4.9
(4.9)
5.2
(6.1)
5.3
(5.7)
DoD
DepartmentofDefense
FR
febreresp
ratory
ness
hMPV
humanmetapaneumovrus
RSV
resp
ratory
syncyta
vrus
SAR
seve
reacu
teresp
ratory
nfectonSOB
shortness
ofbreath.
*SAR
case
sony
dentfedfrom
US-M
exco
borderpopuato
ns.
doi101371/journalpone0114871t001
Epidemiology of Respiratory Infection
PLOS ONE | DOI:10.1371/journal.pone.0114871 December 30, 2014 4 / 16
Procedures
Case definitions were slightly different for each of the three populations. In the
recruit population, an FRI case was defined as a person who sought medical care
and had an oral temperature $38.0uC (100.5uF) and either cough or sore throat.
For the beneficiary population and border populations, the same FRI case
definition was used; however, a fever $37.8uC (100.0uF) or subjective fever was
used. Additionally, inpatients who met SARI case definition at select border sites
were also sampled. The SARI case definition included people who presented with
either fever $37.8uC (100.0uF) or feeling feverish/chills, in addition to cough, and
hospital admission, with onset in the last 10 days. Additionally, children under age
five were included if they were admitted to the hospital with clinical suspicion of
pneumonia.
Nasal or combination nasal/pharyngeal swabs and questionnaire data were
collected from a convenience sample of up to 20 patients per week per site who
sought medical attention, met the FRI or SARI case definition, and provided
written informed consent. Specimens were placed in universal transport medium
[21], preserved at 280uC, and later transported on dry ice to the reference
laboratory at the NHRC every one to two weeks for testing. Additionally, the
following demographic and clinical signs and symptoms were collected from each
FRI and SARI case: sex, age, study population, month of illness, pneumonia, sore
throat, cough, nausea, shortness of breath, congestion, pink eye, body ache,
headache, temperature, number of days of symptoms before seeking care, and date
of seeking care.
Samples were extracted using the Roche MagNA Pure LC extraction system
following manufacturer’s instructions. Samples were then tested for a broad-
spectrum panel consisting of standard PCR gel tests: hMPV (single plex),
CoVNL63 (single plex), and CoV229E and CoVOC43 (multiplex). Real-time
polymerase chain reaction (PCR) assays were run on the Applied Biosystems 7500
Fast Real-Time PCR System testing for influenza A, influenza B, adenovirus, RSV,
rhinovirus, and a bacterial multiplex consisting of M. pneumoniae, C. pneumoniae,
and B. pertussis. The rhinovirus primers used in our study have been found to
correctly identify 87 of the 100 distinct rhinovirus subtypes and to accurately
distinguish rhinoviruses from enteroviruses [22]. All PCR tests were done using
in-house primers, except for the influenza A and influenza B which were done
using CDC primers. Additionally, viral culture testing for parainfluenza was done
for a systematic sample of specimens not positive for influenza or adenovirus.
Statistical Analysis
The frequencies and means of clinical and demographic characteristics across
participants positive for each of the six viruses, bacterial infections, co-infections
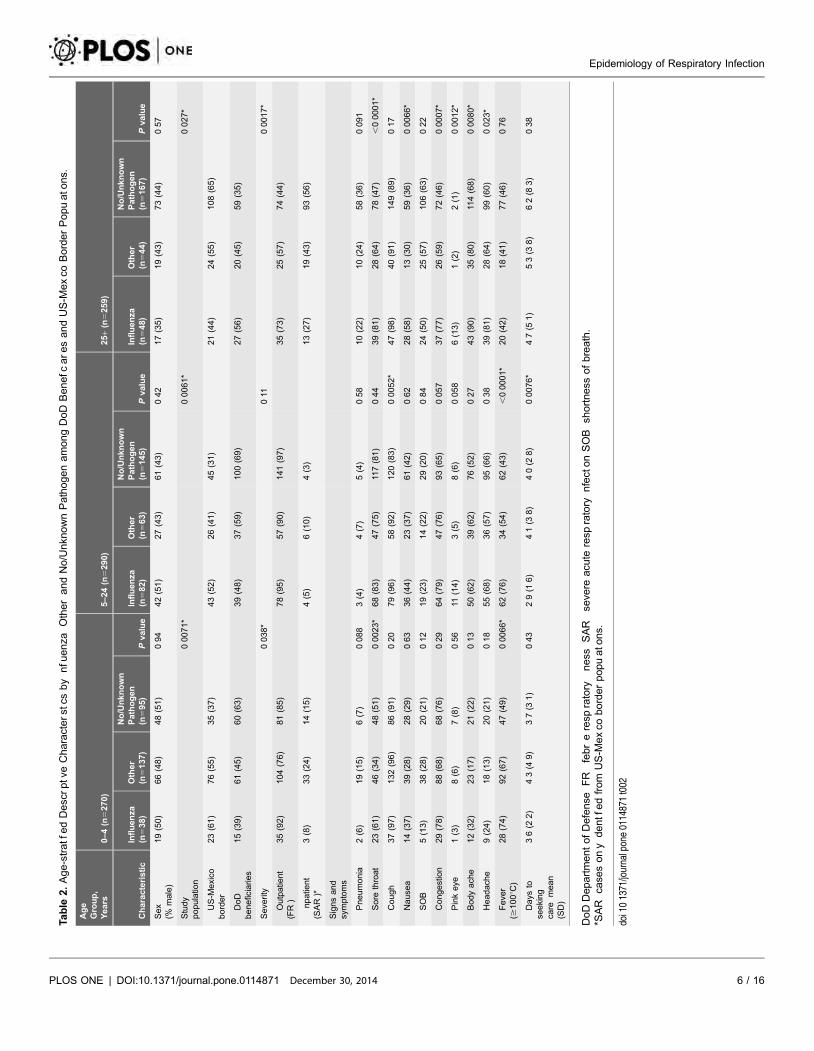
and no/unknown pathogen were compared. (Table 1). Additionally, character-
istics of influenza, other pathogen, or no/unknown pathogen were compared
among age stratified groups of DoD beneficiaries and US-Mexico border
populations (Table 2) and characteristics of rhinovirus, other pathogen, and no/
Epidemiology of Respiratory Infection
PLOS ONE | DOI:10.1371/journal.pone.0114871 December 30, 2014 5 / 16
Table
2.Age-stratfedDescrptveCharacterstcs
by
nfu
enza
OtherandNo/Unkn
ownPathogenamongDoD
Benefc
aresandUS-M
exco
BorderPopuato
ns.
Age
Group,
Years
0–4(n
5270)
5–24(n
5290)
25
+(n
5259)
Characteristic
Influenza
(n538)
Other
(n5137)
No/Unknown
Pathogen
(n595)
Pvalue
Influenza
(n582)
Other
(n563)
No/Unknown
Pathogen
(n5145)
Pvalue
Influenza
(n548)
Other
(n544)
No/Unknown
Pathogen
(n5167)
Pvalue
Sex
(%male)
19(50)
66(48)
48(51)
094
42(51)
27(43)
61(43)
042
17(35)
19(43)
73(44)
057
Study
populatio
n00071*
00061*
0027*
US-M
exico
border
23(61)
76(55)
35(37)
43(52)
26(41)
45(31)
21(44)
24(55)
108(65)
DoD
beneficiaries
15(39)
61(45)
60(63)
39(48)
37(59)
100(69)
27(56)
20(45)
59(35)
Seve
rity
0038*
011
00017*
Outpatie
nt
(FR)
35(92)
104(76)
81(85)
78(95)
57(90)
141(97)
35(73)
25(57)
74(44)
npatie
nt
(SAR)*
3(8)
33(24)
14(15)
4(5)
6(10)
4(3)
13(27)
19(43)
93(56)
Signsand
symptoms
Pneumonia
2(6)
19(15)
6(7)
0088
3(4)
4(7)
5(4)
058
10(22)
10(24)
58(36)
0091
Sore
throat
23(61)
46(34)
48(51)
00023*
68(83)
47(75)
117(81)
044
39(81)
28(64)
78(47)
,00001*
Cough
37(97)
132(96)
86(91)
020
79(96)
58(92)
120(83)
00052*
47(98)
40(91)
149(89)
017
Nause
a14(37)
39(28)
28(29)
063
36(44)
23(37)
61(42)
062
28(58)
13(30)
59(36)
00066*
SOB
5(13)
38(28)
20(21)
012
19(23)
14(22)
29(20)
084
24(50)
25(57)
106(63)
022
Congestion
29(78)
88(68)
68(76)
029
64(79)
47(76)
93(65)
0057
37(77)
26(59)
72(46)
00007*
Pinkeye
1(3)
8(6)
7(8)
056
11(14)
3(5)
8(6)
0058
6(13)
1(2)
2(1)
00012*
Bodyach
e12(32)
23(17)
21(22)
013
50(62)
39(62)
76(52)
027
43(90)
35(80)
114(68)
00080*
Headach
e9(24)
18(13)
20(21)
018
55(68)
36(57)
95(66)
038
39(81)
28(64)
99(60)
0023*
Feve
r($
100uC
)28(74)
92(67)
47(49)
00066*
62(76)
34(54)
62(43)
,00001*
20(42)
18(41)
77(46)
076
Days
tose
eking
care
mean
(SD)
36(2
2)
43(4
9)
37(3
1)
043
29(1
6)
41(3
8)
40(2
8)
00076*
47(5
1)
53(3
8)
62(8
3)
038
DoDDepartmentofDefense
FR
febreresp
ratory
ness
SAR
seve
reacu
teresp
ratory
nfectonSOB
shortness
ofbreath.
*SAR
case
sony
dentfedfrom
US-M
exco
borderpopuato
ns.
doi101371/journalpone0114871t002
Epidemiology of Respiratory Infection
PLOS ONE | DOI:10.1371/journal.pone.0114871 December 30, 2014 6 / 16
unknown pathogen were compared among military recruits (Table 3). Chi-square
tests for categorical variables and analysis of variance (ANOVA) tests for
continuous variables were used to identify signs, symptoms, associated with each
pathogen group from all populations. Variables that were univariately associated
with the pathogens (p,0.15) were investigated further in a multinomial logistic
regression model. Variables with a p,0.05 were considered in the final adjusted
model (Tables S1–S2 in S1 File). Coinfections were coded as ‘‘other pathogen’’
even if one pathogen was influenza or rhinovirus.
Statistical analysis was conducted using SAS software (version 9.3, SAS
Institute, Inc., Cary, North Carolina). PROC LOGISTIC with link5GLOGIT was
used for the multinomial modeling and PROC ANOVA and PROC FREQ were
used for ANOVA and chi-squared analyses, respectively.
Results
During the 18 months of the study, October 2011 through March 2013, 1444
patients met the FRI or SARI case definitions and were enrolled in this study,
consisting 406 (28%) from the FRI/SARI border, 423 (29%) from the DoD
beneficiary, and 615 (43%) from the FRI recruit populations. The percent
positivity for each pathogen out of all specimens tested was rhinoviruses (16%),
influenza (14%), RSV (6%), adenovirus (2%), coronaviruses (5%), bacterial
(2%), hMPV (1%), and coinfections (6%). Influenza A (H3N2) was the most
common influenza subtype, making up 54% of influenza specimens, followed by
influenza B (31%), and pH1N1 (13%). Among coronaviruses, CoVOC43 was the
most commonly identified strain, making up 67% of coronavirus specimens,
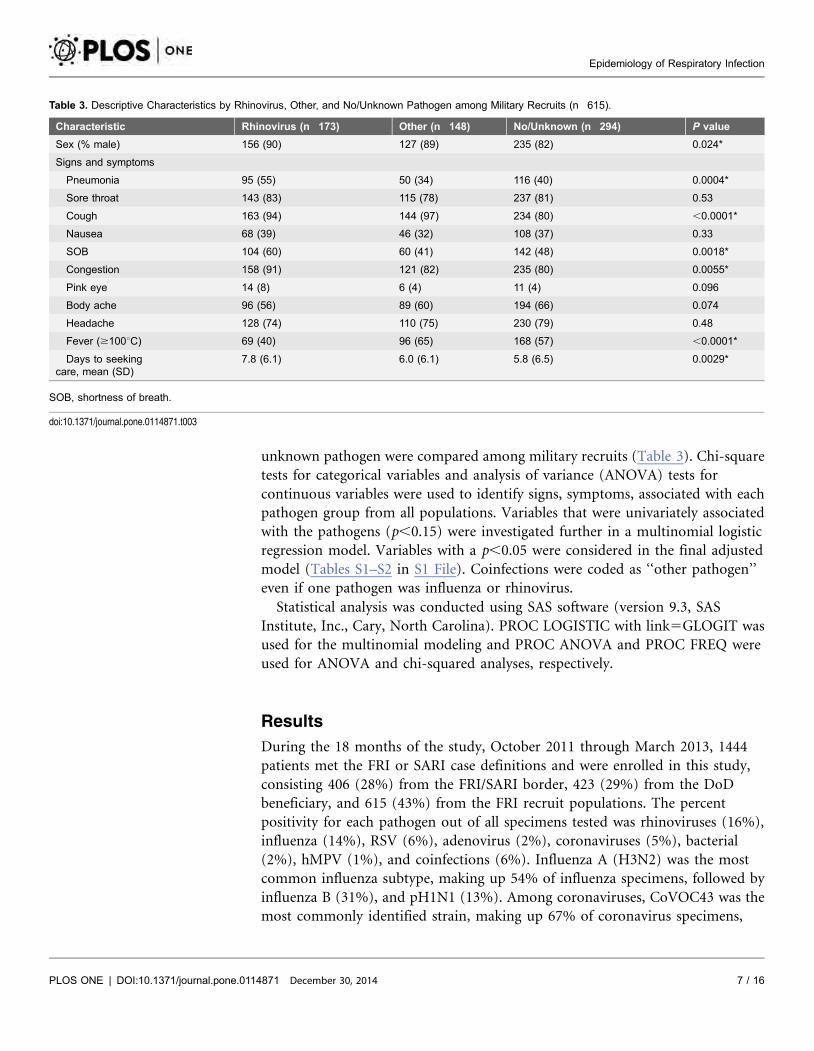
Table 3. Descriptive Characteristics by Rhinovirus, Other, and No/Unknown Pathogen among Military Recruits (n 615).
Characteristic Rhinovirus (n 173) Other (n 148) No/Unknown (n 294) P value
Sex (% male) 156 (90) 127 (89) 235 (82) 0.024*
Signs and symptoms
Pneumonia 95 (55) 50 (34) 116 (40) 0.0004*
Sore throat 143 (83) 115 (78) 237 (81) 0.53
Cough 163 (94) 144 (97) 234 (80) ,0.0001*
Nausea 68 (39) 46 (32) 108 (37) 0.33
SOB 104 (60) 60 (41) 142 (48) 0.0018*
Congestion 158 (91) 121 (82) 235 (80) 0.0055*
Pink eye 14 (8) 6 (4) 11 (4) 0.096
Body ache 96 (56) 89 (60) 194 (66) 0.074
Headache 128 (74) 110 (75) 230 (79) 0.48
Fever ($100uC) 69 (40) 96 (65) 168 (57) ,0.0001*
Days to seekingcare, mean (SD)
7.8 (6.1) 6.0 (6.1) 5.8 (6.5) 0.0029*
SOB, shortness of breath.
doi:10.1371/journal.pone.0114871.t003
Epidemiology of Respiratory Infection
PLOS ONE | DOI:10.1371/journal.pone.0114871 December 30, 2014 7 / 16
followed by CoV229E (21%) and CoVNL63 (12%). (Table 1) Additional testing
found that 1% (8/571) of a subset of specimens were positive for parainfluenza
viruses.
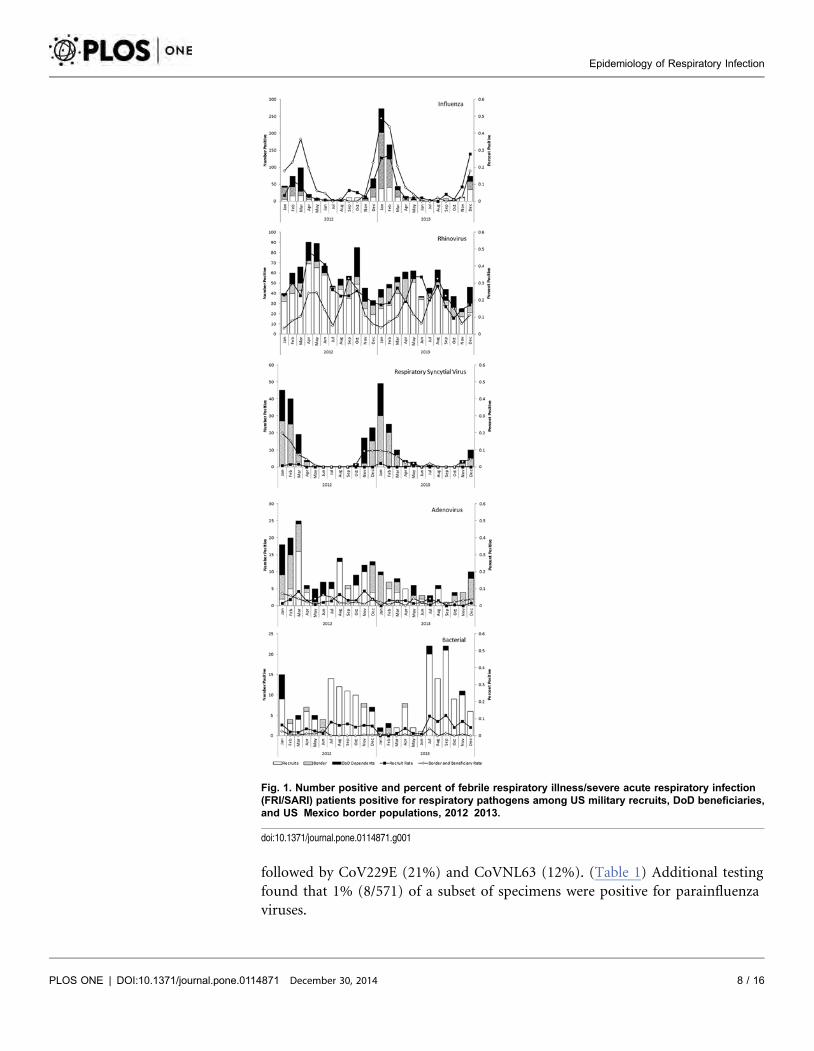
Fig. 1. Number positive and percent of febrile respiratory illness/severe acute respiratory infection(FRI/SARI) patients positive for respiratory pathogens among US military recruits, DoD beneficiaries,and US Mexico border populations, 2012 2013.
doi:10.1371/journal.pone.0114871.g001
Epidemiology of Respiratory Infection
PLOS ONE | DOI:10.1371/journal.pone.0114871 December 30, 2014 8 / 16
Seasonal patterns were apparent for influenza, rhinovirus, and RSV, whereas
more consistent low levels of infection were seen for adenovirus and bacterial
infections. The recruit population had a more constant number of FRI cases
sampled than the other two populations throughout the study period. Overall,
they also had a greater percent positivity for rhinovirus compared with the other
two populations, but lower percent positivity for influenza and RSV. Rhinovirus
appeared to have two peaks: one in spring and one in summer/fall among the
border and beneficiary populations and consistently higher levels among the
recruit population. In all populations influenza and RSV peaked in the winter
(Fig. 1). Influenza A typically peaked before influenza B.
Rhinovirus and bacterial infections were more frequently isolated from recruits
and men who make up the majority of the recruit population; whereas influenza
and RSV were less frequent among these groups compared with the DoD
beneficiary and border populations. Fewer rhinovirus and more RSV pathogens
were identified from SARI cases compared to FRI. Pneumonia and shortness of
breath were more frequent among rhinovirus cases and less common among
influenza cases. However, time to seeking care was shorter for influenza and
hMPV and longest for bacterial infections. Influenza, RSV, adenovirus, and hMPV
cases all had higher temperatures compared with no/unknown pathogens, and
rhinovirus has significantly lower temperature (Table 1).
Descriptive statistics for influenza, other, and no/unknown pathogen among
DoD beneficiaries and US-Mexico border populations showed different clinical
presentation across three age groups. Among 0–4 year olds, influenza was more
frequent among US-Mexico border populations compared to DoD Beneficiaries.
In the youngest age group, sore throat and fever were also more frequent among
those positive for influenza compared to other or no/unknown pathogen and
among 5–24 year olds, cough, fever, and short time to seeking care were more
frequent. Finally, among the 25 and older age group, sore throat, nausea,
congestion, pink eye, body ache, and head ache were more frequently seen in the
influenza group compared to the other groups. Interestingly, fever was the least
frequent among influenza positive participants in the oldest age group (Table 2).
Clinical presentation among recruits also differed by those with laboratory
confirmed rhinovirus, other pathogen, or no/unknown pathogen. A higher
percentage of males were diagnosed with rhinovirus or other pathogen compared
to the other and no/unknown pathogen. Additionally, participants with
rhinovirus had higher percentages of pneumonia, shortness of breath, congestion,
and less fever and longer time to seeking care than the other groups and
participants with either rhinovirus or other pathogen had higher cough than the
no/unknown pathogen group (Table 3).
Building on the descriptive statistics, we found that fever was predicative of
influenza compared to no/unknown pathogen among 0–4 year olds. Among 5–24
year olds, fever, cough, and short time to seeking care were predicative of
influenza compared to no/unknown pathogen. Finally, among those 25 years and
older, sore throat and nausea were predictive of influenza compared to no/
unknown pathogen. (Table S1 in S1 File). Among the recruit population, cough
Epidemiology of Respiratory Infection
PLOS ONE | DOI:10.1371/journal.pone.0114871 December 30, 2014 9 / 16
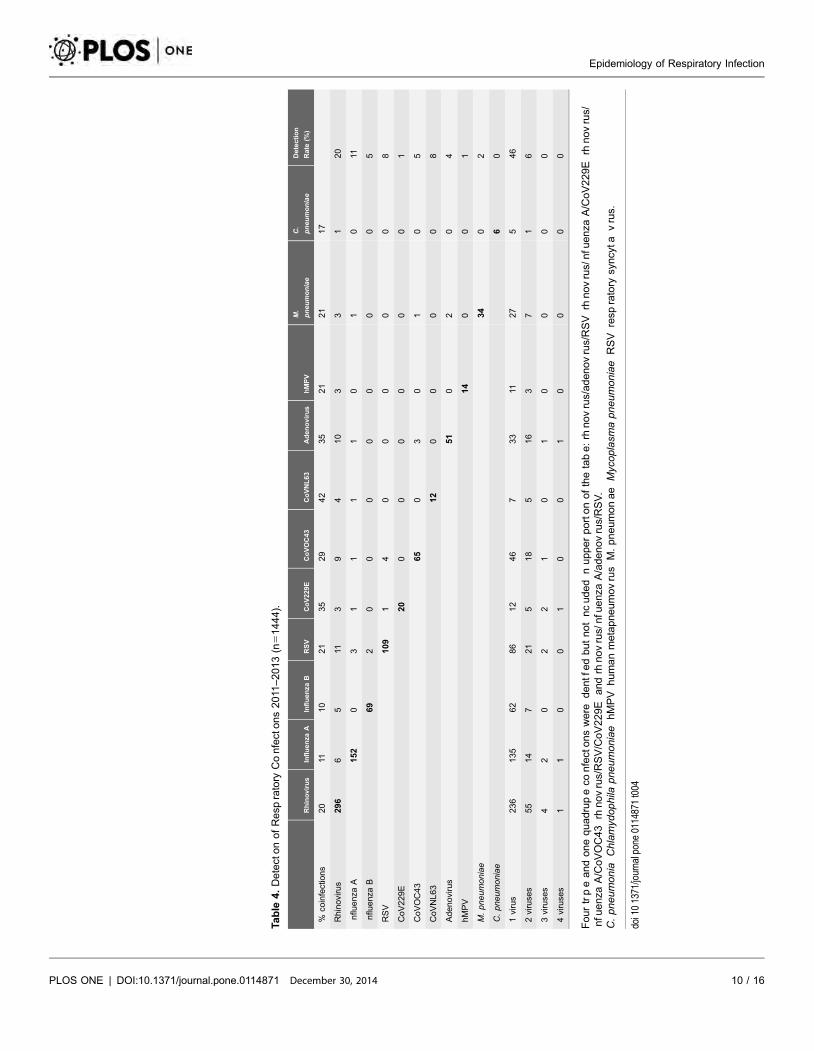
Table
4.DetectonofResp
ratory
Confectons2011
–2013(n
51444).
Rhinovirus
Influenza
AInfluenza
BRSV
CoV229E
CoVOC43
CoVNL63
Adenovirus
hMPV
M.
pneumoniae
C.
pneumoniae
Detection
Rate
(%)
%co
infections
20
1110
21
35
29
42
35
21
21
17
Rhinovirus
296
65
113
94
10
33
120
nflu
enza
A152
03
11
11
01
011
nflu
enza
B69
20
00
00
00
5
RSV
109
14
00
00
08
CoV229E
20
00
00
00
1
CoVOC43
65
03
01
05
CoVNL63
12
00
00
8
Adenovirus
51
02
04
hMPV
14
00
1
M.pneumoniae
34
02
C.pneumoniae
60
1virus
236
135
62
86
12
46
733
1127
546
2viruse
s55
14
721
518
516
37
16
3viruse
s4
20
22
10
10
00
0
4viruse
s1
10
01
00
10
00
0
Fourtrpeandonequadrupeco
nfectonswere
dentfedbutnotncuded
nupperportonofthetabe:rh
novrus/adenovrus/RSV
rhnovrus/nfu
enza
A/CoV229E
rhnovrus/
nfu
enza
A/CoVOC43
rhnovrus/RSV/CoV229E
andrh
novrus/nfu
enza
A/adenovrus/RSV.
C.pneumonia
Chlamyd
ophila
pneumoniae
hMPV
humanmetapneumovrus
M.pneumonae
Mycoplasm
apneumoniae
RSV
resp
ratory
syncy
tavrus.
doi101371/journalpone0114871t004
Epidemiology of Respiratory Infection
PLOS ONE | DOI:10.1371/journal.pone.0114871 December 30, 2014 10 / 16
and less fever were predictive of rhinovirus, and cough, fever, and less shortness of
breath were predictive of other pathogen compared to no/unknown pathogen.
(Table S2 in S1 File).
At least one pathogen was identified in 51% of all FRI and SARI cases.
Coinfections were found in 81 (6%) of all FRI/SARI cases tested, among which
were 76 double, four triple, and one quadruple coinfections. The most frequent
pathogen associated with a coinfection was rhinovirus, followed by RSV and
CoVOC43. The top three most common coinfections were rhinovirus and RSV
(15% of all coinfections, 11 cases), rhinovirus and adenovirus (13% of all
coinfections, 10 cases), and rhinovirus and CoVOC43 (12% of all coinfections, 9
cases). Interestingly, our study found an overall coinfection percent positivity of
6% which declined with age: 11% of 0–4 year olds, 5% of 5–24 year olds, 3% of
25–49 year olds and 2% of 50+ year olds. (Table 4).
Discussion
In order to reduce respiratory disease burden, it is necessary to gain a better
understanding of the percent positivity, coinfection rates, and seasonality of
specific respiratory pathogens. Additionally, a predictive clinical model that uses
symptoms, seasonality, and patient demographics can also help improve
prevention efforts and patient treatment. Timeliness is especially important for
influenza antivirals, which work best if given within the first 48 hours of
symptoms. However, rapid diagnostic tests have poor sensitivity [23] and
multiplex PCR tests are impractical for most clinical settings. Additionally,
treatment with antibiotics can often be incorrectly prescribed for viral infections,
leading to increased antibiotic resistance. Therefore, creating models to better
predict the type of pathogen using symptoms and characteristics easily collected
by a clinician at the time of visit could improve treatment accuracy and help
protect the effectiveness of existing antibiotics and antivirals.
Many respiratory etiology studies have been done outside the United States
among patients with both severe, lower respiratory illness [24, 25, 26], as well as
more mild, upper respiratory disease [7, 8, 9, 10, 11, 12]. These studies are
important because viral etiologies vary across populations and regions, depending
on factors such as population susceptibility, age, circulating strains, climate,
comorbidities, and vaccination coverage. Our study adds to the very limited
number of etiology studies done in the United States [2, 3, 4] by examining viral
etiology among three different US populations: military recruits, DoD
dependents, and a US–Mexico border civilians and including all ages. Our study is
also unique in that it collected clinical signs, symptoms, and demographics for
each case tested with the broad-spectrum respiratory panel. Similar studies have
been limited and have used smaller sample sizes, focused on one age group, and
did not test for as many respiratory pathogens. Identifying population-specific
baselines of infection enables us to identify elevated rates, which may indicate an
outbreak or the start of a pandemic. Recognizing associated symptoms can help
Epidemiology of Respiratory Infection
PLOS ONE | DOI:10.1371/journal.pone.0114871 December 30, 2014 11 / 16
determine the most likely pathogen, as was seen in 2009 with the pandemic
influenza (H1N1) strain first identified in Brawley and San Diego, California, in
two of the populations in this study [27].
There were several key differences of infection among the three populations.
The recruit population had consistently higher levels of rhinovirus and bacterial
infections than the other groups, which may be reflective of close living conditions
and a younger age group, mostly 18–24 years old. This population is also highly
vaccinated for influenza and showed the smallest amount of influenza infection
compared with the other two populations. The higher frequency of influenza
among 0–4 year olds in the US-Mexico border population (61%) compared to
beneficiaries (39%) may be reflective of different exposures or differences in
vaccination uptake. However, the overall frequency of influenza found between
the two groups was similar. Adenovirus, which historically had a large impact on
recruits, was also low as a result of resumption of the adenovirus vaccines in
October 2011 [28]. RSV, which usually infects young children, was more
commonly found in the DoD dependent (48%) and border populations (48%)
compared with the recruits (4%). Overall, rhinoviruses were the most common
respiratory pathogen identified (236 cases, 16%), followed by influenza (197 cases,
14%), RSV (85 cases, 6%), and coronaviruses (66 cases, 5%), which coincides with
other etiology studies [13].
The results of the age-stratified influenza, other pathogen, and no/unknown
results showed some interesting differences across age groups. Most interesting
was the relatively low percentage of influenza positive participants with fever
(42%) in the 25 and older year age group, compared to the 0–4 (74%), and 5–25
year olds (76%). Fever may sometimes be masked by the consumption of
antipyretics, although this group also complained of high headache (81%) and
body ache (90%). The presentation differences of influenza by age could have
some important implications for influenza surveillance, as the standard influenza-
like illness and SARI case definitions require [29]. Consequently, an age-stratified
case definition may be more appropriate as the standard case definitions may be
underestimating the burden of influenza in older age groups. Circulating strains
may also influence clinical presentation across age groups. (Table 2, Table S1 in
S1 File).
In our 5–24 year olds we found fever, cough, and short time to seeking care to
be predictive of influenza infection. Unfortunately, previous studies assessing the
diagnostic accuracy of fever, cough, and acute onset to predict flu have found
them to have low sensitivity (20%), and high specificity (96%) [18]. Another
study, found that sore throat and fever in participants less than 5 years old had a
sensitivity of 51% and specificity of 54% and cough and fever among those greater
than 5 years had a sensitivity of 80% and specificity of 42% [30]. Although
identifying predictive symptoms can be useful, it is important to recognize that
diagnostic accuracy may still be low due to overlapping symptoms of many
respiratory infections and may change due to fluctuations in circulating strains,
age of the population and comorbidities. (Table 2, Table S1 in S1 File).
Epidemiology of Respiratory Infection
PLOS ONE | DOI:10.1371/journal.pone.0114871 December 30, 2014 12 / 16
Rhinovirus was the most frequently identified pathogen among recruits,
although it typically does not present with severe illness or acute onset, which is
reflected in the long time to seeking care among rhinovirus positive participants.
Interestingly, we also found the lowest percentage of fever among participants
positive for rhinovirus compared to any other respiratory pathogen (Table 1).
These findings are similar to other studies [13, 14, 31] and could have important
implications for designing respiratory disease surveillance systems to capture
outbreaks of viruses in the same family. For example, the recent outbreak of
enterovirus 68 has similar symptoms of low fever [32]. (Table 3, Table S2 in S1
File).
Understanding coinfections can also be useful for preventing respiratory
disease. Our study found around 30% to 40% of coronavirus and adenovirus
infections occurred as coinfections and they most frequently occurred with
rhinovirus. Similarly, other studies have also found the highest ratio of
coinfections among adenovirus and coronaviruses [33, 34], and have found
rhinovirus to be part of the most frequently occurring coinfections [26, 33]. These
results suggest that infection with some viruses, such as rhinoviruses, could create
opportunistic environments for colonization with other viruses and bacteria.
Interestingly, coinfections were most common among the youngest age group,
newborn to four years, which did not have the highest rhinovirus rate. Targeting
rhinovirus infection through creation of new vaccines or treatment could have
more far-reaching benefit in protecting a person from other infections.
Respiratory coinfection rates have varied across studies and are likely influenced
by age, type of case definition used to enroll participants, and pathogens tested.
Previous studies with a median age of 2–3 years old have found coinfections
among SARI and acute respiratory tract infections of 17% and 19%, respectively
[26, 33]. A third study among childcare attendees in the US found even higher
coinfection rates of 47% [4]. Finally, a study from Scotland that tested respiratory
specimens from all age groups found a coinfection rate of 5% [34]. These studies
coincide with ours and show high coinfection rates among children. Declining
coinfection rates with age may be a result of overall increased immunity to a broad
range of respiratory pathogens as people get older.
One limitation of this study is that it only captured people with FRI/SARI who
sought medical care. Military recruits may be less likely to seek care than other
groups due to concern over losing training time or having to restart the program.
Therefore, the etiology of more mild infections may be underrepresented for these
two groups. Additionally, the case definitions were slightly different for the three
populations, which may have influenced which pathogens were identified in each
group. Although this study involved three different US populations, the results of
this study may be less generalizable to the general US public who are not
associated with the military or living on the US–Mexico border. Despite this, signs
and symptoms from these pathogens should be similar across other populations
in similar age groups and with similar vaccination coverage. Additionally, we
found that seasonality of infection for recruits was similar to that of the border
and beneficiary populations for several pathogens, but with different intensity.
Epidemiology of Respiratory Infection
PLOS ONE | DOI:10.1371/journal.pone.0114871 December 30, 2014 13 / 16
Consequently, illness surveillance in recruits, which made up the largest
proportion of our study population, can be beneficial in informing disease trends
in the general public.
Although we tested for many pathogens, there are likely still circulating viruses
and bacteria for which we did not test, such as bocavirus, CoVHKU1, or
potentially unrecognized viruses; therefore, these cases were likely incorrectly
classified as part of the ‘‘no pathogen’’ group. Additionally, the timing of sample
collection in the course of illness could impact whether or not viruses were
identified by PCR. Symptom collection may also be biased in the youngest age
group of 0–4 year olds, who may not be able to articulate how they are feeling.
Despite this, our study was part of a well-established existing surveillance program
that consistently collected and tested a substantial number of specimens at many
different sites across the United States. In the future, additional years of
surveillance data will continue to improve our understanding of seasonality.
Although nothing will replace the accuracy of laboratory diagnostics, a broader
understanding of seasonality, clinical presentation, demographics, and coinfection
rates of pathogen specific respiratory diseases can improve diagnosis and
treatment, by informing clinicians on appropriate antiviral and antibiotic
treatment during the patient’s visit. This can ultimately reduce the number of lost
work days and transmission. Additionally, describing baseline of disease and
seasonality for specific pathogens can improve our ability to detect outbreaks.
Identifying the percent positivity of each pathogen, coinfection rates, and risk
factors for disease will help inform vaccination programs, and possible investment
in the development of future vaccines or treatments.
Supporting Information
S1 File. Tables S1 and S2. Table S1. Age Stratified Multinomial Logistic
Regression Predicting Influenza, Other Pathogen, or No/Unknown Pathogen
among DoD Beneficiaries and US-Mexico Border Populations Using Participant
Characteristics. Table S2. Multinomial Logistic Regression Predicting Rhinovirus,
Other Pathogen, or No/Unknown Pathogen among Military Recruits Using
Participant Characteristics, Recruits, N5613.
doi:10.1371/journal.pone.0114871.s001 (DOCX)
Acknowledgments
We thank Maria Rosario Araneta, Patrick Blair, Daisy Cabrera, Johnnie Conolly,
Jennifer Cortinas, Larivhie DelaCruz, Daniel Edgeworth, Maria Fierro, James
Fowler, Holly Gallo, Christian Hansen, Elizabeth Hunt, Paula Kriner, Michelle
LeWark, Erin McDonough, Patricia Michaels, Sonia Montiel, Chris Myers, Viola
Paulk, Michelle Ricketts, Richard Shaffer, Jennifer Smith, and Steven Waterman.
Disclaimer: The views expressed in this article are those of the authors and do not
reflect the official policy or position of the Department of the Navy, Department
Epidemiology of Respiratory Infection
PLOS ONE | DOI:10.1371/journal.pone.0114871 December 30, 2014 14 / 16
of Defense, or the US Government. Approved for public release; distribution is
unlimited. U.S. Government Work (17 USC 105). Not copyrighted in the U.S.
This research was conducted in compliance with all applicable federal and
international regulations governing the protection of human subjects in research
(protocols NHRC 31230 and NHRC.1999.0002).
Author ContributionsConceived and designed the experiments: AWH JMR PEK MB SPL RR GTB.
Performed the experiments: MB. Analyzed the data: JMR AWH RR SPL.
Contributed to the writing of the manuscript: JMR AWH PEK MB SPL RR GTB.
References
1. World Health Organization (WHO). Acute respiratory infections. Available: http://www.who.int/vaccine_research/diseases/ari/en/index.html. Accessed 2013 Nov 21.
2. Landes MB, Neil RB, McCool SS, Mason BP, Woron AM, et al. (2013) The frequency and seasonalityof influenza and other respiratory viruses in Tennessee: two influenza seasons of surveillance data,2010 2012. Influenza Other Respir Viruses 7: 1122 1127.
3. Fowlkes A, Giorgi A, Erdman D, Temte J, Goodkin K, et al. (2014) Viruses associated with acuterespiratory infections and influenza like illness among outpatients from the Influenza IncidenceSurveillance Project, 2010 2011. J Infect Dis 209: 1715 1725.
4. Martin ET, Fairchok MP, Stednick ZJ, Kuypers J, Englund JA (2013) Epidemiology of multiplerespiratory viruses in childcare attendees. J Infect Dis 207: 982 989.
5. Berkley JA, Munywoki P, Ngama M, Kazungu S, Abwao J, et al. (2010) Viral etiology of severepneumonia among Kenyan infants and children. JAMA 303: 2051 2057.
6. Bellei N, Carraro E, Perosa A, Watanabe A, Arruda E, et al. (2008) Acute respiratory infection andinfluenza like illness viral etiologies in Brazilian adults. J Med Virol 80: 824 827.
7. Li H, Wei Q, Tan A, Wang L (2013) Epidemiological analysis of respiratory viral etiology for influenzalike illness during 2010 in Zuhai, China. Virol J 10: 1 10.
8. Laguna-Torres VA, Gomez J, Ocana V, Aguilar P, Saldarriaga T, et al. (2009) Influenza like illnesssentinel surveillance in Peru. PLoS One 4: 1 13.
9. Nicholson K, Kent J, Hammersley V, Cancio E (1997) Acute viral infections of upper respiratory tract inelderly people living in the community: comparative, prospective population based study of diseaseburden. BMJ 315: 1060 1064.
10. Njouom R, Yekwa EL, Cappy P, Vabret A, Boisier P, et al. (2012) Viral etiology of influenza likeillnesses in Cameroon, January December 2009. J Infect Dis 206: S29 S35.
11. Razanajatovo NH, Richard V, Hoffman J, Reynes JM, Razafitrimo GM, et al. (2011) Viral etiology ofinfluenza like illnesses in Antananarivo, Madagascar, July 2008 to June 2009. PLoS One 6: 1 7.
12. Renois F, Talmud D, Huguenin A, Moutte L, Strady C, et al. (2010) Rapid detection of respiratory tractviral infections and coinfections in patients with influenza like illnesses by use of reverse transcriptionPCR DNA microarray systems. J Clin Microbiol 48: 3836 3842.
13. Galindo-Fraga A, Ortiz-Hernandez AA, Ramırez-Venegas A, Vazquez RV, Moreno-Espinosa S,et al. (2013) Clinical characteristics and outcomes of influenza and other influenza like illness in MexicoCity. Int J Infect Dis 17: e510 517.
14. Budge PJ, Griffin MR, Edwards KM, Williams JV, Verastegui H, et al. (2014) A household basedstudy of acute viral respiratory illnesses in Andean children. Pediatr Infect Dis J 33: 443 447.
Epidemiology of Respiratory Infection
PLOS ONE | DOI:10.1371/journal.pone.0114871 December 30, 2014 15 / 16
15. Lee VJ, Yap J, Cook AR, Tan CH, Loh JP, et al. (2011) A clinical diagnostic model for predictinginfluenza among young adult military personnel with febrile respiratory illness in Singapore. PLoS One 6:1 5.
16. Boivin G, Hardy I, Tellier G, Maziade J (2000) Predicting influenza infections during epidemics with useof a clinical case definition. Clin Infect Dis 31: 1166 1169.
17. Monto AS, Gravenstein S, Elliott M, Colopy M, Schweinle J (2000) Clinical signs and symptomspredicting influenza infection. Arch Intern Med 160: 3243 3247.
18. Woolpert T, Brodine S, Lemus H, Waalen J, Blair P, et al. (2012) Determination of clinical anddemographic predictors of laboratory confirmed influenza with subtype analysis. BMC Infect Dis 12: 111.
19. Yang X, Yao Y, Chen M, Yang X, Xie Y, et al. (2012) Etiology and clinical characteristics of influenza likeillness (ILI) in outpatients in Beijing, June 2010 to May 2011. PLoS One 7: 1 8.
20. Call SA, Vollenweider MA, Hornung CA, Simel DL, McKinney WP (2005) Does this patient haveinfluenza? JAMA [reprinted] 293: 987 997.
21. Diagnostic Hybrids. Collection and Transport: Universal Transport Medium. Available: http://www.dhiusa.com/content/product/universal_transport_medium_utm. Accessed 2014 Sep 18.
22. Lu X, Holloway B, Dare RK, Kuypers J, Yagi S, et al. (2008) Real time reverse transcription PCRassay for comprehensive detection of human rhinovirus. J Clin Microbiol 46: 533 539.
23. Uyeki TM, Prasad R, Vukotich C, Stebbins S, Rinaldo CR, et al. (2009) Low sensitivity of rapiddiagnostic test for influenza. Clin Infect Dis 48: e89 92.
24. Nakanishi M, Yoshida Y, Takeda N, Hirana H, Horita T, et al. (2011) Community acquired pneumoniadistinguished from influenza infection based on clinical signs and symptoms during a novel (swine)influenza A/H1N1 pandemic. Prim Care Respir J 20: 421 426.
25. Carballal G, Videla CM, Espinosa MA, Savy V, Uez O, et al. (2011) Multicentered study of viral acutelower respiratory infections in children from four cities of Argentina, 1993 1994. J Med Virol 64: 167174.
26. Pretorius MA, Madhi SA, Cohen C, Naidoo D, Groome M, et al. (2012) Respiratory viral coinfectionsidentified by a 10 plex real time reverse transcription polymerase chain reaction assay in patientshospitalized with severe acute respiratory illness South Africa, 2009 2010. J Infect Dis 206: S159 165.
27. Metzgar D, Baynes D, Myers CA, Kammerer P, Unabia M, et al. (2010) Initial identification andcharacterization of an emerging zoonotic influenza virus prior to pandemic spread. J Clin Microbiol 48:4228 4234.
28. Hoke CH Jr, Snyder CE Jr (2013) History of the restoration of adenovirus type 4 and type 7 vaccine, liveoral (Adenovirus Vaccine) in the context of the Department of Defense acquisition system. Vaccine 31:1623 1632.
29. World Health Organization. WHO surveillance case definitions for ILI and SARI. Available: http://www.who.int/influenza/surveillance monitoring/ili sari surveillance case definition/en/. Accessed 2014 Sep16.
30. Hirve S, Chadha M, Lele P, Lele P, Lafond KE, et al. (2012) Performance of case definitions used forinfluenza surveillance among hospitalized patients in a rural area of India. Bull World Health Organ 90:804 12.
31. Messacar K, Robinson CC, Bagdure D, Curtis DJ, Glode MP, et al. (2012) Rhino/enteroviruses inhospitalized children: a comparison to influenza viruses. J Clin Virol 56: 41 45.
32. Midgley CM, Jackson MA, Selvarangan R, Turabeldize G, Obringer E, et al. (2014) Severerespiratory illness associated with enterovirus D68 Missouri and Illinois, 2014. MMWR Morb MortalWkly Rep 63: 773.
33. Kim JK, Jeon J-S, Kim JW, Rheem I (2013) Epidemiology of respiratory viral infection using multiplexRT PCR in Cheonan, Korea (2006 2010). J Microbiol Biotechnol 23: 267 273.
34. Gaunt ER, Hardie A, Claas ECJ, Simmonds P, Templeton E (2010) Epidemiology and clinicalpresentations of four human coronaviruses 229E, HKU1, and OC43 detected over 3 years using a novelmultiplex real time PCR method. J Clin Microbiol 48: 2940 2947.
Epidemiology of Respiratory Infection
PLOS ONE | DOI:10.1371/journal.pone.0114871 December 30, 2014 16 / 16
NAVHLTHRSCHCENINST 5600.1D 4/2013 Enclosure (5)
REPORT DOCUMENTATION PAGE
The public reporting burden for his collection of informa ion is estimated to average 1 hour per response, including the time for reviewing instructions, searching existing data sources, gathering and maintaining the data needed, and completing and reviewing the collection of information. Send comments regarding this burden estimate or any other aspect of this collection of information, including suggestions for reducing the burden, to Washington Headquarters Services, Directorate for Information Operations and Reports, 1215 Jefferson Davis Highway, Suite 1204, Arlington, VA 22202-4302, Respondents should be aware that notwi hstanding any other provision of law, no person shall be subject to any penalty for failing to comply with a collection of information if it does not display a currently valid OMB Control number. PLEASE DO NOT RETURN YOUR FORM TO THE ABOVE ADDRESS. 1. REPORT DATE (DD MM YY)
10 04 14 2. REPORT TYPE
Journal Article 3. DATES COVERED (from – to)
December 2012–present
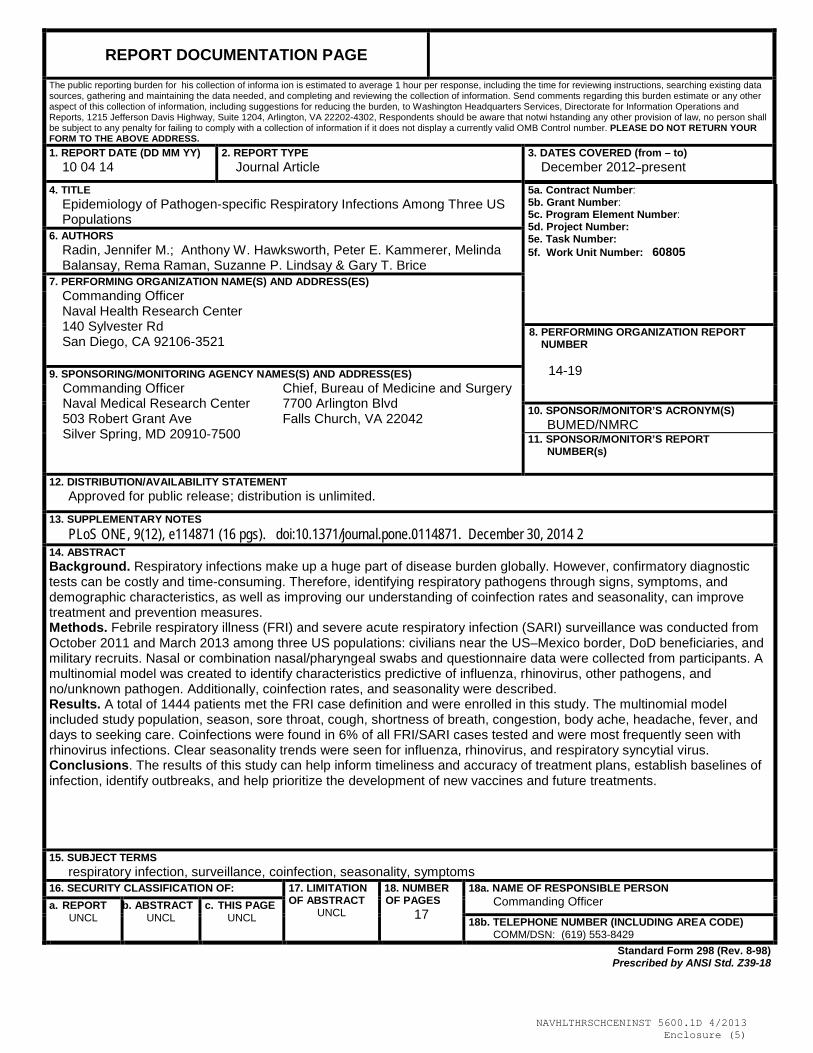
4. TITLE Epidemiology of Pathogen-specific Respiratory Infections Among Three US Populations
5a. Contract Number: 5b. Grant Number: 5c. Program Element Number: 5d. Project Number: 5e. Task Number: 5f. Work Unit Number: 60805
6. AUTHORS Radin, Jennifer M.; Anthony W. Hawksworth, Peter E. Kammerer, Melinda Balansay, Rema Raman, Suzanne P. Lindsay & Gary T. Brice
7. PERFORMING ORGANIZATION NAME(S) AND ADDRESS(ES) Commanding Officer Naval Health Research Center 140 Sylvester Rd San Diego, CA 92106-3521
8. PERFORMING ORGANIZATION REPORT NUMBER
14-19
9. SPONSORING/MONITORING AGENCY NAMES(S) AND ADDRESS(ES)
Commanding Officer Chief, Bureau of Medicine and Surgery Naval Medical Research Center 7700 Arlington Blvd 503 Robert Grant Ave Falls Church, VA 22042 Silver Spring, MD 20910-7500
10. SPONSOR/MONITOR’S ACRONYM(S) BUMED/NMRC
11. SPONSOR/MONITOR’S REPORT NUMBER(s)
12. DISTRIBUTION/AVAILABILITY STATEMENT Approved for public release; distribution is unlimited.
13. SUPPLEMENTARY NOTES PLoS ONE, 9(12), e114871 (16 pgs). doi:10.1371/journal.pone.0114871. December 30, 2014 2
14. ABSTRACT Background. Respiratory infections make up a huge part of disease burden globally. However, confirmatory diagnostic tests can be costly and time-consuming. Therefore, identifying respiratory pathogens through signs, symptoms, and demographic characteristics, as well as improving our understanding of coinfection rates and seasonality, can improve treatment and prevention measures. Methods. Febrile respiratory illness (FRI) and severe acute respiratory infection (SARI) surveillance was conducted from October 2011 and March 2013 among three US populations: civilians near the US–Mexico border, DoD beneficiaries, and military recruits. Nasal or combination nasal/pharyngeal swabs and questionnaire data were collected from participants. A multinomial model was created to identify characteristics predictive of influenza, rhinovirus, other pathogens, and no/unknown pathogen. Additionally, coinfection rates, and seasonality were described. Results. A total of 1444 patients met the FRI case definition and were enrolled in this study. The multinomial model included study population, season, sore throat, cough, shortness of breath, congestion, body ache, headache, fever, and days to seeking care. Coinfections were found in 6% of all FRI/SARI cases tested and were most frequently seen with rhinovirus infections. Clear seasonality trends were seen for influenza, rhinovirus, and respiratory syncytial virus. Conclusions. The results of this study can help inform timeliness and accuracy of treatment plans, establish baselines of infection, identify outbreaks, and help prioritize the development of new vaccines and future treatments.
15. SUBJECT TERMS respiratory infection, surveillance, coinfection, seasonality, symptoms
16. SECURITY CLASSIFICATION OF: 17. LIMITATION OF ABSTRACT
UNCL
18. NUMBER OF PAGES
17
18a. NAME OF RESPONSIBLE PERSON Commanding Officer a. REPORT
UNCL b. ABSTRACT
UNCL c. THIS PAGE
UNCL 18b. TELEPHONE NUMBER (INCLUDING AREA CODE) COMM/DSN: (619) 553-8429
Standard Form 298 (Rev. 8-98) Prescribed by ANSI Std. Z39-18