Embed Size (px)
Citation preview

Research ArticleDetection of Melamine in Soybean Meal UsingNear-Infrared Microscopy Imaging with Pure ComponentSpectra as the Evaluation Criteria
Zengling Yang,1 Lujia Han,1 Chengte Wang,1 Jing Li,1,2 Juan A. Fernández Pierna,3
Pierre Dardenne,3 and Vincent Baeten3
1College of Engineering, China Agricultural University, Haidian District, Beijing 100083, China2Engineering College, Jiangxi Agricultural University, Nanchang 330045, China3Valorisation of Agricultural Products Department, Walloon Agricultural Research Centre (CRA-W), Henseval Building,24 Chaussee de Namur, 5030 Gembloux, Belgium
Correspondence should be addressed to Lujia Han; [email protected]
Received 27 July 2016; Accepted 30 August 2016
Academic Editor: Antonio A. Dos Santos
Copyright © 2016 Zengling Yang et al. This is an open access article distributed under the Creative Commons Attribution License,which permits unrestricted use, distribution, and reproduction in any medium, provided the original work is properly cited.
Soybean meal was adulterated with melamine with the purpose of boosting the protein content for unlawful interests. In recentyears, the near-infrared (NIR) spectroscopy technique has been widely used for guaranteeing food and feed security for its fast,nondestructive, and pollution-free characteristics. However, there are problems with using near-infrared (NIR) spectroscopy fordetecting samples with low contaminant concentration because of instrument noise and sampling issues. In addition, methodsbased on NIR are indirect and depend on calibration models. NIR microscopy imaging offers the opportunity to investigate thechemical species present in food and feed at the microscale level (the minimum spot size is a few micrometers), thus avoiding theproblem of the spectral features of contaminants being diluted by scanning.The aim of this work was to investigate the feasibility ofusingNIRmicroscopy imaging to identifymelamine particles in soybeanmeal using only the pure component spectrum.The resultspresented indicate that using the classical least squares (CLS) algorithm with the nonnegative least squares (NNLS) algorithm,without needing first to develop a calibration model, could identify soybean meal that is both uncontaminated and contaminatedwith melamine particles at as low a level as 50mg kg−1.
1. Introduction
Soybeanmeal is one of themost important feed rawmaterialsand one of the main ingredients in compound feed becauseit has a complete protein profile. In the past decade,the price of soybean meal has tripled (http://faostat3.fao.org/home/index.html). The price is dictated by the pro-tein content: the higher the content, the higher the price.There have been recent cases of soybean meal being adulter-ated with melamine (1,3,5-triazine-2,4,6-triamine) in orderto boost the protein content [1]. There have also been caseswhere it was suspected that soybean meal had been contami-nated with low melamine levels. The reference methods (wetchemistry) usually are time-consuming and expensive, cause
damage to the sample, and need chemical reagent [2–5]. Sothere is a real need for fast, nondestructive, and automaticallycontrolled screening methods that will guarantee quality andsecurity.
Near-infrared (NIR) spectroscopy is widely used in thiscontext because it is a rapid, nondestructive, and nonpollut-ingmethod that requiresminimumor no sample preparation[6]. Applications vary from sample chemical compositionto detecting adulteration or contaminant ingredients in rawmaterials and compound feed [7, 8]. Many studies haveinvestigated the feasibility of using NIR to detect melamine[9–14], but there are still some problems here when it comesto testing samples with low melamine content because of theinstrument noise and sampling design error [15, 16]. NIR can
Hindawi Publishing CorporationJournal of SpectroscopyVolume 2016, Article ID 5868170, 11 pageshttp://dx.doi.org/10.1155/2016/5868170

2 Journal of Spectroscopy
Soybean meal
Melamine
Soybean meal
Melamine
Soybean meal
Melamine
Melamine
Soybean meal
(s1#)
(s4#)
(m1#)
(s3#)
(m2#)
(m3#)
(s2#)
(m4#)
(a)
Soybean meal(S2)
Soybean meal(S3)
Soybean meal(S1)
Soybean meal(S4)
(b)
Figure 1: Experimental sample: (a) Set A-1; (b) Set A-2, melamine: line of dashes.
only acquire the spectra information but cannot provide thespatial information of the sample. NIR microscopy (NIRM)which combines NIR and digital images together is able tocollect the spectrum of individual particles (the minimumspot size is a few micrometers) from samples [17]. With thedevelopment of a high-precision 𝑋-𝑌 motion stage, NIRMimaging is obtained by successively measuring spectra whilethe sample is repositioned in the𝑋 and𝑌 spatial dimensions.Thus, the technique offers an opportunity to explore not onlywhat kinds of chemical species are present at the microscalelevel, but also where they might be present [18].
NIRM imaging is a type of NIR imaging and has betterspatial resolution. In the past decade, NIR imaging hasbecome a powerful analytical tool for detecting contaminantsand defects in agrofood products [19–25]. For feed products,several investigations have been conducted on the feasibilityof using NIRM to detect, identify, and quantify processedanimal byproducts [26–30] and on usingNIR imaging for thecomplete screening of compound feeds [31].
The aim of this study was to investigate the feasibility ofusing NIRM imaging to identify melamine particles in soy-bean meal. The classical least squares (CLS) algorithm withthe nonnegative least squares (NNLS) algorithmwas used forthe analysis of soybean meal adulterated with melamine.
2. Materials and Methods
2.1. Experimental Design. A total of 20 soybeanmeal sampleswere collected from various feed manufacturers and wereground to pass through a 0.5mm sieve. And 3 melaminesampleswere bought from three chemical reagent companies,with 99% of the particles being less than 0.25mm (analyticalreagent, C3H6N6 content certified by the company ≥99.5%).For this study, three sets of samples were used. Set A wasprepared artificially in order to develop a method withoutthe need to create the calibration model. Set B was preparedusing representative matrixes to validate the reliability androbustness of the method. Set C was prepared with lowmelamine content in order to investigate the sensitivity of themethod.
2.1.1. Experimental Sample: Set A. Samples were artificiallyprepared on Teflon Spectralon using soybean meal andmelamine particles (Set A-1, Figure 1(a)): a melamine particle(m2#) was placed on top of a soybean meal particle (s2#); amelamine particle (m4#) was placed under a soybean mealparticle (s4#); a melamine particle (m3#) and a soybeanmeal particle (s3#) were clustered together; a singlemelamineparticle (m1#) was used alone; and a single soybean mealparticle (s1#) was used alone.
If a melamine particle is placed under a soybean mealparticle, the thickness of the latter would affect the detec-tion of the melamine particle. In order to study how thisthickness affected the method, other samples were artificiallyprepared with different soybean meal thicknesses (Set A-2,Figure 1(b)). S1, S2, S3, and S4 relate to soybeanmeal that wasabout 30, 50, 100, and 110 𝜇m thick, respectively.
2.1.2. Experimental Sample: Set B. For Set B, using 20 soy-bean meal and 3 melamine samples, 20 sample mixturescontaminated with 5, 10, 25, and 50 g kg−1 of melamine,respectively, with five replicate samples for each melaminecontent level, were prepared with a mixer (REAX 20/8;Heidolph, Schwabach, Germany) in the laboratory (Table 1).In order to achieve a homogeneous distribution of melaminein the soybean meal, a stepwise dilution procedure wasapplied to ensure that in each dilution step the ratio of thetwo materials to be mixed did not exceed a factor of 3 [32].
2.1.3. Experimental Sample: Set C. As shown in Table 1, 4sample mixtures contaminated with 1,000, 500, 100, and50mg kg−1 of melamine, respectively, were prepared in thelaboratory using 4 soybean meal and 3 melamine samples.
2.2. Data Acquisition. All the samples (Set A, Set B, Set C, and20 pure soybean meal and 3 pure melamine samples) wereanalyzed using aNIRM imaging system (Spotlight400, PerkinElmer), with 16 spectra being acquired simultaneously fromthe line detector.The detector in this instrument is a mercurycadmium telluride (HgCdTe or MCT).The spatial resolutionof scanning is 25 × 25 𝜇m and the spectral resolution is

Journal of Spectroscopy 3
Table 1: Description of the samples Set B and Set C.
Soybean mealsample number
Melaminesample number
Set B Set CSample number Melamine (g kg−1) Sample number Melamine (mg kg−1)
Soy 1 Mel 1 Set B1 5 Set C1 1,000
Soy 2 Mel 2 Set B2 5 Set C2 500
Soy 3 Mel 3 Set B3 5 Set C3 100
Soy 4 Mel 1 Set B4 5 Set C4 50
Soy 5 Mel 2 Set B5 5 / /
Soy 6 Mel 3 Set B6 10 / /
Soy 7 Mel 1 Set B7 10 / /
Soy 8 Mel 2 Set B8 10 / /
Soy 9 Mel 3 Set B9 10 / /
Soy 10 Mel 1 Set B10 10 / /
Soy 11 Mel 2 Set B11 25 / /
Soy 12 Mel 3 Set B12 25 / /
Soy 13 Mel 1 Set B13 25 / /
Soy 14 Mel 2 Set B14 25 / /
Soy 15 Mel 3 Set B15 25 / /
Soy 16 Mel 1 Set B16 50 / /
Soy 17 Mel 2 Set B17 50 / /
Soy 18 Mel 3 Set B18 50 / /
Soy 19 Mel 1 Set B19 50 / /
Soy 20 Mel 2 Set B20 50 / /
32 cm−1. Ratio spectra (𝑅 = 𝑅sample/𝑅teflon) were collectedusing a Teflon Spectralon (Spectralon� Targets, Labsphere,Inc., North Sutton, New Hampshire) as the reflectancestandard and then converted into absorbance (𝐴) by 𝐴 =log10(1/𝑅). Each spectrum was the average of four scansacross the wavenumber range of 7,808–4,000 cm−1.
One image (an area of 8.75 × 8.75mm coupled with 350 ×350 pixels; 122,500 spectra) was scanned for each of Set B andSet C (samples with 1,000, 500, and 100mg kg−1 melamine),respectively. In Set C, four images of samples with 50mg kg−1melamine were scanned, because it was more difficult toidentify melamine particles at low concentrations.
One image (an area of 1.25 × 1.25mm coupled with 50 ×50 pixels; 2,500 spectra) was scanned for each of the 20 puresoybean meal and 3 pure melamine samples.
2.3. Data Analysis
2.3.1. Preprocessing. The main purpose of preprocessing wasto remove spectral and spatial artifacts such as rough surfaces,optic effects, and detector noise. The NIRM imaging datacube and the pure component spectra were both prepro-cessed by applying a first derivative using the Savitzky-Golay algorithm with a five-point filter width and a degree2 polynomial [33]. The noisy part at the end of the spectrawas removed by reducing the spectral range to between 7,300and 4,100 cm−1.
2.3.2. Chemometric Tools. The classical least squares (CLS)algorithm was used to extract melamine distribution mapsfrom whole wavelengths [34, 35]. This algorithm is a suitablemethod involving minimizing the sum of squared residualsin order to predict concentrations using reference spectraonly. It was based on the assumption that the absorbancespectra from a pixel in NIRM imaging can be viewed as theweighted sum of the absorbance of each pure componentspectrum constituting the sample, as well as the experimentalnoise. Initially, the data cube (𝑥 × 𝑦 × 𝜆) was unfolded intoa two-dimensional matrix 𝑋 = (𝑥𝑦 × 𝜆). Matrix 𝑋 was thendecomposed as follows:
𝑋 = 𝐶𝑆𝑇 + 𝐸, (1)
where 𝑆𝑇 represents the pure component signals; 𝐶 is therelative concentration matrix; and 𝐸 is the error matrix.𝐶 was estimated by the pseudoinverse 𝐶 = 𝑋𝑆(𝑆𝑡𝑆)−1
using the nonnegative least squares (NNLS) algorithm. Theconcentration of melamine and soybean meal, respectively,was then calculated as follows [36]:
𝐶mel = 1000 ×∑𝑛𝑖=1 𝐶𝑖
(∑𝑛𝑖=1 𝐶𝑖 + ∑𝑛𝑗=1 𝐶𝑗),
𝐶soy = 1000 ×∑𝑛𝑗=1 𝐶𝑗
(∑𝑛𝑖=1 𝐶𝑖 + ∑𝑛𝑗=1 𝐶𝑗),
(2)
4 Journal of Spectroscopy
where𝐶mel (g kg−1) is the melamine concentration of sample;
𝐶𝑖 is the melamine concentration of each pixel in the NIRMimage predicted byCLS;𝐶𝑗 is the soybeanmeal concentrationof each pixel in the NIRM image predicted by CLS; 𝑛 is thenumber of pixels in one NIRM image; and𝐶soy (g kg−1) is thesoybean meal concentration of the sample.
All 𝐶𝑖 or 𝐶𝑗 values formed a chemical image in whichhigher pixel intensity reflected higher target concentration.Matlab� (The MathWorks, http://www.mathworks.com/)and the PLS Toolbox (Eigenvector Research, http://www.eigenvector.com/) were used to perform this analysis.
3. Results and Discussion
3.1. Soybean Meal and Melamine Component Spectra. Themelamine reference spectrum was obtained by averaging allthe pixel spectra of 3 pure melamine images, and the soybeanmeal reference spectrum was obtained by averaging all thepixel spectra of 20 pure soybean meal images (Figure 2).Melamine is a triazine heterocyclic organic compound, com-posed of nitrogen heterocyclic rings and -NH2. The NIRregion offers a special advantage in the measurement of theprimary amine NH2 group because of a unique combinationband [37]. Melamine has three strong characteristic peaksin the 6,900–6,450 cm−1 range, especially near 6,805 cm−1,which is the N-H combination band (]N-H asymmetricand ]N-H symmetric combination) from primary amides.Figure 2 showed that melamine has a distinctive spectralfeature compared with soybean meal, facilitating the identifi-cation of melamine particles present in mixtures.
3.2. Soybean Meal Analysis Using CLS. Table 2 showed theminimum 𝐶𝑗 of 20 soybean meal samples which were calcu-lated by CLS. Meanwhile, the mean value of the minimumvalues of𝐶𝑗 is 0.8822 and the standard deviation is 0.0484. Inconsideration of the conciseness and effectiveness, the liminalvalue of soybean meal’s 𝐶𝑗 was 0.8.
3.3. Melamine Detection Using CLS. Figure 3 showed thedetection results of Set A samples using CLS algorithm.Figure 3(a) was a soybean meal image produced by CLS.Four soybean meal particles (s1#, s2#, s3#, and s4#) couldbe correctly identified. Figure 3(b) showed amelamine imageproduced by CLS. CLS could detect the presence ofmelaminem1#, m2#, and m3#, but not m4# which was placed under a150 𝜇mthick soybeanmeal particle. In order to investigate theeffect of soybeanmeal thickness on the detection ofmelamineunder the soybean meal particle using the CLS algorithm, animage of sample Set A-2 was obtained and analyzed usingCLS. When the soybean meal was 30 𝜇m and 50 𝜇m thick,CLS could detect the presence of melamine, but it could notdo so if the melamine was under soybean meal that wasthicker than 100 𝜇m. In addition, the signal of the melamineunder soybean meal that was 50 𝜇m thick was weaker thanthe signal when the thickness was 30𝜇m, illustrating the dif-ficulty of detecting the presence ofmelamine whenmelamineparticles were embedded in soybean meal particles.
Table 2: The minimum 𝐶𝑗 of 20 soybean meal samples calculatedby CLS.
Sample number Min of 𝐶𝑗Soy 1 0.9387Soy 2 0.8099Soy 3 0.9317Soy 4 0.9358Soy 5 0.9278Soy 6 0.7671Soy 7 0.8276Soy 8 0.9322Soy 9 0.9008Soy 10 0.8214Soy 11 0.8721Soy 12 0.9315Soy 13 0.9084Soy 14 0.8611Soy 15 0.8941Soy 16 0.8941Soy 17 0.9036Soy 18 0.8479Soy 19 0.8702Soy 20 0.8677
Sample Set B containing 20 contaminated samples wereanalyzed using the CLS algorithm and the results were shownin Table 3.The concentrations ofmelamine calculated by CLSwere 0.84±0.30, 3.51±0.75, 8.17±1.21, and 32.23±4.33 g kg−1for the 5, 10, 25, and 50 g kg−1 melamine content samples,respectively. The melamine in the 20 mixture samples wassuccessfully detected. Although the melamine concentrationwas underestimated by CLS, there was a good linear rela-tionship between the predicted and real values (predictedvalues = 0.57 × real values, 𝑅2 = 0.90). Particle size, surfaceroughness, and density of the sample spread on a TeflonSpectralon surface in a single layer were important factorsin quantifying melamine correctly. It is also likely that themelamine concentration was underestimated because of thedifficulty in detectingmelamine if the particles were under ortightly embedded in the soybean meal particles, as shown insample Set A.
The pixel spectra corresponding to the 𝐶𝑖 maximum ofmelamine for the 20 sample mixtures are shown in Figure 4.These melamine spectral characteristics indicated reliableextraction by CLS. In addition, the results showed thatNIRM imaging data combined with the CLS algorithm couldprovide a visual melamine distributionmap (Figure 5) for theanalyst, which could not be done by NIR because the spatialinformation is lost.
Journal of Spectroscopy 5
Soybean meal
Melamine
0
0.2
0.4
0.6
0.80.9
Abso
rban
ce (l
og(1
/R))
7000 6000 5000 40007808Wavelength (cm−1)
(a)
Soybean meal
Melamine
7000 6000 5000 40007808Wavelength (cm−1)
−0.04
−0.02
0
0.02
0.04
0.06
Abso
rban
ce (l
og(1
/R))
(b)
Figure 2: Average spectrum of soybean meal and melamine particles: raw spectra (a) and first derivative spectra (b).
1
0.9
0.8
0.7
0.6
0.5
0.4
0.3
0.2
0.1
0(a)
1
0.9
0.8
0.7
0.6
0.5
0.4
0.3
0.2
0.1
0(b)
1
0.9
0.8
0.7
0.6
0.5
0.4
0.3
0.2
0.1
0(c)
1
0.9
0.8
0.7
0.6
0.5
0.4
0.3
0.2
0.1
0(d)
Figure 3: The detection results of soybean and melamine of Set A samples using CLS algorithm: (a) soybean image of Set A-1; (b) melamineimage of Set A-1; (c) soybean image of Set A-2; (d) melamine image of Set A-2.

6 Journal of Spectroscopy
Table 3: Discriminant results of the analysis of the Set B samples using CLS.
Sample number Melamine (g kg−1) Melamine detected𝐶mel (g kg
−1) Max of 𝐶𝑖 Number of spectraSet B1 5 1.16 1.0919 1,955Set B2 5 1.01 0.7524 1,897Set B3 5 0.92 0.6206 1,959Set B4 5 0.41 0.5971 1,337Set B5 5 0.67 0.5686 1,509Set B6 10 3.06 0.6696 6,635Set B7 10 3.27 0.8080 6,449Set B8 10 3.53 0.8891 7,865Set B9 10 2.91 0.7721 7,998Set B10 10 4.78 0.9064 10,871Set B11 25 8.54 0.9536 21,913Set B12 25 7.03 0.5367 25,188Set B13 25 6.74 0.7325 15,940Set B14 25 9.18 0.8827 19,452Set B15 25 9.35 0.7916 39,533Set B16 50 37.22 0.9413 90,127Set B17 50 28.71 0.8753 81,584Set B18 50 34.09 0.5128 106,041Set B19 50 26.78 0.6352 89,335Set B20 50 34.37 0.6912 101,457
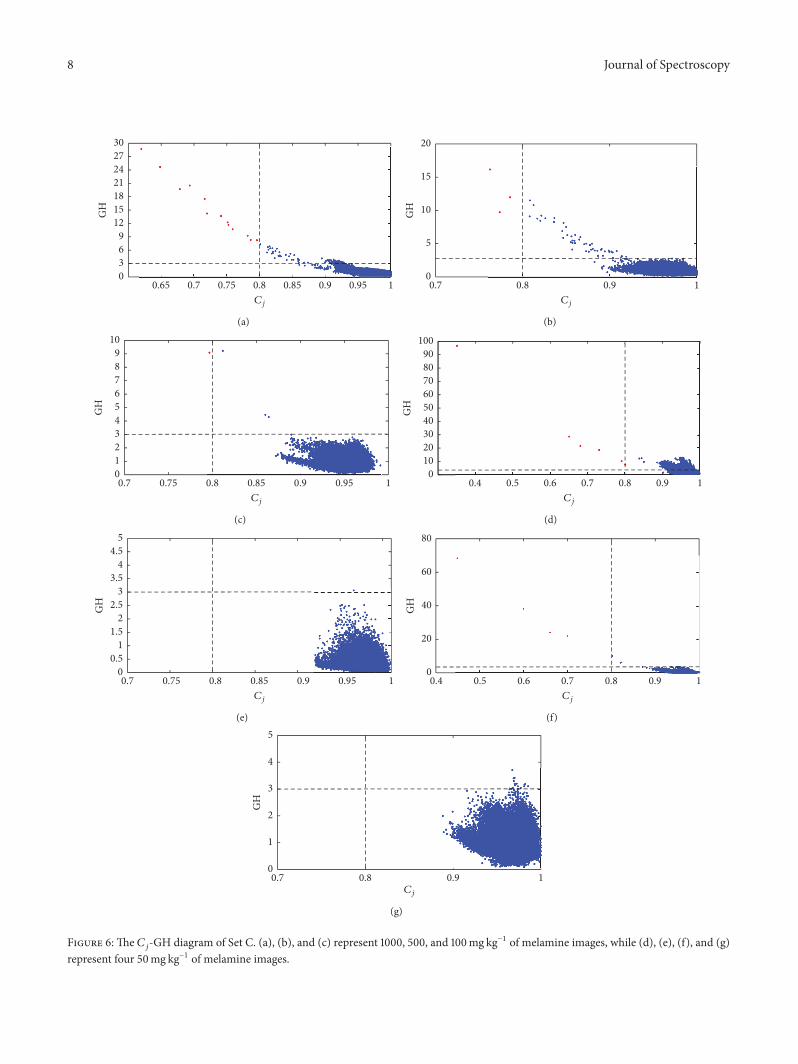
Sample Set C was used to investigate the method’ssensitivity. 𝐶𝑗 < 0.8 and GH > 3 were combined togetherfor melamine detection in sample Set C. The GH is thestandardized Mahalanobis distance between each spectrumand average spectrum, and GH > 3 is used to identify theoutliers [38, 39]. In this work, 480 representative spectrawere picked out from the 20 pure soybean meal images. Andthe GH values between the target spectrum and the 480soybean spectrawere calculated to identify whether the targetspectrum is soybean spectrum or not.
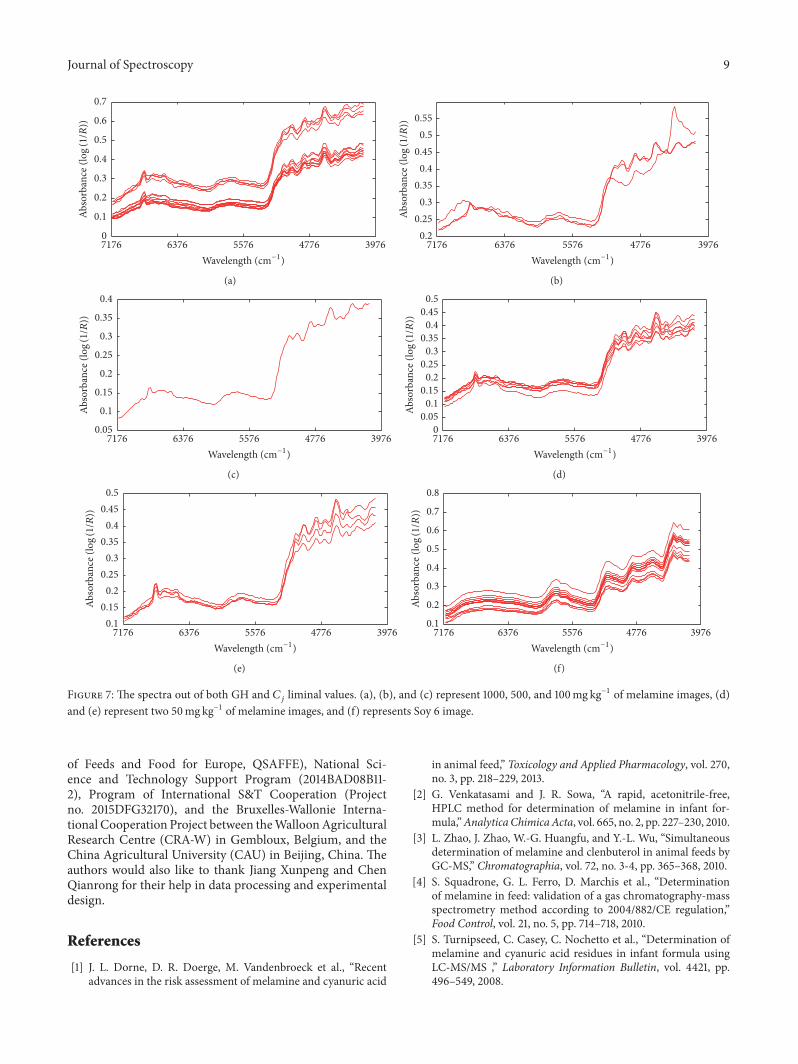
As shown in Figure 6, all the 1000, 500, and 100mg kg−1of melamine images had spectra out of both GH and 𝐶𝑗liminal values. Two of four 50mg kg−1 melamine imageshad spectra out of both GH and 𝐶𝑗 liminal values. UsingGH and 𝐶𝑗 liminal values to analyze 20 pure soybeanmeal samples, there were also some abnormal spectra inSoy 6. The abnormal spectra detected by 𝐶𝑗 < 0.8 andGH > 3 of Set C and Soy 6 were shown in Figure 7.All the spectra separated from Set C had the melaminespectra characteristics which could be recognized by visualinspection. Meanwhile the spectra separated from Soy 6were not similar with melamine spectrum or soybean mealaverage spectrum; this part of the spectra was more like full-fat soybean which could be seen in the article published byShen et al. [39].
4. Conclusions
The results presented in this study showed the feasibilityof the NIRM imaging with pure component spectra forthe analysis of soybean meal adulterated with melamine.Theminimum effective detection concentration of melaminewas 50mg kg−1. NIRM imaging method is a nondestructive,pollution-free, and cheaper testing technology comparedwith wet chemical analysis method, and it could analyze onesample within four hours. NIRM imaging combined with theCLS algorithm can successfully detect melamine in soybeanmeal without building the calibrationmodel, which provideda new and feasible way for safety control of feed.
Competing Interests
The authors declare that there is no conflict of interestsregarding the publication of this paper.
Acknowledgments
The research leading to these results was funded by theEuropean Union’s Seventh Framework Program (FP7/2007–2013) under Grant Agreement 265702 (Quality and Safety
Journal of Spectroscopy 7
7000 6000 5000 40007808Wavelength (cm−1)
−0.2
0
0.2
0.4
0.6
0.8
1
1.2
Abso
rban
ce (l
og(1
/R))
Figure 4: The pixel spectra corresponding to the 𝐶𝑖 maximum of melamine for Set B samples: 5 g kg−1 (cyan), 10 g kg−1 (blue), 25 g kg−1(magenta), and 50 g kg−1 (red).
0
1
0.9
0.8
0.7
0.6
0.5
0.4
0.3
0.2
0.1
35030025020015010050
350
300
250
200
150
100
50
(a)
0
1
0.9
0.8
0.7
0.6
0.5
0.4
0.3
0.2
0.1
35030025020015010050
350
300
250
200
150
100
50
(b)
0
1
0.9
0.8
0.7
0.6
0.5
0.4
0.3
0.2
0.1
35030025020015010050
350
300
250
200
150
100
50
(c)
0
1
0.9
0.8
0.7
0.6
0.5
0.4
0.3
0.2
0.1
35030025020015010050
350
300
250
200
150
100
50
(d)
Figure 5:The melamine distribution map predicted by CLS applied to the NIRM imaging data. Only one sample was taken as an example ofeach concentration. (a), (b), (c), and (d) represent 5, 10, 25, and 50 g kg−1 of melamine, respectively.
8 Journal of Spectroscopy
0.7 0.75 0.8 0.85 0.9 0.95 10.65Cj
0369
12151821242730
GH
(a)
0
5
10
15
20
GH
0.8 0.9 10.7Cj
(b)
0123456789
10
GH
0.75 0.8 0.85 0.9 0.95 10.7Cj
(c)
0102030405060708090
100
GH
0.5 0.6 0.7 0.8 0.9 10.4Cj
(d)
00.5
11.5
22.5
33.5
44.5
5
GH
0.75 0.8 0.85 0.9 0.95 10.7Cj
(e)
0
20
40
60
80
GH
0.5 0.6 0.7 0.8 0.9 10.4Cj
(f)
0
1
2
3
4
5
GH
0.8 0.9 10.7Cj
(g)
Figure 6: The 𝐶𝑗-GH diagram of Set C. (a), (b), and (c) represent 1000, 500, and 100mg kg−1 of melamine images, while (d), (e), (f), and (g)represent four 50mg kg−1 of melamine images.
Journal of Spectroscopy 9
0
0.1
0.2
0.3
0.4
0.5
0.6
0.7
Abso
rban
ce (l
og(1
/R))
6376 5576 4776 39767176Wavelength (cm−1)
(a)
0.20.25
0.30.35
0.40.45
0.50.55
Abso
rban
ce (l
og(1
/R))
6376 5576 4776 39767176Wavelength (cm−1)
(b)
6376 5576 4776 39767176Wavelength (cm−1)
0.05
0.1
0.15
0.2
0.25
0.3
0.35
0.4
Abso
rban
ce (l
og(1
/R))
(c)
00.05
0.10.15
0.20.25
0.30.35
0.40.45
0.5
Abso
rban
ce (l
og(1
/R))
6376 5576 4776 39767176Wavelength (cm−1)
(d)
6376 5576 4776 39767176Wavelength (cm−1)
0.10.15
0.20.25
0.30.35
0.40.45
0.5
Abso
rban
ce (l
og(1
/R))
(e)
0.1
0.2
0.3
0.4
0.5
0.6
0.7
0.8
Abso
rban
ce (l
og(1
/R))
6376 5576 4776 39767176Wavelength (cm−1)
(f)
Figure 7: The spectra out of both GH and 𝐶𝑗 liminal values. (a), (b), and (c) represent 1000, 500, and 100mg kg−1 of melamine images, (d)and (e) represent two 50mg kg−1 of melamine images, and (f) represents Soy 6 image.
of Feeds and Food for Europe, QSAFFE), National Sci-ence and Technology Support Program (2014BAD08B11-2), Program of International S&T Cooperation (Projectno. 2015DFG32170), and the Bruxelles-Wallonie Interna-tional Cooperation Project between theWalloonAgriculturalResearch Centre (CRA-W) in Gembloux, Belgium, and theChina Agricultural University (CAU) in Beijing, China. Theauthors would also like to thank Jiang Xunpeng and ChenQianrong for their help in data processing and experimentaldesign.
References
[1] J. L. Dorne, D. R. Doerge, M. Vandenbroeck et al., “Recentadvances in the risk assessment of melamine and cyanuric acid
in animal feed,” Toxicology and Applied Pharmacology, vol. 270,no. 3, pp. 218–229, 2013.
[2] G. Venkatasami and J. R. Sowa, “A rapid, acetonitrile-free,HPLC method for determination of melamine in infant for-mula,”Analytica ChimicaActa, vol. 665, no. 2, pp. 227–230, 2010.
[3] L. Zhao, J. Zhao, W.-G. Huangfu, and Y.-L. Wu, “Simultaneousdetermination of melamine and clenbuterol in animal feeds byGC-MS,” Chromatographia, vol. 72, no. 3-4, pp. 365–368, 2010.
[4] S. Squadrone, G. L. Ferro, D. Marchis et al., “Determinationof melamine in feed: validation of a gas chromatography-massspectrometry method according to 2004/882/CE regulation,”Food Control, vol. 21, no. 5, pp. 714–718, 2010.
[5] S. Turnipseed, C. Casey, C. Nochetto et al., “Determination ofmelamine and cyanuric acid residues in infant formula usingLC-MS/MS ,” Laboratory Information Bulletin, vol. 4421, pp.496–549, 2008.
10 Journal of Spectroscopy
[6] L. Chen, Z. Yang, and L. Han, “A review on the use of near-infrared spectroscopy for analyzing feed protein materials,”Applied Spectroscopy Reviews, vol. 48, no. 7, pp. 509–522, 2013.
[7] V. Baeten, M. Manley, and J. A. Fernandez Pierna, “Spec-troscopic techniques: Fourier Transform (FT) Near Infraredspectroscopy (NIR) and microscopy (NIRM),” inModern Tech-niques for Food Authentication, D.-W. Sun, Ed., pp. 117–148,Academic Press, Oxford, UK, 2008.
[8] J. A. Fernandez Pierna, V. Baeten, and A. Boix, “Detection,identification and quantification of processed animal proteinsin feedingstuffs,” inNear InfraredMicroscopy, J. S. Jorgensen andV. Baeten, Eds., pp. 81–91, Les Presses Universitaires de Namur,Namur, Belgium, 2012.
[9] C. Lu, B. Xiang, G. Hao, J. Xu, Z. Wang, and C. Chen,“Rapid detection of melamine in milk powder by near infraredspectroscopy,” Journal of Near Infrared Spectroscopy, vol. 17, no.2, pp. 59–67, 2009.
[10] L. J. Mauer, A. A. Chernyshova, A. Hiatt, A. Deering, and R.Davis, “Melamine detection in infant formula powder usingnear- and mid-infrared spectroscopy,” Journal of Agriculturaland Food Chemistry, vol. 57, no. 10, pp. 3974–3980, 2009.
[11] R. M. Balabin and S. V. Smirnov, “Melamine detection bymid- and near-infrared (MIR/NIR) spectroscopy: a quick andsensitive method for dairy products analysis including liquidmilk, infant formula, and milk powder,” Talanta, vol. 85, no. 1,pp. 562–568, 2011.
[12] S. A. Haughey, S. F. Graham, E. Cancouet, and C. T. Elliott,“The application of Near-Infrared Reflectance Spectroscopy(NIRS) to detect melamine adulteration of soya bean meal,”Food Chemistry, vol. 136, no. 3-4, pp. 1557–1561, 2013.
[13] S. Jawaid, F.N. Talpur, S. T.H. Sherazi, S.M.Nizamani, andA.A.Khaskheli, “Rapid detection of melamine adulteration in dairymilk by SB-ATR-Fourier transform infrared spectroscopy,”FoodChemistry, vol. 141, no. 3, pp. 3066–3071, 2013.
[14] O. Abbas, B. Lecler, P. Dardenne, and V. Baeten, “Detectionof melamine and cyanuric acid in feed ingredients by nearinfrared spectroscopy and chemometrics,” Journal of NearInfrared Spectroscopy, vol. 21, no. 3, pp. 183–194, 2013.
[15] K. Norris, “Hazards with near infrared spectroscopy in detect-ing contamination,” Journal of Near Infrared Spectroscopy, vol.17, no. 4, pp. 165–166, 2009.
[16] V. Baeten and P. Dardenne, “Applications of near-infraredimaging for monitoring agricultural food and feed products,” inSpectrochemical Analysis Using Infrared Multichannel Detectors,R. Bhargava and I. W. Levin, Eds., pp. 283–302, Blackwell, 2005.
[17] Z. Yang, C.Wang, L. Han, J. Li, andX. Liu, “Rapid screening andvisual tracing of melamine in soybeanmeal by NIRmicroscopyimaging,” Journal of Innovative Optical Health Sciences, vol. 7,no. 4, Article ID 1350072, 2014.
[18] F. Clarke, “Extracting process-related information from phar-maceutical dosage forms using near infrared microscopy,”Vibrational Spectroscopy, vol. 34, no. 1, pp. 25–35, 2004.
[19] J. Dubois, E. Neil Lewis, F. S. Fry Jr., and E. M. Calvey,“Bacterial identification by near-infrared chemical imaging offood-specific cards,” Food Microbiology, vol. 22, no. 6, pp. 577–583, 2005.
[20] D. P. Ariana, R. Lu, and D. E. Guyer, “Near-infrared hyper-spectral reflectance imaging for detection of bruises on picklingcucumbers,” Computers and Electronics in Agriculture, vol. 53,no. 1, pp. 60–70, 2006.
[21] P. Williams, P. Geladi, G. Fox, and M. Manley, “Maize kernelhardness classification by near infrared (NIR) hyperspectral
imaging and multivariate data analysis,” Analytica ChimicaActa, vol. 653, no. 2, pp. 121–130, 2009.
[22] J. P. Wold, M. O’Farrell, M. Høy, and J. Tschudi, “On-linedetermination and control of fat content in batches of beeftrimmings by NIR imaging spectroscopy,”Meat Science, vol. 89,no. 3, pp. 317–324, 2011.
[23] R. Krska and M. Nielen, “Rapid detection in food and feed,”Analytical and Bioanalytical Chemistry, vol. 405, no. 24, pp.7717–7718, 2013.
[24] P. Vermeulen, J. A. Fernandez Pierna, H. P. van Egmond, P.Dardenne, and V. Baeten, “Online detection and quantificationof ergot bodies in cereals using near infrared hyperspectralimaging,” Food Additives & Contaminants: Part A, vol. 29, no.2, pp. 232–240, 2012.
[25] Y. Huang, S. Min, J. Duan, L. Wu, and Q. Li, “Identificationof additive components in powdered milk by NIR imagingmethods,” Food Chemistry, vol. 145, pp. 278–283, 2014.
[26] V. Baeten, C. VonHolst, A. Garrido, J. Vancutsem, A.M. Renier,and P. Dardenne, “Detection of banned meat and bone mealin feedstuffs by near-infrared microscopic analysis of the densesediment fraction,” Analytical and Bioanalytical Chemistry, vol.382, no. 1, pp. 149–157, 2005.
[27] B. De la Roza-Delgado, A. Soldado, A. Martınez-Fernandez etal., “Application of near-infrared microscopy (NIRM) for thedetection of meat and bone meals in animal feeds: a tool forfood and feed safety,” Food Chemistry, vol. 105, no. 3, pp. 1164–1170, 2007.
[28] V. Fernandez-Ibanez, T. Fearn, A. Soldado, and B. de laRoza-Delgado, “Spectral library validation to identify ingre-dients of compound feedingstuffs by near infrared reflectancemicroscopy,” Talanta, vol. 80, no. 1, pp. 54–60, 2009.
[29] D. Perez-Marın, T. Fearn, J. E. Guerrero, and A. Garrido-Varo,“A methodology based on NIR-microscopy for the detection ofanimal protein by-products,” Talanta, vol. 80, no. 1, pp. 48–53,2009.
[30] O. Abbas, J. A. Fernandez Pierna, A. Boix, C. Von Holst, P. Dar-denne, and V. Baeten, “Key parameters for the development ofa NIR microscopic method for the quantification of processedby-products of animal origin in compound feedingstuffs,”Analytical and Bioanalytical Chemistry, vol. 397, no. 5, pp. 1965–1973, 2010.
[31] J. A. Fernandez Pierna, V. Baeten, and P. Dardenne, “Screeningof compound feeds using NIR hyperspectral data,” Chemomet-rics and Intelligent Laboratory Systems, vol. 84, no. 1-2, pp. 114–118, 2006.
[32] G. Gizzi, C. von Holst, V. Baeten, G. Berben, and L. VanRaamsdonk, “Determination of processed animal proteins,includingmeat and bonemeal, in animal feed,” Journal of AOACInternational, vol. 87, no. 6, pp. 1334–1341, 2004.
[33] C. Gendrin, Y. Roggo, and C. Collet, “Pharmaceutical appli-cations of vibrational chemical imaging and chemometrics: areview,” Journal of Pharmaceutical and Biomedical Analysis, vol.48, no. 3, pp. 533–553, 2008.
[34] K. L. A. Chan, N. Elkhider, and S. G. Kazarian, “Spectroscopicimaging of compacted pharmaceutical tablets,” Chemical Engi-neering Research and Design, vol. 83, no. 11, pp. 1303–1310, 2005.
[35] G. P. Sabin, M. C. Breitkreitz, A. M. de Souza et al., “Analysisof pharmaceutical pellets: an approach using near-infraredchemical imaging,” Analytica Chimica Acta, vol. 706, no. 1, pp.113–119, 2011.

Journal of Spectroscopy 11
[36] C. Gendrin, Y. Roggo, and C. Collet, “Content uniformity ofpharmaceutical solid dosage forms by near infrared hyperspec-tral imaging: a feasibility study,” Talanta, vol. 73, no. 4, pp. 733–741, 2007.
[37] L. Weyer and J. Workman Jr, Practical Guide to InterpretiveNear-Infrared Spectroscopy, CRC Press, 2007.
[38] J. A. Guthrie, Robustness of NIR Calibrations for AssessingFruit Quality, Faculty of Arts, Health and Sciences, CentralQueensland University, 2005.
[39] G. Shen, X. Fan, Z. Yang, and L. Han, “A feasibility study of non-targeted adulterant screening based onNIRM spectral library ofsoybean meal to guarantee quality: the example of non-proteinnitrogen,” Food Chemistry, vol. 210, pp. 35–42, 2016.

Submit your manuscripts athttp://www.hindawi.com
Hindawi Publishing Corporationhttp://www.hindawi.com Volume 2014
Inorganic ChemistryInternational Journal of
Hindawi Publishing Corporation http://www.hindawi.com Volume 2014
International Journal ofPhotoenergy
Hindawi Publishing Corporationhttp://www.hindawi.com Volume 2014
Carbohydrate Chemistry
International Journal of
Hindawi Publishing Corporationhttp://www.hindawi.com Volume 2014
Journal of
Chemistry
Hindawi Publishing Corporationhttp://www.hindawi.com Volume 2014
Advances in
Physical Chemistry
Hindawi Publishing Corporationhttp://www.hindawi.com
Analytical Methods in Chemistry
Journal of
Volume 2014
Bioinorganic Chemistry and ApplicationsHindawi Publishing Corporationhttp://www.hindawi.com Volume 2014
SpectroscopyInternational Journal of
Hindawi Publishing Corporationhttp://www.hindawi.com Volume 2014
The Scientific World JournalHindawi Publishing Corporation http://www.hindawi.com Volume 2014
Medicinal ChemistryInternational Journal of
Hindawi Publishing Corporationhttp://www.hindawi.com Volume 2014
Chromatography Research International
Hindawi Publishing Corporationhttp://www.hindawi.com Volume 2014
Applied ChemistryJournal of
Hindawi Publishing Corporationhttp://www.hindawi.com Volume 2014
Hindawi Publishing Corporationhttp://www.hindawi.com Volume 2014
Theoretical ChemistryJournal of
Hindawi Publishing Corporationhttp://www.hindawi.com Volume 2014
Journal of
Spectroscopy
Analytical ChemistryInternational Journal of
Hindawi Publishing Corporationhttp://www.hindawi.com Volume 2014
Journal of
Hindawi Publishing Corporationhttp://www.hindawi.com Volume 2014
Quantum Chemistry
Hindawi Publishing Corporationhttp://www.hindawi.com Volume 2014
Organic Chemistry International
ElectrochemistryInternational Journal of
Hindawi Publishing Corporation http://www.hindawi.com Volume 2014
Hindawi Publishing Corporationhttp://www.hindawi.com Volume 2014
CatalystsJournal of