Embed Size (px)
Citation preview

Clean Technologies for the Purification of
Wastewaters: Adsorptive Parametric Pumping
A dissertation presented to the FACULDADE DE ENGENHARIA DA UNIVERSIDADE DO PORTO
for the degree of Doctor in Chemical Engineering
by
Miriam Žabková Supervisor
Professor Alírio Egídio Rodrigues Co-Supervisor
Dr. Eduardo Borges da Silva
Laboratório Associado
Laboratório de Processos de Separação e Reacção Departamento de Engenharia Química
Faculdade de Engenharia da Universidade do Porto Porto, Portugal
November 2006


Acknowledgments
This thesis is the result of four years of work during which I have been accompanied
and supported by many people. It is now my great pleasure to take this opportunity
to thank them.
My most earnest acknowledgment goes to my advisor Prof Alírio E. Rodrigues who
has been an excellent advisor with great efforts to bring many professional advices
and explain things clearly and simply.
I am grateful to Fundação para a Ciência e Tecnologia from the Ministry of Science
and Technology of Portugal for supporting my Ph.D. grant (SF RH/BD/8007/2002).
Many thanks to Spanish friend Dr. Marta Otero for her help in parametric pumping
pilot-plant operation.
To Dr. Eduardo da Silva who has been an excellent collaborator, for long discussions
about work associated to modelling of ion-exchange system and membrane
separation. I appreciate also his help and advices, which made things more clear.
I am grateful to all my friends and colleagues from LSRE, University Porto, for being
the marvellous friend anytime ready to help
Special thanks to Mirjana Minceva and Paula Gomes for their friendship, time spent
on travels around Portugal and for their care and support during my Ph.D. in many
ways.
I am forever indebted to my parents, parents-in-low and Lubica, Branislav and Janka
for their understanding, endless patience and moral support.
After all, I wish to thank my husband Michal. He supported me, encouraged me at
any time, and most important he loved me.


Abstract
The general objective of the thesis was to study the removal of phenolic species from effluents and from Kraft lignin oxidation process by adsorption, ion-exchange and membrane processes.
Adsorption of phenol, salicylic acid and p-nitrophenol from aqueous solutions onto polymeric resins (Sephabeads SP206 and SP207, Amberlite XAD16 and Duolite S861) and activated carbon (Filtrasorb F400) was studied. Batch equilibrium experiments were carried out at three different temperatures (293, 310 and 333 K) and equilibrium data fitted by the Langmuir isotherm. In order to ascertain the fixed bed implementation of the adsorbents, adsorption runs were carried out at laboratory scale and the effects of temperature and flow-rate were addressed. The linear driving force (LDF) approximation was used to predict the adsorption kinetics and simulate experimental breakthrough curves. Parametric pumping is an innovative technology that allows removing phenolic compounds from waste solutions to be recovered and recycled. Polymeric resin Sephabeads SP206 was the better adsorbent studied in this work for the recovery and/or purification of liquid streams containing phenol, salicylic acid and 4-nitrophenol by adsorptive parametric pumping. Different operating conditions were used in an automated pilot plant and experimental results compared to those simulated using home-made package.
Adsorption of synthetic vanillin onto non-ionic polymeric resins Sephabeads SP206 by using static and dynamic approach has been investigated. The impact of sodium hydroxide on the adsorption of vanillin was investigated and for this purpose, the modified Langmuir model of isotherm has been used. Increasing concentration of sodium hydroxide has significantly reduced the adsorbed amount of the vanillin onto polymeric adsorbent SP206. The mathematical model includes linear driving force for intraparticle mass transfer and reaction in liquid phase for the system vanillin/sodium hydroxide.
The membrane ultrafiltration process particularly focused to recovery of vanillin from Kraft lignin oxidation products. This process is considered as the first step of the vanillin recovery process. During the ultrafiltration process the vanillin as low molecular weight species is withdrawn in the permeate stream. For this purpose tubular ceramic membranes with different cut-offs: 1, 5, 15 and 50 kDa were selected and their performances compared. The influence of the lignin and vanillin concentration and pH of the feed mixture on the ultrafiltration process has been investigated as well. The mathematical model that considers concentration polarisation and gel layer formation phenomena has been developed to predict the flux decline during the ultrafiltration process.
The recovery of vanillin obtained in the oxidation of Kraft lignin process in alkali medium (pH 12-13) by using ion-exchange process with neutralization reaction in presence of a buffer solution (vanillate/vanillin) was studied. A set of batch equilibrium experiments (uptake curves) has been evaluated in order to obtain the concentration evolution of the vanillin, vanillate species and pH with time until equilibrium between liquid and resin phase is established. The fixed bed ion-exchange /+Na +H has been analyzed at laboratory scale and the evolution of vanillin, vanillate and pH was studied. A mathematical model developed for both batch and fixed-bed systems consider intraparticle diffusion controlled neutralization of the cationic resin by the system vanillin/NaOH. The model predicts the curves evaluated by batch experiments and breakthrough and elution curves obtained from fixed bed experiments.


Resumo
O objectivo da tese é o estudo da remoção de compostos fenólicos de efluentes e do processo de oxidação de lenhina Kraft através de processos de adsorção, permuta iónica e membranas.
A adsorção de fenol, ácido salicílico e p-nitrofenol em soluções aquosas sobre resinas poliméricas (Sephabeads SP206 and SP207, Amberlite XAD16 e Duolite S861) e carvões activados (Filtrasorb F400) foi estudada em sistema descontínuo e de leito fixo a três temperaturas diferentes (293, 310 e 333 K) e ainda analisada a influência do caudal usando um modelo de força motriz linear.
A bombagem paramétrica é uma tecnologia avançada que permite a remoção de compostos fenólicos de efluentes que podem então ser recuperados e reciclados. A resina polimérica Sephabeads SP206 mostrou o melhor desempenho na purificação de caudais líquidos contaminados com fenol, ácido salicílico e 4-nitrofenol. Experiências foram realizadas em uma unidade piloto automatizada usando diferentes condições operacionais. Os resultados experimentais foram comparados com os resultados obtidos através da simulação do processo.
A adsorção de vanilina sintética em resinas não poliméricas (Sephabeads SP206) foi estudada em condições estáticas e dinâmicas. O efeito da concentração de hidróxido de sódio sobre a adsorção da vanilina foi também investigado e, nesta análise, isotermas de Langmuir modificadas foram empregadas. O aumento da concentração de hidróxido de sódio acarretou uma redução substancial das quantidades de vanilina adsorvida sobre o adsorvente polimérico SP206. O modelo matemático usado inclui a aproximação de força motriz linear para a transferência de massa intraparticular para o sistema de vanilina/hidróxido de sódio.
Este trabalho também apresenta o estudo do processo de ultrafiltração voltado para a recuperação da vanilina da lenhina degradada proveniente do processo de oxidação da lenhina Kraft. Este processo com membranas é considerado o primeiro passo na recuperação da vanilina. Durante o processo da ultrafiltração, a vanilina bem como outras espécies de baixo peso molecular são retiradas na corrente de permeado. Neste estudo, membranas de cerâmica tubulares com diferentes cut-offs (1, 5, 15, e 50 kDa) foram empregadas e seus desempenhos comparados. A influência do pH e da concentração de lenhina e de vanilina no processo de ultrafiltração foi também analisada. Um modelo matemático que considera a polarização e a formação de uma camada de gel sobre a superfície da membrana foi desenvolvido para prever o declínio do fluxo do permeado durante o processo de ultrafiltração.
A obtenção da vanilina proveniente da oxidação da lenhina Kraft em meio alcalino (pH 12-13) usando processos de permuta iónica com reacções de neutralização na presença de uma solução vanilato/vanilina com pH controlado foi também objectivo deste trabalho. Experiências em sistema descontínuo e de leito fixo foram realizadas. O modelo matemático desenvolvido tanto para o sistema batelada como para o sistema de leito fixo considera a difusão intraparticular a etapa controladora da permuta iónica na resina catiônica para o sistema vanilina/hidróxido de sódio. O modelo permite predizer a evolução das espécies vanilina, vanilato de sódio e pH em função do tempo.


Résumé
L’objectif général de cette thèse est d’étudier la soustraction des espèces phénoliques des effluents et des procédés d’oxydation de la lignine Kraft par adsorption, par des procédés d’échanges ioniques et membranaires On a étudié l’adsorption du phénol, de l’acide salicylique et du p-nitrophénol issus de solutions ioniques sur des résines polymériques (Sephabeads SP206 and SP207, Amberlite XAD16 et Duolite S861) et sur des charbons actifs (Filtrasorb F400). Des expériences d’équilibre de type batch ont été réalisées à trois températures différentes (293, 310 and 333 K) et les données d’équilibre ont été ajustées par le modèle de Langmuir. Afin de s’assurer de l’application des adsorbants en lit fixe, les expériences d’adsorption ont été réalisées à l’échelle du laboratoire et les effets de la température et du débit ont été étudiés. L’approximation LDF (Linear Driving Force) a été utilisée pour prédire les cinétiques d’adsorption et simuler les courbes de perçage. Le pompage paramétrique est une technologie innovante qui nous a permis de retirer les composés phénoliques des solutions déchets afin de pouvoir les récupérer et les recycler. La résine polymère Sephabeads SP206 s’est révélée être le meilleur adsorbant dans ce travail de récupération et/ou de purification de courants liquides contenant du phénol, de l’acide salicylique et du 4-nitrophenol par pompage paramétrique. Différentes conditions opératoires ont été utilisées dans un pilote automatisé et les résultats expérimentaux ont été comparés à ceux de la simulation en utilisant un package fait maison. Il a également été étudié l’adsorption de la vanilline synthétique sur des résines polymères non-ioniques Sephabeads SP206 en utilisant une approche statique et dynamique ; L’impact de l’hydroxyde de sodium sur l’adsorption de la vanilline a été analysé, et pour ce cas, le modèle de Langmuir modifié a été utilisé. L’augmentation de la concentration de l’hydroxyde de sodium a nettement réduit les quantités de vanilline adsorbées Le modèle mathématique inclut un modèle LDF pour le transfert de matière intraparticulaire et pour la réaction dans la phase liquide pour le système vanilline/NaOH. Le procédé d’ultrafiltration par membrane est centré particulièrement sur le recouvrement de la vanilline à partir de produits d’oxydation de la lignine Kraft. Ce procédé est considéré comme la première étape du procédé de recouvrement de la vanilline. Durant le procédé d’ultrafiltration la vanilline comme toutes espèces de faible masse moléculaire, est soutirée dans le courant du perméat. Dans ce cas, des membranes céramiques tubulaires avec différentes coupes : 1, 5, 15 and 50 kDa ont été sélectionnées et leurs performances comparées. L’influence de la concentration en lignine, en vanilline et le pH du mélange d’alimentation sur le procédé d’ultrafiltration ont également été étudiés. Le modèle mathématique considère une polarisation de la concentration et le phénomène de formation d’une couche de gel à été développé afin de prédire le déclin de flux durant le procédé d’ultrafiltration. Nous avons également exploré le recouvrement de la vanilline obtenu dans le procédé d’oxydation de la lignine Kraft dans de l’alcali moyen (pH 12-13) en utilisant un procédé d’échange ionique avec une réaction de neutralisation en présence d’une solution tampon (vanilate / vanilline). Une série d’expériences d’équilibres de type batch ont été évaluées dans le but d’obtenir l’évolution des concentrations de la vanilline, de la vanilate et le pH jusqu’à ce que l’équilibre entre la phase liquide et la résine soit atteint. Le lit fixe à échange ionique /+Na +H a été analysé à l’échelle du laboratoire et les évolutions de la vanilline, de la vanilate et du pH ont été étudiées. Un modèle mathématique développé aussi bien pour les systèmes batch et lit fixe considère une diffusion intraparticulaire à neutralisation contrôlée de la résine cationique par le système vanilline/ NaOH. Le modèle est en accord raisonnable avec les courbes évaluées par les expériences batch et les courbes de perçage et d’élution obtenues par les expériences en lit fixe.


Resumé
Cieľom tejto práce bolo študovať odstranovanie fenolových zlúčenín z odpadových vôd a z Kraft lignín oxidačných procesov pomocou adsorpčných, ion výmenných a membranových metód.
Adsorpcia fenolu, kyseliny salicilovej a p-nitrofenolu z vodných roztokov sa študovala na polymerických adsorbentoch (Sephabeads SP206 a SP207, Amberlit XAD16 a Duolit S861) a aktivovnom uhlí (Filtrasorb F400). Experimentálne statické adsorpčné rovnováhy boli namerané pri troch rozličných teplotách (293, 310 a 333 K) a analyzované Langmuirovým modelom izotermy. Kolonové testy s adsorbentmi sa uskutočnili v laboratornej škále pričom sa študoval efekt teploty a prietoku na adsorbciu. Za účelom modelovania experimentálnych concentračných profilov bola kinetika adsorpcie pre prenos hmoty do vnútra častice priblížená použitím priamej hnaciej sily (linear driving force, LDF). “Parametric pumping“ je inovačná technológia, ktorá umožnuje odstraňovanie fenolových zlučenín z odpadových vôd za účelom izolácie a opätovného využitia. Polymerický adsorbent Sephabeads SP206 bol v tento práci najdený ako najvhodnejší zo študovaných adsorbentov na izoláciu a/alebo čistenie kvapalných zdrojov obsahujúcich fenol, kyselinu salicilovú a 4-nitrofenolu použitím adorpčného “parametric pumping“. Na plno-automatizovanom skúšobnom zariadení boli testované rôzne operačné podmienky a experimentálne výsledky sa porovnali s teoretickými výsledkami z nášho modelovacieho programu. Adsorpcia syntetického vanilínu na neionický polymerický adsorbent Sephabeads SP206 bola študovaná použitín statických a dynamických metód. Zisťoval sa vplyv hydroxidu sodného na adsorbciu vanilínu a za týmto účelom bol použitý modifikovaný Langmuirov model izotermy. Zvyšujúca sa koncentrácia hydroxidu sodného významne znížila adsorbované množstvo vanilínu na polymerickom adsorbente SP206. Matematický model zahŕňal vnútročasticový prenos hmoty opisaný priamou hnaciou silou (linear driving force) a reakciu v kvapalnej fáze prebiehajúca v systéme vanilín/hydroxid sodný.
Membranová ultrafiltrácia bola špeciálne zameraná na získavanie vanilánu z Kraft lignín oxidačných produktov. Táto metóda je považovaná za prvý krok v procese získavania vanilínu. Počas ultrafiltrácie, vanilín ako látka s nízkou molekulovou hmotnosťou je odoberaná na strane permeátu. Za týmto účelom boli vybrané tubulárne keramické membrány s veľkosťami pórov: 1, 5, 15 a 50 kDa a efektivita separácie bola porovnaná. Vplyv koncentrácie lignínu a vanilínu v základnom roztoku a jeho pH na ultrafiltráciu bolo tiež predmetom študie. Matematický model zahŕňal jav koncentračnej polarizácie a formovania vrstvy gelu pre potreby modelovania poklesu fluxu počas ultrafiltrácie. Získavanie vanilínu vyrobeného oxidáciou Kraft lignínu v alkalickom roztoku (pH 12 - 13) sa študoval na iónvýmennom materialy. Proces bol spojený s neutralizačnou reakciou v prostredí tlmivého roztoku (vanililát/vanilín). Rad statických experimentov sa vykonanal za účeľom merania koncentračného profilu vanilínu a vanilátu a pH s časom až do dosiahnutia rovnovážneho stavu medzi kvapalnou a pevnou fázou. Vývoj koncentrácií vanilínu, vanilátu a zmena pH s časom boli taktiež zisťované v laboratórnej škále použitím kolóny naplnenej iónvýmennym materialom . Navrhnutý matematický model pre statický a dynamický systém zahŕňal neutralizáciu v kyslom katexe kontrolovanú vnútročasticovou difúzivitou systémom vanilín/NaOH. Súlad bol najdený medzi riešením matematického modelu a statickými i dynamickými experimentálnymi výsledkami.
++ HNa /


Table of Contents
List of Figures........................................................................................................v List of Tables........................................................................................................................xiii
1. INTRODUCTION ............................................................................................................. 1 1.1 Relevance and Motivation ......................................................................................... 1 1.2 Objectives and Outline............................................................................................... 4 1.3 References.................................................................................................................. 6
2. ADSORPTIVE PURIFICATION OF PHENOL WASTEWATERS: PARAMETRIC PUMPING OPERATION .................................................................... 9 2.1 Introduction................................................................................................................ 9 2.2 Experimental part..................................................................................................... 11
2.2.1 Chemicals and adsorbents ............................................................................ 11 2.2.2 Batch adsorption........................................................................................... 12 2.2.3 Fixed-bed adsorption.................................................................................... 13
2.3 Mathematical models ............................................................................................... 15 2.3.1 Adsorption isotherms ................................................................................... 15 2.3.2 Fixed bed modeling...................................................................................... 16 2.3.3 Parametric pumping simulation ................................................................... 19
2.4 Results and discussion ............................................................................................. 21 2.4.1 Adsorption equilibrium isotherm ................................................................. 21 2.4.2 Fixed- bed adsorption................................................................................... 24 2.4.3 Parametric pumping ..................................................................................... 29
2.5 Conclusions.............................................................................................................. 34 2.6 Nomenclature ........................................................................................................... 35 2.7 References................................................................................................................ 38
3. REMOVAL OF SALICYLIC ACID FROM EFFLUENTS USING NATURAL AND POLYMERIC ADSORBENTS ...................................................................................... 43 3.1 Introduction.............................................................................................................. 43 3.2 Experimental section................................................................................................ 45
3.2.1 Chemicals and adsorbents ............................................................................ 45 3.2.2 Batch adsorption studies .............................................................................. 45 3.2.3 Fixed bed adsorption and desorption of salicylic acid ................................. 45 3.2.4 Operation of the pilot parametric pumping pilot plant................................. 46
3.3 Mathematical model................................................................................................. 47 3.3.1 Thermal separation potential........................................................................ 47 3.3.2 Mathematical model..................................................................................... 49
3.4 Results and discussion ............................................................................................. 52 3.4.1 Thermal separation potential........................................................................ 52 3.4.2 Laboratory scale fixed bed adsorption and desorption of salicylic acid ...... 55 3.4.3 Parametric pumping operation ..................................................................... 64
3.5 Conclusions.............................................................................................................. 72 3.6 Nomenclature ........................................................................................................... 72 3.7 References................................................................................................................ 75

ii
4. PURIFICATION OF 4-NITROPHENOL WASTEWATERS BY THERMAL PARAMETRIC PUMPING: MODELING AND PILOT SCALE EXPERIMENTS79 4.1 Introduction ..............................................................................................................79 4.2 Experimental part .....................................................................................................81
4.2.1 Chemicals and adsorbents ............................................................................81 4.2.2 Batch adsorption ...........................................................................................81 4.2.3 Fixed-bed adsorption ....................................................................................82 4.2.4 Parametric pumping system..........................................................................85
4.3 Mathematical model for parametric pumping ..........................................................86 4.3.1 Equilibrium model with axial dispersion......................................................87 4.3.2 Model of Linear Driving Force (LDF) with axial dispersion.......................89
4.4 Results and discussion..............................................................................................90 4.4.1 Adsorption isotherms....................................................................................90 4.4.2 Parametric pumping operation and simulation.............................................92
4.5 Conclusions ..............................................................................................................96 4.6 Nomenclature ...........................................................................................................97 4.7 References ..............................................................................................................100
5. SEPARATION OF SYNTHETIC VANILLIN AT DIFFERENT PH ONTO POLYMERIC ADSORBENT SEPHABEADS SP 206 ..............................................103 5.1 Introduction ............................................................................................................103 5.2 Experimental part ...................................................................................................105
5.2.1 Chemicals and adsorbents ..........................................................................105 5.2.2 Equipment...................................................................................................105 5.2.3 Batch adsorption .........................................................................................106 5.2.4 Fixed-bed adsorption ..................................................................................106
5.3 Theoretical section..................................................................................................107 5.3.1 Adsorption equilibrium isotherms ..............................................................107 5.3.2 Adsorption equilibrium isotherm in the presence of sodium hydroxide ....109 5.3.3 Fixed-bed modeling....................................................................................109 5.3.4 Kinetics of reaction vanillin/sodium hydroxide .........................................110
5.4 Results and discussion............................................................................................112 5.4.1 Adsorption equilibrium isotherm................................................................112 5.4.2 Fixed- bed adsorption .................................................................................116
5.5 Conclusions ............................................................................................................124 5.6 Nomenclature .........................................................................................................125 5.7 References ..............................................................................................................127
6. RECOVERY OF VANILLIN FROM LIGNIN/VANILLIN MIXTURE BY USING TUBULAR CERAMIC ULTRAFILTRATION MEMBRANES..............................131 6.1 Introduction ............................................................................................................131 6.2 Experimental part ...................................................................................................133
6.2.1 Chemicals and methods ..............................................................................133 6.2.2 Equipment and experimental set-up ...........................................................134 6.2.3 Measurement of water flux through membrane .........................................135 6.2.4 Membrane cleaning after experiments .......................................................136 6.2.5 Ultrafiltration of vanillin/lignin mixture.....................................................137 6.2.6 Measurement of viscosity ...........................................................................137
6.3 Mathematical model ...............................................................................................138 6.3.1 Osmotic pressure and polarization layer controlled flux decline ...............140 6.3.2 Gel layer controlled flux decline ................................................................142

iii
6.4 Results and discussion ........................................................................................... 145 6.4.1 Measurement of the water flux trough the membrane ............................... 145 6.4.2 Ultrafiltration of vanillin/lignin mixture .................................................... 146 6.4.3 Experimental results of ultrafiltration of permeate obtained using membrane of 1 kDa cut-off................................................................................... 164
6.5 Conclusion ............................................................................................................. 167 6.6 Nomenclature ......................................................................................................... 168 6.7 Reference ............................................................................................................... 170
7. RECOVERY OF VANILLIN FROM KRAFT LIGNIN OXIDATION BY ION-EXCHANGE WITH NEUTRALIZATION................................................................ 175 7.1 Introduction............................................................................................................ 175 7.2 Experimental Methods ........................................................................................... 178
7.2.1 Chemicals and ion-exchanger .................................................................... 178 7.2.2 Equipment .................................................................................................. 179 7.2.3 Ion-exchange equilibrium experiments...................................................... 179 7.2.4 Uptake ion-exchange experiments ............................................................. 180 7.2.5 Fixed-bed performance .............................................................................. 180
7.3 Theory and Modelling............................................................................................ 181 7.3.1 Equilibrium for the ordinary binary ion-exchange..................................... 181 7.3.2 Ion-exchange equilibrium of the system vanillin/ NaOH-Amberlite IR120H...................................................................................... 182 7.3.3 Batch ion-exchange modelling................................................................... 184 7.3.4 The fixed-bed operation ............................................................................. 188
7.4 Results and Discussion .......................................................................................... 189 7.4.1 Ion-exchange equilibrium isotherm and uptake profiles............................ 189 7.4.2 Fixed-bed performance .............................................................................. 196
7.5 Conclusions............................................................................................................ 201 7.6 Nomenclature ......................................................................................................... 201 7.7 References.............................................................................................................. 204
8. CONCLUSION AND FUTURE WORK..................................................................... 209
APPENDICES
A. SAFETY DATA............................................................................................................A-1
B. ADSORPTION OF PHENOL AND SALICYLIC ACID ONTO POLYMERIC
RESINS AMBERLITE XAD16 AND DUOLITE S861..............................................B-1
C. ION-EXCHANGE EQUILIBRIUM EXPERIMENTAL DATA..............................C-1
D. EXPERIMENTAL DATA OBTAINED DURING ULTRAFILTRATION
EXPERIMENTS............................................................................................................D-1


v
List of Figures
Chapter 2
Figure 2.1 Experimental set-up of the parametric pumping pilot plant.................................... 14
Figure 2.2 Experimental adsorption equilibrium (symbols), *q versus *C and fittings to Langmuir model (lines) at different temperatures (293, 310 and 333K) for the adsorption of phenol onto Filtrasorb F400.......................................................... 22
Figure 2.3 Experimental adsorption equilibrium (symbols), *q versus *C and fittings to Langmuir model (lines) at different temperatures (293, 310 and 333K) for the adsorption of phenol onto Sephabeads SP206 .................................................... 22
Figure 2.4 Experimental adsorption equilibrium (symbols), *q versus *C and fittings to Langmuir model (lines) at different temperatures (293, 310 and 333K) for the adsorption of phenol onto Sephabeads SP207 .................................................... 23
Figure 2.5 Fixed bed adsorption of phenol onto Filtrasorb F400. The bed length was 100 mm for Filtrasorb F400 and solution was fed at three temperatures (293K, 310K and 333K) at flow-rate 10 mL min-1. Symbols correspond to the experimental results and full lines to the simulated ones.................................... 24
Figure 2.6 Fixed bed adsorption of phenol onto Filtrasorb F400. The bed length was 100 mm for Filtrasorb F400 and solution was fed at three temperatures (293K, 310K and 333K) at the flow-rate 15 mL min-1. Symbols correspond to the experimental results and full lines to the simulated ones.................................... 25
Figure 2.7 Fixed bed adsorption of phenol onto Sephabeads SP206. The bed length was 300 mm for Sephabeads SP206 and solution was fed at three temperatures (293K, 310K and 333K) at the flow-rate 5.5 mL min-1. Symbols correspond to the experimental results and full lines to the simulated ones.......................... 25
Figure 2.8 Fixed bed adsorption of phenol onto Sephabeads SP206. The bed length was 300 mm for Sephabeads SP206 and solution was fed at three temperatures (293K, 310K and 333K) at the flow-rate 10 mL min-1. Symbols correspond to the experimental results and full lines to the simulated ones. ............................. 26
Figure 2.9 Fixed bed adsorption of phenol onto Sephabeads SP207. The bed length was 300 mm for Sephabeads SP207 and solution was fed at three temperatures (293K, 310K and 333K) at the flow-rate 5.5 mL min-1. Symbols correspond to the experimental results and full lines to the simulated ones.......................... 26
Figure 2.10 Fixed bed adsorption of phenol onto Sephabeads SP207. The bed length was 300 mm for Sephabeads SP206 and solution was fed at three temperatures (293K, 310K and 333K) at the flow-rate 10 mL min-1. Symbols correspond to the experimental results and full lines to the simulated ones. ............................. 27
Figure 2.11 Fixed bed adsorption of phenol onto Sephabeads SP206 in pilot scale (800x90 I.D. mm). The solution was feed at a flow rate of 600 mL min-1 and two runs, at 293K and 333K, respectively, were carried out. ............................................. 27
Figure 2.12 Simulated axial profiles of temperature and concentration during the operation of parametric pumping for phenol wastewater purification at the conditions corresponding to run 4. (A) Bed temperature profile evolution along the 10th hot half-cycle. (B) Bed temperature profile evolution along the 10th cold

vi
half-cycle. (C) Bed temperature profiles at the end of the hot half-cycle (Hhc) and at the end of the cold half-cycle (Chc). (D) Concentration profiles in the bed at the end of the hot half-cycle (Hhc) and cold half-cycle (Chc) for cycles 1, 5 and 10............................................................................................................30
Figure 2.13 History of top and bottom temperatures measured during the recuperative parametric pumping .............................................................................................31
Figure 2.14 Experimental results (symbols) for the parametric pumping run 1 together with the equilibrium model (grey full lines) and the LDF model (black full lines) predictions. Top and bottom product concentrations of phenol are shown as a function of time in recuperative parametric pumping .........................................32
Figure 2.15 Experimental results (symbols) for the parametric pumping run 2 together with the equilibrium model (gray full lines) and the LDF model (black full lines) predictions. Top and bottom product concentrations of phenol are shown as a function of time in recuperative parametric pumping .........................................32
Figure 2.16 Experimental results (symbols) for the parametric pumping run 3 together with the equilibrium model (gray full lines) and the LDF model (black full lines) predictions. Top and bottom product concentrations of phenol is shown as a function of time in recuperative parametric pumping .........................................32
Figure 2.17 Experimental results (symbols) for the parametric pumping run 4 together with the equilibrium model (gray full lines) and the LDF model (black full lines) predictions. Top and bottom product concentrations of phenol are shown as a function of time in recuperative parametric pumping .........................................33
Figure 3.1 Experimental setup of the parametric pumping pilot plant. ....................................47
Chapter 3
Figure 3.2 Experimental adsorption equilibrium, *q versus *C , for the adsorption of salicylic acid onto Filtrasorb F400 (A), Sephabeads SP207 (B) at different temperatures. Fittings to Langmuir (dotted lines) and Nitta (full lines) models are shown together with the experimental data points.........................................54
Figure 3.3 Effect of temperature on the fixed bed adsorption of salicylic acid onto Filtrasorb F400 (A). The bed length was 10 cm for (A) and solution was fed at three different temperatures (293K, 310K and 333K) at a flow-rate of 10 mL min-1. Symbols are the experimental data and full lines are the simulated results obtained by the LDF model......................................................................56
Figure 3.4 Effect of the flow-rate on the fixed bed adsorption of salicylic acid onto Filtrasorb F400 (A), Sephabeads SP207 (B). The bed length was 10 cm for (A) and 30 cm for (B) and solution was feed at 310 K and at two different flow-rates (q10 and q15 for 10 and 15 mL min-1 respectively). Symbols are the experimental data and full lines are the simulated results obtained by the LDF model...........................................................................................................59
Figure 3.5 Effect of the height of the bed on the fixed bed adsorption of salicylic acid onto Filtrasorb F400 (A), Sephabeads SP207 (B). The bed length was 5 and 10 cm (h5 and h10 respectively) and 15cm and 30cm (h15 and h30 respectively) for Filtrasorb F400 and Sephabeads SP206. The solution was fed at 333K and at

vii
a flow-rate of 10 mLmin-1. Symbols are the experimental data and full lines are the simulated results obtained by the LDF model ......................................... 61
Figure 3.6 Salicylic acid saturation-desorption cycles in beds of Filtrasorb F400 (A), Sephabeads SP207 (B) and Sephabeads SP206 (C). The bed length was of 5 cm for Filtrasorb F400 and 15 cm for Sephabeads SP207 and Sephabeads SP206. Both solution (saturation step) and water (desorption step) were fed at a flow-rate of 10 mL min-1 and cycles at 293, 310 and 333K were carried out. Symbols are the experimental data and full lines are the simulated results obtained by the LDF model................................................................................. 63
Figure 3.7 Breakthrough curves corresponding to the fixed bed adsorption of salicylic acid onto Sephabeads SP206 at pilot scale. Symbols are the experimental data and full lines are the simulated results obtained by the LDF model.......................... 64
Figure 3.8 Experimental results and model predictions (grey line) Model I, (black line) Model II for the system salicylic acid/water/ SP206. Top and bottom product concentrations as a function of time in recuperative parametric pumping. Effect of the cycle time (RUN 2: 85 min; RUN 1: 185 min; RUN 3: 230 min) .67
Figure 3.9 Experimental results and model predictions (grey line) Model I, (black line) Model II for the system salicylic acid/water/ SP206. Top and bottom product concentrations as a function of time in recuperative parametric pumping.Effect of the flow-rate (RUN 5: 160 mL min-1; RUN 1: 200 mL min-
1; RUN 4: 300 mL min-1).................................................................................... 68
Figure 3.10 Experimental results and model predictions (grey line) Model I, (black line) Model II for the system salicylic acid/water/ SP206. Top and bottom product concentrations as a function of time in recuperative parametric pumping. Effect of the ratio TB φφ / (RUN 6: 5/3; RUN 1: 3/5; RUN 7: 1/7) .................... 70
Chapter 4
Figure 4.1 Experimental set-up of the parametric pumping pilot plant: 1.- Borosilicate column; 2.- Feed reservoir; 3.- Top reservoir; 4.- Bottom reservoir; 5.- Fraction collector; 6-7.- Heat exchangers; 8-12.- Two way solenoid valves; 13-14.- Three way solenoid valves; 15-19.- Peristaltic pumps; T1-T2.- Thermocouples; P1-P3.- Pressure transducers. .................................................... 86
Figure 4.2 Experimental adsorption equilibrium (symbols), eq versus eC and fittings to Langmuir model (full lines) at three temperatures (293, 310 and 333 K) for the adsorption of 4-nitrophenol onto Sephabeads SP206.................................... 91
Figure 4.3 Fixed bed adsorption of 4-nitrophenol onto Sephabeads SP206. The bed length was 15 cm and solution was fed at three temperatures (293 K, 310 K and 333 K) at a flow-rate of 30 mL min-1. Symbols correspond to the experimental results and full lines to the simulated ones.......................................................... 93
Figure 4.4 Experimental results (symbols) for the parametric pumping run 1 together with the equilibrium model (gray full lines) and the LDF model (black full lines) predictions. Top and bottom product concentrations 4-nitrophenol are shown as a function of time in recuperative parametric pumping.................................. 94
Figure 4.5 Experimental results (symbols) for the parametric pumping run 2 together with the equilibrium model (gray full lines) and the LDF model (black full lines)

viii
predictions. Top and bottom product concentrations of 4-nitrophenol are shown as a function of time in recuperative parametric pumping.......................95
Figure 4.6 Experimental results (symbols) for the parametric pumping run 3 together with the equilibrium model (gray full lines) and the LDF model (black full lines) predictions. Top and bottom product concentrations of 4-nitrophenol are shown as a function of time in recuperative parametric pumping.......................95
Figure 4.7 Experimental results (symbols) for the parametric pumping run 4 together with the equilibrium model (gray full lines) and the LDF model (black full lines) predictions. Top and bottom product concentrations of 4-nitrophenol is shown as a function of time in recuperative parametric pumping. .................................96
Chapter 5
Figure 5.1 Adsorption equilibrium isotherms fitted by the Langmuir equation for the vanillin solution without sodium hydroxide onto polymeric resin SP206. Initial concentration of vanillin was 3.30×10⁻³ mol L-1 with the corresponding pH = 5.3 .............................................................................................................113
Figure 5.2 Adsorption isotherms of the vanillin adsorbed per gram of dry resin as a function of the total concentration (vanillin + vanillate). The initial solution was prepared by mixing 1×10⁻³ M NaOH, 5×10⁻³ M respectively and 6.60×10⁻³ mol L-1 of vanillin. Initial pH of the solution was 6.5, 7.6 respectively. 71039.0 ×=eqK L mol-1.The temperature is 293 K. ....................114
Figure 5.3 Adsorption isotherms of the vanillin adsorbed per gram of dry resin as a function of the total concentration (vanillin + vanillate). The initial solution was prepared by mixing 1×10⁻³ M NaOH, 5×10⁻³ M respectively and 6.60×10⁻³ mol L-1 vanillin. Initial pH of the solution was 6.5, 7.6 respectively.
71044.0 ×=eqK L mol-1.The temperature is 310 K...........................................115
Figure 5.4 Adsorption isotherms of the vanillin adsorbed per gram of dry resin as a function of the total concentration (vanillin + vanillate). The initial solution was prepared by mixing 1×10⁻³ M NaOH, 5×10⁻³ M respectively and 6.60×10⁻³ mol L-1 vanillin. Initial pH of the solution was 6.5, 7.6 respectively. 71049.0 ×=eqK L mol-1.The temperature is 333 K ......................115
Figure 5.5 Experimental and simulated adsorption curves of vanillin onto polymeric resin SP206 at the temperature 293 K, 310 K and 333 K using column (150 x 20 mm, I.D.). (flow rate: 30 mL min-1, feed concentration 6.60 10-4 mol L-1).......117
Figure 5.6 Experimental and simulated adsorption curves of vanillin onto polymeric resin SP206 by the temperature 293 K, 310 K and 333 K using column (150 x 20 mm, I.D.). (flow rate 50 mL min-1, feed concentration 6.60 10-4 mol L-1)........118
Figure 5.7 Experimental and simulated adsorption curves of vanillin onto polymeric resin SP206 by the temperature 293 K, 310 K and 333 K using column (150 x 20 mm, I.D.). (flow rate 20 mL min-1, feed concentration 3.30×10⁻³ mol L-1 ........118
Figure 5.8 Experimental and simulated adsorption curves of vanillin onto polymeric resin SP206 by the temperature 293 K, 310 K and 333 K using column (150 x 20 mm, I.D.). (flowrate 30 mL min-1, feed concentration 3.30×10⁻³ mol L-1 .........119

ix
Figure 5.9 Breakthrough curve of the vanillin. The y-axis is shown as a concentration of vanillin, vanillate / total concentration. The feeding solution was prepared by mixing 1×10⁻³ M NaOH and 8.25×10⁻³ mol L-1 vanillin and pH was 6.7. The initial pH in the zero time was 6.1. The flow rate is 14 mL min-1, the temperature was 293 K. The points are showing experimental points full line demonstrates simulated curves.......................................................................... 121
Figure 5.10 Breakthrough curve of the vanillin. The y-axis is shown as a concentration of vanillin, vanillate / total concentration. The feeding solution was prepared by mixing 1×10⁻³ M NaOH and 8.25×10⁻³ mol L-1 vanillin and pH was 6.6. The initial pH at time zero was 6.1. The flow rate is 14 mL min-1, the temperature was 310 K. The points are showing experimental points, full line demonstrate simulated curves................................................................................................ 122
Figure 5.11 Breakthrough curve of the vanillin. The y-axis is shown as a concentration of vanillin, vanillate / total concentration. The feeding solution was prepared by mixing 5×10⁻³ M NaOH and 8.72×10⁻³ mol L-1 vanillin and pH was 7.4. The initial pH at the zero time was 6.1. The flow rate is 20 mL min-1, the temperature was 293 K. The points are showing experimental points, full line demonstrate simulated curves ........................................................................... 122
Figure 5.12 Breakthrough curve of the vanillin. The y-axis is shown as a concentration of vanillin, vanillate / total concentration. The feeding mixture of 5×10⁻³ M NaOH and 8.72×10⁻³ mol L-1 vanillin and pH was 7.5. The initial pH was 6.1. The flow rate is 20 mL min-1, the temperature was 310 K................................ 123
Figure 5.13 The regeneration of polymeric adsorbent SP 206 saturated with the solution of vanillin and sodium hydroxide at the experimental conditions reported in the Table 5.5 (see condition for flow rate 14 mL min-1, 293 K) was achieved by using 0.1 M sodium hydroxide. The used flowrate of regeneration was 5 mL min-1 .................................................................................................................. 124
Chapter 6
Figure 6.1 Ultrafiltration setup installed in the laboratory (a) and ceramic membranes (b) used in experiments........................................................................................... 134
Figure 6.2 Scheme of the experimental set-up for batch ultrafiltration.................................. 135
Figure 6.3 Concentration polarisations in ultrafiltration (Kovasin and Nordén, 1984) ......... 141
Figure 6.4 Water permeate flux (m3 s-1 m-2) through the membrane as a function of the transmembrane pressure ( PΔ ) (kPa). The membranes tested were 1, 5 and 15 kDa cut-offs. The surface area of each membrane is =S 0.008m2. Open system................................................................................................................ 145
Figure 6.5 Flux of water with the new membrane and after each experiment and subsequent cleaning. The membrane used was 15, 5 and 1 kDa. The cleaning was done by using 0.1M solution NaOH. The transmembrane pressure PΔ at which the flux was measured is 1.3 bar for membrane 15 kDa and 1.5 bar for membrane 1 and 5 kDa...................................................................................... 146
Figure 6.6 Viscosity number cspη (■) and [ ] c)ln( 0ηη ( ) versus concentration of lignin solution (g L-1)................................................................................................... 147

x
Figure 6.7 Permeate flux in membrane of 1 kDa cut-off at pH=8.5 and 12.5. Concentration of lignin was 60 g L-1 and vanillin 6 g L-1. Transmembrane pressure was constant during all experiment PΔ =1.55 bar. Feed flow-rate: ≈feedQ 130 and 120 L h-1, respectively.................................................................................149
Figure 6.8 The values of gel resistance with the time obtained from experimental permeate flux results. The lignin and vanillin concentration was 60 g L-1-6 g L-1, the pH=8.5 and12.5 .................................................................................................151
Figure 6.9 Vanillin and lignin concentration in retentante versus time using membrane of cut-off 1 kDa. The initial concentration of lignin was 60 g L-1 and vanillin 6 g L-1, pH=8.5 (a) and pH=12.5 (b). Transmembrane pressure was constant during all experiment PΔ =1.55 bar. Feed flow-rate: ≈feedQ 130 L h-1.(a);
≈feedQ 120 L h-1(b)...........................................................................................152
Figure 6.10 Vanillin and lignin concentration in permeate versus time using membrane of 1 kDa cut-off. The initial concentration of lignin was 60 g L-1 and vanillin 6 g L-1, pH=8.5(a); pH=12.5(b). Transmembrane pressure was constant during all experiment PΔ =1.55 bar. Feed flow-ratet: ≈feedQ 130 L h-1 (a). ≈feedQ 120 L h-1 (b) .......................................................................................................152
Figure 6.11 Permeate flux in membrane of 5 kDa cut-off at pH= 12.5. The concentration of lignin was 60 g L-1 and vanillin 5 g L-1. Transmembrane pressure was constant during all experiment PΔ =1.55 bar. Feed flow-ratet: ≈feedQ 120 L h-1. ......................................................................................................................154
Figure 6.12 Gel resistance versus time obtained from experimental permeate flux results. Lignin and vanillin concentration were 60 g L-1-and 6 g L-1, pH=12.5.............155
Figure 6.13 Vanillin and lignin concentration in retentante versus time using membrane of 5 kDa cut-off. The initial concentration of lignin was 60 g L-1 and vanillin 5 g L-1, pH=12.5. Transmembrane pressure was constant during all experiment
PΔ =1.55 bar. Feed flowrate t: ≈feedQ 120 L h-1 .............................................155
Figure 6.14 Vanillin and lignin concentration in permeate versus time using membrane of 5 kDa cut-off. The initial concentration of lignin was 60 g L-1 and vanillin 5 g L-1, pH=12.5. Transmembrane pressure: PΔ =1.55 bar. Feed flowrate:
≈feedQ 120 L h-1 ...............................................................................................156
Figure 6.15 Permeate flux in membrane of 15 kDa cut-off at pH=8.5 and 12.5. The concentration of lignin was 60 g L-1 and vanillin 6 g L-1. Transmembrane pressure: PΔ =1.3 bar. Feed flowrate: ≈feedQ 101 L h-1. .................................157
Figure 6.16 Permeate flux in membrane of 15 kDa cut-off at pH=8.5 and 12.5. The concentration of lignin was 20 g L-1 and vanillin 2 g L-1. Transmembrane pressure: PΔ =1.3 bar. Feed flow-rate: ≈feedQ 102 L h-1.................................158
Figure 6.17 Permeate flux in membrane of 15 kDa cut-off at pH=8.5. The concentration of lignin was 5 g L-1 and vanillin 0.5 g L-1. Transmembrane pressure PΔ =1.3 bar. Feed flow-rate: ≈feedQ 109 L h-1...............................................................158

xi
Figure 6.18 The change of gel resistance ( Rg ) with time when filtrating lignin/vanillin solution at the concentrations 5-0.5, 20-2, 60-6 g L-1, pH=8.5 and 12.5 .......... 159
Figure 6.19 Vanillin and lignin concentration in retentante versus time using membrane of 15 kDa cut-off and at pH=8.5(a); pH=12.5(b). The initial concentration of lignin was 60 g L-1 and vanillin 6 g L-1. Transmembrane pressure: PΔ =1.3 bar. Feed flowrate: ≈feedQ 102 L h-1................................................................ 160
Figure 6.20 Vanillin and lignin concentration in permeate versus time using membrane of 15 kDa cut-off and at pH=8.5(a); pH=12.5(b). The initial concentration of lignin was 60 g L-1 and vanillin 6 g L-1. Transmembrane pressure: PΔ =1.3 bar. Feed flowrate: ≈feedQ 101 L h-1................................................................ 160
Figure 6.21 Vanillin and lignin concentration in retentante versus time using membrane of 15 kDa cut-off at pH=8.5(a), pH=12.5(b). The initial concentration of lignin was 20 g L-1 and vanillin 2 g L-1. Transmembrane pressure PΔ =1.3 bar. Feed flowrate: ≈feedQ 102 L h-1. .............................................................................. 161
Figure 6.22 Vanillin and lignin concentration in permeate versus time using membrane of 15 kDa cut-off and at pH=8.5(a), pH=12.5(b). The initial concentration of lignin was 20 g L-1 and vanillin 2 g L-1. Transmembrane pressure PΔ =1.3 bar. Feed flow-rate: ≈feedQ 102 L h-1 .............................................................. 161
Figure 6.23 Vanillin and lignin concentration in retentante versus time using membrane of 15 kDa cut-off and at pH = 8.5. The initial concentration of lignin was 5 g L-1 and vanillin 0.5 g L-1. Transmembrane pressure PΔ =1.3 bar. Feed flow-rate:
≈feedQ 109 L h-1 ............................................................................................... 162
Figure 6.24 Vanillin and lignin concentration in permeate versus time using membrane of 15 kDa cut-off. The initial concentration of lignin was 5 g L-1 and vanillin 0.5 g L-1, pH=8.5. Transmembrane pressure PΔ =1.3 bar. Feed flow-rate: ≈feedQ 109 L h-1 ............................................................................................................ 163
Figure 6.25 Permeate flux in membrane of 1 kDa cut-off at pH = 12.5. The concentration of lignin was 2 g L-1 and vanillin 6 g L-1. Transmembrane pressure PΔ =1.55 bar. Feed flowrate: ≈feedQ 120 L h-1. The full line represents concentration polarisation model and the dotted line gel layer model. ................................... 165
Figure 6.26 Lignin concentration in retentante (a) and permeate(b) as a function of time using membrane of 1 kDa cut-off. The initial concentration of lignin was 2 g L-1 and vanillin 6 g L-1, pH=12.5. Transmembrane pressure PΔ =1.55 bar. Feed flow-rate: ≈feedQ 120 L h-1. The full line represents concentration polarisation model and the dotted line gel layer model. ................................... 166
Figure 6.27 Vanillin concentration in retentate (a) and permeate( b) as a function of time using membrane of 1 kDa cut-off. The initial concentration of lignin was 2 g L-1 and vanillin 6 g L-1, pH=12.5. Transmembrane pressure PΔ =1.55 bar. Feed flow-rate: ≈feedQ 120 L h-1. The full line represents concentration polarisation model and the dotted line gel layer model .................................... 166

xii
Chapter 7
Figure 7.1 Simplified flow sheet of the lignin oxidation for recovery of the synthetic vanillin ...............................................................................................................177
Figure 7.2 Theoretical ion-exchange equilibrium isotherms: ordinary and accompanied by chemical reaction. (dots) – experimental points for ordinary ion-exchange equilibrium of the Na+/H+ ions onto Amberlite IR120H. Initial solution: mixture of 0.1 equiv L-1 sodium chloride ( NaCl ) and pH = 5.3 (at 293 K).....182
Figure 7.3 Ion-exchange equilibrium of the Na+/H+ ions onto Amberlite IR120H (in presence of vanillin – weak acid – in solution). Initial solution: mixture of 0.03 equiv L-1 sodium hydroxide and 0.033eq L-1 ( ≈ 5 g L-1) of vanillin, pH = 8.3 (at 293 K); (dots) – experimental points, (lines) – predicted curves by simulation ..........................................................................................................190
Figure 7.4 Kinetics of Na+/H+ ion-exchange for the system vanillin/NaOH (ion-exchanger: Amberlite IR120 in H+ form). Mass of the wet resin added to the solution: (a) 0.3 g, (b) 0.8g, (c) 1.0g, (d) 1.5g and (e) 2.0g; (dots) – experimental points, (lines) – predicted curves by simulation............................................................193
Figure 7.5 Dimensionless resin concentration profiles of hydrogen (a) and sodium (b) ions in the resin homogeneous particle at different times. Case of 0.8 g wet resin in solution. .............................................................................................................196
Figure 7.6 Ion-exchange profiles of the studied system +Na ions, vanillate (VNa ), vanillin (VH ) and pH. Feed solution: mixture of 0.03 equiv L-1 NaOH and vanillin (pH=8.2). (dots) – experimental profile and (lines) – predicted concentration.. Conditions in column (150 x 20 mm, I.D.): Q = 19 cm3 min-1; pHinitial = 6.1; 293 K .................................................................................................................198
Figure 7.7 Ion-exchange profiles of the studied system +Na ions, vanillate (VNa ), vanillin (VH ) and pH. Feed solution: mixture of (a) 0.04 equiv L-1 NaOH and vanillin (pH=11.4); (b) 0.05 equiv L-1 NaOH and vanillin (pH=11.9); (c) 0.06 equiv L-1 NaOH and vanillin (pH=12.1). (dots) – experimental profile; (lines) - predicted profile. Conditions in column (150 x 20 mm, I.D.): Q = 19 cm3 min-
1; pHinitial = 6.1; 293 K.......................................................................................199
Figure 7.8 Influence of the pH values on fraction of both vanillin forms in liquid phase......200
Chapter 8
Figure 8.1 Scheme of integrated process to produce vanilin ..................................................212

xiii
List of Tables
Chapter 2
Table 2.1 Physical properties of adsorbents used for phenol adsorption ................................. 12
Table 2.2 Equilibrium parameters determined for the adsorption of phenol onto Filtrasorb F400, Sephabeads SP206 and Sephabeads SP207 .............................................. 21
Table 2.3 Separation parameter,b , corresponding to the different systems adsorbent-phenol .................................................................................................................. 23
Table 2.4 Parameters used for estimating the axD corresponding to the different fixed bed systems considered at flow rate 10 mL min-1...................................................... 28
Table 2.5 LDF kinetic rate constants estimated (kLDF) for the adsorption of phenol onto each adsorbent. .................................................................................................... 28
Table 2.6 Experimental conditions used for the different parametric pumping runs in semi-continuous recuperative mode............................................................................. 29
Chapter 3
Table 3.1 Equilibrium determined for de adsorption of salicylic acid onto Filtrasorb F400 and Sephabeads SP206 and SP207...................................................................... 53
Table 3.2 Separation parameter, b , corresponding to the different systems adsorbent-salicylic acid here considered.............................................................................. 55
Table 3.3 Parameters used for estimating Dax and the intraparticle mass transfer coefficients fk and sk for the different fixed bed systems considered ............. 58
Table 3.4 Characteristics and parameters used for the simulations of the operated parametric pumping system ................................................................................ 65
Table 3.5 Experimental conditions used for the different parametric pumping runs carried out in recuperative mode. .................................................................................... 66
Chapter 4
Table 4.1 Equilibrium parameters determined for the adsorption of phenol and 4-nitrophenol onto Sephabeads SP206 and the corresponding separation parameter b calculated for temperature range 293-310K, 310-333K and 293-333K . .................................................................................................................. 90
Table 4.2 Estimated axial dispersions ( axD ) corresponding to the fixed bed systems considered and LDF kinetic rate constants estimated (kLDF) for the adsorption of 4-nitrophenol onto Sephabeads SP206. .......................................................... 92
Table 4.3 Experimental conditions used for the different parametric pumping runs in........... 94

xiv
Chapter 5
Table 5.1 Physical and chemical properties of the polymeric adsorbent Sephabeads SP206 105
Table 5.2 Langmuir isotherms parameters and equilibrium constant at the temperature 293, 310 and 333 K....................................................................................................113
Table 5.3 Experimental conditions for the fixed-bed adsorption of vanillin onto polymeric adsorbent Sephabeads SP 206. ..........................................................................116
Table 5.4 Calculated values of molecular diffusivity and LDFk for vanillin in absence of sodium hydroxide. .............................................................................................116
Table 5.5 Experimental conditions for the fixed-bed adsorption of vanillin in presence of sodium hydroxide in feed solution ....................................................................120
Table 5.6 Calculated values of molecular diffusivity and LDFk for vanillin in presence of sodium hydroxide. .............................................................................................120
Chapter 6
Table 6.1 Model describing concentration polarisation in the case of diluted solution 2/6 g/L lignin vanillin. .............................................................................................144
Table 6.2 The model parameters used in the simulation for membrane 1 kDa cut-off. .........150
Table 6.3 Volume reduction and retention for vanillin (VH) and lignin(L) obtained from experiments onto 1 kDa membrane ...................................................................151
Table 6.4 The values of volume reduction and retention for vanillin and lignin obtained from experiments onto 5 kD membrane. ...........................................................153
Table 6.5 The model parameters used in simulation for the membrane of 5 kDa cut-off ......154
Table 6.6 The values of volume reduction and retention for vanillin and lignin obtained from experiments onto 15 kD membrane. .........................................................156
Table 6.7 Model parameters used in simulations for membrane of 15 kDa cut-off ...............159
Table 6.8 Model parameters used in simulations considering osmotic pressure and concentration polarisation..................................................................................164
Table 6.9 The values of volume reduction and retention for vanillin and lignin obtained from experiments onto 1 kDa membrane ..........................................................165
Chapter 7
Table 7.1 Properties of the ion exchanger Amberlite IR120H ...............................................178
Table 7.2 Initial and equilibrium experimental concentrations of vanillin ( VHC ), vanillate
( VNaC ), total ( TVC ) and measured pH and calculated pHT (according to the
Eq.7.4 – Batch system .......................................................................................191
Table 7.3 Feed experimental concentration of vanillin ( VHC ), vanillate ( VNaC ), total ( TVC )
and measured pH and calculated pHT (according to the Eq.7.4 – Fixed-bed system. ...............................................................................................................197

1. Introduction
1.1 Relevance and Motivation
The aim of this thesis is to apply clean technologies in the purification of wastewaters from
different sources containing phenolic compounds and in the process of producing vanillin
from Kraft lignin.
The present work “Clean Technologies for the Purification of Wastewaters: Adsorptive
Parametric Pumping” is divided into two sections: The first section aims at the removal of
phenolic species from effluents (phenol, salicylic acid, 4-nitrophenol) by using thermal
parametric pumping. The second section deals with the recovery of vanillin from Kraft lignin
oxidation, using membrane and ion-exchange process.
Widespread contamination of water by phenolic effluents has been recognized as an issue of
growing importance in recent years. In fact, the main pollutants of aquatic ecosystems are
considered to be phenols since they are harmful to plants, animals and human, even at low
concentrations (Nigam et al., 2000). By the extensive use of these compounds they readily
enter ecosystems with industrial and municipal waste water, leachates emerging from waste
deposits, by agricultural runoff of pesticides, by effluents from oil refineries, etc.(Li et al.,
2001; Li et al., 2002).

2 CHAPTER 1
Phenolic compounds are widely used in pharmaceutical, petrochemical and other chemical
manufacturing processes. Most of them are toxic, potential or known human carcinogen and
undesirable due to odours and unsightly colour (Martel and Morcellet, 1994) and cannot be
discharged to the water recipient without treatment. The processes frequently involved are
biological degradation, chemical oxidation of the waste organics and adsorption processes.
In the past, municipal treatment-systems were used for the purification of wastewater from
industry. These systems depended on biological activity and were mostly found inefficient in
the removal of the more resistant phenolic effluents. Nowadays, new treatment technologies
are still constantly researched and developed. Current methods for removing phenolics from
wastewater include microbial degradation, chemical oxidation (using ozone, hydrogen
peroxide or chlorine dioxide), and adsorption on natural and synthesized adsorbent,
incineration methods, solvent extraction and irradiation (Cooney, 1998).
It has been shown that biological degradation occurs too slowly (Kunin, 1976). Biological
degradation and chemical oxidation are very sensitive to operation conditions and therefore
can have unpredictable performance. Among the mentioned methods for removing pollutants
adsorption still continues to be the most widely used process, especially in the cases with low
pollutant concentrations. The adsorption processes have better performance and
reproducibility and also they have advantage in economical point of view.
Major types of adsorbents in use are: activated alumina, activated carbon, silica gel, molecular
sieve carbon, molecular sieve zeolites and polymeric adsorbents. Activated carbons are
porous materials, with a large surface area containing predominantly micropores, which are
used for purification and recovery in chemical and pharmaceutical processing as well as for
environmental remediation. They are versatile adsorbents and are therefore used to remove a
broad spectrum of dissolved organic and inorganic species from liquid and gaseous phases.
Commercially available activated carbons are mainly derived from coal, wood or coconut
shell, though there are an enormous range of potential source materials that could be used.
In view of the high cost and tedious procedure for the preparation and regeneration of
activated carbon there is continuing search for alternative low cost potential adsorbents. This
has encouraged research into speciality adsorbents using naturally occurring materials and
synthetic resins that may lead to a cost-effective treatment process and energy efficient
operation.
Clean Technologies for the Purification of Wastewaters: Adsorptive Parametric Pumping

Introduction 3
At present, polymeric adsorbents are widely employed for the isolation and purification of
organic substances.
Due to their wide variations in functionality, surface area, and porosity, polymeric adsorbents
have been increasingly viewed as an alternative to activated carbon for the selective removal
of specific organic substances from contaminated water (Li et al., 2001; Li et al., 2002).
Among the adsorbents used in adsorption technology, copolymers of polystyrene
divinylbenzene are of great importance (Gusler et al., 1993).
Parametric pumping is a cyclic process based upon the fact that the adsorption equilibrium
isotherms of solutes onto some materials are strongly dependent on certain thermodynamic
variables such as temperature, pressure, pH etc. There are two modes for operation: the direct
mode when the temperature change is imposed through the column wall, and the recuperative
mode, when the temperature change is carried by the liquid stream.
Parametric pumping was initially considered as a technology for the recovery of valuable
products. Later it was used for wastewater purification purposes (Costa et al., 1982) giving
the starting point to other works carried out in our laboratory (Ferreira and Rodrigues, 1995b;
Ferreira and Rodrigues, 1995a; Díez et al., 1998; Davesac et al., 2000).
Some potential advantages of parametric pumping are the possibility of continuous operation
and the use of low potential thermal energy as a regenerant. A closed system parametric
pumping has no feed or product streams and the system requires a feed reservoir and two
reservoirs to collect the top and the bottom product. In an open system operating in
recuperative mode the enrichment of the solute occurs in the top reservoir while an almost
free-solute solution is obtained in the bottom reservoir.
The pulp and paper industry is a large water consumer and discharges effluents which
produce high inorganic and organic pollution loadings. Pulp and paper industries are the main
source of pure lignin. The Kraft process is at present dominating chemical pulping process of
wood delignification and accounts for 2/3 of the lignin production. The black liquor is, after
recovery of chemicals, burned in the boiler (Keyoumu et al., 2004). The increase of capacity
of pulp and paper plants is often limited by the boiler capacity which can justify the use of
black liquor as lignin-source to produce vanillin. In the process of Kraft lignin oxidation to
produce vanillin the reaction media at pH =12-13 contains degraded lignin and vanillin (most
Clean Technologies for the Purification of Wastewaters: Adsorptive Parametric Pumping

4 CHAPTER 1
in the vanillate form) (Fargues et al., 1996). By using a membrane process the lignin can be
extracted and the mixture vanillin/vanillate can be recovered in the permeate. The vanillin is
then recovered from the mixture by using a column packed with strong acidic resin in +H
form. The extracted lignin can be later converted into a useful biofuel, or used as dispersant or
to produce biopolymers.
1.2 Objectives and Outline
There are two general objectives of this thesis. The first part is dedicated to purification of
diluted wastewaters containing phenol, salicylic acid and 4-nitrophenol including the search
for suitable adsorbents. For this purpose, the thermal parametric pumping has been considered
as a clean technology which avoids the use of chemical regenerant and contributes to achieve
the concept of zero-pollutant plant.
The objective of the second part of the thesis is to recover vanillin from the reaction media in
the Kraft lignin oxidation process. The recovery includes ultrafiltration process using ceramic
membranes to separate high molecular weight components (lignin) from vanillin. As
following step nonionic polymeric adsorbent and strong cationic ion-exchanger has been
tested in the process of recovery of vanillin.
Adsorption is one of the most common ways for wastewater treatment of phenolic
compounds, which are undesirable pollutants in the environment, specifically in aquatic
media. In the Chapter 2, the adsorption of phenol from aqueous solutions onto two polymeric
resins (Sephabeads SP206, SP207) and onto activated carbon (Filtrasorb F400) was studied.
Polymeric resins Amberlite XAD16 and Duolite S861 have been studied as well and are
described in Appendix B. Batch equilibrium experiments were carried out at three different
temperatures (293, 310 and 333 K) for each of the adsorbents and equilibrium data were fitted
by the Langmuir isotherm. The breakthrough curves were predicted by using linear driving
force (LDF) model. Polymeric resin Sephabeads SP206 was used to purify a phenolic solution
by parametric pumping at pilot scale using hot and cold temperatures of 293 and 333 K.
Salicylic acid is a phenolic compound with a high production in a world scale, which is
mainly linked to aspirin manufacture. Batch and fixed bed adsorption and desorption of
salicylic acid onto activated charcoal (Filtrasorb F400) and onto polymeric adsorbents
(Sephabeads SP207, Sephabeads SP206) was studied. Polymeric resins Amberlite XAD16
Clean Technologies for the Purification of Wastewaters: Adsorptive Parametric Pumping

Introduction 5
and Duolite S861 have been also studied and are described in Appendix B. The adsorptive
behavior of these resins has been compared. The aim is to obtain a purified and a concentrated
stream of salicylic acid, which allows recycling for the industrial process so contributing to
achieve the concept of a zero-pollutant plant. For this purpose, the applicability of parametric
pumping technology for the purification of salicylic acid in liquid phase has been evaluated in
the Chapter 3.
The recovery and/or purification of liquid streams containing 4-nitrophenol by adsorptive
parametric pumping were studied in the Chapter 4. An automated parametric pumping pilot
unit was operated in semi-continuous recuperative mode. The heart of the system was a
column packed with polymeric adsorbent Sephabeads SP206. Previously, the adsorption
behaviour was obtained from batch equilibrium experiments and fixed bed adsorption. The
Simplified Equilibrium model and a linear driving force (LDF) model were used to predict
parametric pumping experimental results.
Chapter 5 considers the adsorption of synthetic vanillin at different pH onto non-ionic
polymeric resins Sephabeads SP206. Batch experiments were carried out in order to obtain
adsorption equilibrium isotherms at temperatures 293, 310, 333 K. The adsorption
equilibrium isotherms have been described by the Langmuir model. The impact of sodium
hydroxide on the adsorption of vanillin was investigated. The mathematical model used to
predict fixed-bed adsorption results includes linear driving force for intraparticle mass
transfer and reaction in liquid phase for the system vanillin/sodium hydroxide.
The membrane separation of the mixture lignin/vanillin using ceramic ultrafiltration tubular
membranes is described in the Chapter 6. The influence of membrane pore size on the
separation of vanillin from lignin/vanillin mixture was experimentally studied by testing
ceramic membranes with different cut-offs (50 (described in appendix D), 15, 5 and 1 kD).
The influence of concentration and pH of the mixture on the recovery of vanillin was
evaluated as well.
The Chapter 7 deals with the recovery of vanillin from Kraft lignin oxidation using an ion
exchange process accompanied by neutralization. In order to produce vanillin, oxidation of
lignin takes place in the presence of alkaline medium (pH=12-13); under such condition
almost all vanillin is present as vanillate. The vanillate solution is passed through the column
packed with ion-exchange resin in +H form (Amberlite IR120H) and the vanillate is
Clean Technologies for the Purification of Wastewaters: Adsorptive Parametric Pumping

6 CHAPTER 1
converted to vanillin form. A set of batch equilibrium experiments (uptake curves) and fixed-
bed experiments were evaluated in order to obtain the evolution of vanillin, vanillate species
and pH with time until equilibrium between liquid and resin phase is established. The
developed mathematical model predicts uptake curves and breakthrough curves and is based
on intraparticle diffusion controlled neutralization of the cationic resin by the system
vanillin/NaOH.
The conclusions of the thesis and suggestions for the future work are addressed in Chapter 8.
1.3 References
Cooney, D. O., Adsorption Design for Wastewater Treatment. Lewis Publishers, Washington
D.C., 1998.
Costa, C. A. V., Rodrigues, A. E., Grevillot, G. and Tondeur, D., Purification of Phenolic
Wastewater by Parametric Pumping - Non-Mixed Dead Volume Equilibrium-Model. AIChE
Journal, 28 (1), 73-85 (1982).
Davesac, R. R., Pinto, L. T., da Silva, F. A., Ferreira, L. M. and Rodrigues, A. E., A package
for thermal parametric pumping adsorptive processes. Chemical Engineering Journal, 76 (2),
115-125 (2000).
Díez, S., Leitão, A., Ferreira, L. M. and Rodrigues, A. E., Adsorption of phenylalanine onto
polymeric resins: equilibrium, kinetics and operation of a parametric pumping unit.
Separation and Purification Technology, 13, 25 - 35 (1998).
Fargues, C., Mathias, A. and Rodrigues, A., Kinetics of Vanillin Production from Kraft
Lignin Oxidation. Industrial and Engineering Chemistry Research, 35 (1), 28-36 (1996).
Ferreira, L. M. and Rodrigues, A. E., Adsorptive separation by thermal parametric pumping
.1. Modeling and simulation. Adsorption-Journal of the International Adsorption Society, 1
(3), 213-231 (1995a).
Ferreira, L. M. and Rodrigues, A. E., Adsorptive separation by thermal parametric pumping
.2. Experimental study of the purification of aqueous phenolic solutions at pilot scale.
Adsorption-Journal of the International Adsorption Society, 1 (3), 233-252 (1995b).
Clean Technologies for the Purification of Wastewaters: Adsorptive Parametric Pumping

Introduction 7
Gusler, G. M., Browne, T. E. and Cohen, Y., Sorption of Organics from Aqueous-Solution
onto Polymeric Resins. Industrial & Engineering Chemistry Research, 32 (11), 2727-2735
(1993).
Keyoumu, A., Sjodahl, R., Henriksson, G., Ek, M., Gellerstedt, G. and Lindstrom, M. E.,
Continuous nano- and ultra-filtration of kraft pulping black liquor with ceramic filters - A
method for lowering the load on the recovery boiler while generating valuable side-products.
Industrial Crops and Products, 20 (2), 143-150 (2004).
Kunin, R., Use of Macroreticular Polymeric Adsorbents for Treatment of Waste Effluents.
Pure and Applied Chemistry, 46 (2-4), 205-211 (1976).
Li, A., Zhang, Q., Chen, J., Fei, Z., Long, C. and Li, W., Adsorption of phenolic compounds
on Amberlite XAD-4 and its acetylated derivative MX-4. Reactive and Functional Polymers,
49 (3), 225-233 (2001).
Li, A., Zhang, Q., Zhang, G., Chen, J., Fei, Z. and Liu, F., Adsorption of phenolic compounds
from aqueous solutions by a water-compatible hypercrosslinked polymeric adsorbent.
Chemosphere, 47 (9), 981-989 (2002).
Martel, B. and Morcellet, M., Sorption of Aromatic-Compounds in Water Using Polymer
Sorbents Containing Amino-Groups. Journal of Applied Polymer Science, 51 (3), 443-451
(1994).
Nigam, P., Armour, G., Banat, I. M., Singh, D., Marchant, R., McHale, A. P. and McMullan,
G., Physical removal of textile dyes from effluents and solid-state fermentation of dye-
adsorbed agricultural residues. Bioresource Technology, 74 (2), 179-179 (2000).
Clean Technologies for the Purification of Wastewaters: Adsorptive Parametric Pumping


2. Adsorptive purification of phenol wastewaters:
parametric pumping operation1
2.1
Introduction
Phenol-containing wastewater presents a serious environmental problem since biological
degradation of phenol occurs too slowly or does not occur at all (Kunin, 1976). Adsorptive
processes are widely used in the purification of such polluted streams and diluted wastewaters
(Humphrey, 1995; Keller, 1995; Knaebel, 1995). For some target solutes, it is also interesting
the fact that sorption operations are able to concentrate solutes, especially when these solutes
are valuable compounds.
Phenols are the most extensively studied compounds in the field of wastewater treatment as
they are persistent pollutants with high toxicity that are released in the wastewaters of a
considerable number of industries (Morao et al., 2004). Different techniques are used for the
removal of phenolic compounds from wastewater (Lin et al., 2002; Kujawski et al., 2004).
1 Based on the papers:
Adsorptive purification of phenol wastewaters: experimental basis and operation of a parametric pumping unit. by M. Otero, M. Zabkova, A.E. Rodrigues, Chemical Engineering Journal, 110, 101-111 (2005)
Phenolic wastewaters purification by thermal parametric pumping: modeling and pilot scale experiments. by M. Otero, M. Zabkova, A.E. Rodrigues, Water Research 39, 3467-3478 (2005)
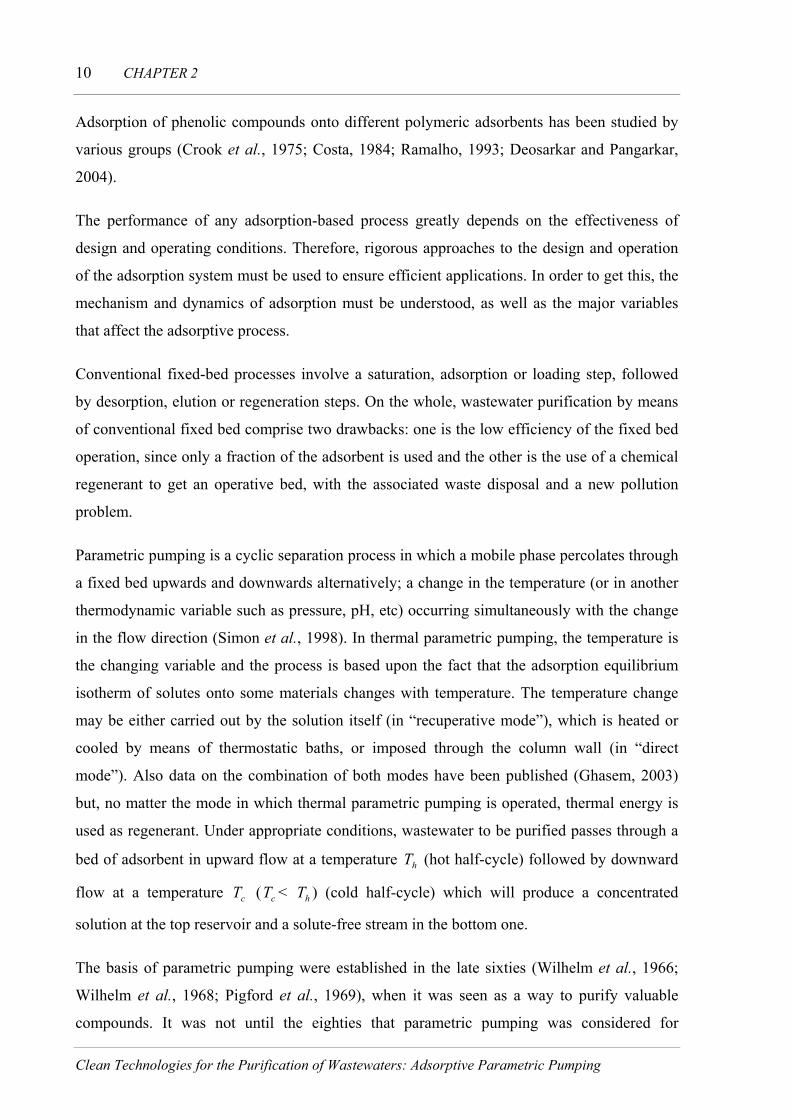
10 CHAPTER 2
Adsorption of phenolic compounds onto different polymeric adsorbents has been studied by
various groups (Crook et al., 1975; Costa, 1984; Ramalho, 1993; Deosarkar and Pangarkar,
2004).
The performance of any adsorption-based process greatly depends on the effectiveness of
design and operating conditions. Therefore, rigorous approaches to the design and operation
of the adsorption system must be used to ensure efficient applications. In order to get this, the
mechanism and dynamics of adsorption must be understood, as well as the major variables
that affect the adsorptive process.
Conventional fixed-bed processes involve a saturation, adsorption or loading step, followed
by desorption, elution or regeneration steps. On the whole, wastewater purification by means
of conventional fixed bed comprise two drawbacks: one is the low efficiency of the fixed bed
operation, since only a fraction of the adsorbent is used and the other is the use of a chemical
regenerant to get an operative bed, with the associated waste disposal and a new pollution
problem.
Parametric pumping is a cyclic separation process in which a mobile phase percolates through
a fixed bed upwards and downwards alternatively; a change in the temperature (or in another
thermodynamic variable such as pressure, pH, etc) occurring simultaneously with the change
in the flow direction (Simon et al., 1998). In thermal parametric pumping, the temperature is
the changing variable and the process is based upon the fact that the adsorption equilibrium
isotherm of solutes onto some materials changes with temperature. The temperature change
may be either carried out by the solution itself (in “recuperative mode”), which is heated or
cooled by means of thermostatic baths, or imposed through the column wall (in “direct
mode”). Also data on the combination of both modes have been published (Ghasem, 2003)
but, no matter the mode in which thermal parametric pumping is operated, thermal energy is
used as regenerant. Under appropriate conditions, wastewater to be purified passes through a
bed of adsorbent in upward flow at a temperature T (hot half-cycle) followed by downward
flow at a temperature T (T < ) (cold half-cycle) which will produce a concentrated
solution at the top reservoir and a solute-free stream in the bottom one.
h
c c hT
The basis of parametric pumping were established in the late sixties (Wilhelm et al., 1966;
Wilhelm et al., 1968; Pigford et al., 1969), when it was seen as a way to purify valuable
compounds. It was not until the eighties that parametric pumping was considered for
Clean Technologies for the Purification of Wastewaters: Adsorptive Parametric Pumping

Adsorptive purification of phenol wastewaters: parametric pumping operation 11
wastewater purification purposes (Costa et al., 1982) giving the starting point to other works
carried out in our laboratory (Ferreira and Rodrigues, 1995b; Ferreira and Rodrigues, 1995a;
Díez et al., 1998; Davesac et al., 2000).
Whether the problem is isolating or purifying a substance of commercial interest or cleaning
wastewater, the technology to separate and purify molecules of choice is of critical
importance.
The interest of parametric pumping for the wastewater treatment is that this technology would
enable purification of industrial wastewaters avoiding the use of chemical regenerant and
allowing the recycling of the concentrated stream for the industrial process so contributing to
achieve the concept of zero-pollutant plant.
The aim of this chapter is to describe the adsorption of phenol onto different polymeric resins
SP206, SP207 and activated charcoal (Filtrasorb F400). Thermal parametric pumping being
based on the variation of temperature, both batch equilibrium and fixed bed tests were carried
out at three different temperatures (293, 310 and 333 K) for each of the adsorbents in order to
study the effect of temperature on the adsorption of phenol. Modeling of the fixed bed
adsorption was made based on the results obtained for adsorption equilibrium isotherms. Also
experiments at different flow rates of the feed solution were carried out. The final aim of the
work is to use parametric pumping for the purification of phenolic wastewater and to compare
experimental with simulated results obtained by a simulation package of parametric pumping
cycles previously developed (Davesac et al., 2000).
2.2 Experimental part
2.2.1 Chemicals and adsorbents
Phenol (C6H6O) was purchased from Sigma-Aldrich (Spain). The solutions of phenol were
prepared with degassed and distilled water.
The activated carbon used was Filtrasorb F400, and was kindly provided by Chemviron
Carbon (Belgium). The nonionic polymeric resins were Sephabeads SP206 and SP207
(Mitsubishi Chemical Corporation) purchased from Resindion (Italy). These resins have been
previously used successfully for phenolic derivatives adsorption (Díez et al., 1998).
Clean Technologies for the Purification of Wastewaters: Adsorptive Parametric Pumping

12 CHAPTER 2
In the Table 2.1 are reported the physical characteristics provided by the producers for the
adsorbents employed in this research work. As it may be seen, the polymeric adsorbents
properties are very different from those of the activated charcoal.
2.2.2 Batch adsorption
Adsorption equilibrium experiments were carried out by contacting a given amount of
adsorbent (0.05-6.0 g) with 100 mL of phenol solution in 250-mL Erlenmeyer flasks. Initial
concentration of the solution was 500 mg L-1 in most cases. Adsorption equilibrium isotherms
were measured by batch equilibration placing the volumetric flasks in a shaking mixer at 150
rpm and using a thermostatic bath for temperature control.
Table 2.1 Physical properties of adsorbents used for phenol adsorption
Adsorbent Filtrasorb F400 Sephabeads SP206 Sephabeads SP207
Aromatic porous resin with hydrophobic
substituents-crosslinked copolymer of styrene
Aromatic porous resin with hydrophobic
substituents-crosslinked copolymer of styrene
Agglomerated coal based granular
activated carbon Matrix
Physical form Black granular carbon Yellow opaque beads Brown opaque beads
Humidity factor (fh) 1 0.5 0.5 (dry particle to wet
particle mass ratio)
Specific surface area (m2g-1) 1050 556 627
Density of wet adsorbent (g L-1) 700 1190 1180
Average 0.7 0.4 0.4
Particle size (mm)
Equilibrium experiments were run at 293, 310 and 333 K for each adsorbent-phenol system.
After shaking during 48 h, the solution was separated from the adsorbent and the final
concentration of phenol in solution was determined by measuring the absorbance at a
wavelength of 272 nm using UV-visible spectrophotometer Jasco (model 7800, Japan) and
the amount of phenol adsorbed onto adsorbents, q (mg g-1dry resin), was calculated. *
Clean Technologies for the Purification of Wastewaters: Adsorptive Parametric Pumping

Adsorptive purification of phenol wastewaters: parametric pumping operation 13
2.2.3 Fixed-bed adsorption
The adsorbents previously used in batch testes were also used in fixed bed operation. A
peristaltic pump Watson-Marlow was used to pump the phenol solution through the beds of
the adsorbents here considered. The temperature of the feeding solution was maintained by a
thermostatic bath (Edmund Bühler). Phenol concentration at the column outlet was measured
by an UV-visible spectrophotometer Jasco (model 7800, Japan) at a wavelength 272 nm.
Fixed bed adsorption of phenol onto different adsorbent was studied at temperatures 293, 310
and 333 K. Experiments at two different flow-rates were carried out as well. The flow-rates of
the feed solution were 10 and 15 mL min-1 for Filtrasorb F400, 10 and 5 mL min-1 for SP 206
and 207. The feed concentration was always around 100 mg L-1 of phenol. Dynamic column
experiments were carried out by packing the adsorbents in lab-scale column (0.30 × 0.01 I.D
m) and feeding with the phenol solution. A peristaltic pump (Watson-Marlow) was used to
pump the phenol solution in downward flow. The temperature of the feed was maintained by
a thermostatic bath (Edmund Bühler).
The height of the bed used in the experiments was 300 mm for the polymeric adsorbents and
100 mm for the activated carbon.
2.2.3.1 Parametric pumping operation
Figure 2.1 shows the pilot plant used to carry out the phenol purification by thermal
parametric pumping. This is a completely automated system and it has been described with
detail elsewhere (Ferreira and Rodrigues, 1995b). Basically, the core is a borosilicate column
(90 I.D x 1000 mm) where the adsorbent is packed. Temperature waves in the cycles are
measured by thermocouples installed at the inlet and outlet of the column. The solution is
pumped through the column downward (cold half-cycle: 293K) and upward (hot half-cycle:
333K) alternatively by using the peristaltic pumps 15 or 16 respectively. The solenoid valves
11 and 12 are one open and the other closed while downward flow and on the contrary during
the upward flow. Heating and cooling of the fluid phase is carried out by the hot 7 and the
cold 6 heat exchangers. There are three reservoirs: top, bottom and feed reservoirs. The top
and bottom reservoirs receive product when the solution is pumped through the column in
upward or downward flow, respectively. From the feed reservoir, the feed solution is passed
into the top reservoir, with the pump 18 on. Pressure transducers installed at the bottom of the
Clean Technologies for the Purification of Wastewaters: Adsorptive Parametric Pumping

14 CHAPTER 2
reservoirs allow detecting when all the solution contained in a reservoir was transferred,
which means the end of one half cycle. Bottom and top products were collected at fixed time
intervals by a fraction collector, with pumps 19 and 17 working. The solute concentration was
determined by an UV-visible spectrophotometer Jasco (model 7800, Japan) at a wavelength
272 nm.
Figure 2.1 Experimental set-up of the parametric pumping pilot plant.
Legend: (1) Glass column G90-Amicon (2) Feed reservoir (3) Top reservoir (4) Bottom reservoir (5) Fraction collector Gilson (6) –(7) Heat exchangers (8)-(12) Two ways solenoid valves (13)-(14) Three ways solenoid valves (15)-(16) Peristaltic pumps Watson Marlow (17)-(19) Peristaltic pumps Gilson (T1)-(T2) Thermocouples (type K) (P1)-(P3) Pressure transducers Schwaevitz (type P510)
The experimental set-up described above was used for the system water-phenol-Sephabeads
SP206. Also other systems have been previously studied (Ferreira and Rodrigues, 1995b;
Ferreira and Rodrigues, 1995a; Díez et al., 1998). Previously to the cyclic operation of the
system, fixed bed adsorption runs were carried out in the pilot unit at both 293 and 333 K
using Sephabeads SP206 as adsorbent. The feed concentration was around 500 mg L-1 and the
Clean Technologies for the Purification of Wastewaters: Adsorptive Parametric Pumping

Adsorptive purification of phenol wastewaters: parametric pumping operation 15
flow-rate 600 mL min-1, the height and the diameter of the SP206 bed being 800 and 90 mm
respectively. Previously to each run, the temperature of the bed was stabilized by pumping
deionised water at 600 mL min-1 and at 293 K or 333 K to later carry out the corresponding
phenol isothermal fixed bed saturation.
The operation of the parametric pumping pilot plant was performed during 10 cycles in a
recuperative mode. The regime of operation was semi-continuous, i.e., the sequence was: feed
input and top product withdrawal during the upward hot half-cycle and bottom product
withdrawal during the downward cold half-cycle. A simulation package (Davesac et al.,
2000) was used for the simulation of the cyclic operation. Experimental results were
compared with the simulated ones obtained using a non-isothermal model which includes
Linear Driving Force describing intraparticle mass transfer and axial dispersion.
2.3 Mathematical models
2.3.1 Adsorption isotherms
The amount of phenol adsorbed onto adsorbent (mg g-1dry resin), was calculated by a
mass balance relationship (Eq. 2.1).
*q
( )WV
CCq *0
* −= 2.1
where (mg L-1) and (mg L-1) are the initial and equilibrium liquid-phase
concentrations, respectively, V the volume of the solution (
0C *C
L ) and W the dry weight (g) of
the corresponding adsorbent. The volume of solution and mass of adsorbent used in
experiment are described in Paragraph 2.2.2.
The adsorption equilibrium isotherms for phenol onto each adsorbent at various temperatures,
(mg g-1dry resin) versus the adsorbate liquid concentration at equilibrium, C (mg L-1)
were fitted with the Langmuir model.
* *q
The Langmuir equation (Eq. 2.2) is based on a theoretical model, which assumes that
adsorption occurs onto specific sites of a uniform energetic surface, without interactions
between adsorbed molecules and adsorption is confined to monolayer coverage.
Clean Technologies for the Purification of Wastewaters: Adsorptive Parametric Pumping

16 CHAPTER 2
CKCQK
qL
L
+=
1* 2.2
where Q is the maximum adsorptive capacity and KL a parameter which relates to the
adsorption enthalpy (Guiochon et al., 1994).
⎟⎠
⎞⎜⎝
⎛ Δ−= ∞
RTH
KK LLL exp 2.3
The adsorption enthalpy in the Langmuir constant is generally a net value that includes the
solvent desorption and the solute adsorption (Giles et al., 1974). The empirical parameters
were calculated by MATLAB 6.1 following the optimization routine and using the Simplex
direct search method. The obtained parameters are given in Table 2.2.
Separation parameter:
From the equilibrium results, it may be found the separation to be expected as a function of
temperature for each of the systems phenol-adsorbent. The separation parameter , introduced
by Pigford (1973), is indicative of the separation potential:
b
ma
b+
=1
2.4
2)()( 21 TmTm
m+
=2
)()( 21 TmTma
−=with the average slope and the deviation , considering
.The capacity parameter is defined as 21 TT <ε
ρε )()1( TKf)(Tm hp−
= , where
is the slope of initial linear region of the isotherm corresponding to each temperature,
LQKTK =)(
ε is the
bed porosity was assumed (ε = 0.4), ρ is the density and the humidity factor of the
corresponding adsorbent, which values appear in
fh
Table 2.1.
2.3.2 Fixed bed modeling
The model used to predict the fixed bed adsorption of the phenol comprises a mass balance,
the adsorption equilibrium isotherm at the liquid/solid interface. The linear driving force
(LDF) rate equation was used to describe the diffusional mass transfer inside adsorbent
particles.
Clean Technologies for the Purification of Wastewaters: Adsorptive Parametric Pumping

Adsorptive purification of phenol wastewaters: parametric pumping operation 17
Species balance:
The mass balance in a bed volume element is:
ttzq
ft
tzCz
tzCuz
tzCD hpiax ∂∂−
+∂
∂=
∂∂
−∂
∂ ),(1),(),(),(2
2ρ
εε 2.5
εwhere is the axial dispersion coefficient , is the interstitial velocity, axD iu is the bed
porosity, is the axial position, C is the concentration in the bulk fluid phase, qz is the
average adsorbed phase concentration in the adsorbent particles, pρ is the density of the
adsorbent and its humidity factor. fh
The boundary conditions for the mass balance equation are the Danckwerts boundary
conditions:
)),0((),(00 CtCu
ztzCD izax −=
∂∂
=0=z 2.6
0),(=
∂∂
=LzztzC 2.7 Lz =
The associated initial conditions for the adsorption are:
2.8 0)0,( =zC
( ) 00, =zq 2.9
Intraparticle mass transfer:
The Linear Driving Force (LDF) approximation (Glueckauf, 1955) was used to describe
intraparticle mass transfer:
[ ]),(),(),( * tzqtzqk
ttzq
LDF −=∂
∂ 2.10
( )tzq ,*where kLDF is the Linear Driving Force kinetic constant, is the adsorbed phase
concentration at particle surface in equilibrium with the bulk concentration.
In the previous equations, the axial dispersion was obtained from the following expression
(Guiochon et al., 1994):
Clean Technologies for the Purification of Wastewaters: Adsorptive Parametric Pumping

18 CHAPTER 2
)Re011.02.0( 48.00 +=ax
p
Ddu
2.11
ηρ pf du0Re =where .
The kLDF used in the model were estimated by the following expression (Azevedo, 2001):
dCdqfr
Dk
hp
peLDF *
2ρ
Ω= 2.12
where (m2min-1) is the effective pore diffusivity, (m) is the radius of the particle of the
adsorbent, Ω is the LDF factor, which is equal to 15 for spherical particles (Azevedo, 2001),
and (
peD pr
dCdq*
) is the slope of the adsorption equilibrium isotherm.
The was calculated from (Guiochon et al., 1994): peD
τε mp
peD
D = 2.13
where is the molecular diffusivity of the solute in water, τmD is the tortuosity of the
adsorbent and its porosity. pε
The molecular diffusivity of phenol in water was calculated from the Wilke-Chang (Wilke
and Chang, 1955) equation (Eq. 2.14), which estimates the (cm2 s-1) as: Dm
( )6.0
2/18104.7
AB
Bm V
TMDη
φ−×= 2.14
where is the molar volume of the solute, the values of were estimated by the Le Bas
additive method (Reid et al., 1987) giving V = 108 cm3 mol-1 for phenol. Wilke and Chang
recommended that the dimensionless association factor of solvent,
AV AV
A
φ was chosen 2.6 if the
solvent is water. The viscosity of water Bη (cp) at the corresponding temperature was used.
Clean Technologies for the Purification of Wastewaters: Adsorptive Parametric Pumping

Adsorptive purification of phenol wastewaters: parametric pumping operation 19
The partial differential equations of the model to describe the adsorption of phenol onto tested
adsorbent were solved using the software package gPROMS® for general PROcess Modelling
System. The orthogonal collocation method on finite elements (OCFE) was used with 50
finite elements and two interior collocation points in each element of the adsorption bed.
2.3.3 Parametric pumping simulation
From the batch and fixed bed tests results, the adsorbent Sephabeads SP206 is the one which
adsorption performance is affected by temperature in a higher degree. Recuperative thermal
parametric pumping being based in differences on adsorption capacity caused by changes in
the temperature of the solution, this resin was selected for studying phenol purification by
parametric pumping. The experimental results of the parametric pumping system Sephabeads
SP206-Phenol were compared with the simulated ones using a Linear Driving Force model
with axial dispersion. Equations corresponding to the model used include, apart of the mass
balance (Eq. 2.5), the equilibrium isotherm (Eq. 2.2 and 2.3) and the mass transfer (Eq. 2.10),
an energy balance and the balance equations of the reservoirs.
Energy balance
[ ]
ttzq
HTTAhz
tzTuCpz
tzTK
ttzTCpCp
ambwwffae
sff
∂∂
Δ−+−−∂
∂±
∂∂
=
=∂
∂−+
),()()(),(),(
),()1(
02
2ρ
ερερ 2.15
where is the axial thermal conductivity, is the heat transfer coefficient of the wall of
the column and is the wall specific area,
aeK wh
wA and fρ ρ are the densities of the fluid and of
the adsorbent, and Cp and Cp are the heat capacities of the fluid and of the adsorbent,
respectively. Considering at the bottom of the column and
sf
0=z z L= at the top, in the (Eq.
2.15), the term zzTu
∂∂ (
0tCp ff±),ρ has the “+” sign for the cold half-cycle downwards, and
the “-“sign for the hot half-cycle upwards.
Balance of the reservoirs
Hot half-cycle
Clean Technologies for the Purification of Wastewaters: Adsorptive Parametric Pumping

20 CHAPTER 2
1−⟩⟨=⟩⟨ nBPBP CC 2.16
)1()(
)1(),()1(
T
TBF
T
nBTP CtLCC
φφφ
φφ
++
++
⟩⟨−=⟩⟨ 2.17
where and are the average concentration of phenol in the fluid which is in the
bottom and in the top reservoirs, respectively,
⟩⟨ BPC ⟩⟨ TPC
Bφ and Tφ are the fraction of the total reservoir
displacement volume ( ) which are withdrawn as product from the bottom and the top
reservoirs, respectively, and n refers to the number of cycles. Total reservoir displacement
volume ( ) is the volume of solution percolated through the column during cold half-
cycle.
( ωπ / )Q
)Q( ωπ /
Cold half-cycle
nBP tCC ⟩⟨=⟩⟨ ),0( 2.18
The boundary conditions for the equations included in the parametric pumping model are:
Hot half-cycle
0=z 2.19 nBPCtC ⟩⟨=),0( ; hTT =
0),(=
∂∂
ztzC 0),(
=∂
∂z
tzT 2.20 Lz =
Cold half-cycle
0),(=
∂∂
ztzC 0),(
=∂
∂z
tzT0=z 2.21
2.22 nTPCtLC ⟩⟨=),( cTT =Lz =
The initial conditions were:
0=t FCzC =)0,( cTzT =)0,( 2.23
Clean Technologies for the Purification of Wastewaters: Adsorptive Parametric Pumping

Adsorptive purification of phenol wastewaters: parametric pumping operation 21
2.4
* *
Results and discussion
2.4.1 Adsorption equilibrium isotherm
The adsorption equilibrium isotherms for phenol onto each adsorbent at various temperatures,
(mg g-1dry resin) versus the adsorbate liquid concentration at equilibrium, C (mg L-1)
were fitted with the Langmuir equation. Langmuir isotherm (Eq.2.2) is based on a theoretical
model where the maximum adsorption capacity corresponds to a monolayer saturated with
adsorbate molecules on the adsorbent surface, which is energetically homogeneous. The
characteristic parameters corresponding to the fittings are shown in
q
Table 2.2.
Table 2.2 Equilibrium parameters determined for the adsorption of phenol onto Filtrasorb F400, Sephabeads SP206 and Sephabeads SP207
Filtrasorb F400
Sephabeads SP206
Sephabeads SP207 Langmuir parameters
Q (mg g-1) 169.1 85.0 88.8
KL∞ (L mg-1) 1.32 x10⁻³ 1.52 x10⁻⁸ 2.99x10⁻⁷
ΔHL (kJ mol-1) -12.12 -30.35 -23.22
The corresponding to the Filtrasorb is higher than those corresponding to the Sephabeads
SP206 and SP207. On the contrary, the process is more exothermic in the case of phenol
adsorption onto the polymeric resins than onto the activated charcoal as indicated by the value
of Δ .
Q
H L
The experimental adsorbed concentrations as a function of liquid phase concentration
corresponding to the phenol adsorption onto Filtrasorb F400 at each of the temperatures
considered are shown in Figure 2.2. The obtained fittings to the Langmuir model are shown
together with the experimental points. The adsorption isotherms of phenol onto polymeric
adsorbents SP206 and SP207 are shown on the Figure 2.3 Figure 2.4. and
Clean Technologies for the Purification of Wastewaters: Adsorptive Parametric Pumping

22 CHAPTER 2
Figure 2.2 Experimental adsorption equilibrium (symbols), versus and fittings to Langmuir model (lines) at different temperatures (293, 310 and 333K) for the adsorption of phenol onto Filtrasorb F400
*q *C
Figure 2.3 Experimental adsorption equilibrium (symbols), versus and fittings to Langmuir model (lines) at different temperatures (293, 310 and 333K) for the adsorption of phenol onto Sephabeads SP206
*q *C
Clean Technologies for the Purification of Wastewaters: Adsorptive Parametric Pumping

Adsorptive purification of phenol wastewaters: parametric pumping operation 23
Figure 2.4 Experimental adsorption equilibrium (symbols), versus and fittings to Langmuir model (lines) at different temperatures (293, 310 and 333K) for the adsorption of phenol onto Sephabeads SP207
*q *C
The adsorptive capacity of phenol is much higher for the activated carbon Filtrasorb F400
than for the polymeric resins. Nevertheless, the influence of temperature on equilibrium is
much more noticeable in the case of the adsorption of phenol onto the resins, especially onto
Sephabeads SP206. From the equilibrium results, it may be found the separation to be
expected as a function of temperature for each of the systems phenol-adsorbent for different
ranges of temperature. Table 2.3 shows for each of the adsorbents considered the
corresponding separation parameter (b ) regarding to the adsorption of phenol. The
parameterb is indicative of the separation potential.
Table 2.3 Separation parameter,b , corresponding to the different systems adsorbent-phenol
293K-333K Temperature range 293K-310K 310K-333K
Filtrasorb F400 0.14 0.16 0.29
Sephabeads SP206 0.33 0.39 0.63
Sephabeads SP207 0.26 0.30 0.52
As it may be observed in Table 2.3, in the temperature range studied, the largest b values
correspond to the adsorption of phenol onto Sephabeads SP206. For this reason the system
Clean Technologies for the Purification of Wastewaters: Adsorptive Parametric Pumping

24 CHAPTER 2
phenol/SP206 was used in parametric pilot plant experiments at temperature range 293 K-333
K.
2.4.2 Fixed- bed adsorption
The breakthrough curves corresponding to the different adsorbents here considered confirm
that the influence of temperature variable on the adsorption of phenol is much more
noticeable for the polymeric resins Sephabeads SP 206 and SP 207 than for the activated
carbon Filtrasorb F400. This can be seen by comparing runs at the same flow rate (10 mL
min-1) on the Figure 2.5 Figure 2.8 Figure 2.10 (Filtrasorb 400) and and (SP206 and SP 207,
respectively).
Experimental data are shown together with the predicted behaviors on Figure 2.5 -2.10. The
LDF model seems to well describe the fixed bed adsorption of phenol onto the adsorbents
here used at the conditions of temperature and flow-rate here studied.
0
20
40
60
80
100
0 200 400 600 800 1000time(min)
conc
(mg/
l)
333K(simul)
333K(exp)
310K(simul)
293K(simul)
293K(exp)
310K(exp)
Figure 2.5 Fixed bed adsorption of phenol onto Filtrasorb F400. The bed length was 100 mm for Filtrasorb F400 and solution was fed at three temperatures (293K, 310K and 333K) at flow-rate 10 mL min-1. Symbols correspond to the experimental results and full lines to the simulated ones.
Clean Technologies for the Purification of Wastewaters: Adsorptive Parametric Pumping

Adsorptive purification of phenol wastewaters: parametric pumping operation 25
0
20
40
60
80
100
0 100 200 300 400 500 600 700 800 900time(min)
conc
(mg/
l)
333K(simul)
333K(exp)
310K(simul)
310K(exp)
293K(simul)
293K(exp)
Figure 2.6 Fixed bed adsorption of phenol onto Filtrasorb F400. The bed length was 100 mm for Filtrasorb F400 and solution was fed at three temperatures (293K, 310K and 333K) at the flow-rate 15 mL min-1. Symbols correspond to the experimental results and full lines to the simulated ones.
0
20
40
60
80
100
0 100 200 300 400 500 600time(min)
conc
(mg/
l)
333K(simul)
333K(exp)
293K(simul)
293K(exp)
310K(simul)
310K(exp)
Figure 2.7 Fixed bed adsorption of phenol onto Sephabeads SP206. The bed length was 300 mm for Sephabeads SP206 and solution was fed at three temperatures (293K, 310K and 333K) at the flow-rate 5.5 mL min-1. Symbols correspond to the experimental results and full lines to the simulated ones.
Clean Technologies for the Purification of Wastewaters: Adsorptive Parametric Pumping

26 CHAPTER 2
0
20
40
60
80
100
0 100 200 300 400 500time(min)
conc
(mg/
l) 333K(simul)
333K(exp)
310K(simul)
310K(exp)
293K(simul)
293K(exp)
Figure 2.8 Fixed bed adsorption of phenol onto Sephabeads SP206. The bed length was 300 mm for Sephabeads SP206 and solution was fed at three temperatures (293K, 310K and 333K) at the flow-rate 10 mL min-1. Symbols correspond to the experimental results and full lines to the simulated ones.
0
20
40
60
80
100
0 100 200 300 400 500 600 700time(min)
conc
(mg/
l)
333K(simul)
333K(exp)
310K(simul)
293K(simul)
293K(exp)
310K(exp)
Figure 2.9 Fixed bed adsorption of phenol onto Sephabeads SP207. The bed length was 300 mm for Sephabeads SP207 and solution was fed at three temperatures (293K, 310K and 333K) at the flow-rate 5.5 mL min-1. Symbols correspond to the experimental results and full lines to the simulated ones.
Clean Technologies for the Purification of Wastewaters: Adsorptive Parametric Pumping

Adsorptive purification of phenol wastewaters: parametric pumping operation 27
0
20
40
60
80
100
0 50 100 150 200 250 300 350 400time(min)
conc
(mg/
l)
333K(simul)
333K(exp)
310K(simul)293K(simul)
293K(exp)
310K(exp)
Figure 2.10 Fixed bed adsorption of phenol onto Sephabeads SP207. The bed length was 300 mm for Sephabeads SP206 and solution was fed at three temperatures (293K, 310K and 333K) at the flow-rate 10 mL min-1. Symbols correspond to the experimental results and full lines to the simulated ones.
0
100
200
300
400
500
0 50 100 150 200 250 300 350 400 450 500
time (min)
Phen
ol c
once
ntra
tion
(mg
L-1)
333K 293K
Figure 2.11 Fixed bed adsorption of phenol onto Sephabeads SP206 in pilot scale column (800x90 I.D. mm). The solution was feed at a flow rate of 600 mL min-1 and two runs, at 293K and 333K, respectively, were carried out.
The values of the Reynolds and the calculated axial dispersion used for the simulation of
the breakthrough curves of phenol are shown in
axD
Table 2.4. The rate constant used in the
model is shown in the
kLDF
Table 2.5.
Clean Technologies for the Purification of Wastewaters: Adsorptive Parametric Pumping

28 CHAPTER 2
Table 2.4 Parameters used for estimating the corresponding to the different fixed bed systems considered at flow rate 10 mL min-1
axD
(cm2 min-1) axDReadsorbent (K) (mm) T L
293 1.45 4.18
310 2.31 4.12 Filtrasorb F400 100
333 3.13 4.07
293 0.46 1.35
310 0.73 1.34 Sephabeads SP206 300
333 0.98 1.33
293 0.46 1.35
310 0.73 1.34 Sephabeads SP207 300
333 0.98 1.33
Table 2.5 LDF kinetic rate constants estimated (kLDF) for the adsorption of phenol onto each adsorbent.
Dpe Dm
pε τ kLDF (min-1) Adsorbent T (K) (m2
min-1) (m2 min-1)
5.34x10⁻⁸ 2.00 x10⁻⁸ 293 0.027
8.88 x10⁻⁸ 3.33 x10⁻⁸ 310 0.036 Filtrasorb F400 0.75 2
1.32 x10⁻⁷ 4.95 x10⁻⁸ 333 0.054
5.34 x10⁻⁸ 1.63 x10⁻⁸ 293 0.074
310 8.88 x10⁻⁸ 2.71 x10⁻⁸ 0.192 Sephabeads SP206 0.61 2
1.32 x10⁻⁷ 4.03 x10⁻⁸ 333 0.409
5.34 x10⁻⁸ 1.68 x10⁻⁸ 293 0.053
310 8.88 x10⁻⁸ 2.80 x10⁻⁸ 0.148 Sephabeads SP207 0.63 2
1.32 x10⁻⁷ 4.16 x10⁻⁸ 333 0.330
Clean Technologies for the Purification of Wastewaters: Adsorptive Parametric Pumping

Adsorptive purification of phenol wastewaters: parametric pumping operation 29
2.4.3 Parametric pumping
From the batch and fixed bed tests results, the adsorbent Sephabeads SP206 is the one which
adsorption performance is affected by temperature in a higher degree. Recuperative thermal
parametric pumping being based in differences on adsorption capacity caused by changes in
the temperature of the solution, this resin was selected for studying phenol purification by
parametric pumping. Fixed bed adsorption of phenol at 293K and at 333K was carried out in
the column of the parametric pumping set-up using a bed of Sephabeads SP206 (800 x 90 I.D
mm). Figure 2.11 shows the experimental results together with those simulated by the model
previously used in lab-scale columns. This model well predicts the fixed bed adsorption of
phenol onto Sephabeads SP206 also at a pilot scale. The characteristic parameters of the
operated system and the conditions under which the parametric pumping runs were carried
out are shown in Table 2.6 Table 2.6. In the V represents volume which is percolated through
the column during hot-half cycle, is reservoir displacement volume,
U
( ωπ /Q ) Bφ , Tφ are fraction
of withdrawn as a bottom and top product, respectively, Q , are flow-rates of
removing the product from the top and bottom reservoir, respectively. , Q , and
describes flow-rate of the fluid in the column during the cold and hot half-cycle and time of
the cold and hot cycle.
( ωπ /Q ) Q
Q t t
TP BP
c h c h
Table 2.6 Experimental conditions used for the different parametric pumping runs in semi-continuous recuperative mode.
Operating variables Run 1 Run 2 Run 3 Run 4
UV (mL) 11616 29000 9500 17000
( ωπ /Q ) (mL) 16940 31200 9600 20000
Bφ 0.31 0.068 0.068 0.15
Tφ 0.34 0.56 0.56 0.25
ct (min) 55 120 60 100
ht (min) 48 100 50 85 (mL.min-1) cQ 308 260 160 200 (mL min-1) hQ 242 290 190 200 (mL min-1) TPQ 134 184 119.5 62.5 (mL min-1) BPQ 105 18 12 32
Clean Technologies for the Purification of Wastewaters: Adsorptive Parametric Pumping

30 CHAPTER 2
Figure 2.12 shows the simulated axial profiles of temperature and concentration
corresponding to the operation of the parametric pumping unit under conditions for the run 4.
The evolution of the temperature profile along the time of the 10th hot half-cycle and the 10th
cold half-cycle may be seen in Figure 2.12 (A) and (B) respectively. The temperatures along
the bed at the end of the hot and at the end of the cold half-cycles are in the Figure 2.12 (C).
In Figure 2.12 (D) the simulated concentration profiles of phenol at the end of the hot and
cold half-cycles are shown for cycles 1, 2, 5, 10 and 20. These historic profiles reflect the
evolution of the concentration waves during the operation of the parametric pumping system.
C273
283
293
303
313
323
333
343
0 0.2 0.4 0.6 0.8 1Z*
T (K
)
ChcHhc
D1.00E-06
1.00E-05
1.00E-04
1.00E-03
1.00E-02
1.00E-01
1.00E+00
1.00E+01
0 0.2 0.4 0.6 0.8 1Z*
Phen
ol lo
g (C/C
F)
Hhc10Hhc5Hhc2Hhc1Chc1Chc2Chc5Chc10Hhc20Chc20
A273
283
293
303
313
323
333
343
0 0.2 0.4 0.6 0.8 1Z*
T (K
)
time
B273
283
293
303
313
323
333
343
0 0.2 0.4 0.6 0.8 1Z*
T (K
)
time
Figure 2.12 Simulated axial profiles of temperature and concentration during the operation of parametric pumping for phenol wastewater purification at the conditions corresponding to run 4. (A) Bed temperature profile evolution along the 10th hot half-cycle. (B) Bed temperature profile evolution along the 10th cold half-cycle. (C) Bed temperature profiles at the end of the hot half-cycle (Hhc) and at the end of the cold half-cycle (Chc). (D) Concentration profiles in the bed at the end of the hot half-cycle (Hhc) and cold half-cycle (Chc) for cycles 1, 2, 5, 10 and 20.
The experimental top and bottom temperatures in the bed at the conditions corresponding to
run 4 are shown in Figure 2.13 along the 10 cycles of operation.
Clean Technologies for the Purification of Wastewaters: Adsorptive Parametric Pumping

Adsorptive purification of phenol wastewaters: parametric pumping operation 31
The parametric pumping unit was operated in a semi-continuous way, the aim being to obtain
clean water as the bottom product and concentrated solution as the top product. Runs under
different experimental conditions were carried out to ascertain the predictions of the models.
The top and bottom concentrations of phenol are represented as a function of time in Figure
2.14 – 2.17. The experimental results were compared with the predicted by the equilibrium
and by the LDF models. The characteristics of the adsorbent and the bed, the operating
variables, the equilibrium isotherm and the thermal and mass transport parameters are
introduced in the program to solve the previous equations.
Figure 2.13 History of top and bottom temperatures measured during the recuperative parametric pumping
Clean Technologies for the Purification of Wastewaters: Adsorptive Parametric Pumping
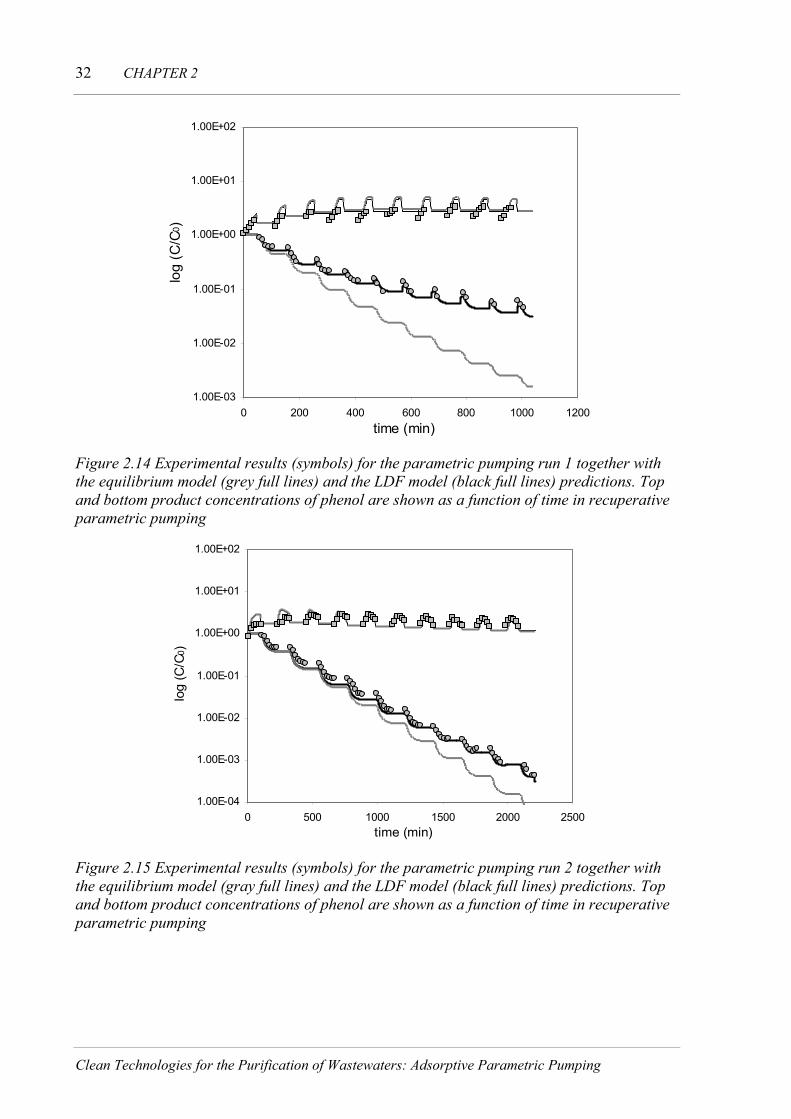
32 CHAPTER 2
1.00E-03
1.00E-02
1.00E-01
1.00E+00
1.00E+01
1.00E+02
0 200 400 600 800 1000 1200time (min)
log
(C/C
0 )
Figure 2.14 Experimental results (symbols) for the parametric pumping run 1 together with the equilibrium model (grey full lines) and the LDF model (black full lines) predictions. Top and bottom product concentrations of phenol are shown as a function of time in recuperative parametric pumping
1.00E-04
1.00E-03
1.00E-02
1.00E-01
1.00E+00
1.00E+01
1.00E+02
0 500 1000 1500 2000 2500time (min)
log
(C/C
0)
Figure 2.15 Experimental results (symbols) for the parametric pumping run 2 together with the equilibrium model (gray full lines) and the LDF model (black full lines) predictions. Top and bottom product concentrations of phenol are shown as a function of time in recuperative parametric pumping
Clean Technologies for the Purification of Wastewaters: Adsorptive Parametric Pumping

Adsorptive purification of phenol wastewaters: parametric pumping operation 33
1.00E-03
1.00E-02
1.00E-01
1.00E+00
1.00E+01
1.00E+02
0 200 400 600 800 1000 1200time (min)
log
(C/C
0 )
Figure 2.16 Experimental results (symbols) for the parametric pumping run 3 together with the equilibrium model (gray full lines) and the LDF model (black full lines) predictions. Top and bottom product concentrations of phenol is shown as a function of time in recuperative parametric pumping
1.00E-04
1.00E-03
1.00E-02
1.00E-01
1.00E+00
1.00E+01
1.00E+02
0 500 1000 1500 2000 2500time (min)
log
(C/C
0)
Figure 2.17 Experimental results (symbols) for the parametric pumping run 4 together with the equilibrium model (gray full lines) and the LDF model (black full lines) predictions. Top and bottom product concentrations of phenol are shown as a function of time in recuperative parametric pumping
The degree of purification of phenol varies depending on the operational conditions applied.
The highest degree of purification was obtained under conditions applied in the run 4. It may
be seen that the two models here used predict the first cycles of the operation for all runs.
Clean Technologies for the Purification of Wastewaters: Adsorptive Parametric Pumping

34 CHAPTER 2
Nevertheless, the equilibrium model with axial dispersion predicts unlimited separation so it
is not appropriate for the simulation when the number of cycles increases. The Linear Driving
Force model with axial dispersion, which considers also mass-transfer resistance inside the
particle, is more accurate in its predictions. For the phenol, the LDF model seems to describe
well the parametric pumping operation under the different conditions of the experimental
runs. As it may be observed, the simulation predictions of the LDF model are in good
agreement with experimental results, which indicates that the Linear Driving Force
approximation is appropriate for describing mass transfer in this cyclic process.
A high level of purification was obtained after 10 cycles of the run 4 and the concentration of
phenol in the bottom reservoir decreased to C <0.001 and in the top reservoir triplicate
that of the feeding.
C/
2.5
F
Conclusions
Adsorption of phenol onto polymeric resins (Sephabeads SP206 and Sephabeads SP207) and
activated carbon (Filtrasorb F400) was studied and focused on parametric pumping. Batch
tests were carried out in order to make a screening of adsorbents related to the effect of
temperature on the adsorptive behavior. On the basis of the separation parameterb ,
Sephabeads SP206 showed the higher separation potential in function of temperature for the
adsorption of phenol. Dynamic studies were also done for the adsorption of phenol onto the
polymeric resins and onto the activated carbon to ascertain the applicability of the LDF
(Linear Driving Force) model in fixed bed. The effect of temperature on the fixed bed
adsorption of phenol was also more noticeable for the polymeric resins, especially for
Sephabeads SP206, rather than for the Filtrasorb F400.
Pilot scale fixed bed using Sephabeads SP206 as adsorbent was studied before operating the
parametric pumping unit. Model equations including intraparticle mass transfer described by
the LDF model satisfactorily predicted the breakthrough curves at pilot scale (in an 800x90
mm bed) carried out both at 293 and 333 K.
Thermal parametric pumping in recuperative mode was performed in a pilot plant using
Sephabeads SP206 for phenol adsorption. By applying a T = 293 K and a T = 333 K a high
level of purification was obtained; the concentration of phenol in the bottom reservoir was
c h
Clean Technologies for the Purification of Wastewaters: Adsorptive Parametric Pumping

Adsorptive purification of phenol wastewaters: parametric pumping operation 35
going down and < 0.001 from the 10th cycle, the = 544 mg L-1. It was seen that the
purification of liquid streams containing phenol might be achieved by thermal parametric
pumping using Sephabeads SP206 as adsorbent. Runs under different conditions were carried
out to confirm the quality of their predictions. Operational conditions define the degree of
purification got by thermal parametric pumping. Two models, an equilibrium model with
axial dispersion and a Linear Driving Force model with axial dispersion were used for
simulating the operation of the parametric pumping unit.
FCC / FC
In all cases, the LDF model, which has more restrictions, seems to predict better the
performance of the system. Under appropriate conditions, at the 10th cycle it was possible to
decrease to 0.0003 (run 4) for phenol. A high degree of purification of phenolic
wastewaters may then be achieved by thermal parametric pumping using Sephabeads SP206
as adsorbent and avoiding the use of any chemical regenerant.
FCC /
2.6 Nomenclature
a deviation in the separation parameter
wall specific area (4/D) (m-1) wA
enthalpy of adsorption for the Langmuir isotherm (J mol-1) LHΔ
b separation parameter
concentration in the bulk fluid phase (g L-1) C
0C initial liquid-phase concentration of phenol in the batch and in the fixed bed operation
(mg L-1)
*C equilibrium liquid-phase concentration of phenol (mg L-1)
FC feed liquid-phase concentration of phenol in the operation of the parametric pumping
unit (mg L-1)
heat capacity of the fluid kJ/(kg.K) fCp
sCp heat capacity of the solid kJ/(kg.K)
average concentration of the fluid in the bottom reservoir (mg L-1) BPC
Clean Technologies for the Purification of Wastewaters: Adsorptive Parametric Pumping

36 CHAPTER 2
average concentration of the fluid in the top reservoir (mg L-1) TPC
diameter of the particle of the adsorbent (cm) pd
bed diameter (mm) D
axial dispersion (m2min-1) axD
the effective pore diffusivity (m2min-1) peD
molecular diffusivity (m2min-1) mD
hf humidity factor (g dry adsorbent/g adsorbent)
wall heat transfer coefficient kJ/(m2 s K) wh
aeK axial thermal conductivity (kJ/(m.s.K))
parameter in the Langmuir isotherm model (L mg-1) LK
equilibrium constant corresponding to the Langmuir model (L mg-1) ∞LK
Linear Driving Force (LDF) kinetic rate constant (min-1) LDFk
bed length (m) L
( )Tm capacity parameter in the separation parameter b
m average slope in the separation parameter b
molecular weight of solvent B (g mol-1) BM
n number of cycles
Pe Péclet number
hPe thermal Péclet number
constant in the Langmuir isotherm model (mg g-1) related to the adsorptive capacity Q
( ωπ /Q ) reservoir displacement volume (cm3)
flowrate of the fluid in the column during the cold half-cycle (mL min-1) cQ
flowrate of the fluid in the column during the cold half-cycle (mL min-1) hQ
Clean Technologies for the Purification of Wastewaters: Adsorptive Parametric Pumping

Adsorptive purification of phenol wastewaters: parametric pumping operation 37
flowrate of removing the product from the bottom reservoir (mL min-1) BPQ
flowrate of removing the product from the top reservoir (mL min-1) TPQ
phenol adsorbed per dry mass of adsorbent at a certain time (mg g –1) q
*q phenol adsorbed per dry mass of adsorbent in equilibrium with the phenol
concentration in solution at a certain time (mg g –1)
Re Reynolds number
radius of the particle of the adsorbent (m) pr
t time (min)
ct cold half-cycle time (min)
ht hot half-time (min)
absolute temperature (K) T
cT feeding temperature during the cold half-cycle (K)
hT feeding temperature during the hot half-cycle
ambT ambient temperature (K)
feed flow rate (cm3 min-1) U
superficial velocity (m min-1) 0u
interstitial velocity (m min-1) iu
V volume of the solution (L)
UV volume percolated during hot-half cycle (L)
molar volume of solute a at its normal boiling temperature (cm3 mol-1) AV
W dry weight (g) of the corresponding adsorbent
axial coordinate in the bed (cm) z
*Z normalized axial coordinate in the bed
Clean Technologies for the Purification of Wastewaters: Adsorptive Parametric Pumping

38 CHAPTER 2
Greek Letters
ε bed porosity
porosity of the adsorbent pε
φ dimensionless association factor of solvent B
Bφ fraction of that is withdrawn as bottom product ( ωπ /Q )
Tφ fraction of that is withdrawn as top product ( ωπ /Q )
η viscosity of the solution (Pa.s)
Bη viscosity of solvent B (cp)
LDF factor, which is equal to 3, 8 or 15 for slab, cylindrical or spherical geometry Ω
ρ density of the adsorbent (g L-1)
density of the fluid (g L-1) fρ
τ tortuosity of the adsorbent
ω frequency of temperature change
2.7 References
Azevedo, D. C. Separation/Reaction in simulated moving bed, Application to the production
of industrial Sugars. Ph. D. Thesis, University of Porto, Porto, 2001.
Costa, C. A. V. Dynamics of cyclic separation processes: adsorption and parametric
pumping. Ph.D. Thesis, University of Porto, Porto, 1984.
Costa, C. A. V., Rodrigues, A. E., Grevillot, G. and Tondeur, D., Purification of Phenolic
Wastewater by Parametric Pumping - Non-Mixed Dead Volume Equilibrium-Model. AIChE
Journal, 28 (1), 73-85 (1982).
Crook, E. H., McDonnell, R. P. and McNulty, J. T., Removal and Recovery of Phenols from
Industrial-Waste Effluents with Amberlite Xad Polymeric Adsorbents. Industrial &
Engineering Chemistry Product Research and Development, 14 (2), 113-118 (1975).
Clean Technologies for the Purification of Wastewaters: Adsorptive Parametric Pumping

Adsorptive purification of phenol wastewaters: parametric pumping operation 39
Davesac, R. R., Pinto, L. T., da Silva, F. A., Ferreira, L. M. and Rodrigues, A. E., A package
for thermal parametric pumping adsorptive processes. Chemical Engineering Journal, 76 (2),
115-125 (2000).
Deosarkar, S. P. and Pangarkar, V. G., Adsorptive separation and recovery of organics from
PHBA and SA plant effluents. Separation and Purification Technology, 38 (3), 241-254
(2004).
Díez, S., Leitão, A., Ferreira, L. M. and Rodrigues, A. E., Adsorption of phenylalanine onto
polymeric resins: equilibrium, kinetics and operation of a parametric pumping unit.
Separation and Purification Technology, 13, 25 - 35 (1998).
Ferreira, L. M. and Rodrigues, A. E., Adsorptive separation by thermal parametric pumping
.1. Modeling and simulation. Adsorption-Journal of the International Adsorption Society, 1
(3), 213-231 (1995a).
Ferreira, L. M. and Rodrigues, A. E., Adsorptive separation by thermal parametric pumping
.2. Experimental study of the purification of aqueous phenolic solutions at pilot scale.
Adsorption-Journal of the International Adsorption Society, 1 (3), 233-252 (1995b).
Ghasem, N. M., Combined mode of operation for thermal parametric pumping. Journal of
Chemical Technology and Biotechnology, 78 (6), 666-669 (2003).
Giles, C. H., Dsilva, A. P. and Easton, I. A., General Treatment and Classification of Solute
Adsorption-Isotherm .2. Experimental Interpretation. Journal of Colloid and Interface
Science, 47 (3), 766-778 (1974).
Glueckauf, E., Theory of Chromatography .10. Formulae for Diffusion into Spheres and Their
Application to Chromatography. Transactions of the Faraday Society, 51 (11), 1540-1551
(1955).
Guiochon, G., Shirazi, S. G. and Katti, A. M., Fundamentals of preparative and nonlinear
chromatography. Academic press, Boston, 1994.
Humphrey, J. L., Separation Processes - Playing a Critical Role. Chemical Engineering
Progress, 91 (10), 31-41 (1995).
Clean Technologies for the Purification of Wastewaters: Adsorptive Parametric Pumping

40 CHAPTER 2
Keller, G. E., Adsorption - Building Upon a Solid Foundation. Chemical Engineering
Progress, 91 (10), 56-67 (1995).
Knaebel, K. S., For Your Next Separation Consider Adsorption. Chemical Engineering, 102
(11), 92-& (1995).
Kujawski, W., Warszawski, A., Ratajczak, W., Porebski, T., Capala, W. and Ostrowska, I.,
Application of pervaporation and adsorption to the phenol removal from wastewater.
Separation and Purification Technology, 40 (2), 123-132 (2004).
Kunin, R., Use of Macroreticular Polymeric Adsorbents for Treatment of Waste Effluents.
Pure and Applied Chemistry, 46 (2-4), 205-211 (1976).
Lin, S. H., Pan, C. L. and Leu, H. G., Equilibrium and mass transfer characteristics of 2-
chlorophenol removal from aqueous solution by liquid membrane. Chemical Engineering
Journal, 87 (2), 163-169 (2002).
Morao, A., Lopes, A., de Amorim, M. T. P. and Goncalves, I. C., Degradation of mixtures of
phenols using boron doped diamond electrodes for wastewater treatment. Electrochimica
Acta, 49 (9-10), 1587-1595 (2004).
Pigford, R. L., Baker, B. and Blum, D. E., An Equilibrium Theory of Parametric Pump.
Industrial & Engineering Chemistry Fundamentals, 8 (1), 144-156 (1969).
Pigford, R. L., Baker, B. and Blun, D., An equilibrium Theory of the Parametric Pumping.
Industrial & Engineering Chemistry Fundamentals, 12, 406 - 412 (1973).
Ramalho, E. Adsorção multicomponente de fenóis. Ph.D. Thesis, University of Porto, Porto,
1993.
Reid, R., C., Prausnitz, J., M. and Poling, B., E., Properties of gas and liquids. McGraw Hill,
New York, 1987.
Simon, G., Grevillot, G., Hanak, L., Szanya, T. and Marton, G., Theoretical study of
adsorptive parametric pumping and temperature swing chromatography with flow reversal.
Chemical Engineering Journal, 70 (1), 71-80 (1998).
Clean Technologies for the Purification of Wastewaters: Adsorptive Parametric Pumping

Adsorptive purification of phenol wastewaters: parametric pumping operation 41
Clean Technologies for the Purification of Wastewaters: Adsorptive Parametric Pumping
Wilhelm, R. H., Rice, A. W. and Bendeliu.Ar, Parametric Pumping - a Dynamic Principle for
Separating Fluid Mixtures. Industrial & Engineering Chemistry Fundamentals, 5 (1), 141-155
(1966).
Wilhelm, R. H., Rice, A. W., Rolke, R. W. and Sweed, N. H., Parametric Pumping - a
Dynamic Principle for Separating Fluid Mixtures. Industrial & Engineering Chemistry
Fundamentals, 7 (3), 337-349 (1968).
Wilke, C. R. and Chang, P., Correlation of Diffusion Coefficients in Dilute Solutions. AIChE
Journal, 1 (2), 264-270 (1955).


3. Removal of salicylic acid from effluents using natural
and polymeric adsorbents1
3.1
Introduction
Salicylic acid is a compound produced from phenol (Hanesian and Perna, 2000), which was
once used as a painkiller being later replaced by aspirin since it causes severe stomach pain.
Salicylic acid has many applications, but the most popular one is the manufacture of
acetylsalicylic acid (aspirin), which is accompanied by the production of phenolic
wastewaters. Aspirin (acetylsalicylic acid-ASA) is the salicylate ester of acetic acid and when
ingested becomes in its active form, salicylic acid (Insel, 1990; Lutomski et al., 1995). More
than 10,000 tons of aspirin are consumed each year only in the United States.
Traditionally, drugs were rarely viewed as potential environmental pollutants and only
recently started to capture the attention of the scientific or popular press (Velagaleti, 1997;
1 Based on the papers:
Fixed bed adsorption of salicylic acid onto polymeric adsorbents and activated charcoal By M. Otero, M. Zabkova, C. A. Grande, A.E. Rodrigues, Industrial & Engineering Chemistry Research, 44, 927-936 (2005)
Salicylic acid adsorption onto Sephabeads SP206 in view of its purification by thermal parametric pumping. by M. Otero, M. Zabkova, A.E. Rodrigues, Adsorption 11, 887-892 (2005)

44 CHAPTER 3
Clean Technologies for the Purification of Wastewaters: Adsorptive Parametric Pumping
Halling-Sorenson et al., 1998; Montague, 1998; Raloff, 1998; Daughton and Ternes, 1999);
nevertheless, salicylic acid, which is a xenobiotic organic compound (Erikson et al., 2003)
may have several important metabolic effects that contribute to its toxicity (Kaplan et al.,
1954; Miyahara and Karlen, 1965; Schwart and Landry, 1965; Thurston et al., 1970; Done
and Temple, 1971; Hmicek et al., 1974; Walters et al., 1983; Bartels and Lund-Jacobsen,
1986). Also, if drugs are not captured from wastewaters during treatment they will remain in
sewage sludge, which is actually a major pathway by which drugs enter the environment
(Montague, 1998).
Adsorptive processes are an option for the purification of wastewaters containing
pharmaceuticals. An additional interesting aspect of sorption operations, especially when
dealing with valuable molecules, is their ability to concentrate solutes.
Traditional fixed bed adsorption systems suffer from two weaknesses: one is the need for a
chemical regenerant, which implies an additional waste disposal problem and the other is the
lack of efficiency, since only a fraction of the adsorbent is used in fixed bed operation.
As an alternative, thermal parametric pumping is a cyclic process based upon the fact that the
adsorption equilibrium isotherm of solutes changes with temperature. A cyclic change of
temperature in simultaneous with flow reversal will enable the separation process. In thermal
parametric pumping, the temperature change can be imposed through the bed jacket in direct
mode or through temperature change of the fluid stream in recuperative mode. If the feed
stream (wastewater) passes through a bed of adsorbent in upward flow at a “hot” temperature
and later in downward flow at a “cold” temperature, this cyclic process will produce a
concentrated solution at a top reservoir and a solute-free solution in the bottom one. This will
make possible the purification of salicylic acid industrial wastewaters without spending
chemicals for regeneration and therefore avoiding a new pollution problem.
The aim of this chapter was to study the fixed bed adsorptive performance of polymeric
adsorbents Sephabeads SP206 and Sephabeads SP207 and a well-known standard activated
charcoal Filtrasorb F400 for the uptake of salicylic acid from aqueous solution. The influence
of bed height and feed flow rate were considered. Special attention was given to the
temperature effect on the adsorption of salicylic acid, purification technologies such as
thermal parametric pumping being based on a marked differential adsorptive behavior in
function of temperature. In this chapter, three adsorbents were also compared according to

Removal of salicylic acid from effluents using natural and polymeric adsorbents 45
Clean Technologies for the Purification of Wastewaters: Adsorptive Parametric Pumping
their thermal separation potential. With the Sephabeads SP206 was subsequently used in the
parametric pumping experiments to evaluate the feasibility of this technology for salicylic
acid wastewater treatment.
3.2 Experimental section
3.2.1 Chemicals and adsorbents
Salicylic acid (C7H6O3) was purchased from Sigma-Aldrich (Spain). Two different polymeric
resins were used in this study: Sephabeads SP206 and SP207 (Mitsubishi Chemical
Corporation), purchased from Resindion (Italy) and activated carbon Filtrasorb F400 was
provided by Chemviron Carbon (Belgium). Physical characteristics data of all the adsorbents
as supplied by the manufacturers are listed in Table 2.1 (Chapter 2). The solutions of salicylic
acid were prepared with degassed distillated water.
3.2.2 Batch adsorption studies
Adsorption equilibrium experiments were carried out by contacting the corresponding amount
of adsorbent with 100 mL of salicylic acid solution in 250 mL Erlenmeyer flasks. Initial
concentration on the solution was around 100 mg L-1 in all experiments. Adsorption
equilibrium isotherms were measured by batch equilibration placing the volumetric flasks in a
shaking mixer at 150 rpm and using a thermostatic bath for temperature control.
Equilibrium experiments were carried out at 293, 310 and 333 K for each adsorbent-salicylic
acid system. After shaking for 48 h, the solution was separated from the adsorbent and the
final concentration of salicylic acid in solution was determined by measuring the absorbance
at 295 and 272 nm respectively by using the UV-visible spectrophotometer Jasco (model
7800, Japan).
3.2.3 Fixed bed adsorption and desorption of salicylic acid
Dynamic column experiments were carried out in a laboratory scale column with a peristaltic
pump Watson-Marlow used to pump the salicylic acid solution into the column. The
temperature of the feed solution was maintained by a thermostatic bath (Edmund Bühler).
Salicylic acid concentration at the column outlet was determined by measuring the absorbance
at a wavelength of 295 nm by using the UV-visible spectrophotometer Jasco (model 7800,
Japan).

46 CHAPTER 3
Clean Technologies for the Purification of Wastewaters: Adsorptive Parametric Pumping
Runs at three different temperatures were carried out for each of the adsorbents by feeding the
column with solutions at 293K, 310K and 333K. Different flow rates (10 and 15 mL min-1)
were also tested. With respect to the height of the bed, lengths of 15 and 30 cm were used for
the polymeric adsorbents and beds of 10 and 5 cm for the activated carbon. Bed diameter was
1 cm for all runs. The feed concentration was around 100 mg L-1 of salicylic acid in all cases.
The elution profiles of the salicylic acid saturated beds were also obtained. Distilled water
was pumped through the columns at the same flow rate and temperature as those used for the
saturation.
3.2.4 Operation of the pilot parametric pumping pilot plant
An automated pilot plant was used to carry out an experiment of water purification with a
salicylic acid containing feed. Figure 3.1 shows a schematic diagram of the unit used for
parametric pumping experiment. Prior to the parametric pumping experiment, breakthrough
curves of a solution with around 100 mg L-1 of salicylic acid were performed at 293 and 333K
to check effects of scale-up (axial dispersion, adsorbent packing and heat losses).
The parametric pumping experiment was performed with the following protocol: after
saturation of the bed at 293K, the salicylic acid solution was pumped through the bed of
Sephabeads SP206 in upward flow (hot half-cycle, at 333K) followed by downward flow
pumping of the solution (cold half-cycle, at 293K). This was repeated for ten cycles, each
cycle comprising one hot and one cold half-cycle. The top reservoir receives the concentrated
salicylic acid product when the solution is pumped through the column in upward flow and
the bottom reservoir receives the purified effluent when the solution is pumped in downward
flow. The system was operated in a recuperative mode, i.e., the temperature change was
carried out by the solution itself, which is heated or cooled by means of thermostatic baths).
Direct mode implies that the temperature change is imposed through the column wall, but the
recuperative mode is more appropriate for industrial purposes as this allows for larger
diameter columns (Ramalho et al., 1991). The combination of both modes has also been
studied (Ghasem, 2003) but under appropriate conditions one can expect to get a concentrated
solution at the top of the column and a free-solute effluent at the bottom, hence thermal
energy is used as regenerant.

Removal of salicylic acid from effluents using natural and polymeric adsorbents 47
Figure 3.1 Experimental setup of the parametric pumping pilot plant.
Legend: (1) Glass column G90-Amicon (2) Feed reservoir (3) Top reservoir (4) Bottom reservoir (5) Fraction collector Gilson (6) –(7) Heat exchangers (8)-(12) Two ways solenoid valves (13)-(14) Three ways solenoid valves (15)-(16) Peristaltic pumps Watson Marlow (17)-(19) Peristaltic pumps Gilson (T1)-(T2) Thermocouples (type K) (P1)-(P3) Pressure transducers Schwaevitz (type P510)
3.3 Mathematical model
3.3.1 Thermal separation potential
The amount of salicylic acid adsorbed onto adsorbent (mg g-1dry resin), was calculated by
a mass balance relationship:
*q
( )WVCCq *
0* −= 3.1
Clean Technologies for the Purification of Wastewaters: Adsorptive Parametric Pumping

48 CHAPTER 3
where (mg L-1) and (mg L-1) are the initial and equilibrium liquid-phase
concentrations, respectively, V the volume of the solution (
0C *C
L ) and W the dry weight (g) of
the corresponding polymeric resin.
The equilibrium was described by the Langmuir and multisite Nitta model (Nitta et al., 1984)
for homogeneous adsorbents using statistical thermodynamic arguments.
Langmuir isotherm model:
*
**
1),(
CKCKq
tzqL
Lm
+= 3.2
Nitta isotherm model: n
N CK )1(* θθ −= 3.3
mqq*=θ
Clean Technologies for the Purification of Wastewaters: Adsorptive Parametric Pumping
where is the fractional amount of the species in the adsorbed phase, is the
saturation capacity and is the number of neighboring sites occupied by the adsorbate.
The , are the constants corresponding to the Langmuir and to the Nitta model,
respectively indicated by the subindexes
mq
n
K NKL
and , which in a general form are given by: NL
⎟⎠⎞
⎜⎝⎛ Δ
−= ∞
RTHKK exp 3.4
Taking into account the equilibrium results, the effect of temperature can be assessed for each
of the systems salicylic acid - adsorbent considering the corresponding separation parameter.
The separation parameter, , introduced by Pigford (Pigford et al., 1973) which indicatives of
the separation potential.
b
mab+
=1
3.5
2)()( 21 TmTmm +
=2
)()( 21 TmTma −=where is the average slope and is the deviation
considering . The capacity parameter is defined as: ε
ρε )()1()(
TKfTm h−
=21 TT < , where
is the slope of the initial linear region of the isotherm, which has been represented )(TK

Removal of salicylic acid from effluents using natural and polymeric adsorbents 49
Clean Technologies for the Purification of Wastewaters: Adsorptive Parametric Pumping
either by or by LQKTK =)( NmKqTK =)( corresponding to each temperature, ε is the bed
porosity, ρ is the density of the adsorbent and is the humidity factor. hf
3.3.2 Mathematical model
The mathematical model used comprises the mass balance in the liquid phase, the nonlinear
adsorption equilibrium isotherm and a linear driving force (LDF) rate equation to describe the
diffusional mass transfer inside adsorbent particles; moreover to simulate the operation of the
parametric pumping unit a global energy balance was considered (Glueckauf and Coates,
1947; Shim et al., 2004). The balance to the reservoirs containing the product from the hot
and the cold cycles, top and bottom reservoirs are also considered. In the case of the
adsorption and desorption runs in fixed bed, neither the balance in the reservoirs neither the
energy balance were included.
Mass balance
The mass balance in a bed volume element is:
ttzq
ft
tzCz
tzCuz
tzCD hiax ∂
∂−+
∂∂
=∂
∂−
∂∂ ),(1),(),(),(
2
2ρ
εε 3.6
εwhere is the axial dispersion , is the interstitial velocity, axD iu is the bed porosity, is
the axial position, t is the time variable, C is the concentration in the bulk fluid phase,
z
q is
the average adsorbed phase concentration in the particle, ρ is the density of the adsorbent
and its humidity factor. The axial dispersion, , was obtained from the following
expression (Guiochon et al., 1994a):
hf axD
ηερ psi du .
Re =)Re011.02.0( 48.00 +=ax
pdD
uwhere .
Intraparticle mass transfer
The mass-transfer rate inside particles can be represented by the Linear Driving Force model:
[ ),(),(),( * tzqtzqk
ttzq
s −=∂
∂ ] 3.7
where ks is the effective mass transfer coefficient, q*(C) is the adsorbed phase concentration in
equilibrium with the bulk concentration.

50 CHAPTER 3
The overall effective linear driving force rate constants for the experiments were estimated
from the following correlation (Farooq and Ruthven, 1990; Silva and Rodrigues, 1997):
LDFh
f
ph
pe
ph
f
p
s kCqf
kr
Cqf
Dr
Cqf
kr
k1
31531 **2*
+∂∂
=∂∂
+∂∂
= ρρρ 3.8
which considers macropore and film resistances to the mass transfer and where is the
effective pore diffusivity, is the radius of the particle of the adsorbent, 15 is the factor
that is equal to 15 for spherical particles (Azevedo, 2001), is the global mass transfer
coefficient, kLDF is the linear driving force kinetic rate constant, k is the external film mass
transfer coefficient,
peD
pr Ω
ks
f
Clean Technologies for the Purification of Wastewaters: Adsorptive Parametric Pumping
ρ and are the density and the humidity factor of the adsorbent and
the derivative (
fh
dCdq*
) represents slope of the equilibrium data.
The external film mass transfer coefficient was correlated by the Ranz-Marshall equation
(Yang, 1987):
fk
2/13/12/1
03/1
Re6.00.2.
6.00.2 Scdu
DDdk
Sh ps
msm
pf +=⎟⎟⎠
⎞⎜⎜⎝
⎛⎟⎟⎠
⎞⎜⎜⎝
⎛+==
ηρ
ρη 3.9
where Sh, Sc and Re stand for the Sherwood, Schmidt and Reynolds numbers, respectively.
The values of the molecular diffusivity, , of salicylic acid in water was approximated by
the Wilke – Chang equation (Wilke and Chang, 1955):
mD
6.08104.7
mm V
MTD
ηφ−×= where
is the absolute temperature,
)(KT
η its viscosity (cP). The molar volume of the adsorbate at its
normal boiling temperature (cm3 mol-1) was estimated by Le Bas method (Reid et al.,
1987).
mV
Energy balance
A global energy balance for the column was used:
[ ]
ttzq
HTTAhz
tzTuCpz
tzTK
ttzTCpCp
ambwwffae
sff
∂∂
Δ−+−−∂
∂±
∂∂
=
=∂
∂−+
),()()(),(),(
),()1(
02
2ρ
ερερ 3.10

Removal of salicylic acid from effluents using natural and polymeric adsorbents 51
where is the axial thermal conductivity, is the heat transfer coefficient of the wall of
the column and is the wall specific area,
aeK wh
wA and fρ ρ are the densities of the fluid and
adsorbent, and and are the heat capacities of the fluid and of the adsorbent,
respectively. Considering at the bottom of the column and
pfC psC
0=z Lz = at the top, in Eq.3.10
the term z
tzTuCp ff ∂∂
±),(
0ρ has the “+” sign for the cold half-cycle downwards, and the
“-“sign for the hot half-cycle upwards.
Balance of the reservoirs
Hot half-cycle
1−⟩⟨=⟩⟨ nBPBP CC 3.11
)1()(
)1(),()1(
T
TBF
T
nBTP C
tLCC
φφφ
φφ
++
++
⟩⟨−=⟩⟨ 3.12
Cold half-cycle
nBP tCC ⟩⟨=⟩⟨ ),0( 3.13
Clean Technologies for the Purification of Wastewaters: Adsorptive Parametric Pumping
where and ⟩⟨ BPC ⟩⟨ TPC are the average concentration of salicylic acid in the fluid in the
bottom and in the top reservoirs, respectively, Bφ and Tφ are the fraction of the total reservoir
displacement volume, )/(π ωQ , that are withdrawn as product from the bottom and the top
reservoirs, respectively, and refers to the number of cycles. n
Boundary and Initial conditions
In the case of the fixed bed adsorption and desorption, the boundary conditions for the mass
balance (Eq 3.6) are the Danckwerts boundary conditions:
)),0((),(00 CtCu
ztzCD izax −=
∂∂
=z = 0 3.14
0),(=
∂∂
=LzztzCz = L 3.15
The initial conditions for the adsorption step are for a clean bed:
3.16 0)0,( =zC

52 CHAPTER 3
3.17 0)0,( =zq
For the simulation of the desorption step, initial conditions are:
eCzC =)0,( 3.18
)()0,( *eCqzq = 3.19
The boundary conditions for the equations included in the parametric pumping model are:
Hot half-cycle
0=z ; 3.20 nBPCtC ⟩⟨=),0( hTT =
0),(=
∂∂
ztzC 0),(
=∂
∂z
tzT ; 3.21 Lz =
Cold half-cycle
0),(=
∂∂
ztzC 0),(
=∂
∂z
tzT0=z ; 3.22
; 3.23 nTPCtLC ⟩⟨=),( cTT =Lz =
The initial conditions were:
FCzC =)0,( ; 3.24 0)0,( TzT =
The partial differential equations corresponding to the fixed bed adsorption and desorption
were solved using the software package gPROMS® for general PROcess Modelling System.
The orthogonal collocation method on finite elements (OCFE) was used with 50 finite
elements and two interior collocation points in each element of the adsorption bed. The
parametric pumping model was solved with a package (Davesac et al., 2000) previously
developed in Visual Basic.
3.4 Results and discussion
3.4.1 Thermal separation potential
Adsorption isotherms
The experimental adsorbed concentrations as a function of liquid phase concentration
corresponding to the salicylic acid adsorption onto each of the adsorbents at each of the
Clean Technologies for the Purification of Wastewaters: Adsorptive Parametric Pumping

Removal of salicylic acid from effluents using natural and polymeric adsorbents 53
temperatures considered are shown in Figure 3.2. The obtained fittings considering Langmuir
and Nitta isotherm models are reported in Table 3.1. As it can be seen from Figure 3.2, the
Nitta isotherm model describes better the equilibrium of salicylic acid onto the adsorbents
than Langmuir isotherm model.
Table 3.1 Equilibrium determined for de adsorption of salicylic acid onto Filtrasorb F400 and Sephabeads SP206 and SP207
Sephabeads SP207
Sephabeads SP206
Clean Technologies for the Purification of Wastewaters: Adsorptive Parametric Pumping
model parameters Filtrasorb F400
(mg g-1) mq 351.0 81.6 45.2
1.85x10⁻⁵ 2.03x10⁻⁷ 1.27x10⁻⁸ (L mg-1) ∞LKLangmuir
(kJ mol-1) -19.69 -27.46 -37.19 LHΔ
(mg g-1) mq 432.8 91.5 66.2
∞NK (L mg-1) 1.51x10⁻⁵ 8.48x10⁻⁸ 1.41x10⁻⁸
n 1.6 1.7 1.7 Nitta
(kJ mol-1) LHΔ -20.29 -30.58 -36.70
The values of the separation parameter (Eq. 3.5) allow easy comparison of the feasibility of
thermal parametric pumping as purification process for different solute-adsorbent systems. As
it may be observed in Table 3.2 the largest b values are those corresponding to the system
salicylic acid-Sephabeads SP206.

54 CHAPTER 3
Figure 3.2 Experimental adsorption equilibrium, versus , for the adsorption of salicylic acid onto Filtrasorb F400 (A), Sephabeads SP207 (B) at different temperatures. Fittings to Langmuir (full lines) and Nitta (dotted lines) models are shown together with the experimental data points
*q *C
Clean Technologies for the Purification of Wastewaters: Adsorptive Parametric Pumping

Removal of salicylic acid from effluents using natural and polymeric adsorbents 55
Figure 3.2 (continued) Experimental adsorption equilibrium, versus , for the adsorption of salicylic acid onto Sephabeads 206 (C) at different temperatures. Fittings to Langmuir (full lines) and Nitta (dotted lines) models are shown together with the experimental data points
*q *C
Table 3.2 Separation parameter, b , corresponding to the different systems adsorbent-salicylic acid here considered
Temperature range 293K-310K 310K-333K 293K-333K
model Langmuir Nitta Langmuir Nitta Langmuir Nitta
Filtrasorb F400 0.22 0.22 0.26 0.27 0.45 0.46
Sephabeads SP207 0.30 0.33 0.35 0.39 0.59 0.64
Sephabeads SP206 0.40 0.39 0.46 0.46 0.72 0.72
3.4.2 Laboratory scale fixed bed adsorption and desorption of salicylic acid
Experimental results corresponding to fixed bed adsorption of salicylic acid onto the
adsorbents here considered are shown in Figure 3.3 Figure 3.5- , desorption are shown in
Figure 3.6. Full lines correspond to simulated results with the model including the mass
balance equation, the Nitta equilibrium isotherm and the intraparticle mass transfer
considering the global coefficient. No fitting parameters were applied for prediction of the
Clean Technologies for the Purification of Wastewaters: Adsorptive Parametric Pumping

56 CHAPTER 3
experimental data. The overall effective linear driving force rate constant was calculated by
including the estimated external film mass transfer and pore diffusion resistance. Model
parameters are reported in Table 3.3 for all the systems considered together with the
calculated and the resulting values of . Schmidt numbers, at temperatures 293, 310,
333 K for salicylic acid were 1377, 817 and 561.
Clean Technologies for the Purification of Wastewaters: Adsorptive Parametric Pumping
fk k Scs
Effect of the temperature
The effect of temperature on the fixed bed performance of the adsorbents considered with
respect of salicylic acid may be seen in Figure 3.3, which shows runs at 293, 310 and 333K.
In all cases, the adsorption capacity of the bed decreases with increasing temperature, i.e., the
adsorption is favored by lowering temperature. As it was for the batch tests, this is especially
evident for the polymeric resins here used, which adsorption capacity of salicylic acid is
strongly affected by temperature.
0
20
40
60
80
100
0 500 1000 1500 2000
time(min)
conc
entra
tion
(mg
L-1)
333K
310K
293K
A
Figure 3.3 Effect of temperature on the fixed bed adsorption of salicylic acid onto Filtrasorb F400 (A). The bed length was 10 cm for (A) and solution was fed at three different temperatures (293K, 310K and 333K) at a flow-rate of 10 mL min-1. Symbols are the experimental data and full lines are the simulated results obtained by the LDF model

Removal of salicylic acid from effluents using natural and polymeric adsorbents 57
0
20
40
60
80
100
0 100 200 300 400 500 600 700 800time(min)
conc
entra
tion
(mg
L-1)
293K
310K
333K
B
0
20
40
60
80
100
0 200 400 600 800time(min)
conc
entra
tion
(mg
L-1)
333K
310K
293K
C
Figure 3.3 (continued) Effect of temperature on the fixed bed adsorption of salicylic acid onto Sephabeads SP207 (B) and Sephabeads SP206 (C). The bed length was 30 cm for (B) and (C) and solution was fed at three different temperatures (293K, 310K and 333K) at a flow-rate of 10 mL min-1. Symbols are the experimental data and full lines are the simulated results obtained by the LDF model
In the case of the activated carbon, the effect of temperature on the adsorption of salicylic
acid is not so marked, even though its adsorptive capacity is much higher that the ones of
Sephabeads SP206 and SP207. From these results, the polymeric resins, especially
Sephabeads SP206, would be more appropriate for carrying out a thermal parametric pumping
process for the purification of salicylic acid, as it was also indicated by the separation
parameterb .
Clean Technologies for the Purification of Wastewaters: Adsorptive Parametric Pumping

58 CHAPTER 3
Table 3.3 Parameters used for estimating Dax and the intraparticle mass transfer coefficients and for the different fixed bed systems considered skfk
ReFlow-rate fkaxD skmD T L
Shadsorbent (mL min-1) (K) (cm) (cm2 min-1) (min-1) (cm2min-1) (cm min-1)
Clean Technologies for the Purification of Wastewaters: Adsorptive Parametric Pumping
Effect of the flow-rate
The effect of flow-rate on the adsorption of salicylic acid may be seen in Figure 3.4 for the
Filtrasorb F400, Sephabeads SP207 and Sephabeads SP206, as A, B and C, respectively. The
figures show the breakthrough curves corresponding to the pumping of solution at two
293 1.45 4.18 10.0 4.46x10⁻⁴ 0.064 0.005
310 2.31 4.12 10.5 4.72x10⁻⁴ 0.071 0.013 10 10
333 3.13 4.07 10.8 5.07x10⁻⁴ 0.078 0.031
293 2.18 6.19 11.9 4.46x10⁻⁴ 0.075 0.005
310 3.47 6.08 12.4 4.72x10⁻⁴ 0.084 0.013 Filtrasorb
10 15
333 4.70 5.99 12.7 5.07x10⁻⁴ 0.092 0.032 F400
293 1.45 4.18 10.0 4.46x10⁻⁴ 0.064 0.005
310 2.31 4.12 10.5 4.72x10⁻⁴ 0.071 0.013 5 10
333 3.13 4.07 10.7 5.07x10⁻⁴ 0.078 0.031
293 0.83 2.42 8.1 4.46x10⁻⁴ 0.090 0.014
310 1.32 2.40 8.4 4.72x10⁻⁴ 0.100 0.043 30 10
333 1.79 2.37 8.6 5.07x10⁻⁴ 0.109 0.075
293 1.24 3.60 9.4 4.46x10⁻⁴ 0.105 0.015
310 1.98 3.55 9.9 4.72x10⁻⁴ 0.117 0.045
333
30 15
2.68 3.51 10.1 5.07x10⁻⁴ 0.128 0.078
Sephabeads SP207
293 0.83 2.42 8.1 4.46x10⁻⁴ 0.090 0.014
310 1.32 2.40 8.4 4.72x10⁻⁴ 0.100 0.043 15 10
333 1.79 2.37 8.6 5.07x10⁻⁴ 0.109 0.075
293 0.83 2.42 8.1 4.46x10⁻⁴ 0.090 0.020
310 1.32 2.40 8.4 4.72x10⁻⁴ 0.100 0.035 30 10
333 1.79 2.37 8.6 5.07x10⁻⁴ 0.109 0.072
293 1.24 3.60 9.4 4.46x10⁻⁴ 0.105 0.021
310 1.98 3.55 9.9 4.72x10⁻⁴ 0.117 0.037
333
30 15
2.68 3.51 10.1 5.07x10⁻⁴ 0.128 0.075
Sephabeads SP206
293 0.83 2.42 8.1 4.46x10⁻⁴ 0.090 0.020
310 1.32 2.40 8.4 4.72x10⁻⁴ 0.100 0.035 15 10
333 1.79 2.37 8.6 5.07x10⁻⁴ 0.109 0.072

Removal of salicylic acid from effluents using natural and polymeric adsorbents 59
different flow-rates, 10 and 15 mL min-1. Lowering the flow-rate leads to longer breakthrough
times but, as it may be seen in Figure 3.4, for both the flow-rates tested a constant-pattern
along the column has been reached.
0
20
40
60
80
100
0 500 1000 1500
time(min)
conc
entra
tion
(mg
L-1)
310Kq10
310Kq15
A
0
20
40
60
80
100
0 100 200 300 400 500 600 700time(min)
conc
entra
tion
(mg
L-1)
310Kq10
310Kq15
B
Figure 3.4 Effect of the flow-rate on the fixed bed adsorption of salicylic acid onto Filtrasorb F400 (A), Sephabeads SP207 (B). The bed length was 10 cm for (A) and 30 cm for (B) and solution was feed at 310 K and at two different flow-rates (q10 and q15 for 10 and 15 mL min-1 respectively). Symbols are the experimental data and full lines are the simulated results obtained by the LDF model
Clean Technologies for the Purification of Wastewaters: Adsorptive Parametric Pumping
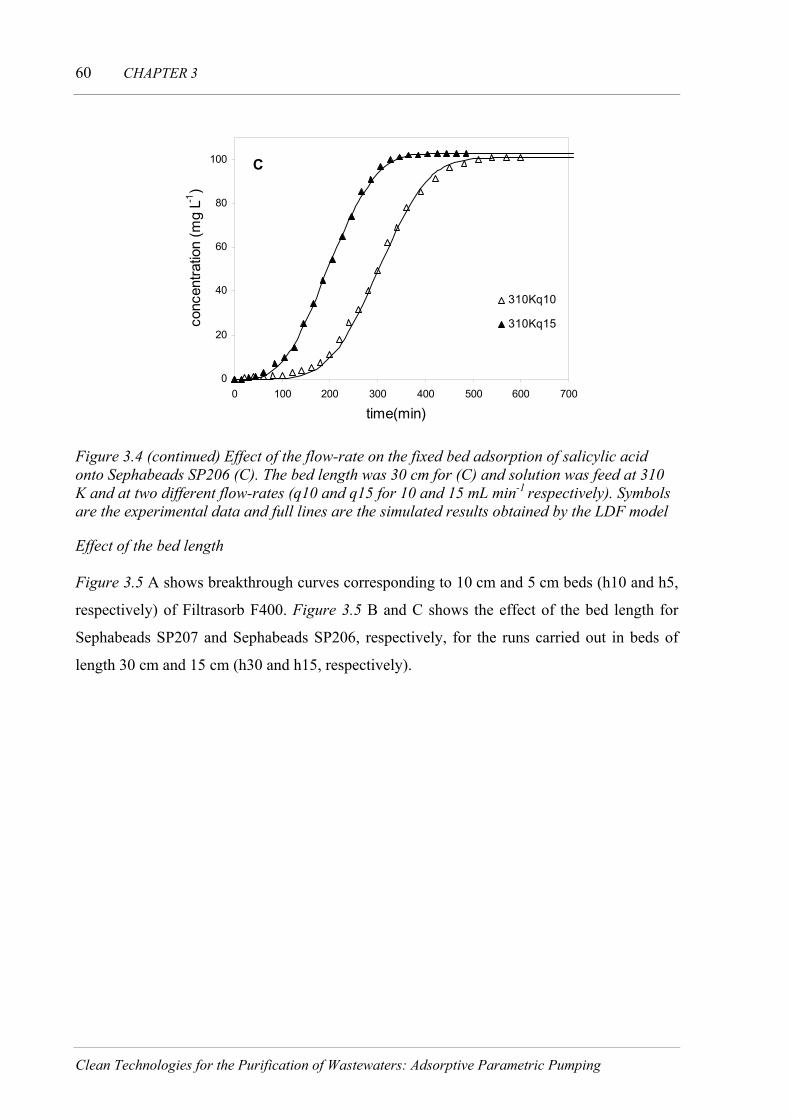
60 CHAPTER 3
0
20
40
60
80
100
0 100 200 300 400 500 600 700
time(min)
conc
entra
tion
(mg
L-1)
310Kq10
310Kq15
C
Figure 3.4 (continued) Effect of the flow-rate on the fixed bed adsorption of salicylic acid onto Sephabeads SP206 (C). The bed length was 30 cm for (C) and solution was feed at 310 K and at two different flow-rates (q10 and q15 for 10 and 15 mL min-1 respectively). Symbols are the experimental data and full lines are the simulated results obtained by the LDF model
Effect of the bed length
Figure 3.5 A shows breakthrough curves corresponding to 10 cm and 5 cm beds (h10 and h5,
respectively) of Filtrasorb F400. Figure 3.5 B and C shows the effect of the bed length for
Sephabeads SP207 and Sephabeads SP206, respectively, for the runs carried out in beds of
length 30 cm and 15 cm (h30 and h15, respectively).
Clean Technologies for the Purification of Wastewaters: Adsorptive Parametric Pumping

Removal of salicylic acid from effluents using natural and polymeric adsorbents 61
0
20
40
60
80
100
0 200 400 600 800 1000 1200
time(min)
conc
entra
tion
(mg
L-1)
333Kh10
333Kh5
A
0
20
40
60
80
100
0 100 200 300 400 500time(min)
conc
entra
tion
(mg
L-1)
333Kh30
333Kh15
B
Figure 3.5 Effect of the height of the bed on the fixed bed adsorption of salicylic acid onto Filtrasorb F400 (A), Sephabeads SP207 (B). The bed length was 5 and 10 cm (h5 and h10 respectively) and 15cm and 30cm (h15 and h30 respectively) for Filtrasorb F400 and Sephabeads SP206. The solution was fed at 333K and at a flow-rate of 10 mLmin-1. Symbols are the experimental data and full lines are the simulated results obtained by the LDF model
As it may be seen, having more adsorbent, the longer the bed, the longer the column takes to
be saturated. Again, a constant pattern along the bed occurs for the different bed lengths here
tested and no entrance effects (more dispersive fronts) have been observed because of using
of a shorter bed.
Clean Technologies for the Purification of Wastewaters: Adsorptive Parametric Pumping

62 CHAPTER 3
0
20
40
60
80
100
0 100 200 300 400 500time(min)
conc
entra
tion
(mg
L-1)
333Kh30
333Kh15
C
Figure 3.5 (continued) Effect of the height of the bed on the fixed bed adsorption of salicylic acid onto Sephabeads SP206 (C). The bed length was 15cm and 30cm (h15 and h30 respectively) for Sephabeads SP206 and SP207. The solution was fed at 333K and at a flow-rate of 10 mLmin-1. Symbols are the experimental data and full lines are the simulated results obtained by the LDF model
Fixed bed desorption of salicylic acid
Desorption was carried out after complete saturation of the columns at the same temperature
and flow-rate, except that water was pumped instead of salicylic acid solution. The Figure 3.6
A, B, C shows saturation-desorption cycles carried out in beds of Filtrasorb F400, Sephabeads
SP207 and Sephabeads SP206, respectively. The comparison of the area corresponding to
adsorption and desorption is within 5% difference, indicating that the operation is completely
reversible. Because of the non-linearity of the adsorption equilibrium, the shape of the
desorption curves is different from the adsorption ones (dispersive front). Note that kinetic
effects are very noticeable in the case of desorption from the Filtrasorb F400 and the lower
the temperature, the lower the mass transfer. The saturation-desorption cycles are much
longer for the beds of Filtrasorb F400 than for Sephabeads SP207 and SP206.
Clean Technologies for the Purification of Wastewaters: Adsorptive Parametric Pumping

Removal of salicylic acid from effluents using natural and polymeric adsorbents 63
Figure 3.6 Salicylic acid saturation-desorption cycles in beds of Filtrasorb F400 (A), Sephabeads SP207 (B) and Sephabeads SP206 (C). The bed length was of 5 cm for Filtrasorb F400 and 15 cm for Sephabeads SP207 and Sephabeads SP206. Both solution (saturation step) and water (desorption step) were fed at a flow-rate of 10 mL min-1 and cycles at 293, 310 and 333K were carried out. Symbols are the experimental data and full lines are the simulated results obtained by the LDF model
Generally in all fixed bed experiments could be noticed slight differences between
experimental and predicted capacities and are less than 6%. These differences could be due to
experimental errors, either in adsorption equilibrium measurements or in flow rate
measurements in the fixed-bed experiments. Some discrepancies were found between the
predicted breakthrough and the experimental runs that may result from overestimation of the
Clean Technologies for the Purification of Wastewaters: Adsorptive Parametric Pumping

64 CHAPTER 3
external film mass transfer coefficient (Eq. 3.9). These differences are more pronounced for
the polymeric resins than for the activated charcoal.
3.4.3 Parametric pumping operation
Pilot scale fixed bed adsorption of salicylic acid
With the aid of fixed bed experiments it was determined that the adsorbent with the higher
separation parameter was the polymeric resin Sephabeads 206. For this reason, the pilot plant
existing in our laboratory was loaded with it for parametric pumping experiments. Before the
cyclic experiment it is desirable to carry out breakthrough experiments to check the fixed bed
behavior in the real system to be used in parametric pumping runs. Fixed bed adsorption
breakthrough curves of salicylic acid were carried out at 293K and at 333K, lower and upper
temperatures where adsorption equilibrium data and kinetics are available. The corresponding
experimental and simulated breakthrough curves are shown in Figure 3.7.
0
20
40
60
80
100
0 200 400 600 800 1000 1200 1400 1600 1800 2000
time (minutes)
conc
(mg/
L)
293K
333K
Figure 3.7 Breakthrough curves corresponding to the fixed bed adsorption of salicylic acid onto Sephabeads SP206 at pilot scale. Symbols are the experimental data and full lines are the simulated results obtained by the LDF model.
Full lines correspond to simulated results with the model including the mass balance equation,
the Langmuir equilibrium isotherm and the intraparticle mass transfer equation considering
the global coefficient. As for the laboratory scale fixed-bed experiments, some discrepancies
between the model and the experimental data occur in the initial region of the pilot scale
curves. As explained before, these discrepancies may result from overestimation of the
external film mass transfer coefficient. Stoichiometric time at 293 K is nearly twice that at
Clean Technologies for the Purification of Wastewaters: Adsorptive Parametric Pumping

Removal of salicylic acid from effluents using natural and polymeric adsorbents 65
333K, indicating the maximum amount of salicylic acid that can be desorbed in the hot half-
cycle of the parametric pumping system.
Parametric pumping experiments
As mentioned before, the adsorbent Sephabeads SP206 was the one chosen for parametric
pumping experiments due to the higher separation parameter b (Table 3.2). The characteristics
of the resin, bed and the model parameters used for the simulations are reported in Table 3.4.
Table 3.4 Characteristics and parameters used for the simulations of the operated parametric pumping system
Bed characteristics Resin properties Thermal parameters Transport parameters
Clean Technologies for the Purification of Wastewaters: Adsorptive Parametric Pumping
ρ =1190 g L-1 hPe = 100 PeL = 0.85 m = 120
293mD = 4.46x10⁻⁸
m2min-1 hf = 0.5 = 1.205 kξd = 0.09 m
= 2 x 10⁻⁴ m = 0.852kJ/(m2 min K) pr 333
mD = 5.07x10⁻⁸ m2min-1 whε = 0.4
= 1.36x10⁻⁸ m2min-1 293peD εp = 0.607
= 1.55x10⁻⁸ m2min-1 333peDτ = 2
The parametric pumping unit was operated in a semi-continuous way, the main aim was to
obtain clean water as the bottom product, and salicylic acid concentrated solution as the top
product. Runs under different experimental conditions were carried out to ascertain the effect
of the cycle time, the flow rate and the ratio between bottom and top product volumes. The
operating variables used in the parametric pumping experiments (temperatures, flow rates and
step times) are listed in Table 3.5. The model used to predict the operation of the parametric
pumping unit comprises the mass and energy balances, the Langmuir isotherm and the linear
driving force (LDF) equations shown.
Effect of the cycle time
The effect of the cycle time on the system salicylic acid-Sephabeads SP206 has been studied
by comparing runs 1, 2 and 3. The volume percolated in upward flow (hot half cycle) and
downward flow was changed while the following conditions were set:

66 CHAPTER 3
Production (VB + VT) = 8 L
Ratio (VB / VT) = 0.6
Flow-rate (Qc and Qh) = 200 mL min-1
Table 3.5 Experimental conditions used for the different parametric pumping runs carried out in recuperative mode.
hQ cQ TPQ BPQ ht ct FC
)/( ωπQambT
Tφ Bφ Run (K) (L) (mL
min-1) (mL
min-1) (mL
min-1) (mL
min-1) (mg L-1) (min) (min)
1 101 85.0 100.0 200 200 0.25 0.15 20 62.50 31.58
2 108 35.0 50.0 200 200 0.50 0.30 10 166.67 66.67
Clean Technologies for the Purification of Wastewaters: Adsorptive Parametric Pumping
3 106 110.0 125.0 200 200 0.2 0.12 25 47.62 25.00 298
4 109 56.6 66.6 300 300 0.25 0.15 20 96.77 48.65
5 114 106.25 125.0 160 160 0.25 0.15 20 49.38 25.00
6 109 75.0 100.0 200 200 0.15 0.25 20 42.86 52.63 300
7 104 95.0 100.0 200 200 0.35 0.05 20 77.78 10.53
The histories of top and bottom concentrations for the parametric pumping experiments show
that during the hot half-cycle, the salicylic acid in the bed is desorbed and so the top
concentration increases; then, during the cold-half cycle, it is possible to adsorb more salicylic
acid so a less concentrated stream is collected as bottom product. Operating conditions were
studied to ascertain the system response (Table 3.5). The effect of the cycle time is shown in
Figure 3.8. A comparison between run 1, run 2 and run 3 shows that not only bottom
purification but also top concentration are favored by longer cycle times. A long cycle time
allows improving of interphase mass transfer and the operation to be closer to the equilibrium
conditions so better results are attained.
Effect of the flow-rate
This effect was ascertained by comparing the runs 1, 4 and 5, which were carried out at
different fluid flow-rates, both upward and downward the column. The following conditions
were fixed: TBφ + φ = 0.4; TBφ φ = 0.6.

Removal of salicylic acid from effluents using natural and polymeric adsorbents 67
RUN 1
1.0E-05
1.0E-04
1.0E-03
1.0E-02
1.0E-01
1.0E+00
1.0E+01
1.0E+02
0 500 1000 1500 2000 2500time (minutes)
log
(C/C
0)
RUN 2
1.0E-03
1.0E-02
1.0E-01
1.0E+00
1.0E+01
1.0E+02
0 200 400 600 800 1000time (minutes)
log
(C/C
0)
Figure 3.8 Experimental results and model predictions (grey line) Model I, (black line) Model II for the system salicylic acid/water/ SP206. Top and bottom product concentrations as a function of time in recuperative parametric pumping. Effect of the cycle time (RUN 2: 85 min; RUN 1: 185 min; RUN 3: 235 min)
Clean Technologies for the Purification of Wastewaters: Adsorptive Parametric Pumping

68 CHAPTER 3
RUN 3
1.0E-05
1.0E-04
1.0E-03
1.0E-02
1.0E-01
1.0E+00
1.0E+01
1.0E+02
0 500 1000 1500 2000 2500time (minutes)
log
(C/C
0)
Figure 3.8 (continue) Experimental results and model predictions (grey line) Model I, (black line) Model II for the system salicylic acid/water/ SP206. Top and bottom product concentrations as a function of time in recuperative parametric pumping. Effect of the cycle time (RUN 2: 85 min; RUN 1: 185 min; RUN 3: 235 min)
The effect of the flow-rate and the ratio between bottom and top product volumes is shown in
Figure 3.9.
RUN 5
1.0E-05
1.0E-04
1.0E-03
1.0E-02
1.0E-01
1.0E+00
1.0E+01
1.0E+02
0 500 1000 1500 2000 2500time (minutes)
log
(C/C
0)
Figure 3.9 Experimental results and model predictions (grey line) Model I, (black line) Model II for the system salicylic acid/water/ SP206. Top and bottom product concentrations as a function of time in recuperative parametric pumping.Effect of the flow-rate (RUN 5: 160 mL min-1; RUN 1: 200 mL min-1; RUN 4: 300 mL min-1)
Clean Technologies for the Purification of Wastewaters: Adsorptive Parametric Pumping

Removal of salicylic acid from effluents using natural and polymeric adsorbents 69
RUN 1
1.0E-05
1.0E-04
1.0E-03
1.0E-02
1.0E-01
1.0E+00
1.0E+01
1.0E+02
0 500 1000 1500 2000 2500time (minutes)
log
(C/C
0)
RUN 4
1.0E-05
1.0E-04
1.0E-03
1.0E-02
1.0E-01
1.0E+00
1.0E+01
1.0E+02
0 200 400 600 800 1000 1200 1400time (minutes)
log
(C/C
0)
Figure 3.9 (continue) Experimental results and model predictions (grey line) Model I, (black line) Model II for the system salicylic acid/water/ SP206. Top and bottom product concentrations as a function of time in recuperative parametric pumping. Effect of the flow-rate (RUN 5: 160 mL min-1; RUN 1: 200 mL min-1; RUN 4: 300 mL min-1)
Lower flow-rates imply longer cycle times, which allow for better separation ratios and a
higher purification level. The flow-rate does not influence the ratio of velocities of thermal
and concentration waves. In this system, the thermal wave is much faster than the
concentration wave. However, a minimum flow-rate is required to guarantee thermal
Clean Technologies for the Purification of Wastewaters: Adsorptive Parametric Pumping

70 CHAPTER 3
breakthrough up to the level of the feed temperature in each half-cycle. According to the
results presented in Figure 3.9, operating conditions of run 5, for which the flow-rate is lower
than for runs 4 and 1, give better separation results. The flow-rate (run 5) is able to maintain a
difference of temperature enough to cause separation and the effect of longer contact between
the phases is favorable.
Effect of the ratio between fractions of volume reservoir obtained as bottom and top product
Clean Technologies for the Purification of Wastewaters: Adsorptive Parametric Pumping
TBφ φ
In order to find out the influence of the TB φφ , runs 1, 6 and 7 were compared. This ratio was
changed for each of these three runs while setting the following: φΒ + φΤ = 0.4; average time
of cycle = 185 min
RUN 6
1.0E-05
1.0E-04
1.0E-03
1.0E-02
1.0E-01
1.0E+00
1.0E+01
1.0E+02
0 500 1000 1500 2000time (minutes)
log
(C/C
0)
Figure 3.10 Experimental results and model predictions (grey line) Model I, (black line) Model II for the system salicylic acid/water/ SP206. Top and bottom product concentrations as a function of time in recuperative parametric pumping. Effect of the ratio TB φφ / (RUN 6: 5/3; RUN 1: 3/5; RUN 7: 1/7)

Removal of salicylic acid from effluents using natural and polymeric adsorbents 71
RUN 1
1.0E-05
1.0E-04
1.0E-03
1.0E-02
1.0E-01
1.0E+00
1.0E+01
1.0E+02
0 500 1000 1500 2000 2500time (minutes)
log
(C/C
0)
RUN 7
1.0E-05
1.0E-04
1.0E-03
1.0E-02
1.0E-01
1.0E+00
1.0E+01
1.0E+02
0 500 1000 1500 2000time (minutes)
log
(C/C
0)
Figure 3.10 (continued) Experimental results and model predictions (grey line) Model I, (black line) Model II for the system salicylic acid/water/ SP206. Top and bottom product concentrations as a function of time in recuperative parametric pumping. Effect of the ratio
TB φφ / (RUN 6: 5/3; RUN 1: 3/5; RUN 7: 1/7)
The ratio TB φφ affects the volume of top and bottom reservoir which is percolated through
the column, so, the larger this ratio is the larger is the top concentrated reservoir volume
which is percolated downward flow and the smaller the purification with respect to the
Clean Technologies for the Purification of Wastewaters: Adsorptive Parametric Pumping

72 CHAPTER 3
starting concentration. Run 7 then results in a higher purification level than runs 6 and 1
although less bottom product is got.
The Model I and Model II predictions are very similar for the top concentrated product but
not for the bottom purified one. On the whole, the LDF model (Model II) predictions are in
better agreement with experimental results. The LDF approximation used in Model II seems
to be adequate to describe intraparticle mass transfer for the cyclic process here considered. It
may be seen in Figure 3.8- Figure 3.10 that the LDF model explain the parametric pumping
operation for the system salicylic acid/water/polymeric adsorbent SP206 to a great extent,
except for small disparities related to deviation of the equilibrium results from the Langmuir
model.
3.5
3.6
Conclusions
The effects of temperature, bed length and flow-rate were studied on fixed bed adsorption of
salicylic acid using different polymeric adsorbents (Sephabeads SP207 and SP206) and
activated carbon (Filtrasorb F400). The simulation of breakthrough curves based on a linear
driving force (LDF) rate model to describe the diffusional mass transfer seems to fit well the
experimental results. The polymeric adsorbents are much more sensitive to temperature when
adsorbing salicylic acid than the Filtrasorb F400. This is especially true for the Sephabeads
SP206, which shows the higher values of the separation parameter b based on the
temperature. Thermal parametric pumping in recuperative mode was carried out in a pilot
plant using Sephabeads SP206 for salicylic acid purification. A LDF model explained top and
bottom concentrations of salicylic acid as a function of time. In terms of a purification of
salicylic acid, thermal parametric pumping using Sephabeads SP206 as adsorbent may be an
interesting option worth to be further studied.
Nomenclature
a deviation in the separation parameter
wall specific area (4/D) (m-1) wA
enthalpy of adsorption (J mol-1) HΔ
b separation parameter
Bi non-dimensional mass Biot number (kf rp/Dpe)
Clean Technologies for the Purification of Wastewaters: Adsorptive Parametric Pumping

Removal of salicylic acid from effluents using natural and polymeric adsorbents 73
concentration in the bulk fluid phase (g L-1) C
initial liquid-phase concentration of phenol (mg L-1) 0C
equilibrium liquid-phase concentration of phenol (mg L-1) eC
feed phenol concentration in the liquid-phase (mg L-1) FC
heat capacity of the fluid kJ/(kg.K) fCp
sCp heat capacity of the solid kJ/(kg.K)
average concentration of the fluid in a reservoir (mg L-1), y = BP or y = TP yC
diameter of the particle of the adsorbent (cm) pd
bed diameter (mm) D
axial dispersion (m2min-1) axD
the effective pore diffusivity (m2min-1) peD
the molecular diffusivity (m2min-1) mD
hf humidity factor (g dry adsorbent/g adsorbent)
global wall heat transfer coefficient kJ/(m2 s K) wh
aeK axial thermal conductivity (kJ/(m.s.K))
parameter in the isotherm model (L mg-1) K
infinite adsorption equilibrium constant for the equilibrium model (L mg-1) ∞K
Linear Driving Force (LDF) kinetic rate constant (min-1) LDFk
bed length (m) L
capacity parameter in the separation parameter b )(Tm
m average slope in the separation parameter b
molecular weight of solvent B (g mol-1) BM
n number of cycles
Clean Technologies for the Purification of Wastewaters: Adsorptive Parametric Pumping

74 CHAPTER 3
Pe Péclet number
hPe thermal Péclet number
constant in the Langmuir isotherm model (mg g-1) related to the adsorptive capacity Q
reservoir displacement volume (mL) )/( ωπQ
flowrate of the fluid in the column during a half-cycle (mL min-1), x = c or x = h xQ
flowrate of removing the product from a reservoir (mL min-1), y = BP or y = TP yQ
average adsorbed phase concentration per dry mass of adsorbent (mg g –1) q
*q solute adsorbed per dry mass of adsorbent in equilibrium with the solute concentration
in solution at a certain time (mg g –1)
solute adsorbed per dry mass of adsorbent at equilibrium (mg g-1) eq
Re Reynolds number
radius of the particle of the adsorbent (m) pr
t time (min)
xt half-cycle time (min), x = c or x = h .
absolute temperature (K) T
xT feeding temperature during a half-cycle (K), x = c or x = h.
abT ambient temperature (K)
flow rate (cm3 min-1) U
superficial velocity (m min-1) 0u
interstitial velocity (m min-1) ju
UV volume percolated during hot-half cycle (mL)
molar volume of solute a at its normal boiling temperature (cm3mol-1) AV
axial coordinate in the bed (cm) z
Clean Technologies for the Purification of Wastewaters: Adsorptive Parametric Pumping

Removal of salicylic acid from effluents using natural and polymeric adsorbents 75
Greek Letters
ε bed porosity
porosity of the adsorbent pε
φ dimensionless association factor of solvent B
Bφ and fractions of the Q (π/ω) that are withdrawn as bottom and top products, respectively Tφ
θ fractional coverage of solute on the adsorbed phase in the Nitta model
η viscosity of the solution (Pa.s)
LDF factor, which is equal to 3, 8 or 15 for slab, cylindrical or spherical geometry Ω
ρ density of the adsorbent (g L-1)
density of the fluid (g L-1) fρ
τ tortuosity of the adsorbent
ηξ heat capacity parameter
ω frequency of temperature change
Sub indexes
corresponding to the Langmuir equilibrium model L
N corresponding to the Nitta equilibrium model
c relative to the cold half-cycle
h relative to the hot half-cycle
bottom product from cold half-cycle BP
top product from hot half-cycle TP
3.7 References
Azevedo, D. C. Separation/Reaction in simulated moving bed, Application to the production
of industrial Sugars. Ph. D. Thesis, University of Porto, Porto, 2001.
Bartels, P. D. and Lund-Jacobsen, H., "Blood lactate and ketone body concentration in
salicylate intoxication". Human Toxicology, 5, 363 - 366 (1986).
Clean Technologies for the Purification of Wastewaters: Adsorptive Parametric Pumping

76 CHAPTER 3
Clean Technologies for the Purification of Wastewaters: Adsorptive Parametric Pumping
Daughton, C. G. and Ternes, T. A., "Pharmaceuticals and Personal Care Products in the
Environment: Agents of Subtle Change?" Environmental Health Perspectives, 107 (6), 907 -
938 (1999).
Davesac, R. R., Pinto, L. T., da Silva, F. A., Ferreira, L. M. and Rodrigues, A. E., "A package
for thermal parametric pumping adsorptive processes". Chemical Engineering Journal, 76 (2),
115-125 (2000).
Done, A. K. and Temple, A. R., "Treatment of salicylate poisoning". Modern Treatments, 8,
528 - 551 (1971).
Erikson, E., Auffarth, K., Eilersen, A.-M., Henze, M. and Ledin, A., "Household chemicals
and personal care products as sources of xenobiotic organic compounds I grey wastewater".
Water Sa, 29, 2 (2003).
Farooq, S. and Ruthven, D. M., "Heat effects in adsorption column dynamics: 2.
Experimental validation of the one-dimensional model". Industrial & Engineering Chemistry
Research, 29, 1084 (1990).
Ghasem, N. M., "Combined mode of operation for thermal parametric pumping". Journal of
Chemical Technology and Biotechnology, 78 (6), 666-669 (2003).
Glueckauf, E. and Coates, J. I., "Theory of Chromatography .4. The Influence of Incomplete
Equilibrium on the Front Boundary of Chromatograms and on the Effectiveness of
Separation". Journal of the Chemical Society, (OCT), 1315-1321 (1947).
Guiochon, G., Shirazi, S. G. and Katti, A. M., Fundamentals of preparative and nonlinear
chromatography. Academic press, Boston, 1994.
Halling-Sorenson, B., Nors Nielsen, S. P., Lanzky, F., Ingerslev, F., Holten Lützhoft, H. C.
and Jergensen, S. E., "Occurrence, fate and effects of pharmaceutical substances in the
environment - a review". Chemosphere, 36 (2), 357 - 393 (1998).
Hanesian, D. and Perna, A. J. The Sitting, Process analysis and Design of a Manufacturing
Facility Using hazardous material in a Residential Community (The manufacture of aspirin).
Workbook, Newark, 2000.
Hmicek, G., Skelton, J. and Miller, W., "Pulmonary edema and salicylate intoxication".
JAMA, 230, 866-867 (1974).

Removal of salicylic acid from effluents using natural and polymeric adsorbents 77
Clean Technologies for the Purification of Wastewaters: Adsorptive Parametric Pumping
Insel, P. A., "Analgesic-antipyretics and anti-inflamatory agents, drugs employed in the
treatment of rheumatoid arthritis and gout" in The Pharmacological Basis of Therapeutics, L.
S. Goodman and A. Gilman, eds. Pergamon Press. Inc., Elmsford, 638 - 681, 1990.
Kaplan, E. H., Kennedy, J. and Davis, J., "Effects of salicylate and other benzoates on
oxidative enzymes of the tricarboxylic acid cycle in rat tissue homogenates". Archives of
Biochemistry and Biophysics, 51, 47 - 61 (1954).
Lutomski, D. M., Bottorff, M. and Shanga, K., "Pharmacokinetic optimisation of the
treatment of embolic disorders". Clinical Pharmacokinetics, 28, 67 - 92 (1995).
Miyahara, J. T. and Karlen, R., "Effect of salicylate on oxidative phosphorylation and
respiration of mitochondrial fragments". Biochemical Journal, 97, 194 - 198 (1965).
Montague, P., "Drugs in the water". Rachel´s Environment & Healh Weekly, No. 1998.
Nitta, T., Shigetomi, T., Kurooka, M. and Katayama, T., "An Adsorption-Isotherm of Multi-
Site Occupancy Model for Homogeneous Surface". Journal of Chemical Engineering of
Japan, 17 (1), 39-45 (1984).
Pigford, R. L., Baker, B. and Blun, D., "An equilibrium Theory of the Parametric Pumping".
Industrial & Engineering Chemistry Fundamentals, 12, 406 - 412 (1973).
Raloff, J., "Drugged waters". Science news, 153, 187 - 189 (1998).
Ramalho, R., Costa, C., Grevillot, G. and Rodrigues, A. E., "Adsorptive parametric pumping
for the purification of phenolic effluents". Separation Technology, 1, 99 - 107 (1991).
Reid, R., C., Prausnitz, J., M. and Poling, B., E., Properties of gas and liquids. McGraw Hill,
New York, 1987.
Schwart, R. and Landry, G., "Organic acid excretion in oxidative intoxication". Journal of
Pediatry, 66, 658 - 666 (1965).
Shim, W. G., Lee, J. W., Rhee, H. and Moon, H., "Condensation of Trichloroethylene vapor
on mesoporous material". Korean Journal of Chemical Engineering, 21 (2), 469 - 476 (2004).
Silva, J. A. and Rodrigues, A. E., "Fixed-bed adsorption of n-Pentane/Isopentane mixtures in
pellets of 5A zeolite". Industrial & Engineering Chemistry Research, 36, 3769 (1997).
Thurston, J. H., Pollock, P. G. and Warren, S. K., "Reduced brain glucose with normal plasma
glucose in salicylate poisoning". Clinical Investigations, 49, 2139 - 2145 (1970).

78 CHAPTER 3
Clean Technologies for the Purification of Wastewaters: Adsorptive Parametric Pumping
Velagaleti, R., "Drugs Are Accumulating in Sewage Sludge, Surface Waters, and Drinking
Water". Drug Information Journal, 31, 715 - 722 (1997).
Walters, J. S., Woodying, J. H. and Stelling, C. R., "Salicylate-induced pulmonary edema".
Radiology, 146, 289 - 293 (1983).
Wilke, C. R. and Chang, P., "Correlation of Diffusion Coefficients in Dilute Solutions".
AIChE Journal, 1 (2), 264-270 (1955).
Yang, R. T., Gas separation by adsorption processes. Butterworth Publishers, Stoneham
(USA), 1987.


4. Purification of 4-nitrophenol wastewaters by thermal
parametric pumping: modeling and pilot scale
experiments1
4.1 Introduction
Phenolic compounds are priority pollutants that enter water bodies through discharge from
pharmaceutical, petrochemical and other chemical manufacturing processes. They are harmful
to organisms at low concentrations and many of them have been classified as hazardous
pollutants because of their potential to harm human health. Given their toxicity, phenols have
been included in the US Environmental Protection Agency (USA EPA, 1987) list of priority
pollutants.
Many methods including sorption (Mortland et al., 1986; El-Geundi, 1997; Gao et al., 2001),
biological degradation (Gusler et al., 1993; Haghighi-Podeh et al., 1995; Gonzalez et al.,
2001), chemical oxidation (Pintar and Levec, 1992; Kiwi et al., 1994; Alemzadeh et al.,
1 Based on the paper: Phenolic wastewaters purification by thermal parametric pumping: modeling and pilot
scale experiments. by M. Otero, M. Zabkova, A.E. Rodrigues, Water Research 39, 3467-3478 (2005)

80 CHAPTER 4
2002), and solvent extraction (Dieckmann and Gray, 1996) have been used to separate these
compounds from water. Among these, sorption is the most commonly applied and it is
effective for low to medium levels of phenols. A large number of theoretical and experimental
results have been published using different adsorbents such as activated carbons, polymeric
resins and organoclays.
Sorption operations are able to concentrate solutes, especially in the case that these solutes are
valuable and can be recycled. In conventional fixed-bed adsorption, there are two steps: the
first one is saturation, adsorption or loading, which is followed by a second step of desorption,
elution or regeneration. This operative scheme accounts for a low efficiency since only a
fraction of the adsorbent capacity is used. Also, it is necessary to use a chemical regenerant to
get an operative bed, so a new waste disposal problem comes out.
Parametric pumping enables purification of industrial wastewaters avoiding the use of
chemical regenerant agents and allowing the recycling of the concentrated stream for the
industrial process so contributing to achieve the concept of zero-pollutant plant. This is a
cyclic separation process, which consists of a mobile phase that percolates through a fixed
bed upwards and downwards cyclically, and, with the same periodicity, a cyclic change
occurs in any thermodynamic variable, such as temperature, pressure, pH, etc (Simon et al.,
1998). In thermal parametric pumping the temperature is the changing variable and the
process assumes that the adsorption equilibrium isotherm of the solute onto the adsorbent
changes with temperature.
The fundamentals of parametric pumping were established in the late sixties (Wilhelm et al.,
1966; Wilhelm et al., 1968; Pigford et al., 1969). At the beginning it was seen as a way to
purify valuable compounds but from the 1980´s parametric pumping started to be considered
for wastewater purification purposes (Costa et al., 1982) what gave the starting point to
previous works carried out in our laboratory (Ferreira and Rodrigues, 1995b; Ferreira and
Rodrigues, 1995a; Díez et al., 1998; Davesac et al., 2000).
In this work, the purpose was to study the purification of 4-nitrophenol from water by thermal
parametric pumping. The polymeric resin Sephabeads SP206 was chosen as adsorbent.
Several runs under different conditions were carried out for each of the solutes. The aim of
the work was to describe the adsorptive parametric pumping cyclic performance. Two
different models: an equilibrium-dispersion model and a Linear Driving Force model with
Clean Technologies for the Purification of Wastewaters: Adsorptive Parametric Pumping

Purification of 4-nitrophenol wastewater by thermal parametric pumping 81
axial dispersion were used. The Linear Driving Force Model with axial dispersion well
predicts the pilot scale experimental results obtained both for phenol and 4-nitrophenol.
4.2 Experimental part
4.2.1 Chemicals and adsorbents
4-nitrophenol (C6H5NO3) was purchased from Fluka (Spain). The solutions of 4-nitrophenol
were prepared with degassed and distilled water.
The polymeric resin Sephabeads SP206 (Mitsubishi Chemical Corporation) was purchased
from Resindion (Italy). This is a nonionic polymeric resin of polystyrene crosslinked with
DVB and it has been previously used with success for other phenolic derivatives adsorption
(Díez, et al., 1998; Davesac et al., 2000). According to the manufacturers, Sephabeads SP206
are yellow opaque beads with a radius (rp) of 0.4 mm, the resin having a density (ρp) of 1190
g L-1 and a moisture content of 50% (fh = 0.5).
4.2.2 Batch adsorption
Adsorption equilibrium experiments were carried out by contacting the corresponding amount
of adsorbent (0.1-3.0 g) with 100 mL of 4-nitrophenol solution in 250-mL Erlenmeyer flasks.
Initial concentration of the solution was around 500 mg L-1. Adsorption equilibrium isotherms
were measured by batch equilibration placing the volumetric flasks in a shaking mixer at 150
rpm and using a thermostatic bath for temperature control.
Equilibrium experiments were run at 293, 310 and 333 K. After shaking during 48 h, the
solution was separated from the adsorbent and the final concentration of solute in water was
determined by measuring the absorbance by means of a UV-visible spectrophotometer Jasco
(model 7800, Japan) and the wavelength was 372 nm. The amount of solute adsorbed onto the
different adsorbents, (mg g-1dry resin), was calculated by a mass balance relationship (Eq
4.1).
qe
Clean Technologies for the Purification of Wastewaters: Adsorptive Parametric Pumping
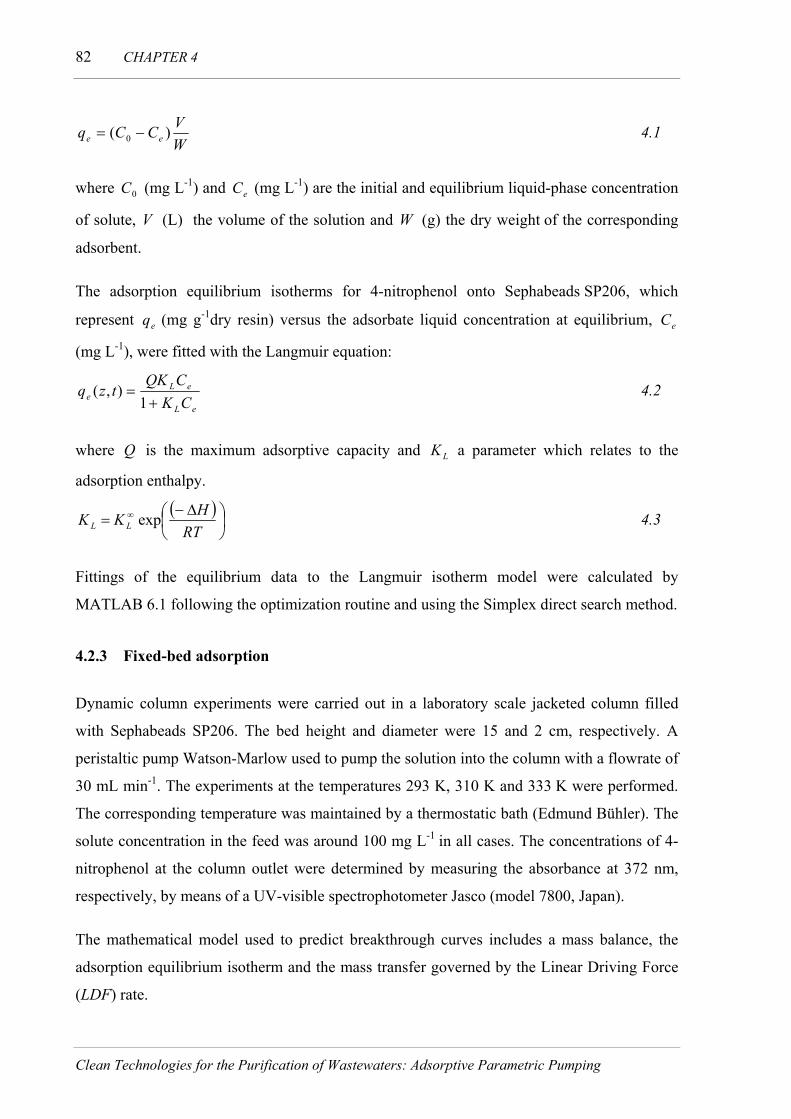
82 CHAPTER 4
WVCCq ee )( 0 −= 4.1
where (mg L-1) and (mg L-1) are the initial and equilibrium liquid-phase concentration
of solute, V (L) the volume of the solution and W (g) the dry weight of the corresponding
adsorbent.
0C eC
The adsorption equilibrium isotherms for 4-nitrophenol onto Sephabeads SP206, which
represent (mg g-1dry resin) versus the adsorbate liquid concentration at equilibrium, C
(mg L-1), were fitted with the Langmuir equation:
qe e
eL
eLe CK
CQKtzq
+=
1),( 4.2
where is the maximum adsorptive capacity and a parameter which relates to the
adsorption enthalpy.
Q LK
( )⎟⎠⎞
⎜⎝⎛ Δ−
= ∞
RTHKK LL exp 4.3
Fittings of the equilibrium data to the Langmuir isotherm model were calculated by
MATLAB 6.1 following the optimization routine and using the Simplex direct search method.
4.2.3 Fixed-bed adsorption
Dynamic column experiments were carried out in a laboratory scale jacketed column filled
with Sephabeads SP206. The bed height and diameter were 15 and 2 cm, respectively. A
peristaltic pump Watson-Marlow used to pump the solution into the column with a flowrate of
30 mL min-1. The experiments at the temperatures 293 K, 310 K and 333 K were performed.
The corresponding temperature was maintained by a thermostatic bath (Edmund Bühler). The
solute concentration in the feed was around 100 mg L-1 in all cases. The concentrations of 4-
nitrophenol at the column outlet were determined by measuring the absorbance at 372 nm,
respectively, by means of a UV-visible spectrophotometer Jasco (model 7800, Japan).
The mathematical model used to predict breakthrough curves includes a mass balance, the
adsorption equilibrium isotherm and the mass transfer governed by the Linear Driving Force
(LDF) rate.
Clean Technologies for the Purification of Wastewaters: Adsorptive Parametric Pumping

Purification of 4-nitrophenol wastewater by thermal parametric pumping 83
Species mass balance:
The mass balance in a bed volume element is:
ttzq
ft
tzCz
tzCuz
tzCD hpiax ∂
∂−+
∂∂
=∂
∂−
∂∂ ),(1),(),(),(
2
2
ρε
ε 4.4
zεwhere is the axial dispersion , is the interstitial velocity, is the bed porosity, axD iu is the
axial position, C is the concentration in the bulk fluid phase, q is the average adsorbed
phase concentration in the adsorbent particles, pρ is the density of the adsorbent and its
humidity factor.
f h
Adsorption equilibrium isotherm:
The equilibrium was described by the Langmuir isotherm, which was above specified by Eq
4.2 and Eq. 4.3.
Intraparticle mass transfer
The Linear Driving Force (LDF) approximation (Glueckauf, 1955) was used to describe
intraparticle mass transfer:
[ ),(),(),( * tzqtzqk
ttzq
LDF −=∂
∂ ] 4.5
where kLDF is the Linear Driving Force kinetic constant, q*(z, t) is the adsorbed phase
concentration in equilibrium with the bulk concentration.
The boundary conditions for the mass balance equation are the Danckwerts boundary
conditions:
)),0((),(00 CtCu
ztzCD izax −=
∂∂
= 4.6 0=z
0),(=
∂∂
=LzztzCLz = 4.7
The associated initial conditions for the adsorption are:
Clean Technologies for the Purification of Wastewaters: Adsorptive Parametric Pumping

84 CHAPTER 4
4.8 0)0,( =zC
4.9 0)0,( =zq
The axial dispersion was obtained from the following expression (Guiochon et al., 1994):
)Re011.02.0( 48.00 +=ax
p
Ddu
4.10
ηρ pf du0Re =where .
The kLDF used in the model were estimated by the following expression (Azevedo, 2001):
dCdqfr
Dk
hp
peLDF *
2 ρ
Ω= 4.11
where (m2min-1) is the effective pore diffusivity, (m) is the radius of the particle of
the adsorbent, Ω is the LDF factor, which is equal to 15 for spherical particles (Azevedo,
2001), and (
peD pr
dCdq *
) is the slope of the equilibrium data.
The was calculated from (Guiochon et al., 1994): peD
τε mp
pe
DD = 4.12
where is the molecular diffusivity of the solute in water, τmD is the tortuosity of the
adsorbent and its porosity. pε
The molecular diffusivity of 4-nitrophenol in water was found from the Wilke-Chang (1955)
method, which estimates the (cm2s-1) as: Dm
( )6.0
2/18104.7
AB
Bm V
TMDη
φ−×= 4.13
where is the molar volume of the solute, the values of were estimated by the Le Bas
additive method (Le Bas, 1915) giving V = 127.9 cm3 mol-1 for 4-nitrophenol. Wilke and
Chang recommended that the dimensionless association factor of solvent,
AV AV
A
φ , was chosen 2.6 if
Clean Technologies for the Purification of Wastewaters: Adsorptive Parametric Pumping

Purification of 4-nitrophenol wastewater by thermal parametric pumping 85
the solvent is water. The viscosity of water Bη (cp) at the corresponding temperature was
used.
The partial differential equations of the model to describe the adsorption of 4-nitrophenol
onto Sephabeads SP206 were solved using the software package gPROMS® for general
PROcess Modelling System (gPROMS, 2003). The orthogonal collocation method on finite
elements (OCFE) was used with 50 finite elements and two interior collocation points in each
element of the adsorption bed.
4.2.4 Parametric pumping system
Figure 4.1 shows the automated parametric pumping pilot plant used for the purification of 4-
nitrophenol from wastewater. The adsorbent, Sephabeads SP206, was placed in the
borosilicate column of the plant. The adsorbent bed was 80 x 9 cm with a porosity ε = 0.4.
The operation of the plant was performed in a semi-continuous way, with feed to the top
reservoir. The aim is to produce a concentrated solution at the top reservoir and a solute-free
stream in the bottom one. After saturation of the bed at the cold temperatureT , the solution
was passed cyclically through the bed of adsorbent in upward flow at a temperature (hot
half-cycle) followed by downward flow at a temperature T (T < ) (cold half-cycle). The
conditions (temperature range, flow-rates, products withdrawal) under which the operation is
carried out determine the concentration and purification obtained.
c
T
T
h
c c h
The parametric pumping pilot plant was operated in a recuperative mode, i.e., temperature
change is not imposed through the column wall (direct mode) but by the solution itself, which
is heated or cooled by means of thermostatic baths. Recuperative mode was chosen as,
compared to direct mode, it would be more appropriate for industrial purposes as this allows
the use of larger diameter columns (Ramalho et al., 1991).
The automated pilot plant used has three reservoirs: top, bottom and feed reservoirs. The top
and bottom reservoirs receive product when the solution is pumped through the column in
upward or downward flow, respectively. From the feed reservoir the feed solution, around
500 mgL-1 of 4-nitrophenol, is passed into the top reservoir. Pressure transducers installed at
the bottom of the reservoirs to detect when all the solution contained in a reservoir was
Clean Technologies for the Purification of Wastewaters: Adsorptive Parametric Pumping
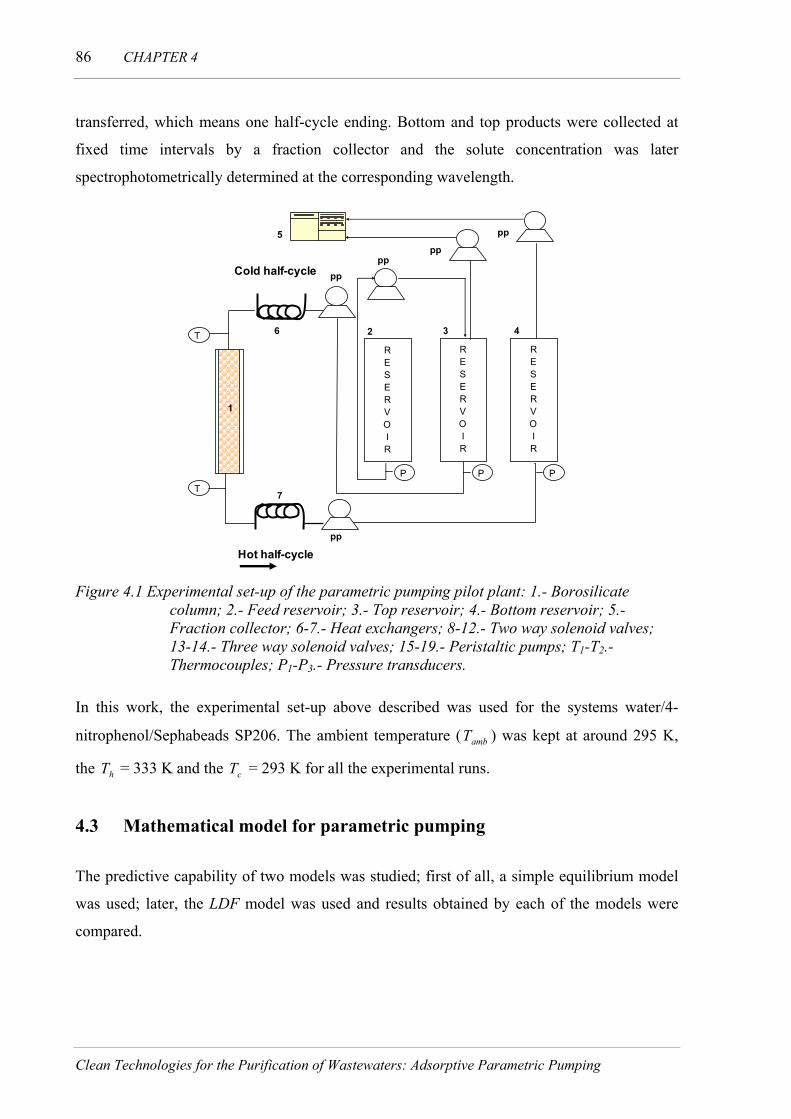
86 CHAPTER 4
transferred, which means one half-cycle ending. Bottom and top products were collected at
fixed time intervals by a fraction collector and the solute concentration was later
spectrophotometrically determined at the corresponding wavelength.
pp
2 3 4
RESERVOIR
RESERVOIR
RESERVOIR
P P P
5
Hot half-cycle
Cold half-cycle
T
T
6
7
pp
pp
pp
pp
1
Figure 4.1 Experimental set-up of the parametric pumping pilot plant: 1.- Borosilicate
column; 2.- Feed reservoir; 3.- Top reservoir; 4.- Bottom reservoir; 5.- Fraction collector; 6-7.- Heat exchangers; 8-12.- Two way solenoid valves; 13-14.- Three way solenoid valves; 15-19.- Peristaltic pumps; T1-T2.- Thermocouples; P1-P3.- Pressure transducers.
In this work, the experimental set-up above described was used for the systems water/4-
nitrophenol/Sephabeads SP206. The ambient temperature (T ) was kept at around 295 K,
the T = 333 K and the T = 293 K for all the experimental runs.
amb
h c
4.3 Mathematical model for parametric pumping
The predictive capability of two models was studied; first of all, a simple equilibrium model
was used; later, the LDF model was used and results obtained by each of the models were
compared.
Clean Technologies for the Purification of Wastewaters: Adsorptive Parametric Pumping

Purification of 4-nitrophenol wastewater by thermal parametric pumping 87
4.3.1 Equilibrium model with axial dispersion
This model will be referred as the equilibrium-dispersion model, assuming that axial
dispersion is also considered to simulate the operation of the parametric pumping unit. This
mathematical model comprises a mass balance, a global energy balance and the adsorption
equilibrium isotherm. The balances of the reservoirs containing the product from the hot and
the cold cycles, top and bottom reservoirs are included as well.
The equilibrium-dispersion model assumes:
a) mixing in the reservoirs is perfect
b) radial temperature gradients in the bed are negligible
c) one-dimensional pseudo-homogeneous model for the heat transfer
d) constant physical properties of the fluid and the adsorbent
e) the effect of the transient temperature regime on the heat and mass transfer parameters
is negligible
f) the film heat and mass transfer resistances are negligible
g) the adsorption equilibrium is described by the Langmuir isotherm and the constant of
equilibrium exponentially depends of temperature
h) instantaneous equilibrium between the pore fluid concentration and the adsorbed
concentration, i.e., mass transfer kinetics is infinitely fast
The model equations are the following:
Mass balance
The mass balance in a bed volume element is:
ttzq
ft
tzCz
tzCuz
tzCD hpiax ∂∂−
+∂
∂=
∂∂
±∂
∂ ),(1),(),(),(2
2
ρε
ε 4.14
where, in the equilibrium model, ),(),( * tzqtzq = .
Clean Technologies for the Purification of Wastewaters: Adsorptive Parametric Pumping

88 CHAPTER 4
Considering z=0 at the bottom of the column and z=L at the top, in the equation above, the
term z
ui ∂±
tzC∂ ),( has the “-” sign for the hot half-cycle upwards, and the “+“ sign for the
cold half-cycle downwards.
Energy balance
A global energy balance for the column was used:
[ ]
ttzq
HTTAhz
tzTuCpz
tzTK
ttzTCpCp
ambwwffae
spff
∂
∂Δ−+−−
∂∂
±∂
∂=
=∂
∂−+
),()()(),(),(
),()1(
02
2
ρ
ερερ 4.15
where is the axial thermal conductivity, is the heat transfer coefficient of the wall of
the column and is the wall specific area,
aeK wh
and wA fρ pρ are the densities of the fluid and of
the adsorbent, and Cp and Cp are the heat capacities of the fluid and of the adsorbent,
respectively. Again, in the equilibrium-dispersion model,
sf
),(),( tzqtzq = * .
Lz =Considering at the bottom of the column and 0=z at the top, in the equation above,
the term z
uCp ff ∂± 0ρ tzT∂ ),( has the “+” sign for the cold half-cycle downwards, and the “-“
sign for the hot half-cycle upwards.
Adsorption equilibrium isotherm
The adsorption equilibrium isotherms for 4-nitrophenol onto Sephabeads SP206 were
described by Langmuir equations (Eq.4.2) and (Eq.4.3).
Balance of the reservoirs
• Hot half-cycle
4.16 1−⟩⟨=⟩⟨ nBPBP CC
)1()(
)1(),()1(
T
TBF
T
nBTP C
tLCC
φφφ
φφ
++
++
⟩⟨−=⟩⟨ 4.17
• Cold half-cycle
Clean Technologies for the Purification of Wastewaters: Adsorptive Parametric Pumping

Purification of 4-nitrophenol wastewater by thermal parametric pumping 89
4.18 nBP tCC ⟩⟨=⟩⟨ ),0(
where and ⟩⟨ BPC ⟩⟨ TPC are the average concentrations of solute in the fluid which is in the
bottom and in the top reservoirs, respectively, and Bφ Tφ are the fraction of the total reservoir
displacement volume ( ( )ωπ /Q ) that are withdrawn as product from the bottom and the top
reservoirs, respectively, and refers to the number of cycles. n
4.3.2 Model of Linear Driving Force (LDF) with axial dispersion
The LDF model was also used for the simulation of the operation of the parametric pumping
unit. This model includes the equations above indicated for the equilibrium-dispersion model
and, apart of the previous, one more equation corresponding to the LDF intraparticle rate,
which was previously used for modeling the breakthrough curves (Eq. 4.5), to describe the
diffusional mass transfer inside adsorbent particles.
The LDF model assumptions are the same as the equilibrium model except for:
a. equilibrium between the bulk fluid concentration and the adsorbed concentration at the
particle surface
b. intraparticle mass transfer velocity described by the linear driving force (LDF) model
Intraparticle mass transfer
The Linear Driving Force (LDF) approximation, first introduced by Glueckauf (1955),
imposes a restriction to the previous equilibrium-dispersion model. According to this model
the average adsorbed phase concentration rate is proportional to the difference between the
adsorbed phase concentration in equilibrium with the bulk fluid and the average adsorbed
phase concentration, given by (Eq. 4.5).
Boundary and Initial conditions
For both models, the boundary conditions for the equations used to predict the parametric
pumping operation, were the following:
• Hot half-cycle
4.19 • 0=z nBPCtC ⟩⟨=),0( hTT =
0),(=
∂∂
ztzT0),(
=∂
∂z
tzC• Lz = 4.20
Clean Technologies for the Purification of Wastewaters: Adsorptive Parametric Pumping

90 CHAPTER 4
• Cold half-cycle
0),(=
∂∂
ztzC 0),(
=∂
∂z
tzT0=z 4.21
Lz = 4.22 nTPCtLC ⟩⟨=),( cTT =
The initial conditions were:
4.23 FCzC =)0,(
4.24 0)0,( TzT =
The partial differential equations corresponding to both the equilibrium and the LDF
parametric pumping models were solved with a package (Davesac et al., 2000) previously
developed in our laboratory in Visual Basic.
4.4 Results and discussion
4.4.1 Adsorption isotherms
HΔThe characteristic parameters Q , and LK corresponding to the fittings of the
experimental data to the Langmuir isotherm model are shown in Table 4.1.
Table 4.1 Equilibrium parameters determined for the adsorption of phenol and 4-nitrophenol onto Sephabeads SP206 and the corresponding separation parameter calculated for temperature range 293-310K, 310-333K and 293-333K .
b
Langmuir parametrs 4-Nitrophenol
Q (mg g-1) 101.1 ∞LK (L mg-1) 8.23×10⁻⁸
LHΔ (kJ mol-1) -30.37
b (temperature range)
b 0.33 (293 K-310 K)
b 0.39 (310 K-333 K)
b 0.64 (293 K-333 K)
The experimental adsorbed concentrations as a function of liquid phase concentration
corresponding to the 4-nitrophenol adsorption onto Sephabeads SP206 at each of the
Clean Technologies for the Purification of Wastewaters: Adsorptive Parametric Pumping

Purification of 4-nitrophenol wastewater by thermal parametric pumping 91
temperatures considered are shown in Figure 4.2. The obtained fittings to the Langmuir
model are shown together with the experimental points.
Figure 4.2 Experimental adsorption equilibrium (symbols), versus and fittings to Langmuir model (full lines) at three temperatures (293, 310 and 333 K) for the adsorption of 4-nitrophenol onto Sephabeads SP206.
eq eC
Separation parameter:
From the equilibrium results, it may be found the separation to be expected as a function of
temperature for the systems 4-nitrophenol-SP206. The separation parameterb , introduced by
Pigford (Pigford et al., 1973), is indicative of the separation potential:
mab+
=1
4.25
2)()( 21 TmTm
m+
=2
)()( 21 TmTma
−= and the deviation with the average slope , considering
.The capacity parameter is defined as 21 TT <ε
ρε )()1( TKf)(Tm hp−
= LQKTK =)(, where
is the slope of initial linear region of the isotherm corresponding to each temperature, ε is the
bed porosity (ε = 0.4), ρ is the density and the humidity factor of the corresponding
adsorbent, which values appear in Table 2.1 (see Chapter 2). Together with the equilibrium
fh
Clean Technologies for the Purification of Wastewaters: Adsorptive Parametric Pumping

92 CHAPTER 4
coefficients, the b parameters corresponding to the adsorption of 4-nitrophenol onto
Sephabeads SP206 are shown in Table 4.1. In the range of temperature considered (293 K-
333 K) the larger the temperature difference, the higher the separation parameter for 4-
nitrophenol.
Fixed bed adsorption
The values of the Reynolds and the calculated axial dispersion used for the simulation of
the breakthrough curves of 4-nitrophenol are shown in
axD
Table 4.2, which also shows the
corresponding rates included in the model here used. kLDF
Table 4.2 Estimated axial dispersions ( ) corresponding to the fixed bed systems considered and LDF kinetic rate constants estimated ( ) for the adsorption of 4-nitrophenol onto Sephabeads SP206.
axD
LDFk
peDaxD mD LDFk T τpε Re (K) (min-1) (cm2 min-1) (cm2min-1) (cm2min-1)
5.11x10⁻⁴ 1.56x10⁻⁴ 293 0.62 1.83 0.022
8.46x10⁻⁴ 2.58x10⁻⁴ 310 0.99 1.81 0.038 0.61 2
1.24x10⁻³ 3.78x10⁻⁴ 333 1.34 1.80 0.077
L = 15 cm
Flow-rate = 30 mL min-1
Fixed bed experimental results from the adsorption of 4-nitrophenol onto polymeric resin are
shown together with the simulated ones in Figure 4.3. The LDF model seems to describe well
the fixed bed adsorption of 4-nitrophenol onto Sephabeads SP206 at the temperatures
considered.
4.4.2 Parametric pumping operation and simulation
The parametric pumping unit was operated in a semi-continuous way, the aim being to obtain
clean water as the bottom product and concentrated solution as the top product. Experiments
under different experimental conditions were carried out to ascertain the predictions of the
models. Experimental conditions are shown in Table 4.3.
Clean Technologies for the Purification of Wastewaters: Adsorptive Parametric Pumping

Purification of 4-nitrophenol wastewater by thermal parametric pumping 93
0
20
40
60
80
100
0 100 200 300 400 500 600 700
time (min)
Con
cent
ratio
n (m
g L-
1)
Figure 4.3 Fixed bed adsorption of 4-nitrophenol onto Sephabeads SP206. The bed length
was 15 cm and solution was fed at three temperatures (293 K, 310 K and 333 K) at a flow-rate of 30 mL min-1. Symbols correspond to the experimental results and full lines to the simulated ones.
The top and bottom concentrations of 4-nitrophenol are represented as a function of time in
Figure 4.4-Figure 4.7. The experimental results were compared with the predicted by the
equilibrium and by the LDF models. The characteristics of the adsorbent and the bed, the
operating variables, the equilibrium isotherm and the thermal and mass transport parameters
are introduced in the program to solve the previous equations.
In the Table 4.3 represents volume which is percolated through the column during hot-half
cycle, is reservoir displacement volume,
UV
,( ωπ / )Q Bφ Tφ are fraction of Q withdrawn as a
bottom and top product, respectively, Q , are flow-rates of removing the product from
the top and bottom reservoir, respectively. , Q , and t describes flow-rate of the fluid in
the column during the cold and hot half-cycle and time of the cold and hot cycle.
( ωπ / )
Q
Q t
TP BP
c h c h
Clean Technologies for the Purification of Wastewaters: Adsorptive Parametric Pumping

94 CHAPTER 4
Table 4.3 Experimental conditions used for the different parametric pumping runs in recuperative mode
Run 1 Run 2 Run 3 Run 4 Operating variables
(mL) UV 11616 29000 9500 17000 (mL) )/( ωπQ 16940 31200 9600 20000
Bφ 0.31 0.068 0.068 0.15 Tφ 0.34 0.56 0.56 0.25 (min) ct 55 120 60 100 (min) ht 48 100 50 85 (mLmin-1) cQ 308 260 160 200 (mLmin-1) hQ 242 290 190 200 (mLmin-1) TPQ 134 184 119.5 62.5 (mLmin-1) BPQ 105 18 12 32
1.00E-03
1.00E-02
1.00E-01
1.00E+00
1.00E+01
1.00E+02
0 200 400 600 800 1000 1200time (min)
log
(C/C
F)
Figure 4.4 Experimental results (symbols) for the parametric pumping run 1 together with the
equilibrium model (gray full lines) and the LDF model (black full lines) predictions. Top and bottom product concentrations 4-nitrophenol are shown as a function of time in recuperative parametric pumping.
The degree of purification of this pollutant varies depending on the operational conditions
applied, and it is especially good for the run 4. It may be seen that the two models here used
predict the first cycles of the operation at the same way. Nevertheless, the equilibrium model
predicts unlimited separation so it is not appropriate for the simulation when the number of
cycles increases. The Linear Driving Force model, which incorporates one more equation,
Clean Technologies for the Purification of Wastewaters: Adsorptive Parametric Pumping

Purification of 4-nitrophenol wastewater by thermal parametric pumping 95
comprises more resistances than the equilibrium model and it is more accurate in its
predictions.
1.00E-04
1.00E-03
1.00E-02
1.00E-01
1.00E+00
1.00E+01
1.00E+02
0 500 1000 1500 2000 2500
time (min)
log
(C/C
F)
Figure 4.5 Experimental results (symbols) for the parametric pumping run 2 together with the
equilibrium model (gray full lines) and the LDF model (black full lines) predictions. Top and bottom product concentrations of 4-nitrophenol are shown as a function of time in recuperative parametric pumping.
1.00E-03
1.00E-02
1.00E-01
1.00E+00
1.00E+01
1.00E+02
0 200 400 600 800 1000 1200
time (min)
log
(C/C
F)
Figure 4.6 Experimental results (symbols) for the parametric pumping run 3 together with the
equilibrium model (gray full lines) and the LDF model (black full lines) predictions. Top and bottom product concentrations of 4-nitrophenol are shown as a function of time in recuperative parametric pumping
Clean Technologies for the Purification of Wastewaters: Adsorptive Parametric Pumping

96 CHAPTER 4
The LDF model seems to describe well the parametric pumping operation under the different
conditions of the experimental runs. As it may observed, the simulation predictions of the
LDF model are in good agreement with experimental results, which indicates that the Linear
Driving Force approximation is appropriate for describing mass transfer in this cyclic process.
1.00E-04
1.00E-03
1.00E-02
1.00E-01
1.00E+00
1.00E+01
1.00E+02
0 500 1000 1500 2000 2500time (min)
log
(C/C
F)
Figure 4.7 Experimental results (symbols) for the parametric pumping run 4 together with the
equilibrium model (gray full lines) and the LDF model (black full lines) predictions. Top and bottom product concentrations of 4-nitrophenol is shown as a function of time in recuperative parametric pumping.
A high level of purification was obtained after 10 cycles and the concentration of 4-
nitrophenol in the bottom reservoir decreased to C <0.0015 and in the top reservoir the
concentration was 3 times higher than the feed concentration.
C/ F
4.5 Conclusions
Adsorption of 4-nitrophenol onto the polymeric resin Sephabeads SP206 was studied with a
focus on parametric pumping.
Batch tests were carried out in order to determine the effect of temperature on the equilibrium.
The Langmuir isotherm model well fitted the equilibrium of adsorption. The corresponding
separation parameters b were evaluated for 4-nitrophenol in the 293-333 K range of
temperature. Differences on adsorption capacity depending on temperature were confirmed by
Clean Technologies for the Purification of Wastewaters: Adsorptive Parametric Pumping

Purification of 4-nitrophenol wastewater by thermal parametric pumping 97
dynamic experiments. The LDF model used well predicted the experimental results obtained
for 4-nitrophenol.
Thermal parametric pumping in recuperative mode was carried out in a pilot plant using
Sephabeads SP206 for 4-nitrophenol purification from water. Two models, an equilibrium-
dispersion model with axial dispersion and a Linear Driving Force model, also with axial
dispersion, were used for simulating the operation of the parametric pumping unit. Runs
under different conditions were carried out to confirm the quality of their predictions.
Operational conditions define the degree of purification obtained by thermal parametric
pumping. In all cases, the LDF model, which has more restrictions, seems to better predict the
performance of the system. Under appropriate conditions, at the 10th cycle it was possible to
decrease to C/CF = 0.0013 for 4-nitrophenol. A high degree of purification of phenolic
wastewaters may then be achieved by thermal parametric pumping using Sephabeads SP206
as adsorbent and avoiding the use of any chemical regenerant.
4.6 Nomenclature
a - deviation in the separation parameter
- wall specific area (4/D) (m-1) wA
- enthalpy of adsorption for the Langmuir isotherm (J mol-1) LHΔ
b - separation parameter
C - concentration in the bulk fluid phase (kg m-3)
- initial liquid-phase concentration of 4-nitrophenol (kg m-3) 0C
- equilibrium liquid-phase concentration of 4-nitrophenol (kg m-3) eC
- feed 4-nitrophenol concentration in the liquid-phase (kg m-3) FC
- heat capacity of the fluid kJ/(kg.K) fCp
- heat capacity of the solid kJ/(kg.K) sCp
- average concentration of the fluid in the bottom reservoir (kg m-3) BPC
- average concentration of the fluid in the top reservoir (kg m-3) TPC
Clean Technologies for the Purification of Wastewaters: Adsorptive Parametric Pumping

98 CHAPTER 4
- diameter of the particle of the adsorbent (m) pd
D - bed diameter (m)
- axial dispersion (m2s-1) axD
- effective pore diffusivity (m2s-1) peD
- molecular diffusivity (m2s-1) mD
- humidity factor (g dry adsorbent/g adsorbent) hf
- global wall heat transfer coefficient kJ/(m2 s K) wh
- axial thermal conductivity (kJ/(m.s.K)) aeK
- parameter in the Langmuir isotherm model (m3 Kg-1) LK
- equilibrium constant corresponding to the Langmuir model (m3 Kg-1) ∞LK
- Linear Driving Force (LDF) kinetic rate constant (s-1) LDFk
L - bed length (m)
m - mass of adsorbent (kg)
- capacity parameter in the separation parameter b )(Tm
m - average slope in the separation parameter b
- molecular weight of solvent B (g mol-1) BM
n - number of cycles
Pe - Péclet number = (-) axi DLu
- thermal Péclet number = (-) hPe 0/ uKLCp aeffρ
- constant in the Langmuir isotherm model related to the adsorption capacity (mg g-1) Q
- reservoir displacement volume (m3) )/( ωπQ
- flowrate of the fluid in the column during the cold half-cycle (m3 s-1) cQ
- flowrate of the fluid in the column during the cold half-cycle (m3 s-1) hQ
Clean Technologies for the Purification of Wastewaters: Adsorptive Parametric Pumping

Purification of 4-nitrophenol wastewater by thermal parametric pumping 99
- flowrate of removing the product from the bottom reservoir (m3 s-1) BPQ
- flowrate of removing the product from the top reservoir (m3 s-1) TPQ
- 4-nitrophenol adsorbed per dry mass of adsorbent at a certain time (mg g –1) q
*q - 4-nitrophenol adsorbed per dry mass of adsorbent in equilibrium with the 4-
nitrophenol concentration in solution at a certain time (mg g –1)
- 4-nitrophenol adsorbed per dry mass of adsorbent at equilibrium (mg g-1) eq
- Reynolds number (-) Re
- radius of the particle of the adsorbent (m) pr
t - time (s)
- cold half-cycle time (s) ct
- hot half-time (s) ht
T - absolute temperature (K)
- feeding temperature during the cold half-cycle (K) cT
- feeding temperature during the hot half-cycle hT
- ambient temperature (K) ambT
- superficial velocity (m s-1) 0u
- interstitial velocity (m s-1) iu
- volume of the solution (m3) V
- volume percolated during hot-half cycle (m3) UV
- molar volume of solute a at its normal boiling temperature (cm3 mol-1) AV
W - dry weight of the corresponding adsorbent (kg)
z - axial coordinate in the bed (m)
Greek Letters
ε - bed porosity
Clean Technologies for the Purification of Wastewaters: Adsorptive Parametric Pumping

100 CHAPTER 4
- porosity of the adsorbent pε
φ - dimensionless association factor of solvent B
- fraction of the that is withdrawn as bottom product )/( ωπQBφ
- fraction of the that is withdrawn as top product )/( ωπQTφ
η - viscosity of the solution (Pa.s)
- viscosity of solvent B (Pa.s) Bη
- LDF factor, which is equal to 3, 8 or 15 for slab, cylindrical or spherical geometry Ω
− density of the adsorbent (kg m-3) pρ
− density of the fluid (kg m-3) fρ
τ - tortuosity of the adsorbent
4.7 References
Alemzadeh, I., Vossoughi, F. and Houshmandi, M., Phenol biodegradation by rotating
biological contactor. Biochemical Engineering Journal, 11 (1), 19-23 (2002).
Azevedo, D. C. Separation/Reaction in simulated moving bed, Application to the production
of industrial Sugars. Ph. D. Thesis, University of Porto, Porto, 2001.
Costa, C. A. V., Rodrigues, A. E., Grevillot, G. and Tondeur, D., Purification of Phenolic
Wastewater by Parametric Pumping - Non-Mixed Dead Volume Equilibrium-Model. AIChE
Journal, 28 (1), 73-85 (1982).
Davesac, R. R., Pinto, L. T., da Silva, F. A., Ferreira, L. M. and Rodrigues, A. E., A package
for thermal parametric pumping adsorptive processes. Chemical Engineering Journal, 76 (2),
115-125 (2000).
Dieckmann, M. S. and Gray, K. A., A comparison of the degradation of 4-nitrophenol via
direct and sensitized photocatalysis in TiO2 slurries. Water Research, 30 (5), 1169-1183
(1996).
Clean Technologies for the Purification of Wastewaters: Adsorptive Parametric Pumping

Purification of 4-nitrophenol wastewater by thermal parametric pumping 101
Díez, S., Leitão, A., Ferreira, L. M. and Rodrigues, A. E., Adsorption of phenylalanine onto
polymeric resins: equilibrium, kinetics and operation of a parametric pumping unit.
Separation and Purification Technology, 13, 25 - 35 (1998).
El-Geundi, M. S., Adsorbents for industrial pollution control. Adsorption Science &
Technology, 15 (10), 777-787 (1997).
Ferreira, L. M. and Rodrigues, A. E., Adsorptive separation by thermal parametric pumping
.1. Modeling and simulation. Adsorption-Journal of the International Adsorption Society, 1
(3), 213-231 (1995a).
Ferreira, L. M. and Rodrigues, A. E., Adsorptive separation by thermal parametric pumping
.2. Experimental study of the purification of aqueous phenolic solutions at pilot scale.
Adsorption-Journal of the International Adsorption Society, 1 (3), 233-252 (1995b).
Gao, B., Wang, X. R., Zhao, J. C. and Sheng, G. Y., Sorption and cosorption of organic
contaminant on surfactant-modified soils. Chemosphere, 43 (8), 1095-1102 (2001).
Glueckauf, E., Theory of Chromatography .10. Formulae for Diffusion into Spheres and Their
Application to Chromatography. Transactions of the Faraday Society, 51 (11), 1540-1551
(1955).
Gonzalez, G., Herrera, G., Garcia, M. T. and Pena, M., Biodegradation of phenolic industrial
wastewater in a fluidized bed bioreactor with immobilized cells of Pseudomonas putida.
Bioresource Technology, 80 (2), 137-142 (2001).
gPROMS, gPROMS v2.2 User Guide.Process System Enterprise Ltd. (2003).
Guiochon, G., Shirazi, S. G. and Katti, A. M., Fundamentals of preparative and nonlinear
chromatography. Academic press, Boston, 1994.
Gusler, G. M., Browne, T. E. and Cohen, Y., Sorption of Organics from Aqueous-Solution
onto Polymeric Resins. Industrial & Engineering Chemistry Research, 32 (11), 2727-2735
(1993).
Haghighi-Podeh, M. R., Bhattacharya, M. R., Sanjoy, K. and Qu, M., Effects of nitrophenols
on acetate utilizing methanogenic systems. Water Research, 29 (2), 391-399 (1995).
Clean Technologies for the Purification of Wastewaters: Adsorptive Parametric Pumping

102 CHAPTER 4
Clean Technologies for the Purification of Wastewaters: Adsorptive Parametric Pumping
Kiwi, J., Pulgarin, C. and Peringer, P., Effect of Fenton and Photo-Fenton Reactions on the
Degradation and Biodegradability of 2-Nitrophenols and 4-Nitrophenols in Water-Treatment.
Applied Catalysis B-Environmental, 3 (4), 335-350 (1994).
Mortland, M. M., Shaobai, S. and Boyd, S. A., Clay-Organic Complexes as Adsorbents for
Phenol and Chlorophenols. Clays and Clay Minerals, 34 (5), 581-585 (1986).
Pigford, R. L., Baker, B. and Blum, D. E., An Equilibrium Theory of Parametric Pump.
Industrial & Engineering Chemistry Fundamentals, 8 (1), 144-156 (1969).
Pigford, R. L., Baker, B. and Blun, D., An equilibrium Theory of the Parametric Pumping.
Industrial & Engineering Chemistry Fundamentals, 12, 406 - 412 (1973).
Pintar, A. and Levec, J., Catalytic Liquid-Phase Oxidation of Refractory Organics in Waste-
Water. Chemical Engineering Science, 47 (9-11), 2395-2400 (1992).
Ramalho, R., Costa, C., Grevillot, G. and Rodrigues, A. E., Adsorptive parametric pumping
for the purification of phenolic effluents. Separation Technology, 1, 99 - 107 (1991).
Simon, G., Grevillot, G., Hanak, L., Szanya, T. and Marton, G., Theoretical study of
adsorptive parametric pumping and temperature swing chromatography with flow reversal.
Chemical Engineering Journal, 70 (1), 71-80 (1998).
USA EPA, Federal Register. Washington D.C., 52 (131), 25861-25962 (1987).
Wilhelm, R. H., Rice, A. W. and Bendeliu.Ar, Parametric Pumping - a Dynamic Principle for
Separating Fluid Mixtures. Industrial & Engineering Chemistry Fundamentals, 5 (1), 141-155
(1966).
Wilhelm, R. H., Rice, A. W., Rolke, R. W. and Sweed, N. H., Parametric Pumping - a
Dynamic Principle for Separating Fluid Mixtures. Industrial & Engineering Chemistry
Fundamentals, 7 (3), 337-349 (1968).
Wilke, C. R. and Chang, P., Correlation of Diffusion Coefficients in Dilute Solutions. AIChE
Journal, 1 (2), 264-270 (1955).


5. Separation of synthetic vanillin at different pH onto
polymeric adsorbent Sephabeads SP 2061
5.1
Introduction
Vanillin (4-hydroxy-3-methoxybenzaldehyde) is the major component of natural vanilla,
which is one of the most used flavoring materials in the food industry, confectionery products
and also as a fragrance (Walton et al., 2003),(Walton et al., 2000). Presently approximately
50% of the worldwide production of synthetic vanillin is used as an intermediate in the
chemical and pharmaceutical industries for the production of herbicides, antifoaming agents
or drugs (Walton et al., 2003),(Hocking, 1997). Synthetic vanillin is also used in household
product, such as air-fresheners and floor polishes. Vanillin displays antioxidant and
antimicrobial properties and so has the potential for use as a food preservative (Krueger and
Krueger, 1983; Burri et al., 1989; Daugsch and Pastore, 2005). It is active against both Gram-
positive and Gram-negative food-spoilage bacteria but also shows antimutagenic effect
(Cerrutti et al., 1997; Keshava et al., 1998; Fitzgerald et al., 2004; Fitzgerald et al., 2005).
The source of vanilla is the bean, or pod of the tropical Vanilla orchid (principally Vanilla
1 Based on the paper: Separation of synthetic vanillin at different pH onto polymeric adsorbent Sephabeads SP
206, by M. Zabkova, et all., Chemical Engineering and Processing, 45, 598-607 (2006)

104 CHAPTER 5
planifolia Andrews, syn. V. fragrans (Salisb. Ames) (Walton et al., 2003; Daugsch and
Pastore, 2005). Vanillin occurs also in other plants, including commercial products such as
tobacco (Makkar and Becker, 1994); however, the pods of the Vanilla orchid still remain the
greatest commercial source of natural vanillin. In addition to vanillin, natural vanilla contains
a large number of other organic compounds. About 200 of these constituents have so far been
identified, of which only 26 occur in concentrations greater than 1 ppm (Anklam et al., 1997).
The five most important constituents are vanillin itself (2-2.8%), p-hydroxybenzaldehyde
(about 0.2%), vanillic acid (about 0.2%), p-hydroxybenzylmethyl ether (about 0.02%) and
acetic acid (about 0.02%) (Klimes and Lamparsky, 1977; Anklam and Muller, 1993).
Natural vanillin is mainly obtained after process of ageing by an alcoholic extraction of
vanilla pods and industrial one is obtained by chemical synthesis from guaiacol or black
liquors from the paper industry (Forss et al., 1986). The world market consists of around 1800
tons of pods, industrial vanillin is around 12,000 tons and a market price is bellowing $15 per
kg, while the market price of natural vanillin is approximately $1200-$4000 per kg
(Lomascolo et al., 1999; Muheim and Lerch, 1999).
The main part of vanillin production is formed by oxidation of sulfite liquor, which is a side
product of the wood pulping process. Vanillin is presented in oxidizing solution as a sodium
salt of vanillin and its isolation can be provided by acidification of the liquor with subsequent
extraction (Hibbert and Tomlinson, 1937). Disadvantage of this method is that a large amount
of acidic solution is needed for neutralization and also the precipitation of the lignin makes
this process more complicated. Another method used is extraction of sodium vanillate from
the alkaline solution by alcohols (Sandborn et al., 1936). The limited solubility of sodium
vanillate in organic solvents is weak point in this case.
The goals of the chapter were to determine adsorption equilibrium isotherms of vanillin onto
nonionic polymeric adsorbent Sephabeads SP206 at different temperatures (293 K, 310 K,
and 333 K) and to evaluate adsorption kinetics in fixed-bed. The fixed-bed breakthrough
curves of vanillin onto polymeric resin SP206 at different flow rates, feed concentrations, and
at different temperatures have been studied. Influence of concentration of sodium hydroxide
on adsorption of vanillin using static and dynamic approach has been investigated.
Clean Technologies for the Purification of Wastewaters: Adsorptive Parametric Pumping

Separation of synthetic vanillin at different pH onto Sephabeads SP206 105
5.2 Experimental part
5.2.1 Chemicals and adsorbents
Vanillin (C H O8 8 3) and sodium hydroxide (NaOH) were purchased from Sigma-Aldrich
(Spain). The solutions of vanillin and sodium hydroxide were prepared with degassed and
deionised water. The adsorption of vanillin from aqueous solutions by using non-ionic
polymeric resin Sephabeads SP206 (Mitsubishi Chemical Corporation) was carried out
purchased from Residion (Italy). The physical characteristics of polymeric resin SP206
provided by the manufacturer are summarized in Table 5.1.
Table 5.1 Physical and chemical properties of the polymeric adsorbent Sephabeads SP206
Color and physical form Yellowish brown opaque spherical beads
Density of wet adsorbent (kg m-3 ) 1190
Moisture content at delivery (%) 50.0
-1Pore volume (mL g ) 1.02
5.2.2 Equipment
The batch adsorption experiments by using Erlenmeyer flasks with the jacket were performed,
which were placed in shaking mixer (GLF-3018, Germany). The temperature was controlled
using thermostatic bath (Edmund Bühler, Germany). The solution was analyzed on UV-VIS
spectrophotometer Jasco (model 7800, Japan) at the wavelength 254, 259 and 376 nm. The
fixed bed adsorption studies were performed in glass column with the jacket (150 × 20 mm,
Surface area (m2 -1g ) 556
Pore radius (Å) 100-150
Particle size range (mm) 0.25-0.6
Particle size used in experiment (mm) 0.4
Porosity of the particle 0.61
Operating pH range 0-14
Clean Technologies for the Purification of Wastewaters: Adsorptive Parametric Pumping

106 CHAPTER 5
I.D.). The vanillin solution was pumped to the system by peristaltic pump Watson-Marlow
(England).
5.2.3 Batch adsorption
Batch experiment has been carried out in two stages. The first stage of batch experiment
without sodium hydroxide has been realized in order to obtain the adsorption equilibrium
isotherm of vanillin onto adsorbent SP206. The adsorption equilibrium isotherm at three
different temperatures has been studied. The second stage of batch experiment has been
performed to study the influence of sodium hydroxide on adsorption of vanillin onto
adsorbent SP206. The batch experiment has been performed in 250 mL Erlenmeyer flasks
where 20 mL of vanillin solution with the same concentration and the different mass of the
wet adsorbent have been added. The mass of wet adsorbent was in the range 0.05 g to 1.5 g.
The humidity of the adsorbent SP206 was determined for each experiment as a difference
between weight of wet adsorbent and after drying at 150 °C. The initial concentrations of the
vanillin used in the first stage and in the second stage of batch experiment were 3.30×10⁻³mol
L-1 -3 -1 and 6.60×10 mol L , respectively. The concentrations of sodium hydroxide used were
1×10⁻³ -1 -3 -1mol L and 5×10 mol L . Solutions were prepared in degassed and deionized water.
Temperature was controlled by thermostatic bath. Equilibrium experiments at 293, 310 and
333 K for each adsorbent-vanillin and adsorbent/vanillin-sodium hydroxide system were
performed. The volumetric flasks were placed in a shaking mixer at constant speed 150 rpm.
The equilibrium in solid-liquid mixture has been reached approximately within 12 hours. The
solution was separated from the adsorbent and the final concentration of vanillin was
determined by measuring the absorbance using UV-VIS spectrophotometer. The absorbance
of the vanillin solution without sodium hydroxide was measured at wavelength of 254 nm.
The total concentration of vanillin and vanillate species was determined by measuring the
absorbance at the wavelength 259 nm, which is isobestic point. Additionally, the
concentration of vanillate was determined at the wavelength of 376 nm.
5.2.4 Fixed-bed adsorption
The fixed bed adsorption studies on the polymeric adsorbent SP206 were performed by the
same approach as was pointed out in previous section. The glass column with jacket (150 ×
20 mm, I.D.) has been used in all fixed-bed experiment and solutions have been delivered by
Clean Technologies for the Purification of Wastewaters: Adsorptive Parametric Pumping

Separation of synthetic vanillin at different pH onto Sephabeads SP206 107
peristaltic pump. Fixed bed adsorption experiments of vanillin without the presence of sodium
hydroxide onto adsorbent SP206 were carried out at three different temperatures 293, 310 and
333 K. The temperature of the column was maintained by a thermostatic bath. Vanillin
concentration at the column outlet was determined at wavelength of 254 nm by an UV-VIS
spectrophotometer. Different runs by changing the flow rate (20, 30, 50 mL min-1),
concentration of vanillin in feed solution (3.30×10⁻³ -1 -4 -1 mol L and 0.66×10 mol L ) and the
temperature of the feed solution were carried out in the first stage.
In the second stage of experiment the influence of concentration of sodium hydroxide has
been investigated. For this purpose 1×10⁻³ -1mol L and 5×10⁻³ -1mol L as initial concentrations
of sodium hydroxide has been used. The concentration of vanillin and vanillate species in the
same manner as was pointed out in the batch adsorption studies part has been determined. The
total concentration of the feed solution was 8.25×10⁻³ -1 -3 -1mol L and 8.72×10 mol L . The
concentration of the vanillin species at the system adsorbent/vanillin-sodium hydroxide was
set as difference of total concentration (sum of concentration of vanillin and vanillate species)
and concentration of the sodium vanillate. Different runs by changing the flow rate (14 and 20
mL min-1), pH and the temperature of the feed solution were carried out in the second stage.
5.3
*
* *
Theoretical section
5.3.1 Adsorption equilibrium isotherms
The adsorption equilibrium isotherms from batch experiments of vanillin onto polymeric
adsorbent SP206 at three temperatures (293, 310 and 333 K) were evaluated. The isotherms of
vanillin were measured by static method batch equilibration of a known mass of adsorbent
with a given volume of vanillin solution. After equilibrium in solution was reached the
concentration of vanillin was measured and the vanillin concentration adsorbed in the
resin was determined by mass balance. The amount of vanillin adsorbed onto adsorbent q
C
q
(mol g-1 of dry resin) was found from the initial and final concentration in the liquid phase.
Mass balance in static system is given
Clean Technologies for the Purification of Wastewaters: Adsorptive Parametric Pumping

108 CHAPTER 5
( )W
CCVq
*0* −
= 5.1
-1 where and (mol L0C *C ) are the initial and equilibrium concentrations of vanillin in liquid
phase, respectively (Diez et al., 1998), V the volume of the solution (L), and W the dry mass
(g) of the adsorbent. The equilibrium adsorption isotherms for each temperature were
measured in two parallel experiments to reduce experimental errors.
Adsorption equilibrium of vanillin onto polymeric resin SP206 without sodium hydroxide has
been described by Langmuir isotherm model. The Langmuir model is based on assumption
that adsorption occurs onto specific sites of a uniform energetic surface, without interactions
between adsorbed molecules and adsorption is confined to monolayer coverage (Ruthven,
1984) and is given
*
**
1 bCbCqq s +
= 5.2
where is the saturation capacity and b relates to the adsorption enthalpy given as sq
⎟⎠⎞
⎜⎝⎛ Δ
−= ∞ RTHbb exp 5.3
where ∞b is the pre-exponential factor of adsorption equilibrium constant, HΔ is heat of
adsorption, R is the gas constant and T is the temperature.
The heat of adsorption can be determined at given loading by Clapeyron equation (Snyder,
1969)
qTc
⎟⎠⎞
⎜⎝⎛
∂∂ ln
−=Δ
2RTH 5.4
The heat of adsorption at given loading was approximately calculated using integrated
Clapeyron relationship (Snyder, 1969).
R
TT
c
c
H
⎟⎟⎠
⎞⎜⎜⎝
⎛−
⎟⎟⎠
⎞⎜⎜⎝
⎛
≈Δ−
21
1
2
11
ln
5.5
Clean Technologies for the Purification of Wastewaters: Adsorptive Parametric Pumping

Separation of synthetic vanillin at different pH onto Sephabeads SP206 109
5.3.2 Adsorption equilibrium isotherm in the presence of sodium hydroxide
The effect of sodium hydroxide on the adsorption equilibrium of vanillin onto polymeric resin
SP206 has been studied.
The reaction taking place in the liquid phase in static system between vanillin and sodium
hydroxide is the following
OHOHCOHOHC 2378388 +⇔+ −− 5.6
The equilibrium constant of the reaction is given as
]][[][
388
378−
−
=OHOHC
OHCKeq 5.7
It is well known that there is no adsorption of sodium salt of phenolic compounds onto
nonionic polymeric resin (Garcia et al., 2002). Therefore, vanillate as a sodium salt of vanillin
was considered as non-adsorbed compounds, which allows studying the effect of pH on the
adsorption equilibrium. Considering VNVT CCC = + , where is the total molar
concentration, is the concentration of vanillin and C is the vanillate concentration and
by combining equation (5.2) and (5.7) one can obtain the extended Langmuir equation
(Garcia et al., 2002), where the pH of solution is taken into account.
C
C
T
V VN
TpH
eq
TsV bCK
bCqq++
= −14101 5.8
where is molar concentration of vanillin in the solid phase, is the saturation capacity
and is the adsorption equilibrium constant, which was evaluated in previous experiment
without the presence of sodium hydroxide in solution.
Vq sq
b
5.3.3 Fixed-bed modeling
In order to study the adsorption behavior of the vanillin, sodium hydroxide onto SP206 in a
fixed-bed system, a dynamic model was used. This mathematical model comprises the mass
balance in the liquid phase, a linear driving force (LDF) for homogeneous particle and the
nonlinear adsorption isotherm. The model equations for an isothermal adsorption in a fixed
bed are as follows:
Clean Technologies for the Purification of Wastewaters: Adsorptive Parametric Pumping

110 CHAPTER 5
Mass balance of species “ ” in a bed volume element: i
...,3,2,1;),(1),(),(),(
2
2
=ℜ+∂
∂−−
∂∂
−∂
∂=
∂∂
it
tzqf
ztzC
uz
tzCD
ttzC
ii
hsi
ii
axi ρ
εε 5.9
εwhere is the axial dispersion coefficient, is the interstitial velocity, axD iu is the bed
porosity, is the axial position, t is the time variable, is the concentration in the bulk
fluid phase for the species (vanillin, vanillate, sodium hydroxide), q is the average adsorbed
phase concentration of species in the particle,
z Ci
i
ρ is the density of wet adsorbent and is the
dry particle to wet particle mass ratio. ℜ is the reaction term for homogenous reaction taking
place in the liquid phase around the homogeneous particle. For the vanillate and sodium
hydroxide species, the term
f h
i
tz,t
qi
∂∂ )(
C
=0 since they are not adsorbed onto the polymeric resin.
5.3.4 Kinetics of reaction vanillin/sodium hydroxide
The kinetics of reaction taking place between vanillin and sodium hydroxide is described by a
first order law on each species resulting in the overall rate law:
VNOHV CkCCkr 211 −= 5.10
where represents the velocity of vanillin disappearance, , 1r 1k 2k reaction rate constants and
, , OHC VNCV are the concentration of vanillin, sodium hydroxide and vanillate respectively.
The chemical reaction between vanillin and sodium hydroxide is very fast and the equilibrium
is established almost instantaneously. For the system under consideration, the equilibrium
constant for the vanillin reaction is 2
1
kkKeq = Table 5.2 and is shown in .
The intraparticle mass transfer has been approximated by linear driving force (LDF) as is
given:
[ ),(),(),( * tzqtzqkt
tzqiiLDF
i −=∂
∂ ] 5.11
where is the linear driving force kinetic coefficient, is the adsorbed phase
concentration in equilibrium with the bulk concentration at the certain time and q is the
average adsorbed phase concentration in the homogeneous adsorbent particle. Intraparticle
*iqLDFk
i
Clean Technologies for the Purification of Wastewaters: Adsorptive Parametric Pumping

Separation of synthetic vanillin at different pH onto Sephabeads SP206 111
mass transfer has been described by a linear driving force model, indicating that the rate of
adsorption into the particle is proportional to the driving force (difference between adsorbed
phase concentration in equilibrium with the bulk fluid concentration and average adsorbed
phase concentration in the particle) still required to reach equilibrium. The boundary
conditions for the mass balance equation are the Danckwerts boundary conditions:
( ) ( )( feediz
ax CtCuz
tzCD −=∂
∂
=,0,
0)0=z ; 5.12
( ) 0,=
∂∂
=LzztzC
; 5.13 Lz =
The associated initial conditions for the adsorption are:
( ) 00, =zCi 5.14
( ) 00, =zqi 5.15
The axial dispersion coefficient was obtained from the expression (Guiochon et al., 1994b)
ax
p
Ddu048.0 )Re011.02.0( =+ 5.16
ηερ pi du
=Rewhere .
The values of the calculated axial dispersion coefficient are shown in axD Table 5.4.
The linear driving force coefficient, for homogeneous particle, was estimated by (Eq.
5.17), (Glueckauf and Coates, 1947).
LDFk
Cqrf
Dk
phs
peLDF
ΔΔ
Ω=
2ρ 5.17
where is the effective pore diffusivity, is the radius of the particle of the adsorbent, peD pr Ω
is constant, which is equal to 15 for the spherical particles (Glueckauf and Coates, 1947) sρ
is the density of adsorbent, the dry particle to wet particle mass ratio and ⎟⎠⎞
⎜⎝⎛
ΔCqΔ
hf the slope
of the equilibrium isotherm.
Clean Technologies for the Purification of Wastewaters: Adsorptive Parametric Pumping

112 CHAPTER 5
τε mp
pe
DD =The effective pore diffusivity , where is the molecular diffusivity of vanillin
in water,
mD
τ =2 is the tortuosity of the adsorbent and pε its porosity. Molecular
diffusivities, (cm2 -1D sm ), of vanillin at different temperatures are estimated by the Wilke-
Chang estimation method (Reid et al., 1987).
6.08104.7
mm V
MTD
ηφ−×= 5.18
where is molecular weight of solvent (g mol-1), M φ is association factor of solvent, which
account for solute-solvent interactions and was set equal to 2.6 for water (Reid et al., 1987),
T is absolute temperature (K), η is viscosity of solvent (cP), V molar volume of solute at its
normal boiling temperature is 142.64 (cm
m
3 -1mol ).
The model equations (Eqs.5.6-5.15) were solved with gPROMS (gPROMS, 2003). The
mathematical model involves a system of partial differential equations and algebraic
equations (PDAEs). The axial domain was discretized using orthogonal collocation method
on finite elements (OCFEM) over 50 elements with third order polynomials in each element.
The system of ordinary differential and algebraic equation (ODAEs) was integrated over time
using the DASOLV integrator implemented in gPROMS. The model can predict breakthrough
and desorption curves that can be compared with those obtained experimentally.
5.4 Results and discussion
5.4.1 Adsorption equilibrium isotherm
The equilibrium adsorption isotherms for vanillin onto nonionic polymeric resin SP206 have
been measured. The equilibrium adsorption isotherms of vanillin onto nonionic polymeric
resin SP206 have been measured and fitted with Langmuir isotherm equation. The heat of
adsorption of vanillin was calculated from experimental adsorption equilibrium data using
(Eq. 5.5) at constant loading. The average value is 29.2 kJ mol-1. It was also calculated after
fitting of equilibrium isotherm with Langmuir equation leading to a value of 28.5 kJ mol-1
which is independent of loading and is reported in Table 5.2.
Clean Technologies for the Purification of Wastewaters: Adsorptive Parametric Pumping

Separation of synthetic vanillin at different pH onto Sephabeads SP206 113
sqq*The loading is defined as . Based on this fact the saturation capacity of the resin has
been considered independent of temperature and in the process of evaluation of the isotherm
parameters it was set constant for all tested temperatures. Parameters of Langmuir model of
isotherm were evaluated by nonlinear fitting. As a minimization algorithm to improve
accuracy in the determination of the isotherm parameters Levenberg-Marquardt method was
used, which is incorporated in Origin 6.0 (Microcal Software, USA). The obtained
coefficients of Langmuir model of isotherm are reported in the Table 5.2.
Table 5.2 Langmuir isotherms parameters and equilibrium constant at the temperature 293, 310 and 333 K
( )HΔ− eqKsq ∞b b T
(K) (mol g-1) (L mol-1) (kJ mol-1) (L mol-1) (L mol-1)
293 4599.3 0.39×10⁷
310 1912.5 0.44×10⁷-4 -27.534×10 3.58×10 28.5
333 1116.5 0.49×10⁷
The experimental adsorbed concentrations as a function of liquid-phase concentration
corresponding to the vanillin adsorption onto SP206 at each of the temperatures involved are
shown in Figure 5.1. The obtained fittings using Langmuir model are shown in Figure 5.1 as
well.
Figure 5.1 Adsorption equilibrium isotherms fitted by the Langmuir equation for the vanillin
solution without sodium hydroxide onto polymeric resin SP206. Initial concentration of vanillin was 3.30×10⁻³ mol L-1 with the corresponding pH = 5.3
Clean Technologies for the Purification of Wastewaters: Adsorptive Parametric Pumping
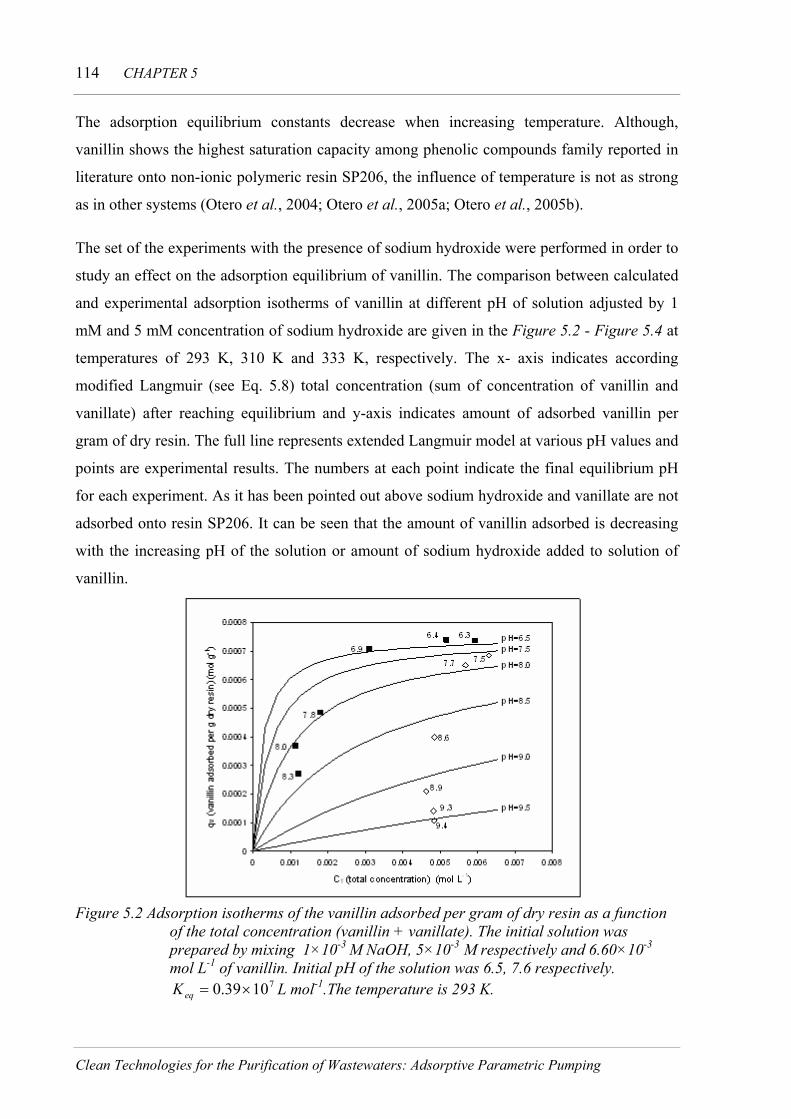
114 CHAPTER 5
The adsorption equilibrium constants decrease when increasing temperature. Although,
vanillin shows the highest saturation capacity among phenolic compounds family reported in
literature onto non-ionic polymeric resin SP206, the influence of temperature is not as strong
as in other systems (Otero et al., 2004; Otero et al., 2005a; Otero et al., 2005b).
The set of the experiments with the presence of sodium hydroxide were performed in order to
study an effect on the adsorption equilibrium of vanillin. The comparison between calculated
and experimental adsorption isotherms of vanillin at different pH of solution adjusted by 1
mM and 5 mM concentration of sodium hydroxide are given in the Figure 5.2 Figure 5.4 - at
temperatures of 293 K, 310 K and 333 K, respectively. The x- axis indicates according
modified Langmuir (see Eq. 5.8) total concentration (sum of concentration of vanillin and
vanillate) after reaching equilibrium and y-axis indicates amount of adsorbed vanillin per
gram of dry resin. The full line represents extended Langmuir model at various pH values and
points are experimental results. The numbers at each point indicate the final equilibrium pH
for each experiment. As it has been pointed out above sodium hydroxide and vanillate are not
adsorbed onto resin SP206. It can be seen that the amount of vanillin adsorbed is decreasing
with the increasing pH of the solution or amount of sodium hydroxide added to solution of
vanillin.
Figure 5.2 Adsorption isotherms of the vanillin adsorbed per gram of dry resin as a function
of the total concentration (vanillin + vanillate). The initial solution was prepared by mixing 1×10⁻³ M NaOH, 5×10⁻³ M respectively and 6.60×10⁻³ mol L-1 of vanillin. Initial pH of the solution was 6.5, 7.6 respectively.
L mol-171039.0 ×=eqK .The temperature is 293 K.
Clean Technologies for the Purification of Wastewaters: Adsorptive Parametric Pumping

Separation of synthetic vanillin at different pH onto Sephabeads SP206 115
Figure 5.3 Adsorption isotherms of the vanillin adsorbed per gram of dry resin as a function
of the total concentration (vanillin + vanillate). The initial solution was prepared by mixing 1×10⁻³ M NaOH, 5×10⁻³ M respectively and 6.60×10⁻³ mol L-1 vanillin. Initial pH of the solution was 6.5, 7.6 respectively.
L mol-171044.0 ×=eqK .The temperature is 310 K
Figure 5.4 Adsorption isotherms of the vanillin adsorbed per gram of dry resin as a function
of the total concentration (vanillin + vanillate). The initial solution was prepared by mixing 1×10⁻³ M NaOH, 5×10⁻³ M respectively and 6.60×10⁻³ mol L-1 vanillin. Initial pH of the solution was 6.5, 7.6 respectively. L mol-171049.0 ×=eqK .The temperature is 333 K
Clean Technologies for the Purification of Wastewaters: Adsorptive Parametric Pumping

116 CHAPTER 5
5.4.2 Fixed- bed adsorption
The fixed bed adsorption of vanillin was studied onto the polymeric resin SP206 on a
laboratory scale to investigate the influence of feed concentration of vanillin, temperature,
flow rate and pH on the process performance. The breakthrough curve experiments without
sodium hydroxide were performed under conditions reported in Table 5.3. The parameters of
mathematical model used to predict breakthrough curves are summarized in Table 5.3. The
calculated values of molecular diffusivity and kinetic coefficient are summarized in kLDF
Table 5.4.
Table 5.3 Experimental conditions for the fixed-bed adsorption of vanillin onto polymeric adsorbent Sephabeads SP 206.
feedVC , axDQ T pH Re (mL min-1 (K) ) (mmol L-1) (cm2 min-1)
293 0.622 1.830 310 0.893 1.815 30 0.66 333 1.311 1.797 293 1.037 3.015
5.8
310 1.489 2.984 50 0.66 333 2.185 2.947 293 0.415 1.229 310 0.596 1.221 20 3.30 333 0.874 1.211 293 0.622 1.830
5.3
310 0.893 1.815 30 3.30 333 1.311 1.797
Table 5.4 Calculated values of molecular diffusivity and for vanillin in absence of sodium hydroxide.
LDFk
feedVC , mD LDFk T (K) (mmol L-1) (cm2 min-1 (min-1) ) 293 4.44×10⁻⁴ 0.015
310 6.76×10⁻⁴ 0.027 0.66
333 10.80×10⁻⁴ 0.047
293 4.44×10⁻⁴ 0.034
310 6.76×10⁻⁴ 0.055 3.30
333 10.80×10⁻⁴ 0.085
Clean Technologies for the Purification of Wastewaters: Adsorptive Parametric Pumping

Separation of synthetic vanillin at different pH onto Sephabeads SP206 117
The experimental and theoretical transient concentration profiles for vanillin at the feed
concentration 6.60×10⁻⁴ -1mol L , and at the flow rate 30 mL min-1 and 50 mL min-1are
presented in Figure 5.5 Figure 5.6 and , respectively. The mathematical model used, which
involved linear driving force for the intraparticle mass transfer describes satisfactorily the
fixed-bed adsorption of vanillin onto Sephabeads SP206 at the temperatures considered. It can
be observed that lowering the flow-rate of the feeding leads to later breakthrough times.
Figure 5.5 Experimental and simulated adsorption curves of vanillin onto polymeric resin
SP206 at the temperature 293 K, 310 K and 333 K using column (150 x 20 mm, I.D.). (flow rate: 30 mL min-1 -4, feed concentration 6.60 10 mol L-1).
The predicted and experimental breakthrough curves for vanillin at the feed concentration
3.30×10⁻³ mol L-1 and at the flow rate 20 mL min-1 and 30 mL min-1 are shown in Figure 5.7
and Figure 5.8, respectively. In the calculation of the mass transfer coefficient kLDF, the slope
of the chord (Cq
ΔΔ ) was used instead of the local slope of the adsorption isotherm. It can be
observed that increasing the concentration, the derivative decreases and as a result the mass
transfer coefficient is higher. The external mass transfer resistance was neglected since Biot
number is always higher than 100. pepf DdkBi /=
Clean Technologies for the Purification of Wastewaters: Adsorptive Parametric Pumping

118 CHAPTER 5
Figure 5.6 Experimental and simulated adsorption curves of vanillin onto polymeric resin
SP206 by the temperature 293 K, 310 K and 333 K using column (150 x 20 mm, I.D.). (flow rate 50 mL min-1 -4, feed concentration 6.60 10 mol L-1)
Figure 5.7 Experimental and simulated adsorption curves of vanillin onto polymeric resin
SP206 by the temperature 293 K, 310 K and 333 K using column (150 x 20 mm, I.D.). (flow rate 20 mL min-1, feed concentration 3.30×10⁻³ mol L-1
Clean Technologies for the Purification of Wastewaters: Adsorptive Parametric Pumping

Separation of synthetic vanillin at different pH onto Sephabeads SP206 119
It should be pointed out that with increasing temperature of the system the saturation of the
bed occurs earlier at both tested concentrations of feed solution of vanillin (see Figure 5.5 -
Figure 5.8). Furthermore, the influence of temperature with increasing feed concentration is
decreasing and therefore the separation of vanillin is decreasing by the temperature of the
system.
The breakthrough curve experiments in the presence of sodium hydroxide were performed
under experimental conditions reported in Table 5.5. The parameters of mathematical model
used to predict concentration profiles of vanillin, vanillate and sodium hydroxide are
summarized in Table 5.5. The calculated values of molecular diffusivity and kinetic
coefficient are summarized in k LDF
Table 5.6.
Figure 5.8 Experimental and simulated adsorption curves of vanillin onto polymeric resin
SP206 by the temperature 293 K, 310 K and 333 K using column (150 x 20 mm, I.D.). (flowrate 30 mL min-1, feed concentration 3.30×10⁻³ mol L-1
Clean Technologies for the Purification of Wastewaters: Adsorptive Parametric Pumping

120 CHAPTER 5
Table 5.5 Experimental conditions for the fixed-bed adsorption of vanillin in presence of sodium hydroxide in feed solution
axD feedVC , feedTC , feedVNC ,Q T pH Re
(K) -1
Table 5.6 Calculated values of molecular diffusivity and for vanillin in presence of sodium hydroxide.
LDFk
feedVNC ,
(mmol L-1)
T
(K)
feedVC ,
(mmol L-1)
feedVC ,
(mmol L-1) pH
mD
(cm2 min-1)
LDFk
(min-1)
1.53 293 6.72 8.25 6.7 4.44×10⁻⁴ 0.050
1.51 310 6.74 8.25 6.6 6.76×10⁻⁴ 0.080
5.18 293 3.54 8.72 7.4 4.44×10⁻⁴ 0.055
5.15 310 3.57 8.72 7.5 6.76×10⁻⁴ 0.092
Figure 5.9 and Figure 5.10 show experimental and theoretical transient concentration profiles
for vanillin, vanillate and sodium hydroxide on the column (150 x 20 mm, I.D.) packed with
resin SP 206 at the total feed concentration 8.25×10⁻³ mol L-1 and at temperatures 293 K and
310 K, respectively.
(mLmin ) (cm2 min-1) -1 -1 -1(mmol L ) (mmol L ) (mmol L )
293 0.290 0.865 6.7 6.72 8.25 1.53 14
310 0.417 0.860 6.6 6.74 8.25 1.51
293 0.415 1.229 7.4 3.54 8.72 5.18 20
310 0.596 1.221 7.5 3.57 8.72 5.15
Clean Technologies for the Purification of Wastewaters: Adsorptive Parametric Pumping

Separation of synthetic vanillin at different pH onto Sephabeads SP206 121
Figure 5.9 Breakthrough curve of the vanillin. The y-axis is shown as a concentration of
vanillin, vanillate / total concentration. The feeding solution was prepared by mixing 1×10⁻³ M NaOH and 8.25×10⁻³ mol L-1 vanillin and pH was 6.7. The initial pH in the zero time was 6.1. The flow rate is 14 mL min-1, the temperature was 293 K. The points are showing experimental points full line demonstrates simulated curves
The predicted and experimental breakthrough curves for vanillin, vanillate and sodium
hydroxide at the total molar concentration 8.72×10⁻³ -1 mol L are shown in Figure 5.11 and
Figure 5.12 at temperatures 293 K and 310 K, respectively. By adding the sodium hydroxide
to the vanillin solution the sodium vanillate is formed according to the chemical reaction (see
Eq. 5.6).
The equilibrium constant of the reaction 21 kkKeq = was evaluated from a series of
experiments. The reaction is very fast and equilibrium is established instantaneously. The
kinetic constant was set as an adjustable parameter with the value L mol-1 -11k 6 min101× .
This value was kept constant in all simulations performed in the work.
Sodium hydroxide and sodium vanillate are not adsorbed onto non-ionic resin SP206 and they
are leaving at the time equal to the space time of the column. As soon as vanillin is removed
from the solution by the adsorbent the equilibrium described by (Eq. 5.6) is displaced to the
left side which leads to an increase of pH values. At a point the bed after saturation with
vanillin the pH must decrease again to the value of feed solution.
Clean Technologies for the Purification of Wastewaters: Adsorptive Parametric Pumping

122 CHAPTER 5
Figure 5.10 Breakthrough curve of the vanillin. The y-axis is shown as a concentration of
vanillin, vanillate / total concentration. The feeding solution was prepared by mixing 1×10⁻³ M NaOH and 8.25×10⁻³ mol L-1 vanillin and pH was 6.6. The initial pH at time zero was 6.1. The flow rate is 14 mL min-1, the temperature was 310 K. The points are showing experimental points, full line demonstrate simulated curves
Figure 5.11 Breakthrough curve of the vanillin. The y-axis is shown as a concentration of
vanillin, vanillate / total concentration. The feeding solution was prepared by mixing 5×10⁻³ M NaOH and 8.72×10⁻³ mol L-1 vanillin and pH was 7.4. The initial pH at the zero time was 6.1. The flow rate is 20 mL min-1, the temperature was 293 K. The points are showing experimental points, full line demonstrate simulated curves
Clean Technologies for the Purification of Wastewaters: Adsorptive Parametric Pumping

Separation of synthetic vanillin at different pH onto Sephabeads SP206 123
Figure 5.12 Breakthrough curve of the vanillin. The y-axis is shown as a concentration of
vanillin, vanillate / total concentration. The feeding mixture of 5×10⁻³ M NaOH and 8.72×10⁻³ mol L-1 vanillin and pH was 7.5. The initial pH was 6.1. The flow rate is 20 mL min-1, the temperature was 310 K
It can be seen that increasing the concentration of sodium hydroxide in the feed solution leads
to later breakthrough times of vanillin. The explanation is because of the coupling of
nonlinear adsorption of vanillin and reaction of vanillin with sodium hydroxide (Rodrigues,
1982).
The regeneration of the bed has been performed as well. For this purpose high concentration
of sodium hydroxide (0.1 M) has been used. The initial conditions of the bed before
regeneration is summarized in Table 5.5 (see condition for flow rate 14 mL min-1, 293 K).
Regeneration of the bed is presented in Figure 5.13. Reaction of vanillin and sodium
hydroxide is very fast and once sodium hydroxide breaks the bed of adsorbent vanillate as a
product of reaction is formed and vanillin is vanished from the outlet of the bed. After this
short time period the diffusion of vanillate in the pores of adsorbent and diffusive and
convective effect in the fixed-bed will carry on the process of regeneration.
Clean Technologies for the Purification of Wastewaters: Adsorptive Parametric Pumping

124 CHAPTER 5
Figure 5.13 The regeneration of polymeric adsorbent SP 206 saturated with the solution of
vanillin and sodium hydroxide at the experimental conditions reported in the Table 5.5 (see condition for flow rate 14 mL min-1, 293 K) was achieved by using 0.1 M sodium hydroxide. The used flowrate of regeneration was 5 mL min-1
5.5 Conclusions
Adsorption of vanillin onto non-ionic polymeric resins Sephabeads SP206 at different
temperatures and concentration of sodium hydroxide were studied. Batch experiments were
carried out in order to obtain adsorption equilibrium isotherms at temperatures 293, 310, 333
K. The adsorption equilibrium isotherms are nonlinear in the investigated concentration range
and described by Langmuir model. Saturation capacity of Sephabeads SP206 was found to be
independent of the temperature. Furthermore, the impact of sodium hydroxide on the
adsorption of vanillin was investigated. For this purpose the modified Langmuir model of
isotherm has been applied. Increasing concentration of sodium hydroxide higher than 1 M has
significantly reduced the adsorbed amount of the vanillin onto polymeric adsorbent SP206.
The fixed-bed adsorption of vanillin onto polymeric resin SP206 at different flow rates, feed
concentrations, and at different temperatures has been studied. The influence of concentration
of sodium hydroxide on adsorption of vanillin in fixed-bed operation has been investigated.
The mathematical model including linear driving force for intraparticle mass transfer and
reaction in liquid phase for system vanillin/sodium hydroxide satisfactorily predicts all
dynamic adsorption experiments in column.
Clean Technologies for the Purification of Wastewaters: Adsorptive Parametric Pumping

Separation of synthetic vanillin at different pH onto Sephabeads SP206 125
5.6 Nomenclature
b adsorption equilibrium constants (L mol-1)
∞b pré-exponencial factor (L mol-1)
Bi Biot number (-)
*C bulk liquid phase concentration (mol L-1)
0C initial concentration in batch system (mol L-1)
feed concentration (mol L-1) feedC
-1iC concentration in the bulk fluid phase (mol L )
OHC molar concentration of sodium hydroxide (mol L-1)
TC total molar concentration as a sum of concentration of vanillin ( ) and vanillate
( ) (mol L
VC-1
VNC )
VC molar concentration of vanillin (mol L-1)
VNC molar concentration of vanillate (mol L-1)
diameter of the column (m) D
axD axial dispersion coefficient (m2 -1 s )
mD molecular diffusivity (m2 -1 s )
diameter of the particle of the adsorbent (m) pd
peD effective pore diffusivity (m2 −1 min )
hf dry particle to wet particle mass ratio (g dry adsorbent /g adsorbent)
-1 heat of adsorption (J mol ) HΔ−
-1 -11k reaction rate constant (L mol s )
2k reaction rate constant (s-1)
equilibrium constant of the reaction (L mol-1) eqK
Clean Technologies for the Purification of Wastewaters: Adsorptive Parametric Pumping

126 CHAPTER 5
external mass transfer coefficient (m s-1) fk
LDFk linear driving force kinetic coefficient (min-1)
length of the bed (m) L
molecular weight of the solute (g mol-1) M
Q flow rate (m3 s-1)
-1 average adsorbed phase concentration in the homogeneous particle (mol g ) q
*q equilibrium adsorbed concentration (mol g-1 of dry resin)
iq average adsorbed phase concentration in the particle (mol g-1of dry resin)
-1sq saturation capacity of the adsorbent (mol g )
vq molar concentration of vanillin in the solid phase (mol g-1of dry resin)
Cq ΔΔ slope of the equilibrium isotherm
-1R gas constant (J mol K-1)
Re Reynolds number (-)
1r velocity of vanillin disappearance (s)
radius of the particle of the adsorbent (m) pr
temperature (K) T
t time variable (s)
iu intersticial velocity (m s-1)
V volume of solution (L)
mV molar volume of solute a at its normal boiling temperature (m3 −1 mol )
W dry weight of adsorbent (g)
axial variable (m) z
Greek letters
ε bed porosity (-)
Clean Technologies for the Purification of Wastewaters: Adsorptive Parametric Pumping

Separation of synthetic vanillin at different pH onto Sephabeads SP206 127
porosity of the adsorbent (-) pε
φ dimensionless association factor of solvent B
η viscosity of the solvent (cP)
-3ρ fluid density (kg m )
-3 density of the solid (kg m ) sρ
LDF factor, which is equal to 3, 8 or 15 for slab, cylindrical or spherical geometry Ω
sqq*Θ loading defined as (-)
τ bed tortuosity (-)
reaction law for species “ i ” iℜ
5.7 References
Anklam, E., Gaglione, S. and Muller, A., Oxidation behaviour of vanillin in dairy products.
Food Chemistry, 60 (1), 43-51 (1997).
Anklam, E. and Muller, A., Supercritical-Fluid Extraction of Vanillin and Ethyl Vanillin from
European Commercially Available Vanilla Sugars. Deutsche Lebensmittel-Rundschau, 89
(11), 344-346 (1993).
Burri, J., Graf, M., Lambelet, P. and Loliger, J., Vanillin - More Than a Flavoring Agent - a
Potent Antioxidant. Journal of the Science of Food and Agriculture, 48 (1), 49-56 (1989).
Cerrutti, P., Alzamora, S. M. and Vidales, S. L., Vanillin as an antimicrobial for producing
shelf-stable strawberry puree. Journal of Food Science, 62 (3), 608-610 (1997).
Daugsch, A. and Pastore, G., Production of vanillin: A biotechnological opportunity. Quimica
Nova, 28 (4), 642-645 (2005).
Diez, S., Leitao, A., Ferreira, L. and Rodrigues, A., Adsorption of phenylalanine onto
polymeric resins: equilibrium, kinetics and operation of a parametric pumping unit.
Separation and Purification Technology, 13 (1), 25-35 (1998).
Clean Technologies for the Purification of Wastewaters: Adsorptive Parametric Pumping

128 CHAPTER 5
Fitzgerald, D. J., Stratford, M., Gasson, M. J. and Narbad, A., The potential application of
vanillin in preventing yeast spoilage of soft drinks and fruit juices. Journal of Food
Protection, 67 (2), 391-395 (2004).
Fitzgerald, D. J., Stratford, M., Gasson, M. J. and Narbad, A., Structure-function analysis of
the vanillin molecule and its antifungal properties. Journal of Agricultural and Food
Chemistry, 53 (5), 1769-1775 (2005).
Forss, K. G., Talka, E. T. and Fremer, K. E., Isolation of Vanillin from Alkaline Oxidized
Spent Sulfite Liquor. Industrial & Engineering Chemistry Product Research and
Development, 25 (1), 103-108 (1986).
Garcia, A., Silva, J., Ferreira, L., Leitão, A. and Rodrigues, A., Regeneration of Fixed-Bed
Adsorbers Saturated with Single and Binary Mixtures of Phenol and m-Cresol. Industrial
Engineering Chemistry Research, 41 (24), 6165-6174 (2002).
Glueckauf, E. and Coates, J. I., Theory of Chromatography .4. The Influence of Incomplete
Equilibrium on the Front Boundary of Chromatograms and on the Effectiveness of
Separation. Journal of the Chemical Society, (OCT), 1315-1321 (1947).
gPROMS, gPROMS v2.2 User Guide.Process System Enterprise Ltd. (2003).
Guiochon, G., Shirazi, S. G. and Katti, A. M., Fundamentals of preparative and nonlinear
chromatography. Academic press, Boston, 1994.
Hibbert, H. and Tomlinson, G. H. J., "United states Patent". 2069 185, Jan. 26, 1937, 1937.
Hocking, M., Vanillin: Synthetic flavoring from spent sulfite liquor. Journal of Chemical
Education, 74 (12), 1384-1384 (1997).
Keshava, C., Keshava, N., Ong, T. M. and Nath, J., Protective effect of vanillin on radiation-
induced micronuclei and chromosomal aberrations in V79 cells. Mutation Research-
Fundamental and Molecular Mechanisms of Mutagenesis, 397 (2), 149-159 (1998).
Klimes, I. and Lamparsky, D., Headspace Techniques Utilized for Detection of Volatile
Flavor Compounds of Vanilla Bean. Abstracts of Papers of the American Chemical Society,
174 (SEP), 17-17 (1977).
Krueger, D. A. and Krueger, H. W., Carbon Isotopes in Vanillin and the Detection of
Falsified Natural Vanillin. Journal of Agricultural and Food Chemistry, 31 (6), 1265-1268
(1983).
Clean Technologies for the Purification of Wastewaters: Adsorptive Parametric Pumping

Separation of synthetic vanillin at different pH onto Sephabeads SP206 129
Lomascolo, A., Lesage-Meessen, L., Labat, M., Navarro, D., Delattre, M. and Asther, M.,
Enhanced benzaldehyde formation by a monokaryotic strain of Pycnoporus cinnabarinus
using a selective solid adsorbent in the culture medium. Canadian Journal of Microbiology,
45 (8), 653-657 (1999).
Makkar, H. P. S. and Becker, K., Isolation of Tannins from Leaves of Some Trees and Shrubs
and Their Properties. Journal of Agricultural and Food Chemistry, 42 (3), 731-734 (1994).
Muheim, A. and Lerch, K., Towards a high-yield bioconversion of ferulic acid to vanillin.
Applied Microbiology and Biotechnology, 51 (4), 456-461 (1999).
Otero, M., Zabkova, M., Grande, C. A. and Rodrigues, A. E., Fixed-Bed Adsorption of
Salicylic Acid onto Polymeric Adsorbents and Activated Charcoal. Industrial Engineering
Chemistry Research, 44 (4), 927-936 (2004).
Otero, M., Zabkova, M. and Rodrigues, A. E., Adsorptive purification of phenol wastewaters:
Experimental basis and operation of a parametric pumping unit. Chemical Engineering
Journal, 110, 101-111 (2005a).
Otero, M., Zabkova, M. and Rodrigues, A. E., Phenolic wastewaters purification by thermal
parametric pumping: Modeling and pilot-scale experiments. Water Research, 39, 3467-3478
(2005b).
Reid, R., C., Prausnitz, J., M. and Poling, B., E., Properties of gas and liquids. McGraw/Hill,
New York, 1987.
Rodrigues, A. E., "Nonlinear Adsorption, Reaction, Diffusion and Convection Phenomena in
Flow Systems" in Residence Time Distribution Theory in Chemical Engineering, A. Petho
and R. Noble, eds. Verlag Chemie GmbH, Weinheim, Germany, 1982.
Ruthven, D. M., Principles of Adsorption and Adsorption ProcessesNew York, 1984.
Sandborn, L. R., Salvesen, J. R. and Howard, G. C., "U. S. Patent". 2,057,117, 1936.
Snyder, C. F., Experimental Equilibrium Adsorption Capacity and calculated isosteric Heat of
adsorption for Ethane-Columbia NXC 8´10 Activated Carbon. Chem. Eng. Prog. Symp. Ser.,
65, 57 (1969).
Walton, N. J., Mayer, M. J. and Narbad, A., Molecules of interest - Vanillin. Phytochemistry,
63 (5), 505-515 (2003).
Clean Technologies for the Purification of Wastewaters: Adsorptive Parametric Pumping

130 CHAPTER 5
Clean Technologies for the Purification of Wastewaters: Adsorptive Parametric Pumping
Walton, N. J., Narbad, A., Faulds, C. B. and Williamson, G., Novel approaches to the
biosynthesis of vanillin. Current Opinion in Biotechnology, 11 (5), 490-496 (2000).


6. Recovery of vanillin from lignin/vanillin mixture by
using tubular ceramic ultrafiltration membranes
6.1 Introduction
Since the late sixties membrane filtration processes have found industrial applications and
started to compete with processes like distillation, evaporation or extraction. Membranes take
advantage of their physical and chemical stability, reproducible performance, selectivity and
high surface area per unit volume (Charcosset, 2006). They have broad applications in the
wastewater treatment, food processing, biotechnology and pharmaceutical industry for the
concentration of solutions and size-selective separation of large molecules from low
molecular weight species. (Sondhi et al., 2003).
Membrane filtration processes are pressure-driven separation techniques generally classified
according to the size of particles retained by the membrane. The main categories of
membranes cover microfiltration, ultrafiltration, nanofiltration and RO with the range of pore
size from 2 μm to 0.5 nm. Microfiltration membranes have pores with size in the range from
50 nm to 2 μm and operating pressures below 2 bars and are mostly used to separate particles
and bacteria from the solution. Ultrafiltration membranes have pore size between 50 nm to 2
nm and operating pressure difference between 1 and 10 bar. Ultrafiltration membranes retain
highmolecular-mass solutes (polymers, proteins, colloids) and small molecules like water,

132 CHAPTER 6
salts can pass through. Ultrafiltration is utilized for the concentration of macromolecular
species such proteins, polysaccharides, various polymers and the elimination of macrosolutes
from effluents or in water for industrial or medical applications.
Nanofiltration membranes have pore size between 0.5 nm and 2 nm and operating pressures
(transmembrane pressure) between 5 and 40 bars. The main utilization of these membranes is
in sugar separation, separation of multivalent from monovalent salts for selective
demineralization and concentration of organic compounds with low molecular weight.
There are already several papers about the treatability of Kraft pulp liquors using
ultrafiltration process (Nuortila-Jokinen and Nystrom, 1996; Keyoumu et al., 2004; Dafinov
et al., 2005; Wallberg et al., 2005; Wallberg and Jonsson, 2006). The Kraft pulp liquor
coming from paper industry is a waste which must be treated before disposal. On the other
hand, organic compounds present in liquors, especially lignin, is a very useful raw material
from which many valuable substances or materials can be produced, such as: vanillin, vanillic
acid, dispersing agents, synthetic tannins, polymer filter sand binding agents, active carbon,
ion-exchanger, etc. The main purpose of lignin removal from the liquor is to separate the
cooking chemicals, NaOH and Na2S to avoid losses of these chemicals from the mill
(Wallberg et al., 2005). The processes used for lignin removal are precipitation and
ultrafiltration. Fractionation of the cooking liquor from Kraft and sulphite pulps by
ultrafiltration has been studied for thirty years (Jokela and Salkinojasalonen, 1992; Carlsson
et al., 1998; Gilarranz et al., 1998). In most of the applications the objective of ultrafiltration
process was to purify the lignin fraction in order to use it as a fuel or valuable product.
In the process of Kraft lignin oxidation to produce vanillin the reaction media contains
degraded molecules of lignin and sodium salt of vanillin (vanillate) and other species. The
isolation of vanillate from the oxidized solution is an important stage in the vanillin
production. During the ultrafiltration process vanillin goes to the permeate stream because of
its low molecular weight. The lignin as a macromolecule stays in the retentante and its
concentration significantly increased during the batch ultrafiltration process. Therefore, the
ultrafiltration technique can be used as a first step in the process of recovery of vanillin from
Kraft lignin oxidation.
The main goal of the work presented in this chapter was to study the membrane ultrafiltration
process particularly focused on the recovery of vanillin from Kraft lignin oxidation media.
Clean Technologies for the Purification of Wastewaters: Adsorptive Parametric Pumping
Recovery of vanillin from lignin/vanillin mixture by using ultrafiltration 133
For this purpose tubular ceramic membranes Kerasep supplied by Orelis, France with
molecular weight cut-off of 15 kDa, 50 kDa and Filtanium membranes with molecular weight
cut-off of 1 kDa, 5 kDa supplied by Tami Industries, France were used. The influence of the
lignin and vanillin concentration and pH of the mixture on the ultrafiltration process has been
studied as well.
6.2
M
Experimental part
6.2.1 Chemicals and methods
Vanillin (C8H O8 3, purity >=98 %), pellets of sodium hydroxide (NaOH, purity >=98 %), and
lignin alkali were used in experimental work. Lignin alkali used has an average molecular
weight = 60000 g/mol and the amount of sulfur total impurities was 9 wt % according to
the supplier Sigma-Aldrich. Hydrochloric acid at concentration 1 M was used for acidification
of the samples. All chemicals were supplied by Sigma Aldrich.
w
The mixtures of vanillin and lignin and sodium hydroxide were prepared with degassed and
deionised water with conductivity value lower than 1 µS/cm. The pH of the mixture was
adjusted by adding NaOH solution.
The vanillin and lignin concentration was measured by UV-VIS spectrophotometer Jasco
(model 7800, Japan) after pretreatment of the samples.
The samples were acidified by concentrated hydrochloric acid to precipitate high molecular
weight components (lignin). The precipitated solid was separated by centrifugation during 15
minutes at 5000 rpm. The supernatant was separated from the precipitated solid, diluted in
deionised water and analyzed by UV spectrophotometer for vanillin content at the wavelength
of 259 nm (Fargues et al., 1996).
The precipitated solid was diluted in 2 N solution of sodium hydroxide in order to dissolve the
lignin content. The amount of lignin was measured by UV spectrophotometer at the
wavelength of 280 nm (Rojas et al., 2006). Due to inclusion of vanillin inside the lignin
precipitate (Fargues et al., 1996), the calibration samples were treated by the same technique
as above.
Clean Technologies for the Purification of Wastewaters: Adsorptive Parametric Pumping

134 CHAPTER 6
6.2.2 Equipment and experimental set-up
All experiments have been performed by using the experimental set-up shown in Figure 6.1.
It consists of a feed tank, peristaltic pump (Watson-Marlow, England), damper, and
ultrafiltration unit (Orelis, France). The membranes used in experiments were Kerasep
membranes with molecular weight cut-off (molecular weight at which the membrane rejects
90 % of solute molecules) of 15 kDa, and 50 kDa supplied by Orelis, France and Filtanium
membranes with molecular weight cut-off of 1 kDa, 5 kDa supplied by Tami Industries,
France. Kerasep membranes were made of Al O -TiO2 3 2 active layer on the ceramic support,
with the service differential pressure of 0-4 bars and resistant to pH 0-14. The total membrane
area was 0.008m2; length was 400mm, inside diameter 6 mm and outside diameter 10 mm.
Filtanium membranes for fine ultrafiltration were made of TiO2 active layer on the ceramic
support, with the operating differential pressure of 0-10 bars and resistant to pH 2-14. The
membranes with cut-off below 15 KDa are usually called fine ultrafiltration membranes. In
another literature sources are defined as nanofiltration membranes. The supplier’s used term
is “fine” ultrafiltration membranes.
The complete ultrafiltration experimental set-up is shown in Figure 6.1 a and ceramic
membranes are shown in Figure 6.1 b.
Figure 6.1 Ultrafiltration setup installed in the laboratory (a) and ceramic membranes (b) used in experiments
Clean Technologies for the Purification of Wastewaters: Adsorptive Parametric Pumping

Recovery of vanillin from lignin/vanillin mixture by using ultrafiltration 135
Figure 6.2 Scheme of the experimental set-up for batch ultrafiltration
1-tank with feed mixture; 2-peristaltic pump; 3-damper; 4-membrane module;5-membrane 6-tank with permeate solution; 7-circulating valve: P -pressure gauge inlet, P1 2-pressure gauge outlet, Q - feed flowrate , Qfeed P- permeate flowrate , Q - retentante flowrate r
6.2.3 Measurement of water flux through membrane
The pure water permeate flowrate was measured for each membrane prior to starting
experiments in order to obtain the water flux at different transmembrane pressure and to
determine the membrane resistance ( ). Water flowrate in the permeate side was measured
at different pressures which were adjusted by a recirculation valve on the system starting from
the lowest to the highest pressure and vice versa. The value of the membrane resistance was
also used as an indicator of the membrane cleaning effectiveness.
mR
PΔ PΔ
The values measured during the experiment were: -Retentante flow rate (L h-1rQ ) -
Permeate flow rate (L h
pQ
-1), - Relative inlet pressure on the feed side (bar) -Relative
outlet pressure on the retentante side (bar)
1 2
T -Temperature (ºC).
The average water permeate flux is the flow of water divided by the surface area of the
membrane and calculated as:
m
p
AQ
J = 6.1
where is permeate flux at time t (L h-1J m-2) and is membrane surface area (m2mA ). The
water permeate flux was measured at different average transmembrane pressures at 25 ºC.
Clean Technologies for the Purification of Wastewaters: Adsorptive Parametric Pumping

136 CHAPTER 6
The average transmembrane pressure (bar) was calculated by PΔ
221 PP
PΔ+Δ
=Δ 6.2
where is the relative pressure at the inlet of the membrane module (bar), is the
relative pressure at the outlet of the membrane module (retentante side) (bar). Pure water
permeate flux data are used to evaluate the membrane hydraulic resistance ( according to
Darcy’s law:
1PΔ 2PΔ
)Rm
mRPJ
0ηΔ
= 6.3
where is the solvent viscosity (Pa.s). 0η
6.2.4 Membrane cleaning after experiments
The retained molecules accumulate on the membrane surface leading to the decrease of the
membrane performance and periodically cleaning of the membrane must be carried out after
each run.
The lignin solubility increases with increasing pH. If deionised water is used ( pH = 6.1),
some lignin can precipitate with lowering the pH and thus block the membrane. Therefore,
0.1-0.2M NaOH solution was used to clean the membrane after each experiment. In the first
step of the cleaning procedure the membrane and feeding tubes were rinsed with solution of
NaOH without opening the circulation valve to remove residues inside the system; later on the
circulation valve was opened and the transmembrane pressure PΔ = 2.0 bar adjusted. By
“open the valve” was meant that there is permeate flow out of the membrane. This is the
expression used in literature but in fact to have permeate flow the valve must be closed.
The time of cleaning procedure was 5-6 hours. In the next step, the system was rinsed with
deionised water, to obtain neutral pH which was measured in the permeate and retentante
side. After each cleaning procedure the permeate flux of water was measured and compared
with the reference value.
Clean Technologies for the Purification of Wastewaters: Adsorptive Parametric Pumping

Recovery of vanillin from lignin/vanillin mixture by using ultrafiltration 137
6.2.5 Ultrafiltration of vanillin/lignin mixture
The experiments were performed by using the lab-scale experimental set-up shown in Figure
6.2. All experiments were carried out in the batch concentration mode. It is a commonly used
method where retentante is recirculated back to the feed tank and the permeate is withdrawn
to a separated reservoir. The lignin/ vanillin mixture was prepared in the feed tank with an
initial feed volume depending on the experiment (7 L, 5 L or 4 L). The studied composition of
the feed mixture were approximately 60 g/L lignin - 6 g/L of vanillin, 20 g/L of lignin - 2 g/L
of vanillin, 5 g /L of lignin -0.5 g/L of vanillin, and the pH tested was in the range 8.5 and
12.5.
Prior to starting the experiment, the feed tank was filled with 0.1 M solution of sodium
hydroxide and the whole system including the tubes was properly washed in order to remove
foreign bodies that membrane can contain. Subsequently, deionised water was passed through
the system and the experimental rig was ready for use. The pH of the mixture was adjusted
with 0.1 M NaOH. Then the system was filled with the feed solution and the feed flowrate
adjusted, which was kept constant during all the experiment duration. The experiment started
when the circulation valve was open and the average transmembrane pressure ( PΔ ) adjusted
to the value of 1.3 or 1.55 bars.
During the experiment the samples of permeate and retentante were collected and retentante
flowrate, permeate flowrate, Δ and 1P PΔ 2 were measured. After each experiment the final
volume of permeate withdrawn and the volume of concentrated solution in the feed tank was
measured and the volume reduction calculated:
0VV
VR p= 6.4
where is the permeate withdrawn volume and is the initial volume of the feed tank. 0VpV
6.2.6 Measurement of viscosity
Viscosity measurements were made with routine capillary viscosimeter Jenna-Glass Schott
Mainz (Germany). The viscosimeter has been designed in such a way that correction of
kinetic energy may be ignored when flow time exceeds 200 second. The solution at the
Clean Technologies for the Purification of Wastewaters: Adsorptive Parametric Pumping

138 CHAPTER 6
concentration 5, 20, 40, 60 and 80 g L-1 of lignin at pH=8.5 and 12.5 was prepared. The
viscosimeter was filled with the sample of lignin and the flow time between two marks
written on the viscosimeter was measured. The measurement was repeated three times for
each sample at the temperature 26 ºC. To evaluate the viscosity (Pa. s), the equation
002865.0=tK ×=η was used where the constant K . The viscosity determined for each
concentration of lignin was used to calculate the intrinsic viscosity [ ]η (L g-1).
6.3 Mathematical model
The membrane ultrafiltration is a size-exclusion based on pressure-driven process. The
important characteristics of ultrafiltration process are the volumetric flux (permeate flux) and
the rejection of the solutes by the membrane. The basic flux equation in a tubular membrane
may be expressed as:
mRPJ
ηΔ
= 6.5
where is the volumetric flux, ΔP is the transmembrane pressure (J pPzP −= )( ); where P(z)
is the pressure distribution along the flow channel and Pp is the permeate pressure of the shell
side. For the case of a perfectly mixed system, both pressures are assumed to be constant and
is the membrane hydraulic resistance. The term mR Rη m can be found as the thickness of
membrane to the permeability ratio and, then, the volumetric flux depends inversely upon the
thickness of the membrane. One of the major challenges with the modelling of ultrafiltration
process is the estimation of the decline of the flux with time.
Konieczny and Rafa (Konieczny and Rafa, 2000) have reported that the basic problems
involving the ultrafiltration of pressure membrane process are:
• flux decline driving the operation of system;
• efficiency of the process is becoming independent of transmembrane pressure (limiting
flux);
• fouling and concentration polarization leading to the reduction of efficiency of
membrane;
Clean Technologies for the Purification of Wastewaters: Adsorptive Parametric Pumping

Recovery of vanillin from lignin/vanillin mixture by using ultrafiltration 139
As it is, Eq.(6.5) does not include any phenomena accounting the lost of efficiency in the
filtration. These phenomena are the gel formation, the membrane polarization, the fouling of
the membrane, resulting from reversible or irreversible pore plugging, which are very
important in UF and need to be included in any detailed analysis.
Fouling is the accumulation of material on the surface or in the pores of the membrane. The
permeate flux decline caused by reversible fouling can be recovered by cleaning the
membrane with de-ionized water, whereas the flow decline caused by irreversible fouling can
be only recovered by replacing the membrane or cleaning it using chemical reagents (Van der
Bruggen et al., 2002). The irreversible case is more critical membrane pores are blocked by
the foulants or the foulants are adsorbed on the membrane surface (Speth et al., 1998).
As mentioned before, the rejection coefficient is also an important parameter to characterize
an UF membrane. The rejection represents a measure of the amount of solute retained by the
membrane. The most common definition of rejection is the observed rejection ( ) because
both permeate and concentrate solute concentration can be measured:
iobsR
bi
piiobs C
CR −= 1 6.6
where and are the permeate and the bulk concentration of the species “i”, in the feed
side of the membrane, respectively (Kovasin and Nordén, 1984). However, the observed
rejection can be taken as an approximation of the separation properties of the membrane. For
impermeable membrane, the rejection will be equal to 1.
biCpiC
There are other definitions of rejection, named intrinsic rejection ( ), when phenomena
leading to decline flux are taking place in UF processes, such as:
OR
• with concentration polarization
w
pO C
CR −= 1 6.7
where is the concentration of the rejected solute at the membrane surface. wC
• with gel formation,
Clean Technologies for the Purification of Wastewaters: Adsorptive Parametric Pumping

140 CHAPTER 6
g
pO C
CR −= 1 6.8
where is the gel concentration of the rejected solute. gC
Combining (Eq 6.6) and (Eq. 6.7) or (Eq. 6.6) and (Eq. 6.8), one can obtain the relation
between the observed and intrinsic rejection coefficients.
A variety of models for volumetric flux calculation have been reported in literature.
Cheng and Wu (Cheng and Wu, 2001) mentioned some used models for analysing the mean
volumetric flux of ultrafiltration: the gel-polarization model (Porter, 1972), the resistence-in-
series model (Yeh and Cheng, 1993), the osmotic pressure model (Nabetani et al., 1990), the
boundary layer model (Wijmans et al., 1985). In this work, the unsteady-state model of the
current ultrafiltration system is addressed using the osmotic pressure with polarization
concentration and gel layer controlled flux decline. Both models are explained below. The
osmotic pressure model is used only for one case when initial mixture of lignin and vanillin in
UF process is diluted in the feed tank.
6.3.1 Osmotic pressure and polarization layer controlled flux decline
The concentration polarization is a phenomenon in which the solute that is rejected by the
membrane accumulates on the membrane surface and then its concentration at surface is
higher than that in the bulk. Figure 6.3 shows a scheme of the polarization on membrane
surface. Since the flux of the species though the membrane is low, its concentration will build
up at the membrane wall and such build up will result in back diffusion of the solute into the
bulk fluid.
From Figure 6.3, the steady state mass balance for the membrane with polarization in the case
when rejection is not equal to 1 is:
ipi
i CJdz
dCDCJ ,=+ 6.9
0=zUsing the boundary conditions at wii CC = and bii CC = at polz δ= , the concentration
of the rejected species “i “ at the membrane wall ( ) can be calculated from the equation: Cwi
Clean Technologies for the Purification of Wastewaters: Adsorptive Parametric Pumping

Recovery of vanillin from lignin/vanillin mixture by using ultrafiltration 141
)/exp()1()/exp(
kJRRkJ
CC
OObi
wi
−+= 6.10
pol
Dδ
=where is the mass transfer coefficient (k ) ; polδ is thickness of polarization layer and
D is diffusivity of species within polarization layer.
Figure 6.3 Concentration polarisations in ultrafiltration (Kovasin and Nordén, 1984)
Concentration polarization may cause a lowering in flux due to an increase in osmotic
pressure difference across the membrane (Kozinski and Lightfoo.En, 1972). Therefore, the
equation for the volumetric flux considering concentration polarization and osmotic pressure
can be written as (Goldsmith, 1971):
mRPJη
πΔ−Δ= 6.11
where )()( piwi CC πππ −=Δ , η is the viscosity of the solution, is the hydraulic
membrane resistance and
mR
πΔ is the osmotic pressure.
The osmotic pressure can be measured directly or estimated from other thermodynamic
quantities. For the case of very diluted (and ideal) solutions, the van’t Hoff equation can be
useful to assume a linear dependence on concentration, as shown in Eq. 6.12.
Clean Technologies for the Purification of Wastewaters: Adsorptive Parametric Pumping

142 CHAPTER 6
6.12 CaC ')( =π
where is an empirically determined constant. The osmotic pressure for macromolecular
solution increases much faster than linearly and Eq.6.12 usually becomes a polynomial
function of the concentration.
'a
6.3.2 Gel layer controlled flux decline
In ultrafiltration, some rejected solutes can form gels, cakes or slimes at the membrane wall.
The gel layer model is based on the assumption that the concentration of the rejected solute on
the membrane cannot exceed a certain value, named gel concentration (Cg). At the beginning
of ultra-filtration only a polarization layer is taking place. After some time, gel concentration
can be reached and then the net solute flux does not lead to a further increase of the
concentration at the membrane surface; however, the thickness of the gel layer can change
(Zaidi and Kumar, 2005). Since the gel layer works as a porous solid which causes an
additional resistance to flow, the volumetric flux can be given by,
gmv RR
PJηη +
Δ= 6.13
where η is the viscosity of the solution, is the membrane resistance and is the
resistance due to the gel layer. The term
mR gR
gRη can be expressed as gg Kδ where gδ represents
the thickness of gel layer that can vary with time and is the permeability of the gel layer. K g
The value of can be obtained from the Kozeny-Carman equation (Wankat, 1991): gK
2
32
1150 )( g
gpg
dK
εηε−
= 6.14
where is particle diameter andpd gε is the porosity of gel layer. The gel permeability is very
sensitive to the particle diameter in the gel layer, as discussed in (Wankat, 1991). The lignin is
a very complex molecule and forms molecule associations which can affect the value of the
diameter of the particle to be considered in the estimation of and, consequently, the
hydraulic resistance of gel.
K g
Clean Technologies for the Purification of Wastewaters: Adsorptive Parametric Pumping

Recovery of vanillin from lignin/vanillin mixture by using ultrafiltration 143
The use of a gel layer model with variable diameter of the particle in bulk and a growing gel
layer includes a time-dependent hydrodynamic resistance to the flow ( ). Therefore, the
fitting parameter of this model is the gel resistance which is affected by operation conditions
(feed flow rate and concentration, pH), as seen later.
)(tRg
Governing Mass Balances Equations
Considering the system shown in Figure 6.3, the overall mass balance is
pm QJAdtVd
==−)( 6.15
where is the volume of the solution in the entire system (feed tank, pipes and UF
module) and is membrane area.
)(tV
mA
The mass balance of the species (i = lignin, vanillin) over the system can be written as,
pipfifrirfi CQCQCQ
dtVCd
−=−=)(
6.16
where is flow rate in stream n of the membrane module and is concentration of the
species “i” in the “n” stream. The subscripts f, r and p mean feed, retentante and permeate
stream, respectively, in the module of membrane. Eq.6.16 can be rewritten as:
nQ niC
)()(
pifipfi CC
VQ
dtCd
−= 6.17
The global and solute mass balances for the membrane module are,
6.18 prf QQQ +=
6.19 ppirriffi QCQCQC +=
The system is assumed as perfectly mixed, the concentration of the species in retentate is the
same as the bulk concentration (C ). The concentration of species i in the retentante or bulk
is:
bi
)( iobs
fibiri R
CCC
θ−==
1 6.20
Clean Technologies for the Purification of Wastewaters: Adsorptive Parametric Pumping
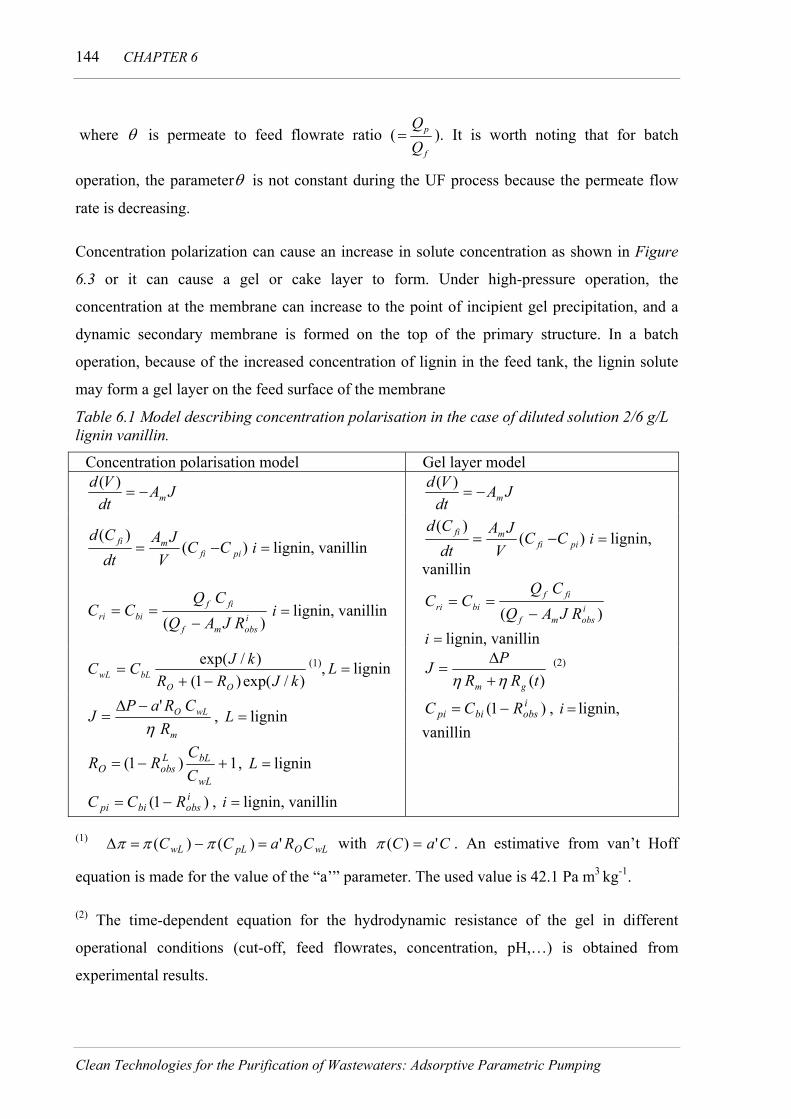
144 CHAPTER 6
f
p
=θ where is permeate to feed flowrate ratio ( ). It is worth noting that for batch
operation, the parameterθ is not constant during the UF process because the permeate flow
rate is decreasing.
Concentration polarization can cause an increase in solute concentration as shown in Figure
6.3 or it can cause a gel or cake layer to form. Under high-pressure operation, the
concentration at the membrane can increase to the point of incipient gel precipitation, and a
dynamic secondary membrane is formed on the top of the primary structure. In a batch
operation, because of the increased concentration of lignin in the feed tank, the lignin solute
may form a gel layer on the feed surface of the membrane
Table 6.1 Model describing concentration polarisation in the case of diluted solution 2/6 g/L lignin vanillin.
Concentration polarisation model Gel layer model
JAdtVd
m−=)( JA
dtVd
m−=)(
)()(
pifimfi CCV
JAdtCd
−=)()(
pifimfi CCV
JAdtCd
−= =i lignin,
vanillin lignin, vanillin =i
)( iobsmf
fifbiri RJAQ
CQCC
−==
)( iobsmf
fifbiri RJAQ
CQCC
−== lignin, vanillin =i
lignin, vanillin =i
)(tRRPJ
gm ηη +Δ
=)/exp()1(
)/exp(kJRR
kJCCOO
bLwL −+= (1) (2), lignin =L
m
wLO
RCRaP
Jη
'−Δ= )1( i
obsbipi RCC −= , lignin, vanillin
=i, lignin =L
1)1( +−=wL
bLLobsO C
CRR , lignin =L
)1( iobsbipi RCC −= , lignin, vanillin =i
(1) with wLOpLwL CRaCC ')()( =−=Δ πππ CaC ')( =π . An estimative from van’t Hoff
equation is made for the value of the “a’” parameter. The used value is 42.1 Pa m3 kg-1.
(2) The time-dependent equation for the hydrodynamic resistance of the gel in different
operational conditions (cut-off, feed flowrates, concentration, pH,…) is obtained from
experimental results.
Clean Technologies for the Purification of Wastewaters: Adsorptive Parametric Pumping

Recovery of vanillin from lignin/vanillin mixture by using ultrafiltration 145
6.4
)R
P
Results and discussion
6.4.1 Measurement of the water flux trough the membrane
-3The viscosity of water at 25 ºC is 0.891 ×10 kg m-1 s-1 and the value of the membrane
resistance ( obtained from experimental results was 2.806×10¹³ m-1m for1 kDa membrane,
1.222×10¹³ m-1 for 5 kDa and 2.806×10¹² m-1 for 15 kDa membrane. The permeate fluxes of
water as a function of transmembrane pressure (Δ ) for membranes of 1, 5 and 15 kDa are
shown in Figure 6.4.
0.0
1.0
2.0
3.0
4.0
5.0
6.0
7.0
0 50 100 150 200
ΔP (kPa)
J x1
0-5 (m
3 s-1
m-2
)
1KDa
5KDa
15KDa
Figure 6.4 Water permeate flux (m3 -1s m-2) through the membrane as a function of the transmembrane pressure ( PΔ ) (kPa). The membranes tested were 1, 5 and 15 kDa cut-offs. The surface area of each membrane is =S 0.008m2. Open system.
Figure 6.4As it is obvious from , with increasing the cut-off of the membrane the water flux is
higher. The cleaning efficiency is shown in Figure 6.5 where the water flux in the new
membranes and after each experiment/cleaning is reported.
Clean Technologies for the Purification of Wastewaters: Adsorptive Parametric Pumping

146 CHAPTER 6
0
50
100
150
200
250
300
350
0 1 2 3 4 5
Number of experiment
J (L
h-1m
-2)
15 kDa
5 kDa
1 kDa
Figure 6.5 Flux of water with the new membrane and after each experiment and subsequent cleaning. The membrane used was 15, 5 and 1 kDa. The cleaning was done by using 0.1M solution NaOH. The transmembrane pressure PΔ at which the flux was measured is 1.3 bar for membrane 15 kDa and 1.5 bar for membrane 1 and 5 kDa.
The use of 0.1 - 0.2 M NaOH as a cleaning agent seems to be acceptable. In the case of
membrane 1, 5 and 15 kDa after each experiment and subsequent cleaning the water flux
obtained was almost the same as with the “new” membranes.
6.4.2 Ultrafiltration of vanillin/lignin mixture
The intrinsic viscosity [ ]η characterize the capacity of the solute to increase the viscosity of
the solution and is defined as the limiting value of the specific viscosity/concentration ratio at
zero concentration and given by: [ ]csp
c
ηη
0lim→
= . The intrinsic viscosity is expressed in unit of
reciprocal concentration (L g-1). The specific viscosity is defined as: , where 00 )(η =sp η −η η
is the viscosity of the pure solvent and 0η η is the viscosity of the solution. The variation of
the viscosity number cspη
with concentration depends on the type of molecule as well as the
solvent. To obtain the intrinsic viscosity it is necessary to find the viscosity at different
concentrations and then extrapolate to zero concentration (infinite dilution). The intrinsic
viscosity [ ] -1η expressed in L g was obtained from extrapolation of experimental data. The
data were extrapolated in two ways to yield the intrinsic viscosity:
1) From viscosity number ( ( ) c00 /ηηη − ) versus concentration plot:,
Clean Technologies for the Purification of Wastewaters: Adsorptive Parametric Pumping

Recovery of vanillin from lignin/vanillin mixture by using ultrafiltration 147
( )[ ] c//ln 0ηη2) From a plot of ( ) versus concentration
The equations which are extrapolated to zero concentration are:
( ) [ ] [ ] cKc 2100 / ηηηηη +=− 6.21 a
( )[ ] [ ] [ ] cKc 220 //ln ηηηη += 6.21 b
where and are the constants (Albrecht, 1971). 1K 2K
The values of intrinsic viscosities obtained by extrapolation are slightly different. The value
of the intrinsic viscosity obtained from the extrapolation of data plotted as viscosity number
versus concentration was 0.00386 L g-1 and from data logarithmic viscosity number versus
concentration 0.00395 L g-1. The constants and are dimensionless with values of
2.345 and 1.167 for pH=8.5, respectively. The values of intrinsic viscosity determined from
the viscosity number plot were employed in future calculations of hydrodynamic radius of
molecule.
1K 2K
y = 1.83x10⁻⁵X+ 3.965x10⁻³
R2 = 0.859
y = 3.50 x10⁻⁵X + 3.864x10⁻³
R2 = 0.971
0
0.001
0.002
0.003
0.004
0.0050.006
0.007
0.008
0.009
0.01
0 20 40 60 80 100
concentration (g L-1)
(ln( η
/ η0 )
)/c
0
0.001
0.002
0.003
0.004
0.0050.006
0.007
0.008
0.009
0.01
( η- η
0 )/ η
0 c
[ ] c)ln( 0ηη (■) and Figure 6.6 Viscosity number cspη ( ) versus concentration of lignin solution (g L-1)
The hydrodynamic radius of the molecule of solubilised lignin was calculated according to
the Einstein viscosity relation (Bird et al., 1994) if the porous sphere particle model is used.
[ ] ⎟⎠⎞
⎜⎝⎛= 3
34025.0 e
A RMN
πη 6.22
which leads to:
Clean Technologies for the Purification of Wastewaters: Adsorptive Parametric Pumping

148 CHAPTER 6
[ ] 3/130
⎟⎟⎠
⎞⎜⎜⎝
⎛=
Ae N
MRπη 6.23
where is Avogadro’s number, [ ]ηAN is the intrinsic viscosity (L g-1), is molecular weight. M
The value of molecular weight used in the calculation was the average molecular weight of
lignin = 60000 g mol-1wM which is given by the supplier Sigma Aldrich. The hydrodynamic
radius obtained for lignin molecule in water solution at pH=8.5 was 155 Å.
The diffusion coefficient is given by the Stokes-Einstein equation (Kovasin and Nordén,
1984):
eRkTD
06πη= 6.24
where is the Boltzmann constant, k T is the temperature, 0η is the solvent viscosity. The
calculated value of the diffusion coefficient for pH=8.5 was m2 -11110623.1 −×=D s .
Numerous correlations have been presented for the calculation of the mass transfer
coefficient. In the turbulent regime, the most widely used equation is the Deissler correlation
(Gross et al., 1958; Brown, 1967) given by:
6.25 25.0875.0Re023.0 ScSh =
0
Reηρvdh=where is the Reynolds number, ρ is the density (kg m-3), is hydraulic
diameter of the flow channel (m),
hd
0η is viscosity of solvent (kg m-1 s-1) and v is the velocity
in the flow channel (m s-1), Schmidt number: DSc ρη /= , Sherwood number ,
where k is the mass transfer coefficient (m s
DkdSh /= h
-1).
6.4.2.1 Experimental results with membrane of 1 kDa cut-off
The optimal membrane cut-off used to recover vanillin from lignin vanillin mixture is not so
obvious as one could expect, indeed, there are two important parameters involved that should
be considered. These parameters are purity of the vanillin and optimal permeate flux.
Therefore when membrane with a low cut-off is used the vanillin in the permeate is obtained
with high purity. In contrast, the permeate flux on such membrane is very low and that
implies the use of high membrane area.
Clean Technologies for the Purification of Wastewaters: Adsorptive Parametric Pumping

Recovery of vanillin from lignin/vanillin mixture by using ultrafiltration 149
The permeate flux is the permeate flow per unit area of the membrane (L h-1 m-2). It is an
important parameter because it influences the full scale operation cost. The factors affecting
the permeate flux are the feed composition, cut-off of the membrane and temperature. The
variation of the permeate fluxes with time for the mixture of lignin and vanillin at
concentrations 60 g L-1 and of 6 g L-1 on the ceramic membrane of 1 kDa cut-off at different
pH are shown in Figure 6.7. It can be noticed that through the ultrafiltration of lignin/vanillin
mixture at the same composition but different pH the flux differs slightly. This fact can be
caused by changing the properties of lignin as well as the solubility in aqueous solvent with
increasing pH.
0
1
2
3
4
5
6
7
8
0 200 400 600 800 1000 1200
time (min)
J(L
h-1m
-2)
60 g/L-8.5 pHsimul60 g/L-12.5 pHsimul
Figure 6.7 Permeate flux in membrane of 1 kDa cut-off at pH=8.5 and 12.5. Concentration of lignin was 60 g L-1 and vanillin 6 g L-1. Transmembrane pressure was constant during all experiment -1=1.55 bar. Feed flow-rate: 130 and 120 L h , respectively ≈feedQPΔ
It is clear from Figure 6.7 that the flux decreases slightly from the beginning of experiment
and no steady state was reached. We have noticed that the permeate flux was very low
immediately after permeate started to be collected. The flux of pure water at the
transmembrane pressure of 1.55 bar was 21 L h-1m2 while the flux of lignin/vanillin mixture
was only 4-5 L h-1m2. In general, during the ultrafiltration process the gel layer is not formed
in the beginning of the process and the main of resistance is caused by the resistance of
membrane ( ). From our experimental data, we can notice that gel resistance is always
higher than membrane resistance from the beginning of experiments. This suggests that even
at the beginning of experiments when the solution circulates through the system without
opening the permeate valve, the gel layer formed at the membrane surface.
mg RR ⟨
Clean Technologies for the Purification of Wastewaters: Adsorptive Parametric Pumping

150 CHAPTER 6
The mathematical model used to describe experimental permeate fluxes for lignin
concentration of 60 g L-1 pH=8.5 and pH = 12.5 assumes that increasing gel layer thickness
leads to the increase of gel resistance ( ). The model parameters applied in the simulations
are shown in the
Rg
Table 6.2.
Table 6.2 The model parameters used in the simulation for membrane 1 kDa cut-off.0feedC (g L-1) η feedQobsR obsR 0V
Run pH Lignin Vanillin (Lignin) (Vanillin) (kg m-1 -1 s ) (L h-1 (L))
1 60 6 8.5 0.951 ≈ 0 1.19x10⁻³ 130 5
2 60 6 12.5 0.972 ≈ 0 1.19x10⁻³ 120 4
* the value of is 2.806× m-1mR 1310 , transmembrane pressure =1.55 bar PΔ
The membrane area 0.008 m2=mA
The gel resistance as a function of time obtained from experimental data using Eq. 6.13 is
shown in Figure 6.8 for the studied pH range. The resistance of gel layer ( ) is always
higher than the membrane resistance ( m
R
13
R
g
-110806.2 ×=mR ) measured using pure water and
is increasing with time. As it was mentioned before, the gel layer resistance depends mostly
on gel layer thickness but it is also influenced by the change of solution properties with time
since the batch method is applied. The solution is becoming more concentrated, more viscous
and the molecular weight distribution changes since certain molecular weight fraction is
withdrawn in the permeate.
To include all factors which influence the permeate flux during the filtration, the gel
resistance ( ) increasing with the time was used as a fitting parameter. The predicted
permeate flux obtained during the filtration of 60-6 g L
g
-1 at the pH=12.5 and 8.5 is shown
along with the experimental data in Figure 6.7.
Clean Technologies for the Purification of Wastewaters: Adsorptive Parametric Pumping
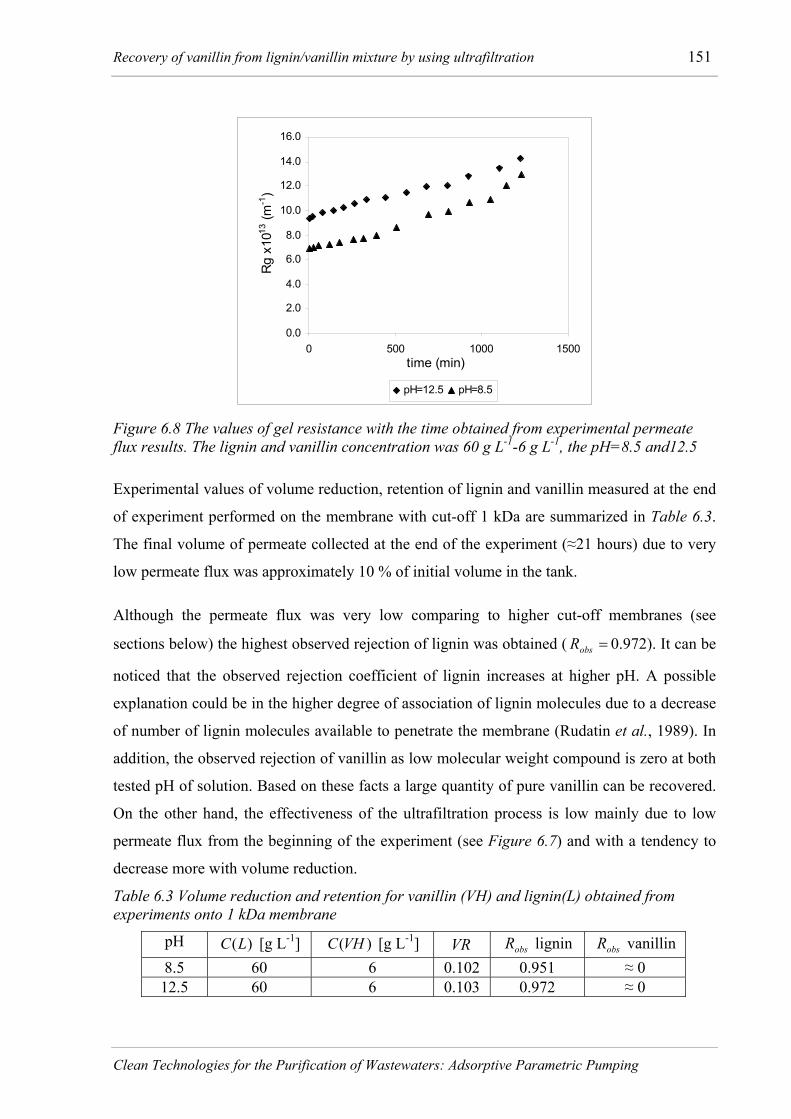
Recovery of vanillin from lignin/vanillin mixture by using ultrafiltration 151
0.0
2.0
4.0
6.0
8.0
10.0
12.0
14.0
16.0
0 500 1000 1500time (min)
Rg
x1013
(m-1
)
pH=12.5 pH=8.5
Figure 6.8 The values of gel resistance with the time obtained from experimental permeate flux results. The lignin and vanillin concentration was 60 g L-1-6 g L-1, the pH=8.5 and12.5
Experimental values of volume reduction, retention of lignin and vanillin measured at the end
of experiment performed on the membrane with cut-off 1 kDa are summarized in Table 6.3.
The final volume of permeate collected at the end of the experiment (≈21 hours) due to very
low permeate flux was approximately 10 % of initial volume in the tank.
Although the permeate flux was very low comparing to higher cut-off membranes (see
sections below) the highest observed rejection of lignin was obtained ( 0.972). It can be
noticed that the observed rejection coefficient of lignin increases at higher pH. A possible
explanation could be in the higher degree of association of lignin molecules due to a decrease
of number of lignin molecules available to penetrate the membrane (Rudatin et al., 1989). In
addition, the observed rejection of vanillin as low molecular weight compound is zero at both
tested pH of solution. Based on these facts a large quantity of pure vanillin can be recovered.
On the other hand, the effectiveness of the ultrafiltration process is low mainly due to low
permeate flux from the beginning of the experiment (see
=Robs
Figure 6.7) and with a tendency to
decrease more with volume reduction.
Table 6.3 Volume reduction and retention for vanillin (VH) and lignin(L) obtained from experiments onto 1 kDa membrane
pH )(LC [g L-1] )(VHC [g L-1obsR obsR lignin vanillin ] VR
8.5 60 6 0.102 0.951 ≈ 0 12.5 60 6 0.103 0.972 ≈ 0
Clean Technologies for the Purification of Wastewaters: Adsorptive Parametric Pumping

152 CHAPTER 6
Each stream (retentante and permeate) was analyzed for lignin and vanillin content. The
concentration histories of vanillin and lignin in retentante and permeate at concentration of
lignin 60 g L-1 and vanillin 6 g L-1 and at pH of solution 8.5 and 12.5 using membrane of 1
kDa cut-off are presented in Figure 6.9 and Figure 6.10, respectively. The experiments were
performed at constant transmembrane pressure PΔ =1.55 bar and feed flow rate 130L h-1.
Figure 6.9 Vanillin and lignin concentration in retentante versus time using membrane of cut-off 1 kDa. The initial concentration of lignin was 60 g L-1 and vanillin 6 g L-1, pH=8.5 (a) and pH=12.5 (b). Transmembrane pressure was constant during all experiment PΔ =1.55 bar. Feed flow-rate: 130 L h-1 -1.(a); 120 L h (b) ≈feedQ ≈feedQ
Figure 6.10 Vanillin and lignin concentration in permeate versus time using membrane of 1 kDa cut-off. The initial concentration of lignin was 60 g L-1 and vanillin 6 g L-1, pH=8.5(a); pH=12.5(b). Transmembrane pressure was constant during all experiment PΔ =1.55 bar. Feed flow-ratet: 130 L h-1 -1 (a). 120 L h (b) ≈feedQ ≈feedQ
Clean Technologies for the Purification of Wastewaters: Adsorptive Parametric Pumping

Recovery of vanillin from lignin/vanillin mixture by using ultrafiltration 153
The variation of lignin and vanillin concentration in the retentante and the permeate with time
was predicted using model equations shown in the Table 6.1.
The predicted curves for both species vanillin and lignin in the retentante and permeate are
shown in Figure 6.9 and Figure 6.10, respectively. The concentration of lignin and vanillin in
the permeate or the retentante stream depends on the observed rejection. Since the batch
method was applied, the feed concentration increases with the time as the retentante is
recycled to the tank Thus the concentration of lignin in the tank increased from 60 g L-1 to 63
g L-1 in the feed solution with pH=8.5 and from 60 g L-1 to 67 g L-1 for the feed solution with
pH=12.5. If the observed lignin rejection is constant, the concentration of lignin in each
stream must increase with increasing concentration in the feed. Because the permeate flux
using membrane of 1 kDa cut-off is very low and only 10% volume reduction was reached,
the concentration of lignin in the feed did not increase significantly as well as the lignin
concentration in the retentante and permeate (Figure 6.9,Figure 6.10). Similarly, vanillin
concentration (see Figure 6.9,Figure 6.10) measured in the samples of retentante and
permeate remained constant during the experiments.
6.4.2.2 Experimental results with membrane of 5 kDa cut-off
Experimental values of volume reduction, retention of lignin and vanillin measured at the end
of experiment performed on the membrane with cut-off 5 kDa are summarized in Table 6.4.
The permeate flux at concentrations of lignin 60 g L-1 and vanillin 5 g L-1 and at pH =12.5 is
shown in Figure 6.11.
Table 6.4 The values of volume reduction and retention for vanillin and lignin obtained from experiments onto 5 kD membrane.
obsR obsR )(LC )(VHC VR [g L-1] [g L-1] lignin vanillin
60* 5 0.275 0.968 ≈ 0
The observed rejection of lignin ( = 0.968) is slightly lower than for the membrane 1 kDa
cut-off ( = 0.972) but the permeate flux was practically ten times bigger. The collected
volume of permeate was 27% from initial solution volume in the tank. The concentration of
lignin measured in the tank at the end of experiment increased from 60 g L
obsR
obsR
-1 to 90 g L-1.
Clean Technologies for the Purification of Wastewaters: Adsorptive Parametric Pumping

154 CHAPTER 6
02468
101214161820
0 200 400 600 800 1000
time (min)
J(L
h-1m
-2)
5 kDa simul
Figure 6.11 Permeate flux in membrane of 5 kDa cut-off at pH= 12.5. The concentration of lignin was 60 g L-1 and vanillin 5 g L-1. Transmembrane pressure was constant during all experiment =1.55 bar. Feed flow-ratet: -1 120 L h . PΔ ≈feedQ
The permeate flux has very similar behavior compared to that observed on the membrane with
cut-off 1 kDa (see Figure 6.7) under the same condition and it decreases slowly with time.
The concentrations of vanillin in each stream of permeate and retentante were similar and the
rejection was found to be close to zero.The permeate flux was predicted by using the gel layer
model where the gel resistance was the fitting parameter. The model parameters used to
predict data are listened in the Table 6.5. The change of gel resistance ( ) with time is
shown in
Rg
Figure 6.12.
Table 6.5 The model parameters used in simulation for the membrane of 5 kDa cut-off
0feedC (g L-1) Run 0V η feedQmR PΔ
pH Lignin Vanillin (m-1) (kg m-1 -1 s ) (bar) (L)(L h-1)
1 60 5 12.5 1.222 1310× 1.190×10-3 120 1.55 4
* =0.968 for lignin and = 0 for vanillin obsR obsR
The concentration histories of vanillin and lignin in retentante and permeate using membrane
of 5 kDa cut-off are presented in Figure 6.13 Figure 6.14 and . The concentration of lignin
and vanillin in feed was 60 g L-1, 5 g L-1, respectively, and pH of mixture was 12.5.
Clean Technologies for the Purification of Wastewaters: Adsorptive Parametric Pumping

Recovery of vanillin from lignin/vanillin mixture by using ultrafiltration 155
0.0
0.5
1.0
1.5
2.0
2.5
3.0
3.5
0 200 400 600 800 1000time (min)
Rg
x1013
(m-1
)
5 kDa
Figure 6.12 Gel resistance versus time obtained from experimental permeate flux results. Lignin and vanillin concentration were 60 g L-1-and 6 g L-1, pH=12.5
The experiment was performed at constant transmembrane pressure = 1.55 bar and feed
flow rate was adjusted to 120L h
PΔ-1. The concentration histories of lignin in the permeate and
retentante were calculated by model equations reported in the Table 6.1. The predicted
concentration histories of lignin and vanillin in each stream together with the experimental
points are shown in Figure 6.13-Figure 6.14.
0
20
40
60
80
100
0 200 400 600 800 1000
time (min)
C(v
anill
in, l
igni
n g
L-1 in
rete
ntan
te
lignin vanillin simul simul
Figure 6.13 Vanillin and lignin concentration in retentante versus time using membrane of 5 kDa cut-off. The initial concentration of lignin was 60 g L-1 and vanillin 5 g L-1, pH=12.5. Transmembrane pressure was constant during all experiment PΔ =1.55 bar. Feed flowrate t:
120 L h-1≈feedQ
Clean Technologies for the Purification of Wastewaters: Adsorptive Parametric Pumping

156 CHAPTER 6
0
1
2
3
4
5
6
0 200 400 600 800 1000time (min)
C(v
anill
in, l
igni
n) g
L-1 in
per
mea
te
lignin vanillin simul simul
Figure 6.14 Vanillin and lignin concentration in permeate versus time using membrane of 5 kDa cut-off. The initial concentration of lignin was 60 g L-1 and vanillin 5 g L-1, pH=12.5. Transmembrane pressure: =1.55 bar. Feed flowrate: -1 120 L h≈feedQPΔ
The predicted concentration profiles using the gel layer model are in good agreement with
experimental data. It is shown that the lignin concentration in the permeate and retentante are
slightly increasing while the vanillin concentration remains constant. The increase of the
lignin concentration in both streams is due to application of batch filtration method. Similarly
as in the case of membrane of 1 kDa cut-off the concentration of vanillin in the permeate was
constant and no obstruction for the penetration of vanillin molecule was found.
6.4.2.3 Experimental results with membrane of 15 kDa cut-off
The experimental results performed with membrane of 15 kDa cut-off are summarized in
Table 6.6 and the variation of permeate fluxes with time at different concentrations and pH of
solution are shown in Figure 6.15-6.18.
Table 6.6 The values of volume reduction and retention for vanillin and lignin obtained from experiments onto 15 kD membrane.
obsR obsR )(LC )(VHC VRpH [g L-1] [g L-1] lignin vanillin 5 0.5 0.500 0.916 ≈ 0 20 2.0 0.440 0.958 ≈ 0 8.5 60 6 0.313 0.943 ≈ 0 20 2.0 0.440 0.873 ≈ 0 12.5 60 6 0.340 0.865 ≈ 0
Clean Technologies for the Purification of Wastewaters: Adsorptive Parametric Pumping

Recovery of vanillin from lignin/vanillin mixture by using ultrafiltration 157
Figure 6.15 shows the permeate flux as a function of time for concentrations 60/6 g/L of
lignin/vanillin solution at pH=8.5 and 12.5.
0
5
10
15
20
25
30
35
0 200 400 600 800 1000 1200 1400
time (min)
J(L
h-1m
2 )
8.5 pH12.5 pHpH=8.5pH=12.5
Figure 6.15 Permeate flux in membrane of 15 kDa cut-off at pH=8.5 and 12.5. The concentration of lignin was 60 g L-1 -1 and vanillin 6 g L . Transmembrane pressure: PΔ =1.3 bar. Feed flowrate: 101 L h-1. ≈feedQ
The difference between the permeate fluxes of the lignin/vanillin solution at same
concentration but at different pH was noticed also when using membrane of 1 kDa. In the
case of membrane with 15 kDa cut-off the permeate flux for the solution of lignin/vanillin at
concentration of 60/6 g L-1 was almost two times higher for lower pH. As it was pointed out
above the difference could be due to the change of the properties of lignin in an alkali media
such as higher solubility and association of macromolecules and became more significant
with increasing the lignin concentration (Rudatin et al., 1989). The difference between
permeate fluxes at the concentration 20 g L-1 at different pH was also present but not so
noticeable as at the higher concentration. The permeate fluxes at different concentration but
the same pH were also compared. The initial permeate flux always decreases as the
concentration of lignin in the initial feed solution increases.
Clean Technologies for the Purification of Wastewaters: Adsorptive Parametric Pumping

158 CHAPTER 6
30
35
40
45
50
55
60
65
70
0 200 400time(min)
J(L
h-1m
2 )
8.5 pH12.5 pHpH=8.5pH=12.5
Figure 6.16 Permeate flux in membrane of 15 kDa cut-off at pH=8.5 and 12.5. The concentration of lignin was 20 g L-1 -1 and vanillin 2 g L . Transmembrane pressure: PΔ =1.3 bar. Feed flow-rate: 102 L h-1 ≈feedQ
20
40
60
80
100
120
140
0 100 200 300 400
time(min)
J (L
h-1m
2 )
Figure 6.17 Permeate flux in membrane of 15 kDa cut-off at pH=8.5. The concentration of lignin was 5 g L-1 and vanillin 0.5 g L-1. Transmembrane pressure PΔ =1.3 bar. Feed flow-rate: 109 L h-1≈feedQ
The permeate fluxes were predicted using the gel resistance obtained from experimental data.
The change of gel resistance with the time is shown in Figure 6.18 for all concentration range
and the model parameters are in Table 6.7
Clean Technologies for the Purification of Wastewaters: Adsorptive Parametric Pumping

Recovery of vanillin from lignin/vanillin mixture by using ultrafiltration 159
0.0
0.5
1.0
1.5
2.0
2.5
3.0
3.5
4.0
0 200 400 600 800
time (min)
Rg
x1013
(m-1
)
5 g/L 20 g/L-8.5pH 60 g/L-8.5 pH
20 g/L-12.5pH 60 g/L-12.5pH
Figure 6.18 The change of gel resistance ( ) with time when filtrating lignin/vanillin solution at the concentrations 5-0.5, 20-2, 60-6 g L
Rg-1, pH=8.5 and 12.5
Table 6.7 Model parameters used in simulations for membrane of 15 kDa cut-off0feedC (g L-1)
η feedQobsR obsR 0V Run pH
Lignin Vanillin Lignin Vanillin (kg m-1 -1 s ) (L h-1 (L))
-31 5 5 0.5 8.5 0.916 ≈ 0 0.887×10 109 -32 5 20 2 8.5 0.958 ≈ 0 0.954×10 102 -33 5 20 2 12.5 0.873 ≈ 0 0.954×10 102 -34 5 60 6 8.5 0.943 ≈ 0 1.190×10 101 -35 5 60 6 12.5 0.865 ≈ 0 1.190×10 101
* the value of is 2.806 × m-1mR 1210 , for all runs is 1.3 bar PΔ
The observed rejection of lignin, , was 0.958 for the solution of lignin/vanillin at
concentration of 20/2 g L
obsR-1 at pH=8.5 and = 0.873 for pH=12.5. The rejection of lignin
significantly decreased also at concentration of lignin/vanillin 60/6 g L
obsR-1 at pH=12.5 and it
was 0.865. It could be noticed that the rejection of lignin at each tested concentrations 20 and
60 g L-1 decreases with increasing pH of the mixture. This is contrary to the results observed
on the membrane of 1 kDa cut-off where at pH 12.5 the rejection was higher than at pH = 8.5.
For the case of feed concentration 60 g L-1 of lignin, 6 g L-1 of vanillin and pH of mixture
equal to 8.5 and 12.5 the histories of vanillin and lignin concentration in retentante and
permeate for the membrane of cut-off 15 kDa are presented in Figure 6.19, Figure 6.20. The
experiment was performed at constant transmembrane pressure PΔ =1.3 bar. Feed flow-rate
was adjusted to 102 L h-1.
Clean Technologies for the Purification of Wastewaters: Adsorptive Parametric Pumping

160 CHAPTER 6
The predicted concentration curves for lignin in the retentante and permeate using equations
reported in Table 6.1 are showed in Figure 6.19, Figure 6.20.
Figure 6.19 Vanillin and lignin concentration in retentante versus time using membrane of 15 kDa cut-off and at pH=8.5(a); pH=12.5(b). The initial concentration of lignin was 60 g L-1 and vanillin 6 g L-1 -1 . Transmembrane pressure: =1.3 bar. Feed flowrate: 102 L hPΔ ≈feedQ
Figure 6.20 Vanillin and lignin concentration in permeate versus time using membrane of 15 kDa cut-off and at pH=8.5(a); pH=12.5(b). The initial concentration of lignin was 60 g L-1 and vanillin 6 g L-1 -1. Transmembrane pressure: =1.3 bar. Feed flowrate: 101 L h≈feedQPΔ
For feed concentration of lignin 20 g L-1 and vanillin 2 g L-1 and pH of mixture equal to 8.5
and 12.5 the behavior of vanillin and lignin concentration in retentante and permeate for the
membrane of cut-off 15 kDa are presented in Figure 6.21 and Figure 6.22, respectively. The
experiment was performed at constant transmembrane pressure PΔ =1.3 bar. Feed flow-rate
was adjusted to 102 L h-1.
Clean Technologies for the Purification of Wastewaters: Adsorptive Parametric Pumping
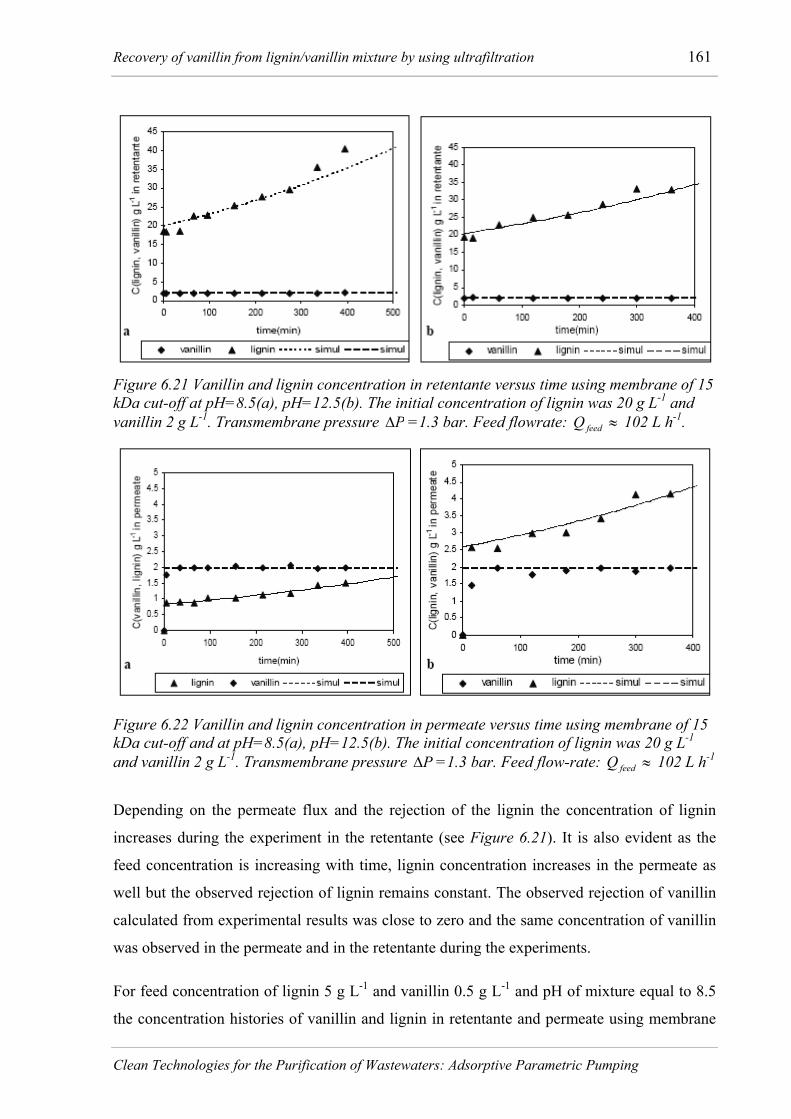
Recovery of vanillin from lignin/vanillin mixture by using ultrafiltration 161
Figure 6.21 Vanillin and lignin concentration in retentante versus time using membrane of 15 kDa cut-off at pH=8.5(a), pH=12.5(b). The initial concentration of lignin was 20 g L-1 and vanillin 2 g L-1 -1. Transmembrane pressure =1.3 bar. Feed flowrate: 102 L h . PΔ ≈feedQ
Figure 6.22 Vanillin and lignin concentration in permeate versus time using membrane of 15 kDa cut-off and at pH=8.5(a), pH=12.5(b). The initial concentration of lignin was 20 g L-1 and vanillin 2 g L-1 -1. Transmembrane pressure =1.3 bar. Feed flow-rate: 102 L hPΔ ≈feedQ
Depending on the permeate flux and the rejection of the lignin the concentration of lignin
increases during the experiment in the retentante (see Figure 6.21). It is also evident as the
feed concentration is increasing with time, lignin concentration increases in the permeate as
well but the observed rejection of lignin remains constant. The observed rejection of vanillin
calculated from experimental results was close to zero and the same concentration of vanillin
was observed in the permeate and in the retentante during the experiments.
For feed concentration of lignin 5 g L-1 -1 and vanillin 0.5 g L and pH of mixture equal to 8.5
the concentration histories of vanillin and lignin in retentante and permeate using membrane
Clean Technologies for the Purification of Wastewaters: Adsorptive Parametric Pumping
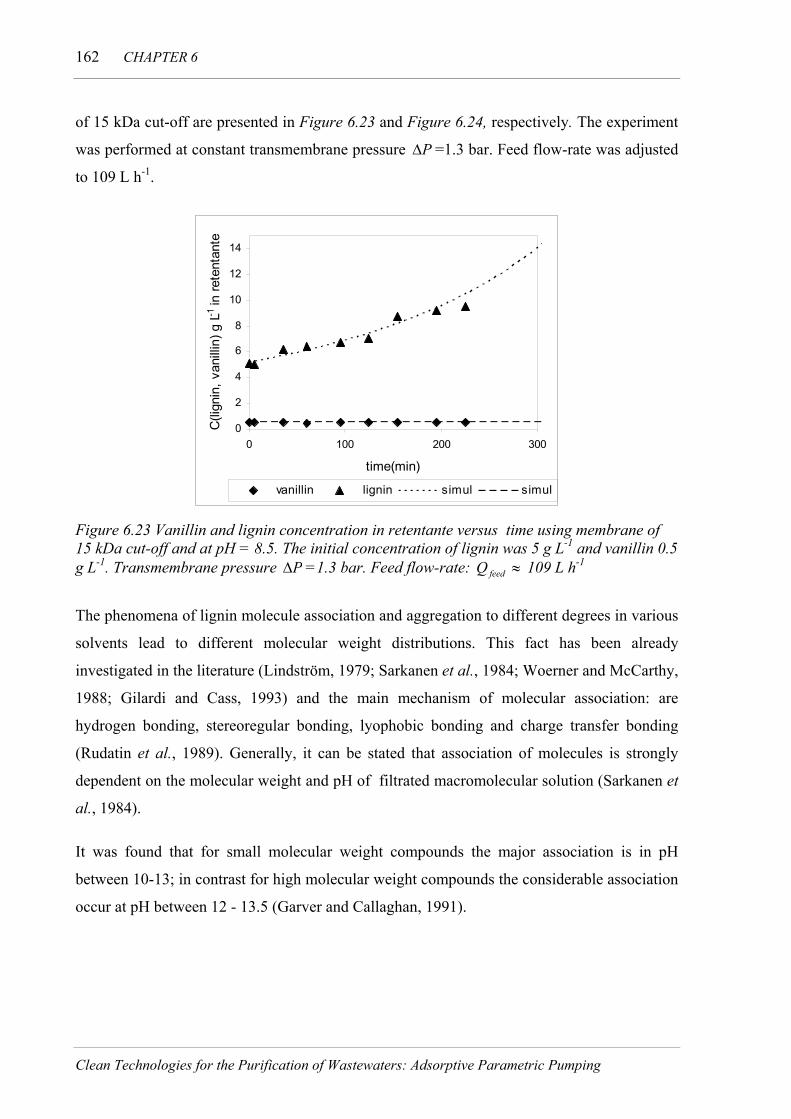
162 CHAPTER 6
of 15 kDa cut-off are presented in Figure 6.23 and Figure 6.24, respectively. The experiment
was performed at constant transmembrane pressure PΔ =1.3 bar. Feed flow-rate was adjusted
to 109 L h-1.
0
2
4
6
8
10
12
14
0 100 200 300
time(min)
C(li
gnin
, van
illin
) g L-1
in re
tent
ante
vanillin lignin simul simul
Figure 6.23 Vanillin and lignin concentration in retentante versus time using membrane of 15 kDa cut-off and at pH = 8.5. The initial concentration of lignin was 5 g L-1 and vanillin 0.5 g L-1 -1. Transmembrane pressure =1.3 bar. Feed flow-rate: 109 L h≈feedQPΔ
The phenomena of lignin molecule association and aggregation to different degrees in various
solvents lead to different molecular weight distributions. This fact has been already
investigated in the literature (Lindström, 1979; Sarkanen et al., 1984; Woerner and McCarthy,
1988; Gilardi and Cass, 1993) and the main mechanism of molecular association: are
hydrogen bonding, stereoregular bonding, lyophobic bonding and charge transfer bonding
(Rudatin et al., 1989). Generally, it can be stated that association of molecules is strongly
dependent on the molecular weight and pH of filtrated macromolecular solution (Sarkanen et
al., 1984).
It was found that for small molecular weight compounds the major association is in pH
between 10-13; in contrast for high molecular weight compounds the considerable association
occur at pH between 12 - 13.5 (Garver and Callaghan, 1991).
Clean Technologies for the Purification of Wastewaters: Adsorptive Parametric Pumping

Recovery of vanillin from lignin/vanillin mixture by using ultrafiltration 163
0
0.2
0.4
0.6
0.8
1
1.2
1.4
0 100 200 300
time(min)
C(li
gnin
, van
illin
) g L-1
in p
erm
eate
vanillin lignin simul simul
Figure 6.24 Vanillin and lignin concentration in permeate versus time using membrane of 15 kDa cut-off. The initial concentration of lignin was 5 g L-1 and vanillin 0.5 g L-1, pH=8.5. Transmembrane pressure -1=1.3 bar. Feed flow-rate: 109 L h≈feedQPΔ
The association of the molecules at high pH lead to particle size increase mostly due to
polyelectrolyte swelling and dissociation of ionisable functional groups (Lindström, 1979)
while when pH decreases the association is due to the formation of hydrogen bonds. Glasser
and Ross (Ross et al., 1986) noticed from the experiments using membrane of 10 kDa and 20
kDa cut-off, respectively that the rejection of the Kraft lignin decreased with increasing pH of
the solution. The same results were found in our experiments using membrane of 15 kDa cut-
off but they are in contradiction with those observed on the membrane of 1 kDa cut-off.
Unfortunately, there are no references in the literature presenting the influence of pH on the
rejection using the membrane with lower cut-off. This disagreement between the rejection of
lignin at two different pH of solution and using different membrane cut-off (1 kDa and 15
kDa) could be related to a change of governing mechanism.
One can speculate that at pH=12.5, the bigger molecules provide more sites for association
compared with small molecules and therefore can be more effectively rejected by 1 kDa
membrane while using 15 kDa membrane even associated molecules can pass through the
membrane to the permeate. On other hand, the association of molecules with lowering the pH
can be predominant leading to the formation of bigger aggregates which are not allowed to
pass through the membrane of 15 kDa cut-off.
Clean Technologies for the Purification of Wastewaters: Adsorptive Parametric Pumping

164 CHAPTER 6
6.4.3 Experimental results of ultrafiltration of permeate obtained using membrane of 1
kDa cut-off
It was observed that with the membrane of lower cut-off, higher rejection could be obtained
(see section 6.4.2.1). On the other hand, ultrafiltration of solution at high concentration of
lignin using low cut-off membrane leads to significant decline of the permeate flux. One
approach to solve the difficulty is to introduce more ultrafiltration stages. For this purpose,
one experiment was carried out with lignin and vanillin solution at the similar concentration
of both components as obtained by ultrafiltration of lignin/vanillin solution at a concentration
60/6 g L-1 using membrane of 1kDa cut-off (see section 6.4.2.1). The permeate flux during
ultrafiltration of lignin/vanillin mixture at the concentration 2 g L-1 of lignin and 6 g L-1 of
vanillin is shown in Figure 6.25. It is very important to point out that the solution was
prepared from fresh lignin and this model solution did not reflect the real permeate
composition of the mentioned experiment essentially due to the content of high molecular
weight fraction.
The permeate flux through the membrane was predicted by using the mathematical model
which includes osmotic pressure and concentration polarisation and by the gel layer model
and both mathematical models are compared with experimental permeate flux in Figure 6.25.
Table 6.8 reports the model parameters used in simulations. The series of mathematical
equations involved in the simulations are listed in Table 6.1. The membrane area was
0.008 m=A ´a
R
1271019.5 ×+×= tRg2
2 m and empirically determined constant from van´t Hoff equation was 42.9 Pa
m3 -1 kg . The gel layer resistance ( ) as a function of time obtained by linear regression is:
, .
g
81.6 10 982.0=R
Table 6.8 Model parameters used in simulations considering osmotic pressure and concentration polarisation.
0feedC (g L-1) η feedQmR 0V k PΔRun pH
Lignin Vanillin (m-1) (kg m-1 -1 -1 s ) (bar) (m s ) (L h-1 (L) )1 2 6 12.5 2.806 1310× 1.190 310−× 120 1.55 4 2.49 610−×* the value of is 0.986 for lignin and zero for vanillin obsR
Clean Technologies for the Purification of Wastewaters: Adsorptive Parametric Pumping

Recovery of vanillin from lignin/vanillin mixture by using ultrafiltration 165
0
5
10
15
20
25
0 200 400 600 800
Time(min)
J(L
h-1m
-2)
Figure 6.25 Permeate flux in membrane of 1 kDa cut-off at pH = 12.5. The concentration of lignin was 2 g L-1 and vanillin 6 g L-1. Transmembrane pressure PΔ =1.55 bar. Feed flowrate: 120 L h-1. ≈feedQ The full line represents concentration polarisation model and the dotted line gel layer model.
The predicted permeate flux using concentration polarisation model is higher than the flux
experimentally obtained. The reason of disagreement between the predicted and experimental
permeate flux can be in mass transfer coefficient calculated according to Deissler correlation
(Eq. 6.25). Mass transfer coefficient was calculated using diffusion coefficient D (Eq. 6.24)
which includes hydrodynamic radius of the lignin molecule (Re) estimated only for the
average molecular weight ( =60000 g mol-1M w ). It is evident that mass transfer coefficient is
not constant but is varying with the time due to change of lignin molecular weight during the
process. Table 6.9 reports the values of volume reduction and retention of lignin and vanillin
on ceramic membrane with cut-off 1 kDa measured at the end of the experiment. The volume
of permeate and feed in the tank was measured and each stream was analyzed for lignin and
vanillin content. The permeate flux was significantly higher in comparison to that when high
concentration was filtrated. During the time of experiment the volume in the tank was reduced
to almost 41% from the initial volume.
Table 6.9 The values of volume reduction and retention for vanillin and lignin obtained from experiments onto 1 kDa membrane
obsR obsR C(L) C(VH) VR [g L-1] [g L-1] lignin vanillin 2 6 0.405 0.986 ≈ 0
Clean Technologies for the Purification of Wastewaters: Adsorptive Parametric Pumping

166 CHAPTER 6
The concentration histories of vanillin and lignin in retentante and permeate at concentration
of lignin 2 g L-1 and vanillin 6 g L-1 and at pH of solution 8.5 and 12.5 using membrane of 1
kDa cut-off are presented in Figure 6.26 a, b and Figure 6.27 a, b respectively. The simulated
concentration profiles for both species in the permeate and in the retentante were obtained
using series of equations reported in the Table 6.1 and are shown along with experimental
data.
Figure 6.26 Lignin concentration in retentante (a) and permeate(b) as a function of time using membrane of 1 kDa cut-off. The initial concentration of lignin was 2 g L-1 and vanillin 6 g L-1 -1., pH=12.5. Transmembrane pressure =1.55 bar. Feed flow-rate: 120 L h≈feedQPΔ The full line represents concentration polarisation model and the dotted line gel layer model.
Figure 6.27 Vanillin concentration in retentate (a) and permeate( b) as a function of time using membrane of 1 kDa cut-off. The initial concentration of lignin was 2 g L-1 and vanillin 6 g L-1 -1, pH=12.5. Transmembrane pressure =1.55 bar. Feed flow-rate: 120 L h≈feedQPΔ . The full line represents concentration polarisation model and the dotted line gel layer model
Clean Technologies for the Purification of Wastewaters: Adsorptive Parametric Pumping

Recovery of vanillin from lignin/vanillin mixture by using ultrafiltration 167
The concentration of lignin in the tank analysed at the end of experiment increased from 2 g
L-1 to 3.2 g L-1. The observed rejection of vanillin was zero and the concentration in the
permeate and retentante was constant. The process was carried out up to 41% volume
reduction and 9.7 g of vanillin was recovered in the permeate. Since the low concentration of
lignin in the solution, the flux decline does not represent significant limitation in the process
as it is at high concentrations (see section 6.4.2.1). This could be a way to optimize the
recovery of vanillin from Kraft lignin oxidation media using ultrafiltration
6.5 Conclusion
The recovery of vanillin from Kraft lignin oxidation product by the ultrafiltration techniques
was investigated and it was shown that it can be employed as an efficient way for such
purpose. The appropriate size of membrane cut-off can significantly reduce the high
molecular components from the lignin/vanillin mixture. Due to high physical and chemical
resistance the ceramic membranes can be applied under strong pH conditions and high
temperature.
The tubular ceramic membranes with different molecular weight cut-offs: 1, 5 and 15 kDa
were used in the experiments to compare their performance. The influence of the lignin and
vanillin concentration and pH of the mixture on the ultrafiltration process has been studied as
well.
The highest value of lignin rejection was obtained with the membrane 1 kDa cut-off. By
filtrating the lignin/vanillin mixture at the concentration 60/6 g L-1 and pH=12.5 the lignin
observed rejection was 0.972. On the other hand, using the membranes with small cut-off
leads to significant decline of permeate flux comparing with the membranes with bigger cut-
off. For example the permeate flux using 1 kDa membrane was only 4 L h-1m2 , while for
membrane 5 kDa was 14 L h-1m2 . One possibility to solve this problem can be to introduce
more ultrafiltration stages starting from bigger cut-off membrane.
The influence of pH of the lignin/vanillin mixture on observed rejection was observed as well.
It was found that increasing pH of the solution leads to decrease of lignin rejection using
membranes with 15 kDa cut-off while the opposite was found using membrane 1 kDa These
phenomena can be explained by different mechanism of macromolecules association
depending on molecular weight, pH and cut-off of the membrane.
Clean Technologies for the Purification of Wastewaters: Adsorptive Parametric Pumping

168 CHAPTER 6
We assume that the formation of a gel layer takes place on the membrane surface and thus has
influence on the separation process because it is responsible for significant flux decline. On
the other hand it was observed that very high cleaning efficiency can be obtained using alkali
cleaning (NaOH). There was no evidence of irreversible fouling or plugging the membrane
pores. All tested cut-off membranes recovered after experiments and subsequent cleaning
procedure the same permeability as was found with “new” membranes.
6.6 Nomenclature
a′ coefficient in van´t Hoff equation (Pa m3kg-1)
mA membrane surface, (m2)
-1bC solute concentration in the bulk, (g L )
gel concentration of the rejected solute, (g L-1) gC
-1 solute concentration in the permeate, (g L ) pC
wC concentration of the rejected solute at the membrane surface, (g L-1)
hd Hydraulic diameter of the flow channel (m)
Particle diameter, (m) pd
D Diffusion coefficient (m2 -1 s )
J Permeate flux, (L h-1 m-2)
k Mass transfer coefficient, (m s-1)
k Boltzmann constant, (1.3806503 × 10⁻²³ m2 -2 kg s K-1)
21,KK Constant in Eqs.6.19 a,b, (-)
gK Pemeability of the gel layer ( m2 -1 -1Pa s )
Length of the membrane, (m) L
wM average molecular weight of the solute, (g mol-1)
23 -1AN Avogadro’s number, (6.0221415 × 10 mol )
Clean Technologies for the Purification of Wastewaters: Adsorptive Parametric Pumping
Recovery of vanillin from lignin/vanillin mixture by using ultrafiltration 169
1PΔ Relative inlet pressure on the feed side, (bar)
2PΔ Relative outlet pressure, (bar)
Permeate pressure of the shell side (bar) pP
Feed flow-rate, (L h-1) feedQ
Permeate flow rate, (L h-1) pQ
-1rQ Retentante flow rate, (L h )
0R Intrinsic rejection, (-)
eR Hydrodynamic radius, (m)
Re Reynolds number, 0Re ηρvdh= (-)
Resistance of the gel layer, (m-1) gR
mR Membrane hydraulic resistance, (m-1)
obsR Observed rejection, (-)
Sc Schmidt number, ABDSc ρη /= , (-)
Sh Sherwood number (-)
t Time, (s)
Temperature, (K) T
Average transmembrane pressure, , (bar) PΔ
VR Volume reduction (-)
0V Initial volume of the feed tank, (m3)
Permeate withdrawn volume, (m3) pV
Axial variable, (m) z
Greek symbols
Porosity of gel layer, (-) gε
Clean Technologies for the Purification of Wastewaters: Adsorptive Parametric Pumping

170 CHAPTER 6
θ Flow rate ratio of permeate and feed, (-)
πΔ Osmotic pressure, (Pa)
ρ Density of the solute, (kg m-3)
Solvent viscosity, (Pa.s) 0η
η Viscosity of the solution, (Pa.s)
[ ]η Intrinsic viscosity (L g-1)
Thickness of the polarization layer, (m) polδ
Thickness of the gel layer, (m) gδ
-1v Velocity in the flow channel, (m s )
Indexes
“ i ” specie vanillin or lignin
6.7 Reference
Manual for capillary viscosimeter from Jenna-Glass. Shott Mainz (Germany),
Albrecht, J. S. An Investigation of the Physical-Chemical Mechanism of Selective
Delignification of Wood with Peracetic Acid. Ph. D. Thesis, Lawrence University, Appleton,
Wisconsin, 1971.
Bird, R., B., Steward, W., E. and Lightfoot, E., N., Transport phenomena. J. Wiley & Son,
New York, 1994.
Brown, W., Solution Properties of Lignin . Thermodynamic Properties and Molecular Weight
Determinations. Journal of Applied Polymer Science, 11 (11), 2381-& (1967).
Carlsson, D. J., Dal-Cin, M. M., Black, P. and Lick, C. N., A surface spectroscopic study of
membranes fouled by pulp mill effluent. Journal of Membrane Science, 142 (1), 1-11 (1998).
Charcosset, C., Membrane processes in biotechnology: An overview. Biotechnology
Advances, 24 (5), 482-492 (2006).
Cheng, T.-W. and Wu, J.-G., Modified boundary layer resistance model for membrane
ultrafiltration. Tamkang Journal of Science and Engineering, 4 (2), 111-117 (2001).
Clean Technologies for the Purification of Wastewaters: Adsorptive Parametric Pumping

Recovery of vanillin from lignin/vanillin mixture by using ultrafiltration 171
Dafinov, A., Font, J. and Garcia-Valls, R., Processing of black liquors by UF/NF ceramic
membranes. Desalination, 173 (1), 83-90 (2005).
Fargues, C., Mathias, A. and Rodrigues, A., Kinetics of vanillin production from om Kraft
lignin oxidation. Industrial & Engineering Chemistry Research, 35 (1), 28-36 (1996).
Garver, T. M. and Callaghan, P. T., Hydrodynamics of Kraft Lignins. Macromolecules, 24
(2), 420-430 (1991).
Gilardi, G. and Cass, A. E. G., Associative and Colloidal Behavior of Lignin and Implications
for Its Biodegradation in-Vitro. Langmuir, 9 (7), 1721-1726 (1993).
Gilarranz, M. A., Rodriguez, F., Oliet, M. and Revenga, J. A., Acid precipitation and
purification of wheat straw lignin. Separation Science and Technology, 33 (9), 1359-1377
(1998).
Goldsmith, R. L., Macromolecular Ultrafiltration with Microporous Membranes. Industrial &
Engineering Chemistry Fundamentals, 10 (1), 113-120 (1971).
Gross, S. K., Sarkanen, K. and Schuerch, C., Determinations of Molecular Weight of Lignin
Degradation Products by 3 Methods. Analytical Chemistry, 30 (4), 518-521 (1958).
Jokela, J. K. and Salkinojasalonen, M., Molecular-Weight Distributions of Organic Halogens
in Bleached Kraft Pulp-Mill Effluents. Environmental Science & Technology, 26 (6), 1190-
1197 (1992).
Keyoumu, A., Sjodahl, R., Henriksson, G., Ek, M., Gellerstedt, G. and Lindstrom, M. E.,
Continuous nano- and ultra-filtration of kraft pulping black liquor with ceramic filters - A
method for lowering the load on the recovery boiler while generating valuable side-products.
Industrial Crops and Products, 20 (2), 143-150 (2004).
Konieczny, K. and Rafa, J., Modeling of the membrane filtration process of natural waters.
Polish Journal of Environmental Studies, 9 (1), 57-63 (2000).
Kovasin, K. and Nordén, H. V., Determination of lignosulphonate rejection from test results
in the ultrafiltration of spent sulphite liquor. Svensk Papperstidning, 87 (6), R44-R47 (1984).
Kozinski, A. A. and Lightfoo.En, Protein Ultrafiltration - General Example of Boundary-
Layer Filtration. Aiche Journal, 18 (5), 1030-& (1972).
Lindström, T., Colloidal Behavior of Kraft Lignin .1. Association and Gelation of Kraft
Lignin in Aqueous-Solutions. Colloid and Polymer Science, 257 (3), 277-285 (1979).
Clean Technologies for the Purification of Wastewaters: Adsorptive Parametric Pumping

172 CHAPTER 6
Nabetani, H., Nakajima, M., Watanabe, A., Nakao, S. and Kimura, S., Effects of Osmotic-
Pressure and Adsorption on Ultrafiltration of Ovalbumin. Aiche Journal, 36 (6), 907-915
(1990).
Nuortila-Jokinen, J. and Nystrom, M., Comparison of membrane separation processes in the
internal purification of paper mill water. Journal of Membrane Science, 119 (1), 99-115
(1996).
Porter, M. C., Concentration Polarization with Membrane Ultrafiltration. Industrial &
Engineering Chemistry Product Research and Development, 11 (3), 234-& (1972).
Rojas, O. J., Song, J. and Argyropoulos, D. S., Lignin separation from kraft black liquors by
tangential ultrafiltration. Ind. La Chimica e l'Industria, 88 (1), 88 - 95 (2006).
Ross, D. F., Cartwright, T. B., Doshi, M. R. and Dugal, H. S., Ultrafiltration of kraft black
liquor. IPC technical paper series, 199, (1986).
Rudatin, S., Sen, Y. L. and Woerner, D. L., "Association of Kraft lignin in aqueous solution"
in Lignin properties and materials, W. G. Glasser and S. Sarkanen, eds. American Chemical
Society, Washington DC, USA, 1989.
Sarkanen, S., Teller, D. C., Stevens, C. R. and McCarthy, J. L., Lignin .20. Associative
Interactions between Kraft Lignin Components. Macromolecules, 17 (12), 2588-2597 (1984).
Sondhi, R., Bhave, R. and Jung, G., Applications and benefits of ceramic membranes.
Membrane Technology, 2003 (11), 14-16 (2003).
Speth, T. F., Summers, R. S. and Gusses, A. M., Nanofiltration foulants from a treated surface
water. Environmental Science & Technology, 32 (22), 3612-3617 (1998).
Van der Bruggen, B., Braeken, L. and Vandecasteele, C., Flux decline in nanofiltration due to
adsorption of organic compounds. Separation and Purification Technology, 29 (1), 23-31
(2002).
Wallberg, O., Holmqvist, A. and Jonsson, A. S., Ultrafiltration of kraft cooking liquors from a
continuous cooking process. Desalination, 180 (1-3), 109-118 (2005).
Wallberg, O. and Jonsson, A.-S., Separation of lignin in kraft cooking liquor from a
continuous digester by ultrafiltration at temperatures above 100[deg]C. Desalination, 195 (1-
3), 187-200 (2006).
Wankat, P. C., Rate-Controlled Separations. Kluwer, 1991.
Clean Technologies for the Purification of Wastewaters: Adsorptive Parametric Pumping

Recovery of vanillin from lignin/vanillin mixture by using ultrafiltration 173
Wijmans, J. G., Nakao, S., Vandenberg, J. W. A., Troelstra, F. R. and Smolders, C. A.,
Hydrodynamic Resistance of Concentration Polarization Boundary-Layers in Ultrafiltration.
Journal of Membrane Science, 22 (1), 117-135 (1985).
Woerner, D. L. and McCarthy, J. L., Lignin-24 Ultrafiltration and Light-Scattering Evidence
for Association of Kraft Lignins in Aqueous-Solutions. Macromolecules, 21 (7), 2160-2166
(1988).
Yeh, H. M. and Cheng, T. W., Resistance-in-Series for Membrane Ultrafiltration in Hollow
Fibers of Tube-and-Shell Arrangement. Separation Science and Technology, 28 (6), 1341-
1355 (1993).
Zaidi, S. K. and Kumar, A., Experimental analysis of a gel layer in dead-end ultrafiltration of
a silica suspension. Desalination, 172 (2), 107-117 (2005).
Clean Technologies for the Purification of Wastewaters: Adsorptive Parametric Pumping


7. Recovery of vanillin from Kraft lignin oxidation by ion-
exchange with neutralization1
7.1 Introduction
Vanillin (4-hydroxy-3-methoxybenzaldehyde) is one of the most common aromatic molecules
used in the food, pharmaceutical and cosmetic industries. There are two commercial types of
vanillin, pure vanillin obtained by chemical synthesis from guaiacol or black liquors from
paper industry and a vanilla extract obtained by the ageing and alcoholic extraction of the pod
of tropical Vanilla orchid (principally Vanilla planifolia Andrews, syn. V. fragrans (Salisb.
Ames)) (Thibault et al., 1998; Walton et al., 2003; Daugsch and Pastore, 2005). The natural
vanillin is very expensive compared to synthetic vanillin produced by oxidation of spent
sulfite liquor. Therefore, synthetic vanillin as the alkaline oxidation product of sulfite waste
liquor is an interesting product to be studied.
The world market consists of around 1800 tons of pods, with the market price approximately
$1200-$4000 per kilo, while industrial vanillin is around 12,000 tons and a market price is
bellowing $15 per kilo (Lomascolo et al., 1999; Muheim and Lerch, 1999). That means
1 Based on the paper “Recovery of vanillin from Kraft lignin oxidation by ion-exchange with neutralization by M.
Zabkova, E.A. Borges da Silva and A.E. Rodrigues, Separation and Purification Technology (2006).

176 CHAPTER 7
Clean Technologies for the Purification of Wastewaters: Adsorptive Parametric Pumping
vanilla extract is 250 times more expensive than synthetic vanillin, because of the complexity
of the culture and tedious ageing process (Thibault et al., 1998). Nowadays, approximately
50% of the worldwide production of synthetic vanillin is used by the chemical and
pharmaceutical industries for the production of herbicides, antifoaming agents, household
products or drugs (Hocking, 1997; Walton et al., 2000; Walton et al., 2003). The antioxidant
and antimicrobial properties are applied in use of vanillin as a food preservative (Krueger and
Krueger, 1983; Burri et al., 1989; Daugsch and Pastore, 2005). It exhibits the activity against
both Gram-positive and Gram-negative food-spoilage bacteria and also shows antimutagenic
effect, for instance, as a suppressor of chromosomal damages (Cerrutti et al., 1997; Keshava
et al., 1998; Fitzgerald et al., 2004; Fitzgerald et al., 2005).
Industrial vanillin is produced apart from guaiacol and glyoxylic acid route by oxidation of
spent sulfite liquor, which is a byproduct of the sulfite wood pulping process (Bjorsvik, 1999;
Bjorsvik et al., 2000). The spent sulfite liquor usually consists of dry solids content (12-15%),
of lignosulfonates (55-60%), monosacharides (20-30%) and salts of organic and inorganic
acids (Forss et al., 1986). Borregaard is one of the world’s largest producers of vanillin,
supplying vanillin from two different processes: one based on guaiacol route and another is
based on oxidation of lignosulfonates (sulfite spent liquor) (Bjorsvik et al., 2000).
The presence of vanillin in the alkaline oxidation products of sulfite waste liquor is of
theoretical interest from the point of view of lignin chemistry (Pearl, 1942). It has been well
known since 1920s that lignin heated under reflux conditions for long times in the presence of
active alkali produces a maximum yield of vanillin (Van Ness, 1983). Pressure, temperature
and reaction time influence the yield and nature of phenolic compounds obtained.
During the oxidation process, in addition of vanillin other reaction products can be formed
such as oxidized lignin, acetovanillone, dehydrodivanillin, guaiacol, p-hydroxibenzaldehyde,
and aromatic acids (Pearl, 1942). In the process of Kraft lignin oxidation to produce vanillin
the reaction media at pH =12-13 contains degraded lignin and vanillin (most in the vanillate
form) (Fargues et al., 1996). After a membrane separation step the permeate will contain
sodium vanillate and excess NaOH and the objective is to recover vanillin from this mixture
by flowing it through a packed bed of acid resin in +H form. Figure 7.1 shows a simplified
flow sheet of the lignin oxidation for recovery of the synthetic vanillin.

Recovery of vanillin from Kraft lignin oxidation by ion-exchange 177
Clean Technologies for the Purification of Wastewaters: Adsorptive Parametric Pumping
Generally, the isolation of vanillin from the oxidized solution is an important stage in vanillin
production. The concentration of vanillin in solution cannot be significantly increased by
evaporation because of the high solids content and the vanillin present as sodium vanillate is
difficult to extract.
Figure 7.1 Simplified flow sheet of the lignin oxidation for recovery of the synthetic vanillin
Vanillin can be extracted from the solution with suitable solvents such as benzene or toluene
after acidification of the liquor. Disadvantage of this method is that a large amount of acidic
solution is required for neutralization and also the precipitation of the lignin complicates the
extraction and causes loss of vanillin (Hibbert and Tomlinson, 1937).
The Lignin precipitation can be avoided by extraction of sodium vanillate from the alkaline
solution, for instance with n-butyl alcohol or isopropyl alcohol (Sandborn and Salvesen, 1936;
Bryan, 1955). However, the limited solubility of sodium vanillate in organic solvents is a
disadvantage of this process.
In 1971, Craig and Logan provided an experiment using weak cation-exchange resins in acid
form for vanillin isolation. The alkaline solution is eluted through the column filled with such

178 CHAPTER 7
Clean Technologies for the Purification of Wastewaters: Adsorptive Parametric Pumping
a resin, sodium vanillate and other phenolates are converted into a phenolic form (Craig and
Logan, 1971). This presented process seems interesting and it became the main goal of the
work presented here.
The target of the work is to study ion-exchange equilibrium between +Na from
vanillin/ NaOH solution and H+ from the strong cationic resin Amberlite IR120H at the
temperature 293 K and to evaluate ion exchange kinetics in fixed-bed. The breakthrough
curves of directly measured vanillate, vanillin and calculated +Na of a fixed bed packed with
cationic resin Amberlite IR120H in H+ form, at different feed concentrations, have been
studied. The influence of alkalinity of the vanillin solution on ion-exchange process using
static and dynamic approach has been investigated.
7.2 Experimental Methods
7.2.1 Chemicals and ion-exchanger
Vanillin (C8H8O3) and sodium hydroxide (NaOH) were purchased from Sigma-Aldrich
(Spain). The solutions of vanillin and sodium hydroxide were prepared with degassed and
deionised water. Demineralized water was used with conductivity value lower than 1μS/cm.
The strong cationic resin Amberlite IR120H supplied from Rohm & Haas (France) was used
as an ion exchanger. The physical characteristics of polymeric ion-exchange resin Amberlite
IR 120 H are summarized in Table 7.1. The resin was pretreated with the chlorohydric acid
(HCl) and demineralized water before use.
Table 7.1 Properties of the ion exchanger Amberlite IR120H
Matrix Styrene divinylbenzene copolymer (8% DVB; gel type)
Functional groups Sulphonic
Total exchange capacity (equiv/g dry resin)∗ 0.0050 a; 0.0055 b
Density of the resin (kg dry resin/m3) 560
Average particle diameter (m) 5.50 10-4 a; 7.04 10-4 c
Moisture content (%) 47 to 62 a Rodriguez et al. (Rodriguez et al., 1998) b Melis et al. (Melis et al., 1996) c Valverde et al. (Valverde et al., 2004) *From manufacturer (Rohm&Haas) ≥1.8 equiv/L wet resin

Recovery of vanillin from Kraft lignin oxidation by ion-exchange 179
Clean Technologies for the Purification of Wastewaters: Adsorptive Parametric Pumping
7.2.2 Equipment
The batch adsorption experiments by using Erlenmeyer flasks with the jacket were performed,
which were placed in shaking mixer (GLF-3018, Germany). The temperature was controlled
using thermostatic bath (Edmund Bühler, Germany). The solution was analyzed on UV-VIS
spectrophotometer Jasco (model 7800, Japan). The fixed bed ion-exchange experiments were
performed in glass column with the jacket (150 × 20 mm, I.D.). The vanillin solution was
pumped to the system by peristaltic pump Watson-Marlow (England). The pH of the solution
was measured by pH meter Crison micropH 2002.
7.2.3 Ion-exchange equilibrium experiments
Contacting a different weight of strong cationic resin Amberlite IR120H and the same volume
of the solution at the same initial concentration the batch ion exchange experiments were
carried out. The moisture content of the resin Amberlite IR120 in H+ form was determined for
each experiment as a difference between weight of wet resin and after drying at 423 K. The
solution was prepared by dissolving 0.033 equiv (≈5 g) of vanillin in 1L of sodium hydroxide
solution with the concentration 0.03 equiv L-1. Immediately after dissolution, according the
chemical reaction between sodium hydroxide and vanillin, the vanillate is formed and
equilibrium is characterized by the equilibrium constant of the reaction. The batch experiment
has been performed in 250 mL Erlenmeyer flasks where 70 mL of prepared solution with the
same concentration and an amount of the wet resin have been added. The weight of wet resin
was in the range 0.005 g to 1.6 g. The temperature (293 K) was controlled by thermostatic
bath. The volumetric flasks were placed in a shaking mixer at constant speed 150 rpm. The
equilibrium in resin-liquid mixture has been reached approximately within 24 hours. The
solution was separated from the ion-exchanger and the final concentration of vanillin was
determined by measuring the absorbance using UV-VIS spectrophotometer. The total
concentration of vanillin and vanillate species was determined by measuring the absorbance at
the wavelength 259 nm, which is isobestic point. Additionally, the concentration of vanillate
was determined at the wavelength of 376 nm.
In the case of ordinary binary +Na / +H ion-exchange isotherm the solution was prepared as a
mixture of 0.1 equiv/L sodium chloride ( NaCl ) and pH was 5.34. The excess of +H ion was
determined by measuring the pH after equilibrium was established.

180 CHAPTER 7
Clean Technologies for the Purification of Wastewaters: Adsorptive Parametric Pumping
In order to obtain the data and parameters of ion-exchange equilibrium isotherm, the
following mass balance is used
( )∗∗ −= iiH
i CCfW
Vq 0 7.1
where ∗iq represents the resin-phase equilibrium concentration, iC0 and ∗
iC are initial and
equilibrium concentrations in the bulk fluid phase, V is the volume of bulk solution, W is the
wet mass of resin and fH is dry particle to wet particle mass ratio.
7.2.4 Uptake ion-exchange experiments
The batch uptake experiment has been performed in 250 mL Erlenmeyer flasks where 50 mL
of vanillin solution with the same concentration and the different mass of the wet resin have
been added. The mass of wet resin was 0.3 g, 0.8 g, 1.0 g, 1.5 g and 2.0 g. The moisture
content of the resin was determined for each experiment as a difference between weight of
wet resin and after drying at 423 K. Temperature (293 K) was controlled by thermostatic bath.
The volumetric flasks were placed in a shaking mixer at constant speed 150 rpm. The liquid
samples (0.1 mL) were taken and analyzed during the time till the system reaches the
equilibrium. The equilibrium in resin-liquid mixture has been reached after time which
depends on the mass of the resin. The concentration of vanillin and vanillate in each sample
was determined by measuring the absorbance using UV-VIS spectrophotometer in the same
way as is described above.
7.2.5 Fixed-bed performance
The fixed bed ion-exchange experiments on the polymeric ion exchange resin Amberlite
IR120H were performed. The glass column with jacket (150 × 20 mm, I.D.) has been used in
all fixed-bed experiments and solutions have been delivered by peristaltic pump. Fixed bed
ion-exchange experiments onto ion-exchanger Amberlite IR120H were provided at the
temperature 293 K. The temperature of the column was maintained by a thermostatic bath.
Vanillin concentration at the column outlet was determined at wavelength of 254 nm by an
UV-VIS spectrophotometer. Different runs by changing the pH of the feed solution, which
leads to different ratio vanillin and vanillate in the feed were carried out. Four different initial

Recovery of vanillin from Kraft lignin oxidation by ion-exchange 181
Clean Technologies for the Purification of Wastewaters: Adsorptive Parametric Pumping
pH of the vanillin solution 8.2, 11.4, 11.9 and 12.1 and the flow rate 19 mL min-1 have been
used.
7.3 Theory and Modelling
7.3.1 Equilibrium for the ordinary binary ion-exchange
Ion exchange equilibrium is attained when an ion exchanger is placed in contact with an
electrolyte solution containing a counterion which is different from that in the ion-exchanger.
The ion-exchanger is initially in the +
H form, and the counterion in the solution is +Na .
Counterion exchange occurs, and the ion +
H in the ion exchanger is partially replaced
by +Na :
++++ +↔+ HNaHNa 7.2
where the barred quantities represent species in the resin phase. In this reversible equilibrium,
both the ion exchanger and the solution contain both competing counterion species, +Na and +H . The reversible ion exchange reaction between the liquid and resin phases
resulting in an equilibrium constant HNaK − for the binary system (Pieroni and Dranoff, 1963):
++
++
=−NaH
HNaHNa xy
xyK 7.3
The ionic fraction is introduced as follows: T
NaNa C
Cx
+
+ = ,T
HH C
Cx
+
+ = , in the liquid-phase;
T
NaNa q
qy
+
+ = , T
HH q
qy
+
+ = , in the resin-phase. The variable iC is the concentration of ionic
species in solution, TC is the total ionic concentration in the solution phase or the solution
normality, iq is the ion concentration in the resin phase, and Tq is the total exchange capacity
of the resin. Figure 7.2 illustrates two cases of ion-exchange equilibria: an ion-exchange
isotherm for an ordinary binary system and an isotherm when the process of ion-exchange is
accompanied by irreversible reaction. Generally, the former takes place when the solution
contains only a neutral salt; the equilibrium shows the usual pattern for the ordinary ion-
exchange process without reaction. This system was broadly revised by many researchers and

182 CHAPTER 7
Clean Technologies for the Purification of Wastewaters: Adsorptive Parametric Pumping
equilibrium data of the conventional equilibrium of a salt of strong acid or base on several
ion-exchangers have already been reported. (Delucas et al., 1992).
Figure 7.2 Theoretical ion-exchange equilibrium isotherms: ordinary and accompanied by chemical
reaction. (dots) – experimental points for ordinary ion-exchange equilibrium of the Na+/H+ ions onto Amberlite IR120H. Initial solution: mixture of 0.1 equiv L-1 sodium chloride ( NaCl ) and pH = 5.3 (at 293 K)
The case of ion-exchange in presence of reaction has been introduced by Helfferich (1965),
who derived rate laws for some typical ion-exchange processes involving neutralizations,
association and complex formation. The bulk solution containing a base in contact with a H-
form resin, such as OHaNOHNaH 2+→+ +−++ , is an example of ion-exchange
accompanied by neutralization. For this situation, the ion-exchange becomes irreversible and
the equilibrium isotherm rectangular – as seen in Figure 7.2. Some experimental points of the
conventional ion-exchange equilibrium of the Na+/H+ ions onto Amberlite IR120H are also
shown in Figure 7.2 and discussed later.
7.3.2 Ion-exchange equilibrium of the system vanillin/NaOH-Amberlite IR120H
The ion-exchange process under consideration includes the consumption of the counter-ion
released by the ion exchange (i.e. +H ) and therefore is accompanied by reaction
(neutralization). Theoretical analysis of typical ion exchange processes involving reactions

Recovery of vanillin from Kraft lignin oxidation by ion-exchange 183
Clean Technologies for the Purification of Wastewaters: Adsorptive Parametric Pumping
has been introduced by Helfferich (Helfferich, 1965). Reactions such as neutralizations,
association or complex-formation reactions have been already described (Helfferich, 1965).
The equations of fractional approach for equilibrium taking into account diffusion controlling
mechanisms– film and intraparticular based on Nernst-Plank equations, have already been
developed (Helfferich, 1965; Haub and Foutch, 1986a). The experimental studies of the rate
of neutralization of a strong acid ion exchanger by strong bases (Blickenstaff et al., 1967a)
and weak base (Blickenstaff et al., 1967b) have supported the theory developed by Helfferich
(Helfferich, 1965).
Here the studied system includes a bulk liquid phase and a resin phase. The bulk phase is an
aqueous liquid where the slight dissociation of vanillin and water dissociation occur. The
dissociation degree is characterized by dissociation constants dK and wK :
+− +↔ HVVH ; VH
HVd C
CCK
+−
= 7.4
+− +↔ HOHOH 2 ; −+=OHHW CCK 7.5
where VH and −V correspond to undissociated and dissociated vanillin form, respectively.
The liquid phase has been prepared as a mixture of vanillin and sodium hydroxide, which is a
strong base and dissociate completely. The stoichiometric amount of −OH anions reacts
entirely with an equivalent amount of +H ions released by the weak acid (vanillin). The
stoichiometric amount of weak acid is ionized and neutralized as well as the sodium salt of
vanillin ( )VNa is formed (Eq.7.6). The sodium vanillate, the salt of strong base and weak acid
in the presence of water breaks completely into its ions.
OHVNaOHNaVH 2+→+ −+−+ 7.6
The resin-phase added to the system provides sites with fixed charges for ion exchange
process. The resin-phase is ion-exchange resin Amberlite IR120H, in which the exchangeable
ion is +H . There are non-exchangeable co-ions −V , −OH and the counter ions +Na , +H in
the studied system.
There are two situations that can occur during the preparation of the solutions to be processed
by ion-exchange: (i) the solution contains the mixture of vanillin and its salt, i.e., a buffer
solution; or (ii) the solution contains an amount of sodium hydroxide higher than the amount

184 CHAPTER 7
Clean Technologies for the Purification of Wastewaters: Adsorptive Parametric Pumping
of vanillin (above the equivalent point), all acid is converted to its salt and hydroxide is in
excess in the initial solution. The equivalence point corresponds the situation when vanillin
has been titrated and essentially none vanillin (VH ) as well none ability to neutralize base
remains in the system.
7.3.3 Batch ion-exchange modelling
The volume rV of strong acid resin is introduced into contact with a volume sV of diluted
aqueous solution of vanillin/ NaOH in the batch process. The rates of ion-exchange occur
under condition of intraparticle and external film diffusion rate control as it is already
reported (Helfferich, 1965). In the studied system, the ion-exchange operation and additional
reactions take place in a well-stirred batch reactor and the process is assumed to be controlled
by intraparticle diffusion. Thus, the concentration gradients in the bulk liquid phase are
neglected.
The ion-exchange reactions can be written as follow:
OHaNOHNaH 2+→+ +−++ 7.7a
VHaNVNaH +↔+ +−++ 7.7b
Equation 7.7a shows the case where the solution contains a base: the H+ ion from resin is
exchanged with Na+ ion from solution and it is converted in water by an irreversible reaction
with −OH co-ion in solution. As a result, the equilibrium isotherm would show a rectangular
shape (Kataoka and Yoshida, 1988). Once the studied system contains vanillate and vanillin
in solution (or only vanillate if the pH value is high enough), the reaction shown by Eq.7.7b is
taking place and after the H+ ion exchanges for Na+ ion, vanillin is produced. As can be seen
later, this system leads to a reversible condition since the isotherm obtained for exchange
Na+/H+ is very favourable but not irreversible.
In the resin phase, the interdiffusion of counterions in the ion exchanger is not affected by the
co-ions. The co-ions −V and −OH are assumed to be excluded from the interior of the resin
particle (Donnan effect). Therefore, in modelling equations describing the ion-exchange in
the resin phase, the reaction consuming +H ion interferes only with the boundary condition at
the resin particle surface (Helfferich, 1965).
Ion flux equations are based on the Nernst-Plank theory and can be written:

Recovery of vanillin from Kraft lignin oxidation by ion-exchange 185
Clean Technologies for the Purification of Wastewaters: Adsorptive Parametric Pumping
⎟⎠⎞
⎜⎝⎛ ∇+∇−= φ
RTFqzqDN iii
efii 7.8
where iN is the flux of the i-th ion in resin phase, zi is valence, φ is electric potential, T is
temperature, F and R are the Faraday and the ideal gas constants, respectively. The
coefficient efiD represents an effective diffusivity of the ion in the resin-phase considered as
homogeneous structure.
The assumptions include the following: individual diffusion coefficients remain constant in
process; activity coefficients are unity; the system is isothermal; reactions of the Eqs.7.4 -7.6
are instantaneous in comparison to the rate of exchange. Moreover, ion exchanger particle is
considered spherical and uniform; the swelling changes are neglected in the model. The
mobile co-ions are confined to liquid phase, since there is no interaction between them and
resin phase. However, a few of them can diffuse into the resin accompanied by neutralising
counter-ions. This action can increase the number of ions in the resin, causing its swelling and
subsequently increase resin exchange capacity slightly above the capacity connected to the
fixed ionic groups alone. The process of swelling is a result of hydrophobic and hydrohilics
interactions between the solvent and the resin matrix (de Lucas et al., 2002) and can be
dependent on cross-linking and exchange capacity of the resin, as well as temperature and
solution composition (Rodrigues, 1986). In the studied system the swelling phenomena was
neglected. It is already reported that +H ion is more mobile than +Na (Rodriguez et al.,
1998). The resin matrix has negative charge and the co-ion moves away from it.
Consequences of using these assumptions in some related models have been discussed
elsewhere (Haub and Foutch, 1986a; Haub and Foutch, 1986b).
The ion-exchange kinetics has been evaluated by measuring the amount of exchange ions
between resin and bulk phase. The electro-neutrality and zero current constraints for the resin
phase requires that
TNaH qqq =+ ++ 7.9
0=+ ++ NaH NN 7.10
By combination of Eq.7.8 and Eq.7.10 to substitute +Hq and electrical potential term, we can
obtain:

186 CHAPTER 7
Clean Technologies for the Purification of Wastewaters: Adsorptive Parametric Pumping
++ ∇−= Naef
Na qDN 7.11
where total resin-phase effective diffusivity efD is expressed by
)1( −+=
+
+
αNaT
TefNaef
qqqD
D 7.12
with efH
efNa DD ++= /α .
The transport equation of counter-ions through the resin with spherical shape can be written
by using Eq. 7.11 leading to,
( )
2
22
2
)1()1(2
)1( ⎟⎟⎠
⎞⎜⎜⎝
⎛∂
∂
−+
−−⎟⎟
⎠
⎞⎜⎜⎝
⎛∂
∂+
∂∂
−+=
∂∂ +
+
+++
+
++
rq
qqqD
rq
rrq
qqqD
tq Na
NaT
TefNaNaNa
NaT
TefNaNa
αα
α 7.13
The situation appearing in the derivation of Eq.7.13 is analogous to coupled Fickian
interdiffusion with non-constant effective interdiffusion coefficient.
Initial and boundary conditions are
0=t ( 0 < r < pR ) 0=+Naq 7.14
0=r ( t > 0 ) 0=∂
∂ +
rq
Na 7.15
pRr = ( t > 0 ) =+Naq+
+
+ NaL
NaLT
cKcKq
1 7.16
where Tq is the total capacity of the ion exchanger and LK is a Langmuir model parameter
for the ion-exchange equilibrium. Since the model considers resin-phase as a homogeneous
particle, the parameter efNaD + represents an homogeneous effective diffusivity of ion sodium.
The +H ion from the resin exchanged for +Na ion diffuses to the particle surface in the radial
direction and is consumed by instantaneous irreversible reaction with −OH anion to form
water at the resin/liquid interface. Additionally, it is assumed that the concentration of the +Na ion at the resin surface is at equilibrium with the bulk liquid. Therefore, an equilibrium
relation (as shown in Eq.7.16) must be taken into account. As an example, ion-exchange
process between resin in +H form and NaOH solution accompanied by neutralization
reaction the equilibrium is characterized by a rectangular isotherm.

Recovery of vanillin from Kraft lignin oxidation by ion-exchange 187
Clean Technologies for the Purification of Wastewaters: Adsorptive Parametric Pumping
The differential mass balance for the liquid phase in batch system can be written as:
tq
fVW
tc Na
HNa
∂
∂−=
∂∂ ++ 7.17
with drqrR
q Na
R
pNa
p
++ ∫=0
23
3 7.18
where q represents the average resin-phase concentration over the pellet, V is liquid phase
volume, W is the wet mass of the resin and fH is dry particle to wet particle mass ratio. The
initial conditions are: ++ = oNaNa cc and 0=+Naq . The +H ion from resin is consumed at the
particle surface and its variation in bulk phase depend on the reactions described by Eqs.7.4 -
7.7. The prediction of +H concentration in the liquid phase is provided by calculating pH of
the solution. The pH value can be evaluated according to the proportion of vanillate sodium
salt and vanillin in the solution and above equivalent point from the concentration of −OH anions.
Using the electroneutrality principle in the bulk liquid phase, we have:
−−++ +=+ OHVHNa cccc 7.19
Following Eq.7.4 and Eq.7.5 the amount of +H ion in bulk phase comes from dissociation of
vanillin and water in the solution. When the dissociation constant of the weak acid is low, the
amount of +H ions in solution can be neglected as well as −OH anions below the equivalent
point and then the concentration of sodium ions is equal to concentration of vanillate.
Keeping the above mentioned assumptions, the dissociation of vanillin is very fast and the
equilibrium of dissociation reaction can be considered. During the ion-exchange process
before the equivalent point is reached some vanillin has been neutralized with strong base
( NaOH ) and the solution contains a weak acid and its salt. The buffering power of vanillin is
determined by 4.7=pKa . Both vanillin and vanillate molecules contain benzyl ring which
can be determined by UV spectrophotometer at the wavelength of 259 nm. As a result, the
total amount of these species in the solution can be measured and the following equation can
be written:

188 CHAPTER 7
Clean Technologies for the Purification of Wastewaters: Adsorptive Parametric Pumping
VNaVHT
V CCC += 7.20
where TVC is a total amount of vanillin and vanillate experimentally determined. Since we
assume the co-ion species are not interacting with the resin the value of TVC should be always
constant.
When pH is higher than that in the equivalent point, the solution contains vanillate but also
sodium hydroxide. As a consequence, the pH value is controlled only by the amount of
hydroxyls anions ( −OH ) in the solution.
Since pH value influences the composition of the vanillin/vanilate in liquid phase we can
state: (i) if reaction described by Eq.7.7b occurs the vanillin is produced and as a result pH of
the solution decreases; (ii) if reaction described by Eq.7.7a occurs the pH of the solution
decreases and consequently vanillin is formed by Eq. 7.4. The set of six variables
( +Naq , +Hq , +NaC , +HC , −VC and VHC ) can be obtained by solving Eq.7.4, Eq. 7.9, Eq.7.13),
Eq.7.17, Eq.7.19 and Eq.7.20.
7.3.4 The fixed-bed operation
In order to study the fixed bed ion exchange behaviour, a differential mass balance in a bed
volume element for the liquid phase can be written:
t
qf
zc
uzc
Dt
c Nahs
NaNaax
Na
∂
∂−−
∂
∂−
∂
∂=
∂
∂ ++++
ρεε1
2
2
7.21
where axD is the axial dispersion , u is the interstitial velocity, ε is the bed porosity, sρ is
the wet resin density and fH is dry particle to wet particle mass ratio. At the initial time,
0=+NaC and 0=+Naq 7.22
The boundary conditions for the mass balance equation are the Danckwerts boundary
conditions:

Recovery of vanillin from Kraft lignin oxidation by ion-exchange 189
Clean Technologies for the Purification of Wastewaters: Adsorptive Parametric Pumping
0=z ;( ) ( )( )++
+
−=∂
∂
=oNaNa
z
Naax ctcu
ztzc
D ,0,
0
7.23
Lz = ; ( )
0,
=∂
∂
=
+
Lz
Na
ztzc
7.24
The intraparticle mass transfer term is modelled as discussed in batch model.
The set of algebraic and partial differential equations derived above has been solved using the
software package gPROMS® (general PROcess Modelling System) (gPROMS, 2003). The
orthogonal collocation method on finite elements (OCFEM) was used with minimum 40 finite
elements and two interior collocation points in each element of the fixed bed. The model
predicts breakthrough and desorption curves that are compared with those obtained
experimentally.
7.4 Results and Discussion
7.4.1 Ion-exchange equilibrium isotherm and uptake profiles
The binary ion-exchange equilibrium isotherm +Na / +H has been evaluated by using sodium
chloride solution as a source of counterion +Na . The experimental equilibrium points along
with the fitted curve are shown on the Figure 7.2. The experimental points represent the
relation between +Na ion fraction ( +Nax ) in the liquid phase and ion fraction ( +Na
y ) in the
resin-phase (in this case, A ion refers to the Na+ ion in Figure 7.2). The equilibrium constant
is obtained from fitting of the experimental points and its value is 822.=−HNaK . For the
calculation of the resin-phase equilibrium concentration, the dry particle to wet particle mass
ratio equal to 0.4 (g dry resin /g wet resin) which is an average value found in resin samples
was used.
The ion-exchange equilibrium of the studied system vanillin- NaOH /Amberlite IR120H is
shown on the Figure 7.3. The x -axis shows concentration of +Na ions remaining in the liquid
phase and y -axes concentration of +Na ions in the resin phase.

190 CHAPTER 7
Clean Technologies for the Purification of Wastewaters: Adsorptive Parametric Pumping
A Langmuir model is used to describe the experimental equilibrium data, =∗+Naq
+
+
+ NaL
NaLT
cKcKq
1,
where Tq is the total capacity of the ion exchanger and LK is a Langmuir model parameter
for the ion-exchange equilibrium. The values of Tq and LK are 0.0053 equiv g-1 dry resin
and 3 422.0 L equiv-1, respectively. As a minimization algorithm to improve accuracy in the
determination of the isotherm parameters Levenberg-Marquardt method was used, which is
incorporated in Origin 6.0 (Microcal Software, USA).
Figure 7.3 Ion-exchange equilibrium of the Na+/H+ ions onto Amberlite IR120H (in presence of
vanillin – weak acid – in solution). Initial solution: mixture of 0.03 equiv L-1 sodium hydroxide and 0.033 equiv L-1 (≈5 g L-1) of vanillin, pH = 8.3 (at 293 K); (dots) – experimental points, (lines) – predicted curves by simulation
Simultaneously, the set of batch experiments were performed in order to obtain the
concentration behaviour of the vanillate, vanillin and pH according the time till equilibrium
between liquid and resin phase is established. The experimental points along with the
simulated behaviours are shown on the Figure 7.4, where amounts of resin phase added were
0.3g, 0.8g, 1.0g, 1.5g and 2.0g, respectively. In Table 7.2, the amount of wet resin,
experimental initial and equilibrium concentrations of vanillin and vanillate, measured pH and
calculated pH according the (Eq. 7.4) are shown.
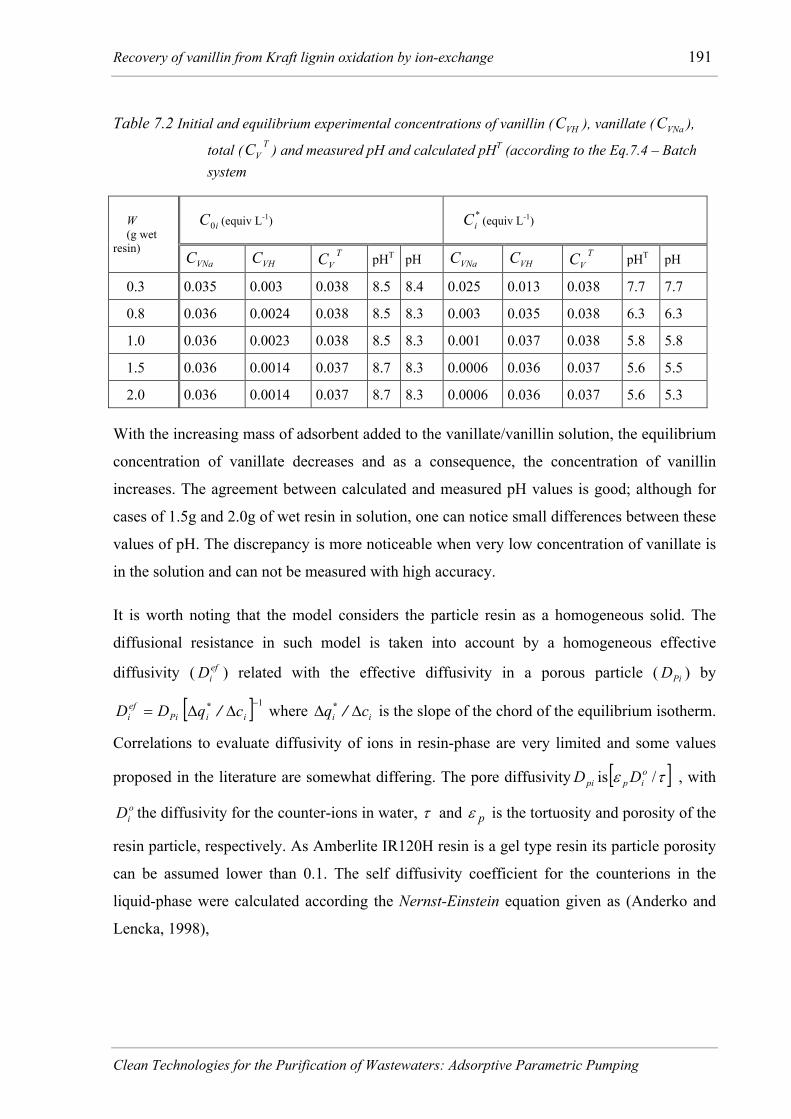
Recovery of vanillin from Kraft lignin oxidation by ion-exchange 191
Clean Technologies for the Purification of Wastewaters: Adsorptive Parametric Pumping
Table 7.2 Initial and equilibrium experimental concentrations of vanillin ( VHC ), vanillate ( VNaC ),
total ( TVC ) and measured pH and calculated pHT (according to the Eq.7.4 – Batch
system
With the increasing mass of adsorbent added to the vanillate/vanillin solution, the equilibrium
concentration of vanillate decreases and as a consequence, the concentration of vanillin
increases. The agreement between calculated and measured pH values is good; although for
cases of 1.5g and 2.0g of wet resin in solution, one can notice small differences between these
values of pH. The discrepancy is more noticeable when very low concentration of vanillate is
in the solution and can not be measured with high accuracy.
It is worth noting that the model considers the particle resin as a homogeneous solid. The
diffusional resistance in such model is taken into account by a homogeneous effective
diffusivity ( efiD ) related with the effective diffusivity in a porous particle ( PiD ) by
[ ] 1−ΔΔ= iiPi
efi cqDD /* where ii cq ΔΔ /* is the slope of the chord of the equilibrium isotherm.
Correlations to evaluate diffusivity of ions in resin-phase are very limited and some values
proposed in the literature are somewhat differing. The pore diffusivity piD is [ ]τε /oip D , with
oiD the diffusivity for the counter-ions in water, τ and pε is the tortuosity and porosity of the
resin particle, respectively. As Amberlite IR120H resin is a gel type resin its particle porosity
can be assumed lower than 0.1. The self diffusivity coefficient for the counterions in the
liquid-phase were calculated according the Nernst-Einstein equation given as (Anderko and
Lencka, 1998),
iC0 (equiv L-1) *iC (equiv L-1) W
(g wet resin)
VNaC VHC TVC pHT pH VNaC VHC T
VC pHT pH
0.3 0.035 0.003 0.038 8.5 8.4 0.025 0.013 0.038 7.7 7.7
0.8 0.036 0.0024 0.038 8.5 8.3 0.003 0.035 0.038 6.3 6.3
1.0 0.036 0.0023 0.038 8.5 8.3 0.001 0.037 0.038 5.8 5.8
1.5 0.036 0.0014 0.037 8.7 8.3 0.0006 0.036 0.037 5.6 5.5
2.0 0.036 0.0014 0.037 8.7 8.3 0.0006 0.036 0.037 5.6 5.3

192 CHAPTER 7
Clean Technologies for the Purification of Wastewaters: Adsorptive Parametric Pumping
0λFz
RTDo = 7.25
where 0λ is limiting diffusivity. The temperature dependence of 0λ can be reproduced for the
range up to 550 K using Smolyakov´s (1969) (Smolyakov, 1969) equation.
( ) ( ) TBATT /ln 0 +=ηλ 7.26
where η is the viscosity of pure water and A, B are adjustable constants for ions tabulated by
Anderko and Lencka (Anderko and Lencka, 1997). The calculated values for
oH
D + = 8.380 10-9 m2 s-1 and oNa
D + = 1.147 10-9 m2 s-1.
For all cases, we assume the values of efNaD + = 2.436 10-12 m2/s and α-1= 7.3 (this last assumed
as the hydrogen and sodium diffusivity ratio in free solution). The sodium homogeneous
effective diffusivity was determined from a fit of the experimental data. For the cases studied,
the slope of the chord of equilibrium isotherm has an order of magnitude between O[102] and
O[103] which gives acceptable values of diffusivity for the purpose of this work. For
simplicity, we assume only an average from homogeneous effective diffusivities obtained by
fitting procedure. However, as expected, one can verify from Figure 7.4 that when there is a
lower equilibrium concentration of sodium in solution, the chord of equilibrium isotherm
increases and a lower value of homogenous effective diffusivity must be expected.

Recovery of vanillin from Kraft lignin oxidation by ion-exchange 193
Clean Technologies for the Purification of Wastewaters: Adsorptive Parametric Pumping
Figure 7.4 Kinetics of Na+/H+ ion-exchange for the system vanillin/NaOH (ion-exchanger:
Amberlite IR120 in H+ form). Mass of the wet resin added to the solution: (a) 0.3 g, (b) 0.8g, (c) 1.0g, (d) 1.5g and (e) 2.0g; (dots) – experimental points, (lines) – predicted curves by simulation
The present kinetic model of ion-exchange accompanied by reactions shown in Eqs.7.7a-b is
under condition of intraparticle diffusion rate control. In this case, the observable rate when
there is a contact between a resin in H+ form and an alkaline solution in a batch (ion-exchange
accompanied by neutralization reaction) is the same as for ordinary ion exchange in infinite
batch (Helfferich, 1965; Blickenstaff et al., 1967b; Blickenstaff et al., 1967a). In both

194 CHAPTER 7
Clean Technologies for the Purification of Wastewaters: Adsorptive Parametric Pumping
situations, the concentration of +H ion is zero at the interface resin/bulk solution. Helfferich
(Helfferich, 1962) has derived the fractional attainment of equilibrium – )(tG function – for
the ordinary ion-exchange in infinite batch. Based on the fact that ion-exchange process
within the exchanger particle is the same for ordinary ion-exchange as well for ion-exchange
accompanied by neutralization reaction, rate laws for this last process can be calculated
depending on the relative ionic capacity of the solution and the resin phases:
1- The amount of counter-ion in the solution is sufficiently large that sorT VCVq < (where oC
is initial concentration of the counter-ion in the solution); if this condition is retained, the
fractional attainment of equilibrium during neutralization is equally given by )(tG (Helfferich,
1965).
2- The amount of resin is sufficiently large that sorT VCVq > that means the amount of
counter-ion in the solution is not enough to convert all of the resin from its original form to
counter-ion form. The critical time ( )Ct is defined to represent a time required for exhaustion
of the solution. While the critical time is not reached (0≤ t ≤ Ct ), the rate law described
remains valid and the fractional attainment of equilibrium is defined as ( ) )(/ 0 tGVCVq srT .
For t ≥ Ct , then the fractional attainment of equilibrium during neutralization is unity meaning
there is no more ion-exchange.
According to our experimental results two cases can be verified considering the ion-exchange
process. First, when the amount of exchangeable ion Na+ in the solution is higher than the
amount of +H ion in the resin ( sorT VCVq < ); this situation can be observed when 0.3g and
0.8g (Figure 7.4a and Figure 7.4b, respectively) of resin is added to the solution.
Another case is when ( sorT VCVq > ), that means the amount of the +Na ions in the solution
is smaller than the exchangeable ion in the resin. Then the ion-exchanger cannot be
completely converted to +Na form. Conversion is progressing with a finite rate until all +Na
are used. If there is only NaOH solution and exchanger in +H form involved in the process
the equilibrium is represented by a rectangular isotherm and after reaching equilibrium there
is no +Na ion remain in the solution. Applying this theory to studied system should result in +Na ions total consumption, vanillin and water formation and pH of the solution equal

Recovery of vanillin from Kraft lignin oxidation by ion-exchange 195
Clean Technologies for the Purification of Wastewaters: Adsorptive Parametric Pumping
pH=4.5 ( dpK =7.4). The dissociation constant of vanillin at the temperature 293 K is dK =
3.98 10-8 L equiv-1(Englis and Wollermann, 1957). As it can be observed from Figs. 4c-e,
where 1.0 g, 1.5 g and 2.0 g of resin is added, the pH of the solution is always higher than pH
mentioned before (pH=4.5) and still some small amount of +Na ion remains. This fact can be
explained by the presence of weak acid (vanillin) in the solution which has an influence on
equilibrium. Figure 7.3 demonstrating equilibrium of +Na ions onto Amberlite IR120H for
the system under consideration confirm that the isotherm is not exactly rectangular and a
reversible reaction as shown in Eq.7.7b is taking place in this case. The concentration of the +Na ions at the surface is assumed to be at equilibrium with the interstitial liquid. Then the
equilibrium shown on the Figure 7.3 must be included in the model of the process. The
mathematical model used, which involved intraparticle diffusion describes quite well the
batch ++ HNa / ion-exchange process accompanied by neutralization onto Amberlite IR120H
at the temperature 293 K.
Figure 7.5a-b shows theoretical concentration profiles of sodium in the resin and hydrogen
ions in the resin homogeneous particle at different times (for the case of 0.8 g wet resin in
solution). When the ionic exchange process is running, exchanger resin is being saturated by
the sodium ions and hydrogen ions diffuse to the surface and react conform to the Eq.7.7. The
Na+ concentration at the resin surface obeys an equilibrium relation – Eq.7.16 – and ion
exchange is not complete such that H+ ions still remain into the resin at the stationary state
(equilibrium condition). Of course, the average resin concentration of the ion Na+ increases
until the value of resin concentration at surface, which is in equilibrium with the bulk phase.
Under conditions of ion exchange accompanied by neutralization with strong bases, the
concentration of the ion H+ at surface is assumed to be zero (Helfferich, 1965; Blickenstaff et
al., 1967b; Blickenstaff et al., 1967a; Haub and Foutch, 1986a) and consequently qNa+ equal
to total capacity of the resin; however, with our experimental observations, in presence of
weak acid as vanillin this situation is not observed.

196 CHAPTER 7
Clean Technologies for the Purification of Wastewaters: Adsorptive Parametric Pumping
Figure 7.5 Dimensionless resin concentration profiles of hydrogen (a) and sodium (b) ions in the
resin homogeneous particle at different times. Case of 0.8 g wet resin in solution.
7.4.2 Fixed-bed performance
The fixed bed ion-exchange process of +Na ions onto polymeric resin Amberlite IR120H ions
was studied in a laboratory scale to investigate the influence pH on the ion-exchange process.
The ion-exchange fixed-bed experiments were performed at the temperature 293 K and flow-
rate 19 mL min-1. The feed concentrations of each species in the liquid phase are reported in
the Table 7.3. The different experiments were carried out at different pH 8.2, 11.4, 11.9 and
12.1. The column was initially filled with ion-exchange resin Amberlite IR120 in H+ form
and deionized water at the pH=6.1 (bed porosity is 0.4).
In Figure 7.6 and Figure 7.7, one can notice ion-exchange profiles of the +Na ions, vanillate
(VNa ), vanillin (VH ) and pH at different feed solutions (mixtures of NaOH and vanillin) in
the fixed bed system. Figure 7.6 shows the breakthrough curve of the vanillate in the fixed
bed when a solution of vanillate and vanillin at the pH 8.2 is fed.

Recovery of vanillin from Kraft lignin oxidation by ion-exchange 197
Clean Technologies for the Purification of Wastewaters: Adsorptive Parametric Pumping
Table 7.3 Feed experimental concentration of vanillin ( VHC ), vanillate ( VNaC ), total ( TVC ) and
measured pH and calculated pHT (according to the Eq.7.4 – Fixed-bed system.
feedC (equiv L-1) −OHC
(equiv L-1) VNaC VHC T
VC pHT pH
0.03 0.03 0.005 0.035 8.1 8.2
0.04 0.033 0 0.033 11.9 11.4
0.05 0.033 0 0.033 12.2 11.9
0.06 0.033 0 0.033 12.4 12.1
Following the chemical reaction of the Eq.7.6 and considering the eletroneutrality in bulk
liquid phase, all amount of +Na ions is under vanillate (VNa ) form. Thus, the simulated curve
for +Na ion is equal to the experimental and simulated curve for sodium vanillate. Moreover,
when the ion exchange operation starts there is no vanillin coming out from the column until
its breakthrough. Therefore, vanillin history starts at zero (because the initial condition of the
bed) and vanillin increases to the plateau at the space time (see also Figure 7.7a-c). In the
model, the electroneutrality principle in the bulk phase is used to calculate the amount of
vanillate and Eq.7.20 – describing the total amount of vanillin and vanillate experimentally
determined TVC – is applied to calculate the amount of vanillin. Since we assume that the co-
ion species are not interacting with the resin and the value of TVC must be constant, the
concentration of vanillin is equal to the value of TVC while the Na+ ion does not
breakthrough.
Figure 7.7a-c show concentration profiles for ion sodium, vanillate, vanillin and pH versus
time for cases of pH 11.4, 11.9 and 12.1. When pH of the feed solution increases, the vanillin
appears in the outlet of the column earlier (even if there is the same amount of vanillate in the
feed solution). The high pH value and high concentration of +Na ions is result of sodium
hydroxide added to the vanillin solution. Of course, the resin will be converted to sodium
form earlier when there are larger concentrations of +Na ions in the liquid phase. The pH
behaviour is always decreasing from the value 6.1 (initial condition of the column) to the
value around 4.5 corresponding to pH of the pure vanillin and then increases along with the
saturation of the resin. The pH (and, therefore, the behavior of H+ ions) changes according to

198 CHAPTER 7
Clean Technologies for the Purification of Wastewaters: Adsorptive Parametric Pumping
the buffer vanillate/vanillin formed during the ion-exchange process. A slight change in the
composition of the salt and the weak acid provides a significant change in the pH value.
Figure 7.6 Ion-exchange profiles of the studied system +Na ions, vanillate (VNa ), vanillin (VH ) and pH. Feed solution: mixture of 0.03 equiv L-1 NaOH and vanillin (pH=8.2). (dots) – experimental profile and (lines) – predicted concentration.. Conditions in column (150 x 20 mm, I.D.): Q = 19 cm3 min-1; pHinitial = 6.1; 293 K
The theoretical amount of vanillin (VH ) as a weak acid and vanillate (VNa ) as a salt of weak
acid and strong base in the solution as a function of pH value is illustrated in Figure 7.8.
It can be observed from the figure that the pH=4.5 corresponds to pure vanillin in solution,
pH=7.4, which is pKd of vanillin at the equivalence point. At pH=10 only vanillate is present
in the solution. After pH of the solution reaches pH at the equivalence point of the system
vanillin/vanillate, the pH values start to be regulated by the amount of hydroxyls anions
( −OH ) in the solution.

Recovery of vanillin from Kraft lignin oxidation by ion-exchange 199
Clean Technologies for the Purification of Wastewaters: Adsorptive Parametric Pumping
Figure 7.7 Ion-exchange profiles of the studied system +Na ions, vanillate (VNa ), vanillin (VH ) and pH. Feed solution: mixture of (a) 0.04 equiv L-1 NaOH and vanillin (pH=11.4); (b) 0.05 equiv L-1 NaOH and vanillin (pH=11.9); (c) 0.06 equiv L-1 NaOH and vanillin (pH=12.1). (dots) – experimental profile; (lines) - predicted profile. Conditions in column (150 x 20 mm, I.D.): Q = 19 cm3 min-1; pHinitial = 6.1; 293 K
The ion-exchange equilibrium is very fast and one can expect stepped behaviour of the
concentration profiles. All the experiments were performed by using glass column (150 × 20

200 CHAPTER 7
Clean Technologies for the Purification of Wastewaters: Adsorptive Parametric Pumping
mm, I.D.) and liquid was delivered by peristaltic pump. We presume that the dispersion
occurs in the column and the tubes used in the experimental set-up. The axial dispersion
coefficient was obtained by fitting experimental data and the value is axD = 6.0 10-4 m2 s-1.
Generally, in all cases our model predicts experimental data satisfactorily.
Figure 7.8 Influence of the pH values on fraction of both vanillin forms in liquid phase.
As it has been pointed out earlier, the lignin heated under reflux conditions for long time in
the presence of active alkali produces vanillin under vanillate form. The Kraft process is a
method for cooking wood, where a mixture of sodium hydroxide and sodium sulfite is used –
see Figure 7.1. It is worth mentioning that besides producing vanillin, the lignin oxidation
process can also lead to the formation of other reaction products such as oxidized lignin,
acetovanillone, dehydrodivanillin, guaiacol, p-hydroxibenzaldehyde and aromatic acids.
These compounds are represented as ‘others’ in Figure 7.1. It is expected that low molecular
weight phenolates in the permeate stream after filtration step will be in salt form as well as
vanillin (in the presence of high alkali medium). This fact will lead to a decrease on the
productivity of the ion-exchange column by its faster saturation and in order to obtain high-
purity vanillin, some another purification step should be necessary. The separation of vanillin
from such a mixture is an important step in its production. We have found the process
described in this work as a possible undemanding technique for the recovery of vanillin from
Kraft process: the vanillate solution is delivered to the column packed with the ion-exchange
resin in +H form and at the outlet the vanillin is collected for a certain time.

Recovery of vanillin from Kraft lignin oxidation by ion-exchange 201
Clean Technologies for the Purification of Wastewaters: Adsorptive Parametric Pumping
7.5 Conclusions
The recovery of vanillin by ion exchange involving neutralization reactions in presence of a
weak acid and a strong base on ion-exchange polymeric resin Amberlite IR120H at 293 K
was studied. The set of batch ion exchange experiments with different mass of ion-exchanger
was carried out in order to obtain the kinetics and equilibrium of the system vanillin/vanillate
on the cationic resin in H+ form. Furthermore, the impact of pH on the ion-exchange process
has been also investigated.
The mathematical model including intra-particle diffusion for system +Na / +H for analyzing
batch and fixed bed systems in vanillin recovery was developed and satisfactorily predicts
uptake curves evaluated by batch experiments and breakthrough and elution curves evaluated
by fixed bed experiments.
In batch operation, the presence of a buffer system comprising of vanillin/vanillate in the ion
exchange process affects the expected rectangular behaviour of isotherm in ion exchange
coupled with neutralization reaction. Thus, the Langmuir model has been used to predict
experimental concentration profiles. In the fixed-bed operation, the breakthrough time of
vanillate depends on the pH of the solution; it is lower when the pH of the feed is higher. The
value of pH during the ion-exchange process changes according the composition of
vanillin/vanillate solution passing through the column packed with ion-exchange resin in +H
form. When the pH of the solution reaches pH at the equivalence point for the buffer
vanillin/salt of vanillin, its value is regulated by the amount of hydroxyl anions ( −OH ) in
solution.
The final statement is that the ion exchange processed through the column filled with ion
exchanger in +H form can therefore be useful for recovery of vanillin from the alkaline
solution provided from the process of Kraft lignin oxidation.
7.6 Nomenclature
C concentration in the bulk fluid phase (equiv L-1)
*C bulk liquid phase equilibrium concentration (equiv L-1)

202 CHAPTER 7
Clean Technologies for the Purification of Wastewaters: Adsorptive Parametric Pumping
0C initial concentration in the bulk phase (equiv L-1)
feedC feed concentration (equiv L-1)
TVC total molar measured concentration of vanillate and vanillin (equiv L-1)
D diameter of the column (m)
axD axial dispersion coefficient (m2 s-1)
0iD self diffusion coefficient of ith species (m2 s-1)
pd diameter of the resin particle (m)
efiD effective homogeneous diffusivity (m2 s−1)
PiD effective porous diffusivity (m2 s−1)
Hf dry particle to wet particle mass ratio (g dry resin /g wet resin)
)(tG tabulated conversion function [25] (-)
HNaK − equilibrium constant of the binary ion-exchange isotherm (-)
dK dissociation constant of vanillin (L equiv-1)
wK dissociation constant of water (L equiv-1)
LK langmuir model parameter in ion-exchange equilibrium (L equiv-1)
L length of the bed (m)
iN flux of the thi ion (mol m-2 s)
Q flow rate (m3 s-1)
iq average resin phase concentration in the particle (equiv g-1 dry resin)
*iq equilibrium resin phase concentration (equiv g-1 of dry resin)
Tq total exchange capacity of the resin (equiv g-1 dry resin)

Recovery of vanillin from Kraft lignin oxidation by ion-exchange 203
Clean Technologies for the Purification of Wastewaters: Adsorptive Parametric Pumping
r radius variable (m)
pR radius of the resin particle (m)
T temperature (K)
t time variable (s)
u intersticial velocity (m s-1)
sV volume of solution (L)
rV volume of the resin phase (L)
W wet weight of the resin (g)
z axial variable (m)
iz valence of ith ion
ix ionic fraction in the liquid phase (-)
iy ionic fraction in the resin phase (-)
Greek letters
α hydrogen and sodium effective homogeneous diffusivity ratio (-)
ε bed porosity (-)
pε porosity of the resin particle (-)
sρ density of the wet resin (kg wet resin m-3)
τ bed tortuosity (-)
0λ limiting diffusivity (m2 s-1)
φ electric potential (ergs coulomb-1)
Superscripts and subscripts
i Species
H+ hydrogen ion
Na+ sodium ion

204 CHAPTER 7
Clean Technologies for the Purification of Wastewaters: Adsorptive Parametric Pumping
OH- hydroxyl ion
V- vanilatte ion
VNa sodium vanillate
VH Vanillin
7.7 References
Anderko, A. and Lencka, M. M., Computation of electrical conductivity of multicomponent
aqueous systems in wide concentration and temperature ranges. Industrial & Engineering
Chemistry Research, 36 (5), 1932-1943 (1997).
Anderko, A. and Lencka, M. M., Modeling self-diffusion in multicomponent aqueous
electrolyte systems in wide concentration ranges. Industrial & Engineering Chemistry
Research, 37 (7), 2878-2888 (1998).
Bjorsvik, H. R., Fine chemicals from lignosulfonates. 1. Synthesis of vanillin by oxidation of
lignosulfonates. Organic Process Research & Development, 3 (5), 330-340 (1999).
Bjorsvik, H. R., Liguori, L. and Minisci, F., High selectivity in the oxidation of mandelic acid
derivatives and in O-methylation of protocatechualdehyde: New processes for synthesis of
vanillin, iso-vanillin, and heliotropin. Organic Process Research & Development, 4 (6), 534-
543 (2000).
Blickenstaff, R. A., Wagner, J. D. and Dranoff, J. S., Kinetics of Ion Exchange Accompanied
by Irreversible Reaction .2. Intraparticle Diffusion Controlled Neutralization of a Strong Acid
Exchanger by Strong Bases. Journal of Physical Chemistry, 71 (6), 1670-1674 (1967a).
Blickenstaff, R. A., Wagner, J. D. and Dranoff, J. S., Kinetics of Ion Exchange Accompanied
by Irreversible Reaction .I. Film Diffusion Controlled Neutralization of a Strong Acid
Exchanger by Strong Bases. Journal of Physical Chemistry, 71 (6), 1665-1669 (1967b).
Bryan, C. C., "Manufacture of Vanillin from Lignin". CA 515266, 1955.
Burri, J., Graf, M., Lambelet, P. and Loliger, J., Vanillin - More Than a Flavoring Agent - a
Potent Antioxidant. Journal of the Science of Food and Agriculture, 48 (1), 49-56 (1989).

Recovery of vanillin from Kraft lignin oxidation by ion-exchange 205
Clean Technologies for the Purification of Wastewaters: Adsorptive Parametric Pumping
Cerrutti, P., Alzamora, S. M. and Vidales, S. L., Vanillin as an antimicrobial for producing
shelf-stable strawberry puree. Journal of Food Science, 62 (3), 608-610 (1997).
Craig, D. and Logan, C. D., Pulp & Paper, 45, 137 - (1971).
Daugsch, A. and Pastore, G., Production of vanillin: A biotechnological opportunity. Quimica
Nova, 28 (4), 642-645 (2005).
de Lucas, A., Valverde, J. L., Romero, M. C., Gomez, J. and Rodriguez, J. F., The ion
exchange equilibria of Na+/K+ in nonaqueous and mixed solvents on a strong acid cation
exchanger. Chemical Engineering Science, 57 (11), 1943-1954 (2002).
Delucas, A., Zarca, J. and Canizares, P., Ion-Exchange Equilibrium of Ca-2+ Ions, Mg-2+
Ions, K+ Ions, Na+ Ions, and H+ Ions on Amberlite Ir-120 - Experimental-Determination and
Theoretical Prediction of the Ternary and Quaternary Equilibrium Data. Separation Science
and Technology, 27 (6), 823-841 (1992).
Englis, D. T. and Wollermann, L. A., Significance of Ph in Determination of Vanillin by
Ultraviolet Absorption. Analytical Chemistry, 29 (8), 1151-1153 (1957).
Fargues, C., Mathias, A. and Rodrigues, A., Kinetics of Vanillin Production from Kraft
Lignin Oxidation. Industrial and Engineering Chemistry Research, 35 (1), 28-36 (1996).
Fitzgerald, D. J., Stratford, M., Gasson, M. J. and Narbad, A., The potential application of
vanillin in preventing yeast spoilage of soft drinks and fruit juices. Journal of Food
Protection, 67 (2), 391-395 (2004).
Fitzgerald, D. J., Stratford, M., Gasson, M. J. and Narbad, A., Structure-function analysis of
the vanillin molecule and its antifungal properties. Journal of Agricultural and Food
Chemistry, 53 (5), 1769-1775 (2005).
Forss, K. G., Talka, E. T. and Fremer, K. E., Isolation of Vanillin from Alkaline Oxidized
Spent Sulfite Liquor. Industrial & Engineering Chemistry Product Research and
Development, 25 (1), 103-108 (1986).
gPROMS, gPROMS v2.2 User Guide.Process System Enterprise Ltd. (2003).

206 CHAPTER 7
Clean Technologies for the Purification of Wastewaters: Adsorptive Parametric Pumping
Haub, C. E. and Foutch, G. L., Mixed-Bed Ion-Exchange at Concentrations Approaching the
Dissociation of Water .1. Model Development. Industrial & Engineering Chemistry
Fundamentals, 25 (3), 373-381 (1986a).
Haub, C. E. and Foutch, G. L., Mixed-Bed Ion-Exchange at Concentrations Approaching the
Dissociation of Water .2. Column Model Applications. Industrial & Engineering Chemistry
Fundamentals, 25 (3), 381-385 (1986b).
Helfferich, F., Ion-Exchange. McGraw-Hill Book Company, New York, NY, 1962.
Helfferich, F., Ion-Exchange Kinetics .V. Ion Exchange Accompanied by Reactions. Journal
of Physical Chemistry, 69 (4), 1178-1187 (1965).
Hibbert, H. and Tomlinson, G. H. J., "United states Patent". 2069 185, Jan. 26, 1937, 1937.
Hocking, M., Vanillin: Synthetic flavoring from spent sulfite liquor. Journal of Chemical
Education, 74 (12), 1384-1384 (1997).
Kataoka, T. and Yoshida, H., Kinetics of Ion-Exchange Accompanied by Neutralization
Reaction. Aiche Journal, 34 (6), 1020-1026 (1988).
Keshava, C., Keshava, N., Ong, T. M. and Nath, J., Protective effect of vanillin on radiation-
induced micronuclei and chromosomal aberrations in V79 cells. Mutation Research-
Fundamental and Molecular Mechanisms of Mutagenesis, 397 (2), 149-159 (1998).
Krueger, D. A. and Krueger, H. W., Carbon Isotopes in Vanillin and the Detection of
Falsified Natural Vanillin. Journal of Agricultural and Food Chemistry, 31 (6), 1265-1268
(1983).
Lomascolo, A., Lesage-Meessen, L., Labat, M., Navarro, D., Delattre, M. and Asther, M.,
Enhanced benzaldehyde formation by a monokaryotic strain of Pycnoporus cinnabarinus
using a selective solid adsorbent in the culture medium. Canadian Journal of Microbiology,
45 (8), 653-657 (1999).
Melis, S., Markos, J., Cao, G. and Morbidelli, M., Separation between amino acids and
inorganic ions through ion exchange: Development of a lumped model. Industrial &
Engineering Chemistry Research, 35 (10), 3629-3636 (1996).

Recovery of vanillin from Kraft lignin oxidation by ion-exchange 207
Clean Technologies for the Purification of Wastewaters: Adsorptive Parametric Pumping
Muheim, A. and Lerch, K., Towards a high-yield bioconversion of ferulic acid to vanillin.
Applied Microbiology and Biotechnology, 51 (4), 456-461 (1999).
Pearl, I. A., Vanillin from lignin materials. Journal of the American Chemical Society, 64 (6),
1429-1431 (1942).
Pieroni, L. J. and Dranoff, J. S., Ion Exchange Equilibria in a Ternary System. Aiche Journal,
9 (1), 42-45 (1963).
Rodrigues, A. E., Ion exchange: Science and Technology. Kluwer Academic Pub, 1986.
Rodriguez, J. F., Valverde, J. L. and Rodrigues, A. E., Measurements of effective self-
diffusion coefficients in a gel-type cation exchanger by the zero-length-column method.
Industrial & Engineering Chemistry Research, 37 (5), 2020-2028 (1998).
Sandborn, L. R. and Salvesen, J. R., "Process of making Vanillin". US 2 057 117, 1936.
Smolyakov, B. S., Limiting equivalent conductivities of ions in water between 25°C and
200°C. VINITI, 776 (69), (1969).
Thibault, J. F., Asther, M., Ceccaldi, B. C., Couteau, D., Delattre, M., Duarte, J. C., Faulds,
C., Heldt-Hansen, H. P., Kroon, P., Lesage-Meessen, L., Micard, V., Renard, C., Tuohy, M.,
Van Hulle, S. and Williamson, G., Fungal bioconversion of agricultural by-products to
vanillin. Food Science and Technology-Lebensmittel-Wissenschaft & Technologie, 31 (6),
530-536 (1998).
Valverde, J. L., De Lucas, A., Carmona, M., Gonzalez, M. and Rodriguez, J. F., A
generalized model for the measurement of effective diffusion coefficients of heterovalent ions
in ion exchangers by the zero-length column method. Chemical Engineering Science, 59 (1),
71-79 (2004).
Van Ness, J. H., "Vanillin" in Kirk-Othmer Encyclopedia of Chemical Technology, A.
Standen, eds. John Wiley & Sons, New York, pp. 704, 1983.
Walton, N. J., Mayer, M. J. and Narbad, A., Molecules of interest - Vanillin. Phytochemistry,
63 (5), 505-515 (2003).

208 CHAPTER 7
Clean Technologies for the Purification of Wastewaters: Adsorptive Parametric Pumping
Walton, N. J., Narbad, A., Faulds, C. B. and Williamson, G., Novel approaches to the
biosynthesis of vanillin. Current Opinion in Biotechnology, 11 (5), 490-496 (2000).


8. Conclusion and future work
Adsorption of phenol, salicylic acid and 4-nitrophenol onto polymeric resins (Sephabeads
SP206 and Sephabeads SP207, Amberlite XAD16, Duolite S861) and activated carbon
(Filtrasorb F400) was investigated. Batch experiments were carried out to provide a screening
of adsorbents focused on the effect of temperature on the adsorptive behavior. Langmuir
isotherm model described adequately the adsorption equilibrium of phenol, salicylic acid and
4-nitrophenol on the adsorbents used.
The effect of temperature, concentration, bed length and flow rate on the fixed bed adsorption
of phenolic compounds onto each polymeric adsorbents and activated carbon was studied.
The effect of temperature on the fixed bed adsorption of phenol, salicylic acid and 4-
nitrophenol was more important for the polymeric resins, especially for Sephabeads SP206,
than for the activated carbon Filtrasorb F400. The prediction of breakthrough curves based on
a linear driving force (LDF) rate model to describe the diffusional mass transfer were in good
agreement with the experimental results for the adsorption of phenolic compounds studied.
Although the activated carbon (Filtrasorb F400) exhibited the highest adsorption capacity for
salicylic acid (Q =351, 0 mg g-1of dry resin) and for phenol (Q =169, 1 mg g-1of dry resin)
compared to polymeric adsorbents, the separation potential b as an indicator of the efficiency
of thermal parametric pumping was found to be much higher for the polymeric adsorbent
Sephabeads SP206 for phenol, salicylic acid and 4-nitrophenol in the range of temperature
considered 293-333 K.

210 CHAPTER 8
Thermal parametric pumping in recuperative mode was carried out using Sephabeads SP206
for purification of wastewater containing salicylic acid, phenol and 4-nitrophenol in a pilot
plant. By applying a temperature for cold cycle Tc = 293 K and for hot cycle Th = 333 K a
high level of purification was obtained. Operational conditions define the degree of
purification which can be obtained by thermal parametric pumping process. The concentration
of all phenolic compounds in the bottom reservoir decreased significantly. The degree of
separation of phenol and 4-nitrophenol was very similar, although slightly higher for phenol,
which has slightly higher molecular diffusion. Under appropriate conditions, at the 10th cycle
it was possible to obtain C for phenol and to C for 4-
nitrophenol. The degree of salicylic acid purification was almost 100 times less than feed
concentration. It was concluded that a high degree of purification of phenolic wastewaters
may be achieved by thermal parametric pumping process using Sephabeads SP206 as
adsorbent and therefore avoiding the use of any chemical regenerant.
0003.0/ =C 0013.0/ =CFbottom Fbottom
Adsorption of vanillin onto non-ionic polymeric resins Sephabeads SP206 at different
temperatures and concentration of sodium hydroxide were studied as well. The adsorption
equilibrium isotherms obtained from batch experiments at the temperatures 293, 310 and 333
K were described by Langmuir isotherm model. The saturation capacity of Sephabeads
SP206, Q =7.534 ×10⁻⁴ mol g-1 of dry resin was found to be independent of the temperature.
The impact of sodium hydroxide on the adsorption of vanillin was also investigated. It was
found that at concentration of sodium hydroxide higher than 1M the adsorbed amount of the
vanillin onto the polymeric adsorbent SP206 was reduced significantly. A modified Langmuir
model was applied to describe the adsorption equilibrium of vanillin in presence of sodium
hydroxide.
Fixed-bed adsorption of vanillin onto polymeric resin SP206 has been studied. The influence
of concentration of sodium hydroxide, temperature, flowrates and feed concentration on
adsorption of vanillin in fixed-bed operation has been investigated. A mathematical model
including linear driving force for intraparticle mass transfer and reaction in liquid phase for
the system vanillin/sodium hydroxide reasonably predicts all dynamic adsorption experiments
in column.
The membrane ultrafiltration process particularly focused on the recovery of vanillin from
Kraft lignin oxidation products was studied by using ceramic tubular membranes with
Clean Technologies for the Purification of Wastewaters: Adsorptive Parametric Pumping

Conclusion and future work 211
molecular weight cut-off of 1, 5, 15 and 50 kDa. The feed concentration of lignin and vanillin
in the mixture was chosen to simulate the conditions of the mixture leaving the Kraft lignin
oxidation reactor. It was found that the ultrafiltration technique can be employed in the
vanillin recovery since most of the lignin is rejected during the process. The rejection of
lignin is always increasing with the cut-off of the membrane.
The best results were observed by using a membrane of 1 kDa cut-off where the lignin
rejection is 97% for lignin feed concentration of 60 g L-1. Even higher rejection was observed
(almost 99%) when the feed concentration is 2 g L-1 of lignin was used. Also, the formation of
gel layer at the membrane surface has a significant influence on the process leading to the
permeate flux decline especially at high feed concentration of lignin. Therefore it is suggested
to carry out the membrane process in two steps to obtain high purity of vanillin in the
permeate stream. The ceramic membranes have unique properties such as wide operating pH
range, temperature resistance and can stand up several cleaning cycles. Easy and appropriate
cleaning procedure can result in a rapid permeate flux recovery without significant damage of
the membrane.
Apart from the use of non-ionic polymeric resin SP206, a strong cation ion-exchange resin
Amberlite IR 120H was applied to the vanillin recovery from reaction media in the Kraft
lignin oxidation process. The recovery of vanillin is a result of ion-exchange involving
neutralization reactions in presence of a weak acid and a strong base. The kinetics and
equilibrium of the system vanillin/vanillate/ cationic resin was obtained from batch ion-
exchange experiments. It was found that the pH during the ion-exchange process changes
according to the composition of vanillin/vanillate solution passing through the column. The
breakthrough time of vanillate strongly depends on the pH of feed solution; it is shorter when
the pH of the feed is higher. A mathematical model including intra-particle diffusion for
system Na+ + /H was developed and satisfactorily predicts the uptake curves from batch
experiments and breakthrough and elution curves in fixed bed experiments. The ion-
exchange process where vanillin alkaline solution is passed through a column filled with ion
exchanger in H + form can be useful for the recovery of vanillin from Kraft lignin oxidation
mixture.
Interesting results in the field of ultrafiltration and ion-exchange processes applied to the
vanillin recovery from Kraft lignin oxidation were found. The integration of those processes
Clean Technologies for the Purification of Wastewaters: Adsorptive Parametric Pumping

212 CHAPTER 8
can lead to a suitable flowsheet applied in the vanillin production from Kraft lignin oxidation
process. Future work should be focused on the integration of individual steps and construction
of a prototype to illustrate the technology from raw-material to the fine product vanillin.
The integrated process will look like the scheme below combining reaction and separation
steps (membrane, ion-exchange, evaporation/crystallization).
Figure 8.1 Scheme of integrated process to produce vanilin
Clean Technologies for the Purification of Wastewaters: Adsorptive Parametric Pumping


APPENDICES


A. Safety Data
A.1 Phenol Safety Data (Sigma-Aldrich)
A.1.1 General
Synonyms: benzenol, carbolic acid, hydroxybenzene, monohydroxybenzene, monophenol,
oxybenzene, phenic acid, phenylic acid, phenyl alcohol, phenyl hydrate, phenyl hydroxide,
phenylic alcohol
Molecular formula: C H OH 6 5
CAS No: 108-95-2
EC No: 203-632-7
A.1.2 Physical data
Appearance: colourless crystals with a characteristic odour

A-2 Safety data
Melting point: 40 - 42 ºC
Boiling point: 182 ºC
Vapour pressure: 0.35 mm Hg at 20 ºC
Specific gravity: 1.07
Flash point: 79 ºC
Explosion limits: 1.5 – 8.6 %
Autoignition temperature: 715 ºC
Water solubility: soluble
A.1.3 Stability
Stable. Substances to be avoided include strong oxidizing agents, strong bases, strong acids,
alkalies and calcium hypochlorite. Flammable. May discolour in light.
A.1.4 Toxicology
This material is a systemic poison and constitutes a serious health hazard. The risks of using it
in the laboratory must be fully assessed before work begins. Vesicant. Typical MEL 2 ppm;
typical OEL 1 ppm. Acute poisoning by ingestion, inhalation or skin contact may lead to
death. Phenol is readily absorbed through the skin. Highly toxic by inhalation. Corrosive -
causes burns. Severe irritant.
A.1.5 Toxicity data
Oral human lowest published lethal dose (ORL-HMN LDLO) 140 mg kg-1 Oral rat lethal dose
50 percent kill (ORL-RAT LD50) 317 mg kg-1 Intraperitoneal rat lethal dose 50 percent kill
(IPR-RAT LD50) 127 mg kg-1 Oral rabbit lowest published lethal dose (ORL-RBT LDLO)
420 mg kg-1 Administration onto skin rat lethal dose 50 percent kill (SKN-RAT LD50) 669
mg kg-1
Clean Technologies for the Purification of Wastewaters: Adsorptive Parametric Pumping

Safety data A-3
A.1.6 Risk phrases
R24 Toxic in contact with skin
R25 Toxic if swallowedR34 Causes burns
R36 Irritating to eyes
R37 Irritating to respiratory system
R38 Irritating to skin
A.1.7 Transport information
UN No 1671. Hazard class 6.1. Packing group II.
A.1.8 Personal protection
Safety glasses, gloves, good ventilation.
A.2 4-Nitrophenol Safety Data (Sigma-Aldrich)
A.2.1 General
Synonyms: p-nitrophenol, 4-hydroxynitrobenzene, p-hydroxynitrobenzene, PNP, NCI-
C55992, UN 1663, niphen
Use: plasticizer, insect repellant
Molecular formula: C6H NO5 3
CAS No: 100-02-7
Clean technologies for the Purification of Wastewaters: Adsorptive Parametric pumping

A-4 Safety data
EC No: 202-811-7
A.2.2 Physical data
Appearance: Yellow to tan crystals or powder
Melting point: 113 - 115 ºC (sublimes)
Boiling point: ca. 279 ºC (decomposes)
Vapour pressure: 1.0 mm Hg at 100 ºC
Density: 1.48 g/ml
Flash point: 192 ºC
Autoignition temperature: 282 C
A.2.3 Stability
Stable. Incompatible with strong oxidizing agents, strong bases, organics, combustible
material, reducing agents. Combustible.
A.2.4 Toxicology
Possible mutagen. Toxic if swallowed, inhaled or absorbed through skin. Eye, skin and
respiratory irritant. Corrosive.
A.2.5 Toxicity data
Subcutaneous rat lowest published lethal dose (SCU-RAT LDLO) 200 mg kg-1 Intravenous
dog lowest published lethal dose (IVN-DOG LDLO) 10 mg kg-1 Intraperitoneal mouse lethal
dose 50 percent kill (IPR-MUS LD50) 75 mg kg-1 Unreported mammal (species unspecified)
lethal dose 50 percent kill (UNR-MAM LD50) 175 mg kg-1
Oral rat lethal dose 50 percent kills (ORL-RAT LD50) 202 mg kg-1 A.2.6 Risk phrases
R23 Toxic by inhalation
R24 Toxic in contact with skin
Clean Technologies for the Purification of Wastewaters: Adsorptive Parametric Pumping

Safety data A-5
R25 Toxic if swallowed
R34 Causes burns
A.2.6 Transport information
Hazard class: 6.1. Packing group: III
A.2.7 Personal protection
Safety glasses, gloves, good ventilation
A.3 Salicylic acid Safety Data (Sigma-Aldrich)
A.3.1 General
Synonyms: 2-hydroxybenzoic acid, o-hydroxybenzoic acid, retarder W, SA, SAX, Verrugon
Molecular formula: C7H O6 3
CAS No: 69-72-7
EC No: 200-712-3
A.3.2 Physical data
Appearance: white powder
Melting point: 161 ºC
Boiling point: 211 ºC at 20 mm Hg
Vapour density: Not available
Vapour pressure: 1 mm Hg at 114 ºC
Clean technologies for the Purification of Wastewaters: Adsorptive Parametric pumping

A-6 Safety data
Specific gravity: Not available
Flash point: 157 ºC
Explosion limits: not available
Ignition temperature: 545 ºC
A.3.3 Stability
Stable. Substances to be avoided include oxidizing agents, strong bases, iodine, fluorine.
Combustible. Sensitive to light.
A.3.4 Toxicology
Harmful by inhalation, ingestion and through skin absorption. Irritant. Chronic effects:
laboratory experiments have shown mutagenic effects. May cause harm to the unborn child.
May act as a sensitizer.
A.3.5 Toxicity data
Oral rat lethal dose 50 percent kill (ORL-RAT LD50) 891 mg kg-1 Oral mouse lethal dose 50
percent kill (ORL-MUS LD50) 480 mg kg-1 Inhalation mammal (species unspecified) lethal
dose 50 percent kill (IHL-MAM LC50) > 300 mg m-3
A.3.6 Risk phrases
R22 Harmful if swallowed
R36 Irritating to eyes
R37 Irritating to respiratory system
R38 Irritating to skin
R41 Risk of serious damage to the eyes
R61 May cause harm to the unborn child
Clean Technologies for the Purification of Wastewaters: Adsorptive Parametric Pumping
Safety data A-7
A.3.7 Transport information
Not regulated
A.3.8 Personal protection
Safety glasses. Do not breathe dust
A.4 Vanillin Safety Data (Sigma-Aldrich)
A.4.1 General
Synonyms: 4-hydroxy-m-anisaldehyde, 4-hydroxy-3-methoxybenzaldehyde, zimco, vanilline,
vanillaldehyde, vanillic aldehyde, lioxin
Molecular formula: C H O8 8 3
CASNo:121-33-5
A.4.2 Physical data
Appearance: white crystals with vanilla odour
Melting point: 81 - 83 ºC
Boiling point: 285 ºC; 170 ºC at 15 mm Hg
Vapour density: 5.3 (air = 1)
Vapour pressure: 1 mm Hg at 107 ºC
-3Density (g cm ): 1.05
Flash point: Not available
Clean technologies for the Purification of Wastewaters: Adsorptive Parametric pumping
A-8 Safety data
Explosion limits: Not available
Water solubility: slight
A.4.3 Stability
Stable. May discolour on exposure to light. Moisture-sensitive. Incompatible with strong
oxidizing agents, perchloric acid.
A.4.4 Toxicology
Harmful if swallowed. May be harmful by inhalation or in contact with skin. Eye irritant.
A.4.5 Toxicity data
Oral rat lethal dose 50 percent kill (ORL-RAT LD50) 1580 mg kg-1 Intraperitoneal rat lethal
dose 50 percent kill (IPR-RAT LD50) 1160 mg kg-1 Administration onto skin rabbit lethal
dose 50 percent kill (SKN-RBT LD50) >5010 mg kg-1
A.4.6 Risk phrases
R22 Harmful if swallowed
R36 Irritating to eyes
A.4.7 Transport information
Non-hazardous for road, air and sea transport
A.4.8 Personal protection
Safety glasses.
Clean Technologies for the Purification of Wastewaters: Adsorptive Parametric Pumping

Safety data A-9
A.5 Lignin Safety Data (Sigma-Aldrich)
A.5.1 General
Synonyms: not reported
Use: extender for plastics, emulsion stabilizer
Molecular formula: macromolecule
CAS No: 9005-53-2
A.5.2 Stability
Stable. Incompatible with strong oxidizing agents.
A.5.3 Toxicology
No toxicological data available
Clean technologies for the Purification of Wastewaters: Adsorptive Parametric pumping

A-10 Safety data
A.5.4 Toxicity data
Not reported
A.5.5 Risk phrases
Not reported
A.5.6 Transport information
Not reported
A.5.7 Personal protection
No safety data available - treat as potentially harmful.
A.6 Sodium Hydroxide Safety Data (Sigma-Aldrich)
A.6.1 General
Synonyms: caustic soda, soda lye, lye, white caustic, aetznatron, ascarite, Collo-Grillrein,
Collo-Tapetta, sodium hydrate, fotofoil etchant, NAOH, STCC 4935235, sodium hydroxide
pellets, Lewis red devil lye
Molecular formula: NaOH
CASNo:1310-73-2
ECNo:215-185-5
Annex I Index No: 011-002-00-6
Clean Technologies for the Purification of Wastewaters: Adsorptive Parametric Pumping

Safety data A-11
A.6.2 Physical data
Appearance: odourless white solid (often sold as pellets)
Melting point: 318 ºC
Boiling point: 1390 ºC
Vapour density: not reported
Vapour pressure: 1 mm Hg at 739 ºC
Specific gravity: 2.12
Flash point: n/a
Explosion limits: n/a
Water solubility: High (Note: dissolution in water is highly exothermic)
A.6.3 Stability
Stable. Incompatible with a wide variety of materials including many metals, ammonium
compounds, cyanides, acids, nitro compounds, phenols, combustible organics. Hygroscopic.
Heat of solution is very high and may lead to a dangerously hot solution if small amounts of
water are used. Absorbs carbon dioxide from the air.
A.6.4 Toxicology
Very corrosive. Causes severe burns. May cause serious permanent eye damage. Very
harmful by ingestion. Harmful by skin contact or by inhalation of dust.
. Typical TLV 2 mg m-1
A.6.5 Toxicity data
Intraperitoneal mouse lethal dose 50 percent kills (IPR-MUS LD50) 40 mg kg-1
Administration into eye (irritant) monkey (EYE-MKY) 1%/24h sev administration onto skin
Clean technologies for the Purification of Wastewaters: Adsorptive Parametric pumping

A-12 Safety data
Clean Technologies for the Purification of Wastewaters: Adsorptive Parametric Pumping
rabbit (SKN-RBT) 500 mg/24h sev Administration into eye (irritant) rabbit (EYE-RBT) 1%
sev
A.6.6 Risk phrases
R35: Causes severe burns
A.6.7 Transport information
Hazard class 8.0. Packing group II. UN No 1823. EMS No 8.0-06
A.6.8 Personal protection
Safety glasses, adequate ventilation, Neoprene or PVC gloves


B. Adsorption of phenol and salicylic acid onto polymeric
resins Amberlite XAD16 and Duolite S861*
B.1 Introduction
Phenol-containing wastewater presents a serious environmental problem since biological
degradation of phenol occurs too slowly or does not occur at all (Kunin, 1976). Adsorptive
processes are widely used in the purification of such polluted streams and diluted wastewaters
(Humphrey, 1995; Keller, 1995; Knaebel, 1995). For some target solutes, it is also interesting
the fact that sorption operations are able to concentrate solutes, especially when these solutes
are valuable compounds.
Phenols are probably the most extensively studied compounds in the field of wastewater
treatment as they are persistent pollutants with high toxicity that are released in the
wastewaters of a considerable number of industries (Morão et al., 2004) Different techniques
are used for the removal of phenolic compounds from wastewater (Lin et al., 2002; Kujawski
et al., 2004). Adsorption of phenolic compounds onto different polymeric adsorbents has been
studied by various groups (Crook et al., 1975; Farrier et al., 1979; Gusler et al., 1993;
* Based on the paper: Comparative study of the adsorption of phenol and salicylic acid from aqueous solution onto nonionic polymeric resins by M. Otero, M. Zabkova, and A. E. Rodrigues, Separation and Purification Technology, 45 (2), 86-95 (2005).

B-2 Adsorption of phenol and salicylic acid onto Amberlite XAD16 and Duolite S861
Clean Technologies for the Purification of Wastewaters: Adsorptive Parametric Pumping
Deosarkar and Pangarkar, 2004). Salicylic acid is a drug compound that nowadays is usually
produced from phenol (Hanesian and Perna, 2000). The manufacture of acetylsalicylic acid
(ASA) is accompanied by the production of phenolic wastewaters containing salicylic acid.
Acetylsalicylic acid-ASA, the salicylate ester of acetic acid, is rapidly hydrolyzed to give
salicylic acid, which is its active form.
The manufacturing of ASA is not the only use of salicylic acid; other applications of salicylic
acid are cosmetics, wart-removing medicines, to externally treat fungus infections, as an acne
topic treatment and to increase the cell turnover as a component of skin creams. This
compound is also employed as food preservative and in plants protection against insects and
pathogens and it is present in wastewaters of different industries. Salicylic acid has also been
shown to be present in the so-called grey wastewaters, which are those from households,
schools, hotels, business complexes as well as some types of industries where no
contributions from toilets, bidets or heavily polluted process water are included (Daughton
and Ternes, 1999; Eriksson et al., 2003).
The performance of any adsorption-based process greatly depends on the effectiveness of
design and operating conditions. Therefore, rigorous approaches to the design and operation
of the adsorption system must be used to ensure efficient applications. In order to get this, the
mechanism and dynamics of adsorption must be understood, as well as major variables that
affect the adsorptive process.
The aim of this work is to describe and compare the adsorption of salicylic acid with that of
its precursor, phenol, onto two different polymeric resins, Duolite S861 and Amberlite
XAD16, both of them polystyrene resins crosslinked with DVB.
The adsorption capacity of the resins as a function of the sorbate concentration in solution,
i.e., the adsorption equilibrium isotherms were measured at different temperatures and results
were fitted to the Langmuir isotherm model. The effect on adsorption of the temperature
variable was addressed as some purification technologies such as parametric pumping are
based on a marked difference on the equilibrium dependence on temperature.
The fixed bed adsorptive performance of Duolite S861 and Amberlite XAD16 was also
compared both for the removal of phenol and salicylic acid. Modeling of the fixed bed
adsorption was made based on the results obtained for adsorption equilibrium isotherms.

Adsorption of phenol and salicylic acid onto Amberlite XAD16 and Duolite S861 B-3
Clean technologies for the Purification of Wastewaters: Adsorptive Parametric pumping
Experiments at different temperatures were done to further determine the effect of
temperature on adsorption. Also experiments at different flow rates of the feed solution were
carried out.
The present study intends to be useful for evaluating the removal of phenol and salicylic acid
from aqueous solutions by means of polymeric resins in view of their application to the
decontamination of industrial wastewaters. For the oral treatment of poisoning activated
carbon has been considered (Moores and Spector, 1986; Merigian and Blaho, 2002;
Osterhoudt et al., 2004).
B.2 Experimental part
B.2.1 Chemicals and adsorbents
Salicylic acid (C7H6O3) and phenol (C6H6O) were both purchased from Sigma-Aldrich
(Spain). Their solutions were prepared with degassed and distilled water.
Two nonionic polymeric resins were used to adsorb these phenolic compounds: Duolite S861,
which was purchased from Auchtel Products Ltd. India, and Amberlite XAD16, which was
obtained from Rohm and Haas (France).
Nonionic polymeric resins have previously been successfully used for phenol and phenolic
derivatives adsorption (Ferreira and Rodrigues, 1995b; Ferreira and Rodrigues, 1995a; Díez et
al., 1998; Davesac et al., 2000). Table B.1 summarizes the data supplied by the manufacturers
on the physical characteristics of the resins used in this work.
Table B.1 Physical properties of polymeric resins Duolite S861 and Amberlite XAD16. Adsorbent Duolite S861a Amberlite XAD16b
Matrix Aromatic porous resin with hydrophobic substituents
Aromatic porous resin with hydrophobic substituents
Chemistry Polystyrene DVB Polystyrene DVB Physical form White beads White translucent Humidity factor ( hf ) 0.28 0.34
Density (kg m-3) 1020 1020
Particle size (m) 5.6 x10⁻⁴ 4.7x10⁻⁴ Porosity 0.72 0.55 a) from Auchtel Products Ltd. (India) b) from Rhom and Haas (France)

B-4 Adsorption of phenol and salicylic acid onto Amberlite XAD16 and Duolite S861
Clean Technologies for the Purification of Wastewaters: Adsorptive Parametric Pumping
B.2.2 Batch adsorption
Adsorption equilibrium experiments were carried out by contacting the corresponding amount
of adsorbent with 100 mL of salicylic acid or phenol solution in 250 mL Erlenmeyer flasks.
Initial concentration on the solution was around 100 mg L-1 in all experiments. Adsorption
equilibrium isotherms were measured by batch equilibration placing the volumetric flasks in a
shaking mixer at 150 rpm and using a thermostatic bath for temperature control. Equilibrium
experiments were carried out at 293, 310 and 333 K for each adsorbent-phenol system. After
shaking for 48 h, the solution was separated from the adsorbent and the final concentration of
salicylic acid and phenol in solution were determined by measuring the absorbance at 295 and
272 nm respectively by means of a UV-visible spectrophotometer Jasco (model 7800, Japan).
B.2.3 Fixed-bed adsorption
Dynamic column experiments were carried out by packing the adsorbents in lab-scale
columns (0.30×0.01 m) and feeding these with the corresponding solution. A peristaltic pump
(Watson-Marlow) was used to pump either the salicylic acid or the phenol solution in
downward flow. The temperature of the feed was maintained by a thermostatic bath (Edmund
Bühler). Salicylic acid and phenol concentration at the column outlet were both
spectrophotometrically determined at 295 and 272 nm, respectively, by an UV-visible
spectrophotometer Jasco (model 7800, Japan).
Fixed bed adsorption was studied at three different temperatures: 293, 310 and 333 K.
Experiments at two different feed flow rates, 5.5 and 10 mL min-1, were carried out.
Experimental data obtained by carrying out the previously described adsorption tests were
compared with the simulated results from the modeling of the different experimental
conditions.
B.3 Mathematical models
B.3.1 Adsorption isotherms
The amount of salicylic acid or phenol adsorbed onto the two different adsorbents, *q (mg g-
1), was calculated by a mass balance relationship (Eq. B.1).

Adsorption of phenol and salicylic acid onto Amberlite XAD16 and Duolite S861 B-5
Clean technologies for the Purification of Wastewaters: Adsorptive Parametric pumping
WVCCq )( *
0* −= B.1
where 0C (mg L-1) and *C (mg L-1) are the initial and equilibrium liquid-phase
concentrations, respectively, V the volume of the solution (L) and W the dry weight (g) of
the corresponding polymeric resin.
The adsorption equilibrium isotherms for phenol and salicylic acid onto each adsorbent at
various temperatures, *q (mg g-1) versus the adsorbate liquid concentration at equilibrium, *C (mg L-1) were fitted with the Langmuir model.
The Langmuir equation (Eq. B.2) is based on a theoretical model which assumes that
adsorption occurs onto specific sites of a uniform energetic surface, without interactions
between adsorbed molecules and adsorption is confined to monolayer coverage.
CKCQK
qL
L
+=
1* B.2
where Q is the maximum adsorptive capacity and LK a parameter which relates to the
adsorption energy (Guiochon et al., 1994).
⎟⎠
⎞⎜⎝
⎛ Δ−= ∞
RTH
KK LLL exp B.3
The adsorption enthalpy in the Langmuir constant is generally a net value that includes the
solvent desorption and the solute adsorption (Giles et al., 1974).
The empirical parameters were calculated by MATLAB 6.1 following the optimization
routine and using the Simplex direct search method.
From the equilibrium results, it may be found the separation to be expected as a function of
temperature for each of the systems phenol-adsorbent. The separation parameterb , introduced
by Pigford (Pigford et al., 1973), is indicative of the separation potential:
mab+
=1
B.4
where the average slope 2)()( 21 TmTmm += and the deviation 2)()( 21 TmTma −= ,
considering 21 TT < .

B-6 Adsorption of phenol and salicylic acid onto Amberlite XAD16 and Duolite S861
Clean Technologies for the Purification of Wastewaters: Adsorptive Parametric Pumping
The capacity parameter here appearing is defined as ε
ρε )()1()(
TKfTm hp−
= where
LQKTK =)( corresponding to each temperature.
B.3.2 Fixed bed modeling
The model used to predict the fixed bed adsorption of these phenolic compounds comprises a
mass balance, the adsorption equilibrium isotherm at the liquid/solid interface and a linear
driving force (LDF) rate equation was used to describe the diffusional mass transfer inside
adsorbent particles.
The mass balance in a bed volume element is:
ttzqf
ttzC
ztzCu
ztzCD hpiax ∂
∂−+
∂∂
=∂
∂−
∂∂ ),(1),(),(),(
2
2
ρε
ε B.5
where axD is the axial dispersion coefficient, iu is the interstitial velocity, ε is the bed
porosity, z is the axial position, t is the time, pρ is the adsorbent particle density, hf is the
humidity factor of the corresponding adsorbent, q is the average concentration in the
adsorbent particle and C is the concentration in the bulk fluid phase.
The boundary conditions are the Danckwerts boundary conditions:
0=z )),0((),(00 CtCu
ztzCD izax −=
∂∂
= B.6
Lz = 0),(=
∂∂
=LzztzC B.7
Initial conditions are:
0)0,( =zC ; 0)0,( =zq B.8
The axial dispersion to be included in the mass balance was obtained from the following
expression (Guiochon et al., 1994):
)Re011.02.0( 48.00 +=ax
p
Ddu
B.9
where ηρ pf du0Re = and Péclet number is ( axDLuPe ε0= ).

Adsorption of phenol and salicylic acid onto Amberlite XAD16 and Duolite S861 B-7
Clean technologies for the Purification of Wastewaters: Adsorptive Parametric pumping
The adsorption equilibrium isotherm is described by the Langmuir equation shown above (Eq.
B.2 and B.3).
The adsorption rate can be represented by a Linear Driving Force approximation:
[ ]),(),(),( * tzqtzqkt
tzqs −=
∂∂ B.10
where sk is an overall mass transfer coefficient, *q is the adsorbed phase concentration in
equilibrium with the bulk concentration C and q is the average adsorbed phase concentration
in the adsorbent particle (described as homogeneous). As expressed by this model, the rate of
adsorption into the particle is essentially proportional to the driving force (difference between
adsorbed phase concentration in equilibrium with the bulk fluid concentration and the average
adsorbed concentration in the particle) still required to reach equilibrium (Glueckauf, 1955).
The effective mass transfer coefficient ( sk ) was estimated from the following correlation
(Farooq and Ruthven, 1990; Silva and Rodrigues, 1997; Silva, 2001; Gorbach et al., 2004):
LDFhp
f
php
pe
php
f
p
s kdCdqf
kr
dCdqf
Dr
dCdqf
kr
k1
31531 **2*
+=+= ρρρ B.11
which considers macropore and film resistances to the mass transfer and where sk is the
overall mass transfer coefficient, peD is the effective pore diffusivity, pr is the radius of the
particle of the adsorbent, LDFk is the coefficient accounting for macropore diffusion and
adsorption, fk is the external film mass transfer coefficient and where the derivative (dCdq*
)
represents the average slope of the Langmuir isotherm corresponding to the concentration
range of the experiment.
The second term of the right hand side of (Eq. B.11) corresponds to LDFk/1 (Glueckauf,
1955) where kLDF =15Dpe
rp2ρp fh
dq*
dC
.
The peD (m2 s-1) was calculated as (Reid et al., 1987):

B-8 Adsorption of phenol and salicylic acid onto Amberlite XAD16 and Duolite S861
Clean Technologies for the Purification of Wastewaters: Adsorptive Parametric Pumping
τε mp
pe
DD = B.12
where mD is the molecular diffusivity of salicylic acid in water, τ is the tortuosity of the
adsorbent and pε its porosity.
The molecular diffusivity of salicylic acid in water mD (m2 s-1) was estimated, after the
corresponding unit transformations, according to the Wilke-Chang (Wilke and Chang, 1955)
method, which assigns for the mD (cm2s-1):
6.0
2/18 )(104.7
Am V
TMDη
φ−×= B.13
where φ is the non-dimensional association factor corresponding to the solvent, BM is the
molecular weight of the solvent, T is the corresponding temperature, Bη the viscosity of the
solvent and AV the molar volume of the solute at the normal boiling point. In this study, the
solvent was water and the solutes, phenol and salicylic acid. Wilke and Chang recommended
that φ be chosen 2.6 if the solvent is water. The values of AV were estimated by the Le Bas
additive method (Reid et al., 1987), in the case of phenol the AV = 108 cm3mol-1 and AV =
146.8 cm3mol-1 for salicylic acid.
Many correlations have been published for the estimation of fk most of which are modified
versions (Yang, 1987; Rexwinkel et al., 1997) of the well-known Ranz-Marshall equation
(Ranz and Marshall, 1952). These empirical correlations have been used for different systems
and may predict quite different values of the film mass transfer (Wijffels et al., 1998; Ko et
al., 2001). Mass transfer data in packed beds have been correlated by the Ranz-Marshall
equation (Ranz and Marshall, 1952):
2/13/12/1
03/1
Re6.00.2.
6.00.2 Scdu
DDdk
Sh ps
mfm
pf +=⎟⎟⎠
⎞⎜⎜⎝
⎛⎟⎟⎠
⎞⎜⎜⎝
⎛+==
ηρ
ρη B.14
where Sh , Sc and Re stand for the Sherwood, Schmidt and Reynolds numbers, respectively.
In the specific case of phenol adsorption from liquid phase, a correlation for the estimation of
the film mass transfer coefficient fk was developed in our laboratory (Costa and Rodrigues,
1985; Ferreira and Rodrigues, 1995a):

Adsorption of phenol and salicylic acid onto Amberlite XAD16 and Duolite S861 B-9
Clean technologies for the Purification of Wastewaters: Adsorptive Parametric pumping
569.0eR32.7 −′=Dj B.15
where the Chilton-Colburn factor 3/1Re ScShjD = and ε−=′ 1ReeR .
The partial differential equations for the modeling of the fixed bed adsorption were solved
using the software package gPROMS® for general PROcess Modelling System (gPROMS,
2003). The orthogonal collocation method on finite elements (OCFE) was used with 50 finite
elements and two interior collocation points in each element of the adsorption bed. No fitting
parameters were used for prediction of the experimental data.
B.4 Results and discussion
B.4.1 Adsorption equilibrium isotherm
The experimental adsorbed concentrations as a function of liquid phase concentration
corresponding to the phenol and salicylic acid adsorption onto each of the adsorbents at each
of the temperatures considered are shown in Figure B.1 and Figure B.2, respectively. The
obtained fittings to the Langmuir model are shown together with the experimental points. As
it may be seen, the Langmuir model well describes the equilibrium of phenol and salicylic
acid onto the adsorbents used in this work.
0
10
20
0 25 50 75 100
C* (mg L-1)
q* (m
g g-1
)
293K 310K 333K
293Kexp 310Kexp 333Kexp
A
Figure B.1 Experimental adsorption equilibrium data (symbols), *q versus *C and fittings to
Langmuir model (lines) for the adsorption of phenol onto Duolite S861 (A) at different temperatures

B-10 Adsorption of phenol and salicylic acid onto Amberlite XAD16 and Duolite S861
Clean Technologies for the Purification of Wastewaters: Adsorptive Parametric Pumping
0
10
20
30
40
0 25 50 75 100C* (mg L-1)
q* (mg
g-1)
293K 310K 333K
293Kexp 310Kexp 333Kexp
B
Figure B.1 (continue) Experimental adsorption equilibrium data (symbols), *q versus *C and fittings to Langmuir model (lines) for the adsorption of phenol onto Amberlite XAD16 (B) at different temperatures
0
10
20
30
40
50
0 25 50 75 100
C* (mg L-1)
q* (m
g g-1
)
293K 310K 333K
293exp 310Kexp 333Kexp
A
Figure B.2 Experimental adsorption equilibrium data (symbols), *q versus *C and fittings to Langmuir model (lines) for the adsorption of salicylic acid onto Duolite S861 (A) at different temperatures

Adsorption of phenol and salicylic acid onto Amberlite XAD16 and Duolite S861 B-11
Clean technologies for the Purification of Wastewaters: Adsorptive Parametric pumping
0
10
20
30
40
50
60
70
80
0 25 50 75 100
C* (mg L-1)
q* (mg
g-1)
293K 310K 333K293Kexp 310Kexp 333Kexp
B
Figure B.2 (continue) Experimental adsorption equilibrium data (symbols), *q versus *C and fittings to Langmuir model (lines) for the adsorption of salicylic acid onto Amberlite XAD16 (B) at different temperatures.
The characteristic parameters of the Langmuir model that were obtained for the adsorption of
salicylic and phenol onto Duolite S861 and Amberlite XAD16 are given in Table B.2.
The influence of temperature on the performance of each of these two adsorbents is reflected
by these parameters. The value of HΔ indicates that the adsorption of salicylic acid is more
exothermic than that of phenol, especially onto Amberlite XAD16. Considering that non-
specific interactions dominate in the adsorption systems here considered, the fact that the net
adsorption enthalpy of salicylic acid is higher than the one of phenol may be attributed to its
higher molecular weight (Ruthven, 1984). The higher value of the adsorption enthalpy for the
Amberlite XAD16 must be related to its structural characteristics compared to those of
Duolite S861, which increases the solute-sorbent interaction on Amberlite XAD16.
The values of the separation parameterb , allow easy comparison of the feasibility of thermal
parametric pumping as purification process for different solute-sorbent systems. As it may be
observed in Table B.3, for both the adsorbents, the highest separation parameters occur for the
whole temperature range here considered, i.e., the range 293 K-333 K.

B-12 Adsorption of phenol and salicylic acid onto Amberlite XAD16 and Duolite S861
Clean Technologies for the Purification of Wastewaters: Adsorptive Parametric Pumping
Table B.2 Parameters obtained from fittings to the Langmuir model corresponding to the equilibrium data of the adsorption of salicylic acid and phenol onto the adsorbents used.
Duolite S861 Amberlite XAD16
Phenol
Q (mg g-1) 96.13 81.68
KL∞ (m3 g-1) 1.22 x10⁻⁵ 7.02 x10⁻⁶
ΔHL (J mol-1) -12.93 x10³ -16.65 x10³
Salicylic acid
Q (mg g-1) 43.01 85.06
KL∞ (m3 g-1) 3.18 x10⁻⁶ 1.29 x10⁻⁷
ΔHL (J mol-1) -23.57 x10³ -30.46 x10³
In this temperature range, the separation parameters are larger for salicylic acid than for
phenol for both adsorbents considered. On the other hand, the separation parameters are larger
for Amberlite XAD16 than for Duolite S861 for both solutes considered here. The largest b
values correspond to the adsorption of salicylic acid onto Amberlite XAD16.
Table B.3 Separation parameters b corresponding to the different adsorbent-adsorbate systems here considered.
Temperature range 293K-310K 310K-333K 293K-333K
Phenol Duolite S861 0.14 0.17 0.31 Amberlite XAD16 0.18 0.22 0.39
Salicylic acid Duolite S861 0.26 0.31 0.52 Amberlite XAD16 0.33 0.39 0.63
B.4.2 Fixed- bed adsorption
Figure B.3 shows experimental breakthrough curves results together with the simulated ones
for phenol on Duolite S861 (Figure B.3a) and Amberlite XAD16 (Figure B.3b). At the same
way Figure B.4 presents results for salicylic acid on both adsorbents.

Adsorption of phenol and salicylic acid onto Amberlite XAD16 and Duolite S861 B-13
Clean technologies for the Purification of Wastewaters: Adsorptive Parametric pumping
0
20
40
60
80
100
0 50 100 150 200 250 300
time(min)
conc
entra
tion
(mg
L-1) 333Kq5.5ml/min
310Kq5.5ml/min293Kq5.5ml/min333Kq10ml/min310Kq10ml/min293Kq10ml/min
A
0
20
40
60
80
100
0 100 200 300 400 500time(min)
conc
entra
tion
(mg
L-1)
333Kq5.5ml/min
310Kq5.5ml/min
293Kq5.5ml/min
333Kq10m/min
310Kq10ml/min
293Kq10ml/min
B
Figure B.3 Fixed bed adsorption of phenol onto Duolite S861 (A) and Amberlite XAD (B) at
different temperatures and flow-rates. The bed length was 30 cm and solution was fed at three different temperatures and at two different flow-rates
The model used predicts the fixed bed adsorption of phenol and salicylic acid onto Duolite
S861 and Amberlite XAD16 reasonably well. The adsorption of both phenolic compounds
was kinetically more favorable onto Duolite S861, which has a higher porosity than Amberlite
XAD16.

B-14 Adsorption of phenol and salicylic acid onto Amberlite XAD16 and Duolite S861
Clean Technologies for the Purification of Wastewaters: Adsorptive Parametric Pumping
0
20
40
60
80
100
0 100 200 300 400 500
time(min)
conc
entra
tion
(mg
L-1)
333Kq5.5ml/min
310Kq5.5ml/min
293Kq5.5ml/min
333Kq10ml/min
310Kq10ml/min
293Kq10ml/min
A
0
20
40
60
80
100
0 200 400 600 800 1000 1200time(min)
conc
entra
tion
(mg
L-1)
333Kq5.5ml/min
310Kq5.5ml/min
293Kq5.5ml/min
333Kq10ml/min
310Kq10ml/min
293Kq10ml/min
B
Figure B.4 Fixed bed adsorption of salicylic acid onto Duolite S861 (A) and onto Amberlite
XAD (B) at different temperatures and flow-rates. The bed length was 30 cm and solution was fed at three different temperatures and at two different flow-rates.
The fixed bed adsorption capacity increases when the temperature of operation decreases and
the higher the temperature, the longer it takes for the saturation of the bed for both the
polymeric resins.

Adsorption of phenol and salicylic acid onto Amberlite XAD16 and Duolite S861 B-15
Clean technologies for the Purification of Wastewaters: Adsorptive Parametric pumping
It may be observed that lowering the flow-rate of the feeding leads to later breakthrough
times. However, for the temperatures considered, for both the flow-rates and both the
adsorbents, the beds have reached a constant-pattern.
Amberlite XAD has a higher capacity than Duolite S861 for the adsorption of salicylic acid
and phenol. Fixed bed saturation of salicylic acid takes longer than that of phenol for both the
resins employed. On the other hand the breakthrough profiles corresponding to the adsorption
of salicylic acid are more disperse than those corresponding to phenol, which is described by
the model and the parameters used.
In order to further compare the obtained results, the length of unused bed (LUB), which is a
measure of the fixed bed performance, was obtained for all cases.
The length of the unused bed, LUB may be calculated by:
⎟⎟⎠
⎞⎜⎜⎝
⎛−=
st
bp
tt
LLUB 1 B.16
where L is the length of the bed (m), bpt is the breakthrough time (s) and stt is the
stoichometric time (s), which may be determined from a single experimental breakthrough
curve (Ruthven, 1984). LUB values together with calculated values of the Reynolds and
Péclet number (axDLu
Peε
0= ) and axial dispersion axD are shown in the Table B.4.
In all cases, the lower the flow rate is, the smaller the corresponding LUB is. In the case of
fixed bed adsorption of phenol adsorption, the LUB are smaller for its adsorption onto
Amberlite XAD16 than for Duolite S861. For the adsorption of salicylic acid, the LUB values
are similar for both resins.
The Linear Driving Force (LDF) model used in this work well predicted the experimental
results obtained in the fixed bed. The mass transfer was described by an overall coefficient
which groups the LDF kinetic rate constant and the estimated external film mass transfer
coefficient. The calculated values of LDF kinetic rate constant are demonstrated in the Table
B.5.

B-16 Adsorption of phenol and salicylic acid onto Amberlite XAD16 and Duolite S861
Clean Technologies for the Purification of Wastewaters: Adsorptive Parametric Pumping
Table B.4 Parameters used for estimating the axD corresponding to the different fixed bed systems considered and values LUB (length of unused bed) for phenol.
adsorbent
Flow-rate (mL min-1)
T (K)
Re Pe axD
10-6(m2 s-1)
LLUB
293 0.54 332 2.63 0.32
310 0.85 335 2.62 0.41 5.5
333 1.16 338 2.58 0.46
293 0.98 336 4.73 0.61
310 1.55 341 4.67 0.59
Duolite S861
10
333 2.10 344 4.62 0.49
293 0.64 280 3.13 0.49
310 1.02 283 3.10 0.48 5.5
333 1.38 285 3.07 0.47
293 1.16 284 5.62 0.64
310 1.85 288 5.53 0.57
Phen
ol
Amberlite XAD16
10
333 2.50 291 5.47 0.56
293 0.54 332 2.63 0.46
310 0.85 335 2.62 0.40 5.5
333 1.16 338 2.58 0.34
293 0.98 336 4.73 0.57
310 1.55 341 4.67 0.58
Duolite S861
10
333 2.10 344 4.62 0.61
0.64 280 3.13 0.59 0.64
1.02 283 3.10 0.64 1.02 5.5
1.38 285 3.07 0.69 1.38
293 1.16 284 5.62 0.73
310 1.85 288 5.53 0.77
Salic
ilic
acid
Amberlite XAD16
10
333 2.50 291 5.47 0.78

Adsorption of phenol and salicylic acid onto Amberlite XAD16 and Duolite S861 B-17
Clean technologies for the Purification of Wastewaters: Adsorptive Parametric pumping
Table B.5 Linear Driving Force kinetic rate constants (kLDF) estimated for the adsorption of phenol and salicylic acid onto each adsorbent.
adsorbent adsorbate T (K) mD 10-10 (m2
s-1) peD 10-10 (m2
s-1) LDFk 10-4 (s-1)
293 8.90 3.20 20.00
310 1.48 5.33 40.17 Phenol
333 2.20 7.92 83.67
293 7.43 2.67 7.33
310 7.87 2.83 8.50
Duolite S861 (a)
Salicylic Acid
333 8.45 3.05 11.17
293 8.90 2.45 6.83
310 1.48 4.07 12.83 Phenol
333 2.20 6.05 23.67
293 7.43 2.05 1.67
310 7.87 2.17 2.17
Amberlite XAD16
(b)
Salicylic Acid
333 8.45 2.32 3.50
(a) εp = 0.72 τ = 2; (b) εp = 0.55 τ = 2
Table B.6 shows the values of the fk coefficients predicted by the Ranz-Marshall correlation
and correlation from our laboratory.

B-18 Adsorption of phenol and salicylic acid onto Amberlite XAD16 and Duolite S861
Clean Technologies for the Purification of Wastewaters: Adsorptive Parametric Pumping
Table B.6 Parameters used for estimating the external film mass transfer coefficients (kf) corresponding to the adsorption of phenol and salicylic acid onto Duolite S861 and Amberlite XAD16.
adsorbent adsorbate T (K) Flow-rate (mL min-1) Sc Sh
afk
10-5(m s-1) Dj bfk
10-5(m s-1)
293 1149.2 6.6 1.25 7.8 8.30 310 434.3 6.2 1.95 6.0 12.22 333
5.5 215.7 5.9 2.75 5.0 16.35
293 1149.2 8.2 1.55 5.5 10.73 310 434.3 7.7 2.42 4.3 15.77
Duolite S861 Phenol
333 10
215.7 7.2 3.38 3.6 21.17 293 1376.6 6.9 1.08 7.8 7.37 310 816.8 7.2 1.20 6.0 8.00 333
5.5 561.5 7.3 1.32 5.0 8.65
293 1376.6 8.6 1.35 5.5 9.52 310 816.8 9.0 1.50 4.3 10.35
Duolite S861
Salicylic Acid
333 10
561.5 9.2 1.65 3.6 11.18 293 1149.2 7.0 1.12 7.1 7.52 310 434.3 6.6 1.73 5.4 11.03 333
5.5 215.7 6.2 2.45 4.6 14.80
293 1149.2 8.8 1.40 5.0 9.72 310 434.3 8.2 2.17 3.9 14.28
Amberlite XAD16 Phenol
333 10
215.7 7.7 3.02 3.2 19.15 293 1376.6 7.3 9.67 7.1 6.67 310 816.8 7.6 1.08 5.4 7.25 333
5.5 561.5 7.8 1.18 4.6 7.82
293 1376.6 9.2 1.22 5.0 8.62 310 816.8 9.6 1.35 3.9 9.37
Amberlite XAD16
Salicylic Acid
333 10
561.5 9.8 1.48 3.2 10.12 afk estimated by the Ranz-Marshall empirical correlation (Ranz and Marshall, 1952). bfk estimated by the Costa-Rodrigues empirical correlation (Costa and Rodrigues, 1985).
Table B.7 shows the overall mass transfer coefficient sk used in (Eq. B.5) for the simulations
of the experimental breakthrough curves in each case. In the case of salicylic acid adsorption
onto Duolite S861 and onto Amberlite XAD16, the sk that better fitts the experimental results
used a film mass transfer coefficient fk estimated from the Ranz-Marshall correlation. For
phenol adsorption in fixed bed packed with these polymeric resins, better fittings were
obtained if in the calculation of the sk parameter, the estimation of the film mass transfer

Adsorption of phenol and salicylic acid onto Amberlite XAD16 and Duolite S861 B-19
Clean technologies for the Purification of Wastewaters: Adsorptive Parametric pumping
coefficient fk is based on the correlation developed by Costa and Rodrigues (Costa and
Rodrigues, 1985).
Table B.7 Overall mass transfer coefficients used for the simulations of the fixed bed adsorption of phenol and salicylic acid onto Duolite S861 and Amberlite XAD16
The adsorption onto the two resins used showed a larger overall mass transfer coefficient for
phenol than salicylic acid. Comparing the polymeric resins from a kinetic point of view, it
may be concluded that the adsorption of both phenolic compounds was kinetically more
favorable onto Duolite S861, which has a higher porosity than onto Amberlite XAD16.
B.5 Conclusions
Phenol being the precursor of salicylic acid, the adsorption of both compounds onto two
different polymeric resins (Duolite S861 and Amberlite XAD16) was compared.
adsorbent adsorbate T (K)
Flow-rate (mL min-1)
LDFk/1102 (s)
dCdqf
kr
hpf
p *3
ρ
(s)
sk/1
(s)
293 5.00 40.98 540.00 310 2.48 23.10 271.80 333
5.5
1.19 12.30 132.00 293 5.00 31.68 531.60 310 2.48 17.88 266.40
Duolite S861 Phenol
333
10
1.19 9.54 129.00 293 13.76 719.10 2095.20 310 11.87 595.38 1783.20 333
5.5 8.99 441.84 1340.40
293 13.76 576.54 1952.40 310 11.87 475.80 1663.20
Duolite S861 Salicylic Acid
333 10
8.99 352.56 1251.00 293 14.51 84.42 1536.00 310 7.79 51.36 830.40 333
5.5 4.22 30.84 453.00
293 14.51 65.28 1516.80 310 7.79 39.66 819.00
Amberlite XAD16 Phenol
333 10
4.22 23.82 446.40 293 58.55 2194.98 8050.20 310 45.23 1624.62 6147.00 333
5.5 28.86 1016.28 3902.40
293 58.55 1751.22 7606.20 310 45.23 1292.10 5814.60
Amberlite XAD16
Salicylic Acid
333 10
28.86 807.12 3693.00

B-20 Adsorption of phenol and salicylic acid onto Amberlite XAD16 and Duolite S861
Clean Technologies for the Purification of Wastewaters: Adsorptive Parametric Pumping
The equilibrium of adsorption of phenol and salicylic acid was described by the Langmuir
isotherm model. In the range of concentration under study, isotherms corresponding to phenol
do not show a clear plateau as they do for the salicylic acid. From the equilibrium results it
may be seen that the capacity of Duolite S861 for phenol adsorption (Q = 96.13 mg g-1) is
slightly higher than for Amberlite XAD (Q = 81.68 mg g-1). On the contrary, Amberlite XAD
salicylic acid adsorptive capacity (Q = 85.06 mg g-1) was nearly double than that of Duolite
S861 (Q = 43.01 mg g-1). Differences on the equilibrium of the two solutes are more evident
when considering their adsorption onto Duolite S861 than onto Amberlite XAD16. The
maximum adsorptive capacity Q of phenol onto Duolite S861 is double than that of salicylic
acid. Similar results have been reported on the adsorption of phenol and salicylic acid onto
polymeric resins (Deosarkar and Pangarkar, 2004). Nevertheless, the separation parameter b
based on temperature is higher for salicylic acid than for phenol, especially onto Amberlite
XAD16, which indicates that purification by parametric pumping would be easier for salicylic
acid in comparison with phenol and using Amberlite XAD16 rather than Duolite S861 as
adsorbent. This separation potential was further confirmed by the results obtained from the
dynamic experiences, the effect of temperature on breakthrough curves being more noticeable
for salicylic acid. In terms of a temperature based purification of salicylic acid, such as
thermal parametric pumping, Amberlite XAD16 would be a better option than Duolite S861,
which may be worth to be studied in future.
The Linear Driving Force (LDF) model used in this work well predicted the experimental
results obtained in the fixed bed. The mass transfer was described by an overall coefficient
which groups the LDF kinetic rate constant and the estimated external film mass transfer
coefficient. The adsorption onto the two resins used showed a larger overall mass transfer
coefficient for phenol than salicylic acid. Comparing the polymeric resins from a kinetic point
of view, it may be concluded that the adsorption of both phenolic compounds was kinetically
more favorable onto Duolite S861, which has a higher porosity than onto Amberlite XAD16.
B.6 Nomenclature
a deviation in the separation parameter
b separation parameter
C concentration in the bulk fluid phase (mg L-1)

Adsorption of phenol and salicylic acid onto Amberlite XAD16 and Duolite S861 B-21
Clean technologies for the Purification of Wastewaters: Adsorptive Parametric pumping
0C initial liquid-phase concentration of phenol (mg L-1)
pd diameter of the particle of the adsorbent (cm)
axD axial dispersion (m2 s-1)
peD the effective pore diffusivity (m2 s-1)
mD the molecular diffusivity (m2 s-1)
hf humidity factor (g dry adsorbent/g adsorbent)
( )TK equilibrium constant dependent on temperature (m3 g-1)
LK parameter in the Langmuir isotherm model (m3 g-1)
∞LK equilibrium constant corresponding to the Langmuir model (m3 g-1)
LDFk Linear Driving Force (LDF) kinetic rate constant (s-1)
fk external film mass transfer coefficient (m s-1)
sk overall mass transfer coefficient (s-1)
L total bed length (m)
LUB length of unused bed (m)
tL length of the transference zone (m)
m mass of adsorbent (g)
MW molecular weight (g mol-1)
BM molecular weight of solvent B (g mol-1)
( )Tm capacity parameter in the separation parameter b (-)
m average slope in the separation parameter b (-
Pe Péclet number axDLu ε0= (-)

B-22 Adsorption of phenol and salicylic acid onto Amberlite XAD16 and Duolite S861
Clean Technologies for the Purification of Wastewaters: Adsorptive Parametric Pumping
Q constant in the Langmuir isotherm model (mg g-1) related to the adsorptive capacity
q solute adsorbed per dry mass of adsorbent at a certain time (mg g –1)
*q solute adsorbed per dry mass of adsorbent in equilibrium with the phenol
concentration in solution (mg g –1)
Re Reynolds number ηρ pf du0=
pr radius of the particle of the adsorbent (m)
Sc Schmidt number mf Dρη=
Sh Sherwood number mpf Ddk=
t time (s)
bpt breakthrough time at 2% outlet concentration (s)
stt stoichometric time (s)
T absolute temperature (K)
U feed flow rate (m3 s-1)
0u superficial velocity (m s-1)
iu ( )ε/0u - interstitial velocity (m s-1)
V volume of the solution (L)
AV molar volume of solute a at its normal boiling temperature (cm3mol-1)
W dry weight (g) of the corresponding adsorbent
z axial coordinate in the bed (m)
LHΔ adsorption enthalpy (Jmol-1)
Greek Letters
ε bed porosity

Adsorption of phenol and salicylic acid onto Amberlite XAD16 and Duolite S861 B-23
Clean technologies for the Purification of Wastewaters: Adsorptive Parametric pumping
pε porosity of the adsorbent
φ dimensionless association factor of solvent B
η viscosity of the solution (Pa.s)
Bη viscosity of solvent B (cp)
Ω LDF factor, which is equal to 3, 8 or 15 for slab, cylindrical or spherical geometry
pρ density of the adsorbent (kg m-3)
fρ density of the solution (kg m-3)
τ tortuosity of the adsorbent
Indexes
A sub index for the solute
B sub index for the solvent
B.7 References
Costa, C. and Rodrigues, A., Design of Cyclic Fixed-Bed Adsorption Processes .1. Phenol Adsorption on Polymeric Adsorbents. AIChE Journal, 31 (10), 1645-1654 (1985).
Crook, E. H., McDonnell, R. P. and McNulty, J. T., Removal and Recovery of Phenols from Industrial-Waste Effluents with Amberlite Xad Polymeric Adsorbents. Industrial & Engineering Chemistry Product Research and Development, 14 (2), 113-118 (1975).
Daughton, C. G. and Ternes, T. A., Pharmaceuticals and personal care products in the environment: Agents of subtle change? Environmental Health Perspectives, 107, 907-938 (1999).
Davesac, R. R., Pinto, L. T., da Silva, F. A., Ferreira, L. M. and Rodrigues, A. E., A package for thermal parametric pumping adsorptive processes. Chemical Engineering Journal, 76 (2), 115-125 (2000).
Deosarkar, S. P. and Pangarkar, V. G., Adsorptive separation and recovery of organics from PHBA and SA plant effluents. Separation and Purification Technology, 38 (3), 241-254 (2004).
Díez, S., Leitão, A., Ferreira, L. M. and Rodrigues, A. E., Adsorption of phenylalanine onto polymeric resins: equilibrium, kinetics and operation of a parametric pumping unit. Separation and Purification Technology, 13, 25 - 35 (1998).

B-24 Adsorption of phenol and salicylic acid onto Amberlite XAD16 and Duolite S861
Clean Technologies for the Purification of Wastewaters: Adsorptive Parametric Pumping
Eriksson, E., Auffarth, K., Eilersen, A. M., Henze, M. and Ledin, A., Household chemicals and personal care products as sources for xenobiotic organic compounds in grey wastewater. Water Sa, 29 (2), 135-146 (2003).
Farooq, S. and Ruthven, D. M., Heat-Effects in Adsorption Column Dynamics .2. Experimental Validation of the One-Dimensional Model. Industrial & Engineering Chemistry Research, 29 (6), 1084-1090 (1990).
Farrier, D. S., Hines, A. L. and Wang, S. W., Adsorption of Phenol and Benzoic-Acid from Dilute Aqueous-Solution onto a Macroreticular Resin. Journal of Colloid and Interface Science, 69 (2), 233-237 (1979).
Ferreira, L. M. and Rodrigues, A. E., Adsorptive separation by thermal parametric pumping .1. Modeling and simulation. Adsorption-Journal of the International Adsorption Society, 1 (3), 213-231 (1995a).
Ferreira, L. M. and Rodrigues, A. E., Adsorptive separation by thermal parametric pumping .2. Experimental study of the purification of aqueous phenolic solutions at pilot scale. Adsorption-Journal of the International Adsorption Society, 1 (3), 233-252 (1995b).
Giles, C. H., Smith, D. and Huitson, A., General Treatment and Classification of Solute Adsorption-Isotherm .1. Theoretical. Journal of Colloid and Interface Science, 47 (3), 755-765 (1974).
Glueckauf, E., Theory of Chromatography .10. Formulae for Diffusion into Spheres and Their Application to Chromatography. Transactions of the Faraday Society, 51 (11), 1540-1551 (1955).
Gorbach, A., Stegmaier, M. and Eigenberger, G., Measurement and modeling of water vapor adsorption on zeolite 4A-equilibria and kinetics. Adsorption-Journal of the International Adsorption Society, 10 (1), 29-46 (2004).
gPROMS, gPROMS v2.2 User Guide.Process System Enterprise Ltd. (2003).
Guiochon, G., Shirazi, S. G. and Katti, A. M., Fundamentals of preparative and nonlinear chromatography. Academic press, Boston, 1994.
Gusler, G. M., Browne, T. E. and Cohen, Y., Sorption of Organics from Aqueous-Solution onto Polymeric Resins. Industrial & Engineering Chemistry Research, 32 (11), 2727-2735 (1993).
Hanesian, D. and Perna, A. J., The Sitting, Process analysis and Design of a Manufacturing Facility Using hazardous material in a Residential Community (The manufacture of aspirin). New Jersey Institute of Technology, Newark, New Jersey, 2000.
Humphrey, J. L., Separation Processes - Playing a Critical Role. Chemical Engineering Progress, 91 (10), 31-41 (1995).
Keller, G. E., Adsorption - Building Upon a Solid Foundation. Chemical Engineering Progress, 91 (10), 56-67 (1995).

Adsorption of phenol and salicylic acid onto Amberlite XAD16 and Duolite S861 B-25
Clean technologies for the Purification of Wastewaters: Adsorptive Parametric pumping
Knaebel, K. S., For Your Next Separation Consider Adsorption. Chemical Engineering, 102 (11), 92-& (1995).
Ko, D. C. K., Porter, J. F. and McKay, G., Film-pore diffusion model for the fixed-bed sorption of copper and cadmium ions onto bone char. Water Research, 35 (16), 3876-3886 (2001).
Kujawski, W., Warszawski, A., Ratajczak, W., Porebski, T., Capala, W. and Ostrowska, I., Application of pervaporation and adsorption to the phenol removal from wastewater. Separation and Purification Technology, 40 (2), 123-132 (2004).
Kunin, R., Use of Macroreticular Polymeric Adsorbents for Treatment of Waste Effluents. Pure and Applied Chemistry, 46 (2-4), 205-211 (1976).
Lin, S. H., Pan, C. L. and Leu, H. G., Equilibrium and mass transfer characteristics of 2-chlorophenol removal from aqueous solution by liquid membrane. Chemical Engineering Journal, 87 (2), 163-169 (2002).
Merigian, K. S. and Blaho, K. E., Single-dose oral activated charcoal in the treatment of the self-poisoned patient: a prospective, randomized, controlled trial. American journal of therapeutics, 9 (4), 301-308 (2002).
Moores, K. and Spector, R., Activated charcoal for gastrointestinal decontamination of the poisoned patient. Iowa medicine : journal of the Iowa Medical Society, 76 (5), 231-238 (1986).
Morão, A., Lopes, A., de Amorim, M. T. P. and Goncalves, I. C., Degradation of mixtures of phenols using boron doped diamond electrodes for wastewater treatment. Electrochimica Acta, 49 (9-10), 1587-1595 (2004).
Osterhoudt, K. C., Durbin, D., Alpern, E. R. and Henretig, F. M., Risk factors for emesis after therapeutic use of activated charcoal in acutely poisoned children. Pediatrics, 113 (4), 806-810 (2004).
Pigford, R. L., Baker, B. and Blun, D., An equilibrium Theory of the Parametric Pumping. Industrial & Engineering Chemistry Fundamentals, 12, 406 - 412 (1973).
Ranz, W. E. and Marshall, W. R., Evaporation from Drops .1. Chemical Engineering Progress, 48 (3), 141-146 (1952).
Reid, R., C., Prausnitz, J., M. and Poling, B., E., Properties of gas and liquids. McGraw Hill, New York, 1987.
Rexwinkel, G., Heesink, A. B. M. and VanSwaaij, W. P. M., Mass transfer in packed beds at low Peclet numbers - wrong experiments or wrong interpretations? Chemical Engineering Science, 52 (21-22), 3995-4003 (1997).
Ruthven, D., M., Principles of adsorption and adsorption processes. Wiley, New York, 1984.
Silva, D. C. Separation/Reaction in simulated moving bed, Application to the production of industrial Sugars. PhD thesis, University of Porto, Porto, 2001.

B-26 Adsorption of phenol and salicylic acid onto Amberlite XAD16 and Duolite S861
Clean Technologies for the Purification of Wastewaters: Adsorptive Parametric Pumping
Silva, J. A. C. and Rodrigues, A. E., Fixed-bed adsorption of n-pentane/isopentane mixtures in pellets of 5A zeolite. Industrial & Engineering Chemistry Research, 36 (9), 3769-3777 (1997).
Wijffels, R. H., Verheul, M., Beverloo, W. A. and Tramper, J., Liquid/solid mass transfer in an air-lift loop reactor with a dispersed solid phase. Journal of Chemical Technology and Biotechnology, 71 (2), 147-154 (1998).
Wilke, C. R. and Chang, P., Correlation of Diffusion Coefficients in Dilute Solutions. AIChE Journal, 1 (2), 264-270 (1955).
Yang, R. T., Gas separation by adsorption processes. Butterworth, Stoneham (USA),, 1987.


C. Ion-exchange equilibrium experimental data
+C.1 Ordinary binary Na /H+ ion-exchange isotherm
Contacting different wet mass (0.005-1.6g) of strong cationic resin Amberlite IR120H with a
given volume of solution at the same initial concentration the batch ion exchange experiments
were carried out. The moisture content of the resin Amberlite IR120 in H+ form was
determined for each experiment as a difference between the weight of wet resin and after
drying at 423 K. The initial solution was prepared as a mixture of 0.1 equiv/L sodium chloride
( ) and pH was 5.34. The volume of the solution was 50 mL. The excess of NaCl +H ion was
determined by measuring the pH after equilibrium was established. In order to obtain the data
and parameters of ion-exchange equilibrium isotherm, the following mass balance is used
( ∗∗ −= iiH
i CCfW
Vq 0 ) C.1
where represents the resin-phase equilibrium concentration, and are the initial and
equilibrium concentrations in the bulk fluid phase, V is the volume of bulk solution, W is the
wet mass of resin and f
∗iq ∗
iCiC0
is dry particle to wet particle mass ratio. H

C-2 Ion-exchange equilibrium – experimental data
Table C.1 Experimental measured values of the ion-exchange isotherm
dry +resin (g)
dry resin 10-4(L) pH C (H+ +C *q ( Na (Na ) ) )
+NaX +Na
Y10-3(equiv/L) 10-2(equiv/L) (equiv/L)
0.08 1.43 2.09 8.10 9.19 2.843 0.919 0.948
0.16 2.86 1.81 15.5 8.45 2.710 0.845 0.903
0.20 3.57 1.71 19.5 8.05 2.729 0.805 0.910
0.24 4.29 1.64 22.9 7.71 2.672 0.771 0.891
0.28 5.00 1.58 26.3 73.7 2.630 0.737 0.877
0.32 5.71 1.52 30.2 69.8 2.642 0.698 0.881
0.40 7.14 1.44 36.3 63.7 2.541 0.637 0.847
0.48 8.57 1.38 41.7 58.3 2.431 0.583 0.810
0.56 10.0 1.32 47.9 52.1 2.393 0.521 0.798
0.72 12.9 1.26 55.0 45.1 2.137 0.451 0.712
1.04 18.6 1.17 67.6 32.4 1.820 0.320 0.607
C.2 Ion-exchange equilibrium of the system vanillin/NaOH-Amberlite
IR120H
Contacting different wet mass of strong cationic resin Amberlite IR120H with a given volume
of solution at the same initial concentration the batch ion exchange experiments were carried
out. The moisture content of the resin Amberlite IR120 in H+ form was determined for each
experiment as a difference between the weight of wet resin and after drying at 423 K. The
solution was prepared by dissolving 0.033 equiv (≈5 g) of vanillin in 1L of sodium hydroxide
solution with the concentration 0.03 equiv L-1. Immediately after dissolution, according to the
chemical reaction between sodium hydroxide and vanillin, the vanillate is formed and
equilibrium is characterized by the equilibrium constant of the reaction. The batch experiment
has been performed in 250 mL Erlenmeyer flasks where 70 mL of prepared solution with the
same concentration and an amount of the wet resin have been added. The weight of wet resin
was in the range 0. 005 g to 1.6 g. The temperature (293 K) was controlled by a thermostatic
bath. The volumetric flasks were placed in a shaking mixer at constant speed 150 rpm. The
equilibrium in the resin-liquid mixture has been reached approximately within 24 hours. The
solution was separated from the ion-exchanger and the final concentration of vanillin was
Clean Technologies for the Purification of Wastewaters: Adsorptive Parametric Pumping

Ion – exchange equilibrium – experimental data C-3
determined by measuring the absorbance using UV-VIS spectrophotometer. The total
concentration of vanillin and vanillate species was determined by measuring the absorbance at
the wavelength 259 nm, which is the isobestic point. Additionally, the concentration of
vanillate was determined at the wavelength of 376 nm.
Table C.2 Measured and calculated values of the ion-exchange isotherm with initial concentration of Na+ cations in solution C was 0.027 equil/L i0
Dry + +C (Na ) q*(Na ) resin pH
Clean technologies for the Purification of Wastewaters: Adsorptive Parametric pumping
(g) 10-3 10-3(equiv/g dry resin)(equiv/L)
0.21 7.19 11.8 5.13
0.25 7.01 9.10 5.04
0.29 6.79 6.49 4.95
0.34 6.57 4.32 4.78
0.42 5.66 1.00 4.37
0.50 5.38 0.32 3.74
0.59 4.88 0.11 3.23


D. Experimental data obtained during ultrafiltration
experiments
In this appendix additional experimental results obtained on the membrane experimental setup
are described. It focus mainly the variation of the volume in the tank and gel resistance as a
function of the time ( ) obtained by linear regression of experimental data are
presented. Moreover, the experimental results obtained using membrane of 50 kDa cut-off are
presented. Chemicals and experimental setup were already described elsewhere (see Chapter
6).
)(tfR =g
D.1 Experimental data obtained with membrane of 1 KDa cut-off
The variation of feed volume in the tank (points) measured for all feed concentrations during
experiments using membrane of 1kDa cut-off is shown in Figure D.1. Lines in Figure D.1
represent predicted volume reduction of feed solution in the tank using the mathematical
model assuming gel layer resistance for the case of lignin/vanillin concentration in the feed
60/6 g L-1 at pH=12.5 and pH=8.5 and model assuming concentration polarization with
osmotic pressure for lignin/vanillin concentration in the feed 2/6 g L-1 of at pH=12.5.

D-2 Experimental data obtained during the ultrafiltration of lignin/vanillin mixture
0
1
2
3
4
5
6
0 200 400 600 800Time(min)
Vol
ume
in th
e ta
nk (L
)
60g/L-12.5 simul 60g/L-8.5simul simul 2 g/L-12.5
Figure D.1 Volume in the tank as a function of the time for membrane of 1 kDa cut-off. The concentrations of lignin/vanillin mixture were 2/6g L-1, 60/6 g L-1, pH=12.5 and 8.5.The initial volume was 5 and 4 L. The predicted curves are shown along with the experimental data.
The variation of permeate volume as a function of the time is shown in Figure D.2. The
experimental data (points) are reported with the simulated results (lines).
00.2
0.40.6
0.81
1.21.4
1.61.8
2
0 200 400 600 800 1000
time (min)
V(L
) per
mea
te
2 g/L 60 g/L-8.5 60 g/L-12.5simul simul simul
Figure D.2 Permeate volumes as a function of time for membrane of 1 kDa cut-off. The concentration of the lignin/vanillin mixture: 2-6 g L-1, 60-6 g L-1, pH=8.5 and 12.5.
Clean Technologies for the Purification of Wastewaters: Adsorptive Parametric Pumping

Experimental data obtained during the ultrafiltration lignin/vanillin mixture D-3
The gel resistance ( ) was calculated from the experimental data and plotted as function of
the time. Then the data were analyzed by linear regression and the function was
obtained. The equations of gel resistance as a function of the time ( ) for the case of
concentration of lignin/vanillin 60/6 g L
gR
)(tfR =
)(tfR =
g
g
-1 in the feed and pH = 8.5 and 12.5 are reported in
Table D.1.
Table D.1 Gel resistance versus time )(tfRg = obtained by linear regression for each experimental run
Run pH )(tfRg =
1 8.5 138 1059.6)(1052.7 ×+××= tRg ; 971.02 =R
2 12.5 138 1044.9)(1017.6 ×+××= tRg ; 988.02 =R
Linear regression of experimental values of the gel layer resistance ( ) are shown in gR Figure
D.3.
0.0
2.0
4.0
6.0
8.0
10.0
12.0
14.0
16.0
0 500 1000 1500time (min)
Rg
x1013
(m-1
)
pH=12.5 pH=8.5
Figure D.3 The gel layer resistance ( ) as the function of time obtained from experimental permeate flux results and linear regression of the data. Lignin and vanillin concentration were 60 g L
gR
-1and 6 g L-1, the pH=8.5 and 12.5
D.2 Experimental data obtained with membrane of 5 KDa cut-off
The volume change in the tank during experiment using membrane of 5 kDa cut-off is shown
in Figure D.4. The initial volume was 4 L and the initial feed concentration was 60/5g L-1
lignin/vanillin mixture at the pH=12.5.
Clean Technologies for the Purification of Wastewaters: Adsorptive Parametric Pumping

D-4 Experimental data obtained during the ultrafiltration of lignin/vanillin mixture
00.5
11.5
22.5
33.5
44.5
0 200 400 600 800 1000
time (min)
Vol
ume
in th
e ta
nk (L
)
60-5 g/L-12.5 simul
Figure D.4 Volume in the tank as a function of time for the membrane of 5 KDa cut-off and at a concentration of lignin/vanillin mixture 60-5 g/L and pH=12.5
The volume change in the permeate as a function of time using 5 kDa membrane is shown in
Figure D.5.
0
0.2
0.4
0.6
0.8
1
1.2
1.4
0 200 400 600 800 1000
time (min)
V(L
) per
mea
te
60 g/L-12.5 simul
Figure D.5 Permeate volume as a function of time for membrane of 5 kDa cut-off
Table D.2 reports the gel layer resistance ( ) as a function of time. gR
Table D.2 Gel resistance versus time )(tfRg = obtained by linear regression for experimental run 1.
Run )(tfRg =
1 138 1041.21059.1 ×+×= tRg ; 890.02 =R
Clean Technologies for the Purification of Wastewaters: Adsorptive Parametric Pumping

Experimental data obtained during the ultrafiltration lignin/vanillin mixture D-5
Linear regression of experimental values of the gel layer resistance ( ) is shown in gR Figure
D.6.
0.0
0.5
1.0
1.5
2.0
2.5
3.0
3.5
0 20000 40000 60000time (min)
Rg
x1013
(m-1
)
5 kDa
Figure D.6 The gel layer resistance ( ) as the function of the time obtained from experimental permeate flux results and linear regression of the data. The lignin and vanillin concentration was 60 g L
gR
-1and 5g L-1, the pH= 12.5
D.3 Experimental data obtained with membrane of 15 KDa cut-off
The variation of volume in the tank and in the permeate measured for the feed concentration
of lignin/vanillin 20/2 g L-1 at pH=8.5 and 12.5 during the experiments using membrane of 15
kDa cut-off are shown in Figure D.7 and Figure D.8, respectively. The lines represent
predicted volume reduction using the mathematical model assuming the gel layer resistance.
0
1
2
3
4
5
6
0 200 400 600
time (min)
Vol
ume
in th
e ta
nk (L
)
20-2g/L-8.5 simul20-2g/L-12.5 simul
Figure D.7 Volume in the tank as a function of time for the membrane of 15 kDa cut-off; lignin/vanillin mixture at concentration of 20-2 g L-1 and pH=8.5 and pH=12.5
Clean Technologies for the Purification of Wastewaters: Adsorptive Parametric Pumping

D-6 Experimental data obtained during the ultrafiltration of lignin/vanillin mixture
0
0.5
1
1.5
2
2.5
3
3.5
4
0 100 200 300 400 500
time (min)
V(L
) per
mea
te
20 g/L-8.5 20 g/L-12.5simul simul
Figure D.8 Permeate volume as a function of time for membrane of 15 kDa cut-off for lignin/vanillin concentration of 20/2 g L-1at pH=8.5 and 12.5.
The variation of volume in the tank and in the permeate measured for the feed concentrations
of 60/6 g L-1and 5/0.5 g L-1of lignin/vanillin and at pH=8.5 and 12.5 during the experiments
using membrane of 15 kDa cut-off are shown in Figure D.7 and Figure D.8, respectively. The
experimental points are fitted with predicted lines using the mathematical model assuming the
gel layer resistance.
0
1
2
3
4
5
6
0 100 200 300
time (min)
Vol
ume
in th
e ta
nk (L
)
60-6g/L-12.5 simul60-6g/L-8.5 simul5-0.5g/L-8.5 simul
Figure D.9 Volume in the tank as a function of time for the membrane of 15 KDa cut-off at concentrations of lignin/vanillin mixture 5/0.5 g L-1 pH=8.5 and 60/6 g L-1 pH=12.5 and 60/6 g L-1 pH=8.5.
Clean Technologies for the Purification of Wastewaters: Adsorptive Parametric Pumping

Experimental data obtained during the ultrafiltration lignin/vanillin mixture D-7
0
0.5
1
1.5
2
2.5
3
3.5
4
0 200 400 600 800 1000
time (min)
V(L
) per
mea
te
5 g/L 60 g/L-8.5 60 g/L 12.5
simul simul simul
Figure D.10 Permeate volume as a function of time for membrane of 15 kDa cut-off for the concentration of lignin/vanillin mixture 5/0.5 g L-1 pH=8.5 and 60/6 g L-1 pH=12.5 and 60/6 g L-1 pH=8.5.
The variation of the gel layer resistance ( ) with time obtained from experimental data
together with linear regression is showed in Figure D.11.
gR
0.0
0.5
1.0
1.5
2.0
2.5
3.0
3.5
4.0
0 200 400 600 800
time (min)
Rg
x1013
(m-1
)
5 g/L 20 g/L-8.5pH 60 g/L-8.5 pH
20 g/L-12.5pH 60 g/L-12.5pH
Figure D.11 The gel layer resistance ( ) as a function of time obtained from experimental permeate flux results and linear regression of the data. The lignin and vanillin concentration were 60/6 g L
gR
-1, 20/2 g L-1 and 5/0.5 g L-1at pH= 12.5 and 8.5
The gel layer resistance as a function of the time ( )(tfRg = ) for each experimental run
performed using membrane 15 kDa cut-off is reported in Table D.3.
Clean Technologies for the Purification of Wastewaters: Adsorptive Parametric Pumping

D-8 Experimental data obtained during the ultrafiltration of lignin/vanillin mixture
Table D.3 Gel resistance versus time )(tfRg = obtained by using linear regression for each experimental run
Run
)(tfRg =
1 128 1092.11043.1 ×+×= tRg ; 998.02 =R
2 128 1051.51049.2 ×+×= tRg ; 983.02 =R
3 128 1019.61095.1 ×+×= tRg ; 987.02 =R
4 138 1005.11059.2 ×+×= tRg ; 990.02 =R
5 138 1098.11084.2 ×+×= tRg ; 998.02 =R
D.4 Experimental data obtained with membrane of 50 KDa cut-off
The membrane permeability which was obtained from the water flux measurement for the
membrane of 50 kDa cut-off was lower than that of 15 kDa membrane. The value of corrected
water flow rate measured with completely new membrane at the pressure 4 bar and 25 ˚C was
410 L h-1m2. This value of corrected water flow rate is in disagreement with the one given by
supplier Orelis France which is 1100+-300 L h-1m2 (Kerasep, 2005). The supplier did not
offer any explanation of the mentioned membrane performance. However, there is already
published work (Rojas et al., 2006) where disagreement with the excepted performance could
be found using tubular ceramic membrane.
The viscosity of water at 25 ºC is 0.891 ×10⁻³ kg m-1 s-1) and the value of the membrane
resistance ( obtained from experimental results was 3.741×10)Rm12 m-1 for 50 kDa membrane
which was higher than for membrane 15 kDa (2.805 ×10¹²m -1). The pure water flowrate
measured at different transmembrane pressure ( PΔ ) using membrane of 50 kDa cut-off is
shown in Figure D.12.
Clean Technologies for the Purification of Wastewaters: Adsorptive Parametric Pumping

Experimental data obtained during the ultrafiltration lignin/vanillin mixture D-9
0
0.00001
0.00002
0.00003
0.00004
0.00005
0.00006
0 50000 100000 150000 200000
ΔP (Pa)
J (m
3 /sm
2 )
50KDa
Figure D.12 The pure water permeate flux obtained at different transmembrane pressures for the membrane 50 kDa cut-off.
Permeate fluxes measured during the experiments for each tested concentrations of
lignin/vanillin (0.5/5, 20/2 and 60/6 g L-1, pH=8.5) solution are compared in Figure D.13. The
mathematical model which involves gel-layer resistance was used to predict experimental
results of permeate flux. The predicted lines are reported together with experimental points in
Figure D.15.
0
10
20
30
40
50
60
70
0 100 200 300 400 500 600
time (min)
J (L
h-1m
-2)
5g/L 20 g/L60 g/L simul 5g/Lsimul 20g/L simul 60g/L
Figure D.13 Permeate fluxes in membrane of 50 kDa cut-off at pH = 8.5. The concentration of lignin was 5, 20 and 60 g L-1 and vanillin 0.5, 2 and 6 g L-1. Transmembrane pressure PΔ =1.3 bar. Feed flow-rate: 56, 100 and 120 L h≈feedQ -1
Clean Technologies for the Purification of Wastewaters: Adsorptive Parametric Pumping

D-10 Experimental data obtained during the ultrafiltration of lignin/vanillin mixture
The model parameters used in simulations are reported in Table D.4.
Table D.4 The model parameters used in simulations considering the gel layer resistance.0feedC
(Lignin) (g L-1)
0feedC
(Vanillin) (g L-1)
pH mR (m-1) η
(kg m-1 s-1) feedQ
(L h-1) PΔ
(bar)
5 0.5 8.5 3.741 1210× 0.887 310−× 56 1.3
20 2 8.5 3.741 1210× 0.954 310−× 100 1.3
60 6 8.5 3.741 1210× 1.190 310−× 120 1.3
Gel layer resistance ( ) obtained from experimental results was analysed using linear
regression is shown in
gR
Figure D.14. The gel layer resistance as a function of time ( )
for each concentration performed using membrane of 50 kDa cut-off is reported in
)(tfR =g
Table D.5.
0.0
0.2
0.4
0.6
0.8
1.0
1.2
1.4
1.6
1.8
0 200 400 600
time (min)
Rg
x1013
m-1
5-0.5 g/L 20-2 g/L 60-6 g/L
Figure D.14 The gel layer resistance ( ) as the function of the time obtained from experimental permeate flux results and linear regression of the data. The lignin and vanillin concentration was 60/6, 20/2 and 5/0.5 g L
gR
-1; pH= 8.5
Table D.5 Gel resistance versus time )(tfRg = obtained by using linear regression for each studied concentration.
0feedC (Lignin)
(g L-1)
0feedC (Vanillin)
(g L-1) pH )(tfRg =
128 1028.51021.2 ×+×= tRg ; 993.02 =R5 0.5 128 1089.81021.1 ×+×= tRg ; 950.02 =R20 2 8.5 138 1027.91097.1 ×+×= tRg ; 977.02 =R60 6
Clean Technologies for the Purification of Wastewaters: Adsorptive Parametric Pumping

Experimental data obtained during the ultrafiltration lignin/vanillin mixture D-11
After each experiment the volume of permeate and retentante was measured as well as the
concentration of vanillin and lignin in each stream. The values of volume reduction, and
observed retention of lignin and vanillin are summarized in Table D.6.
Table D.6 The values of volume reduction and retention for vanillin and lignin obtained from experiments onto 50 kD membrane.
C(L) C(VH) obsR obsR(L) (VH) VR [g L-1] [g L-1]
5 0.5 0.410 0.891 0.34
20 2 0.371 0.95 ≈ 0
60 6 0.312 0.93 ≈ 0
The concentration of vanillin and lignin was determined also in the each sample of the
retentante and the permeate taken during the time of the experiment. The concentration
histories of vanillin and lignin in retentante and permeate using membrane of cut-off 50 kDa
are presented in Figure D.15 a ,b and Figure D.16 a, b respectively. The experiment was
performed at constant transmembrane pressure PΔ =1.3 bar. Feed flow rate was adjusted to
56, 100 and 119 L h-1 for each feed concentration, respectively.
Figure D.15 Variations of lignin (a) and vanillin (b) concentration in retentante stream with time using membrane of 50 kDa cut-off. The initial concentration of lignin was 5, 20 and 60 g L-1 and initial concentration of vanillin was 0.5, 2 and 6 g L-1 and pH=8.5. Transmembrane pressure =1.3 bar. Feed flowrate: -1 56, 100 and 119 L hPΔ ≈feedQ
Clean Technologies for the Purification of Wastewaters: Adsorptive Parametric Pumping

D-12 Experimental data obtained during the ultrafiltration of lignin/vanillin mixture
Figure D.16 Variations of lignin (a) and vanillin (b) concentration in permeate stream with time using membrane of 50 kDa cut-off. The initial concentration of lignin was 5, 20 and 60 g L-1 and initial concentration of vanillin was 0.5, 2 and 6 g L-1 and pH=8.5. Transmembrane pressure -1=1.3 bar. Feed flowrate: 56, 100 and 119 L hPΔ ≈feedQ
The variation of the volume in the tank measured for all feed concentrations during
experiments using membrane of 50kDa cut-off is shown in Figure D.17. The full lines
represents the predicted volume reduction using the mathematical model assuming gel layer
resistance for concentrations of lignin/vanillin 60/6 g L-1, 20/2 g L-1 and 5/0.5 g L-1, pH=8.5
0
1
2
3
4
5
6
7
8
0 200 400 600 800 1000time (min)
Vol
ume
in th
e ta
nk (L
)
20-2g/L-8.5 simul60-6g/L-8.5 simul5-0.5g/L-8.5 simul
Figure D.17 Volume in the tank as a function of time for the membrane of 50 KDa cut-off and at concentrations of lignin/vanillin mixture 5/0.5 g L-1 pH=8.5 and 20/2 g L-1 pH=8.5 and 60/6 g L-1 pH=8.5
The variation of permeate volume as a function of the time is shown in Figure D.18. The
experimental data are reported together with the simulated results.
Clean Technologies for the Purification of Wastewaters: Adsorptive Parametric Pumping

Experimental data obtained during the ultrafiltration lignin/vanillin mixture D-13
0
0.5
1
1.5
2
2.5
3
0 200 400 600 800 1000
time (min)
V(L
) per
mea
te
5 g/L 20 g/L 60 g/Lsimul simul simul
Figure D.18 Permeate volume as a function of time for membrane of 50 kDa cut-off for different lignin/vanillin concentrations 5/0.5 g L-1 pH=8.5 and 20/2 g L-1 pH=8.5 and 60/6 g L-1 pH=8.5
D.5 References
Kerasep, Operating manual Microcarbosep,Rhodia group, Orelis, France, 2005.
Rojas, O. J., Song, J. and Argyropoulos, D. S., Lignin separation from kraft black liquors by
tangential ultrafiltration. Ind. La Chimica e l'Industria, 88 (1), 88 - 95 (2006).
Clean Technologies for the Purification of Wastewaters: Adsorptive Parametric Pumping