Embed Size (px)
Citation preview
RReeppoorrtt OOnn TThhee WWoorrkkiinngg OOff
TThhee MMiinniimmuumm WWaaggeess AAcctt,, 11994488 FFoorr TThhee YYeeaarr 22001111
GGoovveerrnnmmeenntt ooff IInnddiiaa MMiinniissttrryy ooff LLaabboouurr aanndd EEmmppllooyymmeenntt
LLaabboouurr BBuurreeaauu CChhaannddiiggaarrhh//SShhiimmllaa
wwwwww..llaabboouurrbbuurreeaauu..ggoovv.. iinn
PREFACE Minimum wage system serves a useful purpose as it prevents exploitation of
labour and provides necessary cushion to workers through periodic revision of minimum
wages on a statutory basis. The Minimum Wages Act, 1948 empowers the Central and
State Governments to fix and revise the minimum rates of wages payable to workers in
scheduled employments in sweated and unorganized industries. The wage rates so fixed
not only regulate the cost of production to an extent but also have an important bearing
on the standard of living and well being of the work force.
Keeping in view the significant of Minimum Wages particularly for the welfare of
Labour, the Labour Bureau brings out an annual report on the working of the Minimum
Wages Act, 1948. The present report pertains to the year 2011. It presents information
on employments added, employments in which the Minimum Wages were fixed for the
first time, the Minimum Wages in different scheduled employments prevalent during the
year, the range of Minimum Wages, comparative Minimum Wage Rates prevailing in
scheduled employments and number of Inspections etc. Information contained in this
volume is based on the annual reports/returns received from the Chief Labour
Commissioner (Central) as well as the concerned authorities of the State Governments
and Union Territories. The Labour Bureau, therefore, expresses its gratitude to all of
them for their co-operation.
I would like to express my appreciation for the efforts put in by the officers and staff
of the Wages Section of Labour Bureau, Chandigarh, whose names appear in Annexure-
V of this Report for bringing out the publication.
The views expressed in this publication are not necessarily those of the Ministry of
Labour and Employment, Government of India. Suggestions for improvement are
welcome.
D.S.KOLAMKAR DIRECTOR GENERAL CHANDIGARH/SHIMLA Dated the 8th April, 2013
i
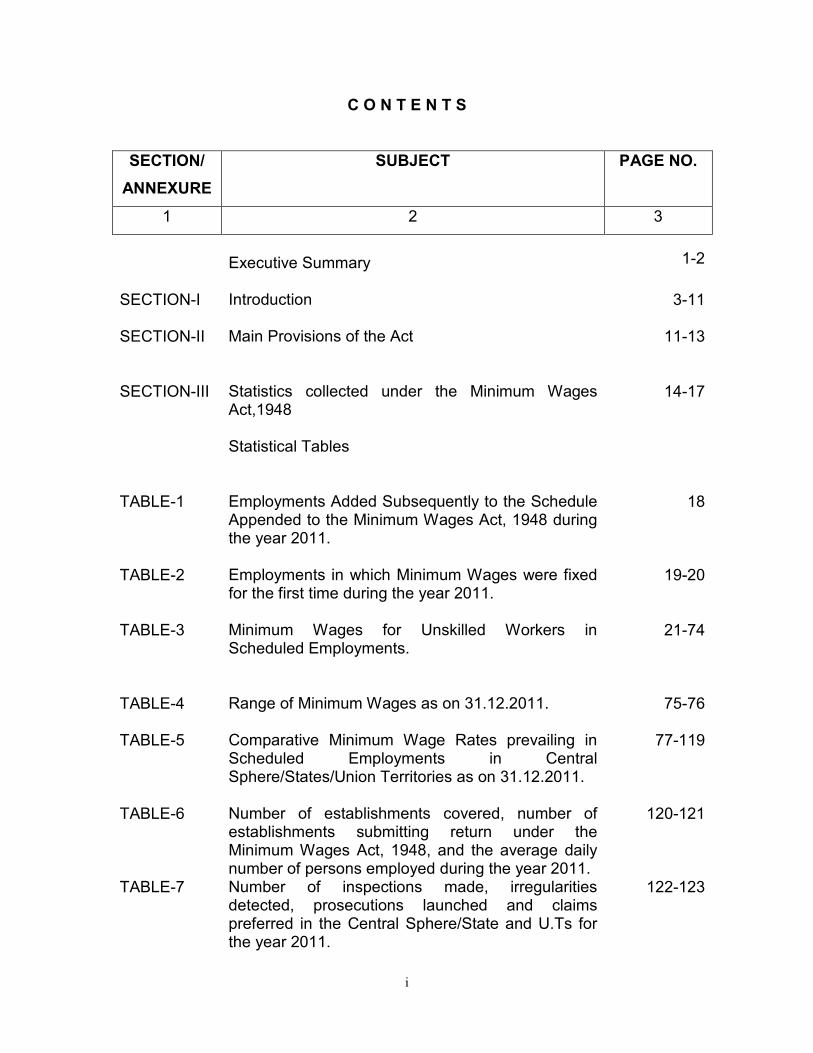
C O N T E N T S
SECTION/ ANNEXURE
SUBJECT PAGE NO.
1 2 3
Executive Summary
1-2
SECTION-I Introduction
3-11
SECTION-II
Main Provisions of the Act 11-13
SECTION-III
Statistics collected under the Minimum Wages Act,1948
14-17
Statistical Tables
TABLE-1 Employments Added Subsequently to the Schedule Appended to the Minimum Wages Act, 1948 during the year 2011.
18
TABLE-2 Employments in which Minimum Wages were fixed for the first time during the year 2011.
19-20
TABLE-3 Minimum Wages for Unskilled Workers in Scheduled Employments.
21-74
TABLE-4 Range of Minimum Wages as on 31.12.2011.
75-76
TABLE-5 Comparative Minimum Wage Rates prevailing in Scheduled Employments in Central Sphere/States/Union Territories as on 31.12.2011.
77-119
TABLE-6 Number of establishments covered, number of establishments submitting return under the Minimum Wages Act, 1948, and the average daily number of persons employed during the year 2011.
120-121
TABLE-7 Number of inspections made, irregularities detected, prosecutions launched and claims preferred in the Central Sphere/State and U.Ts for the year 2011.
122-123
ii
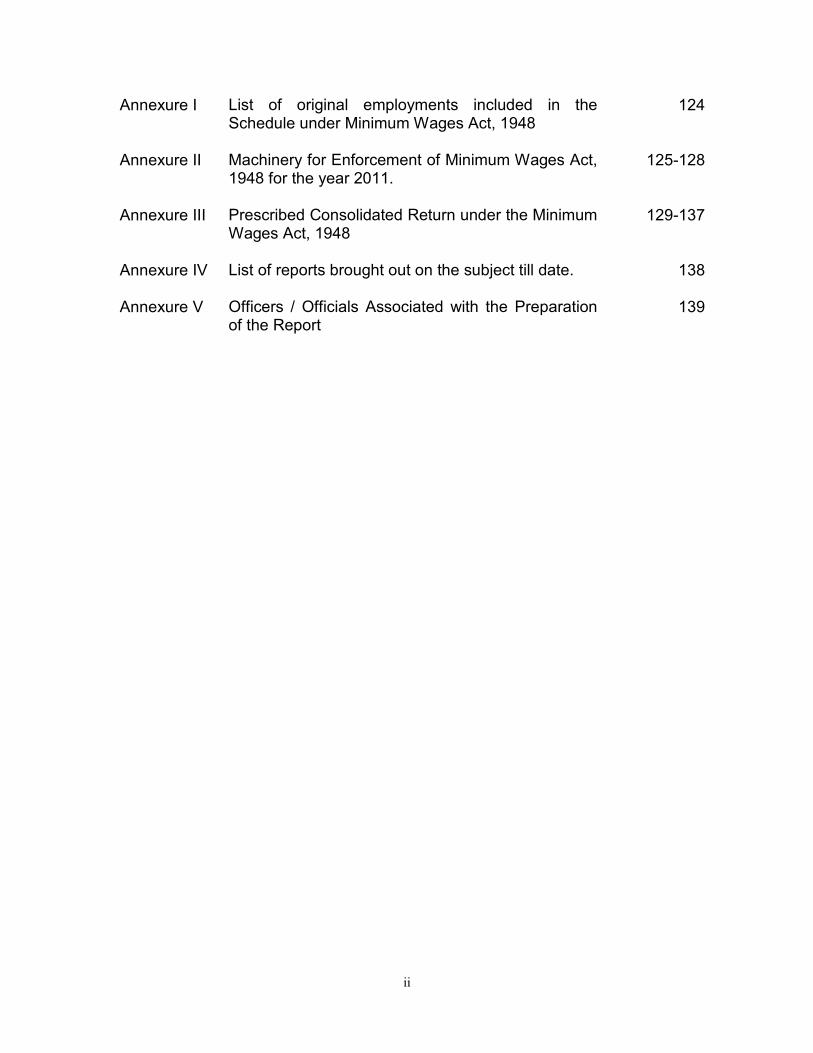
Annexure I List of original employments included in the Schedule under Minimum Wages Act, 1948
124
Annexure II Machinery for Enforcement of Minimum Wages Act, 1948 for the year 2011.
125-128
Annexure III Prescribed Consolidated Return under the Minimum Wages Act, 1948
129-137
Annexure IV List of reports brought out on the subject till date.
138
Annexure V Officers / Officials Associated with the Preparation of the Report
139
1
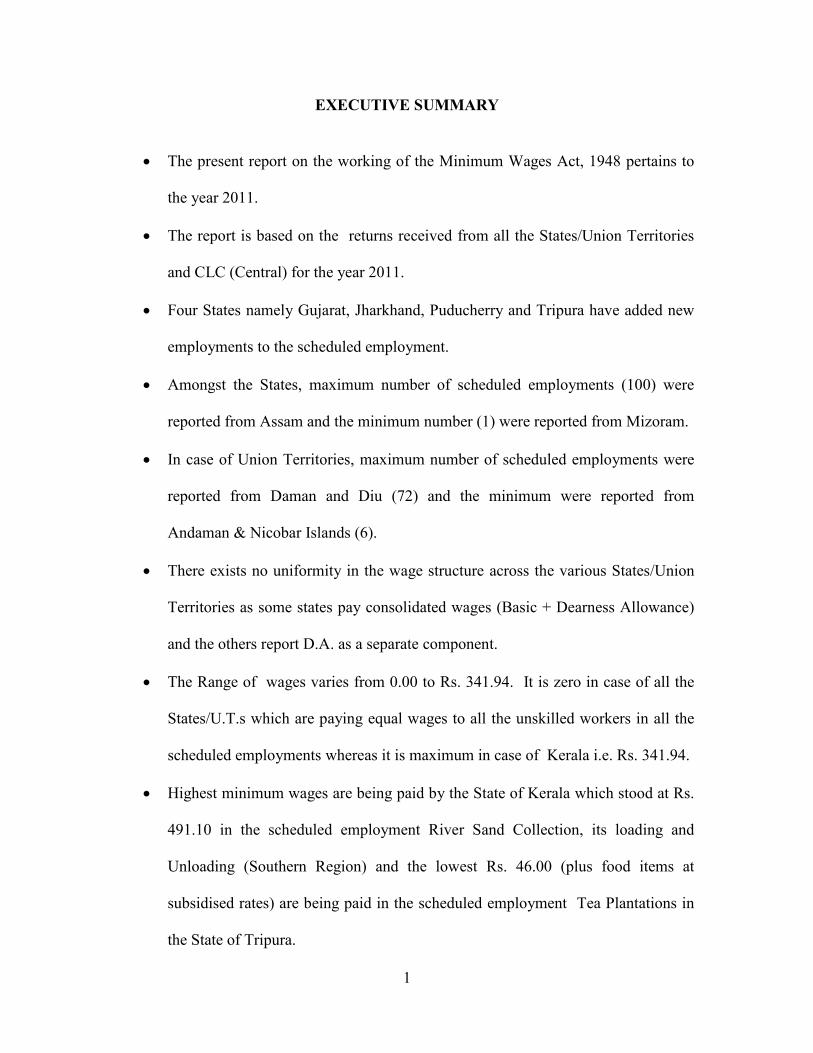
EXECUTIVE SUMMARY
• The present report on the working of the Minimum Wages Act, 1948 pertains to
the year 2011.
• The report is based on the returns received from all the States/Union Territories
and CLC (Central) for the year 2011.
• Four States namely Gujarat, Jharkhand, Puducherry and Tripura have added new
employments to the scheduled employment.
• Amongst the States, maximum number of scheduled employments (100) were
reported from Assam and the minimum number (1) were reported from Mizoram.
• In case of Union Territories, maximum number of scheduled employments were
reported from Daman and Diu (72) and the minimum were reported from
Andaman & Nicobar Islands (6).
• There exists no uniformity in the wage structure across the various States/Union
Territories as some states pay consolidated wages (Basic + Dearness Allowance)
and the others report D.A. as a separate component.
• The Range of wages varies from 0.00 to Rs. 341.94. It is zero in case of all the
States/U.T.s which are paying equal wages to all the unskilled workers in all the
scheduled employments whereas it is maximum in case of Kerala i.e. Rs. 341.94.
• Highest minimum wages are being paid by the State of Kerala which stood at Rs.
491.10 in the scheduled employment River Sand Collection, its loading and
Unloading (Southern Region) and the lowest Rs. 46.00 (plus food items at
subsidised rates) are being paid in the scheduled employment Tea Plantations in
the State of Tripura.
2
• Total of 371 different types of scheduled employments were reported where the
minimum wage rates have been fixed by the States/Union Territories/CLC.
• The response rate in case of the establishments covered under the Act is as low as
0.18 per cent for Uttarakhand and as high as 100.00 per cent for Tripura.
• The highest number of inspections (186259) were reported from the state of
Bihar and the lowest number were reported from Dadra and Nagar Haveli (33).
• The highest number of irregularities were detected by the C.L.C. (166415) and the
lowest (17) were observed in Tripura.
• The highest number of prosecutions were launched by the State of Gujarat (3850)
and the lowest number of prosecutions launched were reported by Andaman and
Nicobar Island (1).
• The highest number of claims were preferred by the State of Andhra Pradesh
(18775) and the lowest were preferred by Dadra and Nagar Haveli (3).
3
REPORT ON THE WORKING OF THE MINIMUM WAGES
ACT, 1948 FOR THE YEAR 2011
I. INTRODUCTION 1.1 The purpose of seeking employment is to sell labour to earn wages so as to attain
a ‘decent’ or ‘dignified’ standard of living. The wage or income that a worker obtains
from his /her work is therefore, what enables him /her to achieve a fair standard of living.
One seeks a fair wage both to fulfil one’s basic needs and to feel reassured that one
receives a fair portion of the wealth in return for one’s work Society and the appropriate
Government has a duty to ensure a fair wage to every worker, to ward off starvation and
poverty, to promote the growth of human resources, and to ensure social justice without
which likely threats to law and order may undermine economic progress.
1.2 The Constitution of India accepts the responsibility of the State to create an
economic order in which every citizen finds employment and receives a ‘fair wage’. This
made it necessary to quantify or lay down clear criteria to identify a fair wage.
Therefore, a Central Advisory Council in its first session (November, 1948) appointed a
Tripartite Committee on Fair Wages. The Committee consisted of representatives of
employers, employees and the Government. Their task was to enquire into and report on
the subject of fair wages to labour.
1.3 THE COMMITTEE ON FAIR WAGES defined three different levels of wages
viz;
(i) Living wage
(ii) Fair wage
(iii)Minimum Wage
1.3.1 Living Wage
The living wage, according to the Committee, represented the highest level of the wage
which should enable the worker to provide for himself and his family not merely the
basic essentials of food, clothing and shelter but a measure of comfort including
education for children, protection against ill health, requirements of essential social
needs and a measure of insurance against more important misfortunes including old age.
But the Committee felt that when such a wage is to be determined, the considerations of
national income and the capacity to pay of the industry concerned has to be taken into
4
account and the Committee was of the opinion that living wage had to be the ultimate
goal or the target.
1.4 Fair Wage 1.4.1 The Fair Wages Committee in this connection observed : “ the objective is not
merely to determine wages which are fair in the abstract, but to see that employment at
existing levels is not only maintained, but if possible increased. From this point of view,
it will be clear that the levels of the wages should enable the industry to maintain
production with efficiency. The capacity of industry to pay should, therefore, be assessed
by the Wage Boards in the light of this very important consideration.”
1.4.2 The Fair Wages Committee also recommended that the fair wage should be
related with the productivity of labour. In this connection, it may be said that in India
since the existing level of wages is unable to maintain the workers on subsistence plus
standard, it is essential that the workers must be first assured a living wage and only after
this minimum has been done, the wages should be related to the productivity. The
Committee further recommended that the fair wage should be related with the prevailing
rates of the wages, though in view of unduly low wages prevailing even in organized
industries in the country, it laid down that the wage fixing machinery should, therefore,
make due allowance for any depression of wages caused by unequal bargaining.
1.4.3 With regard to the machinery to be adopted for the fixation of fair wages, the
Committee favoured the setting up of Wage Boards. It recommended that there should
be a State Board for each State, composed of independent members and representatives
of employers and employees in equal numbers. In addition to the State Board, there
should be a Regional Board for each of the industry taken up for wage regulation.
Finally, there should be a Central Appellate Board to which appeals may be preferred on
the decision of the Wage Boards. On the recommendations of the Committee on Fair
Wages, a bill was introduced in the Parliament in August 1950, known as Fair Wages
Bill. It aimed at fixing fair wages for workers employed in the first instance, in factories
and mines. It contained various other useful provisions also. But the bill now stands
lapsed.
1.4.4 The Fair Wages Committee appointed by the Government of India, as stated
earlier, drew a distinction between a minimum and a living wage and observed that the
5
minimum wage is less than the living wage. With regard to the fair wage, the Committee
recommended that it should be above the minimum wage and below the living wage.
1.5 Minimum Wage
1.5.1 The Committee was of the view that a minimum wage must provide for not
merely the bare sustenance of life, but for the preservation of the efficiency of the
worker. For this purpose, the minimum wage must also provide for some measure of
education, medical requirements and amenities.
1.5.2 The statutory Minimum Wage is the wage determined according to the procedure
prescribed by the relevant provisions of the Minimum Wages Act, 1948.
1.5.3 The question of establishing statutory wage fixing machinery in India was,
therefore, discussed at the third and fourth meetings of the Standing Labour Committee
held in 1943 and 1944 respectively and at successive sessions of the Tripartite Labour
Conference in 1943, 1944 and 1945. The last of these approved the enactment of
minimum wages legislation in principle. On April 11, 1946, a Minimum Wages Bill was
introduced in Parliament but the passage of the Bill was considerably delayed by the
constitutional changes in India. It was, however, passed into an Act in March, 1948.
1.5.4 The Act applies to the employments (Annexure I) that are included in Parts I and
II of the Schedule Appended to the Act. The authority to include an employment in the
schedule and to take steps for getting the minimum rates of wages fixed or revised vests
with the Government – Central or State, according to the nature of employment. Once
the minimum rates of wages are fixed according to the procedure prescribed by law, it is
the obligation of the employer to pay the said wages irrespective of the capacity to pay.
1.6 CONCEPT OF THE MINIMUM WAGES AS DEFINED IN THE
VARIOUS INTERNATIONAL LABOUR ORGANISATION
(ILO) CONFERENCES 1.6.1 A brief history of the concept of Minimum Wages as taken up by the various
International Labour Organisation Conferences from time to time is traced in the
following paragraphs.
6
1.6.2 CONVENTION NO.26 ELEVENTH SESSION (1928)
1.6.3 Eleventh Session held on 30th May, 1928, was convened at Geneva. Adoption of
proposals with regard to Minimum Wage Fixing Machinery was the first item on the
agenda of the Session.
1.6.4 CONVENTION NO. 99 THIRTY FOURTH SESSION (1951)
1.6.5 The Thirty Fourth Session was held on 6th June, 1951 and the Convention
concerning the Minimum Wage Fixing Machinery in Agriculture was the eighth item on
the agenda of the Session. The guidelines for creation / maintenance of adequate
machinery whereby Minimum Wages can be fixed for agricultural workers were similar
to those stated for Minimum Wage Fixing Machinery in the 11th Session of the ILO.
1.6.6 CONVENTION NO.131
FIFTY FOURTH SESSION (1970)
1.6.7 The General Conference of the ILO met in its 54th Session on 3rd June, 1970 in
Geneva and passed the Convention concerning Minimum Wage Fixing, with special
reference to developing countries on 22nd June, 1970. It was thought that the earlier
Conventions with regard to the Minimum Wages had played a valuable part in protecting
disadvantaged groups of wage earners and that another Convention was needed to
complement the earlier ones, which, while of general application, will pay special regard
to the needs of developing countries.
1.7 MINIMUM WAGE DEFINED IN THE VARIOUS SESSIONS
OF INDIAN LABOUR CONFERENCES 1.7.1 FIFTEENTH SESSION, (1957)
At the 15th Session of the Indian Labour Conference held at New Delhi in July
1957, an important resolution was passed, which laid down that the minimum wage
should be need-based and should ensure the minimum human needs of the industrial
worker. The following norms were accepted as a guide for all wage- fixing authorities
including Minimum Wage Committees, Wage Boards, Adjudicators, etc.:
(i) In calculating the minimum wage, the standard working class family
should be taken to comprise three consumption units for one earner, the
earnings of women, children and adolescents being disregarded.
7
(ii) Minimum food requirements should be calculated on the basis of a net
intake of 2700 calories as recommended by Dr. Akroyd for an average
Indian adult of moderate activity.
(iii) Clothing requirements should be estimated on the basis of a per capita
consumption of 18 yards per annum, which would give for the average
worker’s family of four a total of 72 yards.
(iv) In respect of housing, the norm should be the minimum rent charged by
Government in any area for houses provided under the Subsidised
Industrial Housing Scheme for low – income groups ; and
(v) Fuel, lighting and other miscellaneous items of expenditure should
constitute 20 per cent of the total minimum wage. The Resolution
further laid down that wherever the minimum wage fixed was below
the norms recommended above, it would be incumbent on the
authorities concerned to justify the circumstances which prevented
them from adherence to the aforesaid norms. The Resolution, thus,
tried to give a concreteness to the whole concept of minimum wage.
In 1991, the Supreme Court in its judgment expressed the view that children’s
education, medical requirement, minimum recreation, including festivals, ceremonies,
provision for old age and marriage should further constitute 25 per cent and be used as a
guide for fixing the minimum wage.
1.7.2 THE THIRTIETH SESSION (1992)
The Indian Labour Conference in its Thirtieth Session in September, 1992
expressed the view that while the tendency to fix minimum wages at unrealistically high
levels must be checked, implementation of wages once fixed must be ensured. It felt that
the implementation machinery, consisting of labour administration in the States had been
far from effective. It was desirable that workers’ organizations and non-governmental
voluntary organizations etc., played a greater role instead of engaging an army of
inspectors for this purpose.
1.7.3. REVISION
The Minimum Wage rates should be revised at an appropriate interval not
exceeding five years.
8
1.7.4 PROCEDURE FOR FIXATION/REVISION
In (Section 5 of) the Minimum Wages Act, 1948, two methods have been
provided for fixation/revision of minimum wages. They are the Committee method and
Notification method.
(i) COMMITTEE METHOD
Under this method, committees and sub-committees are set up by the
appropriate Governments to hold enquiries and make recommendations
with regard to fixation and revision of minimum wages, as the case may
be.
(ii) NOTIFICATION METHOD
In this method, Government proposals are published in the Official
Gazette for information of the persons likely to be affected thereby and
specify a date not less than two months from the date of the notification on
which the proposals will be taken into consideration. After considering
advice of the Committees/Sub-committees and all the representations
received by the specified date in Notification method, the appropriate
Government shall, by notification in the Official Gazette, fix/revise the
minimum wages in respect of the concerned scheduled employment and it
shall come into force on expiry of three months from the date of its issue.
1.7.5 VARIABLE DEARNESS ALLOWANCE (VDA)
It was recommended in the Labour Ministers' Conference held in 1988, to evolve
a mechanism to protect wages against inflation by linking it to rise in the Consumer Price
Index. The Variable Dearness Allowance came into being in the year 1991. The
allowance is revised twice a year, once on 1st April and then on 1st October.
1.7.6 ENFORCEMENT MACHINERY
The enforcement of the provisions of the Minimum Wages Act in the Central
Sphere is secured through the officers of Central Industrial Relations Machinery. In so
far as State Sphere is concerned, the enforcement is the responsibility of the respective
State Government/Union Territory. Statement showing the strength of Enforcement
Machinery available in different States/Union Territories for enforcement of Minimum
Wages Act, 1948 during the year 2011 is given in Annexure II.
9
1.7.7 NATIONAL WAGE POLICY
Though it is desirable to have a National Wage Policy, it is difficult to conceive a
concept of the same. The issue of National Wage Policy has been discussed on many
occasions at various forums. Because fixation of wages depends on a number of criteria
like local conditions, cost of living and paying capacity which also varies from State to
State and from industry to industry, it would be difficult to maintain uniformity in wages.
The Indian Labour Conference, held in November, 1985 expressed the following views-
“Till such time a national wage policy does not come into being, it would be
desirable to have regional minimum wages in regard to which the Central Government
may lay down the guidelines. The Minimum Wages should be revised at regular
periodicity and should be linked with rise in the cost of living”
Accordingly, the Government issued guidelines in July, 1987 for setting up of
Regional Minimum Wages Advisory Committees. These Committees renamed
subsequently as Regional Labour Ministers’ Conference, made a number of
recommendations which include reduction in disparities in minimum wages in different
states of a region, setting up of inter-state Coordination Council, consultation with
neighbouring States while fixing/revising minimum wages etc.
1.7.8 REGIONAL COMMITTEES TO REDUCE DISPARITIES IN WAGES
There is disparity in rates of minimum wages in various regions of the country.
This is due to the differences in socio-economic and agro-climatic conditions, prices of
essential commodities, paying capacity, productivity and local conditions influencing the
wage rate. The regional disparity in minimum wages is also attributed to the fact that both
the Central and State Governments are the appropriate Government to fix, revise and
enforce minimum wages in scheduled employments in their respective jurisdictions under
10
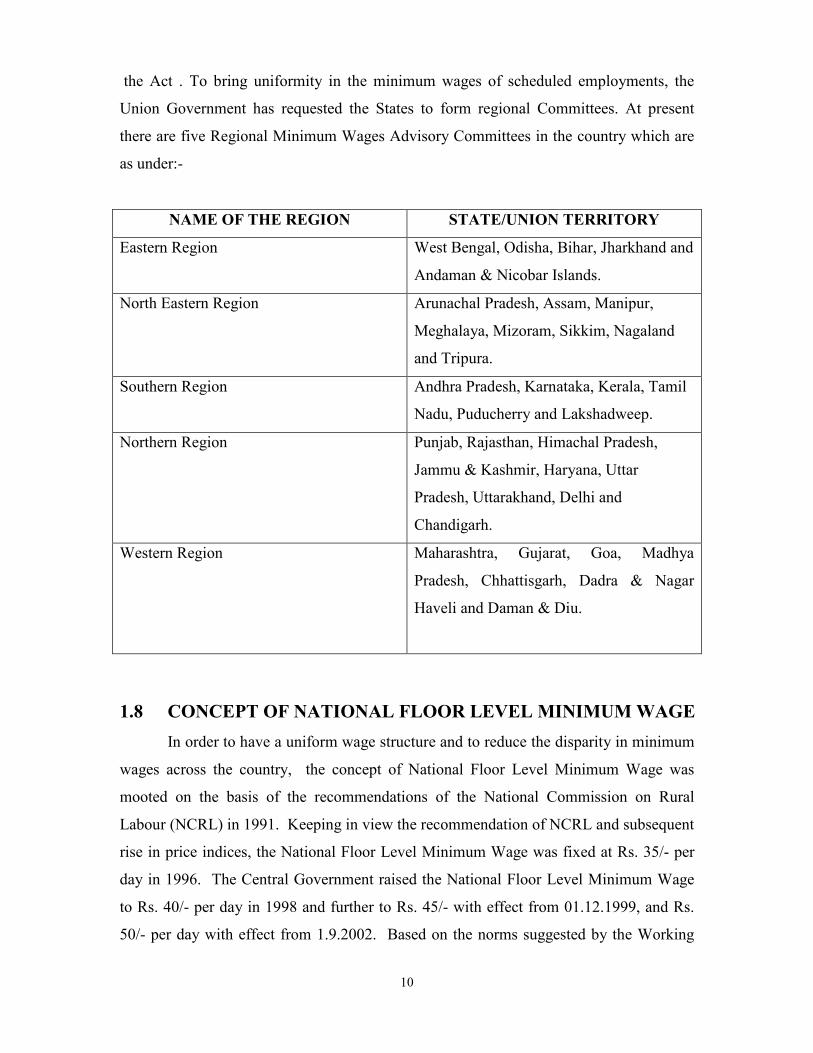
the Act . To bring uniformity in the minimum wages of scheduled employments, the
Union Government has requested the States to form regional Committees. At present
there are five Regional Minimum Wages Advisory Committees in the country which are
as under:-
NAME OF THE REGION STATE/UNION TERRITORY
Eastern Region West Bengal, Odisha, Bihar, Jharkhand and
Andaman & Nicobar Islands.
North Eastern Region Arunachal Pradesh, Assam, Manipur,
Meghalaya, Mizoram, Sikkim, Nagaland
and Tripura.
Southern Region Andhra Pradesh, Karnataka, Kerala, Tamil
Nadu, Puducherry and Lakshadweep.
Northern Region Punjab, Rajasthan, Himachal Pradesh,
Jammu & Kashmir, Haryana, Uttar
Pradesh, Uttarakhand, Delhi and
Chandigarh.
Western Region Maharashtra, Gujarat, Goa, Madhya
Pradesh, Chhattisgarh, Dadra & Nagar
Haveli and Daman & Diu.
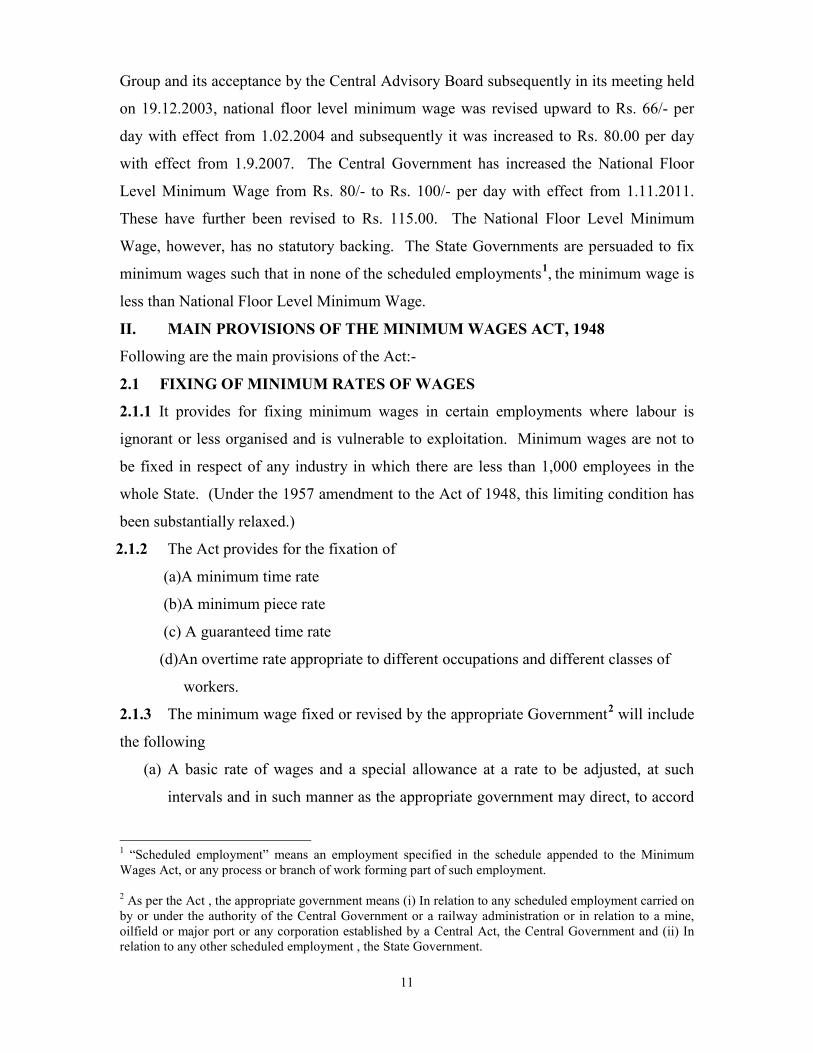
1.8 CONCEPT OF NATIONAL FLOOR LEVEL MINIMUM WAGE In order to have a uniform wage structure and to reduce the disparity in minimum
wages across the country, the concept of National Floor Level Minimum Wage was
mooted on the basis of the recommendations of the National Commission on Rural
Labour (NCRL) in 1991. Keeping in view the recommendation of NCRL and subsequent
rise in price indices, the National Floor Level Minimum Wage was fixed at Rs. 35/- per
day in 1996. The Central Government raised the National Floor Level Minimum Wage
to Rs. 40/- per day in 1998 and further to Rs. 45/- with effect from 01.12.1999, and Rs.
50/- per day with effect from 1.9.2002. Based on the norms suggested by the Working
11
Group and its acceptance by the Central Advisory Board subsequently in its meeting held
on 19.12.2003, national floor level minimum wage was revised upward to Rs. 66/- per
day with effect from 1.02.2004 and subsequently it was increased to Rs. 80.00 per day
with effect from 1.9.2007. The Central Government has increased the National Floor
Level Minimum Wage from Rs. 80/- to Rs. 100/- per day with effect from 1.11.2011.
These have further been revised to Rs. 115.00. The National Floor Level Minimum
Wage, however, has no statutory backing. The State Governments are persuaded to fix
minimum wages such that in none of the scheduled employments1
II. MAIN PROVISIONS OF THE MINIMUM WAGES ACT, 1948
, the minimum wage is
less than National Floor Level Minimum Wage.
Following are the main provisions of the Act:-
2.1 FIXING OF MINIMUM RATES OF WAGES
2.1.1 It provides for fixing minimum wages in certain employments where labour is
ignorant or less organised and is vulnerable to exploitation. Minimum wages are not to
be fixed in respect of any industry in which there are less than 1,000 employees in the
whole State. (Under the 1957 amendment to the Act of 1948, this limiting condition has
been substantially relaxed.)
2.1.2 The Act provides for the fixation of
(a)A minimum time rate
(b)A minimum piece rate
(c) A guaranteed time rate
(d)An overtime rate appropriate to different occupations and different classes of
workers.
2.1.3 The minimum wage fixed or revised by the appropriate Government2
(a) A basic rate of wages and a special allowance at a rate to be adjusted, at such
intervals and in such manner as the appropriate government may direct, to accord
will include
the following
1 “Scheduled employment” means an employment specified in the schedule appended to the Minimum Wages Act, or any process or branch of work forming part of such employment. 2 As per the Act , the appropriate government means (i) In relation to any scheduled employment carried on by or under the authority of the Central Government or a railway administration or in relation to a mine, oilfield or major port or any corporation established by a Central Act, the Central Government and (ii) In relation to any other scheduled employment , the State Government.
12
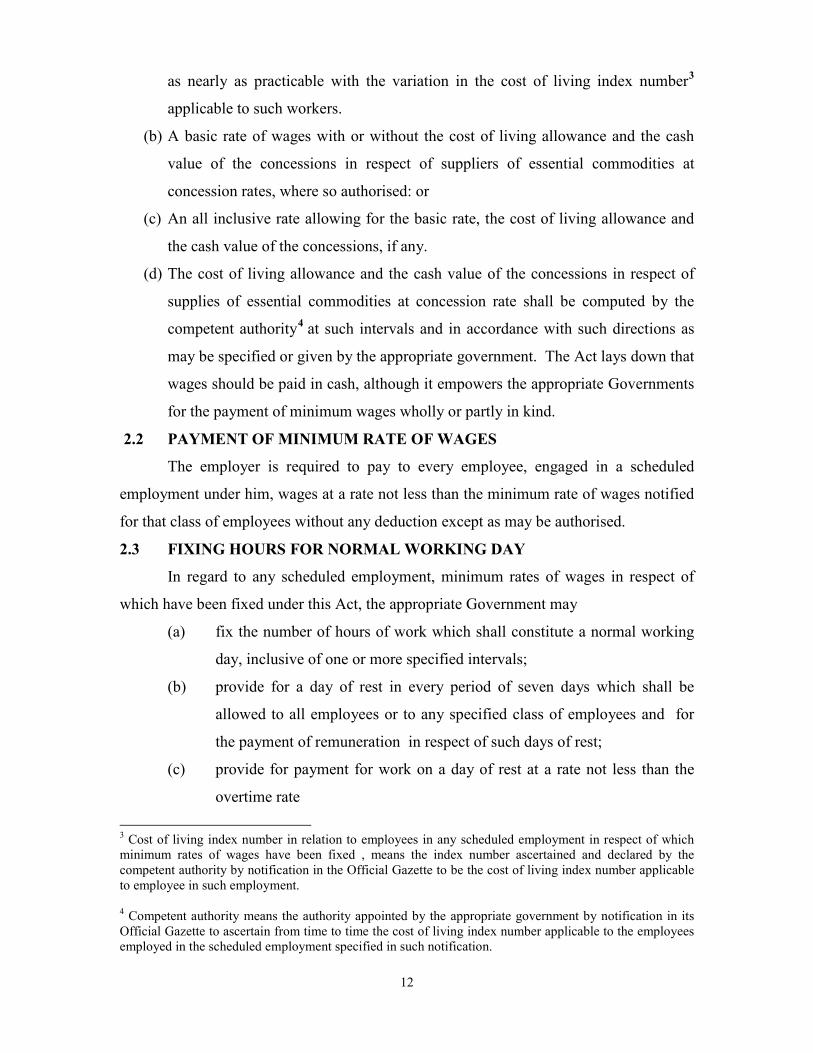
as nearly as practicable with the variation in the cost of living index number3
(b) A basic rate of wages with or without the cost of living allowance and the cash
value of the concessions in respect of suppliers of essential commodities at
concession rates, where so authorised: or
applicable to such workers.
(c) An all inclusive rate allowing for the basic rate, the cost of living allowance and
the cash value of the concessions, if any.
(d) The cost of living allowance and the cash value of the concessions in respect of
supplies of essential commodities at concession rate shall be computed by the
competent authority4
2.2 PAYMENT OF MINIMUM RATE OF WAGES
at such intervals and in accordance with such directions as
may be specified or given by the appropriate government. The Act lays down that
wages should be paid in cash, although it empowers the appropriate Governments
for the payment of minimum wages wholly or partly in kind.
The employer is required to pay to every employee, engaged in a scheduled
employment under him, wages at a rate not less than the minimum rate of wages notified
for that class of employees without any deduction except as may be authorised.
2.3 FIXING HOURS FOR NORMAL WORKING DAY
In regard to any scheduled employment, minimum rates of wages in respect of
which have been fixed under this Act, the appropriate Government may
(a) fix the number of hours of work which shall constitute a normal working
day, inclusive of one or more specified intervals;
(b) provide for a day of rest in every period of seven days which shall be
allowed to all employees or to any specified class of employees and for
the payment of remuneration in respect of such days of rest;
(c) provide for payment for work on a day of rest at a rate not less than the
overtime rate
3 Cost of living index number in relation to employees in any scheduled employment in respect of which minimum rates of wages have been fixed , means the index number ascertained and declared by the competent authority by notification in the Official Gazette to be the cost of living index number applicable to employee in such employment. 4 Competent authority means the authority appointed by the appropriate government by notification in its Official Gazette to ascertain from time to time the cost of living index number applicable to the employees employed in the scheduled employment specified in such notification.
13
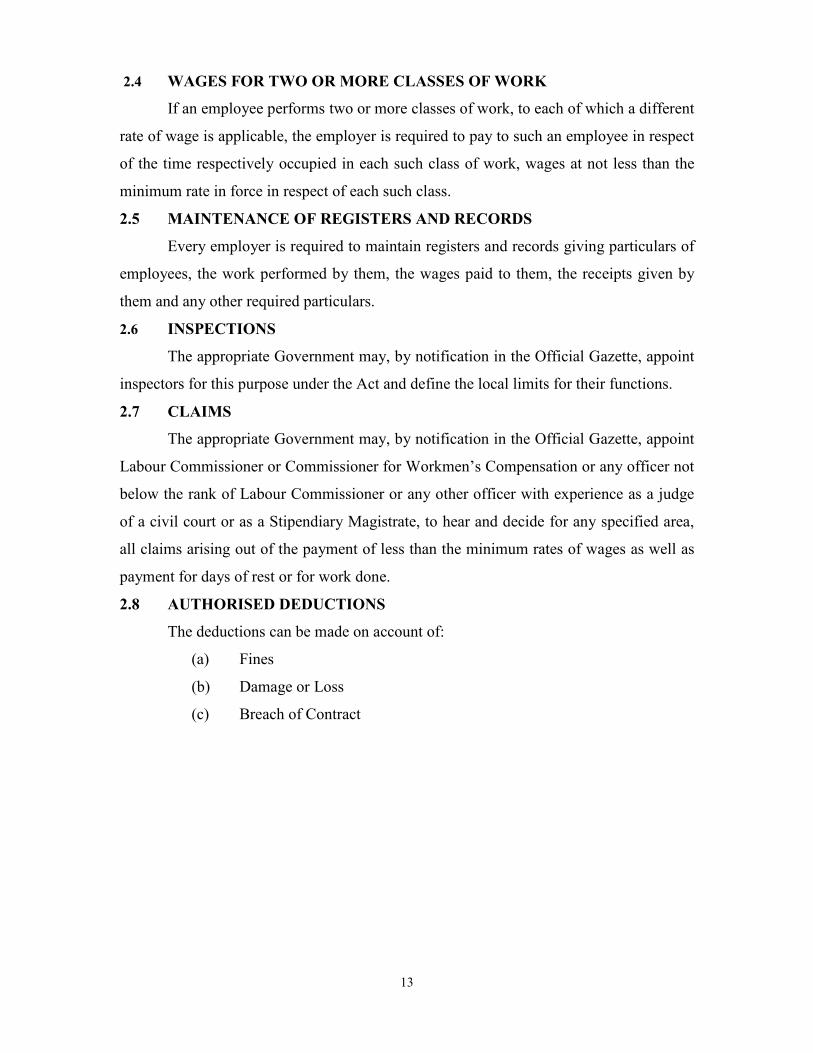
2.4 WAGES FOR TWO OR MORE CLASSES OF WORK
If an employee performs two or more classes of work, to each of which a different
rate of wage is applicable, the employer is required to pay to such an employee in respect
of the time respectively occupied in each such class of work, wages at not less than the
minimum rate in force in respect of each such class.
2.5 MAINTENANCE OF REGISTERS AND RECORDS
Every employer is required to maintain registers and records giving particulars of
employees, the work performed by them, the wages paid to them, the receipts given by
them and any other required particulars.
2.6 INSPECTIONS
The appropriate Government may, by notification in the Official Gazette, appoint
inspectors for this purpose under the Act and define the local limits for their functions.
2.7 CLAIMS
The appropriate Government may, by notification in the Official Gazette, appoint
Labour Commissioner or Commissioner for Workmen’s Compensation or any officer not
below the rank of Labour Commissioner or any other officer with experience as a judge
of a civil court or as a Stipendiary Magistrate, to hear and decide for any specified area,
all claims arising out of the payment of less than the minimum rates of wages as well as
payment for days of rest or for work done.
2.8 AUTHORISED DEDUCTIONS
The deductions can be made on account of:
(a) Fines
(b) Damage or Loss
(c) Breach of Contract
14
III. STATISTICS COLLECTED UNDER THE MINIMUM WAGES
ACT, 1948 3.1 All establishments covered under the Act are required to furnish to the concerned
authority (Central or State) an annual return in prescribed form as per the rules framed
under the Minimum Wages Act, 1948. The Centre / State Governments in turn send a
consolidated return (Annexure III) to the Labour Bureau which compiles an all India
report based on the data contained in these returns after scrutiny to ensure accuracy and
consistency of data. Where the monthly Minimum Wages have been reported, these have
been converted to daily minimum wages by dividing the monthly wages by 26, the
fortnightly and weekly minimum wages have been divided by 12 and 6 respectively to
arrive at the daily minimum wage.
3.2 ADDITION OF NEW EMPLOYMENTS
3.2.1 The State Governments and the Union Territories review the Scheduled
Employments under their jurisdiction from time to time and add new employments in
respect of which it is of the opinion that minimum rates of wages should be fixed
statutorily in addition to the existing ones.
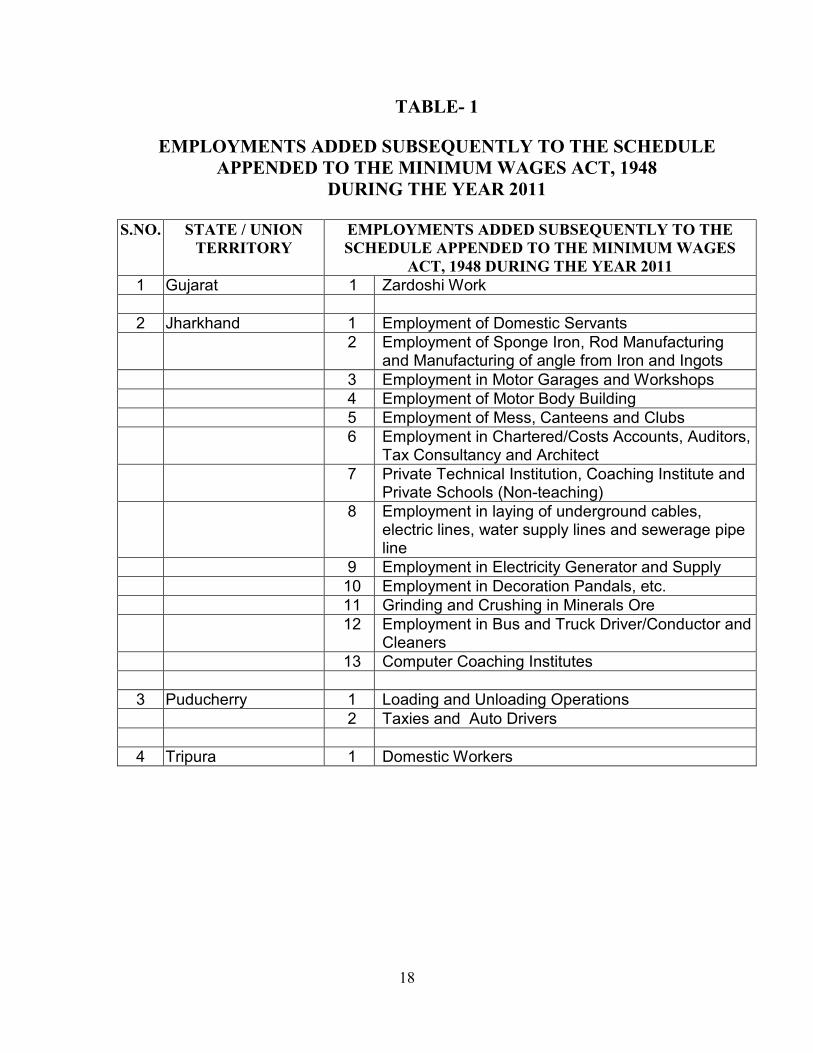
3.2.2 During the year 2011, four States namely Gujarat, Jharkhand, Puducherry and
Tripura added new employments to the Schedule appended to the Act (Table 1).
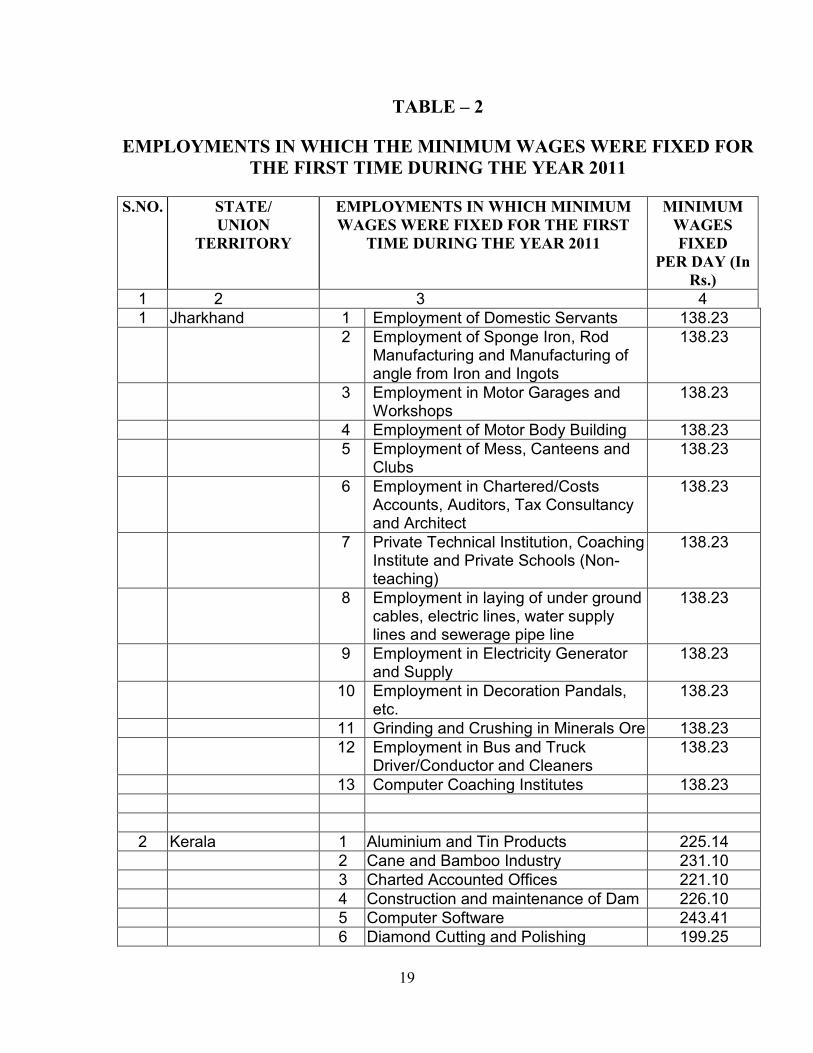
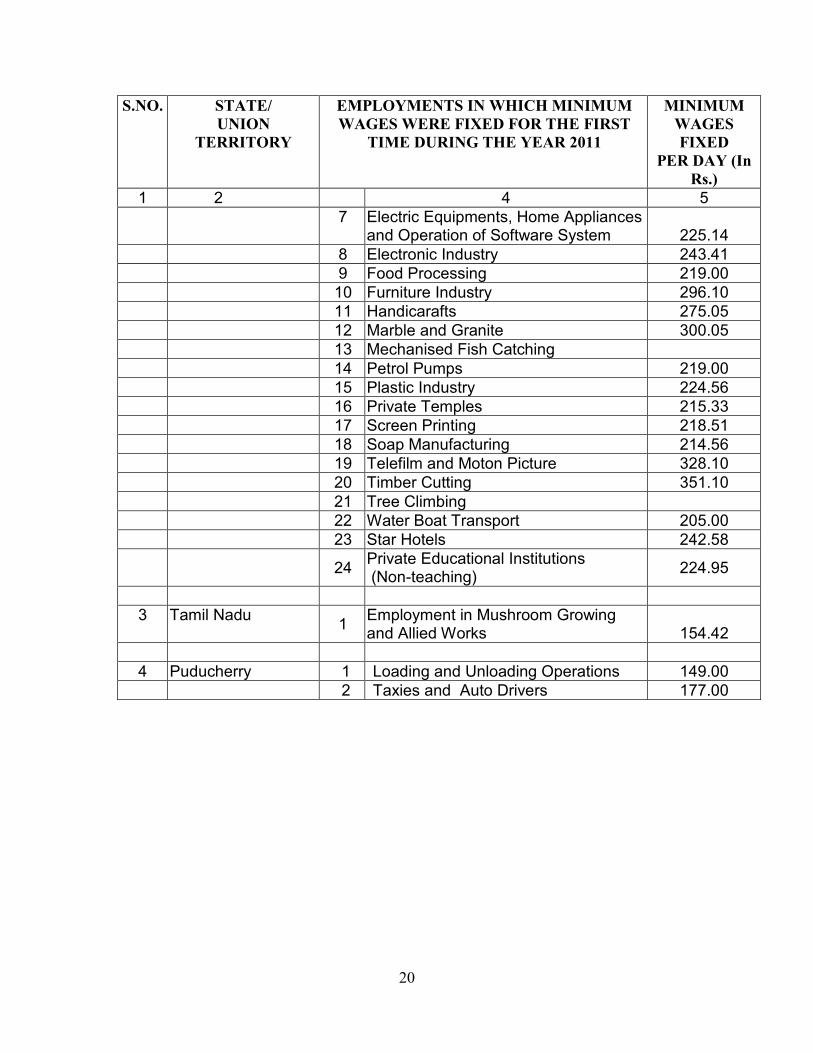
3.3 FIXATION OF MINIMUM WAGES FOR THE FIRST TIME
Table 2 shows that during the year 2011, the minimum wages were fixed for the
first time by the States of Jharkhand in 13 scheduled employments, Kerala in 24
scheduled employments, Tamil Nadu in 1 scheduled employment and Puducherry in 2
scheduled employments.
3.4 SCHEDULED EMPLOYMENTS AND PREVAILING MINIMUM WAGE
RATES
The Central Government and the different State Governments have been
maintaining a set of scheduled employments for fixing minimum rates of wages under
their respective jurisdiction. This set undergoes a change as and when there is an
addition of an employment in the schedule appended to the Minimum Wages Act, 1948
by these appropriate Governments.
15
Table 3 presents the data for 35 States/Union Territories and CLC (Central) on
Minimum Wages for Unskilled Workers in Scheduled Employments as on 31.12.2011.
The number of scheduled employments varies from State to State and so do the minimum
wages. Amongst the States, the largest number of scheduled employments were reported
from Assam which stood at 100 and the lowest number i.e. 1 was reported from
Mizoram. In case of Union Territories, the maximum number of scheduled employments
i.e. 72 were reported from Daman & Diu and the minimum i.e. 6 from Andaman &
Nicobar Islands. An analysis of the table also shows that there is no uniformity in the
wage structure as some States pay consolidated wages (Basic + Dearness Allowance) and
some are reporting D.A. as a separate component. Only 13 States, 3 U.T. and the CLC
(Central) have linked wages to periodic revision of D.A. Further, 17 States/Union
Territories were paying by and large equal wages to all the unskilled workers in all the
scheduled employments.
3.5 SCHEDULED EMPLOYMENTS AND RANGE OF MINIMUM
WAGE RATES
3.5.1 The total number of employments in respect of which the minimum wage rates
have been fixed / revised and the range of minimum wage rates in different States / Union
Territories as on 31.12.2011 have been presented in Table 4.
3.5.2 It emerges from the Table that the number of scheduled employments was highest
in the State of Assam (100) followed by Bihar (88), Jharkhand (88), Karnataka (81) and
Daman and Diu (72).
3.5.3 The dispersion of wage rates as measured by the range between the lowest
minimum wage rate and the highest minimum wage rate at all States / U.Ts. level is
large, which is reflected by the fact that it is zero in case of the States/Union Territories
which are paying equal wages to all the unskilled workers in all the scheduled
employments whereas it is the maximum in case of Kerala i.e. Rs. 341.94.
3.6 MINIMUM WAGE RATES IN SCHEDULED EMPLOYMENTS IN
CENTRAL SPHERE / STATES / UNION TERRITORIES
3.6.1 Table 5 depicts a comparative picture of the minimum wage rates per day
prevailing in the scheduled employments in Central Sphere / States / Union Territories.
The main purpose of classifying this information is:
16
(a) to study the inter-State variations in the minimum wage rates in a
particular scheduled employment and
(b) to present the number and names of the States / U.Ts. fixing minimum
wages for a particular employment at one place.
3.6.2 It is clear from the Table that as on 31.12.2011 there were in all 371 different
types of scheduled employments all over India for which minimum wage rates have been
fixed / revised by the Central Government / States / Union Territories submitting returns .
However differences in the range of minimum wages were found in the same scheduled
employment in States or U.Ts. For instance, in Agriculture, the minimum wage rates of
Rs. 55.00 per day were reported from the State of Puducherry (Yanam Region), and Rs.
247.00 were prevalent in Delhi. Similarly in Public Motor Transport, minimum wage
rates of Rs.70.85 were observed in the States of Tripura and Rs.247.00 per day were
found in Delhi. Further in Construction/Maintenance of Building and Roads, minimum
wage rates of Rs.80.00 per day were found in Arunachal Pradesh and Rs.247.00 in
Delhi. In case of Dal/Flour/Rice Mills, minimum wage rates of Rs. 77.00 per day were
reported from the U.T. of Puducherry and Rs. 247.00 per day was prevalent in Delhi. In
the case of Stone Breaking and Stone Crushing, minimum wage rates of Rs. 80.00 per
day were reported from the States Arunachal Pradesh and Rs. 308.15 in the State of
Kerala. In Forestry/Timber Operations and Social Forestry, minimum wage rates of Rs.
69.27 per day were reported from the State of Andhra Pradesh and Rs. 361.10 per day
were prevalent in the State of Kerala. The same pattern is observable in the other
scheduled employments as well. Table-3 shows that highest minimum wages are being
paid by the State of Kerala which stood at Rs. 491.10 in the scheduled employment River
Sand Collection, its loading and unloading in the Southern Region and lowest in the State
of Tripura i.e. Rs. 46.00 (plus food items at subsidised rates) in scheduled employment
Tea Plantations.
3.7 SUBMISSION OF RETURNS
Details regarding the number of establishments covered under the Minimum
Wages Act, 1948 and those submitting returns as well as average daily employment have
been presented in Table 6. In the State sphere, the response rate was as low as 0.00 per
cent in the State of Lakshadweep and as high as 100.00 per cent in Tripura.
17
3.8 INSPECTIONS
3.8.1 The State-wise details of Inspections made, irregularities detected, prosecutions
launched and claims preferred have been given in Table 7.
3.8.2 In the States/U.Ts. , the highest number of inspections (186259) were reported
from the State of Bihar followed by (117193) by the State of Gujarat and highest
number of irregularities (166415) were reported by C.L.C. followed by (63328) by the
State of Kerala. On the other hand, no inspections were made by Lakshadweep
whereas no irregularities were observed in Meghalaya, Manipur, Sikkim and Daman &
Diu. In the State sphere, the highest number of prosecutions (3850) were launched in
Gujarat whereas no prosecutions were launched in Meghalaya, Manipur, Sikkim, Tripura
and Daman & Diu.. The highest number of claims preferred were in Andhra Pradesh
(18775) followed by Bihar (14487) and no case was preferred by Andaman & Nicobar
Island.
3.9 ENFORCEMENT OF THE ACT
Mere fixation / revision of wages would not be sufficient unless it is ensured that
the workers are paid accordingly. Thus provision of adequate staff is a must for
successful implementation of the Minimum Wages Act. However, in most of the States
and Union Territories, there was no machinery appointed exclusively for the enforcement
of the Minimum Wages Act and the inspection staff appointed under other labour Acts
was entrusted with the enforcement of the Minimum Wages Act also. The Statement
showing the strength of the machinery for enforcement of the Minimum Wages Act, 1948
during the year 2011 has been given in Annexure- II.
18
TABLE- 1
EMPLOYMENTS ADDED SUBSEQUENTLY TO THE SCHEDULE APPENDED TO THE MINIMUM WAGES ACT, 1948
DURING THE YEAR 2011
S.NO. STATE / UNION TERRITORY
EMPLOYMENTS ADDED SUBSEQUENTLY TO THE SCHEDULE APPENDED TO THE MINIMUM WAGES
ACT, 1948 DURING THE YEAR 2011 1 Gujarat 1 Zardoshi Work
2 Jharkhand 1 Employment of Domestic Servants 2 Employment of Sponge Iron, Rod Manufacturing
and Manufacturing of angle from Iron and Ingots 3 Employment in Motor Garages and Workshops 4 Employment of Motor Body Building 5 Employment of Mess, Canteens and Clubs 6 Employment in Chartered/Costs Accounts, Auditors,
Tax Consultancy and Architect 7 Private Technical Institution, Coaching Institute and
Private Schools (Non-teaching) 8 Employment in laying of underground cables,
electric lines, water supply lines and sewerage pipe line
9 Employment in Electricity Generator and Supply 10 Employment in Decoration Pandals, etc. 11 Grinding and Crushing in Minerals Ore 12 Employment in Bus and Truck Driver/Conductor and
Cleaners 13 Computer Coaching Institutes
3 Puducherry 1 Loading and Unloading Operations 2 Taxies and Auto Drivers
4 Tripura 1 Domestic Workers
19
TABLE – 2 EMPLOYMENTS IN WHICH THE MINIMUM WAGES WERE FIXED FOR
THE FIRST TIME DURING THE YEAR 2011
S.NO. STATE/ UNION
TERRITORY
EMPLOYMENTS IN WHICH MINIMUM WAGES WERE FIXED FOR THE FIRST
TIME DURING THE YEAR 2011
MINIMUM WAGES FIXED
PER DAY (In Rs.)
1 2 3 4 1 Jharkhand 1 Employment of Domestic Servants 138.23 2 Employment of Sponge Iron, Rod
Manufacturing and Manufacturing of angle from Iron and Ingots
138.23
3 Employment in Motor Garages and Workshops
138.23
4 Employment of Motor Body Building 138.23 5 Employment of Mess, Canteens and
Clubs 138.23
6 Employment in Chartered/Costs Accounts, Auditors, Tax Consultancy and Architect
138.23
7 Private Technical Institution, Coaching Institute and Private Schools (Non-teaching)
138.23
8 Employment in laying of under ground cables, electric lines, water supply lines and sewerage pipe line
138.23
9 Employment in Electricity Generator and Supply
138.23
10 Employment in Decoration Pandals, etc.
138.23
11 Grinding and Crushing in Minerals Ore 138.23 12 Employment in Bus and Truck
Driver/Conductor and Cleaners 138.23
13 Computer Coaching Institutes 138.23
2 Kerala 1 Aluminium and Tin Products 225.14 2 Cane and Bamboo Industry 231.10 3 Charted Accounted Offices 221.10 4 Construction and maintenance of Dam 226.10 5 Computer Software 243.41 6 Diamond Cutting and Polishing 199.25
20
S.NO. STATE/ UNION
TERRITORY
EMPLOYMENTS IN WHICH MINIMUM WAGES WERE FIXED FOR THE FIRST
TIME DURING THE YEAR 2011
MINIMUM WAGES FIXED
PER DAY (In Rs.)
1 2 4 5 7 Electric Equipments, Home Appliances
and Operation of Software System 225.14 8 Electronic Industry 243.41 9 Food Processing 219.00 10 Furniture Industry 296.10 11 Handicarafts 275.05 12 Marble and Granite 300.05 13 Mechanised Fish Catching 14 Petrol Pumps 219.00 15 Plastic Industry 224.56 16 Private Temples 215.33 17 Screen Printing 218.51 18 Soap Manufacturing 214.56 19 Telefilm and Moton Picture 328.10 20 Timber Cutting 351.10 21 Tree Climbing 22 Water Boat Transport 205.00 23 Star Hotels 242.58 24 Private Educational Institutions
(Non-teaching) 224.95
3 Tamil Nadu 1 Employment in Mushroom Growing
and Allied Works 154.42
4 Puducherry 1 Loading and Unloading Operations 149.00 2 Taxies and Auto Drivers 177.00
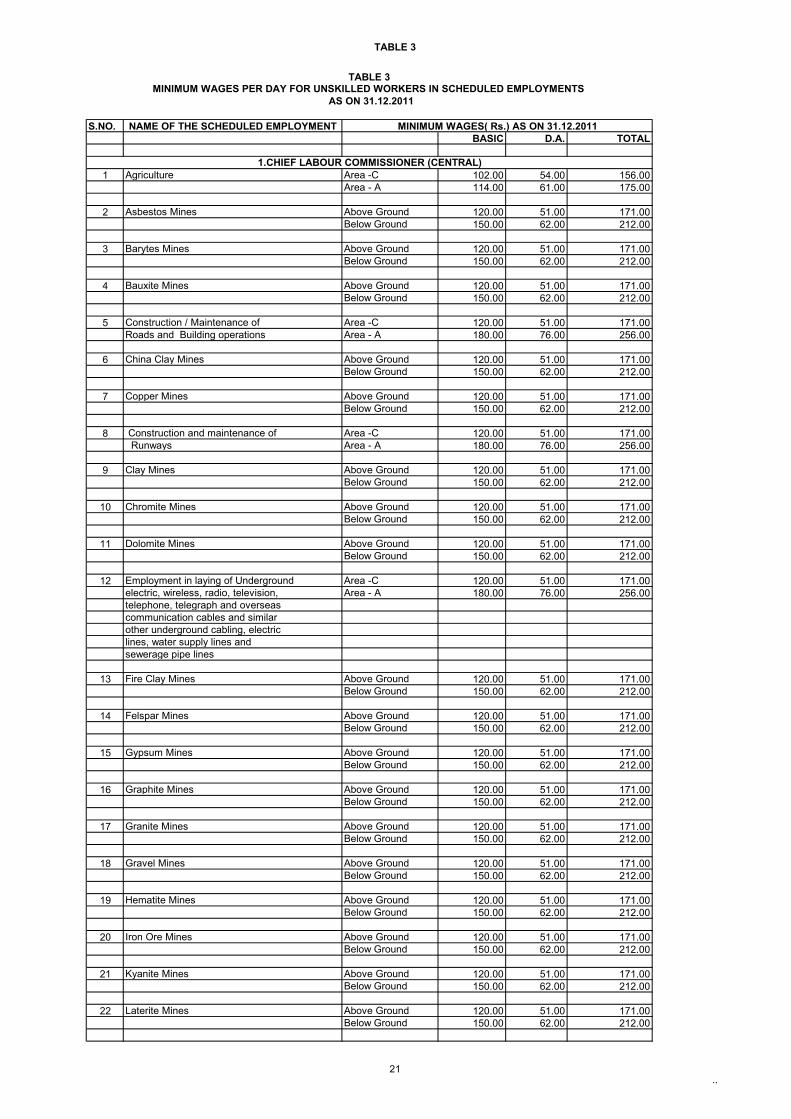
TABLE 3
21..
S.NO. NAME OF THE SCHEDULED EMPLOYMENTBASIC D.A. TOTAL
1 Agriculture Area -C 102.00 54.00 156.00Area - A 114.00 61.00 175.00
2 Asbestos Mines Above Ground 120.00 51.00 171.00Below Ground 150.00 62.00 212.00
3 Barytes Mines Above Ground 120.00 51.00 171.00Below Ground 150.00 62.00 212.00
4 Bauxite Mines Above Ground 120.00 51.00 171.00Below Ground 150.00 62.00 212.00
5 Construction / Maintenance of Area -C 120.00 51.00 171.00Roads and Building operations Area - A 180.00 76.00 256.00
6 China Clay Mines Above Ground 120.00 51.00 171.00Below Ground 150.00 62.00 212.00
7 Copper Mines Above Ground 120.00 51.00 171.00Below Ground 150.00 62.00 212.00
8 Construction and maintenance of Area -C 120.00 51.00 171.00 Runways Area - A 180.00 76.00 256.00
9 Clay Mines Above Ground 120.00 51.00 171.00Below Ground 150.00 62.00 212.00
10 Chromite Mines Above Ground 120.00 51.00 171.00Below Ground 150.00 62.00 212.00
11 Dolomite Mines Above Ground 120.00 51.00 171.00Below Ground 150.00 62.00 212.00
12 Employment in laying of Underground Area -C 120.00 51.00 171.00electric, wireless, radio, television, Area - A 180.00 76.00 256.00telephone, telegraph and overseascommunication cables and similarother underground cabling, electriclines, water supply lines and sewerage pipe lines
13 Fire Clay Mines Above Ground 120.00 51.00 171.00Below Ground 150.00 62.00 212.00
14 Felspar Mines Above Ground 120.00 51.00 171.00Below Ground 150.00 62.00 212.00
15 Gypsum Mines Above Ground 120.00 51.00 171.00Below Ground 150.00 62.00 212.00
16 Graphite Mines Above Ground 120.00 51.00 171.00Below Ground 150.00 62.00 212.00
17 Granite Mines Above Ground 120.00 51.00 171.00Below Ground 150.00 62.00 212.00
18 Gravel Mines Above Ground 120.00 51.00 171.00Below Ground 150.00 62.00 212.00
19 Hematite Mines Above Ground 120.00 51.00 171.00Below Ground 150.00 62.00 212.00
20 Iron Ore Mines Above Ground 120.00 51.00 171.00Below Ground 150.00 62.00 212.00
21 Kyanite Mines Above Ground 120.00 51.00 171.00Below Ground 150.00 62.00 212.00
22 Laterite Mines Above Ground 120.00 51.00 171.00Below Ground 150.00 62.00 212.00
TABLE 3 MINIMUM WAGES PER DAY FOR UNSKILLED WORKERS IN SCHEDULED EMPLOYMENTS
AS ON 31.12.2011
1.CHIEF LABOUR COMMISSIONER (CENTRAL)
MINIMUM WAGES( Rs.) AS ON 31.12.2011
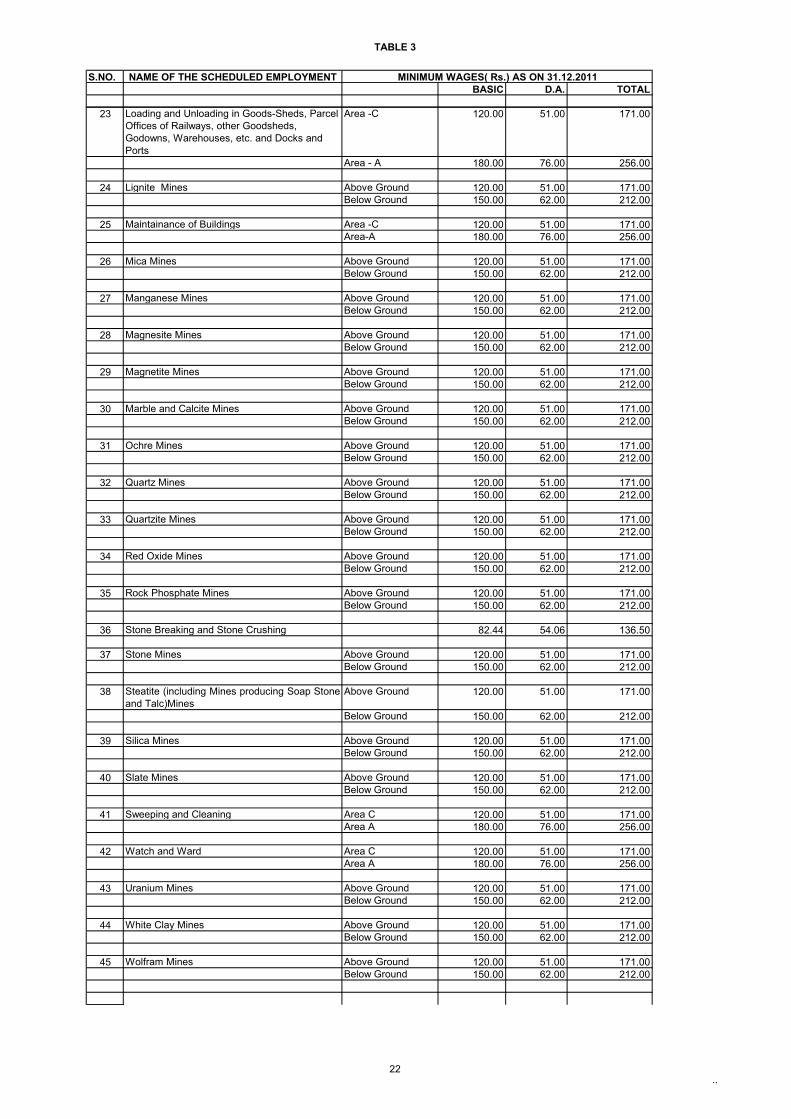
TABLE 3
22..
S.NO. NAME OF THE SCHEDULED EMPLOYMENTBASIC D.A. TOTAL
MINIMUM WAGES( Rs.) AS ON 31.12.2011
23 Loading and Unloading in Goods-Sheds, Parcel Offices of Railways, other Goodsheds, Godowns, Warehouses, etc. and Docks and Ports
Area -C 120.00 51.00 171.00
Area - A 180.00 76.00 256.00
24 Lignite Mines Above Ground 120.00 51.00 171.00Below Ground 150.00 62.00 212.00
25 Maintainance of Buildings Area -C 120.00 51.00 171.00Area-A 180.00 76.00 256.00
26 Mica Mines Above Ground 120.00 51.00 171.00Below Ground 150.00 62.00 212.00
27 Manganese Mines Above Ground 120.00 51.00 171.00Below Ground 150.00 62.00 212.00
28 Magnesite Mines Above Ground 120.00 51.00 171.00Below Ground 150.00 62.00 212.00
29 Magnetite Mines Above Ground 120.00 51.00 171.00Below Ground 150.00 62.00 212.00
30 Marble and Calcite Mines Above Ground 120.00 51.00 171.00Below Ground 150.00 62.00 212.00
31 Ochre Mines Above Ground 120.00 51.00 171.00Below Ground 150.00 62.00 212.00
32 Quartz Mines Above Ground 120.00 51.00 171.00Below Ground 150.00 62.00 212.00
33 Quartzite Mines Above Ground 120.00 51.00 171.00Below Ground 150.00 62.00 212.00
34 Red Oxide Mines Above Ground 120.00 51.00 171.00Below Ground 150.00 62.00 212.00
35 Rock Phosphate Mines Above Ground 120.00 51.00 171.00Below Ground 150.00 62.00 212.00
36 Stone Breaking and Stone Crushing 82.44 54.06 136.50
37 Stone Mines Above Ground 120.00 51.00 171.00Below Ground 150.00 62.00 212.00
38 Steatite (including Mines producing Soap Stoneand Talc)Mines
Above Ground 120.00 51.00 171.00
Below Ground 150.00 62.00 212.00
39 Silica Mines Above Ground 120.00 51.00 171.00Below Ground 150.00 62.00 212.00
40 Slate Mines Above Ground 120.00 51.00 171.00Below Ground 150.00 62.00 212.00
41 Sweeping and Cleaning Area C 120.00 51.00 171.00Area A 180.00 76.00 256.00
42 Watch and Ward Area C 120.00 51.00 171.00Area A 180.00 76.00 256.00
43 Uranium Mines Above Ground 120.00 51.00 171.00Below Ground 150.00 62.00 212.00
44 White Clay Mines Above Ground 120.00 51.00 171.00Below Ground 150.00 62.00 212.00
45 Wolfram Mines Above Ground 120.00 51.00 171.00Below Ground 150.00 62.00 212.00
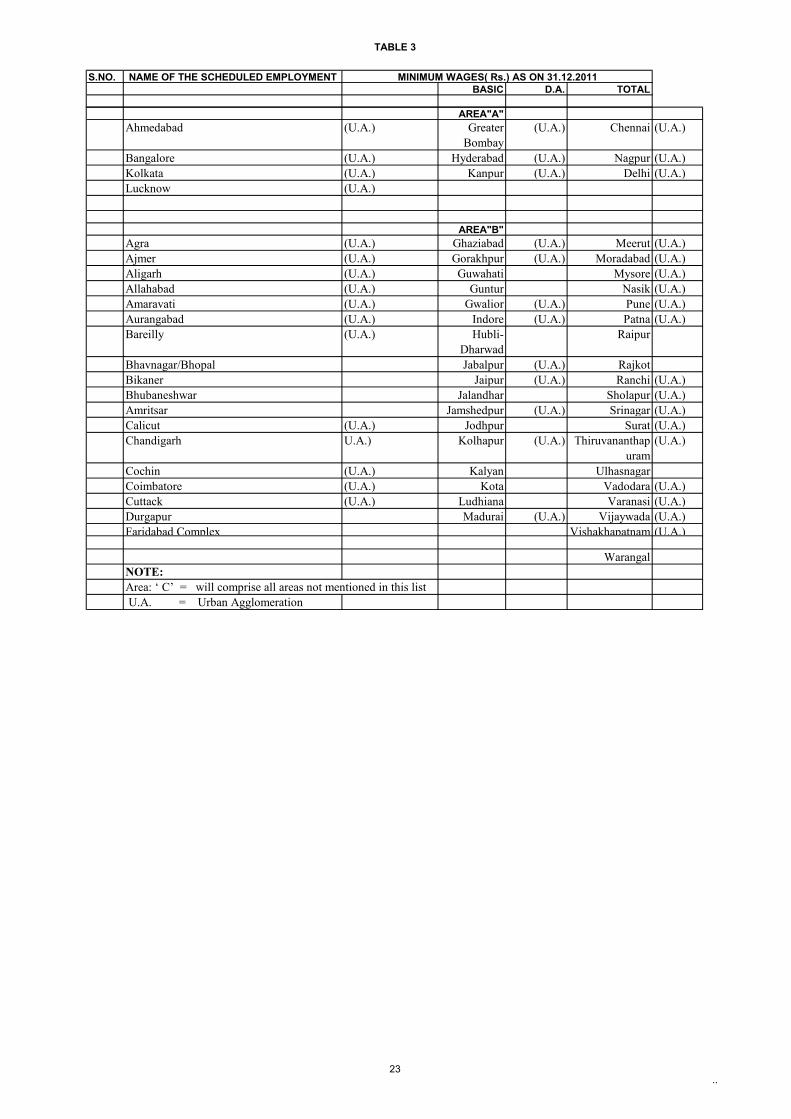
TABLE 3
23..
S.NO. NAME OF THE SCHEDULED EMPLOYMENTBASIC D.A. TOTAL
MINIMUM WAGES( Rs.) AS ON 31.12.2011
AREA"A"Ahmedabad (U.A.) Greater
Bombay(U.A.) Chennai (U.A.)
Bangalore (U.A.) Hyderabad (U.A.) Nagpur (U.A.)Kolkata (U.A.) Kanpur (U.A.) Delhi (U.A.)Lucknow (U.A.)
AREA"B"Agra (U.A.) Ghaziabad (U.A.) Meerut (U.A.)Ajmer (U.A.) Gorakhpur (U.A.) Moradabad (U.A.)Aligarh (U.A.) Guwahati Mysore (U.A.)Allahabad (U.A.) Guntur Nasik (U.A.)Amaravati (U.A.) Gwalior (U.A.) Pune (U.A.)Aurangabad (U.A.) Indore (U.A.) Patna (U.A.)Bareilly (U.A.) Hubli-
DharwadRaipur
Bhavnagar/Bhopal Jabalpur (U.A.) RajkotBikaner Jaipur (U.A.) Ranchi (U.A.)Bhubaneshwar Jalandhar Sholapur (U.A.)Amritsar Jamshedpur (U.A.) Srinagar (U.A.)Calicut (U.A.) Jodhpur Surat (U.A.)Chandigarh U.A.) Kolhapur (U.A.) Thiruvananthap
uram(U.A.)
Cochin (U.A.) Kalyan UlhasnagarCoimbatore (U.A.) Kota Vadodara (U.A.)Cuttack (U.A.) Ludhiana Varanasi (U.A.)Durgapur Madurai (U.A.) Vijaywada (U.A.)Faridabad Complex Vishakhapatnam (U.A.)
WarangalNOTE:Area: ‘ C’ = will comprise all areas not mentioned in this list U.A. = Urban Agglomeration
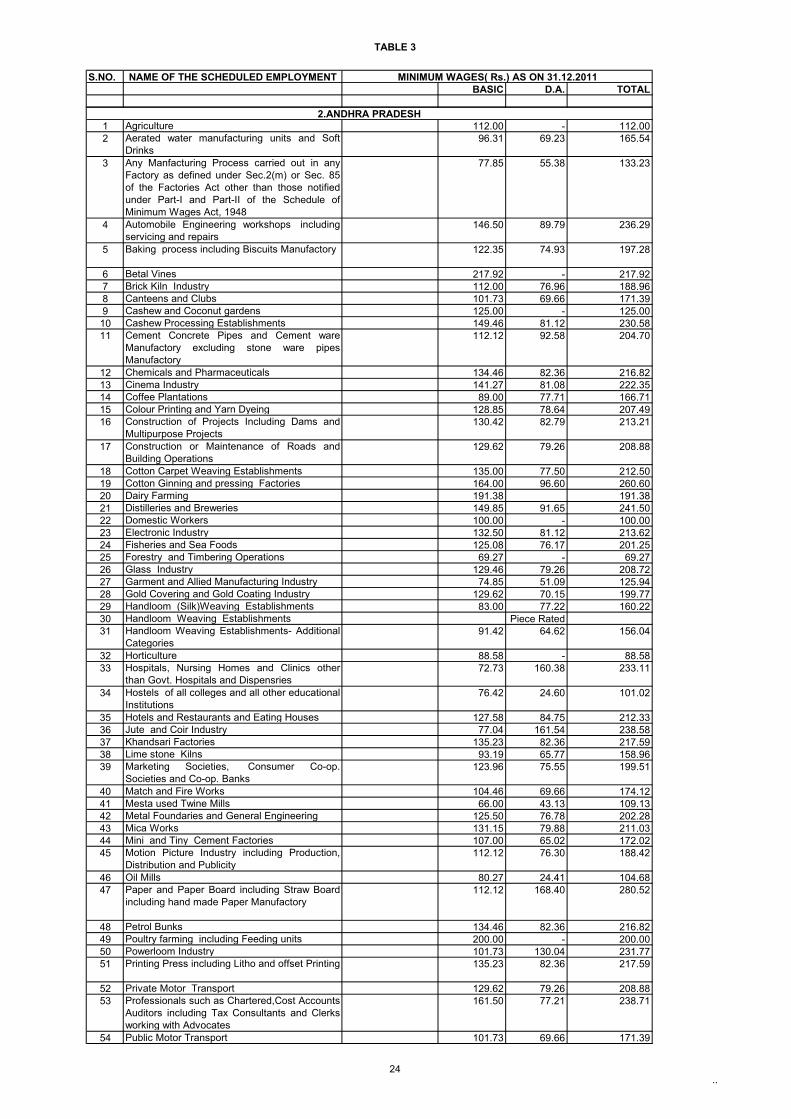
TABLE 3
24..
S.NO. NAME OF THE SCHEDULED EMPLOYMENTBASIC D.A. TOTAL
MINIMUM WAGES( Rs.) AS ON 31.12.2011
1 Agriculture 112.00 - 112.002 Aerated water manufacturing units and Soft
Drinks96.31 69.23 165.54
3 Any Manfacturing Process carried out in anyFactory as defined under Sec.2(m) or Sec. 85of the Factories Act other than those notifiedunder Part-I and Part-II of the Schedule ofMinimum Wages Act, 1948
77.85 55.38 133.23
4 Automobile Engineering workshops includingservicing and repairs
146.50 89.79 236.29
5 Baking process including Biscuits Manufactory 122.35 74.93 197.28
6 Betal Vines 217.92 - 217.927 Brick Kiln Industry 112.00 76.96 188.968 Canteens and Clubs 101.73 69.66 171.399 Cashew and Coconut gardens 125.00 - 125.0010 Cashew Processing Establishments 149.46 81.12 230.5811 Cement Concrete Pipes and Cement ware
Manufactory excluding stone ware pipesManufactory
112.12 92.58 204.70
12 Chemicals and Pharmaceuticals 134.46 82.36 216.8213 Cinema Industry 141.27 81.08 222.3514 Coffee Plantations 89.00 77.71 166.7115 Colour Printing and Yarn Dyeing 128.85 78.64 207.4916 Construction of Projects Including Dams and
Multipurpose Projects130.42 82.79 213.21
17 Construction or Maintenance of Roads andBuilding Operations
129.62 79.26 208.88
18 Cotton Carpet Weaving Establishments 135.00 77.50 212.5019 Cotton Ginning and pressing Factories 164.00 96.60 260.6020 Dairy Farming 191.38 191.3821 Distilleries and Breweries 149.85 91.65 241.5022 Domestic Workers 100.00 - 100.0023 Electronic Industry 132.50 81.12 213.6224 Fisheries and Sea Foods 125.08 76.17 201.2525 Forestry and Timbering Operations 69.27 - 69.2726 Glass Industry 129.46 79.26 208.7227 Garment and Allied Manufacturing Industry 74.85 51.09 125.9428 Gold Covering and Gold Coating Industry 129.62 70.15 199.7729 Handloom (Silk)Weaving Establishments 83.00 77.22 160.2230 Handloom Weaving Establishments Piece Rated31 Handloom Weaving Establishments- Additional
Categories91.42 64.62 156.04
32 Horticulture 88.58 - 88.5833 Hospitals, Nursing Homes and Clinics other
than Govt. Hospitals and Dispensries 72.73 160.38 233.11
34 Hostels of all colleges and all other educationalInstitutions
76.42 24.60 101.02
35 Hotels and Restaurants and Eating Houses 127.58 84.75 212.3336 Jute and Coir Industry 77.04 161.54 238.5837 Khandsari Factories 135.23 82.36 217.5938 Lime stone Kilns 93.19 65.77 158.9639 Marketing Societies, Consumer Co-op.
Societies and Co-op. Banks123.96 75.55 199.51
40 Match and Fire Works 104.46 69.66 174.1241 Mesta used Twine Mills 66.00 43.13 109.1342 Metal Foundaries and General Engineering 125.50 76.78 202.2843 Mica Works 131.15 79.88 211.0344 Mini and Tiny Cement Factories 107.00 65.02 172.0245 Motion Picture Industry including Production,
Distribution and Publicity112.12 76.30 188.42
46 Oil Mills 80.27 24.41 104.6847 Paper and Paper Board including Straw Board
including hand made Paper Manufactory112.12 168.40 280.52
48 Petrol Bunks 134.46 82.36 216.8249 Poultry farming including Feeding units 200.00 - 200.0050 Powerloom Industry 101.73 130.04 231.7751 Printing Press including Litho and offset Printing 135.23 82.36 217.59
52 Private Motor Transport 129.62 79.26 208.8853 Professionals such as Chartered,Cost Accounts
Auditors including Tax Consultants and Clerksworking with Advocates
161.50 77.21 238.71
54 Public Motor Transport 101.73 69.66 171.39
2.ANDHRA PRADESH
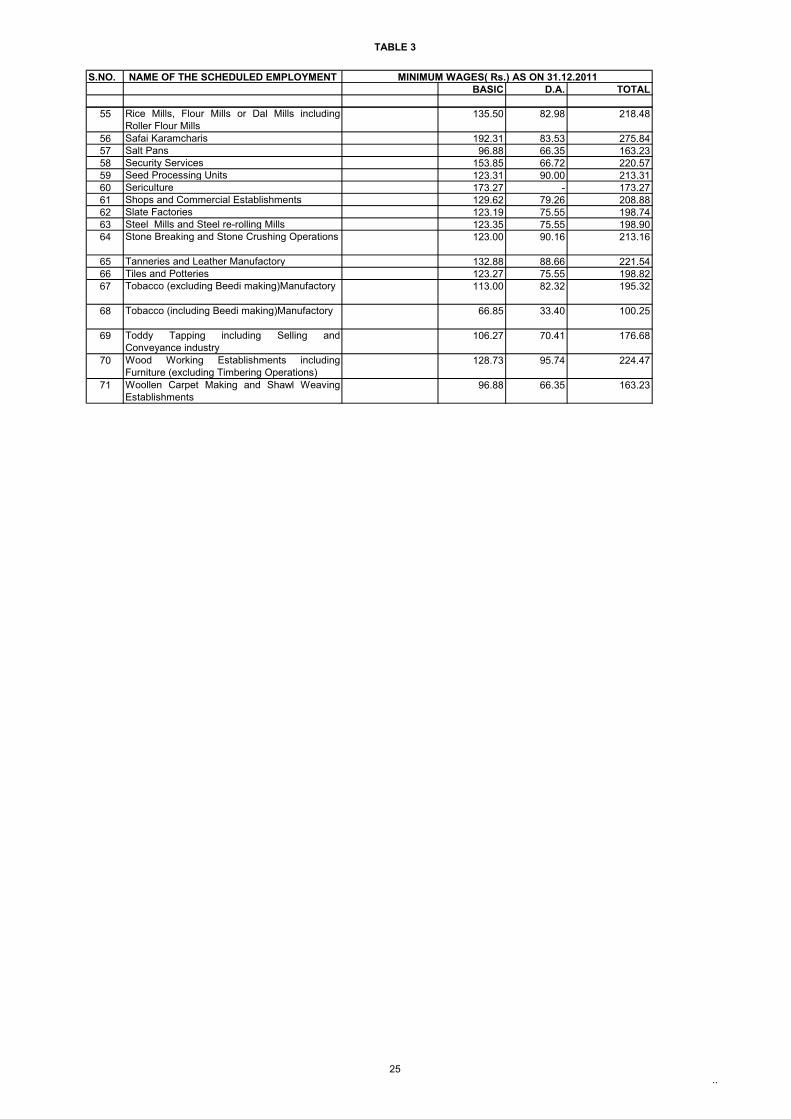
TABLE 3
25..
S.NO. NAME OF THE SCHEDULED EMPLOYMENTBASIC D.A. TOTAL
MINIMUM WAGES( Rs.) AS ON 31.12.2011
55 Rice Mills, Flour Mills or Dal Mills includingRoller Flour Mills
135.50 82.98 218.48
56 Safai Karamcharis 192.31 83.53 275.8457 Salt Pans 96.88 66.35 163.2358 Security Services 153.85 66.72 220.5759 Seed Processing Units 123.31 90.00 213.3160 Sericulture 173.27 - 173.2761 Shops and Commercial Establishments 129.62 79.26 208.8862 Slate Factories 123.19 75.55 198.7463 Steel Mills and Steel re-rolling Mills 123.35 75.55 198.9064 Stone Breaking and Stone Crushing Operations 123.00 90.16 213.16
65 Tanneries and Leather Manufactory 132.88 88.66 221.5466 Tiles and Potteries 123.27 75.55 198.8267 Tobacco (excluding Beedi making)Manufactory 113.00 82.32 195.32
68 Tobacco (including Beedi making)Manufactory 66.85 33.40 100.25
69 Toddy Tapping including Selling andConveyance industry
106.27 70.41 176.68
70 Wood Working Establishments includingFurniture (excluding Timbering Operations)
128.73 95.74 224.47
71 Woollen Carpet Making and Shawl WeavingEstablishments
96.88 66.35 163.23
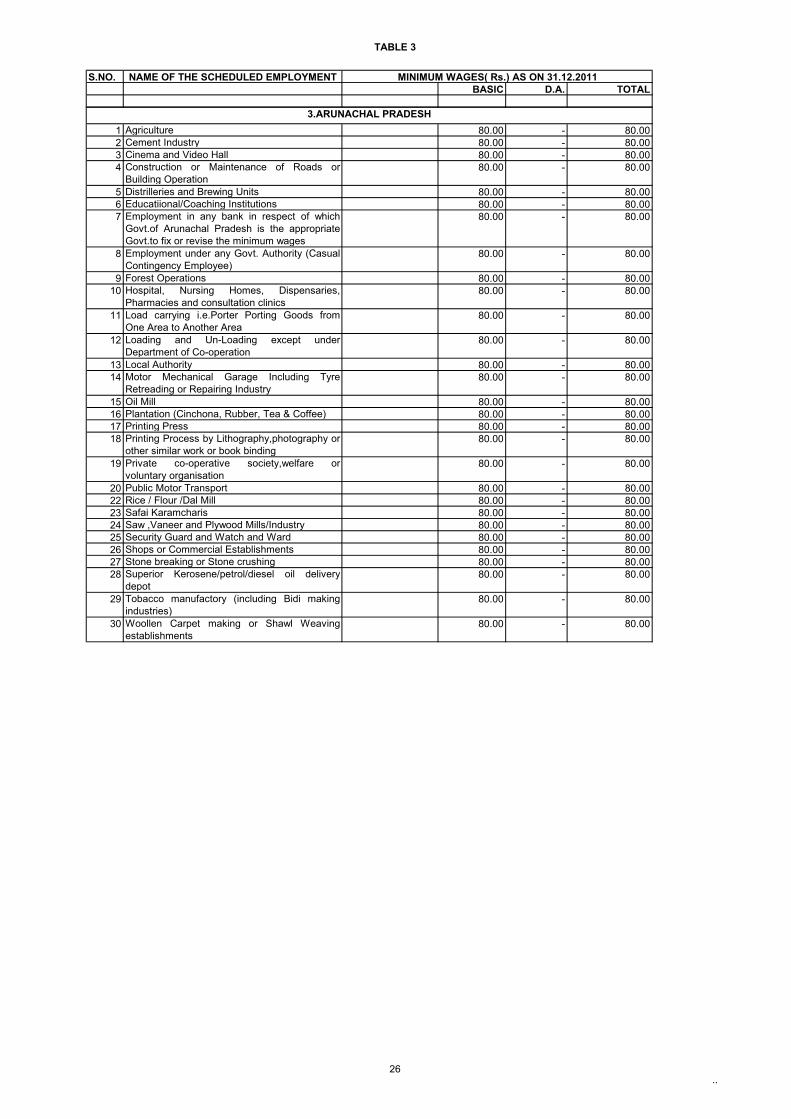
TABLE 3
26..
S.NO. NAME OF THE SCHEDULED EMPLOYMENTBASIC D.A. TOTAL
MINIMUM WAGES( Rs.) AS ON 31.12.2011
1 Agriculture 80.00 - 80.002 Cement Industry 80.00 - 80.003 Cinema and Video Hall 80.00 - 80.004 Construction or Maintenance of Roads or
Building Operation80.00 - 80.00
5 Distrilleries and Brewing Units 80.00 - 80.006 Educatiional/Coaching Institutions 80.00 - 80.007 Employment in any bank in respect of which
Govt.of Arunachal Pradesh is the appropriateGovt.to fix or revise the minimum wages
80.00 - 80.00
8 Employment under any Govt. Authority (CasualContingency Employee)
80.00 - 80.00
9 Forest Operations 80.00 - 80.0010 Hospital, Nursing Homes, Dispensaries,
Pharmacies and consultation clinics80.00 - 80.00
11 Load carrying i.e.Porter Porting Goods fromOne Area to Another Area
80.00 - 80.00
12 Loading and Un-Loading except underDepartment of Co-operation
80.00 - 80.00
13 Local Authority 80.00 - 80.0014 Motor Mechanical Garage Including Tyre
Retreading or Repairing Industry80.00 - 80.00
15 Oil Mill 80.00 - 80.0016 Plantation (Cinchona, Rubber, Tea & Coffee) 80.00 - 80.0017 Printing Press 80.00 - 80.0018 Printing Process by Lithography,photography or
other similar work or book binding 80.00 - 80.00
19 Private co-operative society,welfare orvoluntary organisation
80.00 - 80.00
20 Public Motor Transport 80.00 - 80.0022 Rice / Flour /Dal Mill 80.00 - 80.0023 Safai Karamcharis 80.00 - 80.0024 Saw ,Vaneer and Plywood Mills/Industry 80.00 - 80.0025 Security Guard and Watch and Ward 80.00 - 80.0026 Shops or Commercial Establishments 80.00 - 80.0027 Stone breaking or Stone crushing 80.00 - 80.0028 Superior Kerosene/petrol/diesel oil delivery
depot80.00 - 80.00
29 Tobacco manufactory (including Bidi makingindustries)
80.00 - 80.00
30 Woollen Carpet making or Shawl Weavingestablishments
80.00 - 80.00
3.ARUNACHAL PRADESH
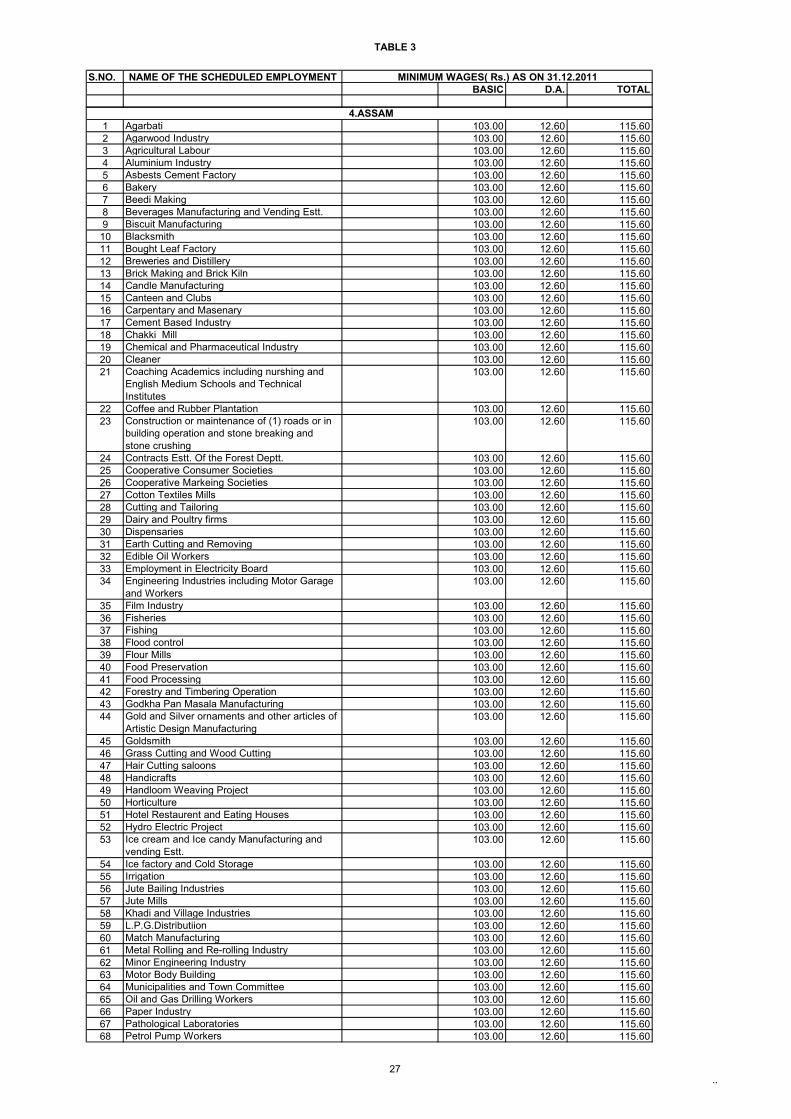
TABLE 3
27..
S.NO. NAME OF THE SCHEDULED EMPLOYMENTBASIC D.A. TOTAL
MINIMUM WAGES( Rs.) AS ON 31.12.2011
1 Agarbati 103.00 12.60 115.602 Agarwood Industry 103.00 12.60 115.603 Agricultural Labour 103.00 12.60 115.604 Aluminium Industry 103.00 12.60 115.605 Asbests Cement Factory 103.00 12.60 115.606 Bakery 103.00 12.60 115.607 Beedi Making 103.00 12.60 115.608 Beverages Manufacturing and Vending Estt. 103.00 12.60 115.609 Biscuit Manufacturing 103.00 12.60 115.6010 Blacksmith 103.00 12.60 115.6011 Bought Leaf Factory 103.00 12.60 115.6012 Breweries and Distillery 103.00 12.60 115.6013 Brick Making and Brick Kiln 103.00 12.60 115.6014 Candle Manufacturing 103.00 12.60 115.6015 Canteen and Clubs 103.00 12.60 115.6016 Carpentary and Masenary 103.00 12.60 115.6017 Cement Based Industry 103.00 12.60 115.6018 Chakki Mill 103.00 12.60 115.6019 Chemical and Pharmaceutical Industry 103.00 12.60 115.6020 Cleaner 103.00 12.60 115.6021 Coaching Academics including nurshing and
English Medium Schools and Technical Institutes
103.00 12.60 115.60
22 Coffee and Rubber Plantation 103.00 12.60 115.6023 Construction or maintenance of (1) roads or in
building operation and stone breaking and stone crushing
103.00 12.60 115.60
24 Contracts Estt. Of the Forest Deptt. 103.00 12.60 115.6025 Cooperative Consumer Societies 103.00 12.60 115.6026 Cooperative Markeing Societies 103.00 12.60 115.6027 Cotton Textiles Mills 103.00 12.60 115.6028 Cutting and Tailoring 103.00 12.60 115.6029 Dairy and Poultry firms 103.00 12.60 115.6030 Dispensaries 103.00 12.60 115.6031 Earth Cutting and Removing 103.00 12.60 115.6032 Edible Oil Workers 103.00 12.60 115.6033 Employment in Electricity Board 103.00 12.60 115.6034 Engineering Industries including Motor Garage
and Workers103.00 12.60 115.60
35 Film Industry 103.00 12.60 115.6036 Fisheries 103.00 12.60 115.6037 Fishing 103.00 12.60 115.6038 Flood control 103.00 12.60 115.6039 Flour Mills 103.00 12.60 115.6040 Food Preservation 103.00 12.60 115.6041 Food Processing 103.00 12.60 115.6042 Forestry and Timbering Operation 103.00 12.60 115.6043 Godkha Pan Masala Manufacturing 103.00 12.60 115.6044 Gold and Silver ornaments and other articles of
Artistic Design Manufacturing103.00 12.60 115.60
45 Goldsmith 103.00 12.60 115.6046 Grass Cutting and Wood Cutting 103.00 12.60 115.6047 Hair Cutting saloons 103.00 12.60 115.6048 Handicrafts 103.00 12.60 115.6049 Handloom Weaving Project 103.00 12.60 115.6050 Horticulture 103.00 12.60 115.6051 Hotel Restaurent and Eating Houses 103.00 12.60 115.6052 Hydro Electric Project 103.00 12.60 115.6053 Ice cream and Ice candy Manufacturing and
vending Estt.103.00 12.60 115.60
54 Ice factory and Cold Storage 103.00 12.60 115.6055 Irrigation 103.00 12.60 115.6056 Jute Bailing Industries 103.00 12.60 115.6057 Jute Mills 103.00 12.60 115.6058 Khadi and Village Industries 103.00 12.60 115.6059 L.P.G.Distributiion 103.00 12.60 115.6060 Match Manufacturing 103.00 12.60 115.6061 Metal Rolling and Re-rolling Industry 103.00 12.60 115.6062 Minor Engineering Industry 103.00 12.60 115.6063 Motor Body Building 103.00 12.60 115.6064 Municipalities and Town Committee 103.00 12.60 115.6065 Oil and Gas Drilling Workers 103.00 12.60 115.6066 Paper Industry 103.00 12.60 115.6067 Pathological Laboratories 103.00 12.60 115.6068 Petrol Pump Workers 103.00 12.60 115.60
4.ASSAM
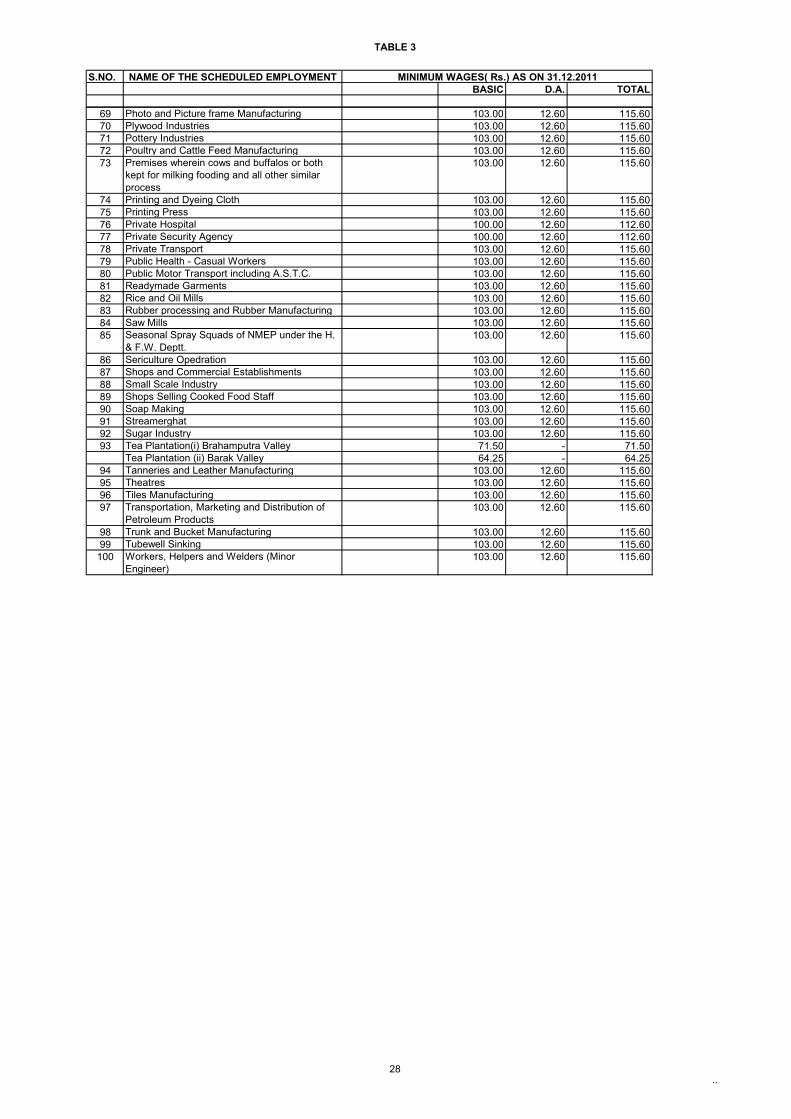
TABLE 3
28..
S.NO. NAME OF THE SCHEDULED EMPLOYMENTBASIC D.A. TOTAL
MINIMUM WAGES( Rs.) AS ON 31.12.2011
69 Photo and Picture frame Manufacturing 103.00 12.60 115.6070 Plywood Industries 103.00 12.60 115.6071 Pottery Industries 103.00 12.60 115.6072 Poultry and Cattle Feed Manufacturing 103.00 12.60 115.6073 Premises wherein cows and buffalos or both
kept for milking fooding and all other similar process
103.00 12.60 115.60
74 Printing and Dyeing Cloth 103.00 12.60 115.6075 Printing Press 103.00 12.60 115.6076 Private Hospital 100.00 12.60 112.6077 Private Security Agency 100.00 12.60 112.6078 Private Transport 103.00 12.60 115.6079 Public Health - Casual Workers 103.00 12.60 115.6080 Public Motor Transport including A.S.T.C. 103.00 12.60 115.6081 Readymade Garments 103.00 12.60 115.6082 Rice and Oil Mills 103.00 12.60 115.6083 Rubber processing and Rubber Manufacturing 103.00 12.60 115.6084 Saw Mills 103.00 12.60 115.6085 Seasonal Spray Squads of NMEP under the H.
& F.W. Deptt.103.00 12.60 115.60
86 Sericulture Opedration 103.00 12.60 115.6087 Shops and Commercial Establishments 103.00 12.60 115.6088 Small Scale Industry 103.00 12.60 115.6089 Shops Selling Cooked Food Staff 103.00 12.60 115.6090 Soap Making 103.00 12.60 115.6091 Streamerghat 103.00 12.60 115.6092 Sugar Industry 103.00 12.60 115.6093 Tea Plantation(i) Brahamputra Valley 71.50 - 71.50
Tea Plantation (ii) Barak Valley 64.25 - 64.2594 Tanneries and Leather Manufacturing 103.00 12.60 115.6095 Theatres 103.00 12.60 115.6096 Tiles Manufacturing 103.00 12.60 115.6097 Transportation, Marketing and Distribution of
Petroleum Products103.00 12.60 115.60
98 Trunk and Bucket Manufacturing 103.00 12.60 115.6099 Tubewell Sinking 103.00 12.60 115.60
100 Workers, Helpers and Welders (Minor Engineer)
103.00 12.60 115.60
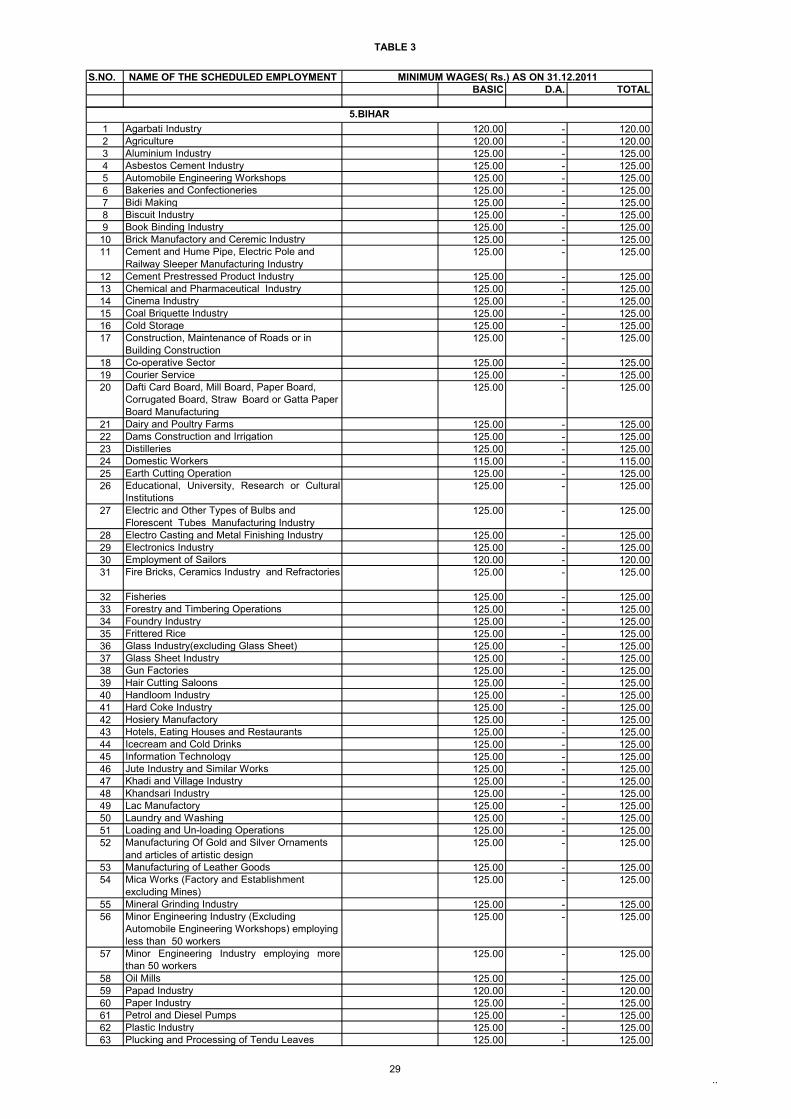
TABLE 3
29..
S.NO. NAME OF THE SCHEDULED EMPLOYMENTBASIC D.A. TOTAL
MINIMUM WAGES( Rs.) AS ON 31.12.2011
1 Agarbati Industry 120.00 - 120.002 Agriculture 120.00 - 120.003 Aluminium Industry 125.00 - 125.004 Asbestos Cement Industry 125.00 - 125.005 Automobile Engineering Workshops 125.00 - 125.006 Bakeries and Confectioneries 125.00 - 125.007 Bidi Making 125.00 - 125.008 Biscuit Industry 125.00 - 125.009 Book Binding Industry 125.00 - 125.0010 Brick Manufactory and Ceremic Industry 125.00 - 125.0011 Cement and Hume Pipe, Electric Pole and
Railway Sleeper Manufacturing Industry125.00 - 125.00
12 Cement Prestressed Product Industry 125.00 - 125.0013 Chemical and Pharmaceutical Industry 125.00 - 125.0014 Cinema Industry 125.00 - 125.0015 Coal Briquette Industry 125.00 - 125.0016 Cold Storage 125.00 - 125.0017 Construction, Maintenance of Roads or in
Building Construction125.00 - 125.00
18 Co-operative Sector 125.00 - 125.0019 Courier Service 125.00 - 125.0020 Dafti Card Board, Mill Board, Paper Board,
Corrugated Board, Straw Board or Gatta Paper Board Manufacturing
125.00 - 125.00
21 Dairy and Poultry Farms 125.00 - 125.0022 Dams Construction and Irrigation 125.00 - 125.0023 Distilleries 125.00 - 125.0024 Domestic Workers 115.00 - 115.0025 Earth Cutting Operation 125.00 - 125.0026 Educational, University, Research or Cultural
Institutions125.00 - 125.00
27 Electric and Other Types of Bulbs and Florescent Tubes Manufacturing Industry
125.00 - 125.00
28 Electro Casting and Metal Finishing Industry 125.00 - 125.0029 Electronics Industry 125.00 - 125.0030 Employment of Sailors 120.00 - 120.0031 Fire Bricks, Ceramics Industry and Refractories 125.00 - 125.00
32 Fisheries 125.00 - 125.0033 Forestry and Timbering Operations 125.00 - 125.0034 Foundry Industry 125.00 - 125.0035 Frittered Rice 125.00 - 125.0036 Glass Industry(excluding Glass Sheet) 125.00 - 125.0037 Glass Sheet Industry 125.00 - 125.0038 Gun Factories 125.00 - 125.0039 Hair Cutting Saloons 125.00 - 125.0040 Handloom Industry 125.00 - 125.0041 Hard Coke Industry 125.00 - 125.0042 Hosiery Manufactory 125.00 - 125.0043 Hotels, Eating Houses and Restaurants 125.00 - 125.0044 Icecream and Cold Drinks 125.00 - 125.0045 Information Technology 125.00 - 125.0046 Jute Industry and Similar Works 125.00 - 125.0047 Khadi and Village Industry 125.00 - 125.0048 Khandsari Industry 125.00 - 125.0049 Lac Manufactory 125.00 - 125.0050 Laundry and Washing 125.00 - 125.0051 Loading and Un-loading Operations 125.00 - 125.0052 Manufacturing Of Gold and Silver Ornaments
and articles of artistic design125.00 - 125.00
53 Manufacturing of Leather Goods 125.00 - 125.0054 Mica Works (Factory and Establishment
excluding Mines)125.00 - 125.00
55 Mineral Grinding Industry 125.00 - 125.0056 Minor Engineering Industry (Excluding
Automobile Engineering Workshops) employing less than 50 workers
125.00 - 125.00
57 Minor Engineering Industry employing morethan 50 workers
125.00 - 125.00
58 Oil Mills 125.00 - 125.0059 Papad Industry 120.00 - 120.0060 Paper Industry 125.00 - 125.0061 Petrol and Diesel Pumps 125.00 - 125.0062 Plastic Industry 125.00 - 125.0063 Plucking and Processing of Tendu Leaves 125.00 - 125.00
5.BIHAR
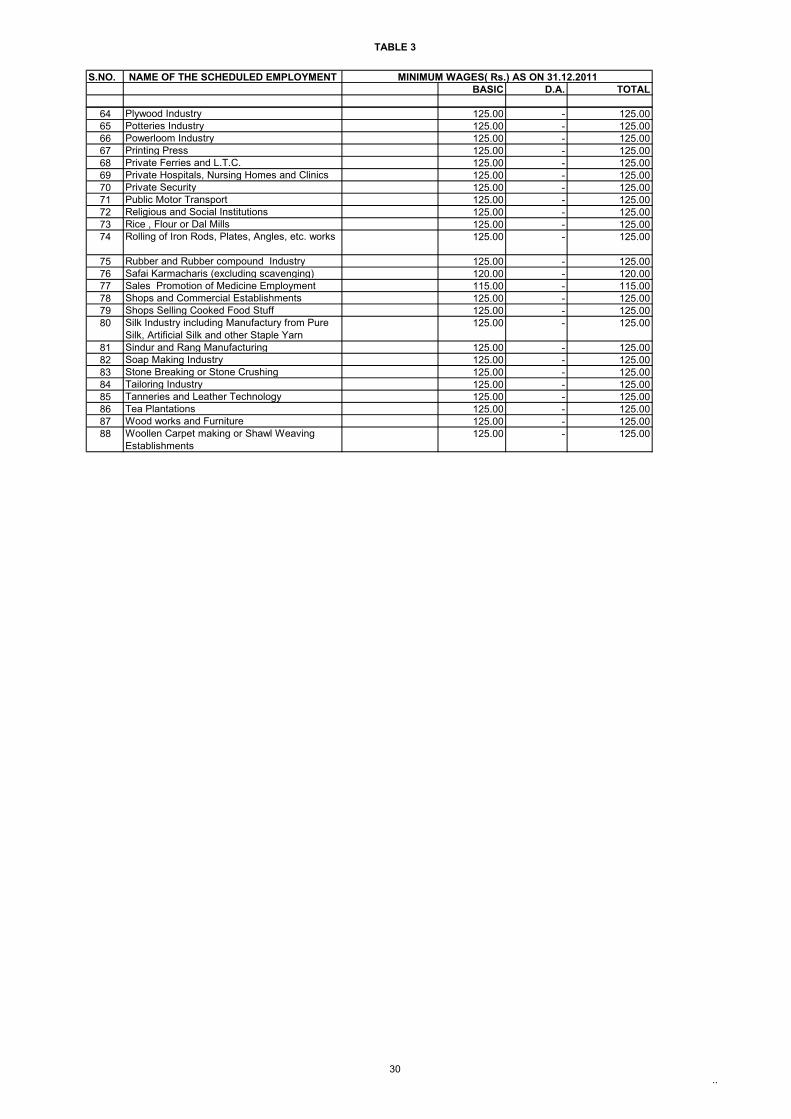
TABLE 3
30..
S.NO. NAME OF THE SCHEDULED EMPLOYMENTBASIC D.A. TOTAL
MINIMUM WAGES( Rs.) AS ON 31.12.2011
64 Plywood Industry 125.00 - 125.0065 Potteries Industry 125.00 - 125.0066 Powerloom Industry 125.00 - 125.0067 Printing Press 125.00 - 125.0068 Private Ferries and L.T.C. 125.00 - 125.0069 Private Hospitals, Nursing Homes and Clinics 125.00 - 125.0070 Private Security 125.00 - 125.0071 Public Motor Transport 125.00 - 125.0072 Religious and Social Institutions 125.00 - 125.0073 Rice , Flour or Dal Mills 125.00 - 125.0074 Rolling of Iron Rods, Plates, Angles, etc. works 125.00 - 125.00
75 Rubber and Rubber compound Industry 125.00 - 125.0076 Safai Karmacharis (excluding scavenging) 120.00 - 120.0077 Sales Promotion of Medicine Employment 115.00 - 115.0078 Shops and Commercial Establishments 125.00 - 125.0079 Shops Selling Cooked Food Stuff 125.00 - 125.0080 Silk Industry including Manufactury from Pure
Silk, Artificial Silk and other Staple Yarn125.00 - 125.00
81 Sindur and Rang Manufacturing 125.00 - 125.0082 Soap Making Industry 125.00 - 125.0083 Stone Breaking or Stone Crushing 125.00 - 125.0084 Tailoring Industry 125.00 - 125.0085 Tanneries and Leather Technology 125.00 - 125.0086 Tea Plantations 125.00 - 125.0087 Wood works and Furniture 125.00 - 125.0088 Woollen Carpet making or Shawl Weaving
Establishments125.00 - 125.00
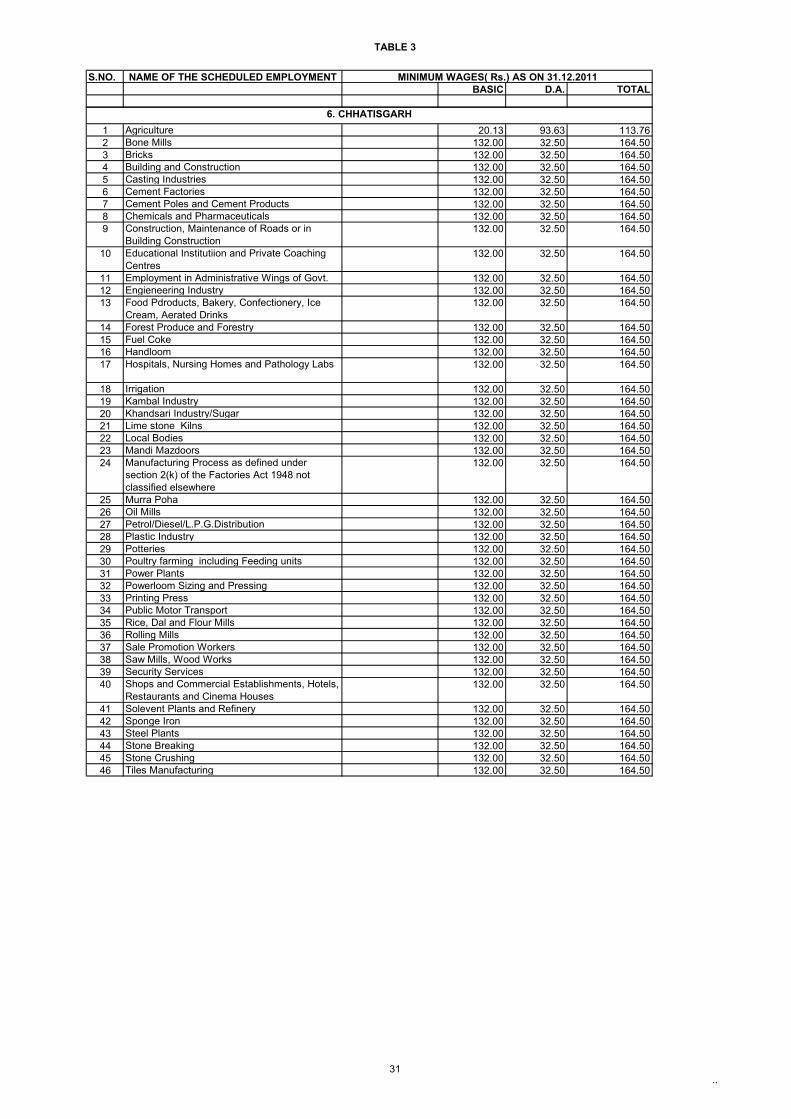
TABLE 3
31..
S.NO. NAME OF THE SCHEDULED EMPLOYMENTBASIC D.A. TOTAL
MINIMUM WAGES( Rs.) AS ON 31.12.2011
1 Agriculture 20.13 93.63 113.762 Bone Mills 132.00 32.50 164.503 Bricks 132.00 32.50 164.504 Building and Construction 132.00 32.50 164.505 Casting Industries 132.00 32.50 164.506 Cement Factories 132.00 32.50 164.507 Cement Poles and Cement Products 132.00 32.50 164.508 Chemicals and Pharmaceuticals 132.00 32.50 164.509 Construction, Maintenance of Roads or in
Building Construction132.00 32.50 164.50
10 Educational Institutiion and Private Coaching Centres
132.00 32.50 164.50
11 Employment in Administrative Wings of Govt. 132.00 32.50 164.5012 Engieneering Industry 132.00 32.50 164.5013 Food Pdroducts, Bakery, Confectionery, Ice
Cream, Aerated Drinks132.00 32.50 164.50
14 Forest Produce and Forestry 132.00 32.50 164.5015 Fuel Coke 132.00 32.50 164.5016 Handloom 132.00 32.50 164.5017 Hospitals, Nursing Homes and Pathology Labs 132.00 32.50 164.50
18 Irrigation 132.00 32.50 164.5019 Kambal Industry 132.00 32.50 164.5020 Khandsari Industry/Sugar 132.00 32.50 164.5021 Lime stone Kilns 132.00 32.50 164.5022 Local Bodies 132.00 32.50 164.5023 Mandi Mazdoors 132.00 32.50 164.5024 Manufacturing Process as defined under
section 2(k) of the Factories Act 1948 not classified elsewhere
132.00 32.50 164.50
25 Murra Poha 132.00 32.50 164.5026 Oil Mills 132.00 32.50 164.5027 Petrol/Diesel/L.P.G.Distribution 132.00 32.50 164.5028 Plastic Industry 132.00 32.50 164.5029 Potteries 132.00 32.50 164.5030 Poultry farming including Feeding units 132.00 32.50 164.5031 Power Plants 132.00 32.50 164.5032 Powerloom Sizing and Pressing 132.00 32.50 164.5033 Printing Press 132.00 32.50 164.5034 Public Motor Transport 132.00 32.50 164.5035 Rice, Dal and Flour Mills 132.00 32.50 164.5036 Rolling Mills 132.00 32.50 164.5037 Sale Promotion Workers 132.00 32.50 164.5038 Saw Mills, Wood Works 132.00 32.50 164.5039 Security Services 132.00 32.50 164.5040 Shops and Commercial Establishments, Hotels,
Restaurants and Cinema Houses132.00 32.50 164.50
41 Solevent Plants and Refinery 132.00 32.50 164.5042 Sponge Iron 132.00 32.50 164.5043 Steel Plants 132.00 32.50 164.5044 Stone Breaking 132.00 32.50 164.5045 Stone Crushing 132.00 32.50 164.5046 Tiles Manufacturing 132.00 32.50 164.50
6. CHHATISGARH
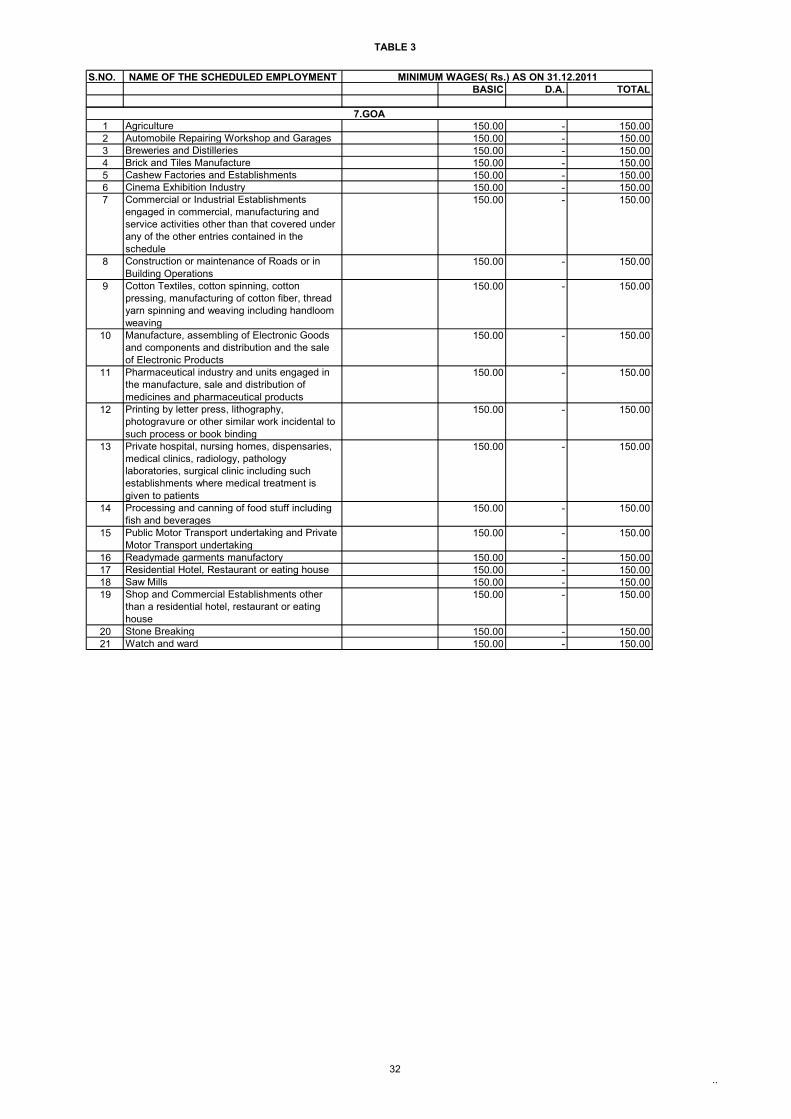
TABLE 3
32..
S.NO. NAME OF THE SCHEDULED EMPLOYMENTBASIC D.A. TOTAL
MINIMUM WAGES( Rs.) AS ON 31.12.2011
1 Agriculture 150.00 - 150.002 Automobile Repairing Workshop and Garages 150.00 - 150.003 Breweries and Distilleries 150.00 - 150.004 Brick and Tiles Manufacture 150.00 - 150.005 Cashew Factories and Establishments 150.00 - 150.006 Cinema Exhibition Industry 150.00 - 150.007 Commercial or Industrial Establishments
engaged in commercial, manufacturing and service activities other than that covered under any of the other entries contained in the schedule
150.00 - 150.00
8 Construction or maintenance of Roads or in Building Operations
150.00 - 150.00
9 Cotton Textiles, cotton spinning, cotton pressing, manufacturing of cotton fiber, thread yarn spinning and weaving including handloom weaving
150.00 - 150.00
10 Manufacture, assembling of Electronic Goods and components and distribution and the sale of Electronic Products
150.00 - 150.00
11 Pharmaceutical industry and units engaged in the manufacture, sale and distribution of medicines and pharmaceutical products
150.00 - 150.00
12 Printing by letter press, lithography, photogravure or other similar work incidental to such process or book binding
150.00 - 150.00
13 Private hospital, nursing homes, dispensaries, medical clinics, radiology, pathology laboratories, surgical clinic including such establishments where medical treatment is given to patients
150.00 - 150.00
14 Processing and canning of food stuff including fish and beverages
150.00 - 150.00
15 Public Motor Transport undertaking and Private Motor Transport undertaking
150.00 - 150.00
16 Readymade garments manufactory 150.00 - 150.0017 Residential Hotel, Restaurant or eating house 150.00 - 150.0018 Saw Mills 150.00 - 150.0019 Shop and Commercial Establishments other
than a residential hotel, restaurant or eating house
150.00 - 150.00
20 Stone Breaking 150.00 - 150.0021 Watch and ward 150.00 - 150.00
7.GOA
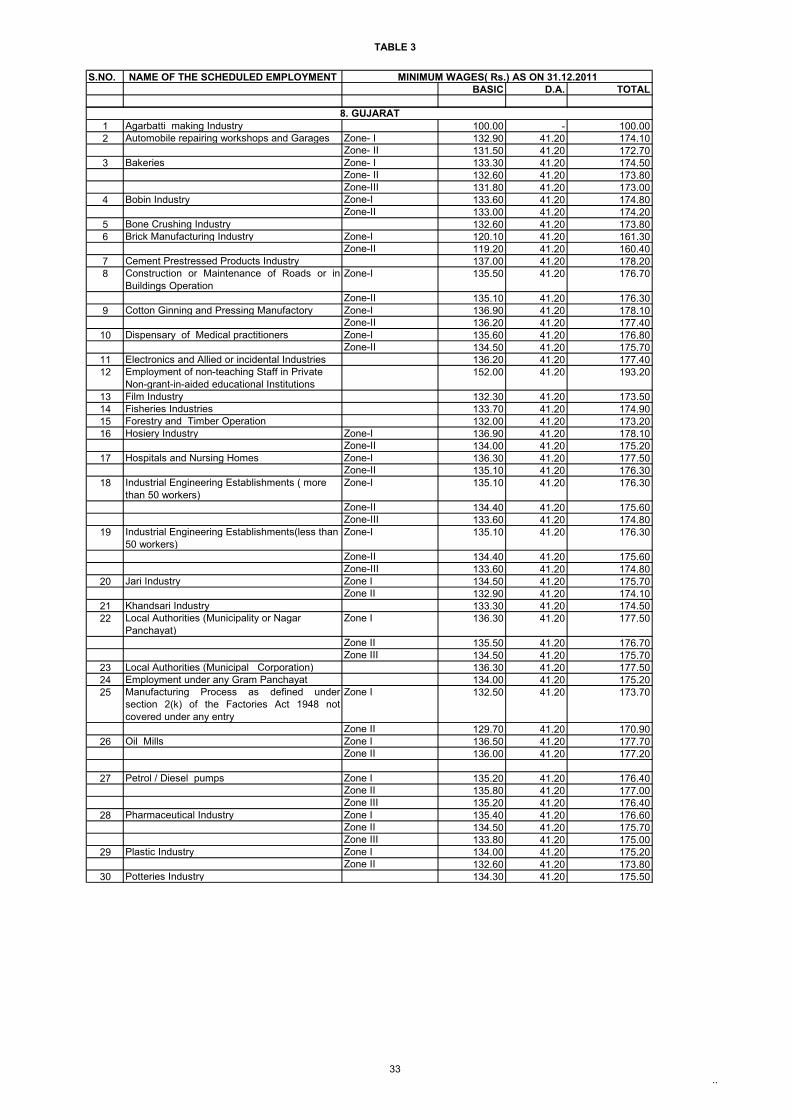
TABLE 3
33..
S.NO. NAME OF THE SCHEDULED EMPLOYMENTBASIC D.A. TOTAL
MINIMUM WAGES( Rs.) AS ON 31.12.2011
1 Agarbatti making Industry 100.00 - 100.002 Automobile repairing workshops and Garages Zone- I 132.90 41.20 174.10
Zone- II 131.50 41.20 172.703 Bakeries Zone- I 133.30 41.20 174.50
Zone- II 132.60 41.20 173.80Zone-III 131.80 41.20 173.00
4 Bobin Industry Zone-I 133.60 41.20 174.80Zone-II 133.00 41.20 174.20
5 Bone Crushing Industry 132.60 41.20 173.806 Brick Manufacturing Industry Zone-I 120.10 41.20 161.30
Zone-II 119.20 41.20 160.407 Cement Prestressed Products Industry 137.00 41.20 178.208 Construction or Maintenance of Roads or in
Buildings OperationZone-I 135.50 41.20 176.70
Zone-II 135.10 41.20 176.309 Cotton Ginning and Pressing Manufactory Zone-I 136.90 41.20 178.10
Zone-II 136.20 41.20 177.4010 Dispensary of Medical practitioners Zone-I 135.60 41.20 176.80
Zone-II 134.50 41.20 175.7011 Electronics and Allied or incidental Industries 136.20 41.20 177.4012 Employment of non-teaching Staff in Private
Non-grant-in-aided educational Institutions152.00 41.20 193.20
13 Film Industry 132.30 41.20 173.5014 Fisheries Industries 133.70 41.20 174.9015 Forestry and Timber Operation 132.00 41.20 173.2016 Hosiery Industry Zone-I 136.90 41.20 178.10
Zone-II 134.00 41.20 175.2017 Hospitals and Nursing Homes Zone-I 136.30 41.20 177.50
Zone-II 135.10 41.20 176.3018 Industrial Engineering Establishments ( more
than 50 workers)Zone-I 135.10 41.20 176.30
Zone-II 134.40 41.20 175.60Zone-III 133.60 41.20 174.80
19 Industrial Engineering Establishments(less than 50 workers)
Zone-I 135.10 41.20 176.30
Zone-II 134.40 41.20 175.60Zone-III 133.60 41.20 174.80
20 Jari Industry Zone I 134.50 41.20 175.70Zone II 132.90 41.20 174.10
21 Khandsari Industry 133.30 41.20 174.5022 Local Authorities (Municipality or Nagar
Panchayat)Zone I 136.30 41.20 177.50
Zone II 135.50 41.20 176.70Zone III 134.50 41.20 175.70
23 Local Authorities (Municipal Corporation) 136.30 41.20 177.5024 Employment under any Gram Panchayat 134.00 41.20 175.2025 Manufacturing Process as defined under
section 2(k) of the Factories Act 1948 notcovered under any entry
Zone I 132.50 41.20 173.70
Zone II 129.70 41.20 170.9026 Oil Mills Zone I 136.50 41.20 177.70
Zone II 136.00 41.20 177.20
27 Petrol / Diesel pumps Zone I 135.20 41.20 176.40Zone II 135.80 41.20 177.00Zone III 135.20 41.20 176.40
28 Pharmaceutical Industry Zone I 135.40 41.20 176.60Zone II 134.50 41.20 175.70Zone III 133.80 41.20 175.00
29 Plastic Industry Zone I 134.00 41.20 175.20Zone II 132.60 41.20 173.80
30 Potteries Industry 134.30 41.20 175.50
8. GUJARAT
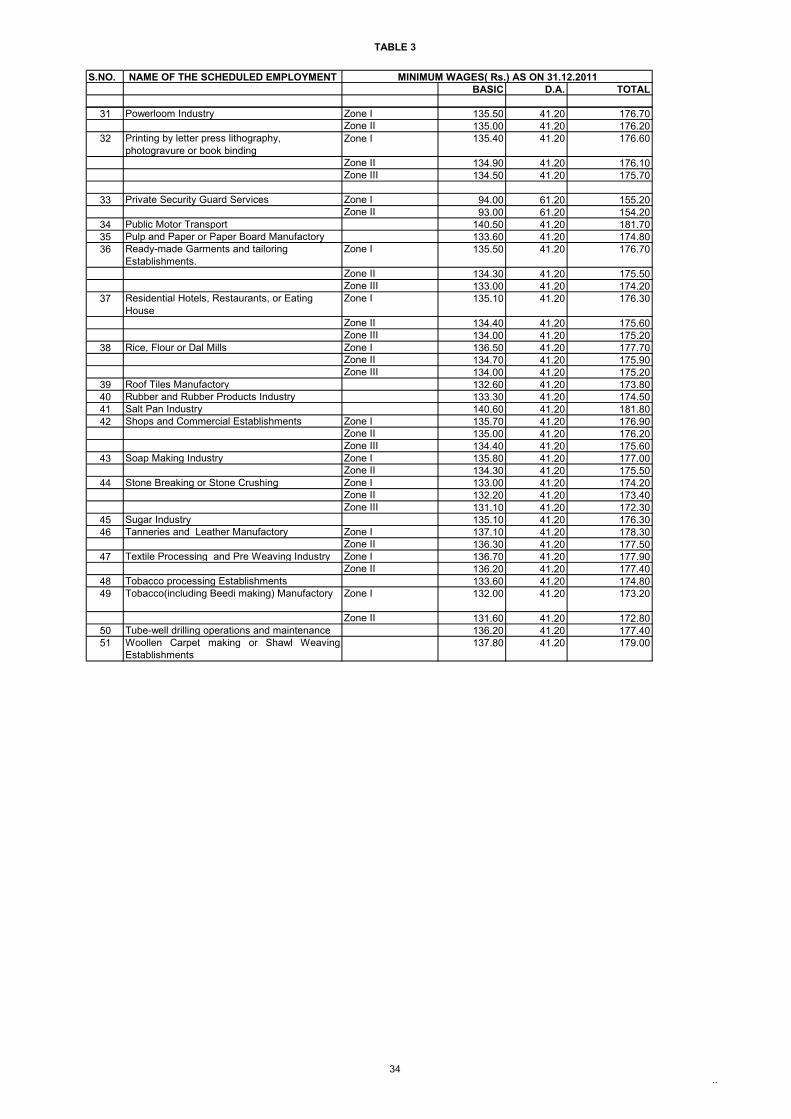
TABLE 3
34..
S.NO. NAME OF THE SCHEDULED EMPLOYMENTBASIC D.A. TOTAL
MINIMUM WAGES( Rs.) AS ON 31.12.2011
31 Powerloom Industry Zone I 135.50 41.20 176.70Zone II 135.00 41.20 176.20
32 Printing by letter press lithography, photogravure or book binding
Zone I 135.40 41.20 176.60
Zone II 134.90 41.20 176.10Zone III 134.50 41.20 175.70
33 Private Security Guard Services Zone I 94.00 61.20 155.20Zone II 93.00 61.20 154.20
34 Public Motor Transport 140.50 41.20 181.7035 Pulp and Paper or Paper Board Manufactory 133.60 41.20 174.8036 Ready-made Garments and tailoring
Establishments.Zone I 135.50 41.20 176.70
Zone II 134.30 41.20 175.50Zone III 133.00 41.20 174.20
37 Residential Hotels, Restaurants, or Eating House
Zone I 135.10 41.20 176.30
Zone II 134.40 41.20 175.60Zone III 134.00 41.20 175.20
38 Rice, Flour or Dal Mills Zone I 136.50 41.20 177.70Zone II 134.70 41.20 175.90Zone III 134.00 41.20 175.20
39 Roof Tiles Manufactory 132.60 41.20 173.8040 Rubber and Rubber Products Industry 133.30 41.20 174.5041 Salt Pan Industry 140.60 41.20 181.8042 Shops and Commercial Establishments Zone I 135.70 41.20 176.90
Zone II 135.00 41.20 176.20Zone III 134.40 41.20 175.60
43 Soap Making Industry Zone I 135.80 41.20 177.00Zone II 134.30 41.20 175.50
44 Stone Breaking or Stone Crushing Zone I 133.00 41.20 174.20Zone II 132.20 41.20 173.40Zone III 131.10 41.20 172.30
45 Sugar Industry 135.10 41.20 176.3046 Tanneries and Leather Manufactory Zone I 137.10 41.20 178.30
Zone II 136.30 41.20 177.5047 Textile Processing and Pre Weaving Industry Zone I 136.70 41.20 177.90
Zone II 136.20 41.20 177.4048 Tobacco processing Establishments 133.60 41.20 174.8049 Tobacco(including Beedi making) Manufactory Zone I 132.00 41.20 173.20
Zone II 131.60 41.20 172.8050 Tube-well drilling operations and maintenance 136.20 41.20 177.4051 Woollen Carpet making or Shawl Weaving
Establishments137.80 41.20 179.00
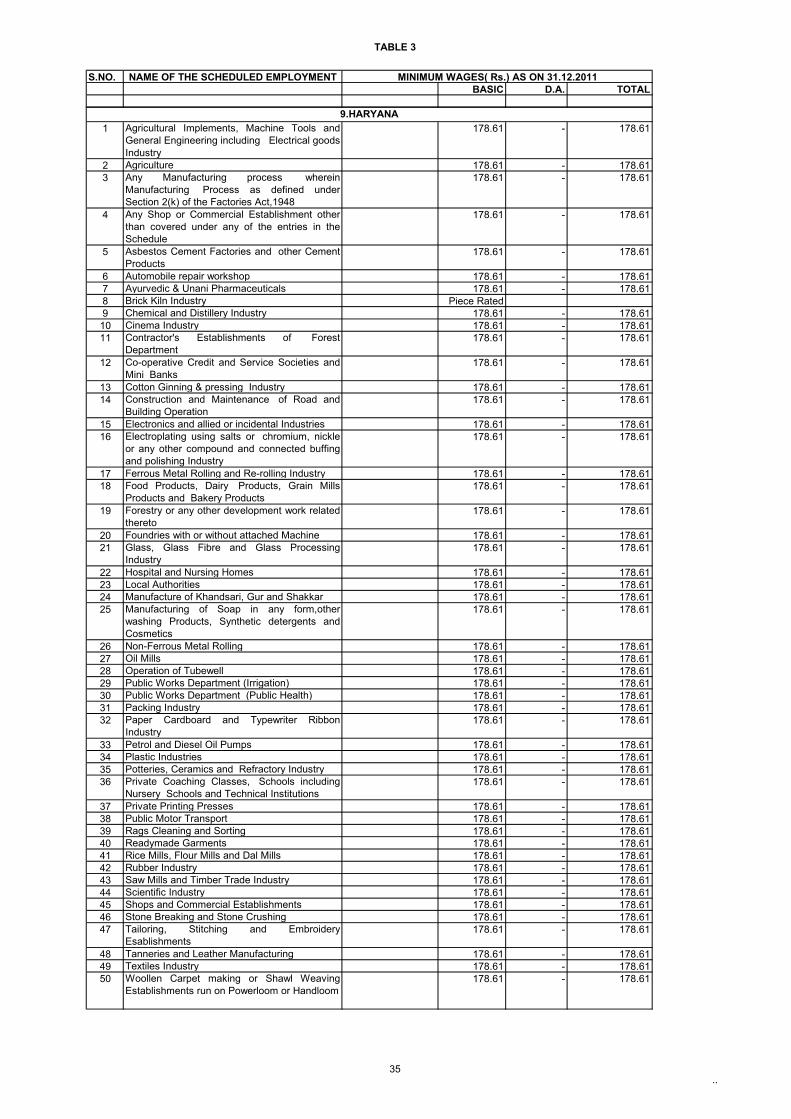
TABLE 3
35..
S.NO. NAME OF THE SCHEDULED EMPLOYMENTBASIC D.A. TOTAL
MINIMUM WAGES( Rs.) AS ON 31.12.2011
1 Agricultural Implements, Machine Tools andGeneral Engineering including Electrical goods Industry
178.61 - 178.61
2 Agriculture 178.61 - 178.613 Any Manufacturing process wherein
Manufacturing Process as defined underSection 2(k) of the Factories Act,1948
178.61 - 178.61
4 Any Shop or Commercial Establishment otherthan covered under any of the entries in theSchedule
178.61 - 178.61
5 Asbestos Cement Factories and other CementProducts
178.61 - 178.61
6 Automobile repair workshop 178.61 - 178.617 Ayurvedic & Unani Pharmaceuticals 178.61 - 178.618 Brick Kiln Industry Piece Rated9 Chemical and Distillery Industry 178.61 - 178.6110 Cinema Industry 178.61 - 178.6111 Contractor's Establishments of Forest
Department178.61 - 178.61
12 Co-operative Credit and Service Societies andMini Banks
178.61 - 178.61
13 Cotton Ginning & pressing Industry 178.61 - 178.6114 Construction and Maintenance of Road and
Building Operation178.61 - 178.61
15 Electronics and allied or incidental Industries 178.61 - 178.6116 Electroplating using salts or chromium, nickle
or any other compound and connected buffingand polishing Industry
178.61 - 178.61
17 Ferrous Metal Rolling and Re-rolling Industry 178.61 - 178.6118 Food Products, Dairy Products, Grain Mills
Products and Bakery Products178.61 - 178.61
19 Forestry or any other development work relatedthereto
178.61 - 178.61
20 Foundries with or without attached Machine 178.61 - 178.6121 Glass, Glass Fibre and Glass Processing
Industry 178.61 - 178.61
22 Hospital and Nursing Homes 178.61 - 178.6123 Local Authorities 178.61 - 178.6124 Manufacture of Khandsari, Gur and Shakkar 178.61 - 178.6125 Manufacturing of Soap in any form,other
washing Products, Synthetic detergents andCosmetics
178.61 - 178.61
26 Non-Ferrous Metal Rolling 178.61 - 178.6127 Oil Mills 178.61 - 178.6128 Operation of Tubewell 178.61 - 178.6129 Public Works Department (Irrigation) 178.61 - 178.6130 Public Works Department (Public Health) 178.61 - 178.6131 Packing Industry 178.61 - 178.6132 Paper Cardboard and Typewriter Ribbon
Industry178.61 - 178.61
33 Petrol and Diesel Oil Pumps 178.61 - 178.6134 Plastic Industries 178.61 - 178.6135 Potteries, Ceramics and Refractory Industry 178.61 - 178.6136 Private Coaching Classes, Schools including
Nursery Schools and Technical Institutions178.61 - 178.61
37 Private Printing Presses 178.61 - 178.6138 Public Motor Transport 178.61 - 178.6139 Rags Cleaning and Sorting 178.61 - 178.6140 Readymade Garments 178.61 - 178.6141 Rice Mills, Flour Mills and Dal Mills 178.61 - 178.6142 Rubber Industry 178.61 - 178.6143 Saw Mills and Timber Trade Industry 178.61 - 178.6144 Scientific Industry 178.61 - 178.6145 Shops and Commercial Establishments 178.61 - 178.6146 Stone Breaking and Stone Crushing 178.61 - 178.6147 Tailoring, Stitching and Embroidery
Esablishments178.61 - 178.61
48 Tanneries and Leather Manufacturing 178.61 - 178.6149 Textiles Industry 178.61 - 178.6150 Woollen Carpet making or Shawl Weaving
Establishments run on Powerloom or Handloom 178.61 - 178.61
9.HARYANA
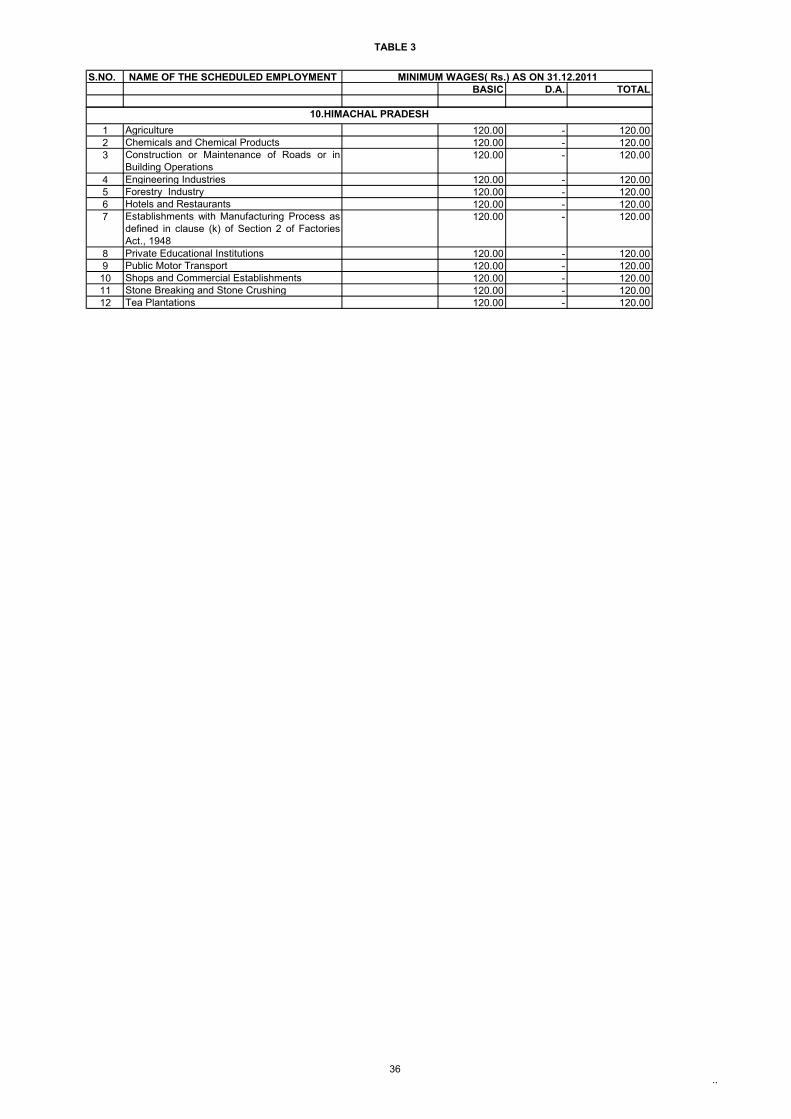
TABLE 3
36..
S.NO. NAME OF THE SCHEDULED EMPLOYMENTBASIC D.A. TOTAL
MINIMUM WAGES( Rs.) AS ON 31.12.2011
1 Agriculture 120.00 - 120.002 Chemicals and Chemical Products 120.00 - 120.003 Construction or Maintenance of Roads or in
Building Operations120.00 - 120.00
4 Engineering Industries 120.00 - 120.005 Forestry Industry 120.00 - 120.006 Hotels and Restaurants 120.00 - 120.007 Establishments with Manufacturing Process as
defined in clause (k) of Section 2 of FactoriesAct., 1948
120.00 - 120.00
8 Private Educational Institutions 120.00 - 120.009 Public Motor Transport 120.00 - 120.0010 Shops and Commercial Establishments 120.00 - 120.0011 Stone Breaking and Stone Crushing 120.00 - 120.0012 Tea Plantations 120.00 - 120.00
10.HIMACHAL PRADESH
TABLE 3
37..
S.NO. NAME OF THE SCHEDULED EMPLOYMENTBASIC D.A. TOTAL
MINIMUM WAGES( Rs.) AS ON 31.12.2011
1 Auto Body Fabrication 110.00 - 110.002 Embroidery including Chain Stitching 110.00 - 110.003 Hair Cutting Saloons 110.00 - 110.004 Ice Factory and Cold Storage 110.00 - 110.005 Light Engineering Works. 110.00 - 110.006 Local Authority, Municipalities and Town Area
Committees.110.00 - 110.00
7 Manufacturing & Tailoring of Garments 110.00 - 110.008 Manufacturing of Arms & Ammunition 110.00 - 110.009 Manufacturing of Drinks & Brewaries 110.00 - 110.00
10 Manufacturing of Food Products 110.00 - 110.0011 Manufacturing of Medicines & Hospitals
Equipments110.00 - 110.00
12 Manufacturing of Metal Steel Utensils 110.00 - 110.0013 Manufacturing of Soap & Detergents 110.00 - 110.0014 Manufacturing of Sports Goods. 110.00 - 110.0015 Manufacturing of Wood Products 110.00 - 110.0016 Motor Transport 110.00 - 110.0017 Oil Mills(including Kohloos) 110.00 - 110.0018 Private Brick and Tile Making 110.00 - 110.0019 Private Transport Industries 110.00 - 110.0020 Rosin and Terpentine Products 110.00 - 110.0021 Shops & Establishments 110.00 - 110.0022 Silicate & Chemical Works 110.00 - 110.0023 Steel Metal Rolling Works 110.00 - 110.0024 Stone Breaking or Stone Crushing 110.00 - 110.0025 Tanneries,Leather Manufacturing 110.00 - 110.0026 Wood Carving 110.00 - 110.0027 Woollen Carpet Making or Shawl Weaving 110.00 - 110.0028 Workshops 110.00 - 110.00
11.JAMMU & KASHMIR
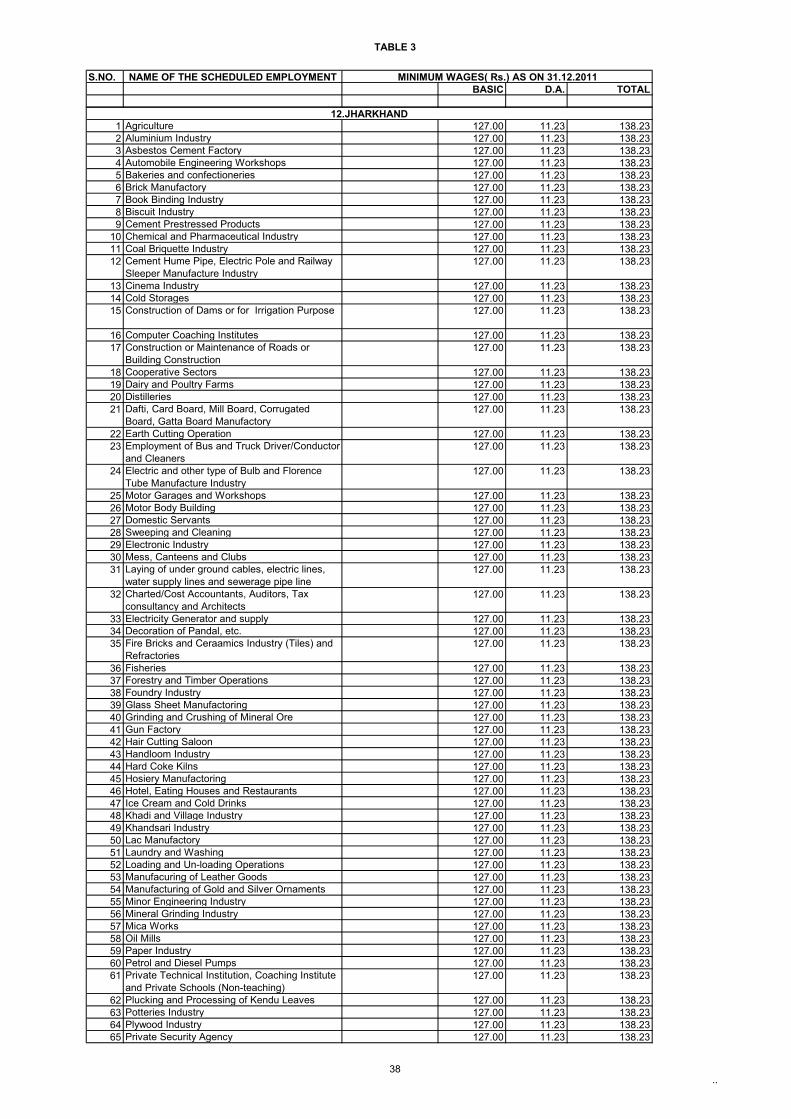
TABLE 3
38..
S.NO. NAME OF THE SCHEDULED EMPLOYMENTBASIC D.A. TOTAL
MINIMUM WAGES( Rs.) AS ON 31.12.2011
1 Agriculture 127.00 11.23 138.232 Aluminium Industry 127.00 11.23 138.233 Asbestos Cement Factory 127.00 11.23 138.234 Automobile Engineering Workshops 127.00 11.23 138.235 Bakeries and confectioneries 127.00 11.23 138.236 Brick Manufactory 127.00 11.23 138.237 Book Binding Industry 127.00 11.23 138.238 Biscuit Industry 127.00 11.23 138.239 Cement Prestressed Products 127.00 11.23 138.23
10 Chemical and Pharmaceutical Industry 127.00 11.23 138.2311 Coal Briquette Industry 127.00 11.23 138.2312 Cement Hume Pipe, Electric Pole and Railway
Sleeper Manufacture Industry127.00 11.23 138.23
13 Cinema Industry 127.00 11.23 138.2314 Cold Storages 127.00 11.23 138.2315 Construction of Dams or for Irrigation Purpose 127.00 11.23 138.23
16 Computer Coaching Institutes 127.00 11.23 138.2317 Construction or Maintenance of Roads or
Building Construction127.00 11.23 138.23
18 Cooperative Sectors 127.00 11.23 138.2319 Dairy and Poultry Farms 127.00 11.23 138.2320 Distilleries 127.00 11.23 138.2321 Dafti, Card Board, Mill Board, Corrugated
Board, Gatta Board Manufactory127.00 11.23 138.23
22 Earth Cutting Operation 127.00 11.23 138.2323 Employment of Bus and Truck Driver/Conductor
and Cleaners127.00 11.23 138.23
24 Electric and other type of Bulb and Florence Tube Manufacture Industry
127.00 11.23 138.23
25 Motor Garages and Workshops 127.00 11.23 138.2326 Motor Body Building 127.00 11.23 138.2327 Domestic Servants 127.00 11.23 138.2328 Sweeping and Cleaning 127.00 11.23 138.2329 Electronic Industry 127.00 11.23 138.2330 Mess, Canteens and Clubs 127.00 11.23 138.2331 Laying of under ground cables, electric lines,
water supply lines and sewerage pipe line127.00 11.23 138.23
32 Charted/Cost Accountants, Auditors, Tax consultancy and Architects
127.00 11.23 138.23
33 Electricity Generator and supply 127.00 11.23 138.2334 Decoration of Pandal, etc. 127.00 11.23 138.2335 Fire Bricks and Ceraamics Industry (Tiles) and
Refractories127.00 11.23 138.23
36 Fisheries 127.00 11.23 138.2337 Forestry and Timber Operations 127.00 11.23 138.2338 Foundry Industry 127.00 11.23 138.2339 Glass Sheet Manufactoring 127.00 11.23 138.2340 Grinding and Crushing of Mineral Ore 127.00 11.23 138.2341 Gun Factory 127.00 11.23 138.2342 Hair Cutting Saloon 127.00 11.23 138.2343 Handloom Industry 127.00 11.23 138.2344 Hard Coke Kilns 127.00 11.23 138.2345 Hosiery Manufactoring 127.00 11.23 138.2346 Hotel, Eating Houses and Restaurants 127.00 11.23 138.2347 Ice Cream and Cold Drinks 127.00 11.23 138.2348 Khadi and Village Industry 127.00 11.23 138.2349 Khandsari Industry 127.00 11.23 138.2350 Lac Manufactory 127.00 11.23 138.2351 Laundry and Washing 127.00 11.23 138.2352 Loading and Un-loading Operations 127.00 11.23 138.2353 Manufacuring of Leather Goods 127.00 11.23 138.2354 Manufacturing of Gold and Silver Ornaments 127.00 11.23 138.2355 Minor Engineering Industry 127.00 11.23 138.2356 Mineral Grinding Industry 127.00 11.23 138.2357 Mica Works 127.00 11.23 138.2358 Oil Mills 127.00 11.23 138.2359 Paper Industry 127.00 11.23 138.2360 Petrol and Diesel Pumps 127.00 11.23 138.2361 Private Technical Institution, Coaching Institute
and Private Schools (Non-teaching)127.00 11.23 138.23
62 Plucking and Processing of Kendu Leaves 127.00 11.23 138.2363 Potteries Industry 127.00 11.23 138.2364 Plywood Industry 127.00 11.23 138.2365 Private Security Agency 127.00 11.23 138.23
12.JHARKHAND
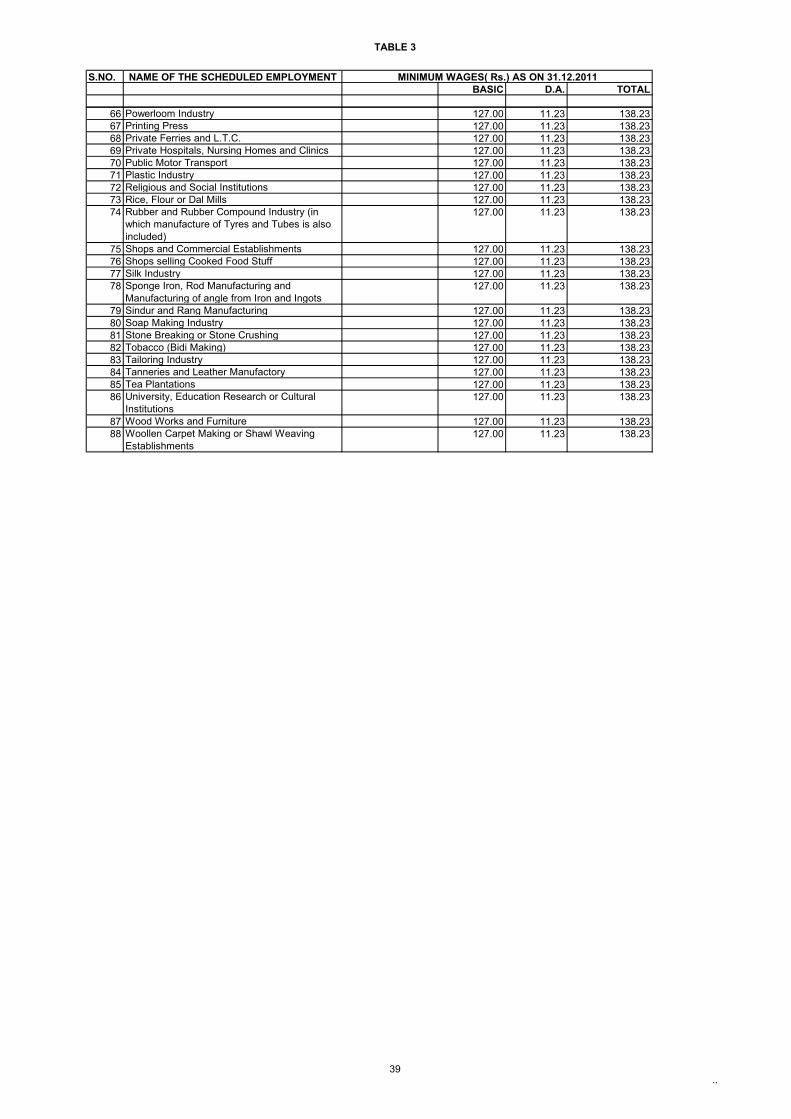
TABLE 3
39..
S.NO. NAME OF THE SCHEDULED EMPLOYMENTBASIC D.A. TOTAL
MINIMUM WAGES( Rs.) AS ON 31.12.2011
66 Powerloom Industry 127.00 11.23 138.2367 Printing Press 127.00 11.23 138.2368 Private Ferries and L.T.C. 127.00 11.23 138.2369 Private Hospitals, Nursing Homes and Clinics 127.00 11.23 138.2370 Public Motor Transport 127.00 11.23 138.2371 Plastic Industry 127.00 11.23 138.2372 Religious and Social Institutions 127.00 11.23 138.2373 Rice, Flour or Dal Mills 127.00 11.23 138.2374 Rubber and Rubber Compound Industry (in
which manufacture of Tyres and Tubes is also included)
127.00 11.23 138.23
75 Shops and Commercial Establishments 127.00 11.23 138.2376 Shops selling Cooked Food Stuff 127.00 11.23 138.2377 Silk Industry 127.00 11.23 138.2378 Sponge Iron, Rod Manufacturing and
Manufacturing of angle from Iron and Ingots127.00 11.23 138.23
79 Sindur and Rang Manufacturing 127.00 11.23 138.2380 Soap Making Industry 127.00 11.23 138.2381 Stone Breaking or Stone Crushing 127.00 11.23 138.2382 Tobacco (Bidi Making) 127.00 11.23 138.2383 Tailoring Industry 127.00 11.23 138.2384 Tanneries and Leather Manufactory 127.00 11.23 138.2385 Tea Plantations 127.00 11.23 138.2386 University, Education Research or Cultural
Institutions127.00 11.23 138.23
87 Wood Works and Furniture 127.00 11.23 138.2388 Woollen Carpet Making or Shawl Weaving
Establishments127.00 11.23 138.23
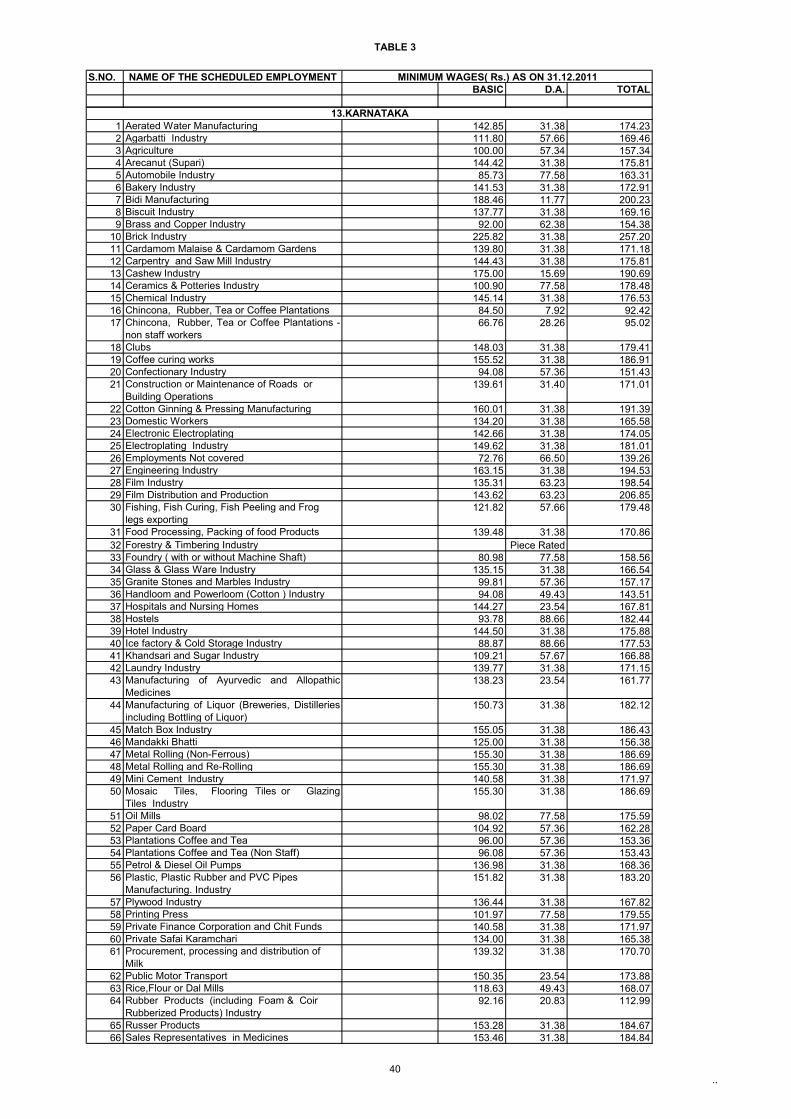
TABLE 3
40..
S.NO. NAME OF THE SCHEDULED EMPLOYMENTBASIC D.A. TOTAL
MINIMUM WAGES( Rs.) AS ON 31.12.2011
1 Aerated Water Manufacturing 142.85 31.38 174.232 Agarbatti Industry 111.80 57.66 169.463 Agriculture 100.00 57.34 157.344 Arecanut (Supari) 144.42 31.38 175.815 Automobile Industry 85.73 77.58 163.316 Bakery Industry 141.53 31.38 172.917 Bidi Manufacturing 188.46 11.77 200.238 Biscuit Industry 137.77 31.38 169.169 Brass and Copper Industry 92.00 62.38 154.38
10 Brick Industry 225.82 31.38 257.2011 Cardamom Malaise & Cardamom Gardens 139.80 31.38 171.1812 Carpentry and Saw Mill Industry 144.43 31.38 175.8113 Cashew Industry 175.00 15.69 190.6914 Ceramics & Potteries Industry 100.90 77.58 178.4815 Chemical Industry 145.14 31.38 176.5316 Chincona, Rubber, Tea or Coffee Plantations 84.50 7.92 92.4217 Chincona, Rubber, Tea or Coffee Plantations -
non staff workers66.76 28.26 95.02
18 Clubs 148.03 31.38 179.4119 Coffee curing works 155.52 31.38 186.9120 Confectionary Industry 94.08 57.36 151.4321 Construction or Maintenance of Roads or
Building Operations139.61 31.40 171.01
22 Cotton Ginning & Pressing Manufacturing 160.01 31.38 191.3923 Domestic Workers 134.20 31.38 165.5824 Electronic Electroplating 142.66 31.38 174.0525 Electroplating Industry 149.62 31.38 181.0126 Employments Not covered 72.76 66.50 139.2627 Engineering Industry 163.15 31.38 194.5328 Film Industry 135.31 63.23 198.5429 Film Distribution and Production 143.62 63.23 206.8530 Fishing, Fish Curing, Fish Peeling and Frog
legs exporting121.82 57.66 179.48
31 Food Processing, Packing of food Products
139.48 31.38 170.8632 Forestry & Timbering Industry Piece Rated33 Foundry ( with or without Machine Shaft) 80.98 77.58 158.5634 Glass & Glass Ware Industry 135.15 31.38 166.5435 Granite Stones and Marbles Industry 99.81 57.36 157.1736 Handloom and Powerloom (Cotton ) Industry 94.08 49.43 143.5137 Hospitals and Nursing Homes 144.27 23.54 167.8138 Hostels 93.78 88.66 182.4439 Hotel Industry 144.50 31.38 175.8840 Ice factory & Cold Storage Industry 88.87 88.66 177.5341 Khandsari and Sugar Industry 109.21 57.67 166.8842 Laundry Industry 139.77 31.38 171.1543 Manufacturing of Ayurvedic and Allopathic
Medicines138.23 23.54 161.77
44 Manufacturing of Liquor (Breweries, Distilleriesincluding Bottling of Liquor)
150.73 31.38 182.12
45 Match Box Industry 155.05 31.38 186.4346 Mandakki Bhatti 125.00 31.38 156.3847 Metal Rolling (Non-Ferrous) 155.30 31.38 186.6948 Metal Rolling and Re-Rolling 155.30 31.38 186.6949 Mini Cement Industry 140.58 31.38 171.9750 Mosaic Tiles, Flooring Tiles or Glazing
Tiles Industry 155.30 31.38 186.69
51 Oil Mills 98.02 77.58 175.5952 Paper Card Board 104.92 57.36 162.2853 Plantations Coffee and Tea 96.00 57.36 153.3654 Plantations Coffee and Tea (Non Staff) 96.08 57.36 153.4355 Petrol & Diesel Oil Pumps 136.98 31.38 168.3656 Plastic, Plastic Rubber and PVC Pipes
Manufacturing. Industry151.82 31.38 183.20
57 Plywood Industry 136.44 31.38 167.8258 Printing Press 101.97 77.58 179.5559 Private Finance Corporation and Chit Funds 140.58 31.38 171.9760 Private Safai Karamchari 134.00 31.38 165.3861 Procurement, processing and distribution of
Milk139.32 31.38 170.70
62 Public Motor Transport 150.35 23.54 173.8863 Rice,Flour or Dal Mills 118.63 49.43 168.0764 Rubber Products (including Foam & Coir
Rubberized Products) Industry92.16 20.83 112.99
65 Russer Products 153.28 31.38 184.6766 Sales Representatives in Medicines 153.46 31.38 184.84
13.KARNATAKA
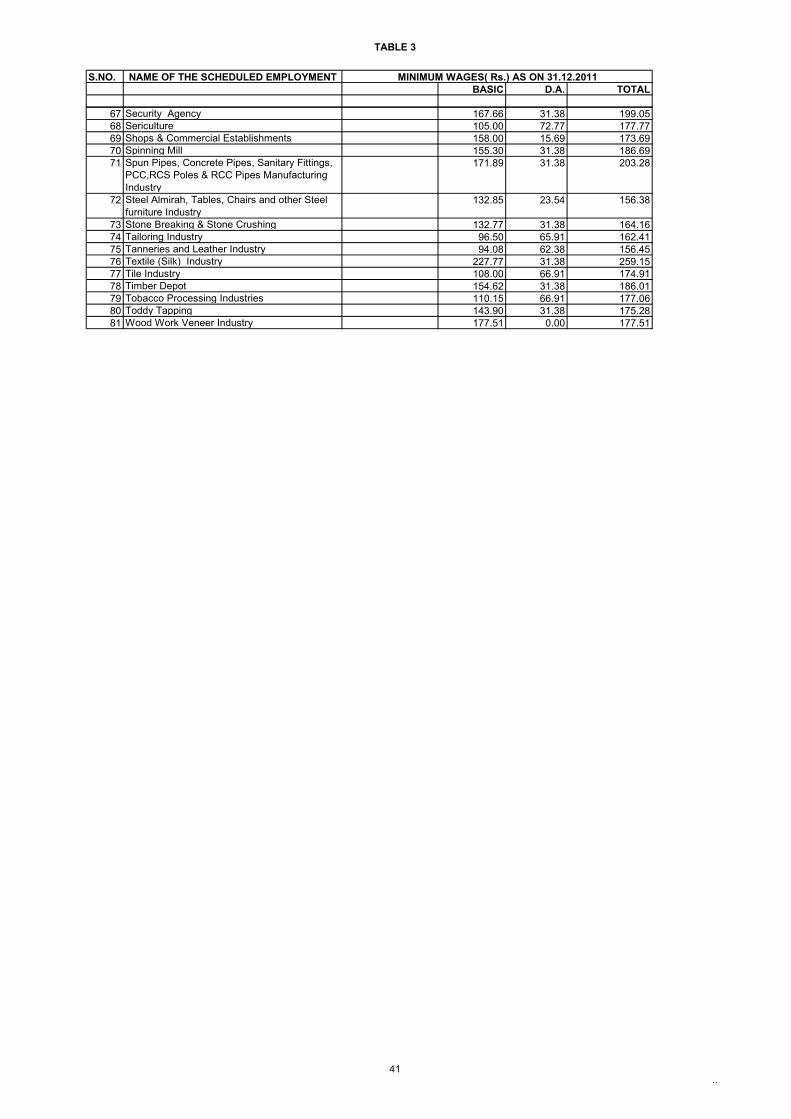
TABLE 3
41..
S.NO. NAME OF THE SCHEDULED EMPLOYMENTBASIC D.A. TOTAL
MINIMUM WAGES( Rs.) AS ON 31.12.2011
67 Security Agency 167.66 31.38 199.0568 Sericulture 105.00 72.77 177.7769 Shops & Commercial Establishments 158.00 15.69 173.6970 Spinning Mill 155.30 31.38 186.6971 Spun Pipes, Concrete Pipes, Sanitary Fittings,
PCC,RCS Poles & RCC Pipes Manufacturing Industry
171.89 31.38 203.28
72 Steel Almirah, Tables, Chairs and other Steel furniture Industry
132.85 23.54 156.38
73 Stone Breaking & Stone Crushing 132.77 31.38 164.1674 Tailoring Industry 96.50 65.91 162.4175 Tanneries and Leather Industry 94.08 62.38 156.4576 Textile (Silk) Industry 227.77 31.38 259.1577 Tile Industry 108.00 66.91 174.9178 Timber Depot 154.62 31.38 186.0179 Tobacco Processing Industries 110.15 66.91 177.0680 Toddy Tapping 143.90 31.38 175.2881 Wood Work Veneer Industry 177.51 0.00 177.51
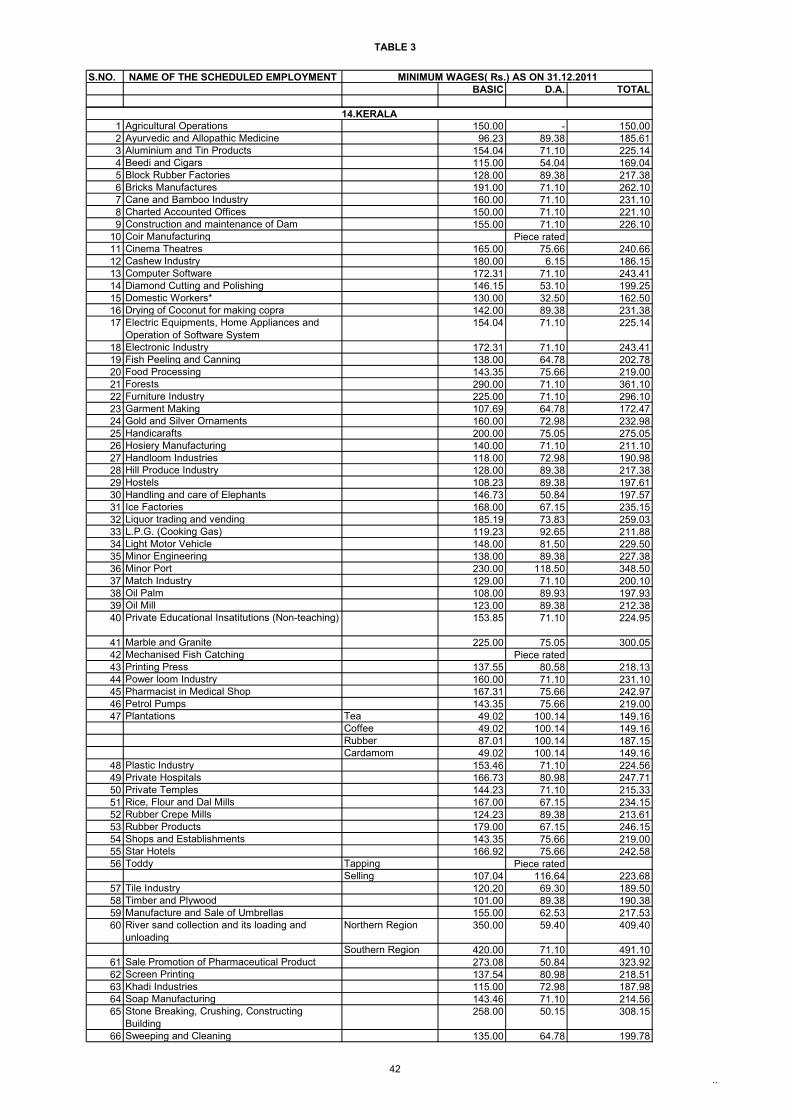
TABLE 3
42..
S.NO. NAME OF THE SCHEDULED EMPLOYMENTBASIC D.A. TOTAL
MINIMUM WAGES( Rs.) AS ON 31.12.2011
1 Agricultural Operations 150.00 - 150.002 Ayurvedic and Allopathic Medicine 96.23 89.38 185.613 Aluminium and Tin Products 154.04 71.10 225.144 Beedi and Cigars 115.00 54.04 169.045 Block Rubber Factories 128.00 89.38 217.386 Bricks Manufactures 191.00 71.10 262.107 Cane and Bamboo Industry 160.00 71.10 231.108 Charted Accounted Offices 150.00 71.10 221.109 Construction and maintenance of Dam 155.00 71.10 226.10
10 Coir Manufacturing Piece rated11 Cinema Theatres 165.00 75.66 240.6612 Cashew Industry 180.00 6.15 186.1513 Computer Software 172.31 71.10 243.4114 Diamond Cutting and Polishing 146.15 53.10 199.2515 Domestic Workers* 130.00 32.50 162.5016 Drying of Coconut for making copra 142.00 89.38 231.3817 Electric Equipments, Home Appliances and
Operation of Software System154.04 71.10 225.14
18 Electronic Industry 172.31 71.10 243.4119 Fish Peeling and Canning 138.00 64.78 202.7820 Food Processing 143.35 75.66 219.0021 Forests 290.00 71.10 361.1022 Furniture Industry 225.00 71.10 296.1023 Garment Making 107.69 64.78 172.4724 Gold and Silver Ornaments 160.00 72.98 232.9825 Handicarafts 200.00 75.05 275.0526 Hosiery Manufacturing 140.00 71.10 211.1027 Handloom Industries 118.00 72.98 190.9828 Hill Produce Industry 128.00 89.38 217.3829 Hostels 108.23 89.38 197.6130 Handling and care of Elephants 146.73 50.84 197.5731 Ice Factories 168.00 67.15 235.1532 Liquor trading and vending 185.19 73.83 259.0333 L.P.G. (Cooking Gas) 119.23 92.65 211.8834 Light Motor Vehicle 148.00 81.50 229.5035 Minor Engineering 138.00 89.38 227.3836 Minor Port 230.00 118.50 348.5037 Match Industry 129.00 71.10 200.1038 Oil Palm 108.00 89.93 197.9339 Oil Mill 123.00 89.38 212.3840 Private Educational Insatitutions (Non-teaching) 153.85 71.10 224.95
41 Marble and Granite 225.00 75.05 300.0542 Mechanised Fish Catching Piece rated43 Printing Press 137.55 80.58 218.1344 Power loom Industry 160.00 71.10 231.1045 Pharmacist in Medical Shop 167.31 75.66 242.9746 Petrol Pumps 143.35 75.66 219.0047 Plantations Tea 49.02 100.14 149.16
Coffee 49.02 100.14 149.16Rubber 87.01 100.14 187.15Cardamom 49.02 100.14 149.16
48 Plastic Industry 153.46 71.10 224.5649 Private Hospitals 166.73 80.98 247.7150 Private Temples 144.23 71.10 215.3351 Rice, Flour and Dal Mills 167.00 67.15 234.1552 Rubber Crepe Mills 124.23 89.38 213.6153 Rubber Products 179.00 67.15 246.1554 Shops and Establishments 143.35 75.66 219.0055 Star Hotels 166.92 75.66 242.5856 Toddy Tapping Piece rated
Selling 107.04 116.64 223.6857 Tile Industry 120.20 69.30 189.5058 Timber and Plywood 101.00 89.38 190.3859 Manufacture and Sale of Umbrellas 155.00 62.53 217.5360 River sand collection and its loading and
unloadingNorthern Region 350.00 59.40 409.40
Southern Region 420.00 71.10 491.1061 Sale Promotion of Pharmaceutical Product 273.08 50.84 323.9262 Screen Printing 137.54 80.98 218.5163 Khadi Industries 115.00 72.98 187.9864 Soap Manufacturing 143.46 71.10 214.5665 Stone Breaking, Crushing, Constructing
Building258.00 50.15 308.15
66 Sweeping and Cleaning 135.00 64.78 199.78
14.KERALA
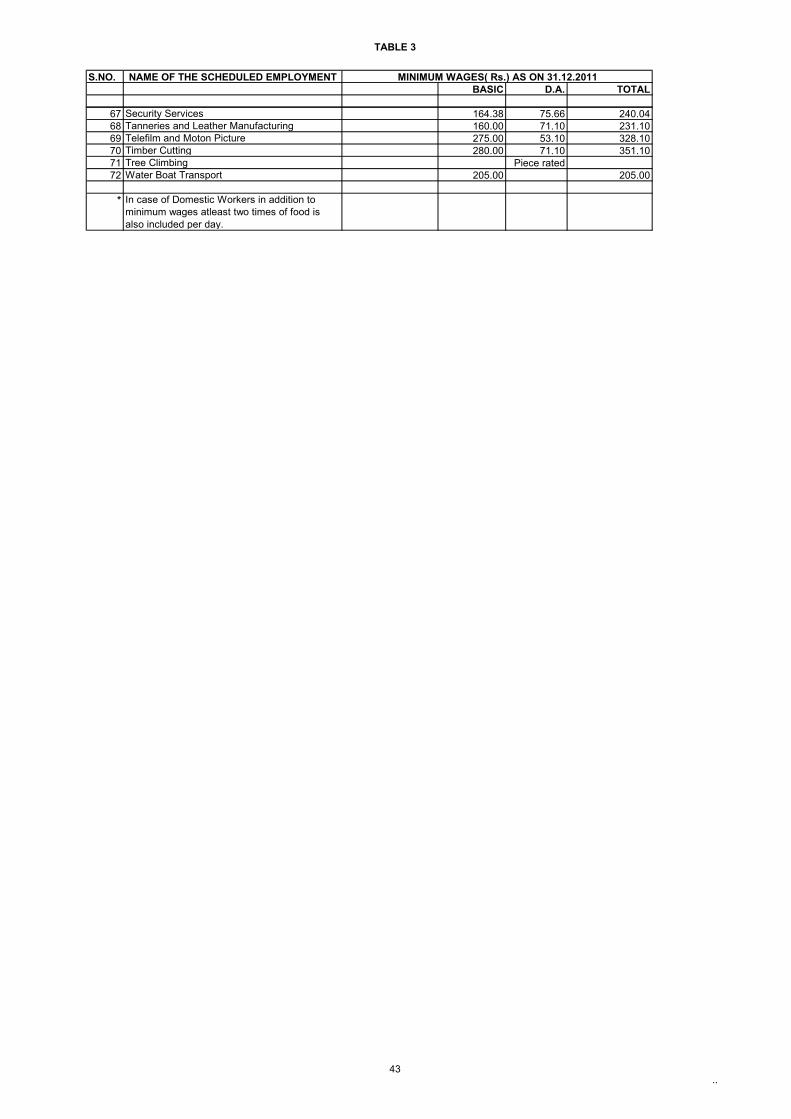
TABLE 3
43..
S.NO. NAME OF THE SCHEDULED EMPLOYMENTBASIC D.A. TOTAL
MINIMUM WAGES( Rs.) AS ON 31.12.2011
67 Security Services 164.38 75.66 240.0468 Tanneries and Leather Manufacturing 160.00 71.10 231.1069 Telefilm and Moton Picture 275.00 53.10 328.1070 Timber Cutting 280.00 71.10 351.1071 Tree Climbing Piece rated72 Water Boat Transport 205.00 205.00
* In case of Domestic Workers in addition to minimum wages atleast two times of food is also included per day.
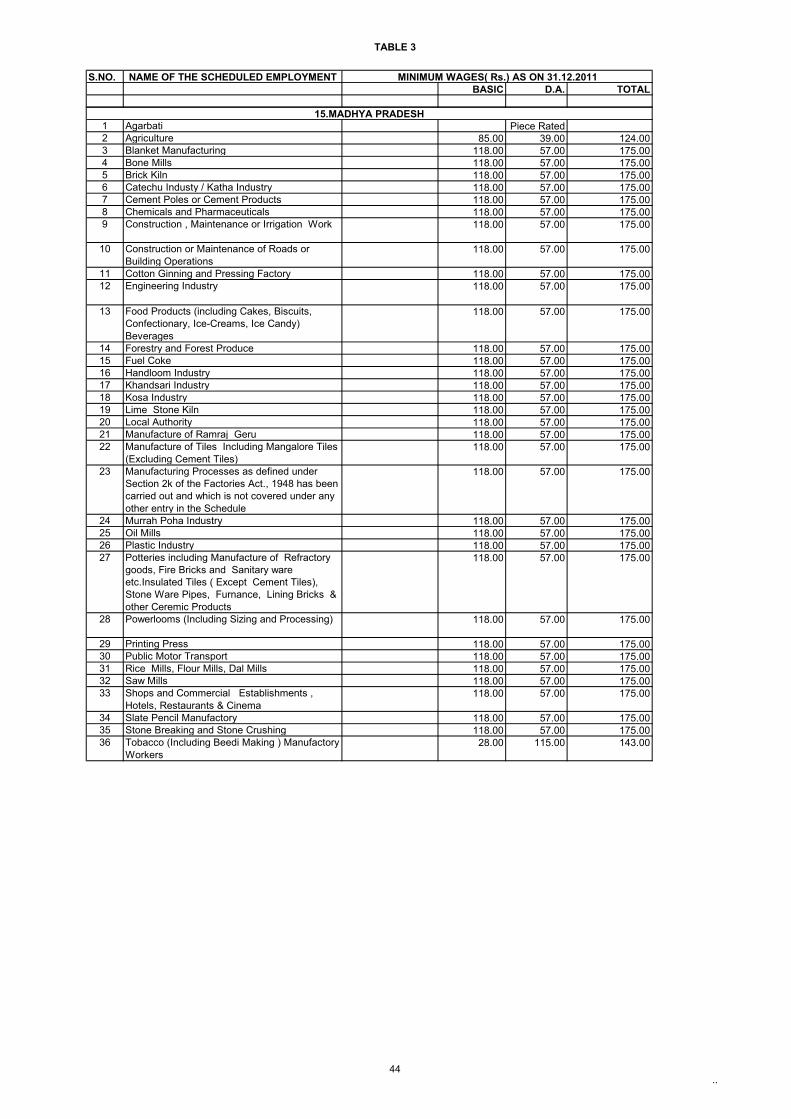
TABLE 3
44..
S.NO. NAME OF THE SCHEDULED EMPLOYMENTBASIC D.A. TOTAL
MINIMUM WAGES( Rs.) AS ON 31.12.2011
1 Agarbati Piece Rated2 Agriculture 85.00 39.00 124.003 Blanket Manufacturing 118.00 57.00 175.004 Bone Mills 118.00 57.00 175.005 Brick Kiln 118.00 57.00 175.006 Catechu Industy / Katha Industry 118.00 57.00 175.007 Cement Poles or Cement Products 118.00 57.00 175.008 Chemicals and Pharmaceuticals 118.00 57.00 175.009 Construction , Maintenance or Irrigation Work 118.00 57.00 175.00
10 Construction or Maintenance of Roads or Building Operations
118.00 57.00 175.00
11 Cotton Ginning and Pressing Factory 118.00 57.00 175.0012 Engineering Industry 118.00 57.00 175.00
13 Food Products (including Cakes, Biscuits, Confectionary, Ice-Creams, Ice Candy) Beverages
118.00 57.00 175.00
14 Forestry and Forest Produce 118.00 57.00 175.0015 Fuel Coke 118.00 57.00 175.0016 Handloom Industry 118.00 57.00 175.0017 Khandsari Industry 118.00 57.00 175.0018 Kosa Industry 118.00 57.00 175.0019 Lime Stone Kiln 118.00 57.00 175.0020 Local Authority 118.00 57.00 175.0021 Manufacture of Ramraj Geru 118.00 57.00 175.0022 Manufacture of Tiles Including Mangalore Tiles
(Excluding Cement Tiles)118.00 57.00 175.00
23 Manufacturing Processes as defined under Section 2k of the Factories Act., 1948 has been carried out and which is not covered under any other entry in the Schedule
118.00 57.00 175.00
24 Murrah Poha Industry 118.00 57.00 175.0025 Oil Mills 118.00 57.00 175.0026 Plastic Industry 118.00 57.00 175.0027 Potteries including Manufacture of Refractory
goods, Fire Bricks and Sanitary ware etc.Insulated Tiles ( Except Cement Tiles), Stone Ware Pipes, Furnance, Lining Bricks & other Ceremic Products
118.00 57.00 175.00
28 Powerlooms (Including Sizing and Processing) 118.00 57.00 175.00
29 Printing Press 118.00 57.00 175.0030 Public Motor Transport 118.00 57.00 175.0031 Rice Mills, Flour Mills, Dal Mills 118.00 57.00 175.0032 Saw Mills 118.00 57.00 175.0033 Shops and Commercial Establishments ,
Hotels, Restaurants & Cinema118.00 57.00 175.00
34 Slate Pencil Manufactory 118.00 57.00 175.0035 Stone Breaking and Stone Crushing 118.00 57.00 175.0036 Tobacco (Including Beedi Making ) Manufactory
Workers28.00 115.00 143.00
15.MADHYA PRADESH
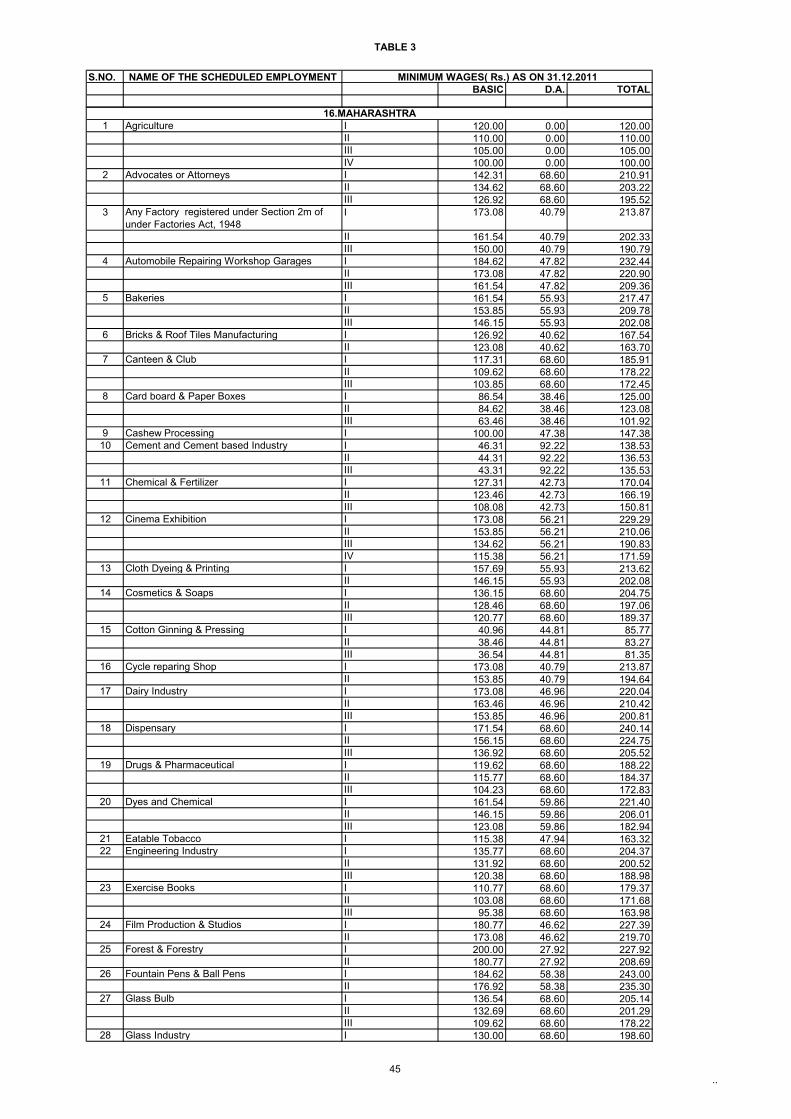
TABLE 3
45..
S.NO. NAME OF THE SCHEDULED EMPLOYMENTBASIC D.A. TOTAL
MINIMUM WAGES( Rs.) AS ON 31.12.2011
1 Agriculture I 120.00 0.00 120.00II 110.00 0.00 110.00III 105.00 0.00 105.00IV 100.00 0.00 100.00
2 Advocates or Attorneys I 142.31 68.60 210.91II 134.62 68.60 203.22III 126.92 68.60 195.52
3 Any Factory registered under Section 2m of under Factories Act, 1948
I 173.08 40.79 213.87
II 161.54 40.79 202.33III 150.00 40.79 190.79
4 Automobile Repairing Workshop Garages I 184.62 47.82 232.44II 173.08 47.82 220.90III 161.54 47.82 209.36
5 Bakeries I 161.54 55.93 217.47II 153.85 55.93 209.78III 146.15 55.93 202.08
6 Bricks & Roof Tiles Manufacturing I 126.92 40.62 167.54II 123.08 40.62 163.70
7 Canteen & Club I 117.31 68.60 185.91II 109.62 68.60 178.22III 103.85 68.60 172.45
8 Card board & Paper Boxes I 86.54 38.46 125.00II 84.62 38.46 123.08III 63.46 38.46 101.92
9 Cashew Processing I 100.00 47.38 147.3810 Cement and Cement based Industry I 46.31 92.22 138.53
II 44.31 92.22 136.53III 43.31 92.22 135.53
11 Chemical & Fertilizer I 127.31 42.73 170.04II 123.46 42.73 166.19III 108.08 42.73 150.81
12 Cinema Exhibition I 173.08 56.21 229.29II 153.85 56.21 210.06III 134.62 56.21 190.83IV 115.38 56.21 171.59
13 Cloth Dyeing & Printing I 157.69 55.93 213.62II 146.15 55.93 202.08
14 Cosmetics & Soaps I 136.15 68.60 204.75II 128.46 68.60 197.06III 120.77 68.60 189.37
15 Cotton Ginning & Pressing I 40.96 44.81 85.77II 38.46 44.81 83.27III 36.54 44.81 81.35
16 Cycle reparing Shop I 173.08 40.79 213.87II 153.85 40.79 194.64
17 Dairy Industry I 173.08 46.96 220.04II 163.46 46.96 210.42III 153.85 46.96 200.81
18 Dispensary I 171.54 68.60 240.14II 156.15 68.60 224.75III 136.92 68.60 205.52
19 Drugs & Pharmaceutical I 119.62 68.60 188.22II 115.77 68.60 184.37III 104.23 68.60 172.83
20 Dyes and Chemical I 161.54 59.86 221.40II 146.15 59.86 206.01III 123.08 59.86 182.94
21 Eatable Tobacco I 115.38 47.94 163.3222 Engineering Industry I 135.77 68.60 204.37
II 131.92 68.60 200.52III 120.38 68.60 188.98
23 Exercise Books I 110.77 68.60 179.37II 103.08 68.60 171.68III 95.38 68.60 163.98
24 Film Production & Studios I 180.77 46.62 227.39II 173.08 46.62 219.70
25 Forest & Forestry I 200.00 27.92 227.92II 180.77 27.92 208.69
26 Fountain Pens & Ball Pens I 184.62 58.38 243.00II 176.92 58.38 235.30
27 Glass Bulb I 136.54 68.60 205.14II 132.69 68.60 201.29III 109.62 68.60 178.22
28 Glass Industry I 130.00 68.60 198.60
16.MAHARASHTRA
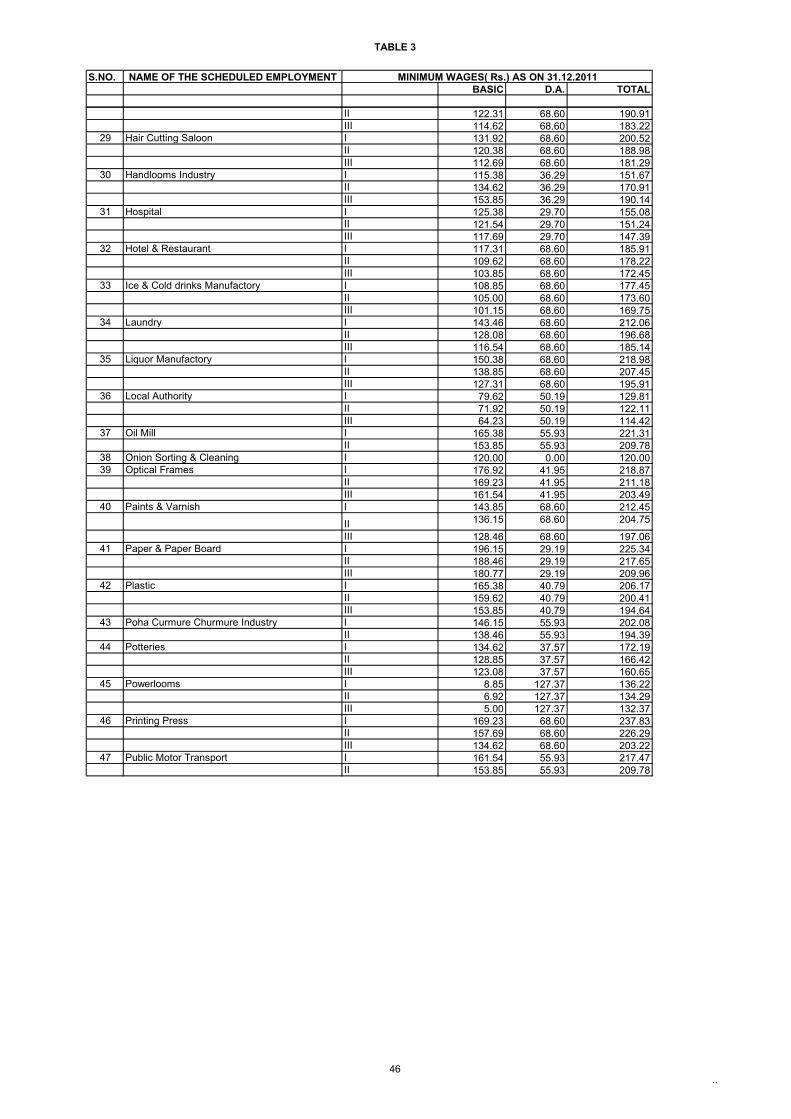
TABLE 3
46..
S.NO. NAME OF THE SCHEDULED EMPLOYMENTBASIC D.A. TOTAL
MINIMUM WAGES( Rs.) AS ON 31.12.2011
II 122.31 68.60 190.91III 114.62 68.60 183.22
29 Hair Cutting Saloon I 131.92 68.60 200.52II 120.38 68.60 188.98III 112.69 68.60 181.29
30 Handlooms Industry I 115.38 36.29 151.67II 134.62 36.29 170.91III 153.85 36.29 190.14
31 Hospital I 125.38 29.70 155.08II 121.54 29.70 151.24III 117.69 29.70 147.39
32 Hotel & Restaurant I 117.31 68.60 185.91II 109.62 68.60 178.22III 103.85 68.60 172.45
33 Ice & Cold drinks Manufactory I 108.85 68.60 177.45II 105.00 68.60 173.60III 101.15 68.60 169.75
34 Laundry I 143.46 68.60 212.06II 128.08 68.60 196.68III 116.54 68.60 185.14
35 Liquor Manufactory I 150.38 68.60 218.98II 138.85 68.60 207.45III 127.31 68.60 195.91
36 Local Authority I 79.62 50.19 129.81II 71.92 50.19 122.11III 64.23 50.19 114.42
37 Oil Mill I 165.38 55.93 221.31II 153.85 55.93 209.78
38 Onion Sorting & Cleaning I 120.00 0.00 120.0039 Optical Frames I 176.92 41.95 218.87
II 169.23 41.95 211.18III 161.54 41.95 203.49
40 Paints & Varnish I 143.85 68.60 212.45
II 136.15 68.60 204.75
III 128.46 68.60 197.0641 Paper & Paper Board I 196.15 29.19 225.34
II 188.46 29.19 217.65III 180.77 29.19 209.96
42 Plastic I 165.38 40.79 206.17II 159.62 40.79 200.41III 153.85 40.79 194.64
43 Poha Curmure Churmure Industry I 146.15 55.93 202.08II 138.46 55.93 194.39
44 Potteries I 134.62 37.57 172.19II 128.85 37.57 166.42III 123.08 37.57 160.65
45 Powerlooms I 8.85 127.37 136.22II 6.92 127.37 134.29III 5.00 127.37 132.37
46 Printing Press I 169.23 68.60 237.83II 157.69 68.60 226.29III 134.62 68.60 203.22
47 Public Motor Transport I 161.54 55.93 217.47II 153.85 55.93 209.78
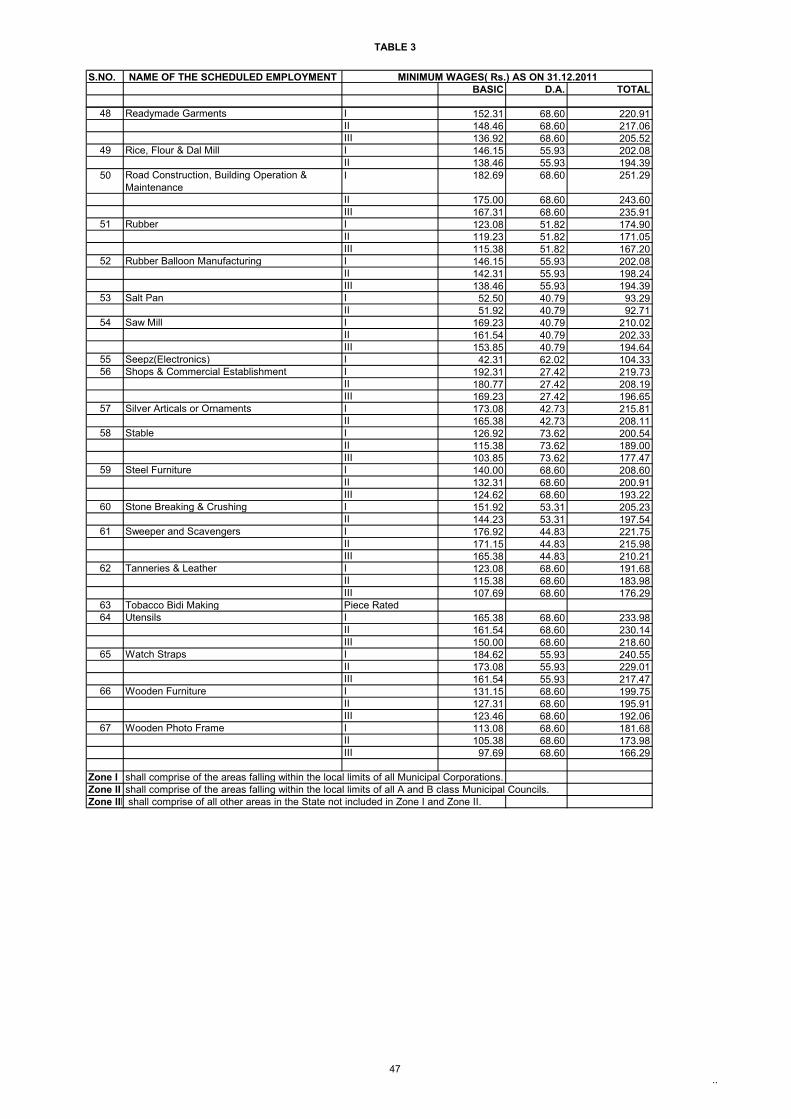
TABLE 3
47..
S.NO. NAME OF THE SCHEDULED EMPLOYMENTBASIC D.A. TOTAL
MINIMUM WAGES( Rs.) AS ON 31.12.2011
48 Readymade Garments I 152.31 68.60 220.91II 148.46 68.60 217.06III 136.92 68.60 205.52
49 Rice, Flour & Dal Mill I 146.15 55.93 202.08II 138.46 55.93 194.39
50 Road Construction, Building Operation & Maintenance
I 182.69 68.60 251.29
II 175.00 68.60 243.60III 167.31 68.60 235.91
51 Rubber I 123.08 51.82 174.90II 119.23 51.82 171.05III 115.38 51.82 167.20
52 Rubber Balloon Manufacturing I 146.15 55.93 202.08II 142.31 55.93 198.24III 138.46 55.93 194.39
53 Salt Pan I 52.50 40.79 93.29II 51.92 40.79 92.71
54 Saw Mill I 169.23 40.79 210.02II 161.54 40.79 202.33III 153.85 40.79 194.64
55 Seepz(Electronics) I 42.31 62.02 104.3356 Shops & Commercial Establishment I 192.31 27.42 219.73
II 180.77 27.42 208.19III 169.23 27.42 196.65
57 Silver Articals or Ornaments I 173.08 42.73 215.81II 165.38 42.73 208.11
58 Stable I 126.92 73.62 200.54II 115.38 73.62 189.00III 103.85 73.62 177.47
59 Steel Furniture I 140.00 68.60 208.60II 132.31 68.60 200.91III 124.62 68.60 193.22
60 Stone Breaking & Crushing I 151.92 53.31 205.23II 144.23 53.31 197.54
61 Sweeper and Scavengers I 176.92 44.83 221.75II 171.15 44.83 215.98III 165.38 44.83 210.21
62 Tanneries & Leather I 123.08 68.60 191.68II 115.38 68.60 183.98III 107.69 68.60 176.29
63 Tobacco Bidi Making Piece Rated64 Utensils I 165.38 68.60 233.98
II 161.54 68.60 230.14III 150.00 68.60 218.60
65 Watch Straps I 184.62 55.93 240.55II 173.08 55.93 229.01III 161.54 55.93 217.47
66 Wooden Furniture I 131.15 68.60 199.75II 127.31 68.60 195.91III 123.46 68.60 192.06
67 Wooden Photo Frame I 113.08 68.60 181.68II 105.38 68.60 173.98III 97.69 68.60 166.29
Zone I shall comprise of the areas falling within the local limits of all Municipal Corporations.Zone II shall comprise of the areas falling within the local limits of all A and B class Municipal Councils.Zone III shall comprise of all other areas in the State not included in Zone I and Zone II.
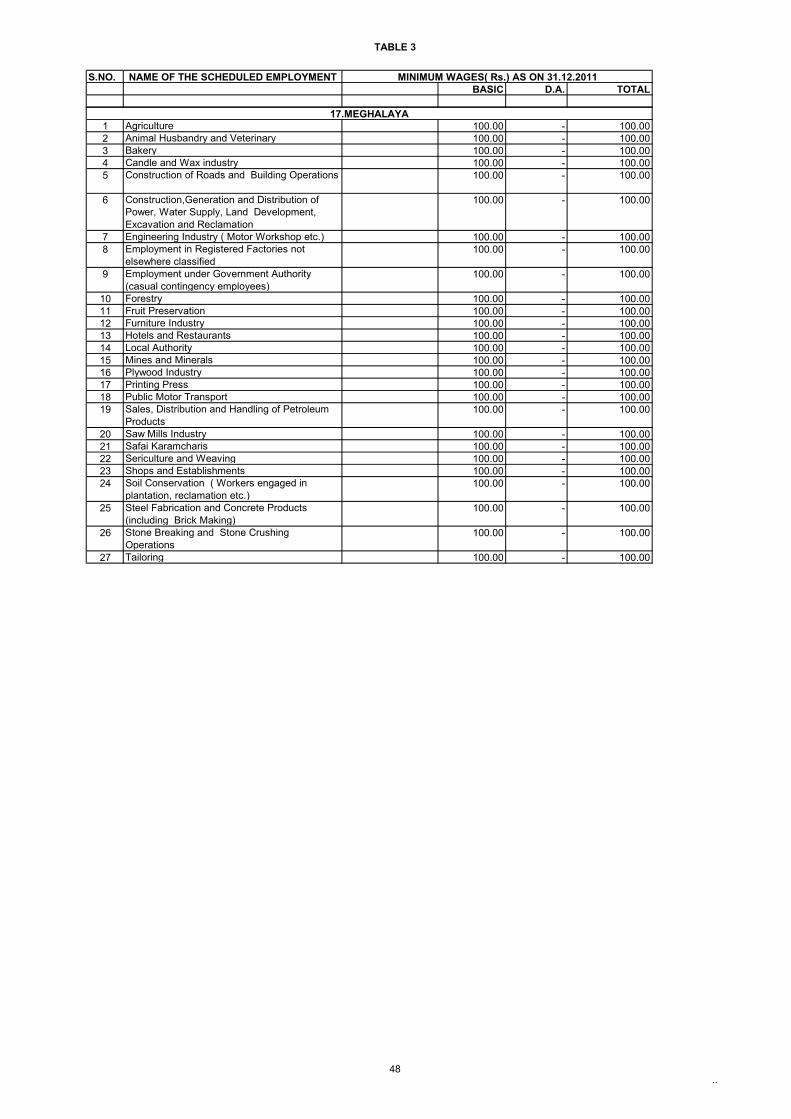
TABLE 3
48..
S.NO. NAME OF THE SCHEDULED EMPLOYMENTBASIC D.A. TOTAL
MINIMUM WAGES( Rs.) AS ON 31.12.2011
1 Agriculture 100.00 - 100.002 Animal Husbandry and Veterinary 100.00 - 100.003 Bakery 100.00 - 100.004 Candle and Wax industry 100.00 - 100.005 Construction of Roads and Building Operations 100.00 - 100.00
6 Construction,Generation and Distribution of Power, Water Supply, Land Development, Excavation and Reclamation
100.00 - 100.00
7 Engineering Industry ( Motor Workshop etc.) 100.00 - 100.008 Employment in Registered Factories not
elsewhere classified100.00 - 100.00
9 Employment under Government Authority (casual contingency employees)
100.00 - 100.00
10 Forestry 100.00 - 100.0011 Fruit Preservation 100.00 - 100.0012 Furniture Industry 100.00 - 100.0013 Hotels and Restaurants 100.00 - 100.0014 Local Authority 100.00 - 100.0015 Mines and Minerals 100.00 - 100.0016 Plywood Industry 100.00 - 100.0017 Printing Press 100.00 - 100.0018 Public Motor Transport 100.00 - 100.0019 Sales, Distribution and Handling of Petroleum
Products100.00 - 100.00
20 Saw Mills Industry 100.00 - 100.0021 Safai Karamcharis 100.00 - 100.0022 Sericulture and Weaving 100.00 - 100.0023 Shops and Establishments 100.00 - 100.0024 Soil Conservation ( Workers engaged in
plantation, reclamation etc.)100.00 - 100.00
25 Steel Fabrication and Concrete Products (including Brick Making)
100.00 - 100.00
26 Stone Breaking and Stone Crushing Operations
100.00 - 100.00
27 Tailoring 100.00 - 100.00
17.MEGHALAYA
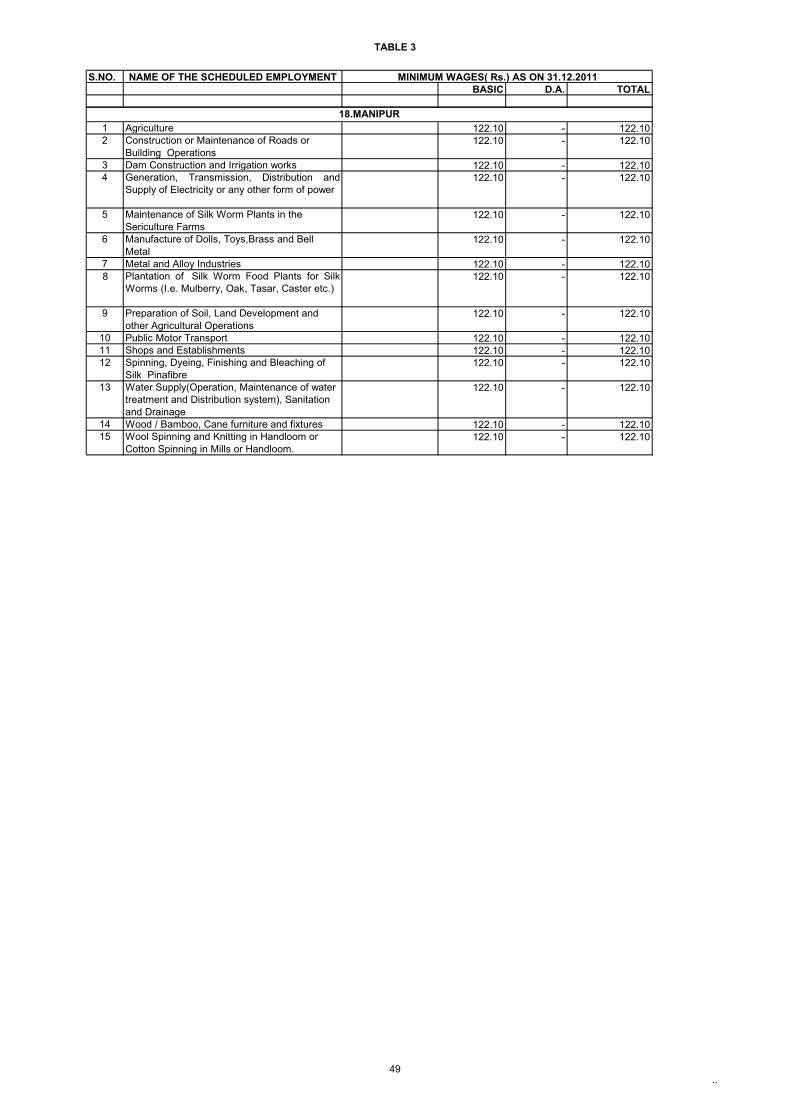
TABLE 3
49..
S.NO. NAME OF THE SCHEDULED EMPLOYMENTBASIC D.A. TOTAL
MINIMUM WAGES( Rs.) AS ON 31.12.2011
1 Agriculture 122.10 - 122.102 Construction or Maintenance of Roads or
Building Operations122.10 - 122.10
3 Dam Construction and Irrigation works 122.10 - 122.104 Generation, Transmission, Distribution and
Supply of Electricity or any other form of power122.10 - 122.10
5 Maintenance of Silk Worm Plants in the Sericulture Farms
122.10 - 122.10
6 Manufacture of Dolls, Toys,Brass and Bell Metal
122.10 - 122.10
7 Metal and Alloy Industries 122.10 - 122.108 Plantation of Silk Worm Food Plants for Silk
Worms (I.e. Mulberry, Oak, Tasar, Caster etc.)122.10 - 122.10
9 Preparation of Soil, Land Development and other Agricultural Operations
122.10 - 122.10
10 Public Motor Transport 122.10 - 122.1011 Shops and Establishments 122.10 - 122.1012 Spinning, Dyeing, Finishing and Bleaching of
Silk Pinafibre 122.10 - 122.10
13 Water Supply(Operation, Maintenance of water treatment and Distribution system), Sanitation and Drainage
122.10 - 122.10
14 Wood / Bamboo, Cane furniture and fixtures 122.10 - 122.1015 Wool Spinning and Knitting in Handloom or
Cotton Spinning in Mills or Handloom.122.10 - 122.10
18.MANIPUR
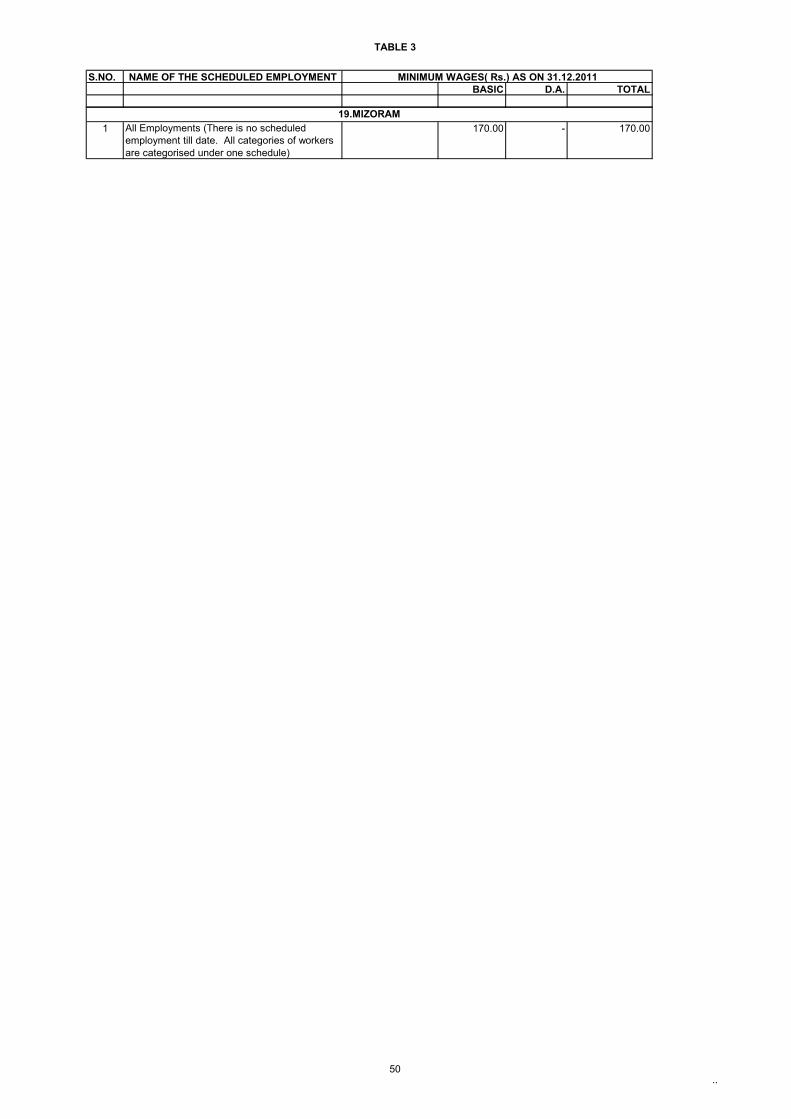
TABLE 3
50..
S.NO. NAME OF THE SCHEDULED EMPLOYMENTBASIC D.A. TOTAL
MINIMUM WAGES( Rs.) AS ON 31.12.2011
1 All Employments (There is no scheduled employment till date. All categories of workers are categorised under one schedule)
170.00 - 170.0019.MIZORAM
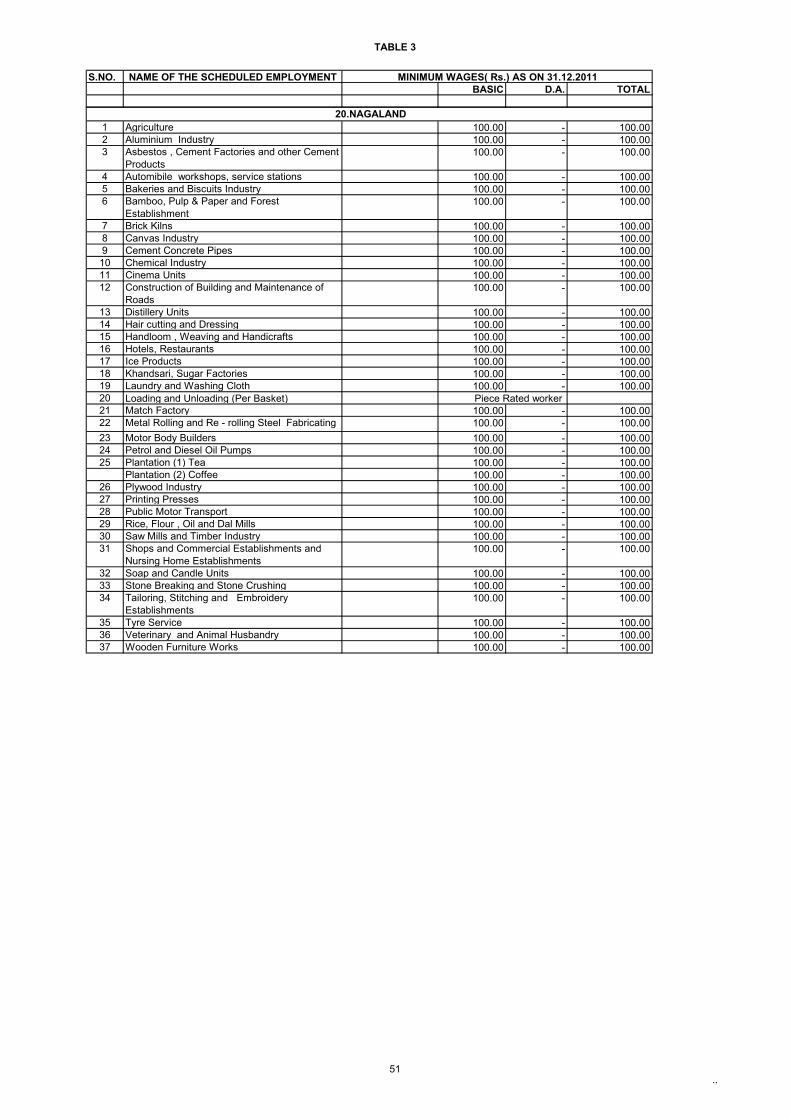
TABLE 3
51..
S.NO. NAME OF THE SCHEDULED EMPLOYMENTBASIC D.A. TOTAL
MINIMUM WAGES( Rs.) AS ON 31.12.2011
1 Agriculture 100.00 - 100.002 Aluminium Industry 100.00 - 100.003 Asbestos , Cement Factories and other Cement
Products100.00 - 100.00
4 Automibile workshops, service stations 100.00 - 100.005 Bakeries and Biscuits Industry 100.00 - 100.006 Bamboo, Pulp & Paper and Forest
Establishment100.00 - 100.00
7 Brick Kilns 100.00 - 100.008 Canvas Industry 100.00 - 100.009 Cement Concrete Pipes 100.00 - 100.0010 Chemical Industry 100.00 - 100.0011 Cinema Units 100.00 - 100.0012 Construction of Building and Maintenance of
Roads100.00 - 100.00
13 Distillery Units 100.00 - 100.0014 Hair cutting and Dressing 100.00 - 100.0015 Handloom , Weaving and Handicrafts 100.00 - 100.0016 Hotels, Restaurants 100.00 - 100.0017 Ice Products 100.00 - 100.0018 Khandsari, Sugar Factories 100.00 - 100.0019 Laundry and Washing Cloth 100.00 - 100.0020 Loading and Unloading (Per Basket) Piece Rated worker 21 Match Factory 100.00 - 100.0022 Metal Rolling and Re - rolling Steel Fabricating
100.00 - 100.00
23 Motor Body Builders 100.00 - 100.0024 Petrol and Diesel Oil Pumps 100.00 - 100.0025 Plantation (1) Tea 100.00 - 100.00
Plantation (2) Coffee 100.00 - 100.0026 Plywood Industry 100.00 - 100.0027 Printing Presses 100.00 - 100.0028 Public Motor Transport 100.00 - 100.0029 Rice, Flour , Oil and Dal Mills 100.00 - 100.0030 Saw Mills and Timber Industry 100.00 - 100.0031 Shops and Commercial Establishments and
Nursing Home Establishments100.00 - 100.00
32 Soap and Candle Units 100.00 - 100.0033 Stone Breaking and Stone Crushing 100.00 - 100.0034 Tailoring, Stitching and Embroidery
Establishments 100.00 - 100.00
35 Tyre Service 100.00 - 100.0036 Veterinary and Animal Husbandry 100.00 - 100.0037 Wooden Furniture Works 100.00 - 100.00
20.NAGALAND
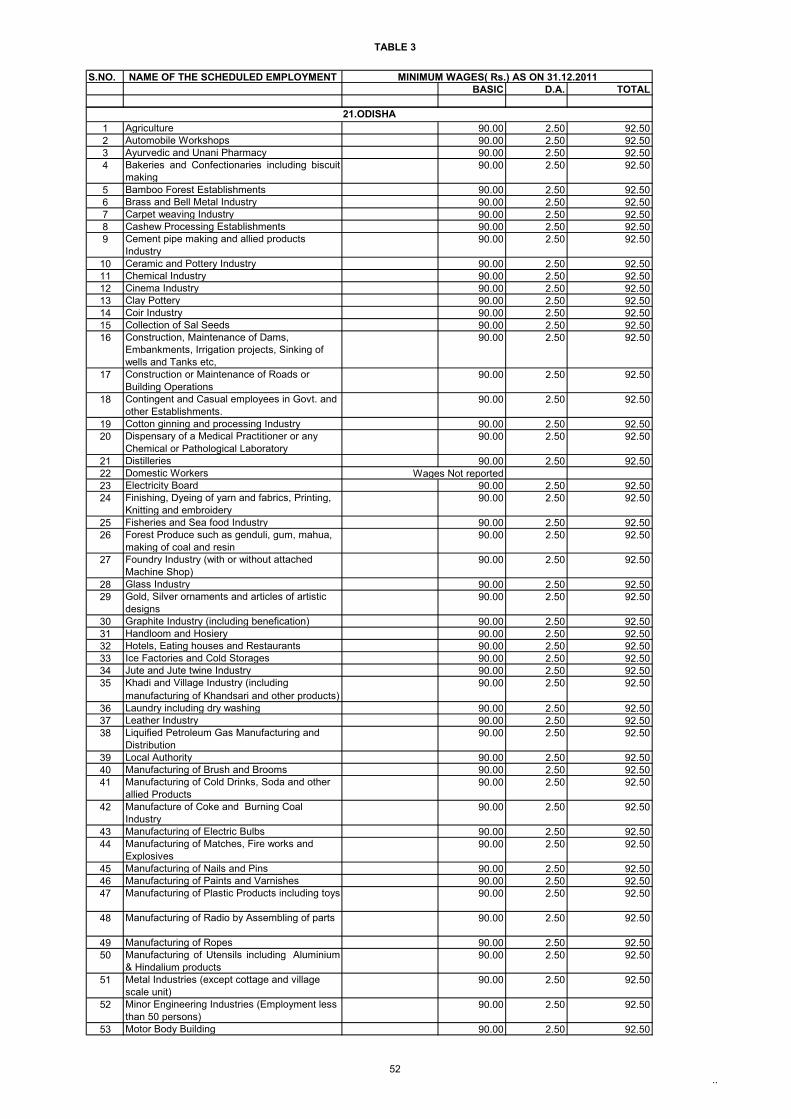
TABLE 3
52..
S.NO. NAME OF THE SCHEDULED EMPLOYMENTBASIC D.A. TOTAL
MINIMUM WAGES( Rs.) AS ON 31.12.2011
1 Agriculture 90.00 2.50 92.502 Automobile Workshops 90.00 2.50 92.503 Ayurvedic and Unani Pharmacy 90.00 2.50 92.504 Bakeries and Confectionaries including biscuit
making 90.00 2.50 92.50
5 Bamboo Forest Establishments 90.00 2.50 92.506 Brass and Bell Metal Industry 90.00 2.50 92.507 Carpet weaving Industry 90.00 2.50 92.508 Cashew Processing Establishments 90.00 2.50 92.509 Cement pipe making and allied products
Industry90.00 2.50 92.50
10 Ceramic and Pottery Industry 90.00 2.50 92.5011 Chemical Industry 90.00 2.50 92.5012 Cinema Industry 90.00 2.50 92.5013 Clay Pottery 90.00 2.50 92.5014 Coir Industry 90.00 2.50 92.5015 Collection of Sal Seeds 90.00 2.50 92.5016 Construction, Maintenance of Dams,
Embankments, Irrigation projects, Sinking of wells and Tanks etc,
90.00 2.50 92.50
17 Construction or Maintenance of Roads or Building Operations
90.00 2.50 92.50
18 Contingent and Casual employees in Govt. and other Establishments.
90.00 2.50 92.50
19 Cotton ginning and processing Industry 90.00 2.50 92.5020 Dispensary of a Medical Practitioner or any
Chemical or Pathological Laboratory90.00 2.50 92.50
21 Distilleries 90.00 2.50 92.5022 Domestic Workers Wages Not reported23 Electricity Board 90.00 2.50 92.5024 Finishing, Dyeing of yarn and fabrics, Printing,
Knitting and embroidery90.00 2.50 92.50
25 Fisheries and Sea food Industry 90.00 2.50 92.5026 Forest Produce such as genduli, gum, mahua,
making of coal and resin90.00 2.50 92.50
27 Foundry Industry (with or without attached Machine Shop)
90.00 2.50 92.50
28 Glass Industry 90.00 2.50 92.5029 Gold, Silver ornaments and articles of artistic
designs 90.00 2.50 92.50
30 Graphite Industry (including benefication) 90.00 2.50 92.5031 Handloom and Hosiery 90.00 2.50 92.5032 Hotels, Eating houses and Restaurants 90.00 2.50 92.5033 Ice Factories and Cold Storages 90.00 2.50 92.5034 Jute and Jute twine Industry 90.00 2.50 92.5035 Khadi and Village Industry (including
manufacturing of Khandsari and other products)90.00 2.50 92.50
36 Laundry including dry washing 90.00 2.50 92.5037 Leather Industry 90.00 2.50 92.5038 Liquified Petroleum Gas Manufacturing and
Distribution90.00 2.50 92.50
39 Local Authority 90.00 2.50 92.5040 Manufacturing of Brush and Brooms 90.00 2.50 92.5041 Manufacturing of Cold Drinks, Soda and other
allied Products90.00 2.50 92.50
42 Manufacture of Coke and Burning Coal Industry
90.00 2.50 92.50
43 Manufacturing of Electric Bulbs 90.00 2.50 92.5044 Manufacturing of Matches, Fire works and
Explosives90.00 2.50 92.50
45 Manufacturing of Nails and Pins 90.00 2.50 92.5046 Manufacturing of Paints and Varnishes 90.00 2.50 92.5047 Manufacturing of Plastic Products including toys 90.00 2.50 92.50
48 Manufacturing of Radio by Assembling of parts 90.00 2.50 92.50
49 Manufacturing of Ropes 90.00 2.50 92.5050 Manufacturing of Utensils including Aluminium
& Hindalium products90.00 2.50 92.50
51 Metal Industries (except cottage and village scale unit)
90.00 2.50 92.50
52 Minor Engineering Industries (Employment less than 50 persons)
90.00 2.50 92.50
53 Motor Body Building 90.00 2.50 92.50
21.ODISHA
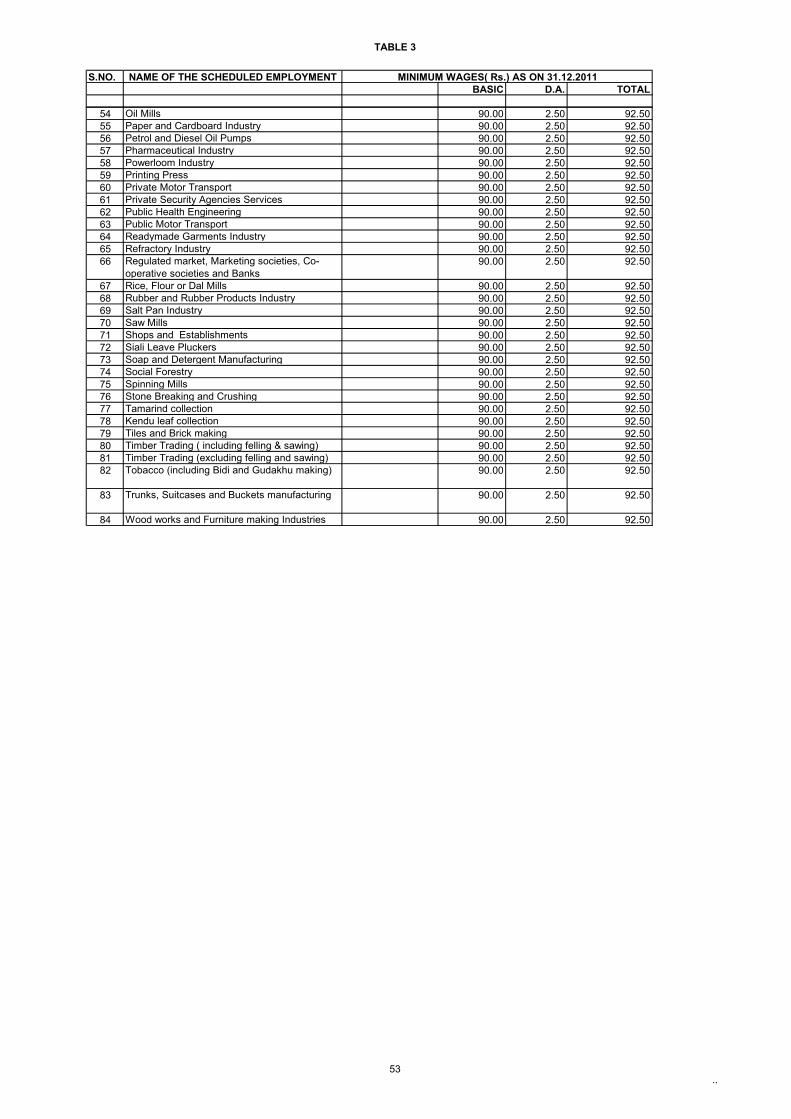
TABLE 3
53..
S.NO. NAME OF THE SCHEDULED EMPLOYMENTBASIC D.A. TOTAL
MINIMUM WAGES( Rs.) AS ON 31.12.2011
54 Oil Mills 90.00 2.50 92.5055 Paper and Cardboard Industry 90.00 2.50 92.5056 Petrol and Diesel Oil Pumps 90.00 2.50 92.5057 Pharmaceutical Industry 90.00 2.50 92.5058 Powerloom Industry 90.00 2.50 92.5059 Printing Press 90.00 2.50 92.5060 Private Motor Transport 90.00 2.50 92.5061 Private Security Agencies Services 90.00 2.50 92.5062 Public Health Engineering 90.00 2.50 92.5063 Public Motor Transport 90.00 2.50 92.5064 Readymade Garments Industry 90.00 2.50 92.5065 Refractory Industry 90.00 2.50 92.5066 Regulated market, Marketing societies, Co-
operative societies and Banks90.00 2.50 92.50
67 Rice, Flour or Dal Mills 90.00 2.50 92.5068 Rubber and Rubber Products Industry 90.00 2.50 92.5069 Salt Pan Industry 90.00 2.50 92.5070 Saw Mills 90.00 2.50 92.5071 Shops and Establishments 90.00 2.50 92.5072 Siali Leave Pluckers 90.00 2.50 92.5073 Soap and Detergent Manufacturing 90.00 2.50 92.5074 Social Forestry 90.00 2.50 92.5075 Spinning Mills 90.00 2.50 92.5076 Stone Breaking and Crushing 90.00 2.50 92.5077 Tamarind collection 90.00 2.50 92.5078 Kendu leaf collection 90.00 2.50 92.5079 Tiles and Brick making 90.00 2.50 92.5080 Timber Trading ( including felling & sawing) 90.00 2.50 92.5081 Timber Trading (excluding felling and sawing) 90.00 2.50 92.5082 Tobacco (including Bidi and Gudakhu making) 90.00 2.50 92.50
83 Trunks, Suitcases and Buckets manufacturing 90.00 2.50 92.50
84 Wood works and Furniture making Industries 90.00 2.50 92.50
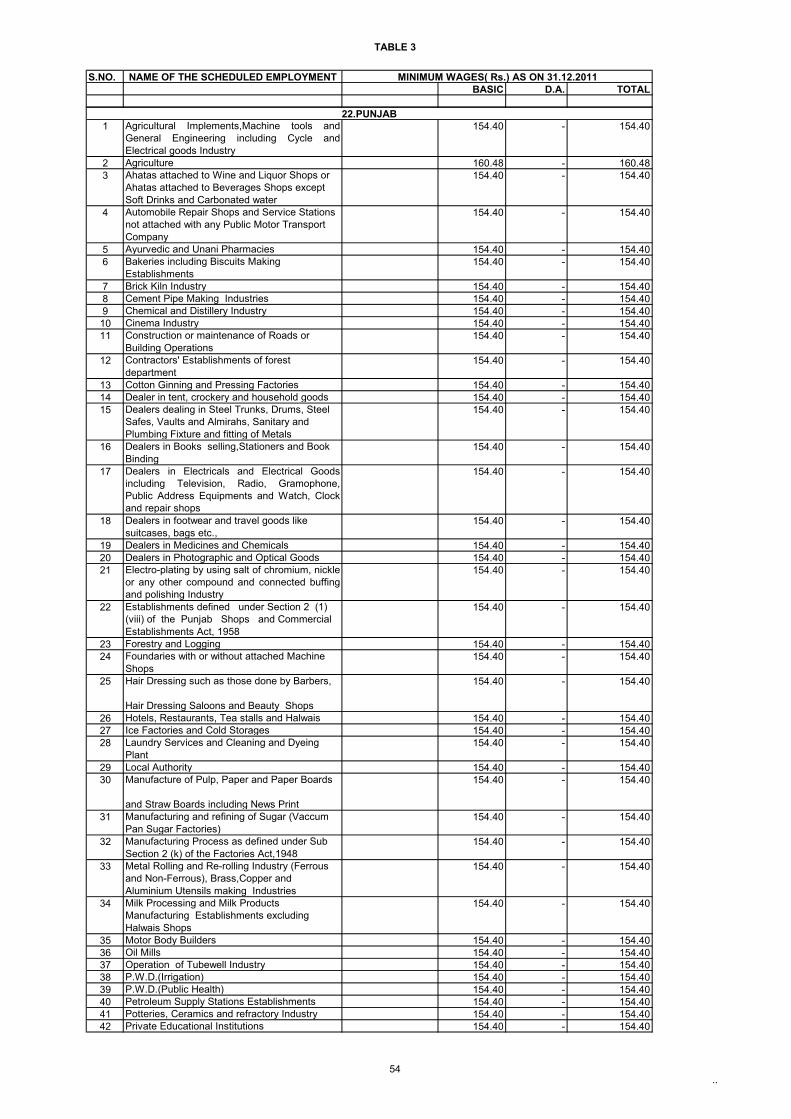
TABLE 3
54..
S.NO. NAME OF THE SCHEDULED EMPLOYMENTBASIC D.A. TOTAL
MINIMUM WAGES( Rs.) AS ON 31.12.2011
1 Agricultural Implements,Machine tools andGeneral Engineering including Cycle andElectrical goods Industry
154.40 - 154.40
2 Agriculture 160.48 - 160.483 Ahatas attached to Wine and Liquor Shops or
Ahatas attached to Beverages Shops except Soft Drinks and Carbonated water
154.40 - 154.40
4 Automobile Repair Shops and Service Stations not attached with any Public Motor Transport Company
154.40 - 154.40
5 Ayurvedic and Unani Pharmacies 154.40 - 154.406 Bakeries including Biscuits Making
Establishments154.40 - 154.40
7 Brick Kiln Industry 154.40 - 154.408 Cement Pipe Making Industries 154.40 - 154.409 Chemical and Distillery Industry 154.40 - 154.4010 Cinema Industry 154.40 - 154.4011 Construction or maintenance of Roads or
Building Operations 154.40 - 154.40
12 Contractors' Establishments of forest department
154.40 - 154.40
13 Cotton Ginning and Pressing Factories 154.40 - 154.4014 Dealer in tent, crockery and household goods 154.40 - 154.4015 Dealers dealing in Steel Trunks, Drums, Steel
Safes, Vaults and Almirahs, Sanitary and Plumbing Fixture and fitting of Metals
154.40 - 154.40
16 Dealers in Books selling,Stationers and Book Binding
154.40 - 154.40
17 Dealers in Electricals and Electrical Goodsincluding Television, Radio, Gramophone,Public Address Equipments and Watch, Clockand repair shops
154.40 - 154.40
18 Dealers in footwear and travel goods like suitcases, bags etc.,
154.40 - 154.40
19 Dealers in Medicines and Chemicals 154.40 - 154.4020 Dealers in Photographic and Optical Goods 154.40 - 154.4021 Electro-plating by using salt of chromium, nickle
or any other compound and connected buffingand polishing Industry
154.40 - 154.40
22 Establishments defined under Section 2 (1) (viii) of the Punjab Shops and Commercial Establishments Act, 1958
154.40 - 154.40
23 Forestry and Logging 154.40 - 154.4024 Foundaries with or without attached Machine
Shops154.40 - 154.40
25 Hair Dressing such as those done by Barbers,
Hair Dressing Saloons and Beauty Shops
154.40 - 154.40
26 Hotels, Restaurants, Tea stalls and Halwais 154.40 - 154.4027 Ice Factories and Cold Storages 154.40 - 154.4028 Laundry Services and Cleaning and Dyeing
Plant154.40 - 154.40
29 Local Authority 154.40 - 154.4030 Manufacture of Pulp, Paper and Paper Boards
and Straw Boards including News Print
154.40 - 154.40
31 Manufacturing and refining of Sugar (Vaccum Pan Sugar Factories)
154.40 - 154.40
32 Manufacturing Process as defined under Sub Section 2 (k) of the Factories Act,1948
154.40 - 154.40
33 Metal Rolling and Re-rolling Industry (Ferrous and Non-Ferrous), Brass,Copper and Aluminium Utensils making Industries
154.40 - 154.40
34 Milk Processing and Milk Products Manufacturing Establishments excluding Halwais Shops
154.40 - 154.40
35 Motor Body Builders 154.40 - 154.4036 Oil Mills 154.40 - 154.4037 Operation of Tubewell Industry 154.40 - 154.4038 P.W.D.(Irrigation) 154.40 - 154.4039 P.W.D.(Public Health) 154.40 - 154.4040 Petroleum Supply Stations Establishments 154.40 - 154.4041 Potteries, Ceramics and refractory Industry 154.40 - 154.4042 Private Educational Institutions 154.40 - 154.40
22.PUNJAB
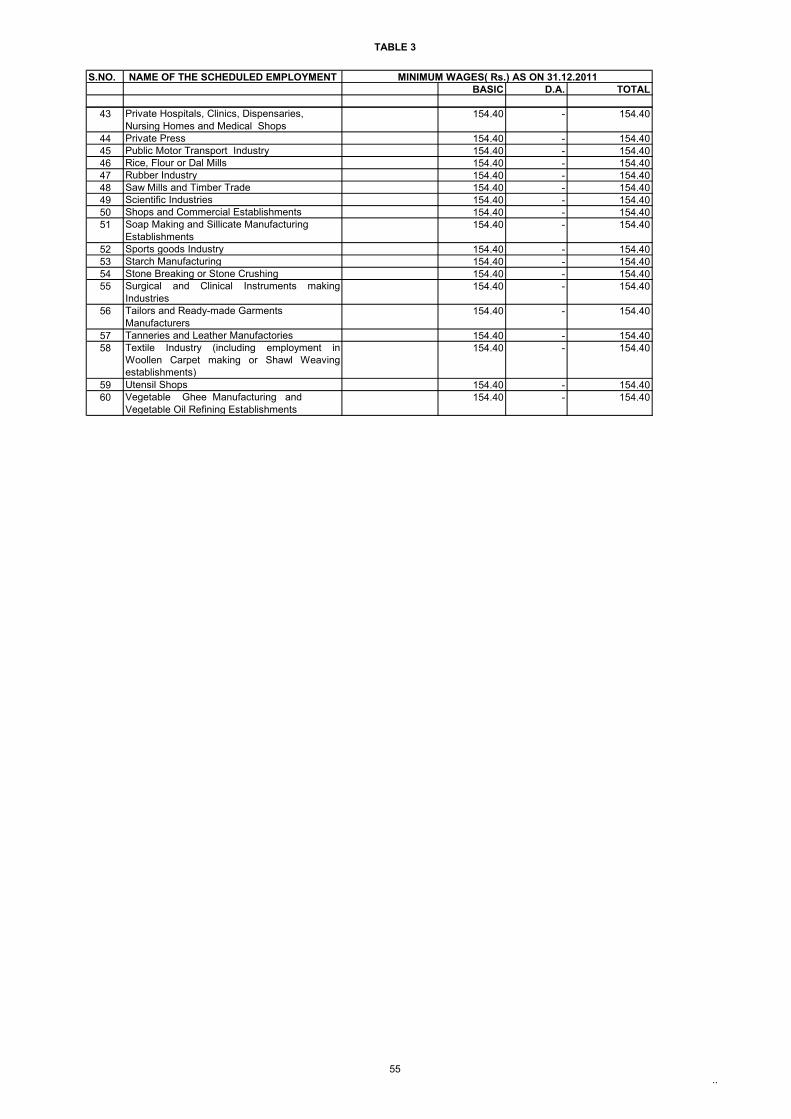
TABLE 3
55..
S.NO. NAME OF THE SCHEDULED EMPLOYMENTBASIC D.A. TOTAL
MINIMUM WAGES( Rs.) AS ON 31.12.2011
43 Private Hospitals, Clinics, Dispensaries, Nursing Homes and Medical Shops
154.40 - 154.40
44 Private Press 154.40 - 154.4045 Public Motor Transport Industry 154.40 - 154.4046 Rice, Flour or Dal Mills 154.40 - 154.4047 Rubber Industry 154.40 - 154.4048 Saw Mills and Timber Trade 154.40 - 154.4049 Scientific Industries 154.40 - 154.4050 Shops and Commercial Establishments 154.40 - 154.4051 Soap Making and Sillicate Manufacturing
Establishments154.40 - 154.40
52 Sports goods Industry 154.40 - 154.4053 Starch Manufacturing 154.40 - 154.4054 Stone Breaking or Stone Crushing 154.40 - 154.4055 Surgical and Clinical Instruments making
Industries154.40 - 154.40
56 Tailors and Ready-made Garments Manufacturers
154.40 - 154.40
57 Tanneries and Leather Manufactories 154.40 - 154.4058 Textile Industry (including employment in
Woollen Carpet making or Shawl Weavingestablishments)
154.40 - 154.40
59 Utensil Shops 154.40 - 154.4060 Vegetable Ghee Manufacturing and
Vegetable Oil Refining Establishments154.40 - 154.40
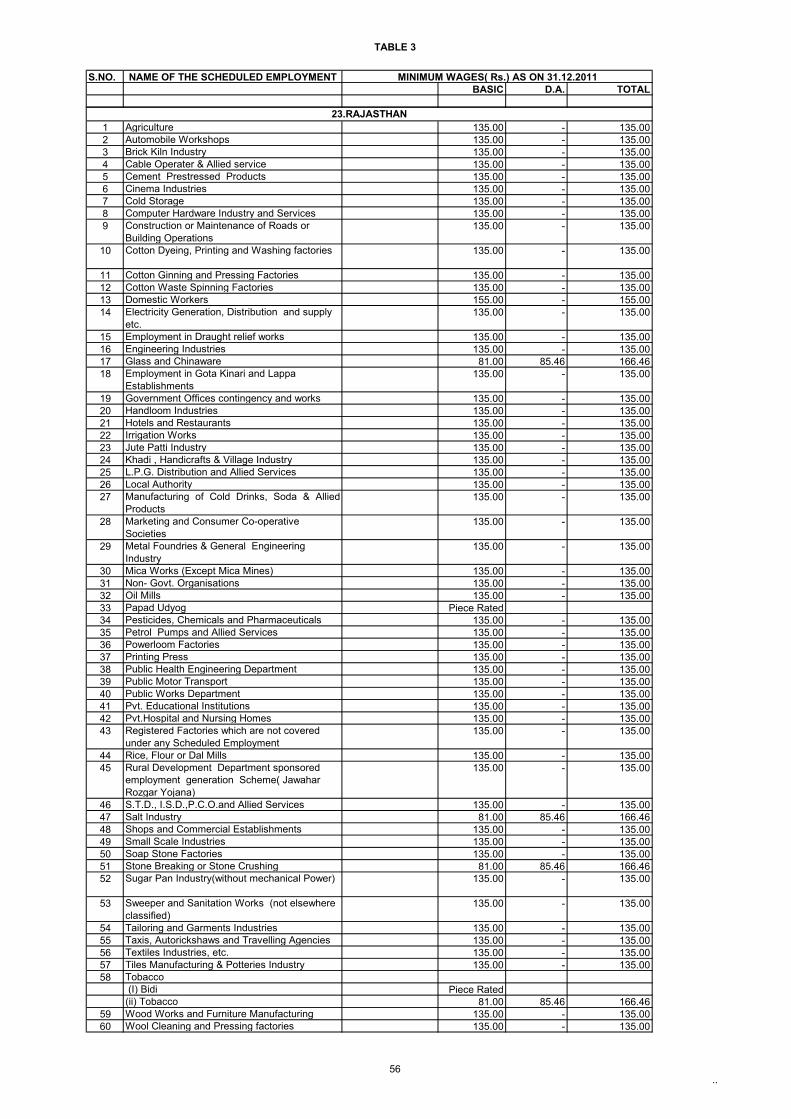
TABLE 3
56..
S.NO. NAME OF THE SCHEDULED EMPLOYMENTBASIC D.A. TOTAL
MINIMUM WAGES( Rs.) AS ON 31.12.2011
1 Agriculture 135.00 - 135.002 Automobile Workshops 135.00 - 135.003 Brick Kiln Industry 135.00 - 135.004 Cable Operater & Allied service 135.00 - 135.005 Cement Prestressed Products 135.00 - 135.006 Cinema Industries 135.00 - 135.007 Cold Storage 135.00 - 135.008 Computer Hardware Industry and Services 135.00 - 135.009 Construction or Maintenance of Roads or
Building Operations135.00 - 135.00
10 Cotton Dyeing, Printing and Washing factories 135.00 - 135.00
11 Cotton Ginning and Pressing Factories 135.00 - 135.0012 Cotton Waste Spinning Factories 135.00 - 135.0013 Domestic Workers 155.00 - 155.0014 Electricity Generation, Distribution and supply
etc. 135.00 - 135.00
15 Employment in Draught relief works 135.00 - 135.0016 Engineering Industries 135.00 - 135.0017 Glass and Chinaware 81.00 85.46 166.4618 Employment in Gota Kinari and Lappa
Establishments135.00 - 135.00
19 Government Offices contingency and works 135.00 - 135.0020 Handloom Industries 135.00 - 135.0021 Hotels and Restaurants 135.00 - 135.0022 Irrigation Works 135.00 - 135.0023 Jute Patti Industry 135.00 - 135.0024 Khadi , Handicrafts & Village Industry 135.00 - 135.0025 L.P.G. Distribution and Allied Services 135.00 - 135.0026 Local Authority 135.00 - 135.0027 Manufacturing of Cold Drinks, Soda & Allied
Products 135.00 - 135.00
28 Marketing and Consumer Co-operative Societies
135.00 - 135.00
29 Metal Foundries & General Engineering Industry
135.00 - 135.00
30 Mica Works (Except Mica Mines) 135.00 - 135.0031 Non- Govt. Organisations 135.00 - 135.0032 Oil Mills 135.00 - 135.0033 Papad Udyog Piece Rated34 Pesticides, Chemicals and Pharmaceuticals 135.00 - 135.0035 Petrol Pumps and Allied Services 135.00 - 135.0036 Powerloom Factories 135.00 - 135.0037 Printing Press 135.00 - 135.0038 Public Health Engineering Department 135.00 - 135.0039 Public Motor Transport 135.00 - 135.0040 Public Works Department 135.00 - 135.0041 Pvt. Educational Institutions 135.00 - 135.0042 Pvt.Hospital and Nursing Homes 135.00 - 135.0043 Registered Factories which are not covered
under any Scheduled Employment135.00 - 135.00
44 Rice, Flour or Dal Mills 135.00 - 135.0045 Rural Development Department sponsored
employment generation Scheme( Jawahar Rozgar Yojana)
135.00 - 135.00
46 S.T.D., I.S.D.,P.C.O.and Allied Services 135.00 - 135.0047 Salt Industry 81.00 85.46 166.4648 Shops and Commercial Establishments 135.00 - 135.0049 Small Scale Industries 135.00 - 135.0050 Soap Stone Factories 135.00 - 135.0051 Stone Breaking or Stone Crushing 81.00 85.46 166.4652 Sugar Pan Industry(without mechanical Power) 135.00 - 135.00
53 Sweeper and Sanitation Works (not elsewhere classified)
135.00 - 135.00
54 Tailoring and Garments Industries 135.00 - 135.0055 Taxis, Autorickshaws and Travelling Agencies 135.00 - 135.0056 Textiles Industries, etc. 135.00 - 135.0057 Tiles Manufacturing & Potteries Industry 135.00 - 135.0058 Tobacco
(I) Bidi Piece Rated(ii) Tobacco 81.00 85.46 166.46
59 Wood Works and Furniture Manufacturing 135.00 - 135.0060 Wool Cleaning and Pressing factories 135.00 - 135.00
23.RAJASTHAN
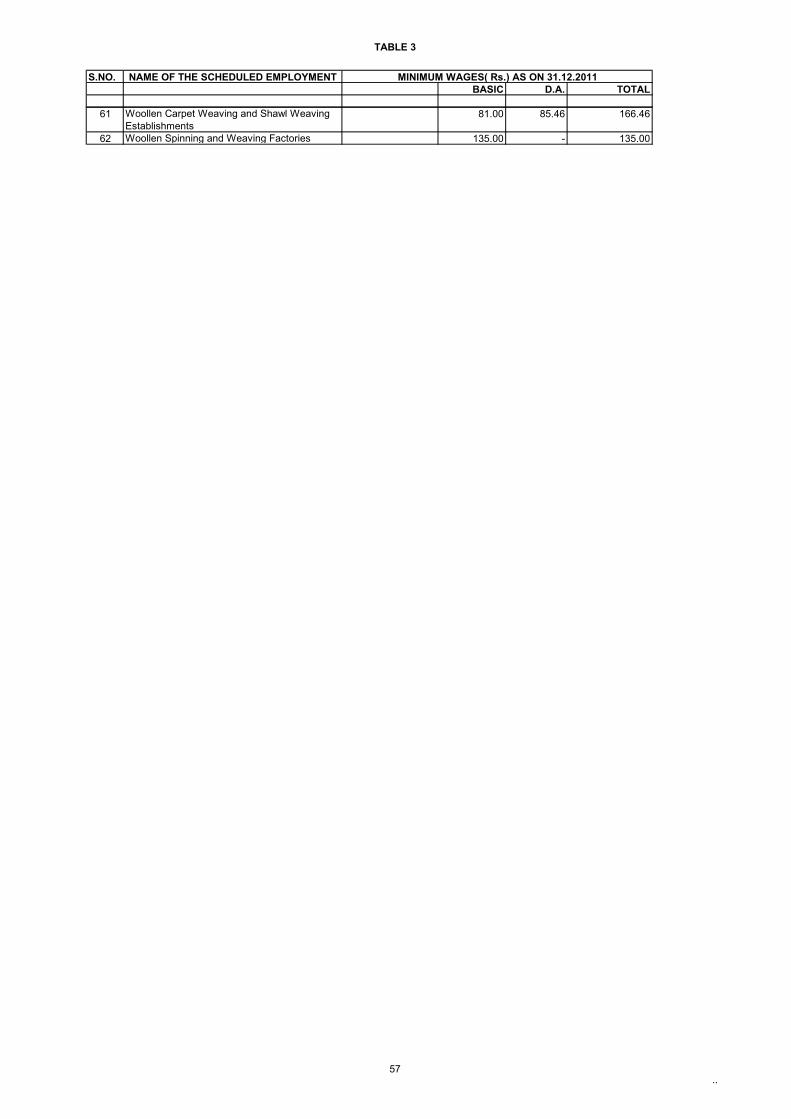
TABLE 3
57..
S.NO. NAME OF THE SCHEDULED EMPLOYMENTBASIC D.A. TOTAL
MINIMUM WAGES( Rs.) AS ON 31.12.2011
61 Woollen Carpet Weaving and Shawl Weaving Establishments
81.00 85.46 166.46
62 Woollen Spinning and Weaving Factories 135.00 - 135.00
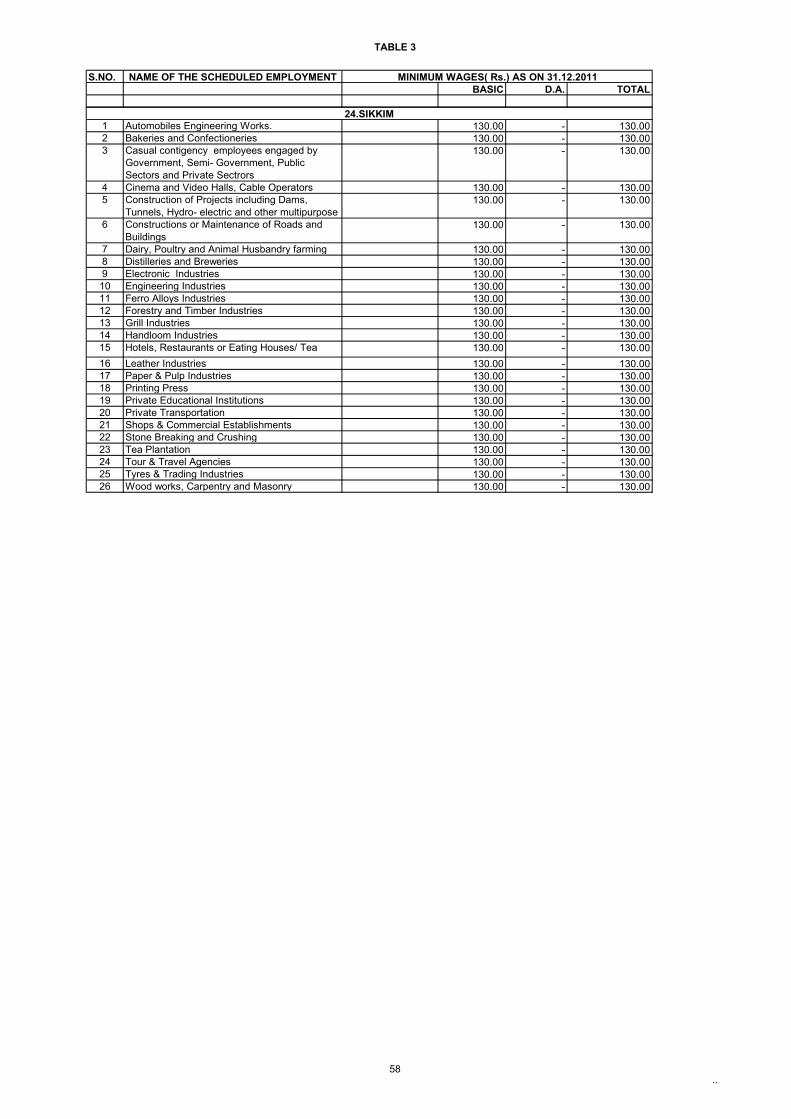
TABLE 3
58..
S.NO. NAME OF THE SCHEDULED EMPLOYMENTBASIC D.A. TOTAL
MINIMUM WAGES( Rs.) AS ON 31.12.2011
1 Automobiles Engineering Works. 130.00 - 130.002 Bakeries and Confectioneries 130.00 - 130.003 Casual contigency employees engaged by
Government, Semi- Government, Public Sectors and Private Sectrors
130.00 - 130.00
4 Cinema and Video Halls, Cable Operators 130.00 - 130.005 Construction of Projects including Dams,
Tunnels, Hydro- electric and other multipurpose130.00 - 130.00
6 Constructions or Maintenance of Roads and Buildings
130.00 - 130.00
7 Dairy, Poultry and Animal Husbandry farming 130.00 - 130.008 Distilleries and Breweries 130.00 - 130.009 Electronic Industries 130.00 - 130.0010 Engineering Industries 130.00 - 130.0011 Ferro Alloys Industries 130.00 - 130.0012 Forestry and Timber Industries 130.00 - 130.0013 Grill Industries 130.00 - 130.0014 Handloom Industries 130.00 - 130.0015 Hotels, Restaurants or Eating Houses/ Tea
Sh130.00 - 130.00
16 Leather Industries 130.00 - 130.0017 Paper & Pulp Industries 130.00 - 130.0018 Printing Press 130.00 - 130.0019 Private Educational Institutions 130.00 - 130.0020 Private Transportation 130.00 - 130.0021 Shops & Commercial Establishments 130.00 - 130.0022 Stone Breaking and Crushing 130.00 - 130.0023 Tea Plantation 130.00 - 130.0024 Tour & Travel Agencies 130.00 - 130.0025 Tyres & Trading Industries 130.00 - 130.0026 Wood works, Carpentry and Masonry 130.00 - 130.00
24.SIKKIM
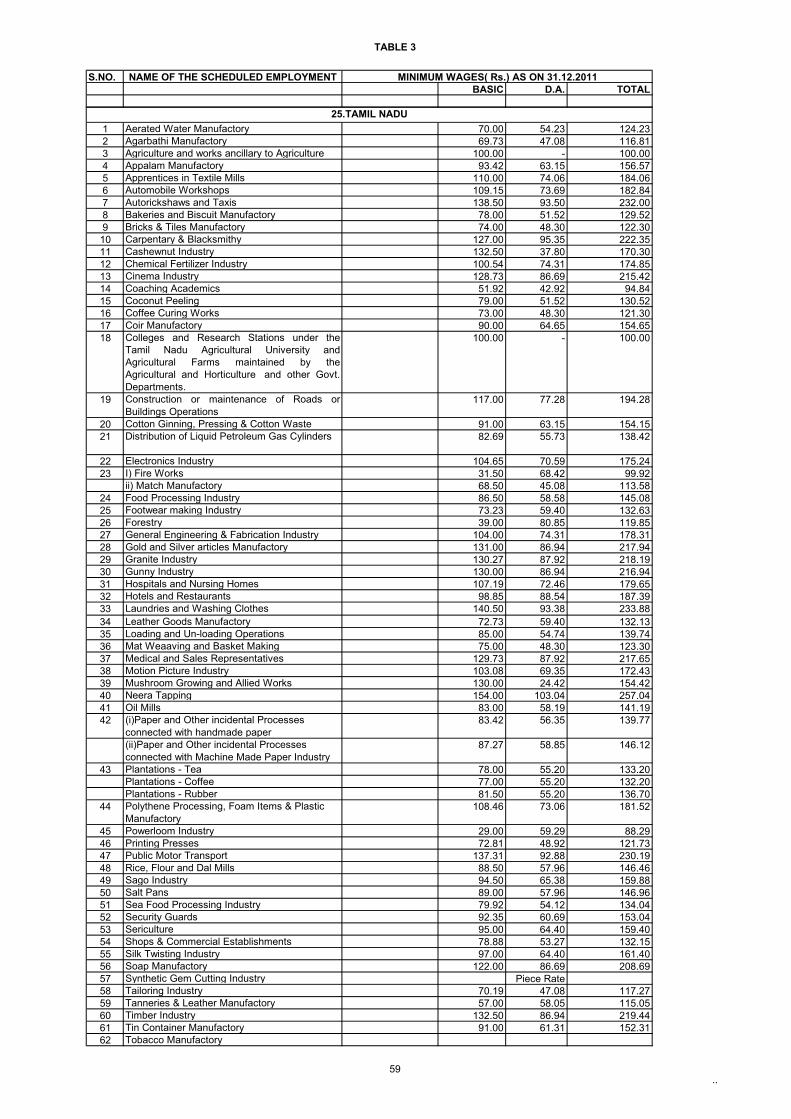
TABLE 3
59..
S.NO. NAME OF THE SCHEDULED EMPLOYMENTBASIC D.A. TOTAL
MINIMUM WAGES( Rs.) AS ON 31.12.2011
1 Aerated Water Manufactory 70.00 54.23 124.232 Agarbathi Manufactory 69.73 47.08 116.813 Agriculture and works ancillary to Agriculture 100.00 - 100.004 Appalam Manufactory 93.42 63.15 156.575 Apprentices in Textile Mills 110.00 74.06 184.066 Automobile Workshops 109.15 73.69 182.847 Autorickshaws and Taxis 138.50 93.50 232.008 Bakeries and Biscuit Manufactory 78.00 51.52 129.529 Bricks & Tiles Manufactory 74.00 48.30 122.3010 Carpentary & Blacksmithy 127.00 95.35 222.3511 Cashewnut Industry 132.50 37.80 170.3012 Chemical Fertilizer Industry 100.54 74.31 174.8513 Cinema Industry 128.73 86.69 215.4214 Coaching Academics 51.92 42.92 94.8415 Coconut Peeling 79.00 51.52 130.5216 Coffee Curing Works 73.00 48.30 121.3017 Coir Manufactory 90.00 64.65 154.6518 Colleges and Research Stations under the
Tamil Nadu Agricultural University andAgricultural Farms maintained by theAgricultural and Horticulture and other Govt.Departments.
100.00 - 100.00
19 Construction or maintenance of Roads orBuildings Operations
117.00 77.28 194.28
20 Cotton Ginning, Pressing & Cotton Waste 91.00 63.15 154.1521 Distribution of Liquid Petroleum Gas Cylinders 82.69 55.73 138.42
22 Electronics Industry 104.65 70.59 175.2423 I) Fire Works 31.50 68.42 99.92
ii) Match Manufactory 68.50 45.08 113.5824 Food Processing Industry 86.50 58.58 145.0825 Footwear making Industry 73.23 59.40 132.6326 Forestry 39.00 80.85 119.8527 General Engineering & Fabrication Industry 104.00 74.31 178.3128 Gold and Silver articles Manufactory 131.00 86.94 217.9429 Granite Industry 130.27 87.92 218.1930 Gunny Industry 130.00 86.94 216.9431 Hospitals and Nursing Homes 107.19 72.46 179.6532 Hotels and Restaurants 98.85 88.54 187.3933 Laundries and Washing Clothes 140.50 93.38 233.8834 Leather Goods Manufactory 72.73 59.40 132.1335 Loading and Un-loading Operations 85.00 54.74 139.7436 Mat Weaaving and Basket Making 75.00 48.30 123.3037 Medical and Sales Representatives 129.73 87.92 217.6538 Motion Picture Industry 103.08 69.35 172.4339 Mushroom Growing and Allied Works 130.00 24.42 154.4240 Neera Tapping 154.00 103.04 257.0441 Oil Mills 83.00 58.19 141.1942 (i)Paper and Other incidental Processes
connected with handmade paper83.42 56.35 139.77
(ii)Paper and Other incidental Processes connected with Machine Made Paper Industry
87.27 58.85 146.12
43 Plantations - Tea 78.00 55.20 133.20Plantations - Coffee 77.00 55.20 132.20Plantations - Rubber 81.50 55.20 136.70
44 Polythene Processing, Foam Items & Plastic Manufactory
108.46 73.06 181.52
45 Powerloom Industry 29.00 59.29 88.2946 Printing Presses 72.81 48.92 121.7347 Public Motor Transport 137.31 92.88 230.1948 Rice, Flour and Dal Mills 88.50 57.96 146.4649 Sago Industry 94.50 65.38 159.8850 Salt Pans 89.00 57.96 146.9651 Sea Food Processing Industry 79.92 54.12 134.0452 Security Guards 92.35 60.69 153.0453 Sericulture 95.00 64.40 159.4054 Shops & Commercial Establishments 78.88 53.27 132.1555 Silk Twisting Industry 97.00 64.40 161.4056 Soap Manufactory 122.00 86.69 208.6957 Synthetic Gem Cutting Industry Piece Rate58 Tailoring Industry 70.19 47.08 117.2759 Tanneries & Leather Manufactory 57.00 58.05 115.0560 Timber Industry 132.50 86.94 219.4461 Tin Container Manufactory 91.00 61.31 152.3162 Tobacco Manufactory
25.TAMIL NADU
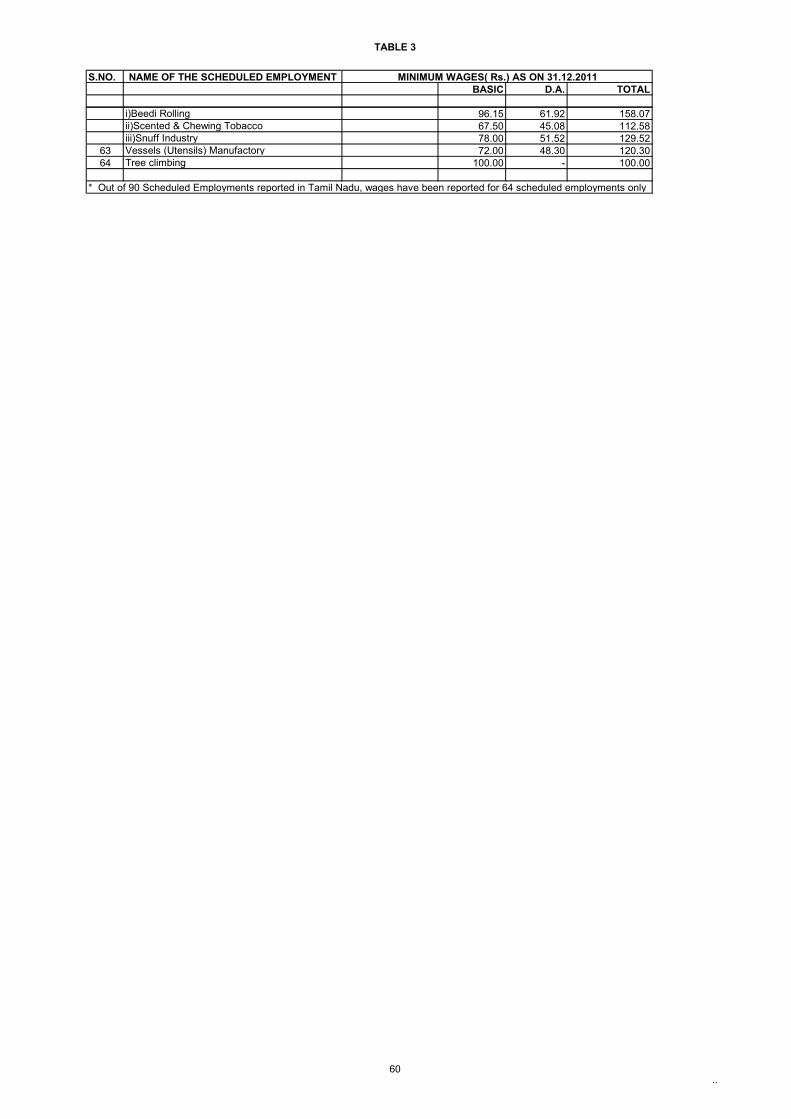
TABLE 3
60..
S.NO. NAME OF THE SCHEDULED EMPLOYMENTBASIC D.A. TOTAL
MINIMUM WAGES( Rs.) AS ON 31.12.2011
i)Beedi Rolling 96.15 61.92 158.07ii)Scented & Chewing Tobacco 67.50 45.08 112.58iii)Snuff Industry 78.00 51.52 129.52
63 Vessels (Utensils) Manufactory 72.00 48.30 120.3064 Tree climbing 100.00 - 100.00
* Out of 90 Scheduled Employments reported in Tamil Nadu, wages have been reported for 64 scheduled employments only
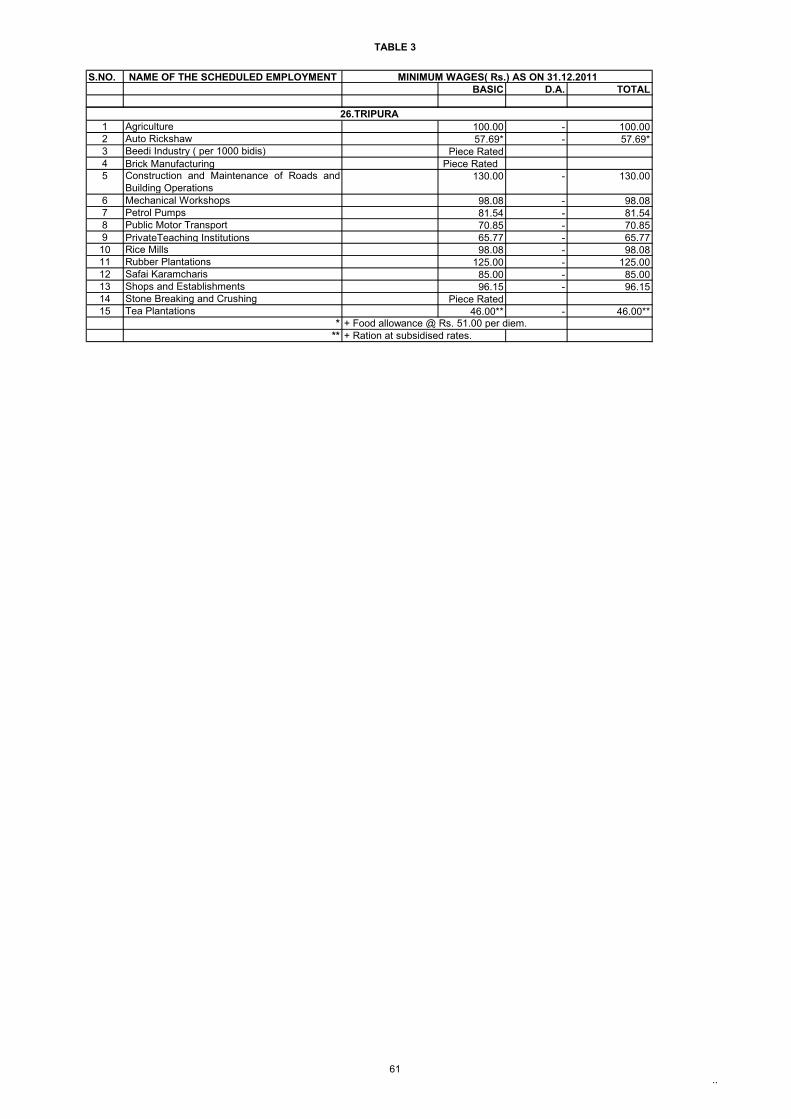
TABLE 3
61..
S.NO. NAME OF THE SCHEDULED EMPLOYMENTBASIC D.A. TOTAL
MINIMUM WAGES( Rs.) AS ON 31.12.2011
1 Agriculture 100.00 - 100.002 Auto Rickshaw 57.69* - 57.69*3 Beedi Industry ( per 1000 bidis) Piece Rated4 Brick Manufacturing Piece Rated 5 Construction and Maintenance of Roads and
Building Operations130.00 - 130.00
6 Mechanical Workshops 98.08 - 98.087 Petrol Pumps 81.54 - 81.548 Public Motor Transport 70.85 - 70.859 PrivateTeaching Institutions 65.77 - 65.7710 Rice Mills 98.08 - 98.0811 Rubber Plantations 125.00 - 125.0012 Safai Karamcharis 85.00 - 85.0013 Shops and Establishments 96.15 - 96.1514 Stone Breaking and Crushing Piece Rated15 Tea Plantations 46.00** - 46.00**
* + Food allowance @ Rs. 51.00 per diem.** + Ration at subsidised rates.
26.TRIPURA
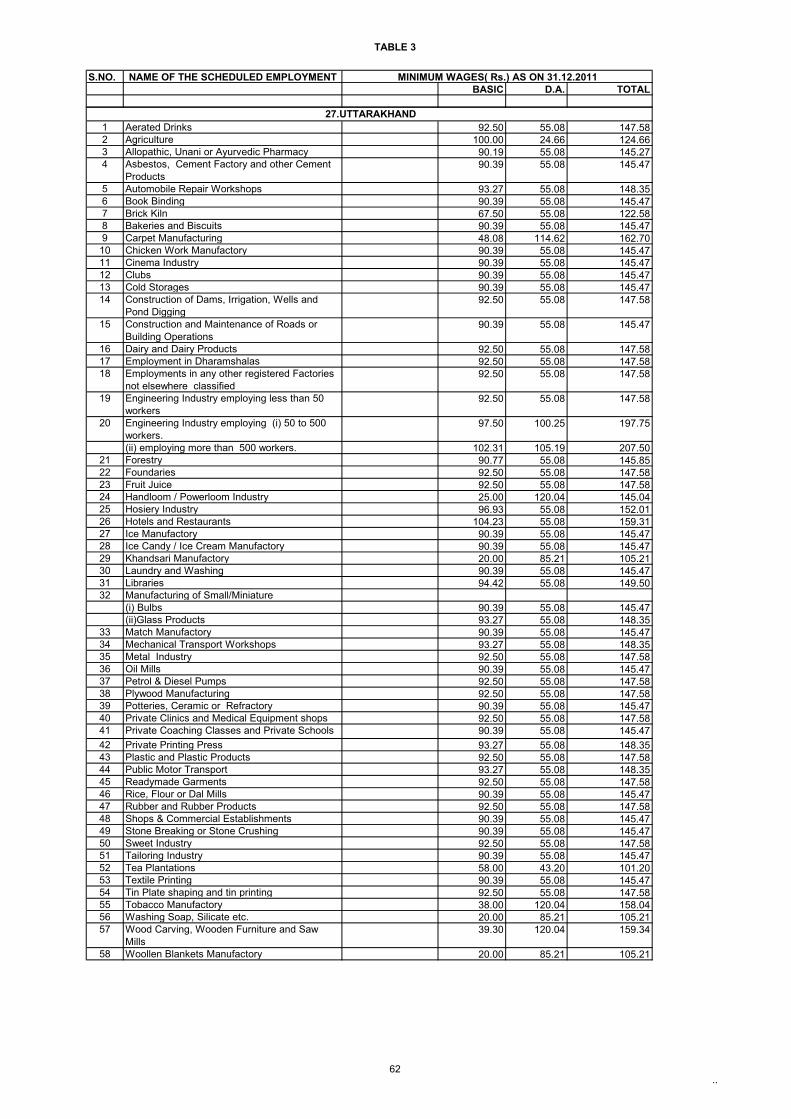
TABLE 3
62..
S.NO. NAME OF THE SCHEDULED EMPLOYMENTBASIC D.A. TOTAL
MINIMUM WAGES( Rs.) AS ON 31.12.2011
1 Aerated Drinks 92.50 55.08 147.582 Agriculture 100.00 24.66 124.663 Allopathic, Unani or Ayurvedic Pharmacy 90.19 55.08 145.274 Asbestos, Cement Factory and other Cement
Products90.39 55.08 145.47
5 Automobile Repair Workshops 93.27 55.08 148.356 Book Binding 90.39 55.08 145.477 Brick Kiln 67.50 55.08 122.588 Bakeries and Biscuits 90.39 55.08 145.479 Carpet Manufacturing 48.08 114.62 162.7010 Chicken Work Manufactory 90.39 55.08 145.4711 Cinema Industry 90.39 55.08 145.4712 Clubs 90.39 55.08 145.4713 Cold Storages 90.39 55.08 145.4714 Construction of Dams, Irrigation, Wells and
Pond Digging92.50 55.08 147.58
15 Construction and Maintenance of Roads or Building Operations
90.39 55.08 145.47
16 Dairy and Dairy Products 92.50 55.08 147.5817 Employment in Dharamshalas 92.50 55.08 147.5818 Employments in any other registered Factories
not elsewhere classified92.50 55.08 147.58
19 Engineering Industry employing less than 50 workers
92.50 55.08 147.58
20 Engineering Industry employing (i) 50 to 500 workers.
97.50 100.25 197.75
(ii) employing more than 500 workers. 102.31 105.19 207.5021 Forestry 90.77 55.08 145.8522 Foundaries 92.50 55.08 147.5823 Fruit Juice 92.50 55.08 147.5824 Handloom / Powerloom Industry 25.00 120.04 145.0425 Hosiery Industry 96.93 55.08 152.0126 Hotels and Restaurants 104.23 55.08 159.3127 Ice Manufactory 90.39 55.08 145.4728 Ice Candy / Ice Cream Manufactory 90.39 55.08 145.4729 Khandsari Manufactory 20.00 85.21 105.2130 Laundry and Washing 90.39 55.08 145.4731 Libraries 94.42 55.08 149.5032 Manufacturing of Small/Miniature
(i) Bulbs 90.39 55.08 145.47(ii)Glass Products 93.27 55.08 148.35
33 Match Manufactory 90.39 55.08 145.4734 Mechanical Transport Workshops 93.27 55.08 148.3535 Metal Industry 92.50 55.08 147.5836 Oil Mills 90.39 55.08 145.4737 Petrol & Diesel Pumps 92.50 55.08 147.5838 Plywood Manufacturing 92.50 55.08 147.5839 Potteries, Ceramic or Refractory 90.39 55.08 145.4740 Private Clinics and Medical Equipment shops 92.50 55.08 147.5841 Private Coaching Classes and Private Schools 90.39 55.08 145.4742 Private Printing Press 93.27 55.08 148.3543 Plastic and Plastic Products 92.50 55.08 147.5844 Public Motor Transport 93.27 55.08 148.3545 Readymade Garments 92.50 55.08 147.5846 Rice, Flour or Dal Mills 90.39 55.08 145.4747 Rubber and Rubber Products 92.50 55.08 147.5848 Shops & Commercial Establishments 90.39 55.08 145.4749 Stone Breaking or Stone Crushing 90.39 55.08 145.4750 Sweet Industry 92.50 55.08 147.5851 Tailoring Industry 90.39 55.08 145.4752 Tea Plantations 58.00 43.20 101.2053 Textile Printing 90.39 55.08 145.4754 Tin Plate shaping and tin printing 92.50 55.08 147.5855 Tobacco Manufactory 38.00 120.04 158.0456 Washing Soap, Silicate etc. 20.00 85.21 105.2157 Wood Carving, Wooden Furniture and Saw
Mills 39.30 120.04 159.34
58 Woollen Blankets Manufactory 20.00 85.21 105.21
27.UTTARAKHAND
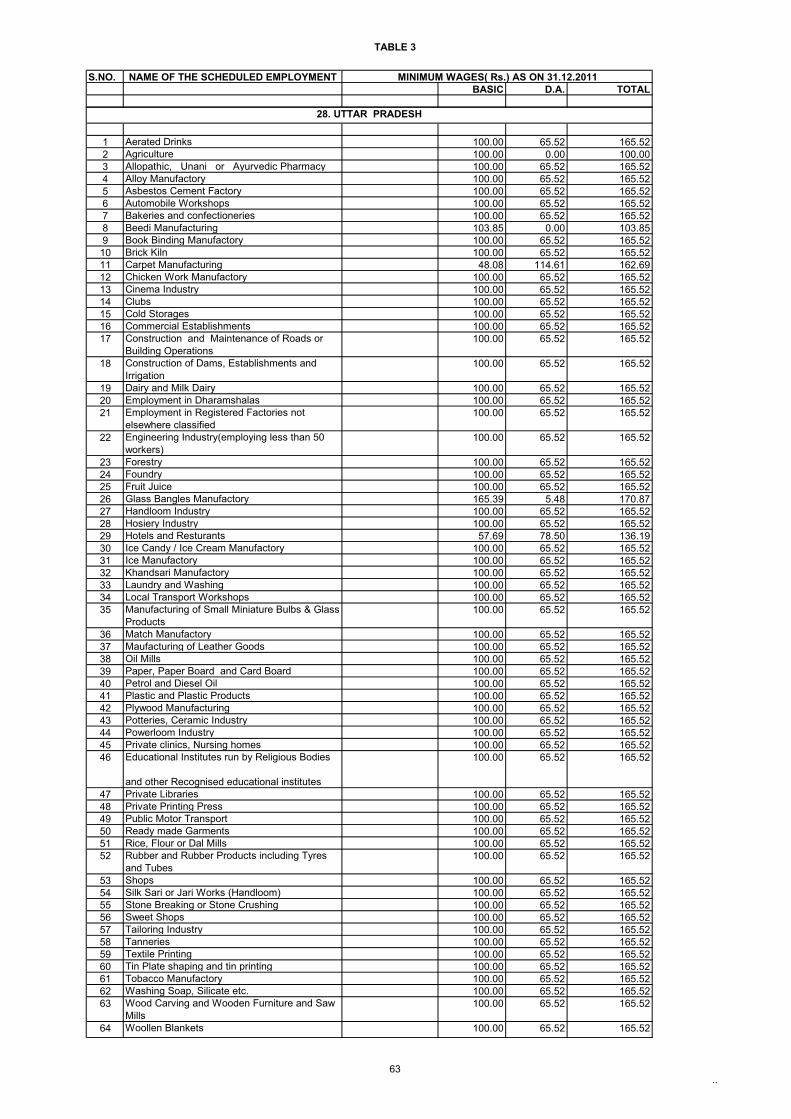
TABLE 3
63..
S.NO. NAME OF THE SCHEDULED EMPLOYMENTBASIC D.A. TOTAL
MINIMUM WAGES( Rs.) AS ON 31.12.2011
1 Aerated Drinks 100.00 65.52 165.522 Agriculture 100.00 0.00 100.003 Allopathic, Unani or Ayurvedic Pharmacy 100.00 65.52 165.524 Alloy Manufactory 100.00 65.52 165.525 Asbestos Cement Factory 100.00 65.52 165.526 Automobile Workshops 100.00 65.52 165.527 Bakeries and confectioneries 100.00 65.52 165.528 Beedi Manufacturing 103.85 0.00 103.859 Book Binding Manufactory 100.00 65.52 165.5210 Brick Kiln 100.00 65.52 165.5211 Carpet Manufacturing 48.08 114.61 162.6912 Chicken Work Manufactory 100.00 65.52 165.5213 Cinema Industry 100.00 65.52 165.5214 Clubs 100.00 65.52 165.5215 Cold Storages 100.00 65.52 165.5216 Commercial Establishments 100.00 65.52 165.5217 Construction and Maintenance of Roads or
Building Operations100.00 65.52 165.52
18 Construction of Dams, Establishments and Irrigation
100.00 65.52 165.52
19 Dairy and Milk Dairy 100.00 65.52 165.5220 Employment in Dharamshalas 100.00 65.52 165.5221 Employment in Registered Factories not
elsewhere classified100.00 65.52 165.52
22 Engineering Industry(employing less than 50 workers)
100.00 65.52 165.52
23 Forestry 100.00 65.52 165.5224 Foundry 100.00 65.52 165.5225 Fruit Juice 100.00 65.52 165.5226 Glass Bangles Manufactory 165.39 5.48 170.8727 Handloom Industry 100.00 65.52 165.5228 Hosiery Industry 100.00 65.52 165.5229 Hotels and Resturants 57.69 78.50 136.1930 Ice Candy / Ice Cream Manufactory 100.00 65.52 165.5231 Ice Manufactory 100.00 65.52 165.5232 Khandsari Manufactory 100.00 65.52 165.5233 Laundry and Washing 100.00 65.52 165.5234 Local Transport Workshops 100.00 65.52 165.5235 Manufacturing of Small Miniature Bulbs & Glass
Products100.00 65.52 165.52
36 Match Manufactory 100.00 65.52 165.5237 Maufacturing of Leather Goods 100.00 65.52 165.5238 Oil Mills 100.00 65.52 165.5239 Paper, Paper Board and Card Board 100.00 65.52 165.5240 Petrol and Diesel Oil 100.00 65.52 165.5241 Plastic and Plastic Products 100.00 65.52 165.5242 Plywood Manufacturing 100.00 65.52 165.5243 Potteries, Ceramic Industry 100.00 65.52 165.5244 Powerloom Industry 100.00 65.52 165.5245 Private clinics, Nursing homes 100.00 65.52 165.5246 Educational Institutes run by Religious Bodies
and other Recognised educational institutes
100.00 65.52 165.52
47 Private Libraries 100.00 65.52 165.5248 Private Printing Press 100.00 65.52 165.5249 Public Motor Transport 100.00 65.52 165.5250 Ready made Garments 100.00 65.52 165.5251 Rice, Flour or Dal Mills 100.00 65.52 165.5252 Rubber and Rubber Products including Tyres
and Tubes100.00 65.52 165.52
53 Shops 100.00 65.52 165.5254 Silk Sari or Jari Works (Handloom) 100.00 65.52 165.5255 Stone Breaking or Stone Crushing 100.00 65.52 165.5256 Sweet Shops 100.00 65.52 165.5257 Tailoring Industry 100.00 65.52 165.5258 Tanneries 100.00 65.52 165.5259 Textile Printing 100.00 65.52 165.5260 Tin Plate shaping and tin printing 100.00 65.52 165.5261 Tobacco Manufactory 100.00 65.52 165.5262 Washing Soap, Silicate etc. 100.00 65.52 165.5263 Wood Carving and Wooden Furniture and Saw
Mills100.00 65.52 165.52
64 Woollen Blankets 100.00 65.52 165.52
28. UTTAR PRADESH
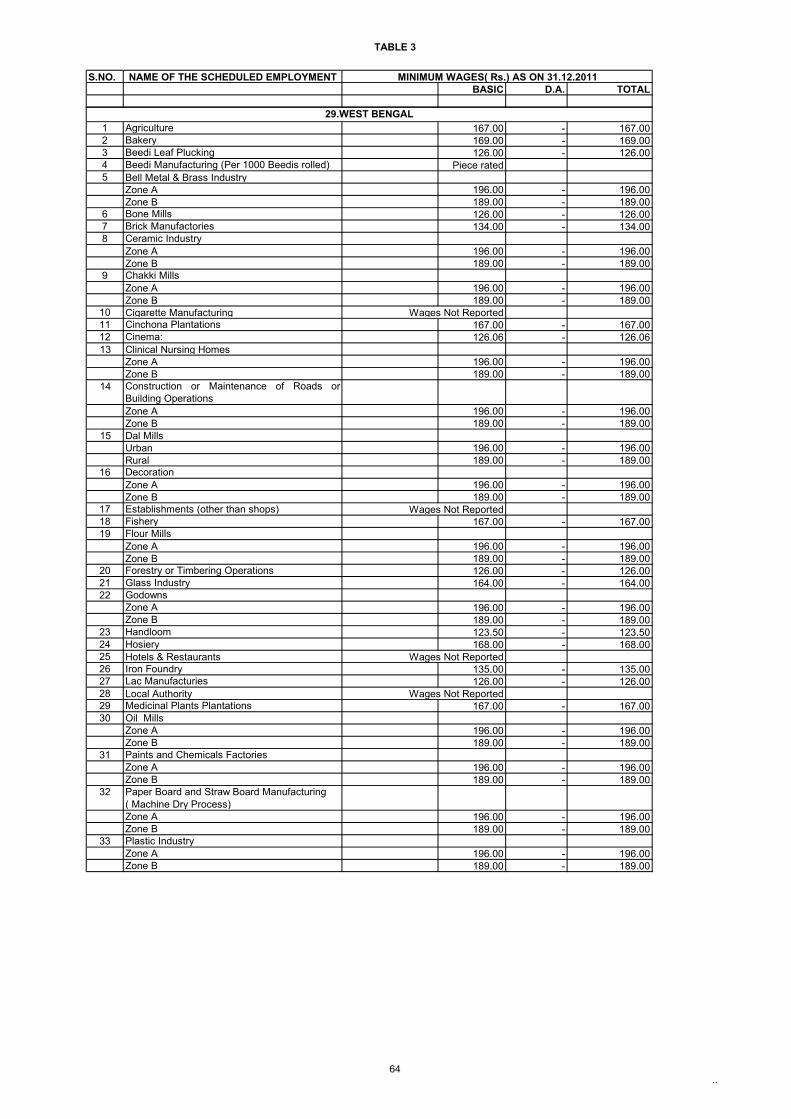
TABLE 3
64..
S.NO. NAME OF THE SCHEDULED EMPLOYMENTBASIC D.A. TOTAL
MINIMUM WAGES( Rs.) AS ON 31.12.2011
1 Agriculture 167.00 - 167.002 Bakery 169.00 - 169.003 Beedi Leaf Plucking 126.00 - 126.004 Beedi Manufacturing (Per 1000 Beedis rolled) Piece rated5 Bell Metal & Brass Industry
Zone A 196.00 - 196.00Zone B 189.00 - 189.00
6 Bone Mills 126.00 - 126.007 Brick Manufactories 134.00 - 134.008 Ceramic Industry
Zone A 196.00 - 196.00Zone B 189.00 - 189.00
9 Chakki MillsZone A 196.00 - 196.00Zone B 189.00 - 189.00
10 Cigarette Manufacturing Wages Not Reported11 Cinchona Plantations 167.00 - 167.0012 Cinema: 126.06 - 126.0613 Clinical Nursing Homes
Zone A 196.00 - 196.00Zone B 189.00 - 189.00
14 Construction or Maintenance of Roads orBuilding OperationsZone A 196.00 - 196.00Zone B 189.00 - 189.00
15 Dal MillsUrban 196.00 - 196.00Rural 189.00 - 189.00
16 DecorationZone A 196.00 - 196.00Zone B 189.00 - 189.00
17 Establishments (other than shops) Wages Not Reported18 Fishery 167.00 - 167.0019 Flour Mills
Zone A 196.00 - 196.00Zone B 189.00 - 189.00
20 Forestry or Timbering Operations 126.00 - 126.0021 Glass Industry 164.00 - 164.0022 Godowns
Zone A 196.00 - 196.00Zone B 189.00 - 189.00
23 Handloom 123.50 - 123.5024 Hosiery 168.00 - 168.0025 Hotels & Restaurants Wages Not Reported26 Iron Foundry 135.00 - 135.0027 Lac Manufacturies 126.00 - 126.0028 Local Authority Wages Not Reported29 Medicinal Plants Plantations 167.00 - 167.0030 Oil Mills
Zone A 196.00 - 196.00Zone B 189.00 - 189.00
31 Paints and Chemicals FactoriesZone A 196.00 - 196.00Zone B 189.00 - 189.00
32 Paper Board and Straw Board Manufacturing ( Machine Dry Process)Zone A 196.00 - 196.00Zone B 189.00 - 189.00
33 Plastic IndustryZone A 196.00 - 196.00Zone B 189.00 - 189.00
29.WEST BENGAL
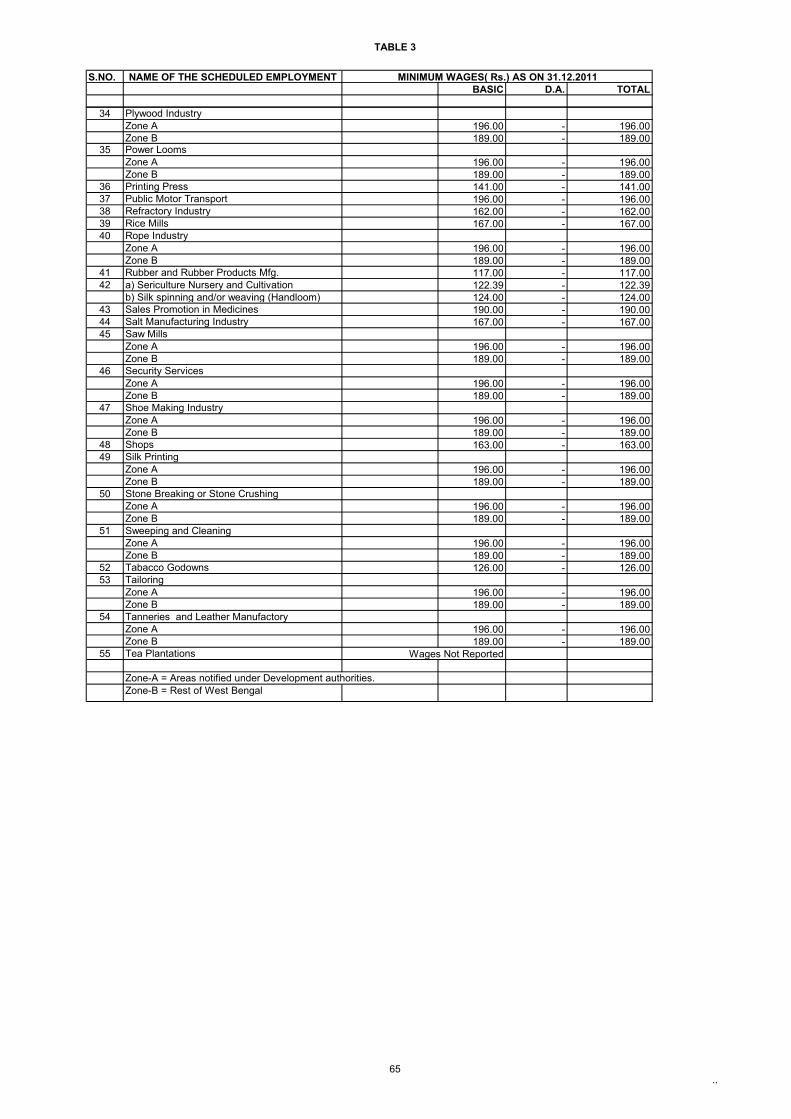
TABLE 3
65..
S.NO. NAME OF THE SCHEDULED EMPLOYMENTBASIC D.A. TOTAL
MINIMUM WAGES( Rs.) AS ON 31.12.2011
34 Plywood IndustryZone A 196.00 - 196.00Zone B 189.00 - 189.00
35 Power LoomsZone A 196.00 - 196.00Zone B 189.00 - 189.00
36 Printing Press 141.00 - 141.0037 Public Motor Transport 196.00 - 196.0038 Refractory Industry 162.00 - 162.0039 Rice Mills 167.00 - 167.0040 Rope Industry
Zone A 196.00 - 196.00Zone B 189.00 - 189.00
41 Rubber and Rubber Products Mfg. 117.00 - 117.0042 a) Sericulture Nursery and Cultivation 122.39 - 122.39
b) Silk spinning and/or weaving (Handloom) 124.00 - 124.0043 Sales Promotion in Medicines 190.00 - 190.0044 Salt Manufacturing Industry 167.00 - 167.0045 Saw Mills
Zone A 196.00 - 196.00Zone B 189.00 - 189.00
46 Security ServicesZone A 196.00 - 196.00Zone B 189.00 - 189.00
47 Shoe Making IndustryZone A 196.00 - 196.00Zone B 189.00 - 189.00
48 Shops 163.00 - 163.0049 Silk Printing
Zone A 196.00 - 196.00Zone B 189.00 - 189.00
50 Stone Breaking or Stone CrushingZone A 196.00 - 196.00Zone B 189.00 - 189.00
51 Sweeping and CleaningZone A 196.00 - 196.00Zone B 189.00 - 189.00
52 Tabacco Godowns 126.00 - 126.0053 Tailoring
Zone A 196.00 - 196.00Zone B 189.00 - 189.00
54 Tanneries and Leather ManufactoryZone A 196.00 - 196.00Zone B 189.00 - 189.00
55 Tea Plantations Wages Not Reported
Zone-A = Areas notified under Development authorities.Zone-B = Rest of West Bengal
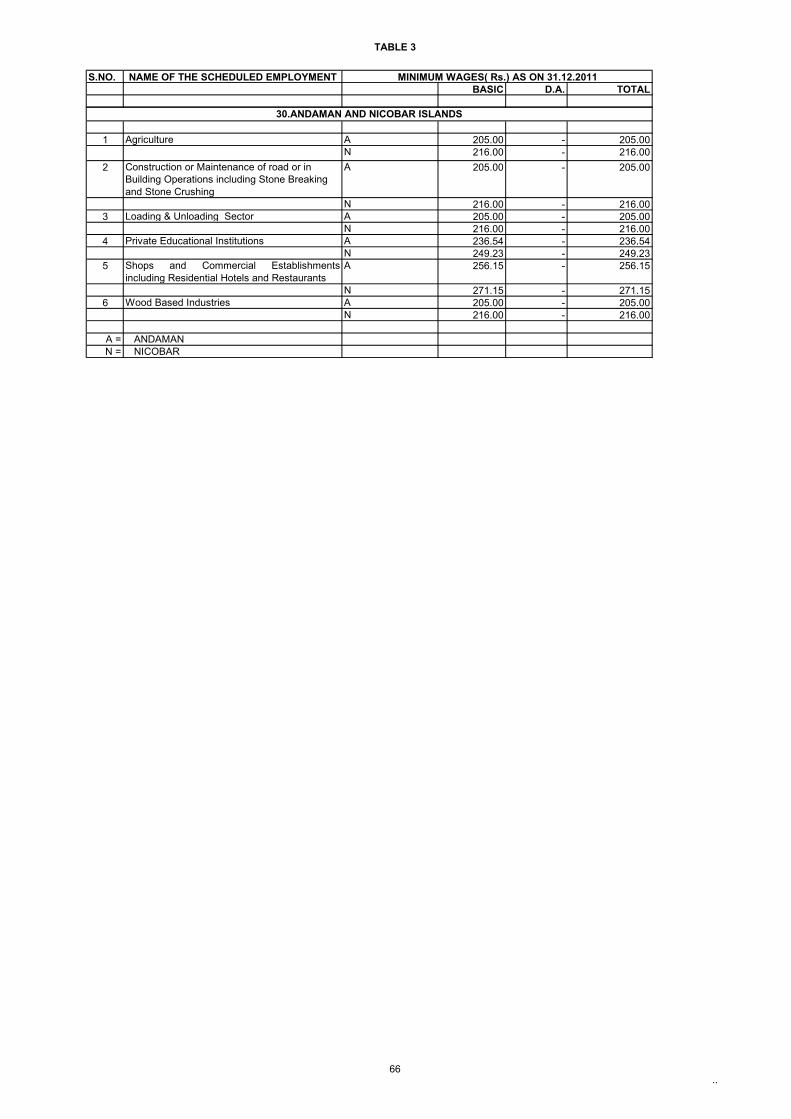
TABLE 3
66..
S.NO. NAME OF THE SCHEDULED EMPLOYMENTBASIC D.A. TOTAL
MINIMUM WAGES( Rs.) AS ON 31.12.2011
1 Agriculture A 205.00 - 205.00N 216.00 - 216.00
2 Construction or Maintenance of road or in Building Operations including Stone Breaking and Stone Crushing
A 205.00 - 205.00
N 216.00 - 216.003 Loading & Unloading Sector A 205.00 - 205.00
N 216.00 - 216.004 Private Educational Institutions A 236.54 - 236.54
N 249.23 - 249.235 Shops and Commercial Establishments
including Residential Hotels and RestaurantsA 256.15 - 256.15
N 271.15 - 271.156 Wood Based Industries A 205.00 - 205.00
N 216.00 - 216.00
A = ANDAMANN = NICOBAR
30.ANDAMAN AND NICOBAR ISLANDS
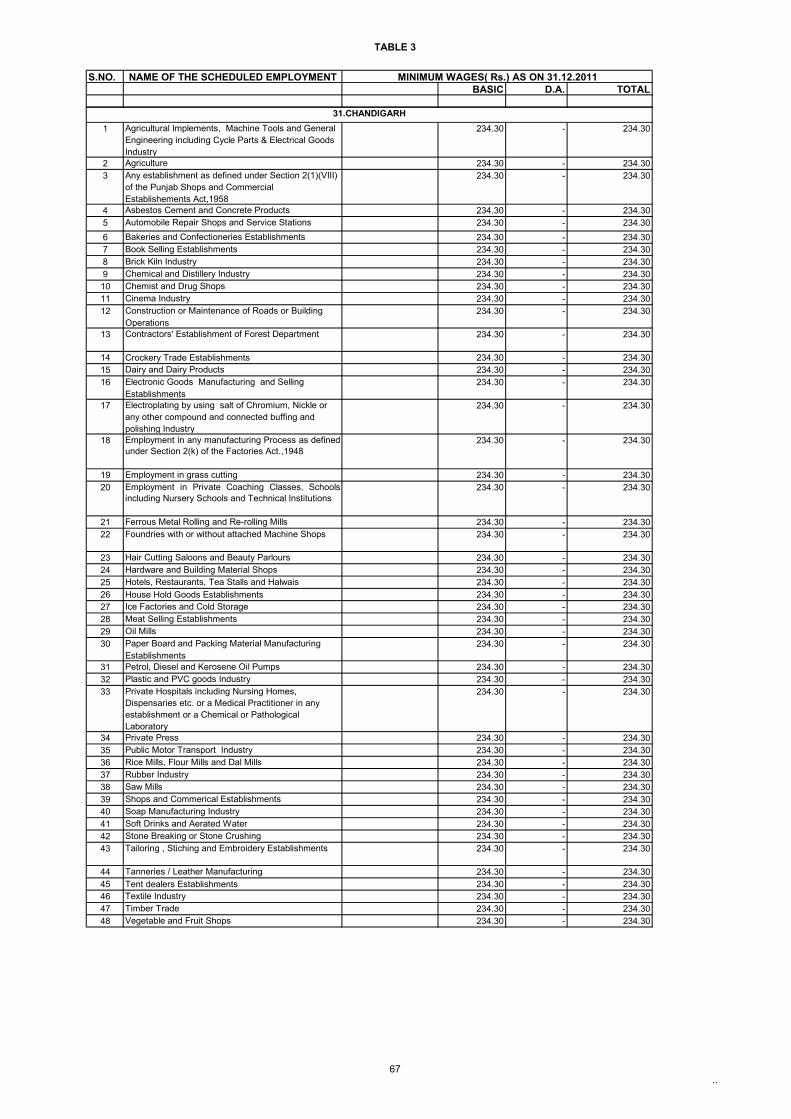
TABLE 3
67..
S.NO. NAME OF THE SCHEDULED EMPLOYMENTBASIC D.A. TOTAL
MINIMUM WAGES( Rs.) AS ON 31.12.2011
1 Agricultural Implements, Machine Tools and General Engineering including Cycle Parts & Electrical Goods Industry
234.30 - 234.30
2 Agriculture 234.30 - 234.303 Any establishment as defined under Section 2(1)(VIII)
of the Punjab Shops and Commercial Establishements Act,1958
234.30 - 234.30
4 Asbestos Cement and Concrete Products 234.30 - 234.305 Automobile Repair Shops and Service Stations 234.30 - 234.306 Bakeries and Confectioneries Establishments 234.30 - 234.307 Book Selling Establishments 234.30 - 234.308 Brick Kiln Industry 234.30 - 234.309 Chemical and Distillery Industry 234.30 - 234.3010 Chemist and Drug Shops 234.30 - 234.3011 Cinema Industry 234.30 - 234.3012 Construction or Maintenance of Roads or Building
Operations 234.30 - 234.30
13 Contractors' Establishment of Forest Department 234.30 - 234.30
14 Crockery Trade Establishments 234.30 - 234.3015 Dairy and Dairy Products 234.30 - 234.3016 Electronic Goods Manufacturing and Selling
Establishments234.30 - 234.30
17 Electroplating by using salt of Chromium, Nickle or any other compound and connected buffing and polishing Industry
234.30 - 234.30
18 Employment in any manufacturing Process as definedunder Section 2(k) of the Factories Act.,1948
234.30 - 234.30
19 Employment in grass cutting 234.30 - 234.3020 Employment in Private Coaching Classes, Schools
including Nursery Schools and Technical Institutions234.30 - 234.30
21 Ferrous Metal Rolling and Re-rolling Mills 234.30 - 234.3022 Foundries with or without attached Machine Shops 234.30 - 234.30
23 Hair Cutting Saloons and Beauty Parlours 234.30 - 234.3024 Hardware and Building Material Shops 234.30 - 234.3025 Hotels, Restaurants, Tea Stalls and Halwais 234.30 - 234.3026 House Hold Goods Establishments 234.30 - 234.3027 Ice Factories and Cold Storage 234.30 - 234.3028 Meat Selling Establishments 234.30 - 234.3029 Oil Mills 234.30 - 234.3030 Paper Board and Packing Material Manufacturing
Establishments234.30 - 234.30
31 Petrol, Diesel and Kerosene Oil Pumps 234.30 - 234.3032 Plastic and PVC goods Industry 234.30 - 234.3033 Private Hospitals including Nursing Homes,
Dispensaries etc. or a Medical Practitioner in any establishment or a Chemical or Pathological Laboratory
234.30 - 234.30
34 Private Press 234.30 - 234.3035 Public Motor Transport Industry 234.30 - 234.3036 Rice Mills, Flour Mills and Dal Mills 234.30 - 234.3037 Rubber Industry 234.30 - 234.3038 Saw Mills 234.30 - 234.3039 Shops and Commerical Establishments 234.30 - 234.3040 Soap Manufacturing Industry 234.30 - 234.3041 Soft Drinks and Aerated Water 234.30 - 234.3042 Stone Breaking or Stone Crushing 234.30 - 234.3043 Tailoring , Stiching and Embroidery Establishments 234.30 - 234.30
44 Tanneries / Leather Manufacturing 234.30 - 234.3045 Tent dealers Establishments 234.30 - 234.3046 Textile Industry 234.30 - 234.3047 Timber Trade 234.30 - 234.3048 Vegetable and Fruit Shops 234.30 - 234.30
31.CHANDIGARH
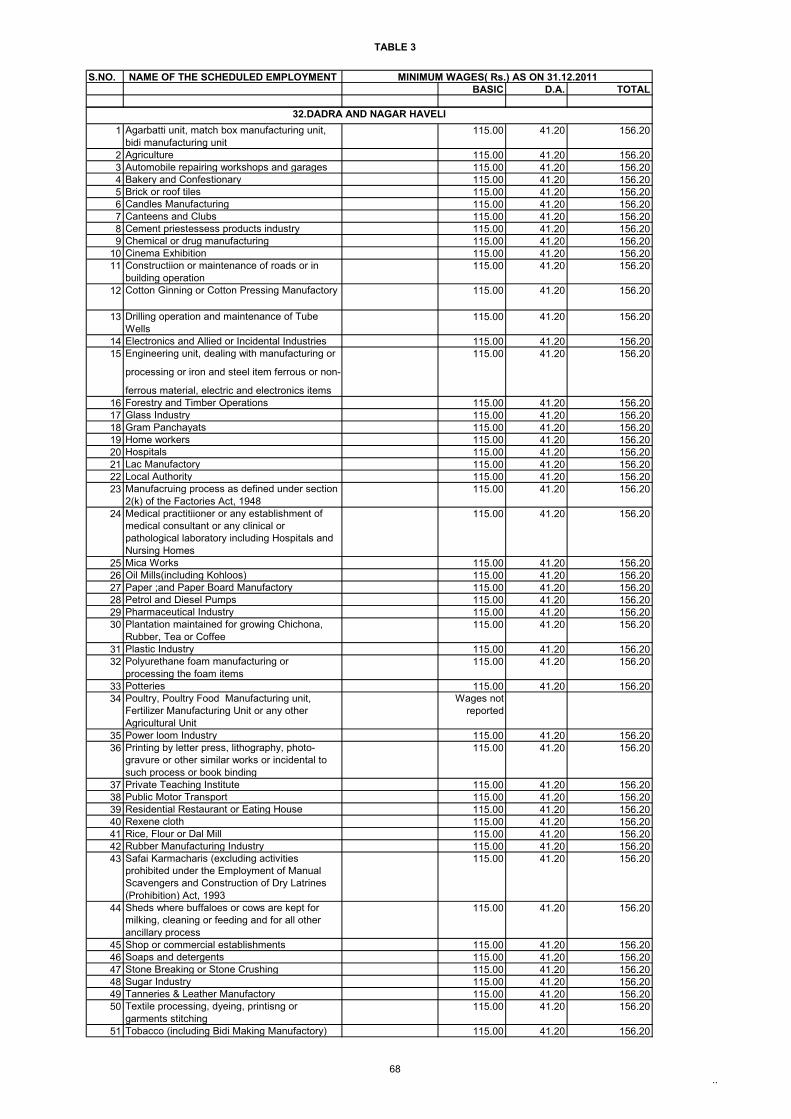
TABLE 3
68..
S.NO. NAME OF THE SCHEDULED EMPLOYMENTBASIC D.A. TOTAL
MINIMUM WAGES( Rs.) AS ON 31.12.2011
1 Agarbatti unit, match box manufacturing unit, bidi manufacturing unit
115.00 41.20 156.20
2 Agriculture 115.00 41.20 156.203 Automobile repairing workshops and garages 115.00 41.20 156.204 Bakery and Confestionary 115.00 41.20 156.205 Brick or roof tiles 115.00 41.20 156.206 Candles Manufacturing 115.00 41.20 156.207 Canteens and Clubs 115.00 41.20 156.208 Cement priestessess products industry 115.00 41.20 156.209 Chemical or drug manufacturing 115.00 41.20 156.20
10 Cinema Exhibition 115.00 41.20 156.2011 Constructiion or maintenance of roads or in
building operation115.00 41.20 156.20
12 Cotton Ginning or Cotton Pressing Manufactory 115.00 41.20 156.20
13 Drilling operation and maintenance of Tube Wells
115.00 41.20 156.20
14 Electronics and Allied or Incidental Industries 115.00 41.20 156.2015 Engineering unit, dealing with manufacturing or
processing or iron and steel item ferrous or non-
ferrous material, electric and electronics items
115.00 41.20 156.20
16 Forestry and Timber Operations 115.00 41.20 156.2017 Glass Industry 115.00 41.20 156.2018 Gram Panchayats 115.00 41.20 156.2019 Home workers 115.00 41.20 156.2020 Hospitals 115.00 41.20 156.2021 Lac Manufactory 115.00 41.20 156.2022 Local Authority 115.00 41.20 156.2023 Manufacruing process as defined under section
2(k) of the Factories Act, 1948115.00 41.20 156.20
24 Medical practitiioner or any establishment of medical consultant or any clinical or pathological laboratory including Hospitals and Nursing Homes
115.00 41.20 156.20
25 Mica Works 115.00 41.20 156.2026 Oil Mills(including Kohloos) 115.00 41.20 156.2027 Paper ;and Paper Board Manufactory 115.00 41.20 156.2028 Petrol and Diesel Pumps 115.00 41.20 156.2029 Pharmaceutical Industry 115.00 41.20 156.2030 Plantation maintained for growing Chichona,
Rubber, Tea or Coffee115.00 41.20 156.20
31 Plastic Industry 115.00 41.20 156.2032 Polyurethane foam manufacturing or
processing the foam items115.00 41.20 156.20
33 Potteries 115.00 41.20 156.2034 Poultry, Poultry Food Manufacturing unit,
Fertilizer Manufacturing Unit or any other Agricultural Unit
Wages not reported
35 Power loom Industry 115.00 41.20 156.2036 Printing by letter press, lithography, photo-
gravure or other similar works or incidental to such process or book binding
115.00 41.20 156.20
37 Private Teaching Institute 115.00 41.20 156.2038 Public Motor Transport 115.00 41.20 156.2039 Residential Restaurant or Eating House 115.00 41.20 156.2040 Rexene cloth 115.00 41.20 156.2041 Rice, Flour or Dal Mill 115.00 41.20 156.2042 Rubber Manufacturing Industry 115.00 41.20 156.2043 Safai Karmacharis (excluding activities
prohibited under the Employment of Manual Scavengers and Construction of Dry Latrines (Prohibition) Act, 1993
115.00 41.20 156.20
44 Sheds where buffaloes or cows are kept for milking, cleaning or feeding and for all other ancillary process
115.00 41.20 156.20
45 Shop or commercial establishments 115.00 41.20 156.2046 Soaps and detergents 115.00 41.20 156.2047 Stone Breaking or Stone Crushing 115.00 41.20 156.2048 Sugar Industry 115.00 41.20 156.2049 Tanneries & Leather Manufactory 115.00 41.20 156.2050 Textile processing, dyeing, printisng or
garments stitching115.00 41.20 156.20
51 Tobacco (including Bidi Making Manufactory) 115.00 41.20 156.20
32.DADRA AND NAGAR HAVELI
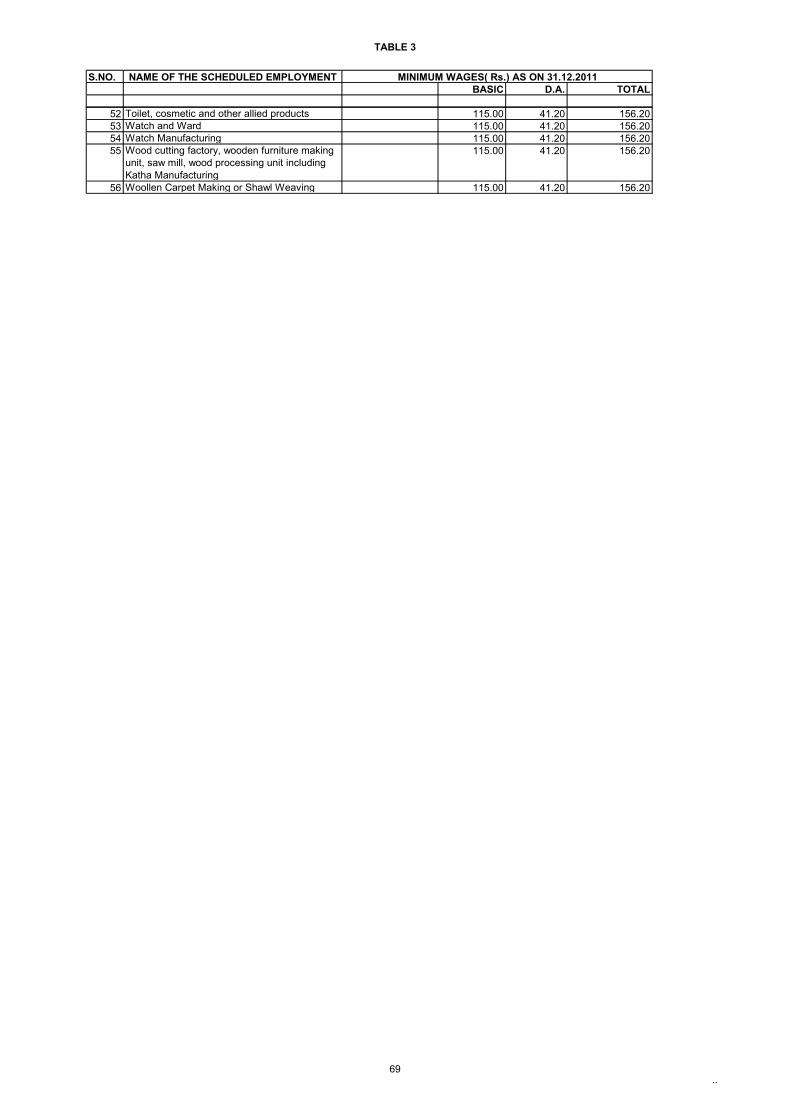
TABLE 3
69..
S.NO. NAME OF THE SCHEDULED EMPLOYMENTBASIC D.A. TOTAL
MINIMUM WAGES( Rs.) AS ON 31.12.2011
52 Toilet, cosmetic and other allied products 115.00 41.20 156.2053 Watch and Ward 115.00 41.20 156.2054 Watch Manufacturing 115.00 41.20 156.2055 Wood cutting factory, wooden furniture making
unit, saw mill, wood processing unit including Katha Manufacturing
115.00 41.20 156.20
56 Woollen Carpet Making or Shawl Weaving 115.00 41.20 156.20
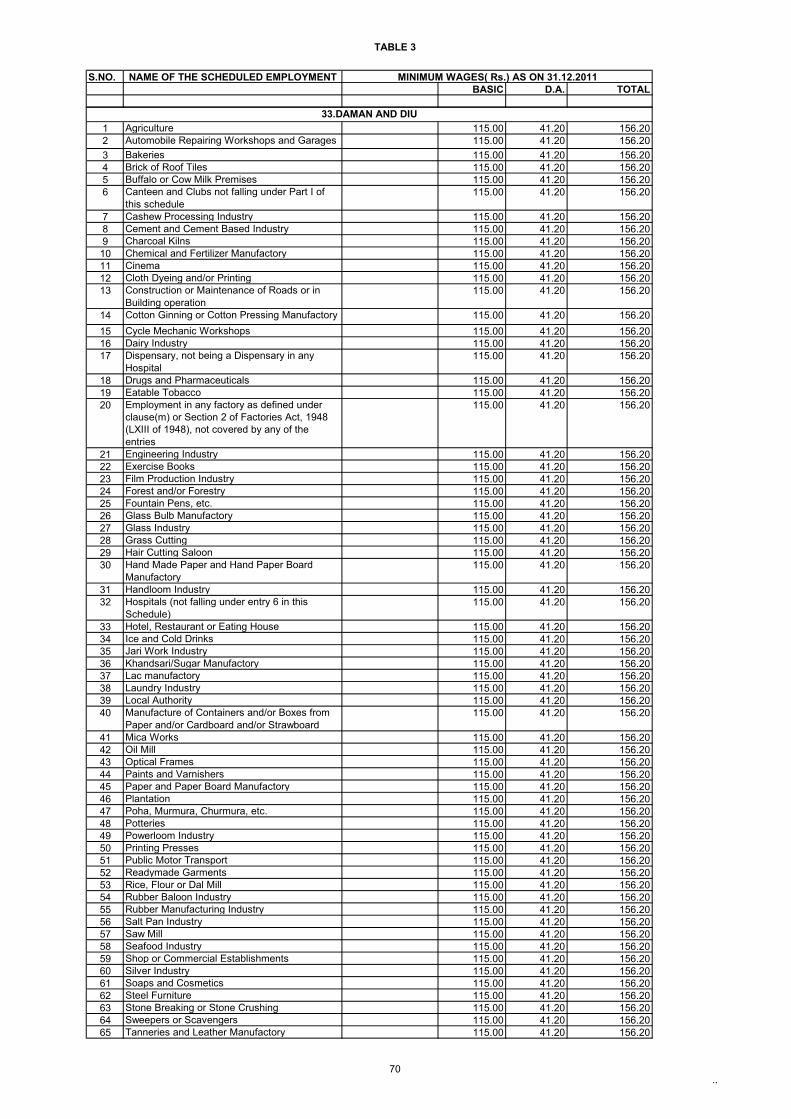
TABLE 3
70..
S.NO. NAME OF THE SCHEDULED EMPLOYMENTBASIC D.A. TOTAL
MINIMUM WAGES( Rs.) AS ON 31.12.2011
1 Agriculture 115.00 41.20 156.202 Automobile Repairing Workshops and Garages 115.00 41.20 156.203 Bakeries 115.00 41.20 156.204 Brick of Roof Tiles 115.00 41.20 156.205 Buffalo or Cow Milk Premises 115.00 41.20 156.206 Canteen and Clubs not falling under Part I of
this schedule115.00 41.20 156.20
7 Cashew Processing Industry 115.00 41.20 156.208 Cement and Cement Based Industry 115.00 41.20 156.209 Charcoal Kilns 115.00 41.20 156.2010 Chemical and Fertilizer Manufactory 115.00 41.20 156.2011 Cinema 115.00 41.20 156.2012 Cloth Dyeing and/or Printing 115.00 41.20 156.2013 Construction or Maintenance of Roads or in
Building operation115.00 41.20 156.20
14 Cotton Ginning or Cotton Pressing Manufactory 115.00 41.20 156.2015 Cycle Mechanic Workshops 115.00 41.20 156.2016 Dairy Industry 115.00 41.20 156.2017 Dispensary, not being a Dispensary in any
Hospital115.00 41.20 156.20
18 Drugs and Pharmaceuticals 115.00 41.20 156.2019 Eatable Tobacco 115.00 41.20 156.2020 Employment in any factory as defined under
clause(m) or Section 2 of Factories Act, 1948 (LXIII of 1948), not covered by any of the entries
115.00 41.20 156.20
21 Engineering Industry 115.00 41.20 156.2022 Exercise Books 115.00 41.20 156.2023 Film Production Industry 115.00 41.20 156.2024 Forest and/or Forestry 115.00 41.20 156.2025 Fountain Pens, etc. 115.00 41.20 156.2026 Glass Bulb Manufactory 115.00 41.20 156.2027 Glass Industry 115.00 41.20 156.2028 Grass Cutting 115.00 41.20 156.2029 Hair Cutting Saloon 115.00 41.20 156.2030 Hand Made Paper and Hand Paper Board
Manufactory115.00 41.20 156.20
31 Handloom Industry 115.00 41.20 156.2032 Hospitals (not falling under entry 6 in this
Schedule)115.00 41.20 156.20
33 Hotel, Restaurant or Eating House 115.00 41.20 156.2034 Ice and Cold Drinks 115.00 41.20 156.2035 Jari Work Industry 115.00 41.20 156.2036 Khandsari/Sugar Manufactory 115.00 41.20 156.2037 Lac manufactory 115.00 41.20 156.2038 Laundry Industry 115.00 41.20 156.2039 Local Authority 115.00 41.20 156.2040 Manufacture of Containers and/or Boxes from
Paper and/or Cardboard and/or Strawboard115.00 41.20 156.20
41 Mica Works 115.00 41.20 156.2042 Oil Mill 115.00 41.20 156.2043 Optical Frames 115.00 41.20 156.2044 Paints and Varnishers 115.00 41.20 156.2045 Paper and Paper Board Manufactory 115.00 41.20 156.2046 Plantation 115.00 41.20 156.2047 Poha, Murmura, Churmura, etc. 115.00 41.20 156.2048 Potteries 115.00 41.20 156.2049 Powerloom Industry 115.00 41.20 156.2050 Printing Presses 115.00 41.20 156.2051 Public Motor Transport 115.00 41.20 156.2052 Readymade Garments 115.00 41.20 156.2053 Rice, Flour or Dal Mill 115.00 41.20 156.2054 Rubber Baloon Industry 115.00 41.20 156.2055 Rubber Manufacturing Industry 115.00 41.20 156.2056 Salt Pan Industry 115.00 41.20 156.2057 Saw Mill 115.00 41.20 156.2058 Seafood Industry 115.00 41.20 156.2059 Shop or Commercial Establishments 115.00 41.20 156.2060 Silver Industry 115.00 41.20 156.2061 Soaps and Cosmetics 115.00 41.20 156.2062 Steel Furniture 115.00 41.20 156.2063 Stone Breaking or Stone Crushing 115.00 41.20 156.2064 Sweepers or Scavengers 115.00 41.20 156.2065 Tanneries and Leather Manufactory 115.00 41.20 156.20
33.DAMAN AND DIU
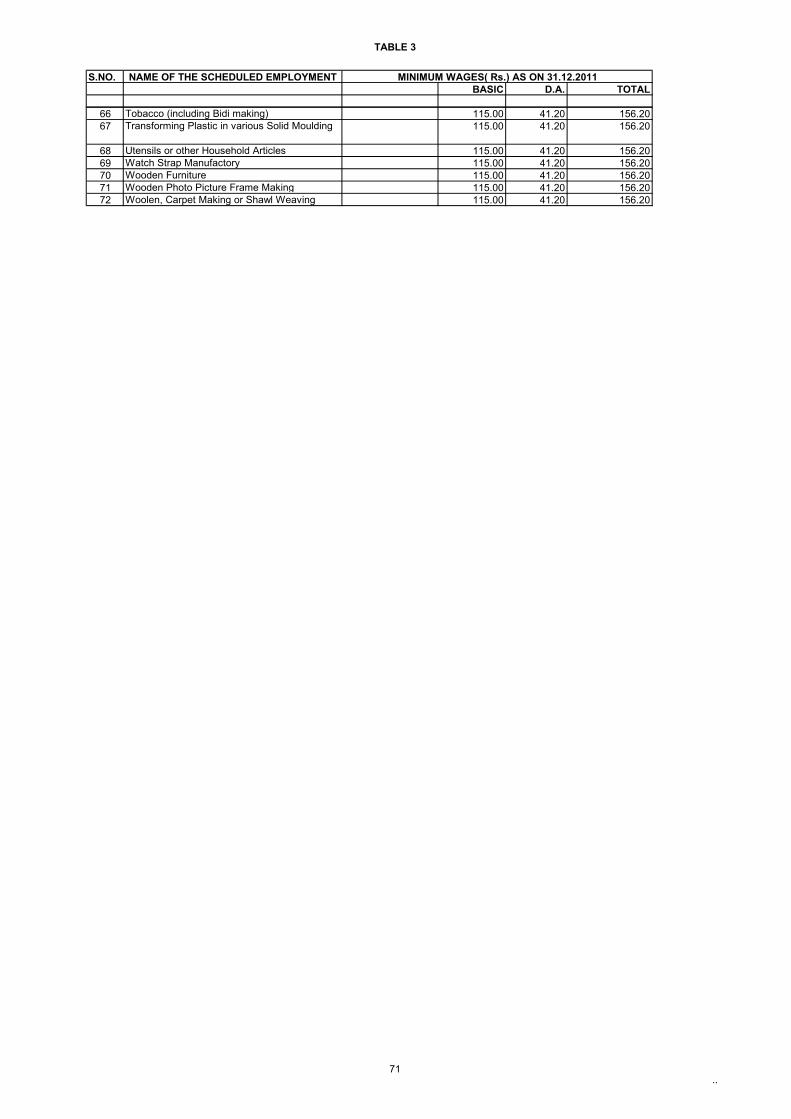
TABLE 3
71..
S.NO. NAME OF THE SCHEDULED EMPLOYMENTBASIC D.A. TOTAL
MINIMUM WAGES( Rs.) AS ON 31.12.2011
66 Tobacco (including Bidi making) 115.00 41.20 156.2067 Transforming Plastic in various Solid Moulding 115.00 41.20 156.20
68 Utensils or other Household Articles 115.00 41.20 156.2069 Watch Strap Manufactory 115.00 41.20 156.2070 Wooden Furniture 115.00 41.20 156.2071 Wooden Photo Picture Frame Making 115.00 41.20 156.2072 Woolen, Carpet Making or Shawl Weaving 115.00 41.20 156.20
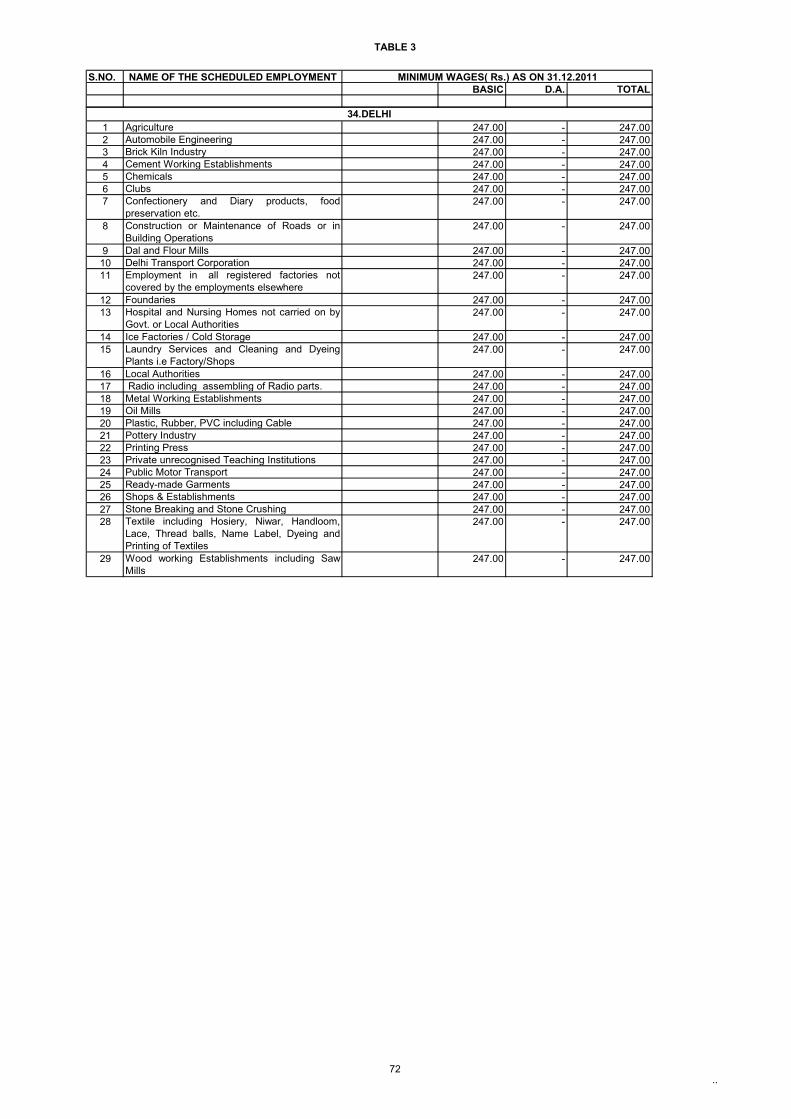
TABLE 3
72..
S.NO. NAME OF THE SCHEDULED EMPLOYMENTBASIC D.A. TOTAL
MINIMUM WAGES( Rs.) AS ON 31.12.2011
1 Agriculture 247.00 - 247.002 Automobile Engineering 247.00 - 247.003 Brick Kiln Industry 247.00 - 247.004 Cement Working Establishments 247.00 - 247.005 Chemicals 247.00 - 247.006 Clubs 247.00 - 247.007 Confectionery and Diary products, food
preservation etc.247.00 - 247.00
8 Construction or Maintenance of Roads or inBuilding Operations
247.00 - 247.00
9 Dal and Flour Mills 247.00 - 247.0010 Delhi Transport Corporation 247.00 - 247.0011 Employment in all registered factories not
covered by the employments elsewhere247.00 - 247.00
12 Foundaries 247.00 - 247.0013 Hospital and Nursing Homes not carried on by
Govt. or Local Authorities247.00 - 247.00
14 Ice Factories / Cold Storage 247.00 - 247.0015 Laundry Services and Cleaning and Dyeing
Plants i.e Factory/Shops247.00 - 247.00
16 Local Authorities 247.00 - 247.0017 Radio including assembling of Radio parts. 247.00 - 247.0018 Metal Working Establishments 247.00 - 247.0019 Oil Mills 247.00 - 247.0020 Plastic, Rubber, PVC including Cable 247.00 - 247.0021 Pottery Industry 247.00 - 247.0022 Printing Press 247.00 - 247.0023 Private unrecognised Teaching Institutions 247.00 - 247.0024 Public Motor Transport 247.00 - 247.0025 Ready-made Garments 247.00 - 247.0026 Shops & Establishments 247.00 - 247.0027 Stone Breaking and Stone Crushing 247.00 - 247.0028 Textile including Hosiery, Niwar, Handloom,
Lace, Thread balls, Name Label, Dyeing andPrinting of Textiles
247.00 - 247.00
29 Wood working Establishments including SawMills
247.00 - 247.00
34.DELHI
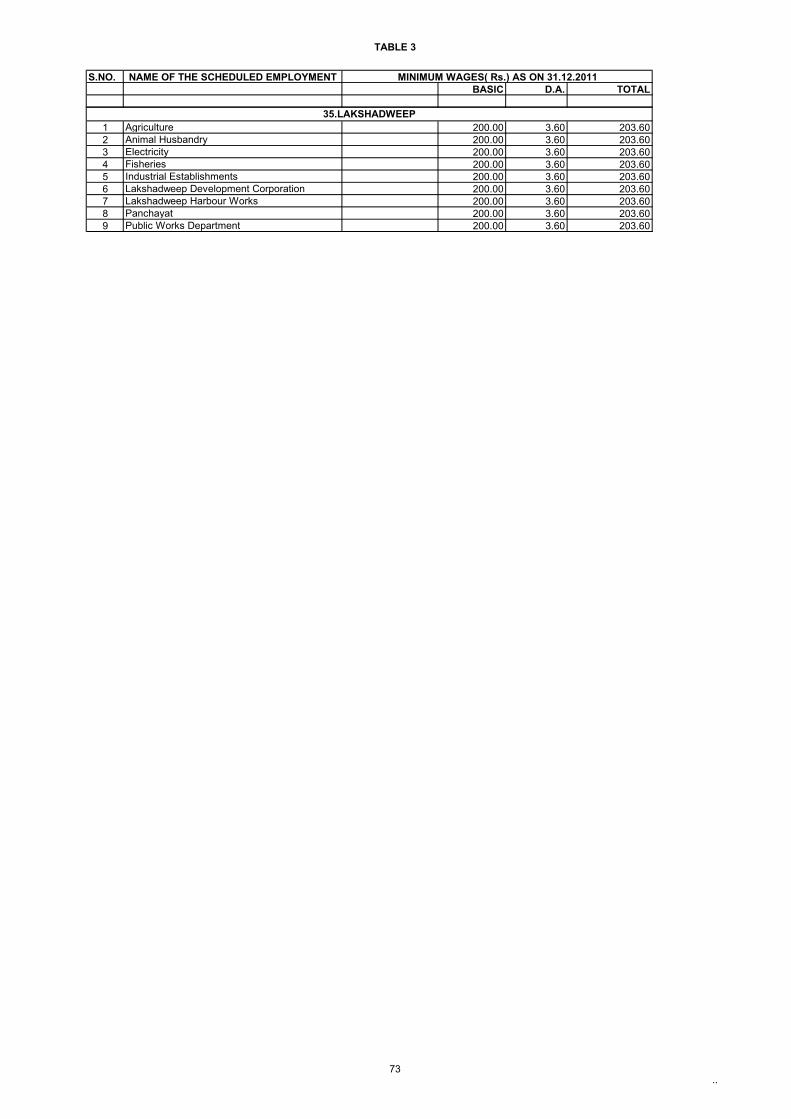
TABLE 3
73..
S.NO. NAME OF THE SCHEDULED EMPLOYMENTBASIC D.A. TOTAL
MINIMUM WAGES( Rs.) AS ON 31.12.2011
1 Agriculture 200.00 3.60 203.602 Animal Husbandry 200.00 3.60 203.603 Electricity 200.00 3.60 203.604 Fisheries 200.00 3.60 203.605 Industrial Establishments 200.00 3.60 203.606 Lakshadweep Development Corporation 200.00 3.60 203.607 Lakshadweep Harbour Works 200.00 3.60 203.608 Panchayat 200.00 3.60 203.609 Public Works Department 200.00 3.60 203.60
35.LAKSHADWEEP
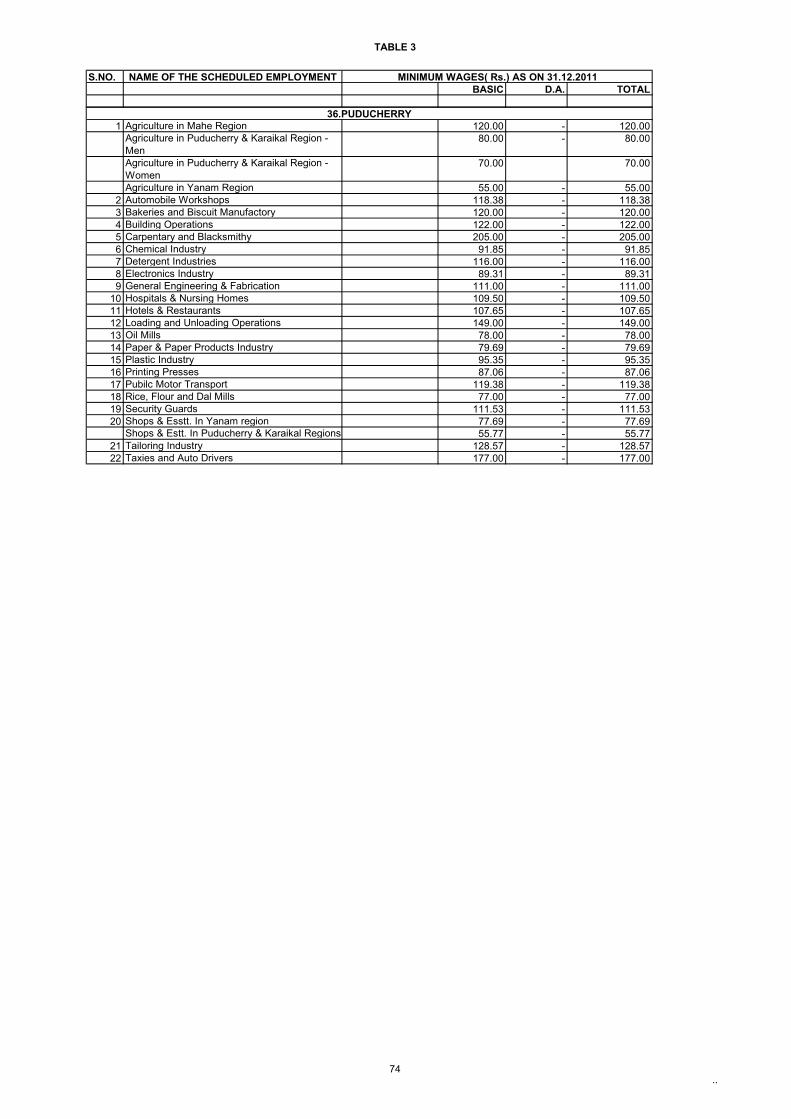
TABLE 3
74..
S.NO. NAME OF THE SCHEDULED EMPLOYMENTBASIC D.A. TOTAL
MINIMUM WAGES( Rs.) AS ON 31.12.2011
1 Agriculture in Mahe Region 120.00 - 120.00Agriculture in Puducherry & Karaikal Region - Men
80.00 - 80.00
Agriculture in Puducherry & Karaikal Region - Women
70.00 70.00
Agriculture in Yanam Region 55.00 - 55.002 Automobile Workshops 118.38 - 118.383 Bakeries and Biscuit Manufactory 120.00 - 120.004 Building Operations 122.00 - 122.005 Carpentary and Blacksmithy 205.00 - 205.006 Chemical Industry 91.85 - 91.857 Detergent Industries 116.00 - 116.008 Electronics Industry 89.31 - 89.319 General Engineering & Fabrication 111.00 - 111.00
10 Hospitals & Nursing Homes 109.50 - 109.5011 Hotels & Restaurants 107.65 - 107.6512 Loading and Unloading Operations 149.00 - 149.0013 Oil Mills 78.00 - 78.0014 Paper & Paper Products Industry 79.69 - 79.6915 Plastic Industry 95.35 - 95.3516 Printing Presses 87.06 - 87.0617 Pubilc Motor Transport 119.38 - 119.3818 Rice, Flour and Dal Mills 77.00 - 77.0019 Security Guards 111.53 - 111.5320 Shops & Esstt. In Yanam region 77.69 - 77.69
Shops & Estt. In Puducherry & Karaikal Regions 55.77 - 55.7721 Tailoring Industry 128.57 - 128.5722 Taxies and Auto Drivers 177.00 - 177.00
36.PUDUCHERRY
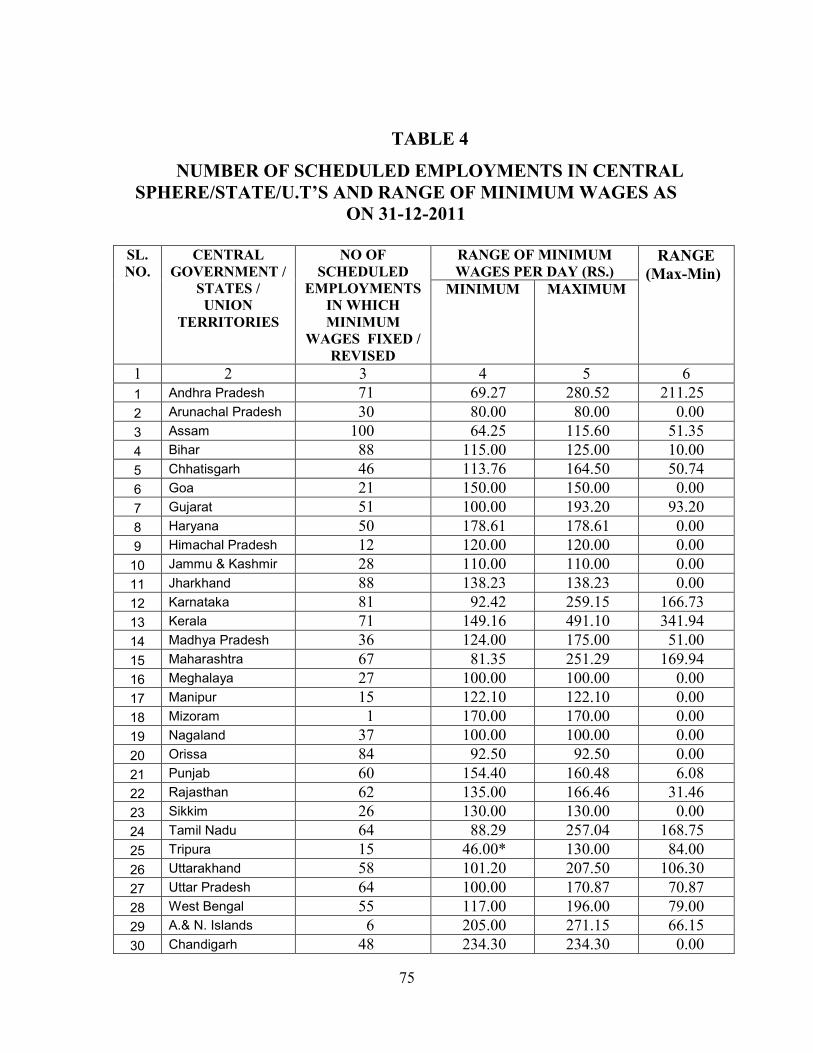
75
TABLE 4
NUMBER OF SCHEDULED EMPLOYMENTS IN CENTRAL SPHERE/STATE/U.T’S AND RANGE OF MINIMUM WAGES AS
ON 31-12-2011 SL. NO.
CENTRAL GOVERNMENT /
STATES / UNION
TERRITORIES
NO OF SCHEDULED
EMPLOYMENTS IN WHICH MINIMUM
WAGES FIXED / REVISED
RANGE OF MINIMUM WAGES PER DAY (RS.)
RANGE (Max-Min)
MINIMUM MAXIMUM
1 2 3 4 5 6 1 Andhra Pradesh 71 69.27 280.52 211.25 2 Arunachal Pradesh 30 80.00 80.00 0.00 3 Assam 100 64.25 115.60 51.35 4 Bihar 88 115.00 125.00 10.00 5 Chhatisgarh 46 113.76 164.50 50.74 6 Goa 21 150.00 150.00 0.00 7 Gujarat 51 100.00 193.20 93.20 8 Haryana 50 178.61 178.61 0.00 9 Himachal Pradesh 12 120.00 120.00 0.00
10 Jammu & Kashmir 28 110.00 110.00 0.00 11 Jharkhand 88 138.23 138.23 0.00 12 Karnataka 81 92.42 259.15 166.73 13 Kerala 71 149.16 491.10 341.94 14 Madhya Pradesh 36 124.00 175.00 51.00 15 Maharashtra 67 81.35 251.29 169.94 16 Meghalaya 27 100.00 100.00 0.00 17 Manipur 15 122.10 122.10 0.00 18 Mizoram 1 170.00 170.00 0.00 19 Nagaland 37 100.00 100.00 0.00 20 Orissa 84 92.50 92.50 0.00 21 Punjab 60 154.40 160.48 6.08 22 Rajasthan 62 135.00 166.46 31.46 23 Sikkim 26 130.00 130.00 0.00 24 Tamil Nadu 64 88.29 257.04 168.75 25 Tripura 15 46.00* 130.00 84.00 26 Uttarakhand 58 101.20 207.50 106.30 27 Uttar Pradesh 64 100.00 170.87 70.87 28 West Bengal 55 117.00 196.00 79.00 29 A.& N. Islands 6 205.00 271.15 66.15 30 Chandigarh 48 234.30 234.30 0.00
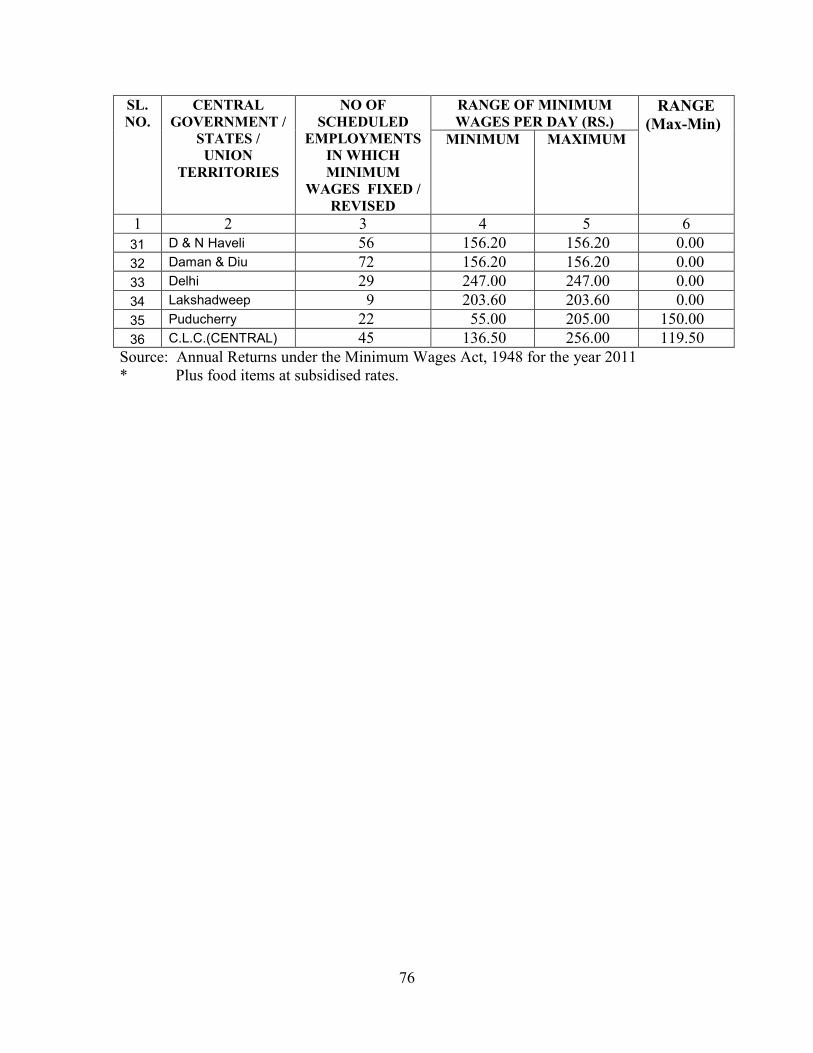
76
SL. NO.
CENTRAL GOVERNMENT /
STATES / UNION
TERRITORIES
NO OF SCHEDULED
EMPLOYMENTS IN WHICH MINIMUM
WAGES FIXED / REVISED
RANGE OF MINIMUM WAGES PER DAY (RS.)
RANGE (Max-Min)
MINIMUM MAXIMUM
1 2 3 4 5 6 31 D & N Haveli 56 156.20 156.20 0.00 32 Daman & Diu 72 156.20 156.20 0.00 33 Delhi 29 247.00 247.00 0.00 34 Lakshadweep 9 203.60 203.60 0.00 35 Puducherry 22 55.00 205.00 150.00 36 C.L.C.(CENTRAL) 45 136.50 256.00 119.50
Source: Annual Returns under the Minimum Wages Act, 1948 for the year 2011 * Plus food items at subsidised rates.
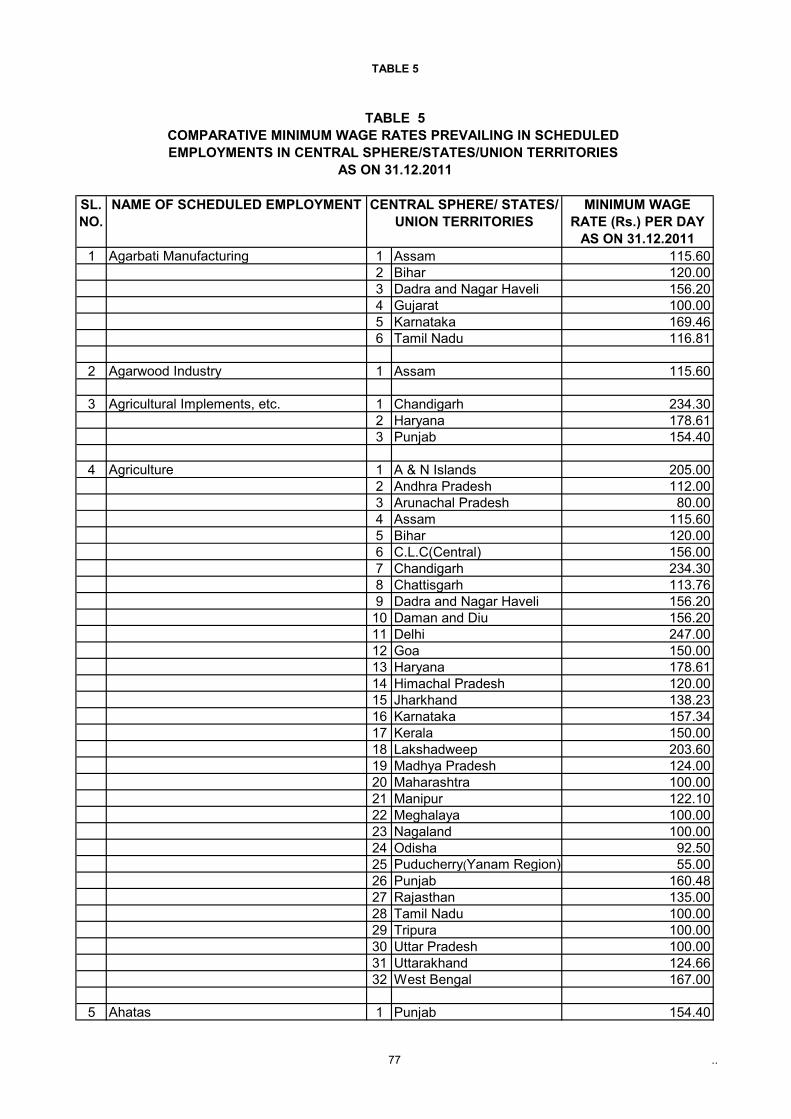
TABLE 5
77 ..
1 Agarbati Manufacturing 1 Assam 115.602 Bihar 120.003 Dadra and Nagar Haveli 156.204 Gujarat 100.005 Karnataka 169.466 Tamil Nadu 116.81
2 Agarwood Industry 1 Assam 115.60
3 Agricultural Implements, etc. 1 Chandigarh 234.302 Haryana 178.613 Punjab 154.40
4 Agriculture 1 A & N Islands 205.002 Andhra Pradesh 112.003 Arunachal Pradesh 80.004 Assam 115.605 Bihar 120.006 C.L.C(Central) 156.007 Chandigarh 234.308 Chattisgarh 113.769 Dadra and Nagar Haveli 156.2010 Daman and Diu 156.2011 Delhi 247.0012 Goa 150.0013 Haryana 178.6114 Himachal Pradesh 120.0015 Jharkhand 138.2316 Karnataka 157.3417 Kerala 150.0018 Lakshadweep 203.6019 Madhya Pradesh 124.0020 Maharashtra 100.0021 Manipur 122.1022 Meghalaya 100.0023 Nagaland 100.0024 Odisha 92.5025 Puducherry(Yanam Region) 55.0026 Punjab 160.4827 Rajasthan 135.0028 Tamil Nadu 100.0029 Tripura 100.0030 Uttar Pradesh 100.0031 Uttarakhand 124.6632 West Bengal 167.00
5 Ahatas 1 Punjab 154.40
SL.NO.
TABLE 5COMPARATIVE MINIMUM WAGE RATES PREVAILING IN SCHEDULED EMPLOYMENTS IN CENTRAL SPHERE/STATES/UNION TERRITORIES
AS ON 31.12.2011
NAME OF SCHEDULED EMPLOYMENT CENTRAL SPHERE/ STATES/ UNION TERRITORIES
MINIMUM WAGE RATE (Rs.) PER DAY
AS ON 31.12.2011
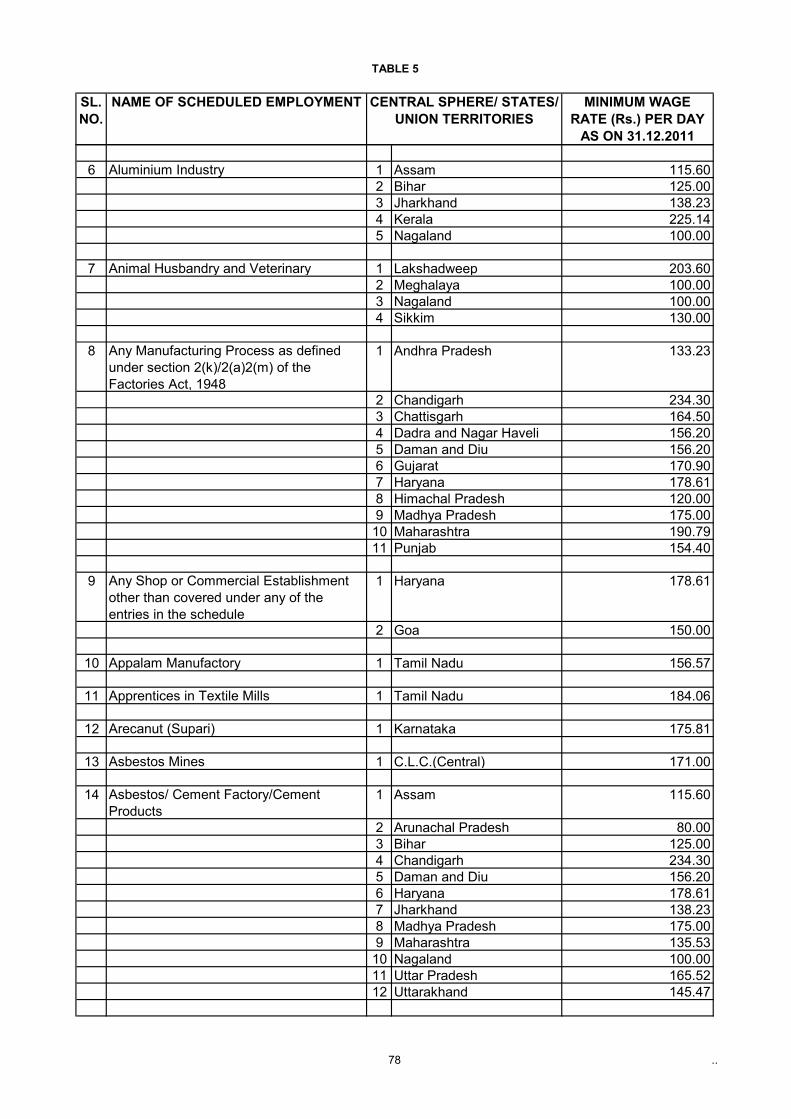
TABLE 5
78 ..
SL.NO.
NAME OF SCHEDULED EMPLOYMENT CENTRAL SPHERE/ STATES/ UNION TERRITORIES
MINIMUM WAGE RATE (Rs.) PER DAY
AS ON 31.12.2011
6 Aluminium Industry 1 Assam 115.602 Bihar 125.003 Jharkhand 138.234 Kerala 225.145 Nagaland 100.00
7 Animal Husbandry and Veterinary 1 Lakshadweep 203.602 Meghalaya 100.003 Nagaland 100.004 Sikkim 130.00
8 Any Manufacturing Process as defined under section 2(k)/2(a)2(m) of the Factories Act, 1948
1 Andhra Pradesh 133.23
2 Chandigarh 234.303 Chattisgarh 164.504 Dadra and Nagar Haveli 156.205 Daman and Diu 156.206 Gujarat 170.907 Haryana 178.618 Himachal Pradesh 120.009 Madhya Pradesh 175.0010 Maharashtra 190.7911 Punjab 154.40
9 Any Shop or Commercial Establishment other than covered under any of the entries in the schedule
1 Haryana 178.61
2 Goa 150.00
10 Appalam Manufactory 1 Tamil Nadu 156.57
11 Apprentices in Textile Mills 1 Tamil Nadu 184.06
12 Arecanut (Supari) 1 Karnataka 175.81
13 Asbestos Mines 1 C.L.C.(Central) 171.00
14 Asbestos/ Cement Factory/Cement Products
1 Assam 115.60
2 Arunachal Pradesh 80.003 Bihar 125.004 Chandigarh 234.305 Daman and Diu 156.206 Haryana 178.617 Jharkhand 138.238 Madhya Pradesh 175.009 Maharashtra 135.5310 Nagaland 100.0011 Uttar Pradesh 165.5212 Uttarakhand 145.47
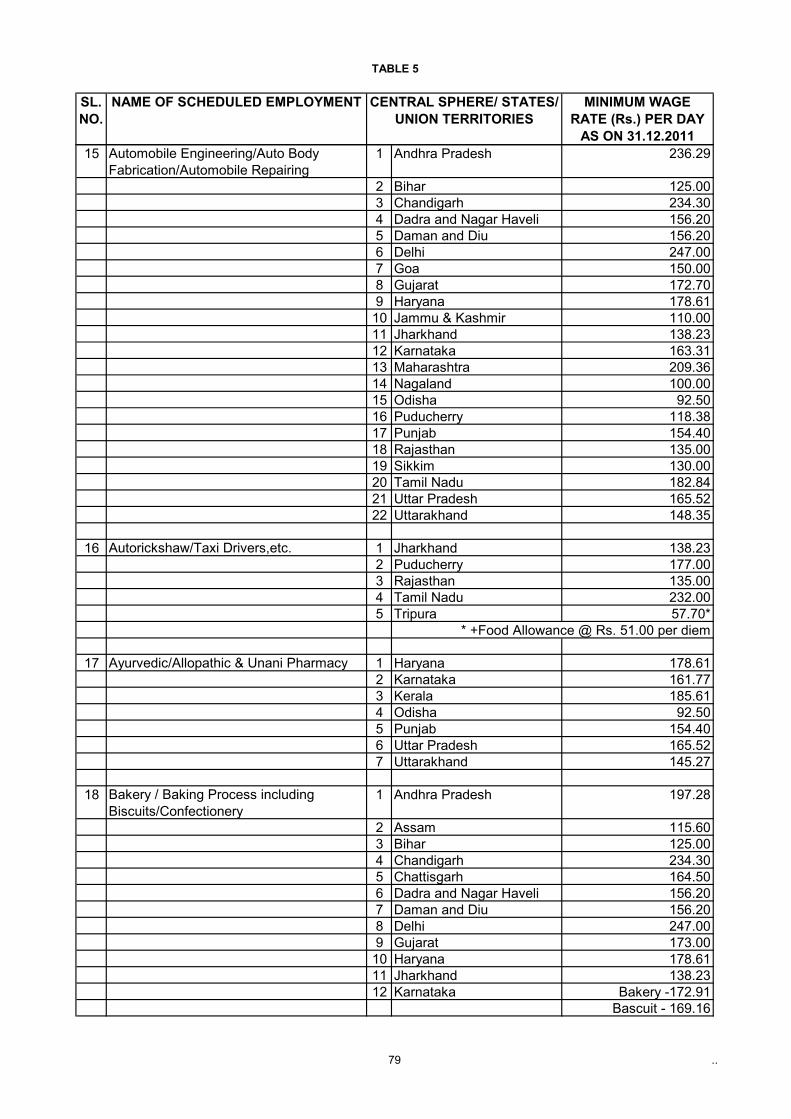
TABLE 5
79 ..
SL.NO.
NAME OF SCHEDULED EMPLOYMENT CENTRAL SPHERE/ STATES/ UNION TERRITORIES
MINIMUM WAGE RATE (Rs.) PER DAY
AS ON 31.12.201115 Automobile Engineering/Auto Body
Fabrication/Automobile Repairing1 Andhra Pradesh 236.29
2 Bihar 125.003 Chandigarh 234.304 Dadra and Nagar Haveli 156.205 Daman and Diu 156.206 Delhi 247.007 Goa 150.008 Gujarat 172.709 Haryana 178.6110 Jammu & Kashmir 110.0011 Jharkhand 138.2312 Karnataka 163.3113 Maharashtra 209.3614 Nagaland 100.0015 Odisha 92.5016 Puducherry 118.3817 Punjab 154.4018 Rajasthan 135.0019 Sikkim 130.0020 Tamil Nadu 182.8421 Uttar Pradesh 165.5222 Uttarakhand 148.35
16 Autorickshaw/Taxi Drivers,etc. 1 Jharkhand 138.232 Puducherry 177.003 Rajasthan 135.004 Tamil Nadu 232.005 Tripura 57.70*
* +Food Allowance @ Rs. 51.00 per diem
17 Ayurvedic/Allopathic & Unani Pharmacy 1 Haryana 178.612 Karnataka 161.773 Kerala 185.614 Odisha 92.505 Punjab 154.406 Uttar Pradesh 165.527 Uttarakhand 145.27
18 Bakery / Baking Process including Biscuits/Confectionery
1 Andhra Pradesh 197.28
2 Assam 115.603 Bihar 125.004 Chandigarh 234.305 Chattisgarh 164.506 Dadra and Nagar Haveli 156.207 Daman and Diu 156.208 Delhi 247.009 Gujarat 173.0010 Haryana 178.6111 Jharkhand 138.2312 Karnataka Bakery -172.91
Bascuit - 169.16
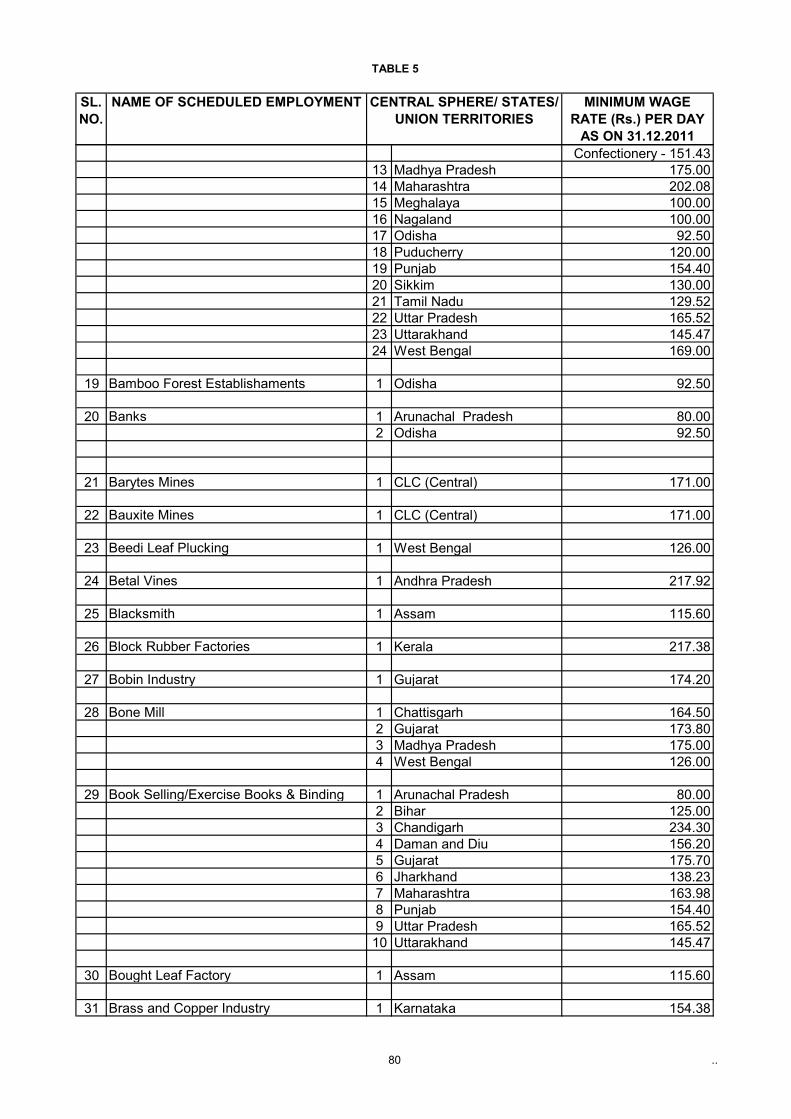
TABLE 5
80 ..
SL.NO.
NAME OF SCHEDULED EMPLOYMENT CENTRAL SPHERE/ STATES/ UNION TERRITORIES
MINIMUM WAGE RATE (Rs.) PER DAY
AS ON 31.12.2011Confectionery - 151.43
13 Madhya Pradesh 175.0014 Maharashtra 202.0815 Meghalaya 100.0016 Nagaland 100.0017 Odisha 92.5018 Puducherry 120.0019 Punjab 154.4020 Sikkim 130.0021 Tamil Nadu 129.5222 Uttar Pradesh 165.5223 Uttarakhand 145.4724 West Bengal 169.00
19 Bamboo Forest Establishaments 1 Odisha 92.50
20 Banks 1 Arunachal Pradesh 80.002 Odisha 92.50
21 Barytes Mines 1 CLC (Central) 171.00
22 Bauxite Mines 1 CLC (Central) 171.00
23 Beedi Leaf Plucking 1 West Bengal 126.00
24 Betal Vines 1 Andhra Pradesh 217.92
25 Blacksmith 1 Assam 115.60
26 Block Rubber Factories 1 Kerala 217.38
27 Bobin Industry 1 Gujarat 174.20
28 Bone Mill 1 Chattisgarh 164.502 Gujarat 173.803 Madhya Pradesh 175.004 West Bengal 126.00
29 Book Selling/Exercise Books & Binding 1 Arunachal Pradesh 80.002 Bihar 125.003 Chandigarh 234.304 Daman and Diu 156.205 Gujarat 175.706 Jharkhand 138.237 Maharashtra 163.988 Punjab 154.409 Uttar Pradesh 165.5210 Uttarakhand 145.47
30 Bought Leaf Factory 1 Assam 115.60
31 Brass and Copper Industry 1 Karnataka 154.38
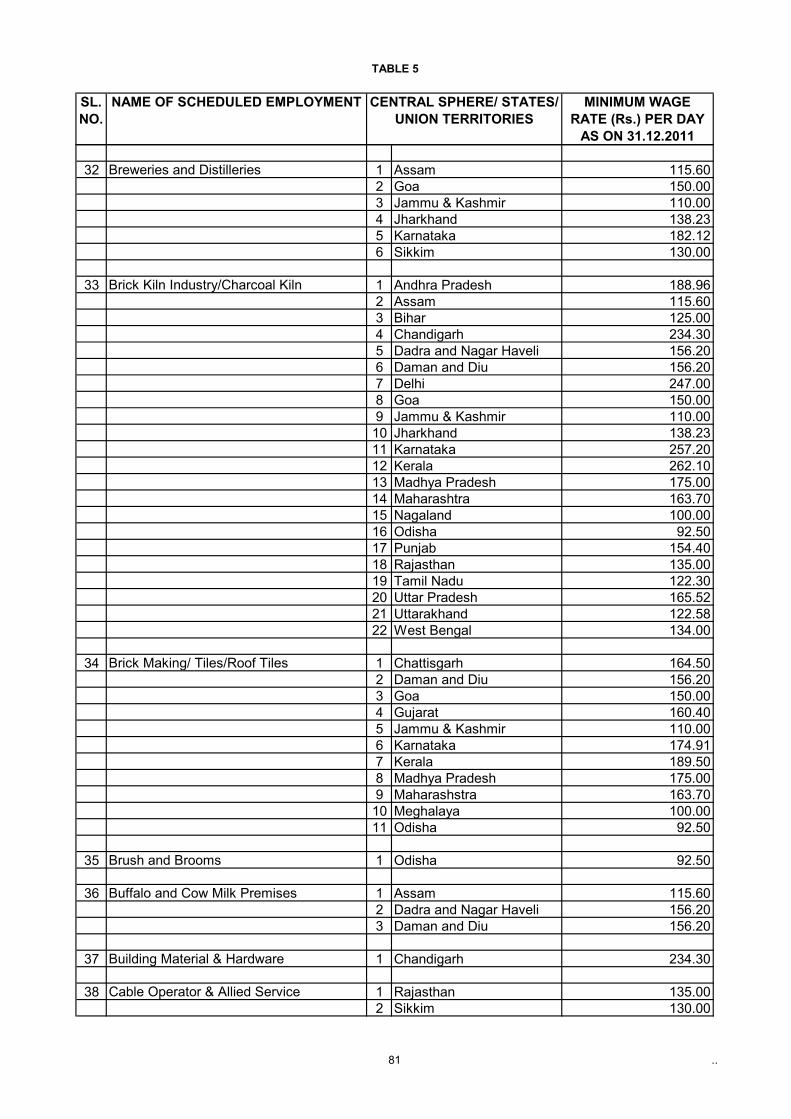
TABLE 5
81 ..
SL.NO.
NAME OF SCHEDULED EMPLOYMENT CENTRAL SPHERE/ STATES/ UNION TERRITORIES
MINIMUM WAGE RATE (Rs.) PER DAY
AS ON 31.12.2011
32 Breweries and Distilleries 1 Assam 115.602 Goa 150.003 Jammu & Kashmir 110.004 Jharkhand 138.235 Karnataka 182.126 Sikkim 130.00
33 Brick Kiln Industry/Charcoal Kiln 1 Andhra Pradesh 188.962 Assam 115.603 Bihar 125.004 Chandigarh 234.305 Dadra and Nagar Haveli 156.206 Daman and Diu 156.207 Delhi 247.008 Goa 150.009 Jammu & Kashmir 110.0010 Jharkhand 138.2311 Karnataka 257.2012 Kerala 262.1013 Madhya Pradesh 175.0014 Maharashtra 163.7015 Nagaland 100.0016 Odisha 92.5017 Punjab 154.4018 Rajasthan 135.0019 Tamil Nadu 122.3020 Uttar Pradesh 165.5221 Uttarakhand 122.5822 West Bengal 134.00
34 Brick Making/ Tiles/Roof Tiles 1 Chattisgarh 164.502 Daman and Diu 156.203 Goa 150.004 Gujarat 160.405 Jammu & Kashmir 110.006 Karnataka 174.917 Kerala 189.508 Madhya Pradesh 175.009 Maharashstra 163.7010 Meghalaya 100.0011 Odisha 92.50
35 Brush and Brooms 1 Odisha 92.50
36 Buffalo and Cow Milk Premises 1 Assam 115.602 Dadra and Nagar Haveli 156.203 Daman and Diu 156.20
37 Building Material & Hardware 1 Chandigarh 234.30
38 Cable Operator & Allied Service 1 Rajasthan 135.002 Sikkim 130.00
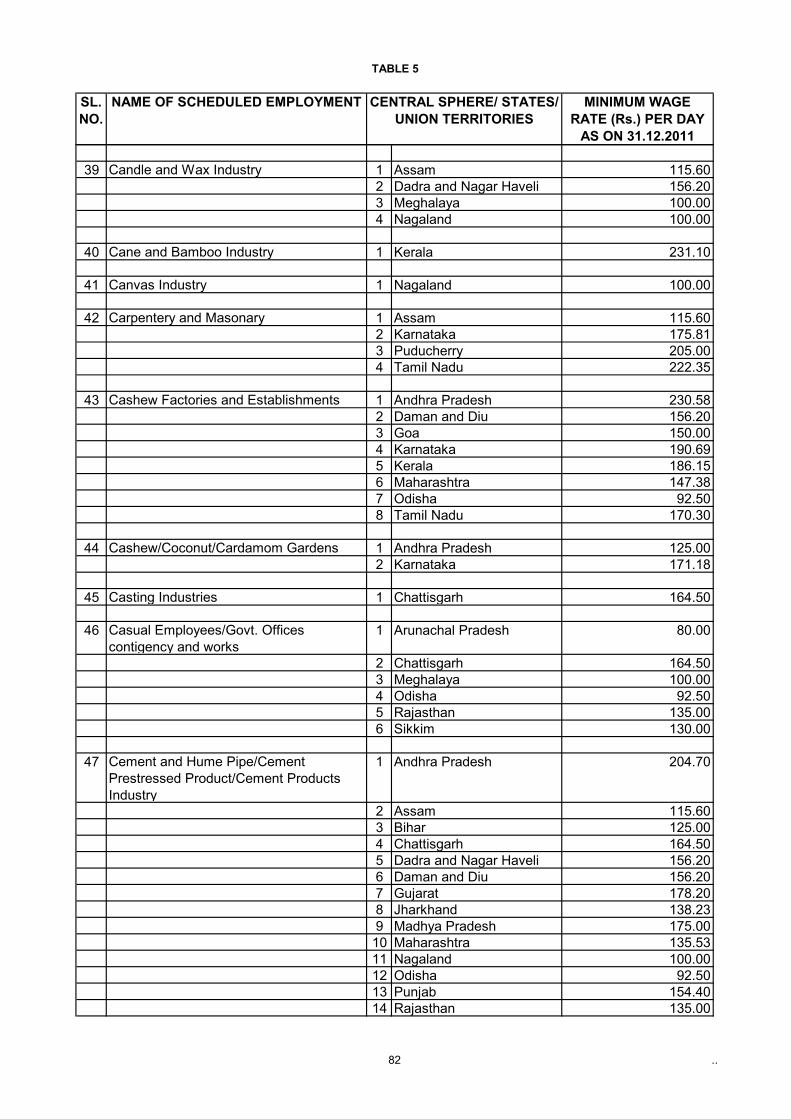
TABLE 5
82 ..
SL.NO.
NAME OF SCHEDULED EMPLOYMENT CENTRAL SPHERE/ STATES/ UNION TERRITORIES
MINIMUM WAGE RATE (Rs.) PER DAY
AS ON 31.12.2011
39 Candle and Wax Industry 1 Assam 115.602 Dadra and Nagar Haveli 156.203 Meghalaya 100.004 Nagaland 100.00
40 Cane and Bamboo Industry 1 Kerala 231.10
41 Canvas Industry 1 Nagaland 100.00
42 Carpentery and Masonary 1 Assam 115.602 Karnataka 175.813 Puducherry 205.004 Tamil Nadu 222.35
43 Cashew Factories and Establishments 1 Andhra Pradesh 230.582 Daman and Diu 156.203 Goa 150.004 Karnataka 190.695 Kerala 186.156 Maharashtra 147.387 Odisha 92.508 Tamil Nadu 170.30
44 Cashew/Coconut/Cardamom Gardens 1 Andhra Pradesh 125.002 Karnataka 171.18
45 Casting Industries 1 Chattisgarh 164.50
46 Casual Employees/Govt. Offices contigency and works
1 Arunachal Pradesh 80.00
2 Chattisgarh 164.503 Meghalaya 100.004 Odisha 92.505 Rajasthan 135.006 Sikkim 130.00
47 Cement and Hume Pipe/Cement Prestressed Product/Cement Products Industry
1 Andhra Pradesh 204.70
2 Assam 115.603 Bihar 125.004 Chattisgarh 164.505 Dadra and Nagar Haveli 156.206 Daman and Diu 156.207 Gujarat 178.208 Jharkhand 138.239 Madhya Pradesh 175.0010 Maharashtra 135.5311 Nagaland 100.0012 Odisha 92.5013 Punjab 154.4014 Rajasthan 135.00
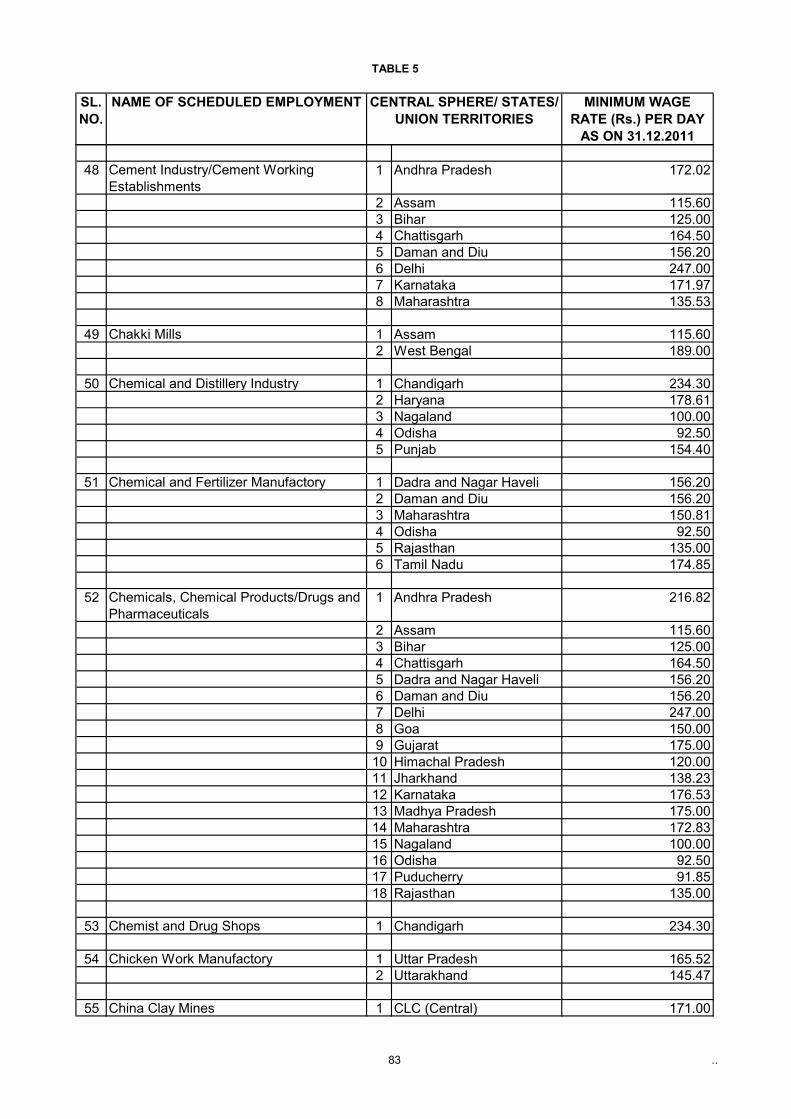
TABLE 5
83 ..
SL.NO.
NAME OF SCHEDULED EMPLOYMENT CENTRAL SPHERE/ STATES/ UNION TERRITORIES
MINIMUM WAGE RATE (Rs.) PER DAY
AS ON 31.12.2011
48 Cement Industry/Cement Working Establishments
1 Andhra Pradesh 172.02
2 Assam 115.603 Bihar 125.004 Chattisgarh 164.505 Daman and Diu 156.206 Delhi 247.007 Karnataka 171.978 Maharashtra 135.53
49 Chakki Mills 1 Assam 115.602 West Bengal 189.00
50 Chemical and Distillery Industry 1 Chandigarh 234.302 Haryana 178.613 Nagaland 100.004 Odisha 92.505 Punjab 154.40
51 Chemical and Fertilizer Manufactory 1 Dadra and Nagar Haveli 156.202 Daman and Diu 156.203 Maharashtra 150.814 Odisha 92.505 Rajasthan 135.006 Tamil Nadu 174.85
52 Chemicals, Chemical Products/Drugs and Pharmaceuticals
1 Andhra Pradesh 216.82
2 Assam 115.603 Bihar 125.004 Chattisgarh 164.505 Dadra and Nagar Haveli 156.206 Daman and Diu 156.207 Delhi 247.008 Goa 150.009 Gujarat 175.0010 Himachal Pradesh 120.0011 Jharkhand 138.2312 Karnataka 176.5313 Madhya Pradesh 175.0014 Maharashtra 172.8315 Nagaland 100.0016 Odisha 92.5017 Puducherry 91.8518 Rajasthan 135.00
53 Chemist and Drug Shops 1 Chandigarh 234.30
54 Chicken Work Manufactory 1 Uttar Pradesh 165.522 Uttarakhand 145.47
55 China Clay Mines 1 CLC (Central) 171.00
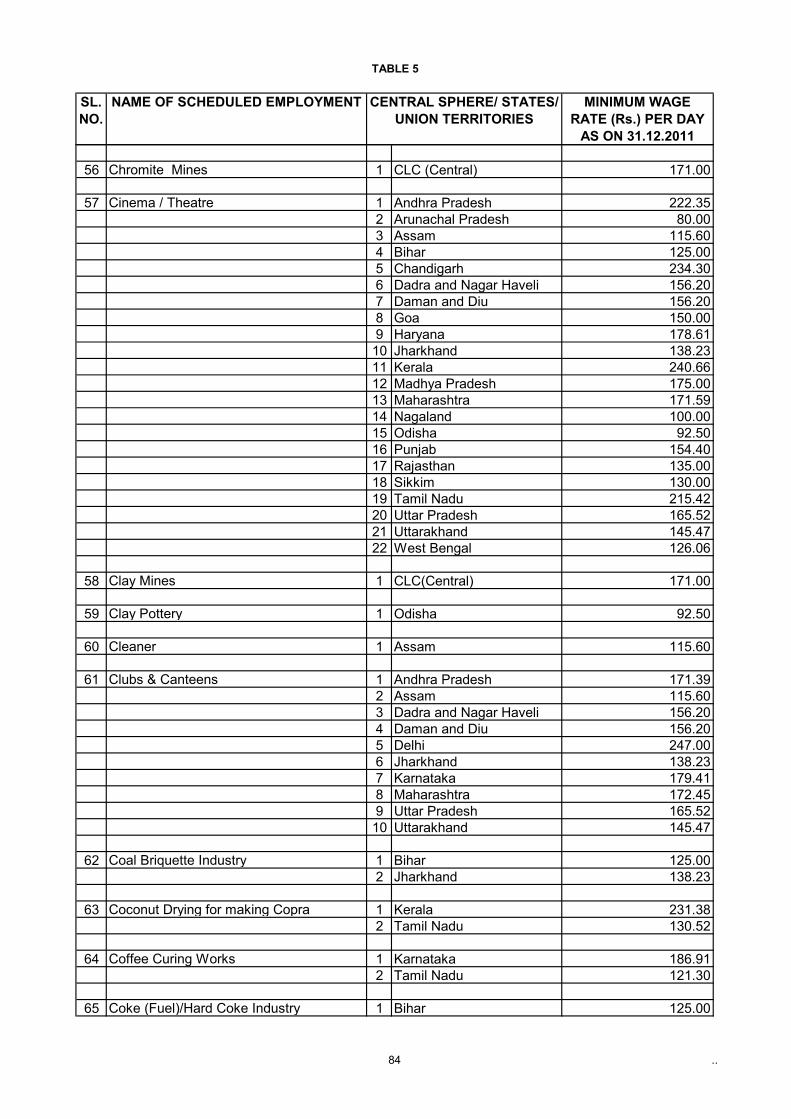
TABLE 5
84 ..
SL.NO.
NAME OF SCHEDULED EMPLOYMENT CENTRAL SPHERE/ STATES/ UNION TERRITORIES
MINIMUM WAGE RATE (Rs.) PER DAY
AS ON 31.12.2011
56 Chromite Mines 1 CLC (Central) 171.00
57 Cinema / Theatre 1 Andhra Pradesh 222.352 Arunachal Pradesh 80.003 Assam 115.604 Bihar 125.005 Chandigarh 234.306 Dadra and Nagar Haveli 156.207 Daman and Diu 156.208 Goa 150.009 Haryana 178.6110 Jharkhand 138.2311 Kerala 240.6612 Madhya Pradesh 175.0013 Maharashtra 171.5914 Nagaland 100.0015 Odisha 92.5016 Punjab 154.4017 Rajasthan 135.0018 Sikkim 130.0019 Tamil Nadu 215.4220 Uttar Pradesh 165.5221 Uttarakhand 145.4722 West Bengal 126.06
58 Clay Mines 1 CLC(Central) 171.00
59 Clay Pottery 1 Odisha 92.50
60 Cleaner 1 Assam 115.60
61 Clubs & Canteens 1 Andhra Pradesh 171.392 Assam 115.603 Dadra and Nagar Haveli 156.204 Daman and Diu 156.205 Delhi 247.006 Jharkhand 138.237 Karnataka 179.418 Maharashtra 172.459 Uttar Pradesh 165.5210 Uttarakhand 145.47
62 Coal Briquette Industry 1 Bihar 125.002 Jharkhand 138.23
63 Coconut Drying for making Copra 1 Kerala 231.382 Tamil Nadu 130.52
64 Coffee Curing Works 1 Karnataka 186.912 Tamil Nadu 121.30
65 Coke (Fuel)/Hard Coke Industry 1 Bihar 125.00
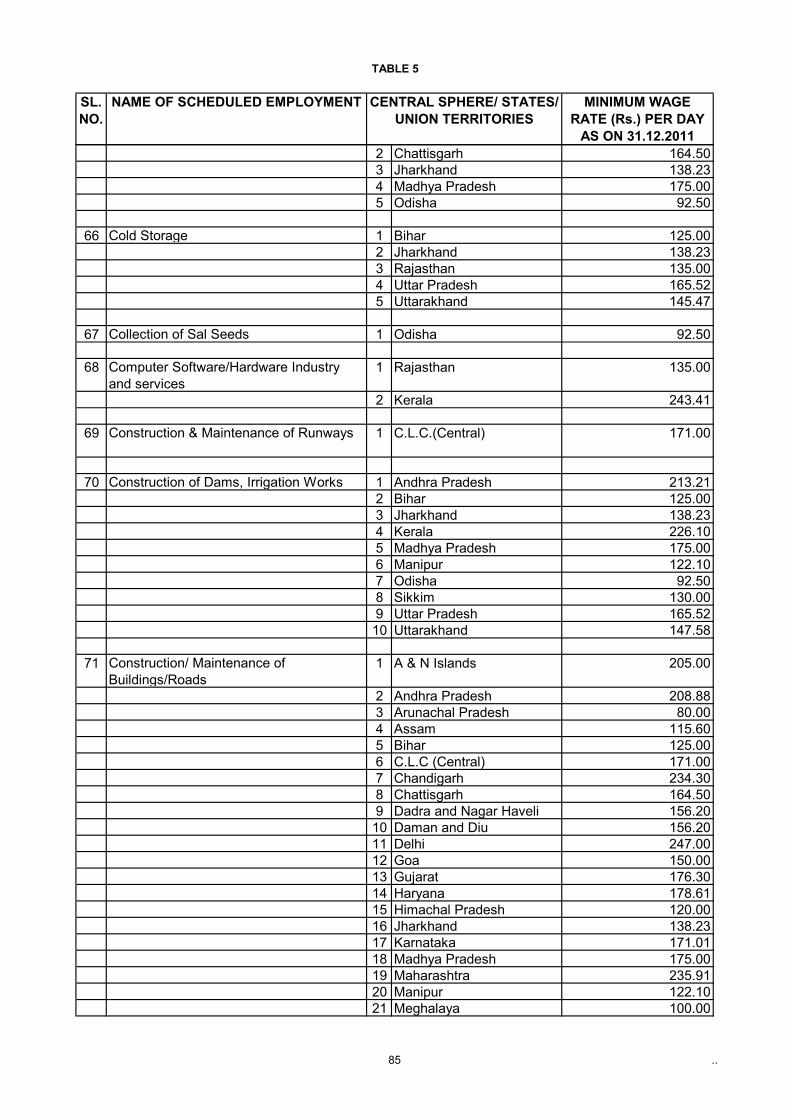
TABLE 5
85 ..
SL.NO.
NAME OF SCHEDULED EMPLOYMENT CENTRAL SPHERE/ STATES/ UNION TERRITORIES
MINIMUM WAGE RATE (Rs.) PER DAY
AS ON 31.12.20112 Chattisgarh 164.503 Jharkhand 138.234 Madhya Pradesh 175.005 Odisha 92.50
66 Cold Storage 1 Bihar 125.002 Jharkhand 138.233 Rajasthan 135.004 Uttar Pradesh 165.525 Uttarakhand 145.47
67 Collection of Sal Seeds 1 Odisha 92.50
68 Computer Software/Hardware Industry and services
1 Rajasthan 135.00
2 Kerala 243.41
69 Construction & Maintenance of Runways 1 C.L.C.(Central) 171.00
70 Construction of Dams, Irrigation Works 1 Andhra Pradesh 213.212 Bihar 125.003 Jharkhand 138.234 Kerala 226.105 Madhya Pradesh 175.006 Manipur 122.107 Odisha 92.508 Sikkim 130.009 Uttar Pradesh 165.5210 Uttarakhand 147.58
71 Construction/ Maintenance of Buildings/Roads
1 A & N Islands 205.00
2 Andhra Pradesh 208.883 Arunachal Pradesh 80.004 Assam 115.605 Bihar 125.006 C.L.C (Central) 171.007 Chandigarh 234.308 Chattisgarh 164.509 Dadra and Nagar Haveli 156.2010 Daman and Diu 156.2011 Delhi 247.0012 Goa 150.0013 Gujarat 176.3014 Haryana 178.6115 Himachal Pradesh 120.0016 Jharkhand 138.2317 Karnataka 171.0118 Madhya Pradesh 175.0019 Maharashtra 235.9120 Manipur 122.1021 Meghalaya 100.00
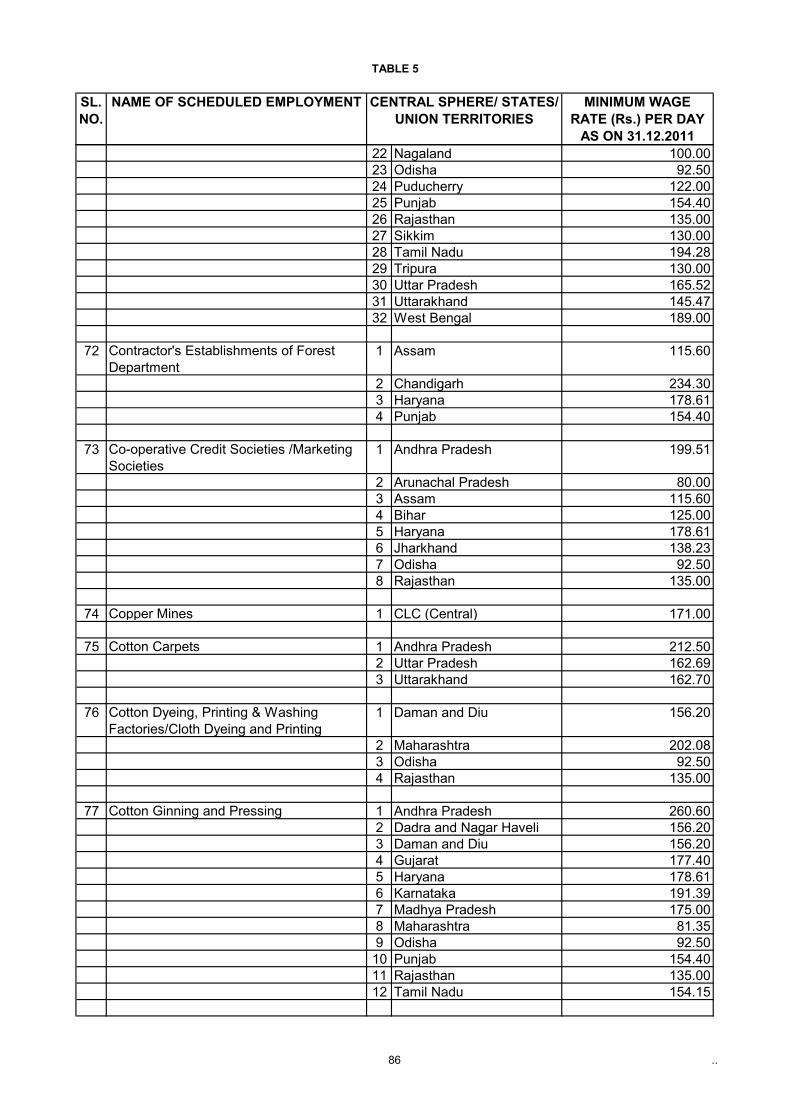
TABLE 5
86 ..
SL.NO.
NAME OF SCHEDULED EMPLOYMENT CENTRAL SPHERE/ STATES/ UNION TERRITORIES
MINIMUM WAGE RATE (Rs.) PER DAY
AS ON 31.12.201122 Nagaland 100.0023 Odisha 92.5024 Puducherry 122.0025 Punjab 154.4026 Rajasthan 135.0027 Sikkim 130.0028 Tamil Nadu 194.2829 Tripura 130.0030 Uttar Pradesh 165.5231 Uttarakhand 145.4732 West Bengal 189.00
72 Contractor's Establishments of Forest Department
1 Assam 115.60
2 Chandigarh 234.303 Haryana 178.614 Punjab 154.40
73 Co-operative Credit Societies /Marketing Societies
1 Andhra Pradesh 199.51
2 Arunachal Pradesh 80.003 Assam 115.604 Bihar 125.005 Haryana 178.616 Jharkhand 138.237 Odisha 92.508 Rajasthan 135.00
74 Copper Mines 1 CLC (Central) 171.00
75 Cotton Carpets 1 Andhra Pradesh 212.502 Uttar Pradesh 162.693 Uttarakhand 162.70
76 Cotton Dyeing, Printing & Washing Factories/Cloth Dyeing and Printing
1 Daman and Diu 156.20
2 Maharashtra 202.083 Odisha 92.504 Rajasthan 135.00
77 Cotton Ginning and Pressing 1 Andhra Pradesh 260.602 Dadra and Nagar Haveli 156.203 Daman and Diu 156.204 Gujarat 177.405 Haryana 178.616 Karnataka 191.397 Madhya Pradesh 175.008 Maharashtra 81.359 Odisha 92.5010 Punjab 154.4011 Rajasthan 135.0012 Tamil Nadu 154.15
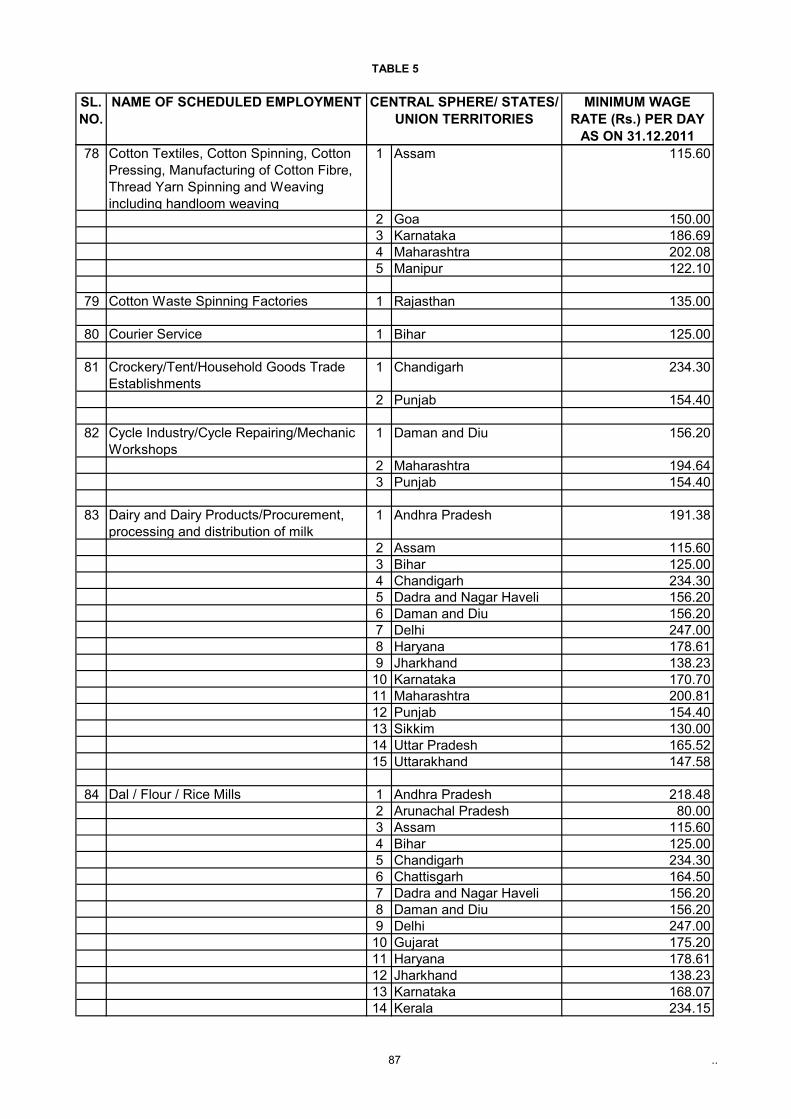
TABLE 5
87 ..
SL.NO.
NAME OF SCHEDULED EMPLOYMENT CENTRAL SPHERE/ STATES/ UNION TERRITORIES
MINIMUM WAGE RATE (Rs.) PER DAY
AS ON 31.12.201178 Cotton Textiles, Cotton Spinning, Cotton
Pressing, Manufacturing of Cotton Fibre, Thread Yarn Spinning and Weaving including handloom weaving
1 Assam 115.60
2 Goa 150.003 Karnataka 186.694 Maharashtra 202.085 Manipur 122.10
79 Cotton Waste Spinning Factories 1 Rajasthan 135.00
80 Courier Service 1 Bihar 125.00
81 Crockery/Tent/Household Goods Trade Establishments
1 Chandigarh 234.30
2 Punjab 154.40
82 Cycle Industry/Cycle Repairing/Mechanic Workshops
1 Daman and Diu 156.20
2 Maharashtra 194.643 Punjab 154.40
83 Dairy and Dairy Products/Procurement, processing and distribution of milk
1 Andhra Pradesh 191.38
2 Assam 115.603 Bihar 125.004 Chandigarh 234.305 Dadra and Nagar Haveli 156.206 Daman and Diu 156.207 Delhi 247.008 Haryana 178.619 Jharkhand 138.2310 Karnataka 170.7011 Maharashtra 200.8112 Punjab 154.4013 Sikkim 130.0014 Uttar Pradesh 165.5215 Uttarakhand 147.58
84 Dal / Flour / Rice Mills 1 Andhra Pradesh 218.482 Arunachal Pradesh 80.003 Assam 115.604 Bihar 125.005 Chandigarh 234.306 Chattisgarh 164.507 Dadra and Nagar Haveli 156.208 Daman and Diu 156.209 Delhi 247.0010 Gujarat 175.2011 Haryana 178.6112 Jharkhand 138.2313 Karnataka 168.0714 Kerala 234.15
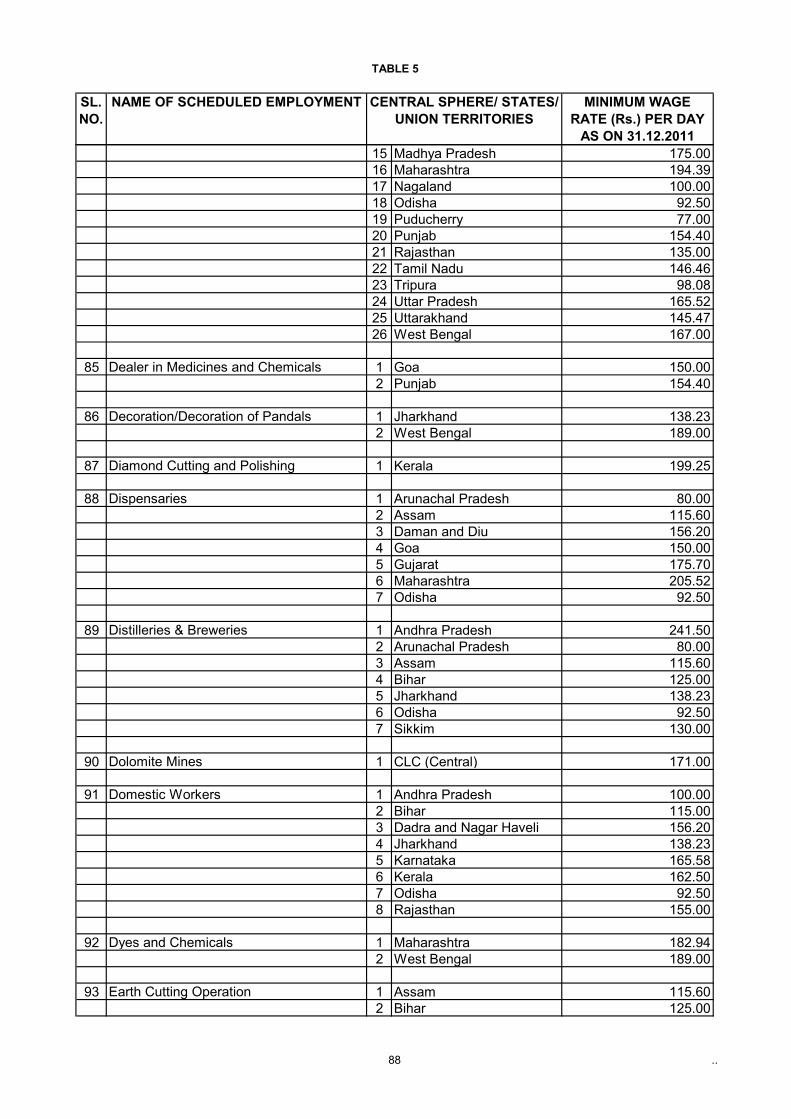
TABLE 5
88 ..
SL.NO.
NAME OF SCHEDULED EMPLOYMENT CENTRAL SPHERE/ STATES/ UNION TERRITORIES
MINIMUM WAGE RATE (Rs.) PER DAY
AS ON 31.12.201115 Madhya Pradesh 175.0016 Maharashtra 194.3917 Nagaland 100.0018 Odisha 92.5019 Puducherry 77.0020 Punjab 154.4021 Rajasthan 135.0022 Tamil Nadu 146.4623 Tripura 98.0824 Uttar Pradesh 165.5225 Uttarakhand 145.4726 West Bengal 167.00
85 Dealer in Medicines and Chemicals 1 Goa 150.002 Punjab 154.40
86 Decoration/Decoration of Pandals 1 Jharkhand 138.232 West Bengal 189.00
87 Diamond Cutting and Polishing 1 Kerala 199.25
88 Dispensaries 1 Arunachal Pradesh 80.002 Assam 115.603 Daman and Diu 156.204 Goa 150.005 Gujarat 175.706 Maharashtra 205.527 Odisha 92.50
89 Distilleries & Breweries 1 Andhra Pradesh 241.502 Arunachal Pradesh 80.003 Assam 115.604 Bihar 125.005 Jharkhand 138.236 Odisha 92.507 Sikkim 130.00
90 Dolomite Mines 1 CLC (Central) 171.00
91 Domestic Workers 1 Andhra Pradesh 100.002 Bihar 115.003 Dadra and Nagar Haveli 156.204 Jharkhand 138.235 Karnataka 165.586 Kerala 162.507 Odisha 92.508 Rajasthan 155.00
92 Dyes and Chemicals 1 Maharashtra 182.942 West Bengal 189.00
93 Earth Cutting Operation 1 Assam 115.602 Bihar 125.00
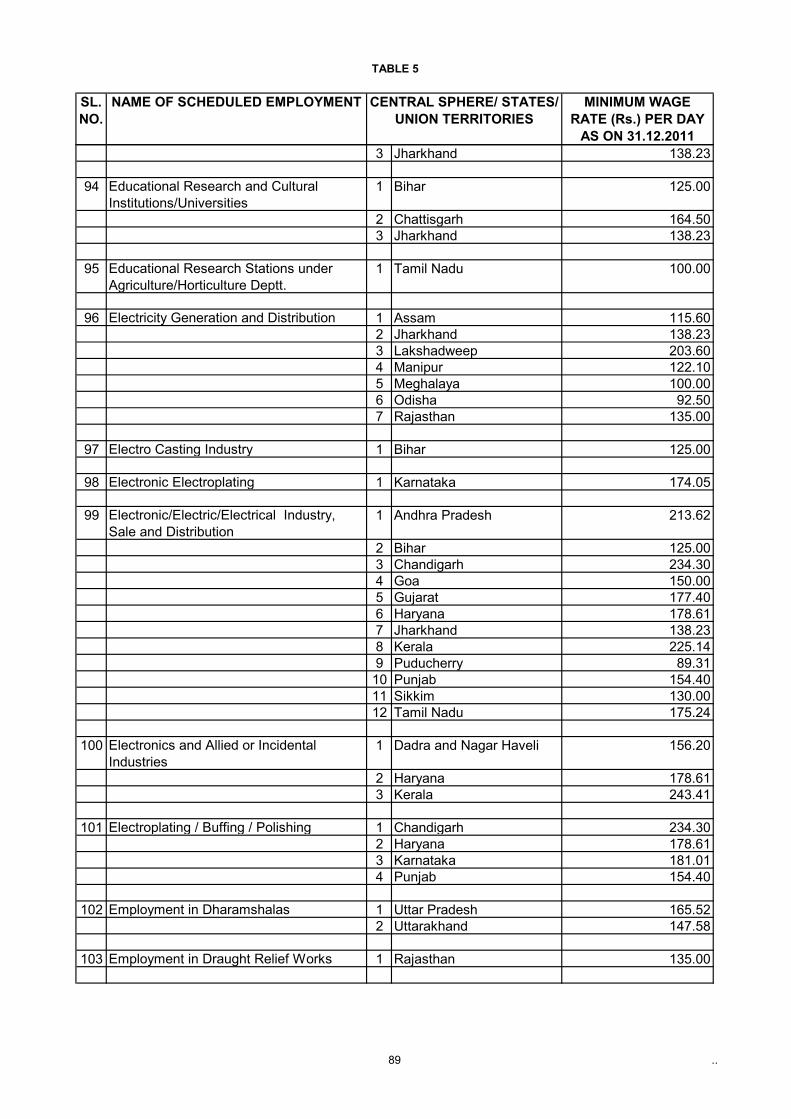
TABLE 5
89 ..
SL.NO.
NAME OF SCHEDULED EMPLOYMENT CENTRAL SPHERE/ STATES/ UNION TERRITORIES
MINIMUM WAGE RATE (Rs.) PER DAY
AS ON 31.12.20113 Jharkhand 138.23
94 Educational Research and Cultural Institutions/Universities
1 Bihar 125.00
2 Chattisgarh 164.503 Jharkhand 138.23
95 Educational Research Stations under Agriculture/Horticulture Deptt.
1 Tamil Nadu 100.00
96 Electricity Generation and Distribution 1 Assam 115.602 Jharkhand 138.233 Lakshadweep 203.604 Manipur 122.105 Meghalaya 100.006 Odisha 92.507 Rajasthan 135.00
97 Electro Casting Industry 1 Bihar 125.00
98 Electronic Electroplating 1 Karnataka 174.05
99 Electronic/Electric/Electrical Industry, Sale and Distribution
1 Andhra Pradesh 213.62
2 Bihar 125.003 Chandigarh 234.304 Goa 150.005 Gujarat 177.406 Haryana 178.617 Jharkhand 138.238 Kerala 225.149 Puducherry 89.3110 Punjab 154.4011 Sikkim 130.0012 Tamil Nadu 175.24
100 Electronics and Allied or Incidental Industries
1 Dadra and Nagar Haveli 156.20
2 Haryana 178.613 Kerala 243.41
101 Electroplating / Buffing / Polishing 1 Chandigarh 234.302 Haryana 178.613 Karnataka 181.014 Punjab 154.40
102 Employment in Dharamshalas 1 Uttar Pradesh 165.522 Uttarakhand 147.58
103 Employment in Draught Relief Works 1 Rajasthan 135.00
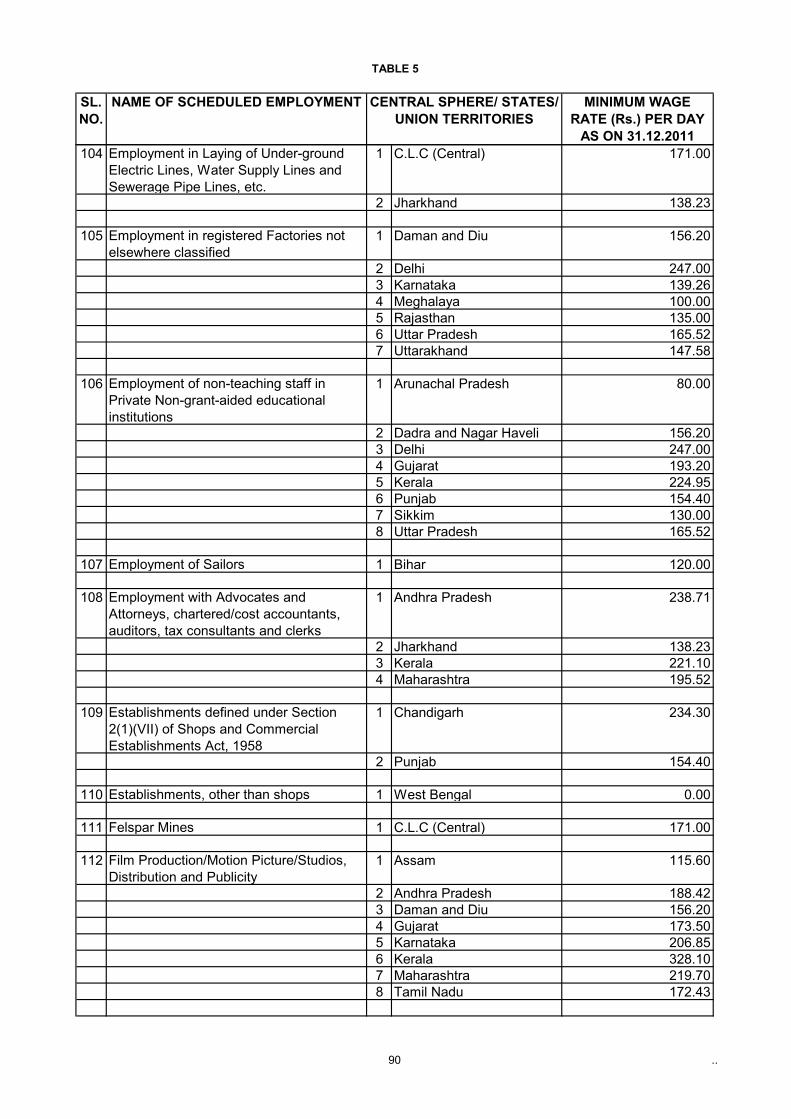
TABLE 5
90 ..
SL.NO.
NAME OF SCHEDULED EMPLOYMENT CENTRAL SPHERE/ STATES/ UNION TERRITORIES
MINIMUM WAGE RATE (Rs.) PER DAY
AS ON 31.12.2011104 Employment in Laying of Under-ground
Electric Lines, Water Supply Lines and Sewerage Pipe Lines, etc.
1 C.L.C (Central) 171.00
2 Jharkhand 138.23
105 Employment in registered Factories not elsewhere classified
1 Daman and Diu 156.20
2 Delhi 247.003 Karnataka 139.264 Meghalaya 100.005 Rajasthan 135.006 Uttar Pradesh 165.527 Uttarakhand 147.58
106 Employment of non-teaching staff in Private Non-grant-aided educational institutions
1 Arunachal Pradesh 80.00
2 Dadra and Nagar Haveli 156.203 Delhi 247.004 Gujarat 193.205 Kerala 224.956 Punjab 154.407 Sikkim 130.008 Uttar Pradesh 165.52
107 Employment of Sailors 1 Bihar 120.00
108 Employment with Advocates and Attorneys, chartered/cost accountants, auditors, tax consultants and clerks
1 Andhra Pradesh 238.71
2 Jharkhand 138.233 Kerala 221.104 Maharashtra 195.52
109 Establishments defined under Section 2(1)(VII) of Shops and Commercial Establishments Act, 1958
1 Chandigarh 234.30
2 Punjab 154.40
110 Establishments, other than shops 1 West Bengal 0.00
111 Felspar Mines 1 C.L.C (Central) 171.00
112 Film Production/Motion Picture/Studios, Distribution and Publicity
1 Assam 115.60
2 Andhra Pradesh 188.423 Daman and Diu 156.204 Gujarat 173.505 Karnataka 206.856 Kerala 328.107 Maharashtra 219.708 Tamil Nadu 172.43
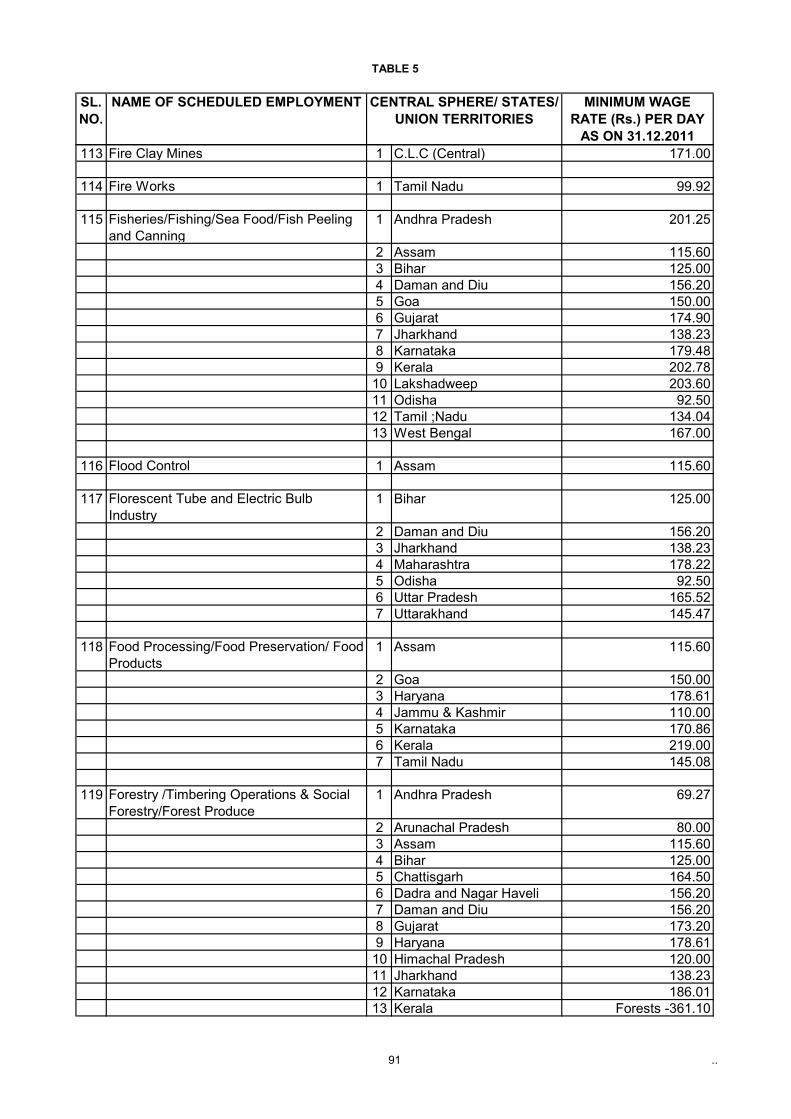
TABLE 5
91 ..
SL.NO.
NAME OF SCHEDULED EMPLOYMENT CENTRAL SPHERE/ STATES/ UNION TERRITORIES
MINIMUM WAGE RATE (Rs.) PER DAY
AS ON 31.12.2011113 Fire Clay Mines 1 C.L.C (Central) 171.00
114 Fire Works 1 Tamil Nadu 99.92
115 Fisheries/Fishing/Sea Food/Fish Peeling and Canning
1 Andhra Pradesh 201.25
2 Assam 115.603 Bihar 125.004 Daman and Diu 156.205 Goa 150.006 Gujarat 174.907 Jharkhand 138.238 Karnataka 179.489 Kerala 202.7810 Lakshadweep 203.6011 Odisha 92.5012 Tamil ;Nadu 134.0413 West Bengal 167.00
116 Flood Control 1 Assam 115.60
117 Florescent Tube and Electric Bulb Industry
1 Bihar 125.00
2 Daman and Diu 156.203 Jharkhand 138.234 Maharashtra 178.225 Odisha 92.506 Uttar Pradesh 165.527 Uttarakhand 145.47
118 Food Processing/Food Preservation/ Food Products
1 Assam 115.60
2 Goa 150.003 Haryana 178.614 Jammu & Kashmir 110.005 Karnataka 170.866 Kerala 219.007 Tamil Nadu 145.08
119 Forestry /Timbering Operations & Social Forestry/Forest Produce
1 Andhra Pradesh 69.27
2 Arunachal Pradesh 80.003 Assam 115.604 Bihar 125.005 Chattisgarh 164.506 Dadra and Nagar Haveli 156.207 Daman and Diu 156.208 Gujarat 173.209 Haryana 178.6110 Himachal Pradesh 120.0011 Jharkhand 138.2312 Karnataka 186.0113 Kerala Forests -361.10
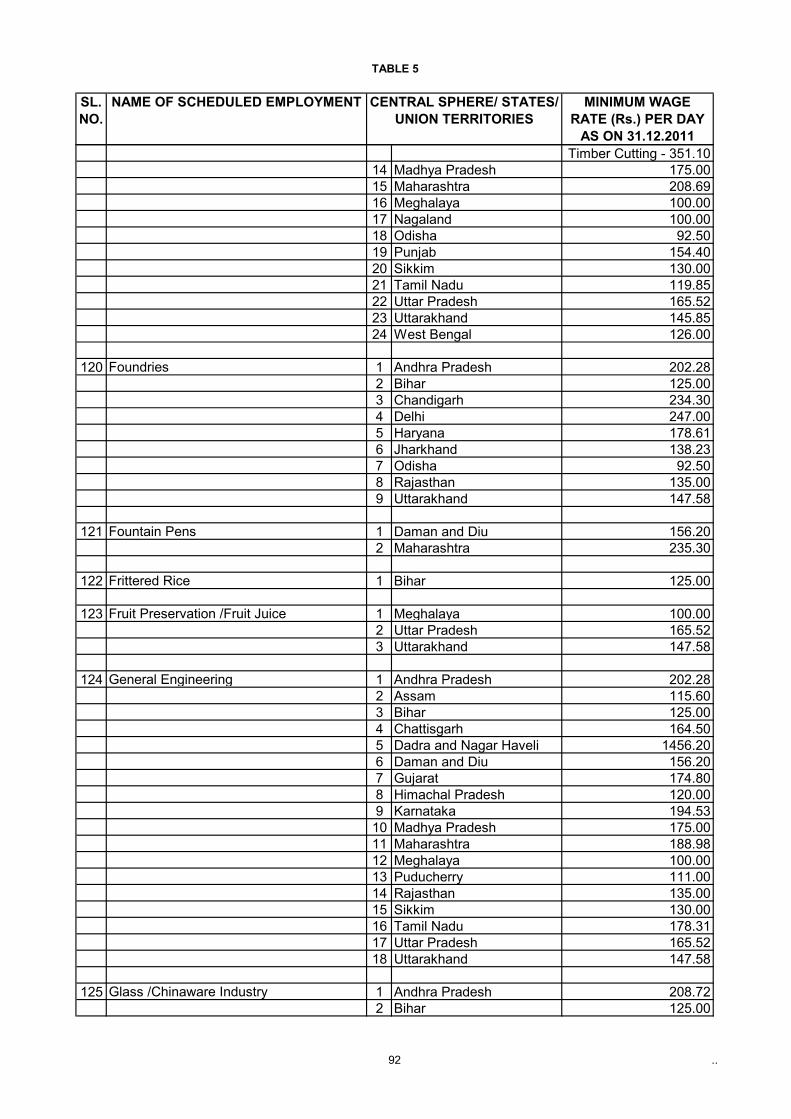
TABLE 5
92 ..
SL.NO.
NAME OF SCHEDULED EMPLOYMENT CENTRAL SPHERE/ STATES/ UNION TERRITORIES
MINIMUM WAGE RATE (Rs.) PER DAY
AS ON 31.12.2011Timber Cutting - 351.10
14 Madhya Pradesh 175.0015 Maharashtra 208.6916 Meghalaya 100.0017 Nagaland 100.0018 Odisha 92.5019 Punjab 154.4020 Sikkim 130.0021 Tamil Nadu 119.8522 Uttar Pradesh 165.5223 Uttarakhand 145.8524 West Bengal 126.00
120 Foundries 1 Andhra Pradesh 202.282 Bihar 125.003 Chandigarh 234.304 Delhi 247.005 Haryana 178.616 Jharkhand 138.237 Odisha 92.508 Rajasthan 135.009 Uttarakhand 147.58
121 Fountain Pens 1 Daman and Diu 156.202 Maharashtra 235.30
122 Frittered Rice 1 Bihar 125.00
123 Fruit Preservation /Fruit Juice 1 Meghalaya 100.002 Uttar Pradesh 165.523 Uttarakhand 147.58
124 General Engineering 1 Andhra Pradesh 202.282 Assam 115.603 Bihar 125.004 Chattisgarh 164.505 Dadra and Nagar Haveli 1456.206 Daman and Diu 156.207 Gujarat 174.808 Himachal Pradesh 120.009 Karnataka 194.5310 Madhya Pradesh 175.0011 Maharashtra 188.9812 Meghalaya 100.0013 Puducherry 111.0014 Rajasthan 135.0015 Sikkim 130.0016 Tamil Nadu 178.3117 Uttar Pradesh 165.5218 Uttarakhand 147.58
125 Glass /Chinaware Industry 1 Andhra Pradesh 208.722 Bihar 125.00
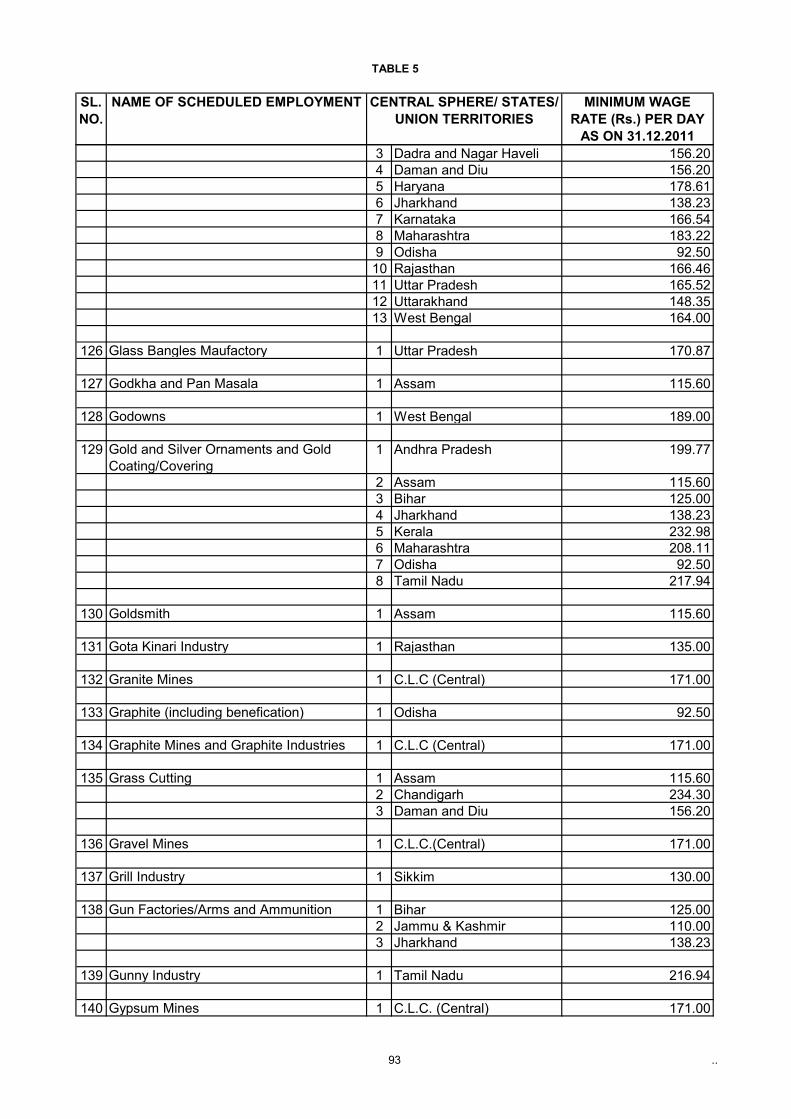
TABLE 5
93 ..
SL.NO.
NAME OF SCHEDULED EMPLOYMENT CENTRAL SPHERE/ STATES/ UNION TERRITORIES
MINIMUM WAGE RATE (Rs.) PER DAY
AS ON 31.12.20113 Dadra and Nagar Haveli 156.204 Daman and Diu 156.205 Haryana 178.616 Jharkhand 138.237 Karnataka 166.548 Maharashtra 183.229 Odisha 92.5010 Rajasthan 166.4611 Uttar Pradesh 165.5212 Uttarakhand 148.3513 West Bengal 164.00
126 Glass Bangles Maufactory 1 Uttar Pradesh 170.87
127 Godkha and Pan Masala 1 Assam 115.60
128 Godowns 1 West Bengal 189.00
129 Gold and Silver Ornaments and Gold Coating/Covering
1 Andhra Pradesh 199.77
2 Assam 115.603 Bihar 125.004 Jharkhand 138.235 Kerala 232.986 Maharashtra 208.117 Odisha 92.508 Tamil Nadu 217.94
130 Goldsmith 1 Assam 115.60
131 Gota Kinari Industry 1 Rajasthan 135.00
132 Granite Mines 1 C.L.C (Central) 171.00
133 Graphite (including benefication) 1 Odisha 92.50
134 Graphite Mines and Graphite Industries 1 C.L.C (Central) 171.00
135 Grass Cutting 1 Assam 115.602 Chandigarh 234.303 Daman and Diu 156.20
136 Gravel Mines 1 C.L.C.(Central) 171.00
137 Grill Industry 1 Sikkim 130.00
138 Gun Factories/Arms and Ammunition 1 Bihar 125.002 Jammu & Kashmir 110.003 Jharkhand 138.23
139 Gunny Industry 1 Tamil Nadu 216.94
140 Gypsum Mines 1 C.L.C. (Central) 171.00
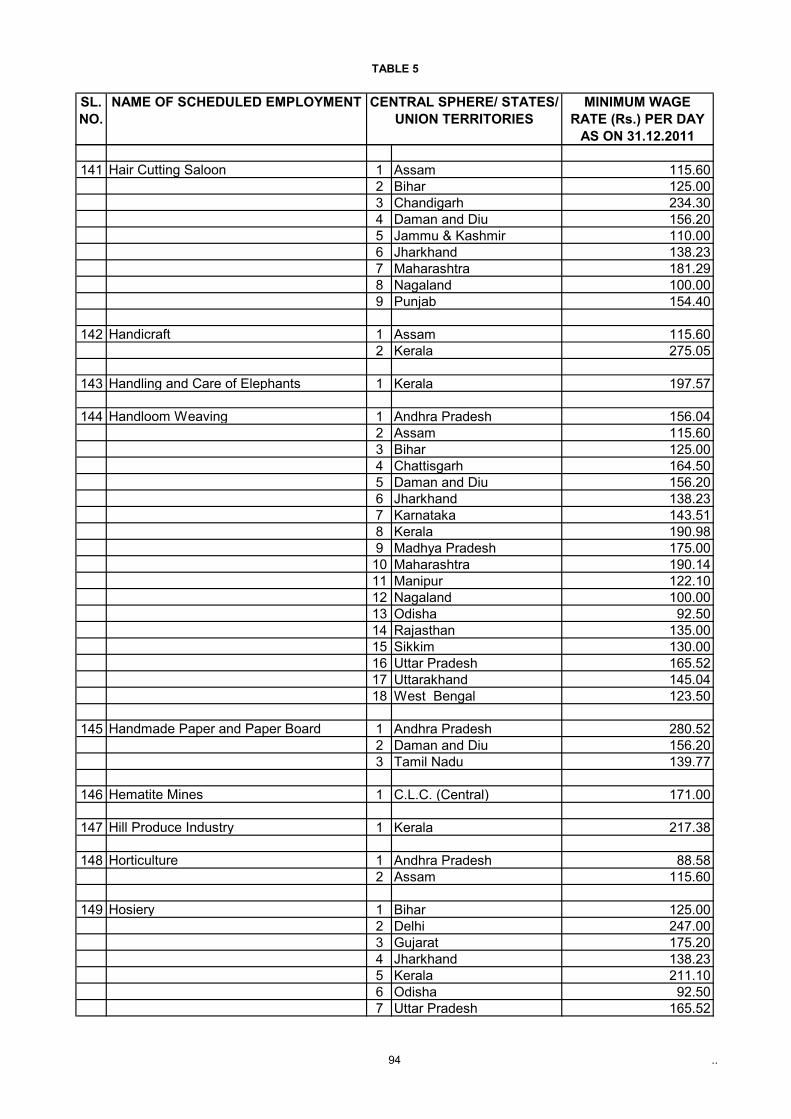
TABLE 5
94 ..
SL.NO.
NAME OF SCHEDULED EMPLOYMENT CENTRAL SPHERE/ STATES/ UNION TERRITORIES
MINIMUM WAGE RATE (Rs.) PER DAY
AS ON 31.12.2011
141 Hair Cutting Saloon 1 Assam 115.602 Bihar 125.003 Chandigarh 234.304 Daman and Diu 156.205 Jammu & Kashmir 110.006 Jharkhand 138.237 Maharashtra 181.298 Nagaland 100.009 Punjab 154.40
142 Handicraft 1 Assam 115.602 Kerala 275.05
143 Handling and Care of Elephants 1 Kerala 197.57
144 Handloom Weaving 1 Andhra Pradesh 156.042 Assam 115.603 Bihar 125.004 Chattisgarh 164.505 Daman and Diu 156.206 Jharkhand 138.237 Karnataka 143.518 Kerala 190.989 Madhya Pradesh 175.0010 Maharashtra 190.1411 Manipur 122.1012 Nagaland 100.0013 Odisha 92.5014 Rajasthan 135.0015 Sikkim 130.0016 Uttar Pradesh 165.5217 Uttarakhand 145.0418 West Bengal 123.50
145 Handmade Paper and Paper Board 1 Andhra Pradesh 280.522 Daman and Diu 156.203 Tamil Nadu 139.77
146 Hematite Mines 1 C.L.C. (Central) 171.00
147 Hill Produce Industry 1 Kerala 217.38
148 Horticulture 1 Andhra Pradesh 88.582 Assam 115.60
149 Hosiery 1 Bihar 125.002 Delhi 247.003 Gujarat 175.204 Jharkhand 138.235 Kerala 211.106 Odisha 92.507 Uttar Pradesh 165.52
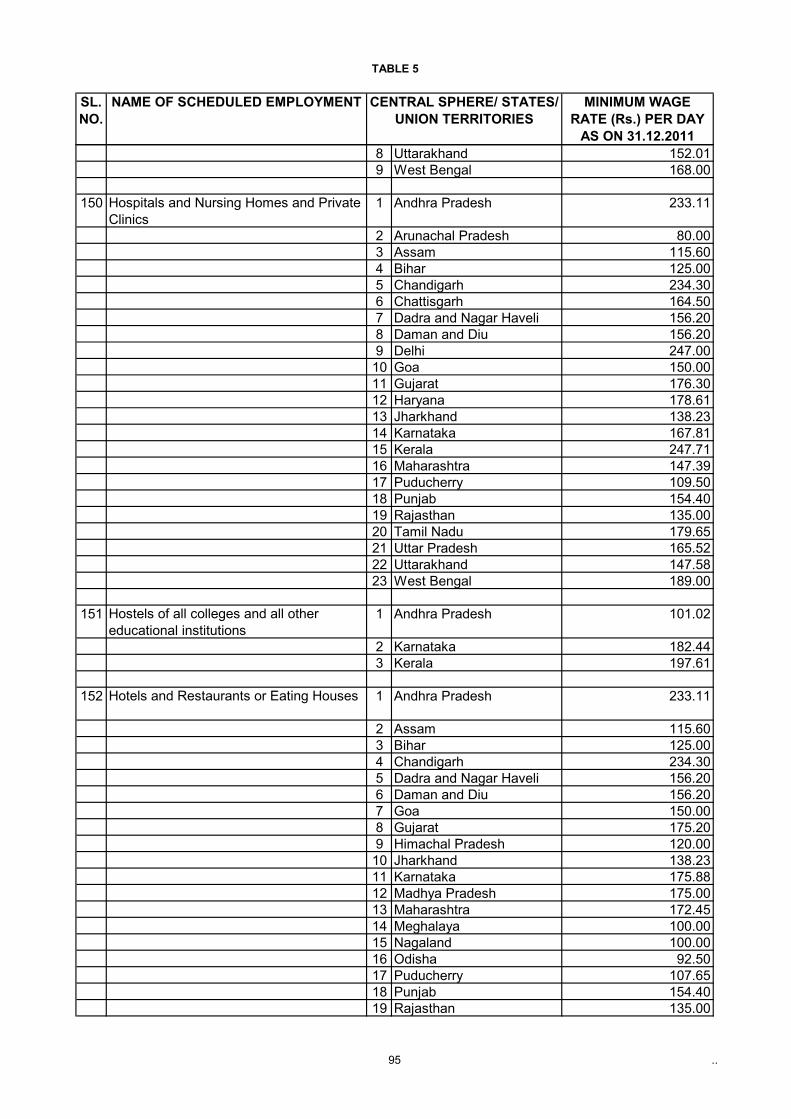
TABLE 5
95 ..
SL.NO.
NAME OF SCHEDULED EMPLOYMENT CENTRAL SPHERE/ STATES/ UNION TERRITORIES
MINIMUM WAGE RATE (Rs.) PER DAY
AS ON 31.12.20118 Uttarakhand 152.019 West Bengal 168.00
150 Hospitals and Nursing Homes and Private Clinics
1 Andhra Pradesh 233.11
2 Arunachal Pradesh 80.003 Assam 115.604 Bihar 125.005 Chandigarh 234.306 Chattisgarh 164.507 Dadra and Nagar Haveli 156.208 Daman and Diu 156.209 Delhi 247.0010 Goa 150.0011 Gujarat 176.3012 Haryana 178.6113 Jharkhand 138.2314 Karnataka 167.8115 Kerala 247.7116 Maharashtra 147.3917 Puducherry 109.5018 Punjab 154.4019 Rajasthan 135.0020 Tamil Nadu 179.6521 Uttar Pradesh 165.5222 Uttarakhand 147.5823 West Bengal 189.00
151 Hostels of all colleges and all other educational institutions
1 Andhra Pradesh 101.02
2 Karnataka 182.443 Kerala 197.61
152 Hotels and Restaurants or Eating Houses 1 Andhra Pradesh 233.11
2 Assam 115.603 Bihar 125.004 Chandigarh 234.305 Dadra and Nagar Haveli 156.206 Daman and Diu 156.207 Goa 150.008 Gujarat 175.209 Himachal Pradesh 120.0010 Jharkhand 138.2311 Karnataka 175.8812 Madhya Pradesh 175.0013 Maharashtra 172.4514 Meghalaya 100.0015 Nagaland 100.0016 Odisha 92.5017 Puducherry 107.6518 Punjab 154.4019 Rajasthan 135.00
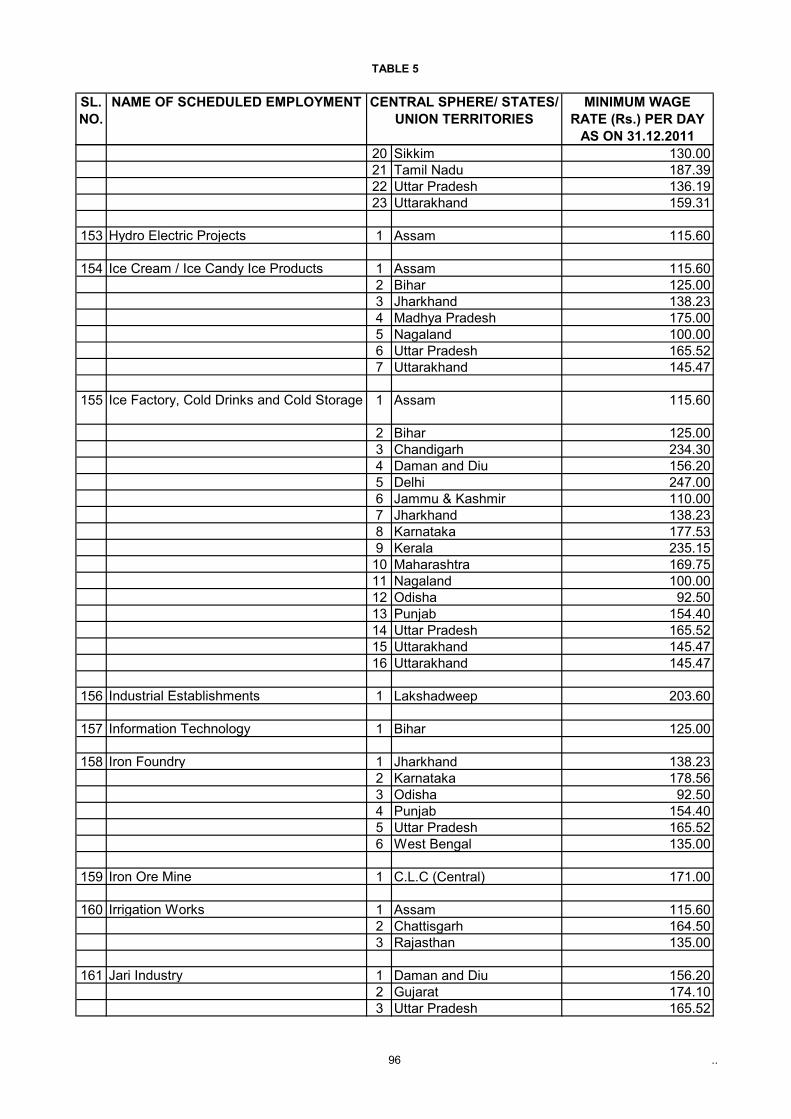
TABLE 5
96 ..
SL.NO.
NAME OF SCHEDULED EMPLOYMENT CENTRAL SPHERE/ STATES/ UNION TERRITORIES
MINIMUM WAGE RATE (Rs.) PER DAY
AS ON 31.12.201120 Sikkim 130.0021 Tamil Nadu 187.3922 Uttar Pradesh 136.1923 Uttarakhand 159.31
153 Hydro Electric Projects 1 Assam 115.60
154 Ice Cream / Ice Candy Ice Products 1 Assam 115.602 Bihar 125.003 Jharkhand 138.234 Madhya Pradesh 175.005 Nagaland 100.006 Uttar Pradesh 165.527 Uttarakhand 145.47
155 Ice Factory, Cold Drinks and Cold Storage 1 Assam 115.60
2 Bihar 125.003 Chandigarh 234.304 Daman and Diu 156.205 Delhi 247.006 Jammu & Kashmir 110.007 Jharkhand 138.238 Karnataka 177.539 Kerala 235.1510 Maharashtra 169.7511 Nagaland 100.0012 Odisha 92.5013 Punjab 154.4014 Uttar Pradesh 165.5215 Uttarakhand 145.4716 Uttarakhand 145.47
156 Industrial Establishments 1 Lakshadweep 203.60
157 Information Technology 1 Bihar 125.00
158 Iron Foundry 1 Jharkhand 138.232 Karnataka 178.563 Odisha 92.504 Punjab 154.405 Uttar Pradesh 165.526 West Bengal 135.00
159 Iron Ore Mine 1 C.L.C (Central) 171.00
160 Irrigation Works 1 Assam 115.602 Chattisgarh 164.503 Rajasthan 135.00
161 Jari Industry 1 Daman and Diu 156.202 Gujarat 174.103 Uttar Pradesh 165.52
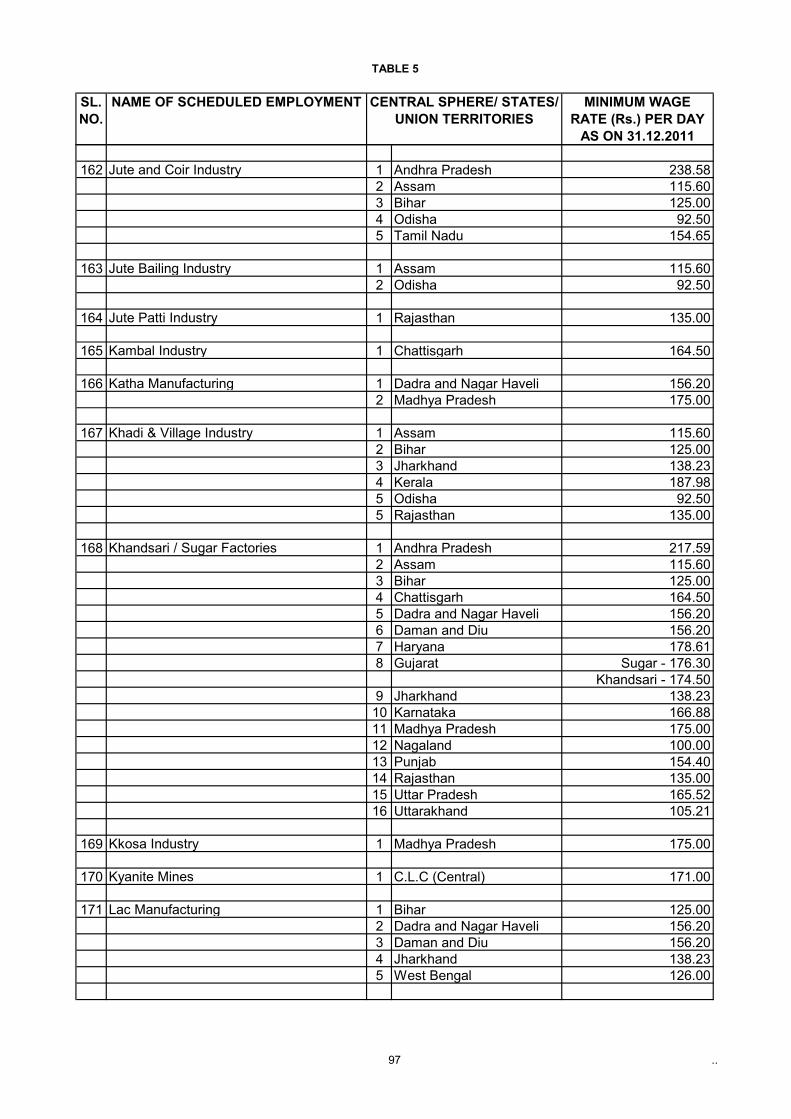
TABLE 5
97 ..
SL.NO.
NAME OF SCHEDULED EMPLOYMENT CENTRAL SPHERE/ STATES/ UNION TERRITORIES
MINIMUM WAGE RATE (Rs.) PER DAY
AS ON 31.12.2011
162 Jute and Coir Industry 1 Andhra Pradesh 238.582 Assam 115.603 Bihar 125.004 Odisha 92.505 Tamil Nadu 154.65
163 Jute Bailing Industry 1 Assam 115.602 Odisha 92.50
164 Jute Patti Industry 1 Rajasthan 135.00
165 Kambal Industry 1 Chattisgarh 164.50
166 Katha Manufacturing 1 Dadra and Nagar Haveli 156.202 Madhya Pradesh 175.00
167 Khadi & Village Industry 1 Assam 115.602 Bihar 125.003 Jharkhand 138.234 Kerala 187.985 Odisha 92.505 Rajasthan 135.00
168 Khandsari / Sugar Factories 1 Andhra Pradesh 217.592 Assam 115.603 Bihar 125.004 Chattisgarh 164.505 Dadra and Nagar Haveli 156.206 Daman and Diu 156.207 Haryana 178.618 Gujarat Sugar - 176.30
Khandsari - 174.509 Jharkhand 138.2310 Karnataka 166.8811 Madhya Pradesh 175.0012 Nagaland 100.0013 Punjab 154.4014 Rajasthan 135.0015 Uttar Pradesh 165.5216 Uttarakhand 105.21
169 Kkosa Industry 1 Madhya Pradesh 175.00
170 Kyanite Mines 1 C.L.C (Central) 171.00
171 Lac Manufacturing 1 Bihar 125.002 Dadra and Nagar Haveli 156.203 Daman and Diu 156.204 Jharkhand 138.235 West Bengal 126.00
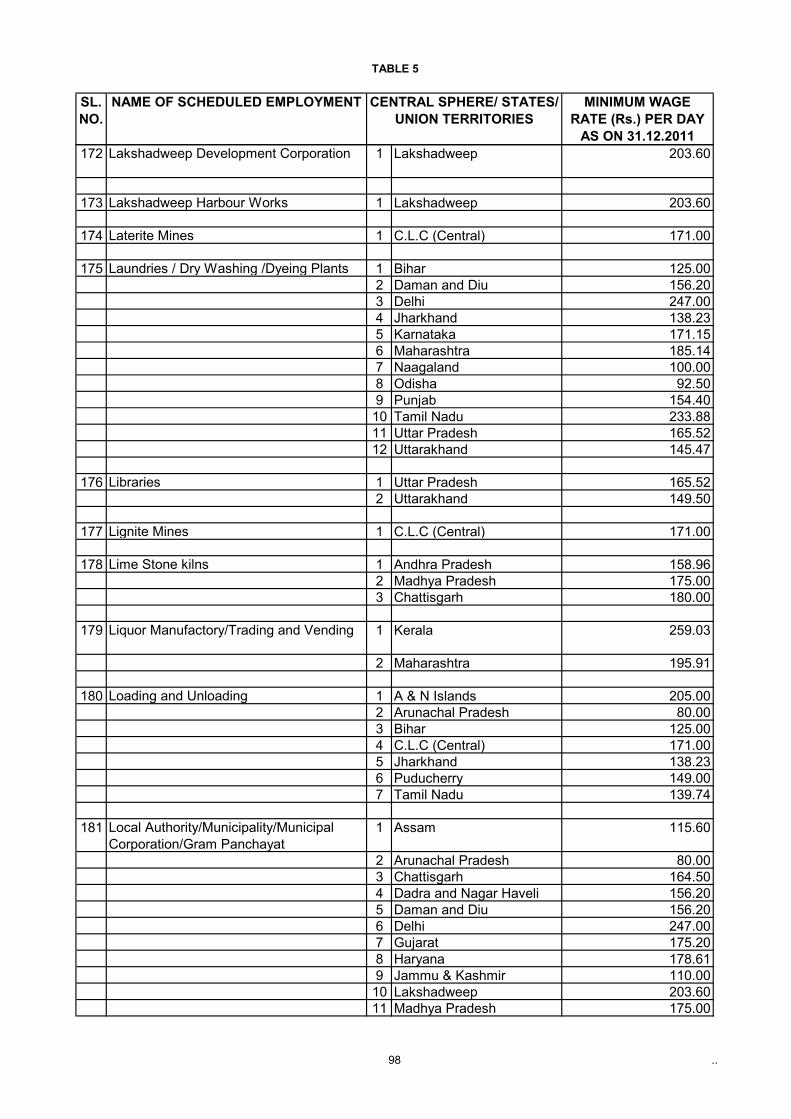
TABLE 5
98 ..
SL.NO.
NAME OF SCHEDULED EMPLOYMENT CENTRAL SPHERE/ STATES/ UNION TERRITORIES
MINIMUM WAGE RATE (Rs.) PER DAY
AS ON 31.12.2011172 Lakshadweep Development Corporation 1 Lakshadweep 203.60
173 Lakshadweep Harbour Works 1 Lakshadweep 203.60
174 Laterite Mines 1 C.L.C (Central) 171.00
175 Laundries / Dry Washing /Dyeing Plants 1 Bihar 125.002 Daman and Diu 156.203 Delhi 247.004 Jharkhand 138.235 Karnataka 171.156 Maharashtra 185.147 Naagaland 100.008 Odisha 92.509 Punjab 154.4010 Tamil Nadu 233.8811 Uttar Pradesh 165.5212 Uttarakhand 145.47
176 Libraries 1 Uttar Pradesh 165.522 Uttarakhand 149.50
177 Lignite Mines 1 C.L.C (Central) 171.00
178 Lime Stone kilns 1 Andhra Pradesh 158.962 Madhya Pradesh 175.003 Chattisgarh 180.00
179 Liquor Manufactory/Trading and Vending 1 Kerala 259.03
2 Maharashtra 195.91
180 Loading and Unloading 1 A & N Islands 205.002 Arunachal Pradesh 80.003 Bihar 125.004 C.L.C (Central) 171.005 Jharkhand 138.236 Puducherry 149.007 Tamil Nadu 139.74
181 Local Authority/Municipality/Municipal Corporation/Gram Panchayat
1 Assam 115.60
2 Arunachal Pradesh 80.003 Chattisgarh 164.504 Dadra and Nagar Haveli 156.205 Daman and Diu 156.206 Delhi 247.007 Gujarat 175.208 Haryana 178.619 Jammu & Kashmir 110.0010 Lakshadweep 203.6011 Madhya Pradesh 175.00
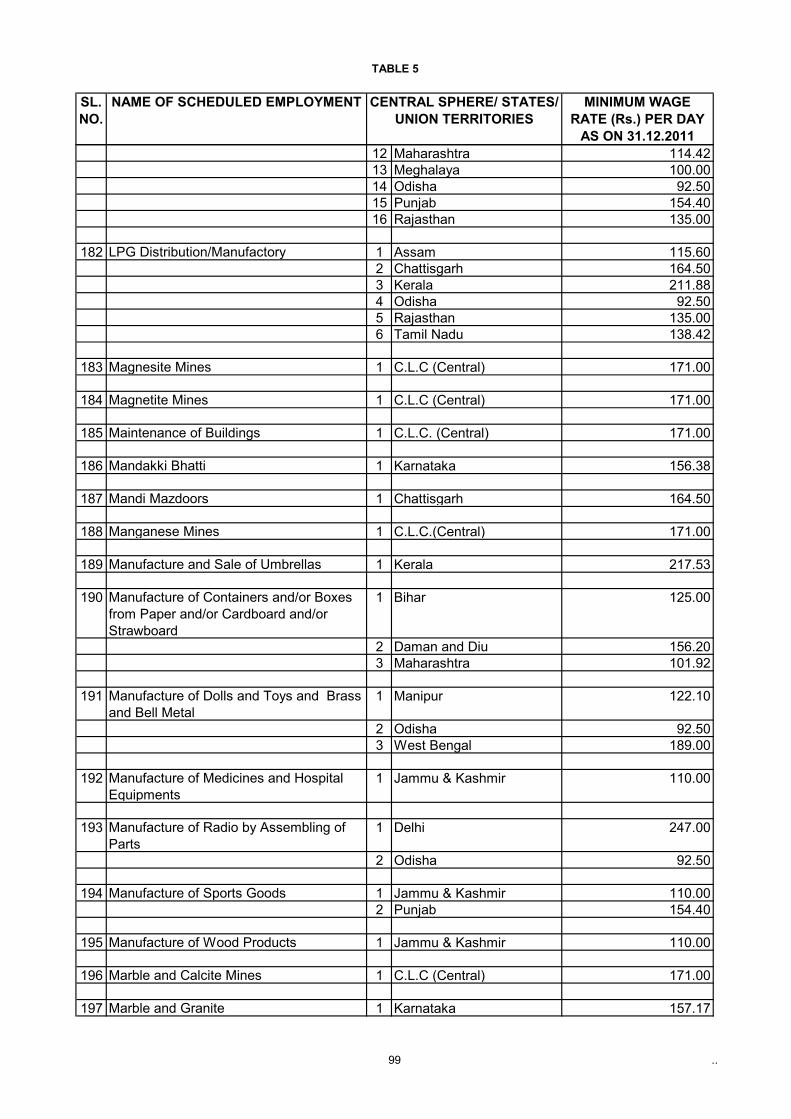
TABLE 5
99 ..
SL.NO.
NAME OF SCHEDULED EMPLOYMENT CENTRAL SPHERE/ STATES/ UNION TERRITORIES
MINIMUM WAGE RATE (Rs.) PER DAY
AS ON 31.12.201112 Maharashtra 114.4213 Meghalaya 100.0014 Odisha 92.5015 Punjab 154.4016 Rajasthan 135.00
182 LPG Distribution/Manufactory 1 Assam 115.602 Chattisgarh 164.503 Kerala 211.884 Odisha 92.505 Rajasthan 135.006 Tamil Nadu 138.42
183 Magnesite Mines 1 C.L.C (Central) 171.00
184 Magnetite Mines 1 C.L.C (Central) 171.00
185 Maintenance of Buildings 1 C.L.C. (Central) 171.00
186 Mandakki Bhatti 1 Karnataka 156.38
187 Mandi Mazdoors 1 Chattisgarh 164.50
188 Manganese Mines 1 C.L.C.(Central) 171.00
189 Manufacture and Sale of Umbrellas 1 Kerala 217.53
190 Manufacture of Containers and/or Boxes from Paper and/or Cardboard and/or Strawboard
1 Bihar 125.00
2 Daman and Diu 156.203 Maharashtra 101.92
191 Manufacture of Dolls and Toys and Brass and Bell Metal
1 Manipur 122.10
2 Odisha 92.503 West Bengal 189.00
192 Manufacture of Medicines and Hospital Equipments
1 Jammu & Kashmir 110.00
193 Manufacture of Radio by Assembling of Parts
1 Delhi 247.00
2 Odisha 92.50
194 Manufacture of Sports Goods 1 Jammu & Kashmir 110.002 Punjab 154.40
195 Manufacture of Wood Products 1 Jammu & Kashmir 110.00
196 Marble and Calcite Mines 1 C.L.C (Central) 171.00
197 Marble and Granite 1 Karnataka 157.17
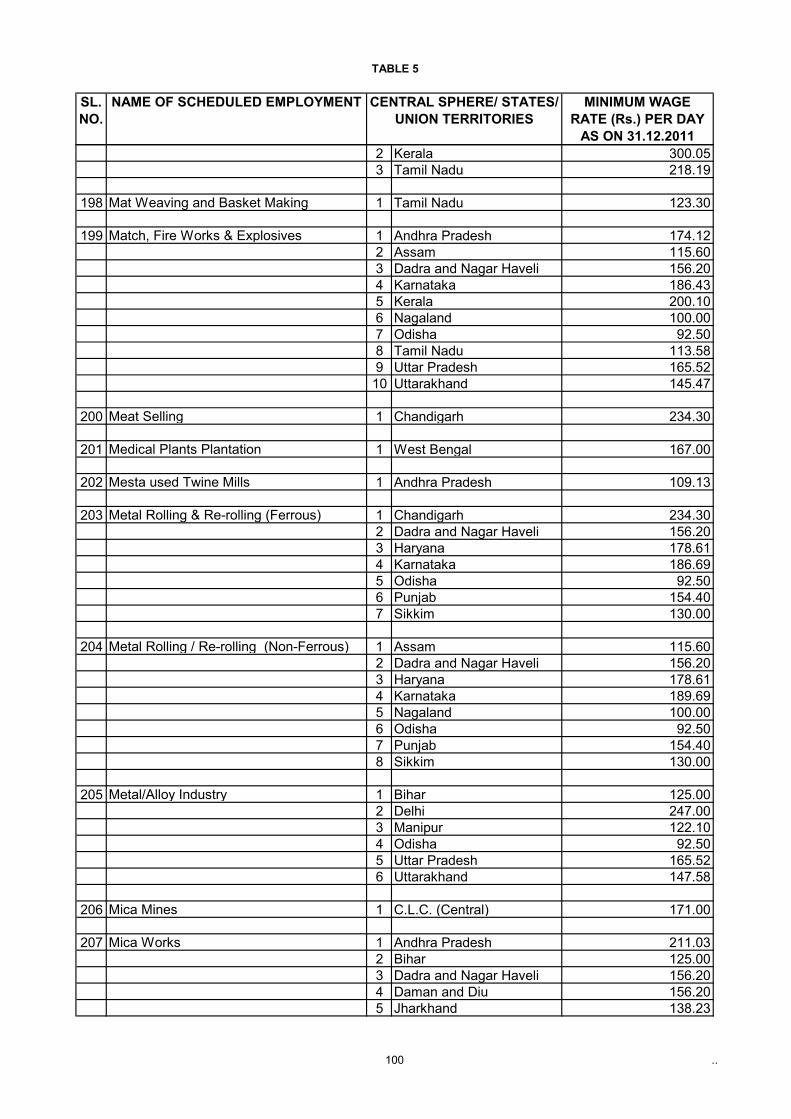
TABLE 5
100 ..
SL.NO.
NAME OF SCHEDULED EMPLOYMENT CENTRAL SPHERE/ STATES/ UNION TERRITORIES
MINIMUM WAGE RATE (Rs.) PER DAY
AS ON 31.12.20112 Kerala 300.053 Tamil Nadu 218.19
198 Mat Weaving and Basket Making 1 Tamil Nadu 123.30
199 Match, Fire Works & Explosives 1 Andhra Pradesh 174.122 Assam 115.603 Dadra and Nagar Haveli 156.204 Karnataka 186.435 Kerala 200.106 Nagaland 100.007 Odisha 92.508 Tamil Nadu 113.589 Uttar Pradesh 165.5210 Uttarakhand 145.47
200 Meat Selling 1 Chandigarh 234.30
201 Medical Plants Plantation 1 West Bengal 167.00
202 Mesta used Twine Mills 1 Andhra Pradesh 109.13
203 Metal Rolling & Re-rolling (Ferrous) 1 Chandigarh 234.302 Dadra and Nagar Haveli 156.203 Haryana 178.614 Karnataka 186.695 Odisha 92.506 Punjab 154.407 Sikkim 130.00
204 Metal Rolling / Re-rolling (Non-Ferrous) 1 Assam 115.602 Dadra and Nagar Haveli 156.203 Haryana 178.614 Karnataka 189.695 Nagaland 100.006 Odisha 92.507 Punjab 154.408 Sikkim 130.00
205 Metal/Alloy Industry 1 Bihar 125.002 Delhi 247.003 Manipur 122.104 Odisha 92.505 Uttar Pradesh 165.526 Uttarakhand 147.58
206 Mica Mines 1 C.L.C. (Central) 171.00
207 Mica Works 1 Andhra Pradesh 211.032 Bihar 125.003 Dadra and Nagar Haveli 156.204 Daman and Diu 156.205 Jharkhand 138.23
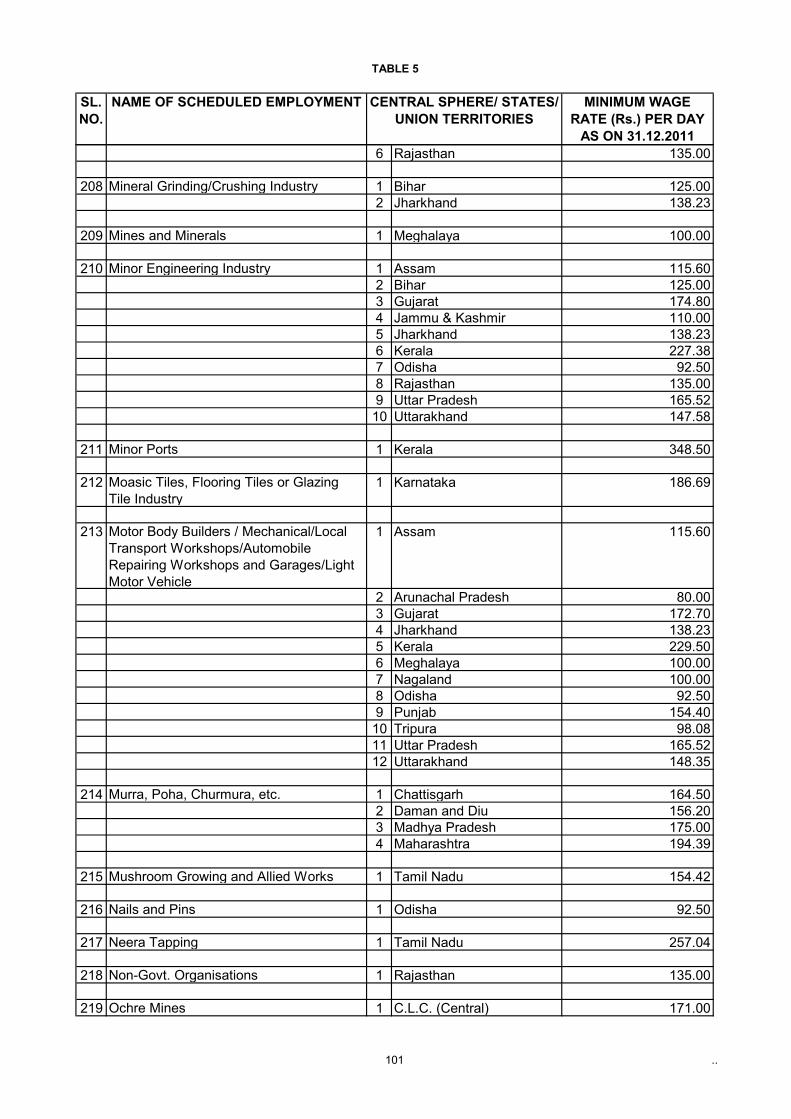
TABLE 5
101 ..
SL.NO.
NAME OF SCHEDULED EMPLOYMENT CENTRAL SPHERE/ STATES/ UNION TERRITORIES
MINIMUM WAGE RATE (Rs.) PER DAY
AS ON 31.12.20116 Rajasthan 135.00
208 Mineral Grinding/Crushing Industry 1 Bihar 125.002 Jharkhand 138.23
209 Mines and Minerals 1 Meghalaya 100.00
210 Minor Engineering Industry 1 Assam 115.602 Bihar 125.003 Gujarat 174.804 Jammu & Kashmir 110.005 Jharkhand 138.236 Kerala 227.387 Odisha 92.508 Rajasthan 135.009 Uttar Pradesh 165.5210 Uttarakhand 147.58
211 Minor Ports 1 Kerala 348.50
212 Moasic Tiles, Flooring Tiles or Glazing Tile Industry
1 Karnataka 186.69
213 Motor Body Builders / Mechanical/Local Transport Workshops/Automobile Repairing Workshops and Garages/Light Motor Vehicle
1 Assam 115.60
2 Arunachal Pradesh 80.003 Gujarat 172.704 Jharkhand 138.235 Kerala 229.506 Meghalaya 100.007 Nagaland 100.008 Odisha 92.509 Punjab 154.4010 Tripura 98.0811 Uttar Pradesh 165.5212 Uttarakhand 148.35
214 Murra, Poha, Churmura, etc. 1 Chattisgarh 164.502 Daman and Diu 156.203 Madhya Pradesh 175.004 Maharashtra 194.39
215 Mushroom Growing and Allied Works 1 Tamil Nadu 154.42
216 Nails and Pins 1 Odisha 92.50
217 Neera Tapping 1 Tamil Nadu 257.04
218 Non-Govt. Organisations 1 Rajasthan 135.00
219 Ochre Mines 1 C.L.C. (Central) 171.00
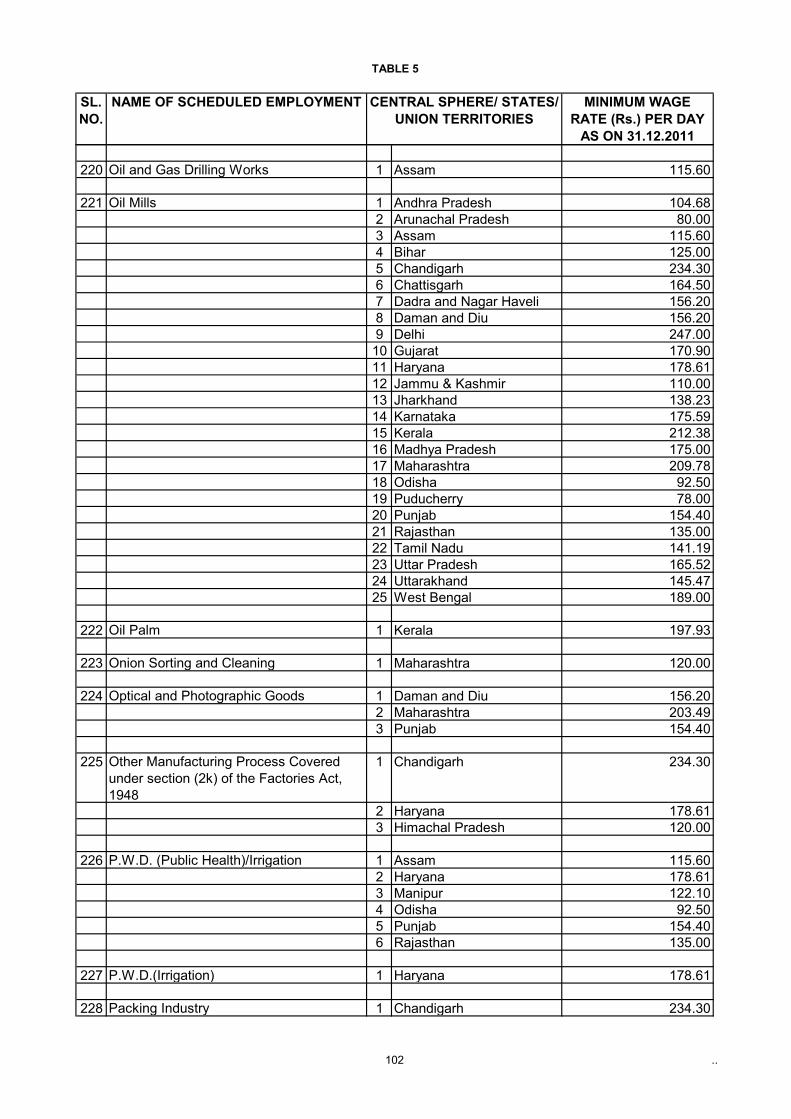
TABLE 5
102 ..
SL.NO.
NAME OF SCHEDULED EMPLOYMENT CENTRAL SPHERE/ STATES/ UNION TERRITORIES
MINIMUM WAGE RATE (Rs.) PER DAY
AS ON 31.12.2011
220 Oil and Gas Drilling Works 1 Assam 115.60
221 Oil Mills 1 Andhra Pradesh 104.682 Arunachal Pradesh 80.003 Assam 115.604 Bihar 125.005 Chandigarh 234.306 Chattisgarh 164.507 Dadra and Nagar Haveli 156.208 Daman and Diu 156.209 Delhi 247.0010 Gujarat 170.9011 Haryana 178.6112 Jammu & Kashmir 110.0013 Jharkhand 138.2314 Karnataka 175.5915 Kerala 212.3816 Madhya Pradesh 175.0017 Maharashtra 209.7818 Odisha 92.5019 Puducherry 78.0020 Punjab 154.4021 Rajasthan 135.0022 Tamil Nadu 141.1923 Uttar Pradesh 165.5224 Uttarakhand 145.4725 West Bengal 189.00
222 Oil Palm 1 Kerala 197.93
223 Onion Sorting and Cleaning 1 Maharashtra 120.00
224 Optical and Photographic Goods 1 Daman and Diu 156.202 Maharashtra 203.493 Punjab 154.40
225 Other Manufacturing Process Covered under section (2k) of the Factories Act, 1948
1 Chandigarh 234.30
2 Haryana 178.613 Himachal Pradesh 120.00
226 P.W.D. (Public Health)/Irrigation 1 Assam 115.602 Haryana 178.613 Manipur 122.104 Odisha 92.505 Punjab 154.406 Rajasthan 135.00
227 P.W.D.(Irrigation) 1 Haryana 178.61
228 Packing Industry 1 Chandigarh 234.30
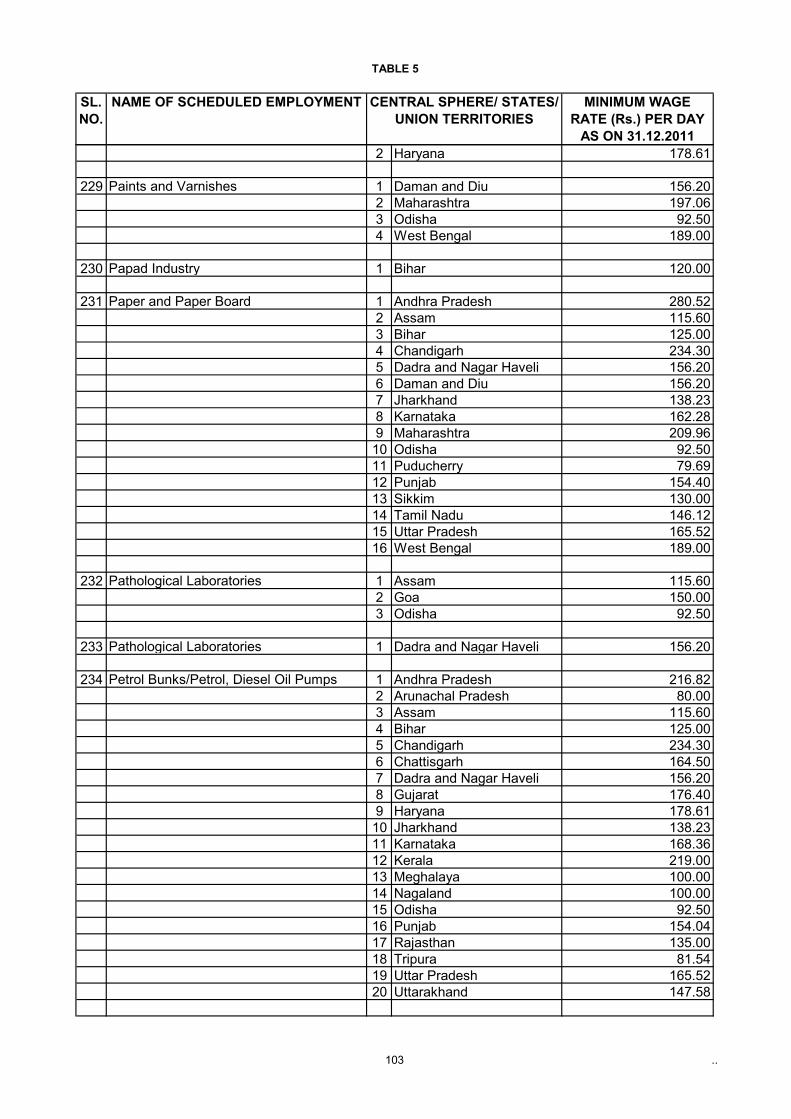
TABLE 5
103 ..
SL.NO.
NAME OF SCHEDULED EMPLOYMENT CENTRAL SPHERE/ STATES/ UNION TERRITORIES
MINIMUM WAGE RATE (Rs.) PER DAY
AS ON 31.12.20112 Haryana 178.61
229 Paints and Varnishes 1 Daman and Diu 156.202 Maharashtra 197.063 Odisha 92.504 West Bengal 189.00
230 Papad Industry 1 Bihar 120.00
231 Paper and Paper Board 1 Andhra Pradesh 280.522 Assam 115.603 Bihar 125.004 Chandigarh 234.305 Dadra and Nagar Haveli 156.206 Daman and Diu 156.207 Jharkhand 138.238 Karnataka 162.289 Maharashtra 209.9610 Odisha 92.5011 Puducherry 79.6912 Punjab 154.4013 Sikkim 130.0014 Tamil Nadu 146.1215 Uttar Pradesh 165.5216 West Bengal 189.00
232 Pathological Laboratories 1 Assam 115.602 Goa 150.003 Odisha 92.50
233 Pathological Laboratories 1 Dadra and Nagar Haveli 156.20
234 Petrol Bunks/Petrol, Diesel Oil Pumps 1 Andhra Pradesh 216.822 Arunachal Pradesh 80.003 Assam 115.604 Bihar 125.005 Chandigarh 234.306 Chattisgarh 164.507 Dadra and Nagar Haveli 156.208 Gujarat 176.409 Haryana 178.6110 Jharkhand 138.2311 Karnataka 168.3612 Kerala 219.0013 Meghalaya 100.0014 Nagaland 100.0015 Odisha 92.5016 Punjab 154.0417 Rajasthan 135.0018 Tripura 81.5419 Uttar Pradesh 165.5220 Uttarakhand 147.58
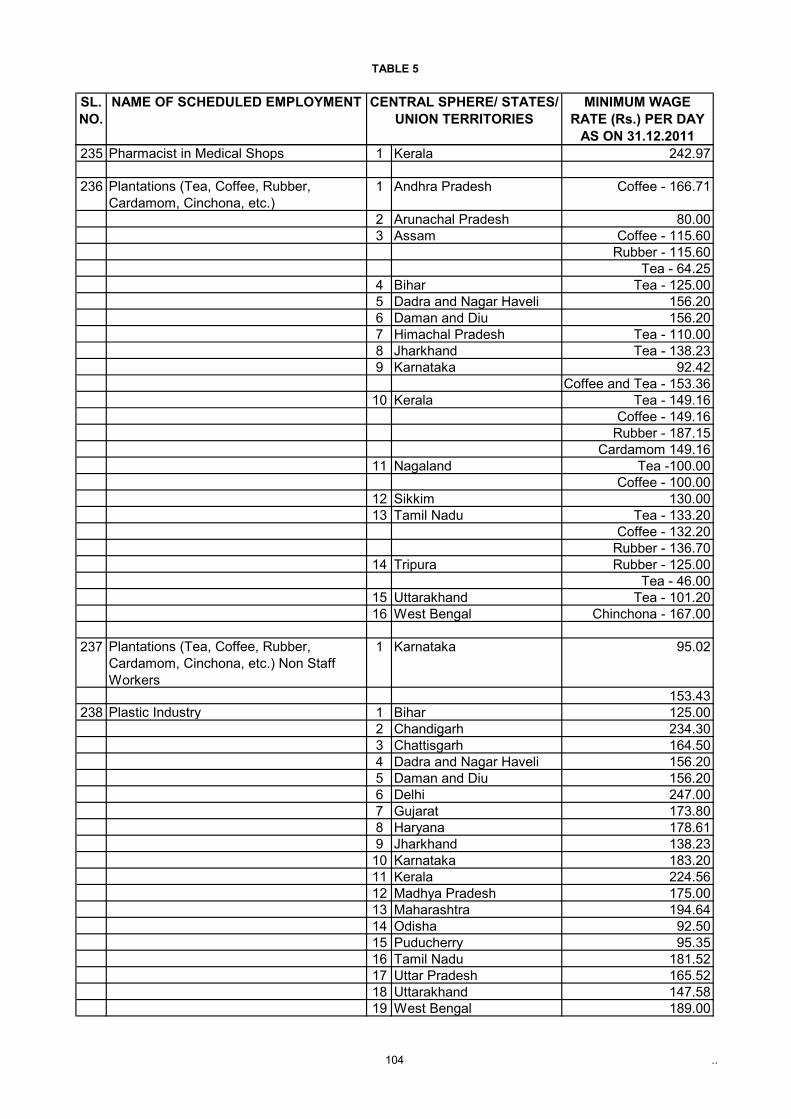
TABLE 5
104 ..
SL.NO.
NAME OF SCHEDULED EMPLOYMENT CENTRAL SPHERE/ STATES/ UNION TERRITORIES
MINIMUM WAGE RATE (Rs.) PER DAY
AS ON 31.12.2011235 Pharmacist in Medical Shops 1 Kerala 242.97
236 Plantations (Tea, Coffee, Rubber, Cardamom, Cinchona, etc.)
1 Andhra Pradesh Coffee - 166.71
2 Arunachal Pradesh 80.003 Assam Coffee - 115.60
Rubber - 115.60Tea - 64.25
4 Bihar Tea - 125.005 Dadra and Nagar Haveli 156.206 Daman and Diu 156.207 Himachal Pradesh Tea - 110.008 Jharkhand Tea - 138.239 Karnataka 92.42
Coffee and Tea - 153.3610 Kerala Tea - 149.16
Coffee - 149.16Rubber - 187.15
Cardamom 149.1611 Nagaland Tea -100.00
Coffee - 100.0012 Sikkim 130.0013 Tamil Nadu Tea - 133.20
Coffee - 132.20Rubber - 136.70
14 Tripura Rubber - 125.00Tea - 46.00
15 Uttarakhand Tea - 101.2016 West Bengal Chinchona - 167.00
237 Plantations (Tea, Coffee, Rubber, Cardamom, Cinchona, etc.) Non Staff Workers
1 Karnataka 95.02
153.43238 Plastic Industry 1 Bihar 125.00
2 Chandigarh 234.303 Chattisgarh 164.504 Dadra and Nagar Haveli 156.205 Daman and Diu 156.206 Delhi 247.007 Gujarat 173.808 Haryana 178.619 Jharkhand 138.2310 Karnataka 183.2011 Kerala 224.5612 Madhya Pradesh 175.0013 Maharashtra 194.6414 Odisha 92.5015 Puducherry 95.3516 Tamil Nadu 181.5217 Uttar Pradesh 165.5218 Uttarakhand 147.5819 West Bengal 189.00
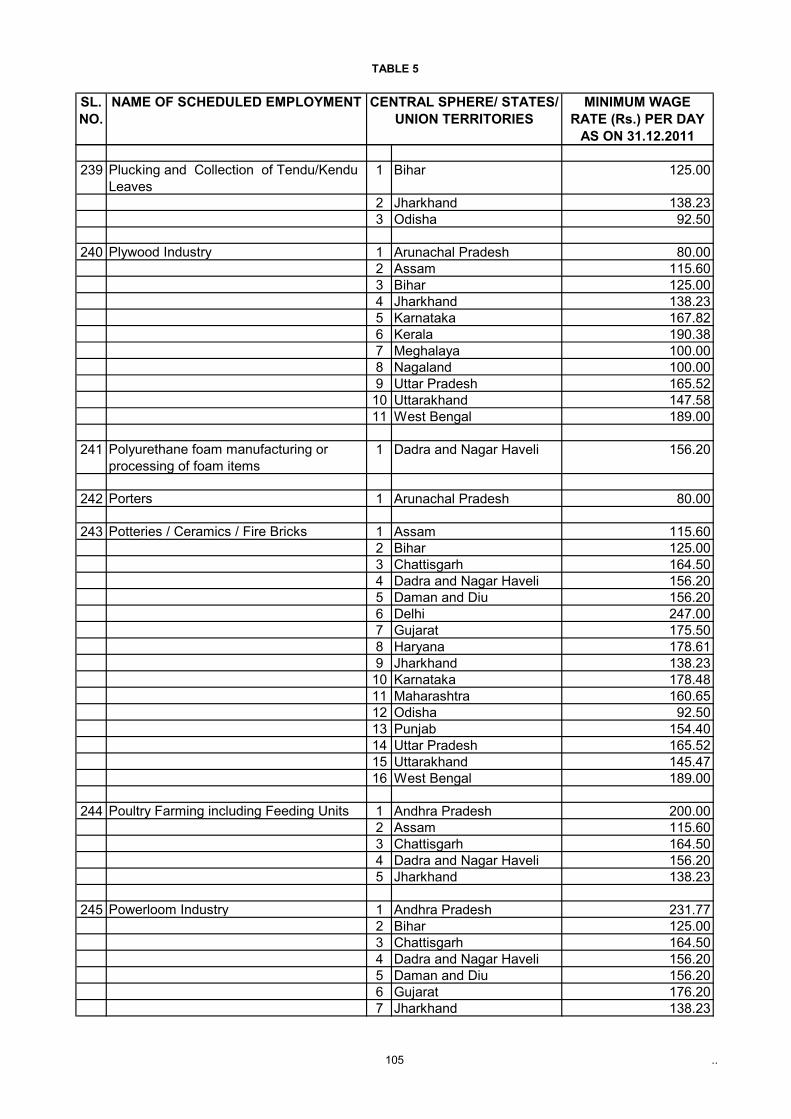
TABLE 5
105 ..
SL.NO.
NAME OF SCHEDULED EMPLOYMENT CENTRAL SPHERE/ STATES/ UNION TERRITORIES
MINIMUM WAGE RATE (Rs.) PER DAY
AS ON 31.12.2011
239 Plucking and Collection of Tendu/Kendu Leaves
1 Bihar 125.00
2 Jharkhand 138.233 Odisha 92.50
240 Plywood Industry 1 Arunachal Pradesh 80.002 Assam 115.603 Bihar 125.004 Jharkhand 138.235 Karnataka 167.826 Kerala 190.387 Meghalaya 100.008 Nagaland 100.009 Uttar Pradesh 165.5210 Uttarakhand 147.5811 West Bengal 189.00
241 Polyurethane foam manufacturing or processing of foam items
1 Dadra and Nagar Haveli 156.20
242 Porters 1 Arunachal Pradesh 80.00
243 Potteries / Ceramics / Fire Bricks 1 Assam 115.602 Bihar 125.003 Chattisgarh 164.504 Dadra and Nagar Haveli 156.205 Daman and Diu 156.206 Delhi 247.007 Gujarat 175.508 Haryana 178.619 Jharkhand 138.2310 Karnataka 178.4811 Maharashtra 160.6512 Odisha 92.5013 Punjab 154.4014 Uttar Pradesh 165.5215 Uttarakhand 145.4716 West Bengal 189.00
244 Poultry Farming including Feeding Units 1 Andhra Pradesh 200.002 Assam 115.603 Chattisgarh 164.504 Dadra and Nagar Haveli 156.205 Jharkhand 138.23
245 Powerloom Industry 1 Andhra Pradesh 231.772 Bihar 125.003 Chattisgarh 164.504 Dadra and Nagar Haveli 156.205 Daman and Diu 156.206 Gujarat 176.207 Jharkhand 138.23
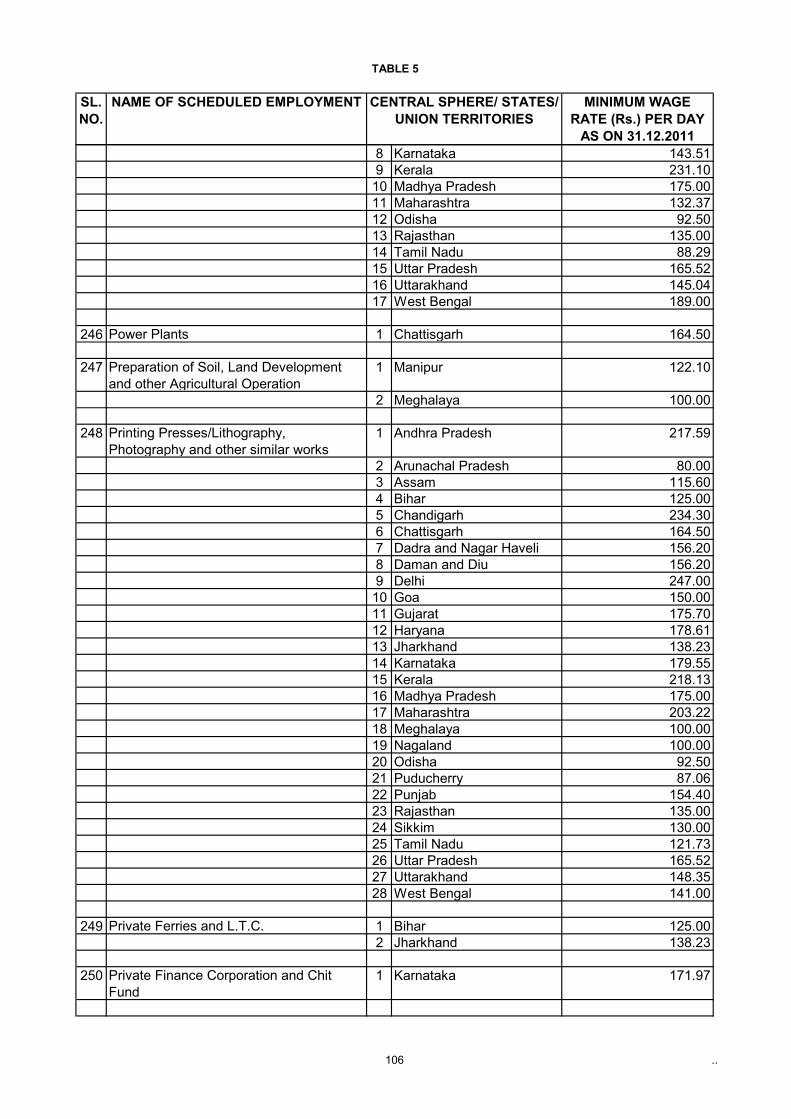
TABLE 5
106 ..
SL.NO.
NAME OF SCHEDULED EMPLOYMENT CENTRAL SPHERE/ STATES/ UNION TERRITORIES
MINIMUM WAGE RATE (Rs.) PER DAY
AS ON 31.12.20118 Karnataka 143.519 Kerala 231.1010 Madhya Pradesh 175.0011 Maharashtra 132.3712 Odisha 92.5013 Rajasthan 135.0014 Tamil Nadu 88.2915 Uttar Pradesh 165.5216 Uttarakhand 145.0417 West Bengal 189.00
246 Power Plants 1 Chattisgarh 164.50
247 Preparation of Soil, Land Development and other Agricultural Operation
1 Manipur 122.10
2 Meghalaya 100.00
248 Printing Presses/Lithography, Photography and other similar works
1 Andhra Pradesh 217.59
2 Arunachal Pradesh 80.003 Assam 115.604 Bihar 125.005 Chandigarh 234.306 Chattisgarh 164.507 Dadra and Nagar Haveli 156.208 Daman and Diu 156.209 Delhi 247.0010 Goa 150.0011 Gujarat 175.7012 Haryana 178.6113 Jharkhand 138.2314 Karnataka 179.5515 Kerala 218.1316 Madhya Pradesh 175.0017 Maharashtra 203.2218 Meghalaya 100.0019 Nagaland 100.0020 Odisha 92.5021 Puducherry 87.0622 Punjab 154.4023 Rajasthan 135.0024 Sikkim 130.0025 Tamil Nadu 121.7326 Uttar Pradesh 165.5227 Uttarakhand 148.3528 West Bengal 141.00
249 Private Ferries and L.T.C. 1 Bihar 125.002 Jharkhand 138.23
250 Private Finance Corporation and Chit Fund
1 Karnataka 171.97
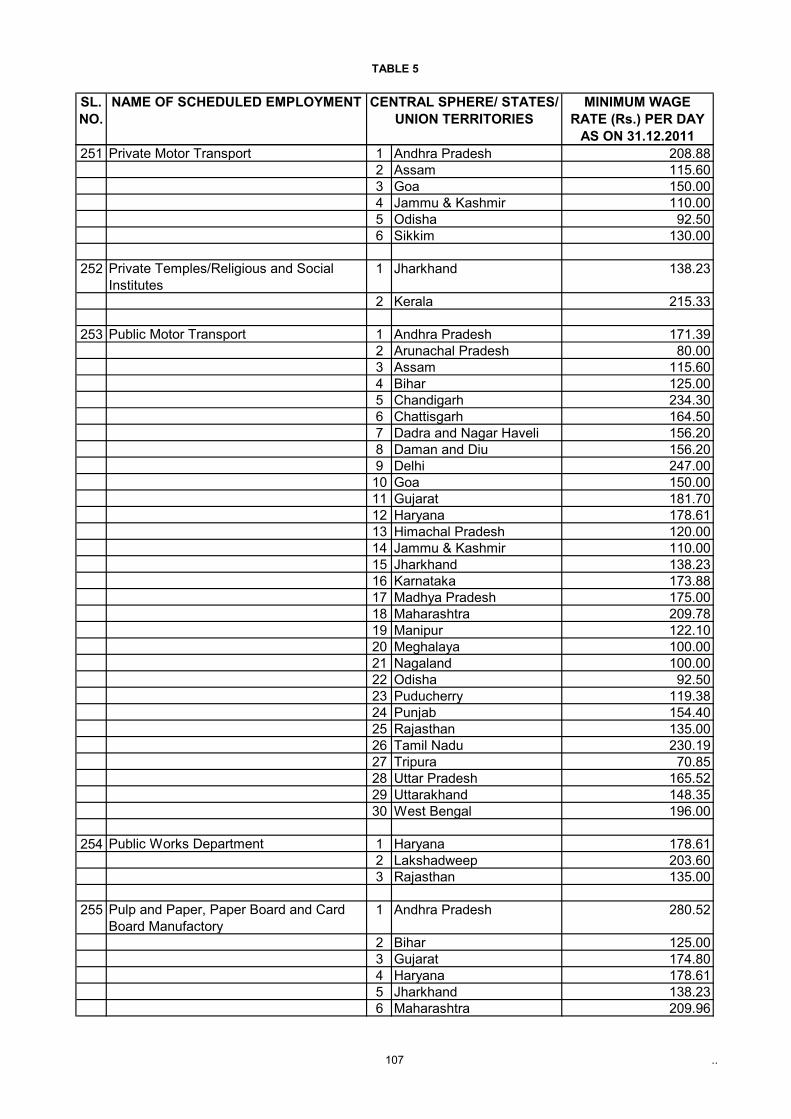
TABLE 5
107 ..
SL.NO.
NAME OF SCHEDULED EMPLOYMENT CENTRAL SPHERE/ STATES/ UNION TERRITORIES
MINIMUM WAGE RATE (Rs.) PER DAY
AS ON 31.12.2011251 Private Motor Transport 1 Andhra Pradesh 208.88
2 Assam 115.603 Goa 150.004 Jammu & Kashmir 110.005 Odisha 92.506 Sikkim 130.00
252 Private Temples/Religious and Social Institutes
1 Jharkhand 138.23
2 Kerala 215.33
253 Public Motor Transport 1 Andhra Pradesh 171.392 Arunachal Pradesh 80.003 Assam 115.604 Bihar 125.005 Chandigarh 234.306 Chattisgarh 164.507 Dadra and Nagar Haveli 156.208 Daman and Diu 156.209 Delhi 247.0010 Goa 150.0011 Gujarat 181.7012 Haryana 178.6113 Himachal Pradesh 120.0014 Jammu & Kashmir 110.0015 Jharkhand 138.2316 Karnataka 173.8817 Madhya Pradesh 175.0018 Maharashtra 209.7819 Manipur 122.1020 Meghalaya 100.0021 Nagaland 100.0022 Odisha 92.5023 Puducherry 119.3824 Punjab 154.4025 Rajasthan 135.0026 Tamil Nadu 230.1927 Tripura 70.8528 Uttar Pradesh 165.5229 Uttarakhand 148.3530 West Bengal 196.00
254 Public Works Department 1 Haryana 178.612 Lakshadweep 203.603 Rajasthan 135.00
255 Pulp and Paper, Paper Board and Card Board Manufactory
1 Andhra Pradesh 280.52
2 Bihar 125.003 Gujarat 174.804 Haryana 178.615 Jharkhand 138.236 Maharashtra 209.96
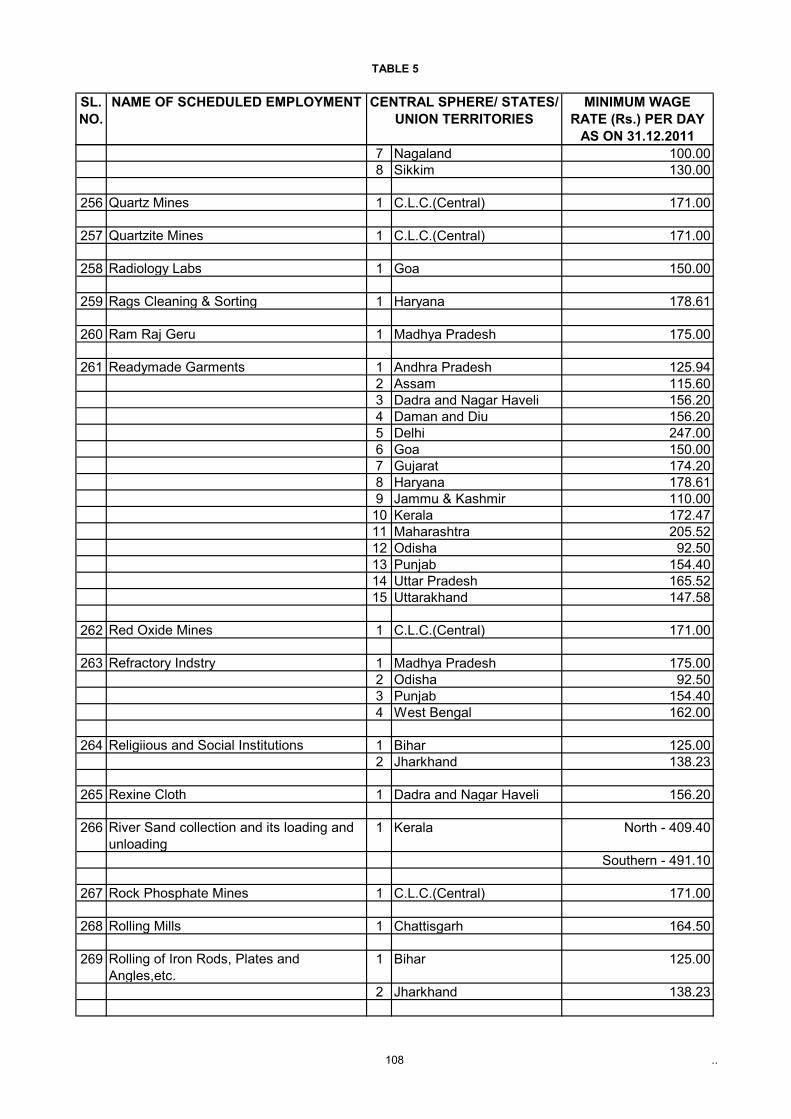
TABLE 5
108 ..
SL.NO.
NAME OF SCHEDULED EMPLOYMENT CENTRAL SPHERE/ STATES/ UNION TERRITORIES
MINIMUM WAGE RATE (Rs.) PER DAY
AS ON 31.12.20117 Nagaland 100.008 Sikkim 130.00
256 Quartz Mines 1 C.L.C.(Central) 171.00
257 Quartzite Mines 1 C.L.C.(Central) 171.00
258 Radiology Labs 1 Goa 150.00
259 Rags Cleaning & Sorting 1 Haryana 178.61
260 Ram Raj Geru 1 Madhya Pradesh 175.00
261 Readymade Garments 1 Andhra Pradesh 125.942 Assam 115.603 Dadra and Nagar Haveli 156.204 Daman and Diu 156.205 Delhi 247.006 Goa 150.007 Gujarat 174.208 Haryana 178.619 Jammu & Kashmir 110.0010 Kerala 172.4711 Maharashtra 205.5212 Odisha 92.5013 Punjab 154.4014 Uttar Pradesh 165.5215 Uttarakhand 147.58
262 Red Oxide Mines 1 C.L.C.(Central) 171.00
263 Refractory Indstry 1 Madhya Pradesh 175.002 Odisha 92.503 Punjab 154.404 West Bengal 162.00
264 Religiious and Social Institutions 1 Bihar 125.002 Jharkhand 138.23
265 Rexine Cloth 1 Dadra and Nagar Haveli 156.20
266 River Sand collection and its loading and unloading
1 Kerala North - 409.40
Southern - 491.10
267 Rock Phosphate Mines 1 C.L.C.(Central) 171.00
268 Rolling Mills 1 Chattisgarh 164.50
269 Rolling of Iron Rods, Plates and Angles,etc.
1 Bihar 125.00
2 Jharkhand 138.23
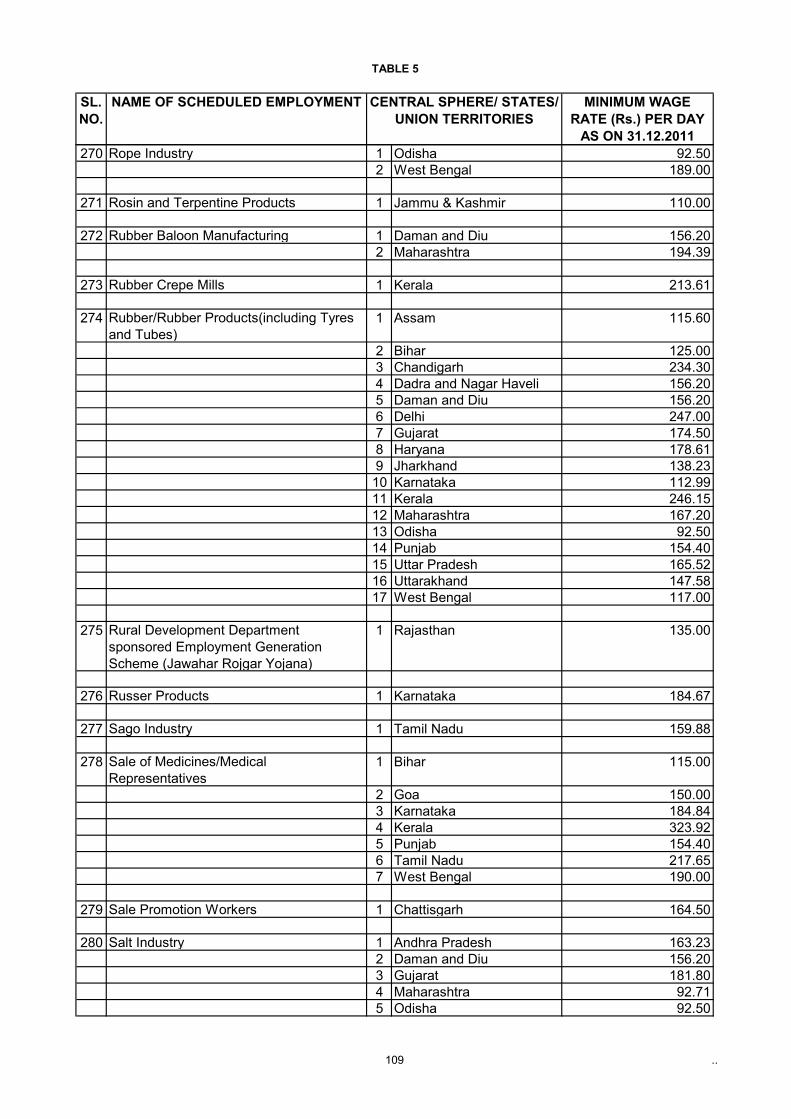
TABLE 5
109 ..
SL.NO.
NAME OF SCHEDULED EMPLOYMENT CENTRAL SPHERE/ STATES/ UNION TERRITORIES
MINIMUM WAGE RATE (Rs.) PER DAY
AS ON 31.12.2011270 Rope Industry 1 Odisha 92.50
2 West Bengal 189.00
271 Rosin and Terpentine Products 1 Jammu & Kashmir 110.00
272 Rubber Baloon Manufacturing 1 Daman and Diu 156.202 Maharashtra 194.39
273 Rubber Crepe Mills 1 Kerala 213.61
274 Rubber/Rubber Products(including Tyres and Tubes)
1 Assam 115.60
2 Bihar 125.003 Chandigarh 234.304 Dadra and Nagar Haveli 156.205 Daman and Diu 156.206 Delhi 247.007 Gujarat 174.508 Haryana 178.619 Jharkhand 138.2310 Karnataka 112.9911 Kerala 246.1512 Maharashtra 167.2013 Odisha 92.5014 Punjab 154.4015 Uttar Pradesh 165.5216 Uttarakhand 147.5817 West Bengal 117.00
275 Rural Development Department sponsored Employment Generation Scheme (Jawahar Rojgar Yojana)
1 Rajasthan 135.00
276 Russer Products 1 Karnataka 184.67
277 Sago Industry 1 Tamil Nadu 159.88
278 Sale of Medicines/Medical Representatives
1 Bihar 115.00
2 Goa 150.003 Karnataka 184.844 Kerala 323.925 Punjab 154.406 Tamil Nadu 217.657 West Bengal 190.00
279 Sale Promotion Workers 1 Chattisgarh 164.50
280 Salt Industry 1 Andhra Pradesh 163.232 Daman and Diu 156.203 Gujarat 181.804 Maharashtra 92.715 Odisha 92.50
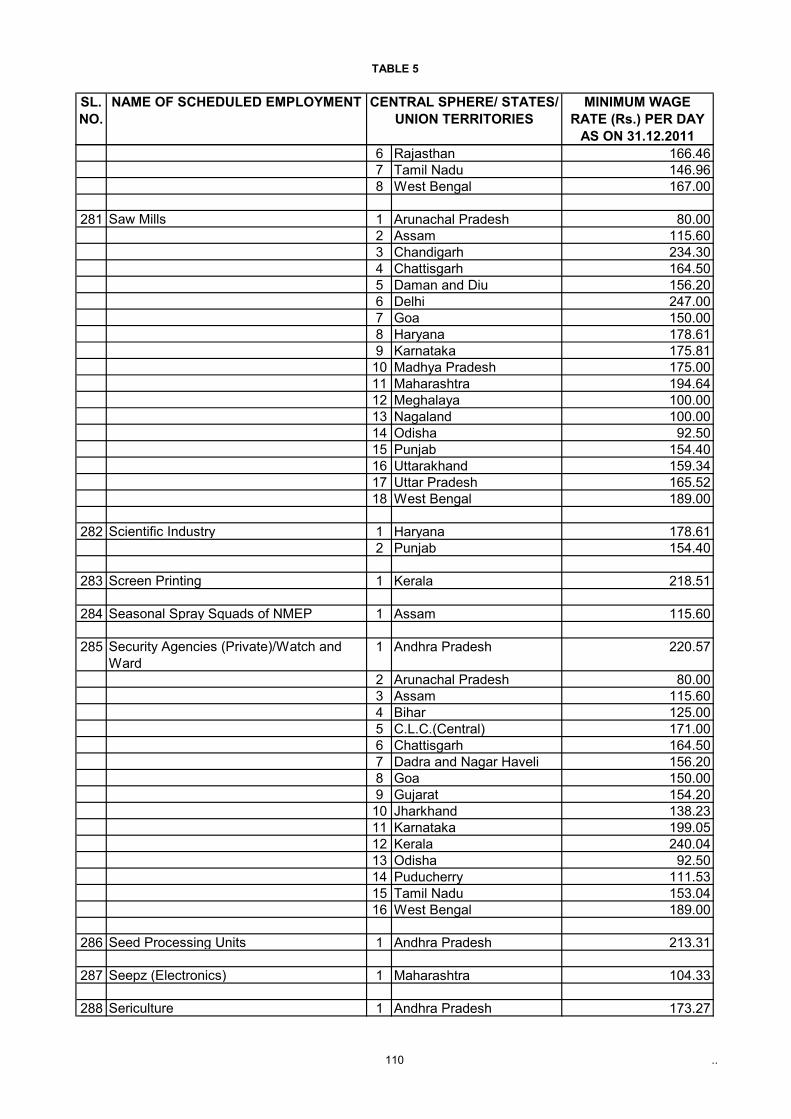
TABLE 5
110 ..
SL.NO.
NAME OF SCHEDULED EMPLOYMENT CENTRAL SPHERE/ STATES/ UNION TERRITORIES
MINIMUM WAGE RATE (Rs.) PER DAY
AS ON 31.12.20116 Rajasthan 166.467 Tamil Nadu 146.968 West Bengal 167.00
281 Saw Mills 1 Arunachal Pradesh 80.002 Assam 115.603 Chandigarh 234.304 Chattisgarh 164.505 Daman and Diu 156.206 Delhi 247.007 Goa 150.008 Haryana 178.619 Karnataka 175.8110 Madhya Pradesh 175.0011 Maharashtra 194.6412 Meghalaya 100.0013 Nagaland 100.0014 Odisha 92.5015 Punjab 154.4016 Uttarakhand 159.3417 Uttar Pradesh 165.5218 West Bengal 189.00
282 Scientific Industry 1 Haryana 178.612 Punjab 154.40
283 Screen Printing 1 Kerala 218.51
284 Seasonal Spray Squads of NMEP 1 Assam 115.60
285 Security Agencies (Private)/Watch and Ward
1 Andhra Pradesh 220.57
2 Arunachal Pradesh 80.003 Assam 115.604 Bihar 125.005 C.L.C.(Central) 171.006 Chattisgarh 164.507 Dadra and Nagar Haveli 156.208 Goa 150.009 Gujarat 154.2010 Jharkhand 138.2311 Karnataka 199.0512 Kerala 240.0413 Odisha 92.5014 Puducherry 111.5315 Tamil Nadu 153.0416 West Bengal 189.00
286 Seed Processing Units 1 Andhra Pradesh 213.31
287 Seepz (Electronics) 1 Maharashtra 104.33
288 Sericulture 1 Andhra Pradesh 173.27
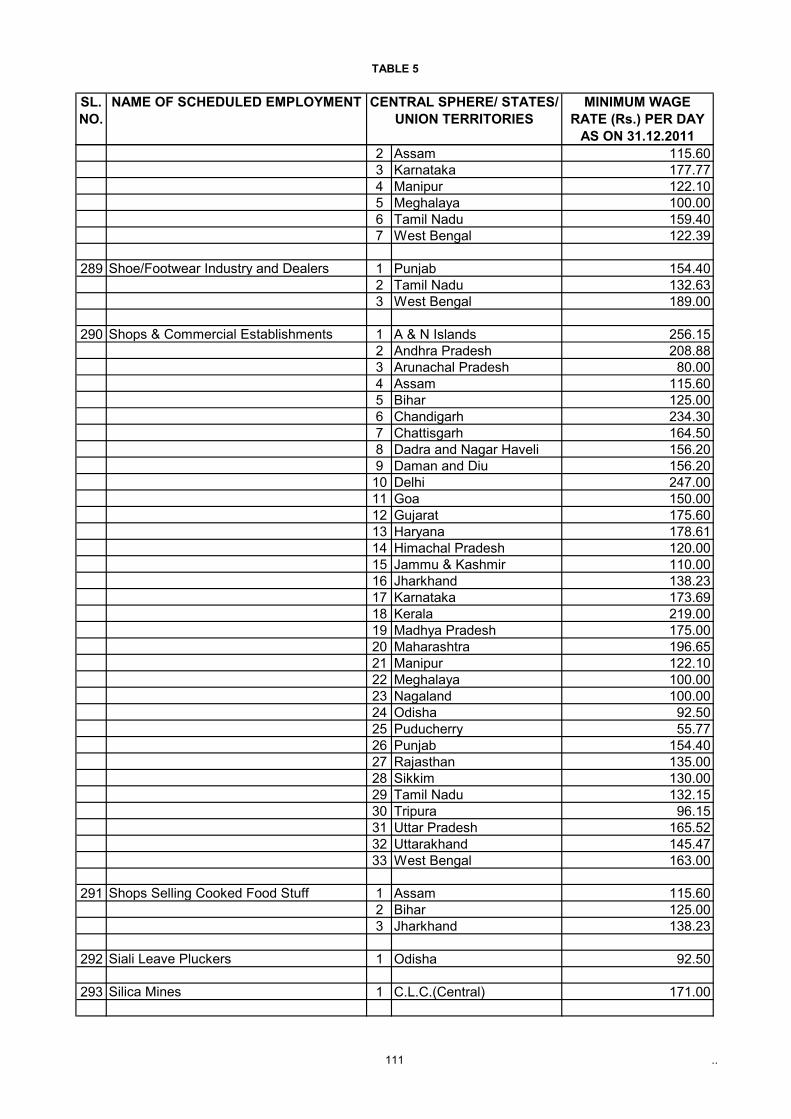
TABLE 5
111 ..
SL.NO.
NAME OF SCHEDULED EMPLOYMENT CENTRAL SPHERE/ STATES/ UNION TERRITORIES
MINIMUM WAGE RATE (Rs.) PER DAY
AS ON 31.12.20112 Assam 115.603 Karnataka 177.774 Manipur 122.105 Meghalaya 100.006 Tamil Nadu 159.407 West Bengal 122.39
289 Shoe/Footwear Industry and Dealers 1 Punjab 154.402 Tamil Nadu 132.633 West Bengal 189.00
290 Shops & Commercial Establishments 1 A & N Islands 256.152 Andhra Pradesh 208.883 Arunachal Pradesh 80.004 Assam 115.605 Bihar 125.006 Chandigarh 234.307 Chattisgarh 164.508 Dadra and Nagar Haveli 156.209 Daman and Diu 156.2010 Delhi 247.0011 Goa 150.0012 Gujarat 175.6013 Haryana 178.6114 Himachal Pradesh 120.0015 Jammu & Kashmir 110.0016 Jharkhand 138.2317 Karnataka 173.6918 Kerala 219.0019 Madhya Pradesh 175.0020 Maharashtra 196.6521 Manipur 122.1022 Meghalaya 100.0023 Nagaland 100.0024 Odisha 92.5025 Puducherry 55.7726 Punjab 154.4027 Rajasthan 135.0028 Sikkim 130.0029 Tamil Nadu 132.1530 Tripura 96.1531 Uttar Pradesh 165.5232 Uttarakhand 145.4733 West Bengal 163.00
291 Shops Selling Cooked Food Stuff 1 Assam 115.602 Bihar 125.003 Jharkhand 138.23
292 Siali Leave Pluckers 1 Odisha 92.50
293 Silica Mines 1 C.L.C.(Central) 171.00
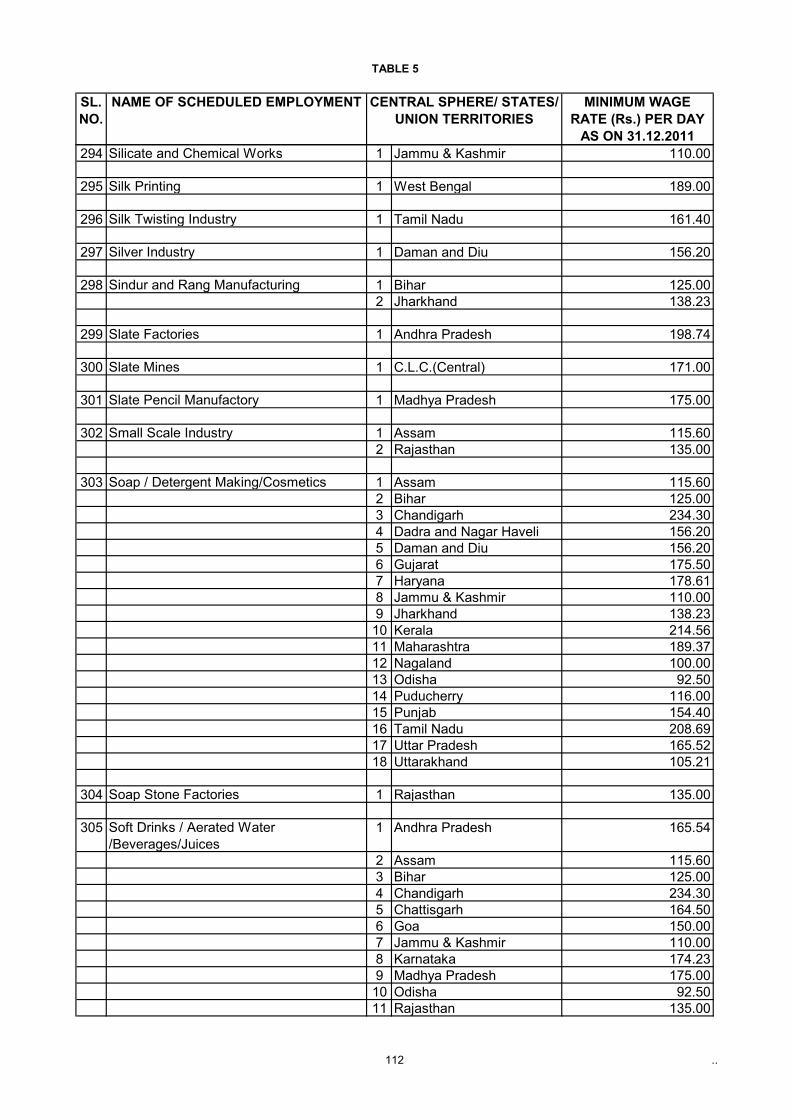
TABLE 5
112 ..
SL.NO.
NAME OF SCHEDULED EMPLOYMENT CENTRAL SPHERE/ STATES/ UNION TERRITORIES
MINIMUM WAGE RATE (Rs.) PER DAY
AS ON 31.12.2011294 Silicate and Chemical Works 1 Jammu & Kashmir 110.00
295 Silk Printing 1 West Bengal 189.00
296 Silk Twisting Industry 1 Tamil Nadu 161.40
297 Silver Industry 1 Daman and Diu 156.20
298 Sindur and Rang Manufacturing 1 Bihar 125.002 Jharkhand 138.23
299 Slate Factories 1 Andhra Pradesh 198.74
300 Slate Mines 1 C.L.C.(Central) 171.00
301 Slate Pencil Manufactory 1 Madhya Pradesh 175.00
302 Small Scale Industry 1 Assam 115.602 Rajasthan 135.00
303 Soap / Detergent Making/Cosmetics 1 Assam 115.602 Bihar 125.003 Chandigarh 234.304 Dadra and Nagar Haveli 156.205 Daman and Diu 156.206 Gujarat 175.507 Haryana 178.618 Jammu & Kashmir 110.009 Jharkhand 138.2310 Kerala 214.5611 Maharashtra 189.3712 Nagaland 100.0013 Odisha 92.5014 Puducherry 116.0015 Punjab 154.4016 Tamil Nadu 208.6917 Uttar Pradesh 165.5218 Uttarakhand 105.21
304 Soap Stone Factories 1 Rajasthan 135.00
305 Soft Drinks / Aerated Water /Beverages/Juices
1 Andhra Pradesh 165.54
2 Assam 115.603 Bihar 125.004 Chandigarh 234.305 Chattisgarh 164.506 Goa 150.007 Jammu & Kashmir 110.008 Karnataka 174.239 Madhya Pradesh 175.0010 Odisha 92.5011 Rajasthan 135.00
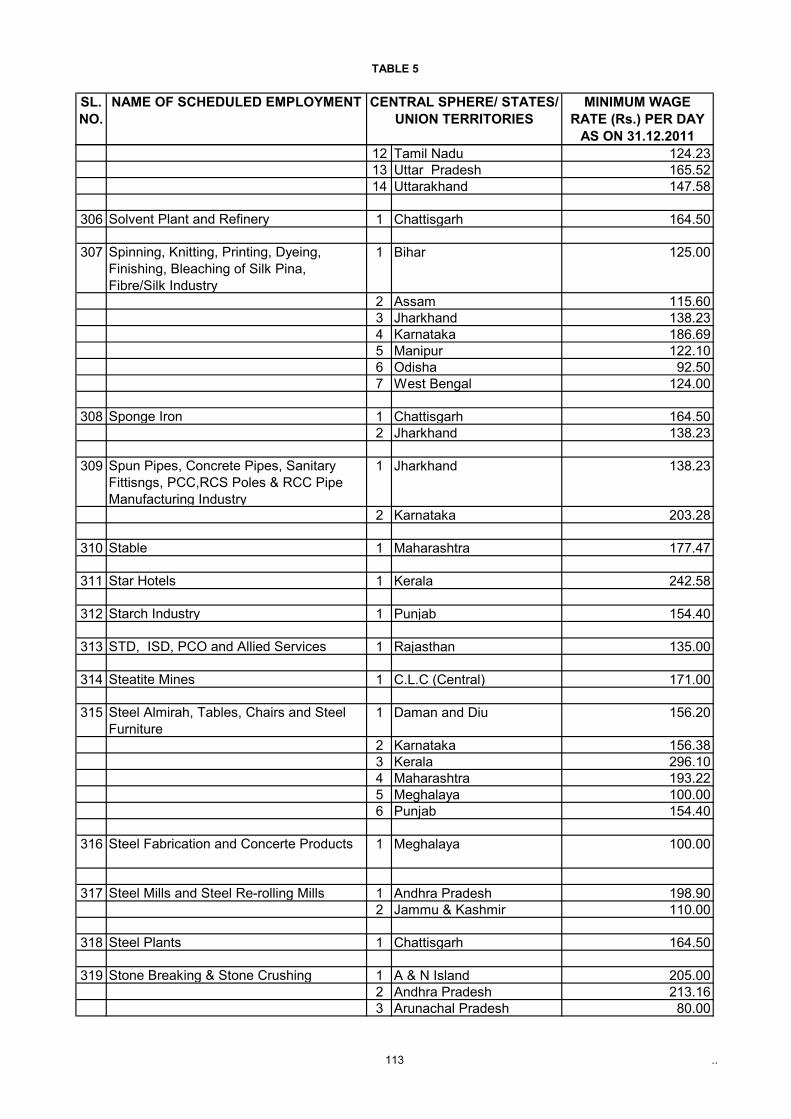
TABLE 5
113 ..
SL.NO.
NAME OF SCHEDULED EMPLOYMENT CENTRAL SPHERE/ STATES/ UNION TERRITORIES
MINIMUM WAGE RATE (Rs.) PER DAY
AS ON 31.12.201112 Tamil Nadu 124.2313 Uttar Pradesh 165.5214 Uttarakhand 147.58
306 Solvent Plant and Refinery 1 Chattisgarh 164.50
307 Spinning, Knitting, Printing, Dyeing, Finishing, Bleaching of Silk Pina, Fibre/Silk Industry
1 Bihar 125.00
2 Assam 115.603 Jharkhand 138.234 Karnataka 186.695 Manipur 122.106 Odisha 92.507 West Bengal 124.00
308 Sponge Iron 1 Chattisgarh 164.502 Jharkhand 138.23
309 Spun Pipes, Concrete Pipes, Sanitary Fittisngs, PCC,RCS Poles & RCC Pipe Manufacturing Industry
1 Jharkhand 138.23
2 Karnataka 203.28
310 Stable 1 Maharashtra 177.47
311 Star Hotels 1 Kerala 242.58
312 Starch Industry 1 Punjab 154.40
313 STD, ISD, PCO and Allied Services 1 Rajasthan 135.00
314 Steatite Mines 1 C.L.C (Central) 171.00
315 Steel Almirah, Tables, Chairs and Steel Furniture
1 Daman and Diu 156.20
2 Karnataka 156.383 Kerala 296.104 Maharashtra 193.225 Meghalaya 100.006 Punjab 154.40
316 Steel Fabrication and Concerte Products 1 Meghalaya 100.00
317 Steel Mills and Steel Re-rolling Mills 1 Andhra Pradesh 198.902 Jammu & Kashmir 110.00
318 Steel Plants 1 Chattisgarh 164.50
319 Stone Breaking & Stone Crushing 1 A & N Island 205.002 Andhra Pradesh 213.163 Arunachal Pradesh 80.00
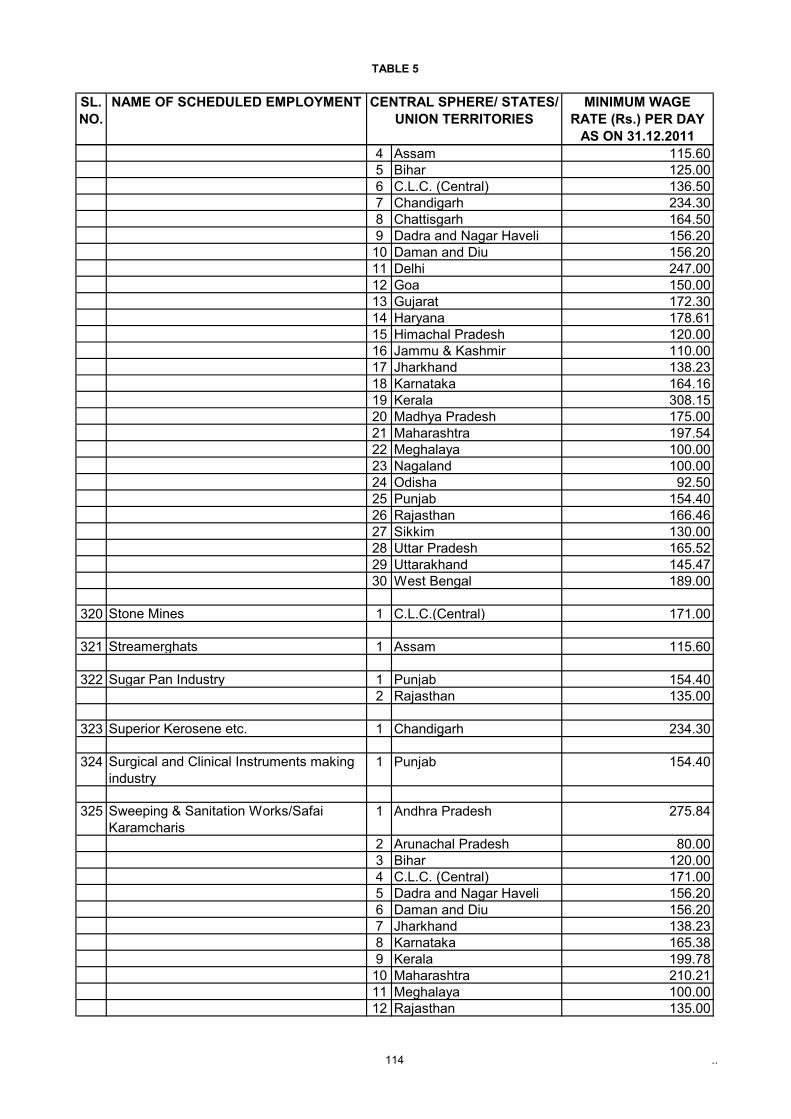
TABLE 5
114 ..
SL.NO.
NAME OF SCHEDULED EMPLOYMENT CENTRAL SPHERE/ STATES/ UNION TERRITORIES
MINIMUM WAGE RATE (Rs.) PER DAY
AS ON 31.12.20114 Assam 115.605 Bihar 125.006 C.L.C. (Central) 136.507 Chandigarh 234.308 Chattisgarh 164.509 Dadra and Nagar Haveli 156.2010 Daman and Diu 156.2011 Delhi 247.0012 Goa 150.0013 Gujarat 172.3014 Haryana 178.6115 Himachal Pradesh 120.0016 Jammu & Kashmir 110.0017 Jharkhand 138.2318 Karnataka 164.1619 Kerala 308.1520 Madhya Pradesh 175.0021 Maharashtra 197.5422 Meghalaya 100.0023 Nagaland 100.0024 Odisha 92.5025 Punjab 154.4026 Rajasthan 166.4627 Sikkim 130.0028 Uttar Pradesh 165.5229 Uttarakhand 145.4730 West Bengal 189.00
320 Stone Mines 1 C.L.C.(Central) 171.00
321 Streamerghats 1 Assam 115.60
322 Sugar Pan Industry 1 Punjab 154.402 Rajasthan 135.00
323 Superior Kerosene etc. 1 Chandigarh 234.30
324 Surgical and Clinical Instruments making industry
1 Punjab 154.40
325 Sweeping & Sanitation Works/Safai Karamcharis
1 Andhra Pradesh 275.84
2 Arunachal Pradesh 80.003 Bihar 120.004 C.L.C. (Central) 171.005 Dadra and Nagar Haveli 156.206 Daman and Diu 156.207 Jharkhand 138.238 Karnataka 165.389 Kerala 199.7810 Maharashtra 210.2111 Meghalaya 100.0012 Rajasthan 135.00
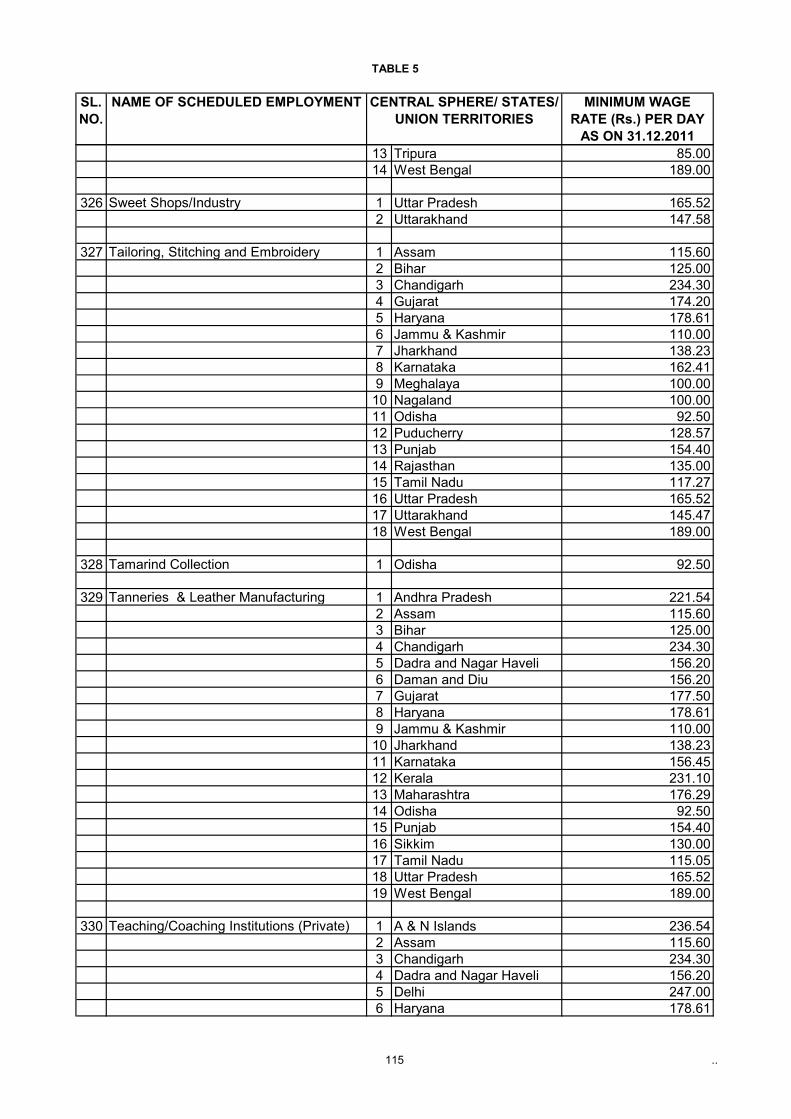
TABLE 5
115 ..
SL.NO.
NAME OF SCHEDULED EMPLOYMENT CENTRAL SPHERE/ STATES/ UNION TERRITORIES
MINIMUM WAGE RATE (Rs.) PER DAY
AS ON 31.12.201113 Tripura 85.0014 West Bengal 189.00
326 Sweet Shops/Industry 1 Uttar Pradesh 165.522 Uttarakhand 147.58
327 Tailoring, Stitching and Embroidery 1 Assam 115.602 Bihar 125.003 Chandigarh 234.304 Gujarat 174.205 Haryana 178.616 Jammu & Kashmir 110.007 Jharkhand 138.238 Karnataka 162.419 Meghalaya 100.0010 Nagaland 100.0011 Odisha 92.5012 Puducherry 128.5713 Punjab 154.4014 Rajasthan 135.0015 Tamil Nadu 117.2716 Uttar Pradesh 165.5217 Uttarakhand 145.4718 West Bengal 189.00
328 Tamarind Collection 1 Odisha 92.50
329 Tanneries & Leather Manufacturing 1 Andhra Pradesh 221.542 Assam 115.603 Bihar 125.004 Chandigarh 234.305 Dadra and Nagar Haveli 156.206 Daman and Diu 156.207 Gujarat 177.508 Haryana 178.619 Jammu & Kashmir 110.0010 Jharkhand 138.2311 Karnataka 156.4512 Kerala 231.1013 Maharashtra 176.2914 Odisha 92.5015 Punjab 154.4016 Sikkim 130.0017 Tamil Nadu 115.0518 Uttar Pradesh 165.5219 West Bengal 189.00
330 Teaching/Coaching Institutions (Private) 1 A & N Islands 236.542 Assam 115.603 Chandigarh 234.304 Dadra and Nagar Haveli 156.205 Delhi 247.006 Haryana 178.61
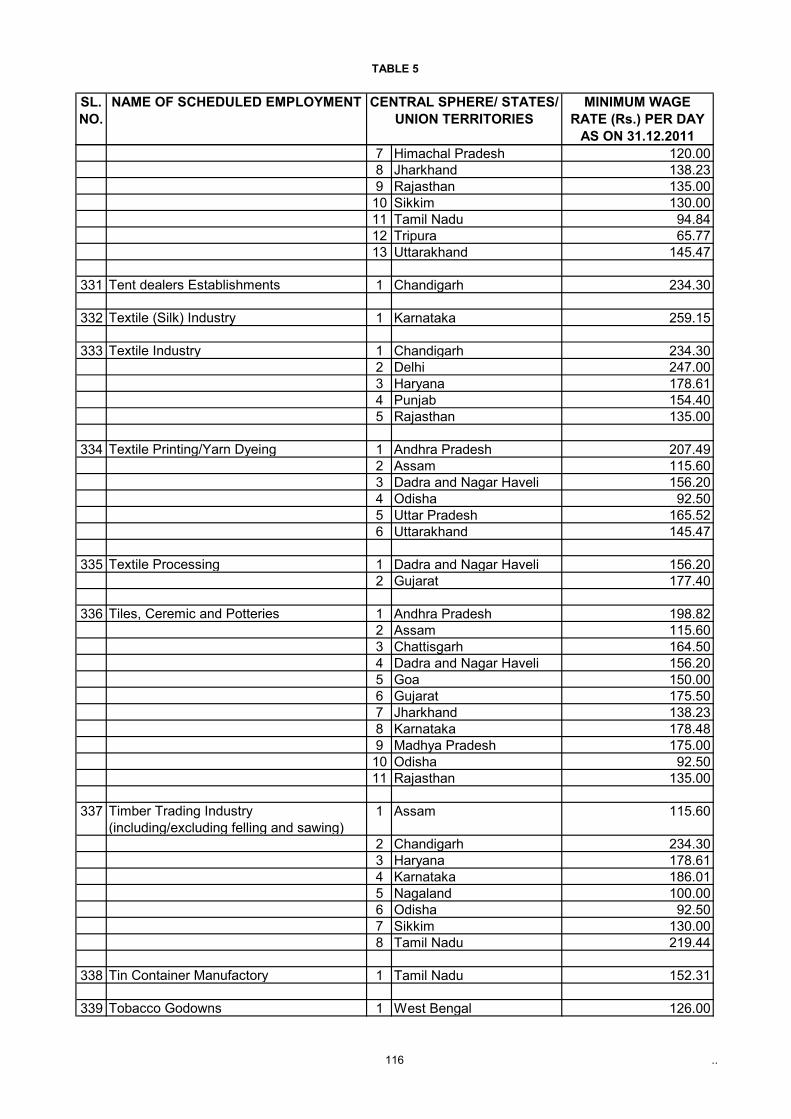
TABLE 5
116 ..
SL.NO.
NAME OF SCHEDULED EMPLOYMENT CENTRAL SPHERE/ STATES/ UNION TERRITORIES
MINIMUM WAGE RATE (Rs.) PER DAY
AS ON 31.12.20117 Himachal Pradesh 120.008 Jharkhand 138.239 Rajasthan 135.0010 Sikkim 130.0011 Tamil Nadu 94.8412 Tripura 65.7713 Uttarakhand 145.47
331 Tent dealers Establishments 1 Chandigarh 234.30
332 Textile (Silk) Industry 1 Karnataka 259.15
333 Textile Industry 1 Chandigarh 234.302 Delhi 247.003 Haryana 178.614 Punjab 154.405 Rajasthan 135.00
334 Textile Printing/Yarn Dyeing 1 Andhra Pradesh 207.492 Assam 115.603 Dadra and Nagar Haveli 156.204 Odisha 92.505 Uttar Pradesh 165.526 Uttarakhand 145.47
335 Textile Processing 1 Dadra and Nagar Haveli 156.202 Gujarat 177.40
336 Tiles, Ceremic and Potteries 1 Andhra Pradesh 198.822 Assam 115.603 Chattisgarh 164.504 Dadra and Nagar Haveli 156.205 Goa 150.006 Gujarat 175.507 Jharkhand 138.238 Karnataka 178.489 Madhya Pradesh 175.0010 Odisha 92.5011 Rajasthan 135.00
337 Timber Trading Industry (including/excluding felling and sawing)
1 Assam 115.60
2 Chandigarh 234.303 Haryana 178.614 Karnataka 186.015 Nagaland 100.006 Odisha 92.507 Sikkim 130.008 Tamil Nadu 219.44
338 Tin Container Manufactory 1 Tamil Nadu 152.31
339 Tobacco Godowns 1 West Bengal 126.00
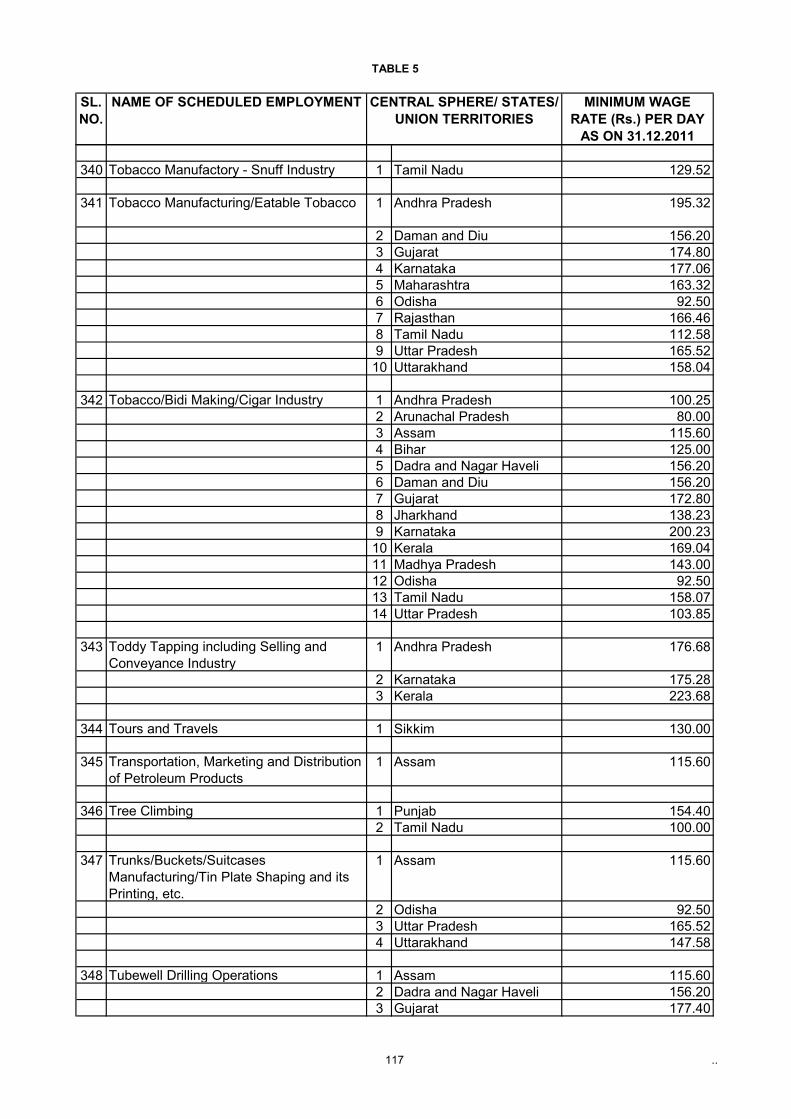
TABLE 5
117 ..
SL.NO.
NAME OF SCHEDULED EMPLOYMENT CENTRAL SPHERE/ STATES/ UNION TERRITORIES
MINIMUM WAGE RATE (Rs.) PER DAY
AS ON 31.12.2011
340 Tobacco Manufactory - Snuff Industry 1 Tamil Nadu 129.52
341 Tobacco Manufacturing/Eatable Tobacco 1 Andhra Pradesh 195.32
2 Daman and Diu 156.203 Gujarat 174.804 Karnataka 177.065 Maharashtra 163.326 Odisha 92.507 Rajasthan 166.468 Tamil Nadu 112.589 Uttar Pradesh 165.5210 Uttarakhand 158.04
342 Tobacco/Bidi Making/Cigar Industry 1 Andhra Pradesh 100.252 Arunachal Pradesh 80.003 Assam 115.604 Bihar 125.005 Dadra and Nagar Haveli 156.206 Daman and Diu 156.207 Gujarat 172.808 Jharkhand 138.239 Karnataka 200.2310 Kerala 169.0411 Madhya Pradesh 143.0012 Odisha 92.5013 Tamil Nadu 158.0714 Uttar Pradesh 103.85
343 Toddy Tapping including Selling and Conveyance Industry
1 Andhra Pradesh 176.68
2 Karnataka 175.283 Kerala 223.68
344 Tours and Travels 1 Sikkim 130.00
345 Transportation, Marketing and Distribution of Petroleum Products
1 Assam 115.60
346 Tree Climbing 1 Punjab 154.402 Tamil Nadu 100.00
347 Trunks/Buckets/Suitcases Manufacturing/Tin Plate Shaping and its Printing, etc.
1 Assam 115.60
2 Odisha 92.503 Uttar Pradesh 165.524 Uttarakhand 147.58
348 Tubewell Drilling Operations 1 Assam 115.602 Dadra and Nagar Haveli 156.203 Gujarat 177.40
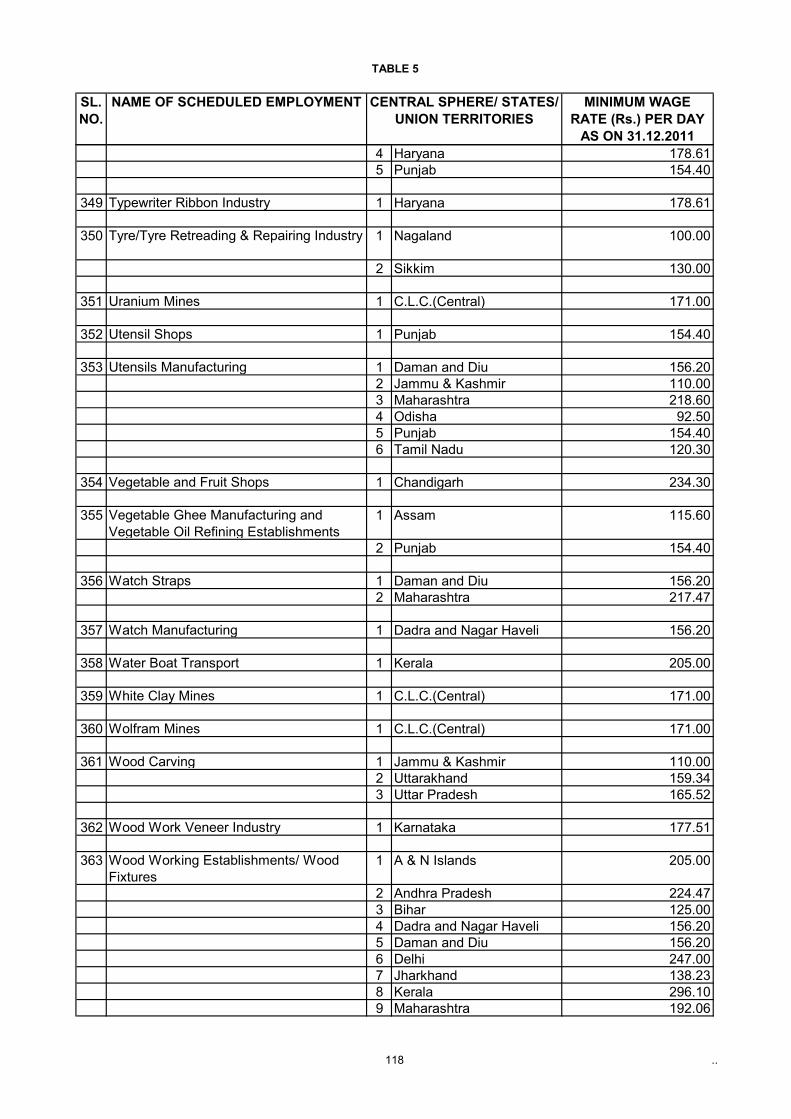
TABLE 5
118 ..
SL.NO.
NAME OF SCHEDULED EMPLOYMENT CENTRAL SPHERE/ STATES/ UNION TERRITORIES
MINIMUM WAGE RATE (Rs.) PER DAY
AS ON 31.12.20114 Haryana 178.615 Punjab 154.40
349 Typewriter Ribbon Industry 1 Haryana 178.61
350 Tyre/Tyre Retreading & Repairing Industry 1 Nagaland 100.00
2 Sikkim 130.00
351 Uranium Mines 1 C.L.C.(Central) 171.00
352 Utensil Shops 1 Punjab 154.40
353 Utensils Manufacturing 1 Daman and Diu 156.202 Jammu & Kashmir 110.003 Maharashtra 218.604 Odisha 92.505 Punjab 154.406 Tamil Nadu 120.30
354 Vegetable and Fruit Shops 1 Chandigarh 234.30
355 Vegetable Ghee Manufacturing and Vegetable Oil Refining Establishments
1 Assam 115.60
2 Punjab 154.40
356 Watch Straps 1 Daman and Diu 156.202 Maharashtra 217.47
357 Watch Manufacturing 1 Dadra and Nagar Haveli 156.20
358 Water Boat Transport 1 Kerala 205.00
359 White Clay Mines 1 C.L.C.(Central) 171.00
360 Wolfram Mines 1 C.L.C.(Central) 171.00
361 Wood Carving 1 Jammu & Kashmir 110.002 Uttarakhand 159.343 Uttar Pradesh 165.52
362 Wood Work Veneer Industry 1 Karnataka 177.51
363 Wood Working Establishments/ Wood Fixtures
1 A & N Islands 205.00
2 Andhra Pradesh 224.473 Bihar 125.004 Dadra and Nagar Haveli 156.205 Daman and Diu 156.206 Delhi 247.007 Jharkhand 138.238 Kerala 296.109 Maharashtra 192.06
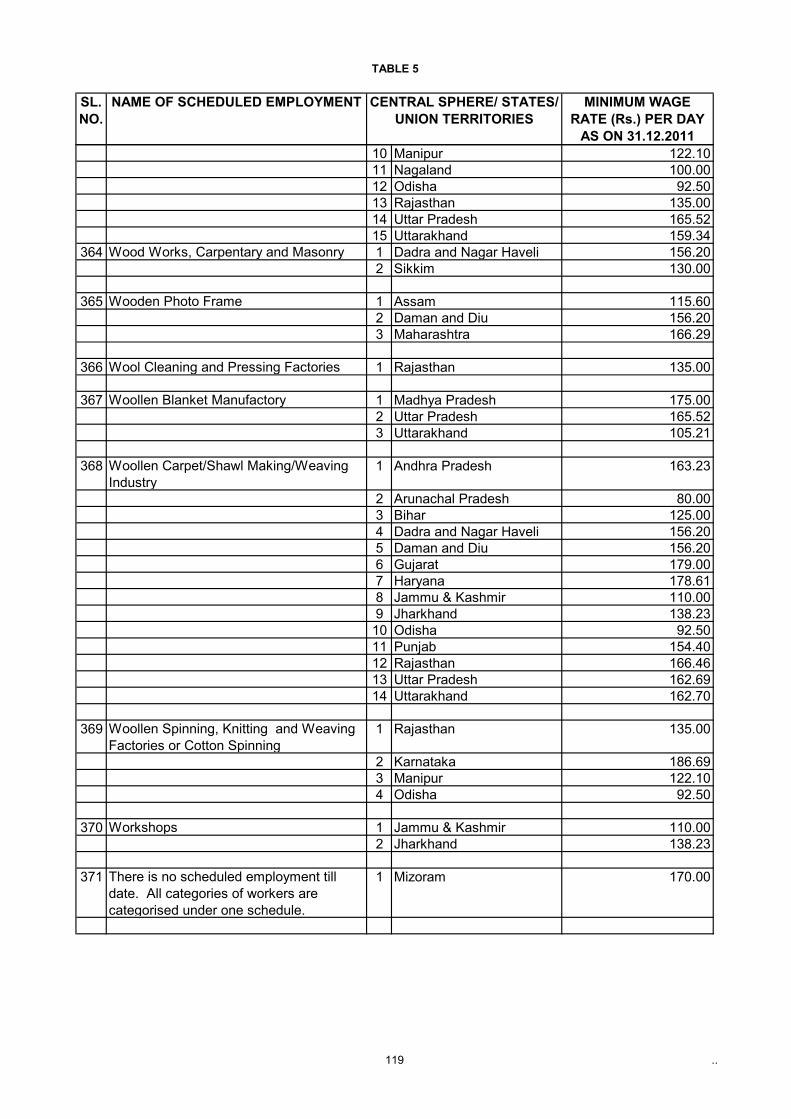
TABLE 5
119 ..
SL.NO.
NAME OF SCHEDULED EMPLOYMENT CENTRAL SPHERE/ STATES/ UNION TERRITORIES
MINIMUM WAGE RATE (Rs.) PER DAY
AS ON 31.12.201110 Manipur 122.1011 Nagaland 100.0012 Odisha 92.5013 Rajasthan 135.0014 Uttar Pradesh 165.5215 Uttarakhand 159.34
364 Wood Works, Carpentary and Masonry 1 Dadra and Nagar Haveli 156.202 Sikkim 130.00
365 Wooden Photo Frame 1 Assam 115.602 Daman and Diu 156.203 Maharashtra 166.29
366 Wool Cleaning and Pressing Factories 1 Rajasthan 135.00
367 Woollen Blanket Manufactory 1 Madhya Pradesh 175.002 Uttar Pradesh 165.523 Uttarakhand 105.21
368 Woollen Carpet/Shawl Making/Weaving Industry
1 Andhra Pradesh 163.23
2 Arunachal Pradesh 80.003 Bihar 125.004 Dadra and Nagar Haveli 156.205 Daman and Diu 156.206 Gujarat 179.007 Haryana 178.618 Jammu & Kashmir 110.009 Jharkhand 138.2310 Odisha 92.5011 Punjab 154.4012 Rajasthan 166.4613 Uttar Pradesh 162.6914 Uttarakhand 162.70
369 Woollen Spinning, Knitting and Weaving Factories or Cotton Spinning
1 Rajasthan 135.00
2 Karnataka 186.693 Manipur 122.104 Odisha 92.50
370 Workshops 1 Jammu & Kashmir 110.002 Jharkhand 138.23
371 There is no scheduled employment till date. All categories of workers are categorised under one schedule.
1 Mizoram 170.00
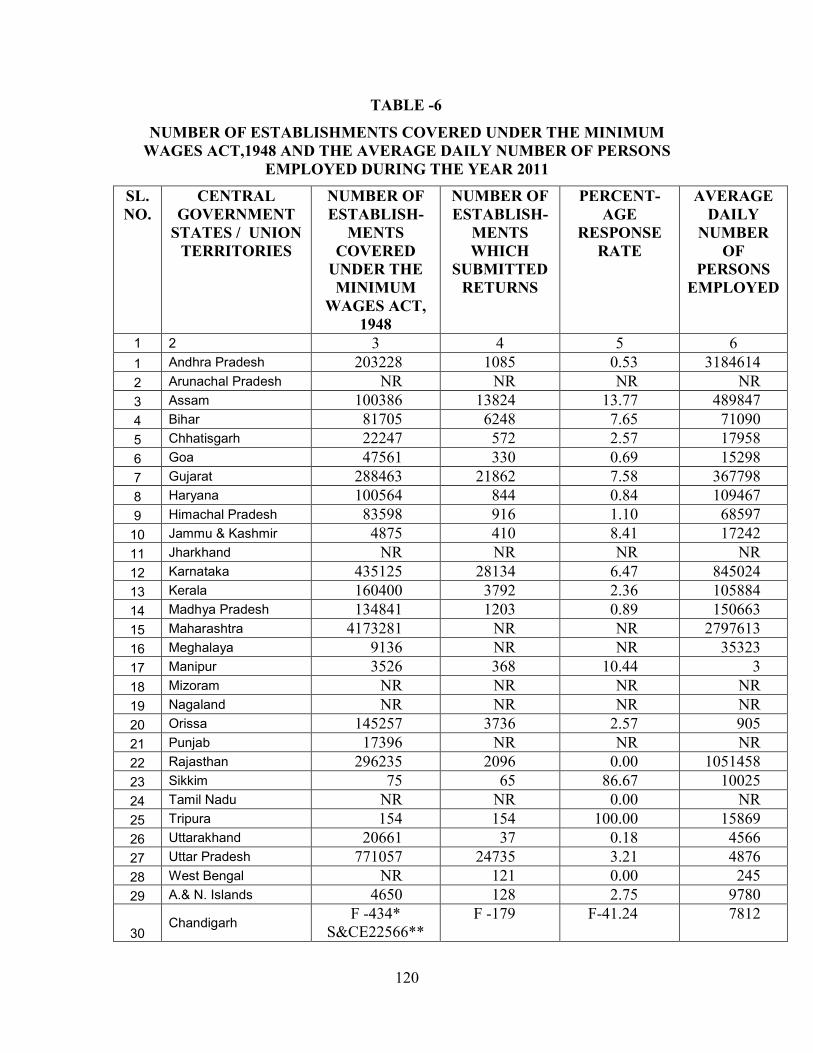
120
TABLE -6
NUMBER OF ESTABLISHMENTS COVERED UNDER THE MINIMUM WAGES ACT,1948 AND THE AVERAGE DAILY NUMBER OF PERSONS
EMPLOYED DURING THE YEAR 2011
SL. NO.
CENTRAL GOVERNMENT
STATES / UNION TERRITORIES
NUMBER OF ESTABLISH-
MENTS COVERED
UNDER THE MINIMUM
WAGES ACT, 1948
NUMBER OF ESTABLISH-
MENTS WHICH
SUBMITTED RETURNS
PERCENT-AGE
RESPONSE RATE
AVERAGE DAILY
NUMBER OF
PERSONS EMPLOYED
1 2 3 4 5 6 1 Andhra Pradesh 203228 1085 0.53 3184614 2 Arunachal Pradesh NR NR NR NR 3 Assam 100386 13824 13.77 489847 4 Bihar 81705 6248 7.65 71090 5 Chhatisgarh 22247 572 2.57 17958 6 Goa 47561 330 0.69 15298 7 Gujarat 288463 21862 7.58 367798 8 Haryana 100564 844 0.84 109467 9 Himachal Pradesh 83598 916 1.10 68597
10 Jammu & Kashmir 4875 410 8.41 17242 11 Jharkhand NR NR NR NR 12 Karnataka 435125 28134 6.47 845024 13 Kerala 160400 3792 2.36 105884 14 Madhya Pradesh 134841 1203 0.89 150663 15 Maharashtra 4173281 NR NR 2797613 16 Meghalaya 9136 NR NR 35323 17 Manipur 3526 368 10.44 3 18 Mizoram NR NR NR NR 19 Nagaland NR NR NR NR 20 Orissa 145257 3736 2.57 905 21 Punjab 17396 NR NR NR 22 Rajasthan 296235 2096 0.00 1051458 23 Sikkim 75 65 86.67 10025 24 Tamil Nadu NR NR 0.00 NR 25 Tripura 154 154 100.00 15869 26 Uttarakhand 20661 37 0.18 4566 27 Uttar Pradesh 771057 24735 3.21 4876 28 West Bengal NR 121 0.00 245 29 A.& N. Islands 4650 128 2.75 9780
30 Chandigarh F -434*
S&CE22566** F -179 F-41.24 7812
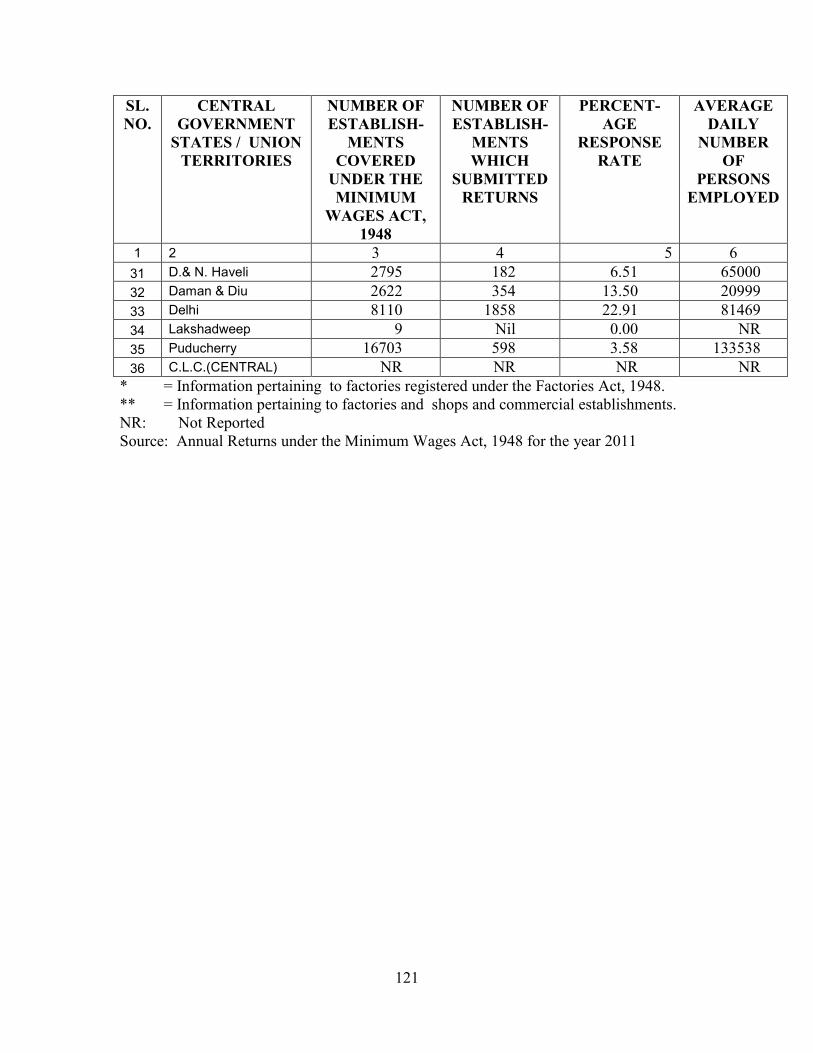
121
SL. NO.
CENTRAL GOVERNMENT
STATES / UNION TERRITORIES
NUMBER OF ESTABLISH-
MENTS COVERED
UNDER THE MINIMUM
WAGES ACT, 1948
NUMBER OF ESTABLISH-
MENTS WHICH
SUBMITTED RETURNS
PERCENT-AGE
RESPONSE RATE
AVERAGE DAILY
NUMBER OF
PERSONS EMPLOYED
1 2 3 4 5 6 31 D.& N. Haveli 2795 182 6.51 65000 32 Daman & Diu 2622 354 13.50 20999 33 Delhi 8110 1858 22.91 81469 34 Lakshadweep 9 Nil 0.00 NR 35 Puducherry 16703 598 3.58 133538 36 C.L.C.(CENTRAL) NR NR NR NR
* = Information pertaining to factories registered under the Factories Act, 1948. ** = Information pertaining to factories and shops and commercial establishments. NR: Not Reported Source: Annual Returns under the Minimum Wages Act, 1948 for the year 2011
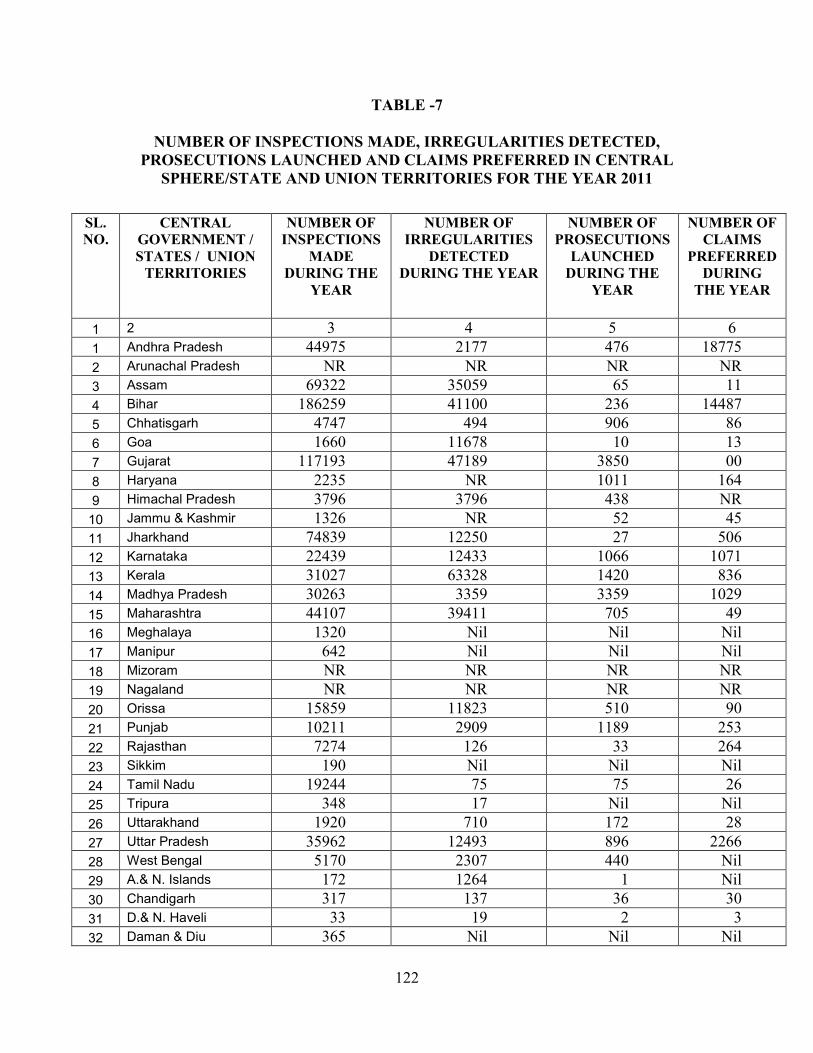
122
TABLE -7
NUMBER OF INSPECTIONS MADE, IRREGULARITIES DETECTED, PROSECUTIONS LAUNCHED AND CLAIMS PREFERRED IN CENTRAL
SPHERE/STATE AND UNION TERRITORIES FOR THE YEAR 2011
SL. NO.
CENTRAL GOVERNMENT / STATES / UNION
TERRITORIES
NUMBER OF INSPECTIONS
MADE DURING THE
YEAR
NUMBER OF IRREGULARITIES
DETECTED DURING THE YEAR
NUMBER OF PROSECUTIONS
LAUNCHED DURING THE
YEAR
NUMBER OF CLAIMS
PREFERRED DURING
THE YEAR
1 2 3 4 5 6 1 Andhra Pradesh 44975 2177 476 18775 2 Arunachal Pradesh NR NR NR NR 3 Assam 69322 35059 65 11 4 Bihar 186259 41100 236 14487 5 Chhatisgarh 4747 494 906 86 6 Goa 1660 11678 10 13 7 Gujarat 117193 47189 3850 00 8 Haryana 2235 NR 1011 164 9 Himachal Pradesh 3796 3796 438 NR
10 Jammu & Kashmir 1326 NR 52 45 11 Jharkhand 74839 12250 27 506 12 Karnataka 22439 12433 1066 1071 13 Kerala 31027 63328 1420 836 14 Madhya Pradesh 30263 3359 3359 1029 15 Maharashtra 44107 39411 705 49 16 Meghalaya 1320 Nil Nil Nil 17 Manipur 642 Nil Nil Nil 18 Mizoram NR NR NR NR 19 Nagaland NR NR NR NR 20 Orissa 15859 11823 510 90 21 Punjab 10211 2909 1189 253 22 Rajasthan 7274 126 33 264 23 Sikkim 190 Nil Nil Nil 24 Tamil Nadu 19244 75 75 26 25 Tripura 348 17 Nil Nil 26 Uttarakhand 1920 710 172 28 27 Uttar Pradesh 35962 12493 896 2266 28 West Bengal 5170 2307 440 Nil 29 A.& N. Islands 172 1264 1 Nil 30 Chandigarh 317 137 36 30 31 D.& N. Haveli 33 19 2 3 32 Daman & Diu 365 Nil Nil Nil
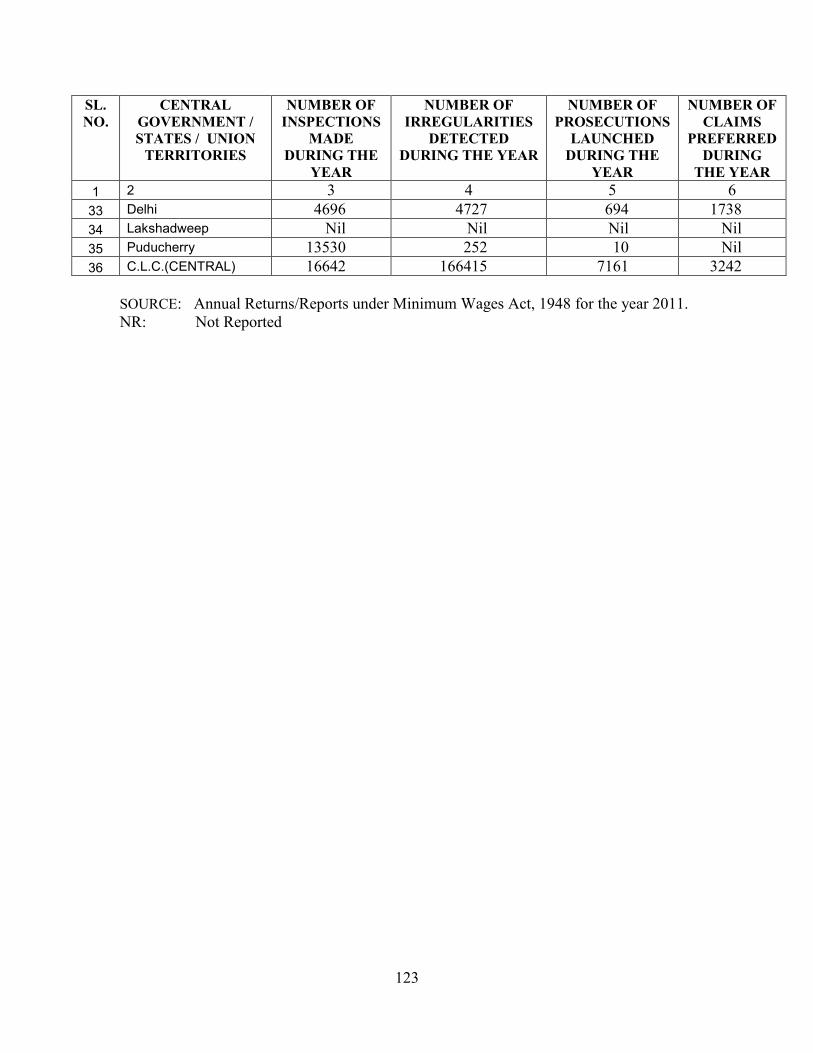
123
SL. NO.
CENTRAL GOVERNMENT / STATES / UNION
TERRITORIES
NUMBER OF INSPECTIONS
MADE DURING THE
YEAR
NUMBER OF IRREGULARITIES
DETECTED DURING THE YEAR
NUMBER OF PROSECUTIONS
LAUNCHED DURING THE
YEAR
NUMBER OF CLAIMS
PREFERRED DURING
THE YEAR 1 2 3 4 5 6
33 Delhi 4696 4727 694 1738 34 Lakshadweep Nil Nil Nil Nil 35 Puducherry 13530 252 10 Nil 36 C.L.C.(CENTRAL) 16642 166415 7161 3242
SOURCE: Annual Returns/Reports under Minimum Wages Act, 1948 for the year 2011. NR: Not Reported
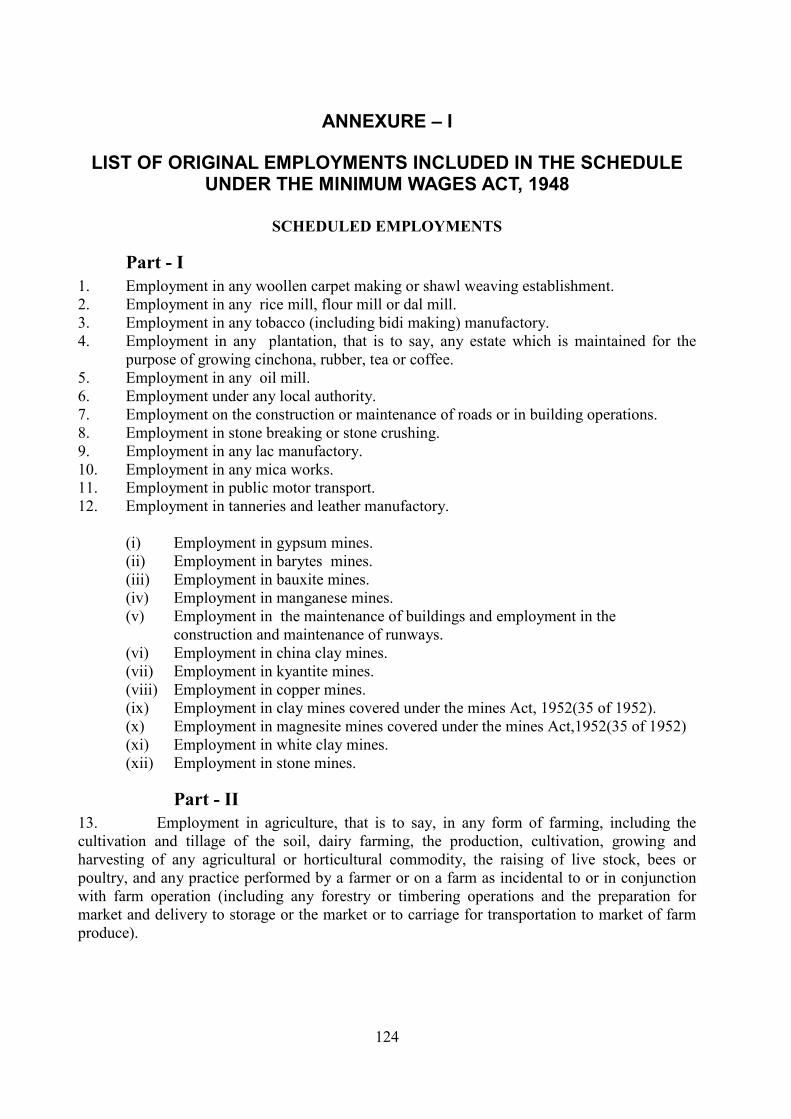
124
ANNEXURE – I
LIST OF ORIGINAL EMPLOYMENTS INCLUDED IN THE SCHEDULE UNDER THE MINIMUM WAGES ACT, 1948
SCHEDULED EMPLOYMENTS
Part - I 1. Employment in any woollen carpet making or shawl weaving establishment. 2. Employment in any rice mill, flour mill or dal mill. 3. Employment in any tobacco (including bidi making) manufactory. 4. Employment in any plantation, that is to say, any estate which is maintained for the
purpose of growing cinchona, rubber, tea or coffee. 5. Employment in any oil mill. 6. Employment under any local authority. 7. Employment on the construction or maintenance of roads or in building operations. 8. Employment in stone breaking or stone crushing. 9. Employment in any lac manufactory. 10. Employment in any mica works. 11. Employment in public motor transport. 12. Employment in tanneries and leather manufactory.
(i) Employment in gypsum mines. (ii) Employment in barytes mines. (iii) Employment in bauxite mines. (iv) Employment in manganese mines. (v) Employment in the maintenance of buildings and employment in the
construction and maintenance of runways. (vi) Employment in china clay mines. (vii) Employment in kyantite mines. (viii) Employment in copper mines. (ix) Employment in clay mines covered under the mines Act, 1952(35 of 1952). (x) Employment in magnesite mines covered under the mines Act,1952(35 of 1952) (xi) Employment in white clay mines. (xii) Employment in stone mines.
Part - II 13. Employment in agriculture, that is to say, in any form of farming, including the cultivation and tillage of the soil, dairy farming, the production, cultivation, growing and harvesting of any agricultural or horticultural commodity, the raising of live stock, bees or poultry, and any practice performed by a farmer or on a farm as incidental to or in conjunction with farm operation (including any forestry or timbering operations and the preparation for market and delivery to storage or the market or to carriage for transportation to market of farm produce).
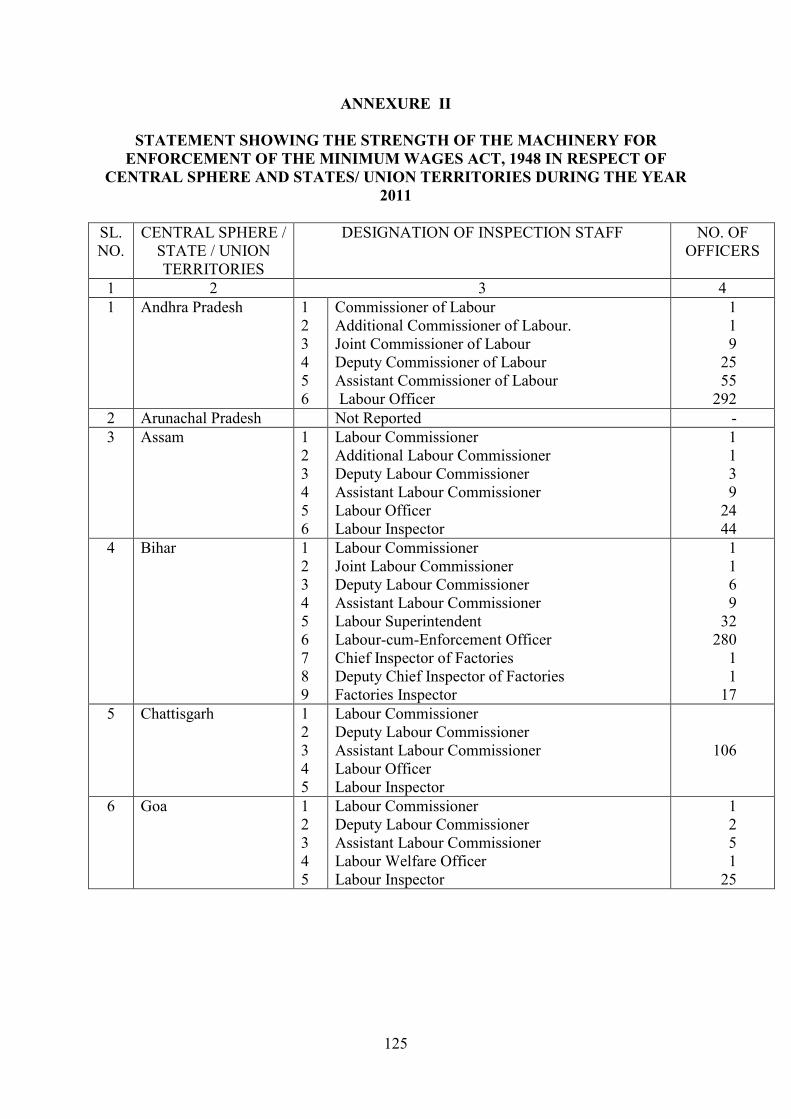
125
ANNEXURE II
STATEMENT SHOWING THE STRENGTH OF THE MACHINERY FOR ENFORCEMENT OF THE MINIMUM WAGES ACT, 1948 IN RESPECT OF
CENTRAL SPHERE AND STATES/ UNION TERRITORIES DURING THE YEAR 2011
SL. NO.
CENTRAL SPHERE / STATE / UNION TERRITORIES
DESIGNATION OF INSPECTION STAFF NO. OF OFFICERS
1 2 3 4 1 Andhra Pradesh 1
2 3 4 5 6
Commissioner of Labour Additional Commissioner of Labour. Joint Commissioner of Labour Deputy Commissioner of Labour Assistant Commissioner of Labour Labour Officer
1 1 9
25 55
292 2 Arunachal Pradesh Not Reported - 3 Assam 1
2 3 4 5 6
Labour Commissioner Additional Labour Commissioner Deputy Labour Commissioner Assistant Labour Commissioner Labour Officer Labour Inspector
1 1 3 9
24 44
4 Bihar 1 2 3 4 5 6 7 8 9
Labour Commissioner Joint Labour Commissioner Deputy Labour Commissioner Assistant Labour Commissioner Labour Superintendent Labour-cum-Enforcement Officer Chief Inspector of Factories Deputy Chief Inspector of Factories Factories Inspector
1 1 6 9
32 280
1 1
17 5 Chattisgarh 1
2 3 4 5
Labour Commissioner Deputy Labour Commissioner Assistant Labour Commissioner Labour Officer Labour Inspector
106
6 Goa 1 2 3 4 5
Labour Commissioner Deputy Labour Commissioner Assistant Labour Commissioner Labour Welfare Officer Labour Inspector
1 2 5 1
25
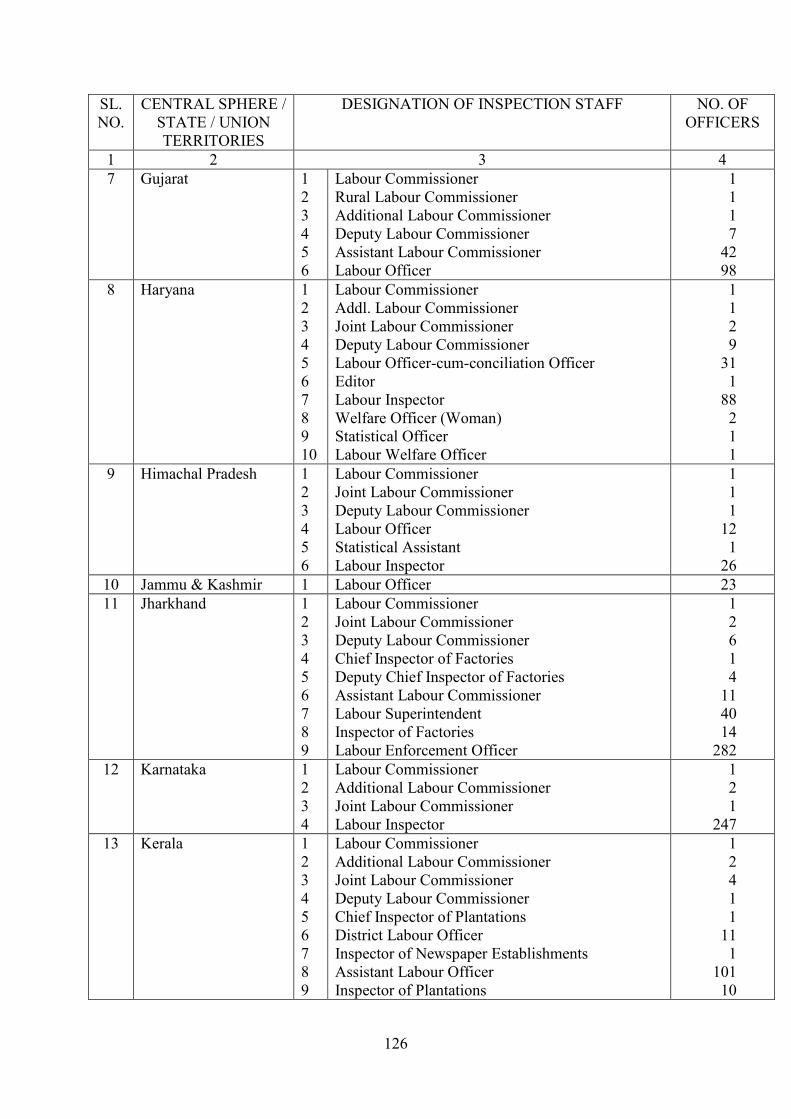
126
SL. NO.
CENTRAL SPHERE / STATE / UNION TERRITORIES
DESIGNATION OF INSPECTION STAFF NO. OF OFFICERS
1 2 3 4 7 Gujarat 1
2 3 4 5 6
Labour Commissioner Rural Labour Commissioner Additional Labour Commissioner Deputy Labour Commissioner Assistant Labour Commissioner Labour Officer
1 1 1 7
42 98
8 Haryana 1 2 3 4 5 6 7 8 9 10
Labour Commissioner Addl. Labour Commissioner Joint Labour Commissioner Deputy Labour Commissioner Labour Officer-cum-conciliation Officer Editor Labour Inspector Welfare Officer (Woman) Statistical Officer Labour Welfare Officer
1 1 2 9
31 1
88 2 1 1
9 Himachal Pradesh 1 2 3 4 5 6
Labour Commissioner Joint Labour Commissioner Deputy Labour Commissioner Labour Officer Statistical Assistant Labour Inspector
1 1 1
12 1
26 10 Jammu & Kashmir 1 Labour Officer 23 11 Jharkhand 1
2 3 4 5 6 7 8 9
Labour Commissioner Joint Labour Commissioner Deputy Labour Commissioner Chief Inspector of Factories Deputy Chief Inspector of Factories Assistant Labour Commissioner Labour Superintendent Inspector of Factories Labour Enforcement Officer
1 2 6 1 4
11 40 14
282 12 Karnataka 1
2 3 4
Labour Commissioner Additional Labour Commissioner Joint Labour Commissioner Labour Inspector
1 2 1
247 13 Kerala 1
2 3 4 5 6 7 8 9
Labour Commissioner Additional Labour Commissioner Joint Labour Commissioner Deputy Labour Commissioner Chief Inspector of Plantations District Labour Officer Inspector of Newspaper Establishments Assistant Labour Officer Inspector of Plantations
1 2 4 1 1
11 1
101 10
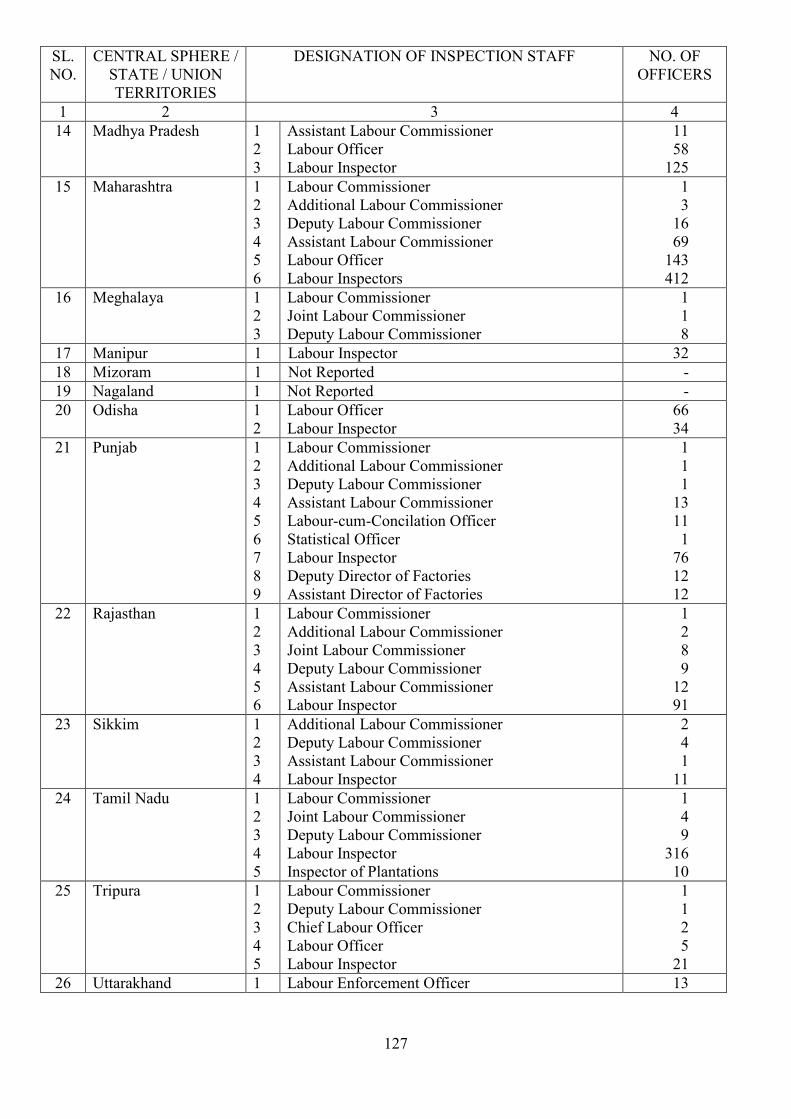
127
SL. NO.
CENTRAL SPHERE / STATE / UNION TERRITORIES
DESIGNATION OF INSPECTION STAFF NO. OF OFFICERS
1 2 3 4 14 Madhya Pradesh 1
2 3
Assistant Labour Commissioner Labour Officer Labour Inspector
11 58
125 15 Maharashtra 1
2 3 4 5 6
Labour Commissioner Additional Labour Commissioner Deputy Labour Commissioner Assistant Labour Commissioner Labour Officer Labour Inspectors
1 3
16 69
143 412
16 Meghalaya 1 2 3
Labour Commissioner Joint Labour Commissioner Deputy Labour Commissioner
1 1 8
17 Manipur 1 Labour Inspector 32 18 Mizoram 1 Not Reported - 19 Nagaland 1 Not Reported - 20 Odisha 1
2 Labour Officer Labour Inspector
66 34
21 Punjab 1 2 3 4 5 6 7 8 9
Labour Commissioner Additional Labour Commissioner Deputy Labour Commissioner Assistant Labour Commissioner Labour-cum-Concilation Officer Statistical Officer Labour Inspector Deputy Director of Factories Assistant Director of Factories
1 1 1
13 11 1
76 12 12
22 Rajasthan 1 2 3 4 5 6
Labour Commissioner Additional Labour Commissioner Joint Labour Commissioner Deputy Labour Commissioner Assistant Labour Commissioner Labour Inspector
1 2 8 9
12 91
23 Sikkim 1 2 3 4
Additional Labour Commissioner Deputy Labour Commissioner Assistant Labour Commissioner Labour Inspector
2 4 1
11 24 Tamil Nadu 1
2 3 4 5
Labour Commissioner Joint Labour Commissioner Deputy Labour Commissioner Labour Inspector Inspector of Plantations
1 4 9
316 10
25 Tripura 1 2 3 4 5
Labour Commissioner Deputy Labour Commissioner Chief Labour Officer Labour Officer Labour Inspector
1 1 2 5
21 26 Uttarakhand 1 Labour Enforcement Officer 13
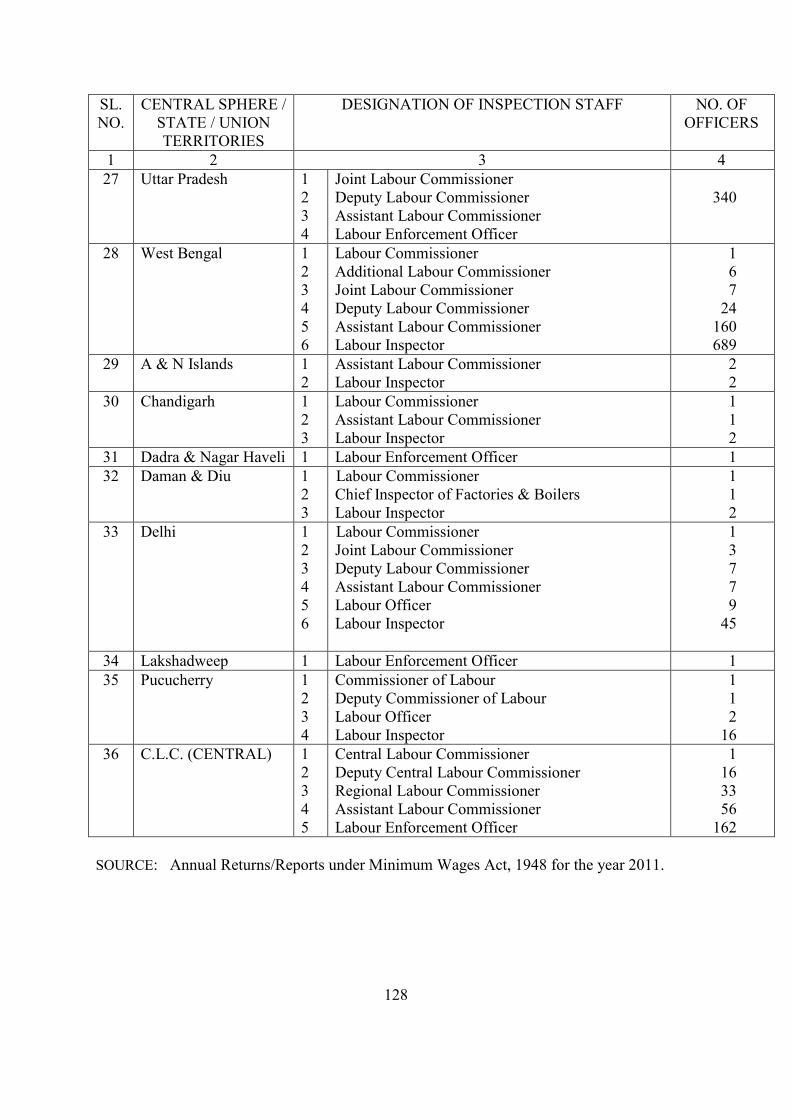
128
SL. NO.
CENTRAL SPHERE / STATE / UNION TERRITORIES
DESIGNATION OF INSPECTION STAFF NO. OF OFFICERS
1 2 3 4 27 Uttar Pradesh 1
2 3 4
Joint Labour Commissioner Deputy Labour Commissioner Assistant Labour Commissioner Labour Enforcement Officer
340
28 West Bengal 1 2 3 4 5 6
Labour Commissioner Additional Labour Commissioner Joint Labour Commissioner Deputy Labour Commissioner Assistant Labour Commissioner Labour Inspector
1 6 7
24 160 689
29 A & N Islands 1 2
Assistant Labour Commissioner Labour Inspector
2 2
30 Chandigarh 1 2 3
Labour Commissioner Assistant Labour Commissioner Labour Inspector
1 1 2
31 Dadra & Nagar Haveli 1 Labour Enforcement Officer 1 32 Daman & Diu 1
2 3
Labour Commissioner Chief Inspector of Factories & Boilers Labour Inspector
1 1 2
33 Delhi 1 2 3 4 5 6
Labour Commissioner Joint Labour Commissioner Deputy Labour Commissioner Assistant Labour Commissioner Labour Officer Labour Inspector
1 3 7 7 9
45
34 Lakshadweep 1 Labour Enforcement Officer 1 35 Pucucherry 1
2 3 4
Commissioner of Labour Deputy Commissioner of Labour Labour Officer Labour Inspector
1 1 2
16 36 C.L.C. (CENTRAL) 1
2 3 4 5
Central Labour Commissioner Deputy Central Labour Commissioner Regional Labour Commissioner Assistant Labour Commissioner Labour Enforcement Officer
1 16 33 56
162 SOURCE: Annual Returns/Reports under Minimum Wages Act, 1948 for the year 2011.
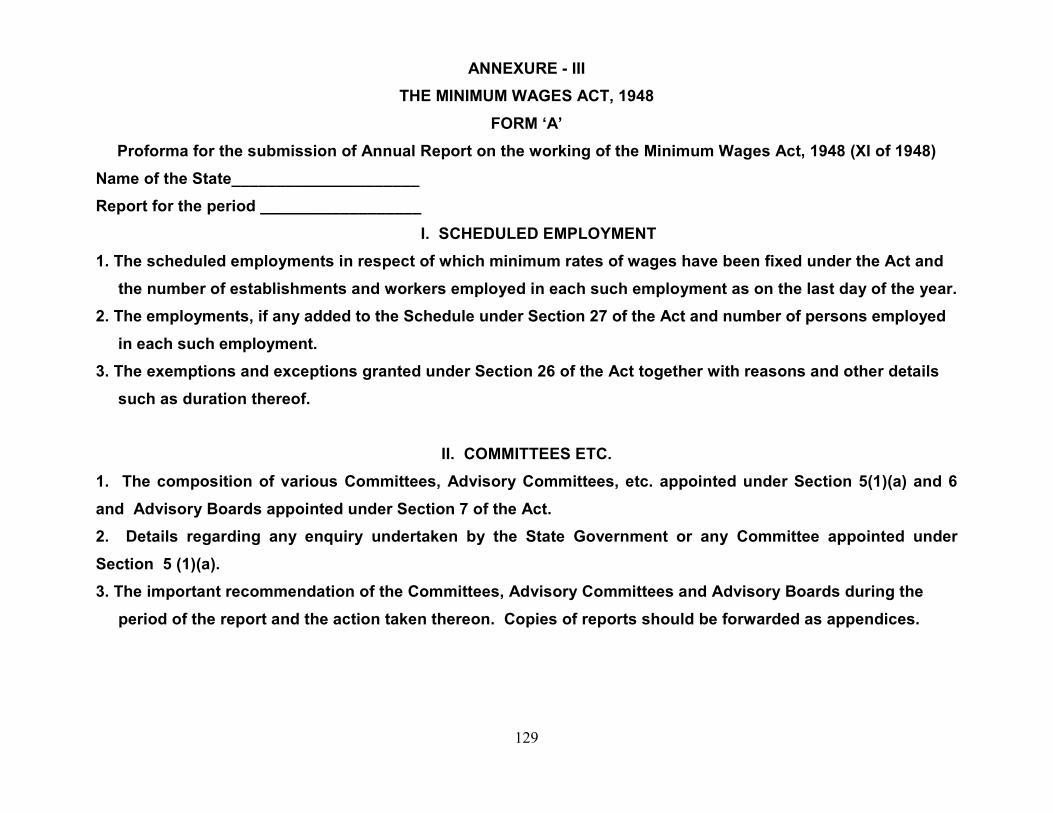
129
ANNEXURE - III THE MINIMUM WAGES ACT, 1948
FORM ‘A’ Proforma for the submission of Annual Report on the working of the Minimum Wages Act, 1948 (XI of 1948)
Name of the State_____________________ Report for the period __________________
I. SCHEDULED EMPLOYMENT 1. The scheduled employments in respect of which minimum rates of wages have been fixed under the Act and the number of establishments and workers employed in each such employment as on the last day of the year. 2. The employments, if any added to the Schedule under Section 27 of the Act and number of persons employed in each such employment. 3. The exemptions and exceptions granted under Section 26 of the Act together with reasons and other details such as duration thereof.
II. COMMITTEES ETC. 1. The composition of various Committees, Advisory Committees, etc. appointed under Section 5(1)(a) and 6 and Advisory Boards appointed under Section 7 of the Act. 2. Details regarding any enquiry undertaken by the State Government or any Committee appointed under Section 5 (1)(a). 3. The important recommendation of the Committees, Advisory Committees and Advisory Boards during the period of the report and the action taken thereon. Copies of reports should be forwarded as appendices.
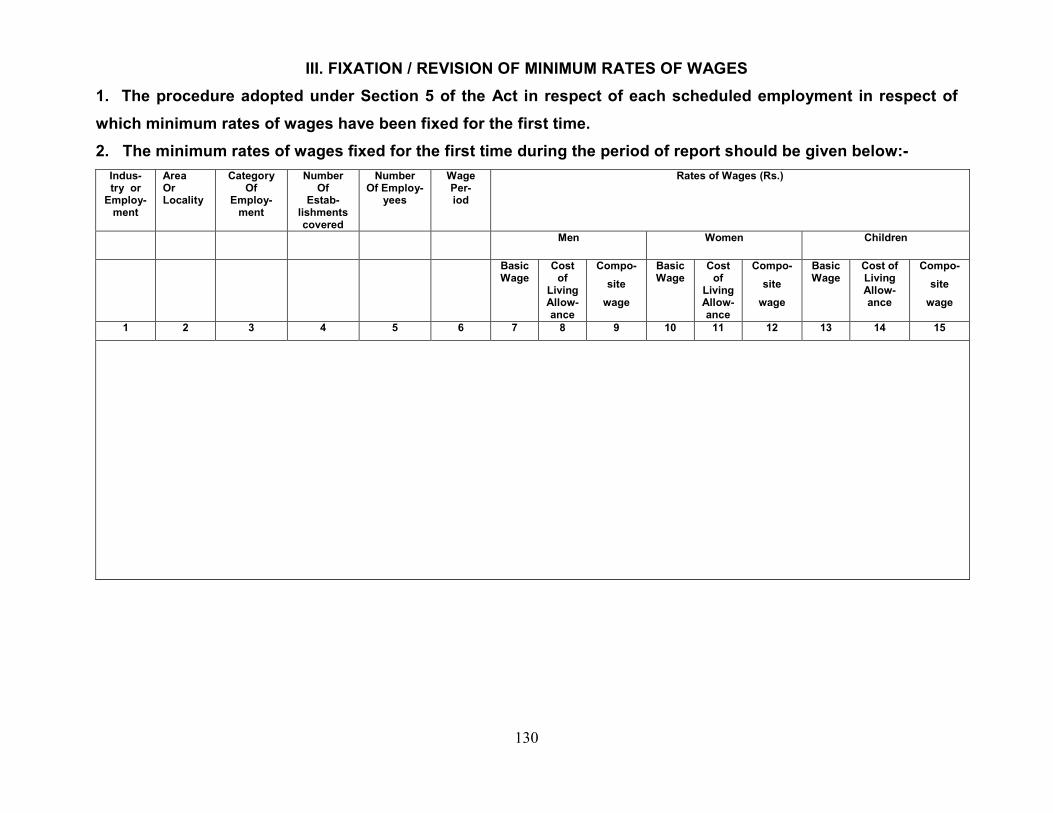
130
III. FIXATION / REVISION OF MINIMUM RATES OF WAGES 1. The procedure adopted under Section 5 of the Act in respect of each scheduled employment in respect of which minimum rates of wages have been fixed for the first time. 2. The minimum rates of wages fixed for the first time during the period of report should be given below:-
Indus- try or
Employ- ment
Area Or Locality
Category Of
Employ- ment
Number Of
Estab- lishments covered
Number Of Employ-
yees
Wage Per- iod
Rates of Wages (Rs.)
Men Women Children
Basic Wage
Cost of
Living Allow- ance
Compo- site
wage
Basic Wage
Cost of
Living Allow- ance
Compo- site
wage
Basic Wage
Cost of Living Allow- ance
Compo- site
wage
1 2 3 4 5 6 7 8 9 10 11 12 13 14 15
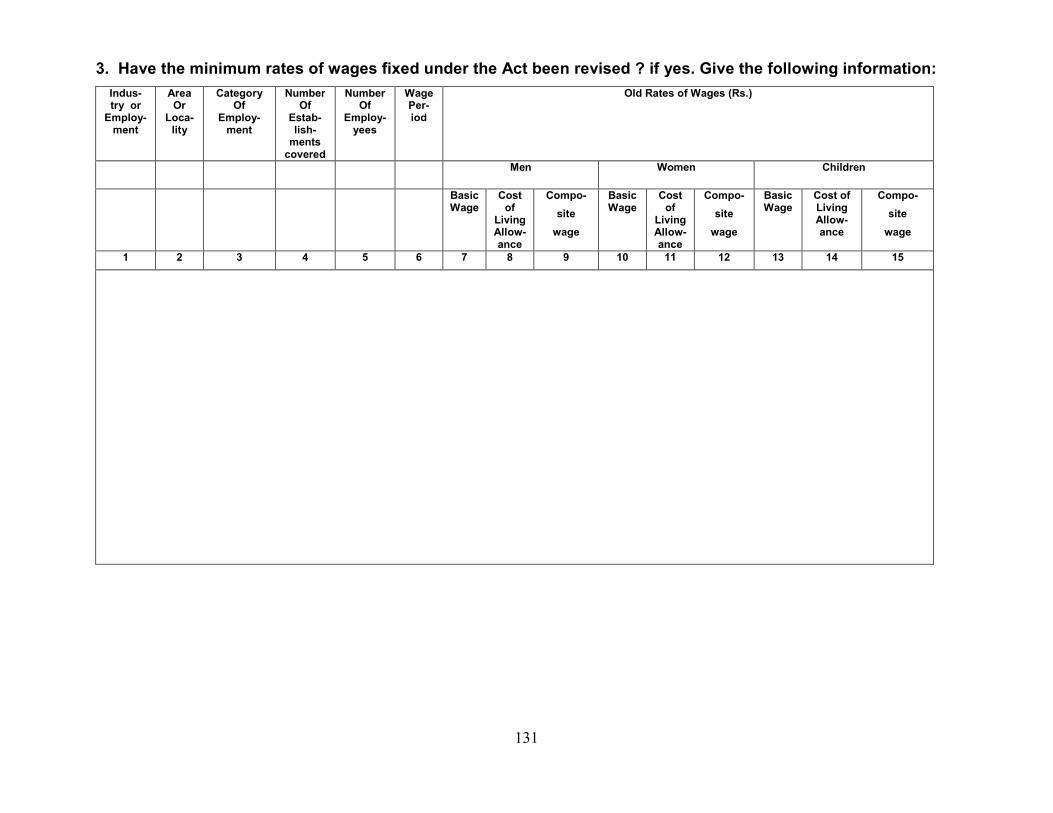
131
3. Have the minimum rates of wages fixed under the Act been revised ? if yes. Give the following information: Indus- try or
Employ- ment
Area Or
Loca- lity
Category Of
Employ- ment
Number Of
Estab- lish-
ments covered
Number Of
Employ- yees
Wage Per- iod
Old Rates of Wages (Rs.)
Men Women Children
Basic Wage
Cost of
Living Allow- ance
Compo- site
wage
Basic Wage
Cost of
Living Allow- ance
Compo- site
wage
Basic Wage
Cost of Living Allow- ance
Compo- site
wage
1 2 3 4 5 6 7 8 9 10 11 12 13 14 15
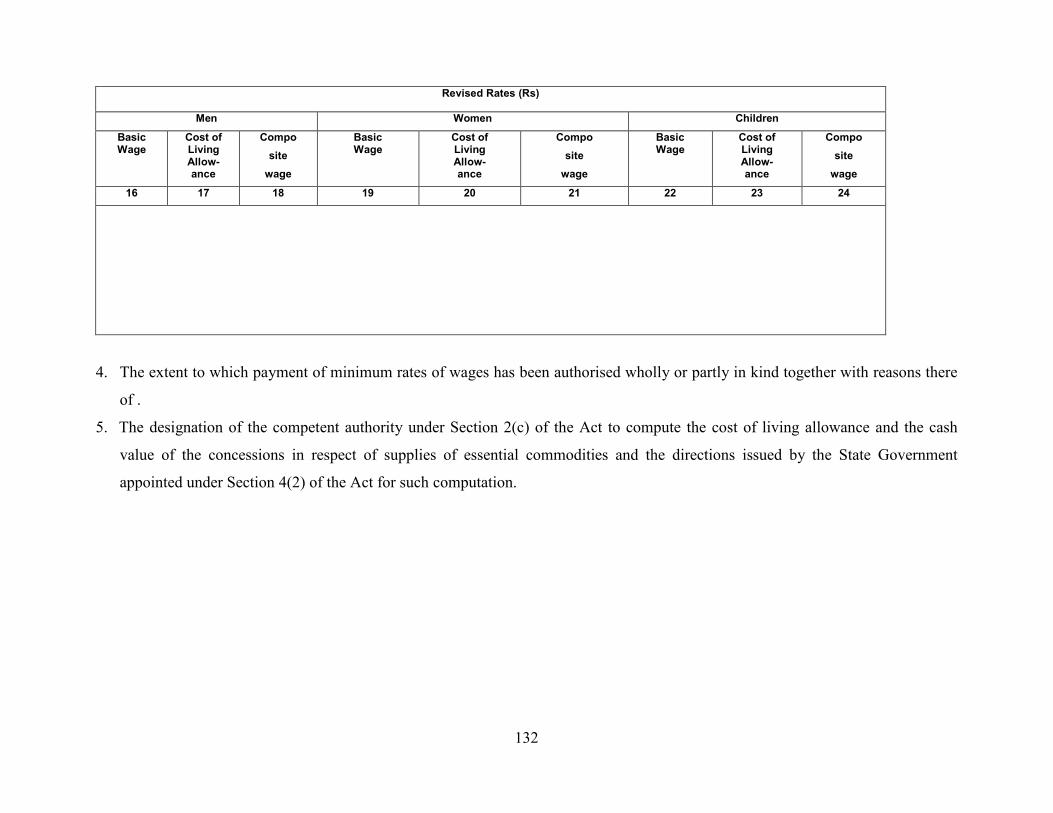
132
Revised Rates (Rs)
Men Women Children
Basic Wage
Cost of Living Allow- ance
Compo site
wage
Basic Wage
Cost of Living Allow- ance
Compo site
wage
Basic Wage
Cost of Living Allow- ance
Compo site
wage
16 17 18 19 20 21 22 23 24
4. The extent to which payment of minimum rates of wages has been authorised wholly or partly in kind together with reasons there
of .
5. The designation of the competent authority under Section 2(c) of the Act to compute the cost of living allowance and the cash
value of the concessions in respect of supplies of essential commodities and the directions issued by the State Government
appointed under Section 4(2) of the Act for such computation.
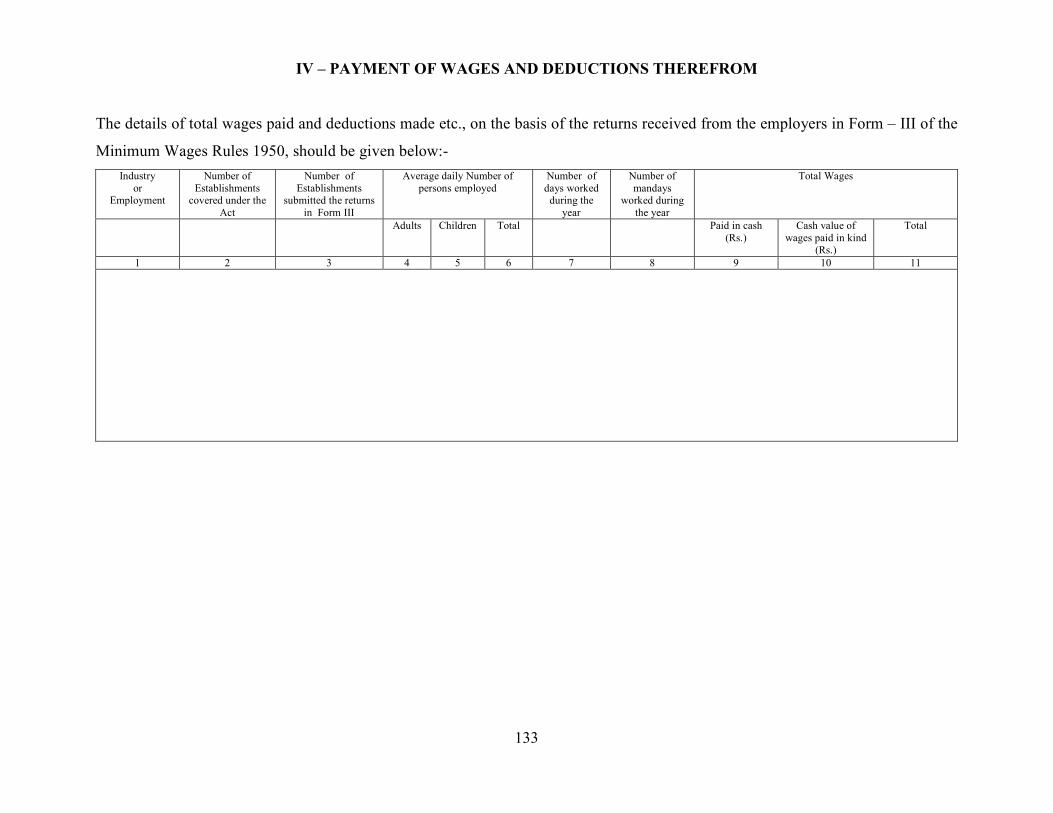
133
IV – PAYMENT OF WAGES AND DEDUCTIONS THEREFROM
The details of total wages paid and deductions made etc., on the basis of the returns received from the employers in Form – III of the
Minimum Wages Rules 1950, should be given below:- Industry
or Employment
Number of Establishments
covered under the Act
Number of Establishments
submitted the returns in Form III
Average daily Number of persons employed
Number of days worked
during the year
Number of mandays
worked during the year
Total Wages
Adults Children Total Paid in cash (Rs.)
Cash value of wages paid in kind
(Rs.)
Total
1 2 3 4 5 6 7 8 9 10 11
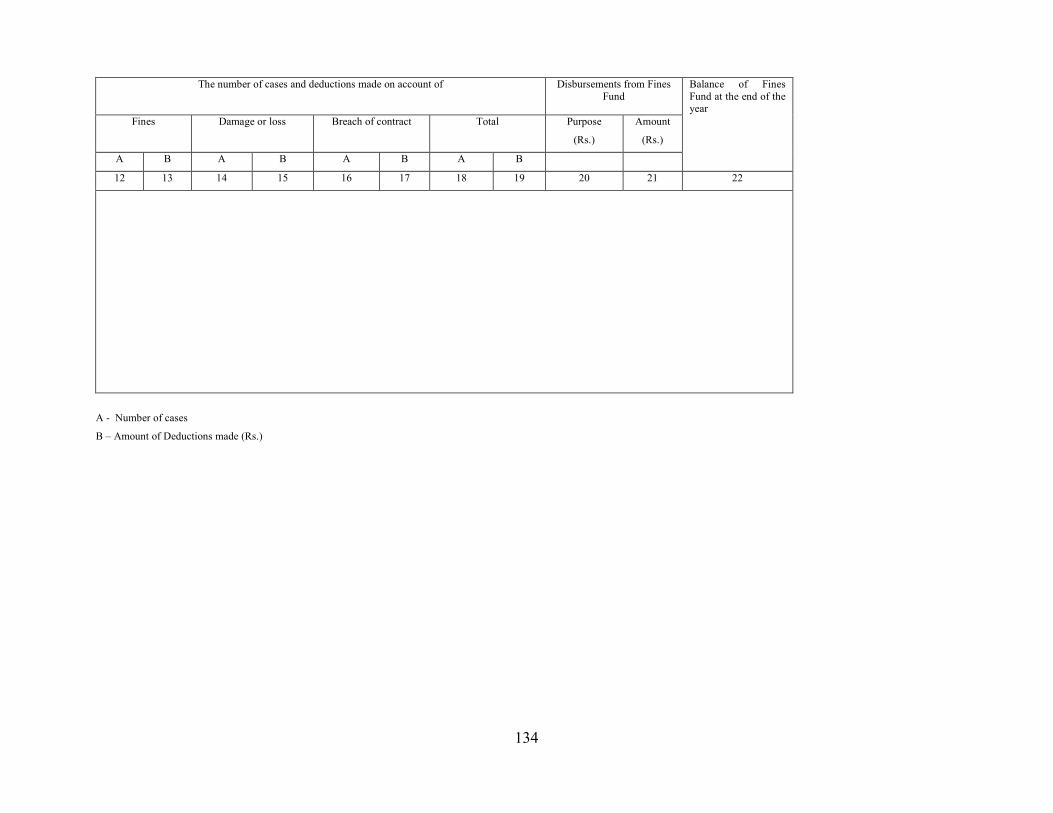
134
The number of cases and deductions made on account of
Disbursements from Fines Fund
Balance of Fines Fund at the end of the year
Fines Damage or loss Breach of contract Total Purpose
(Rs.)
Amount
(Rs.)
A B A B A B A B
12 13 14 15 16 17 18 19 20 21 22
A - Number of cases
B – Amount of Deductions made (Rs.)
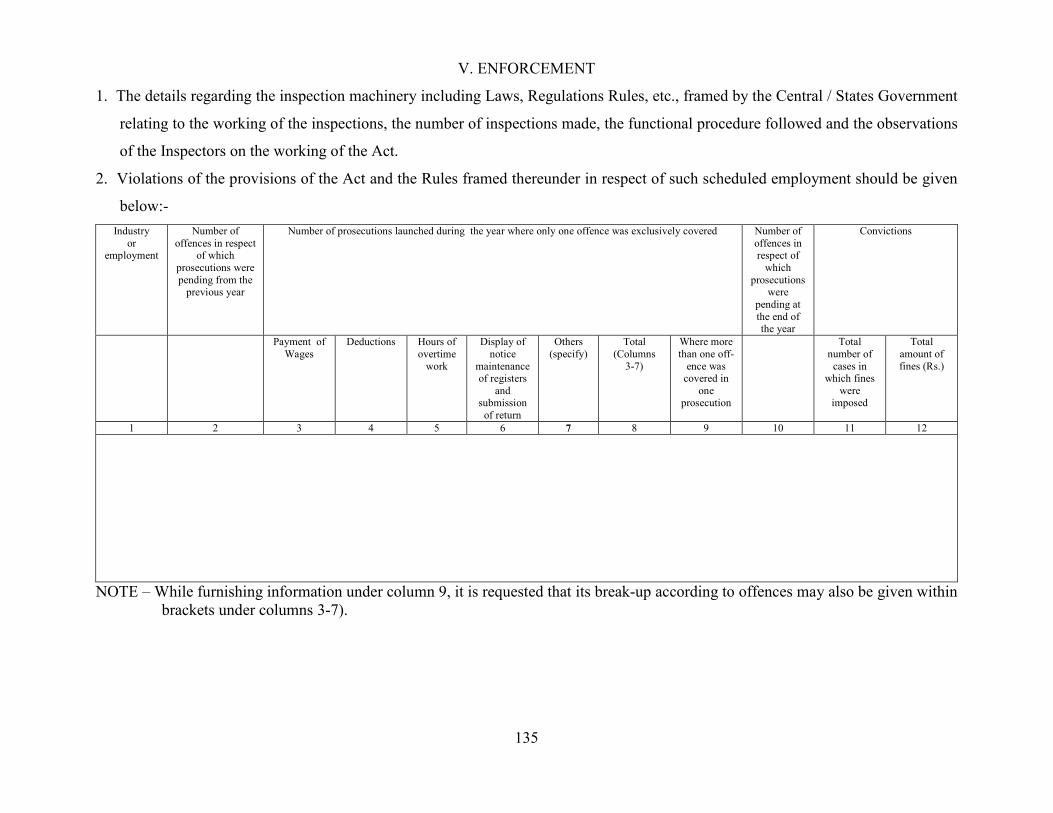
135
V. ENFORCEMENT
1. The details regarding the inspection machinery including Laws, Regulations Rules, etc., framed by the Central / States Government
relating to the working of the inspections, the number of inspections made, the functional procedure followed and the observations
of the Inspectors on the working of the Act.
2. Violations of the provisions of the Act and the Rules framed thereunder in respect of such scheduled employment should be given
below:- Industry
or employment
Number of offences in respect
of which prosecutions were pending from the
previous year
Number of prosecutions launched during the year where only one offence was exclusively covered Number of offences in respect of
which prosecutions
were pending at the end of the year
Convictions
Payment of Wages
Deductions Hours of overtime
work
Display of notice
maintenance of registers
and submission
of return
Others (specify)
Total (Columns
3-7)
Where more than one off-
ence was covered in
one prosecution
Total number of
cases in which fines
were imposed
Total amount of fines (Rs.)
1 2 3 4 5 6 7 8 9 10 11 12
NOTE – While furnishing information under column 9, it is requested that its break-up according to offences may also be given within brackets under columns 3-7).
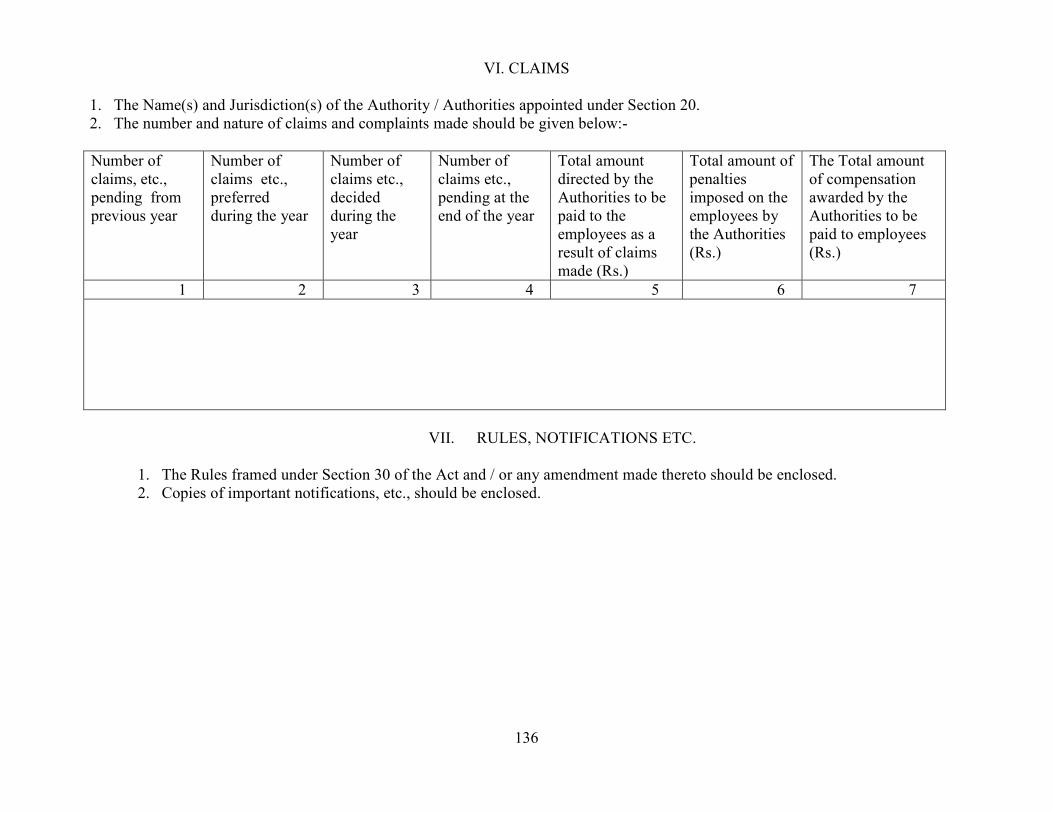
136
VI. CLAIMS
1. The Name(s) and Jurisdiction(s) of the Authority / Authorities appointed under Section 20. 2. The number and nature of claims and complaints made should be given below:- Number of claims, etc., pending from previous year
Number of claims etc., preferred during the year
Number of claims etc., decided during the year
Number of claims etc., pending at the end of the year
Total amount directed by the Authorities to be paid to the employees as a result of claims made (Rs.)
Total amount of penalties imposed on the employees by the Authorities (Rs.)
The Total amount of compensation awarded by the Authorities to be paid to employees (Rs.)
1 2 3 4 5 6 7
VII. RULES, NOTIFICATIONS ETC.
1. The Rules framed under Section 30 of the Act and / or any amendment made thereto should be enclosed. 2. Copies of important notifications, etc., should be enclosed.
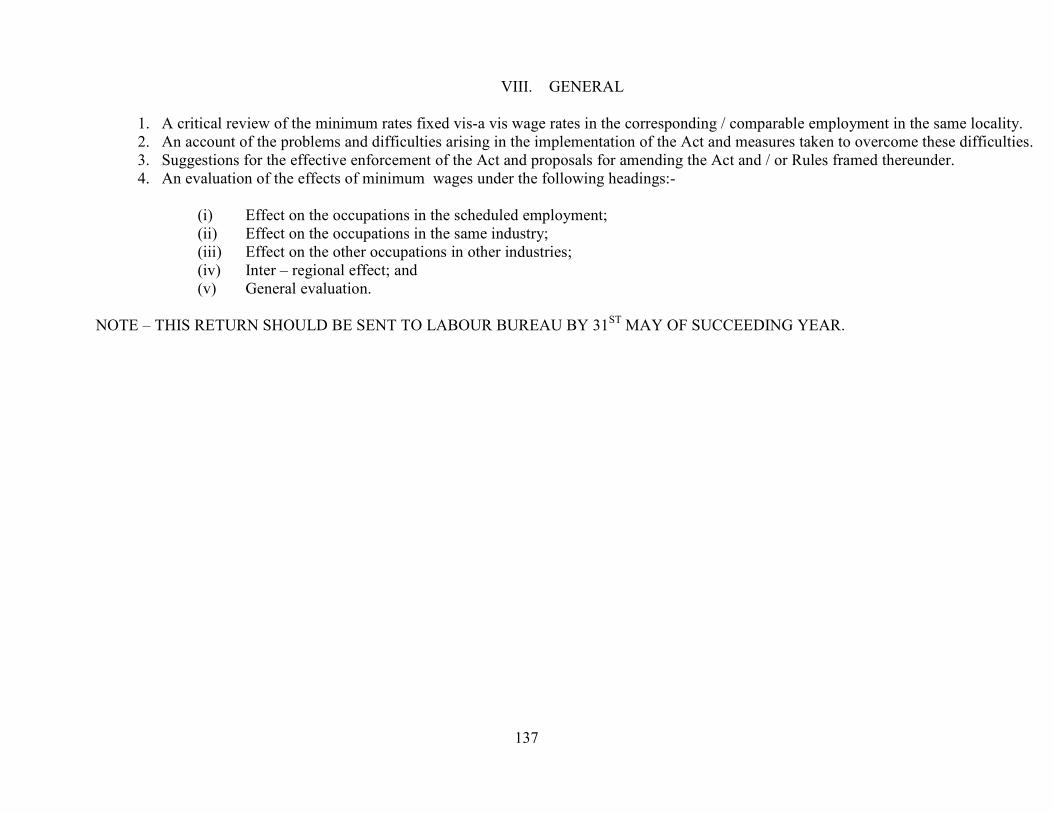
137
VIII. GENERAL
1. A critical review of the minimum rates fixed vis-a vis wage rates in the corresponding / comparable employment in the same locality. 2. An account of the problems and difficulties arising in the implementation of the Act and measures taken to overcome these difficulties. 3. Suggestions for the effective enforcement of the Act and proposals for amending the Act and / or Rules framed thereunder. 4. An evaluation of the effects of minimum wages under the following headings:-
(i) Effect on the occupations in the scheduled employment; (ii) Effect on the occupations in the same industry; (iii) Effect on the other occupations in other industries; (iv) Inter – regional effect; and (v) General evaluation.
NOTE – THIS RETURN SHOULD BE SENT TO LABOUR BUREAU BY 31ST MAY OF SUCCEEDING YEAR.
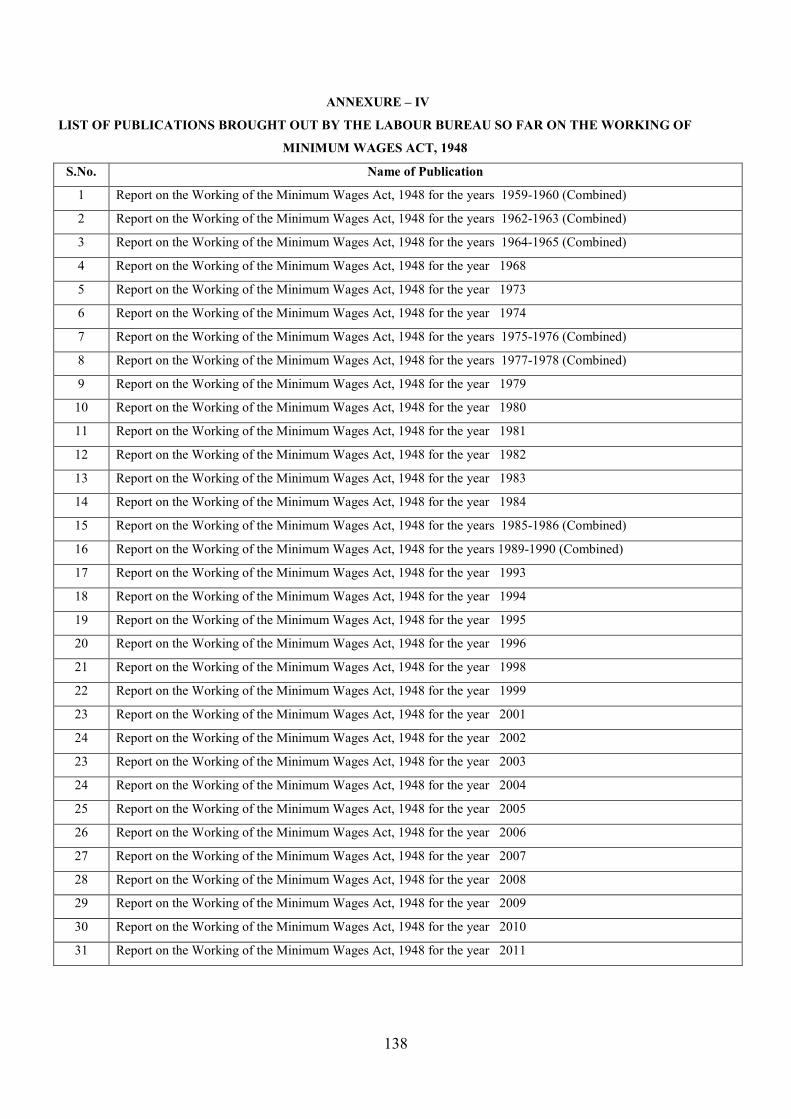
138
ANNEXURE – IV
LIST OF PUBLICATIONS BROUGHT OUT BY THE LABOUR BUREAU SO FAR ON THE WORKING OF
MINIMUM WAGES ACT, 1948
S.No. Name of Publication
1 Report on the Working of the Minimum Wages Act, 1948 for the years 1959-1960 (Combined)
2 Report on the Working of the Minimum Wages Act, 1948 for the years 1962-1963 (Combined)
3 Report on the Working of the Minimum Wages Act, 1948 for the years 1964-1965 (Combined)
4 Report on the Working of the Minimum Wages Act, 1948 for the year 1968
5 Report on the Working of the Minimum Wages Act, 1948 for the year 1973
6 Report on the Working of the Minimum Wages Act, 1948 for the year 1974
7 Report on the Working of the Minimum Wages Act, 1948 for the years 1975-1976 (Combined)
8 Report on the Working of the Minimum Wages Act, 1948 for the years 1977-1978 (Combined)
9 Report on the Working of the Minimum Wages Act, 1948 for the year 1979
10 Report on the Working of the Minimum Wages Act, 1948 for the year 1980
11 Report on the Working of the Minimum Wages Act, 1948 for the year 1981
12 Report on the Working of the Minimum Wages Act, 1948 for the year 1982
13 Report on the Working of the Minimum Wages Act, 1948 for the year 1983
14 Report on the Working of the Minimum Wages Act, 1948 for the year 1984
15 Report on the Working of the Minimum Wages Act, 1948 for the years 1985-1986 (Combined)
16 Report on the Working of the Minimum Wages Act, 1948 for the years 1989-1990 (Combined)
17 Report on the Working of the Minimum Wages Act, 1948 for the year 1993
18 Report on the Working of the Minimum Wages Act, 1948 for the year 1994
19 Report on the Working of the Minimum Wages Act, 1948 for the year 1995
20 Report on the Working of the Minimum Wages Act, 1948 for the year 1996
21 Report on the Working of the Minimum Wages Act, 1948 for the year 1998
22 Report on the Working of the Minimum Wages Act, 1948 for the year 1999
23 Report on the Working of the Minimum Wages Act, 1948 for the year 2001
24 Report on the Working of the Minimum Wages Act, 1948 for the year 2002
23 Report on the Working of the Minimum Wages Act, 1948 for the year 2003
24 Report on the Working of the Minimum Wages Act, 1948 for the year 2004
25 Report on the Working of the Minimum Wages Act, 1948 for the year 2005
26 Report on the Working of the Minimum Wages Act, 1948 for the year 2006
27 Report on the Working of the Minimum Wages Act, 1948 for the year 2007
28 Report on the Working of the Minimum Wages Act, 1948 for the year 2008
29 Report on the Working of the Minimum Wages Act, 1948 for the year 2009
30 Report on the Working of the Minimum Wages Act, 1948 for the year 2010
31 Report on the Working of the Minimum Wages Act, 1948 for the year 2011
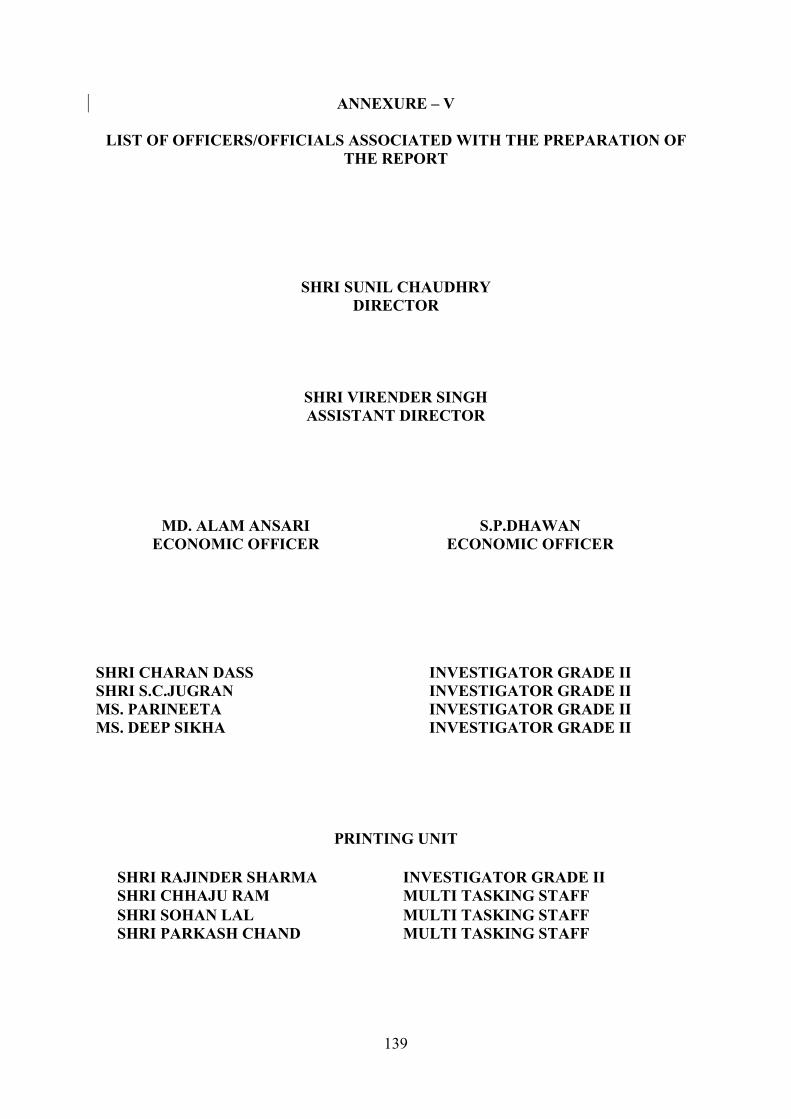
139
ANNEXURE – V
LIST OF OFFICERS/OFFICIALS ASSOCIATED WITH THE PREPARATION OF THE REPORT
SHRI SUNIL CHAUDHRY DIRECTOR
SHRI VIRENDER SINGH ASSISTANT DIRECTOR
MD. ALAM ANSARI ECONOMIC OFFICER
S.P.DHAWAN ECONOMIC OFFICER
SHRI CHARAN DASS INVESTIGATOR GRADE II SHRI S.C.JUGRAN INVESTIGATOR GRADE II MS. PARINEETA INVESTIGATOR GRADE II MS. DEEP SIKHA INVESTIGATOR GRADE II
PRINTING UNIT
SHRI RAJINDER SHARMA INVESTIGATOR GRADE II SHRI CHHAJU RAM MULTI TASKING STAFF SHRI SOHAN LAL MULTI TASKING STAFF SHRI PARKASH CHAND MULTI TASKING STAFF
© Government of India Controller of Publication
PDLB.16-2011 90-2012 (DSK-II)
Price: Rs. Printed by Labour Bureau, SCO 28-31, Sector 17-A, Chandigarh -160017 For the Controller of Publications, Civil Lines, Delhi- 110054


![THE MINIMUM WAGES ACT, 1948 ARRANGEMENT OF SECTIONS S · 3 THE MINIMUM WAGES ACT, 1948 ACT NO. 11 OF 19481 [15th March, 1948.] An Act to provide for fixing minimum rates of wages](https://img.dokumen.tips/doc/110x75/5ead1b5d36600c5a9e129053/the-minimum-wages-act-1948-arrangement-of-sections-s-3-the-minimum-wages-act-1948.jpg)

![THE MINIMUM WAGES ACT, 1948 - Home: Department …labour.uk.gov.in/files/Minimum_wages_Act.pdf1 THE MINIMUM WAGES ACT, 1948 1[ACT NO. 11 OF 1948] An Act to provide for fixing minimum](https://img.dokumen.tips/doc/110x75/5afedaa37f8b9a8b4d8f8a32/the-minimum-wages-act-1948-home-department-the-minimum-wages-act-1948-1act.jpg)


![THE MINIMUM WAGES ACT, 1948 - Uttarakhand · THE MINIMUM WAGES ACT, 1948 1[ACT NO. 11 OF 1948] An Act to provide for fixing minimum rates of wages in certain employment Whereas it](https://img.dokumen.tips/doc/110x75/5f4186af94eb55431f26f2f1/the-minimum-wages-act-1948-uttarakhand-the-minimum-wages-act-1948-1act-no.jpg)