Embed Size (px)
Citation preview
ii
...................................................................................................................................................... iii
........................................................................................................................ 1
1.1 Introduction ................................................................................................................................. 1
1.2 Objectives .................................................................................................................................... 1
1.3 Scope of workshop ...................................................................................................................... 2
1.4 Participants .................................................................................................................................. 2
1.5 Questions Raised During the Workshop ...................................................................................... 3
1.6 Summary “Board of expectations” .............................................................................................. 5
....................................................................................................................... 6
2.1 Setting the Scene: About the Information Matters Project ........................................................ 6
2.2 QA /QC System Overview ............................................................................................................ 6
2.3 Quality Control (QC): Principles and Processes ........................................................................... 8
2.4 Quality Assurance (QA): Principles and Processes ...................................................................... 9
2.5 Key Category Analysis and Uncertainty ..................................................................................... 10
2.6 Improving Data Quality – Dealing with Data Gaps and Problems ............................................. 11
........................................................................................................... 15
.................................................................................................................................................. 16
Annex 1: Training Agenda ....................................................................................................................... 16
Annex 2: List of Participants.................................................................................................................... 21
Annex 3: Workshop Evaluation ............................................................................................................... 24
iii
AGI Association of Ghanaian Industries
BMUB Federal Ministry for the Environment, Nature Conservation, Building and Nuclear Safety
BUR Biennial Update Report
CDM Clean Development Mechanism
DSA Data Supply Agreements
EC Energy Commission
EPA Environmental Protection Agency
FC Forestry Commission
FPP Forest Preservation Program
GEF Global Environmental Facility
GHG Greenhouse Gas
GIPC Ghana Investment Promotion Council
GIZ Deutsche Gesellschaft für Internationale Zusammenarbeit (GIZ) GmbH
IKI International Climate Initiative
IM Information Matters
IPCC Intergovernmental Panel on Climate Change
KSEFs Key Sector Emission Factors
LECB Low Emission Capacity Building Programme
LULUCF Land Use, Land Use Change and Forestry
M&E Monitoring and Evaluation
MDAs Ministries, Departments and Agencies
MESTI Ministry of Environment, Science, Technology and Innovation
MoF Ministry of Finance
MOFA Ministry of Food and Agriculture
MRV Measurement, Reporting and Verification
iv
NAMAs Nationally Appropriate Mitigation Actions
NCSP National Communication Support Programme
NDPC National Development Planning Commission
PEF Private Enterprise Federation
REDD+ Reducing Emissions from Deforestation and Forest Degradation
TACCC Transparency, Accuracy, Completeness, Comparability and Consistency
UNDP United Nations Development Program
UNEP United Nations Environment Program
UNFCCC United Nations Framework Convention on Climate Change

1
In 2013, Ghana launched a programme named
“climate ambitious reporting (CARP)” which
seeks to provide foundation for coordinating all
climate reporting efforts. The aim of the CARP is
to put in place an integrated national system that is
capable of enabling Ghana to meet its
international reporting obligations of (a) preparing
National Communications (NATCOM) every four
(4) years, (b) preparing Biennial Update Reports
(BUR) every two (2) years and (c) participate in
international Consultation and Analysis (ICA) of
the BUR and above all provide evidence to
support climate mitigation planning at all levels.
The Environmental Protection Agency (EPA) has
received support from the German Government
through the GIZ Information Matters (IM)
Project to contribute to the rolling-out of the
CARP. The contributions from IM will help to
create awareness and build capacities among key
institutions that are involved in the preparation of
the national greenhouse gas inventory,
implementation actions and tracking of climate
finance.
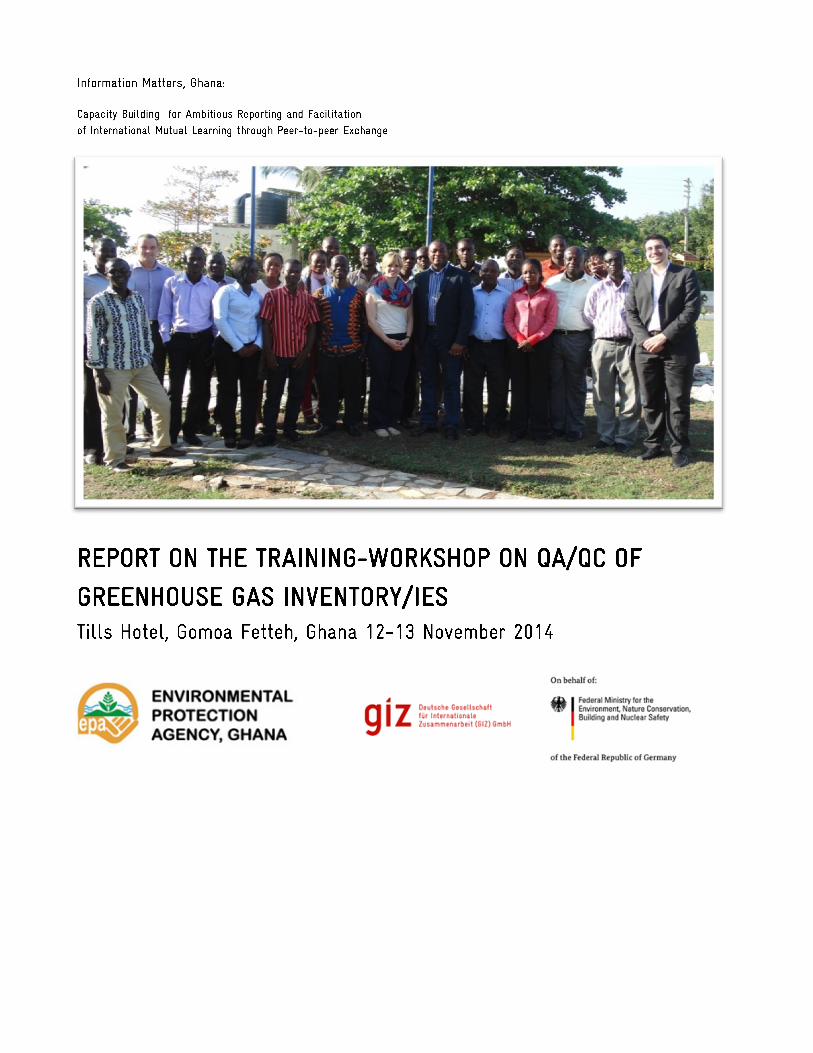
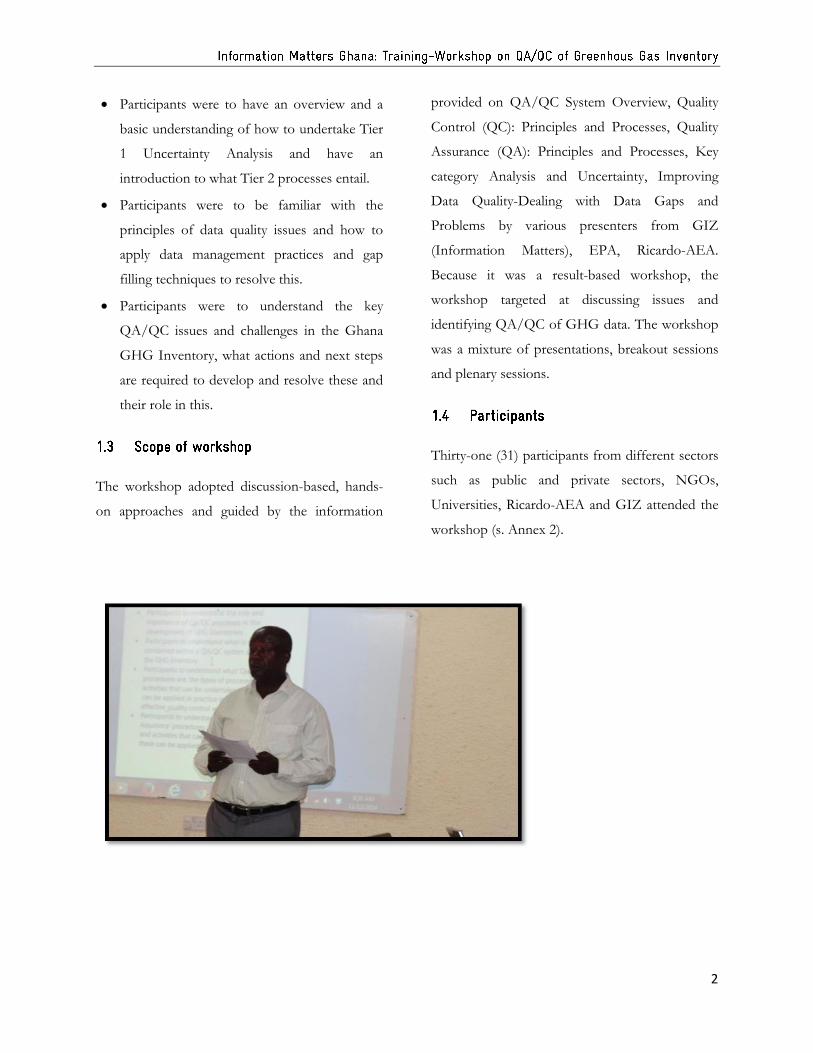
In line with the GIZ-IMP, the EPA organized a
training workshop on QA/QC of Greenhouse
Gas Inventory/ies from 12-13 November 2014 at
Till’s Hotel, Gomoa Fetteh. The aim of the
workshop is to familiarize the participants with
the fundamental principles of QA/QC, the main
requirements when compiling a GHG Inventory,
verification and the three main principles of
QA/QC. According, various institutions were
invited to participate in the training programme.
The workshop was moderated by Mr. Mark Fynn
of GIZ and Mr. K. Y. Oppong-Boadi.
The following objectives were spelt out for the
participant by Dr. Ross:
Participants were to understand the role and
importance of QA/QC processes in the
development of GHG inventories.
Participants were to understand what is meant
by and contained within a QA/QC system
and plan for the GHG Inventory.
Participants were to understand what ‘Quality
Control’ procedures are, the types of
processes and activities that can be
undertaken and how these can be applied in
practice to implement effective quality
assurance within a GHG Inventory.
Participants were to understand what ‘Quality
Assurance’ procedures are, the types of
processes and activities that can be
undertaken and how these can be applied in
practice to implement effective quality
assurance within a GHG Inventory.
Participants were to have an overview of and
a basic understanding of how to undertake
Key Category Analysis.
2
Participants were to have an overview and a
basic understanding of how to undertake Tier
1 Uncertainty Analysis and have an
introduction to what Tier 2 processes entail.
Participants were to be familiar with the
principles of data quality issues and how to
apply data management practices and gap
filling techniques to resolve this.
Participants were to understand the key
QA/QC issues and challenges in the Ghana
GHG Inventory, what actions and next steps
are required to develop and resolve these and
their role in this.
The workshop adopted discussion-based, hands-
on approaches and guided by the information
provided on QA/QC System Overview, Quality
Control (QC): Principles and Processes, Quality
Assurance (QA): Principles and Processes, Key
category Analysis and Uncertainty, Improving
Data Quality-Dealing with Data Gaps and
Problems by various presenters from GIZ
(Information Matters), EPA, Ricardo-AEA.
Because it was a result-based workshop, the
workshop targeted at discussing issues and
identifying QA/QC of GHG data. The workshop
was a mixture of presentations, breakout sessions
and plenary sessions.
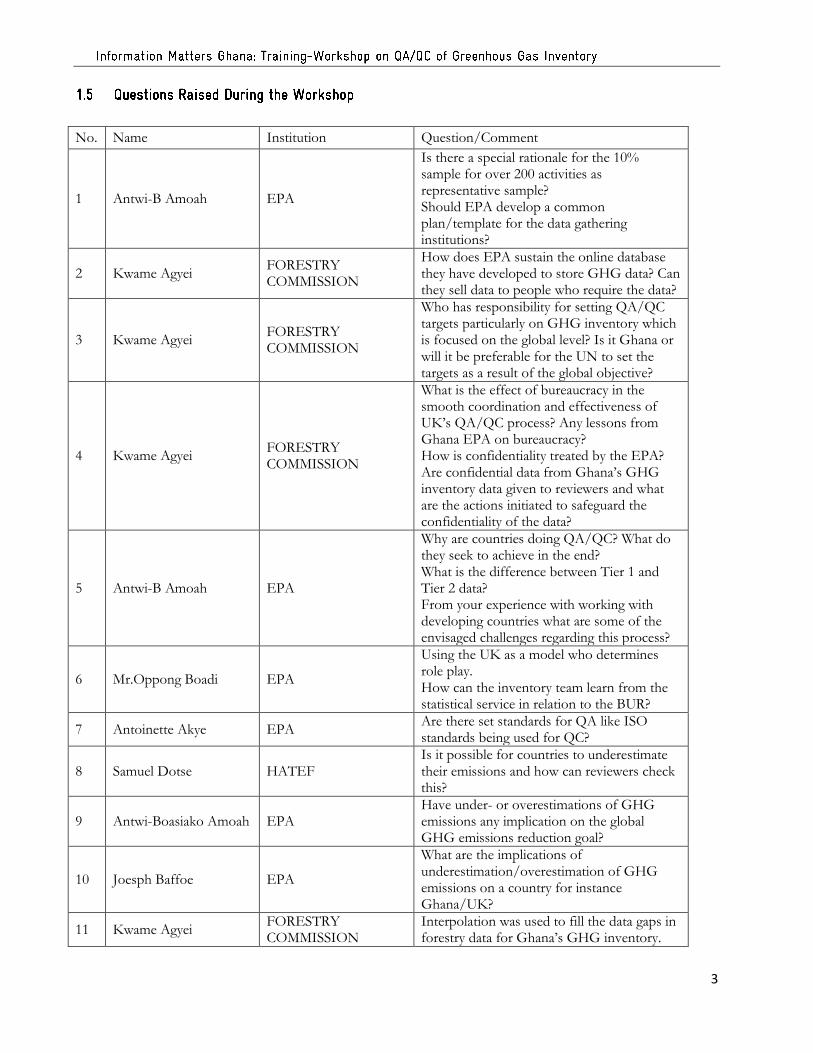
Thirty-one (31) participants from different sectors
such as public and private sectors, NGOs,
Universities, Ricardo-AEA and GIZ attended the
workshop (s. Annex 2).
3
No. Name Institution Question/Comment
1 Antwi-B Amoah EPA
Is there a special rationale for the 10% sample for over 200 activities as representative sample? Should EPA develop a common plan/template for the data gathering institutions?
2 Kwame Agyei FORESTRY COMMISSION
How does EPA sustain the online database they have developed to store GHG data? Can they sell data to people who require the data?
3 Kwame Agyei FORESTRY COMMISSION
Who has responsibility for setting QA/QC targets particularly on GHG inventory which is focused on the global level? Is it Ghana or will it be preferable for the UN to set the targets as a result of the global objective?
4 Kwame Agyei FORESTRY COMMISSION
What is the effect of bureaucracy in the smooth coordination and effectiveness of UK’s QA/QC process? Any lessons from Ghana EPA on bureaucracy? How is confidentiality treated by the EPA? Are confidential data from Ghana’s GHG inventory data given to reviewers and what are the actions initiated to safeguard the confidentiality of the data?
5 Antwi-B Amoah EPA
Why are countries doing QA/QC? What do they seek to achieve in the end? What is the difference between Tier 1 and Tier 2 data? From your experience with working with developing countries what are some of the envisaged challenges regarding this process?
6 Mr.Oppong Boadi EPA
Using the UK as a model who determines role play. How can the inventory team learn from the statistical service in relation to the BUR?
7 Antoinette Akye EPA Are there set standards for QA like ISO standards being used for QC?
8 Samuel Dotse HATEF Is it possible for countries to underestimate their emissions and how can reviewers check this?
9 Antwi-Boasiako Amoah EPA Have under- or overestimations of GHG emissions any implication on the global GHG emissions reduction goal?
10 Joesph Baffoe EPA
What are the implications of underestimation/overestimation of GHG emissions on a country for instance Ghana/UK?
11 Kwame Agyei FORESTRY COMMISSION
Interpolation was used to fill the data gaps in forestry data for Ghana’s GHG inventory.
4
The reason for the use of interpolation was that proxy database on ground inventory and expert judgement showed a different trend than the remote sensing based database used in the GHG inventory. Should we have used multiple approaches for the data filling or interpolation?
12 Antwi-Boasiako Amoah EPA
Can you explain why uncertainty analysis focuses on accuracy and not precision? Is there a fixed established significance level for uncertainty analysis within the IPCC Guidelines?
13 Oppong Boadi EPA How does quality of data affect Tier 1 and 2?
5
As a warm up exercise each participant was asked
to write down their expectations and worries
about QA/QC on Zop boards to refer back to
throughout the workshop. These questions were
grouped under the following sections:
(a) Expectations;
How to apply data management practices to
QA/QC
To know if institutions are able to qualify net
GHG inventory per year
To be able to manage and ensure quality data
for analysis decision making on greenhouse
gas
Expects at the end to agree on QA/QC
methods that should not be missing in any
data production process
To know how prepared Ghans is in reporting
for the next BUR and what are the inputs
required
Understand Tier 1 and Tier 2 analysis
To fully understand the QA/QC issues
relative to GHG inventory in Ghana
Application of QA/QC issues on natural
resource data
Apply QA/QC successfully in agricultural
data collection to address GHG emissions
Standard QA/QC process in relation to GHG
data collection and interpretation
To have an in depth understanding of
QA/QC process
To learn about the IPCC good practice guide
To know more about how the IPCC good
practice guide is linked with the BUR
Adopt robust means of filling data gaps
To understand the application of QA/QC in
my line of duty
To acquire adequate skills in data management
which can be enhanced for accurate decisions
and policies to be met
(b) Worries;
The achieving of targets set for the reduction
of GHG emissions
Are we on course in rolling out programmes
aimed at reducing CFC?
Time constraints
How can QA/QC be applied whiles resource
constraints are not being addressed?
The credibility of modern software which
make projections can be made into the future
without necessarily collecting raw data
Overcoming and identifying gaps in data
collection and tracking
Sustainability of this exercise on a national
level
Fitting this exercise into existing programmes
and systems ongoing in this area, i.e. GHG
inventory and other programmes
Lack of institutional coordination in tracking
GHG inventory
6
The presentation was made by Ms. Kirsten
Orschulok, GIZ HQ, about IM on the global
perspective. Her presentation was devided in three
parts: a) Global structure, global goal and
cooperation partners, b) project activities and the
project countries and c) the first outcome of the
project.
She stated that the project is supported by the
German Ministry for the Environment, Nature
Conservation, Building and Nuclear Safety
(BMUB). The participating countries include
Dominican Republic, Chile, Ghana and the
Philippines. She mentioned project synergies with
the UNDP-LECB, West Africa GHG Project,
UNEP in partner countries, as well as with the
WRI and the International Partnership on
Mitigation and MRV.
The Global Project Goals are as listed:
• Identification of specific needs and priorities
of the MRV systems and GHG monitoring in
the partner countries
• Strengthen in-country capacities for enhanced
reporting (BURs and NCs) of climate relevant
information to UNFCCC
• Provision of tailored-made capacity-building
trainings and workshops (in-country)
• Support the process through peer-to-peer
exchange and generation of lessons learnt
She talked about some of the roles and
responsibilities for the various project partners
such as BMUB IKI, GIZ, Ricardo-AEA, UNDP,
WRI and the UBA. She highlighted that the
projects started with a kick-off workshop, which is
followed by two (2) capacity building in-country
workshops and a final peer-to-peer exchange
workshop in Germany. Subsequently, she
mentioned the workshops which have been
carried out so far including a Regional Workshop
on BURs. She also spoke about the finalization of
the BUR template which will come out in January,
being available in French and Spanish as well.
This presentation was made by Ross Hunter and
Raul Salas. Mr. Hunter started by defining Quality
Assurance (QA) as a system to ensure regular and
adequate checking of data and information and
Quality Control (QC) as a system of regular
independent reviews. TACCC ensures that these
principles are carried out for the GHG
inventories.
He mentioned key elements of QA/QC such as
compiling a QA/QC plan and implement it,
defining QA/QC roles and responsibilities,
documentation and archiving, data and method
review and improvement, and subsequent
recalculations, assessment of uncertainties and
improvement priorities as well as data and method
validation and verification.
7
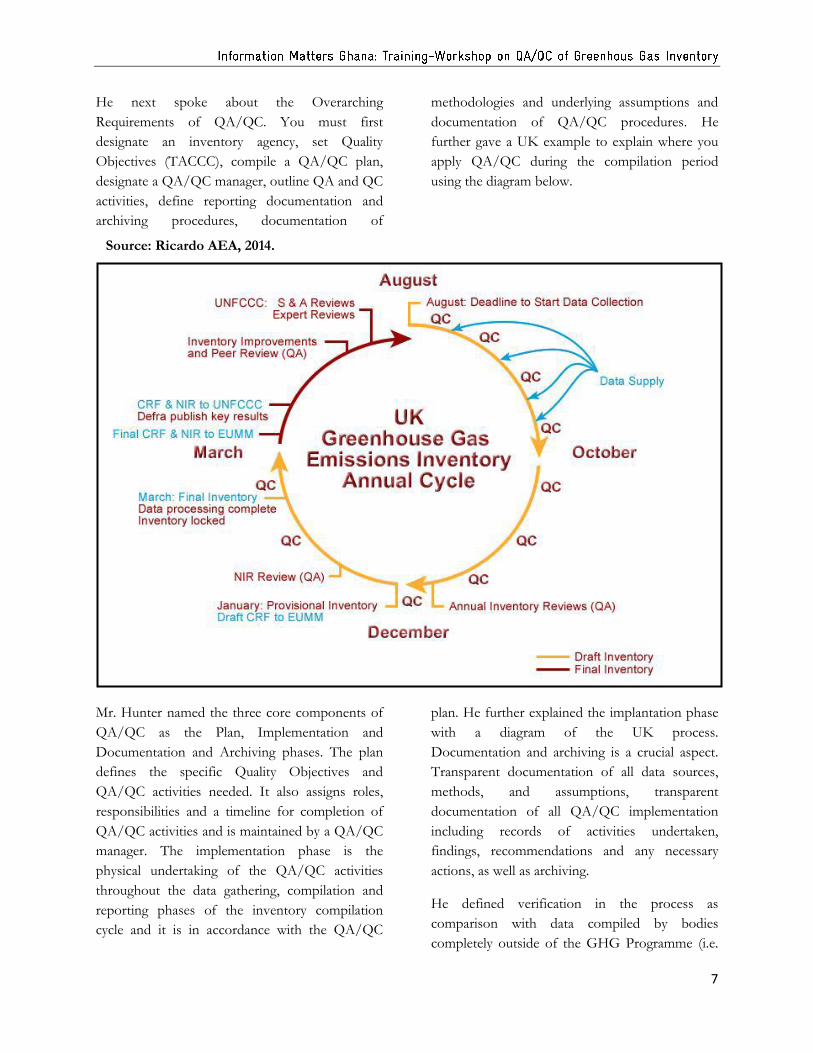
He next spoke about the Overarching
Requirements of QA/QC. You must first
designate an inventory agency, set Quality
Objectives (TACCC), compile a QA/QC plan,
designate a QA/QC manager, outline QA and QC
activities, define reporting documentation and
archiving procedures, documentation of
methodologies and underlying assumptions and
documentation of QA/QC procedures. He
further gave a UK example to explain where you
apply QA/QC during the compilation period
using the diagram below.
Mr. Hunter named the three core components of
QA/QC as the Plan, Implementation and
Documentation and Archiving phases. The plan
defines the specific Quality Objectives and
QA/QC activities needed. It also assigns roles,
responsibilities and a timeline for completion of
QA/QC activities and is maintained by a QA/QC
manager. The implementation phase is the
physical undertaking of the QA/QC activities
throughout the data gathering, compilation and
reporting phases of the inventory compilation
cycle and it is in accordance with the QA/QC
plan. He further explained the implantation phase
with a diagram of the UK process.
Documentation and archiving is a crucial aspect.
Transparent documentation of all data sources,
methods, and assumptions, transparent
documentation of all QA/QC implementation
including records of activities undertaken,
findings, recommendations and any necessary
actions, as well as archiving.
He defined verification in the process as
comparison with data compiled by bodies
completely outside of the GHG Programme (i.e.
Source: Ricardo AEA, 2014.
8
‘fully independent data’), comparison with higher
or lower tier compilation methods – or completely
different methods and comparisons with
atmospheric measurements.
He said it is important to know how to handle
confidential data. Also outlining how data is used
whilst ensuring sensitive data is not published is
important. One example is to ensure confidential
data is not reported (whilst not impacting on
GHG emissions data): Industrial production data
can be commercially sensitive, e.g. cement and
adipic acid production – data is not reported
although emissions are reported. Another example
is aggregating Data: EU-ETS data are supplied is
aggregated to sector level to ensure data for
individual sites cannot be identified.
He concluded with a summary that QA/QC is a
crucial part of the GHG Inventory compilation
process and it plays a key role in ensuring TACCC
principles are applied. So to develop a QA/QC
and implement it, documenting and archiving are
also a core part of effective QA/QC.
Raul Salas followed a presentation on principles
and processes of quality control. He started by
defining the principles of Transparency, Accuracy,
Completeness, Comparability and Consistency
(TACCC).
Transparency: Means clear documentation and
reporting at a level that allows individuals or
groups other than experts or compilers of
inventory to understand how the inventory was
compiled and ensure that it meets good practice
requirements.
Consistency means that estimates are reported for
every different inventory years, pollutants and
source categories are made in such a way that
differences in the results between years and source
categories reflect real differences in emissions.
Comparability means that the national inventory is
reported in such a way that allows it to be
compared with national inventories of other
Parties.
Completeness means that estimates are reported
for all pollutants, all relevant source categories and
all years and for the entire territorial areas of
Parties covered by the reporting requirements set
forth in the provisions of the UNFCCC and its
protocols.
Accuracy means that emissions are neither
systematically overestimated nor underestimated,
as far as can be judged and with uncertainties
reduced as far as practicable.
He then talked about quality control as a system
of routine technical activities designed by
inventory experts/compilers to measure and
control the quality of data/inventory developed. A
QC system is designed to:
Check consistency of inventory so as to verify
data integrity, correctness and completeness
Identify and reduce errors and omissions
Maximize consistency within the inventory
preparation process
Facilitate internal and external inventory
review process
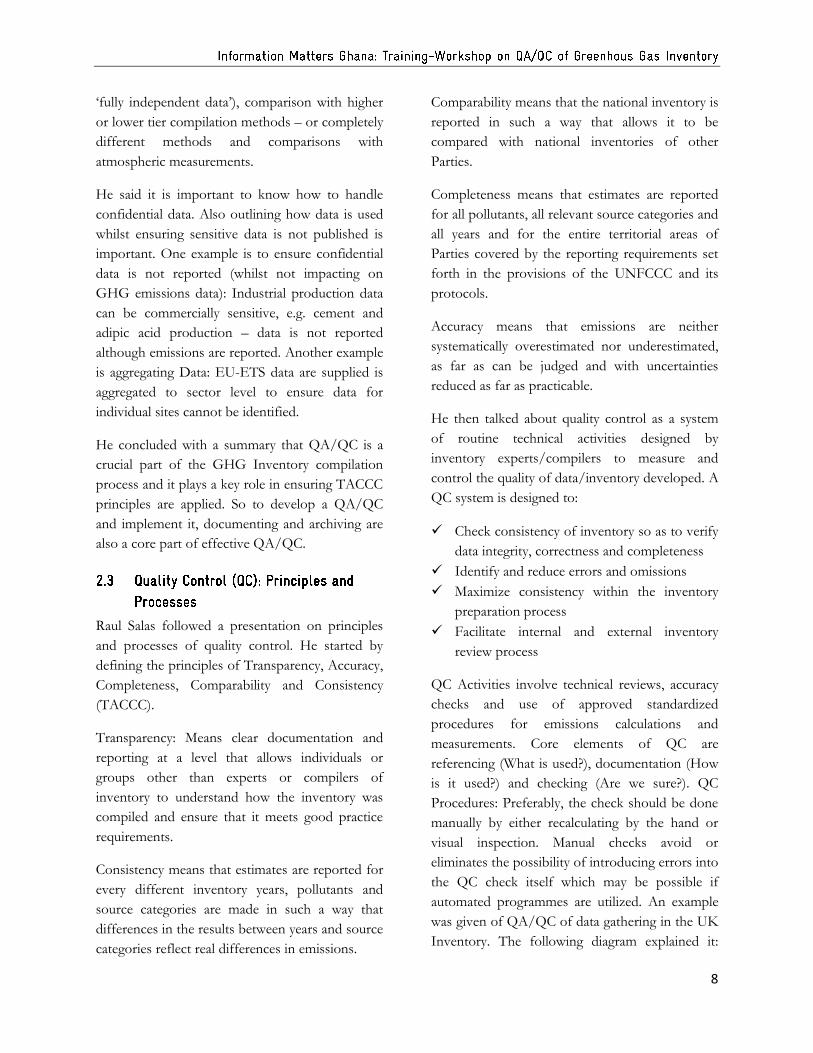
QC Activities involve technical reviews, accuracy
checks and use of approved standardized
procedures for emissions calculations and
measurements. Core elements of QC are
referencing (What is used?), documentation (How
is it used?) and checking (Are we sure?). QC
Procedures: Preferably, the check should be done
manually by either recalculating by the hand or
visual inspection. Manual checks avoid or
eliminates the possibility of introducing errors into
the QC check itself which may be possible if
automated programmes are utilized. An example
was given of QA/QC of data gathering in the UK
Inventory. The following diagram explained it:
9
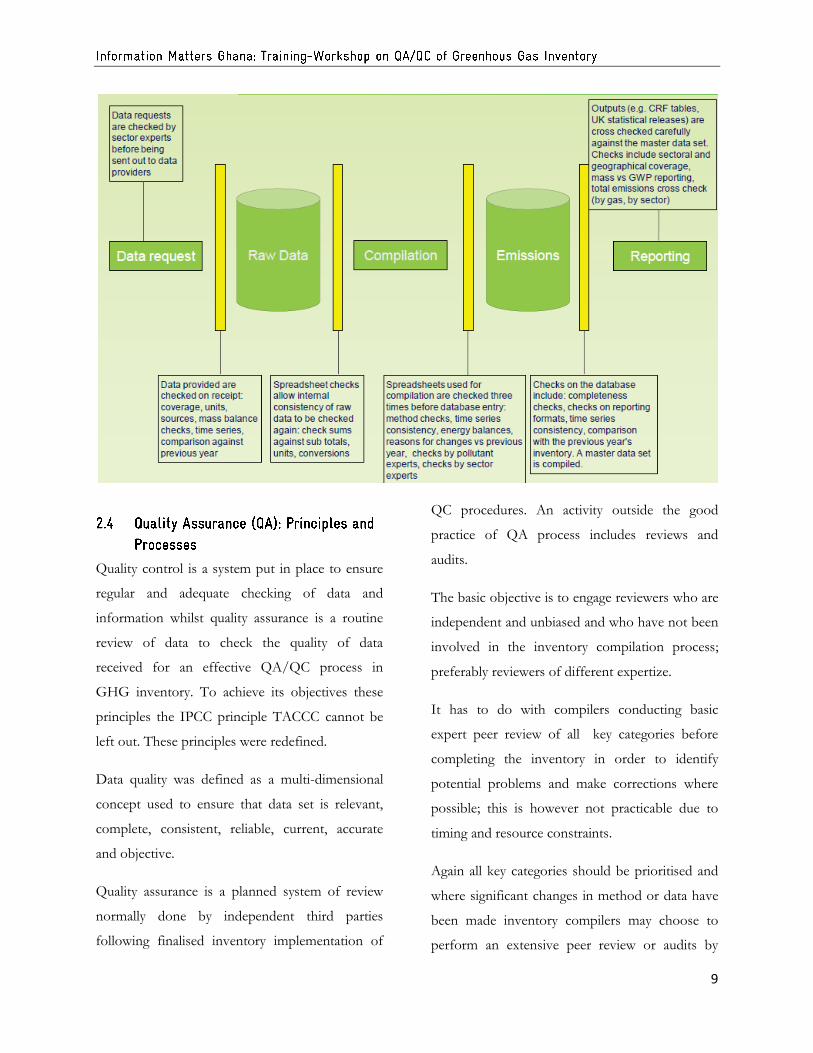
Quality control is a system put in place to ensure
regular and adequate checking of data and
information whilst quality assurance is a routine
review of data to check the quality of data
received for an effective QA/QC process in
GHG inventory. To achieve its objectives these
principles the IPCC principle TACCC cannot be
left out. These principles were redefined.
Data quality was defined as a multi-dimensional
concept used to ensure that data set is relevant,
complete, consistent, reliable, current, accurate
and objective.
Quality assurance is a planned system of review
normally done by independent third parties
following finalised inventory implementation of
QC procedures. An activity outside the good
practice of QA process includes reviews and
audits.
The basic objective is to engage reviewers who are
independent and unbiased and who have not been
involved in the inventory compilation process;
preferably reviewers of different expertize.
It has to do with compilers conducting basic
expert peer review of all key categories before
completing the inventory in order to identify
potential problems and make corrections where
possible; this is however not practicable due to
timing and resource constraints.
Again all key categories should be prioritised and
where significant changes in method or data have
been made inventory compilers may choose to
perform an extensive peer review or audits by

10
contacting inventory compilers from other
countries as part of an external review within the
QA procedures with the available resources.
QA and verification activities take more
independent view on the choice of inputs and
assumptions used in the inventory estimation.
This is done to ensure that the inventory’s results,
assumptions and methods are reasonable.
Audits may be used to assess how effective and
useful the QA have been in accordance with QC
outlined plans. It can also be used to verify the
implementation of the QC plans and that data
quality objectives have been met.
Ross Hunter started his presentation by defining
key category as one that is prioritised within the
national inventory system because its estimate has
a significant influence on a country’s total
inventory of GHG. In simple terms, these
categories are emission or removal categories that
contribute the most to the total or trend of
emissions.
Types of KCA Analysis were listed as Quantitative
Analysis and Qualitative Analysis. Quantitative
Analysis is numerical values that describe the
contribution of a category to the national total
emissions and their trend (Level and Trend
Assessments). Qualitative Analysis considers other
criteria that are not easily accessed through a
quantitative analysis
He listed criteria Qualitative Analysis for KCA as
mitigation techniques and technologies, expected
growth of emissions in the future, unexpectedly
high or low emissions, no quantitative assessment
of uncertainties performed and completeness.
Steps for Key Category Analysis:
1. Prepare the list of categories based on the
IPCC categories;
2. Perform quantitative analysis of the
relationship between the level and the
trend of each category emissions and total
national emissions;
3. Consider any qualitative considerations
that would add additional key categories;
4. Document the results and use to inform
inventory.
There are two approaches to Quantitative KCA.
Approach one (1) is based on contribution to total
and trend. This is simple and uses only data from
emission estimates. Approach two (2) is based on
contribution to overall uncertainty. This is more
complex, needs a complete performed uncertainty
analysis. The two approaches can be used together
when setting priorities.
11
Possible approaches to KCA were explained with the table below:
Possible approaches to KCA Tier/Approach
Country specific uncertainty estimates used for each source category?
Key Categories identified according to…
1 no Level Trend
2 yes Level Trend
Ghana currently completes a Tier/Approach one
(1) KCA (for level and trend).
Uncertainty estimates are an important element of
creating a GHG inventory. Uncertainty
information is not intended to dispute the validity
of the inventory, but to assess accuracy. This helps
prioritise future efforts to improve the accuracy of
the inventory and guide decisions on sourcing
suitable data and methodological choice.
The uncertainty analysis results can be presented
as a percentage, and the 95% confidence range is
shown. But sometimes all you might be able to do
is categorize into high, medium and low.
Uncertainty guidance for inventories are described
in the IPCC 2000 Good Practice Guidance and
extended information included in the IPCC 2006
Guidelines, with revised terminology.
“Estimates should be accurate in the sense that
they are systematically neither over nor under true
emissions or removals, so far as can be judged,
and that uncertainties are reduced so far as is
practicable.” Biases are not dealt with by the
uncertainty analysis – following the IPCC
Guidelines and good practice QA/QC procedures
should eliminate most sources of bias.
There are many causes of uncertainty. Some of
these were listed as uncertainties in activity data or
choice of emission factors, uncertainties in
definitions, uncertainties from the natural
variability in processes that produce emissions as
well as uncertainties from the assessment of the
process or quantity.
This presentation was on how to fill data gaps
using four methods. It was conducted by Raul
Salas.
He started asking the following questions „What
do we do when there are gaps in the data?” “We only have

12
data for 1995 and 2000.” “We want to switch to a Tier 2
method, but we only have disaggregated livestock data
starting last year.” “The Energy Ministry stopped collecting
data on natural gas flaring. What do we do?”
He stated barriers to obtaining available data as
lack of awareness of what data might be available,
lack of structured data sharing processes.
Timeliness – key datasets are not available at the
time required. Sharing data may be viewed as
losing power by individuals, departments or
organizations. There may be restrictions on
statistics data prior to official release and
commercially sensitive data – e.g. from individual
companies or installations. Keeping up with the
policy cycle – new measures and targets can be
developed and implemented very quickly,
sometimes without consulting data and technical
experts.
Common data problems: data reported in wrong
units, or out by a factor of 100, 1000 etc. Step-
changes in a time series due to: change in scope of
data (e.g. European Union – Emissions Trading
Scheme Phase I, Phase II, Phase III); change in
the data gathering systems (e.g. changes in
reporting thresholds for industrial sites that used
to report data now not having to); change in the
provision of reporting guidance (e.g. where sector-
specific guidance has been updated so all
operators start to use a new EF for a given
pollutant and this leads to a major step-change in
the reported data); erroneous data that cannot be
fixed and must therefore be deleted; additional
efforts to conduct stakeholder consultation.
Availability of suitable data will be an issue. It
should not be afraid to use data that has gaps, is
new or does not provide total coverage – as long
as you understand these issues. In many cases data
will provide an indication of direction of travel
rather than a definitive answer for whether a
target has been met or the exact mitigation effect
of a policy. In the absence of comprehensive data
this is better than nothing. Collecting new data
should be a last resort as it is time-consuming and
costly. Data availability, range, quality, accuracy
often improves over time – and it is important to
adapt/react to this. You start with what you have
and improve it yearly with your inventories.
These data barriers can be overcome by first
undertaking a systematic review of data available
to establish who may hold what data that you
require. Followed by the establishment of a
working group for data management, key data
providers can develop data provision
arrangements and resolve compliance issues. Then
implement data supply agreements (DSA’s) with
key data providers outlining what they will provide
and when (Ghana already uses DSA’s to help
compile the GHG Inventory) and finally aggregate
data to a level where it no longer is deemed as
commercially.
He said visualization of the Data is a key issue. It
allows seeing the trend. Visualising data on a
graph issues, can clarify comparisons and potential
solutions. It allows you to identify outliers or step

13
changes – to trigger further investigation. It can be
done in MS Excel or similar.
Data gaps can be dealt with using splicing and
surrogate or proxy data techniques. Splicing is
combining or joining more than one method or
data series to form a complete time. Surrogate or
proxy data to “create” data that are otherwise
missing. The following methods are used in
splicing: Overlap, Surrogate Data, Interpolation
and Trend Extrapolation.
In overlap, an assessment of comparability of two
datasets over a time series is made looking for
consistent overlap or difference. Preferably for
multiple years to avoid bias. It is possible to either
use comparable dataset or recalculate existing data
on the basis of consistency. Where there is a
consistent relationship, the default is to use a
proportional adjustment of old estimates/data to
be consistent with new. You must remember that
it is crucial to have multiple years of overlap to
apply properly. This method should not be
applied blindly.
In surrogate data, you use a dataset that is
indicative of changes or trends to ‘fill in’ (or as a
surrogate) data gaps. You need to understand
relationship prior to using surrogate data, e.g.
using regression analysis. Again multiple years’
data are desirable to avoid bias.
In interpolation, gaps are filled within datasets by
estimating trends between two or more data
points, e.g. intermediate years where no data is
available. This is useful for datasets with regular
gaps, e.g. periodic surveys. Comparing
interpolated data with surrogate data increases
confidence and it is a good QA/QC practice.
Trend Extrapolation estimates trend and therefore
actual value for a baseline by extending or
‘extrapolating’ trend backwards. This method can
also extrapolate forwards for projections. It is
similar to interpolation – although less known
about the trend. It should not be used for
extended periods of time – the longer the period
the greater the uncertainty. Again other splicing
techniques should be used alongside to improve
confidence. ‘Actual’ data (when available) may
differ from extrapolation
A summary of Splicing and Gap-filling
methods/approaches were given in the table
below:
Approach Applicability Comments
Overlap
Data necessary to apply both old and new
method must be available for at least one
year, preferably
more.
Only use when overlap shows
pattern that appears reliable
14
Surrogate
data
Missing data is strongly
correlated with proxy data
Should test multiple potential
proxy data variables
Interpolation For periodic data or gap in
time series
Linear or non-linear interpolation.
Only use where data shows
steady trend
Trend extrapolation
Beginning or the end of the time series is
missing
data
Only use where trend is steady and
likely to be reliable. Should
only be used for a few years
He concluded by saying that the preferred
approaches are overlap and surrogate, because
they are based on actual data. Interpolation and
extrapolation are effectively projections that
assume certain trends in the absence of data.
Similarly in research, it is not good practice to
simply apply a gap-filling method blindly. You
should understand why your approach is justified
and be able to explain it transparently.

15
First, a roadmap was set out as follows:
1. A coordinator needs to be appointed
2. A team should be formed comprising the
Ghana Statistical Service (GSS), National
Development and Planning Commission
(NDPC), Environmental Protection
Agency (EPA), Forestry Commission
(FC) and the Universities.
The following activities were to be carried out
i. Liaise with sector universities
ii. Team to review and come out with a
proposal for plan
iii. Hold a stakeholder meeting
iv. Develop a draft plan and share it with
stakeholders
v. Seek for financial resources
vi. Finalise the plan
vii. Sustainable capacity building (involve
young experts)
16
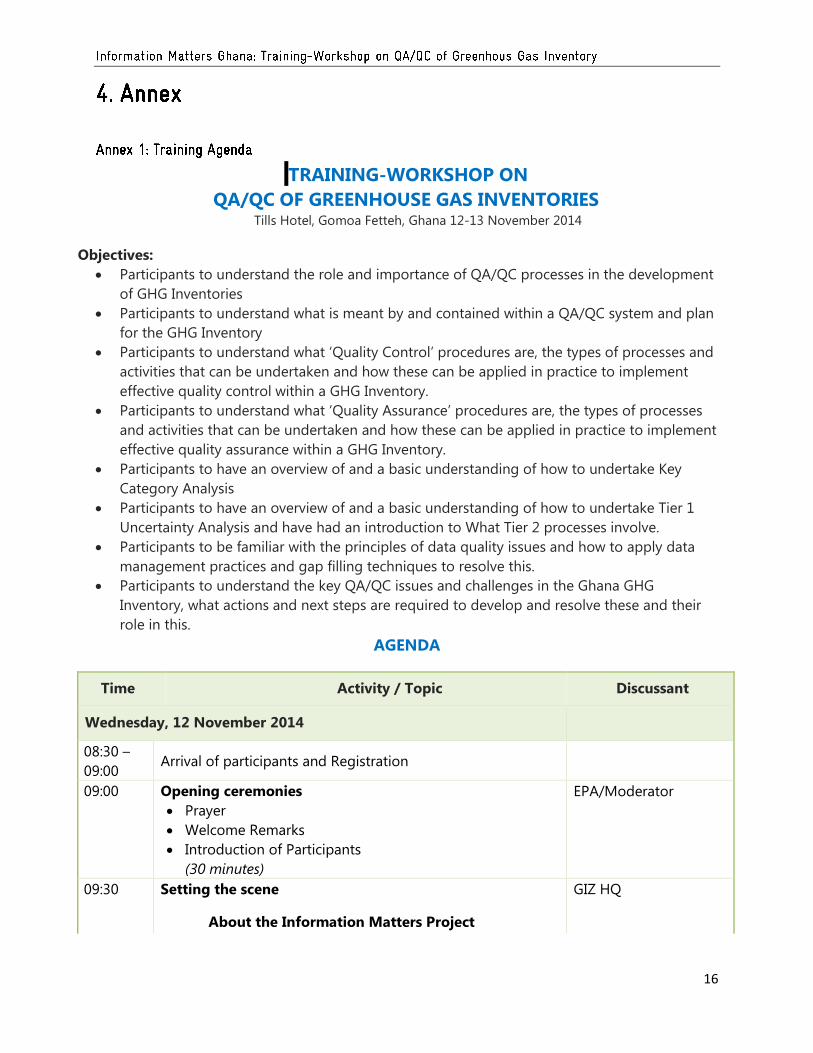
TRAINING-WORKSHOP ON
QA/QC OF GREENHOUSE GAS INVENTORIES Tills Hotel, Gomoa Fetteh, Ghana 12-13 November 2014
Objectives:
Participants to understand the role and importance of QA/QC processes in the development
of GHG Inventories
Participants to understand what is meant by and contained within a QA/QC system and plan
for the GHG Inventory
Participants to understand what ‘Quality Control’ procedures are, the types of processes and
activities that can be undertaken and how these can be applied in practice to implement
effective quality control within a GHG Inventory.
Participants to understand what ‘Quality Assurance’ procedures are, the types of processes
and activities that can be undertaken and how these can be applied in practice to implement
effective quality assurance within a GHG Inventory.
Participants to have an overview of and a basic understanding of how to undertake Key
Category Analysis
Participants to have an overview of and a basic understanding of how to undertake Tier 1
Uncertainty Analysis and have had an introduction to What Tier 2 processes involve.
Participants to be familiar with the principles of data quality issues and how to apply data
management practices and gap filling techniques to resolve this.
Participants to understand the key QA/QC issues and challenges in the Ghana GHG
Inventory, what actions and next steps are required to develop and resolve these and their
role in this.
AGENDA
Time Activity / Topic Discussant
Wednesday, 12 November 2014
08:30 –
09:00 Arrival of participants and Registration
09:00 Opening ceremonies
Prayer
Welcome Remarks
Introduction of Participants
(30 minutes)
EPA/Moderator
09:30 Setting the scene
About the Information Matters Project
GIZ HQ
17
Time Activity / Topic Discussant
(15 minutes)
09:45 Overview and objectives of the training
(10 minutes)
Ricardo-AEA
09:50 Overview of existing and planned developments for
QA/QC in Ghana’s GHG Inventory (20 minutes)
Overview of existing plans and processes in place to
perform QA/QC on Ghana’s GHG Inventory
Ongoing issues – in terms of QA/QC processes and
quality of data
Plans for developing and enhancing QA/QC in the GHG
Inventory in the future
Questions (10 minutes)
EPA
10:20 Plenary Discussion: What does QA/QC mean to you? (40
minutes)
What does QA and QC mean to you?
Do you apply QA/QC to the data and information you
use?
If so what? Give some examples of QA and QC
processes that you have used
To what extent are these processes reflected or
documented within the GHG Inventory QA/QC
system?
Questions and topics delegates are hoping is covered
in the workshop – the ‘Board of Expectations and
Hopes’
Whole group
discussion facilitated
by Ricardo-AEA
11:00 to
11:20
AM Break
11:20 QA/QC System Overview (20 minutes)
Requirements for QA/QC within a GHG Inventory
Developing a QA/QC Plan – the key considerations
Handling confidential data and information
Documentation and archiving
Questions (10 minutes)
Ricardo-AEA
11:50 Quality Control (QC): Principles and Processes (30 minutes)
What is Quality Control?
Types of QC checks/ activities
Implementing QC processes – manual and automated
Ricardo-AEA
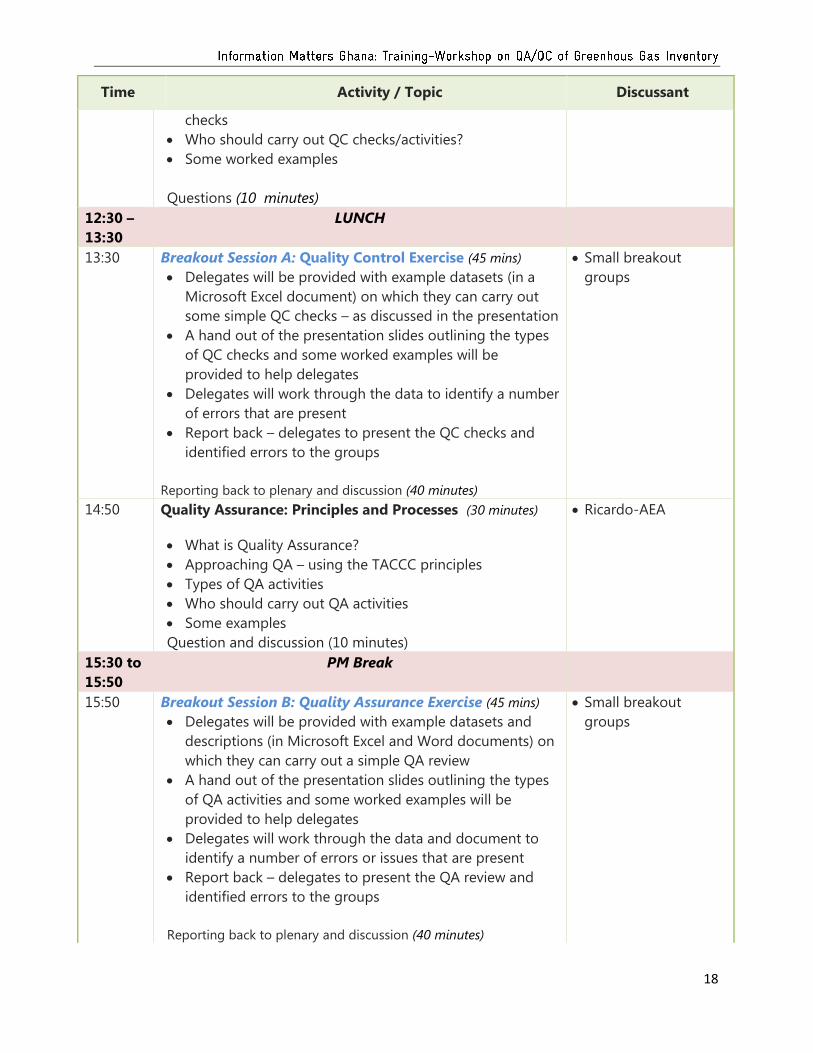
18
Time Activity / Topic Discussant
checks
Who should carry out QC checks/activities?
Some worked examples
Questions (10 minutes)
12:30 –
13:30
LUNCH
13:30 Breakout Session A: Quality Control Exercise (45 mins)
Delegates will be provided with example datasets (in a
Microsoft Excel document) on which they can carry out
some simple QC checks – as discussed in the presentation
A hand out of the presentation slides outlining the types
of QC checks and some worked examples will be
provided to help delegates
Delegates will work through the data to identify a number
of errors that are present
Report back – delegates to present the QC checks and
identified errors to the groups
Reporting back to plenary and discussion (40 minutes)
Small breakout
groups
14:50 Quality Assurance: Principles and Processes (30 minutes)
What is Quality Assurance?
Approaching QA – using the TACCC principles
Types of QA activities
Who should carry out QA activities
Some examples
Question and discussion (10 minutes)
Ricardo-AEA
15:30 to
15:50
PM Break
15:50 Breakout Session B: Quality Assurance Exercise (45 mins)
Delegates will be provided with example datasets and
descriptions (in Microsoft Excel and Word documents) on
which they can carry out a simple QA review
A hand out of the presentation slides outlining the types
of QA activities and some worked examples will be
provided to help delegates
Delegates will work through the data and document to
identify a number of errors or issues that are present
Report back – delegates to present the QA review and
identified errors to the groups
Reporting back to plenary and discussion (40 minutes)
Small breakout
groups

19
Time Activity / Topic Discussant
17:15 Closing of Day 1; Expectations for Day 2 Moderator
Thursday, 13th November 2014
09:00 Preliminaries (15 minutes)
Recapitulation
Overview of Day 2 Agenda
Moderator
09:15 Key Category Analysis and Uncertainty (30 minutes)
Overview of the Key category Analysis approach required
as part of GHG Inventory compilation
Quantitative and qualitative approaches
Uncertainty Analysis – the tier 1 approach
Uncertainty Analysis – introducing the tier 2 approach
Questions and discussion (20 minutes)
Ricardo-AEA
10:15 Improving Data Quality – Dealing with Data Gaps and
Problems (30 minutes)
Data barriers and solutions
Overcoming these barriers – data management solutions
and an introduction to data gap filling techniques
How to carry out overlap, surrogate, interpolation and
extrapolation data splicing techniques
Visualising data
Questions and discussion (15 minutes)
Ricardo-AEA
11:00 to
11:20
AM Break
11:20 Breakout Session C: Data Gap Filling (45 minutes)
Delegates will be provided with some example datasets
(in Microsoft Excel format) that incorporate gaps and will
be tasked with filling these using overlap, surrogate,
interpolation and extrapolation splicing techniques
A hand out of the presentation slides outlining the
different data splicing techniques and some worked
examples will be provided to help delegates
Delegates will work through the data and complete gap
filling for each dataset
Report back – delegates to present how they have
completed the gap filling exercise to the group
Report back to plenary (40 minutes)
Small breakout
groups

20
Time Activity / Topic Discussant
12:45 –
13:45
LUNCH
13:45 Next steps and actions for implementing QA/QC
processes within the Ghana GHG Inventory (30 minutes)
Recap of existing QA/QC issues and challenges in the
Ghana GHG Inventory
How can current QA/QC systems, processes and
activities be built upon?
Key QA/QC tasks/actions going forward – by sector
Which organisations will need to be involved in
developing/implementing these?
Questions (10 minutes)
EPA
14:15 Plenary (1 hour)
Discussion of Issues and identification of QA/QC Actions
– what, who and when?
Whole group
discussion
EPA/Moderator
15:15 to
15:35
PM Break
15:35 Plenary (continued) (1 hour)
Whole group
discussion
EPA/Moderator
16:35 Feedback forms (15 minutes) Moderator
17:00 Closure Moderator
Mr Oppong-Boadi (EPA) and Mark Fynn (GIZ)
Moderator

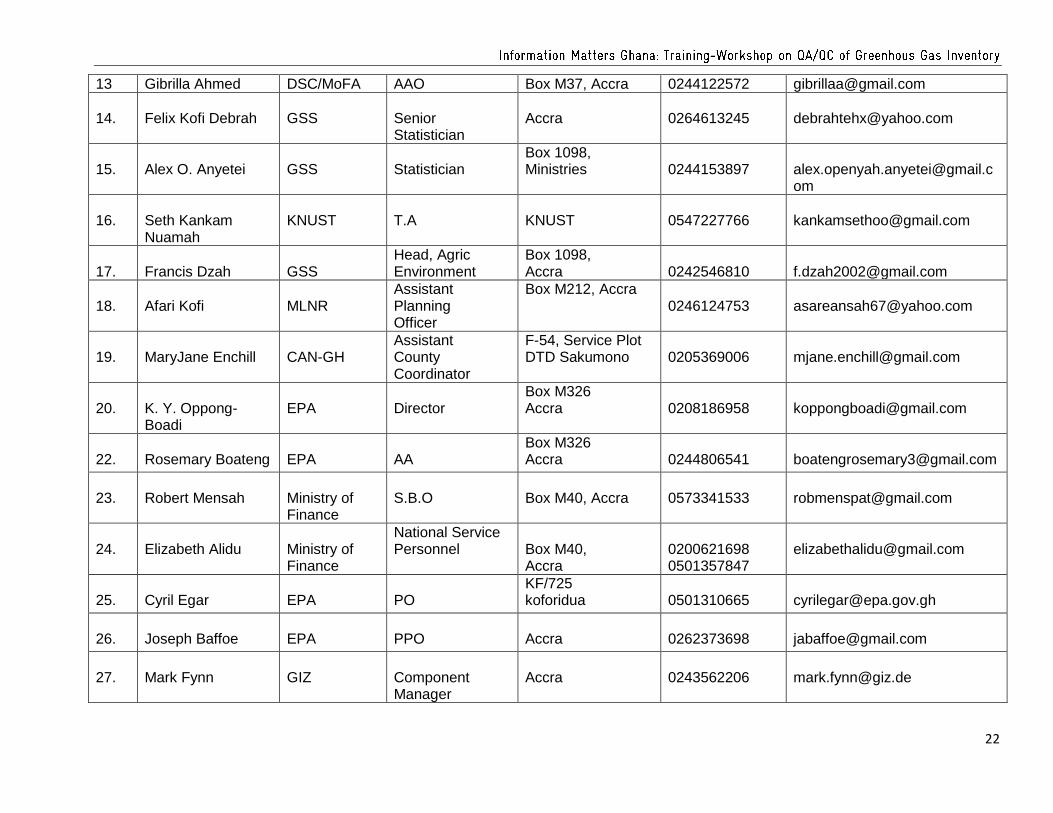
21
TRAINING WORKSHOP ON QA/QC OF GREENHOUSE GAS INVENTORY
Tills Hotel, Gomoa Fetteh, Ghana, Dates 12-13 November 2014
No
Name
Organization
Position
Address
Phone No.
1.
Samuel Dotse
HATOF
F-54 Service Plot D70 (801) Klagon
0207360517
2. Antwi-B. Amoah EPA SPO Box M326, Accra 0243987871 [email protected]
3 Gibrilla Ahmed DSC/MoFA AAO Box M37, Accra 0244122572 [email protected]
4. Felix Kofi Debrah GSS Senior Statistician
Accra 0264613245 [email protected]
5. Alex O. Anyetei GSS Statistician Box 1098, Ministries
0244153897 [email protected]
6. Seth Kankam Nuamah
KNUST T.A KNUST 0547227766 [email protected]
7. Francis Dzah GSS Head, Agric Environment
Box 1098, Accra
0242546810 [email protected]
8. Afari Kofi MLNR Assistant Planning Officer
Box M212, Accra
0246124753 [email protected]
9.
Mary Jane Enchill
CAN-GH
Assistant County Coordinator
F-54, Service Plot DTD Sakumono
0205369006
10.
K. Y. Oppong-Boadi
EPA
Director
Box M326 Accra
0208186958
11.
Samuel Dotse
HATOF
F-54 Service Plot D70 (801) Klagon
0207360517
12.
Antwi-B. Amoah
EPA
SPO
Box M326, Accra
0243987871
22
13 Gibrilla Ahmed DSC/MoFA AAO Box M37, Accra 0244122572 [email protected]
14.
Felix Kofi Debrah
GSS
Senior Statistician
Accra
0264613245
15.
Alex O. Anyetei
GSS
Statistician
Box 1098, Ministries
0244153897
16.
Seth Kankam Nuamah
KNUST
T.A
KNUST
0547227766
17.
Francis Dzah
GSS
Head, Agric Environment
Box 1098, Accra
0242546810
18.
Afari Kofi
MLNR
Assistant Planning Officer
Box M212, Accra
0246124753
19.
MaryJane Enchill
CAN-GH
Assistant County Coordinator
F-54, Service Plot DTD Sakumono
0205369006
20.
K. Y. Oppong-Boadi
EPA
Director
Box M326 Accra
0208186958
22.
Rosemary Boateng
EPA
AA
Box M326 Accra
0244806541
23.
Robert Mensah
Ministry of Finance
S.B.O
Box M40, Accra
0573341533
24.
Elizabeth Alidu
Ministry of Finance
National Service Personnel
Box M40, Accra
0200621698 0501357847
25.
Cyril Egar
EPA
PO
KF/725 koforidua
0501310665
26.
Joseph Baffoe
EPA
PPO
Accra
0262373698
27.
Mark Fynn
GIZ
Component Manager
Accra
0243562206
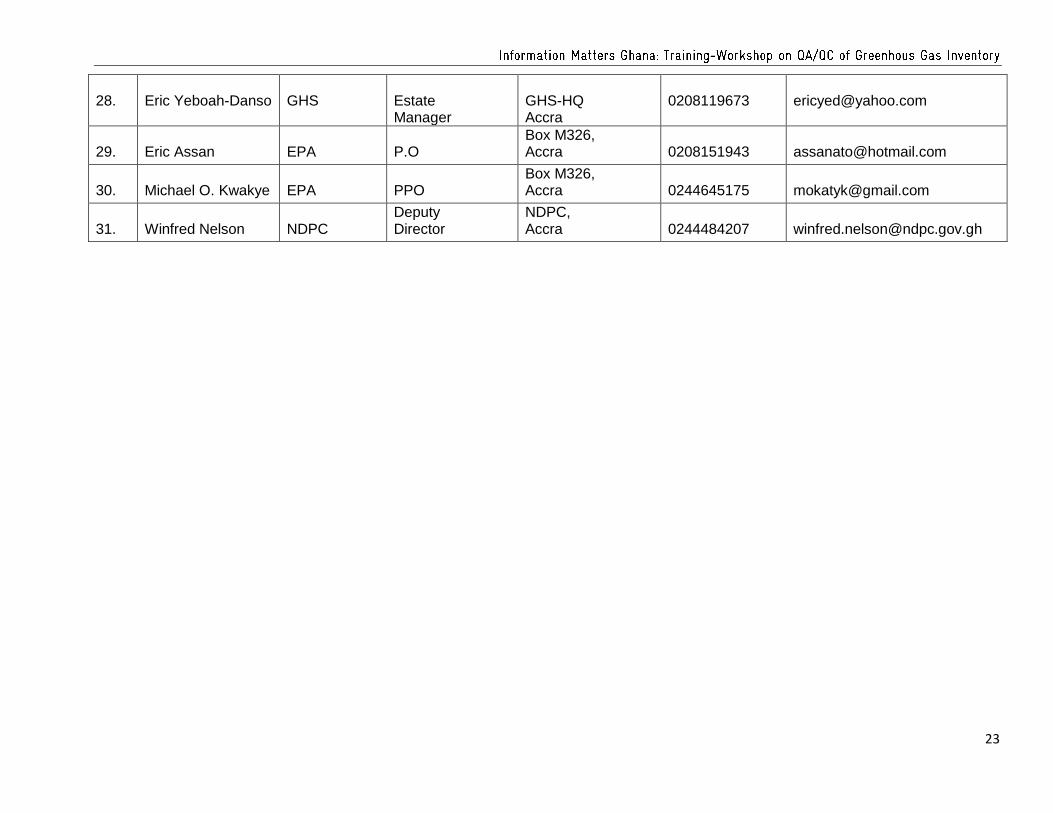
23
28.
Eric Yeboah-Danso
GHS
Estate Manager
GHS-HQ Accra
0208119673
29.
Eric Assan
EPA
P.O
Box M326, Accra
0208151943
30.
Michael O. Kwakye
EPA
PPO
Box M326, Accra
0244645175
31.
Winfred Nelson
NDPC
Deputy Director
NDPC, Accra
0244484207
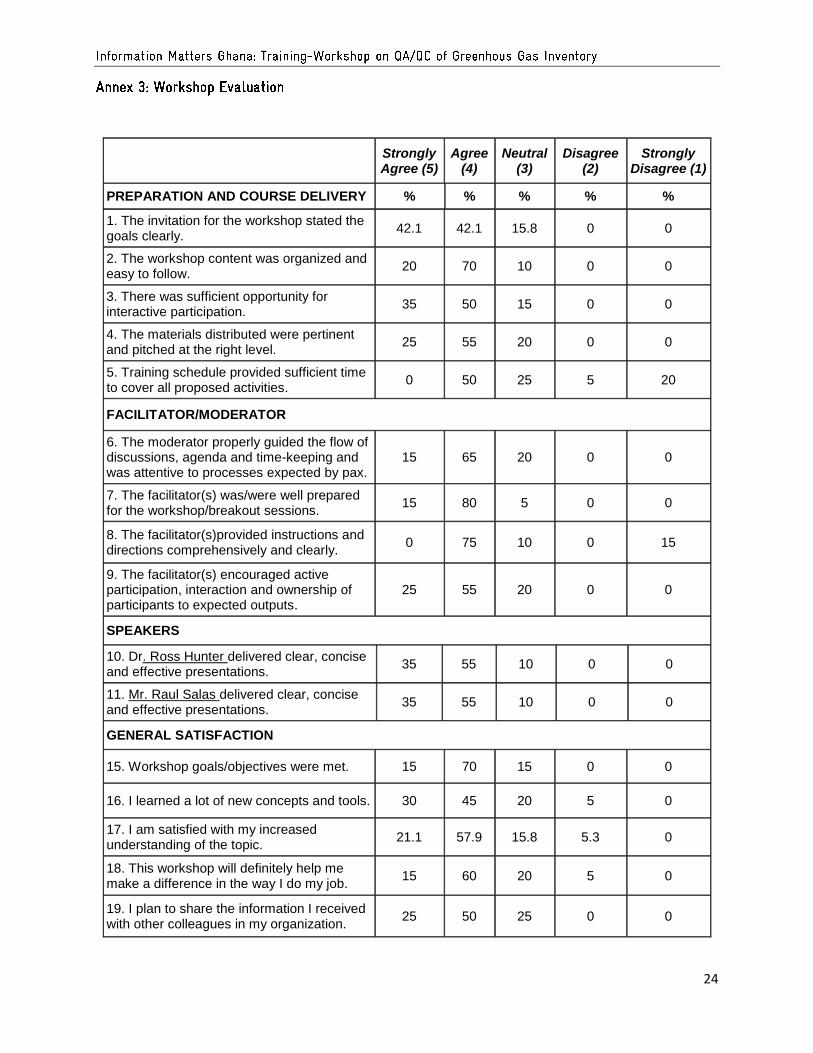
24
Strongly Agree (5)
Agree (4)
Neutral (3)
Disagree (2)
Strongly Disagree (1)
PREPARATION AND COURSE DELIVERY % % % % %
1. The invitation for the workshop stated the goals clearly.
42.1 42.1 15.8 0 0
2. The workshop content was organized and easy to follow.
20 70 10 0 0
3. There was sufficient opportunity for interactive participation.
35 50 15 0 0
4. The materials distributed were pertinent and pitched at the right level.
25 55 20 0 0
5. Training schedule provided sufficient time to cover all proposed activities.
0 50 25 5 20
FACILITATOR/MODERATOR
6. The moderator properly guided the flow of discussions, agenda and time-keeping and was attentive to processes expected by pax.
15 65 20 0 0
7. The facilitator(s) was/were well prepared for the workshop/breakout sessions.
15 80 5 0 0
8. The facilitator(s)provided instructions and directions comprehensively and clearly.
0 75 10 0 15
9. The facilitator(s) encouraged active participation, interaction and ownership of participants to expected outputs.
25 55 20 0 0
SPEAKERS
10. Dr. Ross Hunter delivered clear, concise and effective presentations.
35 55 10 0 0
11. Mr. Raul Salas delivered clear, concise and effective presentations.
35 55 10 0 0
GENERAL SATISFACTION
15. Workshop goals/objectives were met. 15 70 15 0 0
16. I learned a lot of new concepts and tools. 30 45 20 5 0
17. I am satisfied with my increased understanding of the topic.
21.1 57.9 15.8 5.3 0
18. This workshop will definitely help me make a difference in the way I do my job.
15 60 20 5 0
19. I plan to share the information I received with other colleagues in my organization.
25 50 25 0 0
25
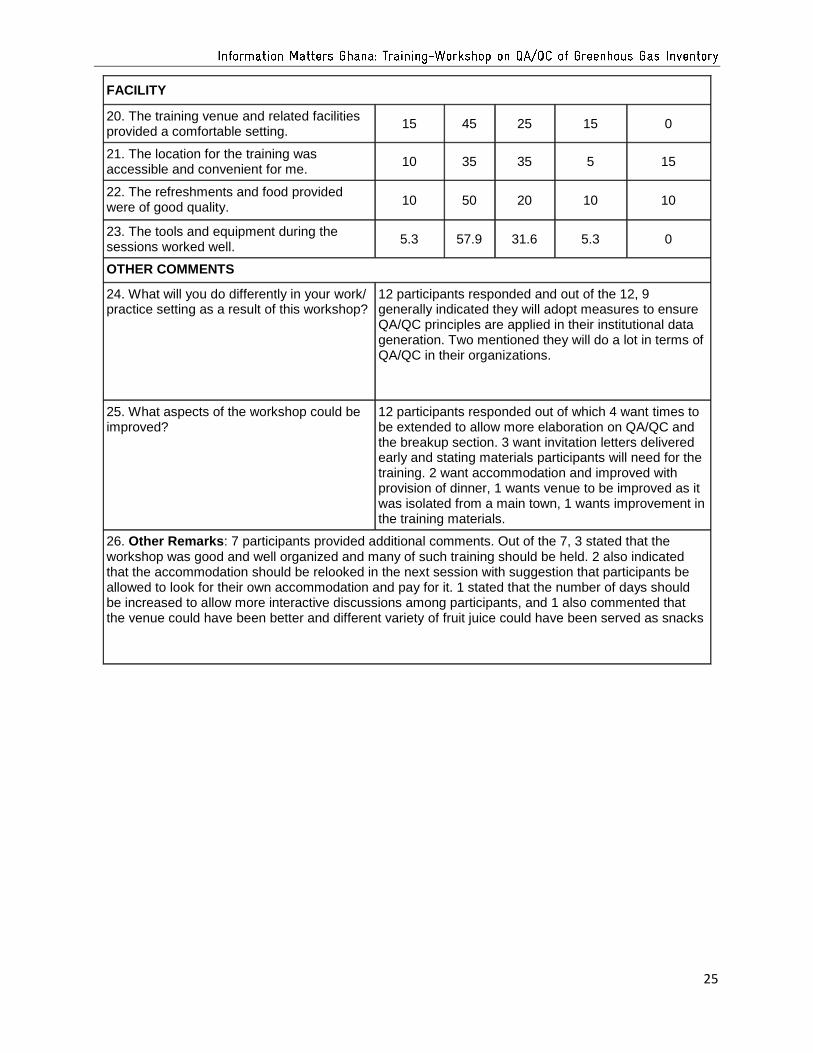
FACILITY
20. The training venue and related facilities provided a comfortable setting.
15 45 25 15 0
21. The location for the training was accessible and convenient for me.
10 35 35 5 15
22. The refreshments and food provided were of good quality.
10 50 20 10 10
23. The tools and equipment during the sessions worked well.
5.3 57.9 31.6 5.3 0
OTHER COMMENTS
24. What will you do differently in your work/ practice setting as a result of this workshop?
12 participants responded and out of the 12, 9 generally indicated they will adopt measures to ensure QA/QC principles are applied in their institutional data generation. Two mentioned they will do a lot in terms of QA/QC in their organizations.
25. What aspects of the workshop could be improved?
12 participants responded out of which 4 want times to be extended to allow more elaboration on QA/QC and the breakup section. 3 want invitation letters delivered early and stating materials participants will need for the training. 2 want accommodation and improved with provision of dinner, 1 wants venue to be improved as it was isolated from a main town, 1 wants improvement in the training materials.
26. Other Remarks: 7 participants provided additional comments. Out of the 7, 3 stated that the workshop was good and well organized and many of such training should be held. 2 also indicated that the accommodation should be relooked in the next session with suggestion that participants be allowed to look for their own accommodation and pay for it. 1 stated that the number of days should be increased to allow more interactive discussions among participants, and 1 also commented that the venue could have been better and different variety of fruit juice could have been served as snacks

26