Embed Size (px)
Citation preview
May 2017
Report on Study into Hong Kong’s Auto-fuel Market

Report on Study into Hong Kong’s Auto-fuel Marketi
Table of ContentsExecutive Summary ................................................................................................................. 01
1. Introduction ........................................................................................................................ 22
Our analytical framework ................................................................................................... 23
Our approach to the study ................................................................................................ 24
Structure of this report ......................................................................................................... 25
2. Two common perceptions ............................................................................................... 26
High prices – the results of collusive behaviour or other factors? .................................... 26
Parallel pricing versus price fixing ........................................................................................ 28
3. Analysis of market structure ........................................................................................... 30
Supply of auto-fuel ............................................................................................................... 30
Demand for auto-fuel .......................................................................................................... 34
Summary and implications ................................................................................................. 39
4. Analysis of market conduct ........................................................................................... 43
Price setting and adjustment practices ............................................................................. 43
Analysis of retail margins ..................................................................................................... 51
Summary and implications ................................................................................................. 59
5. Recommendations ............................................................................................................ 62
Short-term options................................................................................................................ 62
Longer-term options ............................................................................................................ 65
6. Appendix: Analysis of input cost pass-through .......................................................... 68
7. Appendix: Designation of sites for PFS use ................................................................. 77
Report on Study into Hong Kong’s Auto-fuel Market
ii
List of TablesTable 1 Diesel vehicles by type ........................................................................................ 37
Table 2 Summary of key structural characteristics......................................................... 39
Table 3 Summary of key pricing practices and market outcomes .............................. 59
Table 4 Estimation results for one of the retailers, for regular petrol .............................. 76
List of FiguresFigure 1 International petrol pump price comparison ................................................... 27
Figure 2 A snapshot of the Hong Kong auto-fuel market .............................................. 30
Figure 3 Share of total PFS sites, 2005 and 2015 .............................................................. 33
Figure 4 Licensed private cars and unleaded petrol imports, 2005-2016 ..................... 35
Figure 5 Monthly average walk-in discounts: diesel ....................................................... 45
Figure 6 Monthly average walk-in discounts: standard 98 RON petrol ......................... 46
Figure 7 Geographic price variations, premium petrol and diesel, New York .............. 50
Figure 8 Gross margins for petrol and diesel, 2005 and 2016 ........................................ 52
Figure 9 PFS site tender results, 2011-2016 ........................................................................ 55
Figure 10 Increases in residential real-estate prices .......................................................... 57
Figure 11 Headline retail price of regular petrol of one of the retailers and MOPS ........ 74
Figure 12 Estimation results for one of the retailers, for regular petrol .............................. 75
Report on Study into Hong Kong’s Auto-fuel Market01
EXECUTIVE SUMMARYThis report summarises the findings of the Hong Kong Competition Commission’s (Commission) study of the local auto-fuel market. Given the vital role that auto-fuels play in day-to-day life, it is important for the markets in which they are supplied to be functioning well. Indeed, the main objective of market studies conducted by competition agencies is to determine the state of competition in relevant markets.
News reports highlighting that petrol prices in Hong Kong are the highest in the world have brought the state of competition in the local auto-fuel market into even sharper focus. However, there is a danger of only searching for signs of anti-competitive conduct as an explanation for high prices and overlooking a number of structural and behavioural issues that may have been undermining competition.
Competition authorities around the world have studied their respective auto-fuel markets at length. Many of these studies have highlighted common issues in the different markets but the Commission is of the view that the Hong Kong market has a number of features that have not generally been seen elsewhere. These features are not only highly unusual but also go to the heart of the issue of whether our city has a competitive auto-fuel market.
It is important to take note that this market study is not conducted as part of an investigation, and therefore the Commission does not have compulsory information gathering powers at its disposal and has to rely heavily on stakeholders’ willingness to provide information and materials gathered from the public domain. For the purpose of this report, the Commission has requested oil companies to provide information on a voluntary basis. While it is acknowledged that co-operation was generally forthcoming, there was some information that could not be obtained. In spite of this, the Commission is confident that this report provides an accurate and balanced overview of the sector.
This report identifies a number of issues which the Commission believes to be responsible for hindering competition and which would likely have contributed to high auto-fuel prices in Hong Kong. The report then goes on to make recommendations on how to address these issues. With public support, many of these proposed changes should not take long to implement. Indeed, some should be implemented immediately. The fact that the Government will be re-tendering a number of petrol filling station (PFS) sites, the leases of which are expiring in 2018, creates the perfect impetus for adding more competitive dynamics to the market.
Report on Study into Hong Kong’s Auto-fuel Market
02
Two common perceptionsThroughout the Commission’s interactions with stakeholders, two key themes emerged time and again: that prices are higher in Hong Kong than anywhere else and that they are always the same across companies. These two factors were widely perceived to be evidence of collusion amongst oil companies. Given the pervasiveness of those beliefs, it is worth pointing out that these two features on their own cannot be taken as hard evidence of anti-competitive conduct.
Hard evidence of anti-competitive conduct requires proof of an agreement or concerted action among competing suppliers, not just observably high or identical/ comparable prices. However, as this report outlines, even if there is no evidence of anti-competitive conduct, this does not mean that the auto-fuel market in Hong Kong is functioning as competitively as it should be.
High prices - the result of collusive behaviour or other factors?
Retail pump prices are indeed high in Hong Kong, relative to the rest of the world. However, in isolation, that is not conclusive evidence of collusion. Firstly, one can argue that very few Hong Kong customers pay the ‘headline’ pump price for either petrol or diesel because of the ubiquitous discounts that are made available through different sources. The cumulative effect of those discounts could reduce the pump price by anything from $0.90/litre to $2/litre (or more) for petrol, and from $2/litre to $5/litre (or more) for diesel. In other words, the effective retail prices that customers pay can be materially lower than the advertised pump prices.
Secondly, there are cost differentials. It is worth noting that before petrol and diesel enter the storage facilities on Tsing Yi Island, around $9-$10/litre and $3-$4/litre have already been spent respectively, on product costs and duty (for petrol only at $6.06/litre). This accounts for a substantial part of the final pump prices. Retailers must also incur the ongoing costs of operating the retail sites themselves, such as labour.
Then there are land costs. Hong Kong is a small, densely populated city. There is only limited land available for auto-fuel retailing sites in desirable locations and it is natural to expect that a premium will need to be paid. Ultimately, ‘auto-fuel retailing’ must compete with all other alternative potential uses of land, including residential and commercial real-estate developments. These traits all contribute to the high pump prices. However, short of reducing duties (for petrol) and/or somehow reducing land prices, little can be done to change that overall picture.
Report on Study into Hong Kong’s Auto-fuel Market03
Parallel pricing versus price fixing
Retail pump prices are almost always identical across Hong Kong retailers, and move together. When one firm changes its pump prices, all others follow within one or two days, until they are all at the same level again – this is sometimes called ‘parallel pricing’. It is important to understand that this is an almost universal feature of homogeneous product markets. Irrespective of whether the firms are competing vigorously or coordinating their pricing, one would still expect to see very similar prices. Given that all the retailers are selling virtually identical products, it would be more puzzling if prices were not moving together. In isolation, the existence of broadly parallel pricing therefore reveals very little about whether firms are competing or coordinating.
In the Hong Kong context, when one talks about auto-fuel price, it is also necessary to take into consideration the wide prevalence of discounting. This is because headline pump prices do not tell the whole story with respect to either price levels or movements. If pump prices do not move, but discounts do, then prices may be different across time and retailers.
To determine the degree of rivalry, it is therefore necessary to look beyond the mere similarity in pump prices and examine more closely the market’s underlying structural and behavioural characteristics. Only then can robust conclusions be drawn about the effectiveness of competition and whether potential concerns exist that might warrant some forms of market intervention. These underlying dynamics are consequently the Commission’s core focus throughout the remainder of this market study.
Crudeoil
Singapore
Retailsites
Terminal storage
facilities
Refining facilities
Tsing Yi Island
Hong Kong Island Kowloon New Territories
Imported auto-fuel (transported by ship)
Shell Esso Caltex Sinopec
Shell Esso Caltex Sinopec
Retail auto-fuel (transported by tanker truck)
Large users
Shell(3)
Esso(7)
Caltex(7)
Sinopec(9)
PetroChina(4)
Feoso(2)
Shell(16)
Esso(15)
Caltex(10)
Sinopec(5)
PetroChina(2)
Feoso(1)
Shell(23)
Esso(25.5)
Caltex(22)
Sinopec(24)
PetroChina(4)
Feoso(1)
Concord(0.5)
Report on Study into Hong Kong’s Auto-fuel Market
04
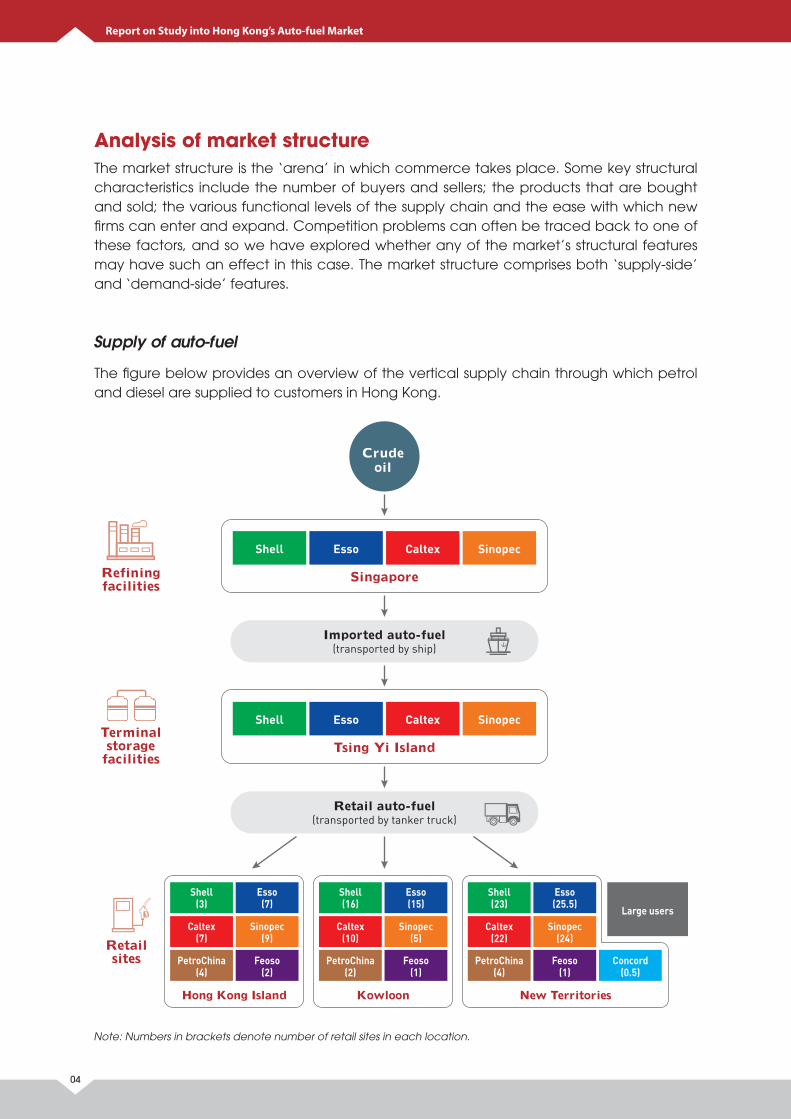
Analysis of market structureThe market structure is the ‘arena’ in which commerce takes place. Some key structural characteristics include the number of buyers and sellers; the products that are bought and sold; the various functional levels of the supply chain and the ease with which new firms can enter and expand. Competition problems can often be traced back to one of these factors, and so we have explored whether any of the market’s structural features may have such an effect in this case. The market structure comprises both ‘supply-side’ and ‘demand-side’ features.
Supply of auto-fuel
The figure below provides an overview of the vertical supply chain through which petrol and diesel are supplied to customers in Hong Kong.
Note: Numbers in brackets denote number of retail sites in each location.
Report on Study into Hong Kong’s Auto-fuel Market05
Crude oil is the primary input into auto-fuel and its cost represents a major component of final retail prices. Oil is converted into auto-fuel in large, technically complex refineries. Hong Kong has no refineries, and is consequently wholly dependent on imports of refined auto-fuel. These imports arrive principally from refineries in Singapore owned by the major retailers.1 Typically, the ‘vertically integrated’ retailers receive multiple shipments per month, in 30,000 tonne tankers capable of transporting different auto-fuels simultaneously.
Upon arrival in Hong Kong, the fuel is stored in large ‘terminal storage’ tanks on Tsing Yi Island. Four companies own terminal storage facilities in this location – Shell, ExxonMobil (Esso), Chevron (Caltex) and Sinopec. Acquiring land to build new terminal storage would be difficult – especially for a new entrant.2 Renting existing storage from competitors would also be challenging.3 Because PetroChina does not have its own terminal storage, it must purchase a wholesale supply of fuel from its competitors, placing it at a competitive disadvantage.
Most auto-fuel in Hong Kong is sold through retail stations. Sites for stations are designated for that specific use by the government after the consideration of many factors, including potential demand, environmental impacts, and road and fire safety concerns. In theory, parcels of privately-owned land being used for other purposes can also be converted into PFS sites. However, the conversion process is arduous and time consuming (typically taking two to three years) and, consequently, would likely give pause to potential new entrants.
Most PFS are owned by the major retailers and pump prices are determined by them. Unlike some of the low-cost ‘self-service’ stations seen in other countries (e.g., stations operated by supermarkets), most of Hong Kong’s sites are ‘full-service’. Space restriction has also been mentioned as a reason behind the limited revenue that can be generated from sales of ‘high-margin’ non-fuel items like snack food – nearly all revenue comes from fuel sales.
Three types of auto-fuel are currently imported into Hong Kong – ‘standard’ 98 RON unleaded petrol, ‘super’ 98 RON unleaded petrol4 and diesel. The 98 RON octane rating is uniformly higher than in most other markets, where it is considered a premium fuel and either offered alongside a cheaper alternative (e.g., 91 RON), or not at all. Currently all diesel sold is required to meet ‘Euro V’ standards.
1 Importing from their own facilities presumably represents the most cost-effective way to source fuel. 2 A deep-draft jetty would be required capable of receiving 30,000 tonne tankers, and in an unpopulated area.
Government approval would also be needed – and may be hard to obtain.3 The vertically integrated retailers are under no obligation to provide access and they might simply – and quite
rationally – refuse outright, or demand uneconomic terms (which amounts to the same thing).4 The Commission notes that there have been some claims that the ‘super’ variety of petrol on sale in Hong Kong
may be of a higher RON than 98 RON, however the Commission has not been able to verify this.
Report on Study into Hong Kong’s Auto-fuel Market
06
98 RON unleaded petrol was introduced to Hong Kong in October 1991. Prior to that, another lower octane grade of petrol, 95 RON leaded petrol was sold but it was substituted by 95 RON unleaded petrol in April 1991. Between October 1991 and March 1992, both 95 RON and 98 RON unleaded petrol were available. 95 RON unleaded petrol was subsequently withdrawn from the market by all oil companies after being sold in the market for less than one year.
Retailers have stated that their decision to sell only 98 RON petrol reflected customer preference. However, the plausibility of this explanation is questionable, since most modern cars can comfortably use 95 RON petrol. Hong Kong stands alone in the world where only such a top grade of petrol (in practical terms the most expensive) is available for motorists. Both the “standard” and “super” varieties of petrol on offer here are 98 RON. The Commission has found it difficult to establish how the current one-product situation came about more than 20 years ago. That it was said to be reflective of consumer demand has made it all the more puzzling. To put this in perspective, 95 RON can be used in most cars with the exception of a very few luxurious and high performance models. In Singapore, for example, the 98 RON petrol price is around 15% higher than that of 95 RON petrol5 and the market share of 95 RON is over 50%6. As shown by a consumer preference survey7, a vast majority (86.2%) of the respondents in Hong Kong indicated that they are likely to switch to petrol with lower octane level than 98 RON petrol if it is 10% cheaper, while close to half of the respondents (45.7%) will definitely/ are very likely to make the switch. Furthermore, in another survey8 conducted on the car types in Hong Kong, it was shown that more than 99% of the petrol engine vehicles sampled could use 95 RON petrol, and only around 15% are recommended to use 98 RON.
The PFS sites themselves are leased to suppliers for 21-year periods via a tender process. Since July 2000, PFS sites are now leased in batches of up to five at a time, rather than one-by-one, and firms may lodge ‘super’ bids to lease all the stations together.9 The basic idea of the ‘super’ bid option was to enable new entrants to obtain scale more quickly, without the uncertainties of acquiring sites on a piecemeal basis. Both Sinopec and PetroChina availed themselves of the opportunity to acquire multiple sites in the early tenders held under this process.
5 The price differential percentage is the average of the data on 10/4/2017 or 11/4/2017 from 4 major auto-fuel retailers in Singapore.
6 Competition Commission of Singapore (2011), Inquiry into Retail Petrol Market in Singapore, p. 6. Available here.7 The Commission commissioned the Social Science Research Centre of The University of Hong Kong to conduct the
survey in 2017 during which 625 interviews were successfully completed. 8 The Commission commissioned the Social Science Research Centre of The University of Hong Kong to conduct the
survey in 2017 during which 3,053 petrol-powered vehicles were sampled in 5 different locations across Hong Kong on both weekdays and weekends.
9 In addition, all PFS sites are now made available for re-tender upon expiry of the 21-year lease, instead of rolling these over as was previously the case. There are also fewer restrictions on whom may submit tenders, e.g. there is no need to hold a Special Import Licence, or a supply contract with a licence holder.
Esso, 29%(52 sites) (-5%)
Shell, 23%(42 sites) (-6%)
Shell, 29%(50 sites)
Caltex, 22%(39 sites) (-5%)
Caltex, 27%(47 sites)
Sinopec, 21%(38 sites) (+19%)
Sinopec, 2%(3 sites)
PetroChina, 5%(10 sites) (+4%)PetroChina, 1%
(2 sites) Concord, 1%(1 site)
Esso, 34%(59 sites)
CRC, 6%(11 sites)
2005 2015
CRC, 0% (0 sites) (-6%)Concord, 0% (0 sites) (-1%)
Report on Study into Hong Kong’s Auto-fuel Market07
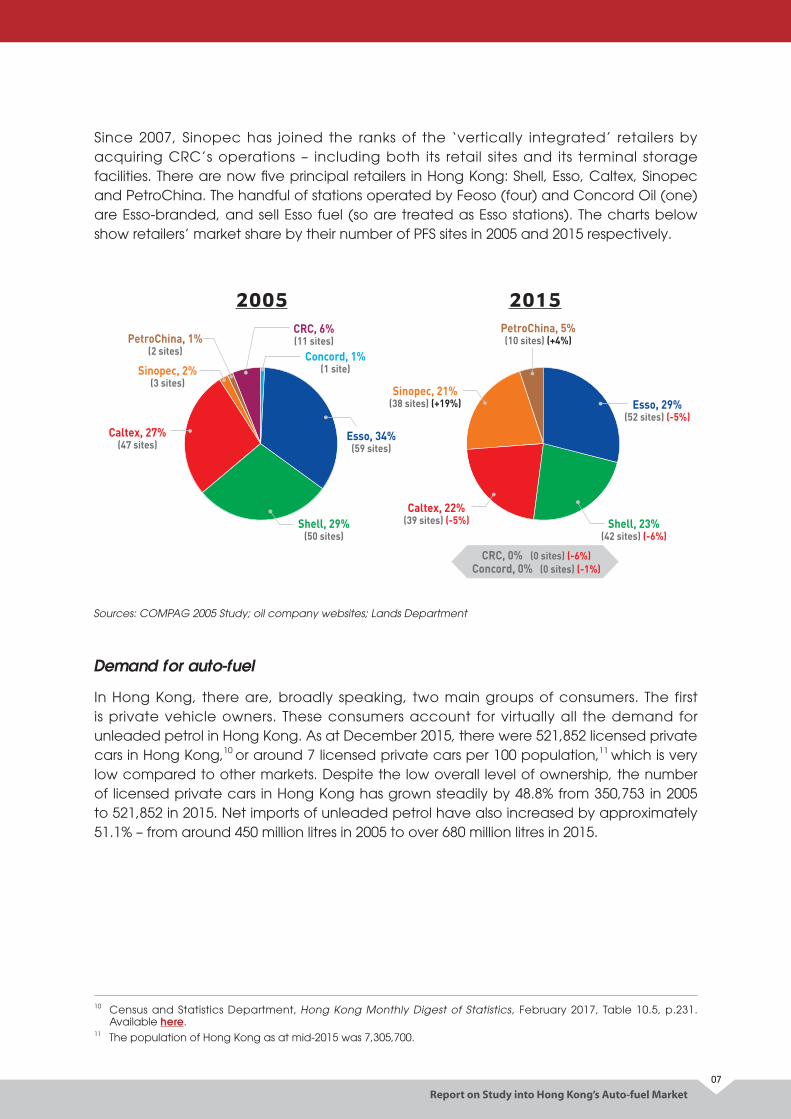
Since 2007, Sinopec has joined the ranks of the ‘vertically integrated’ retailers by acquiring CRC’s operations – including both its retail sites and its terminal storage facilities. There are now five principal retailers in Hong Kong: Shell, Esso, Caltex, Sinopec and PetroChina. The handful of stations operated by Feoso (four) and Concord Oil (one) are Esso-branded, and sell Esso fuel (so are treated as Esso stations). The charts below show retailers’ market share by their number of PFS sites in 2005 and 2015 respectively.
Sources: COMPAG 2005 Study; oil company websites; Lands Department
Demand for auto-fuel
In Hong Kong, there are, broadly speaking, two main groups of consumers. The first is private vehicle owners. These consumers account for virtually all the demand for unleaded petrol in Hong Kong. As at December 2015, there were 521,852 licensed private cars in Hong Kong,10 or around 7 licensed private cars per 100 population,11 which is very low compared to other markets. Despite the low overall level of ownership, the number of licensed private cars in Hong Kong has grown steadily by 48.8% from 350,753 in 2005 to 521,852 in 2015. Net imports of unleaded petrol have also increased by approximately 51.1% – from around 450 million litres in 2005 to over 680 million litres in 2015.
10 Census and Statistics Department, Hong Kong Monthly Digest of Statistics, February 2017, Table 10.5, p.231. Available here.
11 The population of Hong Kong as at mid-2015 was 7,305,700.
Report on Study into Hong Kong’s Auto-fuel Market
08
Despite the significant increase in overall demand over the last decade, there has only been a very small increase by approximately 4.6% in the number of PFS sites: from 173 in 2005 to 181 in 2015.12 This has translated into a sizeable uplift in the average amount of petrol being bought at each PFS site. The estimated average sales per PFS site has increased by approximately 46.2% from around 2.6 million litres per annum13 in 2005 to around 3.8 million litres per annum14 in 2015. All other things being equal, this should have allowed retailers to defray their fixed costs over larger volumes.
The second group of consumers are commercial transport operators, which account for most of the demand for diesel. The largest consumers in this group are the franchised bus operators. Each franchised bus company tenders its fuel supply periodically – a practice encouraged by the Government to demonstrate that they are controlling their input costs. They also have their own facilities for dispensing fuel and are therefore not dependent upon retail sites. Another category of large users for which competition appears quite keen is trucking fleets.
The remaining consumers of diesel are ‘single operator’ trucking providers, non-franchised bus companies and diesel-powered private cars. We have been advised that these customers are reliant on road-side filling stations and do not receive the same level of discounts as larger users. Bigger discounts can potentially be obtained, however, through third-party ‘consolidators’ (or ‘fleet card agents’).15 The Commission understands that the average diesel throughput at each PFS site has also increased since 2005, but not to the same extent as for petrol.
A curious feature of the Hong Kong market is the way customers appear to respond to pump price changes. In most international markets, consumers – or a significant proportion of them – are keenly aware of the prevailing fuel prices and try their best to buy where it is cheaper. This is quite intuitive: why pay more for the same thing, if you can switch by simply driving a bit further down the road? At least, that is the reaction one would expect to observe. What the Commission has actually observed in Hong Kong is quite different.
Some oil companies provided the Commission with daily volumes of auto-fuel sales, which enabled us to examine what happened at four ‘pairs’ of adjacent stations when their pump prices diverged.16 Sometimes the expected result was observed – that is, the station with the lower pump price appeared to gain volume and the more expensive site lost volume, compared with the previous week’s levels. But not always.
12 This number has decreased slightly in recent years – from 185 in 2011 – due to several station closures.13 454 million litres for 173 stations.14 685 million litres for 181 stations.15 As the name suggests, these parties seek to ‘consolidate’ a large group of motorists, then negotiate a volume
discount with an oil company. They are then able to pass on less than 100% of that discount, making a margin. 16 When retailers change their ‘headline pump prices’ there is usually a small window of time during which those
prices differ across brands and, by extension, across retail sites.
Report on Study into Hong Kong’s Auto-fuel Market09
On other occasions, the opposite occurred – and the station with the higher pump price ostensibly picked up volume. We consider some potential explanations for this unusual phenomenon in our assessment of market conduct.
Summary of structural characteristics
The key structural features of the Hong Kong auto-fuel market are summarised in the table below. Many of these are very difficult to change. For example, little can be done about Hong Kong’s unique topography, which makes it harder for ‘alternative retailing models’ to emerge.17 However, there are other structural traits that are potentially amenable to reforms that might promote competition by making it easier for new firms – and nascent entrants – to acquire PFS sites and access to auto-fuel supply. We shall return to these in our recommendations.
High seller concentration
The market is highly concentrated, but the retailers’ respective market share based on number of PFS have moved significantly over the last decade – due primarily to the growth of Sinopec.
High degree of vertical integration
The market exhibits a high degree of vertical integration, with the vast majority of auto-fuel sold through retail stations owned by integrated oil companies (the only exception being PetroChina).
Similar cost structures
The major retailers are likely to have broadly similar cost structures, i.e., there is no low-cost ‘maverick’ competitor and Hong Kong’s topography limits opportunities for alternative retailing models to emerge.
High barriers to entry and expansion
The market is characterised by high barriers to entry – it is particularly difficult for new entrants to obtain a sufficient number of PFS sites and access to terminal storage facilities.
Availability of single product for petrol
Only one octane number of petrol, 98 RON, is available in Hong Kong.
Small number of private drivers
Few people drive cars. The city is dense, rendering car travel and parking inconvenient – particularly given the very convenient public transport options.
Strong dependence on retail sales
The majority of customers make auto-fuel purchases from retail stations – with only larger operators (such as the franchised bus companies) possessing their own filling infrastructure.
17 For example, supermarkets selling auto-fuel and retailers devoting significant floor space to high-margin ‘non-fuel’ items (noting also that few Hong Kong motorists exit their cars when filling up, in any case).
Report on Study into Hong Kong’s Auto-fuel Market
10
Analysis of market conductCertain types of conduct – or market outcomes – can signal potential competition problems, buttressing any concerns identified in a structural assessment. Alternatively, certain behaviours may simply be symptomatic of the unique characteristics of the Hong Kong market. The way that firms set prices – and the margins that they earn (to the extent they can be measured) – are especially important factors to consider.
The way pump prices are displayed
In most other markets, ascertaining the prevailing prices of petrol and diesel is straightforward. Stations typically have large price boards displaying clearly the current pump prices to passing motorists. This makes it quite easy for customers in these other markets to figure out what they will pay. In Hong Kong, it is harder for customers to gauge and compare prices in this way – and to ‘shop around’.
This is partly due to the greater complexity of discounts – which we discuss below – but, also, because of the lack of visibility of pump prices themselves. Some PFS sites do not have price boards at all (although, since 2000, all new leases require them) and those that are in place are not always visible from the street and/ or are relatively small. Moreover, some stations that have large, clearly visible boards at their disposal do not actually use them to display pump prices – which is puzzling.
When a retailer changes its pump prices, it usually takes one or two days for all the other retailers to follow suit. There is therefore a window – however brief – when pump prices diverge across the different brands. Given the infrequency of pump price changes (a phenomenon we explore below), these periods surrounding ‘price change events’ are potentially of great significance to the competitive process. During these windows, motorists may be aware that prices are changing, but they may not be fully apprised of those retailers that have changed the prices and those that are lagging. In the Commission’s view, that is problematic.
It might also at least partly explain the seemingly counterintuitive phenomenon described earlier, whereby stations with higher pump prices during ‘price change episodes’ were sometimes seen to ‘gain volumes’ at the expense of neighbouring stations with lower pump prices. It could be that some of those customers simply did not know there was a pump price difference between the two stations. In the Commission’s view, the ubiquitous use of prominent price boards would clearly assist with that ‘price discovery’ process. Indeed, this view is well supported by the recent consumer preference survey where almost 70% respondents favoured such price boards.
Report on Study into Hong Kong’s Auto-fuel Market11
Prevalence and complexity of discounts
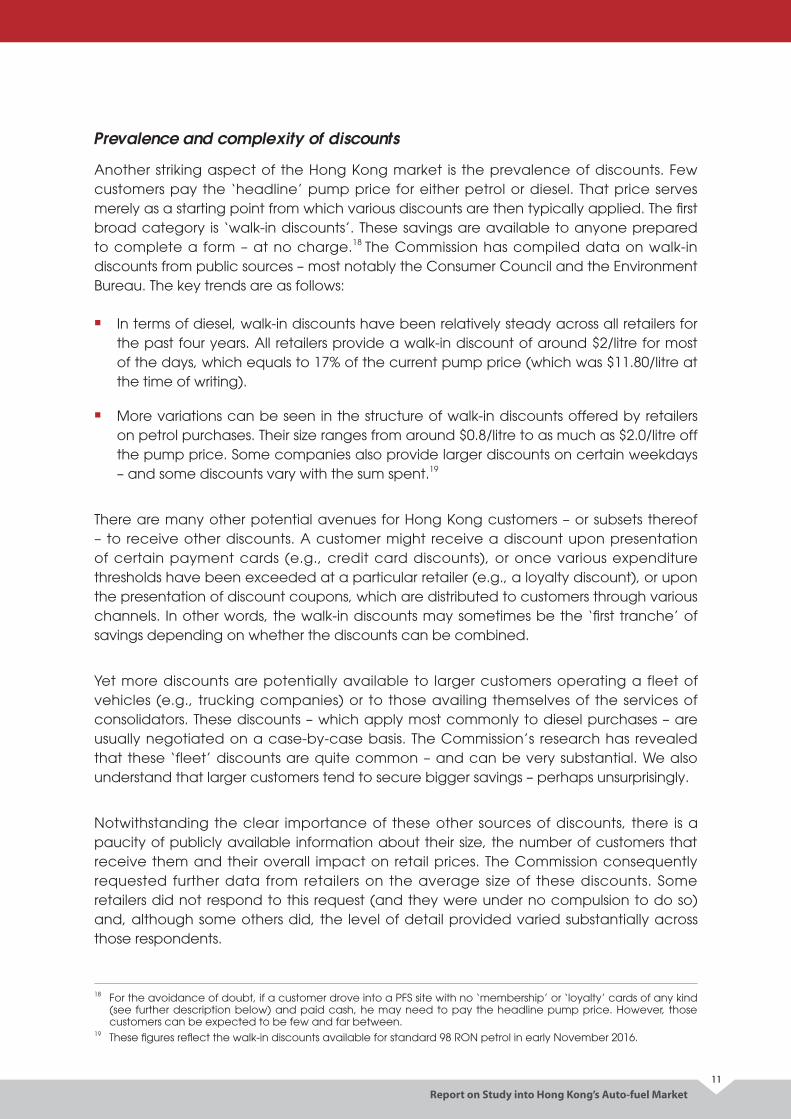
Another striking aspect of the Hong Kong market is the prevalence of discounts. Few customers pay the ‘headline’ pump price for either petrol or diesel. That price serves merely as a starting point from which various discounts are then typically applied. The first broad category is ‘walk-in discounts’. These savings are available to anyone prepared to complete a form – at no charge.18 The Commission has compiled data on walk-in discounts from public sources – most notably the Consumer Council and the Environment Bureau. The key trends are as follows:
g In terms of diesel, walk-in discounts have been relatively steady across all retailers for the past four years. All retailers provide a walk-in discount of around $2/litre for most of the days, which equals to 17% of the current pump price (which was $11.80/litre at the time of writing).
g More variations can be seen in the structure of walk-in discounts offered by retailers on petrol purchases. Their size ranges from around $0.8/litre to as much as $2.0/litre off the pump price. Some companies also provide larger discounts on certain weekdays – and some discounts vary with the sum spent.19
There are many other potential avenues for Hong Kong customers – or subsets thereof – to receive other discounts. A customer might receive a discount upon presentation of certain payment cards (e.g., credit card discounts), or once various expenditure thresholds have been exceeded at a particular retailer (e.g., a loyalty discount), or upon the presentation of discount coupons, which are distributed to customers through various channels. In other words, the walk-in discounts may sometimes be the ‘first tranche’ of savings depending on whether the discounts can be combined.
Yet more discounts are potentially available to larger customers operating a fleet of vehicles (e.g., trucking companies) or to those availing themselves of the services of consolidators. These discounts – which apply most commonly to diesel purchases – are usually negotiated on a case-by-case basis. The Commission’s research has revealed that these ‘fleet’ discounts are quite common – and can be very substantial. We also understand that larger customers tend to secure bigger savings – perhaps unsurprisingly.
Notwithstanding the clear importance of these other sources of discounts, there is a paucity of publicly available information about their size, the number of customers that receive them and their overall impact on retail prices. The Commission consequently requested further data from retailers on the average size of these discounts. Some retailers did not respond to this request (and they were under no compulsion to do so) and, although some others did, the level of detail provided varied substantially across those respondents.
18 For the avoidance of doubt, if a customer drove into a PFS site with no ‘membership’ or ‘loyalty’ cards of any kind (see further description below) and paid cash, he may need to pay the headline pump price. However, those customers can be expected to be few and far between.
19 These figures reflect the walk-in discounts available for standard 98 RON petrol in early November 2016.
Report on Study into Hong Kong’s Auto-fuel Market
12
The information that we did receive was sufficient to highlight the significance of these discounts. However, the ‘gaps’ in the data mean that we cannot say for certain how they would affect the overall prices paid by customers, i.e., the incremental effect above and beyond the walk-in discounts, if any, described earlier. What we can say with more confidence is that the overall variety of discounts offered in Hong Kong is consistently more than those in the other international markets.
It has been suggested that this discounting conduct reflects a competitive market. It is argued that oil companies do not engage in competition over the headline prices, but they do compete by offering a wide range of discounts, including walk-in discounts, credit card discounts, loyalty discounts, coupons, etc. Consumers who enjoy the discounts benefit as the effective prices they pay are lower than they would have to pay without discounts.
The Commission is of the view that discounts are not a perfect substitute for price competition. Specifically, discounts are not offered to all buyers in a uniform way. They are in fact a form of price discrimination, and it is a common way in which businesses maximise their profits. It operates by way of offering the exact same product at different prices based on the supply/demand characteristics of each market segment, rather than the underlying supply/demand characteristics of the market as a whole.
The Commission finds the discount system in the local auto-fuel market complex and opaque, making it difficult for consumers to compare the effective or actual prices. The Commission wishes to point out that the prevalence of discounts in the market does not necessarily mean that competition is vigorous. Indeed, the Commission is of the view that the opacity of discounts alleviates the competitive pressure on the oil companies to compete on price.
The movement of prices
Hong Kong auto-fuel pump prices do not move very often. Although a widely-used measure of the wholesale price – the price in Singapore published by Platts (‘mean-of-Platts-Singapore or ‘MOPS’) – fluctuates daily, pump prices in Hong Kong usually remain at the same level for several days. This is unusual, compared to most markets, where pump prices often fluctuate daily. Of course, the frequency of changes in true retail prices will again be influenced by how often discounts change. However, these appear to move not too frequently as well.
Part of the explanation may lie in the fact that Hong Kong has no refining capacity and therefore must import all of its auto-fuel in large increments – generally in 30,000 tonne shipments. These large shipments of refined auto-fuel, purchased at one fixed price, provide supply for several weeks. Consequently, the input cost profile of a Hong Kong retailer is quite different to that facing an importer in, say, New York or Los Angeles where refined auto-fuel is piped in every day at a different daily price.
Report on Study into Hong Kong’s Auto-fuel Market13
However, it does not offer a complete explanation. If all retailers set their prices on a weighted/ moving average basis then, at some point in time, a company’s costs would have been below that average. In such circumstances, it appears unusual that no company perceives a competitive benefit in reducing its retail prices more quickly when product costs fall. Accordingly, the widespread practice of ‘smoothing’ fluctuations in input costs when setting retail prices may indicate a lack of effective competition between Hong Kong retailers.
Another curious feature of Hong Kong’s prices is that they move in sync across geographic regions. It is unusual to observe complete pricing symmetry across a geographic location of comparable size to Hong Kong. In most international markets, prices do vary geographically – sometimes significantly. One might therefore expect to observe different prices in different local areas in Hong Kong due to the variations in demand and supply.
This lack of geographic price variation could, again, indicate a lack of vigorous competition between retailers. Alternatively, it could simply be symptomatic of the Hong Kong market. That is, whilst there is little or no geographic price variation, there is an atypical degree of price variation across customers, through the discount schemes. This approach to pricing may be the most effective retail strategy in Hong Kong, where locking-in repeat business from large commercial diesel and petrol customers through loyalty schemes may be critical for all retailers.
Finally, there is no evidence that retailers are increasing their retail margins by passing-through increases in import costs more quickly than reductions, i.e., engaging in ‘rockets and feathers’ pricing. Rather, the analysis undertaken by the Commission has shown that the timing of price changes in response to movements in input cost is broadly symmetric for both petrol and diesel.
Retail margins
The level of retail margins prevailing in a market can potentially provide a further indication of the level of competition. Unfortunately, the Commission does not have reliable data on several key factors that are necessary to arrive at robust estimates of retail margins. The only margin that can be calculated with any precision is retailers’ ‘gross margin’. This margin shows the per-litre revenue stream that retailers are receiving, from which they must cover all their costs after allowing for product costs and taxes.
$0.00
$2.00
$4.00
$6.00
$8.00
$10.00
$12.00
$14.00
$16.00
2005Petrol
2016 2005Diesel
2016
$3.00
$12.06
$2.1572%
$3.00
$6.06
$5.15
$14.77
$3.56
$6.06$2.86
$7.23
$3.26
$3.03
$11.45
$8.42
$1.11
Government duty Product cost Gross margin
$5.16158%
Gross MarginMust Fund:• Discounts• Operational costs• Land & construction costs• Net margin
Report on Study into Hong Kong’s Auto-fuel Market
14
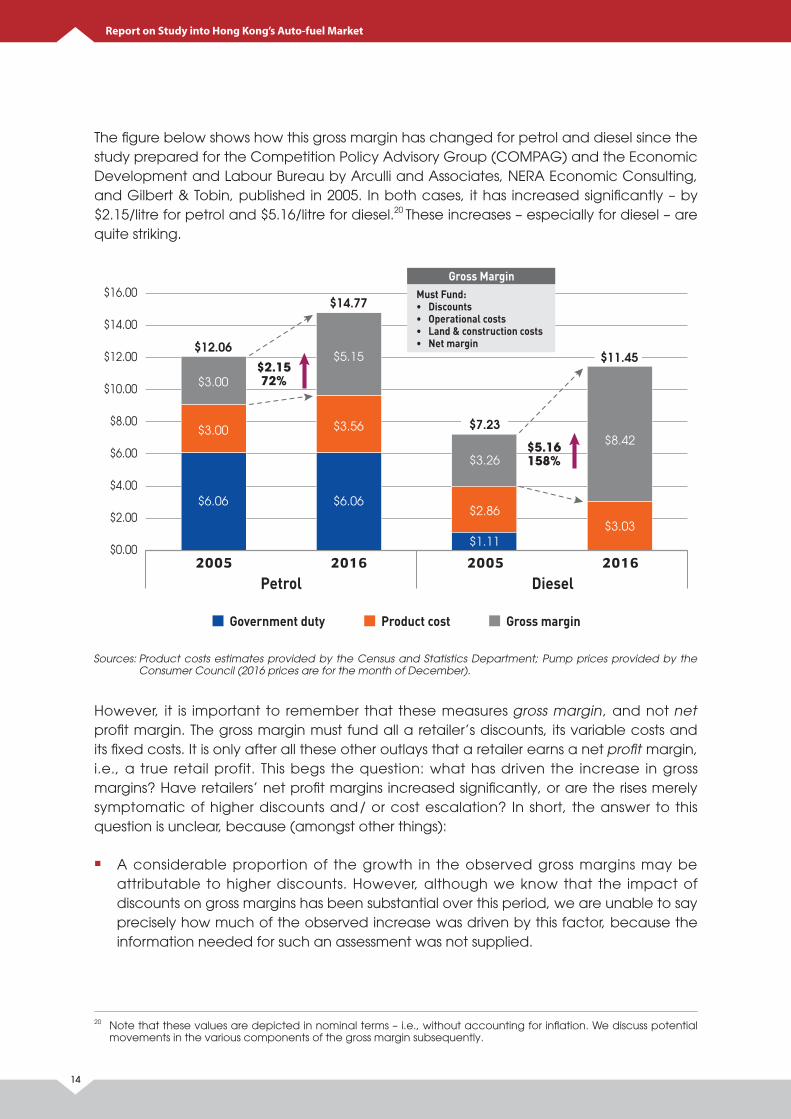
The figure below shows how this gross margin has changed for petrol and diesel since the study prepared for the Competition Policy Advisory Group (COMPAG) and the Economic Development and Labour Bureau by Arculli and Associates, NERA Economic Consulting, and Gilbert & Tobin, published in 2005. In both cases, it has increased significantly – by $2.15/litre for petrol and $5.16/litre for diesel.20 These increases – especially for diesel – are quite striking.
Sources: Product costs estimates provided by the Census and Statistics Department; Pump prices provided by the Consumer Council (2016 prices are for the month of December).
However, it is important to remember that these measures gross margin, and not net profit margin. The gross margin must fund all a retailer’s discounts, its variable costs and its fixed costs. It is only after all these other outlays that a retailer earns a net profit margin, i.e., a true retail profit. This begs the question: what has driven the increase in gross margins? Have retailers’ net profit margins increased significantly, or are the rises merely symptomatic of higher discounts and/ or cost escalation? In short, the answer to this question is unclear, because (amongst other things):
g A considerable proportion of the growth in the observed gross margins may be attributable to higher discounts. However, although we know that the impact of discounts on gross margins has been substantial over this period, we are unable to say precisely how much of the observed increase was driven by this factor, because the information needed for such an assessment was not supplied.
20 Note that these values are depicted in nominal terms – i.e., without accounting for inflation. We discuss potential movements in the various components of the gross margin subsequently.
Report on Study into Hong Kong’s Auto-fuel Market15
g The cost of PFS land has more than doubled during this period, i.e., the average tender price has gone up by 117%. It is conceivable that a substantial proportion of this increase is attributable primarily to a general upward trend in all land prices throughout Hong Kong over this period, which must ultimately flow-through to auto-fuel prices, e.g., The Price Indices of Private Domestic published by the Rating and Valuation Department indicates that the residential prices have increased by around 210% since 2005.
We therefore cannot rule out the possibility that the observed rises in gross margins are largely or wholly attributable to benign factors (i.e., the increases in discounts and/ or costs). We reflect more upon these data limitations in the recommendations presented subsequently.
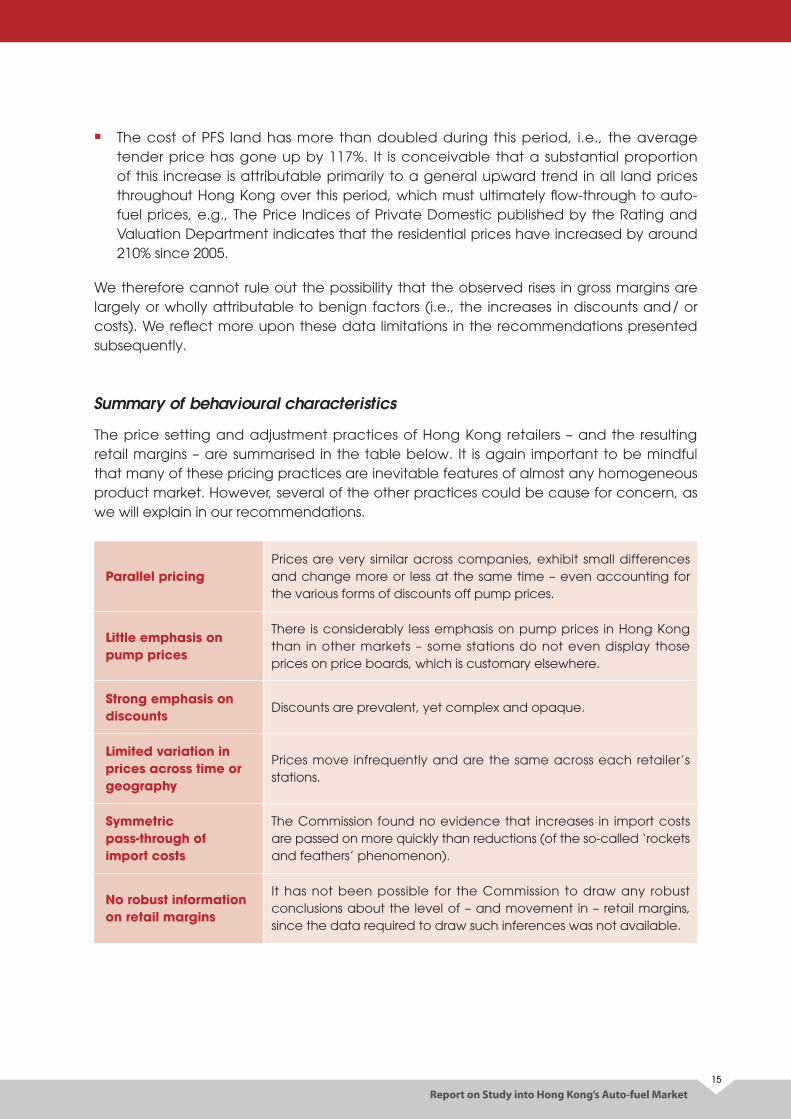
Summary of behavioural characteristics
The price setting and adjustment practices of Hong Kong retailers – and the resulting retail margins – are summarised in the table below. It is again important to be mindful that many of these pricing practices are inevitable features of almost any homogeneous product market. However, several of the other practices could be cause for concern, as we will explain in our recommendations.
Parallel pricingPrices are very similar across companies, exhibit small differences and change more or less at the same time – even accounting for the various forms of discounts off pump prices.
Little emphasis on pump prices
There is considerably less emphasis on pump prices in Hong Kong than in other markets – some stations do not even display those prices on price boards, which is customary elsewhere.
Strong emphasis on discounts
Discounts are prevalent, yet complex and opaque.
Limited variation in prices across time or geography
Prices move infrequently and are the same across each retailer’s stations.
Symmetric pass-through of import costs
The Commission found no evidence that increases in import costs are passed on more quickly than reductions (of the so-called ‘rockets and feathers’ phenomenon).
No robust information on retail margins
It has not been possible for the Commission to draw any robust conclusions about the level of – and movement in – retail margins, since the data required to draw such inferences was not available.
Report on Study into Hong Kong’s Auto-fuel Market
16
RecommendationsOur analysis has highlighted several impediments to further competition in the Hong Kong auto-fuel market. Some of these are structural in nature and others relate to the way retailers set prices, and the difficulties customers have in comparing them.
Short-term options
In the Commission’s opinion, there are four reforms that could be undertaken almost immediately and which may serve to enhance competition with relatively little downside risk. The first is to promote greater choice for consumers by simply mandating the sale of alternative cheaper products like 95 RON octane petrol.
As we explained earlier, the Commission is not persuaded by retailers’ claims that they sell only 98 RON petrol because that is all that customers want to buy. Indeed, our view is well supported by the recent consumer preference survey where a vast majority (86.2%) of the respondents said that they are likely to switch to the petrol with lower octane level than 98 RON petrol if it is 10% cheaper, while close to half (45.7%) of the respondents will definitely / are very likely to make the switch. Also, another survey on car types in Hong Kong confirmed that more than 99% of the petrol engine cars sampled can use 95 RON petrol. According to many experts, the difference in performance relative to 95 RON petrol is negligible for most modern cars. We consider that many consumers might purchase 95 RON petrol, if given the option. Indeed, it is commonly sold in other international markets – much more so than 98 RON petrol. In fact, the Commission understands that the Government had written to oil companies in 2010 encouraging them to supply petrol of different octane numbers to the Hong Kong market.
Although there may be challenges to overcome, the Government should consider whether mechanisms are available to mandate the re-introduction of 95 RON petrol in some way. For example, offering 95 RON petrol could be made a condition of lease of PFS site. Such supply might be conditional upon there being sufficient space, or it might not. If there was no such conditionality, 95 RON petrol would then be the ‘default’ fuel option at those sites and 98 RON would then become an ‘optional’ premium product – supplied only if there is space. Alternatively, the Government could specify that particular sites which are put up for tender should supply 95 RON exclusively.
Any requirement to offer 95 RON petrol would need to also consider how any additional terminal storage requirements would be met. The potential options here include two of those listed subsequently in Recommendation 5, e.g., a Government-owned open-access facility, or a facility operated by a third-party and offered to ‘all-comers’. All the potential challenges associated with those options that were raised below would apply equally here, and would need to be addressed if this course of action were to be pursued.
Report on Study into Hong Kong’s Auto-fuel Market17
Of course, there remains yet another alternative – if enough demand for 95 RON petrol is generated by car owners in Hong Kong, oil companies will have to consider ways to meet this demand and one possibility would be to withdraw one of the two varieties of 98 RON petrol to make way for 95 RON petrol at least in some of their PFS sites.
The Commission is also of the view that re-introducing 95 RON petrol will not only provide more and likely cheaper options to drivers, it may also put competitive pressure on the sales of existing 98 RON petrol, possibly leading to lower prices and benefiting those consumers who will choose to continue to use 98 RON petrol.
RECOMMENDATION 1
The Government should facilitate the re-introduction of 95 RON petrol by considering making it a lease condition for new PFS sites or those sites which are up for re-tender and exploring various terminal storage options.
The second short-term reform concerns the processes surrounding the designation and conversion of sites for PFS use. Demand for auto-fuel has grown considerably over the past decade (net imports of unleaded petrol are up by around 50%) but yet there are only eight more PFS sites today than there were in 2005 (an increase of less than 5%). This discrepancy is conspicuous. It suggests that the process by which land is earmarked for PFS sites is not functioning effectively and that it remains too difficult to convert privately-held land to PFS use.
If the processes for the designation and conversion of sites for PFS use could be reformed so that more are made available when overall demand is increasing, then this could reduce barriers to entry. Presently, this structural characteristic may be serving as an impediment to additional competition.
RECOMMENDATION 2
The Government should enable more sites for PFS use to be tendered and/or converted.
Thirdly, with the leases of 28 PFS sites expiring in 2018, this is an opportune time for the Government to review the tendering system for such sites with a view to introducing more competition to the Hong Kong auto-fuel market. Back in 2000, the Government introduced a laudable new tendering arrangement that allowed firms with no import licences to bid for PFS sites and also enabled them to submit “super bids” to gain a critical mass of stations within a short time to better compete with incumbents. In light of the findings in this study, the Commission is of the view that there is room for
Report on Study into Hong Kong’s Auto-fuel Market
18
further enhancements and the timing is right for the Government to engage different stakeholders in such a review. Indeed, there have been no shortage of suggestions from different quarters on alternative ways of tendering for PFS sites over the years. For example, the Government had been asked to consider applying a system similar to how Liquefied Petroleum Gas (LPG) suppliers bid for LPG filling stations to PFS.
RECOMMENDATION 3
The Government should engage different stakeholders and initiate a review of the tendering system for PFS sites.
Fourthly, every PFS site in Hong Kong should display its current headline prices and walk-in discounts on a prominent price board that can be easily read by passing motorists. Without such boards, a motorist will be deprived of an easy and direct way of knowing the pump prices and the walk-in discounts being offered by different stations – including during those crucial windows of time when prices are moving.
The Commission acknowledges that it may still be difficult for customers to gauge perfectly the price differentials across retailers if the existing complex discounting regimes persist. However, ‘difficult’ is clearly preferable to ‘impossible’. In our view, the potential benefit of enabling customers to ‘shop around’ more easily justifies any additional costs that retailers would need to incur erecting boards at those sites that do not currently have them. Moreover, the risk of facilitating greater price coordination is minimal, given the prevalence of discounting.
Again, the recent consumer preference survey indicated that almost 70% of respondents supported the display of price information on prominent boards at auto-fuel stations.
RECOMMENDATION 4
The auto-fuel retailers should display the prevailing pump prices and walk-in discounts for their petrol and diesel products on prominent boards that can be read by passing motorists at every PFS site.
Longer-term options
Substantial enhancements in competition between retailers are unlikely to occur in the longer-term unless it is easier for smaller firms – including new entrants – to source competitively priced imports and terminal storage. Indeed, the existing competitive norms (e.g., the emphasis on discounts, the ‘smoothing’ of prices, the exclusive sale of 98 RON octane petrol, etc.) are most likely to be challenged by a new entrant, or a smaller competitor with fewer ‘existing profits’ at stake.
Report on Study into Hong Kong’s Auto-fuel Market19
However, the opportunities for that kind of entry and expansion are limited at present. Building terminal storage or renting it from existing owners may simply not be feasible, for the reasons we discussed earlier. Yet, without it, entrants are forced to buy their fuel from other retailers, placing them at a significant competitive disadvantage. The Government may therefore wish to explore alternative ways of providing economically priced terminal storage, to enable new entrants to import their own supplies of auto-fuel. The potential options include:
g introducing an access regime whereby companies with existing terminal facilities are required to allow third parties access to those facilities on regulated terms, subject to capacity being available; or
g introducing a new ‘open access’ facility that might be built and operated by a third party – the Government could put the proposal to tender, and mandate criteria such as the price that the operator would offer to retailers.
To be sure, a multitude of potential considerations would need to be considered before any of these options was implemented, including:
g each of the options would entail considerable additional costs (e.g., designing, consulting upon and administering the approach) and many of these would fall upon the Government ;
g questions would need to be resolved as to how firms would co-mingle and ‘share’ products in any ‘shared’ facility – this raises complex questions about quality and liability;
g if an access regime is introduced, it would be necessary to define when capacity was ‘available’ and when it was not, which would be challenging and could give rise to opportunities for strategic conduct; and
g entrants may still be at a distinct cost disadvantage even with terminal storage – at least initially – since shipping costs vary considerably with the size of the tanker and they are unlikely to be able to justify 30,000 tonne shipments.
For the avoidance of doubt, the Commission is not recommending that the Government necessarily pursue any of these options21 – indeed, the factors set out above (and many others that are not listed) could well mean that the costs outweigh the benefits. We are simply suggesting that there could be merit in exploring them in more detail, since significant changes to the competitive landscape of the retail market are unlikely to occur whilst the upstream structural barriers to obtaining economically-priced imports persist.
21 Indeed, we note that the COMPAG 2005 Study examined each of these options – albeit only briefly – and chose not to recommend them. See: COMPAG 2005 Study, p.82.
Report on Study into Hong Kong’s Auto-fuel Market
20
The exploration of options might even look beyond the terminal storage level to alternative sources of supply. For example, given Hong Kong's proximity to the Mainland, it may be possible for fuels to be imported via a pipeline that could be constructed from Shenzhen to Hong Kong – with a bonded warehouse situated along the border on the Hong Kong side. There again seems to be no obvious downside to exploring whether these alternative ‘structural’ solutions might serve to deliver long-term benefits in the form of increased retail competition that outweigh their costs.
If any of the options set out above could make it easier for new entrants to acquire access to economically priced imports, the more likely it is that significant change will be seen in the retail market. For instance, reducing this structural barrier to entry could lead to different pricing approaches (e.g., less emphasis on discounting) and more product differentiation. For example, a new entrant may be more inclined than the incumbent retailers to offer 95 RON octane petrol as a cheaper alternative to the existing premium products.
RECOMMENDATION 5
The Government should explore whether potential ‘structural’ reform options – such as various interventions at the terminal storage and alternative source of auto-fuel supply, could deliver benefits through increased retail competition that outweigh the attendant costs and risks.
Finally, another long-term recommendation is more general in nature and concerns the way in which market studies are undertaken. Presently, the Commission does not have the power to compel parties to produce information when conducting such studies. We must rely instead on their willingness to cooperate. The potential problem this creates has been self-evident throughout this report. We did not always receive the data we requested from parties, and the resulting ‘gaps’ have prevented us from undertaking some analyses with the degree of rigour required to draw robust inferences – the assessment of retail margins being the clearest example.
At present, 58 out of 60 competition authorities (over 96%)22 which carry out market studies, enjoy some sort of power to request information. Power includes authorization provided by law to competition authorities to request information to be provided by stakeholders, whether such authorization is expressed on general (‘to protect competition’) or specific terms (‘for the purpose of carrying out market studies’). The ability to exercise such powers have been found to be vital to many important studies which have been undertaken and led to positive changes in relevant markets.
22 OECD (2016), The Role of Market Studies as a Tool to Promote Competition, p.12. Available here.
Report on Study into Hong Kong’s Auto-fuel Market21
Future market studies would therefore be assisted if the Commission has compulsory information gathering powers so that the same problems do not recur. After all, the purpose of such studies is to obtain information about how a market functions to see whether potential problems exist. If businesses can simply refuse to provide it, that can serve to undermine that fundamental objective. Provided sensible limits are placed upon what the Commission can ask for and how it is reported, we believe that parties should be compelled to furnish the information required to undertake the relevant analyses.
RECOMMENDATION 6
The Commission should be provided with information gathering powers that would compel the production of materials when undertaking future market studies, provided no undue burden is placed on those parties and confidentiality is protected appropriately.
Report on Study into Hong Kong’s Auto-fuel Market
22
1. INTRODUCTION
1.1 This report summarises the findings of the Hong Kong Competition Commission’s (Commission) study of the local auto-fuel market. Throughout the world, auto-fuel prices attract considerable public attention – and Hong Kong is no exception. Changes in petrol and diesel prices resonate throughout the economy, affecting everybody. There are obvious and immediate effects on private and commercial drivers at the pump, but there are countless indirect effects as well (e.g., fuel prices influence the costs of moving goods and of providing public transport services).
1.2 Given the vital role that auto-fuels play in day-to-day life, it is important for the markets in which they are supplied to be functioning well. Indeed, the main objective of market studies conducted by competition agencies is to determine the state of competition in relevant markets. News reports highlighting that petrol prices in Hong Kong are the highest in the world have brought the state of competition in the local auto-fuel market into even sharper focus. However, there is a danger of only searching for signs of anti-competitive conduct as an explanation for these high prices and overlooking a number of structural and behavioural issues that may have been undermining competition.
1.3 Competition authorities around the world have studied their respective auto-fuel markets at length. Many of these studies have highlighted common issues in different markets but the Commission is of the view that the Hong Kong market has a number of features that have not generally been seen elsewhere. These features are not only highly unusual but also go to the heart of the issue of whether our city has a competitive auto-fuel market.
1.4 It is important to take note that this market study is not conducted as part of an investigation, and therefore the Commission does not have compulsory information gathering powers at its disposal and has to rely heavily on stakeholders’ willingness to provide information and materials gathered from the public domain. For the purpose of this report, the Commission has requested oil companies to provide information on a voluntary basis. While it is acknowledged that co-operation was generally forthcoming, there was some information that could not be obtained. In spite of this, the Commission is confident that this report provides an accurate and balanced overview of the sector.
1.5 This report identifies a number of issues which the Commission believes to be responsible for hindering competition and which would likely have contributed to high auto-fuel prices in Hong Kong. The report then goes on to make recommendations on how to address these issues. With public support, many of these proposed changes should not take long to implement. Indeed, some should be implemented immediately. The fact that the Government will be re-tendering a number of petrol filling station (PFS) sites, the leases of which are expiring in 2018, creates the perfect impetus for adding more competitive dynamics to the market.
Report on Study into Hong Kong’s Auto-fuel Market23
Our analytical framework 1.6 Our market study has focused on two separate but related matters: the structural
features of the auto-fuel market, and the conduct and performance of its participants. The market structure is the ‘arena’ in which commerce takes place. Some key structural characteristics include the number of buyers and sellers; the products that are bought and sold; the various functional levels of the supply chain and the ease with which new firms can enter and expand.
1.7 The nature of this ‘arena’ can have a considerable bearing upon the degree of competition that is observed within it. Competition problems can often be traced back to a structural characteristic that is hindering rivalry (e.g., a substantial barrier to entry). In this study, we have examined the existing structure of the Hong Kong market and considered whether any of its features may be having such an effect. For example, we have explored (amongst other things):
(a) the challenges that retailers – including new entrants – face obtaining PFS sites and securing access to terminal storage facilities;
(b) the petrol offered – ‘standard’ and ‘super’ 98 RON – which has a higher octane rating than the standard fuels offered in most other countries;23 and
(c) the demand for auto-fuel, which is influenced by Hong Kong’s unique topography and the existence of excellent public transport options.
1.8 Once the overall market structure has been assessed, the logical next step is to gauge the way in which market participants are behaving within that arena. Certain types of conduct – or market outcomes – can signal potential competition problems, buttressing any concerns identified in a structural assessment. There are several behavioural features of the Hong Kong market that appear to be atypical, internationally. These include, but are not limited to:
(a) the choice by some retailers to not display pump prices on visible price boards at all their sites – even though such boards may be in place;
(b) the almost ubiquitous nature of petrol and diesel discounts, and the complex way they are often structured; and
(c) the ‘smoothing’ of prices over time (i.e., retailers do not immediately pass on import cost changes) and geography (i.e., prices are the same everywhere).
1.9 In this study, we have considered whether these unusual characteristics are attributable simply to the unique features of the Hong Kong market, or whether they may be cause for concern. We have also attempted to measure retail margins. However, a paucity of reliable information – particularly regarding the discounts that retailers are offering – has prevented us from drawing any firm conclusions on this point. We reflect more on those informational challenges shortly.
23 In most other countries, 98 RON is considered a premium fuel that is either offered alongside a cheaper alternative (e.g., 91 RON), or not at all.
Report on Study into Hong Kong’s Auto-fuel Market
24
Our approach to the study 1.10 We have not started this study with a ‘blank sheet of paper’. A considerable amount
of research has already been undertaken into the Hong Kong auto-fuel market by other parties – some of it quite recently. Some of the key analyses include:
(a) a study by the Hong Kong Consumer Council (“Consumer Council 2016 Study”)24. The study published in 2016 reported fresh findings on asymmetric pass-through as well as estimates of profitability;
(b) a study by the Hong Kong Consumer Council published in 2015 (“Consumer Council 2015 Study”)25. The study focused on the relationship between the price of crude oil and retail auto-fuel prices in Hong Kong. The aim of the study was to verify claims of asymmetric pass-through;
(c) a study prepared for the Competition Policy Advisory Group (COMPAG) and the Economic Development and Labour Bureau by Arculli and Associates, NERA Economic Consulting, and Gilbert & Tobin published in 2005 (“COMPAG 2005 Study”)26. The study examined whether there was evidence of coordination in Hong Kong’s retail auto-fuel market; and
(d) a study by the Hong Kong Consumer Council published in 2000 (“Consumer Council 2000 Study”)27. The study included a wealth of institutional detail, an assessment of competition and various proposals for reform. Some of the proposed measures were subsequently implemented.
1.11 Rather than revisiting all the topics that have been covered in this earlier work, the Commission has focused on the key developments since the last comprehensive market analysis – the COMPAG 2005 Study. We have also reviewed similar studies of auto-fuels markets in other jurisdictions, including:
(a) the policy roundtable on Competition in Road Fuel published by the OECD in 2013 (“OECD Report”),28 which drew on experiences in thirty-one countries;
(b) the Competition Commission of Singapore’s (CCS) report on the retail petrol market in Singapore (2011)29 and a subsequent update (2016);30
(c) the United Kingdom (UK) Office of Fair Trading’s (OFT) report on the UK petrol and diesel sector (2013)31; and
(d) the German Federal Cartel Office’s (Bundeskartellamt or BKartA) fuel sector inquiry report (2011).32
24 Consumer Council (2016), Report on Auto-fuel Price Monitoring 2016. Available here. 25 Consumer Council (2015), Auto-fuel Price Monitoring Analysis. Available here. 26 Economic Development and Labour Bureau (2005), Study of the Auto-fuel Retail Market. Available here.27 Consumer Council (2000), A study of Motor Gasoline, Diesel and LPG Markets in Hong Kong. Available here. 28 OECD (2013), Policy Roundtables Competition in Road Fuel. Available here. 29 Competition Commission of Singapore (2011), Inquiry into Retail Petrol Market in Singapore. Available here.30 Competition Commission of Singapore (2016), Interim findings from CCS’s retail petrol study. Available here.31 Office of Fair Trading (2013), UK petrol and diesel sector: an OFT call for information. 32 Federal Cartel Office (2011), Fuel sector inquiry (report summary in English) and Sektoruntersuchung Kraftstoffe (full
report in German).
Report on Study into Hong Kong’s Auto-fuel Market25
1.12 Moreover, the Commission commissioned the Social Science Research Centre of The University of Hong Kong to carry out two extensive studies in order to gather ‘demand-side’ information from the consumers’ perspectives:
(a) a consumer preference survey was conducted in 2017 during which 625 interviews were successfully completed with 82,032 telephone numbers attempted; and
(b) a car type survey was conducted in 2017 during which 3,053 petrol-powered car models were sampled in 5 different locations across Hong Kong on both weekdays and weekends.
1.13 The Commission also interacted with numerous stakeholders throughout this study, including the government, auto-fuel retailers, trade associations, public bodies, the academia and experts. We also sought data on auto-fuel prices and discounts, and on input costs. In some cases, reliable data were available from public sources but, in others, they resided only with the retailers. The information requested was not always provided, which has limited our ability to complete analyses of discounts and retail margins.33
Structure of this report 1.14 The remainder of this report is structured as follows:
(a) chapter 2 addresses two common perceptions about auto-fuel pricing that we encountered repeatedly throughout our interactions with stakeholders;
(b) chapter 3 provides an overview of the market structure, including features that could be serving to limit the degree of competition;
(c) chapter 4 examines the behaviours of market participants – including pricing and discounting practices – and certain market outcomes; and
(d) chapter 5 recommends some potential initiatives that can promote competition in the short- and longer-term.
1.15 Some more detailed information pertaining to certain analyses set out in the body of this report is also provided in a series of appendices.
33 The Commission does not have the power to compel the production of such information when conducting a market study – we must rely instead on the relevant parties’ willingness to cooperate. The resulting ‘gaps’ in the data have prevented us from undertaking some analyses with the degree of rigour that would be required to draw robust inferences.
Report on Study into Hong Kong’s Auto-fuel Market
26
2. TWO COMMON PERCEPTIONS
2.1 Throughout the Commission’s interactions with stakeholders, two key themes emerged time and again: that prices are higher in Hong Kong than anywhere else and that they are always the same across companies. These two factors were widely perceived to be evidence of collusion amongst oil companies. Given the pervasiveness of those beliefs, it is worth pointing out that these two features on their own cannot be taken as hard evidence of anti-competitive conduct.
2.2 Hard evidence of anti-competitive conduct requires proof of an agreement or concerted action between competing suppliers, not just observably high or identical/ comparable prices. However, as this report outlines, even if there is no evidence of anti-competitive conduct, this does not mean that the auto-fuel market in Hong Kong is functioning as competitively as it should be.
High prices – the results of collusive behaviour or other factors?
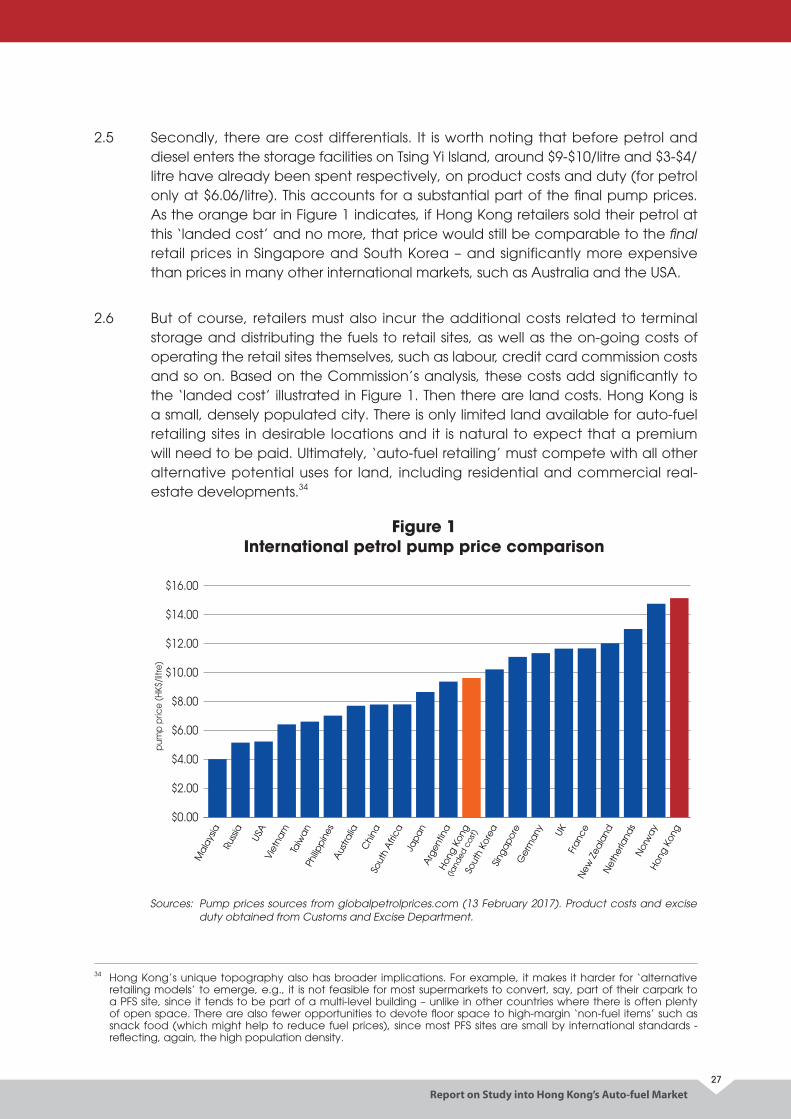
2.3 Figure 1 on the following page confirms that retail pump prices are indeed high in Hong Kong, relative to the rest of the world. However, in isolation, that is not conclusive evidence of collusion. High pump prices do not, by themselves, indicate that competition is ineffective or that retailers’ profits are excessive. In truth, simple comparisons of pump prices between markets reveal very little about their respective competitive dynamics. Markets with high ‘headline’ pump prices could entail more vigorous competition than those with lower prices if, for example:
(a) retailers in the market with the higher ‘headline’ pump prices are offering larger discounts to customers, reducing the effective retail price; and/ or
(b) there are significant differences between the costs that retailers are incurring to supply the products to each market.
2.4 Both of these considerations are highly germane in Hong Kong. As we explain in more detail subsequently, one can argue that very few Hong Kong customers pay the ‘headline’ pump prices for either petrol or diesel because of the ubiquitous discounts that are made available through different sources. The cumulative effect of those discounts could reduce the pump price by anything from $0.90/litre to $2/litre (or more) for petrol and from $2/litre to $5/litre (or more) for diesel. In other words, the effective retail prices that customers pay can be materially lower than advertised pump prices.
Ma
lays
iaRu
ssia
USA
Vie
tna
mTa
iwa
nPh
ilipp
ines
Aus
tralia
Chi
naSo
uth
Afri
caJa
pa
nA
rgen
tina
Hon
g Ko
ng
(land
ed c
ost)
Sout
h Ko
rea
Sing
ap
ore
Ger
ma
ny UKFr
anc
eN
ew Z
eala
ndN
ethe
rland
sN
orw
ay
Hon
g Ko
ng
$0.00
$2.00
$4.00
$6.00
$8.00
$10.00
$12.00
$14.00
$16.00
pum
p p
rice
(HK$
/litre
)
Report on Study into Hong Kong’s Auto-fuel Market27
2.5 Secondly, there are cost differentials. It is worth noting that before petrol and diesel enters the storage facilities on Tsing Yi Island, around $9-$10/litre and $3-$4/litre have already been spent respectively, on product costs and duty (for petrol only at $6.06/litre). This accounts for a substantial part of the final pump prices. As the orange bar in Figure 1 indicates, if Hong Kong retailers sold their petrol at this ‘landed cost’ and no more, that price would still be comparable to the final retail prices in Singapore and South Korea – and significantly more expensive than prices in many other international markets, such as Australia and the USA.
2.6 But of course, retailers must also incur the additional costs related to terminal storage and distributing the fuels to retail sites, as well as the on-going costs of operating the retail sites themselves, such as labour, credit card commission costs and so on. Based on the Commission’s analysis, these costs add significantly to the ‘landed cost’ illustrated in Figure 1. Then there are land costs. Hong Kong is a small, densely populated city. There is only limited land available for auto-fuel retailing sites in desirable locations and it is natural to expect that a premium will need to be paid. Ultimately, ‘auto-fuel retailing’ must compete with all other alternative potential uses for land, including residential and commercial real-estate developments.34
Figure 1 International petrol pump price comparison
Sources: Pump prices sources from globalpetrolprices.com (13 February 2017). Product costs and excise duty obtained from Customs and Excise Department.
34 Hong Kong’s unique topography also has broader implications. For example, it makes it harder for ‘alternative retailing models’ to emerge, e.g., it is not feasible for most supermarkets to convert, say, part of their carpark to a PFS site, since it tends to be part of a multi-level building – unlike in other countries where there is often plenty of open space. There are also fewer opportunities to devote floor space to high-margin ‘non-fuel items’ such as snack food (which might help to reduce fuel prices), since most PFS sites are small by international standards - reflecting, again, the high population density.
Report on Study into Hong Kong’s Auto-fuel Market
28
2.7 These traits all contribute to the high price observed in Figure 1. However, short of reducing duties (for petrol) and/ or somehow reducing land prices, little can be done to change that overall picture.
2.8 When it comes to the level of prices in Hong Kong, we have therefore not focused on how they compare with other countries but, rather, on whether there are other structural or behavioural factors driving them above the levels they need to be, given those market realities – a question we explore in subsequent chapters.
Parallel pricing versus price fixing2.9 Retail pump prices are almost always identical across Hong Kong retailers, and
move together. When one firm changes its pump prices, all others follow within one or two days, until they are all at the same level again – this is sometimes called ‘parallel pricing’. It is important to understand that this is an almost universal feature of homogeneous product markets. Irrespective of whether the firms are competing vigorously or coordinating their pricing, one would still expect to see very similar prices. Given that all the retailers are selling virtually identical products, it would be more puzzling if prices were not moving together.35 In isolation, the existence of broadly parallel pricing therefore reveals very little about the degree of competition.
(a) vigorous competition, e.g., price changes may mirror movements in underlying costs of supply, and retailers may be matching any price decreases to maintain sales volumes and any increases to restore margins; or
(b) price coordination, e.g., the extent of competition between firms may have waned over time, as they recognised their interdependence and fell into a routine of regular conduct, rather than competing vigorously.
2.10 In the Hong Kong context, when one talks about auto-fuel prices, it is also necessary to take into consideration the wide prevalence of discounting. This is because headline pump prices do not tell the whole story with respect to either price levels or movements. If pump prices do not move, but discounts do, then prices may be different across time and retailers. Pump prices can be deceiving, because:
(a) the true retail prices that customers pay might differ slightly across retailers, because of the effect of discounts – which can vary somewhat across firms (depending upon the customers) and throughout the week; and
35 For example, if the retail price at a PFS station was significantly and persistently higher than the price charged by a practically identical neighbouring station for the same product, that would be a most peculiar outcome. It would naturally beg the question: how is that retailer maintaining the higher price?
Report on Study into Hong Kong’s Auto-fuel Market29
(b) when one firm changes its discounts and other firms do not follow, or only after a significant delay, then true retail prices have not changed at the same time, i.e., final prices may not move perfectly in parallel.
2.11 To determine the degree of rivalry, it is therefore necessary to look beyond the mere similarity in pump prices and examine more closely the market’s underlying structural and behavioural characteristics. Only then can robust conclusions be drawn about the effectiveness of competition and whether potential concerns exist that might warrant some forms of market intervention. These underlying market dynamics are consequently the Commission’s core focus throughout the remainder of this market study.
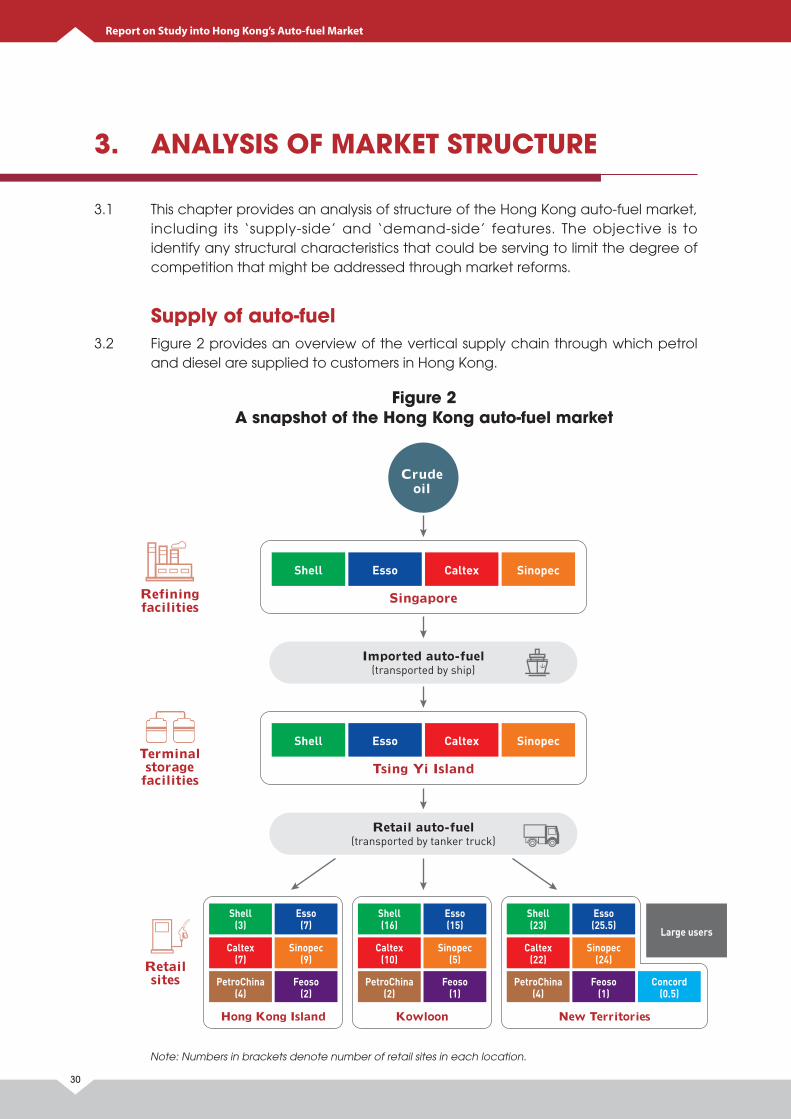
Report on Study into Hong Kong’s Auto-fuel Market
30
3. ANALYSIS OF MARKET STRUCTURE
3.1 This chapter provides an analysis of structure of the Hong Kong auto-fuel market, including its ‘supply-side’ and ‘demand-side’ features. The objective is to identify any structural characteristics that could be serving to limit the degree of competition that might be addressed through market reforms.
Supply of auto-fuel3.2 Figure 2 provides an overview of the vertical supply chain through which petrol
and diesel are supplied to customers in Hong Kong.
Figure 2 A snapshot of the Hong Kong auto-fuel market
Crudeoil
Singapore
Retailsites
Terminal storage
facilities
Refining facilities
Tsing Yi Island
Hong Kong Island Kowloon New Territories
Imported auto-fuel (transported by ship)
Shell Esso Caltex Sinopec
Shell Esso Caltex Sinopec
Retail auto-fuel (transported by tanker truck)
Large users
Shell(3)
Esso(7)
Caltex(7)
Sinopec(9)
PetroChina(4)
Feoso(2)
Shell(16)
Esso(15)
Caltex(10)
Sinopec(5)
PetroChina(2)
Feoso(1)
Shell(23)
Esso(25.5)
Caltex(22)
Sinopec(24)
PetroChina(4)
Feoso(1)
Concord(0.5)
Note: Numbers in brackets denote number of retail sites in each location.
Report on Study into Hong Kong’s Auto-fuel Market31
From the oil field to the station
3.3 Crude oil is the primary input into auto-fuel and its cost represents a major component of final retail prices. Oil is converted into auto-fuel in large, technically complex refineries. Hong Kong has no refineries36 and is consequently wholly dependent on imports of refined auto-fuel. These imports arrive principally from refineries in Singapore owned by the major retailers – nearly all by sea. Typically, the ‘vertically integrated’ retailers receive multiple shipments per month, in 30,000 tonne tankers capable of transporting different auto-fuels simultaneously. Upon arrival in Hong Kong, the fuel is stored in large ‘terminal storage’ tanks on Tsing Yi Island. Four companies own terminal storage facilities in this location – Shell, ExxonMobil (Esso), Chevron (Caltex) and Sinopec. PetroChina does not have terminal storage facilities and must therefore purchase a wholesale supply of fuel from the other ‘vertically integrated’ companies.37 Auto-fuel is then distributed from terminal storage by tanker trucks to retail auto-fuel stations around the clock.38
Retailing
3.4 Most auto-fuel in Hong Kong is sold through retail stations. Sites for stations are designated for that specific use by the government after the consideration of many factors, including potential demand, environmental impacts, and road and fire safety concerns (see Appendix B for more details). In theory, parcels of privately-owned land being used for other purposes can also be converted into PFS sites. However, the conversion process is arduous and time consuming (typically taking two to three years – and sometimes more than five) and, consequently, would likely give pause to potential new entrants.39
3.5 Most PFS are owned by the major retailers and pump prices are determined by them. Unlike some of the low-cost ‘self-service’ stations seen in other countries (e.g., stations operated by supermarkets), most of Hong Kong’s sites are ‘full-service’. Space restrictions has also been mentioned as a reason behind the limited revenue that can be generated from sales of ‘high-margin’ non-fuel items like snack food – nearly all revenue comes from fuel sales.
3.6 Three types of auto-fuel are currently imported into Hong Kong – ‘standard’ 98 RON unleaded petrol, ‘super’ 98 RON unleaded petrol40 and diesel. The 98 RON octane rating is uniformly higher than in most other markets, where it is considered a premium fuel and either offered alongside a cheaper alternative (e.g., 91 RON), or not at all. Currently all diesel sold is required to meet ‘Euro V’ standards.
36 Note that most of the local retailers are active in these stages of the supply chain elsewhere.37 Each has separate tanks for storing unleaded petrol, diesel and LPG as well as other products – and the businesses
can and do share storage space via borrow and loan agreements. 38 Trucking fleets may be company-owned or operator-owned, while the drivers are either contracted to the
company or engaged by the delivery contractor. Tanker trucks typically contain five or six separate compartments to facilitate the delivery of multiple products, e.g., standard and super 98 RON, and diesel. Some ‘high throughput’ stations may require several deliveries per day.
39 Note that approximately 30% of the existing PFS sites are privately owned.40 The Commission notes that there have been some claims that the ‘super’ variety of petrol on sale in Hong Kong
may be of a higher RON than 98 RON, however the Commission has not been able to verify this.
Report on Study into Hong Kong’s Auto-fuel Market
32
3.7 98 RON unleaded petrol was introduced to Hong Kong in October 1991. Prior to that, another lower octane grade of petrol, 95 RON leaded petrol was sold but it was substituted by 95 RON unleaded petrol in April 1991. Between October 1991 and March 1992, both 95 RON and 98 RON unleaded petrol were available. 95 RON unleaded petrol was subsequently withdrawn from the market by all oil companies after being sold in the market for less than one year.
3.8 Retailers stated that their decision to sell only 98 RON petrol reflected customer preference. However, the plausibility of this explanation is questionable, since most modern cars can comfortably use 95 RON petrol. Hong Kong stands alone in the world where only such a top grade of petrol (in practical terms the most expensive) is available for motorists. Both the “standard” and “super” varieties of petrol on offer here are 98 RON. The Commission has found it difficult to establish how the current one-product situation came about more than 20 years ago. That it was said to be reflective of consumer demand has made it all the more puzzling.
3.9 To put this in perspective, 95 RON can be used in most cars with the exception of a very few luxurious and high performance models. In Singapore, for example, the 98 RON petrol price is around 15% higher than that of 95 RON petrol41 and the market share of 95 RON is over 50%42. As shown by a consumer preference survey43, a vast majority (86.2%) of the respondents in Hong Kong indicated that they are likely to switch to petrol with lower octane level than 98 RON petrol if it is 10% cheaper, while close to half of the respondents (45.7%) will definitely / are very likely to make the switch. Furthermore, in another survey44 conducted on the car types in Hong Kong, it was shown that more than 99% of the petrol engine vehicles sampled could use 95 RON petrol, and only around 15% are recommended to use 98 RON.
3.10 PFS sites themselves are leased to suppliers for 21-year periods via a tendering system. Securing land is expensive. For example, the COMPAG 2005 Study estimated that land costs accounted for just over $1/litre for both petrol and diesel sales. Since July 2000, various changes have been made to the tendering arrangements for PFS sites, each designed to lower entry barriers. For example, PFS sites are now leased in batches of up to five at a time, rather than one-by-one, and firms may lodge ‘super’ bids to lease all the stations together.45
41 The price differential percentage is the average of the data on 10/4/2017 or 11/4/2017 from 4 major auto-fuel retailers in Singapore.
42 Competition Commission of Singapore (2011), Inquiry into Retail Petrol Market in Singapore, p. 6. Available here.43 The Commission commissioned the Social Science Research Centre of The University of Hong Kong to conduct the
survey in 2017 during which 625 interviews were successfully completed.44 The Commission commissioned the Social Science Research Centre of The University of Hong Kong to conduct the
survey in 2017 during which 3,053 petrol-powered vehicles were sampled in 5 different locations across Hong Kong on both weekdays and weekends.
45 In addition, all PFS sites are now made available for re-tender upon expiry of the 21-year lease, instead of rolling these over as was previously the case. There are also fewer restrictions on whom may submit tenders, e.g. there is no need to hold a Special Import Licence, or a supply contract with a licence holder.
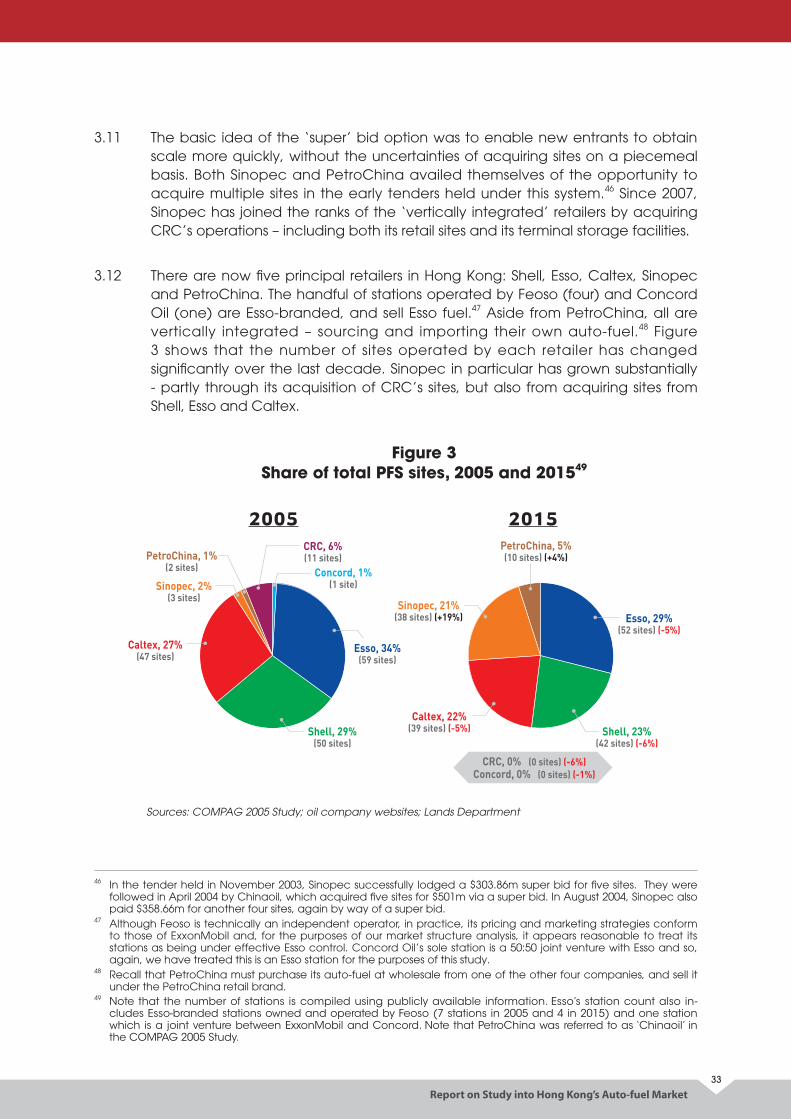
Report on Study into Hong Kong’s Auto-fuel Market33
3.11 The basic idea of the ‘super’ bid option was to enable new entrants to obtain scale more quickly, without the uncertainties of acquiring sites on a piecemeal basis. Both Sinopec and PetroChina availed themselves of the opportunity to acquire multiple sites in the early tenders held under this system.46 Since 2007, Sinopec has joined the ranks of the ‘vertically integrated’ retailers by acquiring CRC’s operations – including both its retail sites and its terminal storage facilities.
3.12 There are now five principal retailers in Hong Kong: Shell, Esso, Caltex, Sinopec and PetroChina. The handful of stations operated by Feoso (four) and Concord Oil (one) are Esso-branded, and sell Esso fuel.47 Aside from PetroChina, all are vertically integrated – sourcing and importing their own auto-fuel.48 Figure 3 shows that the number of sites operated by each retailer has changed significantly over the last decade. Sinopec in particular has grown substantially - partly through its acquisition of CRC’s sites, but also from acquiring sites from Shell, Esso and Caltex.
Figure 3 Share of total PFS sites, 2005 and 201549
Sources: COMPAG 2005 Study; oil company websites; Lands Department
46 In the tender held in November 2003, Sinopec successfully lodged a $303.86m super bid for five sites. They were followed in April 2004 by Chinaoil, which acquired five sites for $501m via a super bid. In August 2004, Sinopec also paid $358.66m for another four sites, again by way of a super bid.
47 Although Feoso is technically an independent operator, in practice, its pricing and marketing strategies conform to those of ExxonMobil and, for the purposes of our market structure analysis, it appears reasonable to treat its stations as being under effective Esso control. Concord Oil’s sole station is a 50:50 joint venture with Esso and so, again, we have treated this is an Esso station for the purposes of this study.
48 Recall that PetroChina must purchase its auto-fuel at wholesale from one of the other four companies, and sell it under the PetroChina retail brand.
49 Note that the number of stations is compiled using publicly available information. Esso’s station count also in-cludes Esso-branded stations owned and operated by Feoso (7 stations in 2005 and 4 in 2015) and one station which is a joint venture between ExxonMobil and Concord. Note that PetroChina was referred to as ‘Chinaoil’ in the COMPAG 2005 Study.
Esso, 29%(52 sites) (-5%)
Shell, 23%(42 sites) (-6%)
Shell, 29%(50 sites)
Caltex, 22%(39 sites) (-5%)
Caltex, 27%(47 sites)
Sinopec, 21%(38 sites) (+19%)
Sinopec, 2%(3 sites)
PetroChina, 5%(10 sites) (+4%)PetroChina, 1%
(2 sites) Concord, 1%(1 site)
Esso, 34%(59 sites)
CRC, 6%(11 sites)
2005 2015
CRC, 0% (0 sites) (-6%)Concord, 0% (0 sites) (-1%)
Report on Study into Hong Kong’s Auto-fuel Market
34
Demand for auto-fuel3.13 In Hong Kong, there are, broadly speaking, two main groups of consumers.
The first is private vehicle owners. These consumers account for virtually all the demand for unleaded petrol in Hong Kong. The second category is commercial transport operators, which use diesel and, again, account for almost all demand. We consider each group of customers in turn below.
Demand for petrol: private vehicle owners3.14 Demand for unleaded petrol stems almost entirely from privately owned cars
and motorcycles.50 Few people drive cars. The city is dense, rendering car travel and parking inconvenient, particularly given the public transport options. As at December 2015, there were 521,852 licensed private cars in Hong Kong,51 or around 7 licensed private cars per 100 population52. This rate of ownership is very low compared to many other markets. For example:
(a) there were around 601,257 ‘cars & station-wagons’ in Singapore at the end of 201653 – or around 11 per 100 population;54
(b) the number of car registration was 221,916 in Manhattan in 201255 – or around 14 per 100 population;56
(c) there were 3,164,424 passenger vehicles in Tokyo in 201757 – or around 23 per 100 population;58 and
(d) there were more than 2.6 million privately owned cars registered to London residents as of 201259 – or around 31 per 100 population.60
3.15 Despite the low overall level of ownership, the number of licensed private cars in Hong Kong has grown steadily by 48.8% from 350,753 in 2005 to 521,852 in 2015. Net imports of unleaded petrol have also increased by approximately 51.1% – from around 450 million litres in 2005 to over 680 million litres in 2015. Demand for petrol has consequently been on a steady upward trajectory for the last decade – as evidenced by Figure 4 (we understand that the volatility seen between 2014 and 2015 is likely to be attributable to discrepancies in the reported data61).62
50 Around 99% of all petrol fuelled vehicles in Hong Kong are either private cars or motorcycles. 51 Census and Statistics Department (February 2017), Hong Kong Monthly Digest of Statistics, Table 10.5, p.231.
Available here.52 The population of Hong Kong as at mid-2015 was 7,305,700. Available here.53 See, Land Transport Authority, Singapore. Available here.54 The population of Singapore was around 5.61 million in 2016. Available here. 55 See, Wall Street Journal. Available here.56 The population of Manhattan was around 1.6 million in 2016. Available here.57 See, Automobile Inspection & Registration Information Association. Available here. 58 The population of Tokyo was around 13.5 million in 2015. Available here.59 See, London Economic Plan. Available here.60 The population of London was around 8.31 million in 2012. Available here. 61 The drop in retained motor gasoline imports in 2014 is likely due to the late declaration of shipments towards the
end of 2014. These would then have been reported in the 2015 statistics. In other words, the 2014 figures are likely to be understated, and the 2015 numbers overstated. Correcting for these factors would be likely to restore the same overall trend observed leading up to 2014, and from 2015 to 2016.
62 Note that while the overall demand for unleaded petrol has grown significantly – by nearly 50% since 2005 – the overall amount of petrol being used by each car per annum has stayed relatively constant. This has remained at around 1,300 litres per year, suggesting that the overall patterns of driving may not have changed much over time, e.g., there are no obvious indications that people are driving further or more frequently (or vice versa).
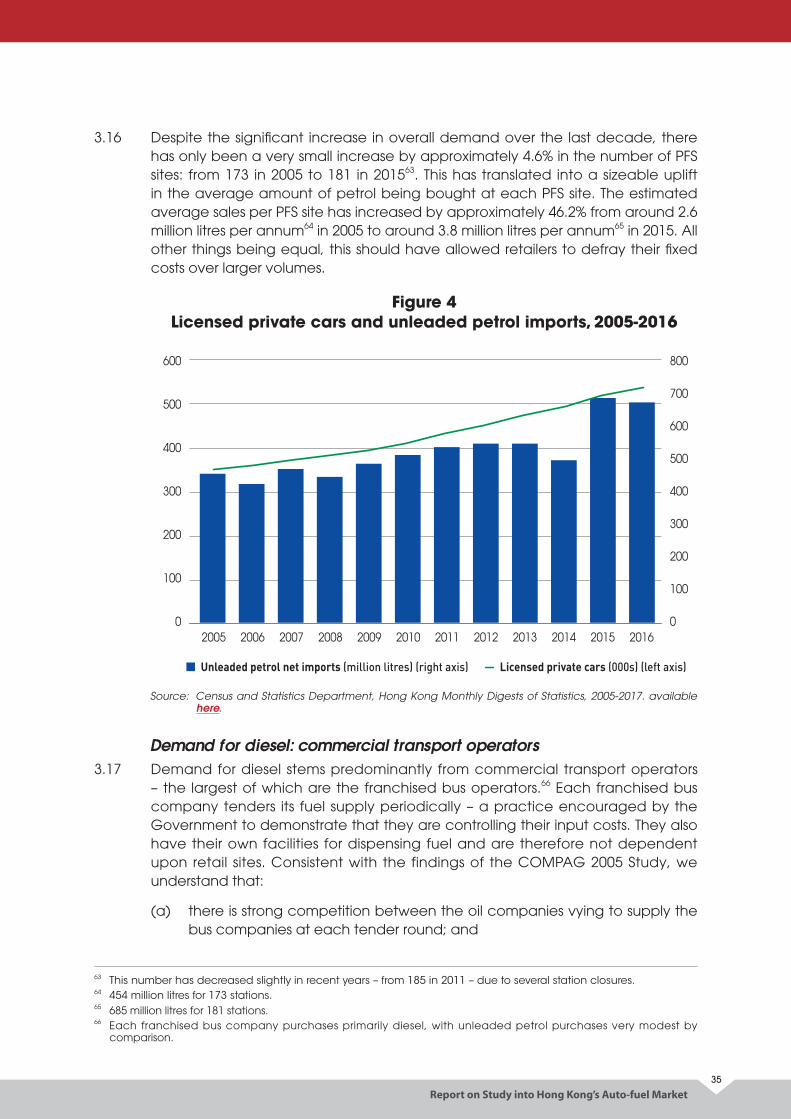
0
200
100
300
400
600
500
700
800
0
200
100
300
400
500
600
20062005 2007 2008 2009 2010 2011 2012 2013 2014 2015 2016
Unleaded petrol net imports (million litres) (right axis) Licensed private cars (000s) (left axis)
Report on Study into Hong Kong’s Auto-fuel Market35
3.16 Despite the significant increase in overall demand over the last decade, there has only been a very small increase by approximately 4.6% in the number of PFS sites: from 173 in 2005 to 181 in 201563. This has translated into a sizeable uplift in the average amount of petrol being bought at each PFS site. The estimated average sales per PFS site has increased by approximately 46.2% from around 2.6 million litres per annum64 in 2005 to around 3.8 million litres per annum65 in 2015. All other things being equal, this should have allowed retailers to defray their fixed costs over larger volumes.
Figure 4 Licensed private cars and unleaded petrol imports, 2005-2016
Source: Census and Statistics Department, Hong Kong Monthly Digests of Statistics, 2005-2017. available here.
Demand for diesel: commercial transport operators3.17 Demand for diesel stems predominantly from commercial transport operators
– the largest of which are the franchised bus operators.66 Each franchised bus company tenders its fuel supply periodically – a practice encouraged by the Government to demonstrate that they are controlling their input costs. They also have their own facilities for dispensing fuel and are therefore not dependent upon retail sites. Consistent with the findings of the COMPAG 2005 Study, we understand that:
(a) there is strong competition between the oil companies vying to supply the bus companies at each tender round; and
63 This number has decreased slightly in recent years – from 185 in 2011 – due to several station closures.64 454 million litres for 173 stations.65 685 million litres for 181 stations.66 Each franchised bus company purchases primarily diesel, with unleaded petrol purchases very modest by
comparison.
Report on Study into Hong Kong’s Auto-fuel Market
36
(b) there is a reasonably wide dispersion in bids – in contrast to the uniformity observed in diesel pump prices at PFS sites (which we explore below).
3.18 Another category of large users for which competition appears quite keen is trucking fleets. As we explain subsequently, most trucking fleets are generally able to secure significant discounts at all retail stations – the size of which depends upon the size of the fleet. Even larger discounts are potentially available to those fleets that can by-pass retail stations by purchasing barrels of diesel directly from the oil companies. Trucking companies that offer cross-border operations also tend to purchase their auto-fuel in Mainland China where prices are lower.
3.19 The remaining consumers of diesel are ‘single operator’ trucking providers, non-franchised bus companies and diesel-powered private cars. We have been advised that these customers are reliant on road-side filling stations and do not receive the same level of discounts as larger users. Bigger discounts can potentially be obtained, however, through third-party ‘consolidators’ (or ‘fleet card agents’). As the name suggests, these parties seek to ‘consolidate’ a large group of motorists, then negotiate a volume discount with an oil company. They are then able to pass on less than 100% of that discount, making a margin.67
3.20 Table 1 shows the number of licenced diesel vehicles in Hong Kong in 2005 and 2016. Significant growth can be seen in the number of diesel-powered private cars and heavy goods vehicles. Of course, the ‘raw’ vehicle numbers will not necessarily translate directly into diesel sales since, as we mentioned earlier, by far the largest users are the public bus companies. With those qualifications in mind there is, nevertheless, a noticeable upward trend in most of the categories set out in Table 1, suggesting that demand for diesel has increased over the period.68
67 From the customer’s perspective, joining a consolidator’s scheme is potentially a good way to obtain a bigger discount on auto-fuel purchases. From the oil companies’ perspective, consolidators are used to manage their credit risk and outsource customer billing and support functions. Whilst the oil companies will still issue cards to the consolidator’s individual customers for its computer records, it is the consolidator who takes on the credit risk for those customers. The consolidator will make money provided he or she can maintain, or better, grow the volumes of auto-fuel sold, and receive timely payment.
68 The Census and Statistics Department does not collect bespoke data on diesel imports. Rather, it collects information on the total combined net imports of diesel oil, gas oil and naphtha. The total net imports of these three products have increased significantly since 2005 (from 4,993 to 6,779 million litres per annum) but, of course, it is not possible to say with certainty whether that is attributable to increases in diesel imports, or the other two fuels. We note that when the COMPAG 2005 Study was undertaken, diesel sales were falling – due principally to the widespread conversion of taxis and minibuses to auto-LPG.
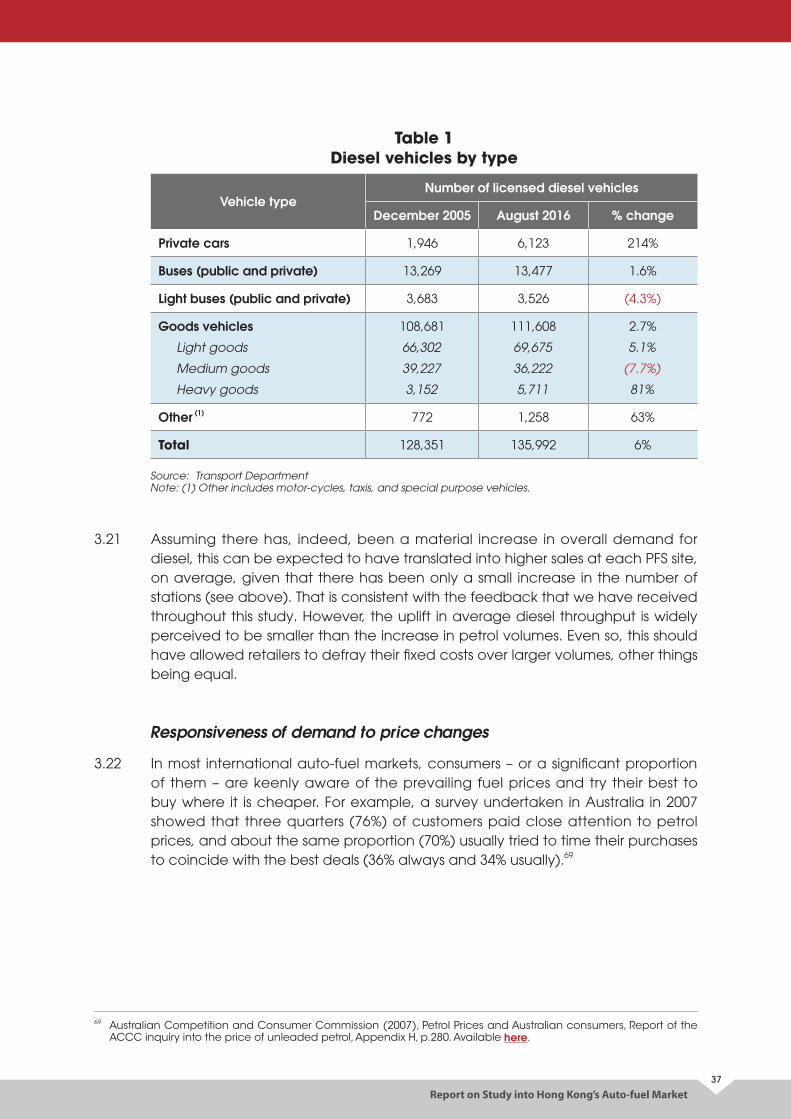
Report on Study into Hong Kong’s Auto-fuel Market37
Table 1 Diesel vehicles by type
Vehicle typeNumber of licensed diesel vehicles
December 2005 August 2016 % change
Private cars 1,946 6,123 214%
Buses (public and private) 13,269 13,477 1.6%
Light buses (public and private) 3,683 3,526 (4.3%)
Goods vehicles
Light goods
Medium goods
Heavy goods
108,681
66,302
39,227
3,152
111,608
69,675
36,222
5,711
2.7%
5.1%
(7.7%)
81%
Other (1) 772 1,258 63%
Total 128,351 135,992 6%
Source: Transport DepartmentNote: (1) Other includes motor-cycles, taxis, and special purpose vehicles.
3.21 Assuming there has, indeed, been a material increase in overall demand for diesel, this can be expected to have translated into higher sales at each PFS site, on average, given that there has been only a small increase in the number of stations (see above). That is consistent with the feedback that we have received throughout this study. However, the uplift in average diesel throughput is widely perceived to be smaller than the increase in petrol volumes. Even so, this should have allowed retailers to defray their fixed costs over larger volumes, other things being equal.
Responsiveness of demand to price changes
3.22 In most international auto-fuel markets, consumers – or a significant proportion of them – are keenly aware of the prevailing fuel prices and try their best to buy where it is cheaper. For example, a survey undertaken in Australia in 2007 showed that three quarters (76%) of customers paid close attention to petrol prices, and about the same proportion (70%) usually tried to time their purchases to coincide with the best deals (36% always and 34% usually).69
69 Australian Competition and Consumer Commission (2007), Petrol Prices and Australian consumers, Report of the ACCC inquiry into the price of unleaded petrol, Appendix H, p.280. Available here.
Report on Study into Hong Kong’s Auto-fuel Market
38
3.23 The upshot of this price sensitivity is that, when a petrol retailer has a higher pump price than its competitors, it will find itself losing volumes as customers avail themselves of those cheaper alternatives. This is quite intuitive, given that the product in question is virtually identical. Indeed, it is natural to expect that most customers would not be prepared to “pay more for the same thing”, if they can switch without too much bother by simply driving a bit further down the road.
3.24 At least, that is what one would anticipate to observe. What the Commission has actually observed in Hong Kong is quite different. As we explain in more detail in chapter 4, when retailers change their ‘headline pump prices’, there is usually a small window of time during which those prices differ across brands and, by extension, across retail sites. Some oil companies provided the Commission with daily volumes of auto-fuel sales, which enabled us to examine what happened at four ‘pairs’ of adjacent stations during these ‘price change’ events.
3.25 Specifically, we reviewed several price change episodes from 2012 for both petrol and diesel, to see what happened to the volumes at these stations when a divergence in prices emerged. Sometimes the expected result was observed – that is, the station with the lower pump price appeared to gain volume and the more expensive site lost volume, compared with the previous week’s levels. But not always. On other occasions, the opposite occurred – and the station with the higher pump price ostensibly picked up volume.
3.26 There are several potential explanations for this rather curious outcome. Perhaps consumers were not well-informed about the price differences (e.g., because they were not clearly displayed on price boards - a matter we return to in chapter 4). Or maybe headline pump prices are not the chief driver of customer demand – indeed, as we shall soon see, discounts are very prevalent and can be very significant.
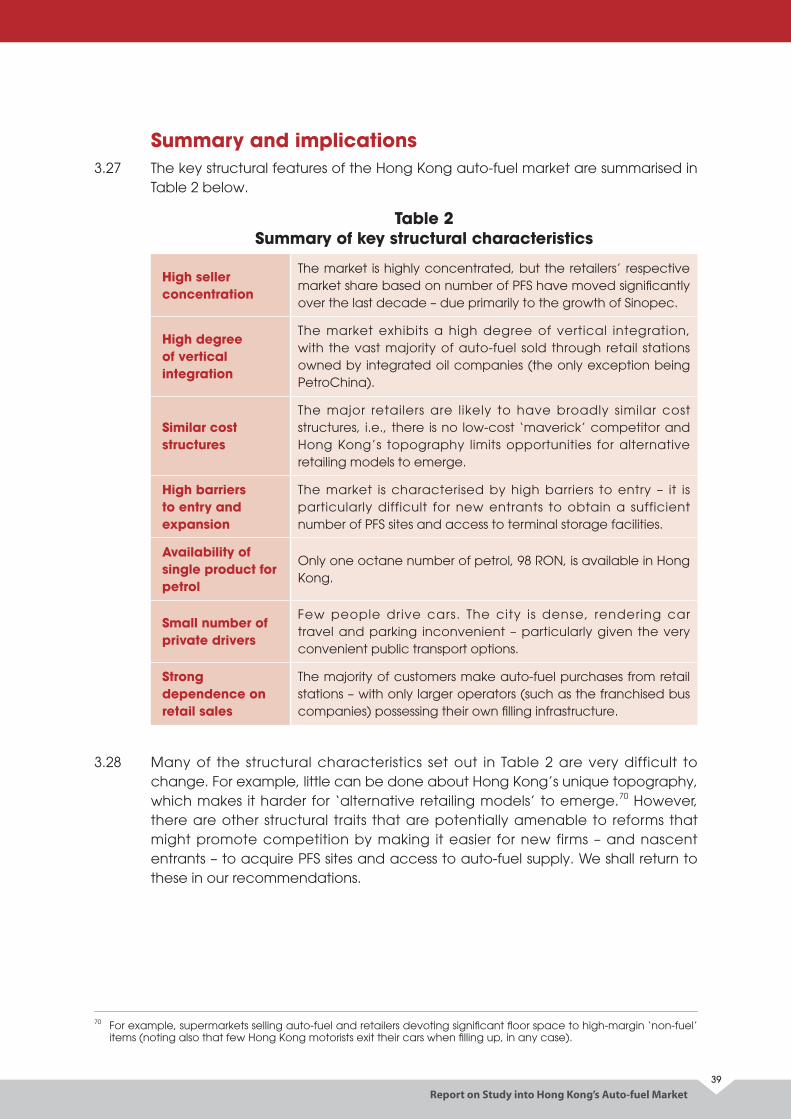
Report on Study into Hong Kong’s Auto-fuel Market39
Summary and implications3.27 The key structural features of the Hong Kong auto-fuel market are summarised in
Table 2 below.
Table 2 Summary of key structural characteristics
High seller concentration
The market is highly concentrated, but the retailers’ respective market share based on number of PFS have moved significantly over the last decade – due primarily to the growth of Sinopec.
High degree of vertical integration
The market exhibits a high degree of vertical integration, with the vast majority of auto-fuel sold through retail stations owned by integrated oil companies (the only exception being PetroChina).
Similar cost structures
The major retailers are likely to have broadly similar cost structures, i.e., there is no low-cost ‘maverick’ competitor and Hong Kong’s topography limits opportunities for alternative retailing models to emerge.
High barriers to entry and expansion
The market is characterised by high barriers to entry – it is particularly difficult for new entrants to obtain a sufficient number of PFS sites and access to terminal storage facilities.
Availability of single product for petrol
Only one octane number of petrol, 98 RON, is available in Hong Kong.
Small number of private drivers
Few people drive cars. The city is dense, rendering car travel and parking inconvenient – particularly given the very convenient public transport options.
Strong dependence on retail sales
The majority of customers make auto-fuel purchases from retail stations – with only larger operators (such as the franchised bus companies) possessing their own filling infrastructure.
3.28 Many of the structural characteristics set out in Table 2 are very difficult to change. For example, little can be done about Hong Kong’s unique topography, which makes it harder for ‘alternative retailing models’ to emerge.70 However, there are other structural traits that are potentially amenable to reforms that might promote competition by making it easier for new firms – and nascent entrants – to acquire PFS sites and access to auto-fuel supply. We shall return to these in our recommendations.
70 For example, supermarkets selling auto-fuel and retailers devoting significant floor space to high-margin ‘non-fuel’ items (noting also that few Hong Kong motorists exit their cars when filling up, in any case).
Report on Study into Hong Kong’s Auto-fuel Market
40
Acquiring a sufficient number of PFS sites
3.29 Any firm seeking to enter the Hong Kong retail auto-fuel market must acquire enough PFS sites to reach an efficient scale. The new tendering arrangements described earlier make this somewhat easier, but it remains difficult, overall. Sites may simply not be available and, even if they are, acquiring them requires a substantial initial capital outlay and, depending upon the sites acquired, further significant expenditure to bring stations to market.71
3.30 These barriers are perhaps illustrated by the fact that, although demand for auto-fuel has grown considerably over past decade (net imports of unleaded petrol are up by around 50%), there are only eight more PFS sites today than there were in 2005 (an increase of less than 5%). This discrepancy is conspicuous. One might have expected to see the steady rise in demand for auto-fuel result in a far more substantial ‘supply-side’ response from firms chasing those additional rents (i.e., significantly more new PFS sites opening).72
3.31 The fact that this has not happened could suggest that the system by which land is earmarked for PFS sites is not functioning effectively – indeed, we note that no new sites have been put up for government tender in recent years (only existing sites). It may also highlight the challenges associated with converting privately-owned land to PFS use. For example, those barriers may have discouraged firms from making those investments, notwithstanding the increase in demand for auto-fuel.
3.32 If the system for designating new PFS sites could be reformed so that more were tendered when overall demand was increasing, and the procedures for converting privately-owned land streamlined to provide a swifter ‘alternative route’ to market, then this would reduce barriers to entry. Presently, this structural characteristic may be serving as an impediment to additional competition, by limiting the ability of existing suppliers to expand and for new suppliers to enter to meet rising demand.
71 The significant sums paid to enter by Sinopec and Chinaoil led some commentators to conclude that the entry of Sinopec and Chinaoil has precluded the possibility of further entry, since the cost of obtaining new sites was thought to be too high. However, if the sums paid for those sites formed part of an overarching entry strategy, it is reasonable to expect that they will decrease, in time. By definition, no firm can submit ‘uneconomic’ bids in perpetuity, and those that attempt to do so will simply exit the market in the longer-term, at which point its sites will become available to potential entrants.
72 Note that even if the additional demand could potentially have been met by the existing PFS sites without creating undue congestion, this does not alter the fact that the higher volumes will have improved the profitability of each site, creating additional incentives for entry and expansion. Put simply, unless PFS sites have, historically, been earning ‘below-normal’ returns (of which there is no indication), more demand should mean entry and/ or expansion.
Report on Study into Hong Kong’s Auto-fuel Market41
Securing a supply of auto-fuel
3.33 If a firm manages to acquire PFS sites, it must then source a supply of imported auto-fuel. Realistically, suppliers with only a small number of PFS sites will not have sufficient scale to justify hiring large 30,000 tonne tankers73 - a significant network of sites is needed before imports of this magnitude are feasible. Even if a retailer reached that scale, it would still need somewhere to store any fuel that it imported. In other words, it would either need to build or buy its own terminal storage or rent space in the existing facilities on Tsing Yi Island. Neither option would be easy.
3.34 Acquiring land to build a terminal storage facility would be difficult – especially for a new entrant. A deep-draft jetty would be required capable of receiving 30,000 tonne tankers, and in an unpopulated area. Government approval would also be needed – and may be hard to obtain. Renting existing storage from competitors would also be challenging. The vertically integrated retailers are under no obligation to provide access and they might simply – and quite rationally – refuse outright, or demand uneconomic terms (which amounts to the same thing).74
3.35 The only remaining option would be to purchase auto-fuel that has been imported by one of the other retailers. But here again, those vertically integrated companies would be under no obligation to supply wholesale auto-fuel and those that do are likely to seek a margin, placing any new entrant at a competitive disadvantage. When Sinopec and PetroChina entered, both were forced to resort to this option – and Feoso has been in this position for some time.
3.36 Recall also that, to become a vertically integrated retai ler, Sinopec accumulated a network of more than thirty PFS sites and obtained terminal storage through a bespoke opportunity arising from the exit of CRC. Were it not for CRC’s exit, Sinopec might have far fewer PFS sites today and still be in Feoso’s and PetroChina’s position, having to purchase fuel from competitors. Its path to market therefore does not necessarily serve as a viable ‘blueprint’ for prospective entrants today.
73 In principle, a small supplier could use smaller tankers – but that would increase its costs compared to the existing vertically integrated competitors.
74 The importing companies do appear to rent capacity to each other. However, a new entrant would likely bring different considerations to bear. In particular, the extra revenue potentially available from renting any spare capacity may be outweighed by the detriment associated with assisting a competitor seeking to gain market share at their expense.
Report on Study into Hong Kong’s Auto-fuel Market
42
3.37 Without access to storage facilities, new or emerging entrants may not represent a serious competitive threat to the incumbent vertically integrated retailers, given the intrinsic cost disadvantages. In the Commission’s view, the difficulties obtaining access to storage for new or emerging entrants may therefore constitute a significant structural barrier to entry and expansion. They may also be serving as an impediment to product differentiation and innovation.
3.38 For example, an incumbent vertically integrated retailer may be reluctant to import and sell 95 RON petrol, since it may anticipate that all others would respond in kind – reducing margins across the board. In contrast, a new entrant looking to make an impact and with no existing sales to cannibalise may have no such qualms. However, for the reasons set out above, even if a new entrant wanted to offer 95 RON petrol, it could not feasibly do so without somewhere to store it. It would therefore need access to reasonably priced terminal storage.
3.39 If it was easier for entrants to obtain access to terminal storage then, in the Commission’s view, this may serve to promote competition in the supply of retail auto-fuels. Currently, this structural barrier to entry may be serving as an impediment to that additional competition, by forcing any entrants to buy imported fuel from their competitors or discouraging entry altogether. It may also be contributing to the narrow range of products sold at the retail level – most notably the exclusive provision of 98 RON octane petrol.
Report on Study into Hong Kong’s Auto-fuel Market43
4. ANALYSIS OF MARKET CONDUCT
4.1 This chapter examines the behaviour of participants in the Hong Kong auto-fuel market – including pricing and discounting practices – and certain market outcomes. Certain types of conduct – or market outcomes – can signal potential competition problems, buttressing any concerns identified in a structural assessment. Alternatively, certain behaviours may simply be symptomatic of the unique characteristics of the Hong Kong market. The way that firms set prices – and the margins that they earn (to the extent they can be measured) – are especially important factors to consider.
Price setting and adjustment practices4.2 We have explained already why, in isolation, headline pump prices reveal little, if
anything, about the degree of competition in the Hong Kong market. However, the way that those prices are set and move over time can potentially provide useful insights into the competitive dynamics. We explore those price setting and adjustment practices below.
The way pump prices are displayed
4.3 In most other markets, ascertaining the prevailing prices of petrol and diesel is straightforward. Stations typically have large price boards displaying clearly the current pump prices to passing motorists. This makes it quite easy for customers in these other markets to gauge what they will pay, even if they receive some forms of discount. For example, if a customer has a certain brand of credit or loyalty card, she might just have to deduct, say, $2/litre, or 5% from the pump price to work out the final price. This calculation can be quite comfortably completed in the fleeting moments between first seeing a price board and driving past the station.
4.4 In Hong Kong, it is harder for customers to gauge and compare prices in this way – and to ‘shop around’. This is partly due to the greater complexity of discounts – which we discuss below – but, also, because of the lack of visibility of pump prices themselves. Some PFS sites do not have price boards at all (although, since 2000, all new leases require them) and those that are in place are not always visible from the street and/ or are relatively small. Moreover, some stations that have large, clearly visible boards at their disposal do not actually use them to display pump prices – which is puzzling.
Report on Study into Hong Kong’s Auto-fuel Market
44
4.5 During the COMPAG 2005 Study, some retailers stated that price boards were ‘unnecessary’ in Hong Kong, since the motorists are always aware of the current pump prices, whether they are displayed or not. We disagree. It is certainly true that price changes are almost always announced in advance by the retailers – and receive rapid, widespread coverage on radio stations and the internet (sometimes even the evening news). But it does not follow from this that consumers are fully informed or that price boards serve no useful purpose – especially in those crucial periods when prices are moving across the city.
4.6 That is because, when a retailer changes its pump prices, it usually takes one or two days for all the other retailers to follow suit. There is therefore a window – however brief – when pump prices diverge across the different brands. Given the infrequency of pump price changes (a phenomenon we explore below), these periods surrounding ‘price change events’ are potentially of great significance to the competitive process. During these windows, motorists may be aware that prices are changing, but they may not be fully apprised of those retailers that have changed the prices and those that are lagging. In the Commission’s view, that is problematic.
4.7 In other international markets, customers have few problems identifying divergences in pump prices since, as we explained above, these can be quickly detected simply by driving past a few stations and glancing at the price boards. Hong Kong motorists may not have that option, for the reasons set out above. This means that, unless a consumer has paid very close attention to all the relevant press releases and retained that information, she may not be aware of the current pump prices at these crucial points in time.
4.8 It might also at least partly explain the seemingly counterintuitive phenomenon described earlier, whereby stations with higher pump prices during ‘price change episodes’ were sometimes seen to ‘gain volumes’ at the expense of neighbouring stations with lower pump prices. It could be that some of those customers simply did not know there was a pump price difference between the two stations. In the Commission’s view, the ubiquitous use of prominent price boards would clearly assist with that ‘price discovery’ process. Indeed, this view is well supported by the recent consumer preference survey where almost 70% respondents favoured such price boards.
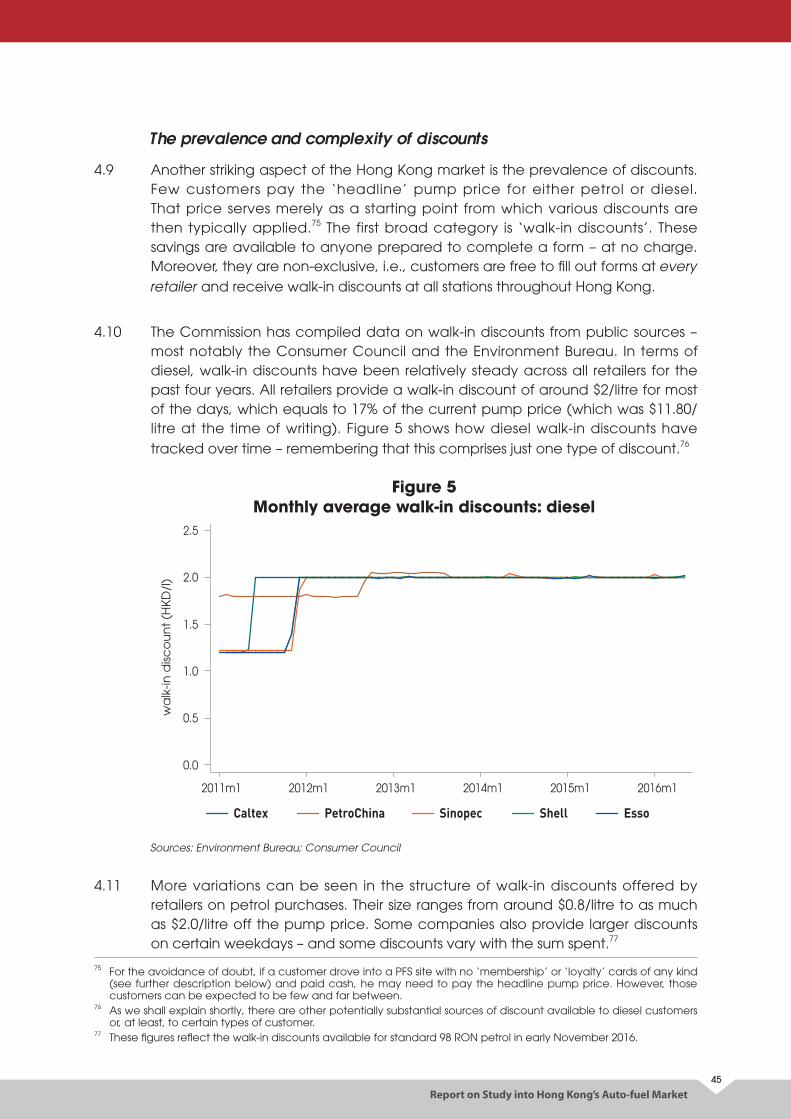
0.0
0.5
1.0
1.5
2.0
2.5
wa
lk-in
disc
ou
nt
(HK
D/l
)
2011m1 2012m1 2013m1 2014m1 2015m1 2016m1
Caltex PetroChina Sinopec Shell Esso
Report on Study into Hong Kong’s Auto-fuel Market45
The prevalence and complexity of discounts
4.9 Another striking aspect of the Hong Kong market is the prevalence of discounts. Few customers pay the ‘headline’ pump price for either petrol or diesel. That price serves merely as a starting point from which various discounts are then typically applied.75 The first broad category is ‘walk-in discounts’. These savings are available to anyone prepared to complete a form – at no charge. Moreover, they are non-exclusive, i.e., customers are free to fill out forms at every retailer and receive walk-in discounts at all stations throughout Hong Kong.
4.10 The Commission has compiled data on walk-in discounts from public sources – most notably the Consumer Council and the Environment Bureau. In terms of diesel, walk-in discounts have been relatively steady across all retailers for the past four years. All retailers provide a walk-in discount of around $2/litre for most of the days, which equals to 17% of the current pump price (which was $11.80/litre at the time of writing). Figure 5 shows how diesel walk-in discounts have tracked over time – remembering that this comprises just one type of discount.76
Figure 5 Monthly average walk-in discounts: diesel
Sources: Environment Bureau; Consumer Council
4.11 More variations can be seen in the structure of walk-in discounts offered by retailers on petrol purchases. Their size ranges from around $0.8/litre to as much as $2.0/litre off the pump price. Some companies also provide larger discounts on certain weekdays – and some discounts vary with the sum spent.77
75 For the avoidance of doubt, if a customer drove into a PFS site with no ‘membership’ or ‘loyalty’ cards of any kind (see further description below) and paid cash, he may need to pay the headline pump price. However, those customers can be expected to be few and far between.
76 As we shall explain shortly, there are other potentially substantial sources of discount available to diesel customers or, at least, to certain types of customer.
77 These figures reflect the walk-in discounts available for standard 98 RON petrol in early November 2016.
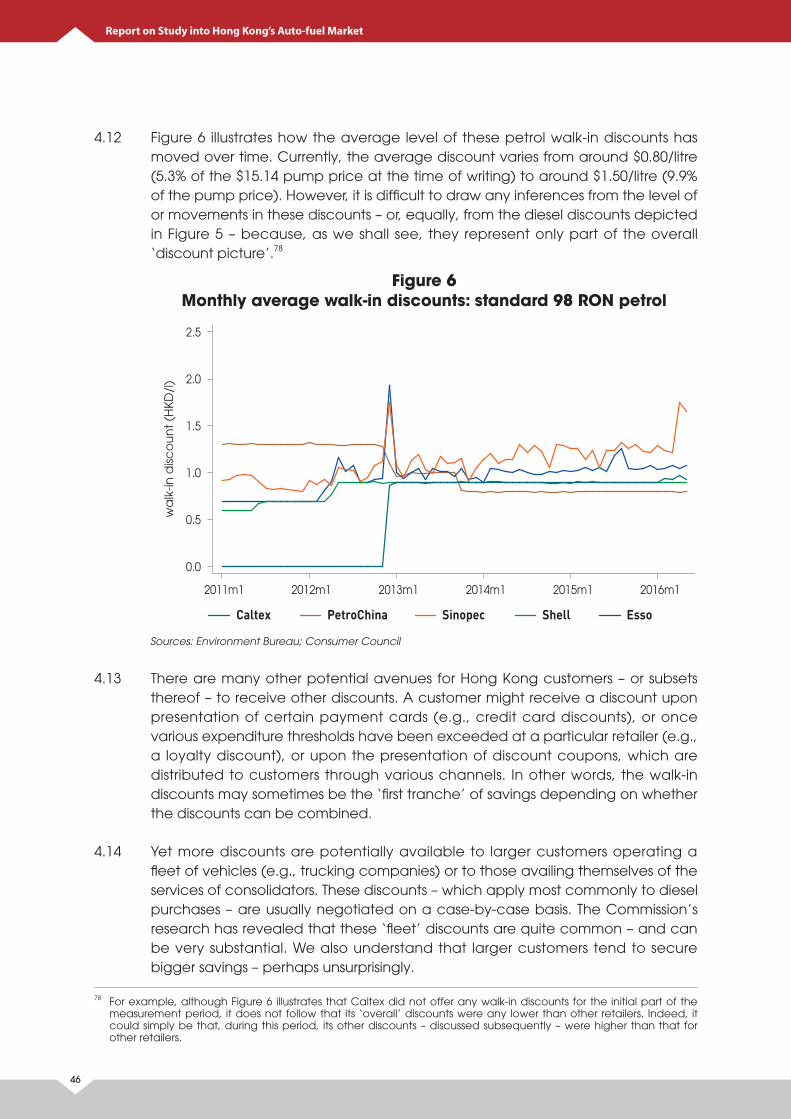
0.0
0.5
1.0
1.5
2.0
2.5
wa
lk-in
disc
ou
nt
(HK
D/l
)
2011m1 2012m1 2013m1 2014m1 2015m1 2016m1
Caltex PetroChina Sinopec Shell Esso
Report on Study into Hong Kong’s Auto-fuel Market
46
4.12 Figure 6 illustrates how the average level of these petrol walk-in discounts has moved over time. Currently, the average discount varies from around $0.80/litre (5.3% of the $15.14 pump price at the time of writing) to around $1.50/litre (9.9% of the pump price). However, it is difficult to draw any inferences from the level of or movements in these discounts – or, equally, from the diesel discounts depicted in Figure 5 – because, as we shall see, they represent only part of the overall ‘discount picture’.78
Figure 6 Monthly average walk-in discounts: standard 98 RON petrol
Sources: Environment Bureau; Consumer Council
4.13 There are many other potential avenues for Hong Kong customers – or subsets thereof – to receive other discounts. A customer might receive a discount upon presentation of certain payment cards (e.g., credit card discounts), or once various expenditure thresholds have been exceeded at a particular retailer (e.g., a loyalty discount), or upon the presentation of discount coupons, which are distributed to customers through various channels. In other words, the walk-in discounts may sometimes be the ‘first tranche’ of savings depending on whether the discounts can be combined.
4.14 Yet more discounts are potentially available to larger customers operating a fleet of vehicles (e.g., trucking companies) or to those availing themselves of the services of consolidators. These discounts – which apply most commonly to diesel purchases – are usually negotiated on a case-by-case basis. The Commission’s research has revealed that these ‘fleet’ discounts are quite common – and can be very substantial. We also understand that larger customers tend to secure bigger savings – perhaps unsurprisingly.
78 For example, although Figure 6 illustrates that Caltex did not offer any walk-in discounts for the initial part of the measurement period, it does not follow that its ‘overall’ discounts were any lower than other retailers. Indeed, it could simply be that, during this period, its other discounts – discussed subsequently – were higher than that for other retailers.
Report on Study into Hong Kong’s Auto-fuel Market47
4.15 Notwithstanding the clear importance of these other sources of discounts, there is a paucity of publicly available information about their size, the number of customers that receive them and their overall impact on retail prices. The Commission consequently requested further data from retailers on the average size of these discounts. Some retailers did not respond to this request (and they were under no compulsion to do so) and, although some others did, the level of detail provided varied substantially across those respondents.79
4.16 The information that we did receive was sufficient to highlight the significance of these discounts. However, the ‘gaps’ in the data mean that we cannot say for certain how they would affect the overall prices paid by customers, i.e., the incremental effect above and beyond the walk-in discounts, if any described earlier. What we can say with more confidence is that the overall variety of discounts offered in Hong Kong is consistently more than those in the other international markets.80
4.17 It has been suggested that this discounting conduct reflects a competitive market. It is argued that oil companies do not engage in competition over the headline prices, but they do compete by offering a wide range of discounts, including walk-in discounts, credit card discounts, loyalty discounts, coupons, etc. Consumers who enjoy the discounts benefit as the effective prices they pay are lower than they would have to pay without discounts.
4.18 The Commission is of the view that discounts are not a perfect substitute for price competition. Specifically, discounts are not offered to all buyers in a uniform way. They are in fact a form of price discrimination, and it is a common way in which businesses maximise their profits. It operates by way of offering the exact same product at different prices based on the supply/demand characteristics of each market segment, rather than the underlying supply/demand characteristics of the market as a whole.
4.19 The Commission finds the discount system in the local auto-fuel market complex and opaque, making it difficult for consumers to compare the effective or actual prices. The Commission wishes to point out that the prevalence of discounts in the market does not necessarily mean that competition is vigorous. Indeed, the Commission is of the view that the opacity of discounts alleviates the competitive pressure on the oil companies to compete on price.
79 As we noted earlier, the Commission does not have the power to compel the production of this type of information when conducting a market study – we are reliant on the willingness of parties to cooperate.
80 Discounts in other markets are usually contingent on some other factor, e.g., cash payment, use of particular credit card or prior expenditure on other goods. By contrast, some discounts in Hong Kong – most notably, walk-in discounts – have no such conditions.
Report on Study into Hong Kong’s Auto-fuel Market
48
4.20 This may again go some way to explaining the peculiar outcome described earlier, whereby stations with higher pump prices during ‘price change episodes’ are sometimes seen to gain volumes relative to neighbouring stations with lower prices. Assuming those pump prices were visible, it could be that customers either struggled to ascertain the relative final prices due to the complexity of the applicable discount schemes, or were disinclined to try – opting instead to collect their ‘regular discounts’ from their usual suppliers, regardless of the prevailing pump price.
The movement of prices
4.21 Hong Kong auto-fuel pump prices do not move very often. Although a widely-used measure of the wholesale price – the price in Singapore published by Platts (‘mean-of-Platts-Singapore or ‘MOPS’) – fluctuates daily, pump prices in Hong Kong usually remain at the same level for several days. This is unusual, compared to most markets, where pump prices often fluctuate daily.81
4.22 Of course, the frequency of changes in true retail prices will again be influenced by how often discounts change. However, these appear to move not too frequently as well. Although some petrol walk-in discounts vary depending on the day of the week (e.g., Sinopec offers higher walk-in discounts from Tuesday to Thursday), the level of those discounts themselves are quite constant (i.e., the discounts on ‘lower priced’ days tends to be the same).82
4.23 The frequent movements observed in retail prices over the longer term in international markets are generally attributed to corresponding changes in input prices. In other words, the volatility of retail auto-fuel prices in these markets largely reflects upstream price volatility, which flow-through to retail prices through the forces of downstream competition. The question is whether the reverse holds. Specifically, does the atypical lack of medium-term price volatility observed in Hong Kong indicate an absence of effective competition?
4.24 Part of the explanation may lie in the fact that Hong Kong has no refining capacity and therefore must import all of its auto-fuel in large increments – generally in 30,000 tonne shipments. These large shipments of refined auto-fuel, purchased at one fixed price, provide supply for several weeks. Consequently, the input cost profile of a Hong Kong retailer is quite different to that facing an importer in, say, New York or Los Angeles where refined auto-fuel is piped in every day at a different daily price. Of course, that is not to say that a Hong Kong importer would expect to sell 30,000 tonnes of imported auto-fuel at this fixed cost price plus the usual margin in a situation where input prices are rising. The firm’s pricing conduct will be influenced by the opportunity cost of auto-fuel in terminal storage rather than this historic cost. Specifically, when determining its retail price
81 See, COMPAG 2005 Study, paragraph 6.2.7.82 This is perhaps unsurprising, given that discounts are often tied to complex card schemes, often with specified
discount tranches related to volumes. Indeed, Hong Kong retailers themselves have indicated that they endeavour to minimise retail prices movements to provide some stability to their customers.
Report on Study into Hong Kong’s Auto-fuel Market49
a firm will weigh up the price its inventory of fuel could fetch in another market (e.g., at the current ‘market price’), or the price it could fetch in Hong Kong at a later date. The historic ‘accounting cost’ paid has no bearing on this assessment.
4.25 The extent of this opportunity cost may, however, be limited in Hong Kong relative to other international markets. In particular, Hong Kong importers may find it quite costly to ship auto-fuel acquired at lower prices to other markets to take advantage of subsequent import price increases. In comparison, in other international markets – like, say, the United States – refined auto-fuel can be easily transported (e.g., by pipeline) to adjacent markets where it can fetch a higher price. This may at least partly explain the limited medium-term price variations observed in Hong Kong.
4.26 However, it does not offer a complete explanation. If all retailers set their prices on a weighted/ moving average basis then, at some point in time, a company’s costs would have been below that average. In such circumstances, it appears unusual that no company perceives a competitive benefit in reducing its retail prices more quickly when product costs fall. Accordingly, the widespread practice of ‘smoothing’ fluctuations in input costs when setting retail prices may indicate a lack of effective competition between Hong Kong retailers.
4.27 Another curious feature of Hong Kong’s prices is that they move in sync across geographic regions. Retailers charge the same pump prices at all their stations – and we understand that generally discounts also do not vary based on the geographic location of stations.
4.28 It is unusual to observe complete pricing symmetry across a geographic location of comparable size to Hong Kong – even if it is only a handful of retailers pricing in this fashion. In most international markets, prices do vary geographically – sometimes significantly. Prices can vary across geography due to transport cost differentials, the presence of ‘maverick competitors’ (e.g., low-cost/high-volume ‘hypermarkets’83) or differences in the number of competitors in locations.84 Figure 7 highlights the variations in petrol and diesel prices across New York’s five boroughs.
83 The establishment of a ‘maverick player’, or a retailer with a fundamentally different cost structure such as a hypermarket in a geographic location may have a significant impact upon retail prices at surrounding retail stations, particularly if it sets significantly lower prices than the incumbents. This may create pockets of low-price stations across a geographic region corresponding to the locations of those maverick players.
84 See, for example, Office of Fair Trading (2013), Econometric Analysis on the Determinants of Price Differences across the UK.
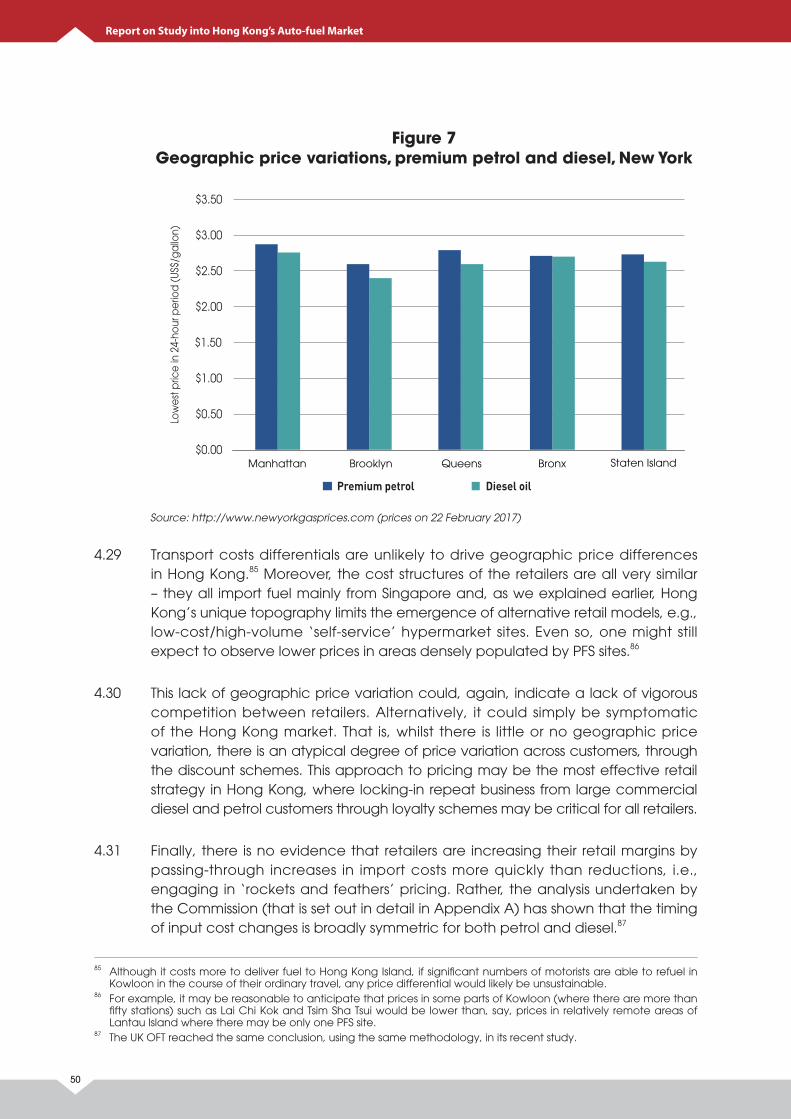
Low
est p
rice
in 2
4-ho
ur p
erio
d (U
S$/g
allo
n)
$0.00
$2.00
$1.00
$2.50
$0.50
$3.00
$1.50
$3.50
Manhattan Brooklyn Queens Bronx
Premium petrol Diesel oil
Staten Island
Report on Study into Hong Kong’s Auto-fuel Market
50
Figure 7 Geographic price variations, premium petrol and diesel, New York
Source: http://www.newyorkgasprices.com (prices on 22 February 2017)
4.29 Transport costs differentials are unlikely to drive geographic price differences in Hong Kong.85 Moreover, the cost structures of the retailers are all very similar – they all import fuel mainly from Singapore and, as we explained earlier, Hong Kong’s unique topography limits the emergence of alternative retail models, e.g., low-cost/high-volume ‘self-service’ hypermarket sites. Even so, one might still expect to observe lower prices in areas densely populated by PFS sites.86
4.30 This lack of geographic price variation could, again, indicate a lack of vigorous competition between retailers. Alternatively, it could simply be symptomatic of the Hong Kong market. That is, whilst there is little or no geographic price variation, there is an atypical degree of price variation across customers, through the discount schemes. This approach to pricing may be the most effective retail strategy in Hong Kong, where locking-in repeat business from large commercial diesel and petrol customers through loyalty schemes may be critical for all retailers.
4.31 Finally, there is no evidence that retailers are increasing their retail margins by passing-through increases in import costs more quickly than reductions, i.e., engaging in ‘rockets and feathers’ pricing. Rather, the analysis undertaken by the Commission (that is set out in detail in Appendix A) has shown that the timing of input cost changes is broadly symmetric for both petrol and diesel.87
85 Although it costs more to deliver fuel to Hong Kong Island, if significant numbers of motorists are able to refuel in Kowloon in the course of their ordinary travel, any price differential would likely be unsustainable.
86 For example, it may be reasonable to anticipate that prices in some parts of Kowloon (where there are more than fifty stations) such as Lai Chi Kok and Tsim Sha Tsui would be lower than, say, prices in relatively remote areas of Lantau Island where there may be only one PFS site.
87 The UK OFT reached the same conclusion, using the same methodology, in its recent study.
Report on Study into Hong Kong’s Auto-fuel Market51
Analysis of retail margins4.32 The level of retail margins prevailing in a market can potentially provide a further
indication of the level of competition. If margins are at a level that should be sufficient to entice new entry and/ or expansion (to the extent that benchmark can be assessed), but that has not occurred, then that suggests there are barriers preventing that outcome, thereby stymying competition. Similarly, if retail margins have been growing steadily over time, this may indicate that competition in the market may be ‘softening’.
4.33 However, accurately measuring retail margins is very difficult. The data required to calculate precise retail margins are extensive and almost never available. Assumptions must inevitably be made, which usually means that estimates only provide a broad indication of the true level of profitability. For that reason, even in the best of circumstances, retail margin estimates should only ever be treated as one indicator of the level of competition – and an imperfect one at that.
4.34 Moreover, these are not the best of circumstances. As we foreshadowed earlier, the Commission does not have reliable data on several key factors that are necessary to arrive at robust estimates of retail margins. For example, we have only limited information about discounts, throughput and various key cost categories, such as land costs. Despite our best efforts, these ‘gaps’ in the analysis have prevented us from drawing any robust conclusions on margins. We will elaborate below.
Gross margins
4.35 The only margin that the Commission can calculate with any precision, given the data at hand, is retailers’ ‘gross margin’. The gross margin reflects the pump price minus taxes and product costs. It shows the per-litre revenue stream that retailers are receiving, from which they must cover all their costs after allowing for product costs and taxes. Figure 8 shows how this margin has changed for petrol and diesel since the COMPAG 2005 Study. In both cases, it has increased significantly – by $2.15/litre for petrol and $5.16/litre for diesel.88
4.36 At first blush, these increases – especially for diesel – are quite striking. However, it is important to remember that these measures gross margin, and not net profit margin. The gross margin must fund all a retailer’s discounts, its variable costs and its fixed costs. It is only after all these other outlays that a retailer earns a net profit margin, i.e., a true retail profit. This begs the question: what has driven the increase in gross margins? Have retailers’ net profit margins increased significantly, or are the rises merely symptomatic of higher discounts and/ or cost escalation?
88 Note that these values are depicted in nominal terms – i.e., without accounting for inflation. We discuss potential movements in the various components of the gross margin in the following sections.
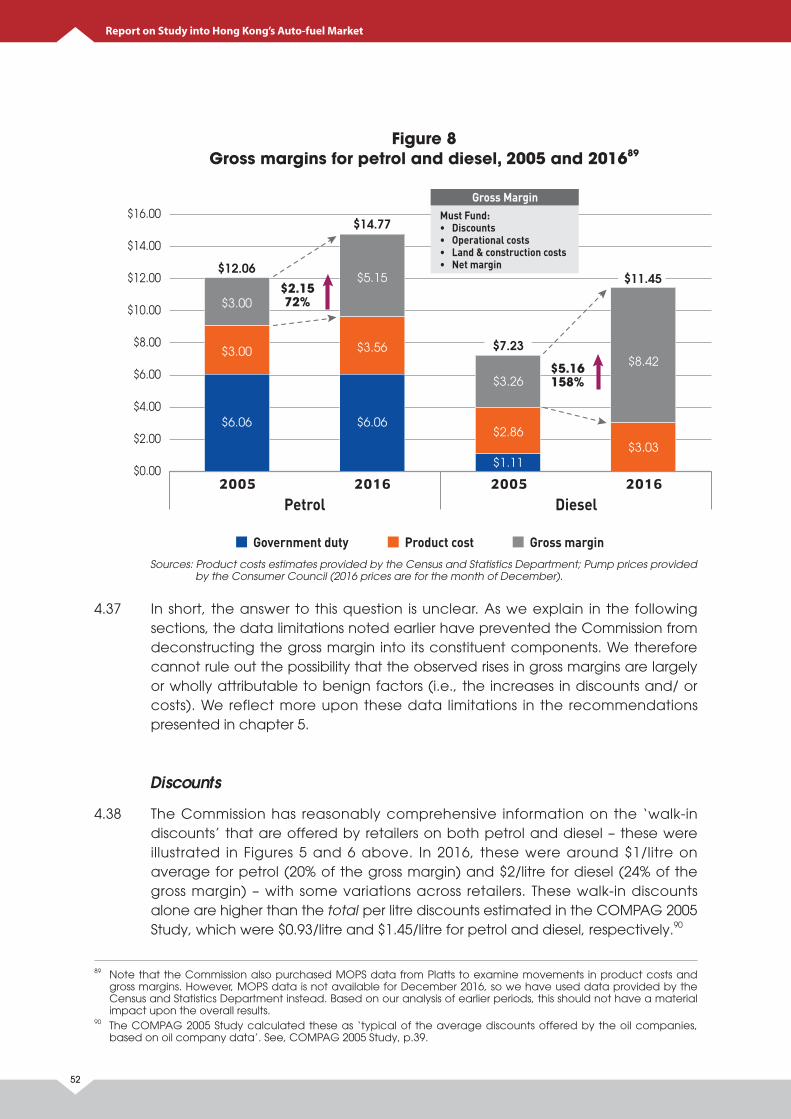
$0.00
$2.00
$4.00
$6.00
$8.00
$10.00
$12.00
$14.00
$16.00
2005Petrol
2016 2005Diesel
2016
$3.00
$12.06
$2.1572%
$3.00
$6.06
$5.15
$14.77
$3.56
$6.06$2.86
$7.23
$3.26
$3.03
$11.45
$8.42
$1.11
Government duty Product cost Gross margin
$5.16158%
Gross MarginMust Fund:• Discounts• Operational costs• Land & construction costs• Net margin
Report on Study into Hong Kong’s Auto-fuel Market
52
Figure 8 Gross margins for petrol and diesel, 2005 and 201689
Sources: Product costs estimates provided by the Census and Statistics Department; Pump prices provided by the Consumer Council (2016 prices are for the month of December).
4.37 In short, the answer to this question is unclear. As we explain in the following sections, the data limitations noted earlier have prevented the Commission from deconstructing the gross margin into its constituent components. We therefore cannot rule out the possibility that the observed rises in gross margins are largely or wholly attributable to benign factors (i.e., the increases in discounts and/ or costs). We reflect more upon these data limitations in the recommendations presented in chapter 5.
Discounts
4.38 The Commission has reasonably comprehensive information on the ‘walk-in discounts’ that are offered by retailers on both petrol and diesel – these were illustrated in Figures 5 and 6 above. In 2016, these were around $1/litre on average for petrol (20% of the gross margin) and $2/litre for diesel (24% of the gross margin) – with some variations across retailers. These walk-in discounts alone are higher than the total per litre discounts estimated in the COMPAG 2005 Study, which were $0.93/litre and $1.45/litre for petrol and diesel, respectively.90
89 Note that the Commission also purchased MOPS data from Platts to examine movements in product costs and gross margins. However, MOPS data is not available for December 2016, so we have used data provided by the Census and Statistics Department instead. Based on our analysis of earlier periods, this should not have a material impact upon the overall results.
90 The COMPAG 2005 Study calculated these as ‘typical of the average discounts offered by the oil companies, based on oil company data’. See, COMPAG 2005 Study, p.39.
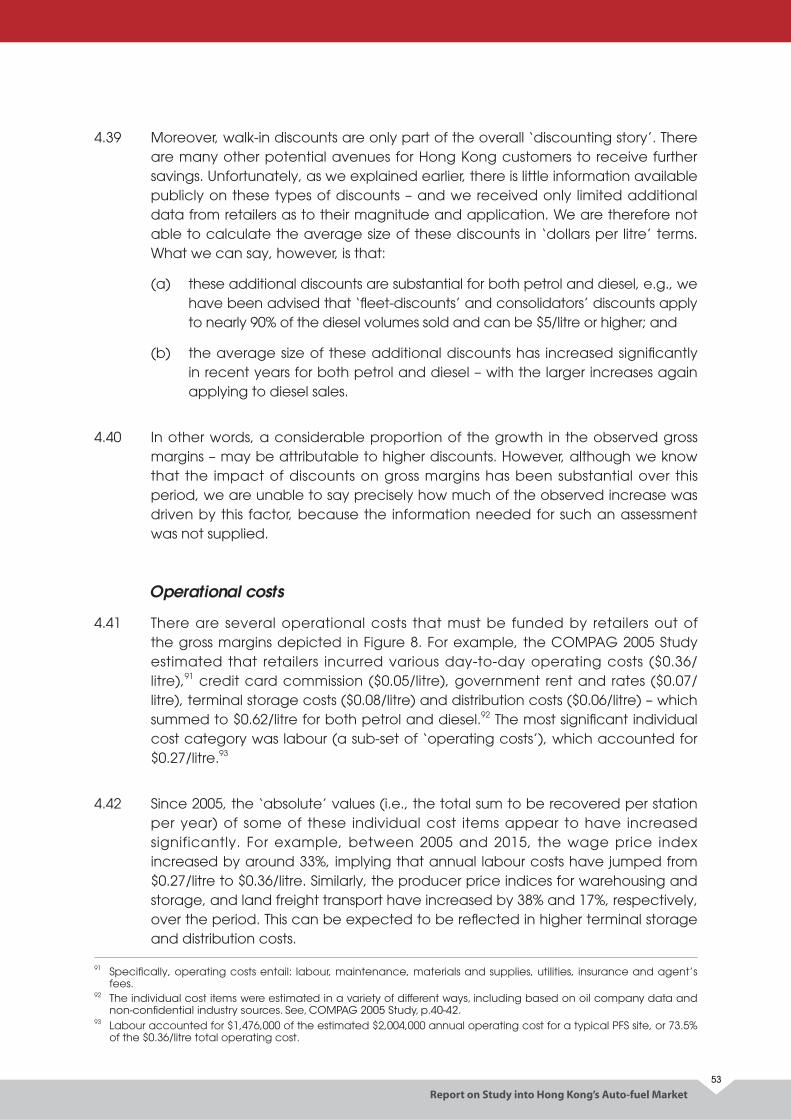
Report on Study into Hong Kong’s Auto-fuel Market53
4.39 Moreover, walk-in discounts are only part of the overall ‘discounting story’. There are many other potential avenues for Hong Kong customers to receive further savings. Unfortunately, as we explained earlier, there is little information available publicly on these types of discounts – and we received only limited additional data from retailers as to their magnitude and application. We are therefore not able to calculate the average size of these discounts in ‘dollars per litre’ terms. What we can say, however, is that:
(a) these additional discounts are substantial for both petrol and diesel, e.g., we have been advised that ‘fleet-discounts’ and consolidators’ discounts apply to nearly 90% of the diesel volumes sold and can be $5/litre or higher; and
(b) the average size of these additional discounts has increased significantly in recent years for both petrol and diesel – with the larger increases again applying to diesel sales.
4.40 In other words, a considerable proportion of the growth in the observed gross margins – may be attributable to higher discounts. However, although we know that the impact of discounts on gross margins has been substantial over this period, we are unable to say precisely how much of the observed increase was driven by this factor, because the information needed for such an assessment was not supplied.
Operational costs
4.41 There are several operational costs that must be funded by retailers out of the gross margins depicted in Figure 8. For example, the COMPAG 2005 Study estimated that retailers incurred various day-to-day operating costs ($0.36/litre),91 credit card commission ($0.05/litre), government rent and rates ($0.07/litre), terminal storage costs ($0.08/litre) and distribution costs ($0.06/litre) – which summed to $0.62/litre for both petrol and diesel.92 The most significant individual cost category was labour (a sub-set of ‘operating costs’), which accounted for $0.27/litre.93
4.42 Since 2005, the ‘absolute’ values (i.e., the total sum to be recovered per station per year) of some of these individual cost items appear to have increased significantly. For example, between 2005 and 2015, the wage price index increased by around 33%, implying that annual labour costs have jumped from $0.27/litre to $0.36/litre. Similarly, the producer price indices for warehousing and storage, and land freight transport have increased by 38% and 17%, respectively, over the period. This can be expected to be reflected in higher terminal storage and distribution costs.
91 Specifically, operating costs entail: labour, maintenance, materials and supplies, utilities, insurance and agent’s fees.
92 The individual cost items were estimated in a variety of different ways, including based on oil company data and non-confidential industry sources. See, COMPAG 2005 Study, p.40-42.
93 Labour accounted for $1,476,000 of the estimated $2,004,000 annual operating cost for a typical PFS site, or 73.5% of the $0.36/litre total operating cost.
Report on Study into Hong Kong’s Auto-fuel Market
54
4.43 On the other hand, retailers are also selling more petrol and diesel at each site. This is significant because, even if operational costs have increased in ‘absolute’ terms, if retailers are also selling more fuel, then those costs may not have changed much – if at all – in ‘dollars per litre’ terms (i.e., the total amount to be recovered per litre sold). As we stated earlier, average annual petrol sales per PFS site increased from 2.6 to 3.8 million litres from 2005 to 2015 – a 46.2% uplift. We understand that average diesel volumes have also increased – but perhaps not by quite as much.
4.44 These increases in throughput could serve to largely – if not wholly – off-set the cost increases described above. For example, the 46.2% increase in average petrol volumes is higher than the 33% increase in the wage price index over the same period, which suggests that ‘per litre’ wage costs may have fallen since 2005.94 Ultimately, the counteracting movements in costs and volumes over the period – and the uncertainties surrounding their respective magnitudes – means we cannot say for certain how operational costs have changed, since 2005.
4.45 However, based on the information that the Commission has examined, in our view, it is reasonable to conclude that operational costs at PFS sites are likely to remain in broadly the same vicinity as they were in 2005, i.e., around $0.50-$0.70/litre. In other words, operational costs may account for around 10-14% and 6-8% of the estimated gross margins for petrol and diesel, respectively.
Land and construction costs
4.46 The COMPAG 2005 Study highlighted that the most significant cost item that retailers incur to sell auto-fuel is the up-front cost of acquiring PFS sites (i.e., land costs). It estimated the then current land costs by looking at the 18 PFS sites leased in the four tender rounds between 2003 and 2005, which fetched an average real price of $78.64 million. These costs were then expressed as an annuity over 21 years, using an estimate of the prevailing risk-free interest rate.95 The resulting land cost estimate was $1.02/litre for both fuels – a very significant sum.
4.47 Figure 9 reveals that, over the last five years, the average price paid for a PFS site has increased by over $90 million, to $170.38 million. Indeed, 15 of the 17 sites tendered during this period fetched prices well above of the $78.64 million figure set out in the COMPAG 2005 Study. To be sure, it could be that some of these stations were particularly well-located, or larger than usual. However, the likelihood that 15 out of the 17 stations were ‘atypically desirable’ – thereby explaining the significant uplift relative to 2005 – seems very slim indeed.
94 Assuming, of course, that retailers have not had to hire new staff to cater for the increase in throughput.95 See, COMPAG 2005 Study, p.40.
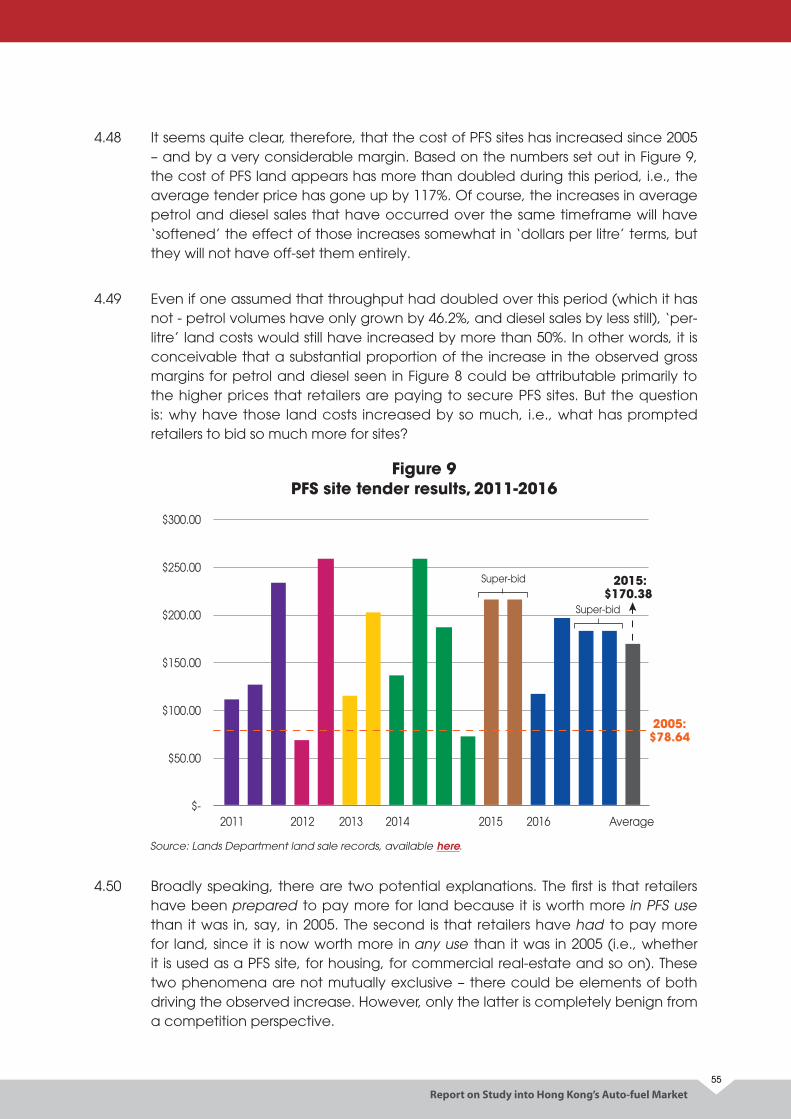
$-
$100.00
$50.00
$150.00
$200.00
$250.00
$300.00
2011 2012 2013 2014 2015 2016 Average
Super-bid 2015:$170.38
2005:$78.64
Super-bid
Report on Study into Hong Kong’s Auto-fuel Market55
4.48 It seems quite clear, therefore, that the cost of PFS sites has increased since 2005 – and by a very considerable margin. Based on the numbers set out in Figure 9, the cost of PFS land appears has more than doubled during this period, i.e., the average tender price has gone up by 117%. Of course, the increases in average petrol and diesel sales that have occurred over the same timeframe will have ‘softened’ the effect of those increases somewhat in ‘dollars per litre’ terms, but they will not have off-set them entirely.
4.49 Even if one assumed that throughput had doubled over this period (which it has not - petrol volumes have only grown by 46.2%, and diesel sales by less still), ‘per-litre’ land costs would still have increased by more than 50%. In other words, it is conceivable that a substantial proportion of the increase in the observed gross margins for petrol and diesel seen in Figure 8 could be attributable primarily to the higher prices that retailers are paying to secure PFS sites. But the question is: why have those land costs increased by so much, i.e., what has prompted retailers to bid so much more for sites?
Figure 9 PFS site tender results, 2011-2016
Source: Lands Department land sale records, available here.
4.50 Broadly speaking, there are two potential explanations. The first is that retailers have been prepared to pay more for land because it is worth more in PFS use than it was in, say, in 2005. The second is that retailers have had to pay more for land, since it is now worth more in any use than it was in 2005 (i.e., whether it is used as a PFS site, for housing, for commercial real-estate and so on). These two phenomena are not mutually exclusive – there could be elements of both driving the observed increase. However, only the latter is completely benign from a competition perspective.
Report on Study into Hong Kong’s Auto-fuel Market
56
4.51 If retailers are driving land prices up because they perceive that the potential ‘downstream’ profits that they can make from retailing auto-fuel have increased – setting aside any overall increase in Hong Kong land prices (the second potential explanation) – then this may be symptomatic of a ‘softening’ of competition. Specifically, if retail competition has waned, increasing the available downstream retail margins, then this could have increased the ‘upstream’ price that firms have been prepared to pay for PFS sites. However, the Commission notes that:
(a) while certainly plausible, it might still be considered somewhat unusual for a reduction in downstream competition (i.e., less rivalry between retailers) to be accompanied by an increase in upstream competition for the sale of PFS sites (i.e., more fierce bidding and higher prices) – arguably the more likely scenario would be less competition at both levels, i.e., higher retail prices coupled with lower land prices; and
(b) even if retailers have indeed driven up land premiums in this way (rather than it simply reflecting increases in overall land prices), they would not be the ultimate beneficiaries – those increased returns on land flow into the Government’s coffers, where they are then used to finance public spending programs (i.e., the funds flow from motorists, to the retailers, to the Government and then back to the public).
4.52 In the Commission’s view, it is conceivable that the significant increase in PFS site costs between 2005 and 2016 is, in fact, attributable primarily to the second potential driver listed above, i.e., the general upward trend in all land prices throughout Hong Kong. As we explained earlier, Hong Kong’s unique topography means that land is in very high demand – for all potential uses – and a premium must therefore be paid to secure the prime locations. At the margin, PFS sites are ultimately competing with all other conceivable uses for ‘investor dollars’.
4.53 Put simply, if investors could make significantly more ‘per square metre’ by building a block of residential apartments on a site, or constructing a commercial office building, then why would they sink capital into a PFS site (assuming the land could be used for all those purposes)? This competition between alternative uses must inevitably be reflected in auto-fuel retail prices. It follows that if land costs are increasing ‘across the board’ in all uses, this should also result in higher tenders for PFS sites as well.
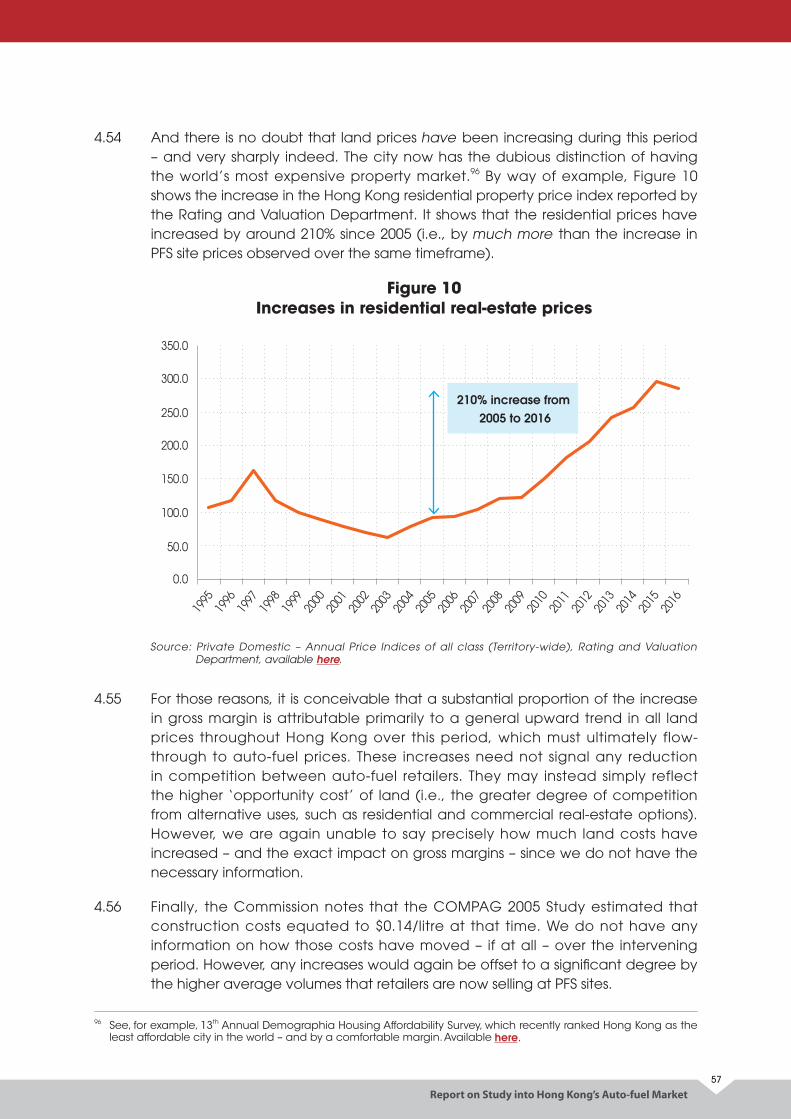
0.0
50.0
150.0
100.0
250.0
350.0
200.0
300.0
1995
1996
1997
1998
1999
2000
2001
2002
2003
2004
2005
2006
2007
2008
2009
2010
2011
2012
2013
2014
2015
2016
210% increase from 2005 to 2016
Report on Study into Hong Kong’s Auto-fuel Market57
4.54 And there is no doubt that land prices have been increasing during this period – and very sharply indeed. The city now has the dubious distinction of having the world’s most expensive property market.96 By way of example, Figure 10 shows the increase in the Hong Kong residential property price index reported by the Rating and Valuation Department. It shows that the residential prices have increased by around 210% since 2005 (i.e., by much more than the increase in PFS site prices observed over the same timeframe).
Figure 10 Increases in residential real-estate prices
Source: Private Domestic – Annual Price Indices of all class (Territory-wide), Rating and Valuation Department, available here.
4.55 For those reasons, it is conceivable that a substantial proportion of the increase in gross margin is attributable primarily to a general upward trend in all land prices throughout Hong Kong over this period, which must ultimately flow-through to auto-fuel prices. These increases need not signal any reduction in competition between auto-fuel retailers. They may instead simply reflect the higher ‘opportunity cost’ of land (i.e., the greater degree of competition from alternative uses, such as residential and commercial real-estate options). However, we are again unable to say precisely how much land costs have increased – and the exact impact on gross margins – since we do not have the necessary information.
4.56 Finally, the Commission notes that the COMPAG 2005 Study estimated that construction costs equated to $0.14/litre at that time. We do not have any information on how those costs have moved – if at all – over the intervening period. However, any increases would again be offset to a significant degree by the higher average volumes that retailers are now selling at PFS sites.
96 See, for example, 13th Annual Demographia Housing Affordability Survey, which recently ranked Hong Kong as the least affordable city in the world – and by a comfortable margin. Available here.
Report on Study into Hong Kong’s Auto-fuel Market
58
Non-fuel sales
4.57 A final piece of the ‘margins story’ that is worth mentioning briefly is non-fuel sales. In Hong Kong, these are immaterial. This is partly because there is often little room to devote to items such as snack food and drinks given the limited space at many PFS sites, and partly because most motorists do not to get out of their cars when filling up at Hong Kong’s ‘full-service’ sites. The COMPAG 2005 Study estimated that the net margin on non-fuel sales was only $0.04/litre at that time.
4.58 In other international markets, customers tend to serve themselves at the bowser, and then go into the store to pay. Once inside, it is common for them to find a large space devoted to non-fuel items. The margins that retailers earn on those products tend to be very high which, given the prevalence of such sales across sites, places downward pressure on the prices that they can charge for fuel. The COMPAG 2005 Study found that non-fuel margins were around $0.22/litre in the United States, and $0.30/litre in Singapore, Sydney, London and Amsterdam.
4.59 The relatively limited opportunity to increase the volume of non-fuel sales, given Hong Kong’s unique characteristics, limits the potential revenue streams across which to offset the various costs described above. In short, retailers must earn virtually all their profits from fuel sales. This serves as a further contributing factor to the high prices observed in Hong Kong, relative to other markets.
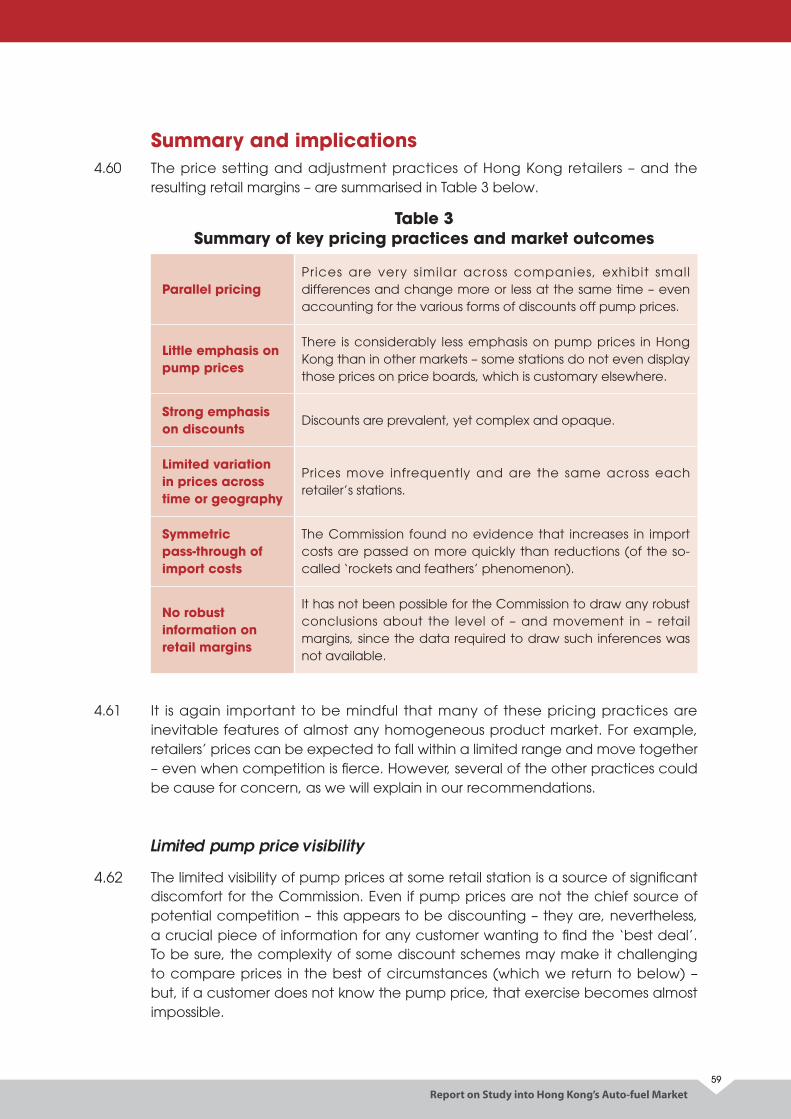
Report on Study into Hong Kong’s Auto-fuel Market59
Summary and implications4.60 The price setting and adjustment practices of Hong Kong retailers – and the
resulting retail margins – are summarised in Table 3 below.
Table 3 Summary of key pricing practices and market outcomes
Parallel pricingPrices are very similar across companies, exhibit small differences and change more or less at the same time – even accounting for the various forms of discounts off pump prices.
Little emphasis on pump prices
There is considerably less emphasis on pump prices in Hong Kong than in other markets – some stations do not even display those prices on price boards, which is customary elsewhere.
Strong emphasis on discounts
Discounts are prevalent, yet complex and opaque.
Limited variation in prices across time or geography
Prices move infrequently and are the same across each retailer’s stations.
Symmetric pass-through of import costs
The Commission found no evidence that increases in import costs are passed on more quickly than reductions (of the so-called ‘rockets and feathers’ phenomenon).
No robust information on retail margins
It has not been possible for the Commission to draw any robust conclusions about the level of – and movement in – retail margins, since the data required to draw such inferences was not available.
4.61 It is again important to be mindful that many of these pricing practices are inevitable features of almost any homogeneous product market. For example, retailers’ prices can be expected to fall within a limited range and move together – even when competition is fierce. However, several of the other practices could be cause for concern, as we will explain in our recommendations.
Limited pump price visibility
4.62 The limited visibility of pump prices at some retail station is a source of significant discomfort for the Commission. Even if pump prices are not the chief source of potential competition – this appears to be discounting – they are, nevertheless, a crucial piece of information for any customer wanting to find the ‘best deal’. To be sure, the complexity of some discount schemes may make it challenging to compare prices in the best of circumstances (which we return to below) – but, if a customer does not know the pump price, that exercise becomes almost impossible.
Report on Study into Hong Kong’s Auto-fuel Market
60
4.63 In the Commission’s view, it is vital for customers to be able to quickly ascertain pump prices by observing prominently displayed price boards. This may assist significantly the ‘price discovery’ process and better enable customers to shop around. Moreover, any improvement in the visibility of pump prices as well as walk-in discounts which are available to all is unlikely to risk giving rise to more coordination between retailers – or explicit collusive agreements – since discounts are likely to continue to be prevalent, and they would be very difficult for retailers to monitor.
Emphasis on complex discounts
4.64 Even if pump prices and walk-in discounts were more visible, Hong Kong retailers’ emphasis on complex discount schemes would still make it challenging for customers to compare prices. These discounts may therefore make customers ‘stickier’ than in other markets, which means they are less likely to switch between retailers when pump prices change. That additional customer inertia could, in turn, serve to limit the degree of rivalry between suppliers. A question mark also remains over the ubiquity of the observed discounting practices and the associated ‘price smoothing’. In a vigorously competitive market, one might expect to observe at least one firm ‘break from the pack’ by, say:
(a) offering universally lower pump prices;
(b) setting different prices at different stations; and/ or
(c) passing on input cost changes more quickly.
4.65 Indeed, firms in other markets characterised by loyalty-based competition often see an advantage in competing on a different basis (e.g., credit card companies may offer a low interest rate but no rewards scheme). The fact that no Hong Kong retailer has tried a similar strategy might therefore indicate that competition falls short of being ‘vigorously effective’. To be clear, that is not to say that retailers are colluding, or not setting their prices independently. It may simply be that, over time, the vigour of competition between those relatively equally-matched firms – all of whom have similar cost structures97 – has waned.
4.66 Certain market ‘norms’ may have consequently emerged – competing primarily based on complex discounts, rather than pump prices, being the most obvious example. Put simply, the market might have matured into a ‘comfortable oligopoly’ – of which there are myriad examples, internationally. There may consequently be relatively little for any incumbent firm to gain by departing from the long-standing pricing practices, since they may perceive that any near-term competitive advantage they could obtain from doing so would be quickly eliminated, when the other retailers inevitably followed suit.
97 For example, the vertically integrated retailers import the same fuels from the same place, store them in the same place and each face the same constraints imposed by Hong Kong’s unique topography, which limit the ability to differentiate their offerings (e.g., by increasing their sales of ‘non-fuel’ items).
Report on Study into Hong Kong’s Auto-fuel Market61
4.67 Alternatively, the adoption of the same discounting practices may simply reflect that this is the best way for all firms to compete, in which case the uniformity may indicate strong competition. For example, the small number of private drivers may mean that it is very important for retailers to secure business from the commercial sectors (e.g., fleet customers). Attempting to lock-in repeat business from large commercial diesel and petrol customers through loyalty schemes may therefore be a sound business strategy for all businesses. It is also worth noting that:
(a) the fact that discounts vary by company suggests that oil companies are making decisions about pricing independently; and
(b) the nature of the discount schemes substantially hinders the ability of firms in this market to collude.98
4.68 Ultimately, we have been unable to reach a firm conclusion on this point. Moreover, even if retailers’ discounting practices are symptomatic of a ‘comfortably oligopoly’, that is not readily susceptible to direct regulatory reform in any case. The best solution to any such problem lies instead in reducing any enduring structural barriers to entry and expansion. Indeed, a smaller retailer – e.g., a new entrant – with fewer (or zero) ‘existing profits’ to worry about is the most likely candidate to ‘break from the pack’ and adopt a different pricing strategy, if there is a competitive edge to be gained from doing so.
4.69 Specifically, if it can be made easier for new entrants to acquire a sufficient network of PFS sites and economically priced imports (e.g., through reasonably priced terminal storage) – the two main impediments identified in chapter 2 – the more likely it is that the observed pricing dynamics will change, if they are indeed symptomatic of less-than-vigorous competition. Moreover, as we explained above, reducing structural barriers to entry could also lead to more product differentiation, e.g., a new entrant may be more inclined than the incumbent retailers to offer 95 RON octane petrol as a cheaper alternative to the existing premium products.
98 It would be very difficult for retailers to know if they were all ‘sticking to’ a collusive agreement, given the clear scope for secret discounting that would be very hard – perhaps even impossible – to detect.
Report on Study into Hong Kong’s Auto-fuel Market
62
5. RECOMMENDATIONS
5.1 The analysis set out in the preceding chapters highlights several impediments to further competition in the Hong Kong auto-fuel market. Some of these are structural in nature – e.g., the challenges firms face obtaining a network of PFS sites and a supply of imported auto-fuel – and others relate to the way retailers set prices, and the difficulties customers have in comparing them. Below, we set out some steps that could be taken in the short-term to reduce these barriers at relatively little cost. We then set out some more substantial reforms entailing greater costs and risks that might be considered in the longer-term.
Short-term options5.2 In the Commission’s opinion, there are four reforms that could be undertaken
almost immediately and which may serve to enhance competition with relatively little downside risk. The first is to promote greater choice for consumers by simply mandating the sale of alternative cheaper products like 95 RON octane petrol.
5.3 As we explained earlier, the Commission is not persuaded by retailers’ claims that they sell only 98 RON petrol because that is all that customers want to buy. Indeed, our view is well supported by the recent consumer preference survey where a vast majority (86.2%) of the respondents said that they are likely to switch to the petrol with lower octane level than 98 RON petrol if it is 10% cheaper, while close to half (45.7%) of the respondents will definitely / are very likely to make the switch. Also, another survey on car types in Hong Kong confirmed that more than 99% of the petrol engine cars sampled can use 95 RON petrol. According to many experts, the difference in performance relative to 95 RON petrol is negligible for most modern cars. We consider that many consumers might purchase 95 RON petrol, if given the option. Indeed, it is commonly sold in other international markets – much more so than 98 RON petrol. In fact, the Commission understands that the Government had written to oil companies in 2010 encouraging them to supply petrol of different octane numbers to the Hong Kong market.
5.4 Although there may be challenges to overcome, the Government should consider whether mechanisms are available to mandate the re-introduction of 95 RON petrol in some way. For example, offering 95 RON petrol could be made a condition of lease of PFS site. Such supply might be conditional upon there being sufficient space, or it might not. If there was no such conditionality, 95 RON petrol would then be the ‘default’ fuel option at those sites and 98 RON would then become an ‘optional’ premium product – supplied only if there is space. Alternatively, the Government could specify that particular sites which are put up for tender should supply 95 RON exclusively.
Report on Study into Hong Kong’s Auto-fuel Market63
5.5 Any requirement to offer 95 RON petrol would need to also consider how any additional terminal storage requirements would be met. The potential options here include two of those listed subsequently in Recommendation 5, e.g., a Government-owned open-access facility, or a facility operated by a third-party and offered to ‘all-comers’. All the potential challenges associated with those options that were raised below would apply equally here, and would need to be addressed if this course of action were to be pursued.
5.6 Of course, there remains yet another alternative – if enough demand for 95 RON petrol is generated by car owners in Hong Kong, oil companies will have to consider ways to meet this demand and one possibility would be to withdraw one of the two varieties of 98 RON petrol to make way for 95 RON petrol at least in some of their PFS sites.
5.7 The Commission is also of the view that re-introducing 95 RON petrol will not only provide more and likely cheaper options to drivers, it may also put competitive pressure on the sales of existing 98 RON petrol, possibly leading to lower prices and benefiting those consumers who will choose to continue to use 98 RON petrol.
RECOMMENDATION 1
The Government should facilitate the re-introduction of 95 RON petrol by considering making it a lease condition for new PFS sites or those sites which are for re-tender and exploring various storage options.
5.8 The second short-term reform concerns the system surrounding the designation and conversion of sites for PFS use. Demand for auto-fuel has grown considerably over the past decade (net imports of unleaded petrol are up by around 50%) but yet there are only eight more PFS sites today than there were in 2005 (an increase of less than 5%). This discrepancy is conspicuous. It suggests that the system by which land is earmarked for PFS sites is not functioning effectively and that it remains too difficult to convert privately-held land to PFS use.
5.9 If the processes for the designation and conversion of sites for PFS use could be reformed so that more are made available when overall demand is increasing, then this could reduce barriers to entry. Presently, this structural characteristic may be serving as an impediment to additional competition.
RECOMMENDATION 2
The Government should enable more sites for PFS use to be tendered and/ or converted.
Report on Study into Hong Kong’s Auto-fuel Market
64
5.10 Thirdly, with the leases of 28 PFS sites expiring in 2018, this is an opportune time for the Government to review the tendering system for such sites with a view to introducing more competition to the Hong Kong auto-fuel market. Back in 2000, the Government introduced a laudable new tendering arrangement that allowed firms with no import licences to bid for PFS sites and also enabled them to submit “super bids” to gain a critical mass of stations within a short time to better compete with incumbents. In light of the findings in this study, the Commission is of the view that there is room for further enhancements and the timing is right for the Government to engage different stakeholders in such a review. Indeed, there have been no shortage of suggestions from different quarters on alternative ways of tendering for PFS sites over the years. For example, the Government had been asked to consider applying a system similar to how Liquefied Petroleum Gas (LPG) suppliers bid for LPG filling stations to PFS.
RECOMMENDATION 3
The Government should engage different stakeholders and initiate a review of the tendering system for PFS sites.
5.11 Fourthly, every PFS site in Hong Kong should display its current headline prices and walk-in discounts on a prominent price board that can be easily read by passing motorists. Without such boards, a motorist will be deprived of an easy and direct way of knowing the pump prices and the walk-in discounts being offered by different stations – including during those crucial windows of time when prices are moving.
5.12 The Commission acknowledges that it may still be difficult for customers to gauge perfectly the price differentials across retailers if the existing complex discounting regimes persist. However, ‘difficult’ is clearly preferable to ‘impossible’. In our view, the potential benefit of enabling customers to ‘shop around’ more easily justifies any additional costs that retailers would need to incur erecting boards at those sites that do not currently have them. Moreover, the risk of facilitating greater price coordination is minimal, given the prevalence of discounting.99
5.13 Again, the recent consumer preference survey indicated that almost 70% of respondents supported the display of price information on prominent boards at auto-fuel stations.
RECOMMENDATION 4
The auto-fuel retailers should display the prevailing pump prices and walk-in discounts for their petrol and diesel products on prominent boards that can be read by passing motorists at every PFS site.
99 As we noted above, it would be very difficult for retailers who was ‘sticking to’ any collusive agreement, given the clear scope for secret discounting that would be very hard – if not impossible – to detect.
Report on Study into Hong Kong’s Auto-fuel Market65
Longer-term options 5.14 Substantial enhancements in competition between retailers are unlikely to occur
in the longer-term unless it is easier for smaller firms – including new entrants – to source competitively priced imports and terminal storage. Indeed, the existing competitive norms (e.g., the emphasis on discounts, the ‘smoothing’ of prices, the exclusive sale of 98 RON octane petrol, etc.) are most likely to be challenged by a new entrant, or a smaller competitor with fewer ‘existing profits’ at stake.
5.15 However, the opportunities for that kind of entry and expansion are limited at present. Building terminal storage or renting it from existing owners may simply not be feasible, for the reasons we set out in chapter 3. Yet, without it, entrants are forced to buy their fuel from other retailers, placing them at a significant competitive disadvantage. The Government may therefore wish to explore alternative ways of providing economically priced terminal storage, to enable new entrants to import their own supplies of auto-fuel. The potential options include:
(a) introducing an access regime whereby companies with existing terminal facilities are required to allow third parties access to those facilities on regulated terms, subject to capacity being available; or
(b) introducing a new ‘open access’ facility that might be built and operated by a third party – the Government could put the proposal to tender, and mandate criteria such as the price that the operator would offer to retailers.
5.16 To be sure, a multitude of potential considerations would need to be considered before any of these options was implemented. Some of the key factors that would need to be weighed up include the following:
(a) each of the options would entail considerable additional costs (e.g., designing, consulting upon and administering the approach) and many of these would fall upon the Government;
(b) questions would need to be resolved as to how firms would co-mingle and ‘share’ products in any ‘shared’ facility – this raises complex questions about quality and liability;
(c) if an access regime is introduced, it would be necessary to define when capacity was ‘available’ and when it was not, which would be challenging and could give rise to opportunities for strategic conduct; and
(d) entrants may still be at a distinct cost disadvantage even with terminal storage – at least initially – since shipping costs vary considerably with the size of the tanker and they are unlikely to be able to justify 30,000 tonne shipments.
Report on Study into Hong Kong’s Auto-fuel Market
66
5.17 For the avoidance of doubt, the Commission is not recommending that the Government necessarily pursue any of these options100 – indeed, the factors set out above (and many others that are not listed) could well mean that the costs outweigh the benefits. We are simply suggesting that there could be merit in exploring them in more detail, since significant changes to the competitive landscape of the retail market are unlikely to occur whilst the upstream structural barriers to obtaining economically-priced imports persist.
5.18 The exploration of options might even look beyond the terminal storage level to alternative sources of supply. For example, given Hong Kong's proximity to the Mainland, it may be possible for fuels to be imported via a pipeline that could be constructed from Shenzhen to Hong Kong – with a bonded warehouse situated along the border on the Hong Kong side. There again seems to be no obvious downside to exploring whether these alternative ’structural’ solutions might serve to deliver long-term benefits in the form of increased retail competition that outweigh their costs.
5.19 If any of the options set out above could make it easier for new entrants to acquire access to economically priced imports, the more likely it is that significant change will be seen in the retail market. For instance, reducing this structural barrier to entry could lead to different pricing approaches (e.g., less emphasis on discounting) and more product differentiation. For example, a new entrant may be more inclined than the incumbent retailers to offer 95 RON octane petrol as a cheaper alternative to the existing premium products.
RECOMMENDATION 5
The Government should explore whether potential ’structural’ reform options – such as various interventions at the terminal storage and alternative source of auto-fuel supply, could deliver benefits through increased retail competition that outweigh the attendant costs and risks.
5.20 Finally, another long-term recommendation is more general in nature and concerns the way in which market studies are undertaken. Presently, the Commission does not have the power to compel parties to produce information when conducting such studies. We must rely instead on their willingness to cooperate. The potential problem this creates has been self-evident throughout this report. We did not always receive the data we requested from parties, and the resulting ‘gaps’ have prevented us from undertaking some analyses with the degree of rigour required to draw robust inferences – the assessment of retail margins being the clearest example.
100 Indeed, we note that the COMPAG 2005 Study examined each of these options – albeit only briefly – and chose not to recommend them. See, COMPAG 2005 Study, p.82.
Report on Study into Hong Kong’s Auto-fuel Market67
5.21 At present, 58 out of 60 competition authorities (over 96%)101 which carry out market studies, enjoy some sort of power to request information. Power includes authorization provided by law to competition authorities to request information to be provided by stakeholders, whether such authorization is expressed on general (“to protect competition”) or specific terms (“for the purpose of carrying out market studies”). The ability to exercise such powers have been found to be vital to many important studies which have been undertaken and led to positive changes in relevant markets.
5.22 Future market studies would therefore be assisted if the Commission has compulsory information gathering powers so that the same problems do not recur. After all, the purpose of such studies is to obtain information about how a market functions to see whether potential problems exist. If businesses can simply refuse to provide it, that can serve to undermine that fundamental objective. Provided sensible limits are placed upon what the Commission can ask for and how it is reported, we believe that parties should be compelled to furnish the information required to undertake the relevant analyses.
RECOMMENDATION 6
The Commission should be provided with information gathering powers that would compel the production of materials when undertaking future market studies, provided no undue burden is placed on those parties and confidentiality is protected appropriately.
101 OECD (2016), The Role of Market Studies as a Tool to Promote Competition, p.12. Available here.
Report on Study into Hong Kong’s Auto-fuel Market
68
6. APPENDIX: ANALYSIS OF INPUT COST PASS-THROUGH
6.1 One feature of retail auto-fuel markets is that consumers are generally well-informed about changes in the price of the main input into retail fuels: crude oil. They therefore expect to see retail fuel prices following the publicly reported movements in oil prices. An allegation that is levelled frequently at oil companies is that they swiftly increase their retail prices following increases in input costs (e.g., when crude oil prices go up), but do not reduce them as quickly and/ or by as much when their input costs fall.
6.2 This phenomenon is known as ‘asymmetric pass-through’ or, more colloquially, as ‘rockets and feathers’, because prices are said to rise sharply, like rockets, when input costs increase, but drift down slowly, like feathers, when they fall. There is now a substantial body of academic research that has investigated this matter in many markets – including auto-fuel. In this appendix, we review the most relevant of these academic contributions, describe the methodology that the Commission has applied to test empirically for the phenomenon in Hong Kong, and report our results.
Overview of the literature and findings elsewhere6.3 An early influential study by Borenstein et al. (1997, henceforth: BCG (1997))102 sets
out what has become the basic methodological framework for empirical analysis of asymmetric pass-through. The study also includes a thorough discussion of the possible causes the phenomenon.
6.4 The authors find that reductions in crude oil prices are passed-on to a lesser extent than increases. To better understand the point in the vertical chain at which this asymmetry originates, they systematically analyse the transmission of costs throughout the vertical chain, starting at ‘the top’ (i.e., the crude oil price) and working their way down to the final retail price. The authors find evidence of the ‘rockets and feathers’ phenomenon in some parts of the vertical chain, including:
(a) between crude oil prices and wholesale gasoline prices at the city terminal; and
(b) between wholesale city terminal prices and retail prices.
6.5 The authors also discuss some possible explanations for asymmetric pass-through. Their candidate explanations are:
(a) costly production/inventory changes;
(b) consumer search behaviour; and
(c) tacit coordination between suppliers (on a focal price).
102 Borenstein, Severin, A. Colin Cameron, and Richard Gilbert (1997), Do gasoline prices respond asymmetrically to crude oil price changes?, Quarterly Journal of Economics, 112(1), p.305–339.
Report on Study into Hong Kong’s Auto-fuel Market69
6.6 These explanations have different relevance for each step of the vertical chain. In the context of our study, the transmission to retail prices is clearly the most relevant, since Hong Kong has no refineries and all auto-fuel is imported. For that reason, consumer search behaviour and tacit coordination appear to be the most germane potential explanations.
6.7 It is worth noting that a later study by Bachmeier & Griffin (2003)103 failed to confirm some of the results reported by BCG (1997). Using daily instead of weekly data and a slightly modified statistical model, the authors found no evidence of asymmetric pass-through from crude oil to regional (wholesale) spot gasoline prices.
6.8 Importantly, unlike BCG (1997), the paper does not analyse the transmission to retail prices, which is the most relevant for the Hong Kong market. However, the paper does clearly demonstrate that the level of aggregation of the underlying data and the choice of statistical model can have a substantial impact on the findings.104
6.9 Several more recent studies utilise less aggregated data to investigate asymmetric pass-through. Chesnes (2012)105 uses daily prices at all levels of the value chain for several different cities in the United States. He investigates asymmetric pass-through using an error correction framework much like that employed in BCG (1997) and Bachmeier & Griffin (2003). Using daily average retail prices from 27 metropolitan areas, Chesnes finds a pronounced asymmetry in pass-through from (wholesale) rack prices to retail prices. More specifically, he finds that retail prices move 3.4 times more quickly when the upstream price rises than when it falls. No other evidence of rockets-and-feather pricing is found in other parts of the supply chain.
6.10 Faber (2015)106 analyses asymmetric pass-through using daily station level data from the Netherlands collected over a period of 783 days between 2006 and 2008 from about 3600 sites. Using an error-correction framework, the author finds evidence of rockets-and-feathers pricing from wholesale spot gasoline to retail prices for 38% of the stations in the dataset. This asymmetry only lasted for 1 or 2 days. Faber’s results show that ‘pass-through’ behaviour may differ across stations, and so aggregating data across stations may distort the results when analysing asymmetric pass-through (although, this is less of an issue in Hong Kong, given the uniformity of pricing across retailers’ networks of stations).
103 Bachmeier, Lance J. and James M. Griffin (2003), New evidence on asymmetric gasoline price responses, Review of Economics and Statistics, 85(3), p.772–776.
104 The Commission has therefore analysed the available data at lowest possible level of aggregation. See sections below for more details.
105 Chesnes, Matthew (2012), Asymmetric pass-through in U.S. gasoline prices, U.S. Federal Trade Commission Bureau of Economics Working Paper, No.302.
106 Faber, Riemer P. (2015), More New Evidence on Asymmetric Gasoline Price Responses, Energy Journal, 36(3), p.287–307.
Report on Study into Hong Kong’s Auto-fuel Market
70
6.11 Remer (2015)107 analyses a dataset of daily, station level prices collected between July 2008 and July 2009 from over 11,000 stations located in several states on the East and West coasts of the United States. Using the standard empirical framework established in BCG (1997), Remer finds clear evidence of asymmetric pass-through from wholesale fuel price changes to retail fuel prices. Remer’s results indicate that a positive wholesale price change of 10 cents results in an immediate increase in the retail price of 0.8 cents on the same day. However, when there is a negative wholesale price change of identical magnitude, the retail price remains virtually unchanged (-0.003 cents) at first. Furthermore, the impact of wholesale price increases on the retail price remains stronger (compared with the impact of wholesale price decreases) for at least 8 days.
6.12 Competition authorities throughout the world have also investigated asymmetric pass-through in retail fuel markets. In 2012, the Spanish competition authority published a report on the retail fuel market. The report includes an analysis of asymmetric pass-through and finds evidence of rockets-and-feathers pricing.108
6.13 In 2011, the Competition Commission of Singapore (“CCS”) published a report laying out the findings of an inquiry into the retail petrol market.109 Among other things, the CCS analysed possible rockets-and-feathers pricing. More specifically, it analysed the transmission of (weekly) crude oil price changes to (weekly) retail prices. The CCS did not find evidence of asymmetric pass-through.
6.14 The United Kingdom Office of Fair Trading (“OFT”) analysed asymmetric pass-through in the context of its call for information on the market in 2013.110 The empirical approach follows closely Chesnes’ methodology. The analysis was carried out at different levels of aggregation: at the national level using weekly data as well as at the level of local areas using both daily and weekly data. It was also carried out for two different pairs of prices in the vertical chain: crude oil to wholesale fuel and wholesale to retail fuel. The analysis was conducted for petrol and diesel. Overall, the OFT did not find clear evidence of rockets-and-feathers pricing.
6.15 To see if there is evidence for the oft-alleged rockets-and-feathers pricing phenomenon in Hong Kong, the Commission has applied the econometric framework pioneered in BCG (1997) that underlies most of the studies cited above. The following section describes our analysis in more detail.
107 Remer, Marc (2015), An empirical investigation of the determinants of asymmetric pricing, International Journal of Industrial Organization, 42, p.46–56.
108 Spain’s National Authority for Markets and Competition (CNMC), 2012. Available here (in Spanish).109 Competition Commission of Singapore (2011), An inquiry into the retail market study in Singapore. Available here. 110 Office of Fair Trading (2013), Pattern asymmetry in the pass-through of input price shocks in the UK road fuels
sector, Annex E to UK petrol and diesel sector: an OFT call for information.
Report on Study into Hong Kong’s Auto-fuel Market71
Methodology 6.16 To test for the presence of symmetric pass-through, we follow the approach
that was first proposed in BCG (1997) and extended/modified by Bachmeiner & Griffin (2003). It has since been used (sometimes with slight modifications) in a wide range of studies.111 The model explains changes in current retail prices by current and past changes in wholesale prices as well as past changes in retail prices. By analysing negative and positive changes separately, it is possible to draw conclusions on asymmetric pass-through.
6.17 More specifically, consistent with the empirical literature, we use an ‘error correction framework’ to model asymmetric pass-through. This modelling approach starts from a stable long-run relationship between retail prices and costs (that is, crude oil prices or wholesale fuel prices), but then allows prices to deviate temporarily from this ‘steady state’ in the shorter term. These short-run adjustments may take place in an asymmetric fashion, revealing the rockets and feathers phenomenon.
6.18 In econometric terms, the model starts from the upstream and downstream price series, which are co-integrated. In technical parlance, a prerequisite for this is that individual prices are ‘non-stationary in levels’, but ‘integrated of order one’ so that their contemporaneous changes – that is, their ‘first order differences’ – are stationary. In more simple terms, this means that while the upstream and downstream prices may not be at the same level (i.e., they are ‘non-stationary in levels’), they should move together over the long-term (i.e., they are ‘stationary’ in terms of their ‘first order differences’). The Commission confirmed that the relevant data exhibited all these characteristics, using the standard statistical tests.112
6.19 From an economic perspective, the expectation is usually that, in the long-run, all changes in crude oil/wholesale fuel prices will be reflected fully in the associated retail prices. Or, in more formal econometric vernacular, that the co-integrating relationship between the upstream and downstream prices is close to 1113.
111 The pioneering study was published by Borestein et al. (1997). However, there have been several closely related papers since then that implement a variation of their approach. Our analysis follows closely to that of Chesnes (2012) and that of the OFT (2013).
112 In particular, the Commission applied the Dickey Fuller tests to the cost and price time series, as well as on the residuals from a regression of price on cost.
113 Otherwise, margins would be ever increasing or ever decreasing in the long-run.
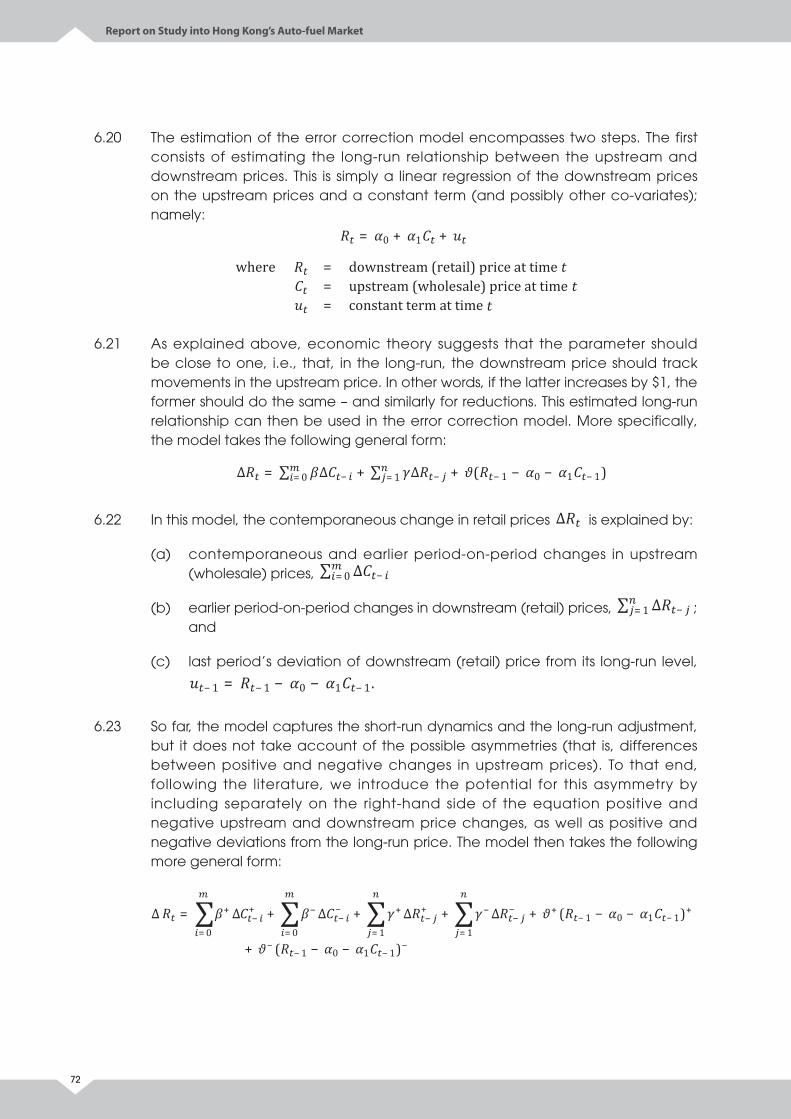
Report on Study into Hong Kong’s Auto-fuel Market
72
6.20 The estimation of the error correction model encompasses two steps. The first consists of estimating the long-run relationship between the upstream and downstream prices. This is simply a linear regression of the downstream prices on the upstream prices and a constant term (and possibly other co-variates); namely:
6.21 As explained above, economic theory suggests that the parameter should be close to one, i.e., that, in the long-run, the downstream price should track movements in the upstream price. In other words, if the latter increases by $1, the former should do the same – and similarly for reductions. This estimated long-run relationship can then be used in the error correction model. More specifically, the model takes the following general form:
6.22 In this model, the contemporaneous change in retail prices is explained by:
(a) contemporaneous and earlier period-on-period changes in upstream (wholesale) prices,
(b) earlier period-on-period changes in downstream (retail) prices, ; and
(c) last period’s deviation of downstream (retail) price from its long-run level,
6.23 So far, the model captures the short-run dynamics and the long-run adjustment, but it does not take account of the possible asymmetries (that is, differences between positive and negative changes in upstream prices). To that end, following the literature, we introduce the potential for this asymmetry by including separately on the right-hand side of the equation positive and negative upstream and downstream price changes, as well as positive and negative deviations from the long-run price. The model then takes the following more general form:
= 0 + 1 +
where = downstream (retail) price at time= upstream (wholesale) price at time = constant term at time
∆ = ∑ ∆ −= 0 + ∑ ∆ −= 1 + ( − 1 − 0 − 1 − 1)
∑ ∆ −= 0
∑ ∆ −= 1
− 1 = − 1 − 0 − 1 − 1.
∑ ∑ ∑ ∑= +−
+
= 0
+ − ∆∆∆ −−
= 0
+ +∆ −+
= 1
+ − ∆ −−
= 1
+ + ( − 1 − 0 − 1 − 1)+
+ − ( − 1 − 0 − 1 − 1)−
∆ + / ∆ + and ∆ − / ∆ −
( − 1 − 0 − 1 − 1)+ and ( − 1 − 0 − 1 − 1)−
+
−
+ −
∆
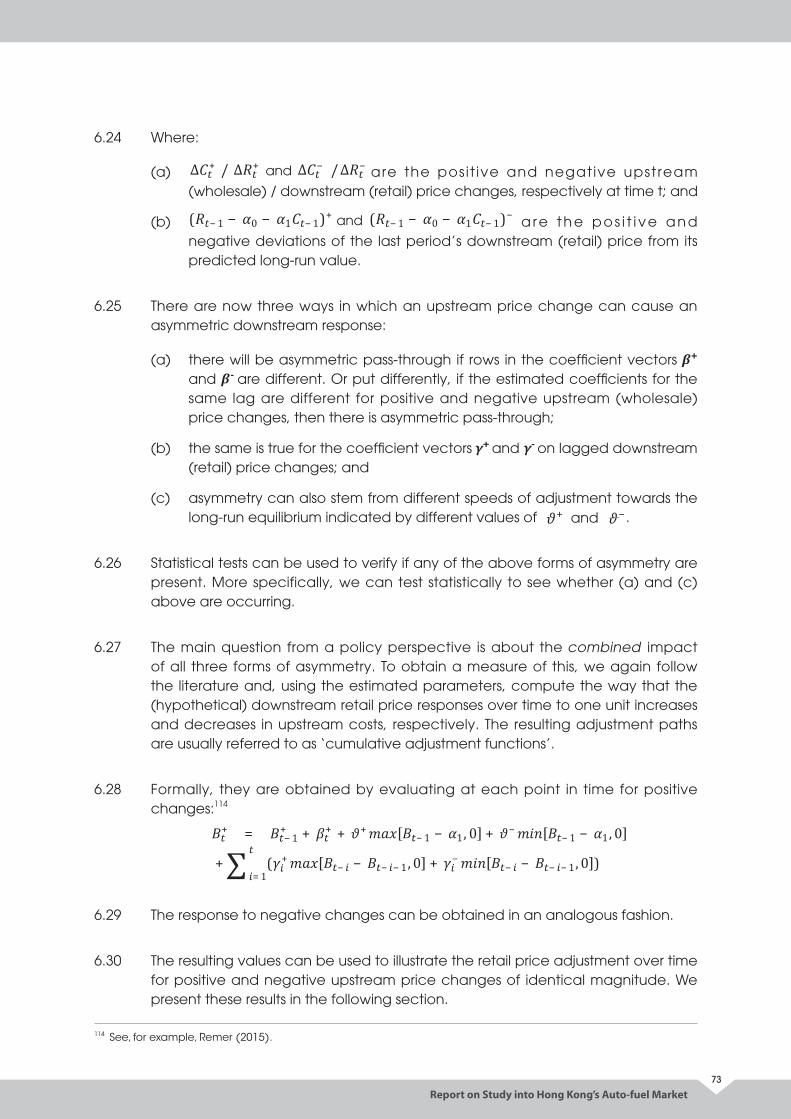
Report on Study into Hong Kong’s Auto-fuel Market73
6.24 Where:
(a) are the posit ive and negative upstream (wholesale) / downstream (retail) price changes, respectively at time t; and
(b) a re t h e p o s i t i v e a n d negative deviations of the last period’s downstream (retail) price from its predicted long-run value.
6.25 There are now three ways in which an upstream price change can cause an asymmetric downstream response:
(a) there will be asymmetric pass-through if rows in the coefficient vectors β+
and β- are different. Or put differently, if the estimated coefficients for the same lag are different for positive and negative upstream (wholesale) price changes, then there is asymmetric pass-through;
(b) the same is true for the coefficient vectors γ+ and γ- on lagged downstream (retail) price changes; and
(c) asymmetry can also stem from different speeds of adjustment towards the long-run equilibrium indicated by different values of .
6.26 Statistical tests can be used to verify if any of the above forms of asymmetry are present. More specifically, we can test statistically to see whether (a) and (c) above are occurring.
6.27 The main question from a policy perspective is about the combined impact of all three forms of asymmetry. To obtain a measure of this, we again follow the literature and, using the estimated parameters, compute the way that the (hypothetical) downstream retail price responses over time to one unit increases and decreases in upstream costs, respectively. The resulting adjustment paths are usually referred to as ‘cumulative adjustment functions’.
6.28 Formally, they are obtained by evaluating at each point in time for positive changes:114
6.29 The response to negative changes can be obtained in an analogous fashion.
6.30 The resulting values can be used to illustrate the retail price adjustment over time for positive and negative upstream price changes of identical magnitude. We present these results in the following section.
114 See, for example, Remer (2015).
= 0 + 1 +
where = downstream (retail) price at time= upstream (wholesale) price at time = constant term at time
∆ = ∑ ∆ −= 0 + ∑ ∆ −= 1 + ( − 1 − 0 − 1 − 1)
∑ ∆ −= 0
∑ ∆ −= 1
− 1 = − 1 − 0 − 1 − 1.
∑ ∑ ∑ ∑= +−
+
= 0
+ − ∆∆∆ −−
= 0
+ +∆ −+
= 1
+ − ∆ −−
= 1
+ + ( − 1 − 0 − 1 − 1)+
+ − ( − 1 − 0 − 1 − 1)−
∆ + / ∆ + and ∆ − / ∆ −
( − 1 − 0 − 1 − 1)+ and ( − 1 − 0 − 1 − 1)−
+
−
+ −
∆
+ −
+ = − 1+ + + + + [ − 1 − 1, 0] + − [ − 1 − 1, 0]
+ ( + [ − − − − 1, 0] + − [ − − − − 1, 0])= 1
∑
and + −
+ = − 1+ + + + + [ − 1 − 1, 0] + − [ − 1 − 1, 0]
+ ( + [ − − − − 1, 0] + − [ − − − − 1, 0])= 1
∑
and
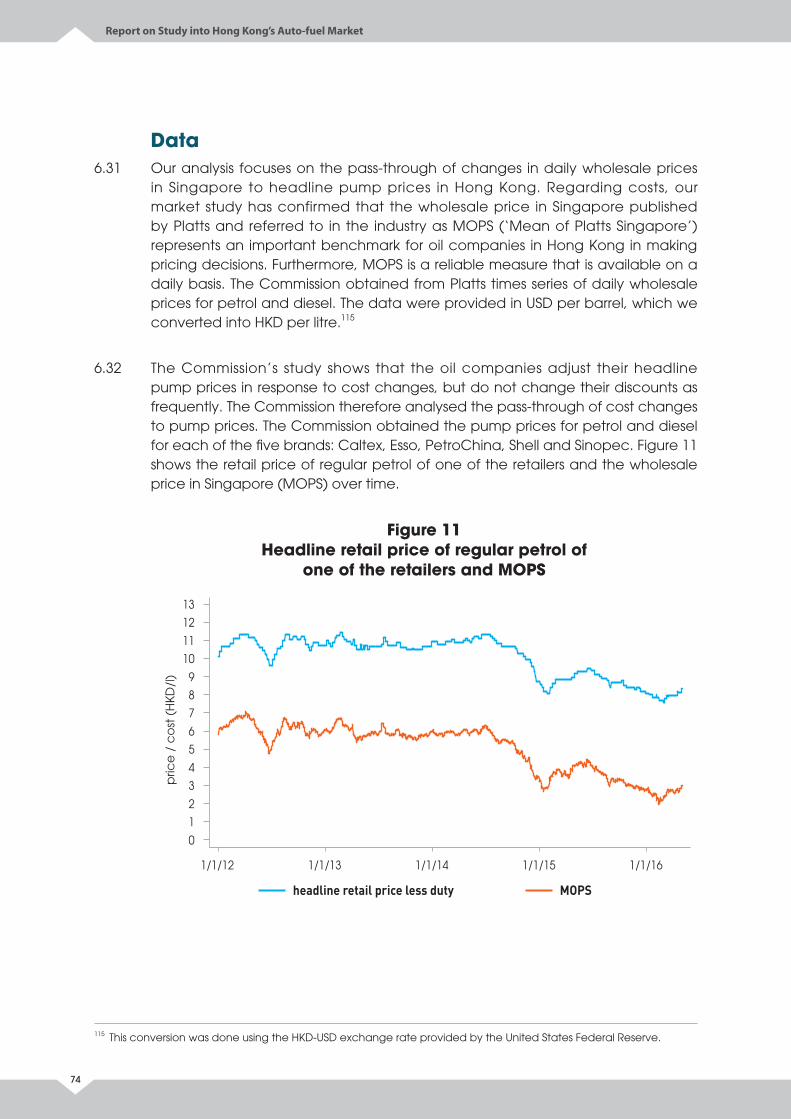
Report on Study into Hong Kong’s Auto-fuel Market
74
Data 6.31 Our analysis focuses on the pass-through of changes in daily wholesale prices
in Singapore to headline pump prices in Hong Kong. Regarding costs, our market study has confirmed that the wholesale price in Singapore published by Platts and referred to in the industry as MOPS (‘Mean of Platts Singapore’) represents an important benchmark for oil companies in Hong Kong in making pricing decisions. Furthermore, MOPS is a reliable measure that is available on a daily basis. The Commission obtained from Platts times series of daily wholesale prices for petrol and diesel. The data were provided in USD per barrel, which we converted into HKD per litre.115
6.32 The Commission’s study shows that the oil companies adjust their headline pump prices in response to cost changes, but do not change their discounts as frequently. The Commission therefore analysed the pass-through of cost changes to pump prices. The Commission obtained the pump prices for petrol and diesel for each of the five brands: Caltex, Esso, PetroChina, Shell and Sinopec. Figure 11 shows the retail price of regular petrol of one of the retailers and the wholesale price in Singapore (MOPS) over time.
Figure 11 Headline retail price of regular petrol of
one of the retailers and MOPS
115 This conversion was done using the HKD-USD exchange rate provided by the United States Federal Reserve.
pric
e /
co
st (
HK
D/l
)
1/1/12 1/1/13 1/1/14 1/1/15 1/1/16
headline retail price less duty MOPS
0
1
2
3
4
5
6
7
8
9
10
11
12
13
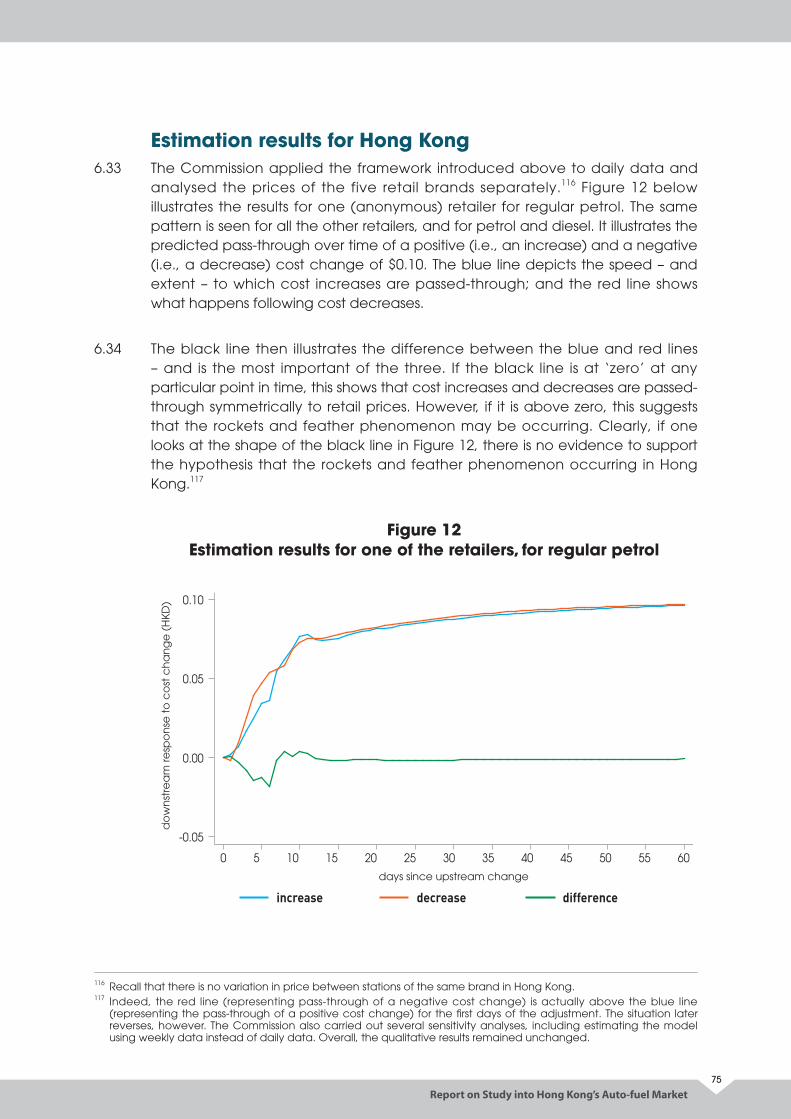
Report on Study into Hong Kong’s Auto-fuel Market75
Estimation results for Hong Kong6.33 The Commission applied the framework introduced above to daily data and
analysed the prices of the five retail brands separately.116 Figure 12 below illustrates the results for one (anonymous) retailer for regular petrol. The same pattern is seen for all the other retailers, and for petrol and diesel. It illustrates the predicted pass-through over time of a positive (i.e., an increase) and a negative (i.e., a decrease) cost change of $0.10. The blue line depicts the speed – and extent – to which cost increases are passed-through; and the red line shows what happens following cost decreases.
6.34 The black line then illustrates the difference between the blue and red lines – and is the most important of the three. If the black line is at ‘zero’ at any particular point in time, this shows that cost increases and decreases are passed-through symmetrically to retail prices. However, if it is above zero, this suggests that the rockets and feather phenomenon may be occurring. Clearly, if one looks at the shape of the black line in Figure 12, there is no evidence to support the hypothesis that the rockets and feather phenomenon occurring in Hong Kong.117
Figure 12 Estimation results for one of the retailers, for regular petrol
116 Recall that there is no variation in price between stations of the same brand in Hong Kong.117 Indeed, the red line (representing pass-through of a negative cost change) is actually above the blue line
(representing the pass-through of a positive cost change) for the first days of the adjustment. The situation later reverses, however. The Commission also carried out several sensitivity analyses, including estimating the model using weekly data instead of daily data. Overall, the qualitative results remained unchanged.
-0.05
0.00
0.05
0.10
do
wn
stre
am
resp
on
se t
o c
ost
ch
an
ge
(H
KD
)
0 5 10 15 20 25 30 35 40 45 50 55 60
days since upstream change
increase decrease difference
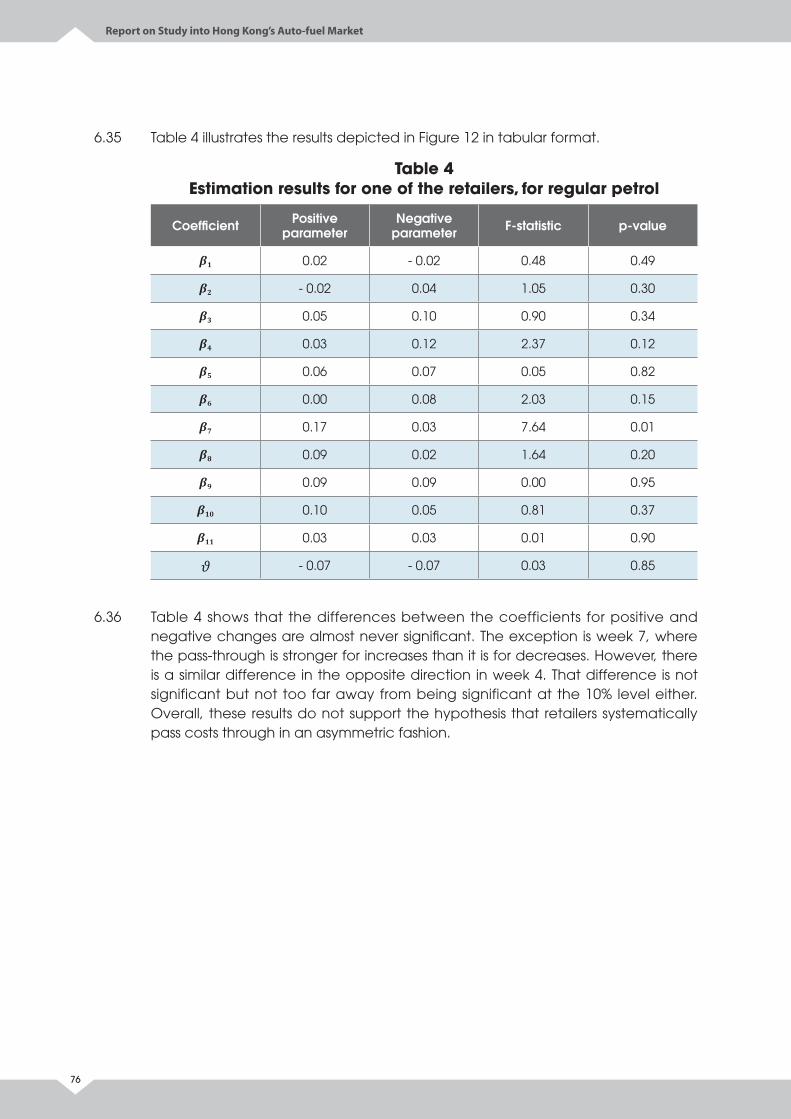
Report on Study into Hong Kong’s Auto-fuel Market
76
6.35 Table 4 illustrates the results depicted in Figure 12 in tabular format.
Table 4 Estimation results for one of the retailers, for regular petrol
Coefficient Positive parameter
Negative parameter F-statistic p-value
β1 0.02 - 0.02 0.48 0.49
β2 - 0.02 0.04 1.05 0.30
β3 0.05 0.10 0.90 0.34
β4 0.03 0.12 2.37 0.12
β5 0.06 0.07 0.05 0.82
β6 0.00 0.08 2.03 0.15
β7 0.17 0.03 7.64 0.01
β8 0.09 0.02 1.64 0.20
β9 0.09 0.09 0.00 0.95
β10 0.10 0.05 0.81 0.37
β11 0.03 0.03 0.01 0.90
- 0.07 - 0.07 0.03 0.85
6.36 Table 4 shows that the differences between the coefficients for positive and negative changes are almost never significant. The exception is week 7, where the pass-through is stronger for increases than it is for decreases. However, there is a similar difference in the opposite direction in week 4. That difference is not significant but not too far away from being significant at the 10% level either. Overall, these results do not support the hypothesis that retailers systematically pass costs through in an asymmetric fashion.
Report on Study into Hong Kong’s Auto-fuel Market77
7. APPENDIX: DESIGNATION OF SITES FOR PFS USE
7.1 In this appendix, we provide some more details on the ways in which land is designated – or converted, as the case may be – for use as a PFS site. Entry into the retail market is restricted by regulation. Retailers cannot simply build new stations where they see fit. Using a piece of land for operating a filling station requires government approval. There are, broadly speaking, two different ways for a company to acquire a site for this purpose:118
(a) Government tender:119 under the new measures adopted by the government in 2000, filling station sites under 21-year PFS leases are tendered out upon expiry of their lease terms.120 Companies can bid for these sites in open tenders. From June 2003 to July 2016, 56 PFS sites (including 11 new sites) have been tendered out.
(b) Conversion of privately-owned land: if a company owns a piece of land (for example, on a crown lease), it can construct and operate a filling station on that piece of land, provided that this is permitted by the land-use zoning and the terms of the lease.121 Otherwise, the company needs to apply for a land-use re-zoning or permission,122 and/ or a lease modification (with a premium) from the relevant government departments. This is a lengthy and costly process.
7.2 The considerable cost and inconvenience associated with converting privately-owned land means that any new company that wants to enter – or any existing smaller retailer that would like to expand – will most likely need to rely on government tenders to obtain new sites. Following the reforms to the tendering arrangements undertaken in 2000 described above, one potential source of PFS sites is existing sites that come up for renewal. However, there is also the question of how new PFS sites are designated.
7.3 The Commission understands that a range of considerations influence the decision of whether a piece of land should be reserved for use as PFS. These include the practical suitability of a site, road safety, environmental and fire safety considerations (including special requirements for stations located within buildings) as well as the basic need for a filling station at a location.123
118 The Commission notes that oil companies also rent sites from other third parties. These sites are owned by third parties and the length of this type of private leases varies.
119 The government sometimes also grants short-term leases to companies for them to operate PFS sites, but the leases are typically for a short period of time only (for example, a one-year short-term lease to extend an expiring 21-year FPS lease before the piece of land taken back by the government for other uses).
120 It should be noted that some of the sites were taken back by the government for other uses and were not put up for tender after the expiration of the original leases.
121 Note that other government permits/approval are still required.122 If “PFS use” is under “Column Two” of the permitted use, then only an application for permission is required.
However, if “PFS use” is not permitted, an application for re-zoning is required.123 Planning Department, Hong Kong Planning Standards and Guidelines, Chapter 12, Section 3.
Report on Study into Hong Kong’s Auto-fuel Market
78
7.4 Information provided by the Government illustrates that the consideration of whether a piece of land should be designated for the operation of filling station can arise in the following situations:
(a) New development or re-development areas: during the course of planning, concerned bureaux and departments can be consulted to ascertain the anticipated demand of filling stations in that area. If it is determined that there is such a need, suitable sites are then reserved for PFS use.
(b) Planning application submitted: if any party (including oil companies or other third parties) submits an application for permission to construct and operate a filling station or an application to re-zone a piece of land for PFS use, then the Town Planning Board (with technical support from the Planning Department) considers the application on a case-by-case basis.
(c) Review of the land use plan of a particular district: when the Planning Department conducts a review of the land use in a particular district, if there are any requests for additional PFS sites from other relevant government bureaux and departments, it will search for suitable sites for PFS use.
7.5 The Commission understands that these considerations are analysed at a district level and, except in cases (a) and (c) (which are both likely to be infrequent by nature), are not initiated by the Government. In other words, PFS sites are mostly made available by the so-called “demand-led” approach. The Commission also notes in particular that the Planning Department considers that “[t]he need for PFS cannot be realistically quantified” and that “site reservation depends on the anticipated growth of the area and volume of traffic”.124
124 Planning Department, Hong Kong Planning Standards and Guidelines, Chapter 12, Paragraph 3.9.1.

Room 3601, 36/F, Wu Chung House213 Queen's Road EastWanchai, HONG KONG
© May 2017 Competition Commission (Hong Kong) All rights reserved