Embed Size (px)
Citation preview
Report on Czech COSPAR-related activities in 2019
This report summarizes selected results of five Czech institutions represented in the Czech
National Committee of COSPAR, namely the Institute of Atmospheric Physics (IAP) of the
Czech Academy of Sciences (CAS), the Astronomical Institute (AI) of CAS, the Faculty of
Mathematics and Physics of the Charles University (FMP CU), BBT - Materials Processing, and
the Czech Space Office. Both selected scientific results and Czech participation in space
experiments are reported. There are also significant outreach/PR activities.
Participation in space experiments
Solar Orbiter (AI CAS, IAP CAS, FMP CU, IPP CAS - TOPTEC)
The Solar Orbiter (SOLO) satellite, project ESA-NASA, was successfully launched from
Florida on February 10, 2020 at 05:03 CET. Czech institutions have been participating in four
out of ten scientific instruments on board of SOLO (STIX, Metis, RPW, and SWA/PAS).
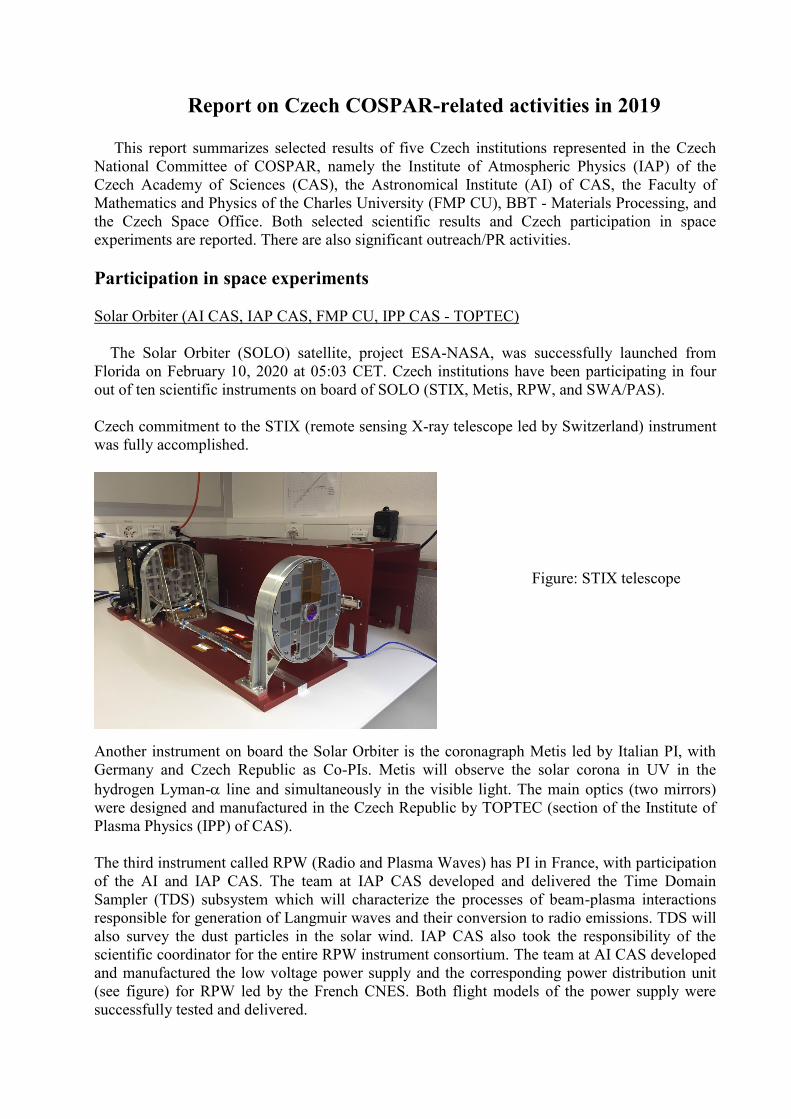
Czech commitment to the STIX (remote sensing X-ray telescope led by Switzerland) instrument
was fully accomplished.
Another instrument on board the Solar Orbiter is the coronagraph Metis led by Italian PI, with
Germany and Czech Republic as Co-PIs. Metis will observe the solar corona in UV in the
hydrogen Lyman- line and simultaneously in the visible light. The main optics (two mirrors)
were designed and manufactured in the Czech Republic by TOPTEC (section of the Institute of
Plasma Physics (IPP) of CAS).
The third instrument called RPW (Radio and Plasma Waves) has PI in France, with participation
of the AI and IAP CAS. The team at IAP CAS developed and delivered the Time Domain
Sampler (TDS) subsystem which will characterize the processes of beam-plasma interactions
responsible for generation of Langmuir waves and their conversion to radio emissions. TDS will
also survey the dust particles in the solar wind. IAP CAS also took the responsibility of the
scientific coordinator for the entire RPW instrument consortium. The team at AI CAS developed
and manufactured the low voltage power supply and the corresponding power distribution unit
(see figure) for RPW led by the French CNES. Both flight models of the power supply were
successfully tested and delivered.
Figure: STIX telescope
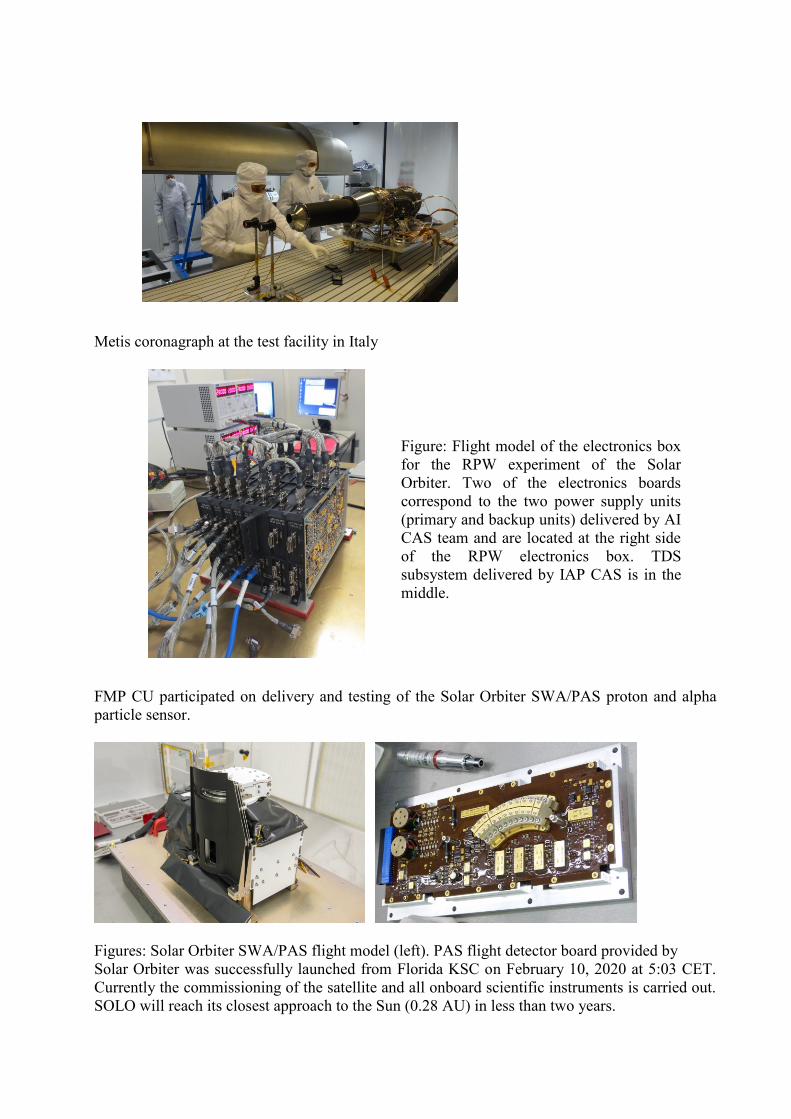
Metis coronagraph at the test facility in Italy
FMP CU participated on delivery and testing of the Solar Orbiter SWA/PAS proton and alpha
particle sensor.
Figures: Solar Orbiter SWA/PAS flight model (left). PAS flight detector board provided by
Solar Orbiter was successfully launched from Florida KSC on February 10, 2020 at 5:03 CET.
Currently the commissioning of the satellite and all onboard scientific instruments is carried out.
SOLO will reach its closest approach to the Sun (0.28 AU) in less than two years.
Figure: Flight model of the electronics box
for the RPW experiment of the Solar
Orbiter. Two of the electronics boards
correspond to the two power supply units
(primary and backup units) delivered by AI
CAS team and are located at the right side
of the RPW electronics box. TDS
subsystem delivered by IAP CAS is in the
middle.

ESA Proba-3 (AI CAS)
The AI CAS is also involved in the ESA Proba-3 mission preparation, and namely TOPTEC
designs and manufactures the optics for the ASPIICS coronagraph, while the SERENUM
company is responsible for the front door mechanism. This large space coronagraph is a unique
mission aimed at testing the formation flight of two satellites. The launch is expected during
2021.
Project ATHENA (AI CAS + IAP CAS)
In 2019, the Czech team became a member of the international instrumentation consortium of the
X-ray Integral Field Unit (X-IFU), the main instrument planned for the ESA large X-ray mission
ATHENA (Advanced Telescope for High Energy Astronomy). The X-IFU instrument will use a
novel technique of X-ray calorimetry to precisely measure energies of X-ray photons. The
international consortium is led by France and has now 13 countries participating in the
consortium, The Czech team will be responsible for delivering the Remote Terminal Unit, a part
of the warm electronics system that will be responsible for temperature measurements and other
mechanical and electronical commands and services. The Czech team is involved in the
consortium board as well as the X-IFU science advisory team. The currently expected launch of
the mission is in 2031.
Project eXTP, IXPE (AI CAS)
In 2019, the Czech team became a member of the international consortium of the Large Area
Detector (LAD) planned for the Chinese-European enhanced X-ray Timing and Polarimetry
mission eXTP. The eXTP mission will be devoted to measure emission from the matter in
extremely strong gravitational and magnetic fields. The LAD instrument will use a very large
collecting area to get high signal to noise to put tight constraints on the measured parameters.
The LAD consortium is led by Italy and the Czech team will be responsible for design and
manufacturing of the detector and collimator frames. The currently expected launch of the
mission is in 2027.
The Czech scientific team is also involved in the exploratory NASA mission IXPE (Imaging X-
ray Polarimetry Explorer) that is expected to be launched in 2021. The Czech team contributed
to the definition of the science programme during the commissioning phase.
Project LISA
The Czech team joined the consortium of the large ESA gravitational-wave mission LISA (Laser
Interferometer Space Antenna). There are ongoing discussions about the Czech contribution to
the hardware development of the mission. Potentially, the Czech Republic could take
responsibility for the development of the Fiber Switch Unit Actuator. This project would involve
several institutes of the Czech Academy of Sciences. A preliminary consortium is composed
from AI, Institute of Physics, IAP and Institute of Thermomechanics.
Project JUICE (IAP CAS + AI CAS)
Project JUICE (JUpiter ICy moons Explorer) was selected by ESA as the first of largest (L class)
missions of the Cosmic Vision programme. The anticipated launch is in 2022, arrival to Jupiter

in 2030. IAP CAS is one the six Co-PI institutions coordinating work on preparation of the
RPWI (Radio and Plasma Wave Instrument) which is distributed between 25 scientific
institutions from 9 countries, led by Swedish IRF-U. IAP CAS is developing the low frequency
(LF) subsystem of the instrument (see http://okf.ufa.cas.cz/juice) which will measure
electromagnetic waves in the vicinity of Jupiter and its moons, especially Ganymede.
AI CAS is developing a power supply unit for the instrument. Conceptually, this power supply
represents completely different design which has been prepared. It must sustain harsh radiation
conditions at Jupiter.
Figure: Left: Engineering model of the LF module for JUICE RPW1 which will analyze
measurements of the electric and magnetic field. Right: Electronics board of the power supply
for the RPWI experiment on JUICE space probe during one of the ground tests. Depicted is
engineering model 2B.
IAPETHOS: Infrared Advanced Polarizer for Space and Other Applications (BBT)
The activity IAPETHOS 2 aims to progress on the results of the previous IAPETHOS activity
with the objective to develop and test new types of unique Calomel-based polarization optical
components for Infrared applications. Five new optical components based on a birefringent
crystal of Calomel: Wollaston, Rochon and Senarmont as standard systems known from optical
industry, optical depolarizer (scrambler) and monolithic or lossless polarizer, as a unique BBT
original design using a single piece optical element. Specific protective housings are being
designed for each type of the functional optical component. A second part of the activity is the
OGSE/EGSE system which will be used for the test campaign. An effective anti-reflective
coating and bonding solution is being developed with target to find the real AR protective
composition layer with long-last adhesion.
Description. The Calomel (Hg2Cl2) is a birefringence material with a broadband transmittance
range and it is a perfect candidate for a new type of polarizer working in the near and thermal
infrared regions. The present optical market offers only wire-grid or holographic type IR
polarizers with very low or limited extinction ratios, which limits final performance of the
product. The developed basic polarizers in the IAPETHOS project achieved impressing
extinction ratios, up to 1:100 000.
The activities in IAPETHOS 2:
- Anti-Reflection (AR) coating. Although Calomel is a unique optical material, its high refractive
index results in high reflection losses. In order to decrease these losses, it is necessary to apply

AR coatings.
- Protective and Anti-Reflection solution development.
- Advanced protective housing. A possible geometric deviation in placing the prisms inside the
housing may lead to significant decrease of the final performance of the polarizer. Therefore a
new advanced protective housing is being developed and manufactured.
- Polarization Scrambler. The basic version demonstrated promising results during the previous
activity and it will reach TRL 4 in this project.
- More accurate measurement methods for the determination of the crystallographic orientation.
Deliverables. New components/devices, consisting in new Calomel polarizers, with Anti-
Reflection coating or layer, and encapsulated in an advanced protective housing.
CALIOPE: Calomel-Based TIR Optical AOTF breadboarding (BBT)
The CALIOPE Project will develop the breadboard of the Calomel-based Acousto-Optical
Tunable Filter (AOTF) designed for the hyperspectral imager in the Thermal Infra-Red (TIR)
spectral band, namely in the 8-10 μm spectral bands. It is part of a larger project plan, named
THETIS, which aims to proceed with the development of a Thermal Hyperspectral Imaging
System integrating a Calomel-based AOTF. The THETIS project includes also the development
of functionality in the Visible (VIS) and possibly in the Middle Wave Infra-Red (MWIR),
namely 3-5 μm. The CALIOPE project represents the manufacturing of the breadboard of the
Calomel-based AOTF, which was designed in the "Phase 1" of the project, in order to reach TRL
4. The Calomel (mercury chloride, Hg2Cl2) features unique optical characteristics in the full
0.38-20 μm range: high optical transmission, high refractive indices, birefringence (4x higher
than calcite), extremely low acoustic wave propagation and high coefficient of acoustic-optical
interaction.
Figure 1. Calomel crystal growth laboratory and finished crystal boules Ø 36mm and 28mm.
The purpose of the CALIOPE project is a verification of AOTF itself as a crucial part of TIR
hyperspectral imaging system. Based upon the detailed study of possible space applications the
detection and analysis of oil spills has been selected as the most promising one. In the TIR
spectral region, the oil spill detection is frequently done as an integral measurement over the TIR
range (mainly in a spectral window of 8 to 14 microns). The basic criterion is a temperature
contrast between oil spill and background sea water. During daytime, oil spots tend to have a

higher temperature than surrounding sea water and vice versa at night. It apparently leads to oil
spill thickness indication as well; thicker oil slick appears to be “hotter” than thinner one in the
specific thickness range and to the determined threshold. The second complementary parameter
is oil spill emissivity, which also depends on an oil type.
Calomel AOTF cell design. The design of the AOTF cell is based on a “collinear AO
interaction” configuration, i.e. both optical and acoustical beams are collinear. The interaction
itself is done on the slow shear acoustic wave and the polarization planes of input and diffracted
optical beams are perpendicular (anisotropic diffraction). The AOTF design parameters are listed
in Table 1.
Table 1: AOTF design parameters.
Parameter Value
Wavelength [µm] 8 - 10
Input beam width [mm] 7
Incident beam angle with 110 axes
[°]
48.00 – 48.00
Transducer (prism) angle [°] 26.34
Transducer beam angle with bonded
face [°]
26.34
Incidence angle [°] 0.00 – 0.00
Crystal length (bonded face) [cm] 2.24
Crystal height [cm] 2.45
Crystal thickness [cm] 1.20
Input face angle (to [001] axis) [°] 42.00
Output face angle [°] 42.00
Output angle (diffracted) [°] 12.07
Reflection at input [%] 9.60 – 9.60
Reflection at output [%] 13.56 - 13.56
Reflection loss [%] 21.87 – 21.86
Acoustic frequency [MHz] 14.44 – 11.55
Transducer electrode width [cm] 1.54
Acoustic beam width [cm] 0.76
Path length [cm] 2.59
Spectral resolution [cm-1] 1.26 – 1.26
Spectral resolution [nm] 8.08 – 12.63
P0_50 (50% diffraction power) [W] 4.50 – 7.04
The design includes several critical parts, which were analyzed in detail by using of MATLAB
and detailed design parameters have been derived. The design expects the collinear interaction
between the acoustic and optical beams. A suitable input optical beam (perpendicular incidence
and polarization) is achieved by the front-end optics (FEO) and front-end polarizer. However,
the arrangement of the acoustic wave must be managed by the design itself. By optimizing the
design, the most efficient design with the desired output characteristics can be achieved
respecting calomel crystal size and properties. Considering that, a transducer delivering the
acoustic wave uses the TeO2 crystal; we can find an orientation of the TeO2 crystal for matching
the impedance of Hg2Cl2 crystal. Thus the acoustic wave generated by the transducer with TeO2
crystal can be transmitted to the Calomel crystal. Important is a group acoustic wave vector,
which heads towards the input window (input of the laser beam) of the Calomel crystal. This part

is crucial. A collinear interaction requires parallel transmission of both acoustic and optical
waves. The transducer orientation design provides an acoustic wave in the direction that is
reflected in the input window and the resulting acoustic wave is parallel to the optical wave.
Both parts – the design of the transducer and the Calomel crystal input window (regarding
design) - create a medium where the conditions of collinear interaction are met.
AOTF considers the anisotropic diffraction. AOTF design parameters/properties are summarized
in Table 1. The acoustic frequencies vary from 14.44 MHz for 8 µm optical input to 11.55 MHz
for 10 µm.
The expected performance was estimated due to the length of the interaction of 2.59 cm (the
optical path). The crucial is the transducer (prism) angle since its orientation allows achieving
the collinear interaction. Another important property is the incidence angle, equal to zero. The
AOTF design expects the perpendicular impact of the optical wave on the input window surface.
Figure: Acoustic transducer configuration
The objective of this activity is to demonstrate the feasibility of a Calomel-based TIR AOTF and
to show that its performance meets the requirements reported in this document. The results of
CALIOPE shall serve as a baseline for the system breadboard development of the THETIS
project. The activity also includes the development of the ground support equipment.
TARANIS (IAP CAS, FMP CU)
In 2018-2019 years we assisted to the assembly, integration, and testing of flight model of
the FM of the IME-HF instrument for the CNES TARANIS mission (IAP CAS -
http://okf.ufa.cas.cz/taranis/) and TARANIS/IDEE energetic electron spectrometer (FMP CU).
TARANIS is scheduled to be launched in June 2020.

Comet Interceptor (IAP CAS, FMP CU)
In 2019 we were involved in the two-step ESA call for the Fast mission (Debye and Comet
Interceptor candidate proposals) and later we were participating in the winning Comet
Interceptor mission during two CDF studies. In this mission FMP CU is going to provide part of
the electronics of the electron spectrometer LEES (the instrument led by IRAP Toulouse, part of
the Dust, Field and Plasma experiment – DFP onboard spacecraft A). IAP CAS will provide the
Data Processing Units (DPU) for the DFP experiments onboard both the main spacecraft A and
the deployable small spacecraft B2. The launch is planned in 2027.
Luna-Resurs-1 OA and Strannik (IAP CAS and FMP CU)
During 2018-2019 FMP CU worked on development of a new Faraday-cup based solar wind
monitor BMSW-LG for the Russian Luna-Resurs-1 OA mission (launch expected in 2023 or
2024). IAP CAS was developing the wave experiment LEMI for the same mission.
The EM models of the instruments were delivered to IKI Moscow in the end of 2019. At the
same time FMP CU were developing a similar instrument BMSW-S for the Russian Strannik
mission (launch 2025).
Figure: Left: Flight model of the TARANIS IDEE DZA data processing unit (FMP CU
delivered two flight models). Right: TARANIS scientific instrument platform integration in
CNES. The DZA and DNA units are part of the MEXIC-1 (golden electronic box on lower
left), one IDEE sensor seen on the very right of the platform.
Figure: Integration of the IDEE flight
sensor units (at right) with the MEXIC-1
(at left) mounted on the TARANIS satellite
instrument platform.
Deep Space Gateway (IAP CAS and FMP CU)
In 2019 FMP CU and IAP CAS also participated in the first part of the conceptual study
SP4GATEWAY of the Deep Space Gateway scientific payload. Here FMP CU has proposed
also a Faraday-cup based solar wind monitor (cSWFC instrument) of similar design as BMSW-
LG-OB and IAP CAS a wave experiment cWAVE, a heritage of MAIGRET-WAM from the
ExoMars mission).
Telemetry station Panska Ves (IAP CAS)
The Czech telemetry station Panska Ves has been receiving data from the ESA Cluster
mission (four satellites, part of information). The data from the WBD instruments onboard
Cluster were processed at IAP and submitted to the Cluster Science Archive at ESA.
Selected scientific results
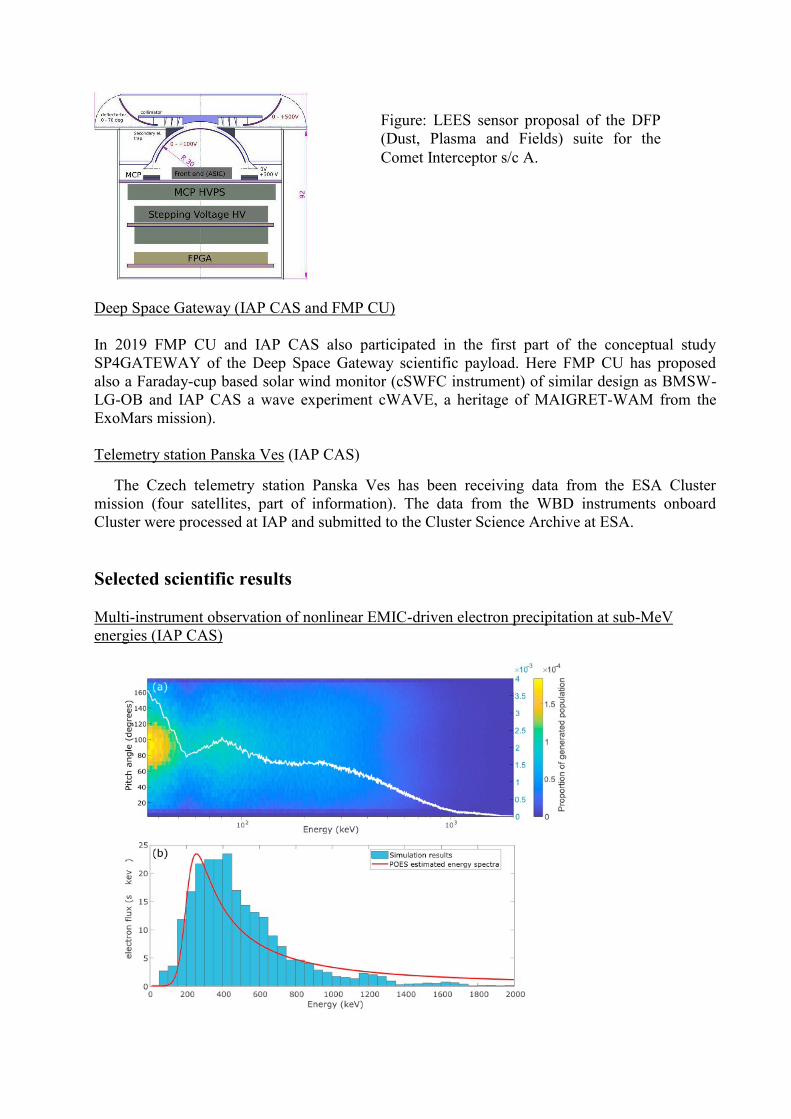
Multi-instrument observation of nonlinear EMIC-driven electron precipitation at sub-MeV
energies (IAP CAS)
Figure: LEES sensor proposal of the DFP
(Dust, Plasma and Fields) suite for the
Comet Interceptor s/c A.

Figure: Distribution of the generated electrons in energy and pitch angle. The white line
represents the energy spectrum of this distribution summed across all pitch angles. The scales on
the right represent the proportion of the total generated electron population. (b) Comparison of
the POES-derived electron precipitation flux spectrum (red line) with the precipitation predicted
by the test particle simulation between 119 and 120 s (cyan histogram)
In recent years, experimental results have consistently shown evidence of electromagnetic ion
cyclotron (EMIC) wave-driven electron precipitation down to energies as low as hundreds of
keV. However, this is at odds with the limits expected from quasi-linear theory. Recent analysis
using nonlinear theory has suggested energy limits as low as hundreds of keV, consistent with
the experimental results, although to date this has not been experimentally verified. In this study,
we have presented concurrent observations from Polar-orbiting Operational Environmental
Satellite, Radiation Belt Storm Probes, Global Positioning System, and ground-based
instruments, showing concurrent EMIC waves and sub–MeV electron precipitation, and a global
dropout in electron flux. We have shown through test particle simulation that the observed waves
are capable of scattering electrons as low as hundreds of keV into the loss cone through
nonlinear trapping, consistent with the experimentally observed electron precipitation.
Hendry, A. T., Santolík, O., Kletzing, C. A., Rodger, C. J., Shiokawa, K., & Baishev, D. (2019).
Multi-instrument observation of nonlinear EMIC-driven electron precipitation at sub-MeV
energies. Geophysical Research Letters,46, 7248-7257. https://doi.org/10.1029/2019GL082401.
Effects of ducting on whistler mode chorus or exohiss in the outer radiation belt.
Previously published statistics based on Cluster spacecraft measurements surprisingly showed
that in the outer radiation belt, lower band whistler mode waves predominantly propagate
unattenuated parallel to the magnetic field lines up to midlatitudes, where ray tracing simulations
indicated highly attenuated waves with oblique wave vectors. We have explained this behavior
by considering a large fraction of ducted waves. We argue that these ducts can be weak and thin
enough to be difficult to detect by spacecraft instrumentation while being strong enough to guide
whistler mode waves in a cold plasma ray tracing simulation. After adding a tenuous hot electron
population, we have obtained a strong effect of Landau damping on unducted waves, while the
ducted waves experience less damping or even growth. Consequently, the weighted average of
amplitudes and wave normal angles of a mixture of ducted and unducted waves has provided us
with strong quasi-parallel waves, consistent with the observations.
Figure: Ray trajectories in the meridional plane. Ducts are placed at L={4.0,5.5,7.0}and
correspond to the initial distance of the blue, purple, and red rays, respectively. The width of the

ducts is 96 km, and the relative density increase is 0.06. Black arrows represent the directions of
wave vectors and are plotted with equidistant group time intervals of 0.1 s and at the end of the
trajectory. Initial wave normal angles are 0◦for the blue trajectory, −15◦for the purple trajectory,
and 15◦for the red trajectory.
Hanzelka, M., & Santolik, O. (2019). Effects of ducting on whistler mode chorus or exohiss in
the outer radiation belt. Geophysical Research Letters, 46, 5735-5745.
https://doi.org/10.1029/2019GL083115.
Direct measurement of low-energy electron foreshock beams (IAP CAS)
Electrostatic plasma waves above and below the local electron plasma frequency represent a
characteristic feature of the foreshock region. These waves are known to be generated by
electron beams originating from the bow shock and their spectrum varies from narrowband
intense waves close to foreshock edge to weaker broadband emissions further downstream. We
have presented a statistical analysis of electron beams observed in the terrestrial foreshock by the
Cluster spacecraft. We compared the energy of foreshock electron beams with the spectrum of
electrostatic waves and established a clear correspondence between beam energy and spectrum
of the waves. The broadband emissions are correlated with low-energy beams, while high-energy
electron beams are associated with narrowband Langmuir waves. Next we solved the linear
dispersion relation for a subset of observed electron plasma distributions. We discovered that
while the observed electron distributions often exhibit a “bump on tail” feature necessary for an
instability, the observed combination of beam energy, density, and temperature typically
corresponds to a stable situation. This indicates that strongly unstable electron beams are quickly
dissipated by the quasi-linear processes and only stable or marginally stable beams persist long
enough to be observed by the instrument.
Figure: Distribution of beam energy versus relative frequency of the largest peak in the electric
field spectrum constructed from the statistical data set of C2 measurements from 2002 to 2010.
(left) Joint two-dimensional histogram of beam energy in electron volts versus the relative

frequency. (right) Analogous histogram with beam velocity normalized to the thermal velocity
on the vertical axis. Color coded is the number of identified beams whose energy falls in the
corresponding energy bin and frequency in the frequency bin simultaneously.
Soucek, J., Pisa, D., & Santolik, O. (2019). Direct measurement of low-energy electron
foreshock beams. Journal of Geophysical Research: Space Physics, 124, 2380-2392
https://doi.org/10.1029/2019JA026470
Evidence for low density holes in Jupiter’s ionosphere (IAP CAS)
Intense electromagnetic impulses induced by Jupiter’s lightning have been recognized to produce
both low-frequency dispersed whistler emissions and non-dispersed radio pulses. We have
collaborated on a discovery of electromagnetic pulses associated with Jovian lightning. Detected
by the Juno Waves instrument during its polar perijove passes, the dispersed millisecond pulses
called Jupiter dispersed pulses (JDPs) provide evidence of low density holes in Jupiter’s
ionosphere. 445 of these JDP emissions have been observed in snapshots of electric field
waveforms. Assuming that the maximum delay occurs in the vicinity of the free space ordinary
mode cutoff frequency, we have estimated the characteristic plasma densities and lengths of
plasma irregularities along the line of propagation from lightning to Juno. These irregularities
show a direct link to low plasma density holes with less than 250 particles in one cubic
centimeter in the nightside ionosphere.
Figure: Example of Jupiter dispersed pulses (JDPs). The spectrogram was converted from a
16.384-ms waveform snapshot. The orange curves are fitted via the O mode propagation model
to a pair of JDPs with a pulse-to-pulse interval of 0.7 ms.
Imai, M., Kolmasová, I., Kurth, W.S., Santolík, O., Hospodarsky, G. B., Gurnett, D.A., Brown,
S. T., Bolton, S.J., Connerney, J. E. P., Levin, S. M. Evidence for low density holes in Jupiter’s
ionosphere. Nature Communications 10, 2751 (2019) doi:10.1038/s41467-019-10708-w
Statistical Survey of Coronal Mass Ejections and Interplanetary Type II Bursts (IAP CAS)
Coronal mass ejections(CMEs)are responsible for most severe space weather events, such as
solar energetic particle events and geomagnetic storms at Earth. Type II radio bursts are slow
drifting emissions produced by beams of suprathermal electrons accelerated at CME-driven
shock waves propagating through the corona and interplanetary medium. We have reported a
statistical study of 153 interplanetary type II radio bursts observed by the two STEREO
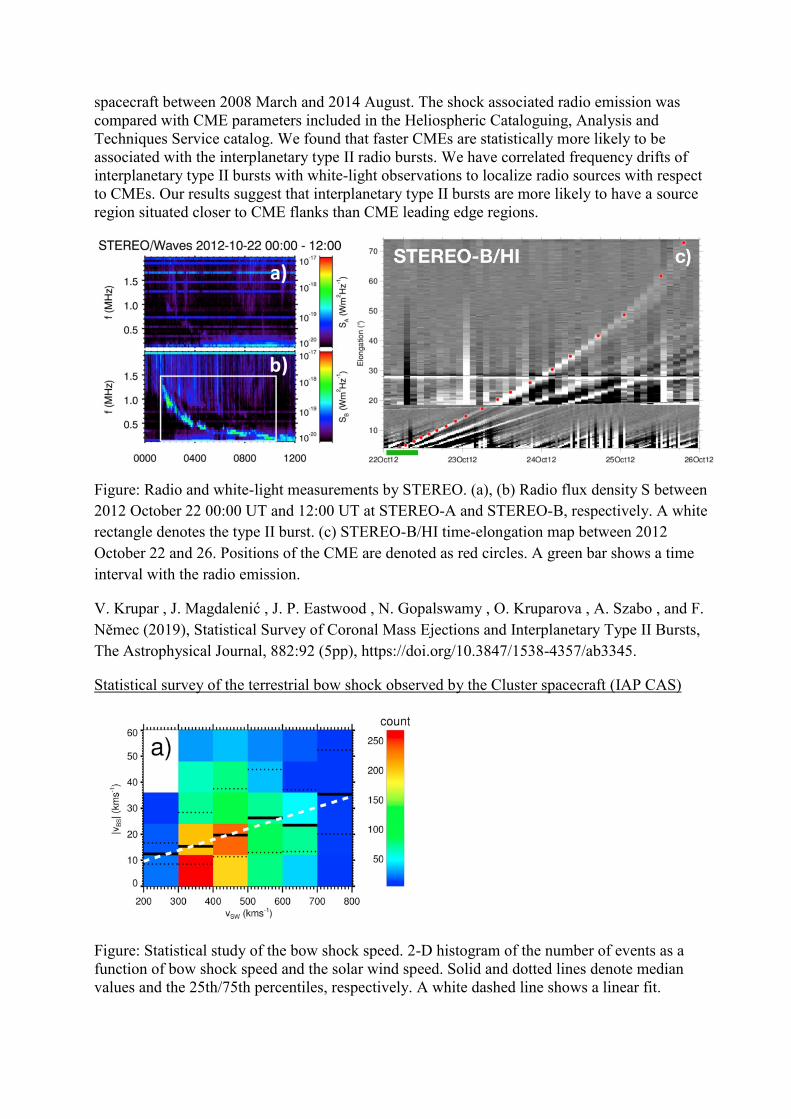
spacecraft between 2008 March and 2014 August. The shock associated radio emission was
compared with CME parameters included in the Heliospheric Cataloguing, Analysis and
Techniques Service catalog. We found that faster CMEs are statistically more likely to be
associated with the interplanetary type II radio bursts. We have correlated frequency drifts of
interplanetary type II bursts with white-light observations to localize radio sources with respect
to CMEs. Our results suggest that interplanetary type II bursts are more likely to have a source
region situated closer to CME flanks than CME leading edge regions.
Figure: Radio and white-light measurements by STEREO. (a), (b) Radio flux density S between
2012 October 22 00:00 UT and 12:00 UT at STEREO-A and STEREO-B, respectively. A white
rectangle denotes the type II burst. (c) STEREO-B/HI time-elongation map between 2012
October 22 and 26. Positions of the CME are denoted as red circles. A green bar shows a time
interval with the radio emission.
V. Krupar , J. Magdalenić , J. P. Eastwood , N. Gopalswamy , O. Kruparova , A. Szabo , and F.
Němec (2019), Statistical Survey of Coronal Mass Ejections and Interplanetary Type II Bursts,
The Astrophysical Journal, 882:92 (5pp), https://doi.org/10.3847/1538-4357/ab3345.
Statistical survey of the terrestrial bow shock observed by the Cluster spacecraft (IAP CAS)
Figure: Statistical study of the bow shock speed. 2-D histogram of the number of events as a
function of bow shock speed and the solar wind speed. Solid and dotted lines denote median
values and the 25th/75th percentiles, respectively. A white dashed line shows a linear fit.

The Sun is continuously emitting a stream of charged particles—called the solar wind—from its
upper atmosphere. The terrestrial magnetosphere forms the obstacle to its flow. Due to
supersonic speed of the solar wind, the bow shock is created ahead of the magnetosphere. This
abrupt transition region between supersonic and subsonic flows has been frequently observed by
the four Cluster spacecraft. Using a timing analysis, we have retrieved speed and directions of
the bow shock motion for a large number of crossings. We have correlated the bow shock speed
with the solar wind speed and predictions of the bow shock locations by the empirical model. A
better understanding of the bow shock kinematics may bring new insights to wave-particle
interactions with applications in laboratory plasmas.
Kruparova, O., Krupar, V.,Safrankova, J., Nemecek, Z.,Maksimovic, M., Santolik, O., et
al.(2019). Statistical survey of the terrestrial bow shock observed by the Cluster spacecraft.
Journal of Geophysical Research: Space Physics,124, 1539-1547.
https://doi.org/10.1029/2018JA026272
3D analysis of gravity wave propagation in the ionosphere (IAP CAS)
Unique observation and analysis of gravity wave (GW) propagation in the ionosphere was
performed on the basis of multipoint and multifrequency continuous Doppler sounding in the
Czech Republic. Radio waves of various frequencies reflect at different heights. Thus, the
propagation of GWs can be studied in three-dimensional space using the time (phase) delays
between observation of corresponding signatures at different reflection points that are separated
both horizontally and vertically. The individual reflection points correspond to different
transmitter-receiver pairs and are usually at heights between about 150 and 260 km, depending
on ionospheric conditions. It is shown that the wave vectors of the observed GWs were mostly
directed obliquely downward, which means that the energy propagated obliquely upward.
Energy of GWs was found to decrease with height in the upper atmosphere. The observed
average attenuation was ~0.14 dB/km.

Figure. Three-dimensional velocities of the analyzed gravity waves. (a and b) Horizontal
velocities in the azimuthal plane calculated under assumption of the L-O and R-X mode,
respectively. (c and d) Horizontal and vertical velocities calculated under assumption of the L-O
and R-X mode, respectively
Chum, J., and K. Podolská, 3D analysis of gravity wave propagation in the ionosphere, Geophys.
Res. Lett., 45, 11562-11571, doi: 10.1029/2018GL079695, 2018.
(In)stability of the relation between ionospheric parameters and solar proxies (IAP CAS)
The relationship between ionospheric parameters and solar activity proxies is important for long-
term studies as ionospheric climatology or long-term trends, and for modeling. It has been
broadly assumed that this relationship is stable with time. Using foF2 and foE of four European
stations with long (1976-2014) data series, Juliusruh, Pruhonice, Rome and Slough/Chilton, we
show that it is not quite correct assumption. The dependence of yearly average values of
ionospheric parameters on solar activity proxies appears to be steeper in 1996-2014 than in
1976-1995 for foF2 and steeper after 2000 for foE (see Figure). Also the relationships among
solar activity proxies appear to change. Yearly values of foF2 and foE are very predominantly
controlled by solar activity represented by proxies.

Figure. Evolution of the 11-year-long sliding window solar dependence parameter B
(MHz/100s.f.u., F10.7) for foF2 from Juliusruh (black full line), Pruhonice (red full line) and
Rome (green full line), and of 10xB for foE from Chilton (blue dashed line) and Juliusruh
(brown dashed line) for intervals centered in years 1981-2009.
Lastovicka, J., Is the relation between ionospheric parameters and solar proxies stable? Geophys.
Res. Lett., 46, 14208-14214, https://doi.org/10.1029/2019GL085033, 2019.
Continuous Doppler sounding of the ionosphere during solar flares (IAP CAS)
Solar flares cause a rapid increase in ionization in the ionosphere, which influences the
propagation of radio waves. The ionospheric response to solar flares is investigated for three
selected examples recorded during the maximum and decreasing phase of the solar cycle 24 with
time resolution of several seconds by continuous Doppler sounding systems installed in the
Czech Republic (50N, 14E), Taiwan (24N, 121E) and Northern Argentina (27S, 65W). The
reflection heights of sounding signals are derived from nearby ionospheric sounders. The
measured Doppler shifts are compared with EUV and X-ray data from the GOES-15 satellite. It
is shown that the largest Doppler shifts are observed at times when the time derivatives of EUV
fluxes are maximal, while the Doppler shifts are around zero at times when the EUV fluxes reach
maxima. This means that loss processes balance the ionization when the EUV fluxes maximize.
The attenuation of Doppler signal caused by enhanced electron density in the D and E layer was
well correlated with the cosmic noise absorption measured by riometer. For large ionizing fluxes,
the attenuation leads to very low signal-to-noise ratio, loss of the received signal, and inability to
process both Doppler shift spectrograms and ionograms.

Figure. Spectrograms recorded by the Doppler sounder in the Czech Republic on 22 October
2014 from 13:45 to 14:55 at (a) 7.04 MHz, (b) 4.65 MHz, (c) 3.59 MHz, (d) Plasma frequency as
a function of height obtained from ionospheric sounder (blue) and from IRI-16 model (red) at
14:00 UT.
Chum, J., J. Urbář, J., Laštovička, M.A. Cabrera, J.-Y. Liu, F.A.M. Bonomi, M. Fagre, J. Fišer,
and Z. Mošna, Continuous Doppler sounding of the ionosphere during solar flares, Earth Plan.
Space. 70, art. # 198, doi: 10.1186/s40623-018-0976-4, 2018.
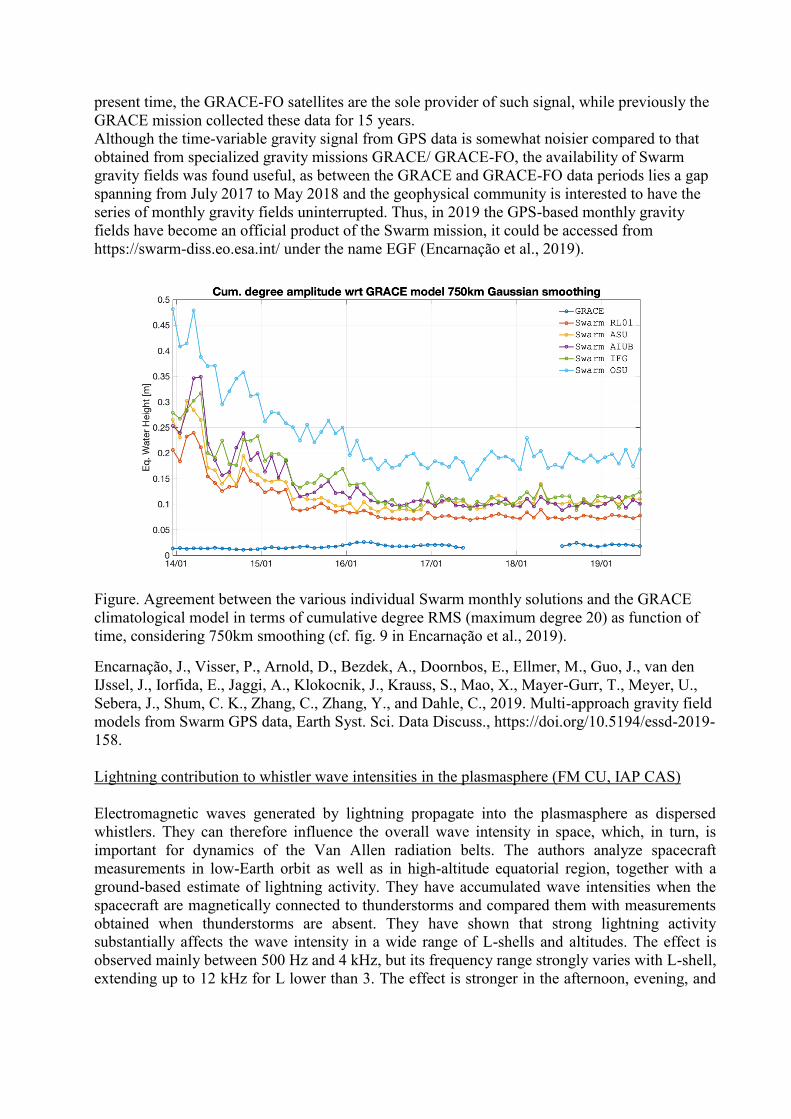
Solar eclipse effects in the ionosphere observed by continuous Doppler sounding (IAP CAS)
The ionospheric response to the solar eclipses of 20 March 2015 above the Czech Republic, 9
March 2016 above Taiwan, and 26February 2017 above South Africa was studied. A distinct
bipolar pulse was observed in ionospheric Doppler shift measurements above the Czech
Republic (Central Europe) and above Taiwan (Eastern Asia). It is a local phenomenon clearly
related with changes of electron density in the ionosphere induced by the passage of the Moon
shadow above the measurement sites. The solar eclipse in Taiwan was rather small, with a
maximum obscuration of 0.22. Yet, it obviously influenced the ionosphere on time scales above
100 min. The solar eclipse in South Africa occurred shortly before sunset and it is likely that
ionospheric effects were masked by gravity waves generated by the evening solar terminator.
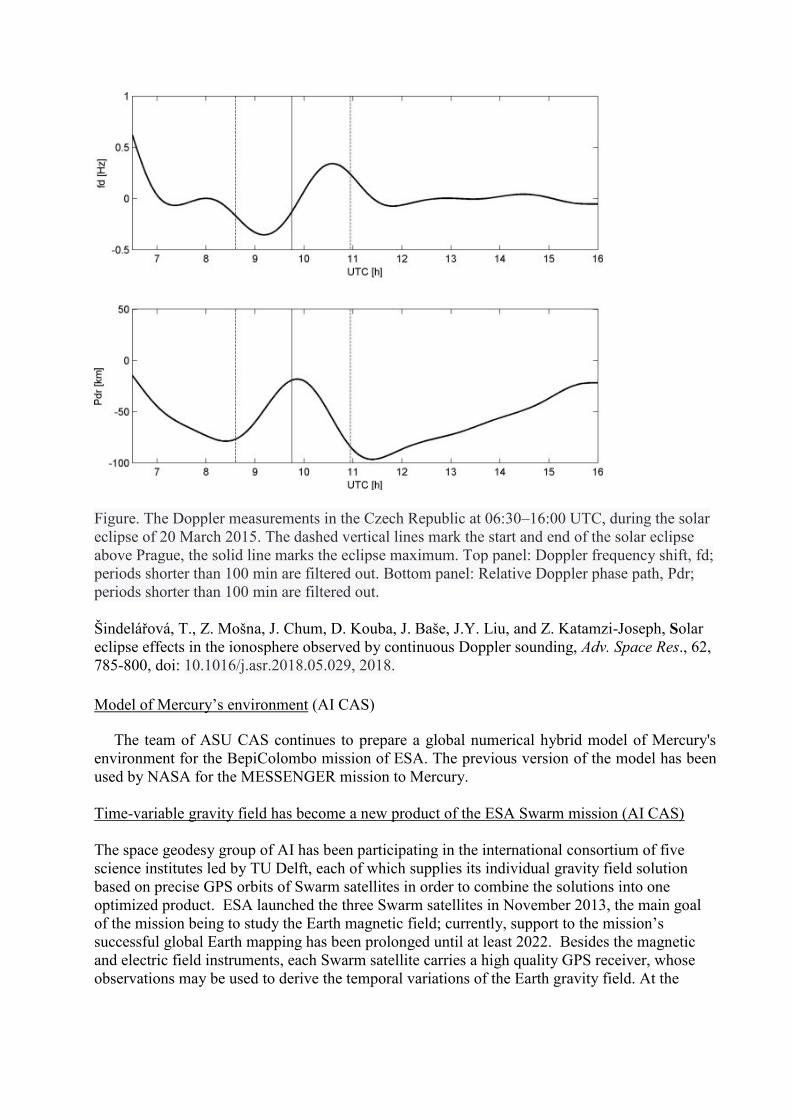
Figure. The Doppler measurements in the Czech Republic at 06:30–16:00 UTC, during the solar
eclipse of 20 March 2015. The dashed vertical lines mark the start and end of the solar eclipse
above Prague, the solid line marks the eclipse maximum. Top panel: Doppler frequency shift, fd;
periods shorter than 100 min are filtered out. Bottom panel: Relative Doppler phase path, Pdr;
periods shorter than 100 min are filtered out.
Šindelářová, T., Z. Mošna, J. Chum, D. Kouba, J. Baše, J.Y. Liu, and Z. Katamzi-Joseph, Solar
eclipse effects in the ionosphere observed by continuous Doppler sounding, Adv. Space Res., 62,
785-800, doi: 10.1016/j.asr.2018.05.029, 2018.
Model of Mercury’s environment (AI CAS)
The team of ASU CAS continues to prepare a global numerical hybrid model of Mercury's
environment for the BepiColombo mission of ESA. The previous version of the model has been
used by NASA for the MESSENGER mission to Mercury.
Time-variable gravity field has become a new product of the ESA Swarm mission (AI CAS)
The space geodesy group of AI has been participating in the international consortium of five
science institutes led by TU Delft, each of which supplies its individual gravity field solution
based on precise GPS orbits of Swarm satellites in order to combine the solutions into one
optimized product. ESA launched the three Swarm satellites in November 2013, the main goal
of the mission being to study the Earth magnetic field; currently, support to the mission’s
successful global Earth mapping has been prolonged until at least 2022. Besides the magnetic
and electric field instruments, each Swarm satellite carries a high quality GPS receiver, whose
observations may be used to derive the temporal variations of the Earth gravity field. At the
present time, the GRACE-FO satellites are the sole provider of such signal, while previously the
GRACE mission collected these data for 15 years.
Although the time-variable gravity signal from GPS data is somewhat noisier compared to that
obtained from specialized gravity missions GRACE/ GRACE-FO, the availability of Swarm
gravity fields was found useful, as between the GRACE and GRACE-FO data periods lies a gap
spanning from July 2017 to May 2018 and the geophysical community is interested to have the
series of monthly gravity fields uninterrupted. Thus, in 2019 the GPS-based monthly gravity
fields have become an official product of the Swarm mission, it could be accessed from
https://swarm-diss.eo.esa.int/ under the name EGF (Encarnação et al., 2019).
Figure. Agreement between the various individual Swarm monthly solutions and the GRACE
climatological model in terms of cumulative degree RMS (maximum degree 20) as function of
time, considering 750km smoothing (cf. fig. 9 in Encarnação et al., 2019).
Encarnação, J., Visser, P., Arnold, D., Bezdek, A., Doornbos, E., Ellmer, M., Guo, J., van den
IJssel, J., Iorfida, E., Jaggi, A., Klokocnik, J., Krauss, S., Mao, X., Mayer-Gurr, T., Meyer, U.,
Sebera, J., Shum, C. K., Zhang, C., Zhang, Y., and Dahle, C., 2019. Multi-approach gravity field
models from Swarm GPS data, Earth Syst. Sci. Data Discuss., https://doi.org/10.5194/essd-2019-
158.
Lightning contribution to whistler wave intensities in the plasmasphere (FM CU, IAP CAS)
Electromagnetic waves generated by lightning propagate into the plasmasphere as dispersed
whistlers. They can therefore influence the overall wave intensity in space, which, in turn, is
important for dynamics of the Van Allen radiation belts. The authors analyze spacecraft
measurements in low-Earth orbit as well as in high-altitude equatorial region, together with a
ground-based estimate of lightning activity. They have accumulated wave intensities when the
spacecraft are magnetically connected to thunderstorms and compared them with measurements
obtained when thunderstorms are absent. They have shown that strong lightning activity
substantially affects the wave intensity in a wide range of L-shells and altitudes. The effect is
observed mainly between 500 Hz and 4 kHz, but its frequency range strongly varies with L-shell,
extending up to 12 kHz for L lower than 3. The effect is stronger in the afternoon, evening, and

night sectors, consistent with more lightning and easier wave propagation through the
ionosphere.
Figure: Ratios between median power spectral densities of magnetic field fluctuations measured
by the Van Allen Probes inside the plasmasphere at the times of high and low lightning activity.
The individual panels were obtained for 3-hr-wide magnetic local time intervals centered at 3, 6,
…, 24 hr.
Záhlava, J., Nemec, F., Santolík, O., Kolmašová, I., Hospodarsky, G. B., Parrot, M., et al.
(2019). Lightning contribution to overall whistler mode wave intensities in the plasmasphere.
Geophysical Research Letters, 46, 8607–8616. https://doi.org/10.1029/ 2019GL083918
Polarization of Solar Wind Velocity Fluctuation (FMP CU)
The paper studies the polarization properties of the velocity fluctuations in solar wind turbulence
comparing the measurements to numerical solutions for a combination of kinetic Alfvén waves
and slow mode waves. The ratio of perpendicular to parallel velocity fluctuations in the inertial
range is smaller than the equivalent ratio for magnetic fluctuations, but gradually increases
throughout this range, on the other hand, in the kinetic range, there is a large decrease in the
ratio, similar to the magnetic fluctuations. There is some evidence that fluctuations in the solar
wind behave more fluid-like than expected for a weakly collisional plasma.

Figure: Ratio of PSDs of the B⊥ and B∥ magnetic field fluctuations (left) and the same plot for
V⊥ and V∥ velocity fluctuations (right). In the right-hand panel, the black and red colors
correspond to Spektr-R and Wind velocities, respectively.
Šafránková, J; Němeček, Z; Němec, F; Verscharen, D; Chen, CHK; Ďurovcová, T; Riazantseva,
MO, Scale-dependent Polarization of Solar Wind Velocity Fluctuations at the Inertial and
Kinetic Scales, Astrophys. J., 870 (1): Art. No. 40 (6 pages), 2019, doi:10.3847/1538-
4357/aaf239
Solar Wind Fluctuations at and below Ion Scales (FMP CU)
In the paper, the authors performed a large statistical study of normalized fluctuations of the
density, bulk velocity, and magnetic field around ion gyroscale and concentrated on (i) their
compressibility, (ii) the ratio of density and magnetic field fluctuations, and (iii) the ratio of
density and velocity fluctuations. They found that observed fluctuations follow the two-fluid
prediction for KAWs generally, but the spread of measured values around their theoretical
predictions is large. However, the analysis of measurement uncertainties shows that the
difference between the observed and predicted levels of fluctuations cannot be fully explained by
these uncertainties and that the nature of solar wind fluctuations is more complex.
Figure: Analysis of AKAW. (a) Scatter plot of observed and KAW predicted values of RnV at f
= fgp. (b) AKAW as a function of $krho_gp for each 30-minute interval (gray curves).
Pitňa, A; Šafránková, J; Němeček, Z; Franci, L; Pi, G; Montagud Camps, V, Characteristics of
Solar Wind Fluctuations at and below Ion Scales, Astrophys. J., 879 (2): Art. No. 82 (9 pages),
2019, doi:10.3847/1538-4357/ab22b8
The α-proton Differential Motion across SIR (FMP CU)

The paper focusses on properties of α-particles with respect to protons in corotating interaction
regions (CIRs) using measurements of the Wind and Helios spacecraft. Inside CIRs, a large
enhancement of AHe accompanied by a decrease in Vαp (α-proton relative drift) is often observed
in both compressed and slowed down fast solar wind close to the CIR leading edge; on the other
hand, a depletion of AHe is sometimes present in the compressed and accelerated slow solar
winds. We explain these observations in terms of magnetic mirroring of the multicomponent
solar wind in a converging magnetic field that develops within CIRs.
Figure: Superposed-epoch analysis of B (top); AHe (center); and Vap / VA (bottom) for Wind CIR
crossings with low (blue) or high (red) medians of Vap / VA within the slow (a), (c), (e) and fast
(b), (d), (f) streams surrounding the CIRs. The regions of the changed solar wind composition
are marked with a yellow background, the gray background parts of the panels are shown only
for completeness. The 25th and 75th percentiles are plotted by the dotted curves. The SI is
represented by the solid black line at 0.
Ďurovcová, T; Němeček, Z; Šafránková, J, Evolution of the α-proton Differential Motion across
Stream Interaction Regions, Astrophys. J., 873 (1): Art. No. 24 (8 pages), 2019,
doi:10.3847/1538-4357/ab01c8

Outreach activities
IAP CAS. A movie on the first Czechoslovak sub-satellite MAGION-1 has been produced under
guidance of IAP CAS; it was awarded by the first prize on scientific movie festival in Olomouc
in 2019. Another movie on MAGIONs 2-5 is under preparation.
There are also significant outreach/PR activities, run by the Czech Academy of Sciences in
frame of its program “Space for Mankind” lead by AI CAS, and also by the Czech Space Office.