Embed Size (px)
Citation preview
Report of the International Ice Patrol in the North Atlantic
2002 Season Bulletin No. 88 CG-188-57
U.S. Department of Homeland Security
United States Coast Guard
Bulletin No. 88
REPORT OF THE INTERNATIONAL ICE PATROL IN THE NORTH ATLANTIC
Season of 2002
CG-188-57
Forwarded herewith is Bulletin No. 88 of the International Ice Patrol, describing the Patrol’s services, ice observations and conditions during the 2002 season. A very dynamic Labrador Current and some of the largest icebergs to make their way to the Grand Banks in over three decades made the 2002 iceberg season both exciting and challenging. In mid-March, the iceberg population was quite literally racing south, causing the southern extent of the Limits of Known Ice to expand by 380 nautical miles in just 16 days. This extraordinary rapid rate of drift served as a poignant reminder of just how unpredictable and dangerous these breathtaking "castles of ice" can be. 2002 also marked the last year that the U. S. Coast Guard International Ice Patrol would operate under the direction of the U. S. Department of Transportation prior to its move to the new U. S. Department of Homeland Security in March of 2003. We hope you find the following information and descriptions of this demanding iceberg season fascinating and informative. Semper Paratus! R. L. DESH
Commander, U. S. Coast Guard Commander, International Ice Patrol
1
International Ice Patrol
2002 Annual Report
Contents List of Abbreviations and Acronyms.................................................. 2
Introduction............................................................................................. 3
Summary of Operations........................................................................ 4
Iceberg Reconnaissance & Oceanographic Operations.................. 10
Ice and Environmental Conditions...................................................... 16
Monthly Sea Ice Charts ......................................................................... 24
Biweekly Iceberg Charts ....................................................................... 32
Acknowledgements ............................................................................... 44
Appendix A: Nations Currently Supporting International Ice Patrol.......... 45
Appendix B: Ship Reports ...................................................................... 46
Appendix C: Commanders of the International Ice Patrol......................... 50
Appendix D: Very Large Tabular Icebergs: Ice Season 2002 and the Past. 51
Appendix E: Season Severity by Three Variable Index: LAKI Area, Length of
Season, Iceberg Population below 48°N ...................................................... 56
Ordering Past IIP Annual Reports from NTIS .................... Back Cover
2
List of Abbreviations and Acronyms
AOR Area Of Responsibility AXBT Air-deployed eXpendable BathyThermograph AVHRR Advanced Very High Resolution Radiometer BAPS iceBerg Analysis and Prediction System CAMSLANT Communications Area Master Station Atlantic CIS Canadian Ice Service
DFO Department of Fisheries and Oceans FLAR Forward-Looking Airborne Radar
HF High Frequency HMCS Her Majesty’s Canadian Ship IGOSS Integrated Global Ocean Services System IIP International Ice Patrol INMARSAT International Maritime Satellite (also Inmarsat) IRD Ice Reconnaissance Detachment IRI International Research Institute LAKI Limit of All Known Ice LDEO Lamont-Doherty Earth Observatory LOS Length Of Season M/V Motor Vessel NAC North Atlantic Current NAO North Atlantic Oscillation NAOI North Atlantic Oscillation Index NIC National Ice Center NSSI Normalized Season Severity Index NTIS National Technical Information Service PAL Provincial Air Lines RADAR Radio Detection And Ranging (also radar) RMS Royal Mail Steamer SOLAS Safety Of Life At Sea SLAR Side-Looking Airborne Radar SST Sea Surface Temperature WOCE World Ocean Circulation Experiment WWW World Wide Web
3
Introduction
This is the 88th annual report of the International Ice Patrol. It contains information on Ice Patrol operations, environmental conditions, and iceberg conditions for the 2002 season in the North Atlantic. Ice Patrol is supported by 17 member nations and conducted by the U. S. Coast Guard. Ice Patrol activities are delineated by U. S. Code, Title 46, Sections 738, 738a through 738d, and the International Convention for the Safety of Life at Sea, 1974. Ice Patrol was initiated shortly after the sinking of the RMS TITANIC on April 15, 1912 and has been conducted yearly since that time with the exception of brief periods during the two World Wars. Commander, International Ice Patrol is under the operational control of Commander, Coast Guard Atlantic Area. IIP conducts aerial reconnaissance from St. John’s, Newfoundland to search the southeastern, southern, and southwestern regions of the Grand Banks of Newfoundland for icebergs. IIP also receives iceberg location reports from ships and planes transiting its area of responsibility. We salute HMCS FREDERICTON who provided the most ship reports during the 2002 season. IIP analyzes iceberg and environmental data at its Operations Center in Groton, Connecticut. IIP predicts iceberg drift and deterioration using a computer model and produces twice-daily iceberg warnings that are broadcast to mariners as bulletins and charts. IIP also responds to requests for iceberg information. Vice Admiral Thad W. Allen was Commander, U.S. Coast Guard Atlantic Area through 14 May 2002 when he was relieved by Vice Admiral James D. Hull. CDR Robert L. Desh was Commander, International Ice Patrol. For more information about International Ice Patrol, including iceberg bulletins and charts, see IIP’s website at http://www.uscg.mil/lantarea/iip/home.html.
4
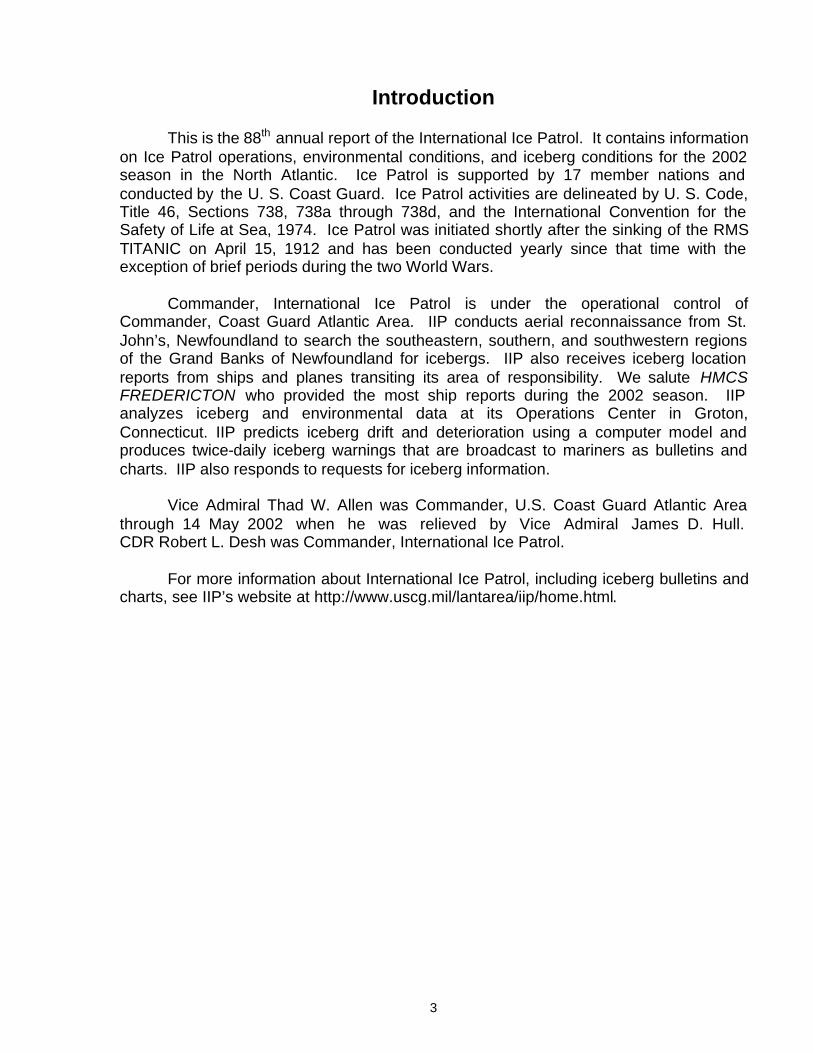
Figure 1. IIP’s operating area. ‘T’ indicates location of TITANIC sinking.
Summary of Operations
International Ice Patrol formally begins its seasonal ice observation and Ice Patrol service when icebergs threaten primary shipping routes between Europe and North America. This usually occurs in February and extends through July, but Ice Patrol commences operations when iceberg conditions dictate. Except during unusually heavy ice years, the Grand Banks of Newfoundland are normally iceberg free from August through January.
International Ice Patrol actively monitors the iceberg danger to transatlantic shipping in the region bounded by 40°N, 52°N, 39°W, and 57°W (Figure 1). Ice Patrol began issuing weekly products on 15 February 2002. Commander, International Ice Patrol opened the season on 19 February 2002 and daily products were distributed through
the close of the season on 15 July 2002. Note: All of the statistics reported in this summary are from the 15 February through 15 July 2002 time frame mentioned above.
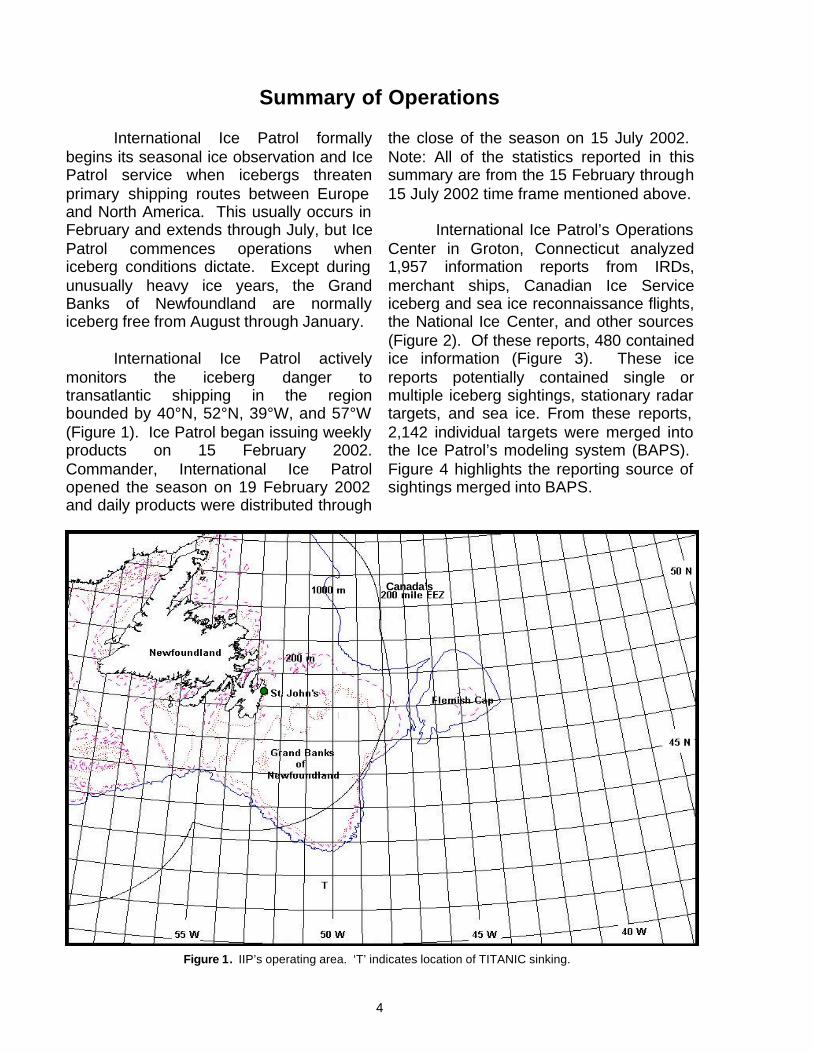
International Ice Patrol’s Operations Center in Groton, Connecticut analyzed 1,957 information reports from IRDs, merchant ships, Canadian Ice Service iceberg and sea ice reconnaissance flights, the National Ice Center, and other sources (Figure 2). Of these reports, 480 contained ice information (Figure 3). These ice reports potentially contained single or multiple iceberg sightings, stationary radar targets, and sea ice. From these reports, 2,142 individual targets were merged into the Ice Patrol’s modeling system (BAPS). Figure 4 highlights the reporting source of sightings merged into BAPS.
Canada’s
5
NIC1%
Oil Platforms>1%
Other2%
IIP2%
Canadian Government
14%Merchant Vessels
81%
Information Reports
Voluntary reports were requested from all ships transiting the Grand Banks region. As in previous years, ships were asked to report ice sightings, weather, and sea surface temperatures via Canadian Coast Guard Radio Station St. John's/ VON, U. S. Coast Guard Communications Area Master Station Atlantic/NMF or Inmarsat-C or Inmarsat-A using code 42. Ships were encouraged to make ice reports even if "no ice" was sighted, as knowledge of the lack of ice is also fundamental to accurate product generation for the mariner. The continued success and viability of the International Ice Patrol depends heavily upon all contributors of ice reports.
Merchant shipping provided the vast majority of reports received by IIP. In 2002, 192 ships from 21 different nations provided IIP with 1,613 or 81% of total reports. This demonstrates that the number of nations that used IIP services exceeds the 17 member nations supporting IIP under SOLAS. Furthermore, the international merchant fleet’s high level of participation indicated the value placed on IIP products and services. In 2002, the merchant vessel that provided the most reports was HMCS FREDERICTON (Canada), submitting 108 separate reports. Appendix B lists all ships that provided information reports, including weather, ice, stationary radar target, and sea surface temperature reports. While the vast majority of information reports were received from merchant shipping, IIP received valuable information from other sources as well. For example, the Canadian Government, which includes reports from the CIS reconnaissance airplane, contract reconnaissance flights by Provincial Airlines, HMCS vessels at sea, and even coastal lighthouses, provided 265 or 14% of the information reports received by IIP. Figure 2 provides a thorough breakdown of the sources for all information reports handled during 2002.
Ice Reports
Only a portion of the total reports
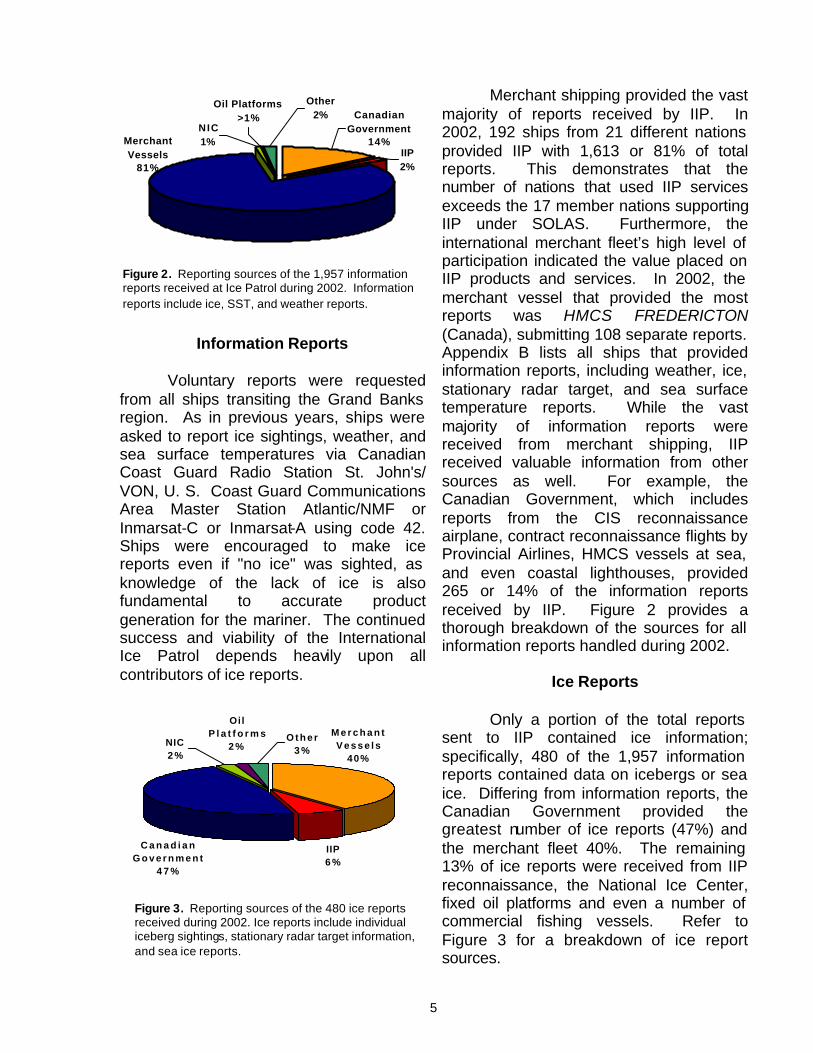
sent to IIP contained ice information; specifically, 480 of the 1,957 information reports contained data on icebergs or sea ice. Differing from information reports, the Canadian Government provided the greatest number of ice reports (47%) and the merchant fleet 40%. The remaining 13% of ice reports were received from IIP reconnaissance, the National Ice Center, fixed oil platforms and even a number of commercial fishing vessels. Refer to Figure 3 for a breakdown of ice report sources.
Figure 2. Reporting sources of the 1,957 information reports received at Ice Patrol during 2002. Information reports include ice, SST, and weather reports.
IIP6 %
O t h e r3 %
Oil P l a t f o r m s
2 %NIC2 %
M e r c h a n t V e s s e l s
40%
C a n a d i a n G o v e r n m e n t
4 7 %
Figure 3. Reporting sources of the 480 ice reports received during 2002. Ice reports include individual iceberg sightings, stationary radar target information, and sea ice reports.
6
I IP19%
Merchant Vessels
8%
Canadian Government
40%
BAPS31%
NIC2%
NIC5%
B A P S3 %
Canadian Government
2 2 %M e r c h a n t Vessels
27%
IIP4 3 %
Merged Targets
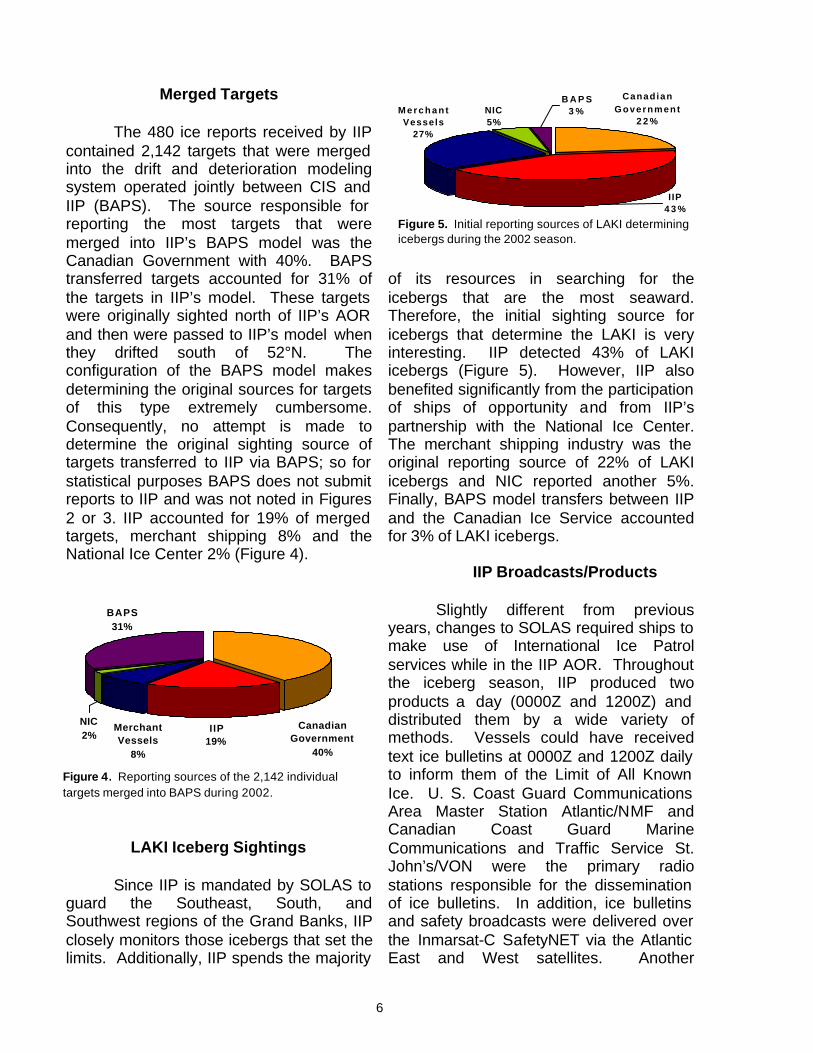
The 480 ice reports received by IIP contained 2,142 targets that were merged into the drift and deterioration modeling system operated jointly between CIS and IIP (BAPS). The source responsible for reporting the most targets that were merged into IIP’s BAPS model was the Canadian Government with 40%. BAPS transferred targets accounted for 31% of the targets in IIP’s model. These targets were originally sighted north of IIP’s AOR and then were passed to IIP’s model when they drifted south of 52°N. The configuration of the BAPS model makes determining the original sources for targets of this type extremely cumbersome. Consequently, no attempt is made to determine the original sighting source of targets transferred to IIP via BAPS; so for statistical purposes BAPS does not submit reports to IIP and was not noted in Figures 2 or 3. IIP accounted for 19% of merged targets, merchant shipping 8% and the National Ice Center 2% (Figure 4).
LAKI Iceberg Sightings
Since IIP is mandated by SOLAS to guard the Southeast, South, and Southwest regions of the Grand Banks, IIP closely monitors those icebergs that set the limits. Additionally, IIP spends the majority
of its resources in searching for the icebergs that are the most seaward. Therefore, the initial sighting source for icebergs that determine the LAKI is very interesting. IIP detected 43% of LAKI icebergs (Figure 5). However, IIP also benefited significantly from the participation of ships of opportunity and from IIP’s partnership with the National Ice Center. The merchant shipping industry was the original reporting source of 22% of LAKI icebergs and NIC reported another 5%. Finally, BAPS model transfers between IIP and the Canadian Ice Service accounted for 3% of LAKI icebergs.
IIP Broadcasts/Products
Slightly different from previous
years, changes to SOLAS required ships to make use of International Ice Patrol services while in the IIP AOR. Throughout the iceberg season, IIP produced two products a day (0000Z and 1200Z) and distributed them by a wide variety of methods. Vessels could have received text ice bulletins at 0000Z and 1200Z daily to inform them of the Limit of All Known Ice. U. S. Coast Guard Communications Area Master Station Atlantic/NMF and Canadian Coast Guard Marine Communications and Traffic Service St. John’s/VON were the primary radio stations responsible for the dissemination of ice bulletins. In addition, ice bulletins and safety broadcasts were delivered over the Inmarsat-C SafetyNET via the Atlantic East and West satellites. Another
Figure 4. Reporting sources of the 2,142 individual targets merged into BAPS during 2002.
Figure 5. Initial reporting sources of LAKI determining icebergs during the 2002 season.
7
transmitting station for the bulletins was the Marine Communications and Traffic Services St. Anthony/VCM. IIP also prepared an ice chart depicting the 1200Z Limit of All Known Ice for broadcast at 1600Z and 1810Z daily. U. S. Coast Guard Communications Area Master Station Atlantic/NMF and the National Weather Service assisted with the transmission of the ice chart. On the eastern side of the Atlantic, the German Federal Maritime and Hydrographic Agency stations Hamburg/DDH and Pinneberg/DDK transmitted IIP’s ice chart. Finally, both the bulletin and chart were placed on IIP’s website. The ice chart was also made available via plain paper facsimile and e-mail on demand.
IIP transmitted 292 scheduled ice
bulletins in 2002. IIP measured the quality and timeliness of the bulletins delivered to the mariner via the SafetyNET service, as this is the primary product for IIP’s largest customer base. Of 292 total bulletins sent, 289 (99%) arrived at the system on time, or by 0000Z or 1200Z, respectively. The late deliveries were due primarily to minor technical difficulties in sending the product through IIP’s commercial INMARSAT provider. All of the tardy deliveries occurred early in the season and subsequent process revisions eliminated late deliveries.
In 2002, IIP produced 147 ice charts that were distributed via HF radiofacsimile, e-mail on demand, and published on the WWW. Of these, 144 (97%) were delivered on time. Late ice charts were defined as those for which the radio frequency start tone starts greater than one minute later than the scheduled transmission time (1600Z or 1810Z). The primary cause of late ice charts was difficulty getting the signal from IIP through the line to CAMSLANT.
Safety Broadcasts
IIP sent 19 unscheduled safety broadcasts during the 2002 season for iceberg or stationary radar target sightings near or outside the published LAKI. Of these 19 broadcasts, six were for ice reported outside the published LAKI, three for icebergs inside but near the LAKI, and the remaining ten detailed stationary radar targets.
Historical Perspective
To compare ice years in a historical
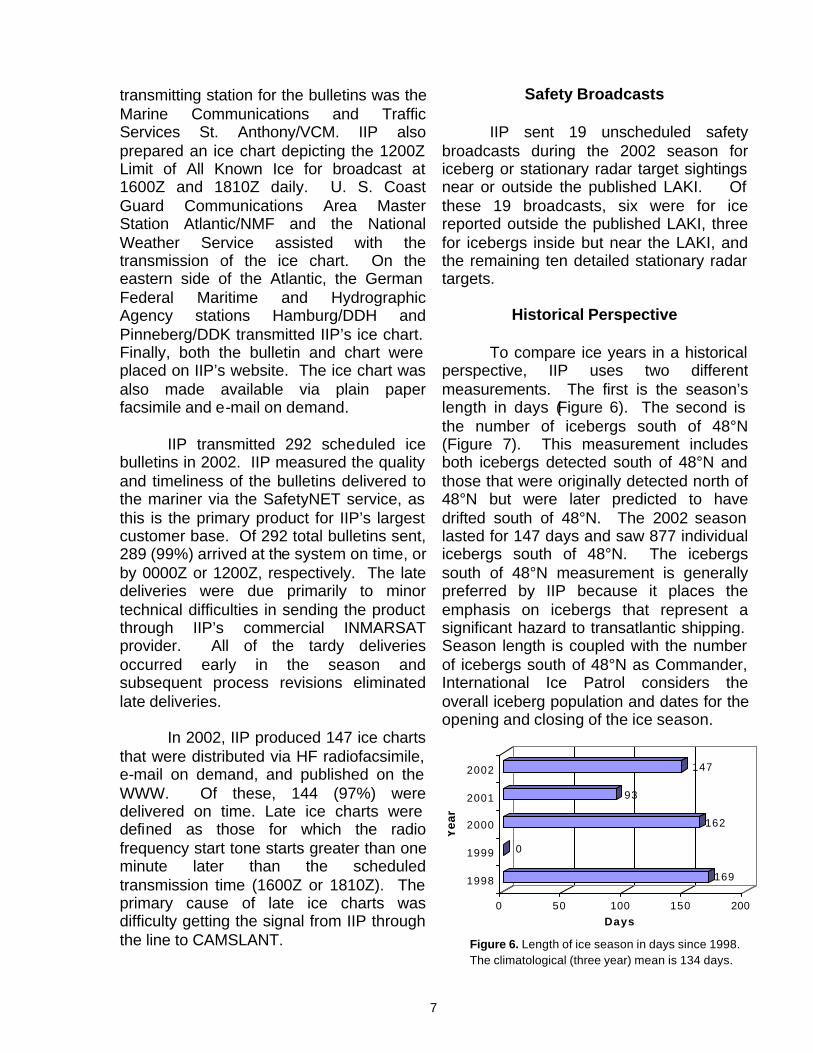
perspective, IIP uses two different measurements. The first is the season’s length in days (Figure 6). The second is the number of icebergs south of 48°N (Figure 7). This measurement includes both icebergs detected south of 48°N and those that were originally detected north of 48°N but were later predicted to have drifted south of 48°N. The 2002 season lasted for 147 days and saw 877 individual icebergs south of 48°N. The icebergs south of 48°N measurement is generally preferred by IIP because it places the emphasis on icebergs that represent a significant hazard to transatlantic shipping. Season length is coupled with the number of icebergs south of 48°N as Commander, International Ice Patrol considers the overall iceberg population and dates for the opening and closing of the ice season.
169
0
162
93
147
0 50 100 150 200Days
1998
1999
2000
2001
2002
Yea
r
Figure 6. Length of ice season in days since 1998. The climatological (three year) mean is 134 days.
8
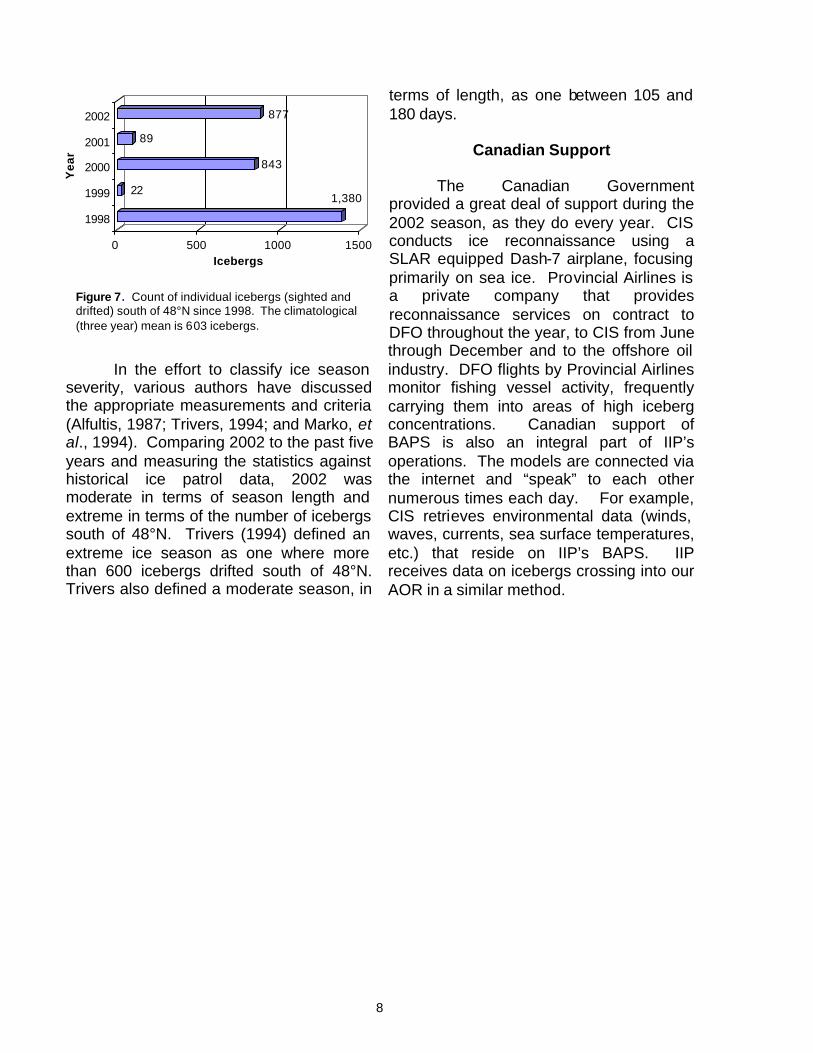
In the effort to classify ice season
severity, various authors have discussed the appropriate measurements and criteria (Alfultis, 1987; Trivers, 1994; and Marko, et al., 1994). Comparing 2002 to the past five years and measuring the statistics against historical ice patrol data, 2002 was moderate in terms of season length and extreme in terms of the number of icebergs south of 48°N. Trivers (1994) defined an extreme ice season as one where more than 600 icebergs drifted south of 48°N. Trivers also defined a moderate season, in
terms of length, as one between 105 and 180 days.
Canadian Support
The Canadian Government
provided a great deal of support during the 2002 season, as they do every year. CIS conducts ice reconnaissance using a SLAR equipped Dash-7 airplane, focusing primarily on sea ice. Provincial Airlines is a private company that provides reconnaissance services on contract to DFO throughout the year, to CIS from June through December and to the offshore oil industry. DFO flights by Provincial Airlines monitor fishing vessel activity, frequently carrying them into areas of high iceberg concentrations. Canadian support of BAPS is also an integral part of IIP’s operations. The models are connected via the internet and “speak” to each other numerous times each day. For example, CIS retrieves environmental data (winds, waves, currents, sea surface temperatures, etc.) that reside on IIP’s BAPS. IIP receives data on icebergs crossing into our AOR in a similar method.
1,38022
843
89
877
0 500 1000 1500Icebergs
1998
1999
2000
2001
2002
Yea
r
Figure 7. Count of individual icebergs (sighted and drifted) south of 48°N since 1998. The climatological (three year) mean is 603 icebergs.
9
References Alfultis, M. 1987. Iceberg Populations South of 48°N Since 1900. Appendix B in Report
of the International Ice Patrol in the North Atlantic, 1987 Season, Bulletin No. 73, CG-188-42, 63-67.
Marko, J. R., D. B. Fissel, P. Wadhams, P. M. Kelly and R. D. Brown, 1994. Iceberg
Severity off Eastern North America: Its Relationship to Sea Ice Variability and Climate Change. J. Climate, 7, 1335-1351.
Trivers, G., 1994. International Ice Patrol’s Iceberg Season Severity. Appendix C in
Report of the International Ice Patrol in the North Atlantic, 1994 Season, Bulletin No. 80, CG-188-49, 49-59.
10
Iceberg Reconnaissance & Oceanographic Operations
Iceberg Reconnaissance
The Ice Reconnaissance Detachment is a subunit under Commander, International Ice Patrol with Coast Guard Air Station Elizabeth City providing the aircraft platform. The IRD is deployed to observe and report ice and oceanographic conditions on the Grand Banks of Newfoundland. Oceanographic observations are used for operational and research purposes.
Ice Patrol’s pre-season IRD
departed on 30 January 2002 to determine the early season iceberg distribution. Regular IRDs operated from Newfoundland approximately every other week from 13 Feb 2002 through 10 Jul 2002. An average of four reconnaissance flights were made during each IRD. Iceberg reconnaissance operations concluded with
the return of the post-season IRD on 6 September 2002.
Coast Guard aircraft are the primary
means of detecting icebergs that form the Limit of All Known Ice. IIP utilizes a Coast Guard C-130 long range aircraft equipped with a Motorola AN/APS-135 Side-Looking Airborne Radar and a Texas Instruments AN/APS-137 Forward-Looking Airborne Radar to conduct iceberg reconnaissance. IIP has used SLAR since 1983 and FLAR since 1993.
Environmental conditions on the
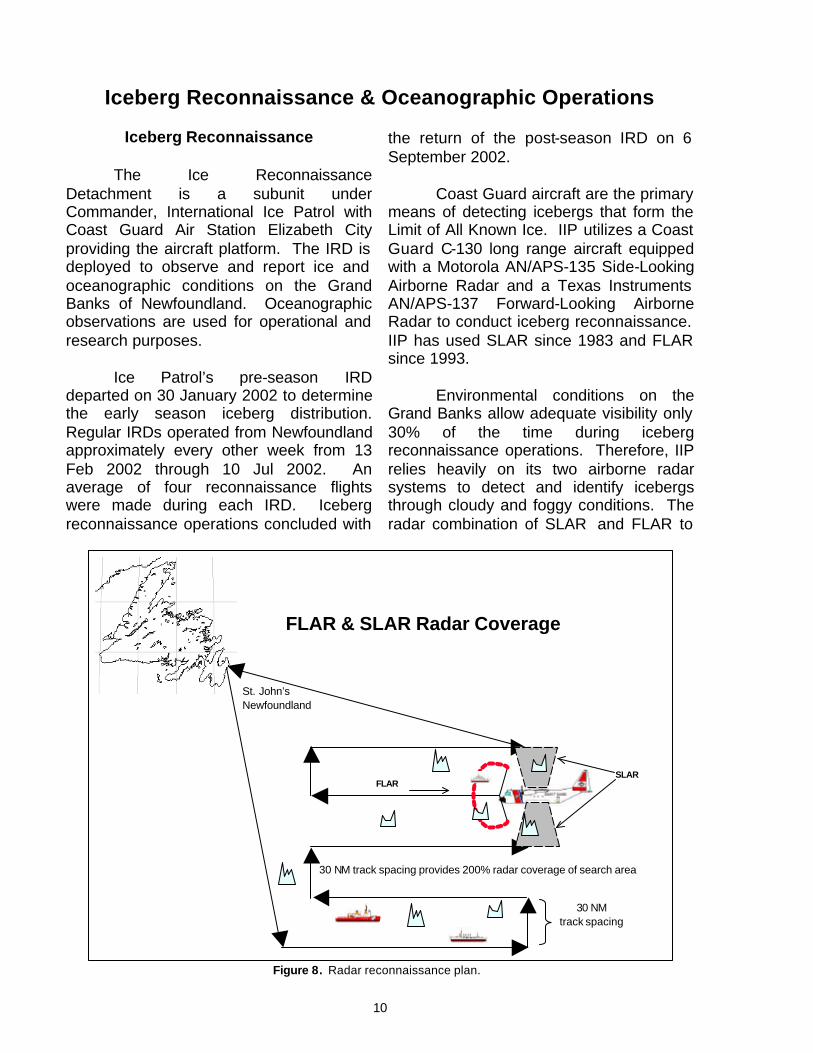
Grand Banks allow adequate visibility only 30% of the time during iceberg reconnaissance operations. Therefore, IIP relies heavily on its two airborne radar systems to detect and identify icebergs through cloudy and foggy conditions. The radar combination of SLAR and FLAR to
FLAR
30 NM track spacing provides 200% radar coverage of search area
St. John’s Newfoundland
FLAR & SLAR Radar Coverage
SLAR
30 NM
track spacing
Figure 8. Radar reconnaissance plan.
11
detect and identify icebergs in pervasive low visibility conditions minimizes the flight hours required to accurately determine the LAKI. The radar combination allows IIP to use 30 nm track spacing. The C-130 with SLAR and FLAR covers a large ocean area while providing 200% radar coverage (Figure 8). IIP can currently cover 40,000 nm2 at 30 nm track spacing in any visibility conditions. A detailed description of IIP’s reconnaissance strategy is provided at http://www.uscg.mil/lantarea/iip/FAQ/faq25.html.
An IRD was deployed to IIP’s base
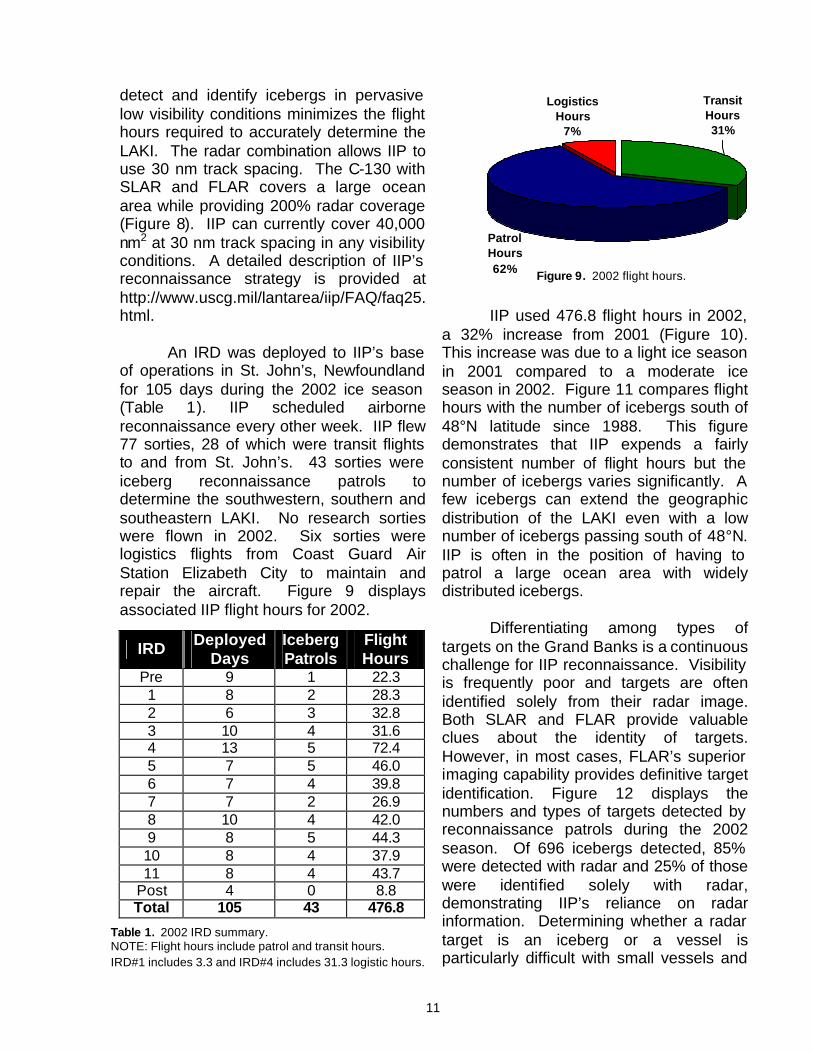
of operations in St. John’s, Newfoundland for 105 days during the 2002 ice season (Table 1). IIP scheduled airborne reconnaissance every other week. IIP flew 77 sorties, 28 of which were transit flights to and from St. John’s. 43 sorties were iceberg reconnaissance patrols to determine the southwestern, southern and southeastern LAKI. No research sorties were flown in 2002. Six sorties were logistics flights from Coast Guard Air Station Elizabeth City to maintain and repair the aircraft. Figure 9 displays associated IIP flight hours for 2002.
IRD Deployed Days
Iceberg Patrols
Flight Hours
Pre 9 1 22.3 1 8 2 28.3 2 6 3 32.8 3 10 4 31.6 4 13 5 72.4 5 7 5 46.0 6 7 4 39.8 7 7 2 26.9 8 10 4 42.0 9 8 5 44.3 10 8 4 37.9 11 8 4 43.7
Post 4 0 8.8 Total 105 43 476.8
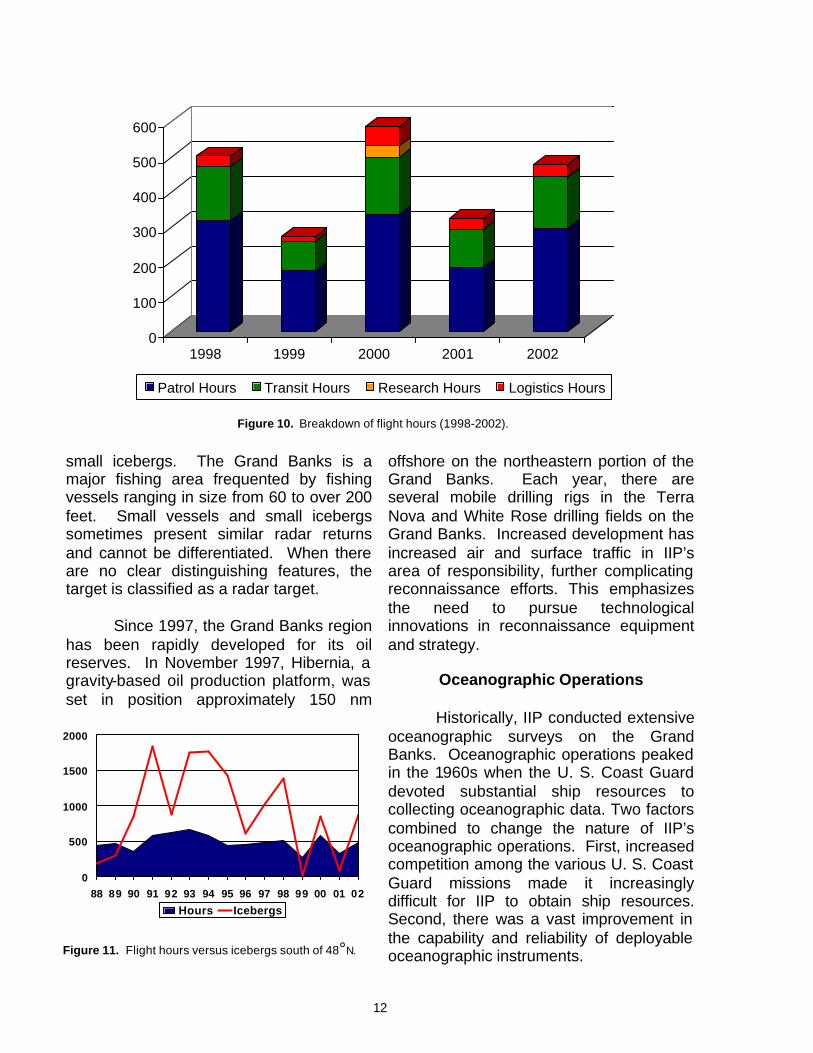
IIP used 476.8 flight hours in 2002, a 32% increase from 2001 (Figure 10). This increase was due to a light ice season in 2001 compared to a moderate ice season in 2002. Figure 11 compares flight hours with the number of icebergs south of 48°N latitude since 1988. This figure demonstrates that IIP expends a fairly consistent number of flight hours but the number of icebergs varies significantly. A few icebergs can extend the geographic distribution of the LAKI even with a low number of icebergs passing south of 48°N. IIP is often in the position of having to patrol a large ocean area with widely distributed icebergs.
Differentiating among types of
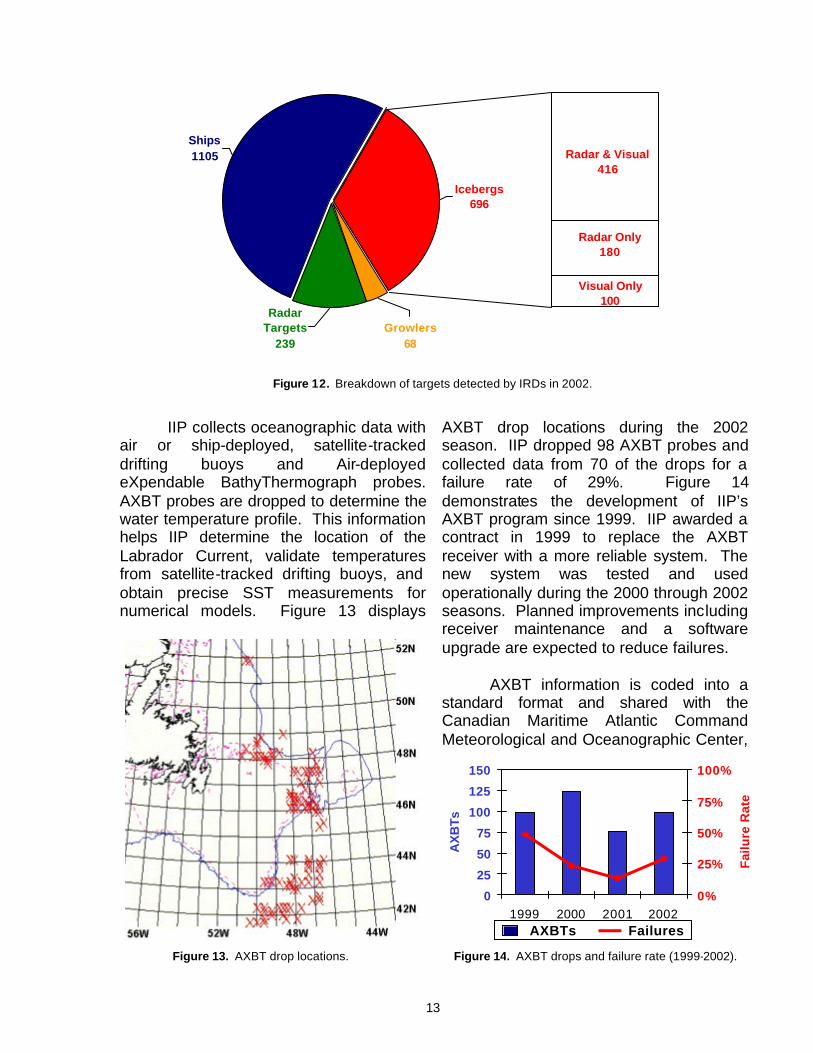
targets on the Grand Banks is a continuous challenge for IIP reconnaissance. Visibility is frequently poor and targets are often identified solely from their radar image. Both SLAR and FLAR provide valuable clues about the identity of targets. However, in most cases, FLAR’s superior imaging capability provides definitive target identification. Figure 12 displays the numbers and types of targets detected by reconnaissance patrols during the 2002 season. Of 696 icebergs detected, 85% were detected with radar and 25% of those were identified solely with radar, demonstrating IIP’s reliance on radar information. Determining whether a radar target is an iceberg or a vessel is particularly difficult with small vessels and
Transit Hours31%
Patrol Hours62%
Logistics Hours
7%
Table 1. 2002 IRD summary. NOTE: Flight hours include patrol and transit hours. IRD#1 includes 3.3 and IRD#4 includes 31.3 logistic hours.
Figure 9. 2002 flight hours.
12
small icebergs. The Grand Banks is a major fishing area frequented by fishing vessels ranging in size from 60 to over 200 feet. Small vessels and small icebergs sometimes present similar radar returns and cannot be differentiated. When there are no clear distinguishing features, the target is classified as a radar target.
Since 1997, the Grand Banks region has been rapidly developed for its oil reserves. In November 1997, Hibernia, a gravity-based oil production platform, was set in position approximately 150 nm
offshore on the northeastern portion of the Grand Banks. Each year, there are several mobile drilling rigs in the Terra Nova and White Rose drilling fields on the Grand Banks. Increased development has increased air and surface traffic in IIP’s area of responsibility, further complicating reconnaissance efforts. This emphasizes the need to pursue technological innovations in reconnaissance equipment and strategy.
Oceanographic Operations Historically, IIP conducted extensive
oceanographic surveys on the Grand Banks. Oceanographic operations peaked in the 1960s when the U. S. Coast Guard devoted substantial ship resources to collecting oceanographic data. Two factors combined to change the nature of IIP’s oceanographic operations. First, increased competition among the various U. S. Coast Guard missions made it increasingly difficult for IIP to obtain ship resources. Second, there was a vast improvement in the capability and reliability of deployable oceanographic instruments.
0
100
200
300
400
500
600
1998 1999 2000 2001 2002
Patrol Hours Transit Hours Research Hours Logistics Hours
Figure 10. Breakdown of flight hours (1998-2002).
0
500
1000
1500
2000
88 89 90 91 92 93 94 95 96 97 98 99 00 01 02
Hours Icebergs
Figure 11. Flight hours versus icebergs south of 48°N.
13
IIP collects oceanographic data with air or ship-deployed, satellite-tracked drifting buoys and Air-deployed eXpendable BathyThermograph probes. AXBT probes are dropped to determine the water temperature profile. This information helps IIP determine the location of the Labrador Current, validate temperatures from satellite-tracked drifting buoys, and obtain precise SST measurements for numerical models. Figure 13 displays
AXBT drop locations during the 2002 season. IIP dropped 98 AXBT probes and collected data from 70 of the drops for a failure rate of 29%. Figure 14 demonstrates the development of IIP’s AXBT program since 1999. IIP awarded a contract in 1999 to replace the AXBT receiver with a more reliable system. The new system was tested and used operationally during the 2000 through 2002 seasons. Planned improvements including receiver maintenance and a software upgrade are expected to reduce failures.
AXBT information is coded into a
standard format and shared with the Canadian Maritime Atlantic Command Meteorological and Oceanographic Center,
Growlers68
RadarTargets
239
Ships1105
Icebergs696
Visual Only100
Radar Only180
Radar & Visual416
Figure 12. Breakdown of targets detected by IRDs in 2002.
Figure 14. AXBT drops and failure rate (1999-2002). Figure 13. AXBT drop locations.
0
25
50
75
100
125
150
1999 2000 2001 2002
AX
BT
s
0%
25%
50%
75%
100%
Fai
lure
Rat
e
AXBTs Failures
14
IIP’s supplier of AXBT probes. The numerical results of AXBT drops are also sent to the U. S. Naval Fleet Numerical Oceanographic and Meteorological Center where they are quality controlled and redistributed via oceanographic products.
Satellite-tracked drifting buoys,
popularly known as WOCE buoys, are drogued at a depth of either 15 or 50 meters and provide near real-time ocean current information. For operational use by IIP, WOCE buoys are deployed primarily in the inshore and offshore branches of the Labrador Current. The historical current database used by IIP’s computer model is modified weekly using information from these drifting buoys. The 2002 iceberg season proved especially challenging in terms of current variability at the southern end of the Grand Banks, demonstrating
IIP’s requirement for this valuable information.
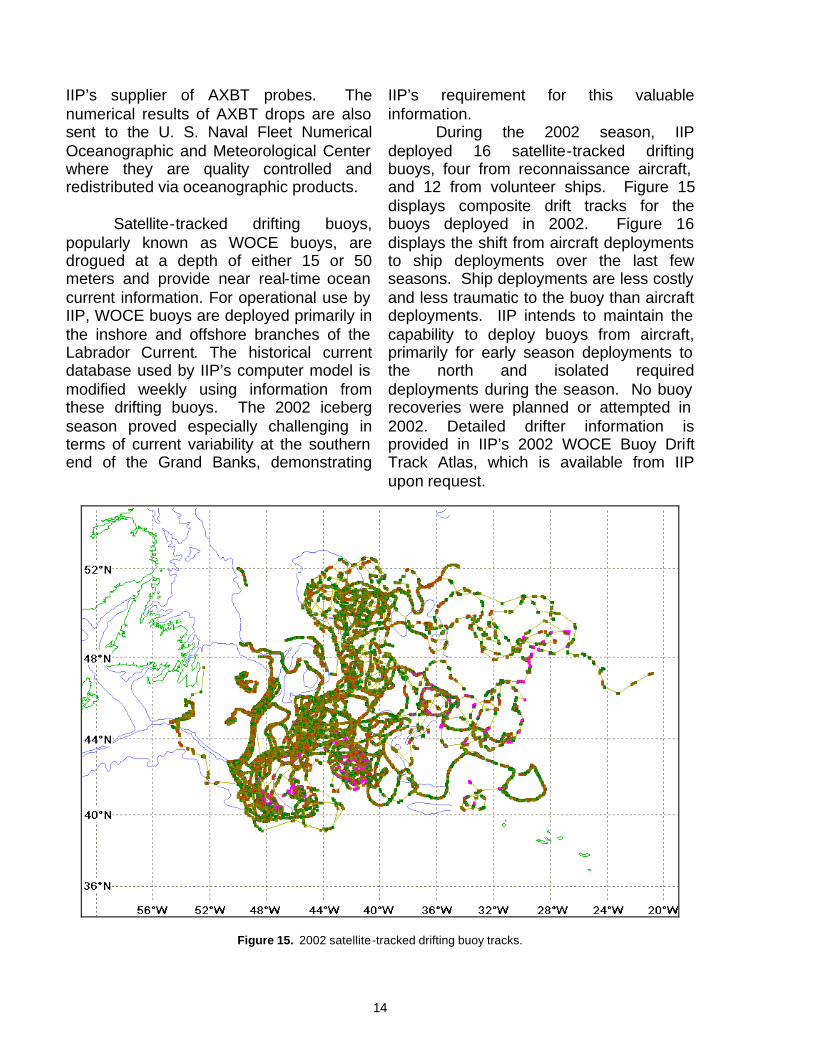
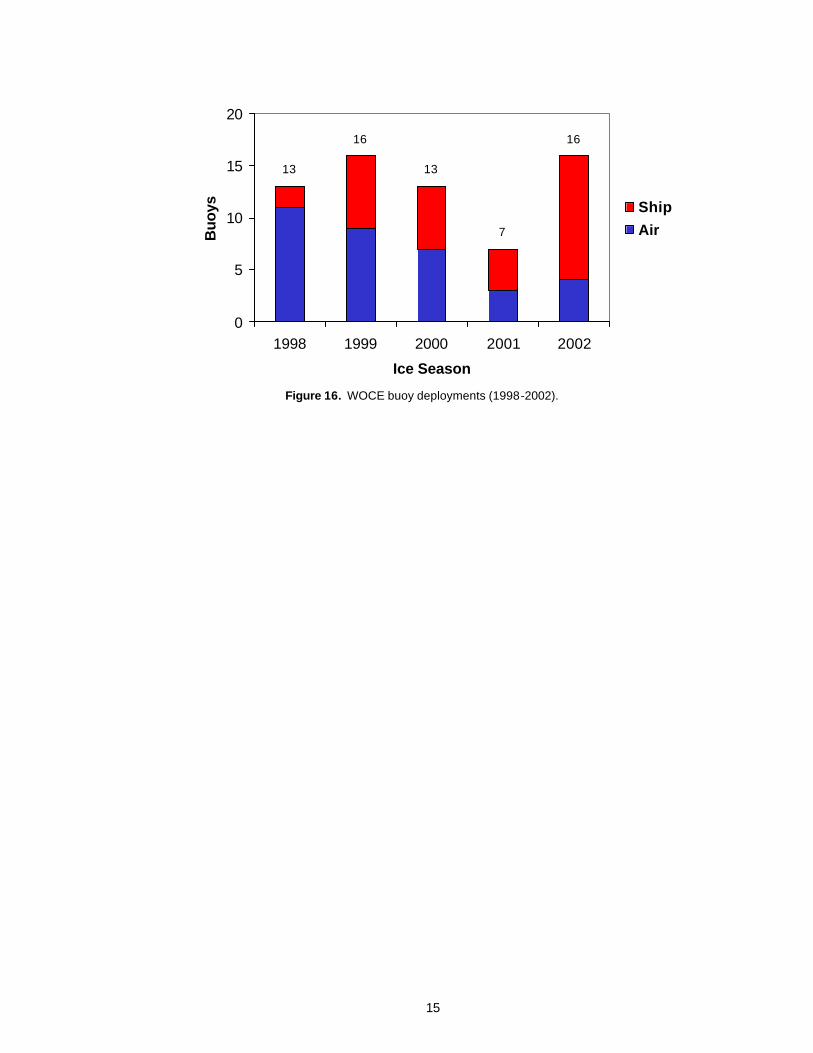
During the 2002 season, IIP deployed 16 satellite-tracked drifting buoys, four from reconnaissance aircraft, and 12 from volunteer ships. Figure 15 displays composite drift tracks for the buoys deployed in 2002. Figure 16 displays the shift from aircraft deployments to ship deployments over the last few seasons. Ship deployments are less costly and less traumatic to the buoy than aircraft deployments. IIP intends to maintain the capability to deploy buoys from aircraft, primarily for early season deployments to the north and isolated required deployments during the season. No buoy recoveries were planned or attempted in 2002. Detailed drifter information is provided in IIP’s 2002 WOCE Buoy Drift Track Atlas, which is available from IIP upon request.
Figure 15. 2002 satellite-tracked drifting buoy tracks.
15
0
5
10
15
20
1998 1999 2000 2001 2002
Ice Season
Buo
ys Ship
Air
13
16
7
13
16
Figure 16. WOCE buoy deployments (1998-2002).
16
Ice and Environmental Conditions
Introduction
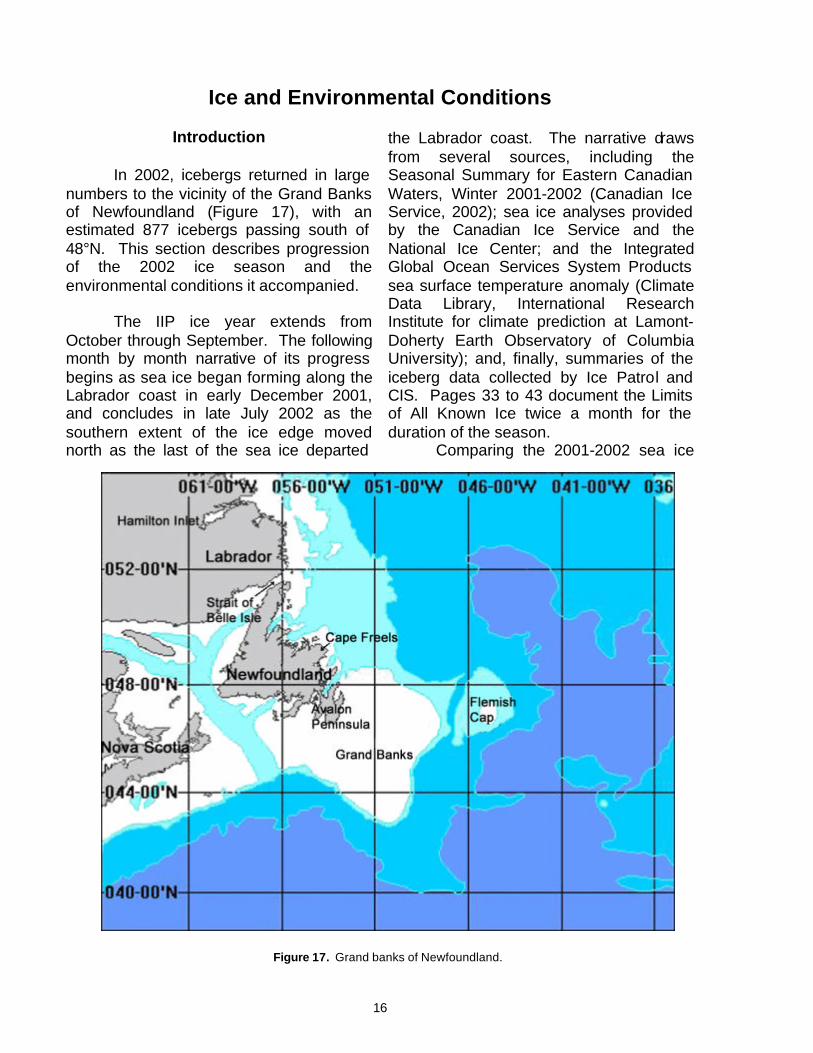
In 2002, icebergs returned in large numbers to the vicinity of the Grand Banks of Newfoundland (Figure 17), with an estimated 877 icebergs passing south of 48°N. This section describes progression of the 2002 ice season and the environmental conditions it accompanied. The IIP ice year extends from October through September. The following month by month narrative of its progress begins as sea ice began forming along the Labrador coast in early December 2001, and concludes in late July 2002 as the southern extent of the ice edge moved north as the last of the sea ice departed
the Labrador coast. The narrative draws from several sources, including the Seasonal Summary for Eastern Canadian Waters, Winter 2001-2002 (Canadian Ice Service, 2002); sea ice analyses provided by the Canadian Ice Service and the National Ice Center; and the Integrated Global Ocean Services System Products sea surface temperature anomaly (Climate Data Library, International Research Institute for climate prediction at Lamont-Doherty Earth Observatory of Columbia University); and, finally, summaries of the iceberg data collected by Ice Patrol and CIS. Pages 33 to 43 document the Limits of All Known Ice twice a month for the duration of the season. Comparing the 2001-2002 sea ice
Figure 17. Grand banks of Newfoundland.
17
and iceberg observations to the historical record emphasizes the departures from normal and gives a greater appreciation for the variability of the ice distribution in the western North Atlantic. For sea ice, Sea Ice Climatic Atlas, East Coast of Canada, 1971-2000 (Canadian Ice Service, 2001) provides a 30 year median of ice concentration at seven day intervals for the period from November 26 through July 16. Viekman and Baumer (1995) present an iceberg limits climatology from mid-March to July 30 based on 21 years of Ice Patrol observations from 1975 through 1995. They provide the extreme, median, and minimum extent of the Limit of All Known Ice for the period. Finally, the average number of icebergs estimated to have drifted south of 48°N for each month was calculated using 102 years (1900 through 2001) of IIP records.
The pre-season sea ice forecast (Canadian Ice Service, 2001), which was issued in early December, predicted:
• one week later than normal freeze-up along the Labrador coast and in east Newfoundland waters due to slightly above normal air and sea surface temperatures in the region,
• movement of the ice edge into the Strait of Belle Isle during the first week of January 2002,
• sea ice reaching Cape Bonavista during the second week of February,
• maximum extent of the sea ice attained in mid-March, with the ice edge approximately at the latitude of St. John’s for the entire month, and
• normal retreat of the southern ice edge in the spring.
A series of six CIS reconnaissance flights conducted in mid-October documented a population of 825 icebergs from 61°N to 66°N, with the highest concentration north of 62°N (Desjardins, 2001). Although most of the icebergs were near the Baffin Island coast, more than 100 were offshore. Desjardins (2001) predicted that the first of these would reach 48°N during the month of February 2002.
December 2001
In Labrador, sea ice began forming in the bays and near coastal areas in early December, which is near normal. However, the southern edge of the main ice pack didn’t arrive on the northern Labrador coast until mid-month, about two weeks later than normal. Warmer than normal air temperatures in southern Labrador throughout December delayed freeze-up along the southern coast and in the Strait of Belle Isle by one to two weeks. In Newfoundland, air temperatures were near normal during the first half of the month, but increased to five to ten degrees above normal during the second half. Mean December sea surface temperatures were near normal off the southern Labrador coast and on the northeast Newfoundland shelf. At month’s end the Strait of Belle Isle was free of sea ice. No icebergs passed south of 48°N during December.
January 2002
Warm conditions continued in southern Labrador and Newfoundland in the first half of January. The southern ice edge continued to expand slowly, and shortly after mid-month reached St. Anthony, about two weeks later than normal. Throughout the region, air temperatures turned dramatically colder during the second half of the month,
18
particularly in southern Labrador where Goose Bay experienced an average air temperature nearly seven degrees below normal. This accelerated sea ice expansion, and by month’s end the southern ice edge reached 50°N, about a week later than normal. Beginning 20 January the Strait of Belle Isle was not recommended for transatlantic marine traffic due to ice conditions
Two CIS reconnaissance flights in late January found a small iceberg population along the Labrador coast from 52°N to nearly 60°N. They located 59 visually confirmed icebergs, 22 radar targets and 18 growlers/bergy bits, mostly in the sea ice. No icebergs passed south of 48°N during the month.
February
Although air temperatures in southern Labrador and Newfoundland moderated somewhat in early February, they continued to be lower than normal. The sea ice continued its rapid expansion, and by mid-month the southern ice edge reached the latitude of Baccalieu Island, which is near the northernmost point of the Avalon Peninsula. The southern extent was close to normal and the eastern edge was less than normal. Thus, despite the slow start in early January, the ice extent recovered to near normal conditions by mid-February. In general, ice thickness was less than normal.
Air temperatures continued their
moderating trend in the last half of February, particularly in Newfoundland, where the mean temperature was well above normal for the two week period. Both the southern and eastern ice edges retreated, the southern to the latitude of Cape Bonavista. Periods of west and southwest winds created a shore lead from
St. John’s to the vicinity of Fogo Island . On 30 January, Ice Patrol deployed
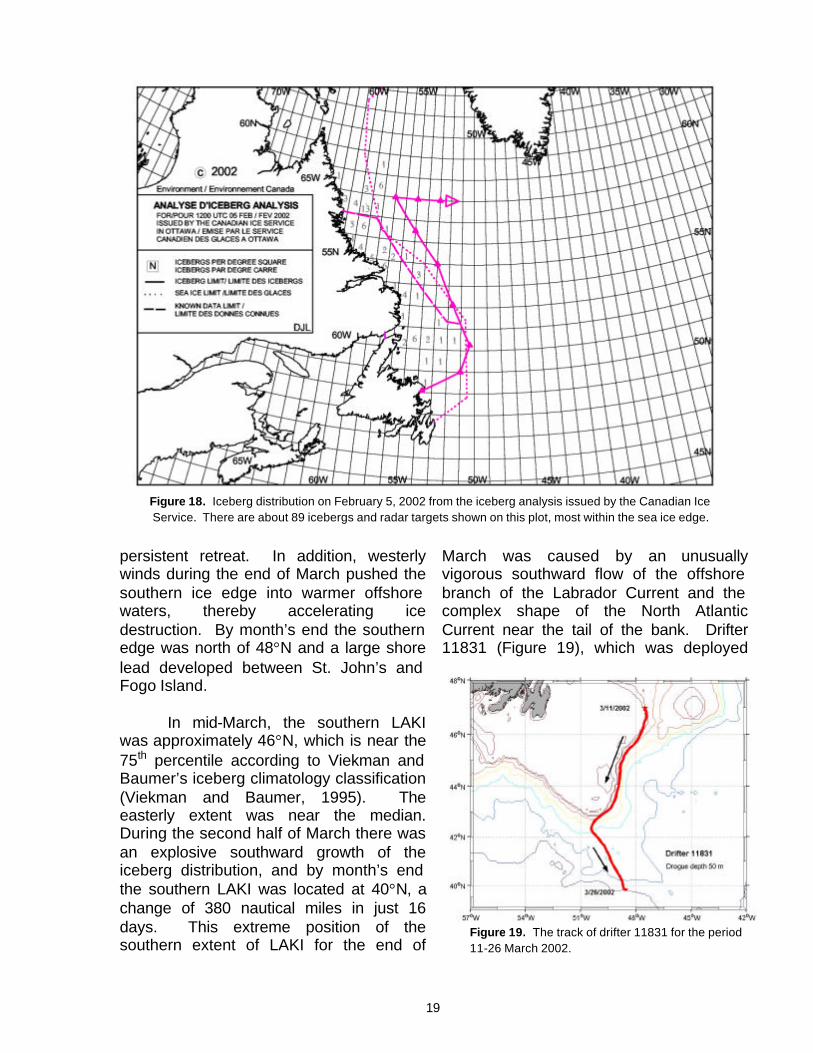
its pre-season Ice Reconnaissance Detachment to Canada. The intent of the IRD was to monitor the progress of the icebergs toward the Grand Banks and help determine the start date for the season. A reconnaissance flight on 4 February focused on the area immediately seaward of the ice edge from 52°N to 59°N to complement the late January CIS flights. They found a small population of nine icebergs and four radar targets off northern Labrador. When combined with the results of the late January CIS flights and several iceberg reports from ships, the early February iceberg distribution (Figure 18) shows a sparse population of icebergs from the north Newfoundland coast to northern Labrador.
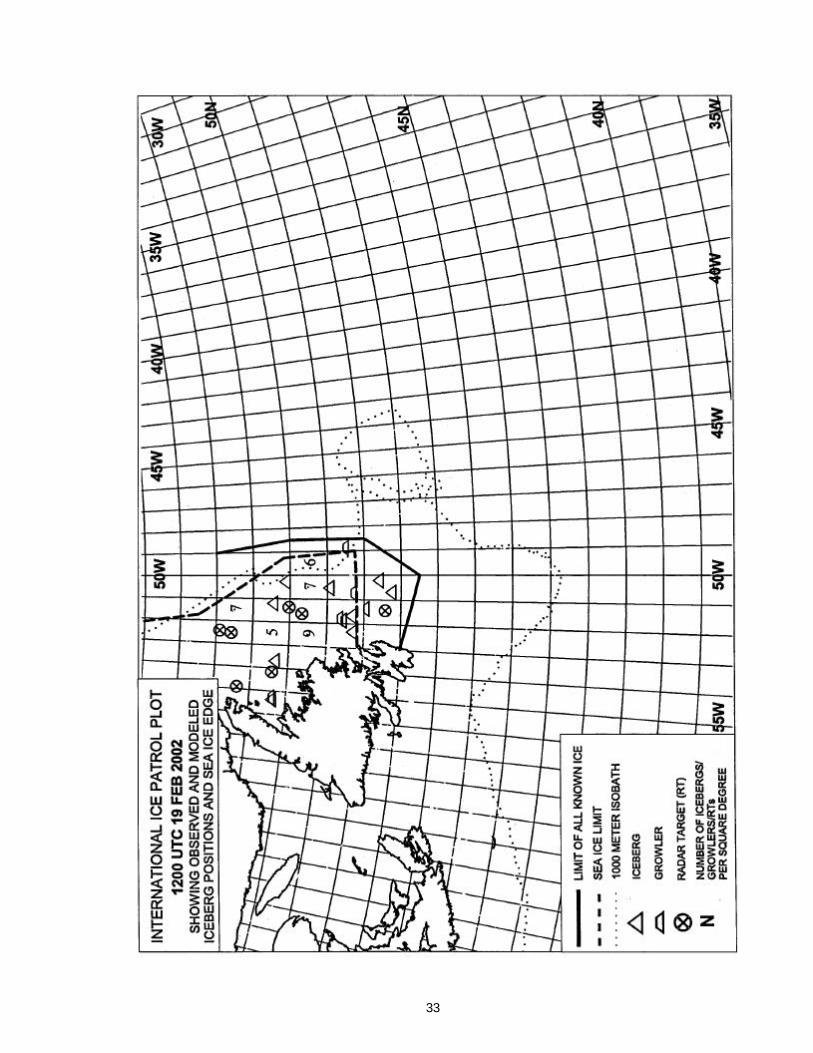
On 19 February, Ice Patrol formally
opened the 2002 ice season. Throughout the month, the Limits of All Known Ice remained in the northern part of the Grand Banks and did not extend eastward into Flemish Pass. Ice Patrol estimated that 16 icebergs passed south of 48°N during February, nearly average for the month.
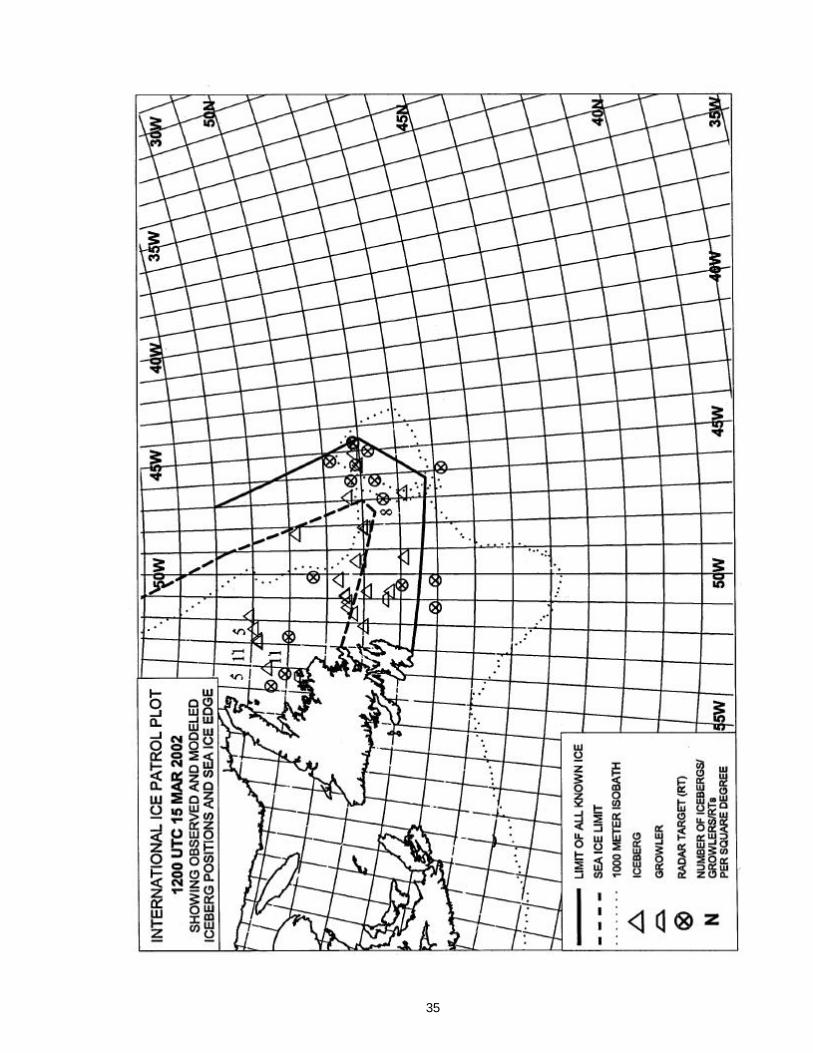
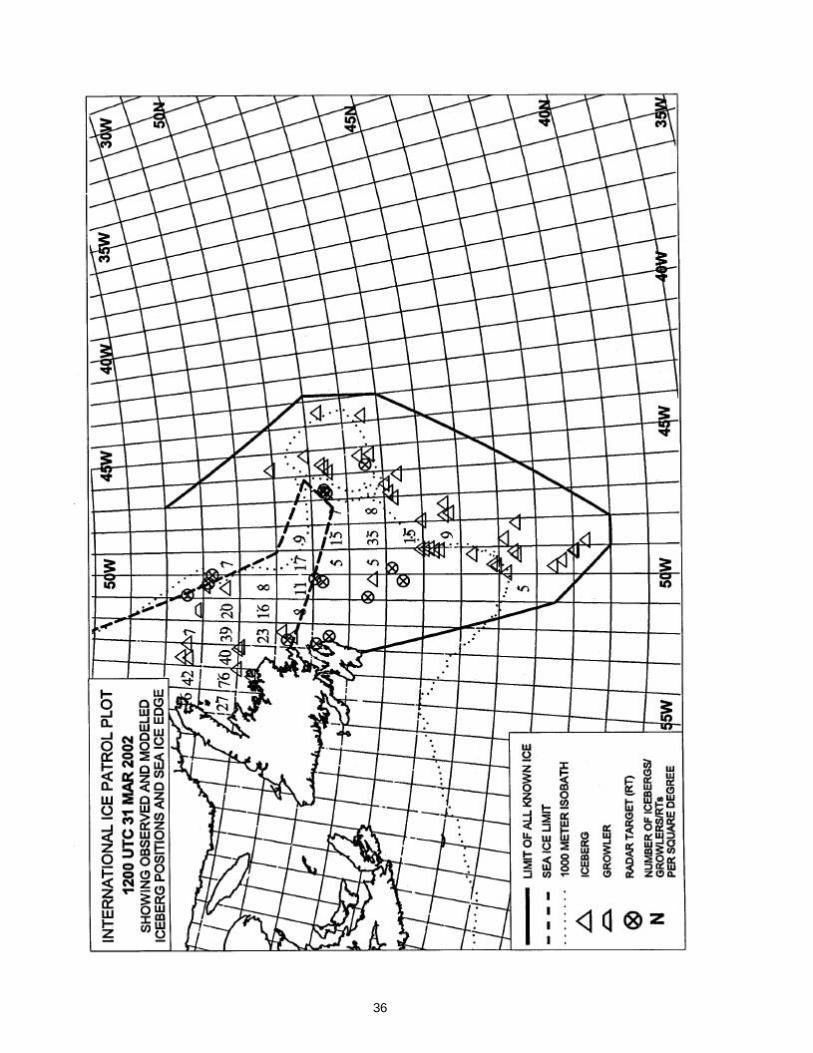
March
Near normal March air temperatures in Newfoundland resulted in a re-advance of the southern ice edge during the first three weeks of the month. A brief period of west and southwest winds early in the month caused the development a short-lived shore lead about 20 to 30 miles wide along the north coast of Newfoundland. This lead closed at the end of the first week of March. By the end of the third week, the southern ice edge attained its maximum extent for 2002, reaching the vicinity of 47°N, 47°W. During the last week of March the ice edge began a
19
persistent retreat. In addition, westerly winds during the end of March pushed the southern ice edge into warmer offshore waters, thereby accelerating ice destruction. By month’s end the southern edge was north of 48°N and a large shore lead developed between St. John’s and Fogo Island.
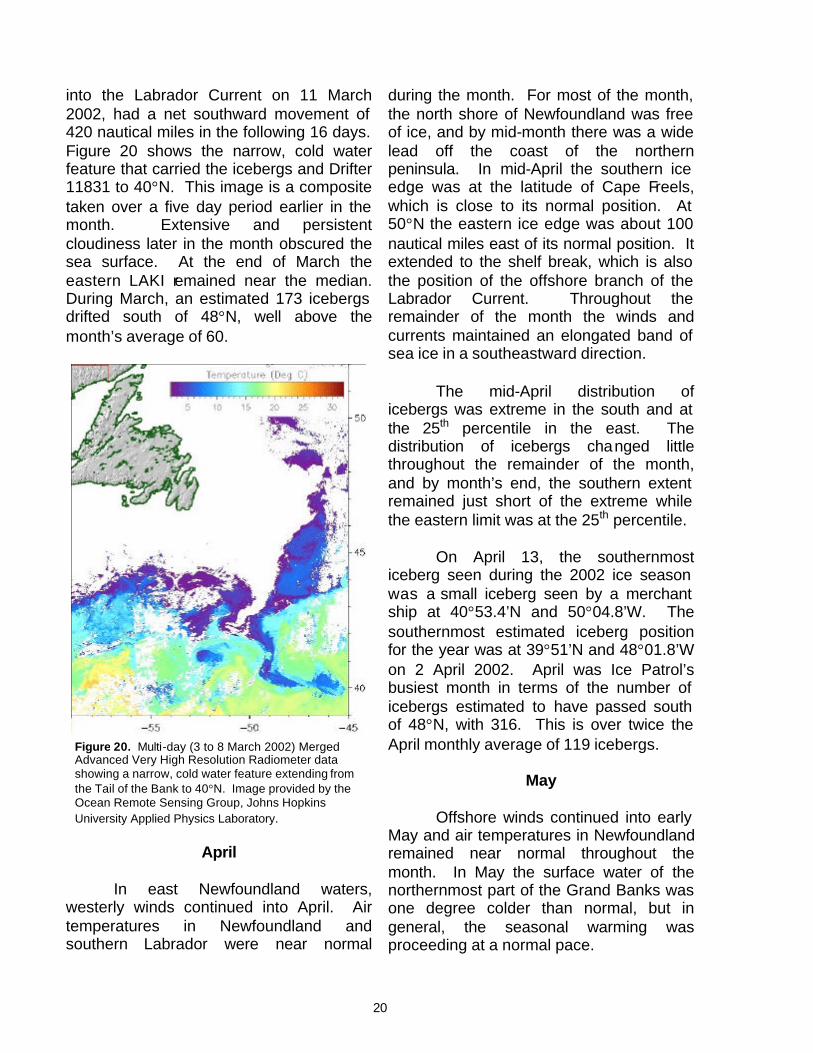
In mid-March, the southern LAKI was approximately 46°N, which is near the 75th percentile according to Viekman and Baumer’s iceberg climatology classification (Viekman and Baumer, 1995). The easterly extent was near the median. During the second half of March there was an explosive southward growth of the iceberg distribution, and by month’s end the southern LAKI was located at 40°N, a change of 380 nautical miles in just 16 days. This extreme position of the southern extent of LAKI for the end of
March was caused by an unusually vigorous southward flow of the offshore branch of the Labrador Current and the complex shape of the North Atlantic Current near the tail of the bank. Drifter 11831 (Figure 19), which was deployed
Figure 18. Iceberg distribution on February 5, 2002 from the iceberg analysis issued by the Canadian Ice Service. There are about 89 icebergs and radar targets shown on this plot, most within the sea ice edge.
Figure 19. The track of drifter 11831 for the period 11-26 March 2002.
20
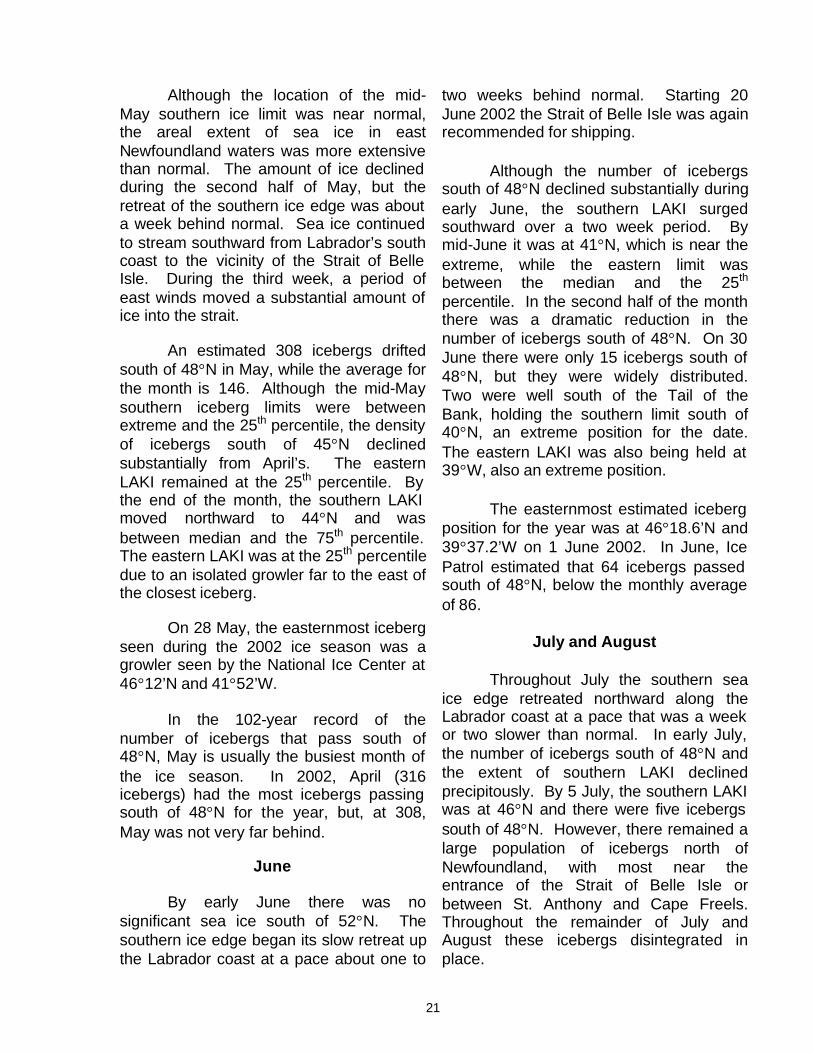
into the Labrador Current on 11 March 2002, had a net southward movement of 420 nautical miles in the following 16 days. Figure 20 shows the narrow, cold water feature that carried the icebergs and Drifter 11831 to 40°N. This image is a composite taken over a five day period earlier in the month. Extensive and persistent cloudiness later in the month obscured the sea surface. At the end of March the eastern LAKI remained near the median. During March, an estimated 173 icebergs drifted south of 48°N, well above the month’s average of 60.
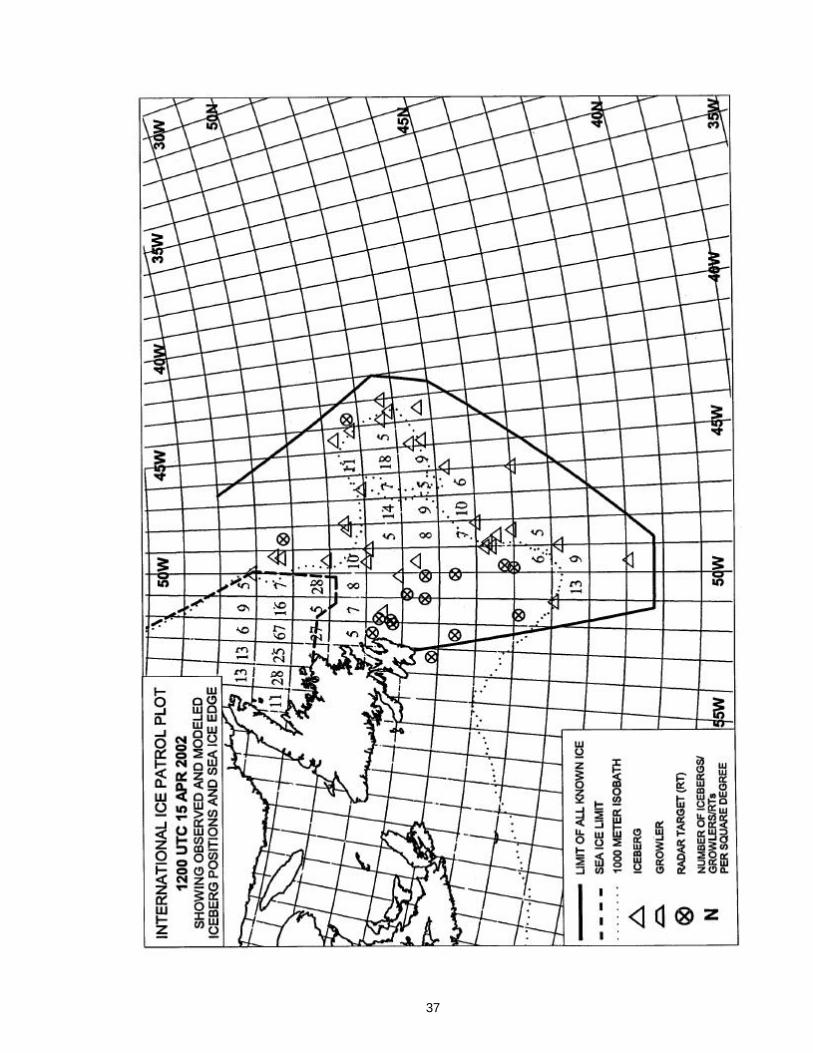
April
In east Newfoundland waters, westerly winds continued into April. Air temperatures in Newfoundland and southern Labrador were near normal
during the month. For most of the month, the north shore of Newfoundland was free of ice, and by mid-month there was a wide lead off the coast of the northern peninsula. In mid-April the southern ice edge was at the latitude of Cape Freels, which is close to its normal position. At 50°N the eastern ice edge was about 100 nautical miles east of its normal position. It extended to the shelf break, which is also the position of the offshore branch of the Labrador Current. Throughout the remainder of the month the winds and currents maintained an elongated band of sea ice in a southeastward direction.
The mid-April distribution of
icebergs was extreme in the south and at the 25th percentile in the east. The distribution of icebergs changed little throughout the remainder of the month, and by month’s end, the southern extent remained just short of the extreme while the eastern limit was at the 25th percentile.
On April 13, the southernmost
iceberg seen during the 2002 ice season was a small iceberg seen by a merchant ship at 40°53.4’N and 50°04.8’W. The southernmost estimated iceberg position for the year was at 39°51’N and 48°01.8’W on 2 April 2002. April was Ice Patrol’s busiest month in terms of the number of icebergs estimated to have passed south of 48°N, with 316. This is over twice the April monthly average of 119 icebergs.
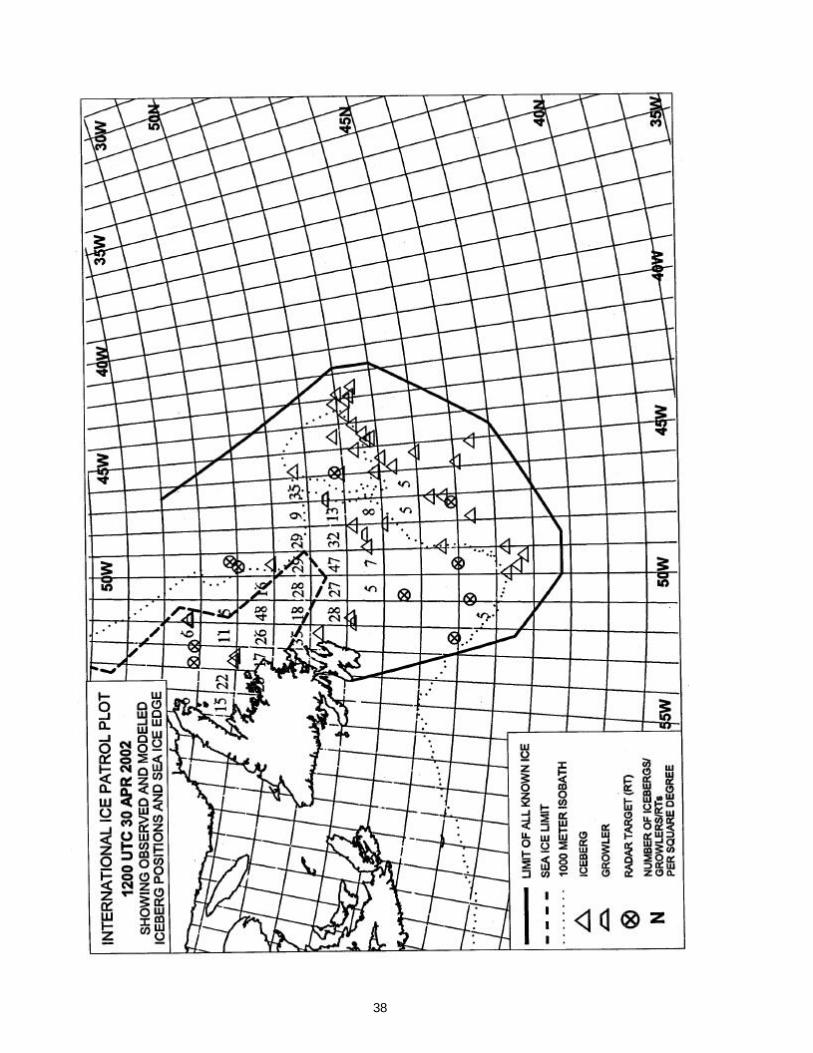
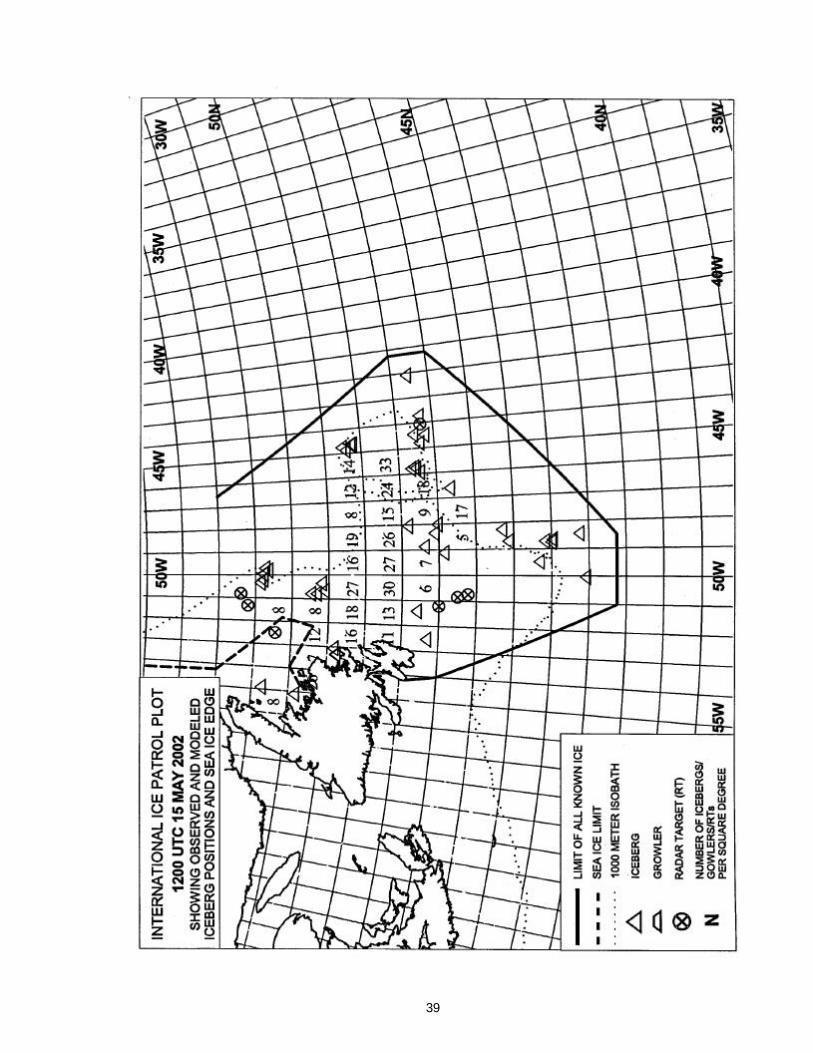
May
Offshore winds continued into early
May and air temperatures in Newfoundland remained near normal throughout the month. In May the surface water of the northernmost part of the Grand Banks was one degree colder than normal, but in general, the seasonal warming was proceeding at a normal pace.
Figure 20. Multi-day (3 to 8 March 2002) Merged Advanced Very High Resolution Radiometer data showing a narrow, cold water feature extending from the Tail of the Bank to 40°N. Image provided by the Ocean Remote Sensing Group, Johns Hopkins University Applied Physics Laboratory.
21
Although the location of the mid-May southern ice limit was near normal, the areal extent of sea ice in east Newfoundland waters was more extensive than normal. The amount of ice declined during the second half of May, but the retreat of the southern ice edge was about a week behind normal. Sea ice continued to stream southward from Labrador’s south coast to the vicinity of the Strait of Belle Isle. During the third week, a period of east winds moved a substantial amount of ice into the strait.
An estimated 308 icebergs drifted
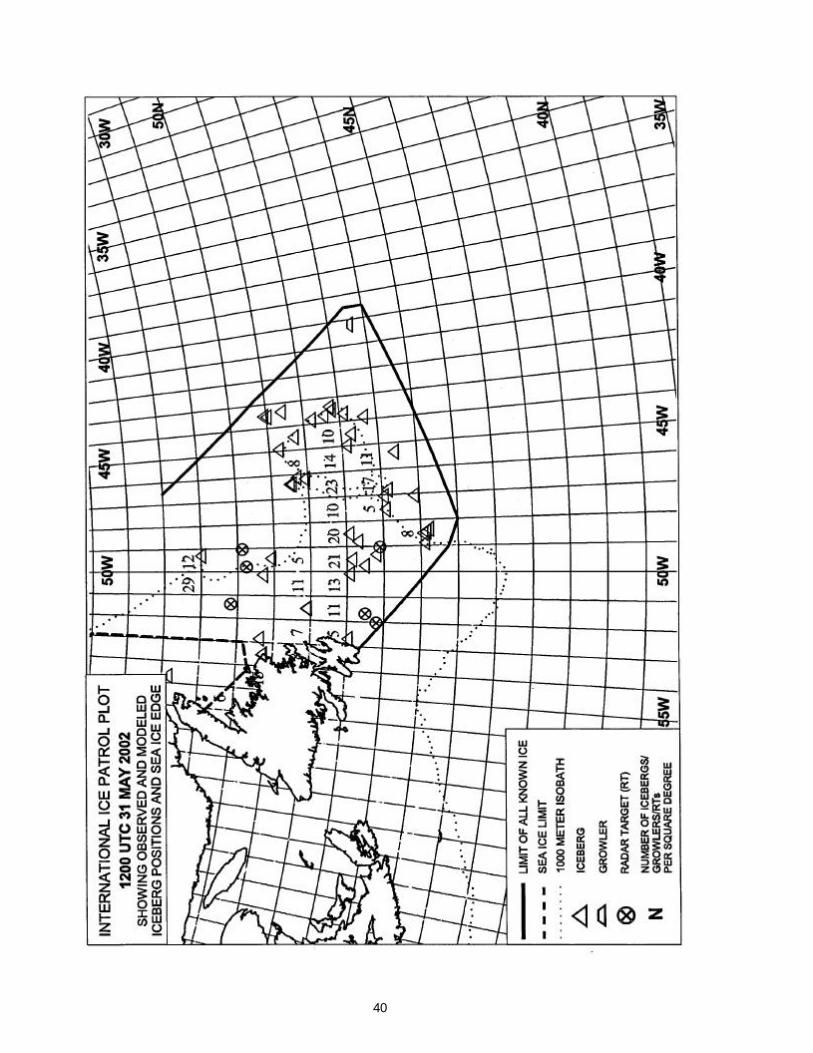
south of 48°N in May, while the average for the month is 146. Although the mid-May southern iceberg limits were between extreme and the 25th percentile, the density of icebergs south of 45°N declined substantially from April’s. The eastern LAKI remained at the 25th percentile. By the end of the month, the southern LAKI moved northward to 44°N and was between median and the 75th percentile. The eastern LAKI was at the 25th percentile due to an isolated growler far to the east of the closest iceberg.
On 28 May, the easternmost iceberg
seen during the 2002 ice season was a growler seen by the National Ice Center at 46°12’N and 41°52’W.
In the 102-year record of the
number of icebergs that pass south of 48°N, May is usually the busiest month of the ice season. In 2002, April (316 icebergs) had the most icebergs passing south of 48°N for the year, but, at 308, May was not very far behind.
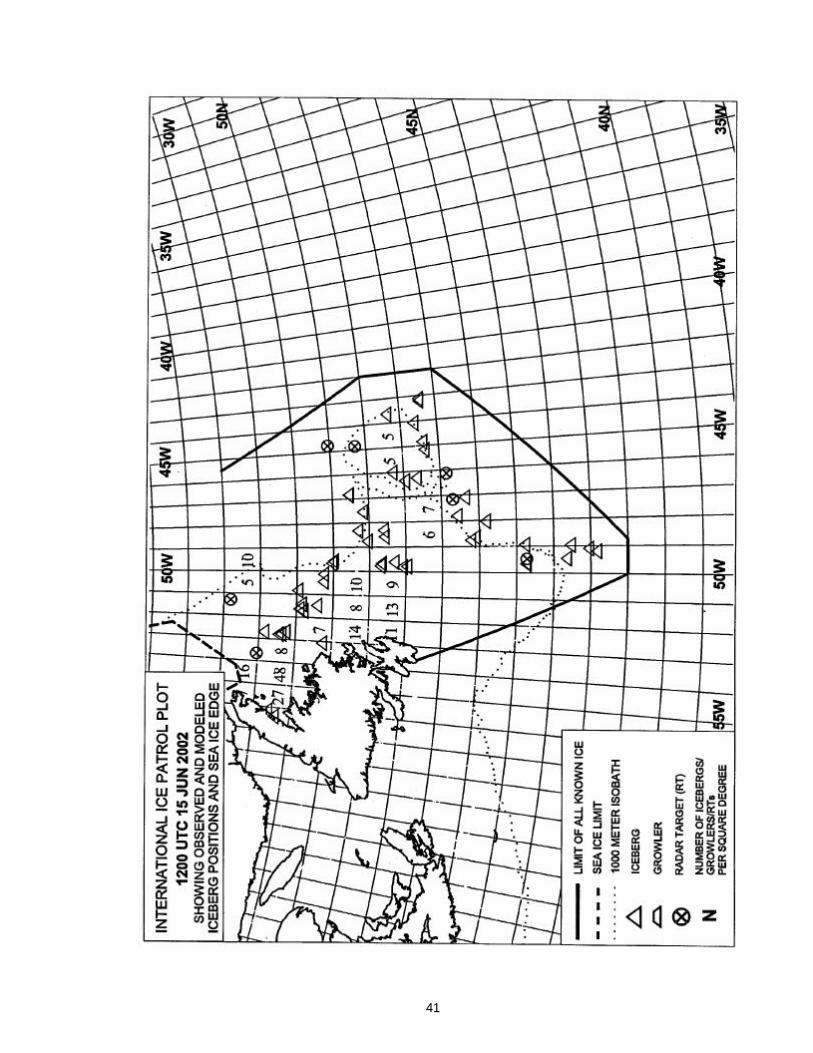
June
By early June there was no
significant sea ice south of 52°N. The southern ice edge began its slow retreat up the Labrador coast at a pace about one to
two weeks behind normal. Starting 20 June 2002 the Strait of Belle Isle was again recommended for shipping.
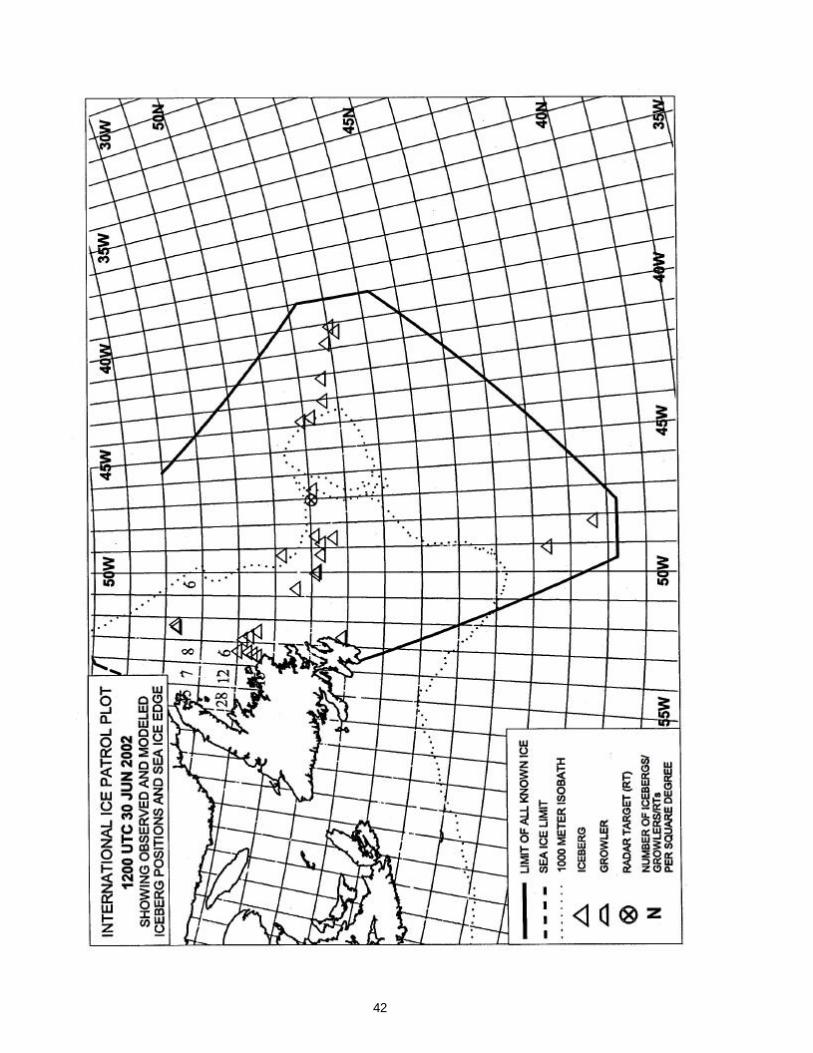
Although the number of icebergs
south of 48°N declined substantially during early June, the southern LAKI surged southward over a two week period. By mid-June it was at 41°N, which is near the extreme, while the eastern limit was between the median and the 25th percentile. In the second half of the month there was a dramatic reduction in the number of icebergs south of 48°N. On 30 June there were only 15 icebergs south of 48°N, but they were widely distributed. Two were well south of the Tail of the Bank, holding the southern limit south of 40°N, an extreme position for the date. The eastern LAKI was also being held at 39°W, also an extreme position.
The easternmost estimated iceberg
position for the year was at 46°18.6’N and 39°37.2’W on 1 June 2002. In June, Ice Patrol estimated that 64 icebergs passed south of 48°N, below the monthly average of 86.
July and August
Throughout July the southern sea
ice edge retreated northward along the Labrador coast at a pace that was a week or two slower than normal. In early July, the number of icebergs south of 48°N and the extent of southern LAKI declined precipitously. By 5 July, the southern LAKI was at 46°N and there were five icebergs south of 48°N. However, there remained a large population of icebergs north of Newfoundland, with most near the entrance of the Strait of Belle Isle or between St. Anthony and Cape Freels. Throughout the remainder of July and August these icebergs disintegrated in place.
22
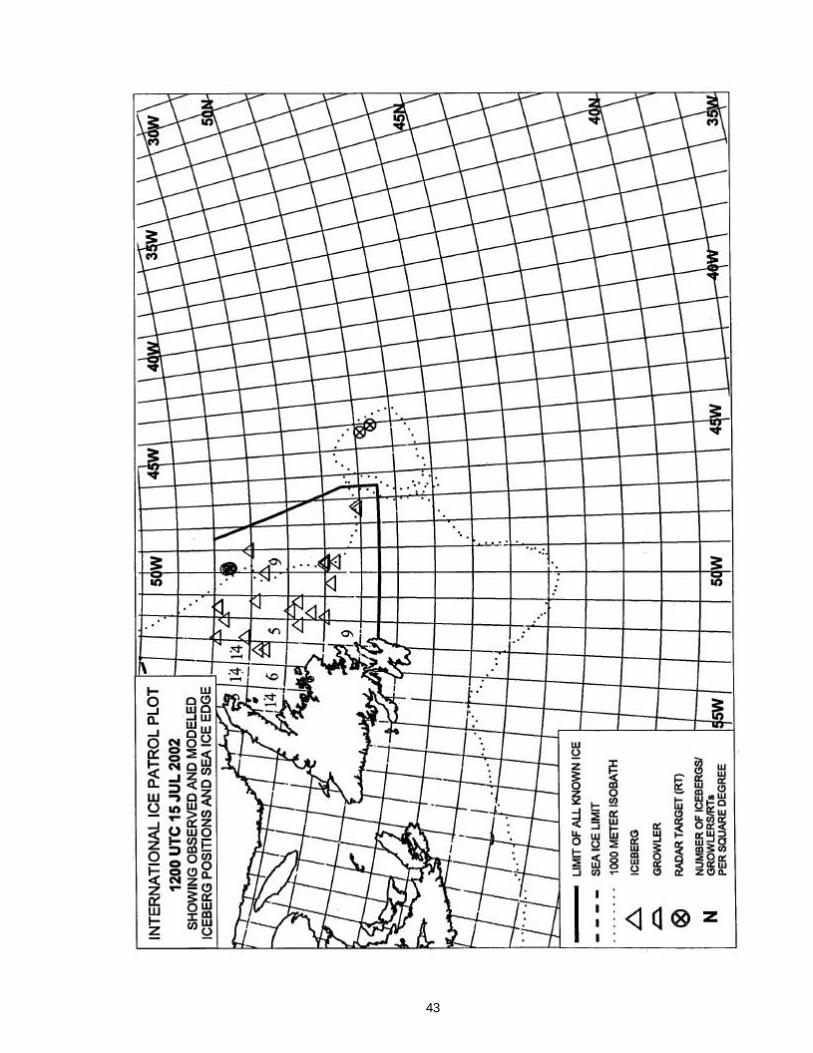
No icebergs passed south of 48°N during July. The average for the month is 31. Ice Patrol’s last 2002 reconnaissance patrol returned from Newfoundland on 10 July. The season closed on 15 July with the southern LAKI at the minimum and the eastern limit at the 75th percentile due to two isolated, small icebergs in the northern part of Flemish Pass. The last of the sea ice departed the coast of Labrador in early August, one to two weeks behind normal.
Summary With 877 icebergs estimated to have passed south of 48°N, the 2002 season falls into the extreme category (>600 icebergs) as defined by Trivers (1994). On the other hand, the 151 day season length places 2002 into the average classification (105 to 180 days). However, neither of these two measurements captures the dominant characteristic of the 2002 iceberg season, the extraordinarily wide distribution of the 877 icebergs. During the second half of March, there was a dramatic southward movement of the LAKI, which then hovered near the climatologically extreme position from late March through June. For a brief period during the end of March and early April, the southern LAKI was south of 40°N. Two factors combined to cause the extreme southward LAKI position. The first was an unusually strong flow in the offshore branch of the Labrador Current that was delivering icebergs from Flemish Pass to the vicinity of the Tail of the Bank, a distance of about 300 nautical miles, in less than two weeks. The second was the complex shape of the NAC southeast of the Tail of the Bank that permitted the development of a narrow, cold water jet between two meanders of the NAC. For most of the season the eastern LAKI was farther east than normal,
and during part of June was near the eastern extreme. From the standpoint of the transatlantic mariner, the 2002 iceberg season was severe due to the vast extent of the iceberg danger area.
Icebergs arrived at 48°N in early to mid-February, as predicted by Desjardins (2001), but early season signals suggested 2002 would be a light to average iceberg season. Though limited in scope, the January and early February aerial reconnaissance showed a sparse iceberg population along the Labrador Coast in position to move into the shipping lanes during the early part of the season. The winter (December 2001 through March 2002) North Atlantic Oscillation Index (NAOI) was 0.76 (Hurrell, 2003), which is slightly positive, but not as strong as the 2.8 winter NAOI for the 2000 season (843 icebergs). Finally, the February iceberg count was near normal. By the end of March, however, it was clear that 2002 would be a very active iceberg season.
The spatial extent of sea ice in east
Newfoundland waters was less than normal in 2002. CIS (2002) calculates the Total Accumulated Ice Coverage for east Newfoundland waters, which is the ocean area covered by sea ice summed for all the weeks of the season. The 2002 ice season was the seventh lowest in the 34 year history (1969 to 2002). The CIS predictions for the development of the 2001/2002 ice season were generally accurate. There was a later than normal arrival of sea ice in east Newfoundland waters. Sea ice reached the vicinity of Cape Bonavista in early February. The sea ice attained its maximum extent in mid-March, with the ice edge approximately at the latitude of St. John’s. The retreat of the southern ice edge in the spring was slower than predicted by about two weeks.
23
References Canadian Ice Service, 2001. Sea Ice Climatic Atlas. East Coast of Canada, 1971-2000.
Canadian Ice Service, 373 Sussex Drive Block E-3, LaSalle Academy, Ottawa, ON, Canada K1A 0H3, 151 pp.
Canadian Ice Service, 2001. Seasonal Outlook, Gulf of St. Lawrence and East
Newfoundland Waters, Winter 2001-2002. Unpublished Manuscript, Canadian Ice Service, 373 Sussex Drive, Ottawa, ON, Canada K1A 0H3, 20 pp.
Canadian Ice Service, 2002. Seasonal Summary for Eastern Canadian Waters, Winter
2001-2002. Unpublished Manuscript, Canadian Ice Service, 373 Sussex Drive, Ottawa, ON, Canada K1A 0H3, 8 pp.
Desjardins, Luc, 2001. Long Range Forecast 2001-2002 Ice/Iceberg Season.
International Ice Patrol Annual Conference, 11 December 2001. Hurrell, J., 2003. North Atlantic Oscillation (NAO) Indices Information. National Center
for Atmospheric Research. http://www.cgd.ucar.edu/~jhurrell/nao.html (30 January 2003) IRI/LDEO Climate Data Library, 2001. IGOSS Monthly Sea Surface Temperature
Anomaly Data. http://ingrid.ldgo.columbia.edu/SOURCES/.IGOSS/.nmc/.monthly/.ssta/ (30 January 2003). Trivers, G., 1994. International Ice Patrol’s Iceberg Season Severity. Appendix C in
Report of the International Ice Patrol in the North Atlantic, 1994 Season, Bulletin No. 80, CG-188-49, 49-59.
Viekman, B. E. and K. D. Baumer, 1995. International Ice Patrol Iceberg Limits
Climatology (1975-1995), Technical Report 95-03, Internationa l Ice Patrol, 1082 Shennecossett Road, Groton, CT 06340-6095, 20 pp.
24
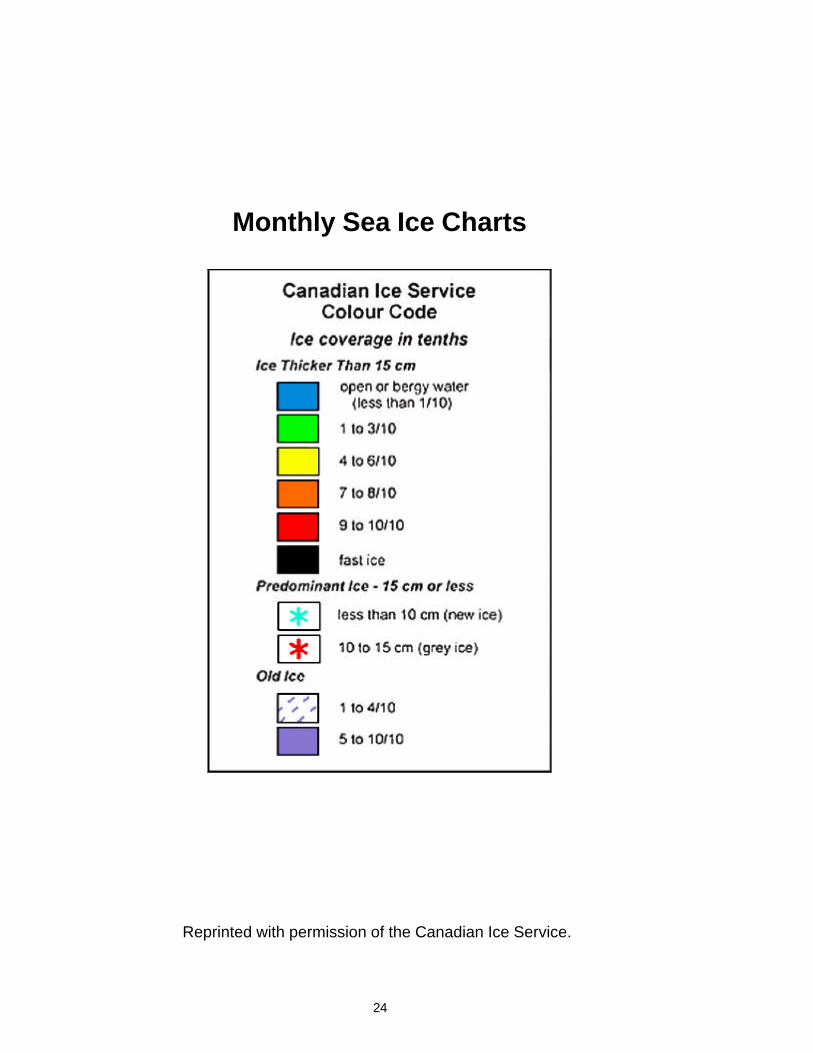
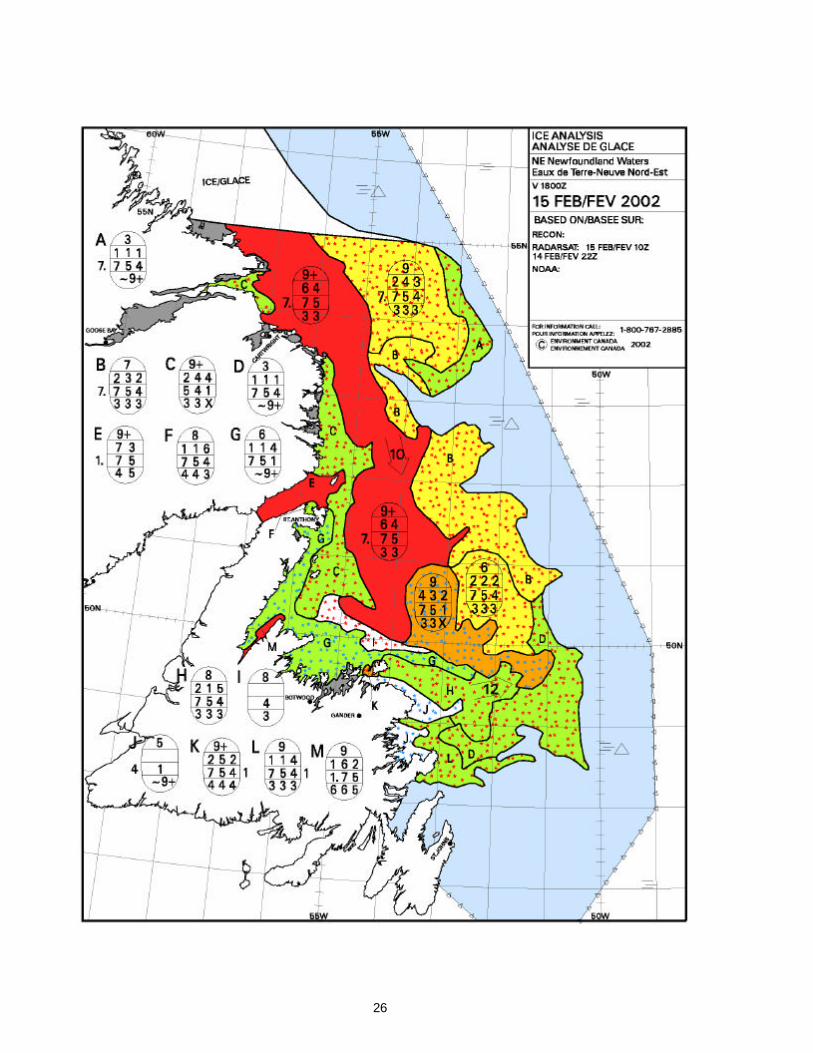
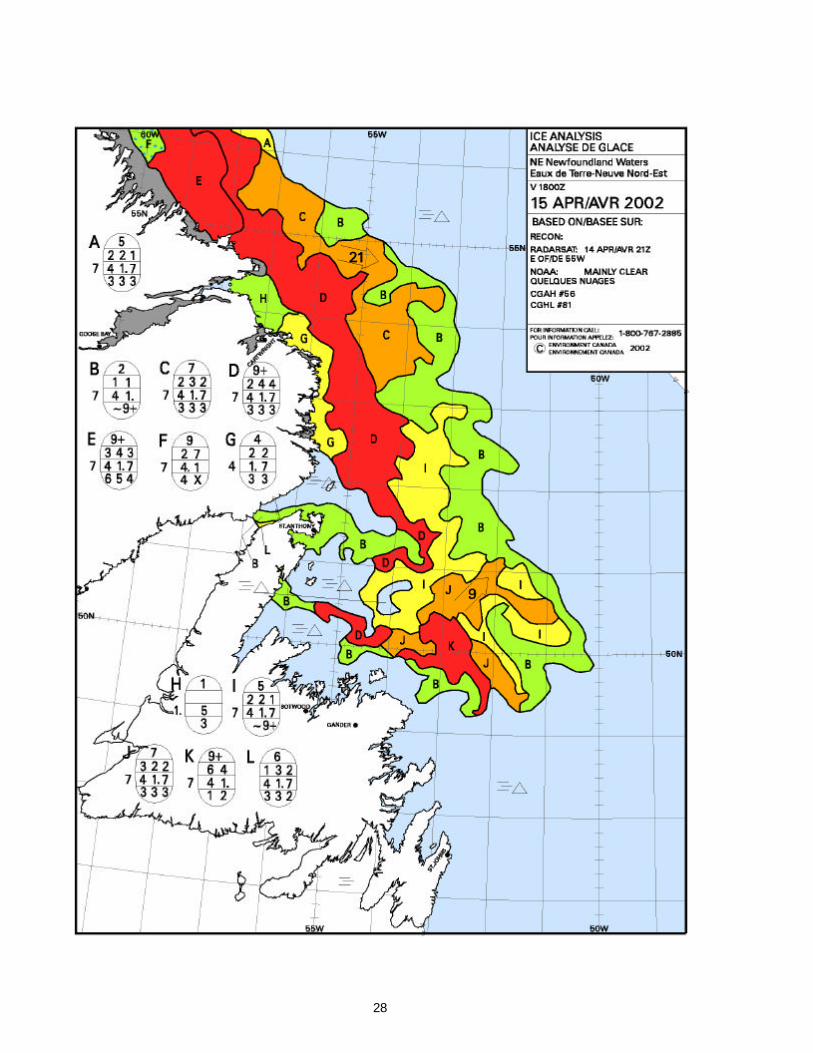
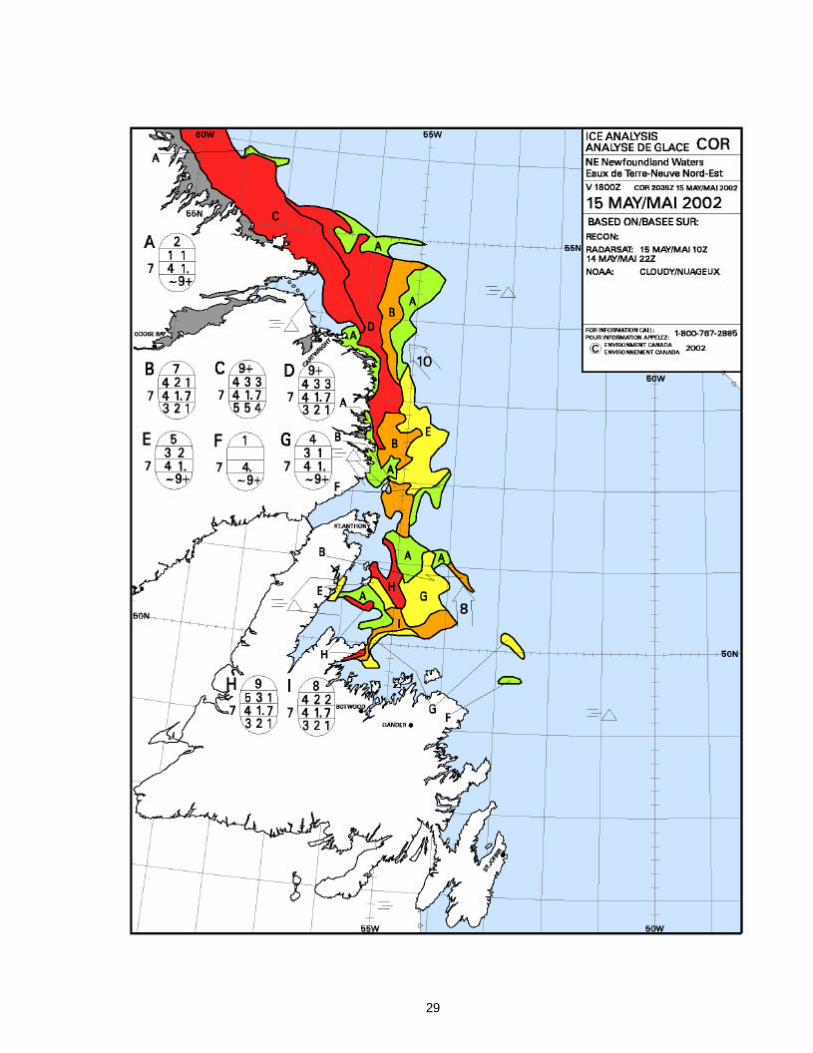
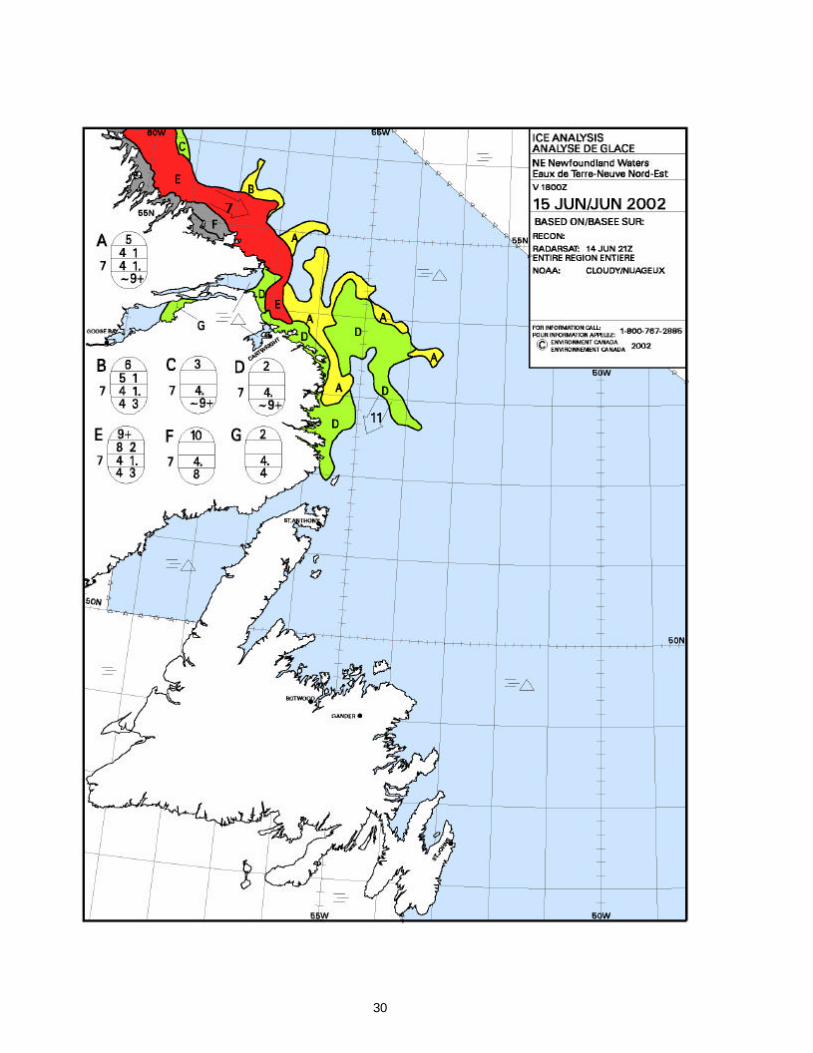
Monthly Sea Ice Charts
Reprinted with permission of the Canadian Ice Service.
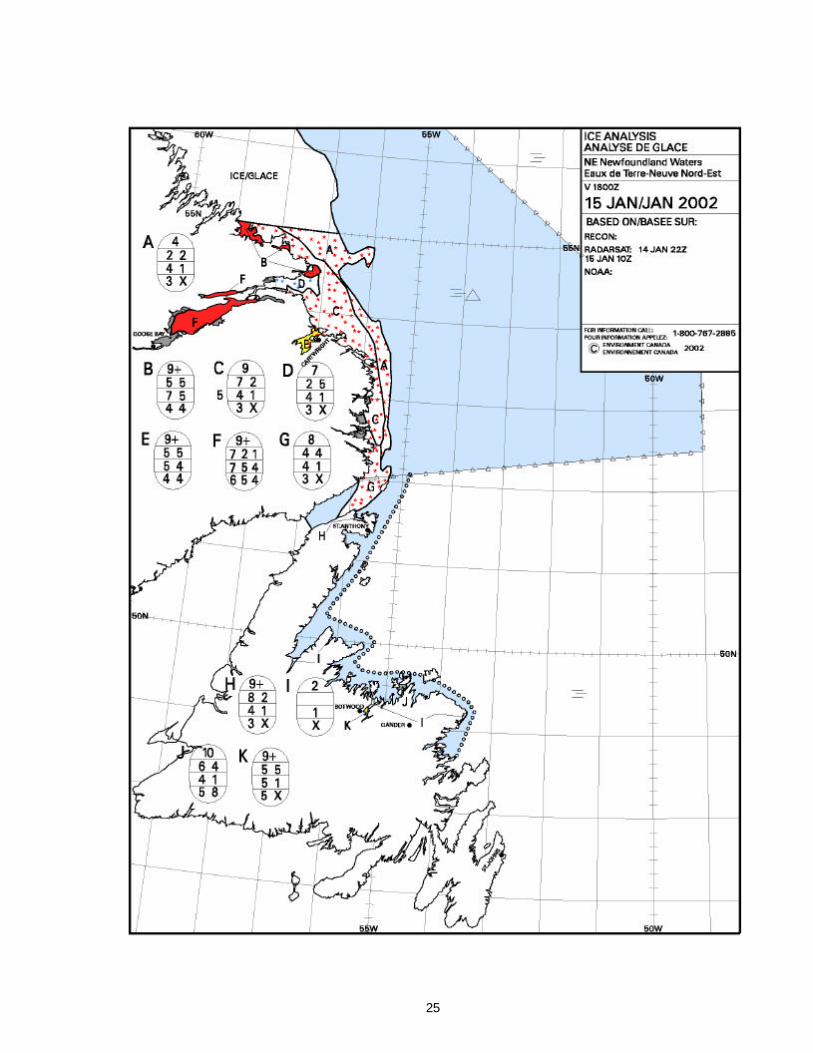
25
26
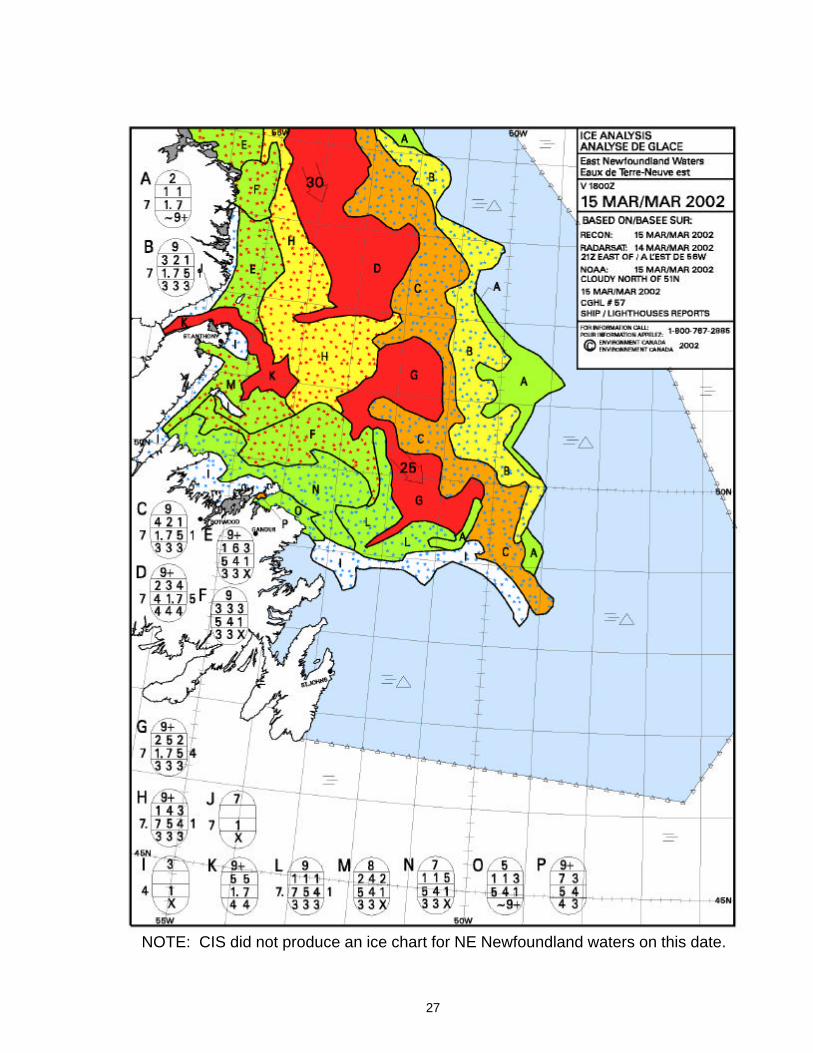
27
NOTE: CIS did not produce an ice chart for NE Newfoundland waters on this date.
28
29
30
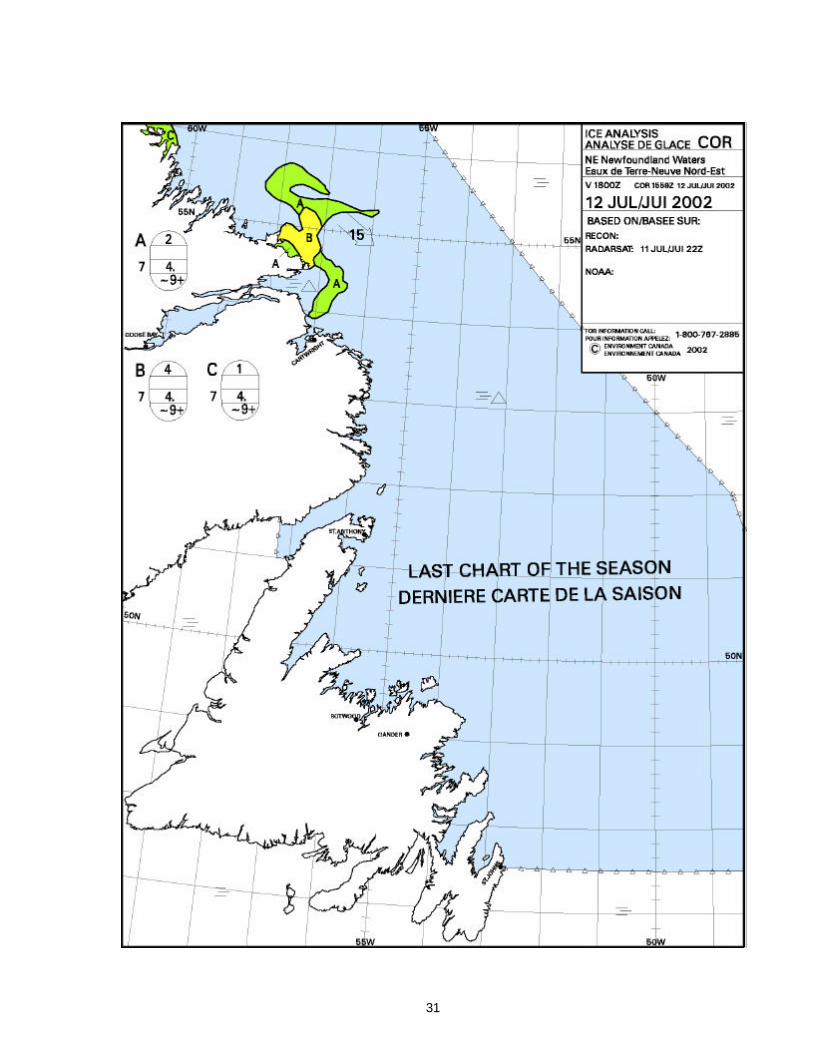
31
32
Biweekly Iceberg Charts
Note: LAKI stops at 52°N
33
34
35
36
37
38
39
40
41
42
43
44
Acknowledgements
Commander, International Ice Patrol acknowledges the assistance and information provided by: Canadian Coast Guard
Canadian Ice Service Canadian Forces National Ice Center
National Weather Service Nav Canada Flight Services
U. S. Coast Guard Air Station Elizabeth City U. S. Coast Guard Atlantic Area Command Center U. S. Coast Guard Atlantic Area Staff U. S. Coast Guard Automated Merchant Vessel Emergency Response System U. S. Coast Guard Communications Area Master Station Atlantic U. S. Coast Guard Operations Systems Center U. S. Coast Guard Research and Development Center
U. S. Naval Atlantic Meteorology and Oceanography Center U. S. Naval Fleet Numerical Meteorology and Oceanography Center
It is important to recognize the outstanding efforts of the personnel at the International Ice Patrol:
CDR R. L. Desh LCDR S. D. Rogerson Dr. D. L. Murphy Mr. G. F. Wright LT L. K. Mack LT C. A. Strong LT S. A. Stoermer 1/C V. C. Futch
MSTC V. L. Fogt MST1 D. L. Alexander
MST1 S. R. Houle YN1 T. J. DeVall MST2 T. T. Krein MST2 E. W. Thompson MST3 D. A. Jolly MST3 J. Dale MST3 B. H. Grebe MST3 J. P. Carew MST3 E. P. Silman MST3 D. N. Brown
International Ice Patrol staff produced this report using Microsoft Word 2000 and Excel 2000.
45
Appendix A
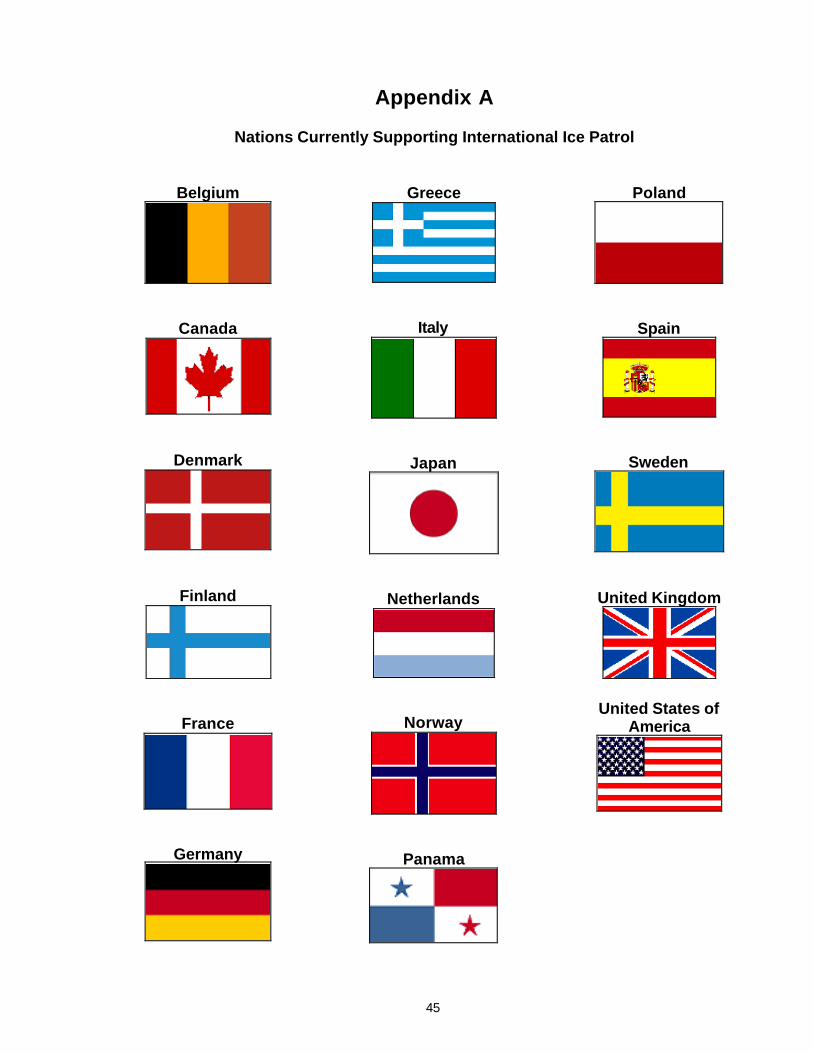
Nations Currently Supporting International Ice Patrol
Belgium
Canada
Denmark
Finland
France
Germany
Greece
Italy
Japan
Netherlands
Norway
Panama
Poland
Spain
Sweden
United Kingdom
United States of America
46
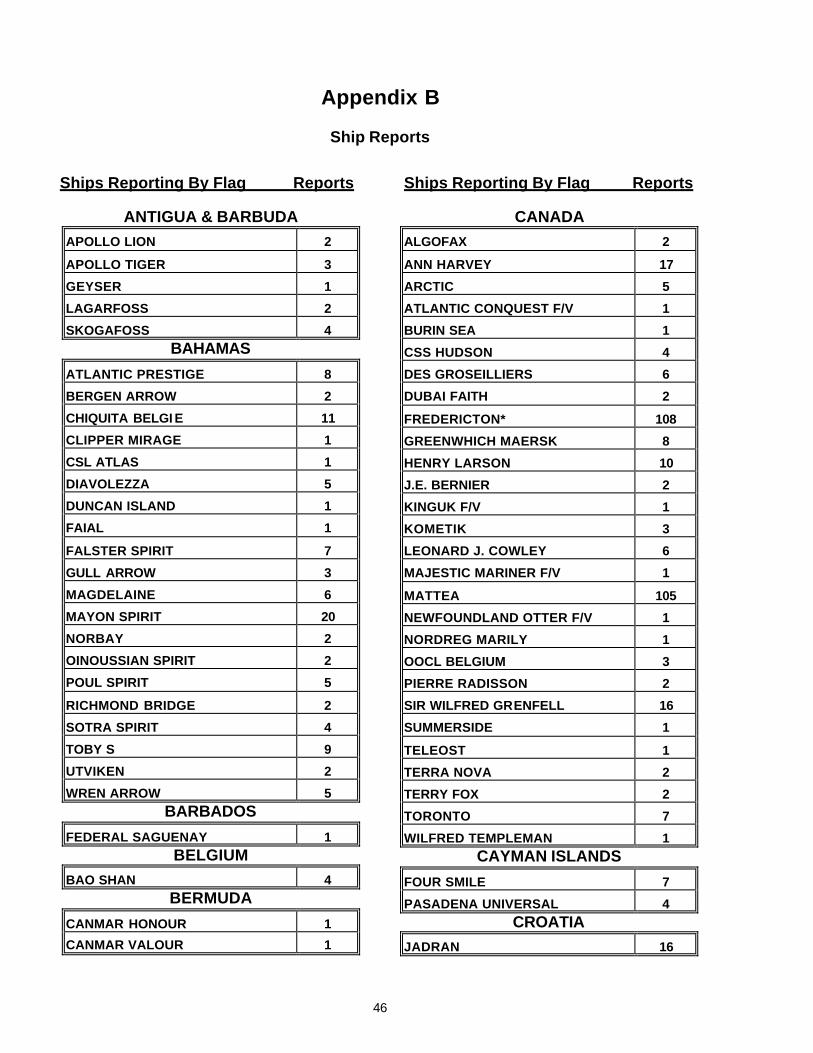
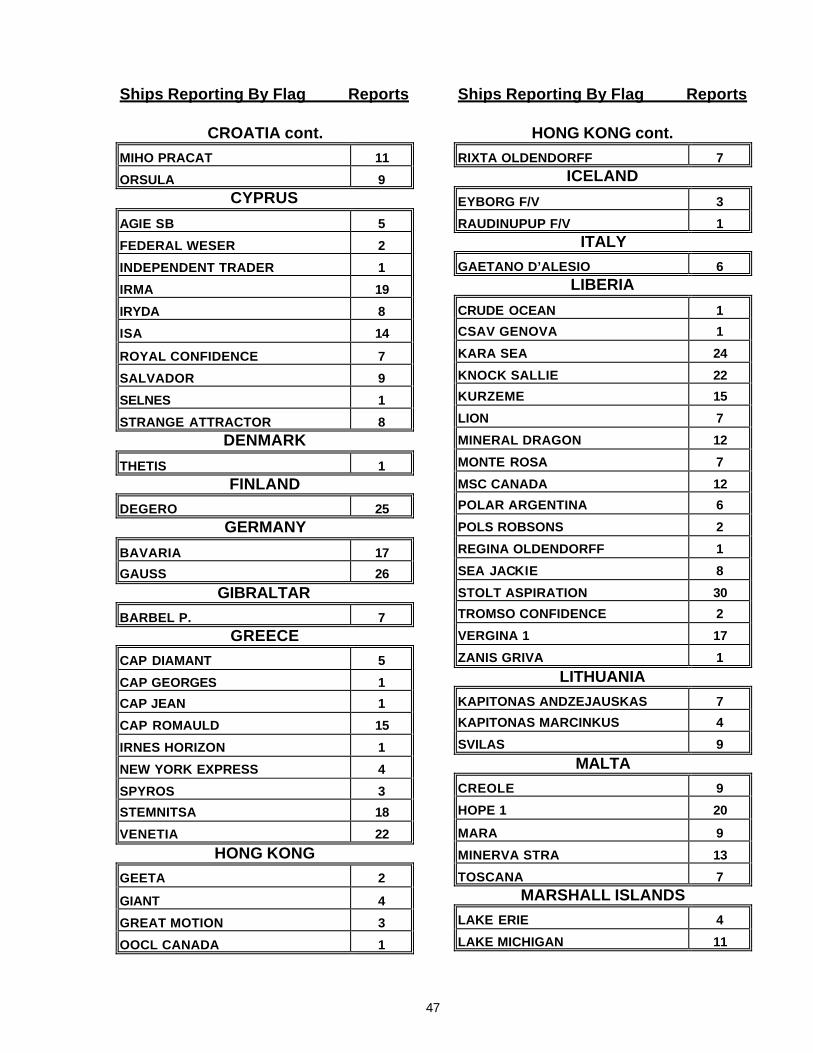
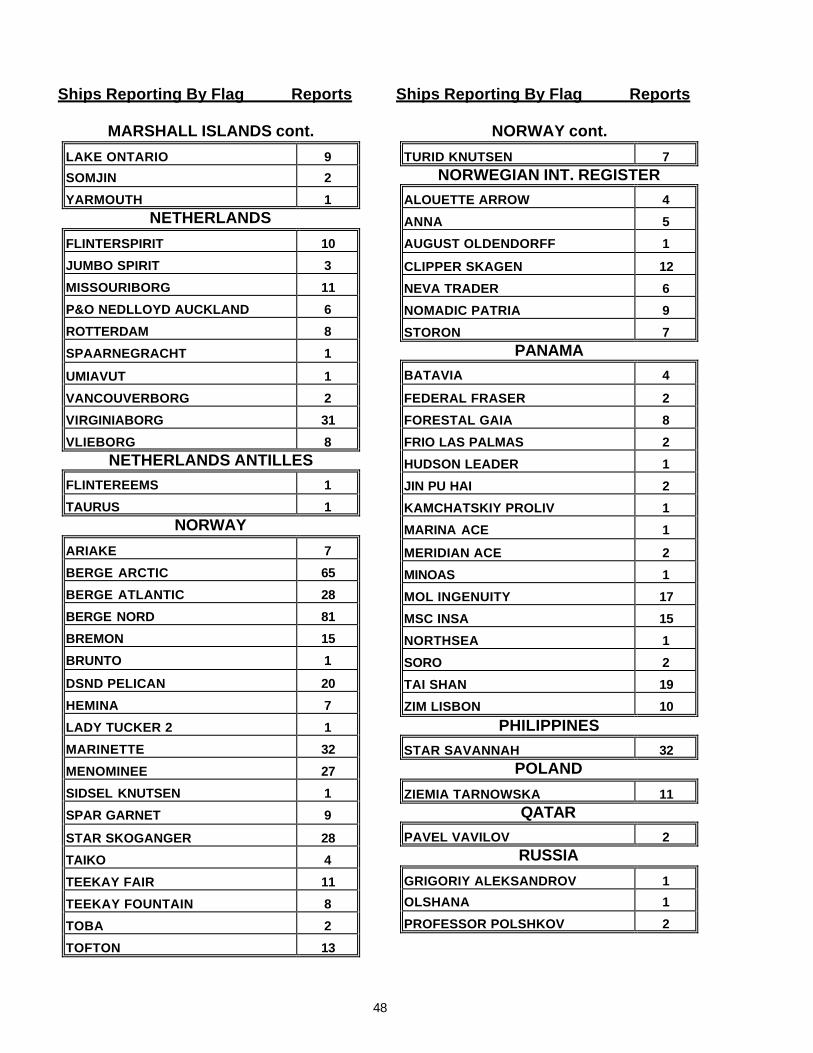
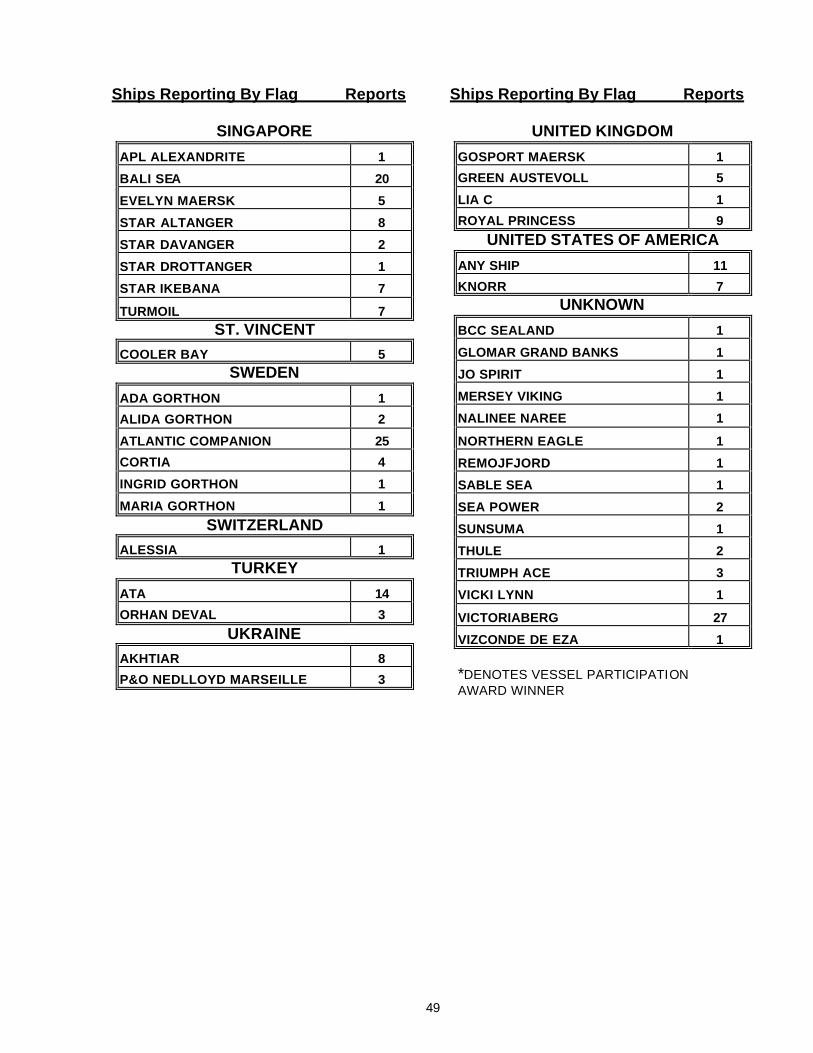
Appendix B
Ship Reports
Ships Reporting By Flag Reports
ANTIGUA & BARBUDA APOLLO LION 2 APOLLO TIGER 3 GEYSER 1
LAGARFOSS 2 SKOGAFOSS 4
BAHAMAS
ATLANTIC PRESTIGE 8 BERGEN ARROW 2
CHIQUITA BELGI E 11
CLIPPER MIRAGE 1
CSL ATLAS 1
DIAVOLEZZA 5
DUNCAN ISLAND 1
FAIAL 1
FALSTER SPIRIT 7
GULL ARROW 3
MAGDELAINE 6
MAYON SPIRIT 20
NORBAY 2 OINOUSSIAN SPIRIT 2 POUL SPIRIT 5
RICHMOND BRIDGE 2 SOTRA SPIRIT 4 TOBY S 9 UTVIKEN 2 WREN ARROW 5
BARBADOS
FEDERAL SAGUENAY 1 BELGIUM
BAO SHAN 4 BERMUDA
CANMAR HONOUR 1 CANMAR VALOUR 1
Ships Reporting By Flag Reports
CANADA
ALGOFAX 2 ANN HARVEY 17 ARCTIC 5
ATLANTIC CONQUEST F/V 1
BURIN SEA 1
CSS HUDSON 4
DES GROSEILLIERS 6
DUBAI FAITH 2
FREDERICTON* 108
GREENWHICH MAERSK 8
HENRY LARSON 10
J.E. BERNIER 2
KINGUK F/V 1
KOMETIK 3
LEONARD J. COWLEY 6
MAJESTIC MARINER F/V 1
MATTEA 105 NEWFOUNDLAND OTTER F/V 1 NORDREG MARILY 1 OOCL BELGIUM 3 PIERRE RADISSON 2 SIR WILFRED GRENFELL 16 SUMMERSIDE 1 TELEOST 1 TERRA NOVA 2 TERRY FOX 2 TORONTO 7 WILFRED TEMPLEMAN 1
CAYMAN ISLANDS
FOUR SMILE 7 PASADENA UNIVERSAL 4
CROATIA JADRAN 16
47
Ships Reporting By Flag Reports
CROATIA cont. MIHO PRACAT 11 ORSULA 9
CYPRUS
AGIE SB 5 FEDERAL WESER 2
INDEPENDENT TRADER 1
IRMA 19
IRYDA 8
ISA 14
ROYAL CONFIDENCE 7
SALVADOR 9
SELNES 1
STRANGE ATTRACTOR 8 DENMARK
THETIS 1 FINLAND
DEGERO 25 GERMANY
BAVARIA 17 GAUSS 26
GIBRALTAR BARBEL P. 7
GREECE CAP DIAMANT 5 CAP GEORGES 1 CAP JEAN 1
CAP ROMAULD 15
IRNES HORIZON 1
NEW YORK EXPRESS 4
SPYROS 3
STEMNITSA 18 VENETIA 22
HONG KONG GEETA 2 GIANT 4 GREAT MOTION 3
OOCL CANADA 1
Ships Reporting By Flag Reports
HONG KONG cont. RIXTA OLDENDORFF 7
ICELAND
EYBORG F/V 3 RAUDINUPUP F/V 1
ITALY GAETANO D’ALESIO 6
LIBERIA
CRUDE OCEAN 1 CSAV GENOVA 1 KARA SEA 24
KNOCK SALLIE 22
KURZEME 15
LION 7
MINERAL DRAGON 12
MONTE ROSA 7
MSC CANADA 12
POLAR ARGENTINA 6
POLS ROBSONS 2
REGINA OLDENDORFF 1
SEA JACKIE 8
STOLT ASPIRATION 30
TROMSO CONFIDENCE 2
VERGINA 1 17 ZANIS GRIVA 1
LITHUANIA KAPITONAS ANDZEJAUSKAS 7 KAPITONAS MARCINKUS 4 SVILAS 9
MALTA CREOLE 9 HOPE 1 20 MARA 9
MINERVA STRA 13
TOSCANA 7 MARSHALL ISLANDS
LAKE ERIE 4 LAKE MICHIGAN 11
48
Ships Reporting By Flag Reports
MARSHALL ISLANDS cont.
LAKE ONTARIO 9
SOMJIN 2
YARMOUTH 1 NETHERLANDS
FLINTERSPIRIT 10 JUMBO SPIRIT 3 MISSOURIBORG 11 P&O NEDLLOYD AUCKLAND 6 ROTTERDAM 8 SPAARNEGRACHT 1
UMIAVUT 1
VANCOUVERBORG 2
VIRGINIABORG 31 VLIEBORG 8
NETHERLANDS ANTILLES FLINTEREEMS 1 TAURUS 1
NORWAY
ARIAKE 7 BERGE ARCTIC 65 BERGE ATLANTIC 28
BERGE NORD 81
BREMON 15
BRUNTO 1
DSND PELICAN 20
HEMINA 7
LADY TUCKER 2 1
MARINETTE 32
MENOMINEE 27
SIDSEL KNUTSEN 1
SPAR GARNET 9
STAR SKOGANGER 28
TAIKO 4
TEEKAY FAIR 11
TEEKAY FOUNTAIN 8
TOBA 2 TOFTON 13
Ships Reporting By Flag Reports
NORWAY cont.
TURID KNUTSEN 7 NORWEGIAN INT. REGISTER
ALOUETTE ARROW 4 ANNA 5
AUGUST OLDENDORFF 1
CLIPPER SKAGEN 12
NEVA TRADER 6 NOMADIC PATRIA 9 STORON 7
PANAMA BATAVIA 4 FEDERAL FRASER 2
FORESTAL GAIA 8
FRIO LAS PALMAS 2
HUDSON LEADER 1
JIN PU HAI 2
KAMCHATSKIY PROLIV 1
MARINA ACE 1
MERIDIAN ACE 2
MINOAS 1
MOL INGENUITY 17
MSC INSA 15
NORTHSEA 1
SORO 2
TAI SHAN 19
ZIM LISBON 10
PHILIPPINES STAR SAVANNAH 32
POLAND
ZIEMIA TARNOWSKA 11 QATAR
PAVEL VAVILOV 2 RUSSIA
GRIGORIY ALEKSANDROV 1 OLSHANA 1
PROFESSOR POLSHKOV 2
49
Ships Reporting By Flag Reports
SINGAPORE
APL ALEXANDRITE 1 BALI SEA 20 EVELYN MAERSK 5 STAR ALTANGER 8 STAR DAVANGER 2 STAR DROTTANGER 1 STAR IKEBANA 7
TURMOIL 7 ST. VINCENT
COOLER BAY 5 SWEDEN
ADA GORTHON 1 ALIDA GORTHON 2
ATLANTIC COMPANION 25
CORTIA 4
INGRID GORTHON 1
MARIA GORTHON 1 SWITZERLAND
ALESSIA 1 TURKEY
ATA 14 ORHAN DEVAL 3
UKRAINE
AKHTIAR 8 P&O NEDLLOYD MARSEILLE 3
Ships Reporting By Flag Reports
UNITED KINGDOM
GOSPORT MAERSK 1 GREEN AUSTEVOLL 5 LIA C 1
ROYAL PRINCESS 9
UNITED STATES OF AMERICA
ANY SHIP 11 KNORR 7
UNKNOWN
BCC SEALAND 1 GLOMAR GRAND BANKS 1 JO SPIRIT 1
MERSEY VIKING 1
NALINEE NAREE 1
NORTHERN EAGLE 1
REMOJFJORD 1
SABLE SEA 1
SEA POWER 2
SUNSUMA 1
THULE 2
TRIUMPH ACE 3 VICKI LYNN 1 VICTORIABERG 27 VIZCONDE DE EZA 1 *DENOTES VESSEL PARTICIPATION AWARD WINNER
50
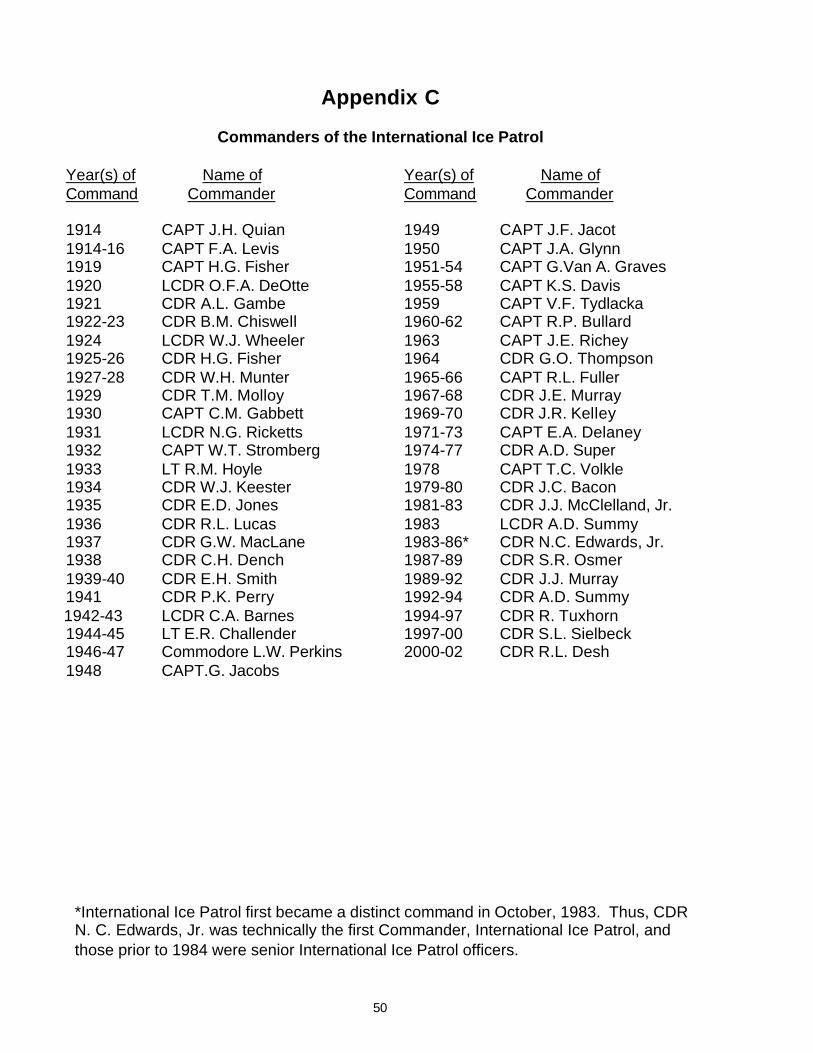
Appendix C
Commanders of the International Ice Patrol Year(s) of Name of Command Commander
1914 CAPT J.H. Quian 1914-16 CAPT F.A. Levis 1919 CAPT H.G. Fisher 1920 LCDR O.F.A. DeOtte 1921 CDR A.L. Gambe 1922-23 CDR B.M. Chiswell 1924 LCDR W.J. Wheeler 1925-26 CDR H.G. Fisher 1927-28 CDR W.H. Munter 1929 CDR T.M. Molloy 1930 CAPT C.M. Gabbett 1931 LCDR N.G. Ricketts 1932 CAPT W.T. Stromberg 1933 LT R.M. Hoyle 1934 CDR W.J. Keester 1935 CDR E.D. Jones 1936 CDR R.L. Lucas 1937 CDR G.W. MacLane 1938 CDR C.H. Dench 1939-40 CDR E.H. Smith 1941 CDR P.K. Perry 1942-43 LCDR C.A. Barnes 1944-45 LT E.R. Challender 1946-47 Commodore L.W. Perkins 1948 CAPT.G. Jacobs
Year(s) of Name of Command Commander 1949 CAPT J.F. Jacot 1950 CAPT J.A. Glynn 1951-54 CAPT G.Van A. Graves 1955-58 CAPT K.S. Davis 1959 CAPT V.F. Tydlacka 1960-62 CAPT R.P. Bullard 1963 CAPT J.E. Richey 1964 CDR G.O. Thompson 1965-66 CAPT R.L. Fuller 1967-68 CDR J.E. Murray 1969-70 CDR J.R. Kelley 1971-73 CAPT E.A. Delaney 1974-77 CDR A.D. Super 1978 CAPT T.C. Volkle 1979-80 CDR J.C. Bacon 1981-83 CDR J.J. McClelland, Jr. 1983 LCDR A.D. Summy 1983-86* CDR N.C. Edwards, Jr. 1987-89 CDR S.R. Osmer 1989-92 CDR J.J. Murray 1992-94 CDR A.D. Summy 1994-97 CDR R. Tuxhorn 1997-00 CDR S.L. Sielbeck 2000-02 CDR R.L. Desh
*International Ice Patrol first became a distinct command in October, 1983. Thus, CDR N. C. Edwards, Jr. was technically the first Commander, International Ice Patrol, and those prior to 1984 were senior International Ice Patrol officers.
51
Appendix D
Very Large Tabular Icebergs: Ice Season 2002 and the Past
LT Scott A. Stoermer, U.S. Coast Guard Mr. Pip Rudkin, Provincial Airlines Limited
Introduction Exceptionally large icebergs, commonly referred to as ice islands, came again into the public eye recently with the breaking loose of a portion the Antarctic ice sheet roughly ten times the size of the island of Manhattan (Dykstra, 2002). The glaciers of the North Atlantic, specifically along the western coast of Greenland, are not as conducive to very large iceberg generation as southern hemisphere ice fields, but do occasionally produce “Antarctic” size icebergs. Ice Season 2002 (February 17, 2002 through July 15, 2002) saw some of the largest North Atlantic icebergs on recent record. These icebergs were actively tracked for a period of approximately two months during the summer, were photographed, and were even examined with side-scan sonar instruments. This brief report documents this season’s sightings and provides some historical data and context for these phenomena.
Background The International Ice Patrol has monitored icebergs that drift south along the coast of Labrador and onto the Grand Banks of Newfoundland region since the sinking of the Titanic in April of 1912. The Labrador Current carries the icebergs that calve, or break away, from glaciers in Greenland and northern Canada southward from Baffin Bay and Davis Strait. Several glaciers are capable of producing icebergs that end their journey on the Grand Banks. Specifically, the Ward Hunt ice shelf, the Humboldt Glacier, and the Petermann Glacier are likely sources of ice islands as the basin conditions seem to favor the production of large tabular icebergs (Robe, 1977). As defined by Bowditch, an ice island is a piece of glacial ice that rises roughly 10 meters above the ocean’s surface and has an overall thickness of about 50 meters. Often, ice islands will have a wave-like surface, appearing ribbed from the air. The surface area of an ice island can range from a few thousand square meters to hundreds of square nautical miles. Thusly, ice islands are not necessarily huge, in terms of surface area, but are unusually thin and flat-topped. No matter the source, tracking and monitoring the danger posed by icebergs to transatlantic shipping interests is the responsibility of the International Ice Patrol. The offshore oil and gas industry has a keen interest in typical iceberg drift tracks as well as average iceberg mass and size distribution as more facilities, both fixed and mobile, are being moved onto the Grand Banks. Ice islands, due to their limited draft, pose a unique threat for the oil and gas industry as they can drift into much shallower water than other icebergs. This possibility increases the risk to current facilities as well as for the placement of new facilities, even as many move to locations on the Grand Banks. The sheer mass of an ice island makes its threat to a facility very great and limits many currently employed iceberg management techniques (i.e. towing). The needs and concerns of the oil industry and the responsibilities of the International Ice Patrol make the study of ice islands, similar to that tracked during the 2002 season very interesting. One of the agencies that is highly involved in iceberg tracking for a number of different organizations is the Environmental Services division of Provincial Airlines Limited (PAL). PAL is a privately owned Canadian company that performs contract sea ice and iceberg reconnaissance for the Canadian Ice Service, Department of Fisheries and Oceans Canada (DFO) as well as private industry clientele. PAL, during the height of the ice season, engages in iceberg reconnaissance and management for the Grand Banks offshore oil and gas industry. Specifically, PAL tracks icebergs in the vicinity of oil and gas facilities and moves (tows) icebergs if necessary to eliminate the threat to platforms and rigs.
52
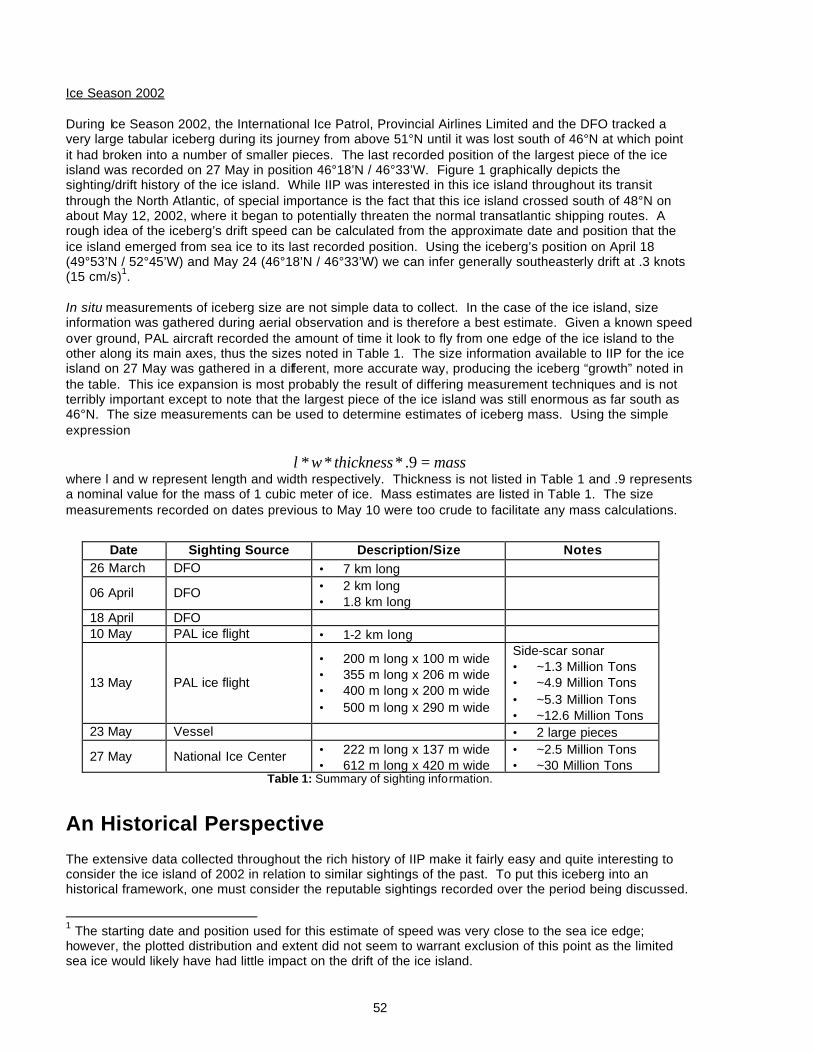
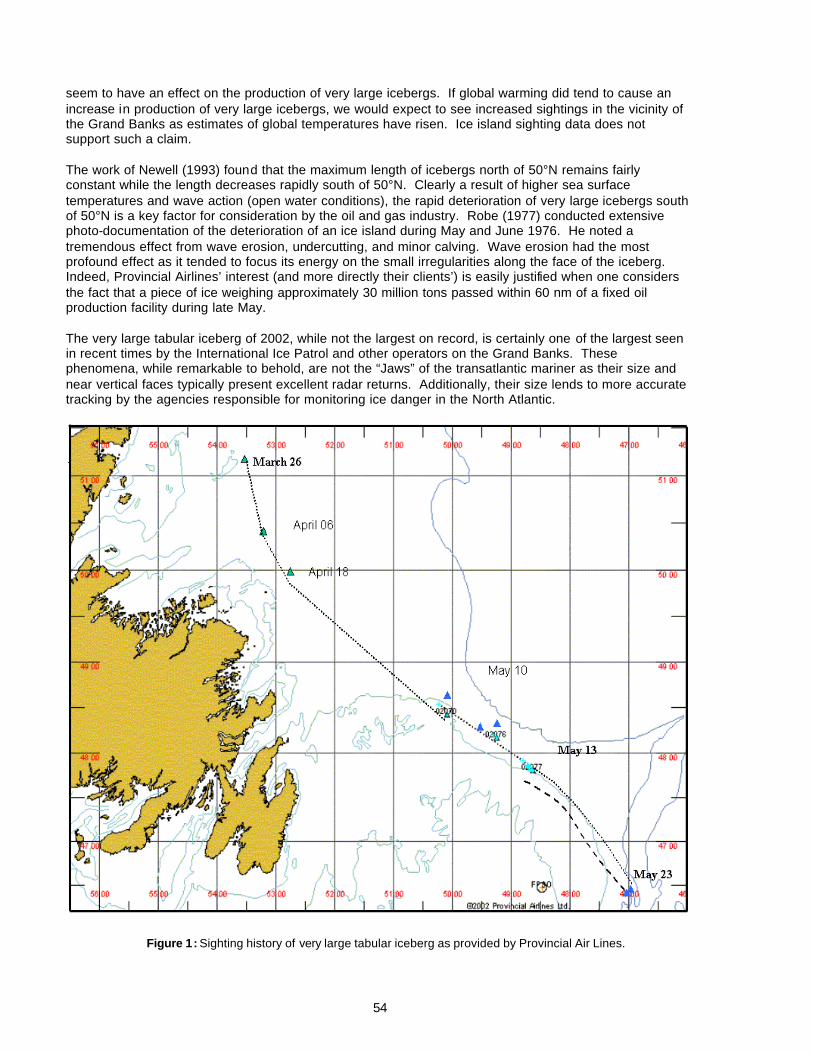
Ice Season 2002 During Ice Season 2002, the International Ice Patrol, Provincial Airlines Limited and the DFO tracked a very large tabular iceberg during its journey from above 51°N until it was lost south of 46°N at which point it had broken into a number of smaller pieces. The last recorded position of the largest piece of the ice island was recorded on 27 May in position 46°18’N / 46°33’W. Figure 1 graphically depicts the sighting/drift history of the ice island. While IIP was interested in this ice island throughout its transit through the North Atlantic, of special importance is the fact that this ice island crossed south of 48°N on about May 12, 2002, where it began to potentially threaten the normal transatlantic shipping routes. A rough idea of the iceberg’s drift speed can be calculated from the approximate date and position that the ice island emerged from sea ice to its last recorded position. Using the iceberg’s position on April 18 (49°53’N / 52°45’W) and May 24 (46°18’N / 46°33’W) we can infer generally southeasterly drift at .3 knots (15 cm/s)1. In situ measurements of iceberg size are not simple data to collect. In the case of the ice island, size information was gathered during aerial observation and is therefore a best estimate. Given a known speed over ground, PAL aircraft recorded the amount of time it look to fly from one edge of the ice island to the other along its main axes, thus the sizes noted in Table 1. The size information available to IIP for the ice island on 27 May was gathered in a different, more accurate way, producing the iceberg “growth” noted in the table. This ice expansion is most probably the result of differing measurement techniques and is not terribly important except to note that the largest piece of the ice island was still enormous as far south as 46°N. The size measurements can be used to determine estimates of iceberg mass. Using the simple expression
massthicknesswl =∗∗∗ 9. where l and w represent length and width respectively. Thickness is not listed in Table 1 and .9 represents a nominal value for the mass of 1 cubic meter of ice. Mass estimates are listed in Table 1. The size measurements recorded on dates previous to May 10 were too crude to facilitate any mass calculations.
Date Sighting Source Description/Size Notes
26 March DFO • 7 km long
06 April DFO • 2 km long • 1.8 km long
18 April DFO 10 May PAL ice flight • 1-2 km long
13 May PAL ice flight
• 200 m long x 100 m wide • 355 m long x 206 m wide • 400 m long x 200 m wide • 500 m long x 290 m wide
Side-scar sonar • ~1.3 Million Tons • ~4.9 Million Tons • ~5.3 Million Tons • ~12.6 Million Tons
23 May Vessel • 2 large pieces
27 May National Ice Center • 222 m long x 137 m wide • 612 m long x 420 m wide
• ~2.5 Million Tons • ~30 Million Tons
Table 1: Summary of sighting information.
An Historical Perspective The extensive data collected throughout the rich history of IIP make it fairly easy and quite interesting to consider the ice island of 2002 in relation to similar sightings of the past. To put this iceberg into an historical framework, one must consider the reputable sightings recorded over the period being discussed.
1 The starting date and position used for this estimate of speed was very close to the sea ice edge; however, the plotted distribution and extent did not seem to warrant exclusion of this point as the limited sea ice would likely have had little impact on the drift of the ice island.
53
Potentially there is not a source more reputable than the annually produced report of the International Ice Observation and Ice Patrol Service in the North Atlantic Ocean. This report documents the activities and findings of IIP for every year in which the Ice Patrol service has been operated. An interesting and enlightening story regarding an ice island occurred in May of 1945 and was reported in Bulletin No. 32: International Ice Observation and Ice Patrol Service in the North Atlantic Ocean – Season of 1946:
Several very large flat-topped bergs were reported, an example of which was the berg reported on the 27th in position 43°08’N / 49°18’W. This berg measured about 4,500 feet long, 3,300 feet wide, and its above-water height was approximately 50 feet. Growlers and debris from the huge block of ice were scattered over a radius of 5 miles. One of the last of the large North Atlantic convoys approached this great floating mass while in dense fog of the 27th and in the confusion that followed 21 ships were damaged. Two of these ships were reported to have suffered damage in collisions with ice and the remaining 19 to have suffered damage in collisions with each other. … All ships were able to proceed under their own power and no loss of life resulted.
The impact from the ice island, both figuratively and literally, was immediately felt as the Admiralty and Chief of Naval Operations issued, on May 28, 1945, a joint order that abolished convoys and forced all merchant ships to burn navigation lights at full brilliancy and not darken ship. Additionally, even though North Atlantic ice patrol services had not be officially re-established, the United States Atlantic Fleet inaugurated twice-daily broadcasts from Argentia, Newfoundland at 0200 and 1400 GCT to shipping commencing on 8 June, 1945 as well as detailing a surface vessel patrol to the Grand Bank region (GPO, 1947). While having not quite the same impact on transatlantic shipping as the ice island of 1945, the iceberg of 2002 is interesting in its own right. The documentation maintained by IIP and the research completed by Newell (1993) allow a fairly good picture of the ice island sightings since about 1912.2 For the purposes of his research, Newell (1993) defined ice islands in a much more specific manner than the general characteristics noted in Bowditch (2002). Newell considered a flat-topped iceberg an ice island if it was reported to be longer than 500 meters when north of 50ºN and one longer than 300 meters when south of this latitude. The first documented sighting of an iceberg meeting these criteria was in 1911. During June of that year, an iceberg more than two nautical miles (>3.7 km) long was noted off Southern Labrador. This particular iceberg was stranded all season and rapidly diminished, deteriorating to approximately .75 miles long by .25 miles wide and 60 ft high when it was photographed in July. Since that date, documented sightings have been made quite often. Dramatically increasing with IIP and the Canadian Ice Service patrols further north, very large iceberg sightings started increasing during after the 1920’s and with advent of aerial iceberg reconnaissance in 1946, the accuracy level of very large iceberg reports has improved. Ice Season severity, as determined by the Ice Patrol, does not seem to be a good indicator of years in which ice islands are sighted in the vicinity of the Grand Banks. Based on many years of data, season severity indicators were developed by Trivers (1994) and defined as mild, moderate and extreme based on length of ice season and the count of icebergs crossing south of 48°N. Extreme years, or those with more than 600 icebergs crossing 48°N and/or lasting more than 180 days, are not highly correlated with the sighting of very large icebergs. This position is further supported by Newell (1993), where he mentions that a very large iceberg could potentially have a dramatic effect on the iceberg population on the Grand Banks if it were to break up. If one considers that a 3 km long by 1.5 km wide iceberg has a mass on the order of 100 million tons and a “standard” medium iceberg on the Grand Banks might be 100 meters by 100 meters with a mass on the order of 100,000 tons, it is easy to see that the larger mass of ice could potentially produce ~1,000 medium icebergs. Fortunately, this does not seem to be the case or even a common occurrence as the correlation between very large iceberg sightings and severe iceberg years is low. An additional conclusion that is possible from this circumstantial data is that global warming does not
2 As noted by Newell (1993), the ice island sighting record is potentially biased by ice research programs and sighting methods (aircraft vs. ship) that have changed (i.e. made identification easier and subsequently increasing the number of reports). The majority of data gathered by Newell was obtained from International Ice Patrol iceberg sighting records.
54
seem to have an effect on the production of very large icebergs. If global warming did tend to cause an increase in production of very large icebergs, we would expect to see increased sightings in the vicinity of the Grand Banks as estimates of global temperatures have risen. Ice island sighting data does not support such a claim. The work of Newell (1993) found that the maximum length of icebergs north of 50°N remains fairly constant while the length decreases rapidly south of 50°N. Clearly a result of higher sea surface temperatures and wave action (open water conditions), the rapid deterioration of very large icebergs south of 50°N is a key factor for consideration by the oil and gas industry. Robe (1977) conducted extensive photo-documentation of the deterioration of an ice island during May and June 1976. He noted a tremendous effect from wave erosion, undercutting, and minor calving. Wave erosion had the most profound effect as it tended to focus its energy on the small irregularities along the face of the iceberg. Indeed, Provincial Airlines’ interest (and more directly their clients’) is easily justified when one considers the fact that a piece of ice weighing approximately 30 million tons passed within 60 nm of a fixed oil production facility during late May. The very large tabular iceberg of 2002, while not the largest on record, is certainly one of the largest seen in recent times by the International Ice Patrol and other operators on the Grand Banks. These phenomena, while remarkable to behold, are not the “Jaws” of the transatlantic mariner as their size and near vertical faces typically present excellent radar returns. Additionally, their size lends to more accurate tracking by the agencies responsible for monitoring ice danger in the North Atlantic.
Figure 1: Sighting history of very large tabular iceberg as provided by Provincial Air Lines.
55
Acknowledgments: LT Stoermer would like to thank Dr. Don Murphy for his insight and critical review of this article. Works Cited: Bowditch, N., American Practical Navigator, Pub. No. 9, 2002. Dykstra, P., Monster iceberg breaks off Antarctic Shelf,
http://www.cnn.com/2002/TECH/space/05/09/iceberg.satellite, 10 May 2002. International Ice Observation and Ice Patrol Service in the North Atlantic Ocean – Season of 1946, Bulletin
No. 32, Government Printing Office, Washington, 1947. Newell, J. P., Exceptionally Large Icebergs and Ice Islands in Eastern Canadian Waters: A Review of
Sightings from 1900 to Present, Arctic, 46, 205-211, 1993. Robe, R. Q., D. C. Maier, and R. C. Kollmeyer, Iceberg Deterioration, Nature, 267, 505-506, 1977. Trivers, G. A., International Ice Patrol’s Iceberg Season Severity, Report of the International Ice Patrol in
the North Atlantic, 80, 49-59, 1994.
56
Appendix E
Season Severity by Three Variable Index: LAKI Area, Length of Season, Iceberg Population below 48 °N
Cadet 1/c Victoria Futch
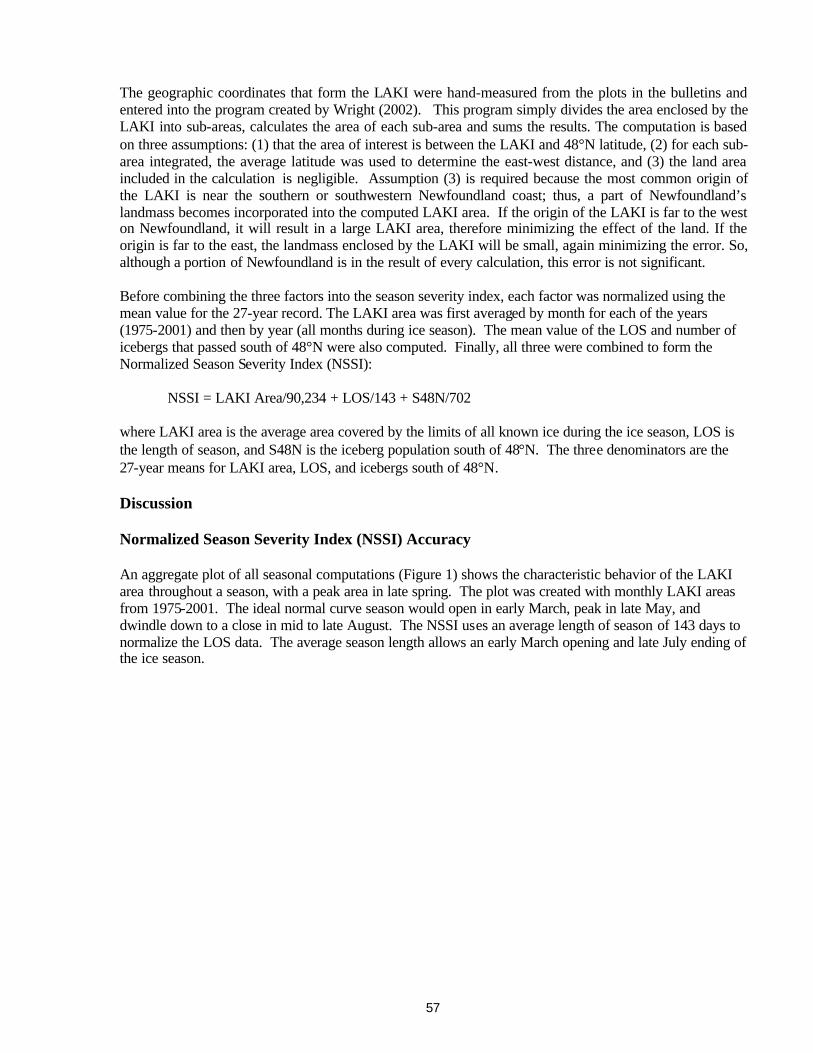
Donald L. Murphy Introduction When International Ice Patrol (IIP) began to measure season severity, the main method was to count the number of icebergs crossing south of 48°N during the season. It is not clear why 48°N was chosen, but it is likely it was viewed as the latitude below which icebergs were considered a menace to the transatlantic mariners. The first time Ice Patrol took an interest in season severity measurements was in 1926 with the publication of Edward H. “Iceberg” Smith’s, “Summary of Iceberg Records in the North-West North Atlantic.” In this publication, Iceberg Smith compiled actual iceberg counts of those crossing 48°N from 1880-1926. After this, the number of icebergs crossing 48°N became a standard statistic in IIP’s annual bulletins. Over the years, this statistic has become the standard indicator of iceberg season severity. However, the interpretation of the season severity measure has varied over the years. For example, Alfultis (1987) defined four iceberg-population severity classes starting at 300 icebergs or fewer for a light year and over 900 icebergs for an extreme year. Trivers (1994) modified the interpretation and defined a light year as one with 300 or fewer icebergs but defined an extreme year as 600 or more icebergs. For the mariner, the number of icebergs present in the shipping lanes is not the only factor that indicates the severity of an iceberg season. The area enclosed by IIP’s Limit of All Known Ice (LAKI), which defines the iceberg danger area, and the length of the iceberg season (LOS) are also very important factors to the mariners. If the iceberg population is widely distributed and persists over a long span of time, the mariner may also view the season as severe, even though there might not be an extraordinary number of icebergs south of 48°N. Each of the three factors costs the mariner money when they are forced to delay or divert due to ice. In an effort to create a more accurate description of season severity, a new index has been created using three variables: the area south of 48°N enclosed by LAKI, iceberg popula tion south of 48°N and LOS. Methods The LAKI, LOS, and number of icebergs passing south of 48°N were taken from IIP’s annual bulletins from 1975-2001. As part of Ice Patrol’s routine operations, LAKI is determined twice a day, every day during the entire ice season. It is a line that encompasses all known icebergs in the northwestern Atlantic Ocean, thus defining the iceberg danger area. A typical LAKI originates near the coast of Newfoundland, proceeds southeastward over the Grand Banks, and then northward to 52°N, where the Canadian Ice Service takes over the responsibility for defining the iceberg danger area. The bulletins from 1981 to 2001 contain LAKI plots for the 15th and 30th (or last) day of each month. Before 1981, the LAKI plots were not consistently published on any particular day, but there were enough plots to produce a twice-a-month record. Data from 1975-1980 were taken from the day as close to the 15th or 30th of the month as possible. Exact dates are nominal, and the slight difference between dates in some months does not affect the results of the calculations. In the annual bulletins before 1975 the LAKI information was not as regular as the more recent bulletins and could not be used.
57
The geographic coordinates that form the LAKI were hand-measured from the plots in the bulletins and entered into the program created by Wright (2002). This program simply divides the area enclosed by the LAKI into sub-areas, calculates the area of each sub-area and sums the results. The computation is based on three assumptions: (1) that the area of interest is between the LAKI and 48°N latitude, (2) for each sub-area integrated, the average latitude was used to determine the east-west distance, and (3) the land area included in the calculation is negligible. Assumption (3) is required because the most common origin of the LAKI is near the southern or southwestern Newfoundland coast; thus, a part of Newfoundland’s landmass becomes incorporated into the computed LAKI area. If the origin of the LAKI is far to the west on Newfoundland, it will result in a large LAKI area, therefore minimizing the effect of the land. If the origin is far to the east, the landmass enclosed by the LAKI will be small, again minimizing the error. So, although a portion of Newfoundland is in the result of every calculation, this error is not significant. Before combining the three factors into the season severity index, each factor was normalized using the mean value for the 27-year record. The LAKI area was first averaged by month for each of the years (1975-2001) and then by year (all months during ice season). The mean value of the LOS and number of icebergs that passed south of 48°N were also computed. Finally, all three were combined to form the Normalized Season Severity Index (NSSI): NSSI = LAKI Area/90,234 + LOS/143 + S48N/702 where LAKI area is the average area covered by the limits of all known ice during the ice season, LOS is the length of season, and S48N is the iceberg population south of 48°N. The three denominators are the 27-year means for LAKI area, LOS, and icebergs south of 48°N. Discussion Normalized Season Severity Index (NSSI) Accuracy An aggregate plot of all seasonal computations (Figure 1) shows the characteristic behavior of the LAKI area throughout a season, with a peak area in late spring. The plot was created with monthly LAKI areas from 1975-2001. The ideal normal curve season would open in early March, peak in late May, and dwindle down to a close in mid to late August. The NSSI uses an average length of season of 143 days to normalize the LOS data. The average season length allows an early March opening and late July ending of the ice season.
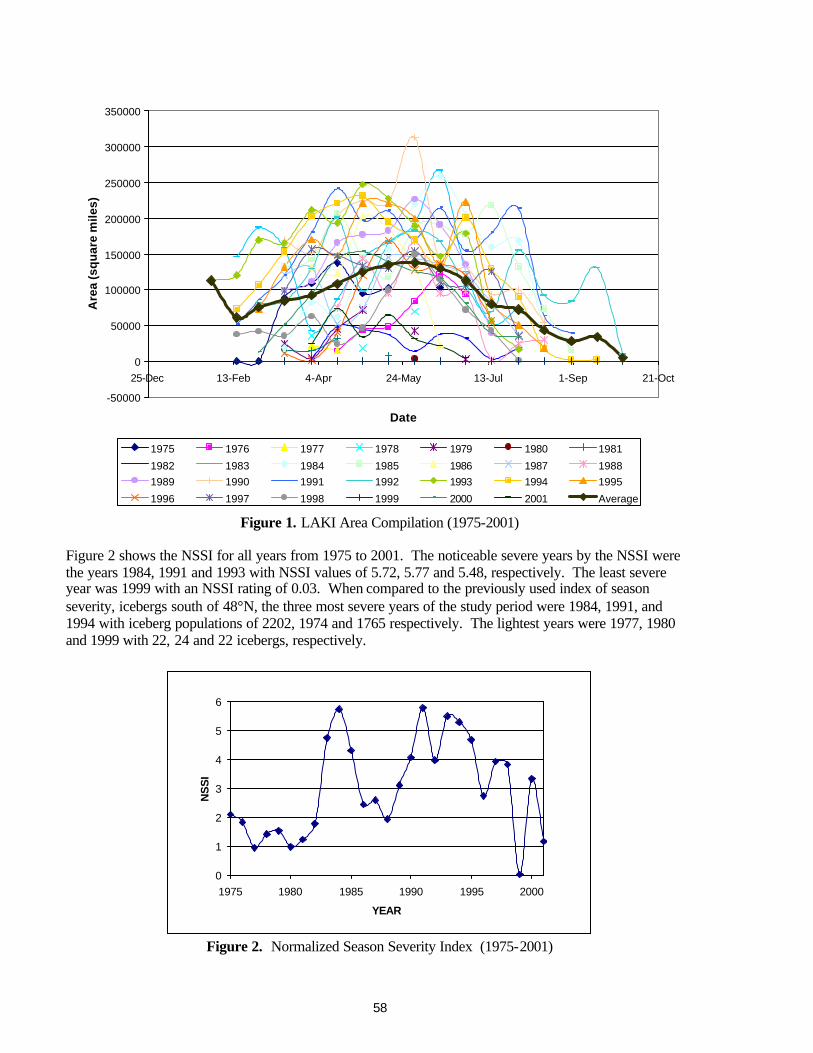
58
-50000
0
50000
100000
150000
200000
250000
300000
350000
25-Dec 13-Feb 4-Apr 24-May 13-Jul 1-Sep 21-Oct
Date
Are
a (s
qu
are
mile
s)
1975 1976 1977 1978 1979 1980 1981
1982 1983 1984 1985 1986 1987 19881989 1990 1991 1992 1993 1994 1995
1996 1997 1998 1999 2000 2001 Average
Figure 1. LAKI Area Compilation (1975-2001) Figure 2 shows the NSSI for all years from 1975 to 2001. The noticeable severe years by the NSSI were the years 1984, 1991 and 1993 with NSSI values of 5.72, 5.77 and 5.48, respectively. The least severe year was 1999 with an NSSI rating of 0.03. When compared to the previously used index of season severity, icebergs south of 48°N, the three most severe years of the study period were 1984, 1991, and 1994 with iceberg populations of 2202, 1974 and 1765 respectively. The lightest years were 1977, 1980 and 1999 with 22, 24 and 22 icebergs, respectively.
0
1
2
3
4
5
6
1975 1980 1985 1990 1995 2000
YEAR
NS
SI
Figure 2. Normalized Season Severity Index (1975-2001)
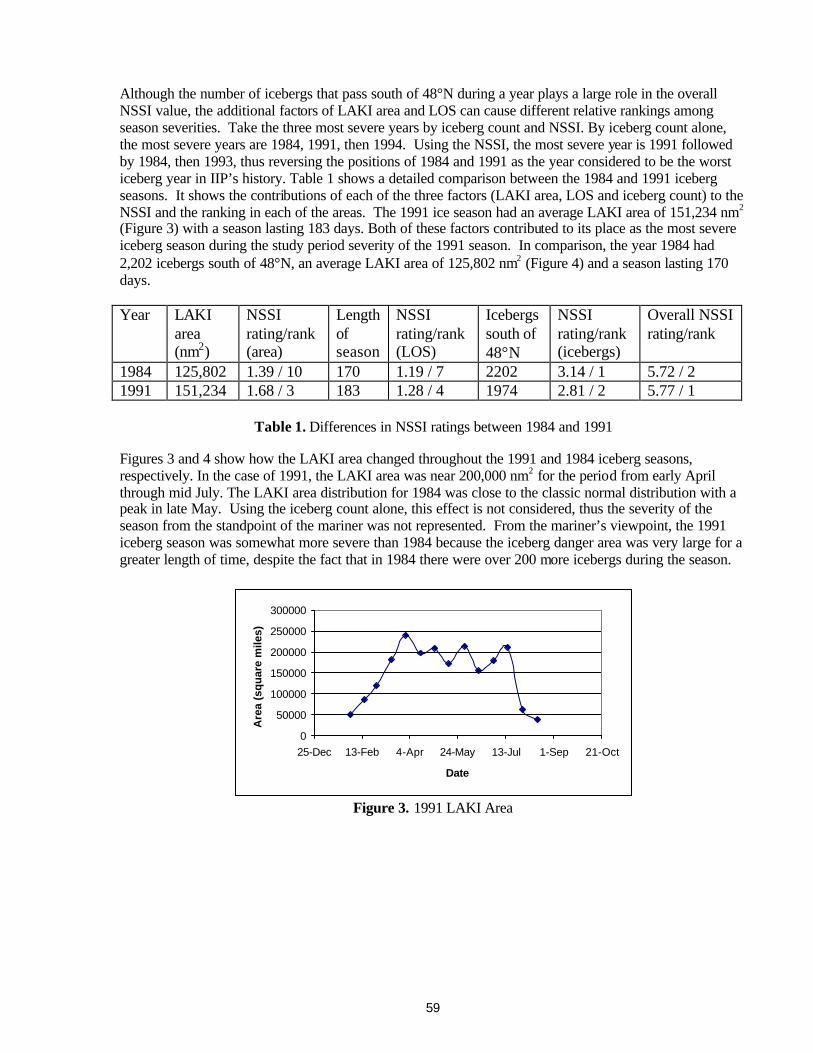
59
Although the number of icebergs that pass south of 48°N during a year plays a large role in the overall NSSI value, the additional factors of LAKI area and LOS can cause different relative rankings among season severities. Take the three most severe years by iceberg count and NSSI. By iceberg count alone, the most severe years are 1984, 1991, then 1994. Using the NSSI, the most severe year is 1991 followed by 1984, then 1993, thus reversing the positions of 1984 and 1991 as the year considered to be the worst iceberg year in IIP’s history. Table 1 shows a detailed comparison between the 1984 and 1991 iceberg seasons. It shows the contributions of each of the three factors (LAKI area, LOS and iceberg count) to the NSSI and the ranking in each of the areas. The 1991 ice season had an average LAKI area of 151,234 nm2 (Figure 3) with a season lasting 183 days. Both of these factors contributed to its place as the most severe iceberg season during the study period severity of the 1991 season. In comparison, the year 1984 had 2,202 icebergs south of 48°N, an average LAKI area of 125,802 nm2 (Figure 4) and a season lasting 170 days. Year LAKI
area (nm2)
NSSI rating/rank (area)
Length of season
NSSI rating/rank (LOS)
Icebergs south of 48°N
NSSI rating/rank (icebergs)
Overall NSSI rating/rank
1984 125,802 1.39 / 10 170 1.19 / 7 2202 3.14 / 1 5.72 / 2 1991 151,234 1.68 / 3 183 1.28 / 4 1974 2.81 / 2 5.77 / 1
Table 1. Differences in NSSI ratings between 1984 and 1991 Figures 3 and 4 show how the LAKI area changed throughout the 1991 and 1984 iceberg seasons, respectively. In the case of 1991, the LAKI area was near 200,000 nm2 for the period from early April through mid July. The LAKI area distribution for 1984 was close to the classic normal distribution with a peak in late May. Using the iceberg count alone, this effect is not considered, thus the severity of the season from the standpoint of the mariner was not represented. From the mariner’s viewpoint, the 1991 iceberg season was somewhat more severe than 1984 because the iceberg danger area was very large for a greater length of time, despite the fact that in 1984 there were over 200 more icebergs during the season.
0
50000
100000
150000
200000
250000
300000
25-Dec 13-Feb 4-Apr 24-May 13-Jul 1-Sep 21-Oct
Date
Are
a (s
qu
are
mile
s)
Figure 3. 1991 LAKI Area
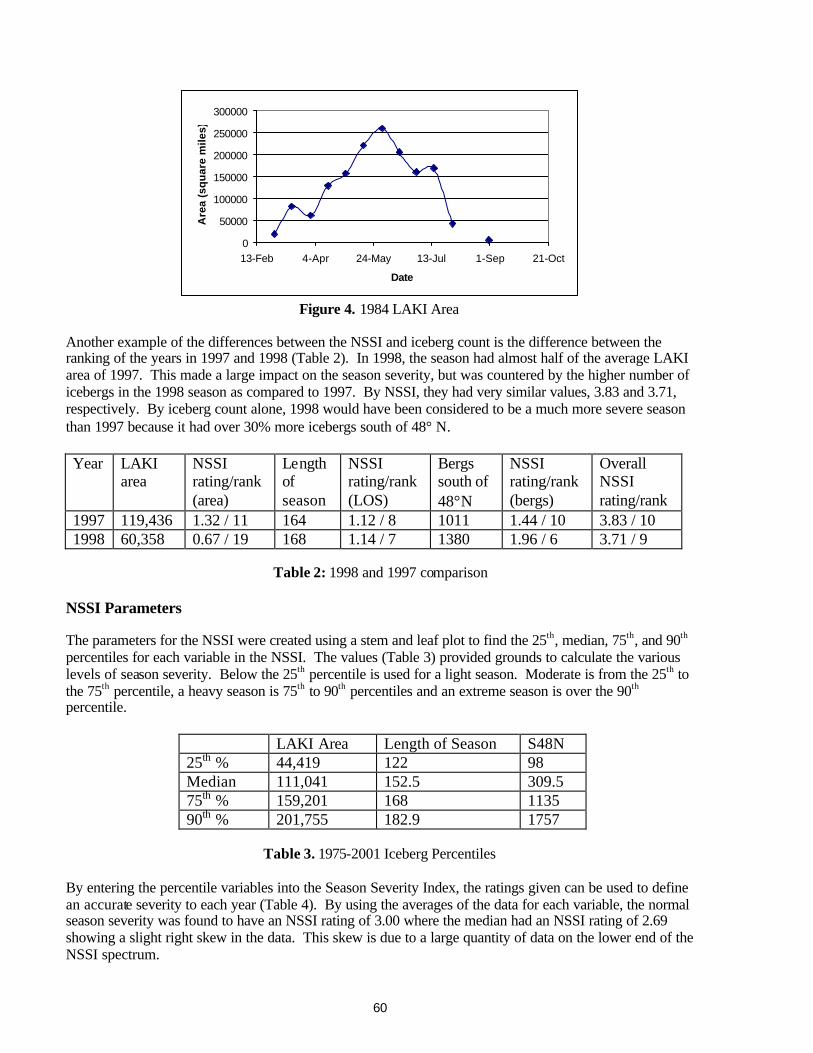
60
0
50000
100000
150000
200000
250000
300000
13-Feb 4-Apr 24-May 13-Jul 1-Sep 21-Oct
Date
Are
a (s
qu
are
mile
s)
Figure 4. 1984 LAKI Area
Another example of the differences between the NSSI and iceberg count is the difference between the ranking of the years in 1997 and 1998 (Table 2). In 1998, the season had almost half of the average LAKI area of 1997. This made a large impact on the season severity, but was countered by the higher number of icebergs in the 1998 season as compared to 1997. By NSSI, they had very similar values, 3.83 and 3.71, respectively. By iceberg count alone, 1998 would have been considered to be a much more severe season than 1997 because it had over 30% more icebergs south of 48° N. Year LAKI
area NSSI rating/rank (area)
Length of season
NSSI rating/rank (LOS)
Bergs south of 48°N
NSSI rating/rank (bergs)
Overall NSSI rating/rank
1997 119,436 1.32 / 11 164 1.12 / 8 1011 1.44 / 10 3.83 / 10 1998 60,358 0.67 / 19 168 1.14 / 7 1380 1.96 / 6 3.71 / 9
Table 2: 1998 and 1997 comparison
NSSI Parameters The parameters for the NSSI were created using a stem and leaf plot to find the 25th, median, 75th, and 90th percentiles for each variable in the NSSI. The values (Table 3) provided grounds to calculate the various levels of season severity. Below the 25th percentile is used for a light season. Moderate is from the 25th to the 75th percentile, a heavy season is 75th to 90th percentiles and an extreme season is over the 90th percentile.
LAKI Area Length of Season S48N 25th % 44,419 122 98 Median 111,041 152.5 309.5 75th % 159,201 168 1135 90th % 201,755 182.9 1757
Table 3. 1975-2001 Iceberg Percentiles
By entering the percentile variables into the Season Severity Index, the ratings given can be used to define an accurate severity to each year (Table 4). By using the averages of the data for each variable, the normal season severity was found to have an NSSI rating of 3.00 where the median had an NSSI rating of 2.69 showing a slight right skew in the data. This skew is due to a large quantity of data on the lower end of the NSSI spectrum.
61
Normalized Season Severity Index Light < 1.45 Moderate 1.45 – 4.25 Heavy 4.25 – 5.00 Extreme > 5.00
Table 4. Final NSSI Rating Categories
The percentiles were used as guides to create the rankings for light, moderate, heavy, and extreme years, but they were not the deciding factor. The averages for each variable and frequency of occurrence were taken into account to create a more accurate representation of season severity. Comparison of NSSI to Previous Standards Most recently, Trivers (1994) updated the International Ice Patrol’s season severity classification based on the number of icebergs that passed south of 48°N during a season. Trivers based his data upon Alfultis (1987) results on season severity, but tried to take into account the difference in iceberg data collection methods. He examined the difference between the pre-SLAR (Side-Looking Airborne Radar) years and the SLAR years. In the pre-SLAR years, Trivers notes that an extreme year in the terms that Alfultis set are average under SLAR years. This difference could be the result of either better detection due to increased technology or natural variations in iceberg counts and distribution. If the increase is due to technology, then this may have an effect on the results of the NSSI, however Trivers found that the pre-SLAR years had not been undercounted. Trivers created new iceberg population severity classes as shown in Table 5. By comparing these severity classes by the data used for the NSSI, the severity classes used by Trivers seem to be low compared to the NSSI data. The average number of icebergs below 48°N was 702 for NSSI years whereas in Trivers the extreme year was classified as 600 plus icebergs. Using Trivers’ (1994) standards to classify the NSSI data, 13 of the 27 years would have been classified as extreme, whereas using NSSI rankings, only 4 years were classified as extreme.
Trivers (1994) Iceberg Population Severity Classes Light < 300 icebergs south of 48° N Moderate 300-600 icebergs south of 48° N Extreme > 600 icebergs south of 48° N
Table 5. Trivers (1994) Severity Classes
Conclusion The NSSI rating combines the three most important variables into a single number that indicates of the severity of an iceberg season: LAKI area, LOS and the number of icebergs that passed south of 48°N. The previously used indicator, the number of icebergs south of 48°N, provided information only on the number of icebergs that entered the shipping lanes, without regard to how far they spread or how long they persisted. The NSSI focuses on the severity of an iceberg season from the standpoint of the transatlantic mariner, IIP’s most important customer, because it represents the areal and temporal extent of the iceberg threat during a given season. The NSSI is also a good indicator of the effort required for IIP to provide its services during a season. A season with a large number of icebergs concentrated near the Grand Banks is far less challenging than a season with a smaller number of widely distributed icebergs. The most important result of a wide iceberg
62
distribution or a long season is the requirement for a greater number of aircraft hours needed to conduct reconnaissance. Thus, the NSSI can be used to compare iceberg seasons with differing iceberg populations in an effort to determine trends in IIP’s efficiency.
There are some drawbacks to using the NSSI as an indicator of season severity. The most significant is that the information required to calculate the NSSI is not available for as long a period as the iceberg counts. The iceberg count extends to the late 1800s, while the NSSI can be computed with confidence back to 1975. In addition, many users of the season severity information are interested only in a specific area, so the iceberg count is a satisfactory indicator. These users include the offshore oil industry and other local marine interests.
63
References
Alfultis, M., 1987: Iceberg Populations South of 48N Since 1900, Report of the International Ice Patrol
Services in the North Atlantic, Bulletin No. 73, Appendix B, pp. 52-62. Smith, E., 1926: Summary of Iceberg Records In the North Western North Atlantic, 1880-1926, Report of
the International Ice Patrol Services in the North Atlantic, Bulletin No. 15, pp 75-77. Trivers, G., 1994: International Ice Patrol’s Iceberg Season Severity, Report of the International Ice Patrol
Services in the North Atlantic, Bulletin No. 80, Appendix C, pp. 49-59. Wright, Greg, 2002: LakiArea2 program

This Page Intentionally Left Blank
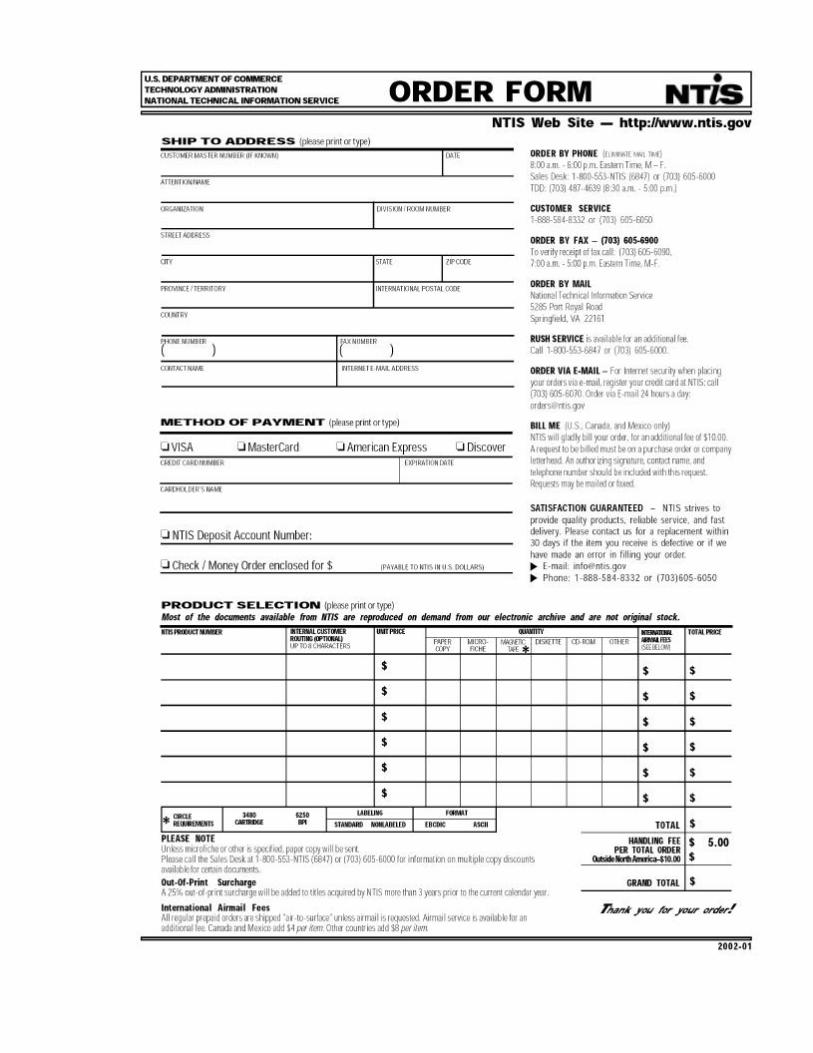

This Page Intentionally Left Blank .
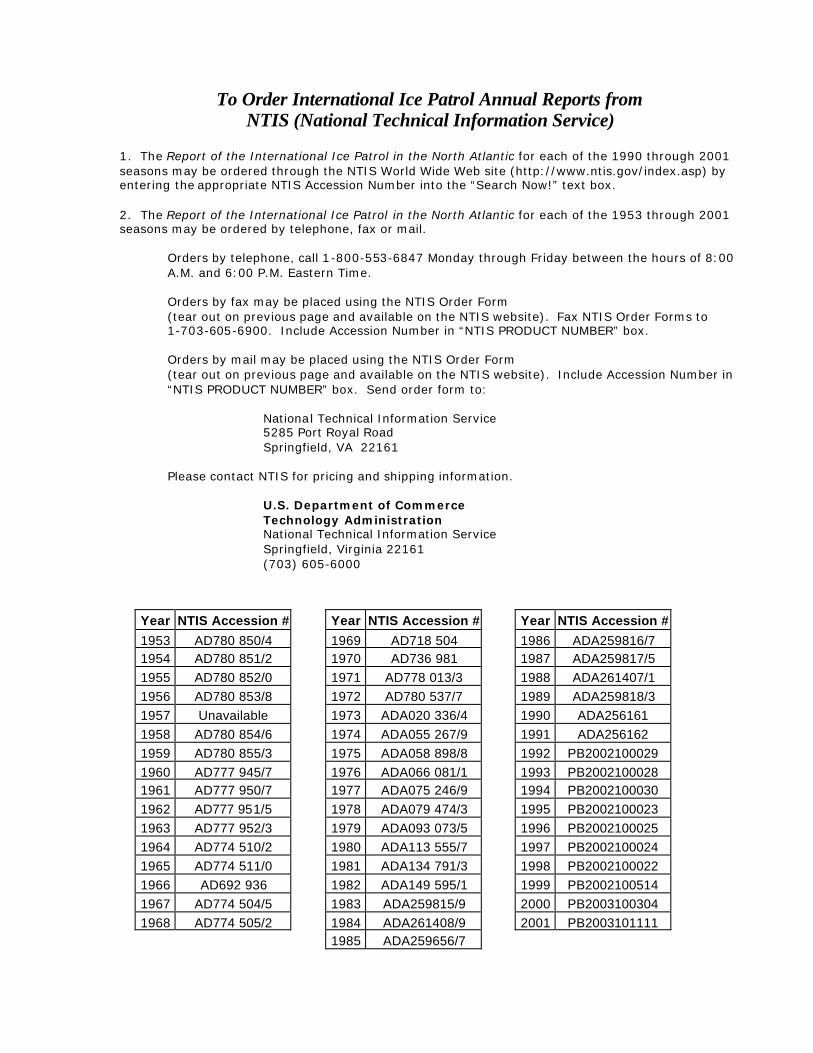
To Order International Ice Patrol Annual Reports from NTIS (National Technical Information Service)
1. The Report of the International Ice Patrol in the North Atlantic for each of the 1990 through 2001 seasons may be ordered through the NTIS World Wide Web site (http://www.ntis.gov/index.asp) by entering the appropriate NTIS Accession Number into the “Search Now!” text box.
2. The Report of the International Ice Patrol in the North Atlantic for each of the 1953 through 2001 seasons may be ordered by telephone, fax or mail.
Orders by telephone, call 1-800-553-6847 Monday through Friday between the hours of 8:00 A.M. and 6:00 P.M. Eastern Time.
Orders by fax may be placed using the NTIS Order Form (tear out on previous page and available on the NTIS website). Fax NTIS Order Forms to 1-703-605-6900. Include Accession Number in “NTIS PRODUCT NUMBER” box. Orders by mail may be placed using the NTIS Order Form (tear out on previous page and available on the NTIS website). Include Accession Number in “NTIS PRODUCT NUMBER” box. Send order form to:
National Technical Information Service 5285 Port Royal Road Springfield, VA 22161
Please contact NTIS for pricing and shipping information.
U.S. Department of Commerce Technology Administration National Technical Information Service Springfield, Virginia 22161 (703) 605-6000
Year NTIS Accession # Year NTIS Accession # Year NTIS Accession #
1953 AD780 850/4 1969 AD718 504 1986 ADA259816/7 1954 AD780 851/2 1970 AD736 981 1987 ADA259817/5 1955 AD780 852/0 1971 AD778 013/3 1988 ADA261407/1 1956 AD780 853/8 1972 AD780 537/7 1989 ADA259818/3 1957 Unavailable 1973 ADA020 336/4 1990 ADA256161 1958 AD780 854/6 1974 ADA055 267/9 1991 ADA256162 1959 AD780 855/3 1975 ADA058 898/8 1992 PB2002100029 1960 AD777 945/7 1976 ADA066 081/1 1993 PB2002100028 1961 AD777 950/7 1977 ADA075 246/9 1994 PB2002100030 1962 AD777 951/5 1978 ADA079 474/3 1995 PB2002100023 1963 AD777 952/3 1979 ADA093 073/5 1996 PB2002100025 1964 AD774 510/2 1980 ADA113 555/7 1997 PB2002100024 1965 AD774 511/0 1981 ADA134 791/3 1998 PB2002100022 1966 AD692 936 1982 ADA149 595/1 1999 PB2002100514 1967 AD774 504/5 1983 ADA259815/9 2000 PB2003100304 1968 AD774 505/2 1984 ADA261408/9 2001 PB2003101111 1985 ADA259656/7