Embed Size (px)
Citation preview
reportOdour Buffer Distances for Ballarat North, Ballarat South and Cardigan Village WWTPs
3552322/100 Rev 1 R1:62014
reportOdour Buffer Distances for Ballarat North, Ballarat South and Cardigan Village WWTPs
Prepared for
Ballarat City Council
By
Beca Pty Ltd
ABN: 85 004 974 341
January 2007
Ballarat WWTP Odour Buffer Distances
3552322/100 Beca Page i R1:62014-TJF65R04 - Rev 1.DOC Rev 1 23 January 2007
Table of Contents
1 Introduction ................................................................................................ 11.1 Overview ..........................................................................................................11.2 Information Sources ........................................................................................2
2 EPA Victoria Regulations for Odour Design Criteria and Buffer Distances.......................................................................................... 32.1 Introduction .....................................................................................................32.2 SEPPs .................................................................................................................32.3 Odour Design Criteria in the SEPP (AQM).....................................................42.4 Buffer Distances ...............................................................................................4
3 Location and Description of Sites............................................................. 73.1 Cardigan Village WWTP .................................................................................73.2 Ballarat North WWTP .....................................................................................103.3 Ballarat South WWTP .....................................................................................15
4 Meteorology............................................................................................. 214.1 Ballarat Airport Meteorology .......................................................................214.2 Meteorological Data File for Dispersion Model .........................................22
5 Description of Odour Sources and Estimate of Odour Emission Rates .......................................................................................... 235.1 Cardigan Village WWTP ...............................................................................235.2 Ballarat North WWTP .....................................................................................255.3 Ballarat South WWTP .....................................................................................27
6 Approach Used to Define Buffer Distances ........................................... 316.1 Overview ........................................................................................................316.2 Modelling Criteria..........................................................................................316.3 Dispersion Model Methodology ..................................................................33
7 Cardigan WWTP Dispersion Model Results and Odour Buffer Distances .................................................................................................. 347.1 Model Results : Scenarios C1, C2 and C3 – Cardigan Village
WWTP normal operation...............................................................................347.2 Model Results: Scenario C4 – Cardigan Village WWTP upset
operation future loading..............................................................................387.3 Discussion of results and odour buffer distance
recommendation..........................................................................................40
8 Ballarat North WWTP Dispersion Model Results and Odour Buffer Distances........................................................................................ 44
Ballarat WWTP Odour Buffer Distances
3552322/100 Beca Page ii R1:62014-TJF65R04 - Rev 1.DOC Rev 1 23 January 2007
8.1 Model Results: Scenario N1 Normal Operation GHD SOERs.....................448.2 Model Results: Scenario N3 Normal Operation Beca SOERs....................488.3 Model Results: Scenario N2 – Ballarat North WWTP upset
operation GHD SOERs...................................................................................518.4 Model Results: Scenario N4 – Ballarat North WWTP upset
operation Beca SOERs..................................................................................548.5 Discussion of results and odour buffer distance
recommendation for Ballarat North WWTP ................................................57
9 Ballarat South WWTP Dispersion Model Results and Odour Buffer Distances........................................................................................ 629.1 Model Results: Scenario S1 Current Layout Normal Operation ...............629.2 Model Results: Scenario S2 Future Layout Normal Operation..................669.3 Model Results: Scenario S3 – Ballarat South WWTP upset
operation current layout ..............................................................................679.4 Model Results: Scenario S4 – Ballarat South WWTP upset
operation future layout ................................................................................719.5 Discussion of results and odour buffer distance
recommendation for Ballarat South WWTP................................................73
10 Planning Scheme Implementation Options .......................................... 7710.1 Current Situation............................................................................................7710.2 Options for Improvement .............................................................................79
11 Community Information Sessions ........................................................... 8111.1 Background ...................................................................................................8111.2 Cardigan Village...........................................................................................8111.3 Ballarat North.................................................................................................8211.4 Ballarat South.................................................................................................83
12 Conclusions .............................................................................................. 84
13 Recommendations .................................................................................. 86
14 References................................................................................................ 87
Ballarat WWTP Odour Buffer Distances
3552322/100 Beca Page 1 R1:62014-TJF65R04 - Rev 1.DOC Rev 1 23 January 2007
1 Introduction
1.1 Overview Wastewater treatment plants (WWTPs) are critical infrastructure for any modern city. They have historically, by virtue of odour and perception impacts, been located away from residential areas, and have been provided with buffer zones – more related to distance than specific odour modelling and odour mitigation strategies.
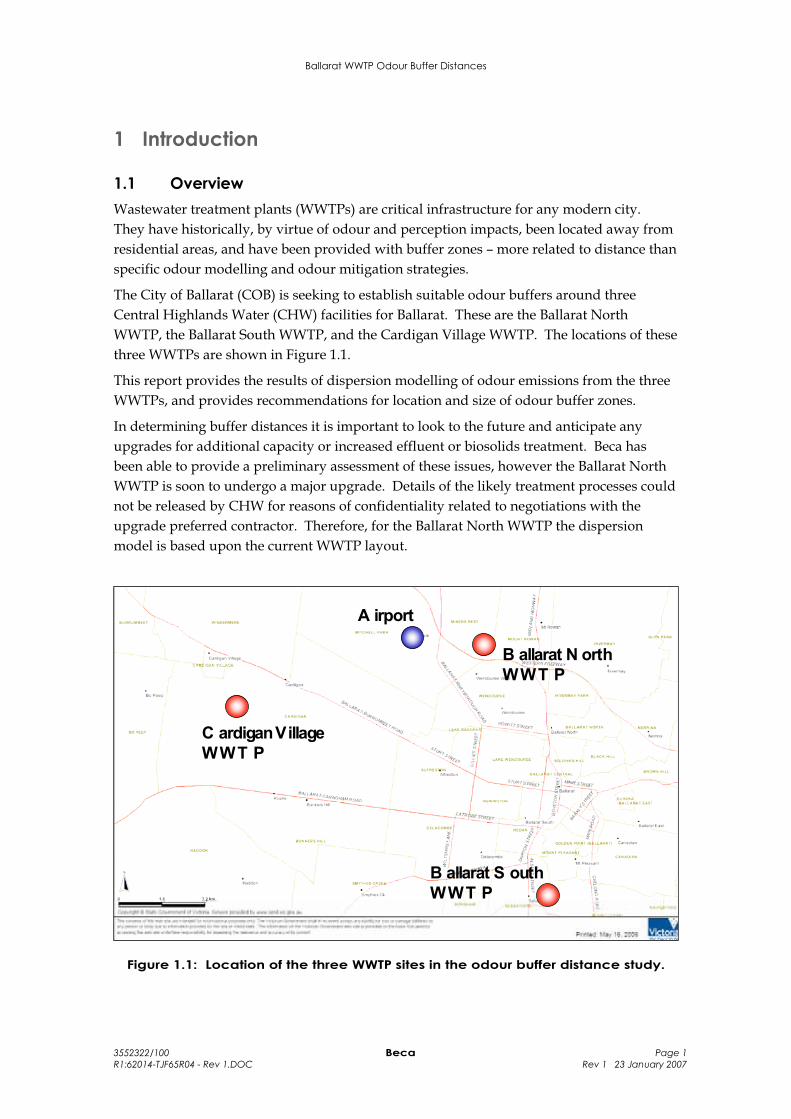
The City of Ballarat (COB) is seeking to establish suitable odour buffers around three Central Highlands Water (CHW) facilities for Ballarat. These are the Ballarat North WWTP, the Ballarat South WWTP, and the Cardigan Village WWTP. The locations of these three WWTPs are shown in Figure 1.1.
This report provides the results of dispersion modelling of odour emissions from the three WWTPs, and provides recommendations for location and size of odour buffer zones.
In determining buffer distances it is important to look to the future and anticipate any upgrades for additional capacity or increased effluent or biosolids treatment. Beca has been able to provide a preliminary assessment of these issues, however the Ballarat North WWTP is soon to undergo a major upgrade. Details of the likely treatment processes could not be released by CHW for reasons of confidentiality related to negotiations with the upgrade preferred contractor. Therefore, for the Ballarat North WWTP the dispersion model is based upon the current WWTP layout.
C ardigan Village WWT P
B allarat N orth WWT P
B allarat S outh WWT P
A irport
Figure 1.1: Location of the three WWTP sites in the odour buffer distance study.

Ballarat WWTP Odour Buffer Distances
3552322/100 Beca Page 2 R1:62014-TJF65R04 - Rev 1.DOC Rev 1 23 January 2007
1.2 Information Sources The dispersion model input data for the Ballarat North WWTP and Cardigan Village WWTP were based on information provided by CHW, site visits which did not include entering the premises, and aerial photos. For the Ballarat South WWTP, this information was supplemented by a site visit and tour of the Ballarat South WWTP on 3rd May 2006, and site drawings provided during the tour.
Specifically, documented information provided by CHW was as follows:
Extracts from internal CHW document concerning Ballarat's wastewater treatment plants entitled Water Supply and Wastewater Service: System Summaries (October 2005). It is understood that the information contained in this document is used primarily to update CHW Board members on CHW water supply and wastewater treatment systems and is not normally released publicly. Accordingly, only the sections of the document considered relevant to this study were released by CHW.
GHD report for CHW dated April 2004 entitled “Odour Emission Rate Surveys and Assessment of Appropriate Buffer Distance for Ballarat North WWTP, Final Report (Draft)”.
Ballarat WWTP Odour Buffer Distances
3552322/100 Beca Page 3 R1:62014-TJF65R04 - Rev 1.DOC Rev 1 23 January 2007
2 EPA Victoria Regulations for Odour Design Criteria and Buffer Distances
2.1 Introduction There are two principal policy documents used by EPA Victoria to define odour performance standards for WWTPs and land use planning approaches for areas around WWTP boundaries. The primary driver for odour management for new plants or substantial expansions to existing plants is the EPA’s State Environment Protection Policy (SEPP) (Air Quality Management), gazetted in December 2001. The SEPP requires dispersion modelling of odour emissions from WWTPs and demonstration that the odour emissions from the WWTP can comply with a design standard at the WWTP boundary.
The second document used by EPA Victoria is not a design standard, rather it is the definition of buffer distances around a WWTP for avoidance of odour nuisance during upset conditions. The buffer distances and their application are defined in a 1990 report entitled “Recommended Buffer Distances for Industrial Residual Air Emissions”, also known as “AQ 2/86”.
Further information on the context and application of the guidelines in the SEPP and AQ 2/86 is outlined sections 2.2 to 2.4.
2.2 SEPPs Victoria’s legal framework for protecting air quality is provided by the Environment Protection Act 1970 which provides for the development of SEPPs. SEPPs establish a statutory policy framework for protecting the environment. They identify the beneficial uses of the environment that are to be protected, set out a program of actions to ensure that those beneficial uses are protected, and identify how the protection will be assessed.
The status of the SEPPs is described in an Information Bulletin produced by EPA Victoria (EPA Victoria, 2002). Relevant information from that bulletin is reproduced in this section for the purpose of setting the context for the assessment in this report.
All individuals and organisations in Victoria (whether public or private) must comply with SEPPs. This includes EPA and other government agencies, which must ensure that their strategies, plans and programs are in line with SEPP provisions.
Victoria has had a SEPP protecting the air environment in place since 1981. In 1999, the SEPP (The Air Environment) was split into two SEPPs to accommodate the development of national legislation setting ambient air quality standards for criteria pollutants such as ozone, oxides of nitrogen and sulphur dioxide. These SEPPs are:
The State Environment Protection Policy (Ambient Air Quality) or ‘SEPP (AAQ)’ (EPA Victoria, 2002(b)); and
The State Environment Protection Policy (Air Quality Management) or ‘SEPP (AQM)’ (EPA Victoria, 2002(a)).
Ballarat WWTP Odour Buffer Distances
3552322/100 Beca Page 4 R1:62014-TJF65R04 - Rev 1.DOC Rev 1 23 January 2007
EPA reviewed both SEPPs in 2000/2001. The reviews took account of recent developments in environmental management and technologies, new scientific information on the impacts of hazardous air pollutants and continuing developments in the modelling of air pollution.
The review process was finalised when the variation to SEPP (AAQ) and a completely revised SEPP (AQM) were gazetted in December 2001.
2.3 Odour Design Criteria in the SEPP (AQM) Emissions of mixed odorous substances, such as those from WWTPs, rendering plants and intensive animal industries may be offensive and therefore need to be minimised and controlled to ensure that the beneficial uses of the environment are protected. General odour is defined in SEPP (AQM) as an unclassified air quality indicator of local amenity and aesthetic enjoyment of the air environment.
The design criteria for new sources of general odour as defined in SEPP (AQM), Schedule A is the odour detection threshold (1 odour unit) and should be applied at and beyond the boundary of a plant. One odour unit is classified as the concentration of an odour in an air sample that can be perceived by 50% of the observers.
SEPP (AQM) defines the required dispersion modelling methodology to accompany this design criteria as follows:
Ausplume dispersion model
3-minute averaging time
9th highest value (99.9 percentile)
Estimates of emission rates must be based on the “worst case” scenario during normal operations, with any uncertainty in the estimates erring on the side of conservatism.
The design standard in SEPP (AQM) does not include odour criteria for upset conditions.
2.4 Buffer Distances
2.4.1 EPA Policy
Where sensitive land uses are not sufficiently separated from industries, amenity and quality of life in the adjacent area may be reduced due to odour, dust or noise emissions, creation of a potential hazard or aesthetically. Because it is not always possible to eliminate impacts on adjacent areas, it is unwise to permit land uses which would be sensitive to such reduced amenity to be located within the affected area.
EPA Victoria recognised this principle when on 9 March 1977 it adopted “Recommended Buffer Zones for Industrial Residual Air Emissions”, which it amended in both 1979 and 1984. The document was amended again for release in its present form in July 1990 with a name change to “Recommended Buffer Distances for Industrial Residual Air Emissions”. This document will be referred to by its EPA Victoria reference code, AQ 2/86, for convenience in this report.
In AQ 2/86, the name of the concept of separating industries and sensitive land uses is referred to as “buffer distances” rather than “buffer zones”, to avoid confusion with the use
Ballarat WWTP Odour Buffer Distances
3552322/100 Beca Page 5 R1:62014-TJF65R04 - Rev 1.DOC Rev 1 23 January 2007
of the word “zone” in a statutory planning context. Beca has adopted the same convention in this report.
AQ 2/86 states that good “in-house” pollution controls can ensure that routine emissions meet State Environment Protection Policy (SEPP) and licence requirements, and are satisfactorily dispersed so that SEPP ground level concentration (GLC) objectives are not exceeded at or beyond the site boundary.
However, even with good pollution control technology and practice, there may still be unintended or accidental emissions which must be anticipated and allowed for. AQ 2/86 states that it is an objective of EPA Victoria and the SEPP that such emissions should be eliminated. However AQ 2/86 also explains that it is recognised that even “state of the art” technology is not always capable of achieving this goal without fail. Equipment failure, accidents and abnormal weather conditions are among the causes which can lead to amenity reducing emissions affecting properties beyond the boundaries of the source premises. Unlike controlled, routine emissions, these “industrial residual air emissions” are often intermittent or episodic in occurrence and may originate at or near ground level. Provision of an adequate buffer distance allows the emissions to dissipate without adverse impacts on sensitive land uses.
AQ 2/86 states that while buffer distances are a means of reducing the effects of such residual emissions, they are not an alternative to source control. AQ 2/86 emphasises that the purpose of the document is not to condone uncontrolled off-site air emissions contravention of SEPP requirements. Rather, the document acknowledges the fact that under the circumstances described above, SEPP objectives might not always be met, and consequently some beneficial uses specified in the SEPP might not always be protected in the vicinity of a plant. This approach has been reinforced to Beca in discussions with EPA Victoria planning staff.
2.4.2 Recommended Buffer Distances for WWTPs in AQ 2/86
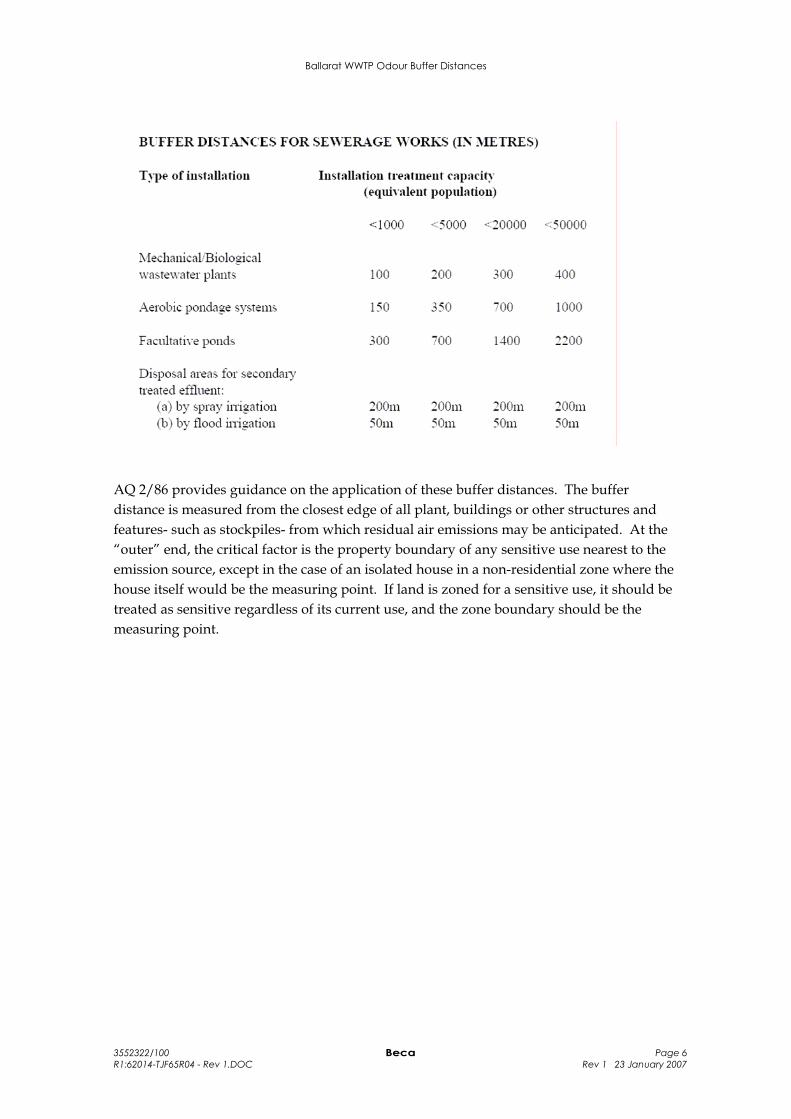
AQ 2/86 recommends the following buffer distances for wastewater treatment plants:
The buffer distance for sewage treatment or effluent disposal works should be determined in consultation with EPA. Wind regimes, topography, waste loading, treatment/disposal methods and design capacity should be taken into account. The following Table may be used as a guide when considering proposals for residential developments in the vicinity of existing sewage treatment works.
Ballarat WWTP Odour Buffer Distances
3552322/100 Beca Page 6 R1:62014-TJF65R04 - Rev 1.DOC Rev 1 23 January 2007
AQ 2/86 provides guidance on the application of these buffer distances. The buffer distance is measured from the closest edge of all plant, buildings or other structures and features- such as stockpiles- from which residual air emissions may be anticipated. At the “outer” end, the critical factor is the property boundary of any sensitive use nearest to the emission source, except in the case of an isolated house in a non-residential zone where the house itself would be the measuring point. If land is zoned for a sensitive use, it should be treated as sensitive regardless of its current use, and the zone boundary should be the measuring point.
Ballarat WWTP Odour Buffer Distances
3552322/100 Beca Page 7 R1:62014-TJF65R04 - Rev 1.DOC Rev 1 23 January 2007
3 Location and Description of Sites
3.1 Cardigan Village WWTP
3.1.1 Location and Existing Treatment Processes
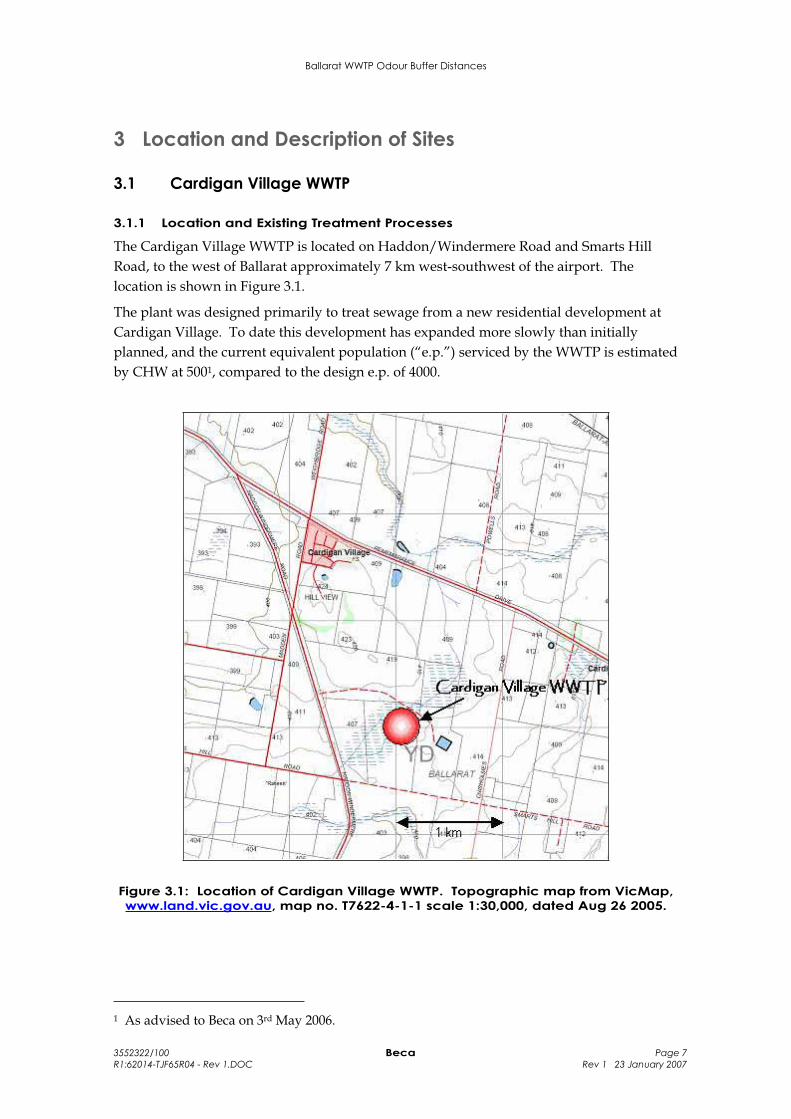
The Cardigan Village WWTP is located on Haddon/Windermere Road and Smarts Hill Road, to the west of Ballarat approximately 7 km west-southwest of the airport. The location is shown in Figure 3.1.
The plant was designed primarily to treat sewage from a new residential development at Cardigan Village. To date this development has expanded more slowly than initially planned, and the current equivalent population (“e.p.”) serviced by the WWTP is estimated by CHW at 5001, compared to the design e.p. of 4000.
Figure 3.1: Location of Cardigan Village WWTP. Topographic map from VicMap, www.land.vic.gov.au, map no. T7622-4-1-1 scale 1:30,000, dated Aug 26 2005.
1 As advised to Beca on 3rd May 2006.
Ballarat WWTP Odour Buffer Distances
3552322/100 Beca Page 8 R1:62014-TJF65R04 - Rev 1.DOC Rev 1 23 January 2007
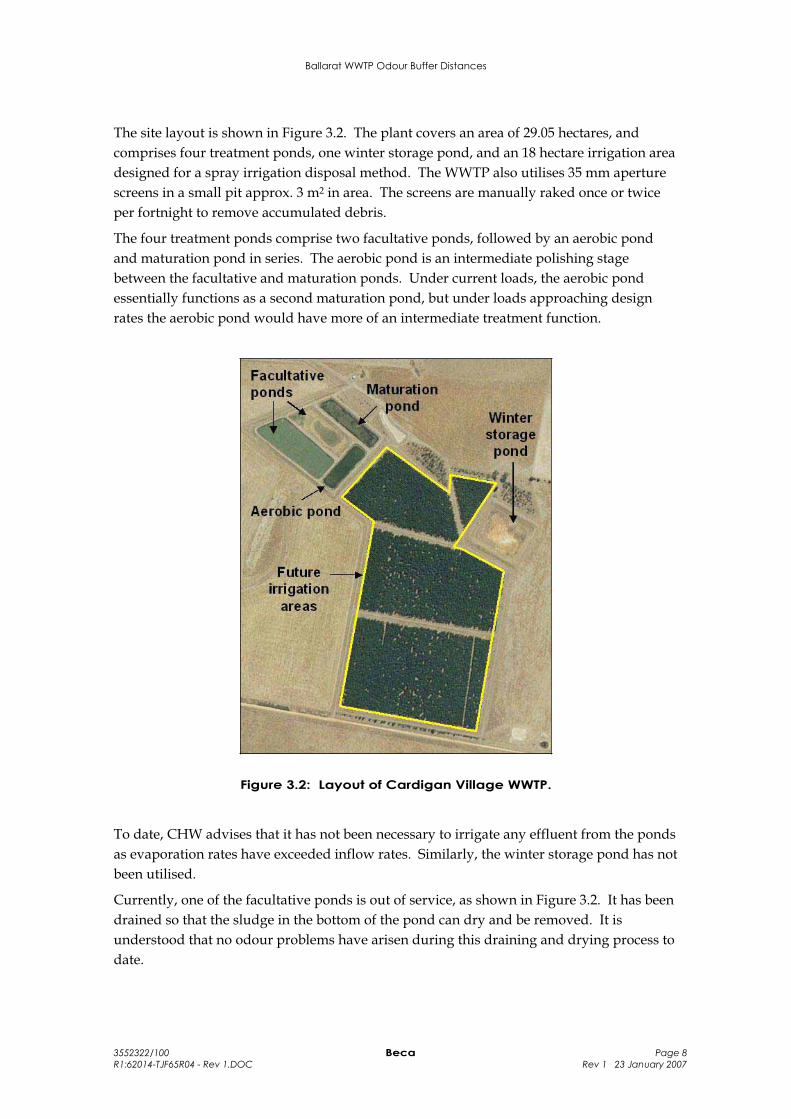
The site layout is shown in Figure 3.2. The plant covers an area of 29.05 hectares, and comprises four treatment ponds, one winter storage pond, and an 18 hectare irrigation area designed for a spray irrigation disposal method. The WWTP also utilises 35 mm aperture screens in a small pit approx. 3 m2 in area. The screens are manually raked once or twice per fortnight to remove accumulated debris.
The four treatment ponds comprise two facultative ponds, followed by an aerobic pond and maturation pond in series. The aerobic pond is an intermediate polishing stage between the facultative and maturation ponds. Under current loads, the aerobic pond essentially functions as a second maturation pond, but under loads approaching design rates the aerobic pond would have more of an intermediate treatment function.
Figure 3.2: Layout of Cardigan Village WWTP.
To date, CHW advises that it has not been necessary to irrigate any effluent from the ponds as evaporation rates have exceeded inflow rates. Similarly, the winter storage pond has not been utilised.
Currently, one of the facultative ponds is out of service, as shown in Figure 3.2. It has been drained so that the sludge in the bottom of the pond can dry and be removed. It is understood that no odour problems have arisen during this draining and drying process to date.
Ballarat WWTP Odour Buffer Distances
3552322/100 Beca Page 9 R1:62014-TJF65R04 - Rev 1.DOC Rev 1 23 January 2007
Desludging is required infrequently. Desludging of underloaded facultative pond systems, where the effluent is from a domestic catchment, should be required at about 15-20 year intervals, or longer depending on the depth of the ponds and the pond loading.
Odour can be emitted during the breakup of sludge cakes and removal offsite, although the quantity of odour emissions varies from site to site depending on the sewerage catchment, and age and stability of the sludge. Lime can be added to the sludge during sludge removal operations to control odour emission, and odour emissions can be minimised by burying the sludge (if it is to remain on the site) or removing it to a more remote location.
As desludging is an infrequent operation with emission rates varying with site management options, odour emissions from desludging and sludge stockpiling have not been included in the odour dispersion model.
3.1.2 Potential Future Plant Expansion
The catchment for the WWTP is expected to increase in future as the residential development around Cardigan Village expands. However, current loads delivered to the WWTP are one eighth of the design capacity, so there is substantial capacity for growth within the current design.
As the volume of sewage delivered to the treatment plant increases in future, there may come a time when evaporation rates from the ponds are no longer greater than the inflow rates, and it is necessary to irrigate some effluent to land. However, odour emissions from the spraying of effluent to land have not been modelled as these cannot be quantified without better knowledge of the timing, frequency, and method of spraying. In addition, odours from the spraying of effluent that has been highly treated in facultative and maturation ponds are likely to be both minor and transient, occurring in different parts of the application land from day to day.
If the catchment around the WWTP expands beyond the design capacity of the treatment plant, then CHW could implement one of several options for increasing the plant capacity. These options would include increasing the number of facultative ponds, or constructing a pre-treatment process to reduce the biochemical oxygen demand (“BOD”) discharged to the pond system. Contemplation of odour buffer distances for these types of amendments to the processes at the WWTP are beyond the scope of this report.
3.1.3 Application of AQ 2/86 buffer distances to Cardigan Village WWTP
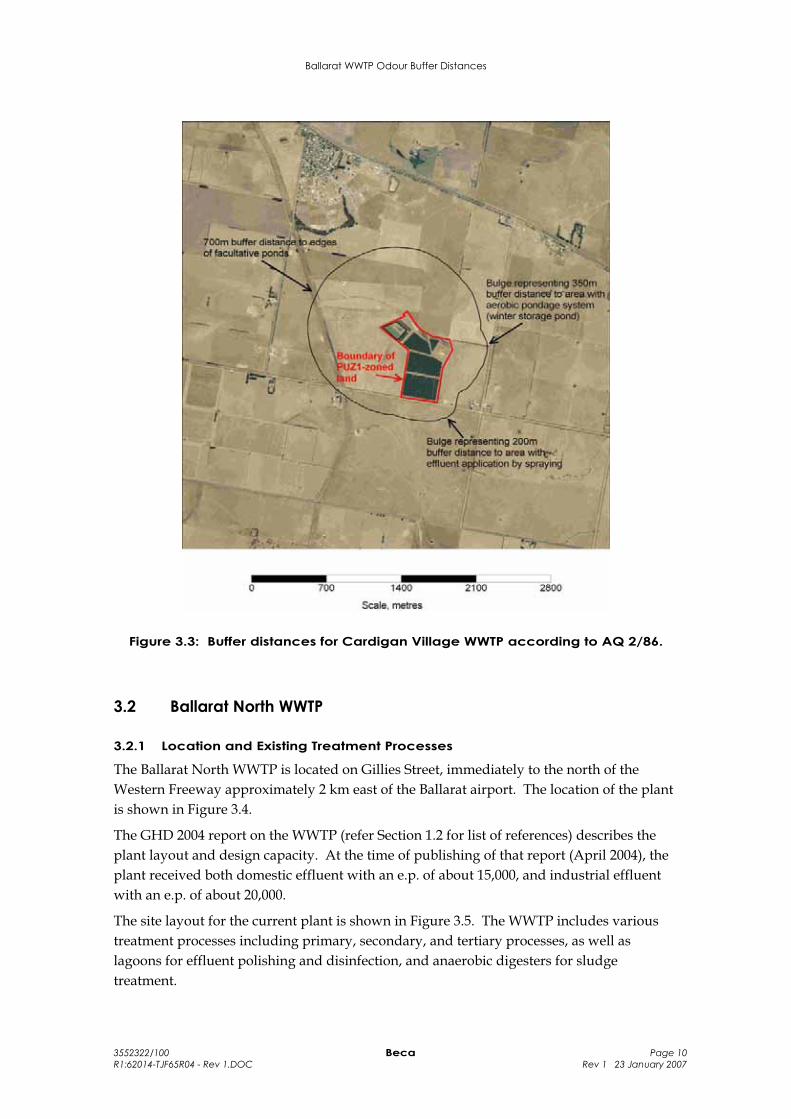
Based on the design e.p. of 4000, the buffer distances in AQ 2/86 (see Section 2.3.2) that would be applicable to the Cardigan Village WWTP are 700 m for facultative ponds, 350 m for aerobic pondage systems (being the aerobic pond, maturation pond, and winter storage pond), and 200 m for effluent application to land by spraying.
The boundary formed by these distances is shown in Figure 3.3. The figure also shows the boundary of the land zoned “PUZ1” (Public Use Zone Service and Utility) which is taken to be the site boundary for assessment of odour dispersion against the 1 OU criteria in SEPP (AQM) (refer Section 2.2 above).
Ballarat WWTP Odour Buffer Distances
3552322/100 Beca Page 10 R1:62014-TJF65R04 - Rev 1.DOC Rev 1 23 January 2007
Figure 3.3: Buffer distances for Cardigan Village WWTP according to AQ 2/86.
3.2 Ballarat North WWTP
3.2.1 Location and Existing Treatment Processes
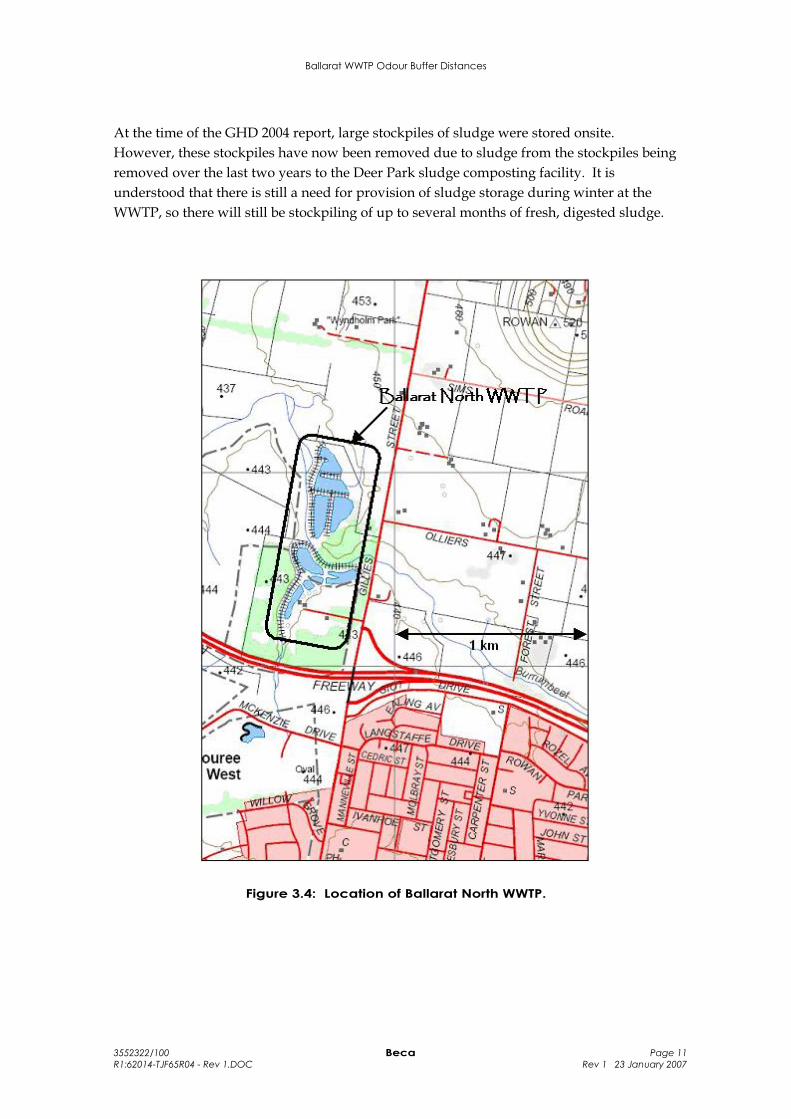
The Ballarat North WWTP is located on Gillies Street, immediately to the north of the Western Freeway approximately 2 km east of the Ballarat airport. The location of the plant is shown in Figure 3.4.
The GHD 2004 report on the WWTP (refer Section 1.2 for list of references) describes the plant layout and design capacity. At the time of publishing of that report (April 2004), the plant received both domestic effluent with an e.p. of about 15,000, and industrial effluent with an e.p. of about 20,000.
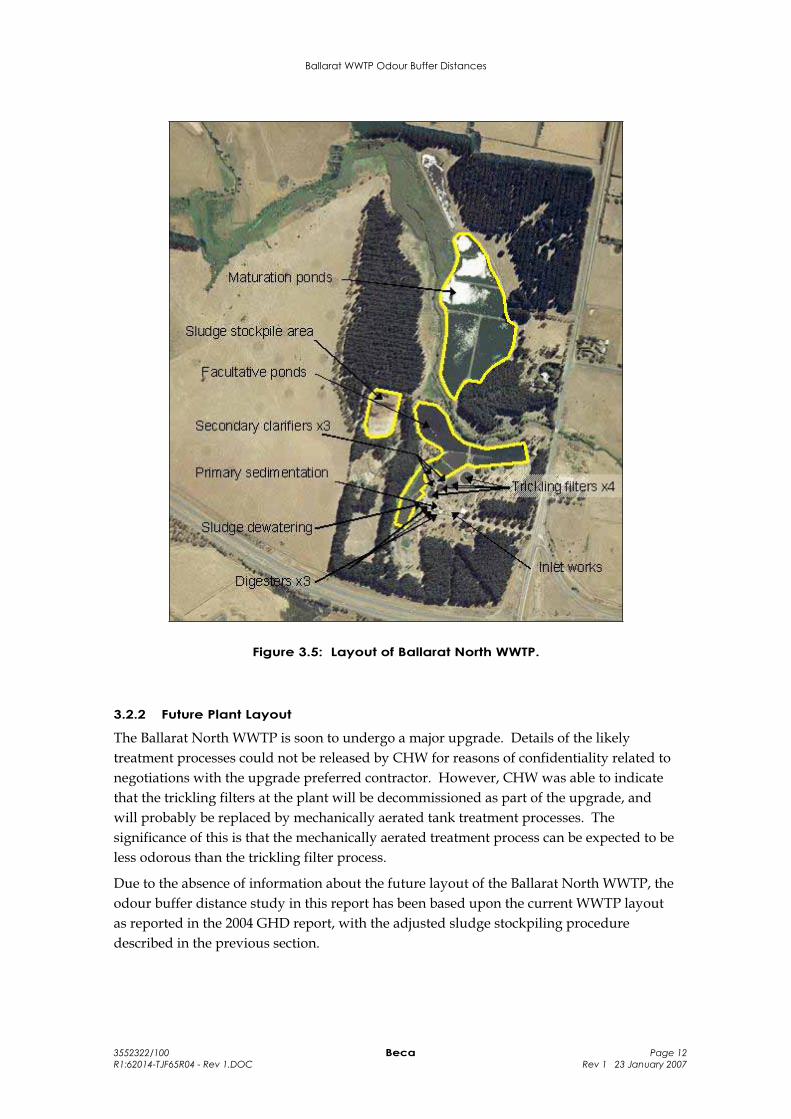
The site layout for the current plant is shown in Figure 3.5. The WWTP includes various treatment processes including primary, secondary, and tertiary processes, as well as lagoons for effluent polishing and disinfection, and anaerobic digesters for sludge treatment.
Ballarat WWTP Odour Buffer Distances
3552322/100 Beca Page 11 R1:62014-TJF65R04 - Rev 1.DOC Rev 1 23 January 2007
At the time of the GHD 2004 report, large stockpiles of sludge were stored onsite. However, these stockpiles have now been removed due to sludge from the stockpiles being removed over the last two years to the Deer Park sludge composting facility. It is understood that there is still a need for provision of sludge storage during winter at the WWTP, so there will still be stockpiling of up to several months of fresh, digested sludge.
Figure 3.4: Location of Ballarat North WWTP.
Ballarat WWTP Odour Buffer Distances
3552322/100 Beca Page 12 R1:62014-TJF65R04 - Rev 1.DOC Rev 1 23 January 2007
Figure 3.5: Layout of Ballarat North WWTP.
3.2.2 Future Plant Layout
The Ballarat North WWTP is soon to undergo a major upgrade. Details of the likely treatment processes could not be released by CHW for reasons of confidentiality related to negotiations with the upgrade preferred contractor. However, CHW was able to indicate that the trickling filters at the plant will be decommissioned as part of the upgrade, and will probably be replaced by mechanically aerated tank treatment processes. The significance of this is that the mechanically aerated treatment process can be expected to be less odorous than the trickling filter process.
Due to the absence of information about the future layout of the Ballarat North WWTP, the odour buffer distance study in this report has been based upon the current WWTP layout as reported in the 2004 GHD report, with the adjusted sludge stockpiling procedure described in the previous section.
Ballarat WWTP Odour Buffer Distances
3552322/100 Beca Page 13 R1:62014-TJF65R04 - Rev 1.DOC Rev 1 23 January 2007
3.2.3 Application of AQ 2/86 buffer distances to Ballarat North WWTP
The buffer distances in AQ 2/86 (see Section 2.3.2) that would be applicable to the Ballarat North WWTP for an e.p. of <50,000 are 400 m for mechanical/biological wastewater plants, 1000 m for aerobic pondage systems, and 2200 m for facultative ponds.
The processes at the plant are considered to be a hybrid of mechanical/biological and aerobic pondage systems. The facultative pond installation classification from AQ 2/86 is not considered to be applicable because most of the biological load from the wastewater is treated by mechanical/biological means prior to discharge to the ponds.
The GHD 2004 report on odour modelling from the Ballarat North WWTP provides useful discussion on the applicability of the AQ 2/86 odour buffer distances. Beca agrees with this discussion which is provided below:
It is clear that the existing buffer in the [Ballarat Planning Scheme Map No. 12ESO] was obtained by characterising Ballarat North WWTP as a ‘Mechanical/Biological’ plant – in which case the relevant distance is 400 m. This interpretation would be valid if the maturation lagoons were providing disinfection only, and were not a significant odour source. However, as shown in the GHD surveys the lagoons are a significant odour source.
An alternate interpretation is to classify the plant as an ‘aerobic pondage system’; serving an e.p. of >20000 and less than 50000. This interpretation is valid if the maturation lagoons are providing treatment as well as disinfection.
It could be argued that the 1000m buffer was only intended for a WWTP that relied only on lagoon treatment – i.e. one that did not have mechanical/biological pre-treatment as does the Ballarat North WWTP.
In hindsight, the buffer distances should probably have been interpreted so that the current operation of the plant would attract a buffer distance that is intermediate between these two values.
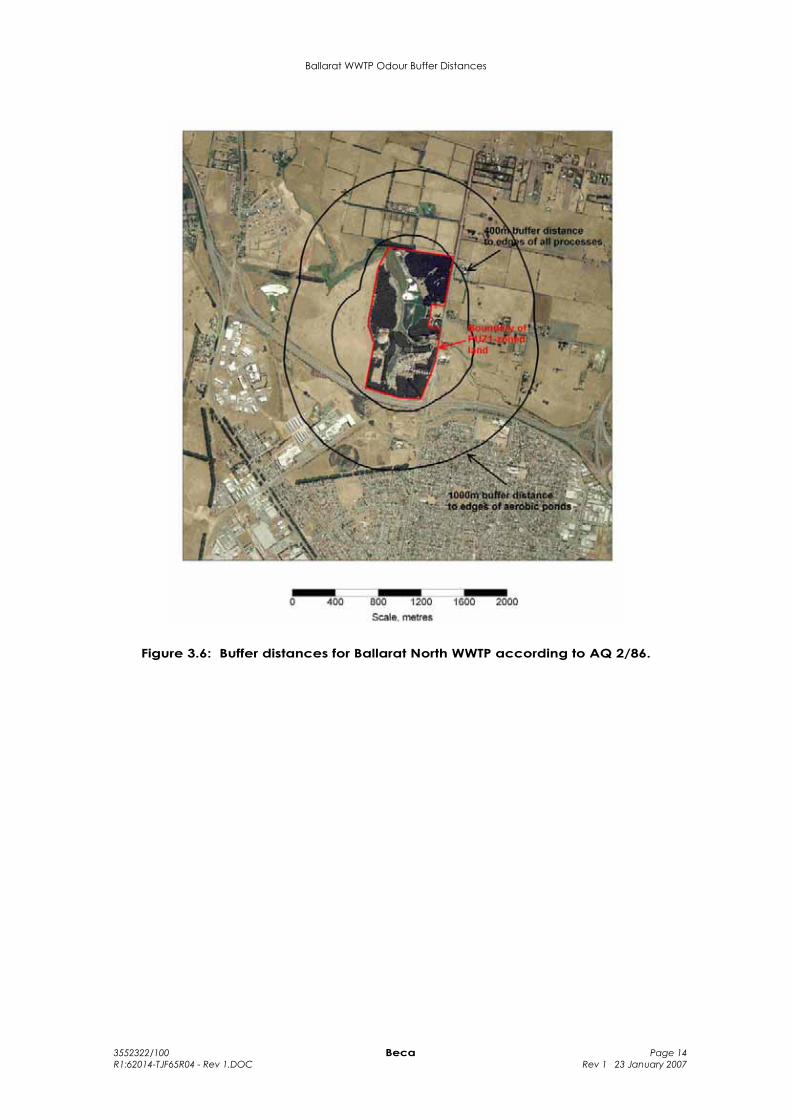
The boundary formed by the 400 m and 1000 m buffer distances is shown in Figure 3.6. The figure also shows the boundary of the land zoned “PUZ1” (Public Use Zone Service and Utility) which is taken to be the site boundary for assessment of odour dispersion against the 1 OU criteria in SEPP (AQM) (refer Section 2.2 above).
The 1000 m buffer extends into residential areas to the southeast of the WWTP. However, there is no known incidence of odour effect due to the WWTP in this suburb.
Ballarat WWTP Odour Buffer Distances
3552322/100 Beca Page 14 R1:62014-TJF65R04 - Rev 1.DOC Rev 1 23 January 2007
Figure 3.6: Buffer distances for Ballarat North WWTP according to AQ 2/86.
Ballarat WWTP Odour Buffer Distances
3552322/100 Beca Page 15 R1:62014-TJF65R04 - Rev 1.DOC Rev 1 23 January 2007
3.3 Ballarat South WWTP
3.3.1 Location and Existing Treatment Processes
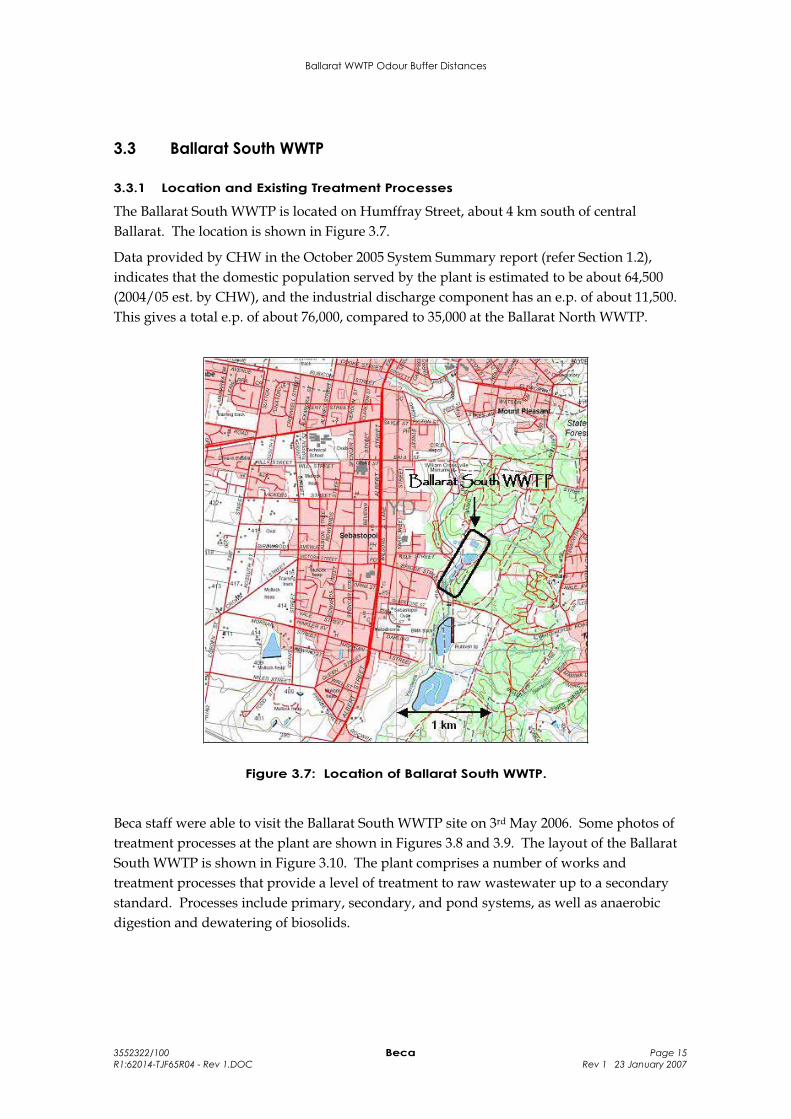
The Ballarat South WWTP is located on Humffray Street, about 4 km south of central Ballarat. The location is shown in Figure 3.7.
Data provided by CHW in the October 2005 System Summary report (refer Section 1.2), indicates that the domestic population served by the plant is estimated to be about 64,500 (2004/05 est. by CHW), and the industrial discharge component has an e.p. of about 11,500. This gives a total e.p. of about 76,000, compared to 35,000 at the Ballarat North WWTP.
Figure 3.7: Location of Ballarat South WWTP.
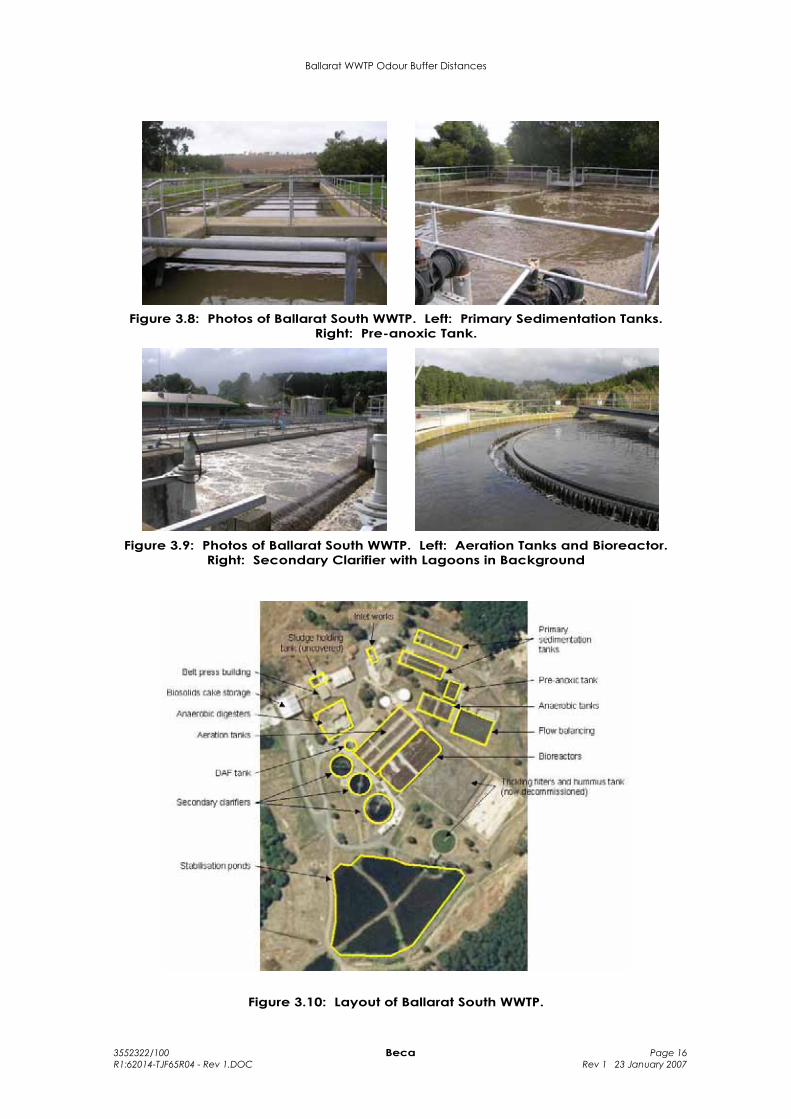
Beca staff were able to visit the Ballarat South WWTP site on 3rd May 2006. Some photos of treatment processes at the plant are shown in Figures 3.8 and 3.9. The layout of the Ballarat South WWTP is shown in Figure 3.10. The plant comprises a number of works and treatment processes that provide a level of treatment to raw wastewater up to a secondary standard. Processes include primary, secondary, and pond systems, as well as anaerobic digestion and dewatering of biosolids.
Ballarat WWTP Odour Buffer Distances
3552322/100 Beca Page 16 R1:62014-TJF65R04 - Rev 1.DOC Rev 1 23 January 2007
Figure 3.8: Photos of Ballarat South WWTP. Left: Primary Sedimentation Tanks. Right: Pre-anoxic Tank.
Figure 3.9: Photos of Ballarat South WWTP. Left: Aeration Tanks and Bioreactor. Right: Secondary Clarifier with Lagoons in Background
Figure 3.10: Layout of Ballarat South WWTP.

Ballarat WWTP Odour Buffer Distances
3552322/100 Beca Page 17 R1:62014-TJF65R04 - Rev 1.DOC Rev 1 23 January 2007
3.3.2 Potential Future Plant Expansion
The Ballarat South WWTP is due for an upgrade for capacity expansion in approximately the year 2015. The plant has been designed to allow for duplication of the aeration basins, and it is understood that these would be located in the current position of the now-decommissioned trickling filters.
In the “future” odour model for the WWTP, Beca has assumed the commissioning of one additional aeration tank, one additional bioreactor, and one additional secondary clarifier, in the layout showed in Figure 3.11. It is noted that the odour model would not be sensitive to the exact location of these tanks within a few tens of metres.
Figure 3.11: Assumed position of additional treatment processes after future plant expansion – Ballarat South WWTP.
Ballarat WWTP Odour Buffer Distances
3552322/100 Beca Page 18 R1:62014-TJF65R04 - Rev 1.DOC Rev 1 23 January 2007
3.3.3 Application of AQ 2/86 buffer distances to Ballarat South WWTP
It is considered that the processes at the Ballarat South WWTP represent a ‘mechanical/biological’ treatment system, and that the lagoons provide little additional treatment to the wastewater. Although the actual performance of the plant has not been reviewed, the mechanical/biological treatment system should reduce both the organic load and the ammonia load in the wastewater. Hence a good quality effluent with low oxygen demand should be being discharged to the lagoons. Therefore it is not considered appropriate to apply buffer distances for the ‘aerobic pondage system’ classification to the Ballarat South WWTP.
The Ballarat South WWTP has a current e.p. of about 76,000, and therefore does not fall within any of the categories for buffer distances in AQ 2/86 which apply only to WWTPs up to an e.p. of 50,000. Therefore, according to the guidance in AQ 2/86 a suitable buffer distance for this WWTP would be determined through consultation with EPA Victoria.
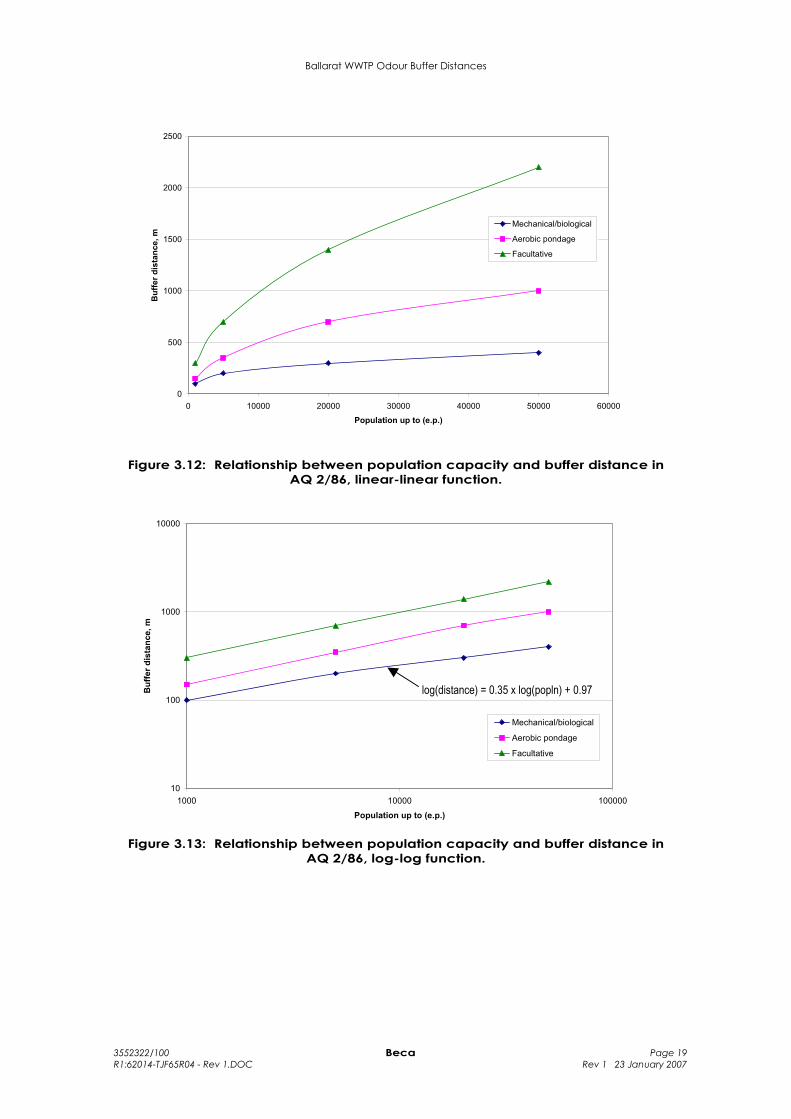
It is noted that the buffer distances do not increase in direct proportion with e.p. in the table in AQ 2/86 (refer Section 2.3.2 above for copy of table). This relationship is typical of buffer distance recommendations as dispersion improves exponentially with increasing distance from the source of the odour. To illustrate, Figures 3.12 and 3.13 show the separation distances in AQ 2/86 graphed as both linear and logarithm functions of population. The function appears linear for the “log-log” graph of population versus separation distance. This function could be used to estimate a possible buffer distance for a larger WWTP, although it is noted that this approach is not suggested by EPA Victoria.
Extrapolating the linear curve for the ‘mechanical/biological’ treatment plant yields a separation distance of 490 m for an e.p. of 80,000. For the purposes of this report this separation distance is rounded to 500 m. However this approach is not a standard assessment method and the 500 m distance is only used as a starting point for comparison with the buffer distance recommended from the dispersion modelling.
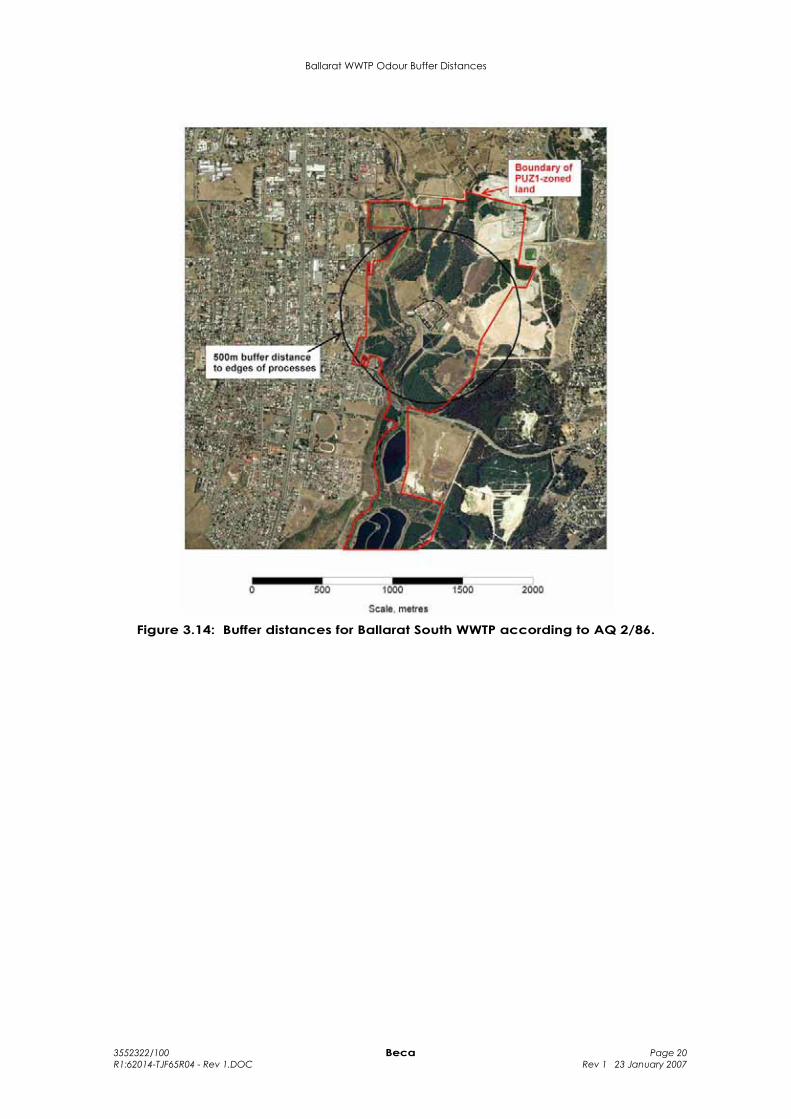
Figure 3.14 shows a buffer distance of 500 m around the treatment processes at the WWTP, excluding the lagoons. The figure also shows the boundary of the land zoned “PUZ1” (Public Use Zone Service and Utility) which is taken to be the site boundary for assessment of odour dispersion against the 1 OU criteria in SEPP (AQM) (refer Section 2.2 above).
Ballarat WWTP Odour Buffer Distances
3552322/100 Beca Page 19 R1:62014-TJF65R04 - Rev 1.DOC Rev 1 23 January 2007
0
500
1000
1500
2000
2500
0 10000 20000 30000 40000 50000 60000
Population up to (e.p.)
Buf
fer d
ista
nce,
m
Mechanical/biological
Aerobic pondage
Facultative
Figure 3.12: Relationship between population capacity and buffer distance in AQ 2/86, linear-linear function.
10
100
1000
10000
1000 10000 100000
Population up to (e.p.)
Buf
fer d
ista
nce,
m
Mechanical/biological
Aerobic pondage
Facultative
Figure 3.13: Relationship between population capacity and buffer distance in AQ 2/86, log-log function.
log(distance) = 0.35 x log(popln) + 0.97
Ballarat WWTP Odour Buffer Distances
3552322/100 Beca Page 20 R1:62014-TJF65R04 - Rev 1.DOC Rev 1 23 January 2007
Figure 3.14: Buffer distances for Ballarat South WWTP according to AQ 2/86.
Ballarat WWTP Odour Buffer Distances
3552322/100 Beca Page 21 R1:62014-TJF65R04 - Rev 1.DOC Rev 1 23 January 2007
4 Meteorology
4.1 Ballarat Airport Meteorology The Bureau of Meteorology (BOM) was consulted regarding availability of meteorological data in proximity to the three WWTPs. The only available data with records of wind speed and direction is from Ballarat Aerodrome, which is about 3 km west of the Ballarat North WWTP. Hourly records of wind speed and direction for Ballarat Aerodrome were purchased from BOM for the period July 2000 to May 2006, giving a total of 50747 hourly records.
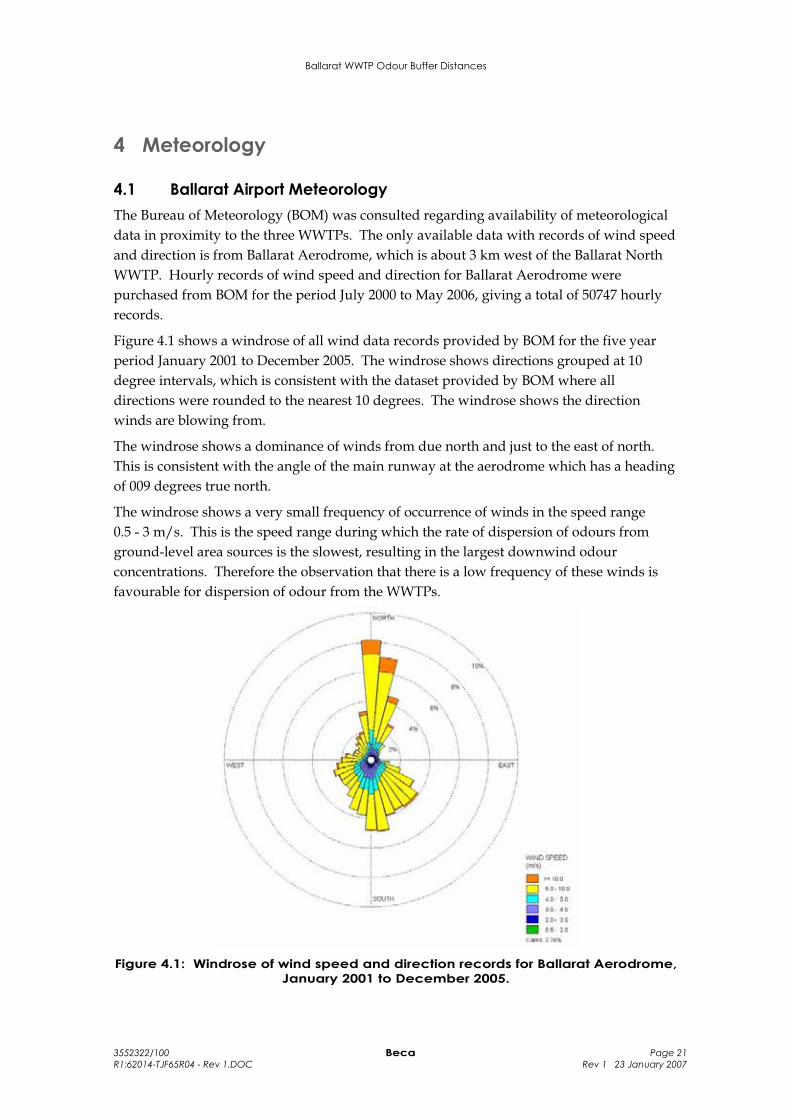
Figure 4.1 shows a windrose of all wind data records provided by BOM for the five year period January 2001 to December 2005. The windrose shows directions grouped at 10 degree intervals, which is consistent with the dataset provided by BOM where all directions were rounded to the nearest 10 degrees. The windrose shows the direction winds are blowing from.
The windrose shows a dominance of winds from due north and just to the east of north. This is consistent with the angle of the main runway at the aerodrome which has a heading of 009 degrees true north.
The windrose shows a very small frequency of occurrence of winds in the speed range 0.5 - 3 m/s. This is the speed range during which the rate of dispersion of odours from ground-level area sources is the slowest, resulting in the largest downwind odour concentrations. Therefore the observation that there is a low frequency of these winds is favourable for dispersion of odour from the WWTPs.
Figure 4.1: Windrose of wind speed and direction records for Ballarat Aerodrome, January 2001 to December 2005.
Ballarat WWTP Odour Buffer Distances
3552322/100 Beca Page 22 R1:62014-TJF65R04 - Rev 1.DOC Rev 1 23 January 2007
The legend on Figure 4.1 notes that “calm” winds occurred 2.76% of the time. The definition of “calm” wind in this context is wind speed less than 0.5 m/s. The data file for 2001 to 2005 contains a total of 42525 records, with 1172 of these records having both direction and speed equals “0”. This may indicate a true calm condition with wind speed less than the recording threshold of the anemometer device.
4.2 Meteorological Data File for Dispersion Model EPA Victoria provided a meteorological data file for Ballarat, formatted for input to the Ausplume dispersion model. The data file is based on wind records from Ballarat Aerodrome for the year 2000, and contains 8328 hourly records (i.e. missing 19 days of data from the year). Direction data in the file is not rounded to the nearest ten degrees.
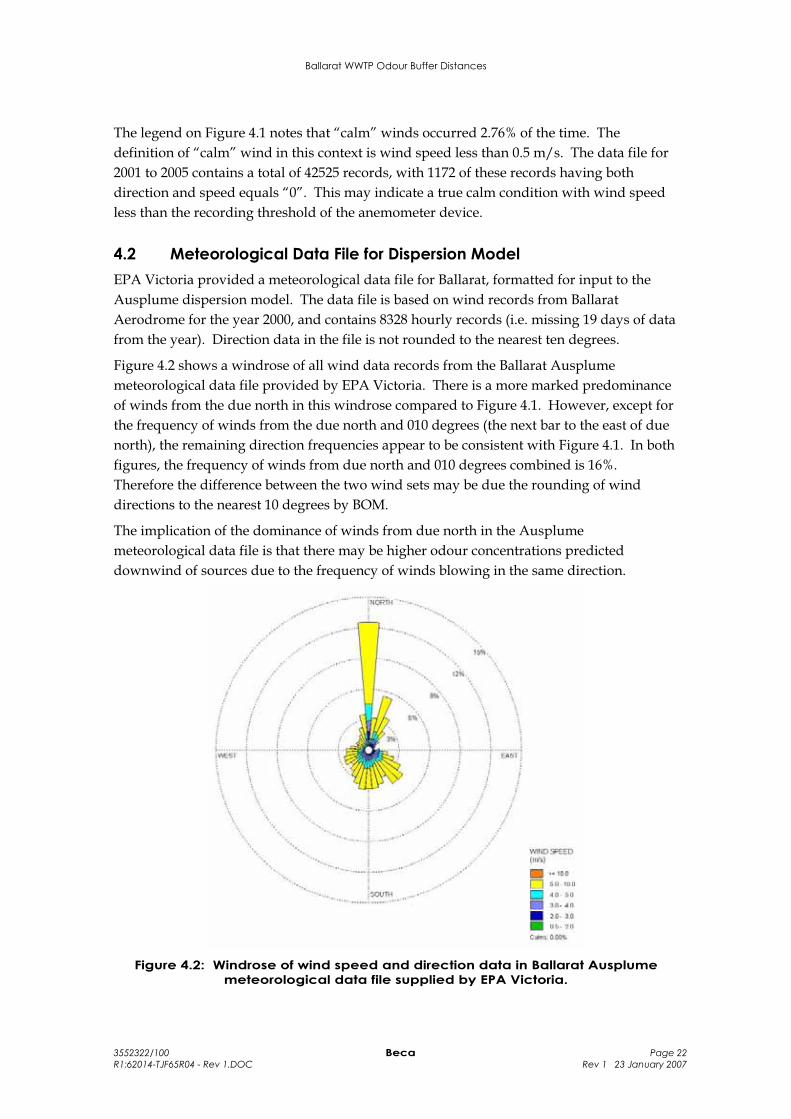
Figure 4.2 shows a windrose of all wind data records from the Ballarat Ausplume meteorological data file provided by EPA Victoria. There is a more marked predominance of winds from the due north in this windrose compared to Figure 4.1. However, except for the frequency of winds from the due north and 010 degrees (the next bar to the east of due north), the remaining direction frequencies appear to be consistent with Figure 4.1. In both figures, the frequency of winds from due north and 010 degrees combined is 16%. Therefore the difference between the two wind sets may be due the rounding of wind directions to the nearest 10 degrees by BOM.
The implication of the dominance of winds from due north in the Ausplume meteorological data file is that there may be higher odour concentrations predicted downwind of sources due to the frequency of winds blowing in the same direction.
Figure 4.2: Windrose of wind speed and direction data in Ballarat Ausplume meteorological data file supplied by EPA Victoria.
Ballarat WWTP Odour Buffer Distances
3552322/100 Beca Page 23 R1:62014-TJF65R04 - Rev 1.DOC Rev 1 23 January 2007
5 Description of Odour Sources and Estimate of Odour Emission Rates
5.1 Cardigan Village WWTP
5.1.1 Odour Sources
The odour sources at the Cardigan Village WWTP which are included in the dispersion model are as follows:
EXISTING SOURCES Screen and sump approx. 3 m2 surface area 2x facultative ponds 1x aerobic pond 1x maturation pond
POTENTIAL ADDITIONAL FUTURE SOURCES 1x winter storage pond
As discussed in Section 3.1, the effluent irrigation area has not been included in the dispersion model.
5.1.2 Specific Odour Emission Rates (SOERs)
Beca has experience with measurement of specific odour emission rates (SOERs) from facultative pond and maturation pond systems in several cities and towns in New Zealand where ambient conditions are similar to the Ballarat area. The term ‘SOER’ refers to an odour emission rate discharged from a unit area of a source, i.e. the odour emission rate per square metre of surface.
The units of SOERs utilised for surface area sources in this report are derived from the calculation of the SOER, which is as follows:
‘odour units per cubic metre (concentration of sampled air)’ x ‘volumetric flush rate (of sampling hood device)’ divided by ‘area of sampled surface’.
This gives a unit for odour emission of [OU] x [m3/s] / [m2], which simplifies to OU.m/s
It is noted that odour emission rates in the GHD 2004 report are quoted ‘per minute’ rather than ‘per second’. However it is Beca’s usual convention to express odour emission rates per second.
Beca’s experience of typical odour emission rates from facultative ponds and maturation ponds in New Zealand are as follows:
Lightly loaded facultative ponds: 0.04 – 0.06 OU.m/s
Fully loaded/overloaded facultative ponds: 0.1 - 0.2 OU.m/s
Maturation ponds: 0.04 – 0.05 OU.m/s
Ballarat WWTP Odour Buffer Distances
3552322/100 Beca Page 24 R1:62014-TJF65R04 - Rev 1.DOC Rev 1 23 January 2007
These SOERs were collected using techniques equivalent to the odour analysis standard AS/NZS 4323.3-2001. The quoted SOERs for the lightly loaded facultative ponds and maturation ponds may be overestimated due to the measurements being close to the lower detection limit (LDL) for the olfactometry device.
In the GHD 2004 report, the following SOERs were determined for ponds at the Ballarat North WWTP (summer measurements, based on a small set of single samples):
Facultative ponds: 0.01 – 0.04 OU.m/s
Maturation ponds: 0.01 OU.m/s
The BOD loading on the facultative ponds at the Ballarat North WWTP is not known, but the ponds are assumed to be lightly loaded due to the pre-treatment from the trickling filters. The SOERs reported in the GHD 2004 report are lower than the SOERs previously measured in Beca’s experience. This may be due to the comparative loading on the ponds, or some other quality of the wastewater, or it may be due to the different sample collection method in the testing in the GHD 2004 report which results in lower SOERs being calculated for the same measured sample odour concentration.
In addition, it is noted that only one sample was collected from each pond in the Ballarat North WWTP sampling. Most of the sampling programmes for facultative ponds and maturation ponds undertaken by Beca involve a larger number of samples, and it has been found that SOERs can vary considerably across the surface of a pond on any particular day and also from day to day.
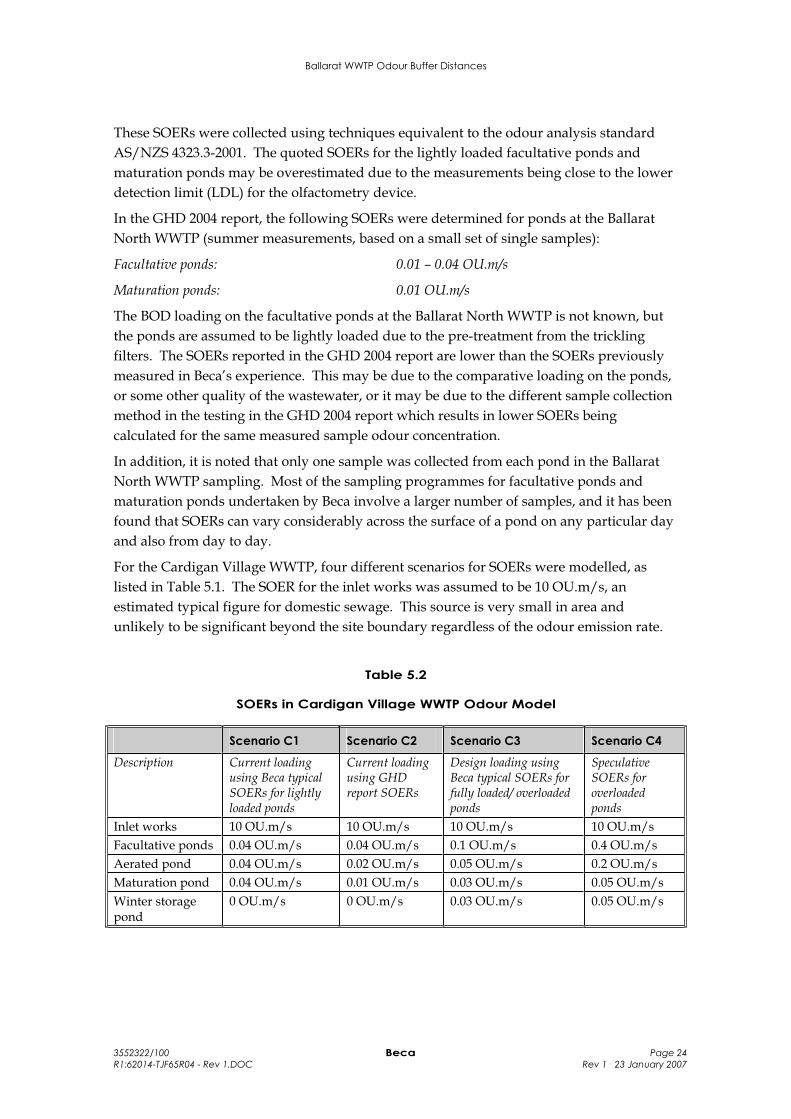
For the Cardigan Village WWTP, four different scenarios for SOERs were modelled, as listed in Table 5.1. The SOER for the inlet works was assumed to be 10 OU.m/s, an estimated typical figure for domestic sewage. This source is very small in area and unlikely to be significant beyond the site boundary regardless of the odour emission rate.
Table 5.2
SOERs in Cardigan Village WWTP Odour Model
Scenario C1 Scenario C2 Scenario C3 Scenario C4
Description Current loading using Beca typical SOERs for lightly loaded ponds
Current loading using GHD report SOERs
Design loading using Beca typical SOERs for fully loaded/ overloaded ponds
Speculative SOERs for overloaded ponds
Inlet works 10 OU.m/s 10 OU.m/s 10 OU.m/s 10 OU.m/s Facultative ponds 0.04 OU.m/s 0.04 OU.m/s 0.1 OU.m/s 0.4 OU.m/s Aerated pond 0.04 OU.m/s 0.02 OU.m/s 0.05 OU.m/s 0.2 OU.m/s Maturation pond 0.04 OU.m/s 0.01 OU.m/s 0.03 OU.m/s 0.05 OU.m/s Winter storage pond
0 OU.m/s 0 OU.m/s 0.03 OU.m/s 0.05 OU.m/s
Ballarat WWTP Odour Buffer Distances
3552322/100 Beca Page 25 R1:62014-TJF65R04 - Rev 1.DOC Rev 1 23 January 2007
5.2 Ballarat North WWTP
5.2.1 Odour Sources
The odour sources at the Ballarat North WWTP which are included in the dispersion model are as follows:
Inlet works 2x primary sedimentation tanks (PSTs) 4x trickling filters 1x sump for sludge storage prior to belt press Belt press building Lagoon 2, lagoon 3, and stabilisation lagoon New sludge storage pile Intermediate sludge storage pile
The area of the various sources was taken from the GHD 2004 report. The areas of the lagoons were verified against measurements from an aerial photograph provided by CHW. The locations of all of the sources were taken from the aerial photograph.
Compared to the dispersion model methodology in the GHD 2004 report, the methodology in this report differs in several ways, as follows:
Areas of ponds simplified to a number of square area sources
Areas of inlet works, PSTs, trickling filters, “new” sludge and “intermediate” sludge also simplified to equivalent square area sources
Area of “old” sludge removed as no longer stockpiled on-site
Small correction to SOERs for trickling filter 1 for spring (appeared to be error in GHD model, not expected to have a significant impact on the modelling results)
Correction to SOERs for sludge stockpiles to reflect same values as measured (SOERs in GHD model were different values)
5.2.2 Specific Odour Emission Rates (SOERs)
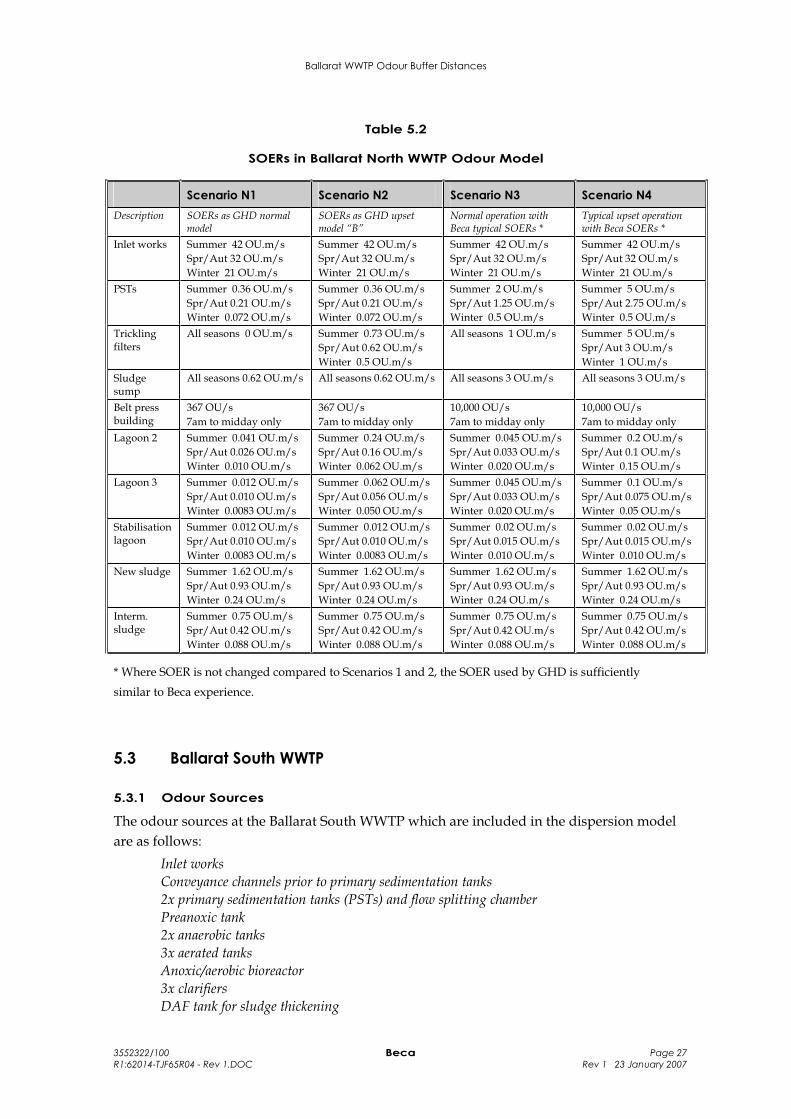
For the Ballarat North WWTP, four different scenarios for SOERs were modelled, as listed in Table 5.2. The first two scenarios used the GHD SOERs with the WWTP in “normal” and “upset” mode. The upset mode used from the GHD 2004 report was the condition identified as “Scenario B” in that report, being caused by peak industry trade waste loading to the WWTP occurring approximately once per year. The second two scenarios used Beca typical SOERs with the same normal and upset plant operation modes.
Table 5.2 shows some large differences between SOERs for the GHD and Beca models for several sources. Discussion on these differences is provided below:
Belt press building. Beca’s odour emission rate is based on tests at two belt press buildings where air from the building is ventilated to atmosphere in a controlled manner. The two odour emission rates have been reduced based on the comparative e.p.’s of the WWTPs to estimate the potential odour emission rate from the plant. Belt
Ballarat WWTP Odour Buffer Distances
3552322/100 Beca Page 26 R1:62014-TJF65R04 - Rev 1.DOC Rev 1 23 January 2007
press buildings can be a significant source of odour at WWTPs and the trend is towards control and treatment of odour from these processes.
Trickling filters. Trickling filters in large WWTP installations have often been associated with substantial odour emissions. It is difficult to measure odour emissions from these surfaces due to the mechanical action of the rotor arms and the high rate of air flow through the filters. In 1996 a method was devised to test odour emission from trickling filters at a WWTP where the filters were an obvious source of substantial quantities of odour. Depending on the day when sampling was carried out, measured SOERs were highly variable and overall SOERs in the range of 1 – 100 OU.m/s were measured on various occasions. The dispersion modelling results from these emissions were consistent with noted odour observations on the site and beyond the WWTP boundaries. In the case of the Ballarat North WWTP, the odour sampling in the GHD 2004 report did not measure any odour emissions above background. The method of sampling was to measure the concentration of ambient air above the filters rather than to collect a surface odour emission rate. It was also observed that there was no apparent odour emission from the filters at the time. It is not known if this is the normal operation condition for these filters, or whether they can emit a noticeable odour at times. For the Beca “normal operation” model, it was assumed that some odour is discharged from the filters and a moderate odour emission rate of 1 OU.m/s was taken. For the “upset” operation, an elevated odour emission rate of 5 OU.m/s was assumed.
PSTs. The PST emission rates documented in the GHD 2004 report are an order of magnitude less than sampling on other PSTs in Beca’s experience. The SOERs for the PSTs used by GHD also appear to be low compared to the SOER measured for the inlet works which is more consistent with Beca’s experience. It was considered prudent to model an increased SOER from the PSTs in the Beca models.
Ballarat WWTP Odour Buffer Distances
3552322/100 Beca Page 27 R1:62014-TJF65R04 - Rev 1.DOC Rev 1 23 January 2007
Table 5.2
SOERs in Ballarat North WWTP Odour Model
Scenario N1 Scenario N2 Scenario N3 Scenario N4 Description SOERs as GHD normal
model SOERs as GHD upset model “B”
Normal operation with Beca typical SOERs *
Typical upset operation with Beca SOERs *
Inlet works Summer 42 OU.m/s Spr/Aut 32 OU.m/s Winter 21 OU.m/s
Summer 42 OU.m/s Spr/Aut 32 OU.m/s Winter 21 OU.m/s
Summer 42 OU.m/s Spr/Aut 32 OU.m/s Winter 21 OU.m/s
Summer 42 OU.m/s Spr/Aut 32 OU.m/s Winter 21 OU.m/s
PSTs Summer 0.36 OU.m/s Spr/Aut 0.21 OU.m/s Winter 0.072 OU.m/s
Summer 0.36 OU.m/s Spr/Aut 0.21 OU.m/s Winter 0.072 OU.m/s
Summer 2 OU.m/s Spr/Aut 1.25 OU.m/s Winter 0.5 OU.m/s
Summer 5 OU.m/s Spr/Aut 2.75 OU.m/s Winter 0.5 OU.m/s
Trickling filters
All seasons 0 OU.m/s Summer 0.73 OU.m/s Spr/Aut 0.62 OU.m/s Winter 0.5 OU.m/s
All seasons 1 OU.m/s Summer 5 OU.m/s Spr/Aut 3 OU.m/s Winter 1 OU.m/s
Sludgesump
All seasons 0.62 OU.m/s All seasons 0.62 OU.m/s All seasons 3 OU.m/s All seasons 3 OU.m/s
Belt press building
367 OU/s 7am to midday only
367 OU/s 7am to midday only
10,000 OU/s 7am to midday only
10,000 OU/s 7am to midday only
Lagoon 2 Summer 0.041 OU.m/s Spr/Aut 0.026 OU.m/s Winter 0.010 OU.m/s
Summer 0.24 OU.m/s Spr/Aut 0.16 OU.m/s Winter 0.062 OU.m/s
Summer 0.045 OU.m/s Spr/Aut 0.033 OU.m/s Winter 0.020 OU.m/s
Summer 0.2 OU.m/s Spr/Aut 0.1 OU.m/s Winter 0.15 OU.m/s
Lagoon 3 Summer 0.012 OU.m/s Spr/Aut 0.010 OU.m/s Winter 0.0083 OU.m/s
Summer 0.062 OU.m/s Spr/Aut 0.056 OU.m/s Winter 0.050 OU.m/s
Summer 0.045 OU.m/s Spr/Aut 0.033 OU.m/s Winter 0.020 OU.m/s
Summer 0.1 OU.m/s Spr/Aut 0.075 OU.m/s Winter 0.05 OU.m/s
Stabilisation lagoon
Summer 0.012 OU.m/s Spr/Aut 0.010 OU.m/s Winter 0.0083 OU.m/s
Summer 0.012 OU.m/s Spr/Aut 0.010 OU.m/s Winter 0.0083 OU.m/s
Summer 0.02 OU.m/s Spr/Aut 0.015 OU.m/s Winter 0.010 OU.m/s
Summer 0.02 OU.m/s Spr/Aut 0.015 OU.m/s Winter 0.010 OU.m/s
New sludge Summer 1.62 OU.m/s Spr/Aut 0.93 OU.m/s Winter 0.24 OU.m/s
Summer 1.62 OU.m/s Spr/Aut 0.93 OU.m/s Winter 0.24 OU.m/s
Summer 1.62 OU.m/s Spr/Aut 0.93 OU.m/s Winter 0.24 OU.m/s
Summer 1.62 OU.m/s Spr/Aut 0.93 OU.m/s Winter 0.24 OU.m/s
Interm.sludge
Summer 0.75 OU.m/s Spr/Aut 0.42 OU.m/s Winter 0.088 OU.m/s
Summer 0.75 OU.m/s Spr/Aut 0.42 OU.m/s Winter 0.088 OU.m/s
Summer 0.75 OU.m/s Spr/Aut 0.42 OU.m/s Winter 0.088 OU.m/s
Summer 0.75 OU.m/s Spr/Aut 0.42 OU.m/s Winter 0.088 OU.m/s
* Where SOER is not changed compared to Scenarios 1 and 2, the SOER used by GHD is sufficiently similar to Beca experience.
5.3 Ballarat South WWTP
5.3.1 Odour Sources
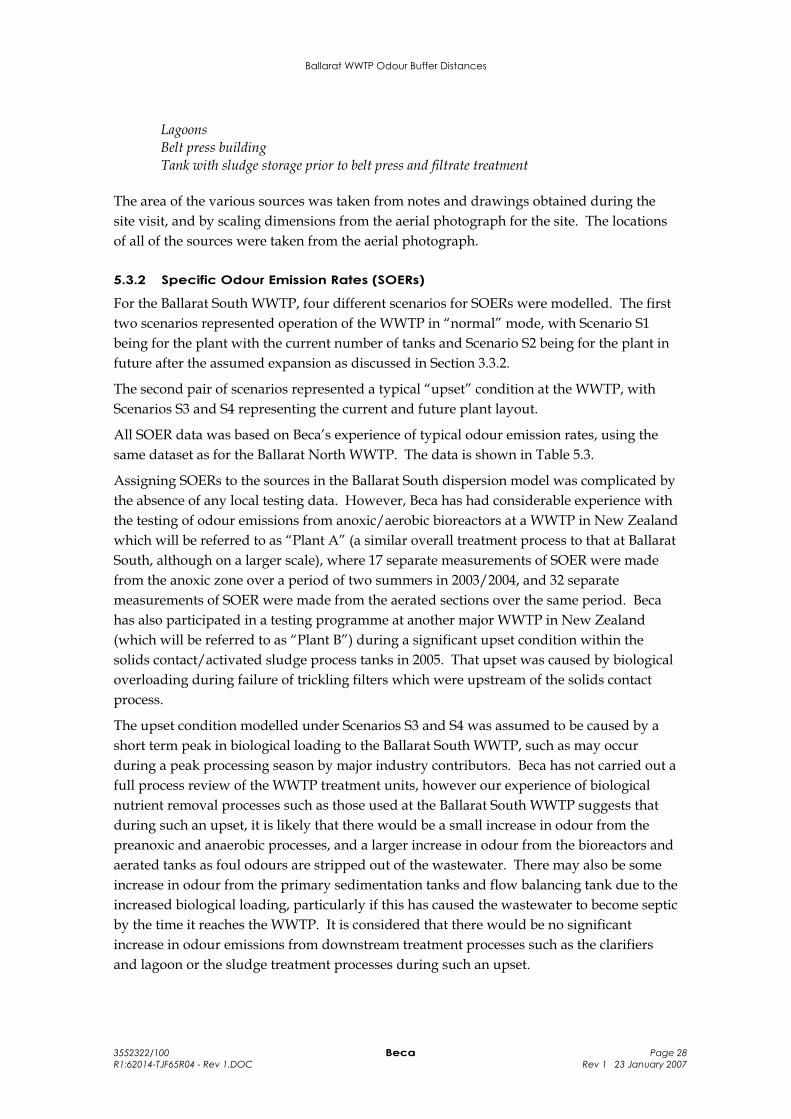
The odour sources at the Ballarat South WWTP which are included in the dispersion model are as follows:
Inlet works Conveyance channels prior to primary sedimentation tanks 2x primary sedimentation tanks (PSTs) and flow splitting chamber Preanoxic tank 2x anaerobic tanks 3x aerated tanks Anoxic/aerobic bioreactor 3x clarifiers DAF tank for sludge thickening
Ballarat WWTP Odour Buffer Distances
3552322/100 Beca Page 28 R1:62014-TJF65R04 - Rev 1.DOC Rev 1 23 January 2007
LagoonsBelt press building Tank with sludge storage prior to belt press and filtrate treatment
The area of the various sources was taken from notes and drawings obtained during the site visit, and by scaling dimensions from the aerial photograph for the site. The locations of all of the sources were taken from the aerial photograph.
5.3.2 Specific Odour Emission Rates (SOERs)
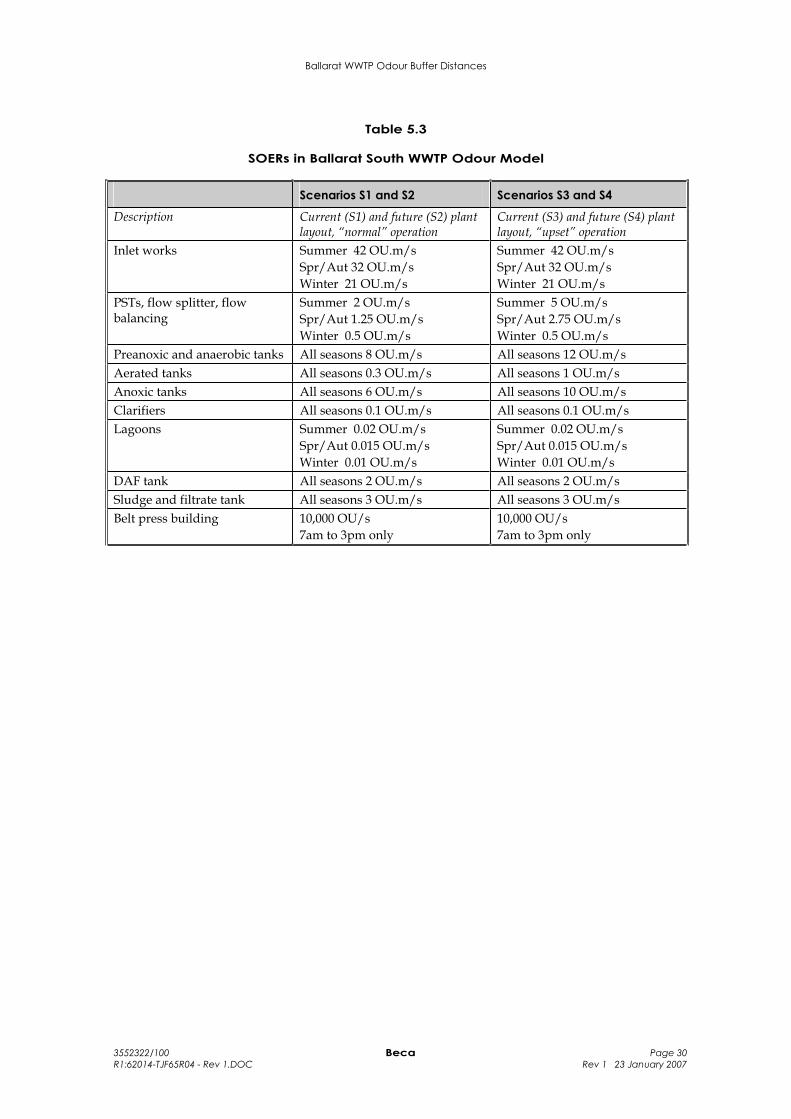
For the Ballarat South WWTP, four different scenarios for SOERs were modelled. The first two scenarios represented operation of the WWTP in “normal” mode, with Scenario S1 being for the plant with the current number of tanks and Scenario S2 being for the plant in future after the assumed expansion as discussed in Section 3.3.2.
The second pair of scenarios represented a typical “upset” condition at the WWTP, with Scenarios S3 and S4 representing the current and future plant layout.
All SOER data was based on Beca’s experience of typical odour emission rates, using the same dataset as for the Ballarat North WWTP. The data is shown in Table 5.3.
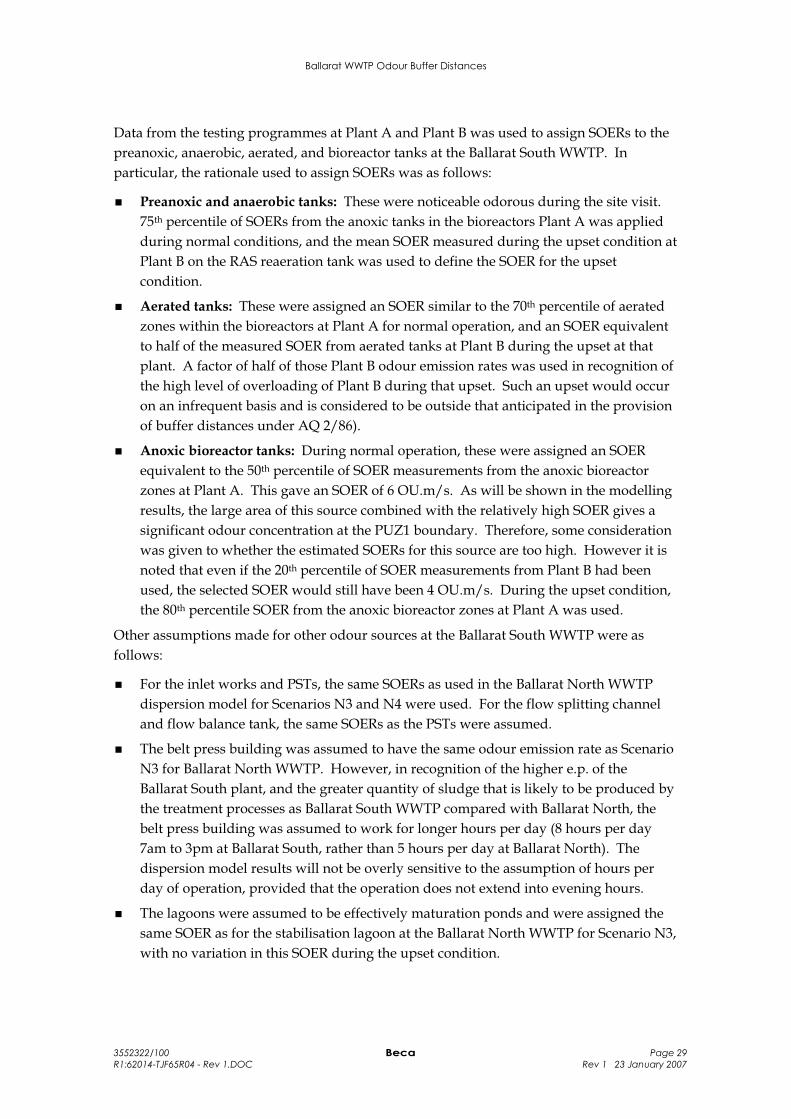
Assigning SOERs to the sources in the Ballarat South dispersion model was complicated by the absence of any local testing data. However, Beca has had considerable experience with the testing of odour emissions from anoxic/aerobic bioreactors at a WWTP in New Zealand which will be referred to as “Plant A” (a similar overall treatment process to that at Ballarat South, although on a larger scale), where 17 separate measurements of SOER were made from the anoxic zone over a period of two summers in 2003/2004, and 32 separate measurements of SOER were made from the aerated sections over the same period. Beca has also participated in a testing programme at another major WWTP in New Zealand (which will be referred to as “Plant B”) during a significant upset condition within the solids contact/activated sludge process tanks in 2005. That upset was caused by biological overloading during failure of trickling filters which were upstream of the solids contact process.
The upset condition modelled under Scenarios S3 and S4 was assumed to be caused by a short term peak in biological loading to the Ballarat South WWTP, such as may occur during a peak processing season by major industry contributors. Beca has not carried out a full process review of the WWTP treatment units, however our experience of biological nutrient removal processes such as those used at the Ballarat South WWTP suggests that during such an upset, it is likely that there would be a small increase in odour from the preanoxic and anaerobic processes, and a larger increase in odour from the bioreactors and aerated tanks as foul odours are stripped out of the wastewater. There may also be some increase in odour from the primary sedimentation tanks and flow balancing tank due to the increased biological loading, particularly if this has caused the wastewater to become septic by the time it reaches the WWTP. It is considered that there would be no significant increase in odour emissions from downstream treatment processes such as the clarifiers and lagoon or the sludge treatment processes during such an upset.
Ballarat WWTP Odour Buffer Distances
3552322/100 Beca Page 29 R1:62014-TJF65R04 - Rev 1.DOC Rev 1 23 January 2007
Data from the testing programmes at Plant A and Plant B was used to assign SOERs to the preanoxic, anaerobic, aerated, and bioreactor tanks at the Ballarat South WWTP. In particular, the rationale used to assign SOERs was as follows:
Preanoxic and anaerobic tanks: These were noticeable odorous during the site visit. 75th percentile of SOERs from the anoxic tanks in the bioreactors Plant A was applied during normal conditions, and the mean SOER measured during the upset condition at Plant B on the RAS reaeration tank was used to define the SOER for the upset condition.
Aerated tanks: These were assigned an SOER similar to the 70th percentile of aerated zones within the bioreactors at Plant A for normal operation, and an SOER equivalent to half of the measured SOER from aerated tanks at Plant B during the upset at that plant. A factor of half of those Plant B odour emission rates was used in recognition of the high level of overloading of Plant B during that upset. Such an upset would occur on an infrequent basis and is considered to be outside that anticipated in the provision of buffer distances under AQ 2/86).
Anoxic bioreactor tanks: During normal operation, these were assigned an SOER equivalent to the 50th percentile of SOER measurements from the anoxic bioreactor zones at Plant A. This gave an SOER of 6 OU.m/s. As will be shown in the modelling results, the large area of this source combined with the relatively high SOER gives a significant odour concentration at the PUZ1 boundary. Therefore, some consideration was given to whether the estimated SOERs for this source are too high. However it is noted that even if the 20th percentile of SOER measurements from Plant B had been used, the selected SOER would still have been 4 OU.m/s. During the upset condition, the 80th percentile SOER from the anoxic bioreactor zones at Plant A was used.
Other assumptions made for other odour sources at the Ballarat South WWTP were as follows:
For the inlet works and PSTs, the same SOERs as used in the Ballarat North WWTP dispersion model for Scenarios N3 and N4 were used. For the flow splitting channel and flow balance tank, the same SOERs as the PSTs were assumed.
The belt press building was assumed to have the same odour emission rate as Scenario N3 for Ballarat North WWTP. However, in recognition of the higher e.p. of the Ballarat South plant, and the greater quantity of sludge that is likely to be produced by the treatment processes as Ballarat South WWTP compared with Ballarat North, the belt press building was assumed to work for longer hours per day (8 hours per day 7am to 3pm at Ballarat South, rather than 5 hours per day at Ballarat North). The dispersion model results will not be overly sensitive to the assumption of hours per day of operation, provided that the operation does not extend into evening hours.
The lagoons were assumed to be effectively maturation ponds and were assigned the same SOER as for the stabilisation lagoon at the Ballarat North WWTP for Scenario N3, with no variation in this SOER during the upset condition.
Ballarat WWTP Odour Buffer Distances
3552322/100 Beca Page 30 R1:62014-TJF65R04 - Rev 1.DOC Rev 1 23 January 2007
Table 5.3
SOERs in Ballarat South WWTP Odour Model
Scenarios S1 and S2 Scenarios S3 and S4
Description Current (S1) and future (S2) plant layout, “normal” operation
Current (S3) and future (S4) plant layout, “upset” operation
Inlet works Summer 42 OU.m/s Spr/Aut 32 OU.m/s Winter 21 OU.m/s
Summer 42 OU.m/s Spr/Aut 32 OU.m/s Winter 21 OU.m/s
PSTs, flow splitter, flow balancing
Summer 2 OU.m/s Spr/Aut 1.25 OU.m/s Winter 0.5 OU.m/s
Summer 5 OU.m/s Spr/Aut 2.75 OU.m/s Winter 0.5 OU.m/s
Preanoxic and anaerobic tanks All seasons 8 OU.m/s All seasons 12 OU.m/s Aerated tanks All seasons 0.3 OU.m/s All seasons 1 OU.m/s Anoxic tanks All seasons 6 OU.m/s All seasons 10 OU.m/s Clarifiers All seasons 0.1 OU.m/s All seasons 0.1 OU.m/s Lagoons Summer 0.02 OU.m/s
Spr/Aut 0.015 OU.m/s Winter 0.01 OU.m/s
Summer 0.02 OU.m/s Spr/Aut 0.015 OU.m/s Winter 0.01 OU.m/s
DAF tank All seasons 2 OU.m/s All seasons 2 OU.m/s Sludge and filtrate tank All seasons 3 OU.m/s All seasons 3 OU.m/s Belt press building 10,000 OU/s
7am to 3pm only 10,000 OU/s 7am to 3pm only
Ballarat WWTP Odour Buffer Distances
3552322/100 Beca Page 31 R1:62014-TJF65R04 - Rev 1.DOC Rev 1 23 January 2007
6 Approach Used to Define Buffer Distances
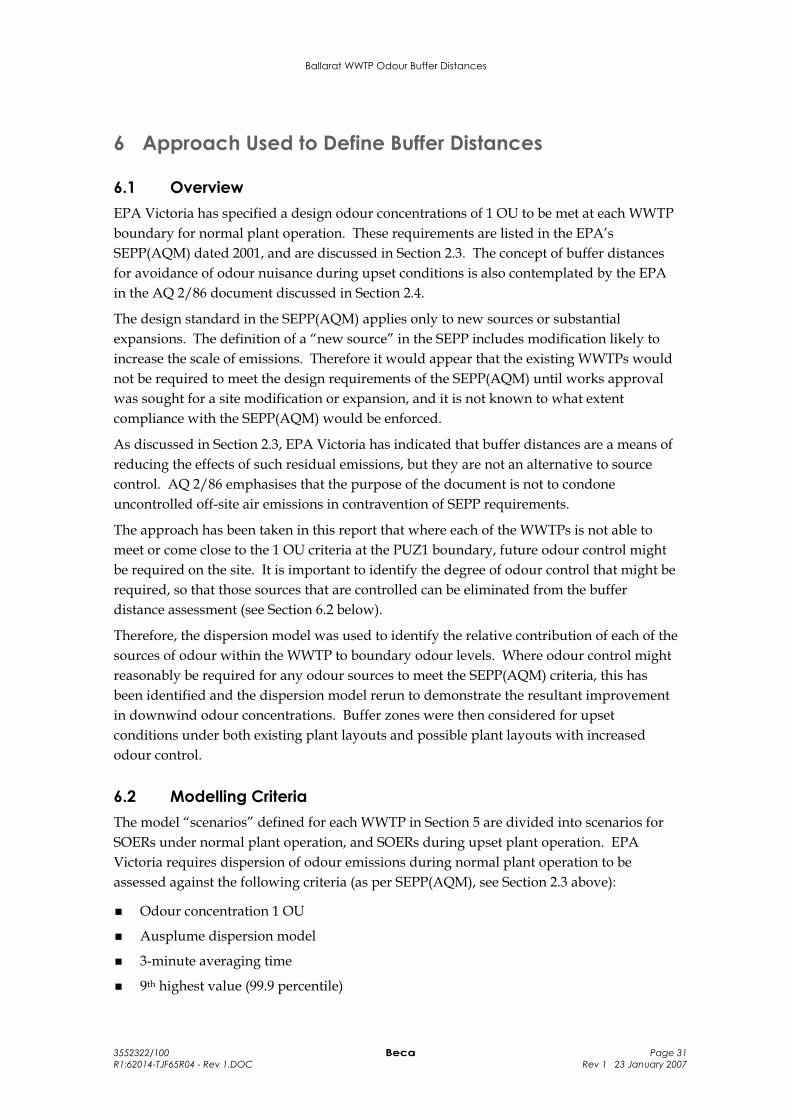
6.1 Overview EPA Victoria has specified a design odour concentrations of 1 OU to be met at each WWTP boundary for normal plant operation. These requirements are listed in the EPA’s SEPP(AQM) dated 2001, and are discussed in Section 2.3. The concept of buffer distances for avoidance of odour nuisance during upset conditions is also contemplated by the EPA in the AQ 2/86 document discussed in Section 2.4.
The design standard in the SEPP(AQM) applies only to new sources or substantial expansions. The definition of a “new source” in the SEPP includes modification likely to increase the scale of emissions. Therefore it would appear that the existing WWTPs would not be required to meet the design requirements of the SEPP(AQM) until works approval was sought for a site modification or expansion, and it is not known to what extent compliance with the SEPP(AQM) would be enforced.
As discussed in Section 2.3, EPA Victoria has indicated that buffer distances are a means of reducing the effects of such residual emissions, but they are not an alternative to source control. AQ 2/86 emphasises that the purpose of the document is not to condone uncontrolled off-site air emissions in contravention of SEPP requirements.
The approach has been taken in this report that where each of the WWTPs is not able to meet or come close to the 1 OU criteria at the PUZ1 boundary, future odour control might be required on the site. It is important to identify the degree of odour control that might be required, so that those sources that are controlled can be eliminated from the buffer distance assessment (see Section 6.2 below).
Therefore, the dispersion model was used to identify the relative contribution of each of the sources of odour within the WWTP to boundary odour levels. Where odour control might reasonably be required for any odour sources to meet the SEPP(AQM) criteria, this has been identified and the dispersion model rerun to demonstrate the resultant improvement in downwind odour concentrations. Buffer zones were then considered for upset conditions under both existing plant layouts and possible plant layouts with increased odour control.
6.2 Modelling Criteria The model “scenarios” defined for each WWTP in Section 5 are divided into scenarios for SOERs under normal plant operation, and SOERs during upset plant operation. EPA Victoria requires dispersion of odour emissions during normal plant operation to be assessed against the following criteria (as per SEPP(AQM), see Section 2.3 above):
Odour concentration 1 OU
Ausplume dispersion model
3-minute averaging time
9th highest value (99.9 percentile)
Ballarat WWTP Odour Buffer Distances
3552322/100 Beca Page 32 R1:62014-TJF65R04 - Rev 1.DOC Rev 1 23 January 2007
Beca has assessed the model scenarios for normal plant operation against this criteria, and has applied this criteria at the boundary of the PUZ1-zoned land occupied by each of the WWTPs as shown in the Figures in Section 3.
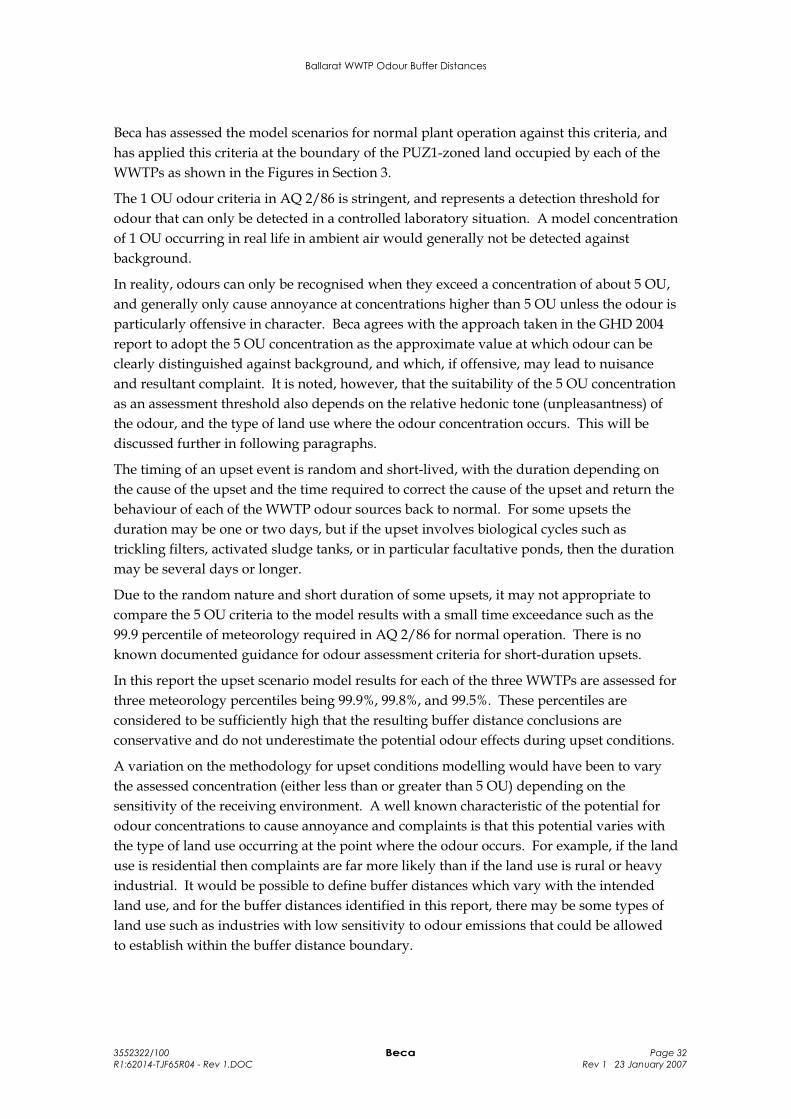
The 1 OU odour criteria in AQ 2/86 is stringent, and represents a detection threshold for odour that can only be detected in a controlled laboratory situation. A model concentration of 1 OU occurring in real life in ambient air would generally not be detected against background.
In reality, odours can only be recognised when they exceed a concentration of about 5 OU, and generally only cause annoyance at concentrations higher than 5 OU unless the odour is particularly offensive in character. Beca agrees with the approach taken in the GHD 2004 report to adopt the 5 OU concentration as the approximate value at which odour can be clearly distinguished against background, and which, if offensive, may lead to nuisance and resultant complaint. It is noted, however, that the suitability of the 5 OU concentration as an assessment threshold also depends on the relative hedonic tone (unpleasantness) of the odour, and the type of land use where the odour concentration occurs. This will be discussed further in following paragraphs.
The timing of an upset event is random and short-lived, with the duration depending on the cause of the upset and the time required to correct the cause of the upset and return the behaviour of each of the WWTP odour sources back to normal. For some upsets the duration may be one or two days, but if the upset involves biological cycles such as trickling filters, activated sludge tanks, or in particular facultative ponds, then the duration may be several days or longer.
Due to the random nature and short duration of some upsets, it may not appropriate to compare the 5 OU criteria to the model results with a small time exceedance such as the 99.9 percentile of meteorology required in AQ 2/86 for normal operation. There is no known documented guidance for odour assessment criteria for short-duration upsets.
In this report the upset scenario model results for each of the three WWTPs are assessed for three meteorology percentiles being 99.9%, 99.8%, and 99.5%. These percentiles are considered to be sufficiently high that the resulting buffer distance conclusions are conservative and do not underestimate the potential odour effects during upset conditions.
A variation on the methodology for upset conditions modelling would have been to vary the assessed concentration (either less than or greater than 5 OU) depending on the sensitivity of the receiving environment. A well known characteristic of the potential for odour concentrations to cause annoyance and complaints is that this potential varies with the type of land use occurring at the point where the odour occurs. For example, if the land use is residential then complaints are far more likely than if the land use is rural or heavy industrial. It would be possible to define buffer distances which vary with the intended land use, and for the buffer distances identified in this report, there may be some types of land use such as industries with low sensitivity to odour emissions that could be allowed to establish within the buffer distance boundary.
Ballarat WWTP Odour Buffer Distances
3552322/100 Beca Page 33 R1:62014-TJF65R04 - Rev 1.DOC Rev 1 23 January 2007
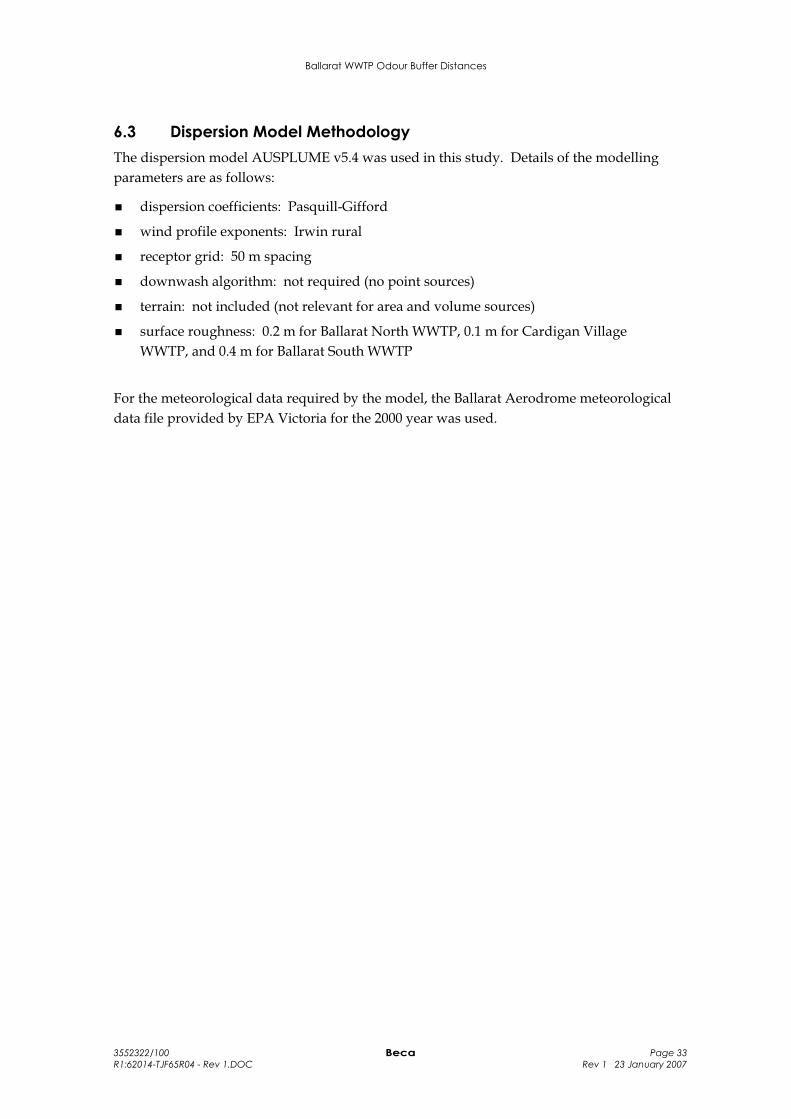
6.3 Dispersion Model Methodology The dispersion model AUSPLUME v5.4 was used in this study. Details of the modelling parameters are as follows:
dispersion coefficients: Pasquill-Gifford
wind profile exponents: Irwin rural
receptor grid: 50 m spacing
downwash algorithm: not required (no point sources)
terrain: not included (not relevant for area and volume sources)
surface roughness: 0.2 m for Ballarat North WWTP, 0.1 m for Cardigan Village WWTP, and 0.4 m for Ballarat South WWTP
For the meteorological data required by the model, the Ballarat Aerodrome meteorological data file provided by EPA Victoria for the 2000 year was used.
Ballarat WWTP Odour Buffer Distances
3552322/100 Beca Page 34 R1:62014-TJF65R04 - Rev 1.DOC Rev 1 23 January 2007
7 Cardigan WWTP Dispersion Model Results and Odour Buffer Distances
7.1 Model Results : Scenarios C1, C2 and C3 – Cardigan Village WWTP normal operation
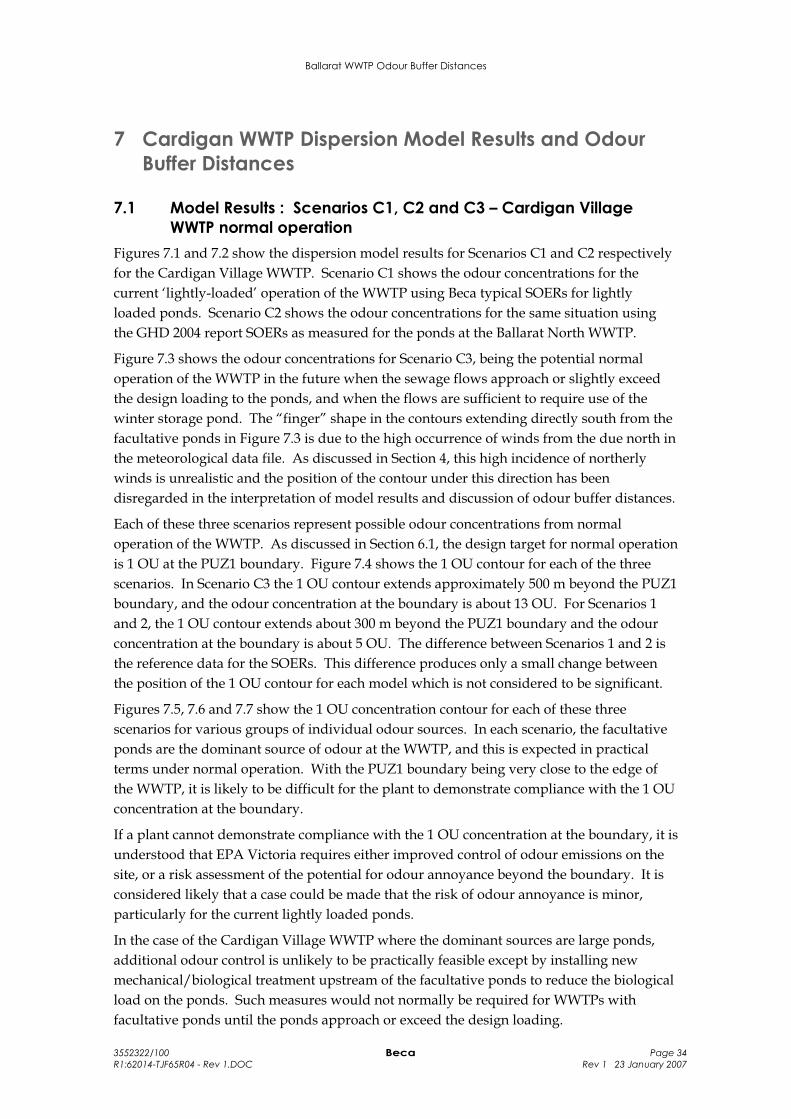
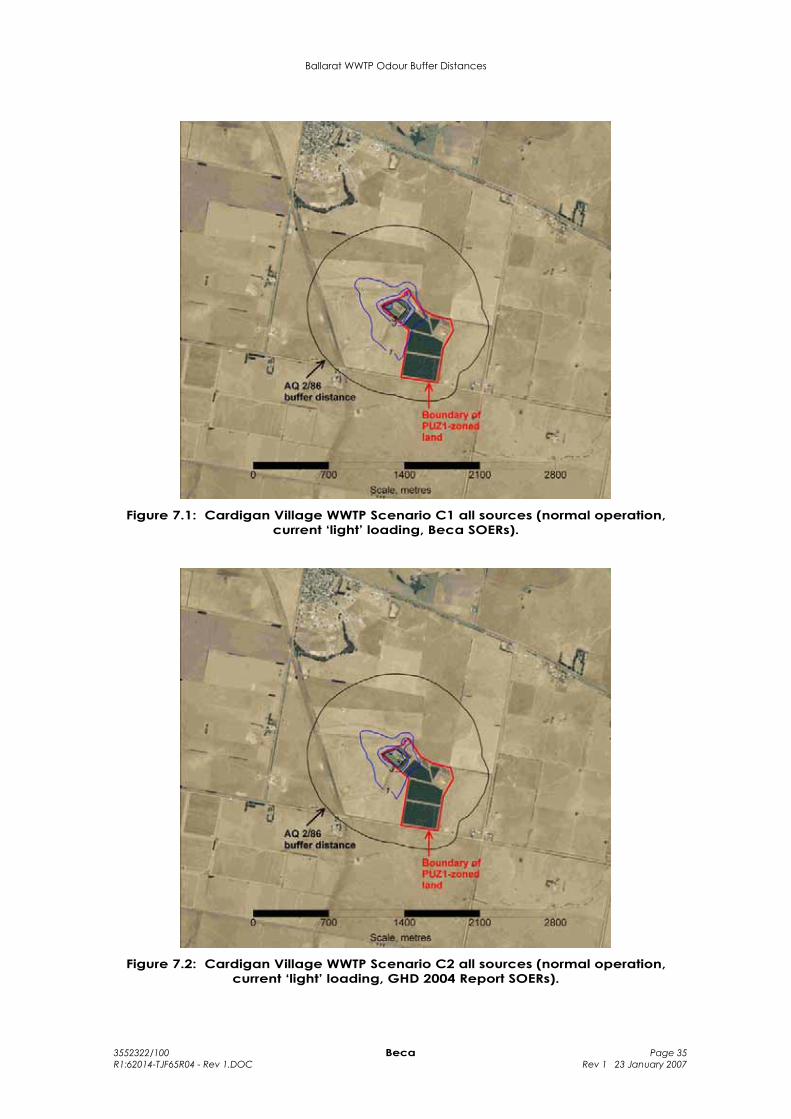
Figures 7.1 and 7.2 show the dispersion model results for Scenarios C1 and C2 respectively for the Cardigan Village WWTP. Scenario C1 shows the odour concentrations for the current ‘lightly-loaded’ operation of the WWTP using Beca typical SOERs for lightly loaded ponds. Scenario C2 shows the odour concentrations for the same situation using the GHD 2004 report SOERs as measured for the ponds at the Ballarat North WWTP.
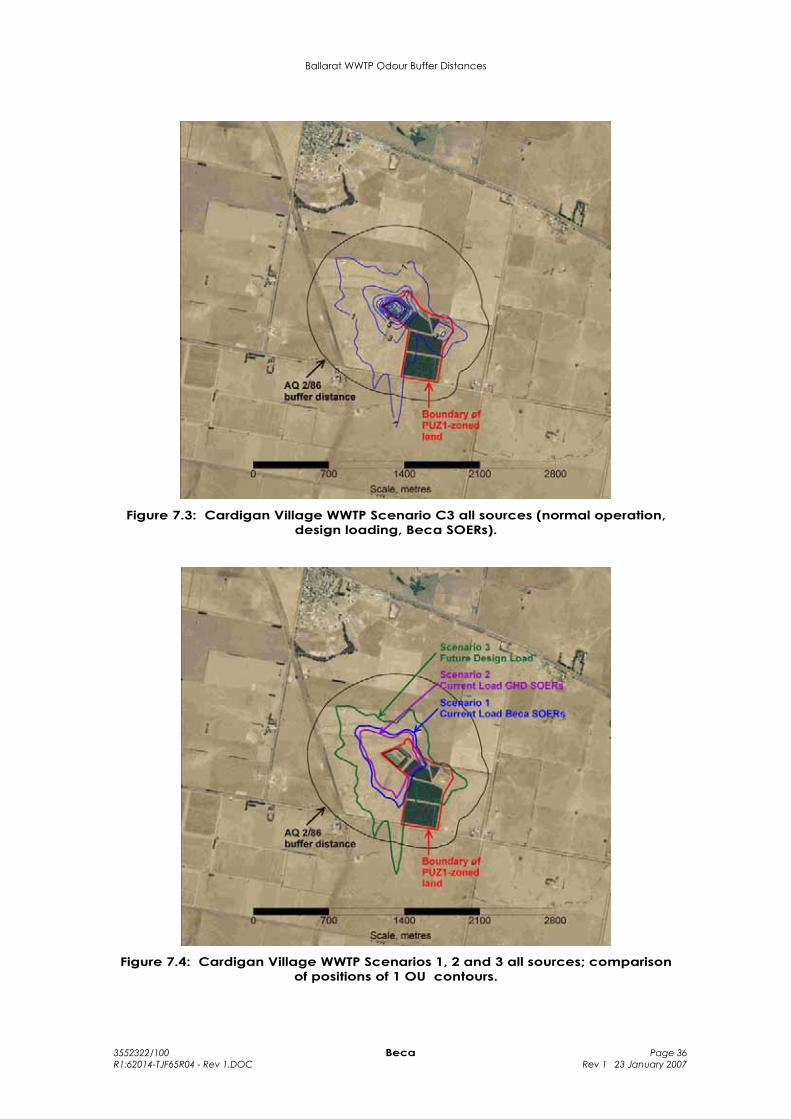
Figure 7.3 shows the odour concentrations for Scenario C3, being the potential normal operation of the WWTP in the future when the sewage flows approach or slightly exceed the design loading to the ponds, and when the flows are sufficient to require use of the winter storage pond. The “finger” shape in the contours extending directly south from the facultative ponds in Figure 7.3 is due to the high occurrence of winds from the due north in the meteorological data file. As discussed in Section 4, this high incidence of northerly winds is unrealistic and the position of the contour under this direction has been disregarded in the interpretation of model results and discussion of odour buffer distances.
Each of these three scenarios represent possible odour concentrations from normal operation of the WWTP. As discussed in Section 6.1, the design target for normal operation is 1 OU at the PUZ1 boundary. Figure 7.4 shows the 1 OU contour for each of the three scenarios. In Scenario C3 the 1 OU contour extends approximately 500 m beyond the PUZ1 boundary, and the odour concentration at the boundary is about 13 OU. For Scenarios 1 and 2, the 1 OU contour extends about 300 m beyond the PUZ1 boundary and the odour concentration at the boundary is about 5 OU. The difference between Scenarios 1 and 2 is the reference data for the SOERs. This difference produces only a small change between the position of the 1 OU contour for each model which is not considered to be significant.
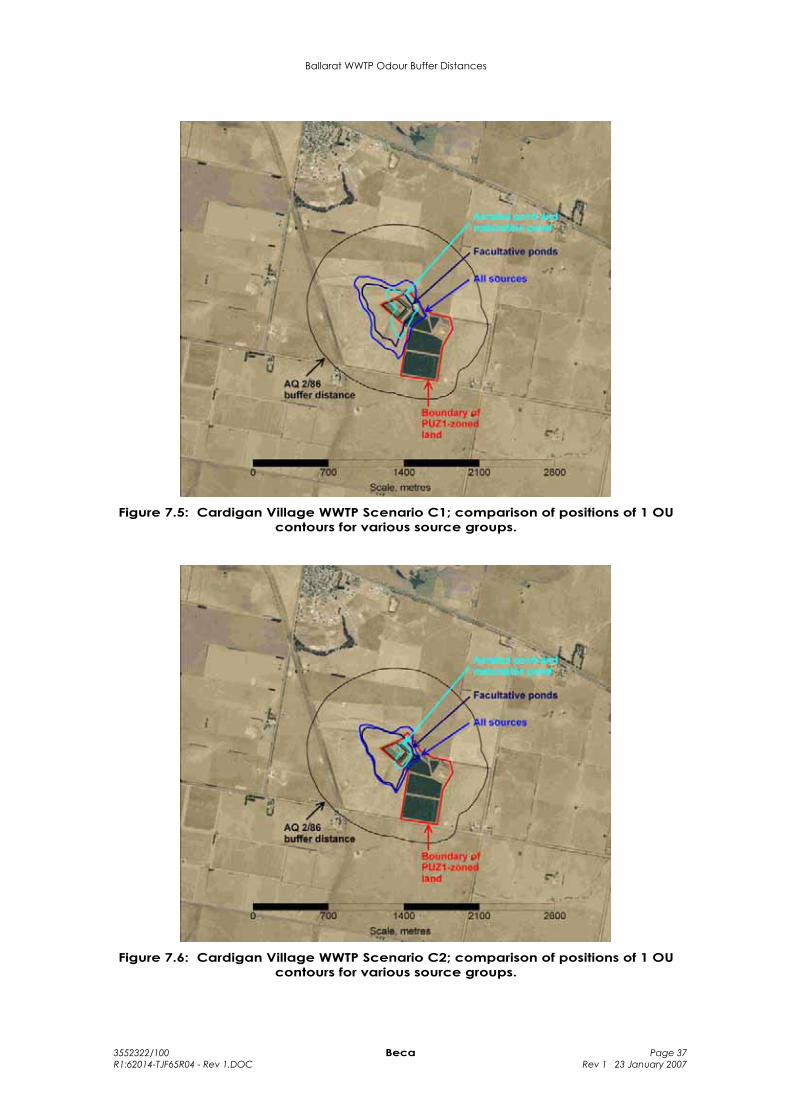
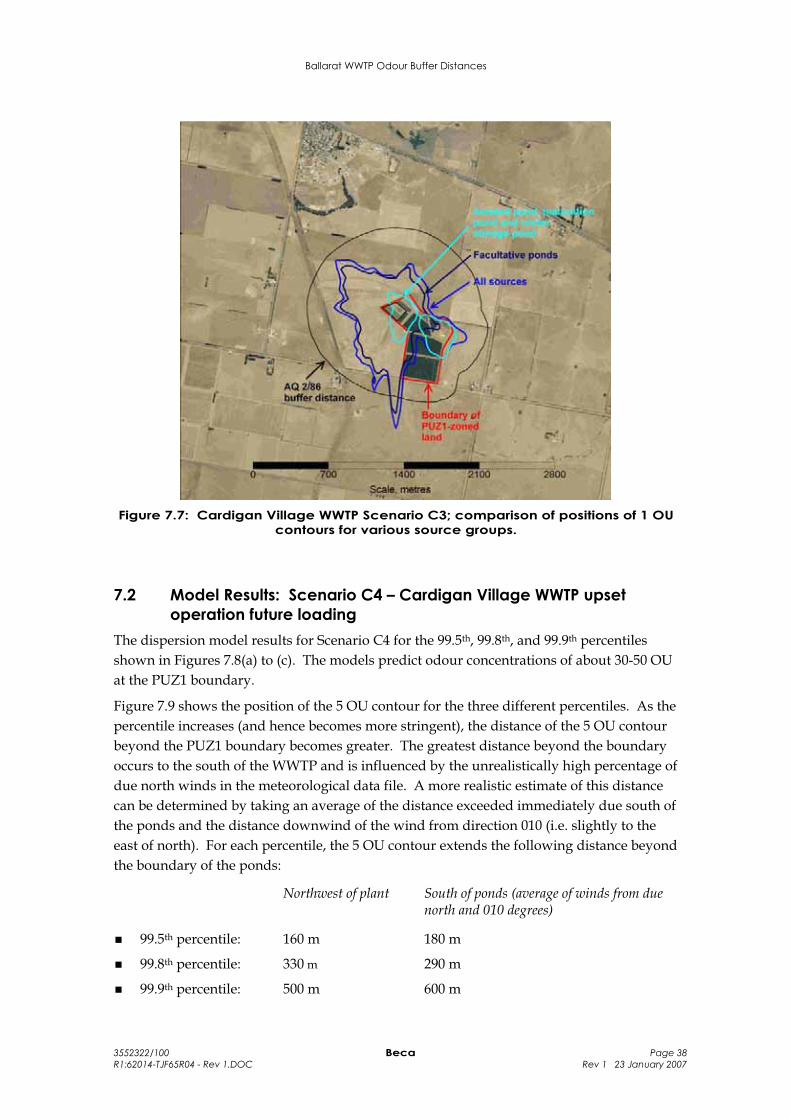
Figures 7.5, 7.6 and 7.7 show the 1 OU concentration contour for each of these three scenarios for various groups of individual odour sources. In each scenario, the facultative ponds are the dominant source of odour at the WWTP, and this is expected in practical terms under normal operation. With the PUZ1 boundary being very close to the edge of the WWTP, it is likely to be difficult for the plant to demonstrate compliance with the 1 OU concentration at the boundary.
If a plant cannot demonstrate compliance with the 1 OU concentration at the boundary, it is understood that EPA Victoria requires either improved control of odour emissions on the site, or a risk assessment of the potential for odour annoyance beyond the boundary. It is considered likely that a case could be made that the risk of odour annoyance is minor, particularly for the current lightly loaded ponds.
In the case of the Cardigan Village WWTP where the dominant sources are large ponds, additional odour control is unlikely to be practically feasible except by installing new mechanical/biological treatment upstream of the facultative ponds to reduce the biological load on the ponds. Such measures would not normally be required for WWTPs with facultative ponds until the ponds approach or exceed the design loading.
Ballarat WWTP Odour Buffer Distances
3552322/100 Beca Page 35 R1:62014-TJF65R04 - Rev 1.DOC Rev 1 23 January 2007
Figure 7.1: Cardigan Village WWTP Scenario C1 all sources (normal operation, current ‘light’ loading, Beca SOERs).
Figure 7.2: Cardigan Village WWTP Scenario C2 all sources (normal operation, current ‘light’ loading, GHD 2004 Report SOERs).
Ballarat WWTP Odour Buffer Distances
3552322/100 Beca Page 36 R1:62014-TJF65R04 - Rev 1.DOC Rev 1 23 January 2007
Figure 7.3: Cardigan Village WWTP Scenario C3 all sources (normal operation, design loading, Beca SOERs).
Figure 7.4: Cardigan Village WWTP Scenarios 1, 2 and 3 all sources; comparison of positions of 1 OU contours.
Ballarat WWTP Odour Buffer Distances
3552322/100 Beca Page 37 R1:62014-TJF65R04 - Rev 1.DOC Rev 1 23 January 2007
Figure 7.5: Cardigan Village WWTP Scenario C1; comparison of positions of 1 OU contours for various source groups.
Figure 7.6: Cardigan Village WWTP Scenario C2; comparison of positions of 1 OU contours for various source groups.
Ballarat WWTP Odour Buffer Distances
3552322/100 Beca Page 38 R1:62014-TJF65R04 - Rev 1.DOC Rev 1 23 January 2007
Figure 7.7: Cardigan Village WWTP Scenario C3; comparison of positions of 1 OU contours for various source groups.
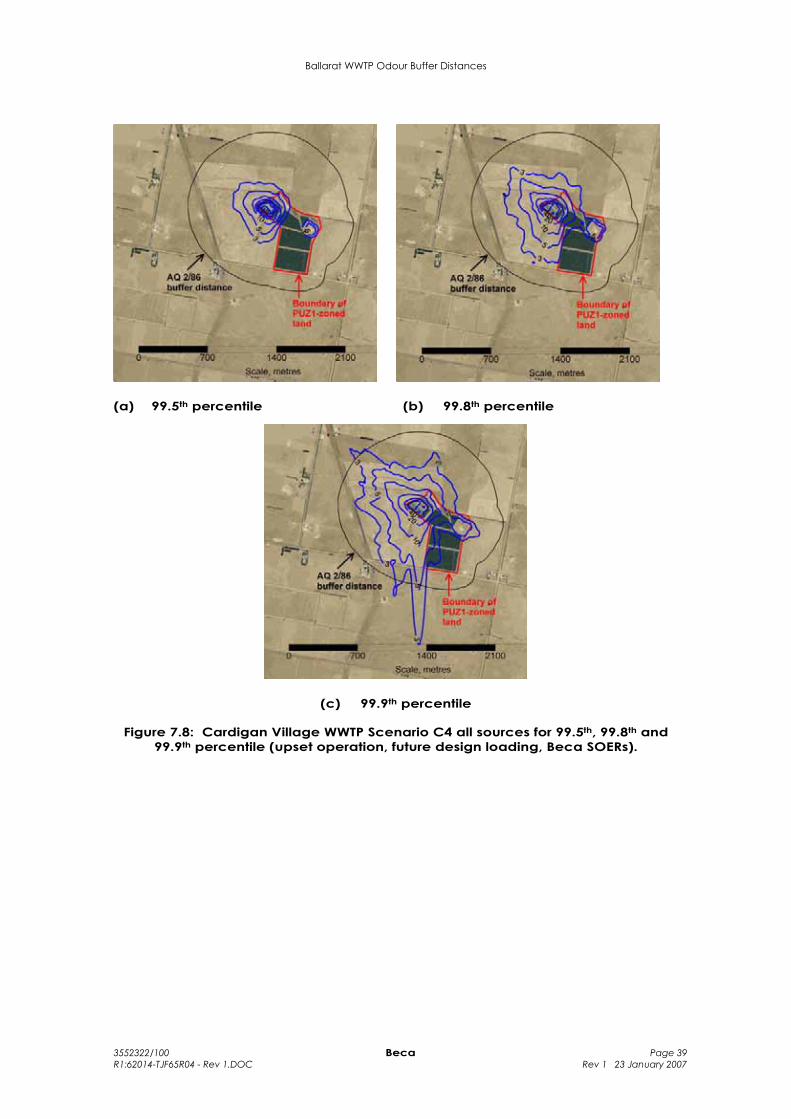
7.2 Model Results: Scenario C4 – Cardigan Village WWTP upset operation future loading
The dispersion model results for Scenario C4 for the 99.5th, 99.8th, and 99.9th percentiles shown in Figures 7.8(a) to (c). The models predict odour concentrations of about 30-50 OU at the PUZ1 boundary.
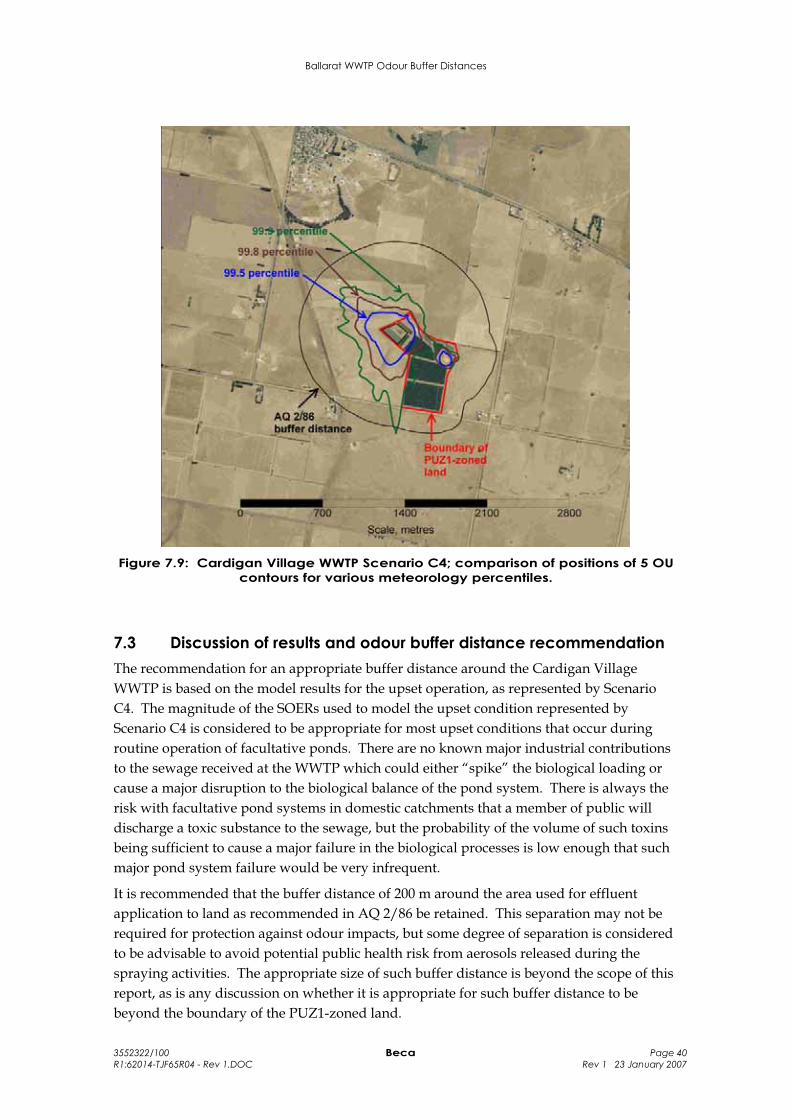
Figure 7.9 shows the position of the 5 OU contour for the three different percentiles. As the percentile increases (and hence becomes more stringent), the distance of the 5 OU contour beyond the PUZ1 boundary becomes greater. The greatest distance beyond the boundary occurs to the south of the WWTP and is influenced by the unrealistically high percentage of due north winds in the meteorological data file. A more realistic estimate of this distance can be determined by taking an average of the distance exceeded immediately due south of the ponds and the distance downwind of the wind from direction 010 (i.e. slightly to the east of north). For each percentile, the 5 OU contour extends the following distance beyond the boundary of the ponds:
Northwest of plant South of ponds (average of winds from due north and 010 degrees)
99.5th percentile: 160 m 180 m
99.8th percentile: 330 m 290 m
99.9th percentile: 500 m 600 m
Ballarat WWTP Odour Buffer Distances
3552322/100 Beca Page 39 R1:62014-TJF65R04 - Rev 1.DOC Rev 1 23 January 2007
(a) 99.5th percentile (b) 99.8th percentile
(c) 99.9th percentile
Figure 7.8: Cardigan Village WWTP Scenario C4 all sources for 99.5th, 99.8th and 99.9th percentile (upset operation, future design loading, Beca SOERs).
Ballarat WWTP Odour Buffer Distances
3552322/100 Beca Page 40 R1:62014-TJF65R04 - Rev 1.DOC Rev 1 23 January 2007
Figure 7.9: Cardigan Village WWTP Scenario C4; comparison of positions of 5 OU contours for various meteorology percentiles.
7.3 Discussion of results and odour buffer distance recommendation The recommendation for an appropriate buffer distance around the Cardigan Village WWTP is based on the model results for the upset operation, as represented by Scenario C4. The magnitude of the SOERs used to model the upset condition represented by Scenario C4 is considered to be appropriate for most upset conditions that occur during routine operation of facultative ponds. There are no known major industrial contributions to the sewage received at the WWTP which could either “spike” the biological loading or cause a major disruption to the biological balance of the pond system. There is always the risk with facultative pond systems in domestic catchments that a member of public will discharge a toxic substance to the sewage, but the probability of the volume of such toxins being sufficient to cause a major failure in the biological processes is low enough that such major pond system failure would be very infrequent.
It is recommended that the buffer distance of 200 m around the area used for effluent application to land as recommended in AQ 2/86 be retained. This separation may not be required for protection against odour impacts, but some degree of separation is considered to be advisable to avoid potential public health risk from aerosols released during the spraying activities. The appropriate size of such buffer distance is beyond the scope of this report, as is any discussion on whether it is appropriate for such buffer distance to be beyond the boundary of the PUZ1-zoned land.
Ballarat WWTP Odour Buffer Distances
3552322/100 Beca Page 41 R1:62014-TJF65R04 - Rev 1.DOC Rev 1 23 January 2007
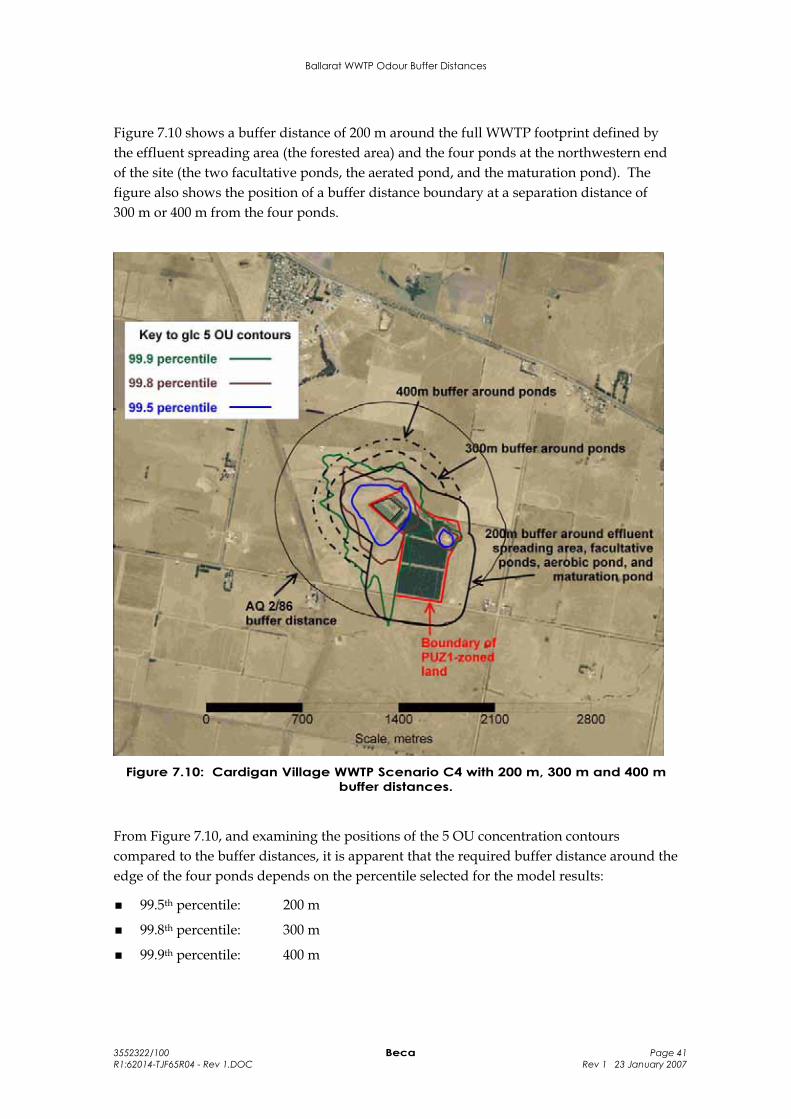
Figure 7.10 shows a buffer distance of 200 m around the full WWTP footprint defined by the effluent spreading area (the forested area) and the four ponds at the northwestern end of the site (the two facultative ponds, the aerated pond, and the maturation pond). The figure also shows the position of a buffer distance boundary at a separation distance of 300 m or 400 m from the four ponds.
Figure 7.10: Cardigan Village WWTP Scenario C4 with 200 m, 300 m and 400 m buffer distances.
From Figure 7.10, and examining the positions of the 5 OU concentration contours compared to the buffer distances, it is apparent that the required buffer distance around the edge of the four ponds depends on the percentile selected for the model results:
99.5th percentile: 200 m
99.8th percentile: 300 m
99.9th percentile: 400 m
Ballarat WWTP Odour Buffer Distances
3552322/100 Beca Page 42 R1:62014-TJF65R04 - Rev 1.DOC Rev 1 23 January 2007
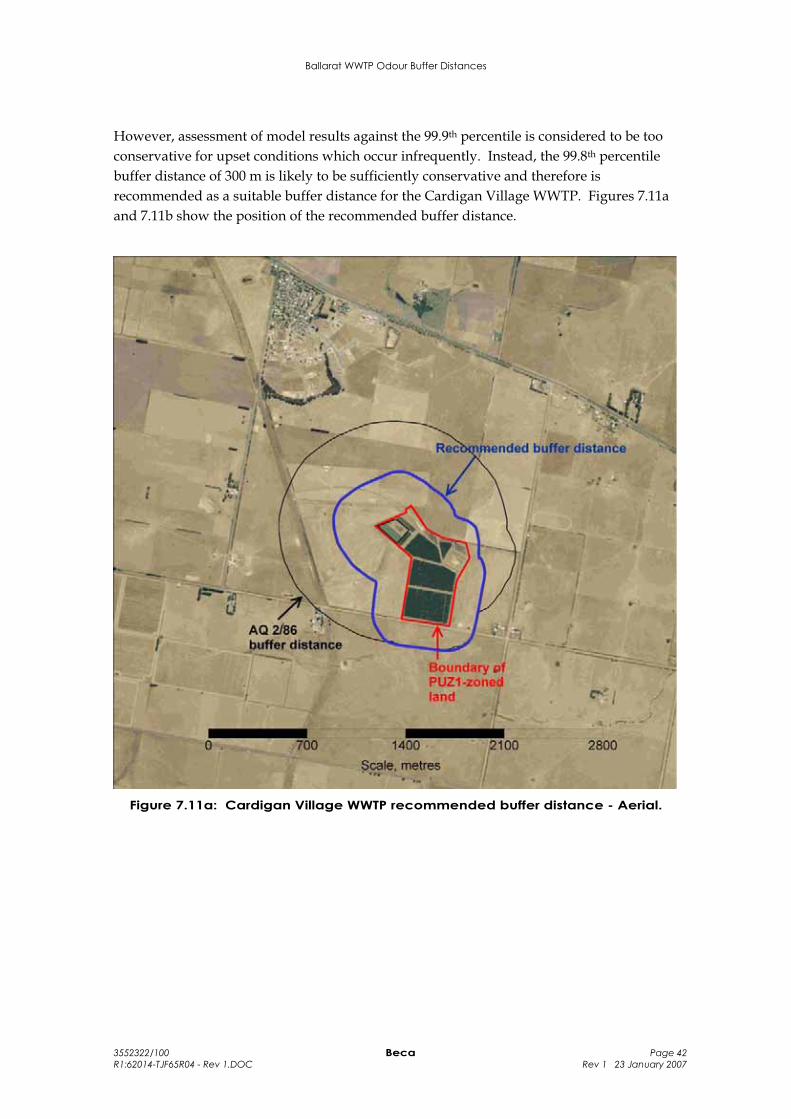
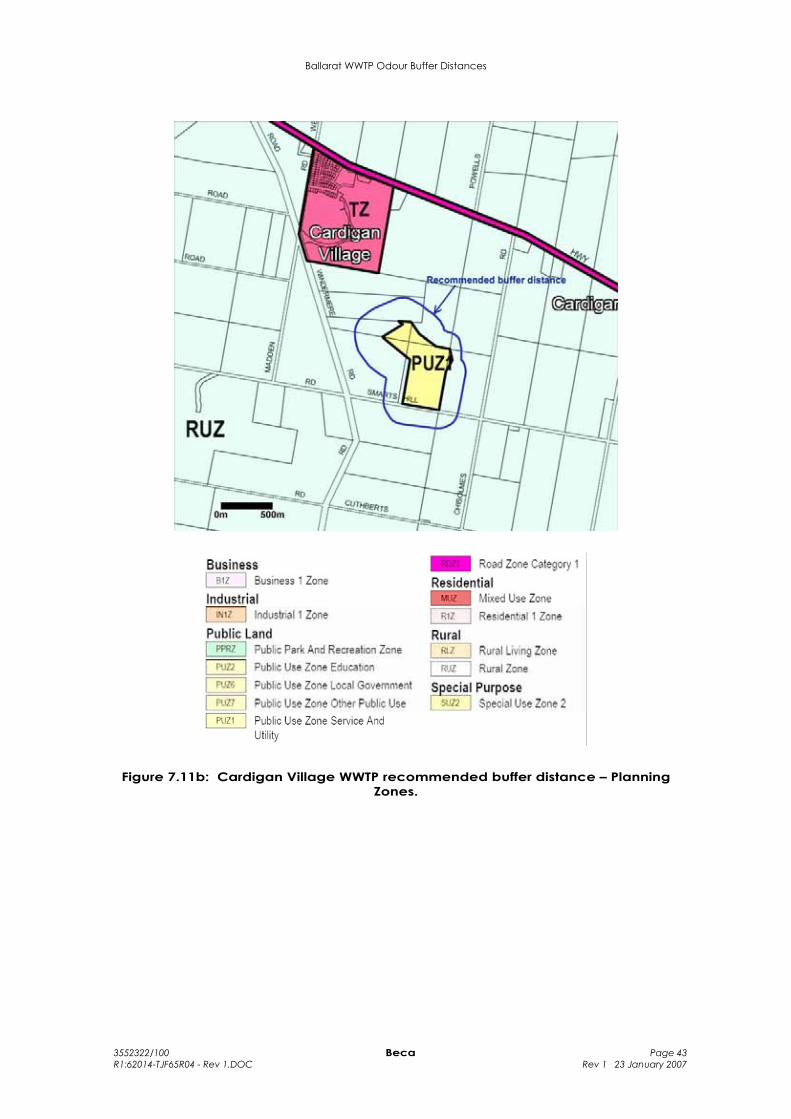
However, assessment of model results against the 99.9th percentile is considered to be too conservative for upset conditions which occur infrequently. Instead, the 99.8th percentile buffer distance of 300 m is likely to be sufficiently conservative and therefore is recommended as a suitable buffer distance for the Cardigan Village WWTP. Figures 7.11a and 7.11b show the position of the recommended buffer distance.
Figure 7.11a: Cardigan Village WWTP recommended buffer distance - Aerial.
Ballarat WWTP Odour Buffer Distances
3552322/100 Beca Page 43 R1:62014-TJF65R04 - Rev 1.DOC Rev 1 23 January 2007
Figure 7.11b: Cardigan Village WWTP recommended buffer distance – Planning Zones.
Ballarat WWTP Odour Buffer Distances
3552322/100 Beca Page 44 R1:62014-TJF65R04 - Rev 1.DOC Rev 1 23 January 2007
8 Ballarat North WWTP Dispersion Model Results and Odour Buffer Distances
Four Scenarios were modelled for the Ballarat North WWTP, as detailed in Table 5.2:
Scenario N1 SOERs as GHD normal model
Scenario N2 SOERs as GHD upset model “B”
Scenario N3 Normal operation with Beca typical SOERs
Scenario N4 Typical upset operation with Beca SOERs
The model results for each of these scenarios are discussed in Sections 8.1 to 8.4 below.
8.1 Model Results: Scenario N1 Normal Operation GHD SOERs Figure 8.1 shows the dispersion model results for Scenario N1 for the Ballarat North WWTP. This model is largely the same as the model for normal plant operation included in the GHD 2004 Report, except as listed in Section 5.2.1.
As with the Cardigan Village WWTP models, there is a “finger” shape in the contours extending directly south from the Ballarat North WWTP due to the unrealistically high occurrence of winds from the due north in the meteorological data file. The GHD 2004 Report model results did not show this “finger” shape in the contours. The reason for that difference is not known.
The model results represent odour concentrations from normal operation of the Ballarat North WWTP, for which the design target for normal operation is 1 OU at the PUZ1 boundary. In Scenario N1 the odour concentration at the PUZ1 boundary is about 5 OU both to the south of the plant and to the west adjacent to the sludge stockpile area. The 5 OU “finger” to the south of the plant is due to the frequency of northerly winds in the meteorological data file – without this anomaly the odour concentration at the southern boundary would be approximately 3 OU. The 1 OU contour extends approximately 300 m beyond the western edge and 500 m beyond the southern edge of the PUZ1 boundary (after adjustment for the “finger” irregularity).
Figures 8.2(a) to (f) show the concentration contours for Scenario N1 for various individual and groups of odour sources. The most dominant odour source is clearly the inlet works. Table 8.1 shows the percentage of the total odour emission rate (summer emission values) contributed by each odour source. The inlet works is clearly the most dominant source in that breakdown as well, contributing 51% of the total odour emission.
The next highest contribution to the total odour emission rate comes from the stabilisation lagoons. However, as this odour emission rate is spread over a very large area, the rate of dispersion from the source is rapid and the odour concentrations are much lower in the dispersion model than would be expected if only Table 8.1 was considered.
The next highest contribution in Table 8.1 comes from the intermediate sludge stockpile, although the actual odour emission rate from that source will vary with the age of the sludge and the volume stockpiled onsite. In Figure 8.1, this source contributes to some
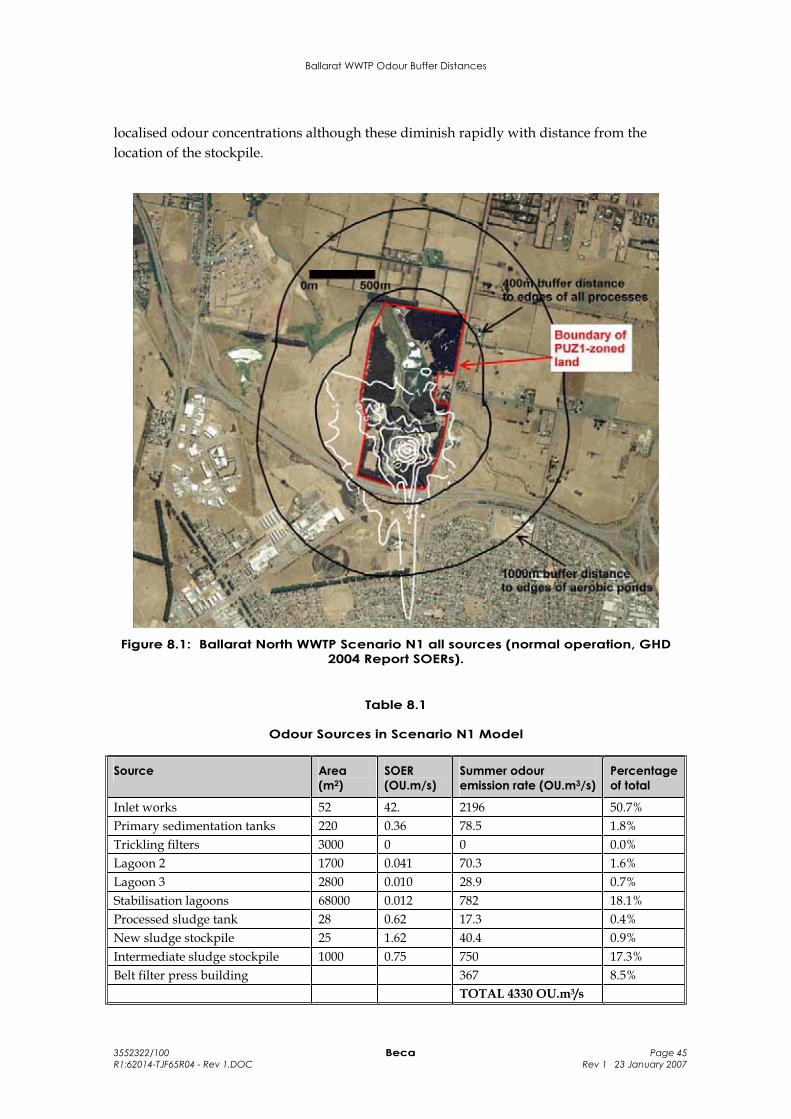
Ballarat WWTP Odour Buffer Distances
3552322/100 Beca Page 45 R1:62014-TJF65R04 - Rev 1.DOC Rev 1 23 January 2007
localised odour concentrations although these diminish rapidly with distance from the location of the stockpile.
Figure 8.1: Ballarat North WWTP Scenario N1 all sources (normal operation, GHD 2004 Report SOERs).
Table 8.1
Odour Sources in Scenario N1 Model
Source Area(m2)
SOER(OU.m/s)
Summer odour emission rate (OU.m3/s)
Percentageof total
Inlet works 52 42. 2196 50.7% Primary sedimentation tanks 220 0.36 78.5 1.8% Trickling filters 3000 0 0 0.0% Lagoon 2 1700 0.041 70.3 1.6% Lagoon 3 2800 0.010 28.9 0.7% Stabilisation lagoons 68000 0.012 782 18.1% Processed sludge tank 28 0.62 17.3 0.4% New sludge stockpile 25 1.62 40.4 0.9% Intermediate sludge stockpile 1000 0.75 750 17.3% Belt filter press building 367 8.5% TOTAL 4330 OU.m3/s
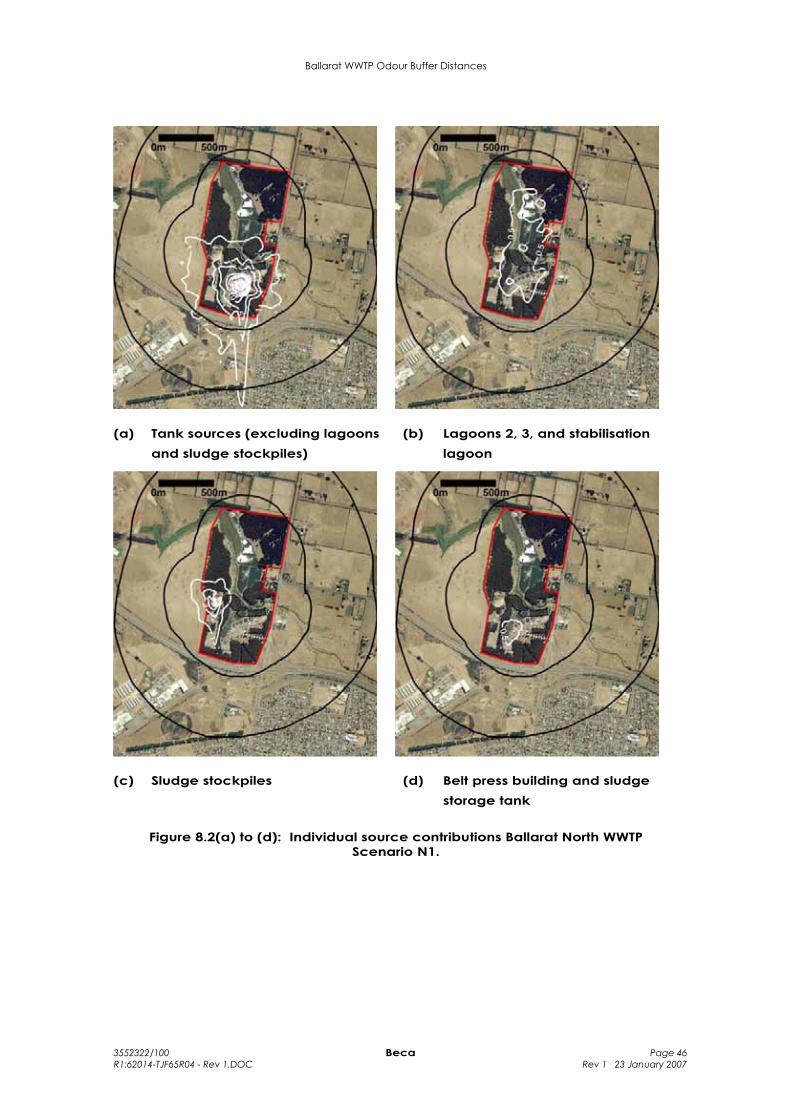
Ballarat WWTP Odour Buffer Distances
3552322/100 Beca Page 46 R1:62014-TJF65R04 - Rev 1.DOC Rev 1 23 January 2007
(a) Tank sources (excluding lagoons and sludge stockpiles)
(b) Lagoons 2, 3, and stabilisation lagoon
(c) Sludge stockpiles (d) Belt press building and sludge storage tank
Figure 8.2(a) to (d): Individual source contributions Ballarat North WWTP Scenario N1.
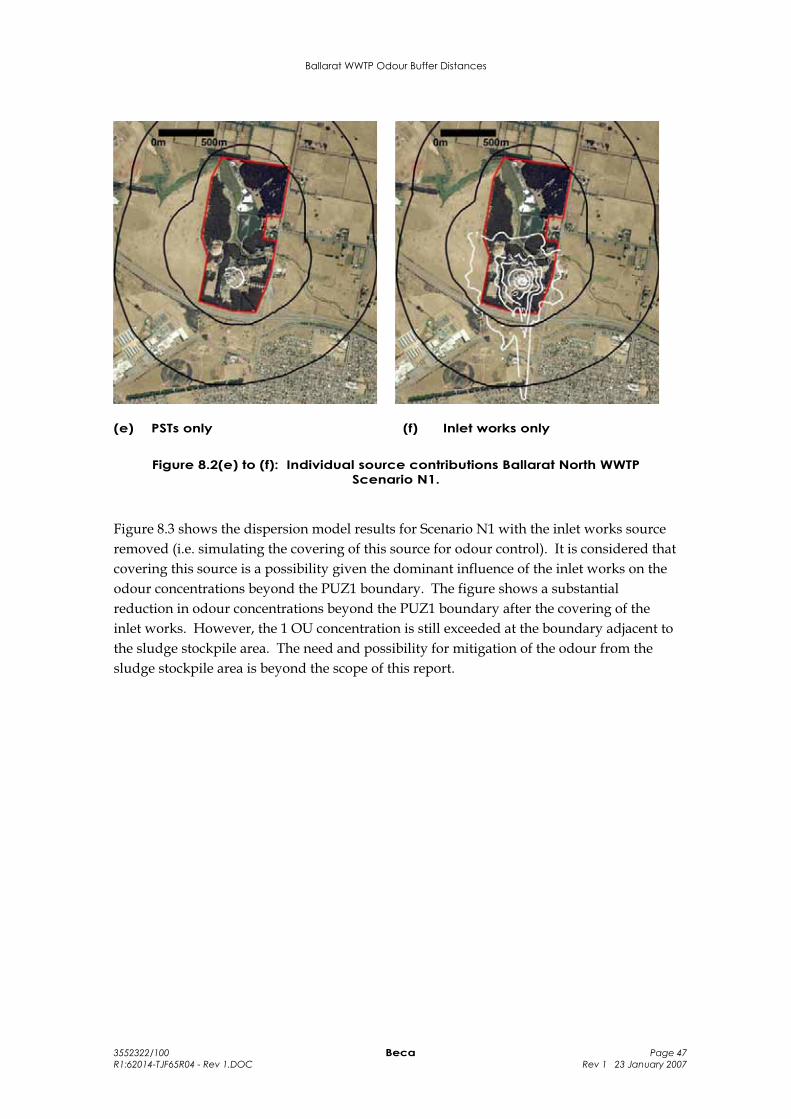
Ballarat WWTP Odour Buffer Distances
3552322/100 Beca Page 47 R1:62014-TJF65R04 - Rev 1.DOC Rev 1 23 January 2007
(e) PSTs only (f) Inlet works only
Figure 8.2(e) to (f): Individual source contributions Ballarat North WWTP Scenario N1.
Figure 8.3 shows the dispersion model results for Scenario N1 with the inlet works source removed (i.e. simulating the covering of this source for odour control). It is considered that covering this source is a possibility given the dominant influence of the inlet works on the odour concentrations beyond the PUZ1 boundary. The figure shows a substantial reduction in odour concentrations beyond the PUZ1 boundary after the covering of the inlet works. However, the 1 OU concentration is still exceeded at the boundary adjacent to the sludge stockpile area. The need and possibility for mitigation of the odour from the sludge stockpile area is beyond the scope of this report.
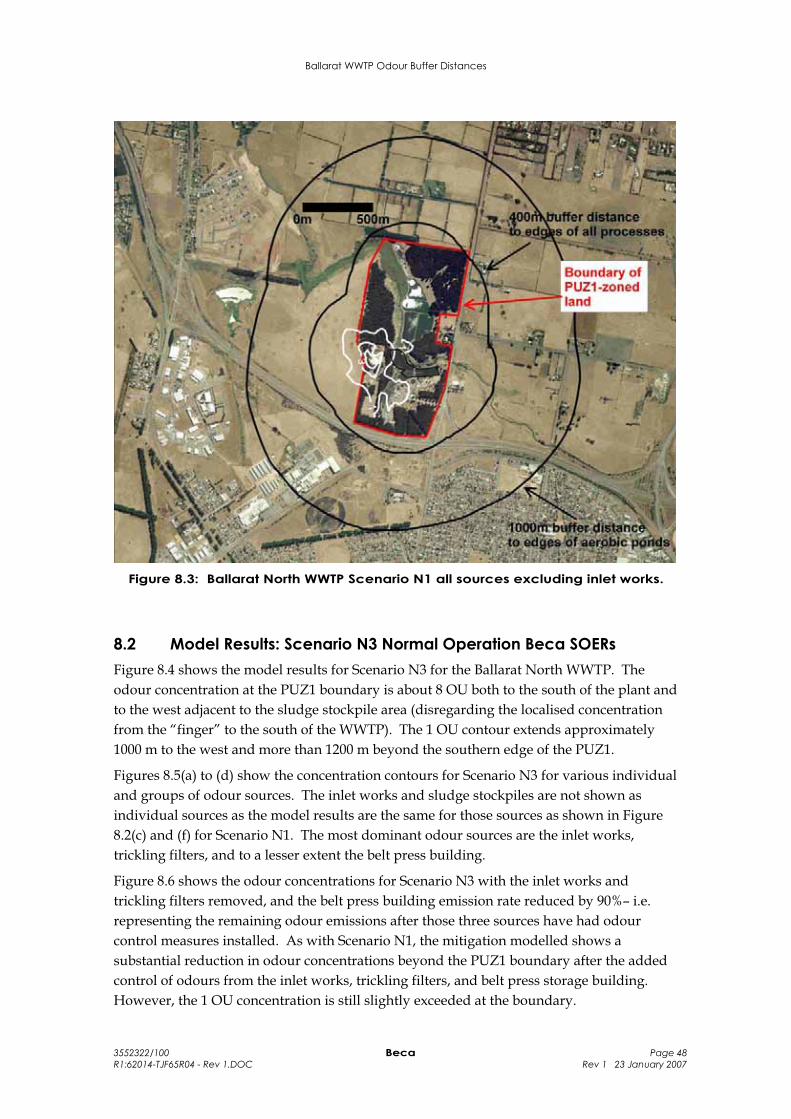
Ballarat WWTP Odour Buffer Distances
3552322/100 Beca Page 48 R1:62014-TJF65R04 - Rev 1.DOC Rev 1 23 January 2007
Figure 8.3: Ballarat North WWTP Scenario N1 all sources excluding inlet works.
8.2 Model Results: Scenario N3 Normal Operation Beca SOERs Figure 8.4 shows the model results for Scenario N3 for the Ballarat North WWTP. The odour concentration at the PUZ1 boundary is about 8 OU both to the south of the plant and to the west adjacent to the sludge stockpile area (disregarding the localised concentration from the “finger” to the south of the WWTP). The 1 OU contour extends approximately 1000 m to the west and more than 1200 m beyond the southern edge of the PUZ1.
Figures 8.5(a) to (d) show the concentration contours for Scenario N3 for various individual and groups of odour sources. The inlet works and sludge stockpiles are not shown as individual sources as the model results are the same for those sources as shown in Figure 8.2(c) and (f) for Scenario N1. The most dominant odour sources are the inlet works, trickling filters, and to a lesser extent the belt press building.
Figure 8.6 shows the odour concentrations for Scenario N3 with the inlet works and trickling filters removed, and the belt press building emission rate reduced by 90%– i.e. representing the remaining odour emissions after those three sources have had odour control measures installed. As with Scenario N1, the mitigation modelled shows a substantial reduction in odour concentrations beyond the PUZ1 boundary after the added control of odours from the inlet works, trickling filters, and belt press storage building. However, the 1 OU concentration is still slightly exceeded at the boundary.
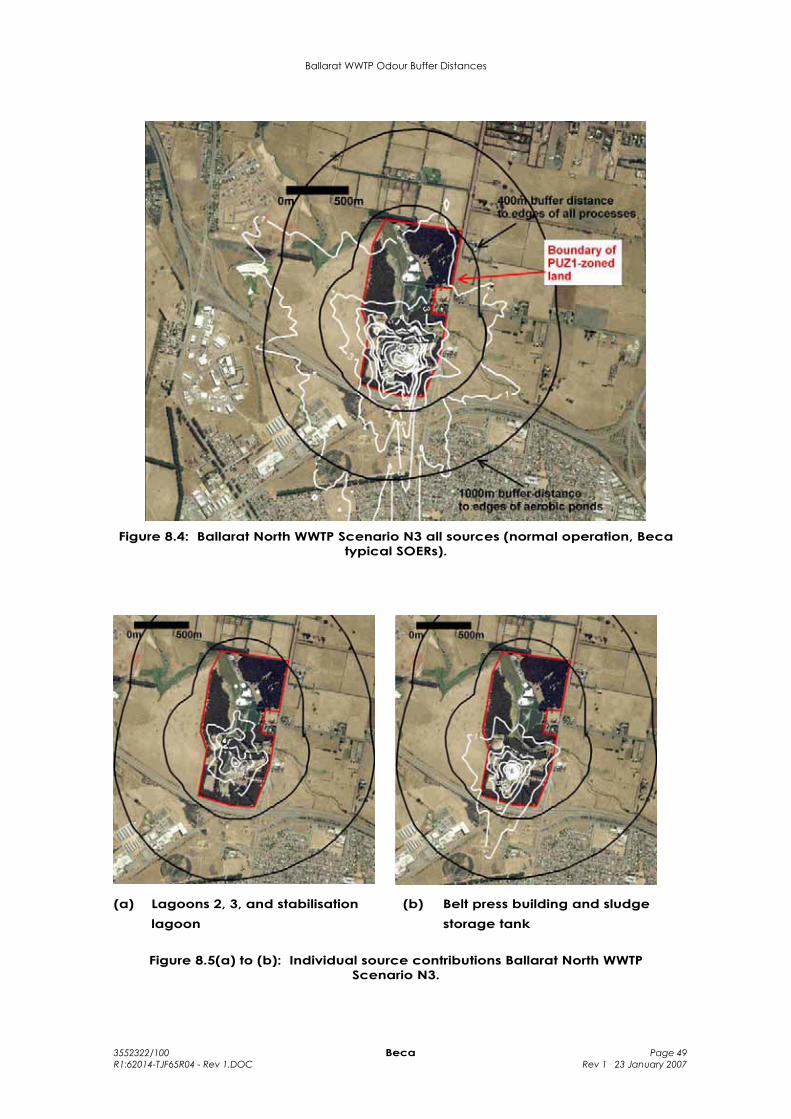
Ballarat WWTP Odour Buffer Distances
3552322/100 Beca Page 49 R1:62014-TJF65R04 - Rev 1.DOC Rev 1 23 January 2007
Figure 8.4: Ballarat North WWTP Scenario N3 all sources (normal operation, Beca typical SOERs).
(a) Lagoons 2, 3, and stabilisation lagoon
(b) Belt press building and sludge storage tank
Figure 8.5(a) to (b): Individual source contributions Ballarat North WWTP Scenario N3.

Ballarat WWTP Odour Buffer Distances
3552322/100 Beca Page 50 R1:62014-TJF65R04 - Rev 1.DOC Rev 1 23 January 2007
(c) PSTs only (d) Trickling filters only
Figure 8.5(c) to (d): Individual source contributions Ballarat North WWTP Scenario N3.
Figure 8.6: Ballarat North WWTP Scenario N3 all sources excluding inlet works and trickling filters, and with odour from belt press building reduced by 90%.

Ballarat WWTP Odour Buffer Distances
3552322/100 Beca Page 51 R1:62014-TJF65R04 - Rev 1.DOC Rev 1 23 January 2007
8.3 Model Results: Scenario N2 – Ballarat North WWTP upset operation GHD SOERs
The dispersion model results for Scenario N2 for the 99.5th, 99.8th, and 99.9th percentiles shown in Figures 8.7(a) to (c). The model predicts odour concentrations of about 3-7 OU at the PUZ1 boundary depending on the percentile selected.
(a) 99.5th percentile (b) 99.8th percentile
(c) 99.9th percentile
Figure 8.7: Ballarat North WWTP Scenario N2 all sources for 99.5th, 99.8th and 99.9th
percentiles.
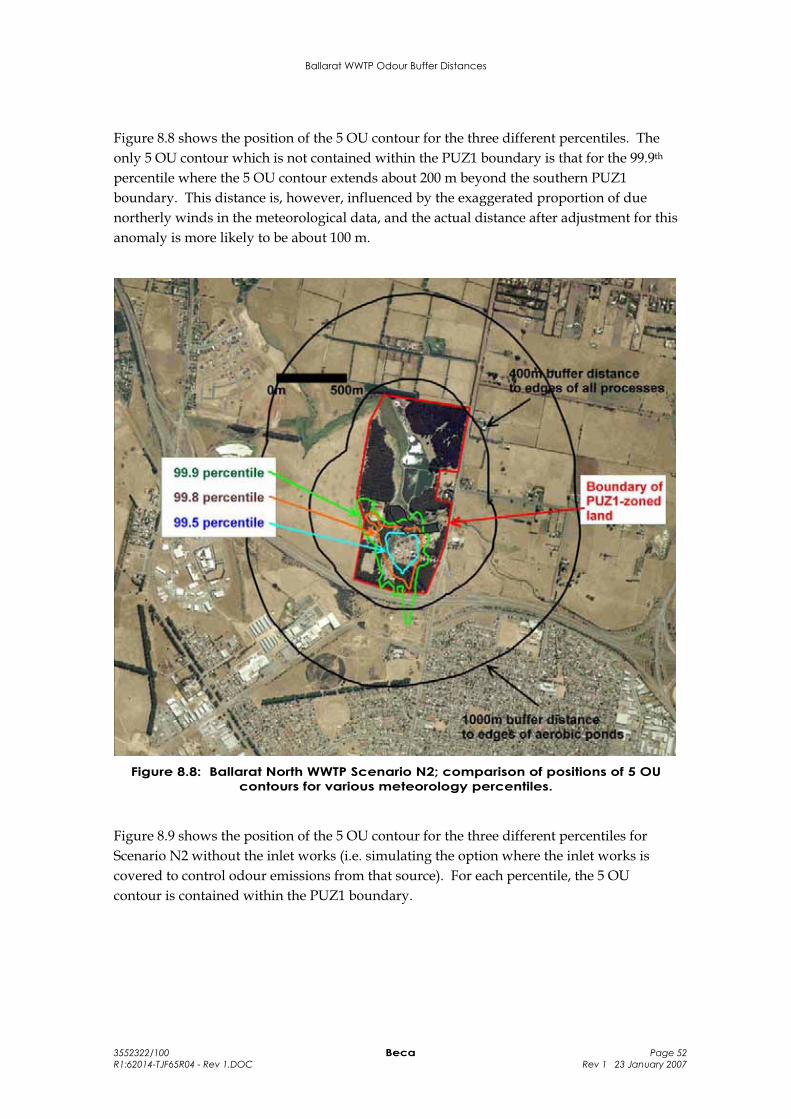
Ballarat WWTP Odour Buffer Distances
3552322/100 Beca Page 52 R1:62014-TJF65R04 - Rev 1.DOC Rev 1 23 January 2007
Figure 8.8 shows the position of the 5 OU contour for the three different percentiles. The only 5 OU contour which is not contained within the PUZ1 boundary is that for the 99.9th
percentile where the 5 OU contour extends about 200 m beyond the southern PUZ1 boundary. This distance is, however, influenced by the exaggerated proportion of due northerly winds in the meteorological data, and the actual distance after adjustment for this anomaly is more likely to be about 100 m.
Figure 8.8: Ballarat North WWTP Scenario N2; comparison of positions of 5 OU contours for various meteorology percentiles.
Figure 8.9 shows the position of the 5 OU contour for the three different percentiles for Scenario N2 without the inlet works (i.e. simulating the option where the inlet works is covered to control odour emissions from that source). For each percentile, the 5 OU contour is contained within the PUZ1 boundary.
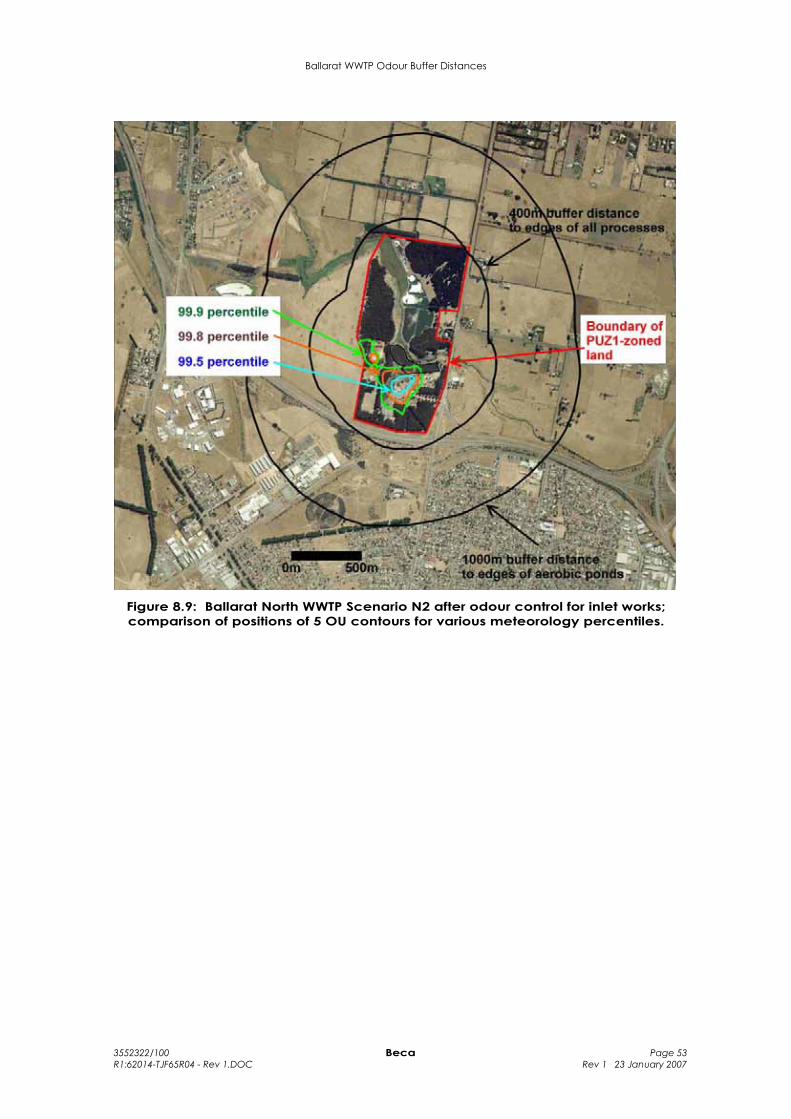
Ballarat WWTP Odour Buffer Distances
3552322/100 Beca Page 53 R1:62014-TJF65R04 - Rev 1.DOC Rev 1 23 January 2007
Figure 8.9: Ballarat North WWTP Scenario N2 after odour control for inlet works; comparison of positions of 5 OU contours for various meteorology percentiles.
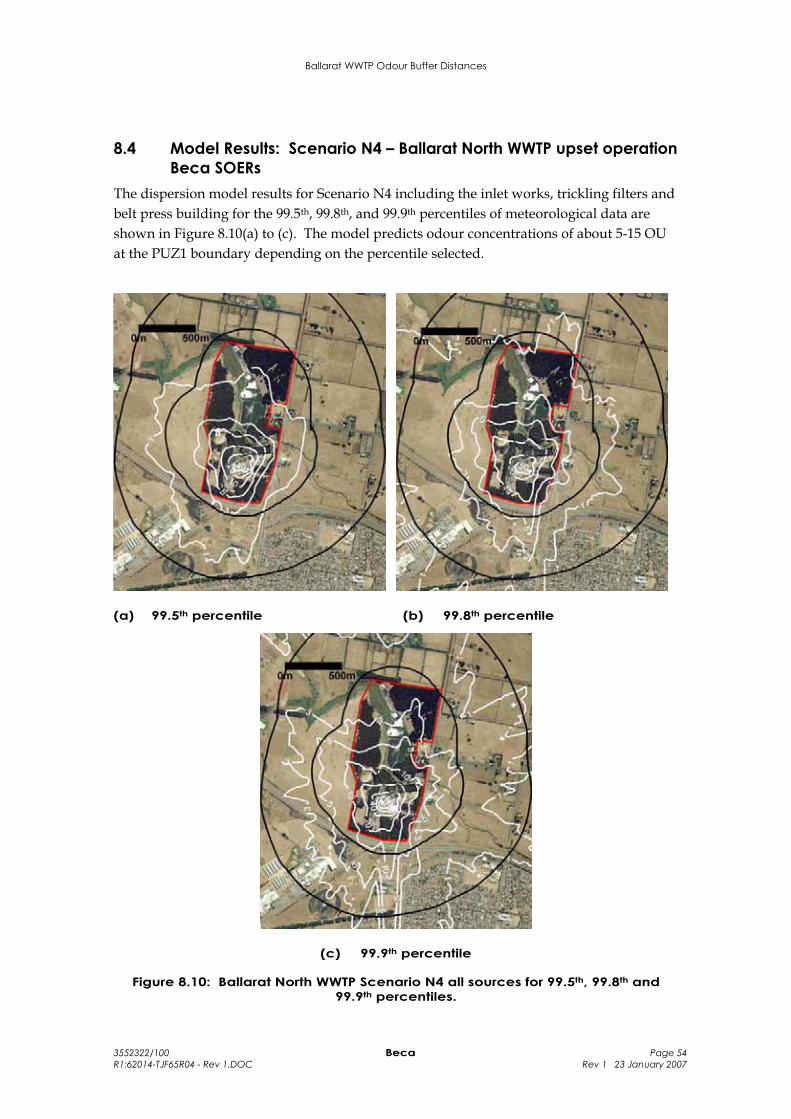
Ballarat WWTP Odour Buffer Distances
3552322/100 Beca Page 54 R1:62014-TJF65R04 - Rev 1.DOC Rev 1 23 January 2007
8.4 Model Results: Scenario N4 – Ballarat North WWTP upset operation Beca SOERs
The dispersion model results for Scenario N4 including the inlet works, trickling filters and belt press building for the 99.5th, 99.8th, and 99.9th percentiles of meteorological data are shown in Figure 8.10(a) to (c). The model predicts odour concentrations of about 5-15 OU at the PUZ1 boundary depending on the percentile selected.
(a) 99.5th percentile (b) 99.8th percentile
(c) 99.9th percentile
Figure 8.10: Ballarat North WWTP Scenario N4 all sources for 99.5th, 99.8th and 99.9th percentiles.
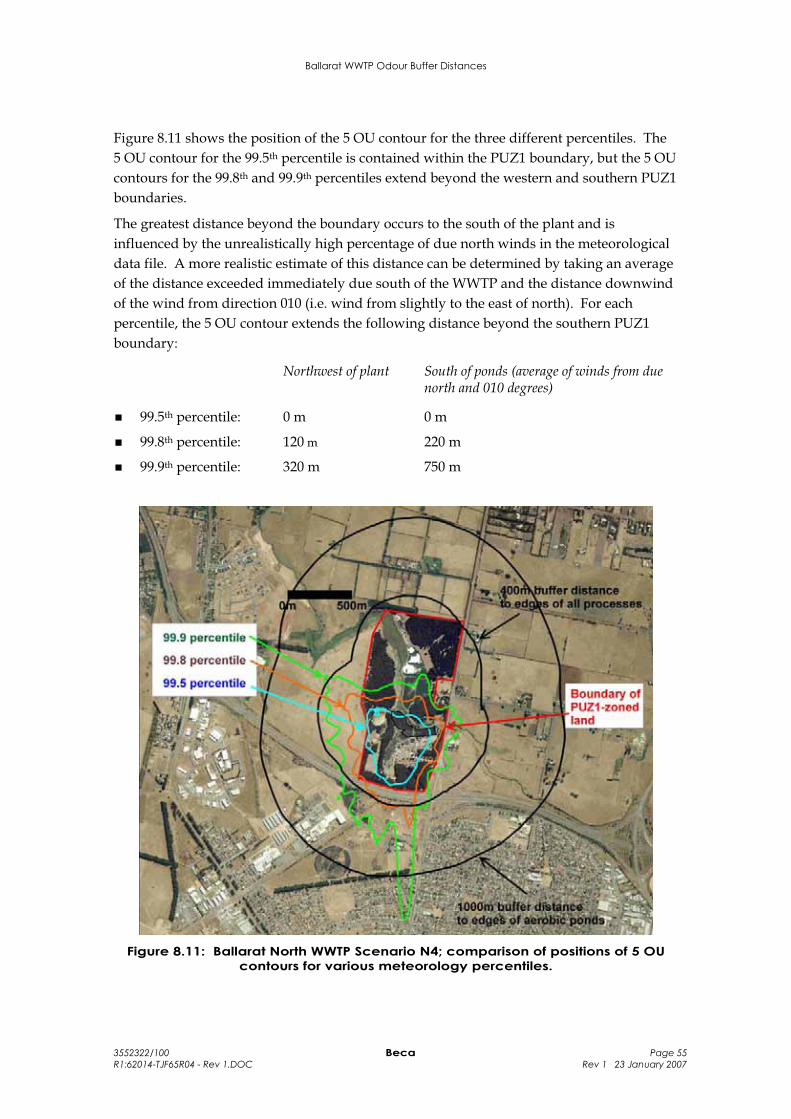
Ballarat WWTP Odour Buffer Distances
3552322/100 Beca Page 55 R1:62014-TJF65R04 - Rev 1.DOC Rev 1 23 January 2007
Figure 8.11 shows the position of the 5 OU contour for the three different percentiles. The 5 OU contour for the 99.5th percentile is contained within the PUZ1 boundary, but the 5 OU contours for the 99.8th and 99.9th percentiles extend beyond the western and southern PUZ1 boundaries.
The greatest distance beyond the boundary occurs to the south of the plant and is influenced by the unrealistically high percentage of due north winds in the meteorological data file. A more realistic estimate of this distance can be determined by taking an average of the distance exceeded immediately due south of the WWTP and the distance downwind of the wind from direction 010 (i.e. wind from slightly to the east of north). For each percentile, the 5 OU contour extends the following distance beyond the southern PUZ1 boundary:
Northwest of plant South of ponds (average of winds from due north and 010 degrees)
99.5th percentile: 0 m 0 m
99.8th percentile: 120 m 220 m
99.9th percentile: 320 m 750 m
Figure 8.11: Ballarat North WWTP Scenario N4; comparison of positions of 5 OU contours for various meteorology percentiles.
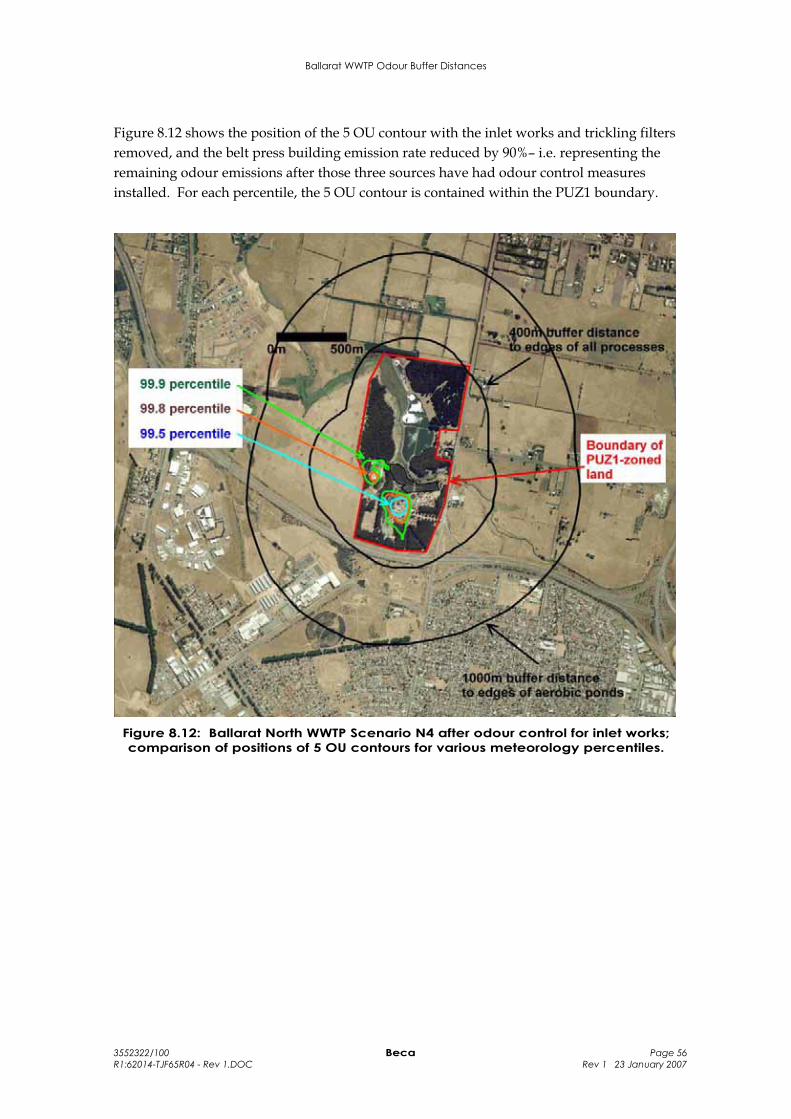
Ballarat WWTP Odour Buffer Distances
3552322/100 Beca Page 56 R1:62014-TJF65R04 - Rev 1.DOC Rev 1 23 January 2007
Figure 8.12 shows the position of the 5 OU contour with the inlet works and trickling filters removed, and the belt press building emission rate reduced by 90%– i.e. representing the remaining odour emissions after those three sources have had odour control measures installed. For each percentile, the 5 OU contour is contained within the PUZ1 boundary.
Figure 8.12: Ballarat North WWTP Scenario N4 after odour control for inlet works; comparison of positions of 5 OU contours for various meteorology percentiles.
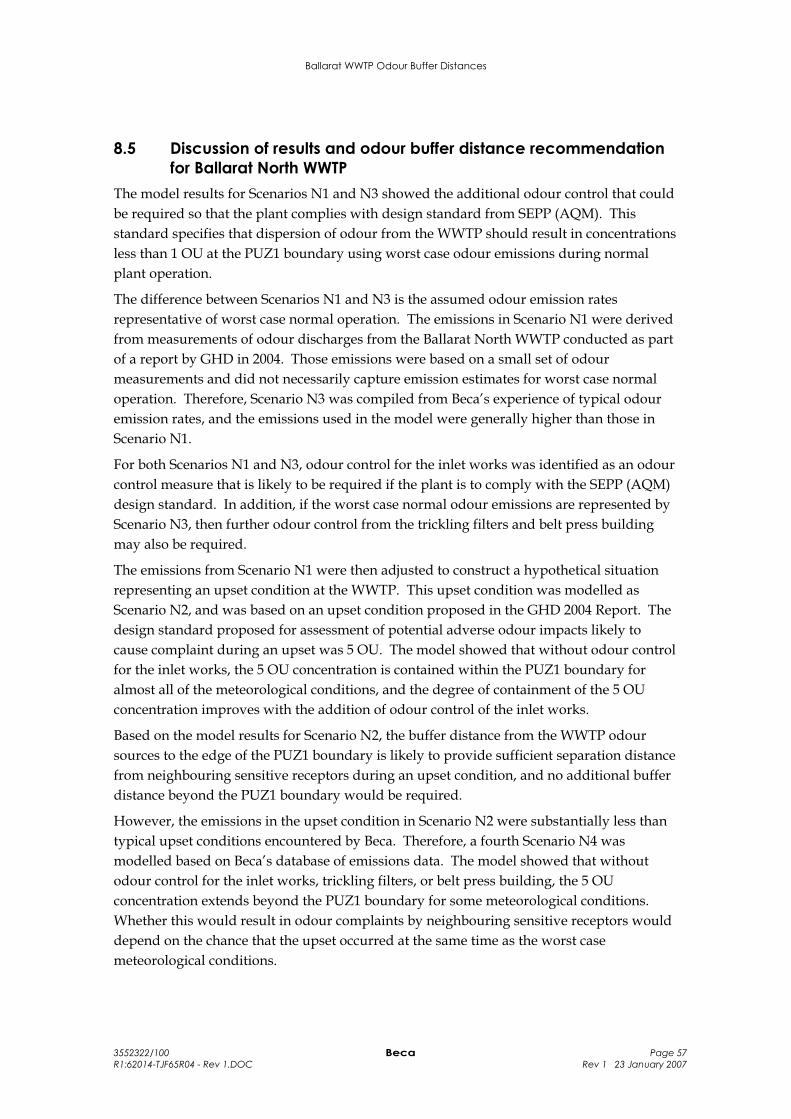
Ballarat WWTP Odour Buffer Distances
3552322/100 Beca Page 57 R1:62014-TJF65R04 - Rev 1.DOC Rev 1 23 January 2007
8.5 Discussion of results and odour buffer distance recommendation for Ballarat North WWTP
The model results for Scenarios N1 and N3 showed the additional odour control that could be required so that the plant complies with design standard from SEPP (AQM). This standard specifies that dispersion of odour from the WWTP should result in concentrations less than 1 OU at the PUZ1 boundary using worst case odour emissions during normal plant operation.
The difference between Scenarios N1 and N3 is the assumed odour emission rates representative of worst case normal operation. The emissions in Scenario N1 were derived from measurements of odour discharges from the Ballarat North WWTP conducted as part of a report by GHD in 2004. Those emissions were based on a small set of odour measurements and did not necessarily capture emission estimates for worst case normal operation. Therefore, Scenario N3 was compiled from Beca’s experience of typical odour emission rates, and the emissions used in the model were generally higher than those in Scenario N1.
For both Scenarios N1 and N3, odour control for the inlet works was identified as an odour control measure that is likely to be required if the plant is to comply with the SEPP (AQM) design standard. In addition, if the worst case normal odour emissions are represented by Scenario N3, then further odour control from the trickling filters and belt press building may also be required.
The emissions from Scenario N1 were then adjusted to construct a hypothetical situation representing an upset condition at the WWTP. This upset condition was modelled as Scenario N2, and was based on an upset condition proposed in the GHD 2004 Report. The design standard proposed for assessment of potential adverse odour impacts likely to cause complaint during an upset was 5 OU. The model showed that without odour control for the inlet works, the 5 OU concentration is contained within the PUZ1 boundary for almost all of the meteorological conditions, and the degree of containment of the 5 OU concentration improves with the addition of odour control of the inlet works.
Based on the model results for Scenario N2, the buffer distance from the WWTP odour sources to the edge of the PUZ1 boundary is likely to provide sufficient separation distance from neighbouring sensitive receptors during an upset condition, and no additional buffer distance beyond the PUZ1 boundary would be required.
However, the emissions in the upset condition in Scenario N2 were substantially less than typical upset conditions encountered by Beca. Therefore, a fourth Scenario N4 was modelled based on Beca’s database of emissions data. The model showed that without odour control for the inlet works, trickling filters, or belt press building, the 5 OU concentration extends beyond the PUZ1 boundary for some meteorological conditions. Whether this would result in odour complaints by neighbouring sensitive receptors would depend on the chance that the upset occurred at the same time as the worst case meteorological conditions.
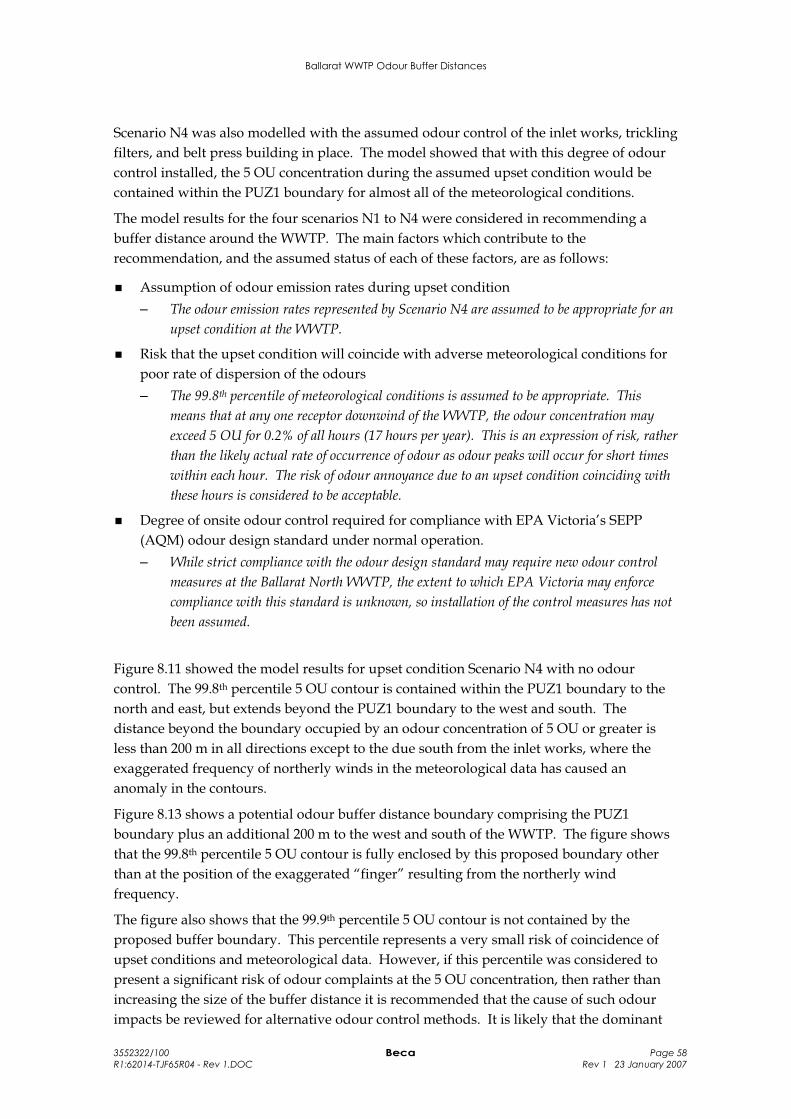
Ballarat WWTP Odour Buffer Distances
3552322/100 Beca Page 58 R1:62014-TJF65R04 - Rev 1.DOC Rev 1 23 January 2007
Scenario N4 was also modelled with the assumed odour control of the inlet works, trickling filters, and belt press building in place. The model showed that with this degree of odour control installed, the 5 OU concentration during the assumed upset condition would be contained within the PUZ1 boundary for almost all of the meteorological conditions.
The model results for the four scenarios N1 to N4 were considered in recommending a buffer distance around the WWTP. The main factors which contribute to the recommendation, and the assumed status of each of these factors, are as follows:
Assumption of odour emission rates during upset condition – The odour emission rates represented by Scenario N4 are assumed to be appropriate for an
upset condition at the WWTP.
Risk that the upset condition will coincide with adverse meteorological conditions for poor rate of dispersion of the odours – The 99.8th percentile of meteorological conditions is assumed to be appropriate. This
means that at any one receptor downwind of the WWTP, the odour concentration may exceed 5 OU for 0.2% of all hours (17 hours per year). This is an expression of risk, rather than the likely actual rate of occurrence of odour as odour peaks will occur for short times within each hour. The risk of odour annoyance due to an upset condition coinciding with these hours is considered to be acceptable.
Degree of onsite odour control required for compliance with EPA Victoria’s SEPP (AQM) odour design standard under normal operation. – While strict compliance with the odour design standard may require new odour control
measures at the Ballarat North WWTP, the extent to which EPA Victoria may enforce compliance with this standard is unknown, so installation of the control measures has not been assumed.
Figure 8.11 showed the model results for upset condition Scenario N4 with no odour control. The 99.8th percentile 5 OU contour is contained within the PUZ1 boundary to the north and east, but extends beyond the PUZ1 boundary to the west and south. The distance beyond the boundary occupied by an odour concentration of 5 OU or greater is less than 200 m in all directions except to the due south from the inlet works, where the exaggerated frequency of northerly winds in the meteorological data has caused an anomaly in the contours.
Figure 8.13 shows a potential odour buffer distance boundary comprising the PUZ1 boundary plus an additional 200 m to the west and south of the WWTP. The figure shows that the 99.8th percentile 5 OU contour is fully enclosed by this proposed boundary other than at the position of the exaggerated “finger” resulting from the northerly wind frequency.
The figure also shows that the 99.9th percentile 5 OU contour is not contained by the proposed buffer boundary. This percentile represents a very small risk of coincidence of upset conditions and meteorological data. However, if this percentile was considered to present a significant risk of odour complaints at the 5 OU concentration, then rather than increasing the size of the buffer distance it is recommended that the cause of such odour impacts be reviewed for alternative odour control methods. It is likely that the dominant
Ballarat WWTP Odour Buffer Distances
3552322/100 Beca Page 59 R1:62014-TJF65R04 - Rev 1.DOC Rev 1 23 January 2007
odour sources during such upsets would be controlled by the same odour control measures discussed above for the normal operation of the WWTP that may be required to meet the SEPP (AQM) design criteria.
Based on this discussion, the proposed boundary shown in Figure 8.13 is recommended as the buffer distance for the Ballarat North WWTP. The position of the boundary is shown in Figures 8.14a and 8.14b without the underlying odour model concentrations.
Figure 8.13: Proposed odour buffer boundary with underlying 5 OU contours from Ballarat North WWTP Scenario N4.
Ballarat WWTP Odour Buffer Distances
3552322/100 Beca Page 60 R1:62014-TJF65R04 - Rev 1.DOC Rev 1 23 January 2007
Figure 8.14a: Proposed odour buffer boundary for Ballarat North WWTP - Aerial.
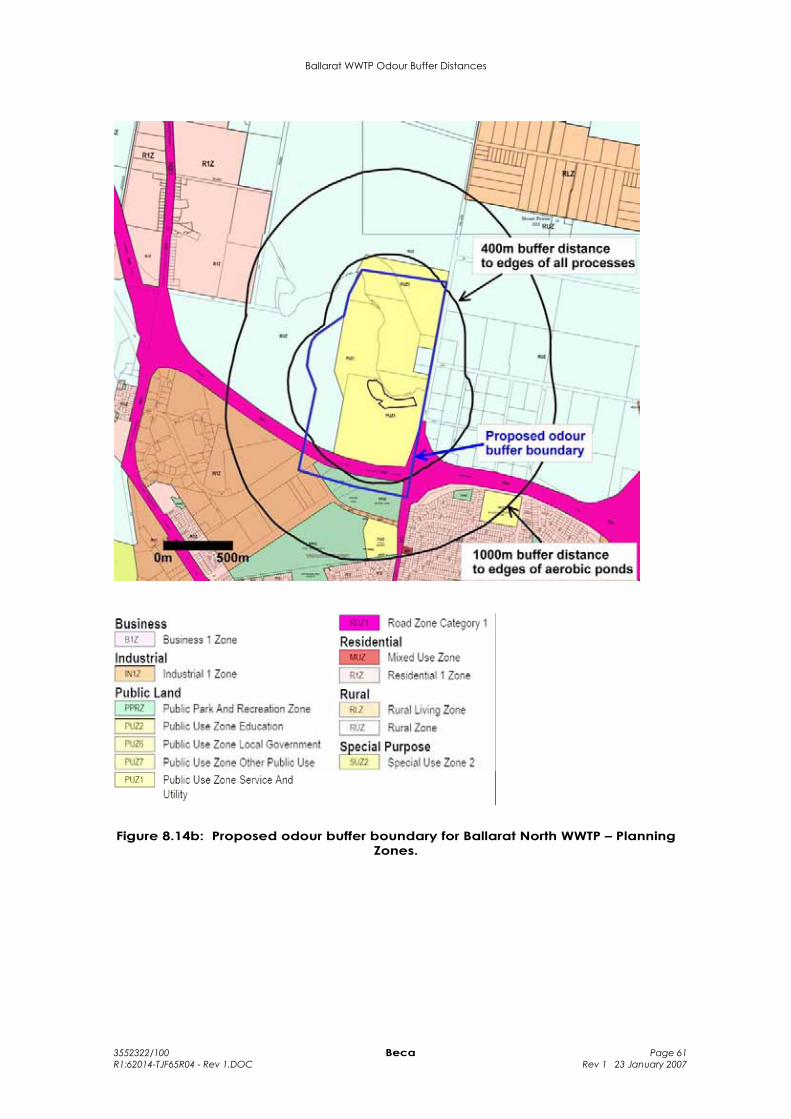
Ballarat WWTP Odour Buffer Distances
3552322/100 Beca Page 61 R1:62014-TJF65R04 - Rev 1.DOC Rev 1 23 January 2007
Figure 8.14b: Proposed odour buffer boundary for Ballarat North WWTP – Planning Zones.
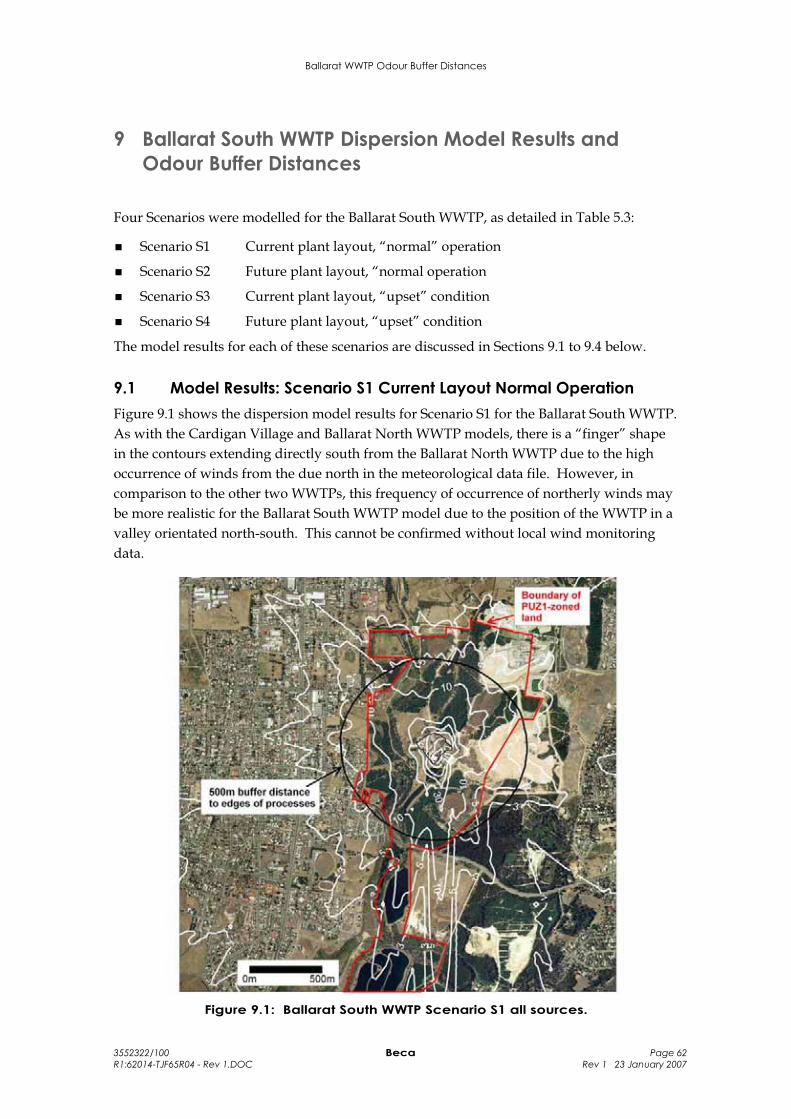
Ballarat WWTP Odour Buffer Distances
3552322/100 Beca Page 62 R1:62014-TJF65R04 - Rev 1.DOC Rev 1 23 January 2007
9 Ballarat South WWTP Dispersion Model Results and Odour Buffer Distances
Four Scenarios were modelled for the Ballarat South WWTP, as detailed in Table 5.3:
Scenario S1 Current plant layout, “normal” operation
Scenario S2 Future plant layout, “normal operation
Scenario S3 Current plant layout, “upset” condition
Scenario S4 Future plant layout, “upset” condition
The model results for each of these scenarios are discussed in Sections 9.1 to 9.4 below.
9.1 Model Results: Scenario S1 Current Layout Normal Operation Figure 9.1 shows the dispersion model results for Scenario S1 for the Ballarat South WWTP. As with the Cardigan Village and Ballarat North WWTP models, there is a “finger” shape in the contours extending directly south from the Ballarat North WWTP due to the high occurrence of winds from the due north in the meteorological data file. However, in comparison to the other two WWTPs, this frequency of occurrence of northerly winds may be more realistic for the Ballarat South WWTP model due to the position of the WWTP in a valley orientated north-south. This cannot be confirmed without local wind monitoring data.
Figure 9.1: Ballarat South WWTP Scenario S1 all sources.

Ballarat WWTP Odour Buffer Distances
3552322/100 Beca Page 63 R1:62014-TJF65R04 - Rev 1.DOC Rev 1 23 January 2007
The model results represent odour concentrations from normal operation of the Ballarat South WWTP, for which the design target for normal operation is 1 OU at the PUZ1 boundary. In Scenario S1 the odour concentration at this boundary is 10 OU both to the northwest and southeast of the plant, and about 15 OU to the south of the plant. The 1 OU concentration contour appears to extend well over 1000 m beyond the PUZ1 boundary.
Figures 9.2(a) to (f) show the concentration contours for Scenario S1 for various individual and groups of odour sources. The most dominant odour sources appear to be the preanoxic and anaerobic tanks, and the aerated tanks/bioreactor (of which the anoxic zone sections are the dominant odour source).
(a) Inlet works only (b) Inlet works, PSTs, flow balance tank
(c) Preanoxic and anaerobic tanks (d) Aerated tanks and bioreactor
Figure 9.2(a) to (d): Individual source contributions Ballarat South WWTP Scenario S1.

Ballarat WWTP Odour Buffer Distances
3552322/100 Beca Page 64 R1:62014-TJF65R04 - Rev 1.DOC Rev 1 23 January 2007
(e) Clarifiers, lagoons, and DAF tank (f) Belt press building and sludge storage tank
Figure 9.2(e) to (f): Individual source contributions Ballarat North WWTP Scenario N1.
If the Ballarat South WWTP is to demonstrate that it can meet the 1 OU design concentration at the PUZ1 boundary, then either more appropriate SOERs must be justified (through sufficient on-site testing to identify worst case normal operation SOERs), or odour control measures need to be introduced. For example, Figure 9.3 shows the dispersion model results after the odour emissions from the preanoxic tank, anaerobic tank, and anoxic zones of the bioreactor are removed, either through covering or process modification. The boundary odour concentration is reduced to 3 OU.
To reduce the boundary odour concentration to 1 OU for the model with these assumed SOERs, then additional odour control such as reduction or removal of the inlet works, PSTs, and flow balancing tank may be required as well. The results of the odour model with all of these odour sources removed is shown in Figure 9.4. The boundary odour concentration both to the northwest and south of the plant is reduced to 1.3 OU.
The model does not indicate that odour control at the belt press building is likely to be required. This is most likely to be due to the operation of the belt presses only during the day, so that the building is not operational (and therefore assumed to have a nil odour emission rate) during early evening, nighttime, and sunrise times when the rate dispersion of odour tends to be the poorest due to meteorological conditions which set in at these times.
Clearly some odour mitigation may be required at the Ballarat South WWTP if the design standard of 1 OU is to be met at the PUZ1 boundary. It is beyond the scope of this report to make a definitive recommendation as to the degree of odour control required, as such recommendations would require a comprehensive suite of odour measurements to determine the actual worst case SOERs under normal operation conditions, and a review of the treatment process at the site (residence times, process flows, aeration regimes, etc).
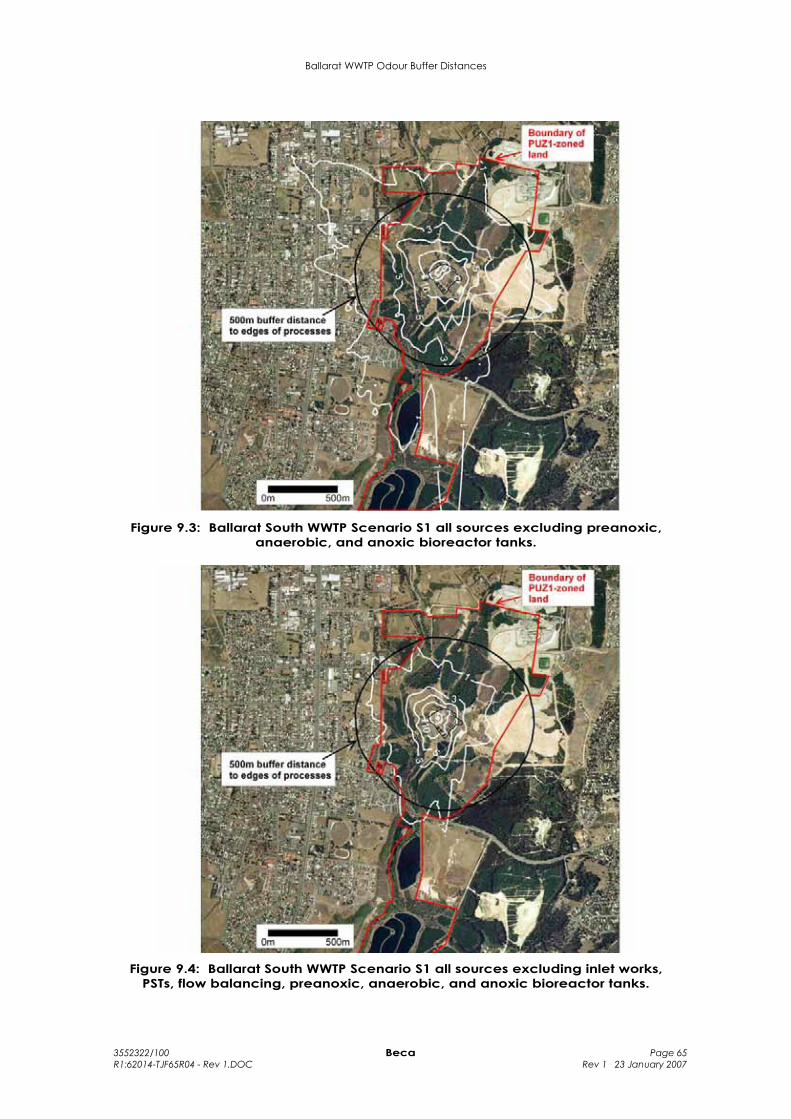
Ballarat WWTP Odour Buffer Distances
3552322/100 Beca Page 65 R1:62014-TJF65R04 - Rev 1.DOC Rev 1 23 January 2007
Figure 9.3: Ballarat South WWTP Scenario S1 all sources excluding preanoxic, anaerobic, and anoxic bioreactor tanks.
Figure 9.4: Ballarat South WWTP Scenario S1 all sources excluding inlet works, PSTs, flow balancing, preanoxic, anaerobic, and anoxic bioreactor tanks.
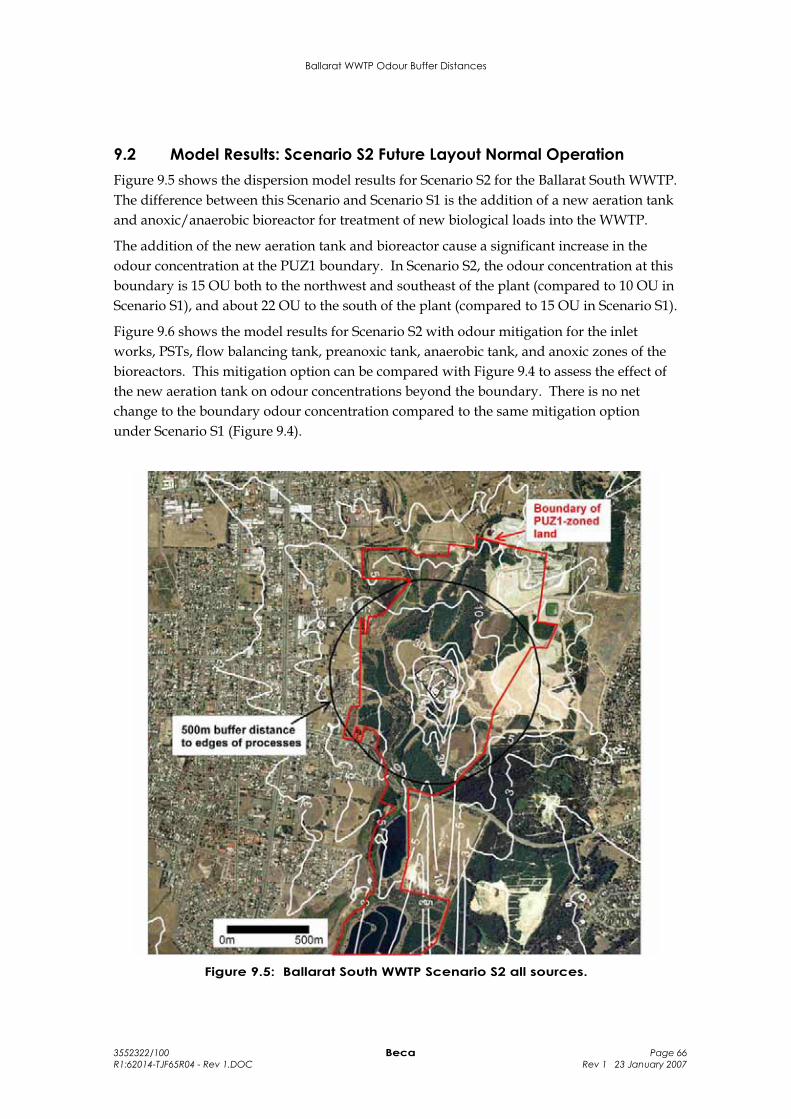
Ballarat WWTP Odour Buffer Distances
3552322/100 Beca Page 66 R1:62014-TJF65R04 - Rev 1.DOC Rev 1 23 January 2007
9.2 Model Results: Scenario S2 Future Layout Normal Operation Figure 9.5 shows the dispersion model results for Scenario S2 for the Ballarat South WWTP. The difference between this Scenario and Scenario S1 is the addition of a new aeration tank and anoxic/anaerobic bioreactor for treatment of new biological loads into the WWTP.
The addition of the new aeration tank and bioreactor cause a significant increase in the odour concentration at the PUZ1 boundary. In Scenario S2, the odour concentration at this boundary is 15 OU both to the northwest and southeast of the plant (compared to 10 OU in Scenario S1), and about 22 OU to the south of the plant (compared to 15 OU in Scenario S1).
Figure 9.6 shows the model results for Scenario S2 with odour mitigation for the inlet works, PSTs, flow balancing tank, preanoxic tank, anaerobic tank, and anoxic zones of the bioreactors. This mitigation option can be compared with Figure 9.4 to assess the effect of the new aeration tank on odour concentrations beyond the boundary. There is no net change to the boundary odour concentration compared to the same mitigation option under Scenario S1 (Figure 9.4).
Figure 9.5: Ballarat South WWTP Scenario S2 all sources.
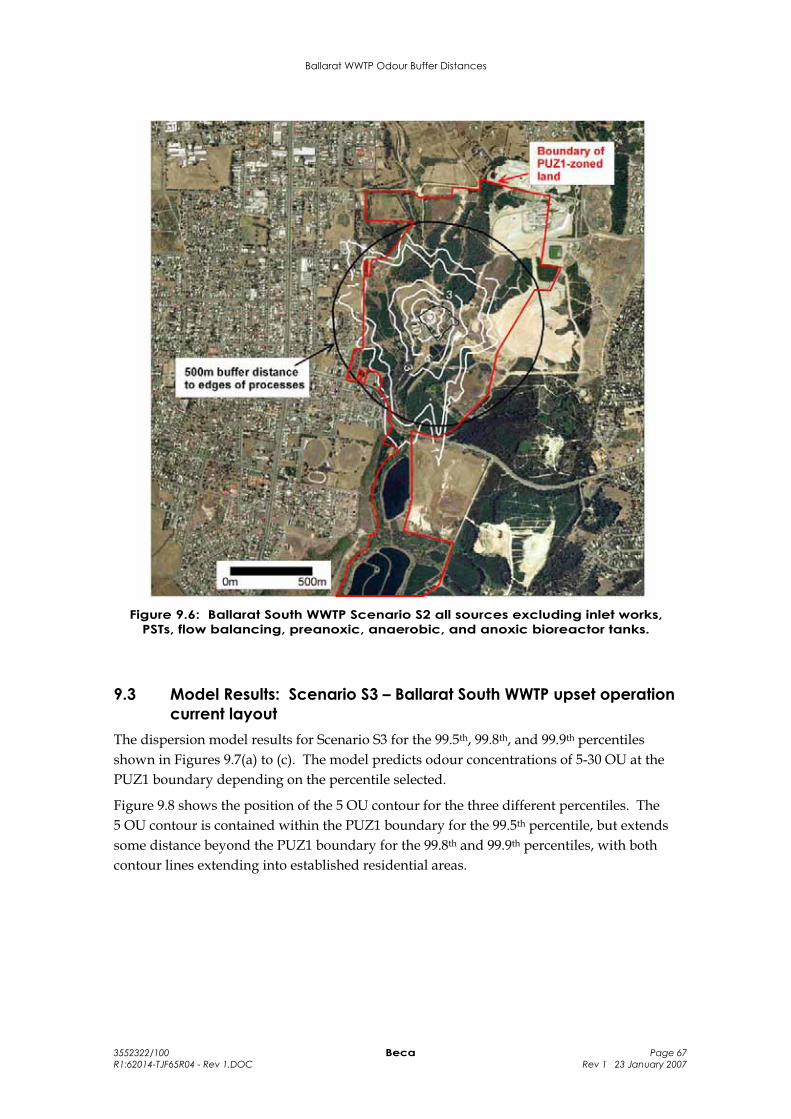
Ballarat WWTP Odour Buffer Distances
3552322/100 Beca Page 67 R1:62014-TJF65R04 - Rev 1.DOC Rev 1 23 January 2007
Figure 9.6: Ballarat South WWTP Scenario S2 all sources excluding inlet works, PSTs, flow balancing, preanoxic, anaerobic, and anoxic bioreactor tanks.
9.3 Model Results: Scenario S3 – Ballarat South WWTP upset operation current layout
The dispersion model results for Scenario S3 for the 99.5th, 99.8th, and 99.9th percentiles shown in Figures 9.7(a) to (c). The model predicts odour concentrations of 5-30 OU at the PUZ1 boundary depending on the percentile selected.
Figure 9.8 shows the position of the 5 OU contour for the three different percentiles. The 5 OU contour is contained within the PUZ1 boundary for the 99.5th percentile, but extends some distance beyond the PUZ1 boundary for the 99.8th and 99.9th percentiles, with both contour lines extending into established residential areas.
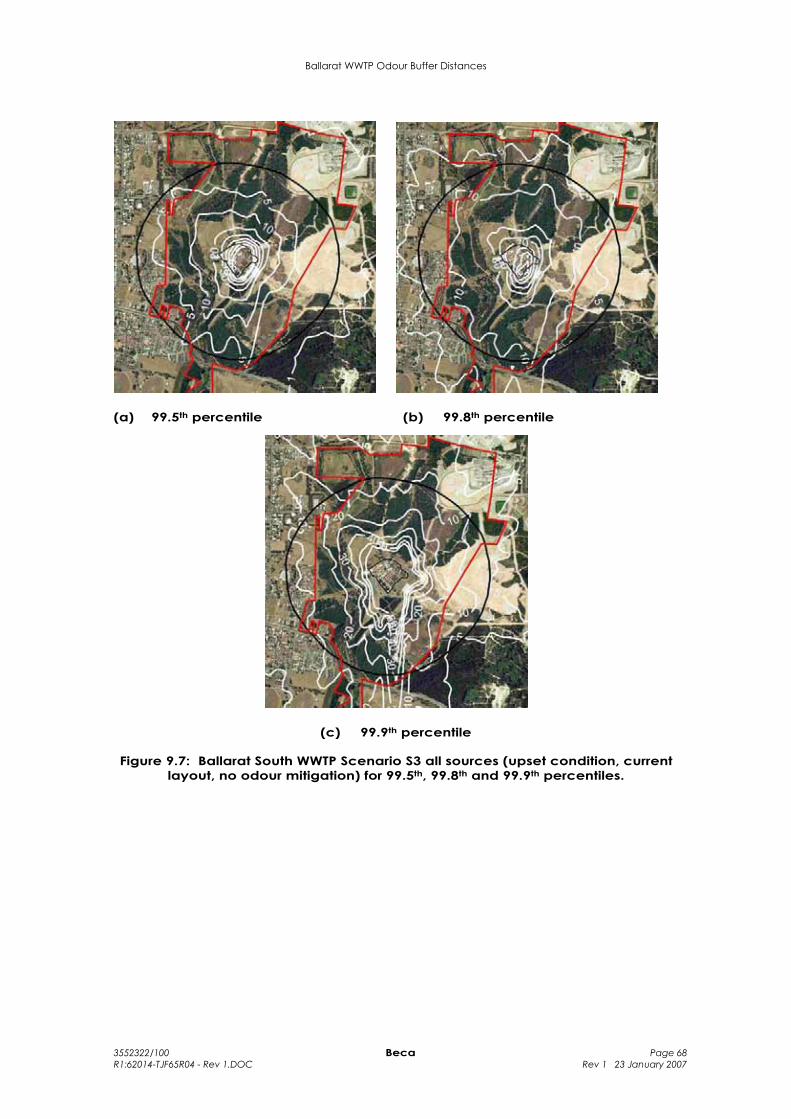
Ballarat WWTP Odour Buffer Distances
3552322/100 Beca Page 68 R1:62014-TJF65R04 - Rev 1.DOC Rev 1 23 January 2007
(a) 99.5th percentile (b) 99.8th percentile
(c) 99.9th percentile
Figure 9.7: Ballarat South WWTP Scenario S3 all sources (upset condition, current layout, no odour mitigation) for 99.5th, 99.8th and 99.9th percentiles.
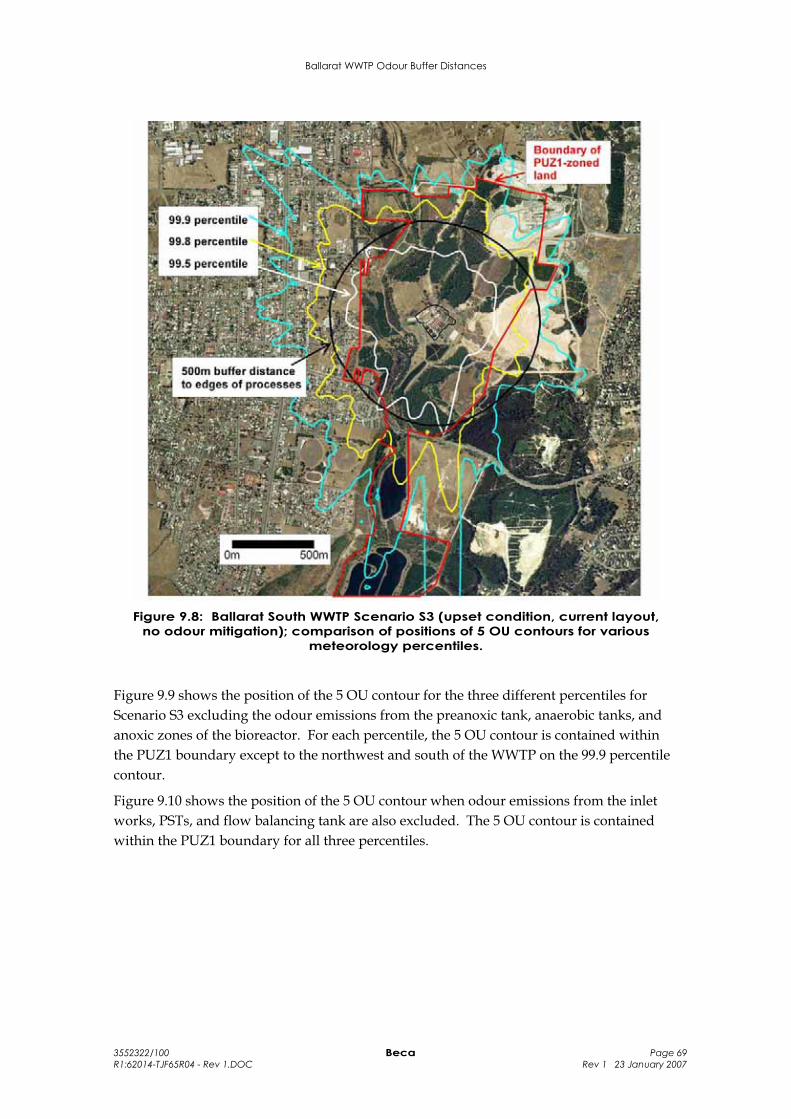
Ballarat WWTP Odour Buffer Distances
3552322/100 Beca Page 69 R1:62014-TJF65R04 - Rev 1.DOC Rev 1 23 January 2007
Figure 9.8: Ballarat South WWTP Scenario S3 (upset condition, current layout, no odour mitigation); comparison of positions of 5 OU contours for various
meteorology percentiles.
Figure 9.9 shows the position of the 5 OU contour for the three different percentiles for Scenario S3 excluding the odour emissions from the preanoxic tank, anaerobic tanks, and anoxic zones of the bioreactor. For each percentile, the 5 OU contour is contained within the PUZ1 boundary except to the northwest and south of the WWTP on the 99.9 percentile contour.
Figure 9.10 shows the position of the 5 OU contour when odour emissions from the inlet works, PSTs, and flow balancing tank are also excluded. The 5 OU contour is contained within the PUZ1 boundary for all three percentiles.
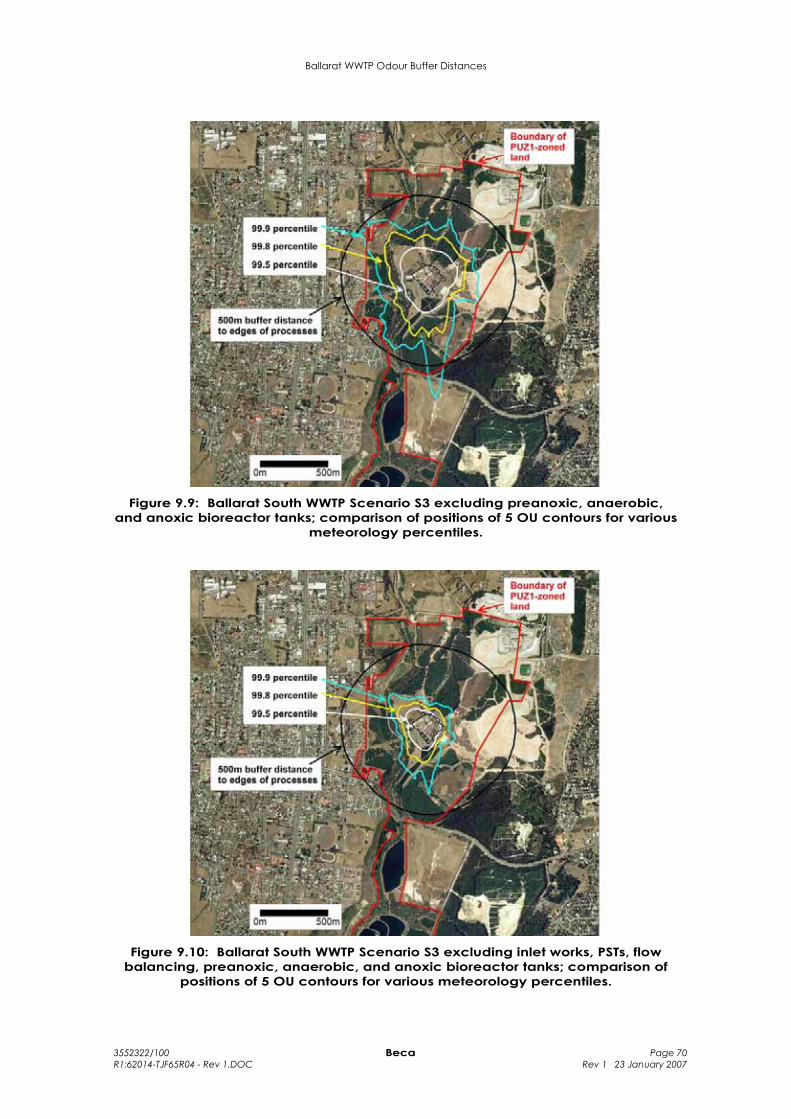
Ballarat WWTP Odour Buffer Distances
3552322/100 Beca Page 70 R1:62014-TJF65R04 - Rev 1.DOC Rev 1 23 January 2007
Figure 9.9: Ballarat South WWTP Scenario S3 excluding preanoxic, anaerobic, and anoxic bioreactor tanks; comparison of positions of 5 OU contours for various
meteorology percentiles.
Figure 9.10: Ballarat South WWTP Scenario S3 excluding inlet works, PSTs, flow balancing, preanoxic, anaerobic, and anoxic bioreactor tanks; comparison of
positions of 5 OU contours for various meteorology percentiles.
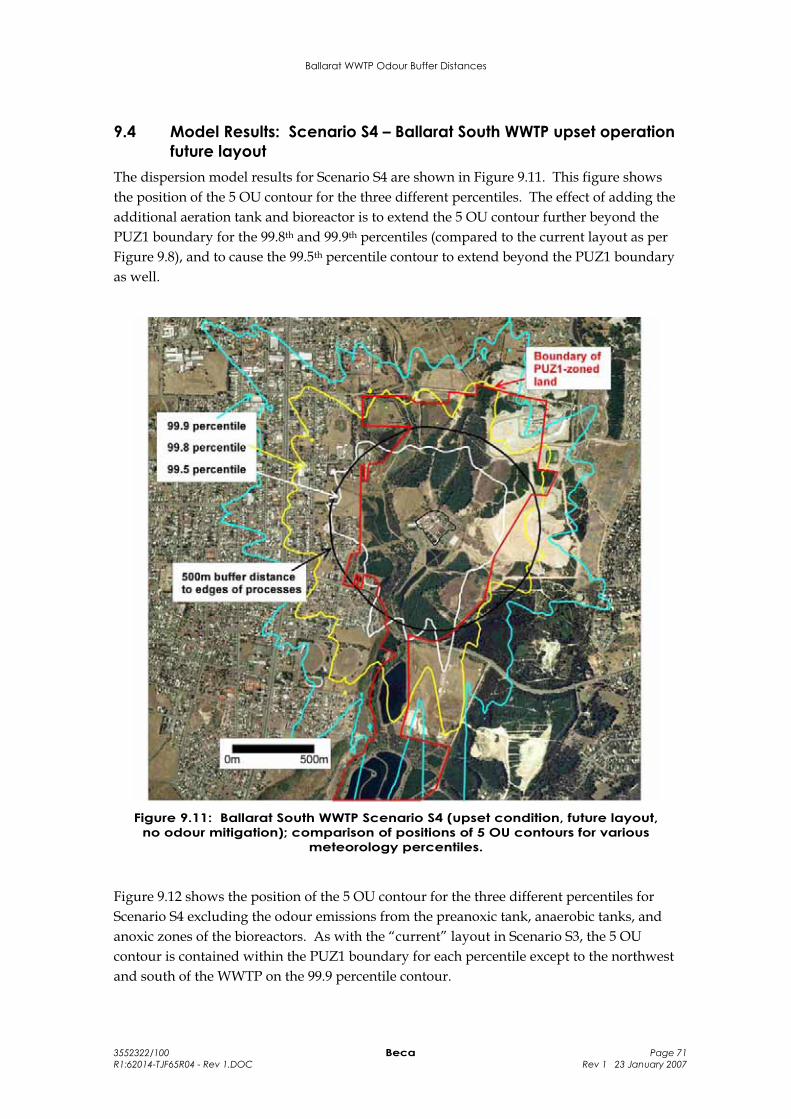
Ballarat WWTP Odour Buffer Distances
3552322/100 Beca Page 71 R1:62014-TJF65R04 - Rev 1.DOC Rev 1 23 January 2007
9.4 Model Results: Scenario S4 – Ballarat South WWTP upset operation future layout
The dispersion model results for Scenario S4 are shown in Figure 9.11. This figure shows the position of the 5 OU contour for the three different percentiles. The effect of adding the additional aeration tank and bioreactor is to extend the 5 OU contour further beyond the PUZ1 boundary for the 99.8th and 99.9th percentiles (compared to the current layout as per Figure 9.8), and to cause the 99.5th percentile contour to extend beyond the PUZ1 boundary as well.
Figure 9.11: Ballarat South WWTP Scenario S4 (upset condition, future layout, no odour mitigation); comparison of positions of 5 OU contours for various
meteorology percentiles.
Figure 9.12 shows the position of the 5 OU contour for the three different percentiles for Scenario S4 excluding the odour emissions from the preanoxic tank, anaerobic tanks, and anoxic zones of the bioreactors. As with the “current” layout in Scenario S3, the 5 OU contour is contained within the PUZ1 boundary for each percentile except to the northwest and south of the WWTP on the 99.9 percentile contour.
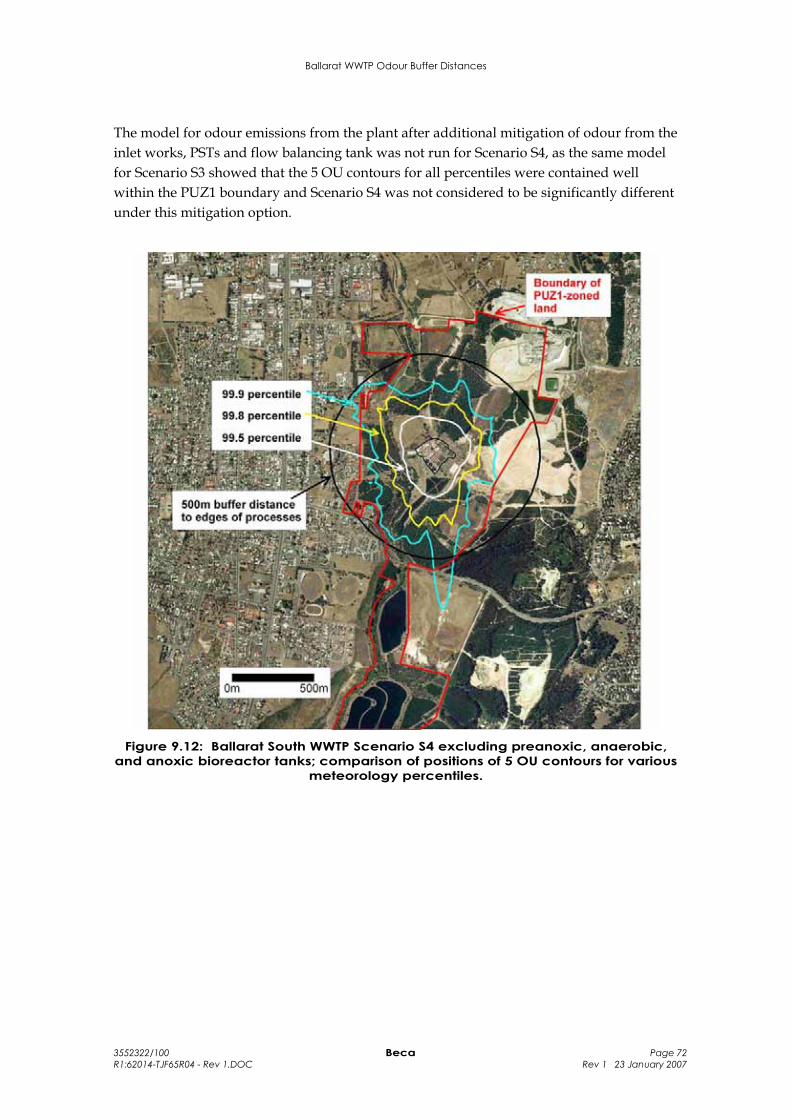
Ballarat WWTP Odour Buffer Distances
3552322/100 Beca Page 72 R1:62014-TJF65R04 - Rev 1.DOC Rev 1 23 January 2007
The model for odour emissions from the plant after additional mitigation of odour from the inlet works, PSTs and flow balancing tank was not run for Scenario S4, as the same model for Scenario S3 showed that the 5 OU contours for all percentiles were contained well within the PUZ1 boundary and Scenario S4 was not considered to be significantly different under this mitigation option.
Figure 9.12: Ballarat South WWTP Scenario S4 excluding preanoxic, anaerobic, and anoxic bioreactor tanks; comparison of positions of 5 OU contours for various
meteorology percentiles.
Ballarat WWTP Odour Buffer Distances
3552322/100 Beca Page 73 R1:62014-TJF65R04 - Rev 1.DOC Rev 1 23 January 2007
9.5 Discussion of results and odour buffer distance recommendation for Ballarat South WWTP
The recommendation of buffer distances for the Ballarat South WWTP is very dependent on the accuracy of assumptions of SOERs, whether the plant is to be required to comply with a modelling concentration of 1 OU at the PUZ1 boundary, and consequently the degree of odour control required to demonstrate this compliance.
Making the assumption that the SOERs used in the odour models in this report are realistic for worst case normal operation of this WWTP, then a substantial amount of odour control or process adjustment would be required to meet a 1 OU concentration at the PUZ1 boundary. At the very least, it may be necessary to cover the anaerobic and preanoxic tanks, and either cover or initiate some other kind of process control for the anoxic zones of the bioreactor. Once the odour from these sources is controlled, then the potential for increased odour emissions from the WWTP during a peak biological loading upset event is largely controlled as well. The dispersion model showed that with this degree of mitigation in place, the 5 OU contours were mostly contained within the PUZ1 boundary.
The dispersion model also showed that in order to demonstrate strict compliance with a concentration of 1 OU at the PUZ1 boundary during normal operation, then additional odour control for the inlet works, PSTs, and flow balancing tank may also be required. The dispersion model for the upset condition with this degree of odour control in place showed the 5 OU concentration contours being retained well within the PUZ1 boundary for all of the percentiles considered.
It is beyond the scope of this report to identify the likelihood of the plant being required to install the extent of odour control indicated by the mitigation options discussed above. If odour mitigation is required consistent with these options, then it is likely that no buffer distance for upset conditions will be required outside the PUZ1 boundary.
Recommendations for buffer distances have also be considered on the basis that the plant is not required to install any odour mitigation for the current plant, but is required to install some type of odour mitigation at the time of the construction of additional tanks for increased plant capacity, so that the net odour emission from the total plant is unchanged. That is, the recommendation for buffer distance boundaries has been based on the dispersion model for Scenario S3 (Figure 9.8).
Figure 9.13a shows the odour concentration contours from Figure 9.8 overlaid on a planning scheme map for the area around the WWTP. In this figure, the 99.9th percentile odour concentration contour has been removed as this is not considered to be a true reflection of reasonable risk of odour annoyance during upset conditions. The figure shows the land areas currently zoned for residential, industrial, rural, and other uses. Immediately adjacent to the PUZ1 zone where the WWTP is located, are zones for residential development (R1Z), industrial uses (IN1Z), public parks and recreation (PPRZ), rural living (RLZ), and general rural (RUZ). In recommending a possible buffer distance boundary, any land currently zoned for residential, rural living, and industrial land use has been excluded (i.e. the R1Z, IN1Z, and RLZ zones). Considering that the purpose of the buffer zone is to provide a means of separation between the WWTP and sensitive receptors
Ballarat WWTP Odour Buffer Distances
3552322/100 Beca Page 74 R1:62014-TJF65R04 - Rev 1.DOC Rev 1 23 January 2007
during upset conditions, rather than normal operating conditions, the public parks and recreation zones are considered as possibly suitable for part of the buffer distance around the WWTP.
Figure 9.13a also shows a possible buffer distance boundary over land around the WWTP zoned PPRZ or RUZ. The shape of the boundary reflects the dominance of winds from the north, and also the tendency observed in the model results for the odour contours to extend further towards the northwest than in other directions. However, the availability of buffer land to the northwest of the WWTP is limited due to the current zoning of that land.
The position of the eastern edge of the buffer area boundary should be regarded as approximate only, and would need to be confirmed through further investigations of odour emissions and odour control for the site, and also after seeking the appropriate planning advice and consultation with the land owners.
The most useful land to identify as buffer area would be the RUZ rural land shown within the buffer boundary in Figure 9.13a to the south of Mount Clear – Sebastopol Road, as this is the downwind direction under the prevailing northerly wind. These winds are likely to be particularly dominant during low wind speed conditions at the Ballarat South WWTP site due to the north-south orientation of the valley in which the WWTP is located.
Figure 9.13b shows the recommended odour buffer distance for the Ballarat South WWTP on an aerial plan.
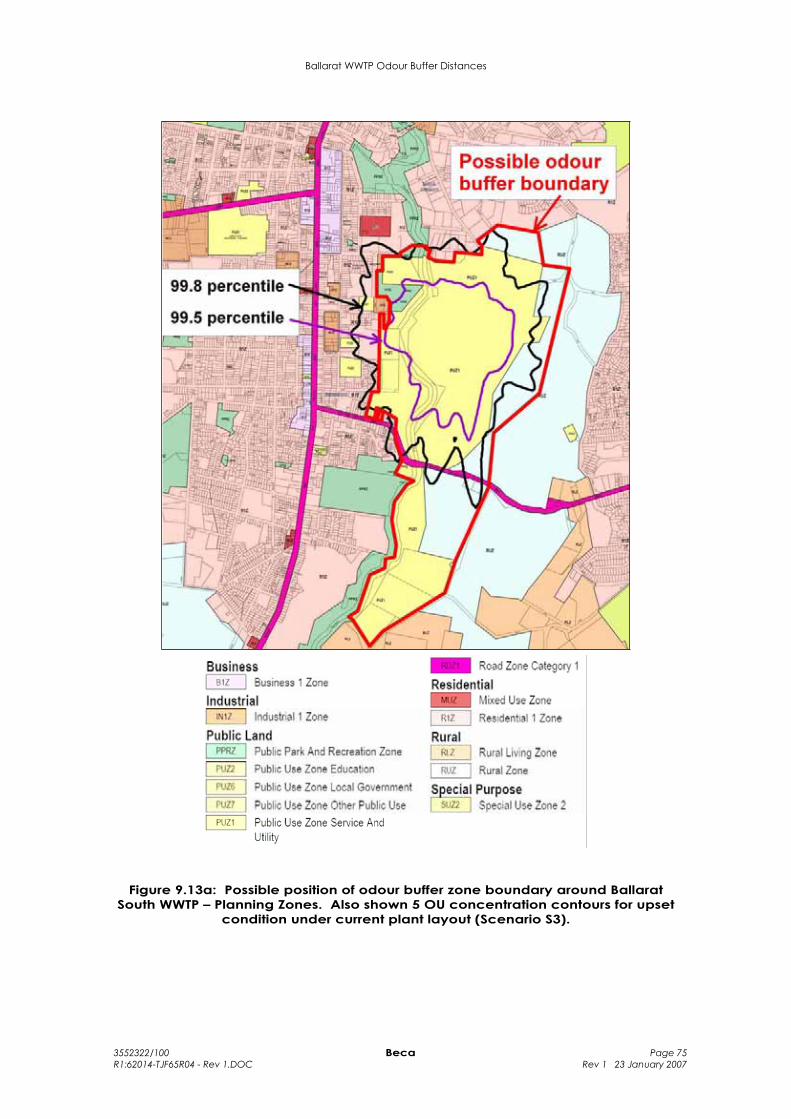
Ballarat WWTP Odour Buffer Distances
3552322/100 Beca Page 75 R1:62014-TJF65R04 - Rev 1.DOC Rev 1 23 January 2007
Figure 9.13a: Possible position of odour buffer zone boundary around Ballarat South WWTP – Planning Zones. Also shown 5 OU concentration contours for upset
condition under current plant layout (Scenario S3).
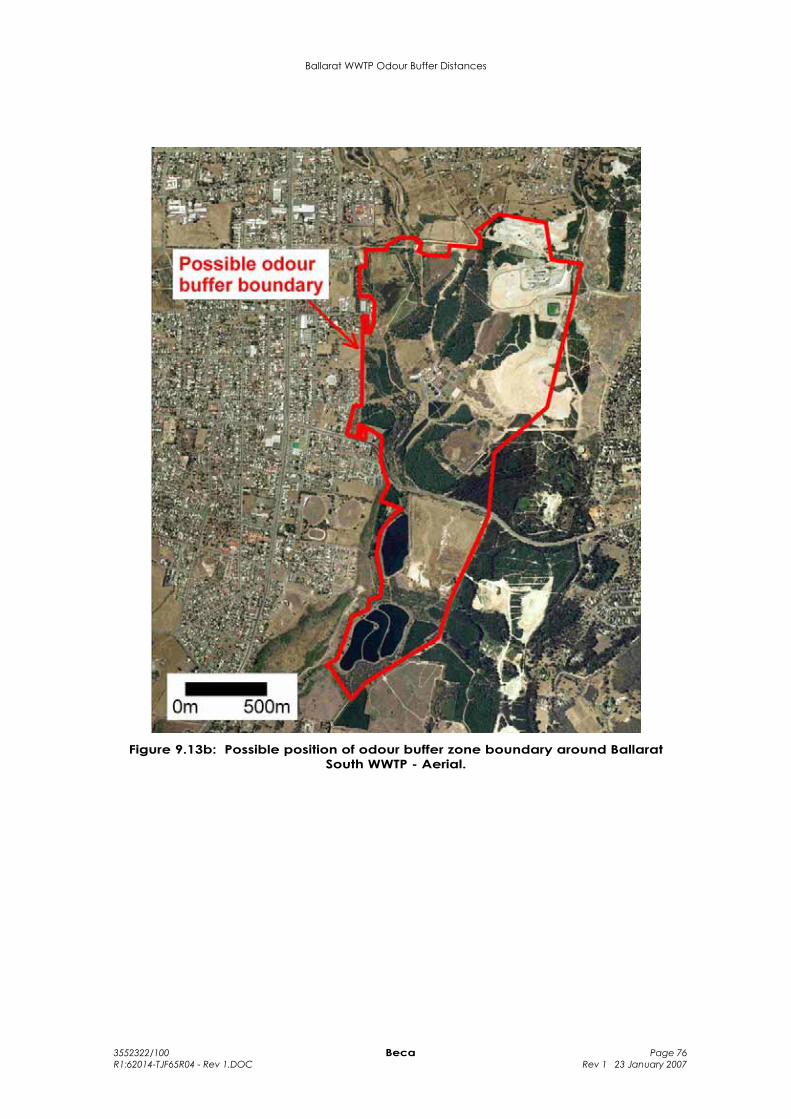
Ballarat WWTP Odour Buffer Distances
3552322/100 Beca Page 76 R1:62014-TJF65R04 - Rev 1.DOC Rev 1 23 January 2007
Figure 9.13b: Possible position of odour buffer zone boundary around Ballarat South WWTP - Aerial.
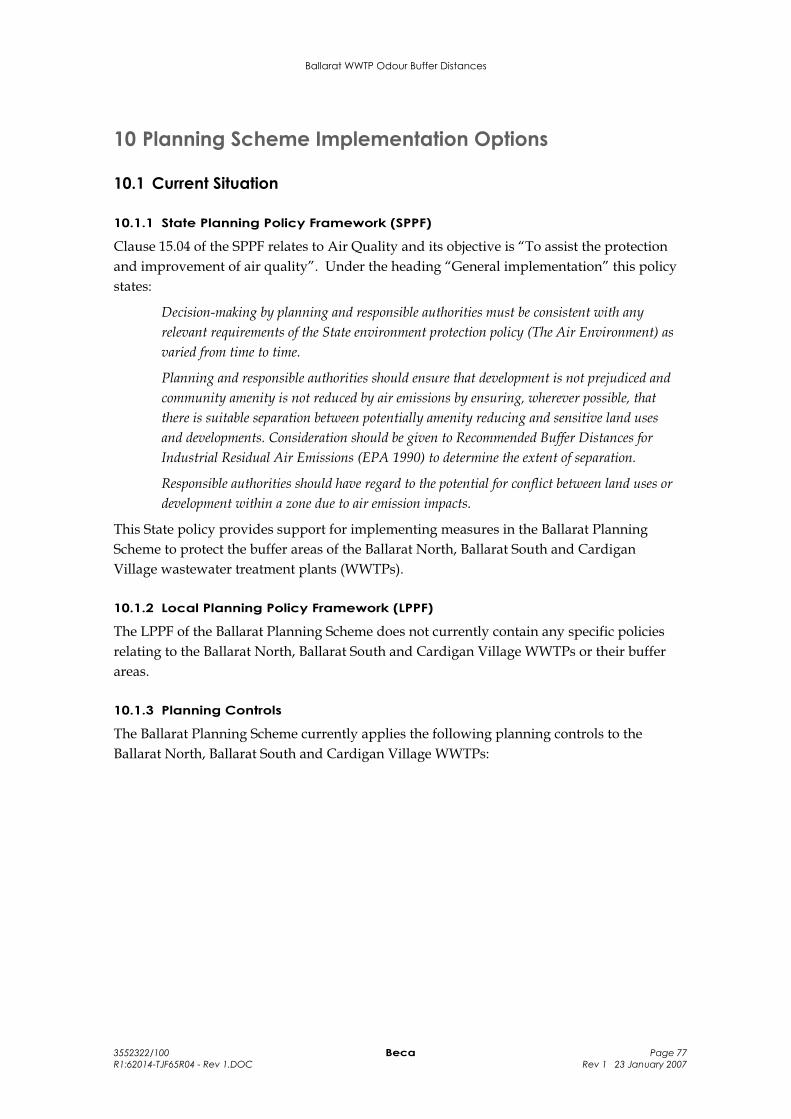
Ballarat WWTP Odour Buffer Distances
3552322/100 Beca Page 77 R1:62014-TJF65R04 - Rev 1.DOC Rev 1 23 January 2007
10 Planning Scheme Implementation Options
10.1 Current Situation
10.1.1 State Planning Policy Framework (SPPF)
Clause 15.04 of the SPPF relates to Air Quality and its objective is “To assist the protection and improvement of air quality”. Under the heading “General implementation” this policy states:
Decision-making by planning and responsible authorities must be consistent with any relevant requirements of the State environment protection policy (The Air Environment) as varied from time to time.
Planning and responsible authorities should ensure that development is not prejudiced and community amenity is not reduced by air emissions by ensuring, wherever possible, that there is suitable separation between potentially amenity reducing and sensitive land uses and developments. Consideration should be given to Recommended Buffer Distances for Industrial Residual Air Emissions (EPA 1990) to determine the extent of separation.
Responsible authorities should have regard to the potential for conflict between land uses or development within a zone due to air emission impacts.
This State policy provides support for implementing measures in the Ballarat Planning Scheme to protect the buffer areas of the Ballarat North, Ballarat South and Cardigan Village wastewater treatment plants (WWTPs).
10.1.2 Local Planning Policy Framework (LPPF)
The LPPF of the Ballarat Planning Scheme does not currently contain any specific policies relating to the Ballarat North, Ballarat South and Cardigan Village WWTPs or their buffer areas.
10.1.3 Planning Controls
The Ballarat Planning Scheme currently applies the following planning controls to the Ballarat North, Ballarat South and Cardigan Village WWTPs:
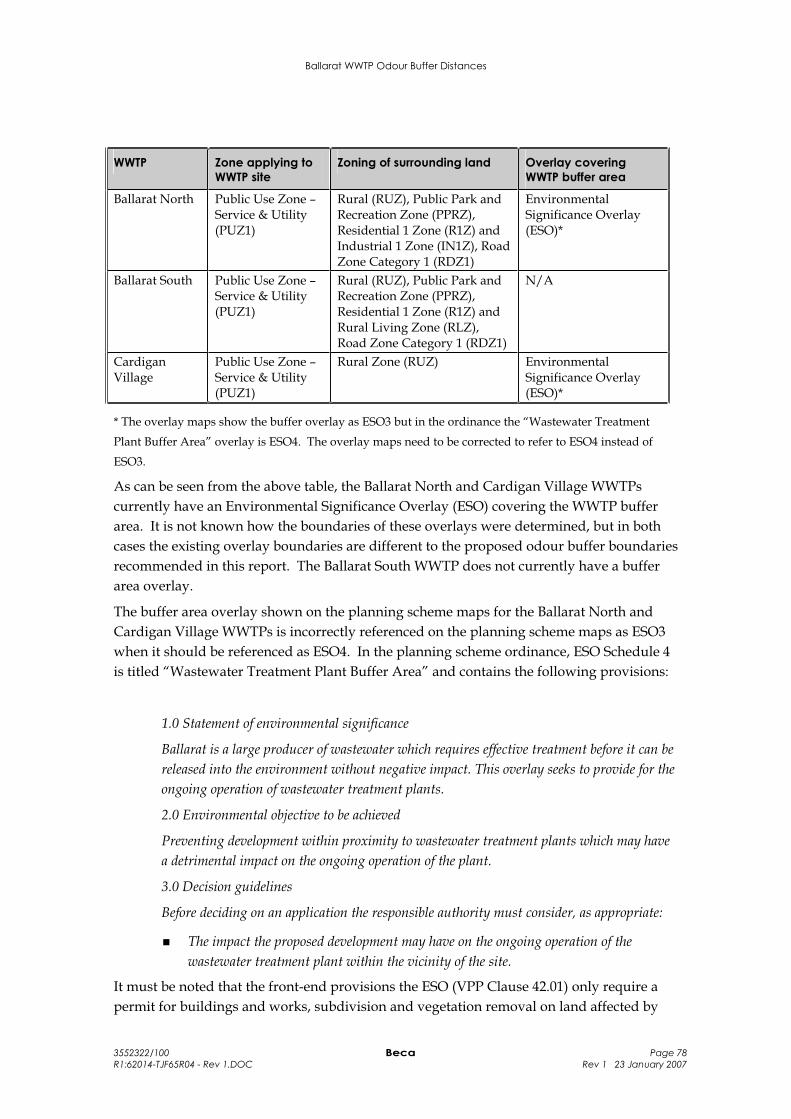
Ballarat WWTP Odour Buffer Distances
3552322/100 Beca Page 78 R1:62014-TJF65R04 - Rev 1.DOC Rev 1 23 January 2007
WWTP Zone applying to WWTP site
Zoning of surrounding land Overlay covering WWTP buffer area
Ballarat North Public Use Zone – Service & Utility (PUZ1)
Rural (RUZ), Public Park and Recreation Zone (PPRZ), Residential 1 Zone (R1Z) and Industrial 1 Zone (IN1Z), Road Zone Category 1 (RDZ1)
Environmental Significance Overlay (ESO)*
Ballarat South Public Use Zone – Service & Utility (PUZ1)
Rural (RUZ), Public Park and Recreation Zone (PPRZ), Residential 1 Zone (R1Z) and Rural Living Zone (RLZ), Road Zone Category 1 (RDZ1)
N/A
CardiganVillage
Public Use Zone – Service & Utility (PUZ1)
Rural Zone (RUZ) Environmental Significance Overlay (ESO)*
* The overlay maps show the buffer overlay as ESO3 but in the ordinance the “Wastewater Treatment Plant Buffer Area” overlay is ESO4. The overlay maps need to be corrected to refer to ESO4 instead of ESO3.
As can be seen from the above table, the Ballarat North and Cardigan Village WWTPs currently have an Environmental Significance Overlay (ESO) covering the WWTP buffer area. It is not known how the boundaries of these overlays were determined, but in both cases the existing overlay boundaries are different to the proposed odour buffer boundaries recommended in this report. The Ballarat South WWTP does not currently have a buffer area overlay.
The buffer area overlay shown on the planning scheme maps for the Ballarat North and Cardigan Village WWTPs is incorrectly referenced on the planning scheme maps as ESO3 when it should be referenced as ESO4. In the planning scheme ordinance, ESO Schedule 4 is titled “Wastewater Treatment Plant Buffer Area” and contains the following provisions:
1.0 Statement of environmental significance
Ballarat is a large producer of wastewater which requires effective treatment before it can be released into the environment without negative impact. This overlay seeks to provide for the ongoing operation of wastewater treatment plants.
2.0 Environmental objective to be achieved
Preventing development within proximity to wastewater treatment plants which may have a detrimental impact on the ongoing operation of the plant.
3.0 Decision guidelines
Before deciding on an application the responsible authority must consider, as appropriate:
The impact the proposed development may have on the ongoing operation of the wastewater treatment plant within the vicinity of the site.
It must be noted that the front-end provisions the ESO (VPP Clause 42.01) only require a permit for buildings and works, subdivision and vegetation removal on land affected by
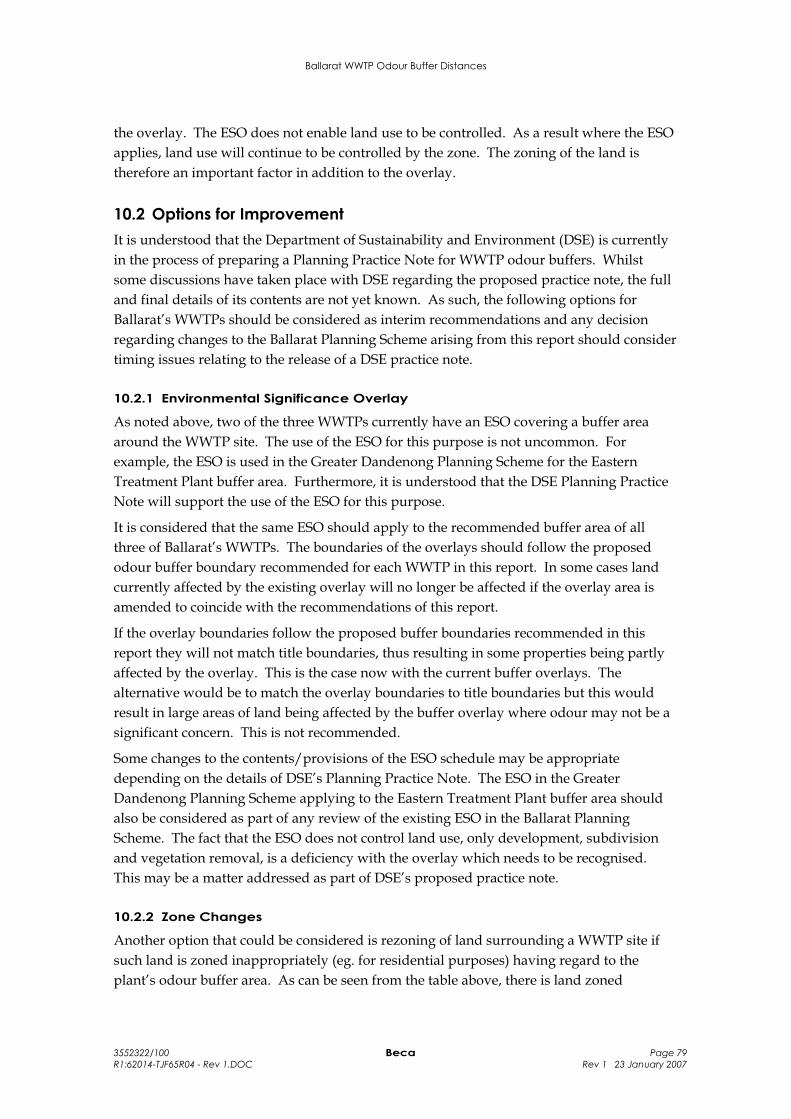
Ballarat WWTP Odour Buffer Distances
3552322/100 Beca Page 79 R1:62014-TJF65R04 - Rev 1.DOC Rev 1 23 January 2007
the overlay. The ESO does not enable land use to be controlled. As a result where the ESO applies, land use will continue to be controlled by the zone. The zoning of the land is therefore an important factor in addition to the overlay.
10.2 Options for Improvement It is understood that the Department of Sustainability and Environment (DSE) is currently in the process of preparing a Planning Practice Note for WWTP odour buffers. Whilst some discussions have taken place with DSE regarding the proposed practice note, the full and final details of its contents are not yet known. As such, the following options for Ballarat’s WWTPs should be considered as interim recommendations and any decision regarding changes to the Ballarat Planning Scheme arising from this report should consider timing issues relating to the release of a DSE practice note.
10.2.1 Environmental Significance Overlay
As noted above, two of the three WWTPs currently have an ESO covering a buffer area around the WWTP site. The use of the ESO for this purpose is not uncommon. For example, the ESO is used in the Greater Dandenong Planning Scheme for the Eastern Treatment Plant buffer area. Furthermore, it is understood that the DSE Planning Practice Note will support the use of the ESO for this purpose.
It is considered that the same ESO should apply to the recommended buffer area of all three of Ballarat’s WWTPs. The boundaries of the overlays should follow the proposed odour buffer boundary recommended for each WWTP in this report. In some cases land currently affected by the existing overlay will no longer be affected if the overlay area is amended to coincide with the recommendations of this report.
If the overlay boundaries follow the proposed buffer boundaries recommended in this report they will not match title boundaries, thus resulting in some properties being partly affected by the overlay. This is the case now with the current buffer overlays. The alternative would be to match the overlay boundaries to title boundaries but this would result in large areas of land being affected by the buffer overlay where odour may not be a significant concern. This is not recommended.
Some changes to the contents/provisions of the ESO schedule may be appropriate depending on the details of DSE’s Planning Practice Note. The ESO in the Greater Dandenong Planning Scheme applying to the Eastern Treatment Plant buffer area should also be considered as part of any review of the existing ESO in the Ballarat Planning Scheme. The fact that the ESO does not control land use, only development, subdivision and vegetation removal, is a deficiency with the overlay which needs to be recognised. This may be a matter addressed as part of DSE’s proposed practice note.
10.2.2 Zone Changes
Another option that could be considered is rezoning of land surrounding a WWTP site if such land is zoned inappropriately (eg. for residential purposes) having regard to the plant’s odour buffer area. As can be seen from the table above, there is land zoned
Ballarat WWTP Odour Buffer Distances
3552322/100 Beca Page 80 R1:62014-TJF65R04 - Rev 1.DOC Rev 1 23 January 2007
Residential 1 in the vicinity of the Ballarat North and Ballarat South WWTPs, however, in both cases the proposed odour buffer boundary does not encroach into those areas of land.
In all three cases most of the land affected by the proposed odour buffers is zoned Rural, Public Park and Recreation Zone or Road Zone which are considered satisfactory zones for land affected by an odour buffer. In the case of the Ballarat North WWTP, land zoned Industrial 1 will also be affected by the odour buffer, but this is also considered satisfactory.
For these reasons no changes to the zoning of land surrounding the WWTPs is considered necessary.
10.2.3 Local Planning Policy Framework (LPPF)
Given the fact that there are three WWTPs in the City of Ballarat and the protection of these facilities from the encroachment of sensitive development is obviously an important issue, consideration should be given to amending the LPPF to highlight this matter and make it clear how Council intends to deal with it. This could be done firstly by amending the Municipal Strategic Statement (MSS). It could also be done by introducing a new Local Planning Policy relating to WWTP odour buffer areas and decision making under the associated ESO.
The Practice Note “Writing a Local Planning Policy” states:
A Local Planning Policy (LPP) is one of the tools available for implementing objectives and strategies in the Municipal Strategic Statement (MSS). The other implementation tools are zones and overlays and their associated schedules. If a planning strategy cannot be implemented fully through the use of these tools, it may be appropriate to use an LPP at Clause 22.
An LPP is a tool for day-to-day decision-making in relation to a specific discretion in a zone or overlay. It helps the responsible authority and other users of the scheme to understand how a particular discretion is likely to be exercised.
A LPP for the buffer areas would help users of the scheme to understand the key issues and planning requirements for proposals which may relate to or impact upon the WWTP buffer areas.
Another option would be to amend one or more of the existing Local Planning Policies which may be relevant to the protection of the buffer areas of the WWTPs. For example, the Residential Policy (Clause 22.01) and Rural Residential / Rural Living Policy (Clause 22.02) could both be amended to state that these forms of development will be discouraged within the buffer areas of WWTPs.
Ballarat WWTP Odour Buffer Distances
3552322/100 Beca Page 81 R1:62014-TJF65R04 - Rev 1.DOC Rev 1 23 January 2007
11 Community Information Sessions
11.1 Background An information session was held for each of the three WWTPs assessed as part of this study. The purpose of the information sessions was to inform the public of the process used to develop the odour buffer distances, summarise the findings of the study and understand community concerns relating to the project. At each session, Beca presented the context of the project, and issues relating to the relevant WWTP, followed by the identified odour plume and rationale for proposed buffers.
Beca went on to explain the future planning process should Council initiate a Planning Scheme Amendment, including the implications of the Environmental Significance Overlays. The method to access information on planning schemes and overlays was provided and an overview of the Planning Scheme Amendment Process was also outlined. This is provided in more detail in Section 10 of this report.
City of Ballarat outlined other planning strategies for the area, however the information session focussed on the findings and future implications of the odour buffer distances study.
Issues raised at each information session are summarised below, followed by the response provided by Beca in italics.
11.2 Cardigan Village The Cardigan Village information session was held at Cardigan Community Hall on Thursday 23rd November at 4.30pm. Approximately 25 people attended the Cardigan Village session.
General comments and concerns raised are listed below:
More explanation required on the definition of odour units (OU), specifically the difference between 1 OU and 5 OU.
5 OU was selected as the most appropriate threshold to use for the selection of odour buffer distances, as the 1 OU odour criteria in AQ 2/86 is stringent, and represents a detection threshold for odour that can only be detected in a controlled laboratory situation. A model concentration of 1 OU occurring in real life in ambient air would generally not be detected against background. In reality, odours can only be recognised when they exceed a concentration of about 5 OU, and generally only cause annoyance at concentrations higher than 5 OU unless the odour is particularly offensive in character.
Impact of topography and vegetation to Ausplume modelling.
Beca briefly explained the inputs to Ausplume during the information session, however a more detailed explanation is provided below:
In some circumstances, plume dispersion models like AUSPLUME can use information on the height of surrounding terrain to simulate the effects of that terrain on the movement and dispersion of the plume. However, like other similar plume dispersion models, AUSPLUME
Ballarat WWTP Odour Buffer Distances
3552322/100 Beca Page 82 R1:62014-TJF65R04 - Rev 1.DOC Rev 1 23 January 2007
does not allow the computation of terrain influences when the emissions arise from area sources (area sources are open sources with a large surface area such as a pond, uncovered tank, pile of biosolids, or odour treatment filter). With wastewater treatment plants, most odour emissions arise from area sources located close to the ground. Most of the odour sources in the dispersion models developed by Beca for the three Ballarat WWTPs were treated as area sources, and therefore there was no value to including terrain data in the model inputs.
The principle assumption behind the absence of terrain effect adjustments with area sources is that the sources are located close to the ground and have negligible thermal or mechanical buoyancy (that is, the emissions are not significantly hotter or colder than the surrounding ambient temperature, and are not thrust into the air through a small-diameter stack). Therefore, the plume of odour released from the area sources will stay close to the ground and follow the terrain as though the terrain were flat. In addition, the wind conditions when dispersion from area sources is the slowest occur when the atmosphere is stable, such as inversion conditions and nighttime periods of near calm winds. During those conditions, vertical mixing in the atmosphere close to the ground is minimal so the interaction of terrain variations and vertical mixing will not be relevant. There are certain circumstances where the assumption that the odour plume will follow the terrain will not be correct, such as in low wind speeds where the plume may move around an elevated point in the terrain rather than pass over it, or in near-calm conditions where air drains down into valley. AUSPLUME cannot handle these types of dispersion conditions and a model such as CALPUFF which is designed to handle complex terrain and near-calm conditions might be needed if these conditions are thought to be significant for odour dispersion and potential neighbour impacts.
Unclear advice previously given to residents regarding the location of the existing buffer distance. Beca explained how to find information on ESOs on the internet and provided a handout summarising how ESOs are used. A copy of the current ESO for the WWTP was on display after the information session.
Questions regarding the reason behind commissioning the project and why this WWTP has been included given limited development pressure – some suspicion relating to the connection of this project to the relocation of the Livestock Saleyards. Council explained that the Cardigan Village was one of three WWTPs included in the study of odour buffer distances for WWTPs serving the Ballarat area, and its’ inclusion in the study was not related to other developments.
11.3 Ballarat North The Ballarat North information session was held at the Cooinda Community Centre on Tuesday 28th November at 4pm. Approximately 20 people attended the session.
Concerns and queries raised at the session were:
Impact of terrain on Ausplume modelling.
Ballarat WWTP Odour Buffer Distances
3552322/100 Beca Page 83 R1:62014-TJF65R04 - Rev 1.DOC Rev 1 23 January 2007
Refer to response for Cardigan Village.
Concerns regarding other draft planning strategies for the area (e.g. Industrial Land Strategy).City of Ballarat summarised other planning strategies specific to the Ballarat North area, however the session remained focussed on the odour buffer distances study.
Details of the conditions that would accompany a new ESO for an odour buffer distance.
Information was made available which summarised the role of ESOs –. Residents were encouraged to participate in the Planning Scheme Amendment process.
11.4 Ballarat South The Ballarat South information session was held at the Sebastopol Senior Citizens Centre on Thursday 23rd November at 7pm, and was attended by approximately 15 people. Attendees queries and concerns raised at the session are listed below:
Residents stated that they had recently experienced sewage odour. Further discussion with the residents indicated that the odour was from a nearby sewer rather than the WWTP.
Concern regarding the impact of the odour buffer on property values. The purpose of ESOs and their planning implications (as detailed in Section 10 of this report) were discussed with attendees. It was clarified that the ESO would be used as a tool for future development within the area of the recommended odour buffer.
Removal of vegetation from neighbouring properties to the WWTP. Discussion with residents identified that the vegetation had been removed over a period of time from an area outside of the water authorities control.

Ballarat WWTP Odour Buffer Distances
3552322/100 Beca Page 84 R1:62014-TJF65R04 - Rev 1.DOC Rev 1 23 January 2007
12 Conclusions The dispersion modelling has led to the recommendation of buffer distances for each of the WWTPs in this report. The buffer distances are not equidistant from the plant odour sources around the compass. Dispersion of odours is dependent on wind characteristics which typically vary significantly for a site depending on the wind direction; the three WWTPs in this study are no exception. The effect of direction-specific meteorology is that, for example, while a separation distance of 100m may be sufficient to protect the amenity of a property in one direction, an adverse odour effect from the same source may be experienced several hundred metres in the opposite direction.
The main factors of uncertainty which contribute to the recommended buffer distances for each of the WWTPs in this report, are as follows:
Assumption of odour emission rates during upset condition
Risk that the upset condition will coincide with adverse meteorological conditions for poor rate of dispersion of the odours
Degree of onsite odour control required for compliance with EPA Victoria’s SEPP (AQM) odour design standard under normal operation.
The first and last of these bulleted items have the greatest impact on the recommendations. In most instances the odour emission rates used for each WWTP in this study have been based on typical near-worst case normal odour emission rates based on Beca’s experience.If these odour emission rates have been overestimated for any of the main odour sources, then some of the odour control measures that have been identified as potential mitigation options for each of the WWTPs may be unnecessary. If this is the case then the required buffer distance for upset conditions may also reduce as the odour emission rates for upset conditions would probably also reduce.
To confirm the odour emission rates appropriate for “worst case normal operation” for each of the main sources at each WWTP, a comprehensive odour sampling programme collecting multiple samples from each of the main sources over a period of months and at least two summer seasons would be required.
In the modelling of odour emissions under normal plant operation, Beca has identified some odour control measures that may be necessary to enable each WWTP to meet a design odour concentration of 1 OU at the plant boundaries. For simplicity in this report, most of the odour control measures have been assumed to entail complete covering of the odour source with no residual odour emission, except for the belt press building at the Ballarat North WWTP where the odour emission was assumed to reduce to 10% of current emission rates. No modelling of dispersion from resultant new odour treatment devices such as biofilters or scrubbers was carried out, but it is considered that these new sources would have a negligible impact on boundary odour emission rates. A review of the processes at each of the WWTPs would also be needed to identify any process or tank design modifications that could reduce odour while still providing the required degree of treatment.
At this time it is not known whether EPA Victoria will, in future, require the WWTPs in this study to comply with a concentration of 1 OU at the plant boundaries. It is likely that
Ballarat WWTP Odour Buffer Distances
3552322/100 Beca Page 85 R1:62014-TJF65R04 - Rev 1.DOC Rev 1 23 January 2007
the dominant odour sources during upset conditions would for the most part be controlled by the same odour control measures discussed for the normal operation of each WWTP that may be required to meet or come close to the SEPP (AQM) design criteria. If the plants did meet this design criteria, then the dispersion modelling in this report indicates that the buffer distance currently provided by the distance from the plant odour sources to the PUZ1 boundary is likely to be sufficient to avoid odour nuisance beyond the boundary during upset conditions, except in the case of the Cardigan Village WWTP. However, as the extent to which EPA Victoria may enforce compliance with this criteria is unknown, installation of odour control measures has not been assumed in making buffer distance recommendations.
It is acknowledged that some odour control measures could be very costly for the WWTPs given the size and nature of some of the units involved (such as the anoxic zones of the bioreactor at the Ballarat South WWTP). In addition, the extent to which EPA Victoria may enforce compliance with the design criteria is unknown. Therefore, installation of odour control measures has not been assumed in making buffer distance recommendations.
Essentially, the provision of buffer distances outside the land enclosed by the PUZ1 boundary becomes a trade off between the degree of odour control onsite and extent of buffer distance. It is beyond the scope of this report to recommend the appropriate balance between these two factors. The recommended odour buffer distances are based on the operation of the WWTPs at the time of the study, with no additional odour mitigation.
The buffer boundaries proposed in this report represent a balance between the practicalities of odour control and the needs of the WWTPs, versus the objective of protecting surrounding land uses and the EPA requirements and are seen as an appropriate starting point for consultation with the various stakeholders.
Ballarat WWTP Odour Buffer Distances
3552322/100 Beca Page 86 R1:62014-TJF65R04 - Rev 1.DOC Rev 1 23 January 2007
13 Recommendations Recommendations to implement the findings of this report are listed below.
Initiate a Planning Scheme Amendment to incorporate the recommended buffer distances as a formal planning tool to avoid the impact of nuisance odour relating to the encroachment of sensitive uses on WWTPs.
Recommence dialogue with CHW and EPA regarding the implementation of the recommended buffer distances into local planning policy.
Liaise with the DSE regarding the release of the Planning Practice Note for WWTP odour buffers, with the view to use the recommended buffer distances for the Ballarat WWTPs as the boundary for odour buffer ESOs.
As detailed in Section 10.2, any decision regarding changes to the Ballarat Planning Scheme arising from this report should consider the timing of the forthcoming DSE practice note.
Some changes to the contents/provisions of the ESO schedule may be appropriate depending on the details of DSE’s Planning Practice Note.
The fact that the ESO does not control land use, only development, subdivision and vegetation removal, is a deficiency with the overlay which needs to be recognised. This may be a matter addressed as part of DSE’s proposed practice note.
Consideration should be given to amending the LPPF to highlight that the protection of the WWTPs from the encroachment of sensitive development is an important issue, and confirm how Council intends to deal with it.
Community and stakeholder consultation is a requirement of the Planning Scheme Amendment process.
Ballarat WWTP Odour Buffer Distances
3552322/100 Beca Page 87 R1:62014-TJF65R04 - Rev 1.DOC Rev 1 23 January 2007
14 References
GHD, 2004: “Odour Emission Rate Surveys and Assessment of Appropriate Buffer Distance for Ballarat North WWTP, Final Report (Draft)”. Report prepared for Central Highlands Water, April 2002.
EPA Victoria, 1990: “Recommended Buffer Distances for Industrial Residual Air Emissions”. Document reference AQ 2/86, July 1990.
EPA Victoria, 2001(a): “State Environment Protection Policy (Air Quality Management)”, gazetted December 2001.
EPA Victoria, 2001(b): “State Environment Protection Policy (Ambient Air Quality)”, gazetted December 2001.
EPA Victoria, 2002: “Protecting Victoria’s Air Quality”, Publication no. 837 February 2002.