Embed Size (px)
DESCRIPTION
Â
Citation preview

www.pwc.com/renewablesdeals
RenewablesDeals2012 outlook and 2011 review
Mergers and acquisitionsactivity in renewable power and related cleantechnology

Introduction 3
Report highlights 4
2012 deal outlook: growing sector maturity 6
2011 deal review: a year of big deal flow 10
Deal places: a focus on markets worldwide 14
Europe 16
North America 18
Asia Pacific 20
Contacts 22
Contents
2 Renewables Deals 2012 outlook and 2011 review
Methodology and terminology
Renewables Deals includes analysis of global renewable energy and cleantechnology M&A deal activity. We define renewable energy deals as those relating to thefollowing sectors: biofuels, biomass, geothermal, hydro, marine, solar and wind.Renewable energy deals relate to the acquisition of (i) operating and construction-stageprojects involved in the production of renewable energy and (ii) companies manufacturingequipment for the renewables sector. We define clean technology deals as those relating tothe acquisition of companies developing energy efficient products for renewable energyinfrastructure. We exclude deals relating to nuclear power assets and deals where only aminority of the business’s activity is in renewables. This year, the analysis is based ontransactions from Clean Energy pipeline’s proprietary M&A database, provided by VentureBusiness Research. This covers both 2010 and 2011 data in this year’s edition. Otherdatabase providers have been used in some earlier years.
The main dataset in the report covers completed M&A deals only, and excludes InitialPublic Offerings (IPOs) and deals which are pending for regulatory, legal or financialreasons. A selection of top pending deals and top IPOs is included separately in the report.The Asia Pacific region is deemed to include Australasia, except if otherwise explicitlystated. Deal values are stated as the consideration value announced or reported includingany assumption of debt and liabilities. Figures relate to the actual stake purchased and arenot grossed up to 100%. The analysis also includes deals with undisclosed value. Dealswhere the transaction value is undisclosed are assigned an average transaction value usinga methodology derived from Clean Energy pipeline’s proprietary M&A data. Comparativedata for prior years may differ to that appearing in previous editions of our annual analysisor other current year deals publications. This can arise in the case of updated information,different methodological bases or methodological refinements and consequent restatementof the input database.

IntroductionWelcome to Renewables Deals, PwC’s annuallook at dealmaking in the renewable energy andrelated clean technology sectors. We publish ouroutlook on the prospects for dealmaking in theyear ahead. We also take a look at what’s beenhappening in the last 12 months and in thedifferent main markets around the world.
The report is the fourth in our serieson renewables. In our companionreport, Power Deals, we separately lookat the trends and dynamics in thewider power utilities and non-renewables generation sector.Together the two reports provide acomprehensive global analysis of M&Aactivity across the power and gasutilities sector.
This year, for the first time, we openour report with our discussion of theoutlook for the year ahead andidentify some of the main themes weexpect to be at work. In our lastreport, we correctly forecast that 2011would prove a busy year forrenewables deals.
We also highlighted the step up ininterest of Japanese and Chinesebuyers which manifested itself in anumber of significant recent deals.
Looking ahead, the sector isundergoing a growing maturity andconsolidation phase. This evolutioninclines us to believe that deal flowwill remain significant in 2012. Inpart, though, this will depend on howthe eurozone crisis unfolds. Weassume a continuation of a ‘rollinguncertainty’ scenario affecting theeurozone and wider world sentiment.But, if there are significant adverseevents that turn eurozone ‘rollinguncertainty’ into deeper crisis, dealflow is likely to be dampened.
Renewables Deals 2012 outlook and 2011 review 3
Manfred Wiegand Global Power & Utilities Leader
John McConomy Partner US Power & Utilities Transaction Services
Andrew McCrosson Partner UK Power & Utilities Transaction Services

Renewables deals reachrecord values
Despite an uncertain general economicand market background, the value ofrenewables dealmaking has reached thehighest level recorded in our reportseries. Total deal value was up 40%year on year – from US$38.2bn in 2010to US$53.5bn in 2011.
‘New generation’technologies enter the big time
Historically, hydro has dominatedrenewable deal flow. But we’ve nowentered an era of US$1bn plus deals in the‘new renewables’ and energy efficiencysectors. Big deals are becoming morecommon in the wind, solar, biomass andenergy efficiency fields. For the first timeever, US$1bn plus deals in these foursectors dominate the list of top deals,outnumbering hydro by seven to one ascontributors to big deal flow.
Report highlights
4 Renewables Deals 2012 outlook and 2011 review

A number of themes are characterisingdeal activity, reflecting significant changein the industry. With growth, therenewable energy sector is undergoing aperiod of shake-out and consolidation.The ultimate result is likely to be asuccession of tie-ups within and betweenthe main manufacturing territories of theUS, Germany and China leading to asmaller number of big global players inboth the wind and solar power markets.
Renewables Deals 2012 outlook and 2011 review 5
Sun shines on solar andenergy efficiency dealactivity
As we predicted in last year’s report, weare seeing particularly strong momentumbehind deal activity in the solar andenergy efficiency sectors. Buoyed by theincrease in big transactions, deal value inthese two sectors has nearly doubled yearon year. Together, they account for thevast majority (79%) of the US$15.3bnincrease in the total value of allrenewables deals.
Deal trends follow differentcross-Atlantic directions
North American and Europe moved indifferent directions. Total targetrenewables deal value rose 80% inEurope, from US$16.7bn to US$30bn yearon year, but it fell 5% in North America.Although two big deals saw NorthAmerican solar deal value more thandouble, total M&A for windpower targetswas down 35%. Low gas prices andcontinued uncertainty over tax credits andother support mechanisms are creatinguncertainty in the US.
Industry change is drivingdeal momentum
6 Renewables Deals 2012 outlook and 2011 review
But, despite this background, deal activityhas been strong in the renewable energy aswell as the energy efficiency sectors. Thereare some distress factors at work but thereis growing confidence in renewablegeneration gaining a more secure place inthe energy mix. Thoughts are beginning toreach ahead to a time when governmentsupport can play a less critical role. Thissentiment was reinforced by the policyreaction in many countries following theFukushima nuclear emergency in Japan.The consequent reappraisal of nuclearenergy has boosted the importance ofrenewable generation in many countries’energy strategies. Growing sector maturityis also heralding consolidation moves insolar which, alongside continued deal flowassociated with windpower financing anddevelopment, are playing a significant partin deal activity.
A number of themes are influencing dealactivity, reflecting change in the industryand, as the sector matures, we believe thatdeal flow will continue to be significant inthe medium term. Actual 2012 activity willdepend on how the eurozone crisisunfolds. We assume a continuation of a‘rolling uncertainty’ scenario affecting theeurozone and wider world sentiment. But,if there are adverse events that turneurozone ‘rolling uncertainty’ into deepercrisis, deal flow is likely to be dampened.
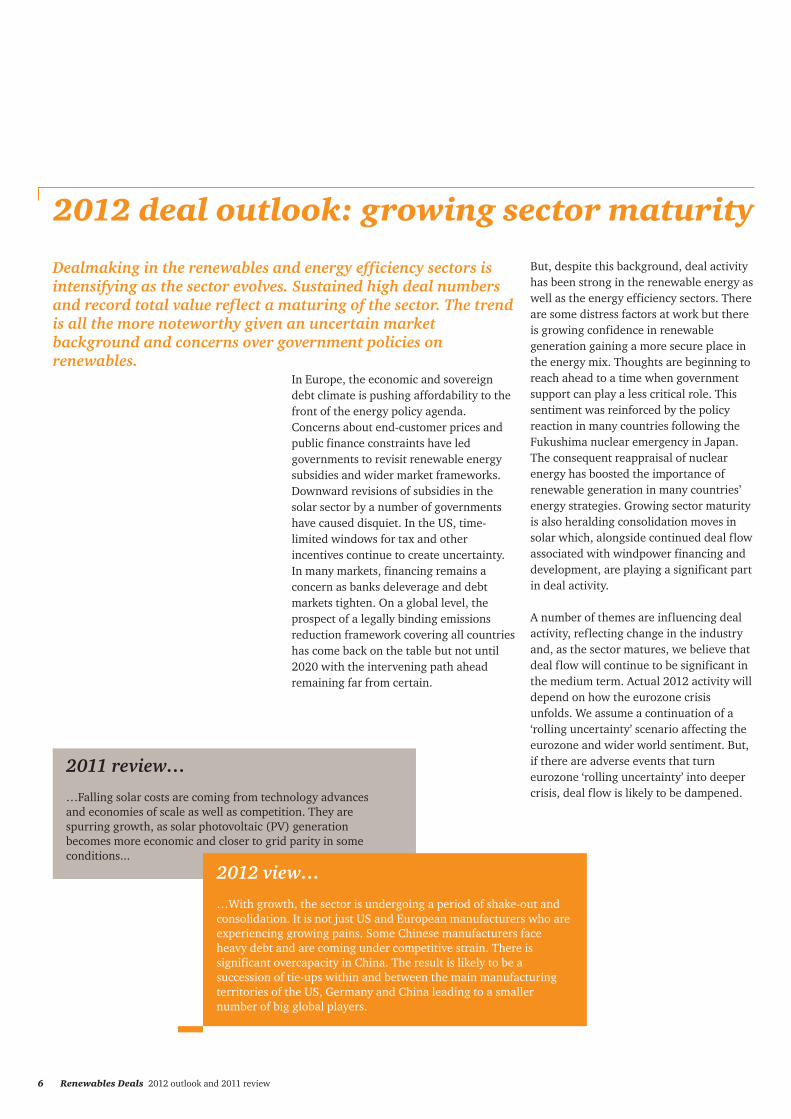
Dealmaking in the renewables and energy efficiency sectors isintensifying as the sector evolves. Sustained high deal numbersand record total value reflect a maturing of the sector. The trendis all the more noteworthy given an uncertain marketbackground and concerns over government policies onrenewables.
2012 deal outlook: growing sector maturity
In Europe, the economic and sovereigndebt climate is pushing affordability to thefront of the energy policy agenda.Concerns about end-customer prices andpublic finance constraints have ledgovernments to revisit renewable energysubsidies and wider market frameworks.Downward revisions of subsidies in thesolar sector by a number of governmentshave caused disquiet. In the US, time-limited windows for tax and otherincentives continue to create uncertainty.In many markets, financing remains aconcern as banks deleverage and debtmarkets tighten. On a global level, theprospect of a legally binding emissionsreduction framework covering all countrieshas come back on the table but not until2020 with the intervening path aheadremaining far from certain.
2011 review……Falling solar costs are coming from technology advancesand economies of scale as well as competition. They arespurring growth, as solar photovoltaic (PV) generationbecomes more economic and closer to grid parity in someconditions...
2012 view……With growth, the sector is undergoing a period of shake-out andconsolidation. It is not just US and European manufacturers who areexperiencing growing pains. Some Chinese manufacturers faceheavy debt and are coming under competitive strain. There issignificant overcapacity in China. The result is likely to be asuccession of tie-ups within and between the main manufacturingterritories of the US, Germany and China leading to a smallernumber of big global players.

Renewables Deals 2012 outlook and 2011 review 7
Solar growing pains
Many solar panel producers are facing thetwin pincer of constrained financingoptions and falling prices as a result ofcompetition from fast expanding Chinesemanufacturers. The bankruptcy of US solarpanel manufacturer Solyndra, a companythat had been in the vanguard of the USgovernment’s green stimulus programme,was one of the most high profile examplesof the squeeze facing part of the sector.Massachusetts-based Evergreen Solar alsofiled for bankruptcy. Elsewhere oil and gasgiant BP exited the solar sector after 40years of research and development. Butthe move was followed by a decision byIndia’s Tata Power to buy out its 51% stakein their 22-year-old joint venture, Tata BPSolar. The size of the solar market in Indiais expected to grow to 800 to 1,200MW by2014-15 and the country has an ambitioustarget of 20,000MW of solar power by2022.
Nature’s uncertainties makefor choppy wind progress
Too much wind has caused developmentdelays on important wind projects whiletoo little wind has hit output projectionson installed projects. The most high profilemanifestation of this has been two profitwarnings from Danish company Vestas butit is by no means alone in encounteringdifficulties. Wind volatility has also causedproblems for the balancing of powersystems. It is not just the vagaries of NorthSea wind that are causing problems.Increased debt funding costs and subsidychanges are affecting project development.Predicting turbine demand in markets suchas China is also proving difficult.
2011 review……Windpower growth is proving turbulent with a number ofcompanies facing strains...
2012 view……In the same way that we expect to see a smaller number of globalplayers in the solar market, consolidation among larger players isalso likely to occur in the windpower sector. The scope for a majorlandmark combination between entities from one or more of AsiaPacific, Europe and North America exists and 2012 could be the yearthat it takes place. European company weakness is coinciding with aChinese government move to limit the number of mainland turbinesuppliers, causing a temporary slowing of projects in China andincreasing the appetite of Chinese turbine manufacturers in overseasmarkets.

8 Renewables Deals 2012 outlook and 2011 review
Asia Pacific bidders out in force
The strong encouragement given torenewable energy and other cleantechinitiatives from China and some other AsiaPacific governments is reflected in a bigincrease in acquisition activity by AsiaPacific bidders. Such bidders were behinddeals totalling US$9.4bn in 2011 with an18% share of worldwide renewables andcleantech bid activity, up from a 13% sharein 2010. Japanese and Chinese biddersaccounted for two of the three largestcompleted deals – Toshiba’s US$2.3bnpurchase of Landis+Gyr and ChinaNational Bluestar’s US$2.2bn acquisitionof Norwegian maker of solar-grade siliconElkem (see figure 3, note 2). They werealso active purchasers of smaller assets.The US$1.7bn investment by UniversalResources in True Green Energy’s projectsin the Philippines represents the interest ofseveral Chinese entities. Elsewhere,Japanese and Chinese companies wereactive buyers of windfarm assets in the US,Australia and Europe (see regionalsections).
Pension and insurance interest steps up
One of the recent landmark deals in thesector was the US$1.1bn investment byDanish pension insurance groupsPensionDanmark and PKA in a 50% stakeof Dong Energy’s Anholt offshore windfarm project. It is the third time Donghas attracted an equity stake into awindpower project but it is notable for thesize of the investment. It also comes at atime when other countries such as the UKare examining ways in which pension andinsurance fund investment can be attractedto windpower investment, although theconstitutional structure of how pensionfunds are managed in the UK remains anissue. Construction risk is a barrier to suchinvestment. In the Danish case, theinvestment covered the construction costbut the risk remained with the developer.
Private equity involvement is changing
Renewables have become a significanthunting ground for private equity investorsattracted by lower asset pricing in thesector. Increasingly such private equityinvestment is geared towardinfrastructure-like investment returnsrather than the traditional buy-out andsell-on approach. KKR, for example,highlighted the attraction of “coreinfrastructure assets providing stable andlong-term cash flow visibility” in itsannouncement of a US$464m investmentwith Munich Re for a 49% stake in GrupoT Solar, a company with extensive solargeneration in Spain and Italy.
Energy affordability worriescreate a ‘trilemma’
Energy prices have become a hot issue insome European countries as the cost ofdecarbonisation bites and the economicsituation puts pressure on customerbudgets. Concerns about energy prices arecreating a ‘trilemma’ in the triangle thathas to be balanced between affordability,meeting carbon targets and security ofsupply, adding to the social pressures ongovernments. This increases theuncertainty faced by investors anddealmakers. Any weakening of the drive tomeet the 2020 low carbon and renewableenergy targets could disrupt investmentassumptions.2011 review…
…2011 saw the first Asian equity investment in UK offshorewindpower with Marubeni Corporation taking a stake in DongEnergy’s Gunfleet Sands project…
2012 view……The deal was one of a number of moves by Asia Pacific buyers forwestern renewables and cleantech assets. We expect to see thisactivity strengthen with interest from acquirers from Korea andSingapore featuring alongside Chinese and Japanese bidders.

Renewables Deals 2012 outlook and 2011 review 9
The eurozone crisis
Eurozone worries did not prevent a big risein overall renewables deal value in 2010.But, worries about a further recession,constraints on financing and fears of aworst case collapse will inevitably causedealmakers to continually reassess theiroptions over the coming months. Someform of eurozone realignment remains avery real possibility. A climate of ‘rollinguncertainty’ looks set to continue through2012 in the absence of sustained growthsignals or strong leadership from policymakers. If economic growth signals turnpositive, then ‘rolling uncertainty’ couldtransition into ‘growing confidence’.However, further adverse events would belikely to cause strain in the renewablessector. Financing might become scarcerand worries about energy affordability(see page 8) could combine with stretchedpublic financing to weaken policy supportfor the sector.
2011 review……Denmark is setting the pace for greater pension fundinvolvement in offshore windpower...
2012 view……We expect more countries and more deals to have pension andinsurance fund involvement with investors, companies andgovernments finding ways to structure such investment to overcomethe problem of construction risk. This risk itself will ease over timeas offshore project experience develops but, even as the track recordevolves, special structuring will be needed. The exact form of sucharrangements, through for example green investment banks, is thesubject of current policy discussion.
The advice in the first half of 2009 was‘if you don’t have to be in the market,stay out of the market. Wait a fewmonths until things improve andconfidence and a sense of calm isrestored. Then go with your deal.’ But that all assumes you have a ‘rearview mirror event’. In 2012 there is noequivalent. Instead, there is greatuncertainty about whether things willbe better or worse in six months time.In this environment, perhapsparadoxically, a complete brake ondealmaking makes less sense. If a deal ishighly strategic and mission critical,then parties may feel it is worth doing ifit can get done on the right terms.
Perspective:‘Rolling uncertainty’ – to deal or not to deal?
With the uncertainty over how long theconstraints will persist, staying out of themarkets just in the hope that things willimprove cannot be assumed to be the rightstrategy.
Confidence about economic growth, theEuropean banking system and the ability ofgovernments to have a coordinated andconvincing policy response are all critical if amore optimistic outlook is to emerge. On thepolitical front, there are many potentialminefields to be negotiated during 2012,both at the inter-governmental level and,domestically, between parties and withelectorates. The potential for furtherdestabilisation cannot be ruled out.
It’s tempting to draw parallels between the crisis of 2008-9 and that of 2011-12.But there are important differences. The credit crunch had a definite focus, centredaround the Lehman crash. The current crisis lacks an equivalent single ‘big eventfocus’ – a ‘rear view mirror event’ that can be seen as a turning point. Instead,there is ongoing material uncertainty with an accumulation of events. We’ve calledit ‘rolling uncertainty’ in this report. This makes the deal environment much moredifficult. The time horizon for an easing of debt issuance and bank finance remainsuncertain. In addition, banks are assessing how the impact of new regulations suchas Basel 3 will affect their own liquidity and capital ratios.

10 Renewables Deals 2012 outlook and 2011 review
The solar and energy efficiency sectorstogether account for the vast majority(79%) of the US$15.3bn increase in thetotal value of all renewables deals with thewind energy sector contributing most ofthe rest. Energy efficiency deal value wasup 170% adding US$6.4bn year on year,solar was up 56% with a rise of US$5.7bnwhile windpower rose 23%, addingUS$2.9bn. Also for the first time ever, thenumber and value of solar deals movedabove windpower deals. The 190 solardeals accounted for one in three of allrenewables deals. They comfortablyoutnumbered the 169 windpower deals.The total solar deal value, at US$15.8bn,edged above the US$15.5bn windpowertotal.
The top ten deals illustrate a number ofimportant themes – utility companiesseeking to scale up their renewablegeneration portfolios, smart gridtechnology acquisitions, Asia Pacificoutbound investment, the growth ofenergy from biomass waste, and increasedinfrastructure, private equity and pensionfund interest in the sector.
Renewables and energy efficiency deal value rose 40% year onyear in 2011. The rise was fuelled by a big increase in US$1bnplus deals. For the first time ever, US$1bn plus deals dominatethe list of the largest deals. And the list is almost all from a waveof solar, energy efficiency and windpower deals. The totalnumber of 2011 deals dipped 6% year on year but remainedhigh at 570, having rebounded in 2010 off the 2009 low of 319.Increased deal value is not just coming from the largest deals.Median deal value rose 25% year on year, from US$28.1m toUS$35.2m.
2011 deal review: a year of big deal flow
In earlier years, deals for hydropowerassets had boosted deal totals but thesehave dropped off in the last two years.Even the largest deal, the CPFL/ERSAmerger, although classed as a hydro deal,is for a target that includes 30%windpower assets in its operational andpipeline portfolio. Rather than hydro, it isthe ‘new generation’ of renewable powerand energy efficiency technologies thatare driving total values higher.
Figure 1: All renewables deals by value (US$bn) and number of deals
2010 2011 Change in 2011Number Value Number Value % number % value
606 US$38.2bn 570 US$53.5bn (6%) 40%
Figure 2: Renewables deals total deal value and percentage share by sector(Deal numbers shown in parenthesis)
2011 (US$53,495m)2010 (US$38,221m)
Biomass (US$3,806m) 7% (44)
Solar (US$15,836m) 30% (190)
Wind (US$15,486m) 29% (169)
Energy efficiency (US$10,104m) 19% (82)
Hydro (US$4,868m) 9% (30)
Biofuels (US$3,038m) 6% (44)
Geothermal (US$357m) 1% (11)
Hydro (US$3,537m) 9% (36)
Wind (US$12,619m) 33% (198)
Solar (US$10,171m) 27% (164)
Biofuels (US$4,616m) 12% (45)
Energy efficiency (US$3,740m) 10% (97)
Biomass (US$2,834m) 7% (48)
Geothermal (US$703m) 2% (18)

No. Value of Date Target name Target Acquirer name Market transaction announced nation sector(US$m)
Renewables Deals 2012 outlook and 2011 review 11
The biggest deal saw Brazilian utility CPFLEnergia S.A. buy out renewable energycompany ERSA Energias Renováveis in aUS$2.9bn move. The merged entity, CPFLEnergias Renováveis, has 4,375MW ofpower operating, under construction orunder preparation for construction, 45% of which is windpower, 36% biomass and18% small scale hydroelectric. CPFL has13% of the electricity market in Brazil. The ERSA merger follows its April 2011acquisition of SL Jantus, owner of thecountry’s largest windfarms.
Moves by utility companies were also afeature of some of the largest Europeanrenewables deals with the buy-backs byIberdrola and EDF of the shares of theirrenewables arms that they had previouslysold off.
Iberdrola’s repurchase of a 20% stake inIberdrola Renovables came at a time thatallowed it to pay little more than half theprice that it had been listed at four yearsearlier. The Iberdrola buy-back wasfollowed by the Fukushima nuclearemergency and consequent reappraisal ofnuclear’s part in the energy mix by anumber of governments (see figure 3, note 1).
The Fukushima emergency gave a boost toshare prices in alternative energycompanies ahead of EDF’s April 2011announcement that it was to buy back the50% share of its alternative powersubsidiary EDF Energies Nouvelles that itdid not already own.
No. Value of Date Target name Target Acquirer name Acquirer Market Type of transaction announced nation nation sector purchase(US$m)
Figure 3: Top ten renewables deals announced and completed in 2011
2,900
2,300
2,077
1,687
1,370
1,364
1,230
1,130
880
731
20 Apr 11
19 Jun 11
08 Apr 11
22 Nov 11
03 May 11
01 Jun 11
08 Sep 11
28 Mar 11
12 Aug 11
22 Jul 11
ERSA Energias Renováveis SA
Landis+Gyr AG
EDF Energies Nouvelles SA
True Green Energy Group
SunPower Corp.
Telvent GIT SA
Sarnia solar project (80MW), EnbridgeOntario wind project (190MW), Talbotwind project (99MW), located in Sarniaand Chatham, Canada.
Windfarm (400MW) – Anholt
Windfarms (443MW) – Castilla y Leonprovince Spain
Hansen Transmissions International NV
CPFL Energia SA
Toshiba Corp. Innovation Network Corp. ofJapan
Electricite de France SA
Universal Resources Development Inc.
Total SA
Schneider Electric SA
Enbridge Income Fund
PensionDanmark A/S PKA A/S
Bridgepoint
ZFHN Zukunftsfonds Heilbronn GmbH & Co. KG
Operational
Technology
Operational
Operational
Technology
Technology
Operational
Operational
Operational
Technology
1
2
3
4
5
6
7
8
9
10
Brazil
Switzerland
France
Philippines
USA
Spain
Canada
Denmark
Spain
Belgium
Hydro
EnergyEfficiency
Wind
Biomass
Solar
EnergyEfficiency
Solar
Wind
Wind
Wind
Brazil
Japan
France
USA
France
France
Canada
Denmark
Spain
Germany
Note 1: Data in all other figures (except IPO figures) are based on all deals completed in 2011. In order to highlight the most recent deals, we have omitted from theabove table two deals completed in 2011 but announced in the previous year – China National Bluestar’s US$2.2bn purchase of Elkem in Norway and Terra Firma CapitalPartner’s US$0.9bn purchase of Rete Rinnovabile Sri in Italy.
Note 2: Iberdrola’s US$3.5bn share repurchase of Iberdrola Renovables deal was also announced and completed in 2011. It is classified as a share repurchaseprogramme and, as such, not included in the data. The EDF buy-back is included as it is classified as a conventional M&A transaction, in which Societe Internationaled’Investissements Financiers and Paris Mouratoglou are selling their stake in the company.
EDF is the world’s largest listed nuclearenergy producer and the deal forms animportant foundation for achieving its2020 ambition of generating 75% of itselectricity output from CO2-free powergeneration fleet. It expects to increase itstotal installed capacity from 137GW in2010 to 162GW in 2020 with the share ofnon-hydro renewable energy increasingfrom 2% to 9%, implying a more thanfivefold increase in renewables. In thesame period it anticipates nuclear’s sharereducing from 54% to 49%1.
1 EDF, investor presentation, September 2011.
Figure 4: Top five renewable deals announced in 2011 and pending at year-end
464
403
330
272
238
18 Jul 11
23 Jun 11
03 Nov 11
29 Jun 11
07 Nov 11
Solar plants (168MW) – Spain & Italy
Solar plants (80MW) – Italy
Windfarm (300MW) – Lac Alfred
Grupo Indal SL
Windfarms (346MW) – China (ChinaLongyuan Power Group Corp Ltd.), Biomass plants (144.2MW) – China (China Longyuan Power Group Corp Ltd.)
KKR Kohlberg Kravis Roberts & Co. LP, Munich Re
F2i Fondi Italiani per le Infrastrutture, Etrion Corp.
Enbridge Inc.
Royal Philips Electronics N.V. (a.k.a. Koninklijke Philips Electronics NV)
China Longyuan Power Group Corp Ltd.
1
2
3
4
5
Spain/Italy
Italy
Canada
Spain
China
Solar
Solar
Wind
Energy Efficiency
Wind

12 Renewables Deals 2012 outlook and 2011 review
Financial buyer interest surges
Deal interest in the sector from privateequity and other types of financial buyershas surged. The number of such deals roseby 27% year on year in 2011 and the totalvalue of financial buyer transactions rose146%, from US$4.8bn to US$11.9bn (see figure 5). Attracted by low assetprices, private equity companies such asBridgepoint and KKR have been very activebuyers in the competition for renewablesassets, alongside companies with longestablished renewables arms such as HGCapital and Platina Partners.
Infrastructure and other investment fundscontinue to be active investors inrenewable energy. The largest such 2011deal came with Canada’s Enbridge IncomeFund’s US$1.2bn purchase of 369MW ofwind and solar generation assets fromindirect wholly owned subsidiaries ofEnbridge Inc. (see North America section).We look in detail at the remainder of thetop deals in the regional chapters later inthis report.
Project finance: pre-construction private equity in offshore windpower
Figure 5: Renewables deals by acquirer type – 2010-2011
2010 2011Number Value (US$m) % number % value Number Value (US$m) % number % value
Alternative energy 84 8,148 42% 28% 71 6,899 36% 16%
Diversified 23 5,045 12% 17% 24 9,040 12% 21%
*Financial 41 4,828 21% 17% 52 11,869 26% 28%
Other 24 4,461 12% 15% 30 7,188 15% 17%
Utility 28 6,509 14% 22% 23 7,629 12% 18%
Total 200 28,991 100% 100% 200 42,625 100% 100%
*Financial includes infrastructure and private equity fundsNote: based on the largest 200 deals by value, representing nearly 80% of total deal value in 2011
Note: based on top 200 deals by value
Figure 6: Operational vs technology purchases – 2010-2011
2010 2011Number Value (US$m) % number % value Number Value (US$m) % number % value
Operational 137 20,940 75% 78% 140 27,888 64% 75%
Technology 63 8,051 25% 22% 60 14,737 36% 25%
Total 200 28,991 100% 100% 200 42,625 100% 100%
In Autumn 2011, Blackstone unveiled one of the biggest offshore projectfinancings with investments totalling around US$3.2bn in two German offshoreprojects. The investments in the Meerwind and Noerdlicher Grund windfarmscame as the German government stepped up its commitment to renewableenergy in the wake of its decision to phase out nuclear power following theFukushima emergency. Meerwind is the largest German offshore windfarm tocomplete its full financing process and is the first to be fully funded by privateinvestors. It is the first to close under the government’s KfW offshore windprogramme, designed to stimulate project funding. With 80 turbines and a288MW capacity, it is expected to be completed in 2013.

Renewables Deals 2012 outlook and 2011 review 13
Deal dialogue:Alternatives to bank finance The current environment means many companies need to look at alternatives tobank finance. The big utility companies can look to traditional markets, such asthe investment grade bond market. But others, particularly in the renewablessector, need to look for alternatives.
The high yield market is one traditional area forweaker issuers. But high yield market conditionsin Europe have been very challenging.Alternatives include the US private placementmarket, where companies do not need a formalpublic rating, mezzanine finance and asset-based lending which has developed and movedon from its old role of being akin to ‘lending oflast resort’.
The pressure on European bank finance is hereto stay and key challenges will not be fullyresolved in the near term. Even for strongissuers, caution will prevail but waiting formarket improvements is no longer a safe option.Borrowing capacity may be increased byaccessing public markets, moves towards a US-style funding model and mixed maturities.Chief finance officers will need to use acombination of instruments and markets tomitigate against the risk of bank failure.
There are many areas of liquidity – in sourcessuch as sovereign wealth funds and hedge funds– but they are spread in different places.Companies accessing such sources need to beready to adjust to a new world ofdisintermediation with such funders expecting adirect interface with the company. Businesscases and deal rationales need to be extremelywell developed. PwC can help with thisinterface. We have developed a database of over130 investors active in European debt markets.We have acted on raising 38bn euros frominvestors since late 2008 and 14bn euros in thelast 18 months alone.
Chinese IPO flow
IPOs are not included in the deals analysisand totals in this report but the largestones are listed in figure 7. The flow ofChinese renewable company IPOscontinued in 2011, on the Hong Kong andShanghai exchanges. The flow wasmaintained despite the marketuncertainties and sovereign debt concernsthat had shut down IPO prospectselsewhere. Sinohydro’s US$2.1bn IPO of30% of its equity was the biggest in Asia in2011 but had to be priced at the bottom ofits indicative range to match lowerdemand. The company has extensive hydrointerests but is also an infrastructurecompany with wide-ranging otherinvestments besides energy.
At the beginning of the year, Sinovel WindGroup had succeeded in pricing itsUS$1.4bn IPO at the top of its indicativerange. Interest in photovoltaic (PV)equipment maker Beijing JingyuntongTechnology Company was strong when itlisted in September 2011 despite concernsabout overcapacity in the solar PV market.Towards the end of the year however, theIPO of Guodian Technology &Environment Group, whose parentcompany is major power plant operatorChina Guodian Corporation, was delayed.
No. Value of Date Company Country Exchange Markettransaction announced sector(US$m)
Figure 7: Top five renewable energy IPOs in 2011
2,114
1,429
878
648
394
29 Sep 11
05 Jan 11
10 Jun 11
30 Dec 11
09 Sep 11
Sinohydro Corporation Ltd.
Sinovel Wind Group Co. Ltd.
Huaneng Renewables Corp. Ltd. (f.k.a. Huaneng New Energy Industrial)
Guodian Technology & Environment Group Corp.
Beijing Jingyuntong Technology Co. Ltd.
China
China
China
China
China
Shanghai Stock Exchange
Shanghai Stock Exchange
Hong Kong Stock Exchange
Hong Kong Stock Exchange
Shanghai Stock Exchange
Hydro, Wind
Wind
Wind, Solar
Energy efficiency
Solar
1
2
3
4
5
The size of its raising was reduced by 50% prior to finally listing at the end ofDecember. Guodian Technology &Environment Group is the largestenvironmental protection and energyconservation solutions provider forChinese coal-fired power plants and is alsoactively developing and promoting windpower and solar energy in China andinternationally.

14 Renewables Deals 2012 outlook and 2011 review
The deal focus has switched firmly back across the Atlanticcompared to a year earlier when North America had rivalledEurope for deal activity. Europe accounted for 56% of targetdeal value in 2011 and European bidders were responsible for48% of total worldwide deal value. Although the number ofEuropean targets dipped 6%, the total value of such targets rose80%, from US$16.7bn to US$30bn.
Deal places: a focus on markets worldwide
South America was another region thatsaw a big increase in deal value – up fromUS$3.8bn in 2010 to US$6.2bn in 2011.The increase was accounted for by theUS$2.9bn CPFL Energias Renováveis deal(see deal review section). But the pace ofdealmaking in the region was also up –deal numbers nearly doubled, albeit from alow base.
North American deal numbers and valuedipped 5%, having recorded a strong risein the previous year. Only two deals fromthe region made it into the top ten listcompared with four in 2010. But there wasa big jump in both the number and valueof deals for North American solar assets.Solar targets comprised over a third (35%)of all deals and 42% of total renewablesdeal value in the region.
Deal numbers were down by a quarter fortargets in the Asia Pacific region but thetotal value transacted rose 15% toUS$4.6bn. This remained well short of theUS$7.3bn of 2009. But these totals do notinclude the flow of Chinese renewablesIPOs that have taken place (see figure 7).Values were higher on the buy side –buyers from the region purchasedUS$9.4bn worldwide in 2011, nearlydouble the US$4.8bn in the previous year.
North America 2010 2011 % change
Value of deals (US$m) 13,045 12,397 (5)%
Number of deals 206 195 (5)%
Average deal value (US$m ) 63 64
Europe 2010 2011 % change
Value of deals (US$m) 16,692 30,049 80%
Number of deals 293 275 (6)%
Average deal value (US$m) 57 109
Figure 8: Deals by target continent

Renewables Deals 2012 outlook and 2011 review 15
South America 2010 2011 % change
Value of deals (US$m) 3,816 6,206 63%
Number of deals 20 38 90%
Average deal value (US$m) 191 163
Asia Pacific (incl. Australasia) 2010 2011 % change
Value of deals (US$m) 4,017 4,612 15%
Number of deals 78 58 (26)%
Average deal value (US$m) 51 80
By Bidder By value Number % share of total % share of total(US$m) of deals deal value deal number
Europe 25,667 (16,292) 264 (274) 48% (43%) 46% (45%)
North America 12,796 (15,975) 207 (238) 24% (42%) 36% (39%)
Asia Pacific 9,415 (4,776) 75 (81) 18% (12%) 13% (13%)
South America 5,253 (1,129) 20 (11) 10% (3%) 4% (2%)
Middle East & Africa 365 (48) 4 (2) 1% (0%) 1% (0%)
Total 53,495 (38,221) 570 (606) 100% (100%) 100% (100%)
Figure 9: 2011 deals by continent by value of transactions (2011 total: US$53,495m)(2010 deals shown in parenthesis – 2010 total US$38,221m)
By Target By value Number % share of total % share of total(US$m) of deals deal value deal number
Europe 30,049 (16,692) 275 (293) 56% (44%) 48% (48%)
North America 12,397 (13,045) 195 (206) 23% (34%) 34% (34%)
Asia Pacific 4,612 (4,017) 58 (78) 9% (11%) 10% (13%)
South America 6,206 (3,816) 38 (20) 12% (10%) 7% (3%)
Middle East & Africa 231 (649) 4 (9) 0% (2%) 1% (1%)
Total 53,495 (38,221) 570 (606) 100% (100%) 100% (100%)

16 Renewables Deals 2012 outlook and 2011 review
In contrast to previous years when Germantargets comprised a larger proportion oftarget value, deal value and numbers weremuch more evenly spread between thelarger European country markets of Spain,Italy, France, Germany and the UK. Thebuy-backs by Iberdrola and EDF (see dealreview section) boosted deal totals inSpain and France. There was also aconcentration of larger deals for solar andwind assets in Spain and Italy, mostnotably private equity firm Bridgepoint’sUS$880m purchase of 11 windfarms fromSpanish construction group ACS and UKprivate equity firm Terra Firma’s US$933mpurchase of solar PV developer ReteRinnovabile from Italian grid operatorTerna. This deal was announced in 2010but did not complete until 2011.
Europe was the biggest hunting ground for renewables andcleantech deals in 2011. Six of the top ten largest deals were forEuropean targets. The biggest deal of the year featured aJapanese buyer. The remainder of the six were all Europeanaffairs. The importance of grid modernisation and smartmetering as a route to facilitating renewable generationexpansion and energy efficiency was highlighted by the twolargest European deals.
EuropeDeal places: a focus on markets worldwide
Figure 10: Europe renewables deals by sector – 2011
By value % share of total Number of deals % share of total(US$m) Europe deal value Europe deal number
Wind 11,954 40% 104 38%
Solar 9,697 32% 103 37%
Energy efficiency 5,761 19% 31 11%
Biomass 1,458 5% 24 9%
Hydro 559 2% 6 2%
Biofuels 473 2% 4 1%
Geothermal 149 0% 3 1%
Total 30,049 100% 275 100%
The US$1.4bn acquisition of Spanishsoftware and services company Telvent byFrance’s Schneider Electric is anotherimportant move in the smart grid andenergy management field. SchneiderElectric is a global specialist in energymanagement with operations in more than100 countries. Telvent’s smart grid servicesinclude grid monitoring and controlsoftware and the company also has variousintelligence and information technologiesthat complement Schneider’s energymanagement services.
The biggest deal saw Japan’s Toshiba winthe auction for Swiss smart meteringcompany Landis+Gyr in a US$2.3bn deal.The company’s auction by its Australianinvestment group owner Bayard Capitalattracted bids from competing US andSwedish private equity interests beforeToshiba sealed the deal. It gives Toshibadiversification into the growing worldwidesmart grid market, complementing itsexisting presence in generation. It comes ata time when the Japanese nuclearemergency has dampened prospects inToshiba’s nuclear generation equipmentmarket.
Renewables Deals 2012 outlook and 2011 review 17
Elsewhere, the US$1.1bn injection ofDanish pension fund investment in DongEnergy’s Anholt windfarm was asignificant milestone in attractinginvestment into offshore winddevelopments (see pension and insuranceinterest steps up on page 8). The majorexpansion of European windpower isproducing a flow of supply chain deals ascompanies compete for growth andmanage their balance sheets. Germany’sZF Friedrichshafen’s US$731m purchase ofBelgium-based Hansen Transmissions,which makes gearboxes for wind turbines,expanded its capacity and capabilities butalso helped relieve debt from Indian windturbine maker Suzlon Energy and Ecofin,which had owned a share of Hansen.
Away from the large deals, the first equityinvestment by an Asian entity in the UKwind sector saw Marubeni Corporationbuy a US$200m 49.9% stake in DongEnergy’s 172MW Gunfleet Sands offshorewindfarm. The project went into fullproduction in 2010. The two companiesalso agreed a long-term purchaseagreement for the power production andgreen certificates arising from Marubeni’sshare of the windfarm.
Deal dialogue:Valuation – uncertainty continues to hinder value
Capital being deployed into the renewablesector continues to grow, albeit at a slower rate.Total investment was up in 2011 from 2010.Wind and solar continue to attract the majorityof investment. 2011 saw the number of solardeals surpass wind and attract more capital forthe first time. But this has not translated into anincrease in valuations. Regulatory uncertainties,combined with greater power price volatilityand a disjointed approach to policy, meantinvestors took a more cautious approach to assetvaluation.
The divergence between buyer and seller priceexpectations and the increased cost of debtfinancing has held back asset values.Technology-specific idiosyncrasies also playedtheir part in valuations:
• Recent lower than expected wind speeds in some regions have also led to buyer caution with many market participants adjusting down load factors across their wind operational assets.
• Overcapacity in the manufacture of solar equipment has driven the solar cost base down, causing governments to re-evaluate theamount of support provided to solar projects.Many European countries have imposed volume caps, reduced or suspended the applicable tariff. This has caused uncertainty for investors and raised risk premiums.
Although valuations in many of the moremature markets have declined, emergingmarkets such as Brazil, India, Turkey and SouthAfrica provide new territories for investors.Competition for good quality assets will ensurevaluations in these markets remain high.
Our global renewables teams have sectorexperts who understand the factorsunderpinning valuations of renewable assets.With PwC’s international network, we are ableto advise on the local situation within thecontext of a global market to assist you withyour deal needs.
Despite an increase in the number of new investors entering the renewablessector in 2011, asset valuations struggled to maintain the highs achieved in 2010as uncertainty about government support mechanisms begin to take a toll oninvestor risk appetite.
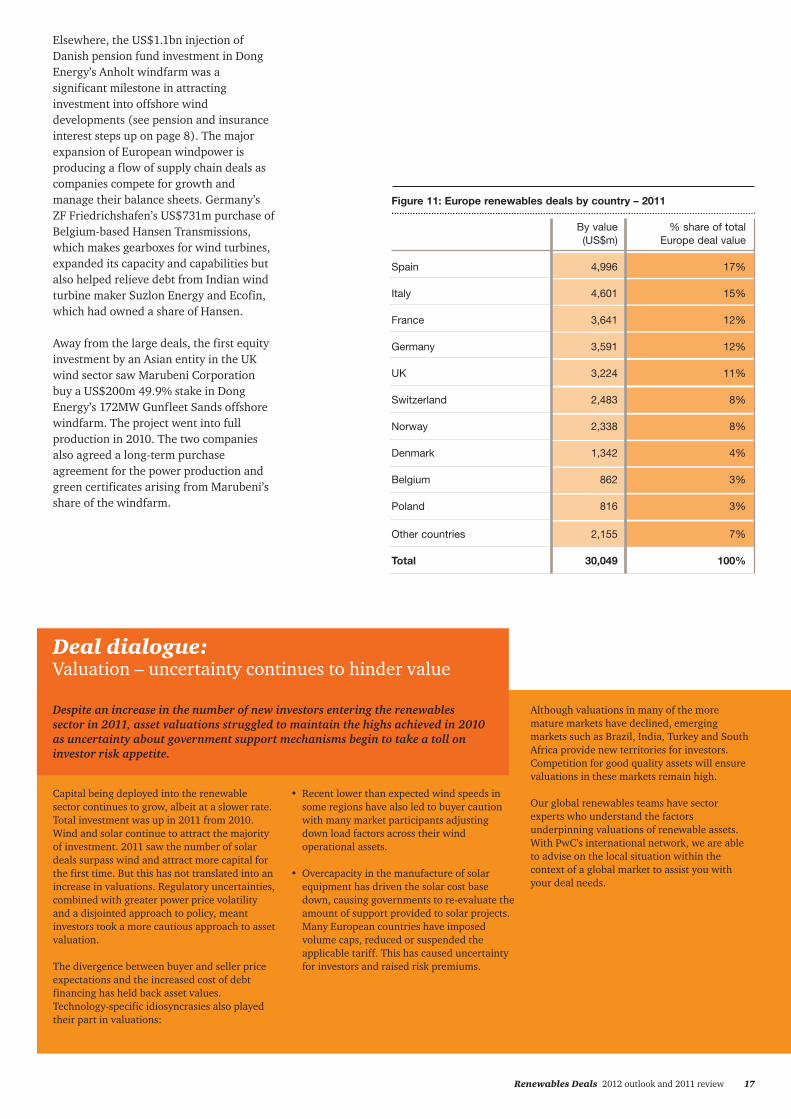
Figure 11: Europe renewables deals by country – 2011
By value % share of total (US$m) Europe deal value
Spain 4,996 17%
Italy 4,601 15%
France 3,641 12%
Germany 3,591 12%
UK 3,224 11%
Switzerland 2,483 8%
Norway 2,338 8%
Denmark 1,342 4%
Belgium 862 3%
Poland 816 3%
Other countries 2,155 7%
Total 30,049 100%
18 Renewables Deals 2012 outlook and 2011 review
Financing and market conditions haveconstrained the ability of solar companiesto gain access to capital. The need to teamup with companies with deep pockets wasreflected in the largest North Americandeal. Total’s investment in a majority stakein SunPower gives the US solar panelsupplier greater financing, geographicaland R&D strength. It is part of a shake-outof the sector that is likely to be dominatedby a smaller number of large globalplayers. The deal was followed by theintegration of Tenesol, Total’s solar unit,with SunPower. After the sale of Tenesol,Total owns about 66% of SunPower’scommon shares.
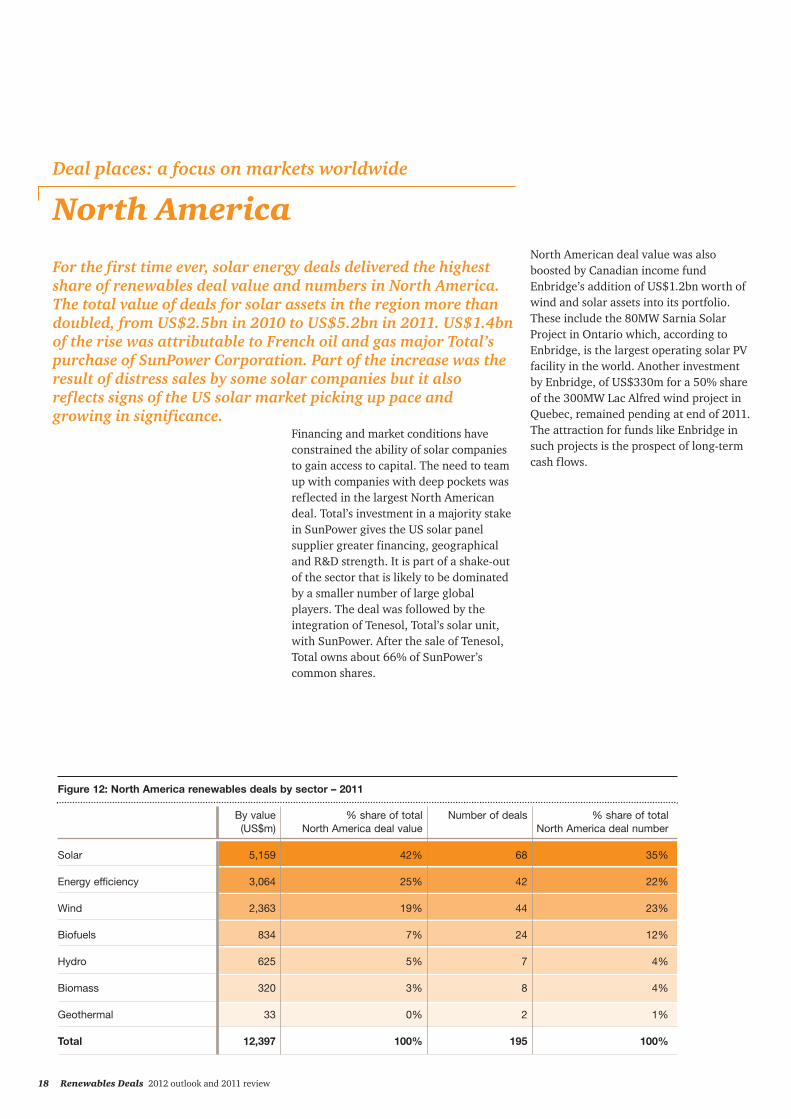
For the first time ever, solar energy deals delivered the highestshare of renewables deal value and numbers in North America.The total value of deals for solar assets in the region more thandoubled, from US$2.5bn in 2010 to US$5.2bn in 2011. US$1.4bnof the rise was attributable to French oil and gas major Total’spurchase of SunPower Corporation. Part of the increase was theresult of distress sales by some solar companies but it alsoreflects signs of the US solar market picking up pace andgrowing in significance.
North AmericaNorth American deal value was alsoboosted by Canadian income fundEnbridge’s addition of US$1.2bn worth ofwind and solar assets into its portfolio.These include the 80MW Sarnia SolarProject in Ontario which, according toEnbridge, is the largest operating solar PVfacility in the world. Another investmentby Enbridge, of US$330m for a 50% shareof the 300MW Lac Alfred wind project inQuebec, remained pending at end of 2011.The attraction for funds like Enbridge insuch projects is the prospect of long-termcash flows.
Deal places: a focus on markets worldwide
Figure 12: North America renewables deals by sector – 2011
By value % share of total Number of deals % share of total(US$m) North America deal value North America deal number
Solar 5,159 42% 68 35%
Energy efficiency 3,064 25% 42 22%
Wind 2,363 19% 44 23%
Biofuels 834 7% 24 12%
Hydro 625 5% 7 4%
Biomass 320 3% 8 4%
Geothermal 33 0% 2 1%
Total 12,397 100% 195 100%

Renewables Deals 2012 outlook and 2011 review 19
The SunPower deal and the First Solar dealhighlight different ends of the financingneeds of solar companies. In the case ofthe former, it is finance for overallexpansion and growth of the company as awhole worldwide. First Solar is also animportant global player. The MidAmericandeal highlights the sometimes ‘stop start’environment for renewable energy projectfinancing in the US. The loan guaranteescheme was always designed as a finitetime-limited programme. Another part ofthe American stimulus package wasprovision for bonus depreciation.
This allowed for 100% bonus depreciationin 2011 and 50% bonus depreciation in2012. Although the 100% bonus has notbeen extended at the time of writing, a 12-month extension has been proposed ina legislative bill before Congress.
Similarly, as the year came to end, therewas again uncertainty over the future ofthe production tax credit which provides asignificant tax incentive to help energydevelopers raise private funds to bringrenewable energy projects to completion.
The growth in deals for energy efficiencyand related cleantech assets has continuedwith US$3.1bn of such deals in 2011, upfrom US$2.5bn the previous year. Butthere was a falling off of windpower deals.Their share of North American deal valuedropped significantly from 28% to 19%with total windpower deal value in theregion falling 35%, from US$3.6bn toUS$2.4bn.
Similar motivations, together with energymix repositioning, prompted MidAmericanEnergy Holdings, the utility companyowned by Warren Buffett’s BerkshireHathaway, to make its first investment insolar power. It announced in December2011 that it will purchase the 550MWTopaz Solar Farm from First Solar. PacificGas and Electric Company will buy theelectricity from Topaz under a 25-yearpower purchase agreement. The PV facilityis under construction and First Solar willcontinue to build and operate the plant.Topaz was one of the first solar energyplants that did not qualify for financingunder the US Department of Energy’s loanguarantee scheme. Commenting on thedeal, Greg Abel, chairman, president andCEO of MidAmerican Energy HoldingsCompany, said: “This project alsodemonstrates that solar energy is acommercially viable technology withoutthe support of governmental loanguarantees2.” No value has been disclosedand the deal remains pending so is notincluded in the deal totals.
Figure 13: North America renewables deals by country – 2011
By value % share of total (US$m) North America deal value
United States 9,482 76%
Canada 2,767 22%
Mexico 148 1%
Total 12,397 100%
2 MidAmerican Energy Holdings, press release, 7 December 2011.
Deal dialogue:Tax equity structures come back into focus in the US
For the past three years, US renewabledevelopers have been able to rely on a federalrenewable grant which provided a grant in lieuof credit for 30% of qualifying construction costsfor the majority of renewable projects. Thisreduced their need for other sources of capital,such as tax equity. But the grant programmeexpired at the end of 2011 putting renewedfocus on the need for investors with taxappetite.
Developers need to consider complex tax equitystructures and their related implications onoverall project cost of capital in order toeffectively compete in developing andtransacting on renewable projects. Thesecomplex tax equity structures will affectearnings and cash flow as well as accountingand financial reporting.
Examples of potential structures can include:
• flip structure: The majority of the tax credits and cost recovery deductions (i.e. depreciation) are allocated to the investor until a preferred return is achieved, after which the majority of such allocations revert to the developer
• sale leaseback: The developer sells the asset to the investor in exchange for cash and leasesthe asset back from the investor. The investor receives the tax credits and cost recovery deductions as well as rent from the developer.
There is no one-size-fits-all model and generallyfinancial models can differ greatly betweeninvestor and developer. It is important tounderstand the different structuring optionsavailable, be able to properly model thestructures, and understand the impact onearnings and financial reporting.
PwC can help. Our power and utilities M&Aspecialists offer expert market and deal strategyadvice and diligence services. We deliver valuethrough quantitative analysis, rigorousimplementation and leading edge structuringtechniques, ensuring tax-efficient dealcompletion, appropriate financial reporting, andpost-deal integration.
With the expiration of the US federal renewable cash grant programme, thefocus of renewable developers is switching back to monetising tax credits andcost recovery deductions. Finding the right structure and understanding how thetransactions affect accounting and financial reporting are essential.

20 Renewables Deals 2012 outlook and 2011 review
The majority of renewables and cleantech deal value involvingAsia Pacific entities continues to be tilted towards outboundworldwide deals rather than targets inside the region. AsiaPacific targets accounted for US$4.6bn but Asia Pacific buyerscompleted US$9.4bn of transactions in 2011. Just under half ofthis bidder total was accounted for by the two big Europeanpurchases by Toshiba and China National Bluestar (see Europesection).
Asia Pacific
Japanese and Chinese buyers have ledexpansionist renewables deal activity butthe scope for companies from othercountries, such as Korea and Singapore,was highlighted in some smaller deals.South Korean conglomerates HanwaChemical Corporation and SK Groupfeatured in moves to invest in China’sSolarFun Power Holdings and US thinfilm solar PV manufacturer HelioVoltrespectively.
The largest deal for assets within theregion was Universal DevelopmentResources US$1.7bn purchase of a 25.5%stake in True Green Energy Group, aFrankfurt listed clean energy groupheadquartered and operational in thePhilippines. Universal DevelopmentResources represents the interests ofseveral prospective constructioncompanies and multi-billion dollar firms inChina, including but not limited to CITICGroup, China State EngineeringConstruction Corporation, and ChinaRailroad Engineering ConstructionCorporation. True Green Energy Group isdeveloping low cost housing infrastructurewhich includes decarbonised electricpower generation through biomass fromwaste energy.
Deal places: a focus on markets worldwide
Figure 14: Asia Pacific renewables deals by sector – 2011
By value % share of total Number of deals % share of total(US$m) Asia Pacific deal value Asia Pacific deal number
Biomass 1,971 43% 11 19%
Wind 980 21% 15 26%
Solar 899 19% 16 28%
Energy efficiency 373 8% 7 12%
Hydro 193 4% 2 3%
Geothermal 101 2% 3 5%
Biofuels 94 2% 4 7%
Total 4,612 100% 58 100%
The China National Bluestar deal, whichhad been announced the previous year,and the more recent purchase of US solarcompany SunPower by Total highlight thetrend towards global consolidation andgrowth in solar. But at the domestic levelwithin China the solar sector remainshighly fragmented across small producersand is in considerable need ofconsolidation. The same is the case in thewindpower sector. China’s Five Year Plan2011-16 stresses that the government willback efficient providers and pressureinefficient providers to leave the market3.Reuters reports a draft proposal fromChina’s Ministry of Industries andInformation Technology (MIIT) envisagingthe creation of one or two big solar makersand about eight to ten medium-sized ones4.
3 Government of China, 12th Five-Year Plan, March 2011.4 Reuters, Analysis: Solar companies to seek deep pockets in downturn, 6 December 2011.
Renewables Deals 2012 outlook and 2011 review 21
This transaction continues a trend ofincreasing interest from Chinese investorsin the Australian wind sector. During 2011,China Datang Renewable Energy teamedup with Australian project developer CBDEnergy in a joint venture with the statedambition of gaining a third of theAustralian wind market over the next eightyears. The Chinese wind turbinemanufacturer, Goldwind, has recentlyinvested in two wind development projectswith the intention of selling these projectsto longer-term investors over time.
Weak wholesale electricity and renewableenergy certificate (REC) prices hashampered new renewable energyconstruction in Australia. However, ahandful of new projects received powerpurchase agreements (PPAs) from retailersin 2011. These included projects fromAcciona of Spain and Chinese investors(see above). Some commentators also sawthe price received by AGL on its developedassets (under construction) as signallingbetter prospects for renewable energygrowth. While the major retailers still holdexcess RECs on their balance sheets, theyhave been prepared to contract atfavourable prices, and may also berecognising that the REC supply/demandbalance could quickly change if sufficientnew projects are not brought online on atimely basis in the period to 2020, bywhich time 20% of their energy supplymust be from renewable sources.
The remainder of deals in the region werefor much smaller values. They wereheaded by a US$262m sale by TokyoElectric Power Company (Tepco) of anadditional stake in renewables companyEurus Energy Holdings Corporation toToyota Tsusho. Toyota Tsusho was alreadya partner in the joint venture between thecompanies and the sale came in the wakeof the Fukushima emergency and thesubsequent need for fundraising by Tepco.
In Australia, the largest completed dealwas natural gas infrastructure companyAPA Group’s US$180m purchase of the80MW Emu Downs windfarm in WesternAustralia and development rights for anadjacent 130MW development site. TheEmu Downs sale was followed closely byAGL Energy’s US$171m sale of the nearlycompleted 67MW Oaklands Hill windfarmin Victoria to Challenger Group. At the endof the year, Guohua, a unit of China’s state-owned coal giant Shenhua Group,was announced on 22 December as thesuccessful bidder for a 75% interest inHydro Tasmania’s Woolnorth Wind Farms(140MW), following a hotly contestedbidding process.
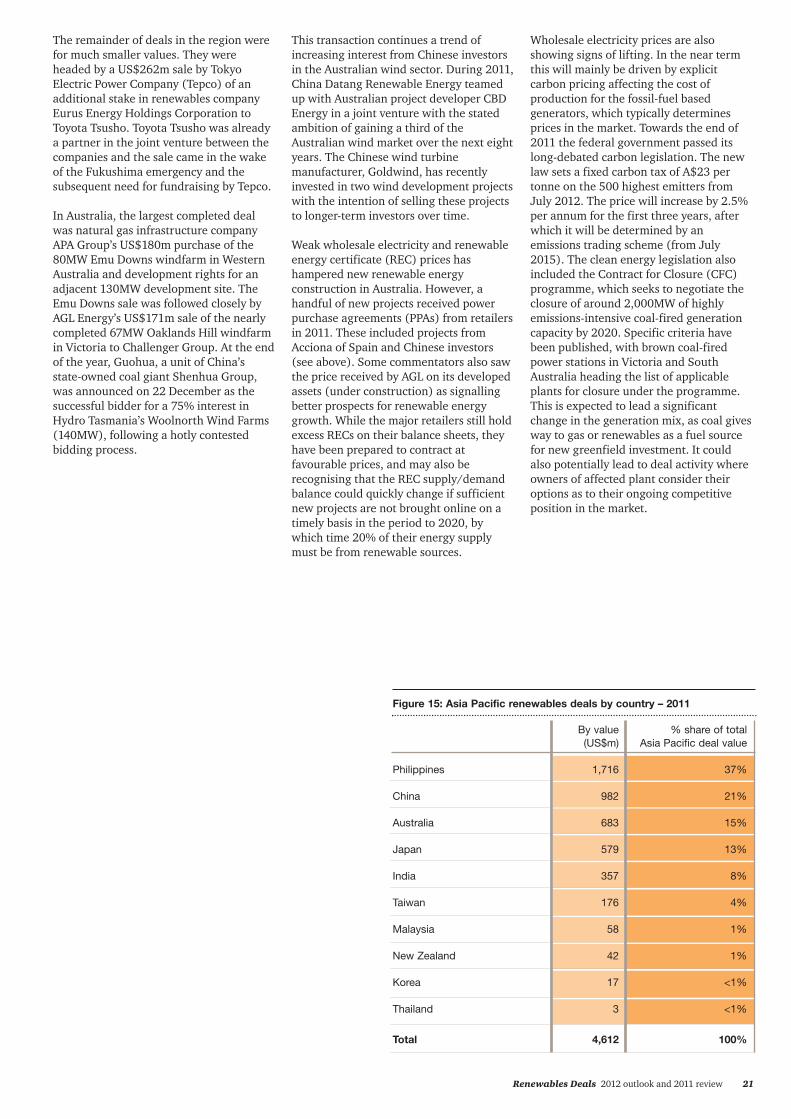
Figure 15: Asia Pacific renewables deals by country – 2011
By value % share of total (US$m) Asia Pacific deal value
Philippines 1,716 37%
China 982 21%
Australia 683 15%
Japan 579 13%
India 357 8%
Taiwan 176 4%
Malaysia 58 1%
New Zealand 42 1%
Korea 17 <1%
Thailand 3 <1%
Total 4,612 100%
Wholesale electricity prices are alsoshowing signs of lifting. In the near termthis will mainly be driven by explicitcarbon pricing affecting the cost ofproduction for the fossil-fuel basedgenerators, which typically determinesprices in the market. Towards the end of2011 the federal government passed itslong-debated carbon legislation. The newlaw sets a fixed carbon tax of A$23 pertonne on the 500 highest emitters fromJuly 2012. The price will increase by 2.5%per annum for the first three years, afterwhich it will be determined by anemissions trading scheme (from July2015). The clean energy legislation alsoincluded the Contract for Closure (CFC)programme, which seeks to negotiate theclosure of around 2,000MW of highlyemissions-intensive coal-fired generationcapacity by 2020. Specific criteria havebeen published, with brown coal-firedpower stations in Victoria and SouthAustralia heading the list of applicableplants for closure under the programme.This is expected to lead a significantchange in the generation mix, as coal givesway to gas or renewables as a fuel sourcefor new greenfield investment. It couldalso potentially lead to deal activity whereowners of affected plant consider theiroptions as to their ongoing competitiveposition in the market.

22 Renewables Deals 2012 outlook and 2011 review
Manfred WiegandGlobal Power & Utilities LeaderTelephone: +49 201 438 1517Email: [email protected]
Paul NillesenTelephone: +31 20 568 6993Email: [email protected]
John GibbsTelephone: +44 20 7212 3800Email: [email protected]
Ronan O’ReganTelephone: +44 20 7804 4259Email: [email protected]
John McConomyTelephone: +1 267 330 2184Email: [email protected]
Rob McCeneyTelephone: +1 713 356 6600Email: [email protected]
Jeremy FagoTelephone: +1 415 498 7031Email: [email protected]
Peter MunnsTelephone: +61 3 8603 4464Email: [email protected]
Andy WelshTelephone: +61 3 8603 2704Email: [email protected]
Olesya HatopGlobal Energy, Utilities & Mining MarketingTelephone: +49 201 438 1431Email: [email protected]
Anja CavuntCentral Cluster Power & Utilities MarketingTelephone: +49 201 438 1433Email: [email protected]
Global Renewables Deals Team
ContactsTerritory contacts
AfricaStanley SubramoneyTelephone: +27 11 797 4380Email: [email protected]
AustralasiaJock O’CallaghanTelephone: +61 3 8603 6137Email: [email protected]
AustriaMichael Sponring Telephone: +43 1 501 88 2935 Email: [email protected]
BrazilGuilherme Valle Telephone: +55 21 3232 6011 Email: [email protected]
CanadaScott BoltonTelephone: +1 403 509 7502Email: [email protected]
Alistair BrydenTelephone: +1 403 509 7354Email: [email protected]
ChinaGavin ChuiTelephone: +86 10 6533 2188Email: [email protected]
DenmarkPer Timmermann Telephone: +45 3945 3945Email: [email protected]
FinlandMauri HätönenTelephone: +358 9 2280 1946 Email: [email protected]
FrancePhilippe GiraultTelephone: +33 1 5657 8897Email: [email protected]
GermanyNorbert Schwieters Telephone: +49 211 981 2153 Email: [email protected]

Renewables Deals 2012 outlook and 2011 review 23
GreeceSocrates Leptos-BourgiTelephone: +30 210 687 4693Email: [email protected]
IndiaKameswara RaoTelephone: +9140 6624 6688Email: [email protected]
IrelandAnn O’ConnellTelephone: +353 1 792 8512Email: [email protected]
ItalyGiovanni PoggioTelephone: +39 06 570252588Email: [email protected]
JapanKoji Yamasaki Telephone: +81 80 3731 5101 Email: [email protected]
Latin AmericaJorge BacherTelephone: +54 11 5811 6952Email: [email protected]
Middle EastPaul NavratilTelephone: +973 1754 0554Email: [email protected]
NetherlandsJeroen van HoofTelephone: +31 88 792 1328Email: [email protected]
New ZealandCraig RiceTelephone: +64 9 355 8641Email: [email protected]
NorwayStåle Johansen Telephone: +47 9526 0476Email: [email protected]
PolandPiotr Luba Telephone: +48 22 523 4679 Email: [email protected]
Russia & Central and Eastern EuropeMichael O’Riordan Telephone: +7 495 232 5774 Email: [email protected]
SingaporePaul CorneliusTelephone: +65 6236 3718Email: [email protected]
SpainInaki Goiriena Telephone: +34 915 684 469 Email: [email protected]
SwedenMartin GaveliusTelephone: +46 8 5553 3529Email: [email protected]
SwitzerlandMarc Schmidli Telephone: +41 58 792 1564 Email: [email protected]
TurkeyFaruk Sabuncu Telephone: +90 212 326 6082 Email: [email protected]
United KingdomSteve JenningsTelephone: +44 20 7802 1449Email: [email protected]
Andrew McCrossonTelephone: +44 20 7213 5334Email: [email protected]
United StatesDavid Etheridge Telephone: +1 415 498 7168 Email: [email protected]
UruguayPatricia Marques Telephone: +598 2916 0463 Email: [email protected]

This publication has been prepared for general guidance on matters of interest only, and does not constitute professional advice. You should notact upon the information contained in this publication without obtaining specific professional advice. No representation or warranty (express orimplied) is given as to the accuracy or completeness of the information contained in this publication, and, to the extent permitted by law,PricewaterhouseCoopers does not accept or assume any liability, responsibility or duty of care for any consequences of you or anyone elseacting, or refraining to act, in reliance on the information contained in this publication or for any decision based on it.
© 2012 PwC. All rights reserved. Not for further distribution without the permission of PwC. “PwC” refers to the network of member firms ofPricewaterhouseCoopers International Limited (PwCIL), or, as the context requires, individual member firms of the PwC network. Each memberfirm is a separate legal entity and does not act as agent of PwCIL or any other member firm. PwCIL does not provide any services to clients.PwCIL is not responsible or liable for the acts or omissions of any of its member firms nor can it control the exercise of their professionaljudgment or bind them in any way. No member firm is responsible or liable for the acts or omissions of any other member firm nor can it controlthe exercise of another member firm’s professional judgment or bind another member firm or PwCIL in any way.
PwC firms help organisations and individuals create the valuethey’re looking for. We’re a network of firms in 158 countries withclose to 169,000 people who are committed to delivering qualityin assurance, tax and advisory services. Tell us what matters toyou and find out more by visiting us at www.pwc.com.
The Global Energy, Utilities and Mining group is the professionalservices leader in the international energy, utilities and miningcommunity, advising clients through a global network of fullydedicated specialists.
For further information, please visit:www.pwc.com/renewablesdeals


