Embed Size (px)
Citation preview
REPORT ON THE IMPLEMENTATION AND COST-EFFECTIVENESS
OF THE P.A. 295 RENEWABLE ENERGY STANDARD
Sally A. Talberg, Chairman Norman J. Saari, Commissioner
Rachael A. Eubanks, Commissioner
MICHIGAN PUBLIC SERVICE COMMISSION Department of Licensing and Regulatory Affairs
In compliance with Public Act 295 of 2008, as amended by Act 342 of 2016
February 15, 2018
Table of Contents
Page
Introduction .................................................................................................................................... 1
Report Criteria ......................................................................................................................... 1
Renewable Energy Plans and Commission Approval ............................................................. 2
Renewable Energy Cost Reconciliation Cases and Commission Approval ............................ 3
Summary of Renewable Energy Data Collected ........................................................................... 3
Renewable Energy Credit Requirements – 2016 Compliance ................................................. 4
Status of Renewable Energy and Advanced Cleaner Energy ........................................................ 8
Impact of Percentage Limits on the Use of Energy Waste Reduction Credits ........................12
Michigan Renewable Energy Certification System (MIRECS) .............................................12
Competition in Areas Served by Multiple Providers .....................................................................15
Impact of the Renewable Energy Standard on Employment .........................................................15
The Cost of Renewable Energy Compared to the Cost of New Coal Energy ...............................18
Cost-Effectiveness of Renewable Energy Standard ......................................................................20
Effect of the Renewable Energy Standard on Electricity Prices ....................................................24
Conclusion .....................................................................................................................................26
Appendices .............................................................................................................................. 28-47
A: Renewable Energy Case Numbers and Electric Providers B: Renewable Energy Credit Requirements and Renewable Energy Plan Summary C: Electric Provider Renewable Energy Annual Report Summary D: MIRECS Energy Credit Summary E: Contract Summary F: Requests for Proposals Summary - DTE Electric and Consumers Energy G: Michigan Utility Scale Wind Farms
1
Introduction
Report Criteria
In December 2016, Governor Snyder signed Public Act 342 of 2016 (PA 342) into law.1
PA 342, which became effective on April 20, 2017, amends Public Act 295 of 2008 (PA 295),
increasing the renewable portfolio standard from 10% in 2015 to at least 12.5% in both 2019 and
2020 with a final requirement of at least 15% in 2021. PA 295, as amended by PA 342 of 2016,
includes a goal of meeting not less than 35% of the state’s electric needs through a combination
of energy waste reduction and renewable energy by 2025.
Section 51(5) (MCL 460.1051(5)) requires that by February 15, 2011, and each year
thereafter, the Michigan Public Service Commission (MPSC or Commission) submit to the
standing committees of the Michigan Senate and House of Representatives with primary
responsibility for energy and environmental issues a report that does all of the following:
a) Summarizes data collected under this section.
b) Discusses the status of renewable energy and advanced cleaner energy in this state and the effect of the Renewable Energy Subpart and Energy Waste Reduction Subpart on electricity prices.2
c) For each of the different types of renewable energy sold at retail in this state, specifies the difference between the cost of the renewable energy and the cost of electricity generated from new conventional coal-fired electric generating facilities.
d) Discusses how the Commission is ensuring that actions taken under this Act by electric providers serving customers in the same distribution territory do not create an unfair competitive advantage for any of those electric providers.
e) Evaluates whether the Renewable Energy Subpart has been cost-effective.
1 https://www.legislature.mi.gov/(S(sv1uc2hkoxc3xdiz4liseava))/mileg.aspx?page=getObject&objectName=2015-SB-0438 2 Previous MPSC annual reports included a discussion of the effect of the Energy Waste Reduction Subpart on electricity prices. Beginning with this year’s report, that topic will be discussed in the Report on the Implementation of PA 295 as Amended by PA 342 2016 Utility Energy Waste Reduction Programs.
2
f) Provides a comparison of the cost effectiveness of the methods of an electric utility with one million or more retail customers in this state as of January 1, 2008, obtaining renewable energy credits from renewable energy systems owned by the electric provider and from contracts that do not require the transfer of ownership of the renewable energy system as described in the former Section 33.3
g) Describes the impact of the Renewable Energy Subpart on employment in this state. The Commission shall consult with other appropriate agencies of the department of labor and economic growth in the development of this information.4
h) Describes the effect of the 10% limit on using energy waste reduction credits or advanced cleaner energy credits to meet the renewable energy credit standards.5
i) Makes any recommendations the Commission may have concerning amendments to the Renewable Energy Subpart, including changes in the 10% limits described in (h) or changes in the definition of renewable energy resource or renewable energy system to reflect environmentally preferable technology.
This eighth annual report provides information on the Commission’s renewable energy
activities related to the Act through calendar year 2017 and summarizes data from the electric
provider annual reports through the 2016 calendar year.
Renewable Energy Plans and Commission Approval
Electric providers were required to meet a 10% renewable energy standard based on retail
sales by the end of 2015. PA 342 requires electric providers to achieve the same number of
renewable energy credits (RECs) needed to meet the 2015 standard for 2016, 2017 and 2018.
PA 342 has an interim requirement of at least 12.5% for 2019 and 2020 and increases to at least
15% by the end of 2021.
The renewable energy standard is applicable to Michigan’s investor-owned electric
utilities, cooperative electric utilities, municipal electric utilities and alternative electric suppliers
3 The report no longer includes item Section 51 (5) (f) due to the repeal of Section 33 in PA 342 of 2016. 4 A State government reorganization took place in 2011 that moved employment-related agencies outside the newly-formed Department of Licensing and Regulatory Affairs (LARA). Consultation with the appropriate agencies is continuing. 5 Section 27 (8), the provision describing substituting advanced cleaner energy credits for renewable energy credits, was repealed by PA 342 of 2016.
3
(AESs). The Act directed electric providers to file initial renewable energy plans (REPs) in
2009.6 The 74 initial REPs described how each electric provider intended to meet the renewable
energy standard requirements. The Act also directed electric providers to file REPs biennially
for Commission review. PA 342 directs the Commission to review each electric provider’s REP
within one year of the Act’s effective date. On August 23, 2017, the Commission established
filing requirements for REPs consistent with the new Act.7 Biennial REP filings are no longer
required under PA 342.
A listing of renewable energy case numbers and electric provider names can be found in
Appendix A. Renewable energy credit requirements and renewable energy plan summaries are
shown in Appendix B.
Renewable Energy Cost Reconciliation Cases and Commission Approval
Per Section 49(1) of PA 295, eight rate-regulated electric providers file annual renewable
energy cost reconciliation cases for 2016. Commission staff examines the pertinent revenues and
expenses, determines the electric provider’s compliance with its filed REP and assesses whether
the provider has met its compliance targets. Case numbers for each renewable energy cost
reconciliation case for the reporting period can be found in Appendix A.8
Summary of Renewable Energy Data Collected
Electric providers are directed by Section 51(1) of PA 295 to file annual reports for each
plan year beginning with 2009. The last electric utility annual reports will be filed during 2022
6 There are currently 70 electric service providers, including 12 AESs serving customers in Michigan. Thirteen AESs which are not serving customers are not included in this total. 7 http://www.michigan.gov/documents/mpsc/U-18409_8-23-17_598908_7.pdf 8 http://www.michigan.gov/mpsc/0,4639,7-159-16393_53570-240178--,00.html
4
due to the PA 342 repeal of Section 51, effective January 1, 2023. Michigan electric provider
annual reports for 2009 through 2016 are available on the Commission’s website.9 A summary
of data from annual reports is shown in Appendix C.
Renewable Energy Credit Requirements – 2016 Compliance
For 2016, electric providers were required to comply using the same amount of
renewable energy credits as in 2015.10 The number of renewable energy credits required for
2015 compliance varied by electric provider and was calculated by multiplying the applicable
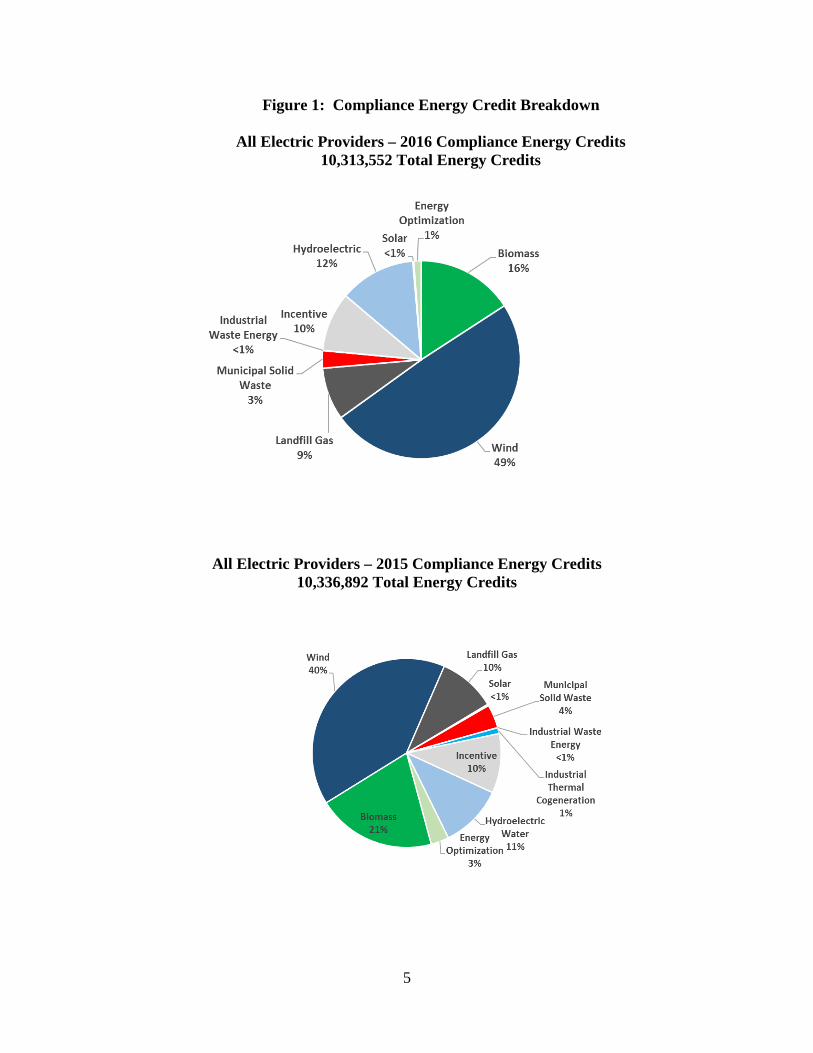
sales figure by the 10% compliance requirement. All11 of Michigan’s electric providers subject
to the standard in 2016 met the standard and retired12 a total of 10,313,552 energy
credits.13 Figure 1 shows the different renewable energy technology types used to generate the
credits for compliance by all electric providers in 2015 and 2016 as well as separately for both
Consumers Energy’s and DTE Electric’s 2016 compliance.
9http://www.michigan.gov/mpsc/0,1607,7-159-16393_53570-240179--,00.html. 10 Several AESs (Calpine Energy Services; U-16650, Constellation Energy Services, Inc.; U-16646 and Constellation NewEnergy Inc.; U-16642) applied to the Commission requesting to have their compliance requirements adjusted to 10% of the previous year’s retail sales for 2016, 2017 and 2018. The Commission approved the requests. 11 Sixty-eight out of seventy electric providers were subject to the 2016 renewable energy standard because MidAmerican Energy Services and Eligo Energy MI, LLC began serving customers in 2015 and 2017, respectively, and therefore did not have a 2016 compliance requirement. 12 Energy credits are “retired” when used for compliance. 13 The term “energy credit” includes renewable energy credits, Michigan incentive renewable energy credits, advanced cleaner energy credits and energy waste reduction credits.
5
Figure 1: Compliance Energy Credit Breakdown
All Electric Providers – 2016 Compliance Energy Credits 10,313,552 Total Energy Credits
All Electric Providers – 2015 Compliance Energy Credits 10,336,892 Total Energy Credits
6
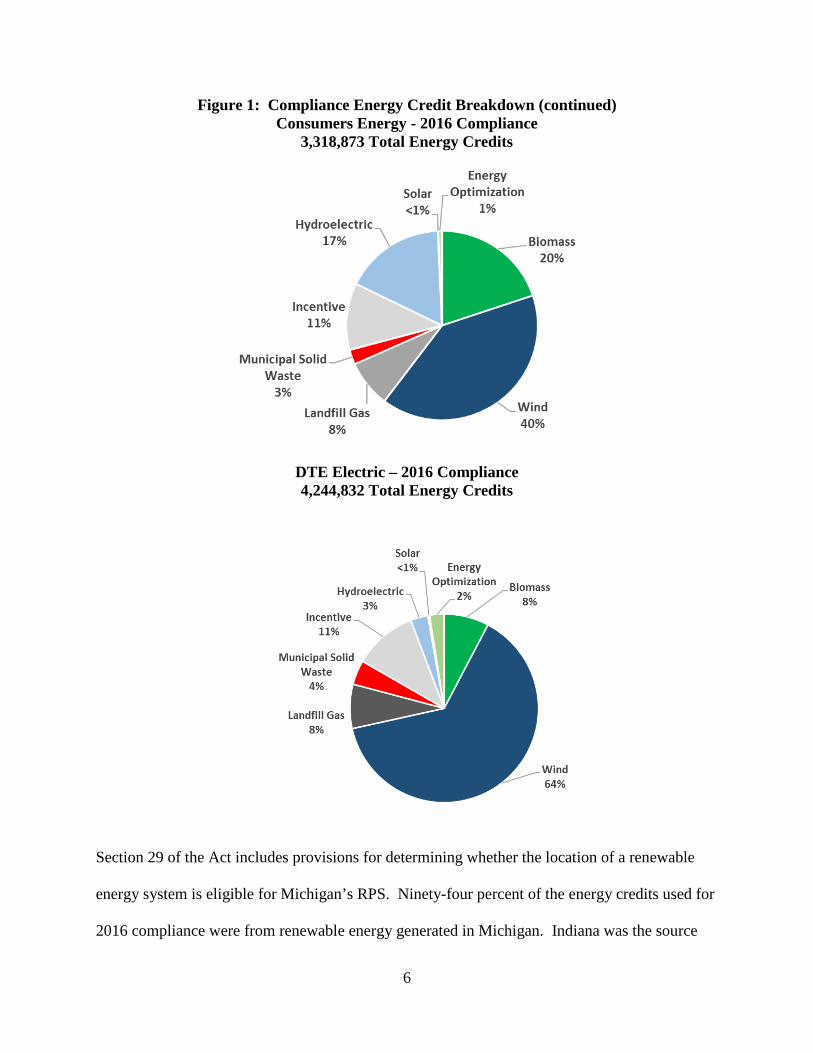
Figure 1: Compliance Energy Credit Breakdown (continued) Consumers Energy - 2016 Compliance
3,318,873 Total Energy Credits
DTE Electric – 2016 Compliance 4,244,832 Total Energy Credits
Section 29 of the Act includes provisions for determining whether the location of a renewable
energy system is eligible for Michigan’s RPS. Ninety-four percent of the energy credits used for
2016 compliance were from renewable energy generated in Michigan. Indiana was the source
7
for over three percent, Wisconsin for over two percent and the remaining credits came from
renewable energy generated in Iowa and Minnesota. Michigan’s multi-state utilities and electric
providers with out-of-state wholesale suppliers are most likely to use energy credits from states
other than Michigan.
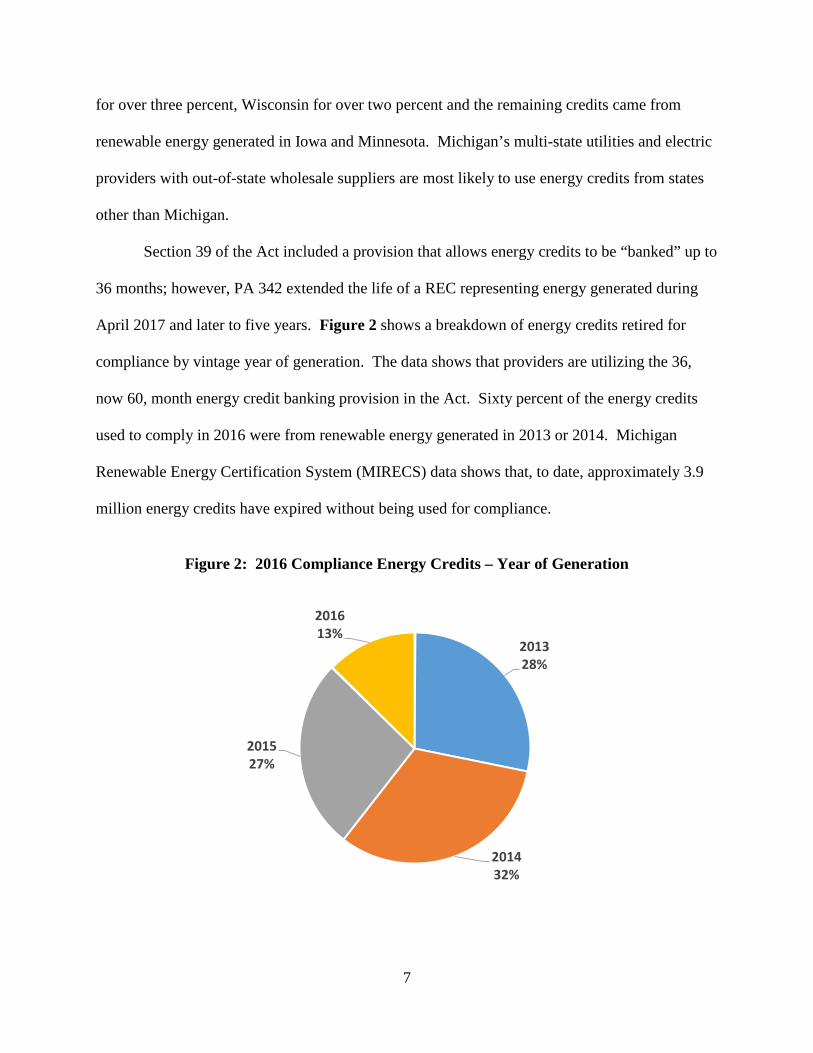
Section 39 of the Act included a provision that allows energy credits to be “banked” up to
36 months; however, PA 342 extended the life of a REC representing energy generated during
April 2017 and later to five years. Figure 2 shows a breakdown of energy credits retired for
compliance by vintage year of generation. The data shows that providers are utilizing the 36,
now 60, month energy credit banking provision in the Act. Sixty percent of the energy credits
used to comply in 2016 were from renewable energy generated in 2013 or 2014. Michigan
Renewable Energy Certification System (MIRECS) data shows that, to date, approximately 3.9
million energy credits have expired without being used for compliance.
Figure 2: 2016 Compliance Energy Credits – Year of Generation
201328%
201432%
201527%
201613%
8
Status of Renewable Energy and Advanced Cleaner Energy
Based on the number of energy credits generated or acquired during 2016, as reported by
electric providers, the number of energy credits generated is equal to 10.8%14 of retail sales as
shown in Appendix C. Michigan’s annual energy credit generation percentage is expected to
continue increasing as new renewable energy projects are expected in future years.
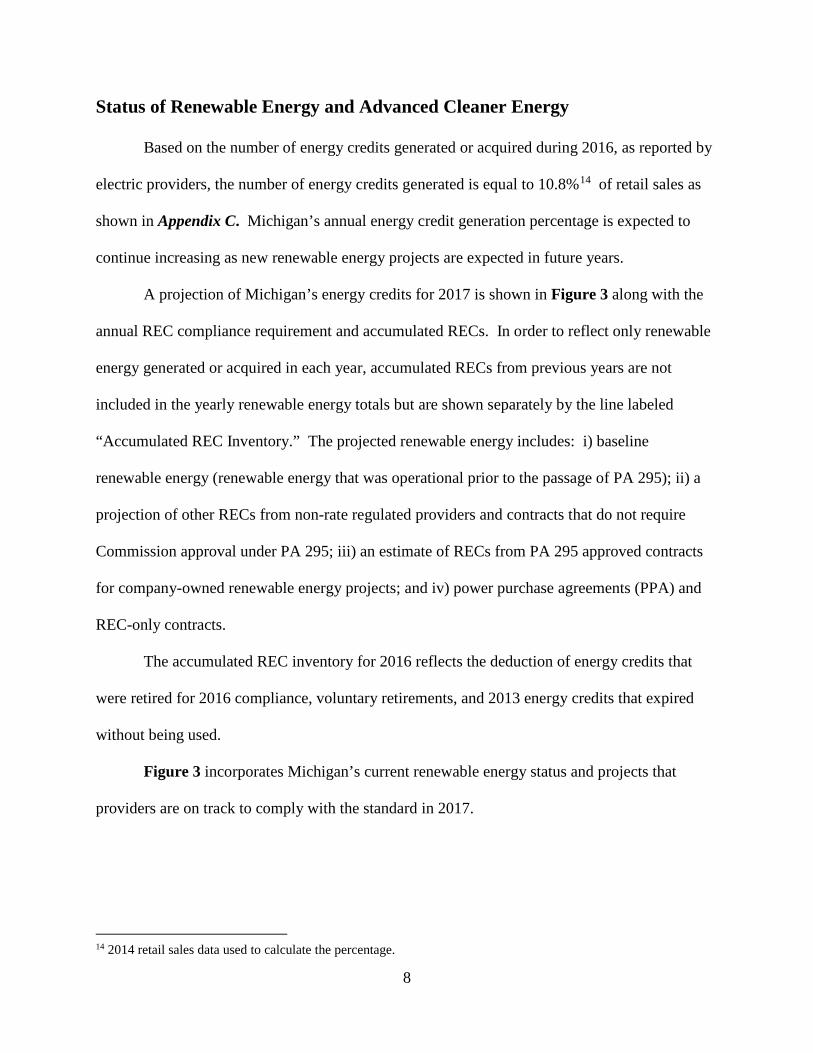
A projection of Michigan’s energy credits for 2017 is shown in Figure 3 along with the
annual REC compliance requirement and accumulated RECs. In order to reflect only renewable
energy generated or acquired in each year, accumulated RECs from previous years are not
included in the yearly renewable energy totals but are shown separately by the line labeled
“Accumulated REC Inventory.” The projected renewable energy includes: i) baseline
renewable energy (renewable energy that was operational prior to the passage of PA 295); ii) a
projection of other RECs from non-rate regulated providers and contracts that do not require
Commission approval under PA 295; iii) an estimate of RECs from PA 295 approved contracts
for company-owned renewable energy projects; and iv) power purchase agreements (PPA) and
REC-only contracts.
The accumulated REC inventory for 2016 reflects the deduction of energy credits that
were retired for 2016 compliance, voluntary retirements, and 2013 energy credits that expired
without being used.
Figure 3 incorporates Michigan’s current renewable energy status and projects that
providers are on track to comply with the standard in 2017.
14 2014 retail sales data used to calculate the percentage.
9
Figure 3: Michigan Renewable Energy Credit Projection
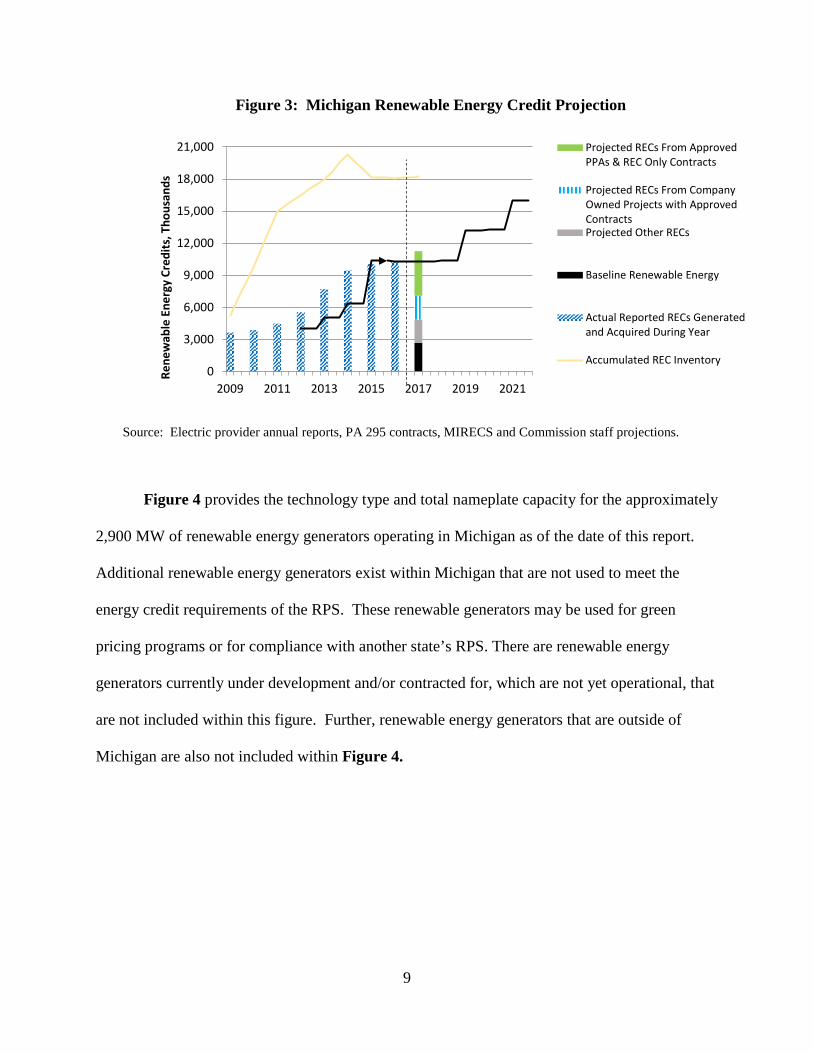
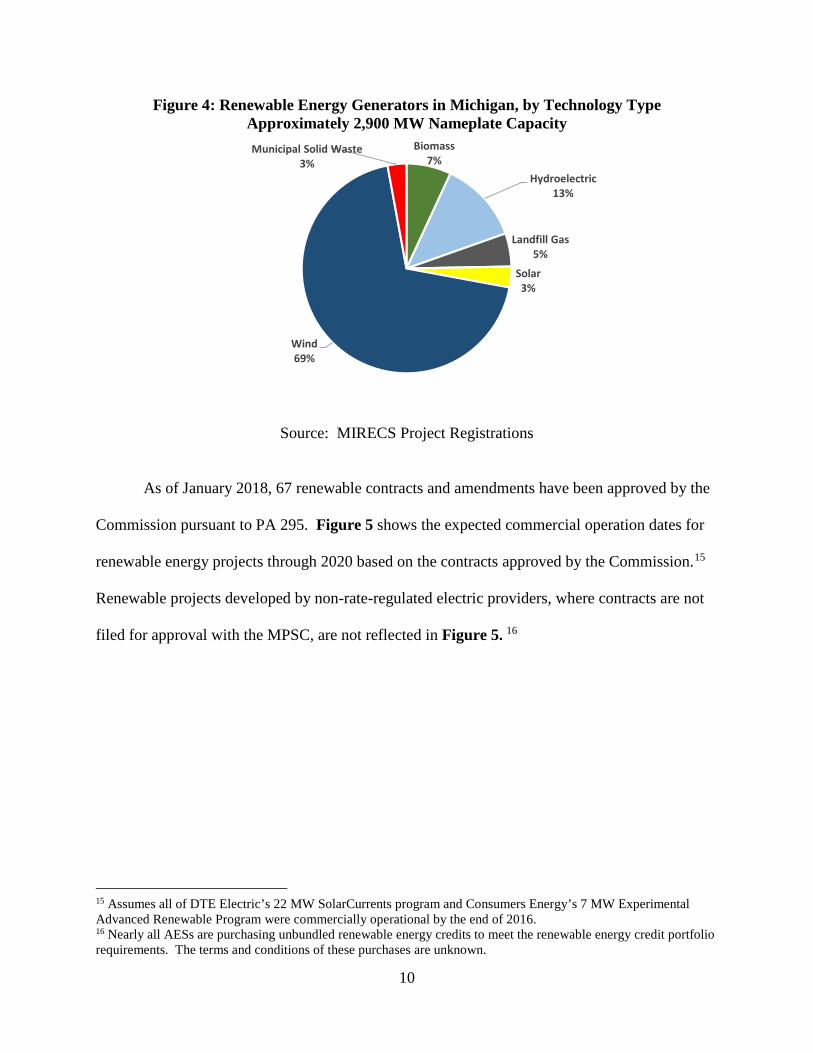
Figure 4 provides the technology type and total nameplate capacity for the approximately
2,900 MW of renewable energy generators operating in Michigan as of the date of this report.
Additional renewable energy generators exist within Michigan that are not used to meet the
energy credit requirements of the RPS. These renewable generators may be used for green
pricing programs or for compliance with another state’s RPS. There are renewable energy
generators currently under development and/or contracted for, which are not yet operational, that
are not included within this figure. Further, renewable energy generators that are outside of
Michigan are also not included within Figure 4.
0
3,000
6,000
9,000
12,000
15,000
18,000
21,000
2009 2011 2013 2015 2017 2019 2021
Rene
wab
le E
nerg
y Cr
edits
, Tho
usan
dsProjected RECs From ApprovedPPAs & REC Only Contracts
Projected RECs From CompanyOwned Projects with ApprovedContractsProjected Other RECs
Baseline Renewable Energy
Actual Reported RECs Generatedand Acquired During Year
Accumulated REC Inventory
Source: Electric provider annual reports, PA 295 contracts, MIRECS and Commission staff projections.
10
Figure 4: Renewable Energy Generators in Michigan, by Technology Type Approximately 2,900 MW Nameplate Capacity
Source: MIRECS Project Registrations
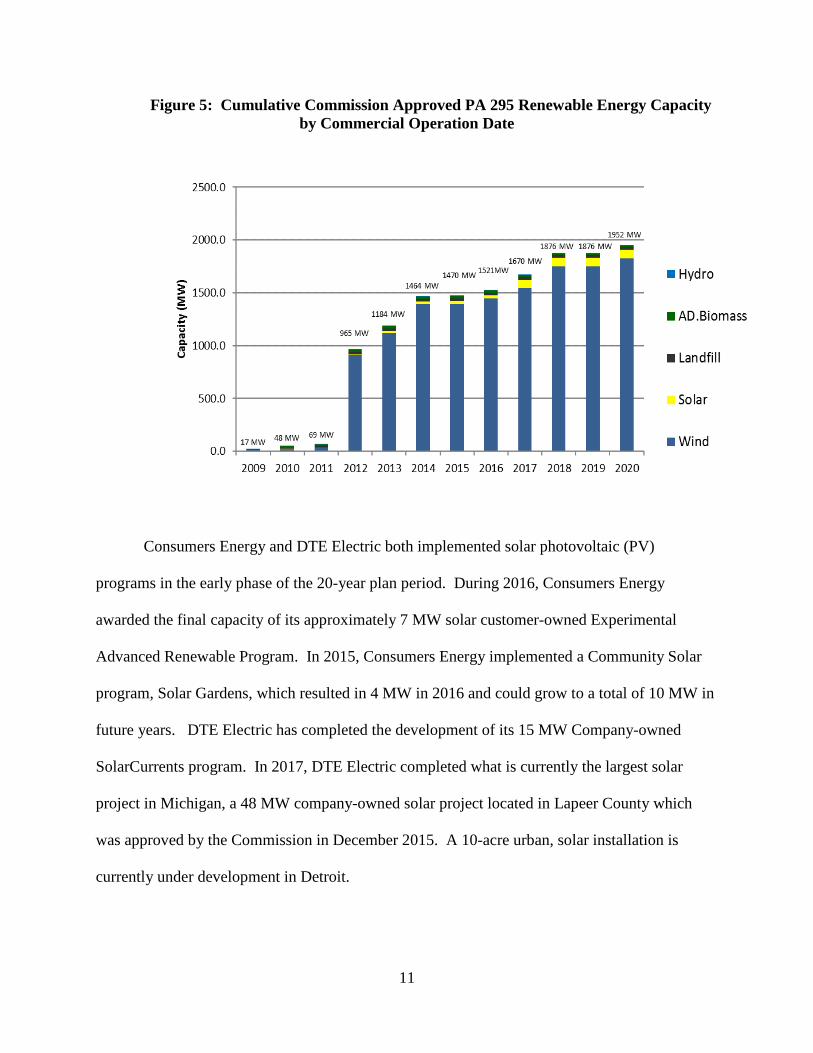
As of January 2018, 67 renewable contracts and amendments have been approved by the
Commission pursuant to PA 295. Figure 5 shows the expected commercial operation dates for
renewable energy projects through 2020 based on the contracts approved by the Commission.15
Renewable projects developed by non-rate-regulated electric providers, where contracts are not
filed for approval with the MPSC, are not reflected in Figure 5. 16
15 Assumes all of DTE Electric’s 22 MW SolarCurrents program and Consumers Energy’s 7 MW Experimental Advanced Renewable Program were commercially operational by the end of 2016. 16 Nearly all AESs are purchasing unbundled renewable energy credits to meet the renewable energy credit portfolio requirements. The terms and conditions of these purchases are unknown.
Biomass7%
Hydroelectric13%
Landfill Gas5%
Solar3%
Wind69%
Municipal Solid Waste3%
11
Figure 5: Cumulative Commission Approved PA 295 Renewable Energy Capacity by Commercial Operation Date
Consumers Energy and DTE Electric both implemented solar photovoltaic (PV)
programs in the early phase of the 20-year plan period. During 2016, Consumers Energy
awarded the final capacity of its approximately 7 MW solar customer-owned Experimental
Advanced Renewable Program. In 2015, Consumers Energy implemented a Community Solar
program, Solar Gardens, which resulted in 4 MW in 2016 and could grow to a total of 10 MW in
future years. DTE Electric has completed the development of its 15 MW Company-owned
SolarCurrents program. In 2017, DTE Electric completed what is currently the largest solar
project in Michigan, a 48 MW company-owned solar project located in Lapeer County which
was approved by the Commission in December 2015. A 10-acre urban, solar installation is
currently under development in Detroit.
12
Impact of Percentage Limits on the Use of Energy Waste Reduction Credits
As allowed by the Act, electric providers included banked energy credits and excess
energy waste reduction credits within their renewable energy credit portfolio to achieve the 2016
compliance requirement. As provided under Section 28 of the Act, energy waste reduction
credits may be substituted for renewable energy credits on a one to one ratio and shall not be
used to meet more than 10% of the renewable energy credit standard. For the 2016 compliance
requirement, two utilities substituted energy waste reduction credits after approval by the
Commission. Consumers Energy and DTE Electric substituted 21,521 and 105,112 energy waste
reduction credits respectively. This compares to 73,117 and 245,148 for the respective
companies in their 2015 compliance portfolios. Likewise, substituting advanced cleaner energy
credits (ACECs) for renewable energy credits has also decreased year over year. For the 2015
compliance requirement, 107,016 ACECs were substituted, while for 2016 the amount decreased
to only 2,252 ACECs. The 10% limit has not been a factor impacting these credit
substitutions. Further, the repeal of Section 27 ended the ability to substitute ACECs for
renewable energy credits after April 2017.
Michigan Renewable Energy Certification System (MIRECS)
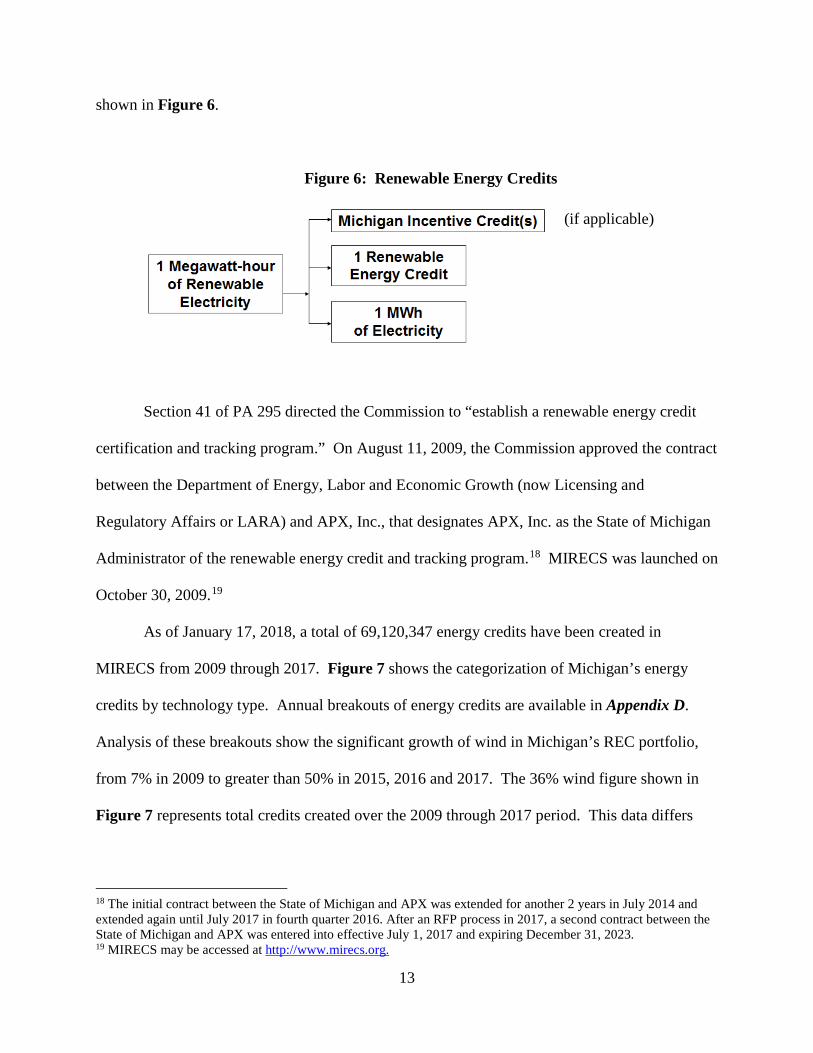
Compliance with the renewable energy standard is demonstrated through the use of
energy credits. One renewable energy credit is created for each megawatt-hour (MWh) of
renewable energy generated. Additionally, the Act provides for Michigan Incentive Renewable
energy credits (IRECs) and the substitution of energy waste reduction credits17 and advanced
cleaner energy credits (ACECs) for RECs. However, due to the repeal of Section 27, ACECs are
no longer substitutable for RECs after April 2017. RECs may be sold separately from energy as
17 At this time, energy waste reduction credits are not transferable from one electric provider to another, meaning that they cannot be sold or otherwise traded.
13
shown in Figure 6.
Figure 6: Renewable Energy Credits
Section 41 of PA 295 directed the Commission to “establish a renewable energy credit
certification and tracking program.” On August 11, 2009, the Commission approved the contract
between the Department of Energy, Labor and Economic Growth (now Licensing and
Regulatory Affairs or LARA) and APX, Inc., that designates APX, Inc. as the State of Michigan
Administrator of the renewable energy credit and tracking program.18 MIRECS was launched on
October 30, 2009.19
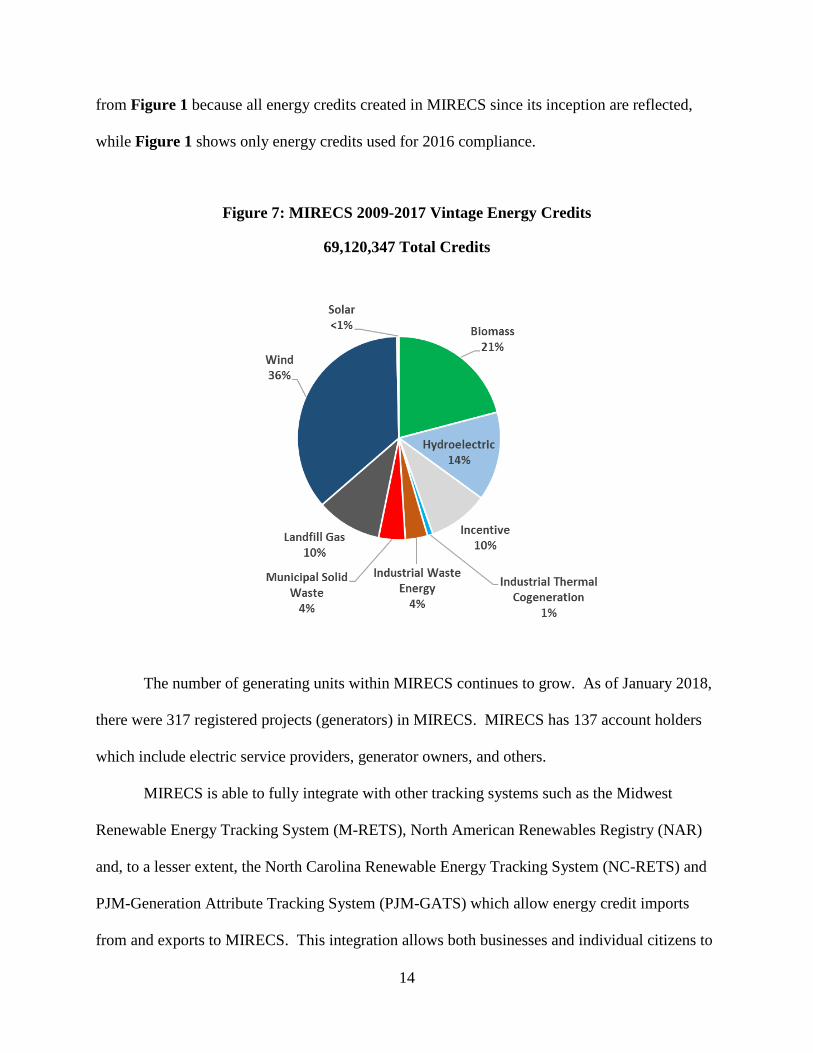
As of January 17, 2018, a total of 69,120,347 energy credits have been created in
MIRECS from 2009 through 2017. Figure 7 shows the categorization of Michigan’s energy
credits by technology type. Annual breakouts of energy credits are available in Appendix D.
Analysis of these breakouts show the significant growth of wind in Michigan’s REC portfolio,
from 7% in 2009 to greater than 50% in 2015, 2016 and 2017. The 36% wind figure shown in
Figure 7 represents total credits created over the 2009 through 2017 period. This data differs
18 The initial contract between the State of Michigan and APX was extended for another 2 years in July 2014 and extended again until July 2017 in fourth quarter 2016. After an RFP process in 2017, a second contract between the State of Michigan and APX was entered into effective July 1, 2017 and expiring December 31, 2023. 19 MIRECS may be accessed at http://www.mirecs.org.
(if applicable)
14
from Figure 1 because all energy credits created in MIRECS since its inception are reflected,
while Figure 1 shows only energy credits used for 2016 compliance.
Figure 7: MIRECS 2009-2017 Vintage Energy Credits
69,120,347 Total Credits
The number of generating units within MIRECS continues to grow. As of January 2018,
there were 317 registered projects (generators) in MIRECS. MIRECS has 137 account holders
which include electric service providers, generator owners, and others.
MIRECS is able to fully integrate with other tracking systems such as the Midwest
Renewable Energy Tracking System (M-RETS), North American Renewables Registry (NAR)
and, to a lesser extent, the North Carolina Renewable Energy Tracking System (NC-RETS) and
PJM-Generation Attribute Tracking System (PJM-GATS) which allow energy credit imports
from and exports to MIRECS. This integration allows both businesses and individual citizens to
15
sell their product to a wider market. Generators registered with other tracking systems have, as
of January 2018, registered 58 projects for the purpose of importing energy credits into
MIRECS. Commission staff assists electric providers with the compliance process and will
continue to hold training/information meetings.
Competition in Areas Served by Multiple Providers
AESs are also required to meet the REC requirement contained in the Act, but not the
separate capacity requirement that was applicable to Consumers Energy and DTE Electric as part
of the former Section 27. Almost all AESs have indicated in their renewable energy plans and
annual reports that they will purchase RECs to meet the renewable energy credit portfolio
requirements. Customer choice participation levels are at the maximum amount allowed by law
and Consumers Energy and DTE Electric currently have customers waiting in the customer
choice queue. Although there are no indications that the Act is creating an unfair competitive
advantage between utilities and AESs, the two largest utilities and the all-requirements supplier
for many of the cooperative utilities in Michigan have driven the expansion of renewable energy
associated with complying with the statute.
Impact of the Renewable Energy Standard on Employment
One purpose of PA 295 is to “provide improved air quality and other benefits to energy
consumers and citizens of this state.” The clean and renewable energy sector continues to
contribute to employment opportunities in Michigan. During the next several years, the
following utility scale wind farms are expected to become commercially operational in
Michigan:
16
• Cross Winds III – 76 MW, Tuscola County
• Pine River Wind – 161.3 MW, Gratiot and Isabella Counties
These projects will result in over 235 MW of new, utility scale wind generation. In addition, it is
expected that a significant amount of wind projects will result from compliance with the 15%
standard pursuant to PA 342.
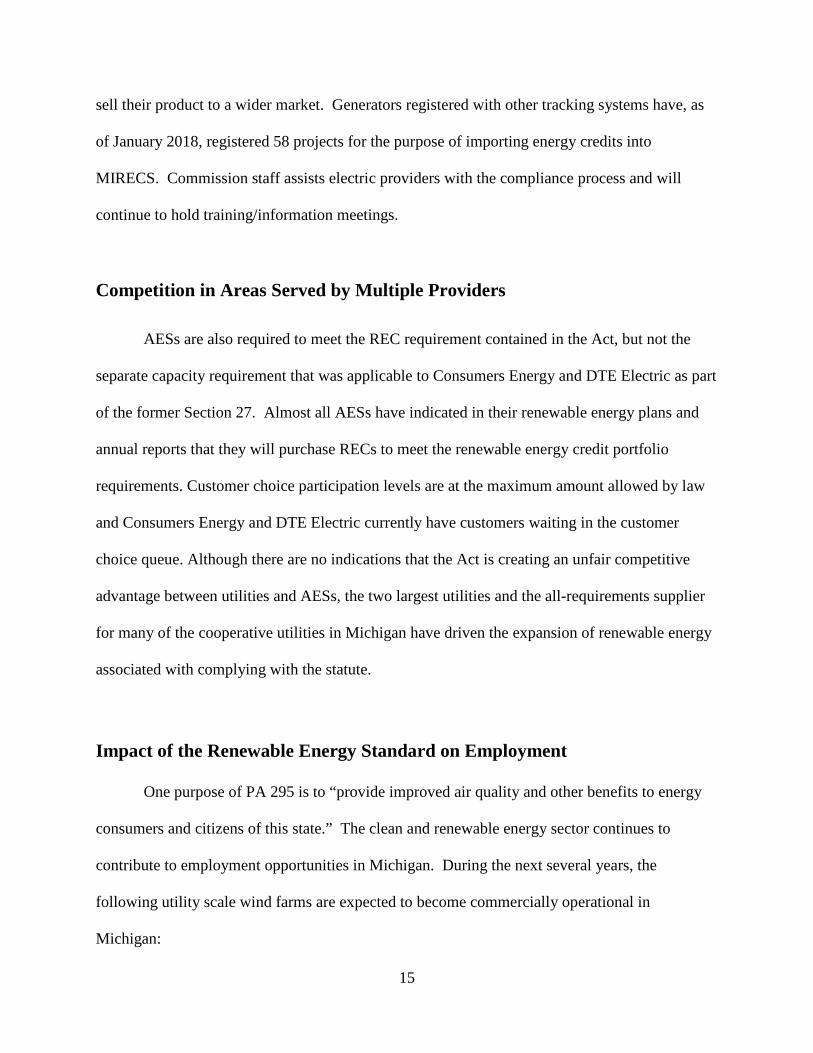
Section 39 of PA 295 provides for Michigan Incentive Renewable Energy Credits for
renewable energy systems that meet certain criteria. For renewable energy systems constructed
using a threshold level of Michigan labor, the amount of the incentive is one-tenth of a REC for
each MWh generated during the first three years of commercial operation. The incentive for
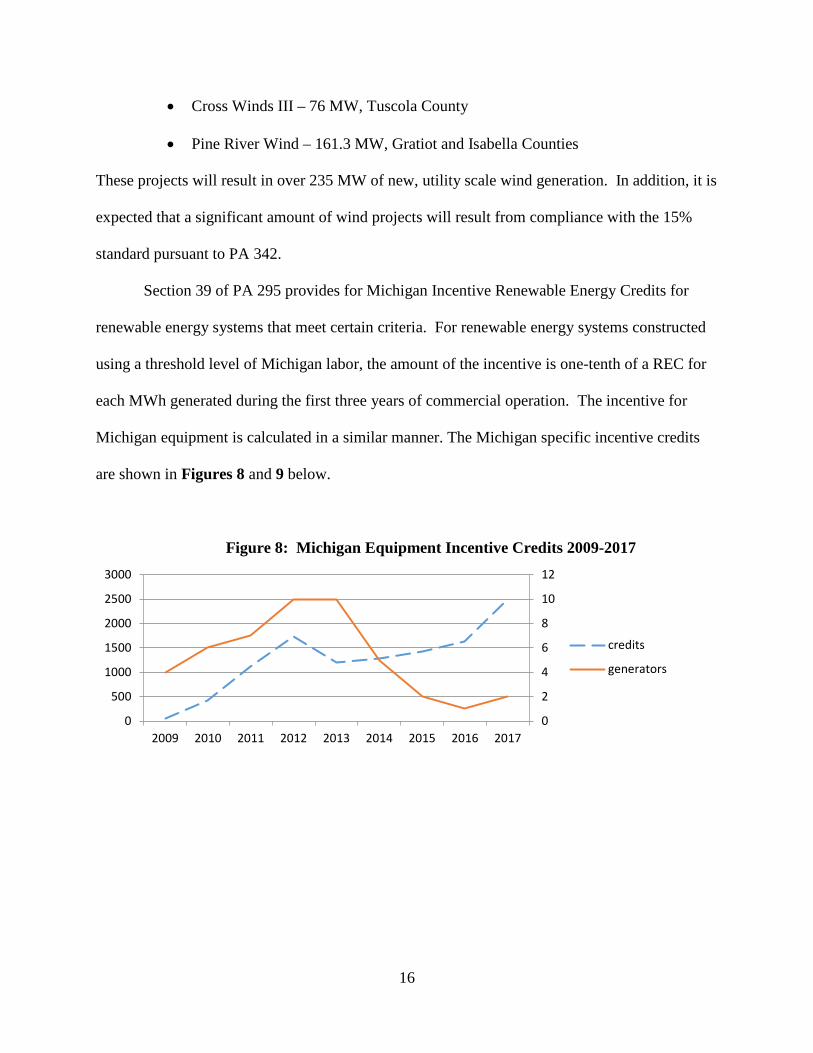
Michigan equipment is calculated in a similar manner. The Michigan specific incentive credits
are shown in Figures 8 and 9 below.
Figure 8: Michigan Equipment Incentive Credits 2009-2017
0
2
4
6
8
10
12
0
500
1000
1500
2000
2500
3000
2009 2010 2011 2012 2013 2014 2015 2016 2017
credits
generators
17
Figure 9: Michigan Labor Incentive Credits 2009-2017
Statewide, there has been significant investment in the renewable energy sector since the
passage of PA 295 in 2008. Assuming an installed cost of $2,000 per kW20 for new renewable
energy projects, $3.3 billion has been invested to bring approximately 1,670 MW21 of new
renewable energy projects on-line through 2017 in Michigan. The $3.3 billion includes both
incremental cost of compliance and the portion of costs recovered as energy costs.
In September 2014, the Michigan Workforce Development Agency in partnership with
the Bureau of Labor Market Information and Strategic Initiatives issued a 2014 Energy Cluster
Workforce Updates report. The 2014 report is an update to the 2013 Cluster Workforce Analysis
which tracked eight detailed industry sectors as a proxy for employment trends in the Renewable
and Alternative Energy cluster. That analysis found the cluster grew from 6,775 jobs in 2005 to
8,200 jobs in 2013.22 The 2014 Cluster Workforce Update found that overall, the Energy Cluster
20 DTE Electric reported an installed cost of $2,225 to $2,438 per kW for its Echo Wind Park contract approval application filed on August 10, 2012. 21 Reflects the projects developed under Act 295 by MPSC rate-regulated electric providers. This number does not include 67.5 MW of wind generation attributable to contracts filed by Indiana Michigan Power Company as these projects are outside of Michigan or 1.05 MW of hydro and anaerobic bio-digestion projects that were commercially operational prior to PA 295. 22 The report’s author provided additional information to MPSC staff showing job data for 2005 and 2013. Data presented in the report is for 2011. http://milmi.org/admin/uploadedPublications/1992_WDA_EnergyFINAL.pdf.
0
10
20
30
40
50
60
70
0
50000
100000
150000
200000
250000
300000
350000
2009 2010 2011 2012 2013 2014 2015 2016 2017
credits
generators
18
was expected to grow 7.1 percent between 2010 and 2020.23 An additional update for the second
quarter of 2017 showed 9,100 jobs among Michigan industries related to the Renewable and
Alternative Energy cluster.24
It appears that Michigan’s incentive REC provision is meeting its intended purpose to
encourage developers to maximize utilization of Michigan equipment and labor. The
Commission will continue to monitor data on the impact of the renewable energy standard on
employment in Michigan.
The Cost of Renewable Energy Compared to the Cost of New Coal Energy
The Commission staff filed a letter in MPSC Case No. U-15800 to provide the required
life cycle cost of electricity generated by a new conventional coal plant:
The Commission’s temporary order implementing 2008 PA 295, Case Number U-15800, directed the staff to work with the providers to develop the required life cycle cost of electricity generated by a new conventional coal-fired facility in terms of a guidepost consisting of a levelized busbar rate, in $/MWh, of an advanced-supercritical pulverized coal plant with a life cycle of 40 years. The Commission directed the staff to submit the number to the Commission by January 30, 2009. The staff has diligently worked with the providers to develop the guidepost rate and finds that the number is $133 per MWh.25
This guidepost rate was derived from data provided to Consumers Energy as a result of
the Company’s inquiry into building a new 830 MW coal fired power facility, and was adopted
by all electric providers. The Commission continues to find that the $133 per MWh guidepost is
reasonable.
23 2014 Cluster Workforce Updates – Energy: http://milmi.org/admin/uploadedPublications/2227_Energy.pdf 24 The report’s author provided additional information to MPSC staff showing job data for 2017. 25 Excerpt from Commission staff January 30, 2009 Guidepost Rate Letter,
http://efile.mpsc.state.mi.us/efile/docs/15800/0023.pdf.
19
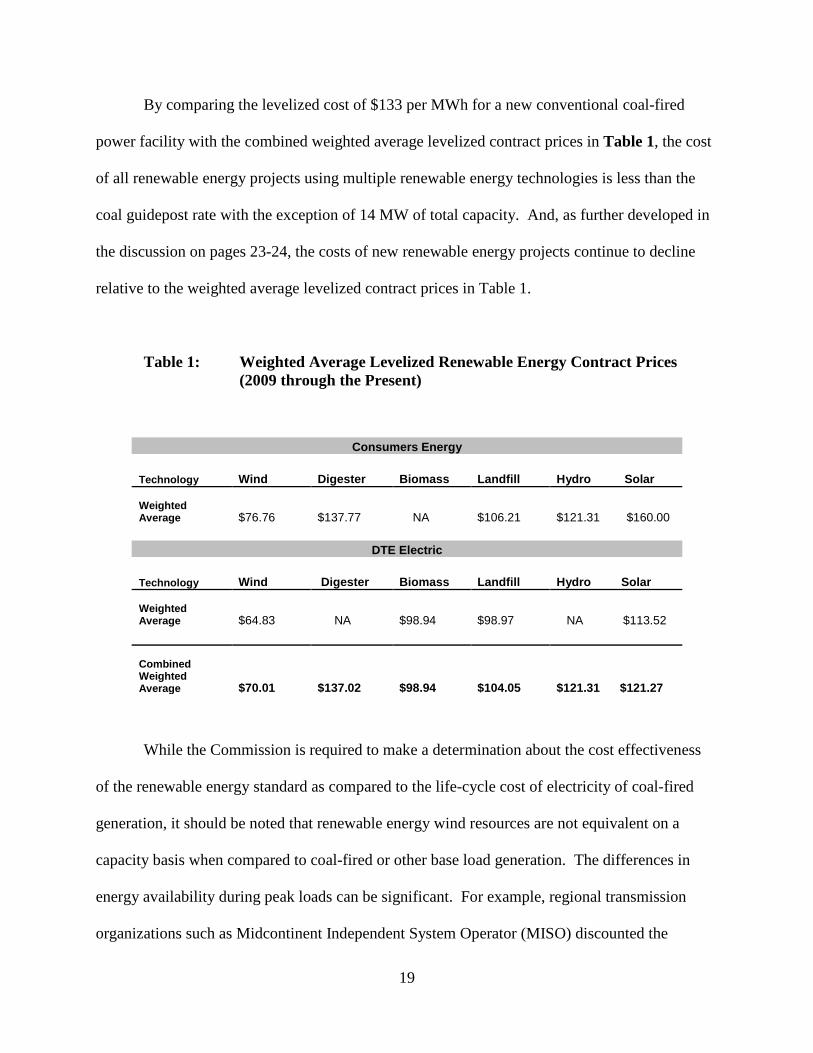
By comparing the levelized cost of $133 per MWh for a new conventional coal-fired
power facility with the combined weighted average levelized contract prices in Table 1, the cost
of all renewable energy projects using multiple renewable energy technologies is less than the
coal guidepost rate with the exception of 14 MW of total capacity. And, as further developed in
the discussion on pages 23-24, the costs of new renewable energy projects continue to decline
relative to the weighted average levelized contract prices in Table 1.
Table 1: Weighted Average Levelized Renewable Energy Contract Prices (2009 through the Present)
Consumers Energy
Technology Wind Digester Biomass Landfill Hydro Solar
Weighted Average $76.76 $137.77 NA $106.21 $121.31 $160.00
DTE Electric
Technology Wind Digester Biomass Landfill Hydro Solar
Weighted Average $64.83 NA $98.94 $98.97 NA $113.52
Combined Weighted Average $70.01 $137.02 $98.94 $104.05 $121.31 $121.27
While the Commission is required to make a determination about the cost effectiveness
of the renewable energy standard as compared to the life-cycle cost of electricity of coal-fired
generation, it should be noted that renewable energy wind resources are not equivalent on a
capacity basis when compared to coal-fired or other base load generation. The differences in
energy availability during peak loads can be significant. For example, regional transmission
organizations such as Midcontinent Independent System Operator (MISO) discounted the
20
capacity value of wind resources during the peak load to as low as 15.6% for the 2017 – 2018
planning year,26 compared to an availability ranging as high, or higher than 80% for base load
generation plants.27 Comparing per unit energy costs of different generation types may not
reflect the true value of the resource to the reliability of the electric system as a whole.
Cost-Effectiveness of the Renewable Energy Standard
Section 51(5)(e) of PA 295 requires an evaluation of the cost-effectiveness of the
renewable energy standard. The actual cost of renewable energy contracts submitted to the
Commission to date continues to show a downward pricing trend. Consumers Energy and DTE
Electric have made substantial progress toward complying with the renewable energy standard.
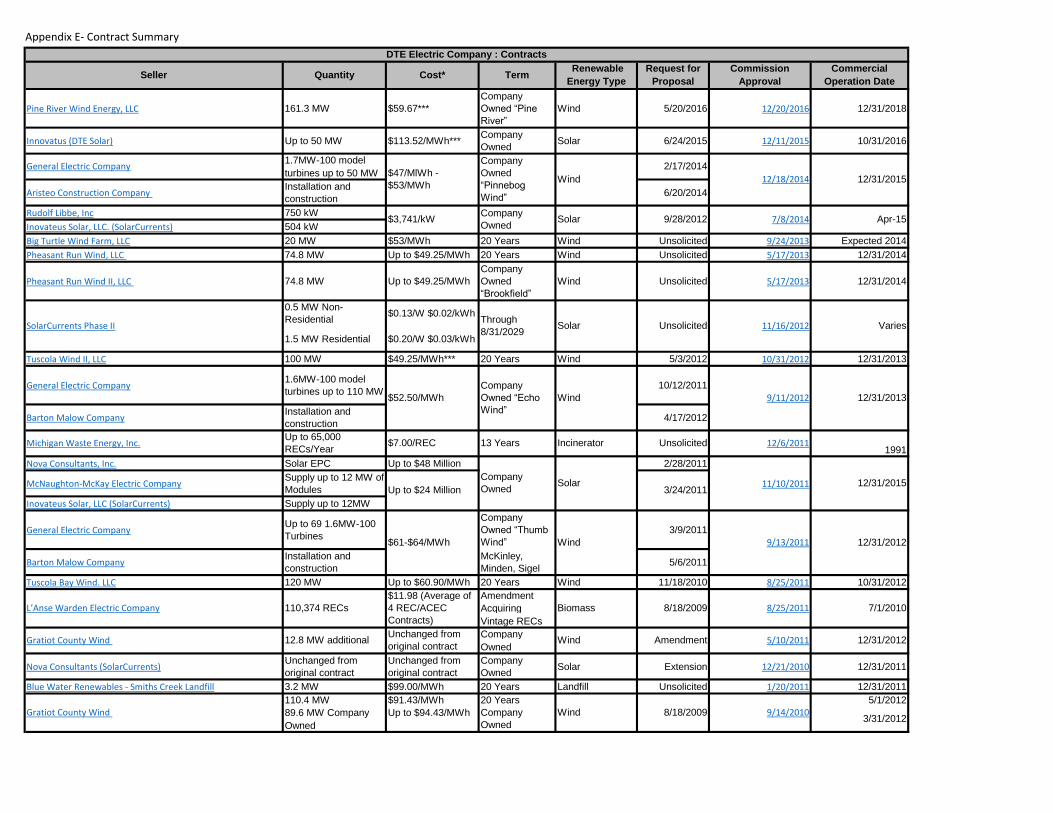
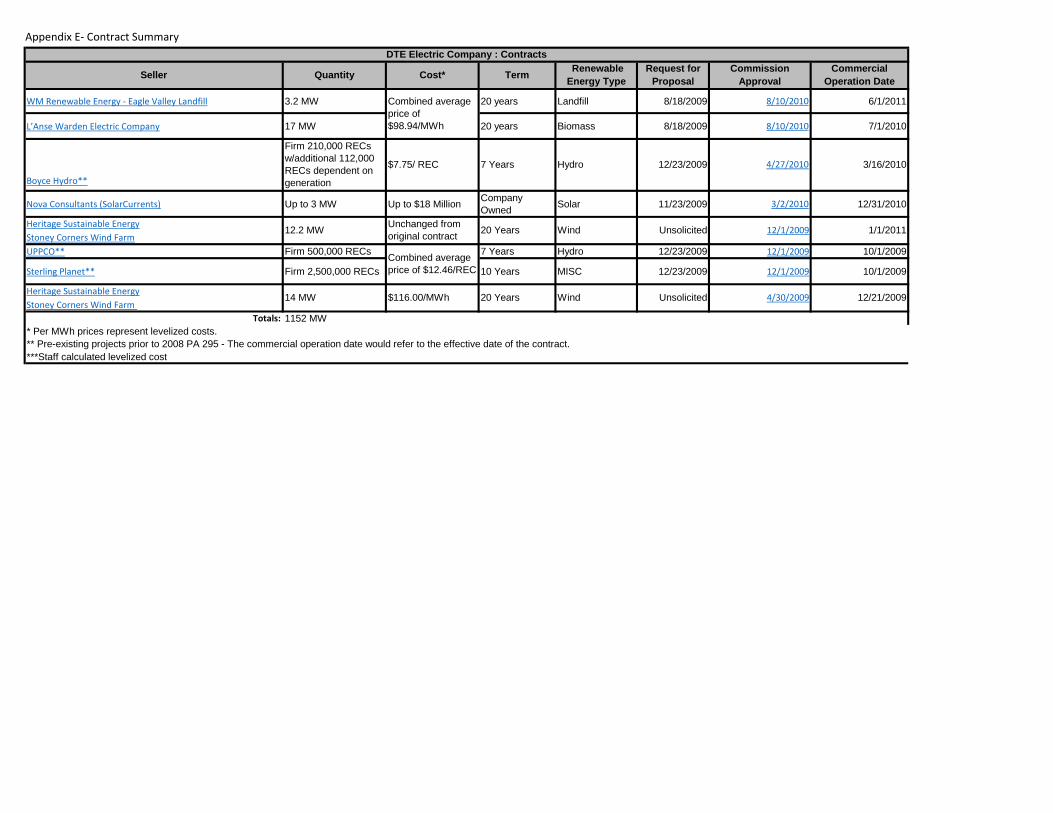
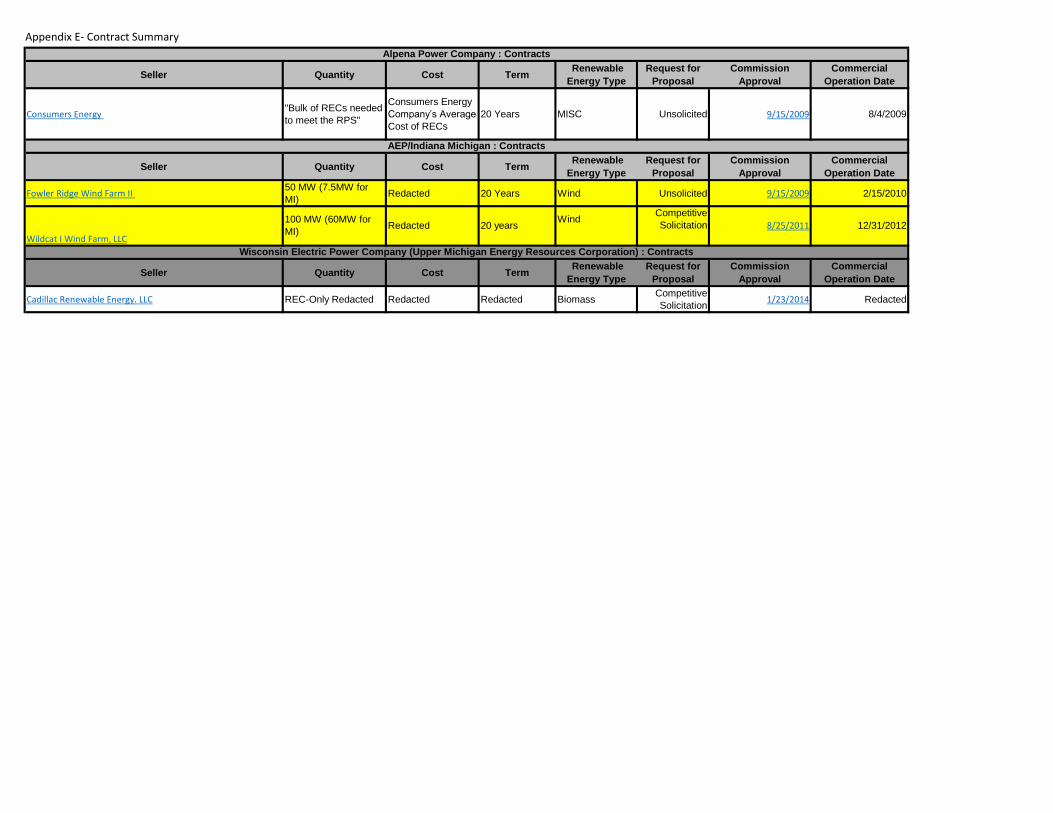
Consumers Energy has filed renewable energy contracts with the Commission totaling
approximately 730 MW, and DTE Electric totaling approximately 1150 MW, as shown in
Appendix E.
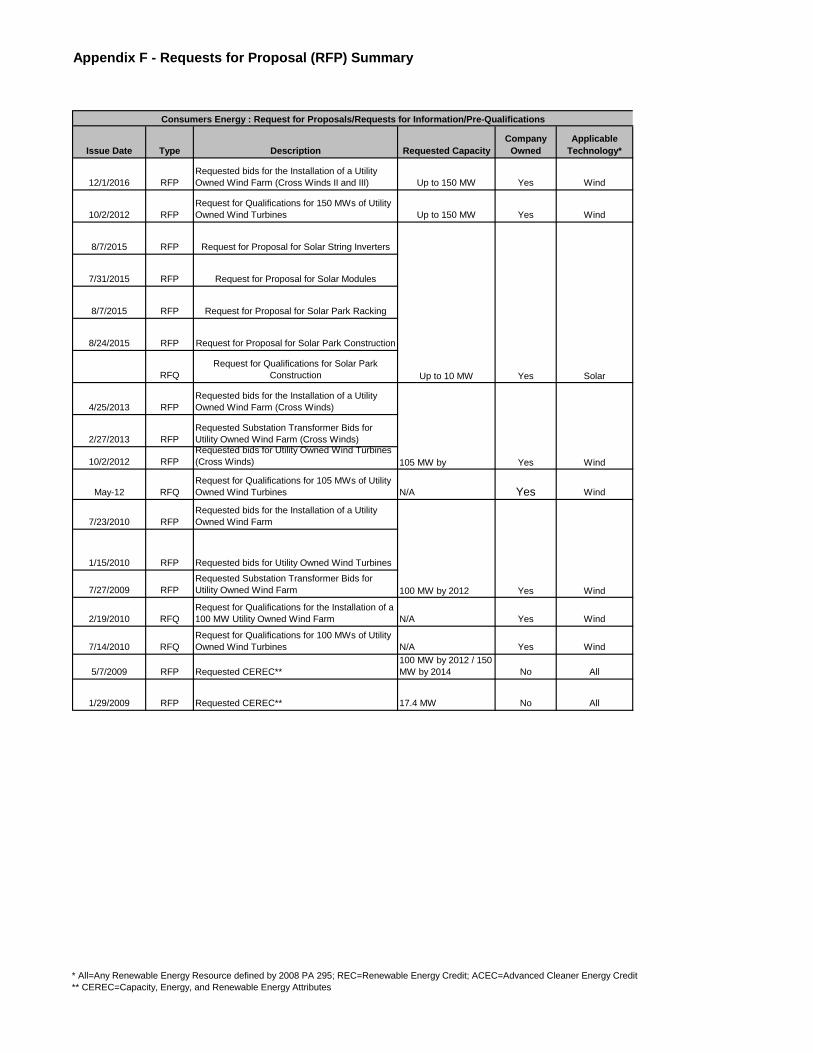
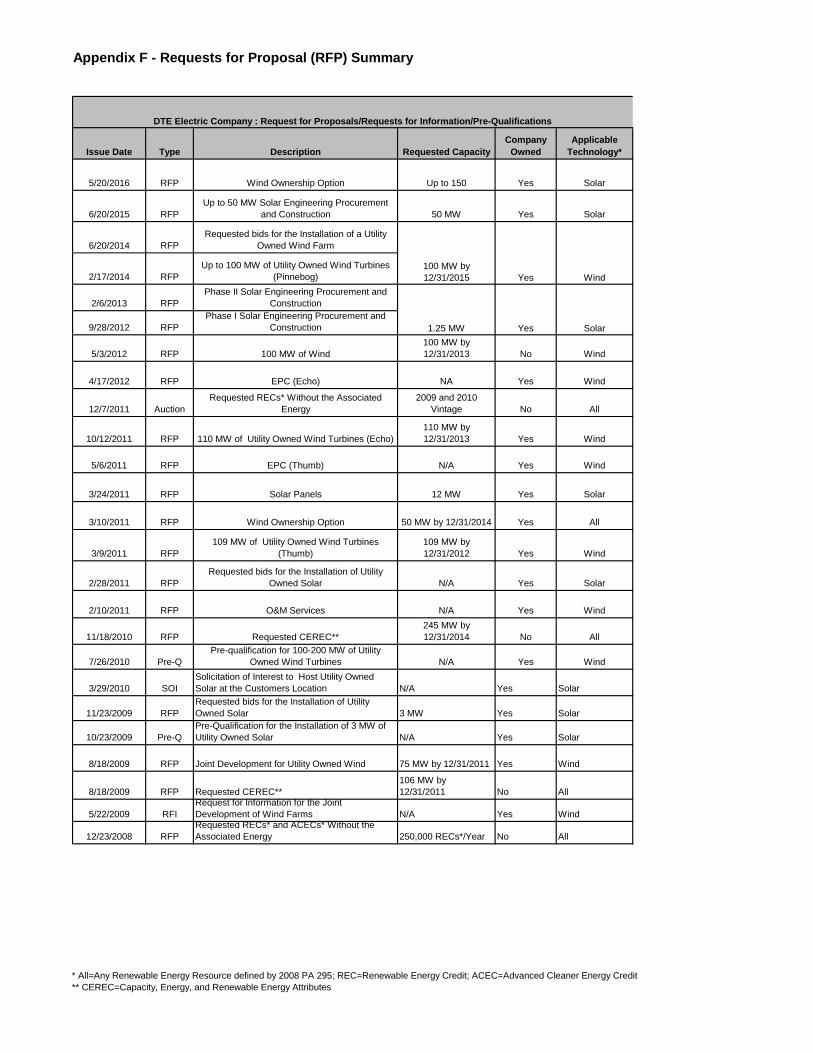
Consumers Energy and DTE Electric have conducted 33 requests for proposals (RFPs) in
total. Consumers Energy has conducted 13 RFPs and four requests for qualifications. DTE
Electric has conducted 20 RFPs, two pre-qualification events, one solar solicitation of interest, a
request for information, and an auction for 2009 and 2010 vintage RECs. In response to the
majority of the companies’ RFPs, Commission staff has reviewed competitive bidding activities
through process audits. The purpose and design of the audits was to ensure that the companies
followed the processes and procedures outlined in the Commission’s December 4, 2008
26 www.misoenergy.org 27 The availability on-peak for base load generators is unit-specific. Older units may have capacity values significantly lower than 80%; however, newer units, especially newer nuclear units may have capacity values on-peak above 90%.
21
Temporary Order in MPSC Case No. U-15800, Attachment D28 and pursuant to the former
Section 33 of PA 295. Details about each company’s competitive bidding activities are shown in
Appendix F.
Pursuant to the former Section 37 of the Act and now Section 28, renewable energy
power purchase and REC-only agreements entered into by any electric provider whose rates are
regulated by the Commission must be submitted to the Commission for approval. Appendix E
lists all renewable energy contracts that have been approved by the MPSC under PA 295 to date.
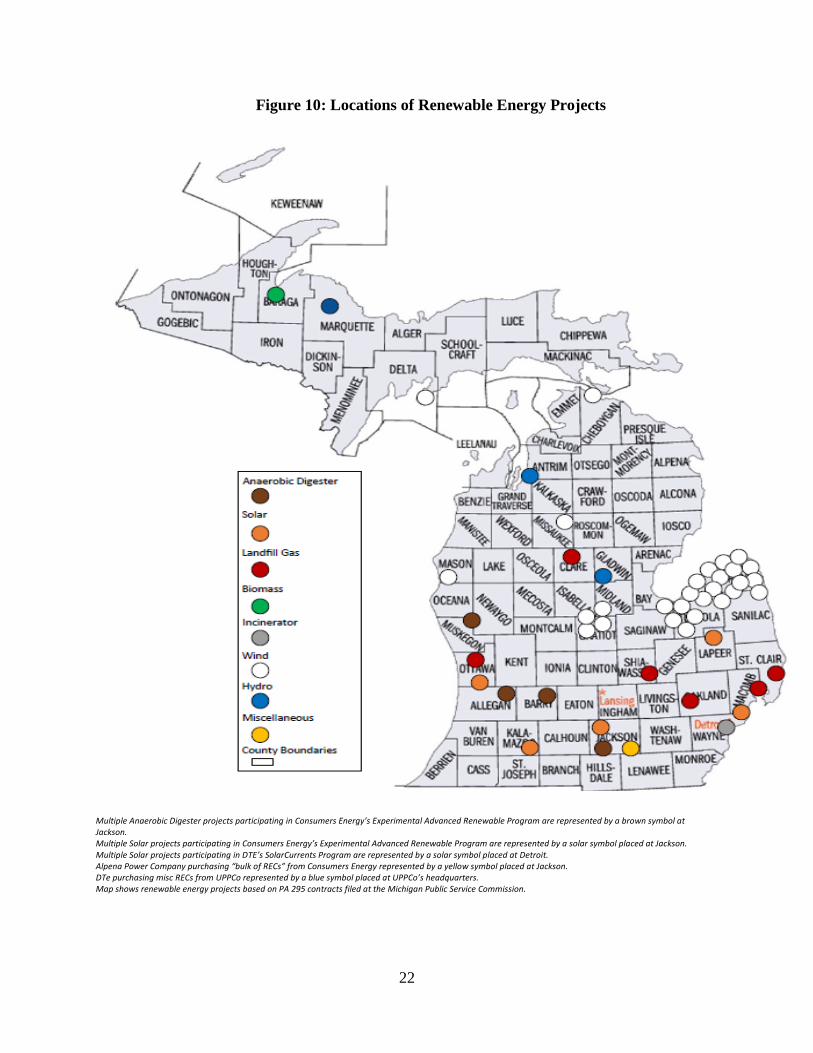
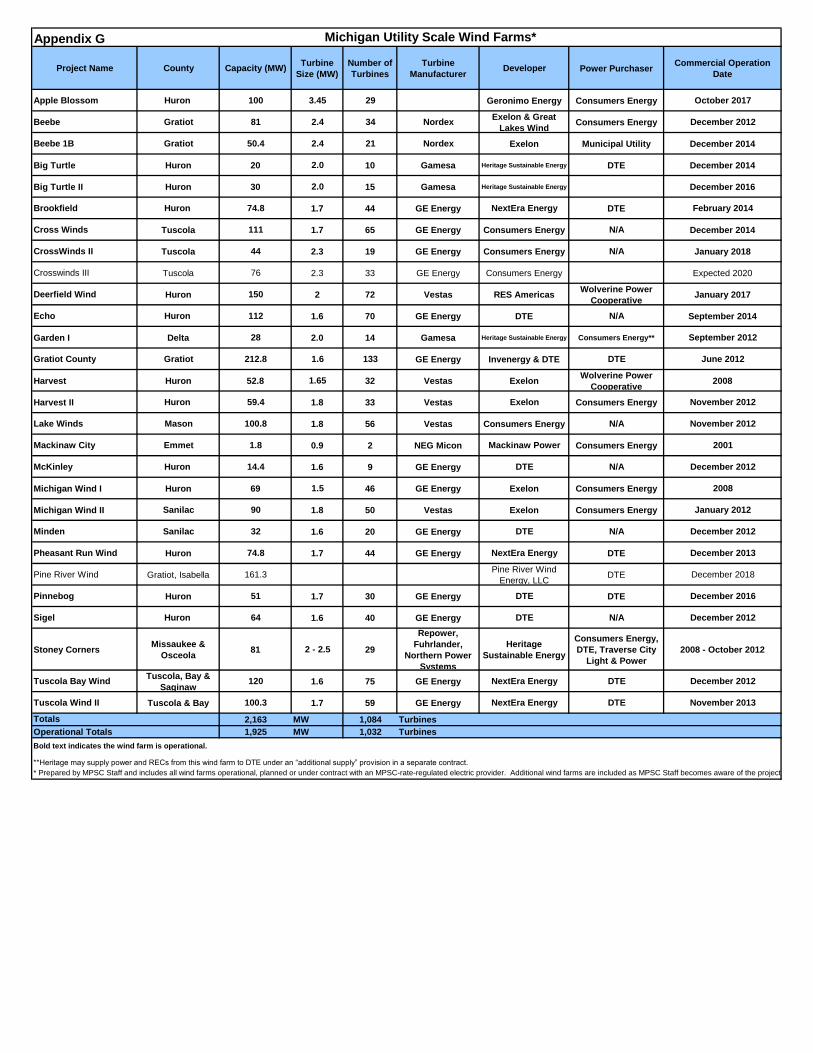
There has been significant renewable energy development as a result of PA 295. Figure
10 shows the location of PA 295 renewable energy projects. Wind energy has been the primary
source of new renewable energy in Michigan. At the end of 2017, including wind projects
developed shortly before Act 295 and wind projects developed by non-rate regulated electric
providers and under the PA 295 contract approval and cost recovery mechanisms, there were
1,925 MW (total includes 127 MW of utility scale projects that began operating prior to the Act)
of utility scale wind projects in operation in Michigan as indicated in Appendix G. Three wind
farms with 294 MW of new wind capacity began operating during 2017 and January 2018. Two
wind farms with 235 MW of new wind capacity are expected to begin operating in the next
several years.
28 https://mi-psc.force.com/sfc/servlet.shepherd/version/download/068t0000000wNSv
22
Figure 10: Locations of Renewable Energy Projects
Multiple Anaerobic Digester projects participating in Consumers Energy’s Experimental Advanced Renewable Program are represented by a brown symbol at Jackson. Multiple Solar projects participating in Consumers Energy’s Experimental Advanced Renewable Program are represented by a solar symbol placed at Jackson. Multiple Solar projects participating in DTE’s SolarCurrents Program are represented by a solar symbol placed at Detroit. Alpena Power Company purchasing “bulk of RECs” from Consumers Energy represented by a yellow symbol placed at Jackson. DTe purchasing misc RECs from UPPCo represented by a blue symbol placed at UPPCo’s headquarters. Map shows renewable energy projects based on PA 295 contracts filed at the Michigan Public Service Commission.
23
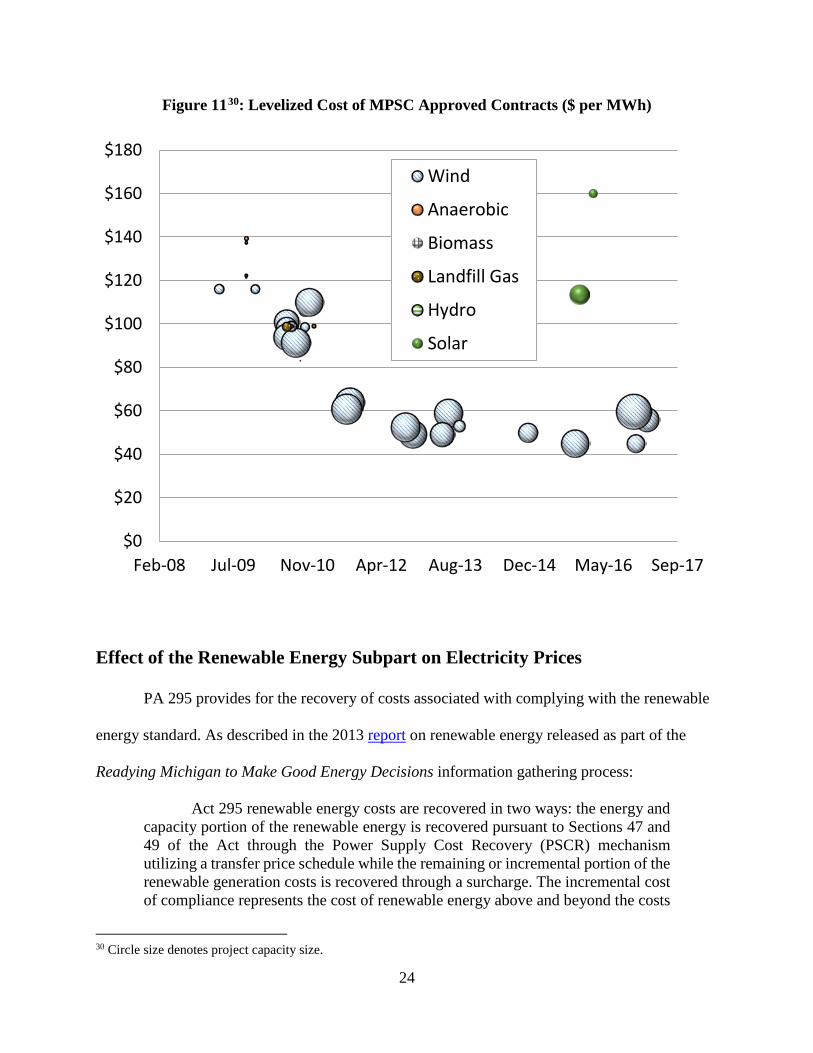
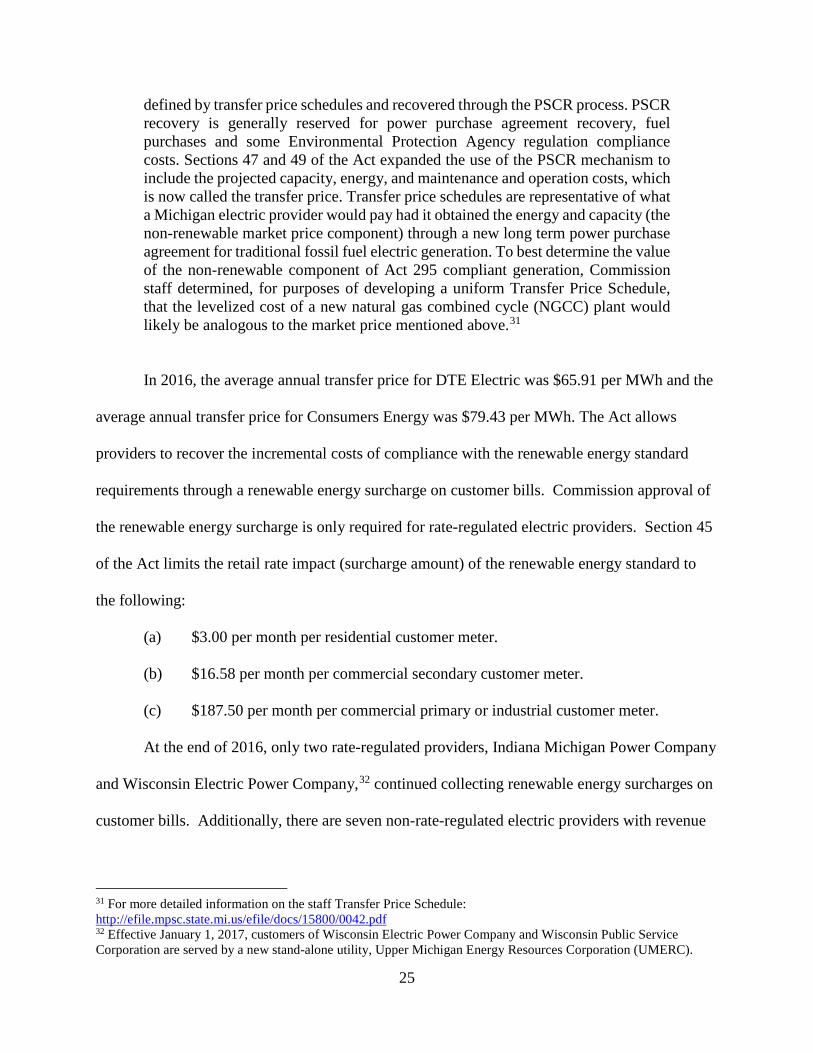
The most recent wind contracts approved by the Commission have levelized costs in the
$45 - $69 per MWh range, approximately half of the levelized cost of the first renewable energy
contracts approved in 2009 and 2010. Weighting the levelized costs of all contracts by the
generation in MWh results in an average cost of $72.60 per MWh. With the exception of 14
MW of capacity, all renewable energy contract prices are lower than the $133 per MWh coal
guidepost rate. Figure 11 shows the decline in levelized costs of contracts over time. The
$72.60 per MWh cost of the renewable energy standard is substantially lower than the cost of a
new coal-fired plant and demonstrates that the renewable energy standard has been cost
effective.
The MWh contract prices shown in Appendix E are levelized cost calculations and reflect
the prices over the contract term for all power purchase agreements or, in the case of a company-
owned project, the depreciable composite life.29 The levelized cost value is used to compare
multiple contracts with varying terms and conditions. Of the 72 contracts and amendments from
five electric providers approved by the Commission to date, all but four have been from
Consumers Energy or DTE Electric and 20 have been unsolicited. With the exception of several
early contracts for small renewable energy projects, the contract prices have been much lower
than expected and have continued to decline.
29 MPSC staff performed audits of the companies’ levelized cost calculations starting in the early part of 2011. Additionally, through RFP process audits, staff reviewed actual costs of contracts obtained through most of the companies’ competitive solicitations. Staff reviewed the actual costs of all contracts listed in Appendix E.
24
Figure 1130: Levelized Cost of MPSC Approved Contracts ($ per MWh)
Effect of the Renewable Energy Subpart on Electricity Prices
PA 295 provides for the recovery of costs associated with complying with the renewable
energy standard. As described in the 2013 report on renewable energy released as part of the
Readying Michigan to Make Good Energy Decisions information gathering process:
Act 295 renewable energy costs are recovered in two ways: the energy and capacity portion of the renewable energy is recovered pursuant to Sections 47 and 49 of the Act through the Power Supply Cost Recovery (PSCR) mechanism utilizing a transfer price schedule while the remaining or incremental portion of the renewable generation costs is recovered through a surcharge. The incremental cost of compliance represents the cost of renewable energy above and beyond the costs
30 Circle size denotes project capacity size.
$0
$20
$40
$60
$80
$100
$120
$140
$160
$180
Feb-08 Jul-09 Nov-10 Apr-12 Aug-13 Dec-14 May-16 Sep-17
Wind
Anaerobic
Biomass
Landfill Gas
Hydro
Solar
25
defined by transfer price schedules and recovered through the PSCR process. PSCR recovery is generally reserved for power purchase agreement recovery, fuel purchases and some Environmental Protection Agency regulation compliance costs. Sections 47 and 49 of the Act expanded the use of the PSCR mechanism to include the projected capacity, energy, and maintenance and operation costs, which is now called the transfer price. Transfer price schedules are representative of what a Michigan electric provider would pay had it obtained the energy and capacity (the non-renewable market price component) through a new long term power purchase agreement for traditional fossil fuel electric generation. To best determine the value of the non-renewable component of Act 295 compliant generation, Commission staff determined, for purposes of developing a uniform Transfer Price Schedule, that the levelized cost of a new natural gas combined cycle (NGCC) plant would likely be analogous to the market price mentioned above.31
In 2016, the average annual transfer price for DTE Electric was $65.91 per MWh and the
average annual transfer price for Consumers Energy was $79.43 per MWh. The Act allows
providers to recover the incremental costs of compliance with the renewable energy standard
requirements through a renewable energy surcharge on customer bills. Commission approval of
the renewable energy surcharge is only required for rate-regulated electric providers. Section 45
of the Act limits the retail rate impact (surcharge amount) of the renewable energy standard to
the following:
(a) $3.00 per month per residential customer meter.
(b) $16.58 per month per commercial secondary customer meter.
(c) $187.50 per month per commercial primary or industrial customer meter.
At the end of 2016, only two rate-regulated providers, Indiana Michigan Power Company
and Wisconsin Electric Power Company,32 continued collecting renewable energy surcharges on
customer bills. Additionally, there are seven non-rate-regulated electric providers with revenue
31 For more detailed information on the staff Transfer Price Schedule: http://efile.mpsc.state.mi.us/efile/docs/15800/0042.pdf 32 Effective January 1, 2017, customers of Wisconsin Electric Power Company and Wisconsin Public Service Corporation are served by a new stand-alone utility, Upper Michigan Energy Resources Corporation (UMERC).
26
recovery mechanisms. Forty-nine non-AES providers do not collect surcharges. Surcharge
details can be found in Appendix B.
Spending on renewable energy has had an impact on electric rates, but should be
considered in context of other rate drivers as well. Information submitted as part of the Readying
Michigan to Make Good Energy Decisions process indicates that several factors, including load
loss, fuel costs, environmental investment, and base system investment, have contributed to
electric rate increases since 2008.33 There are also benefits attributable to an increase in
renewable energy generation sources. Wind and solar generation have zero fuel costs and the
integration of zero fuel-cost generation into the regional market can result in lower locational
marginal prices in the energy market. And, as noted in previous sections, the cost of energy
generated by renewable sources continues to decline and is cheaper than new coal-fired
generation.
Conclusion
The Commission is pleased to note that the renewable energy standard for 2016 was
accomplished successfully by all Michigan electric providers who were subject to the standard.
The combined efforts of the electric providers, renewable energy project developers,
communities hosting renewable energy projects, renewable energy advocates and many others
have contributed to the effective implementation of Michigan’s renewable energy standard. The
renewable energy standard can be credited with the development of over 1,670 MW of new
renewable energy projects. The weighted average price of existing renewable energy contracts
33 http://michigan.gov/documents/energy/Additional_Areas_final_440032_7.pdf, Figures 6 and 7, pp. 24-25.
27
over the 2009 through 2016 time period is $72.60 per MWh, which is considerably less than
forecasted in the initial REPs.
The process to implement the provisions in the new renewable energy standard as
enacted in PA 342 of 2016 is continuing. The Commission intends to build on the successful
activities already in place to guide Michigan’s path to the 15% renewable energy standard in
2021 and achieving the combined goal of meeting Michigan’s electric needs through a
combination of 35% energy waste reduction and renewable energy by 2025.
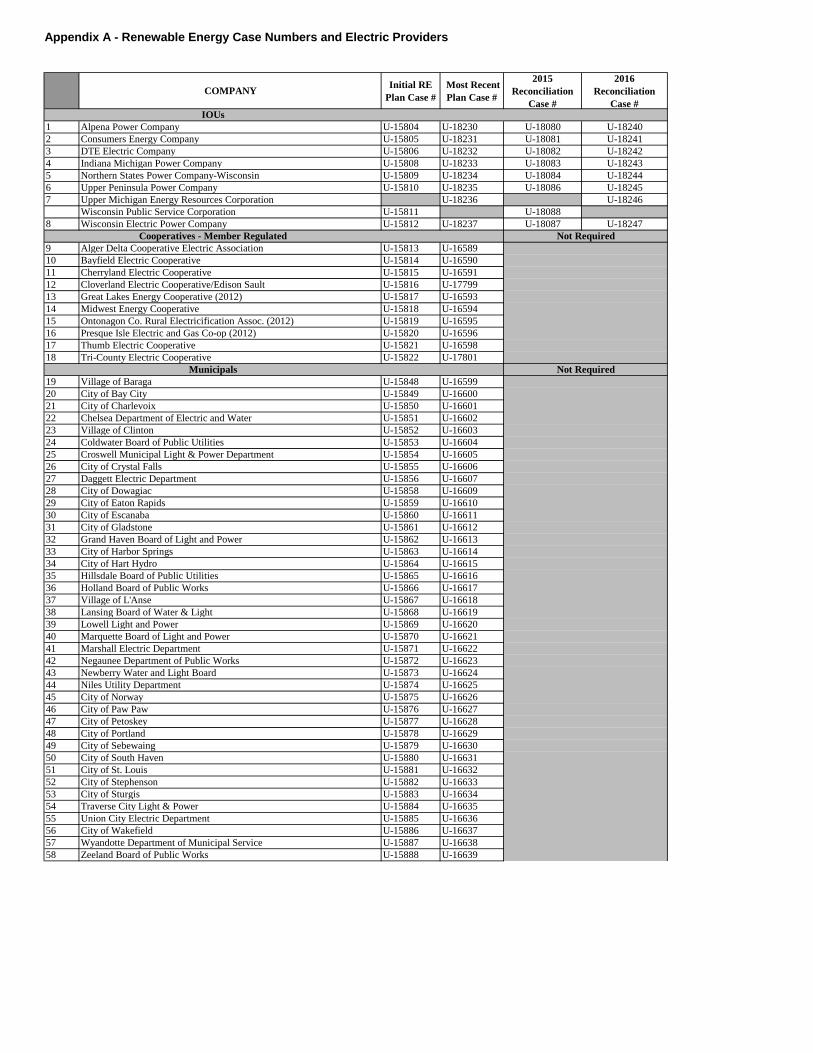
Appendix A - Renewable Energy Case Numbers and Electric Providers
COMPANYInitial RE
Plan Case #
Most Recent
Plan Case #
2015
Reconciliation
Case #
2016
Reconciliation
Case #
1 Alpena Power Company U-15804 U-18230 U-18080 U-18240
2 Consumers Energy Company U-15805 U-18231 U-18081 U-18241
3 DTE Electric Company U-15806 U-18232 U-18082 U-18242
4 Indiana Michigan Power Company U-15808 U-18233 U-18083 U-18243
5 Northern States Power Company-Wisconsin U-15809 U-18234 U-18084 U-18244
6 Upper Peninsula Power Company U-15810 U-18235 U-18086 U-18245
7 Upper Michigan Energy Resources Corporation U-18236 U-18246
Wisconsin Public Service Corporation U-15811 U-18088
8 Wisconsin Electric Power Company U-15812 U-18237 U-18087 U-18247
9 Alger Delta Cooperative Electric Association U-15813 U-16589
10 Bayfield Electric Cooperative U-15814 U-16590
11 Cherryland Electric Cooperative U-15815 U-16591
12 Cloverland Electric Cooperative/Edison Sault U-15816 U-17799
13 Great Lakes Energy Cooperative (2012) U-15817 U-16593
14 Midwest Energy Cooperative U-15818 U-16594
15 Ontonagon Co. Rural Electricification Assoc. (2012) U-15819 U-16595
16 Presque Isle Electric and Gas Co-op (2012) U-15820 U-16596
17 Thumb Electric Cooperative U-15821 U-16598
18 Tri-County Electric Cooperative U-15822 U-17801
19 Village of Baraga U-15848 U-16599
20 City of Bay City U-15849 U-16600
21 City of Charlevoix U-15850 U-16601
22 Chelsea Department of Electric and Water U-15851 U-16602
23 Village of Clinton U-15852 U-16603
24 Coldwater Board of Public Utilities U-15853 U-16604
25 Croswell Municipal Light & Power Department U-15854 U-16605
26 City of Crystal Falls U-15855 U-16606
27 Daggett Electric Department U-15856 U-16607
28 City of Dowagiac U-15858 U-16609
29 City of Eaton Rapids U-15859 U-16610
30 City of Escanaba U-15860 U-16611
31 City of Gladstone U-15861 U-16612
32 Grand Haven Board of Light and Power U-15862 U-16613
33 City of Harbor Springs U-15863 U-16614
34 City of Hart Hydro U-15864 U-16615
35 Hillsdale Board of Public Utilities U-15865 U-16616
36 Holland Board of Public Works U-15866 U-16617
37 Village of L'Anse U-15867 U-16618
38 Lansing Board of Water & Light U-15868 U-16619
39 Lowell Light and Power U-15869 U-16620
40 Marquette Board of Light and Power U-15870 U-16621
41 Marshall Electric Department U-15871 U-16622
42 Negaunee Department of Public Works U-15872 U-16623
43 Newberry Water and Light Board U-15873 U-16624
44 Niles Utility Department U-15874 U-16625
45 City of Norway U-15875 U-16626
46 City of Paw Paw U-15876 U-16627
47 City of Petoskey U-15877 U-16628
48 City of Portland U-15878 U-16629
49 City of Sebewaing U-15879 U-16630
50 City of South Haven U-15880 U-16631
51 City of St. Louis U-15881 U-16632
52 City of Stephenson U-15882 U-16633
53 City of Sturgis U-15883 U-16634
54 Traverse City Light & Power U-15884 U-16635
55 Union City Electric Department U-15885 U-16636
56 City of Wakefield U-15886 U-16637
57 Wyandotte Department of Municipal Service U-15887 U-16638
58 Zeeland Board of Public Works U-15888 U-16639
Cooperatives - Member Regulated
Not Required
Not Required
IOUs
Municipals
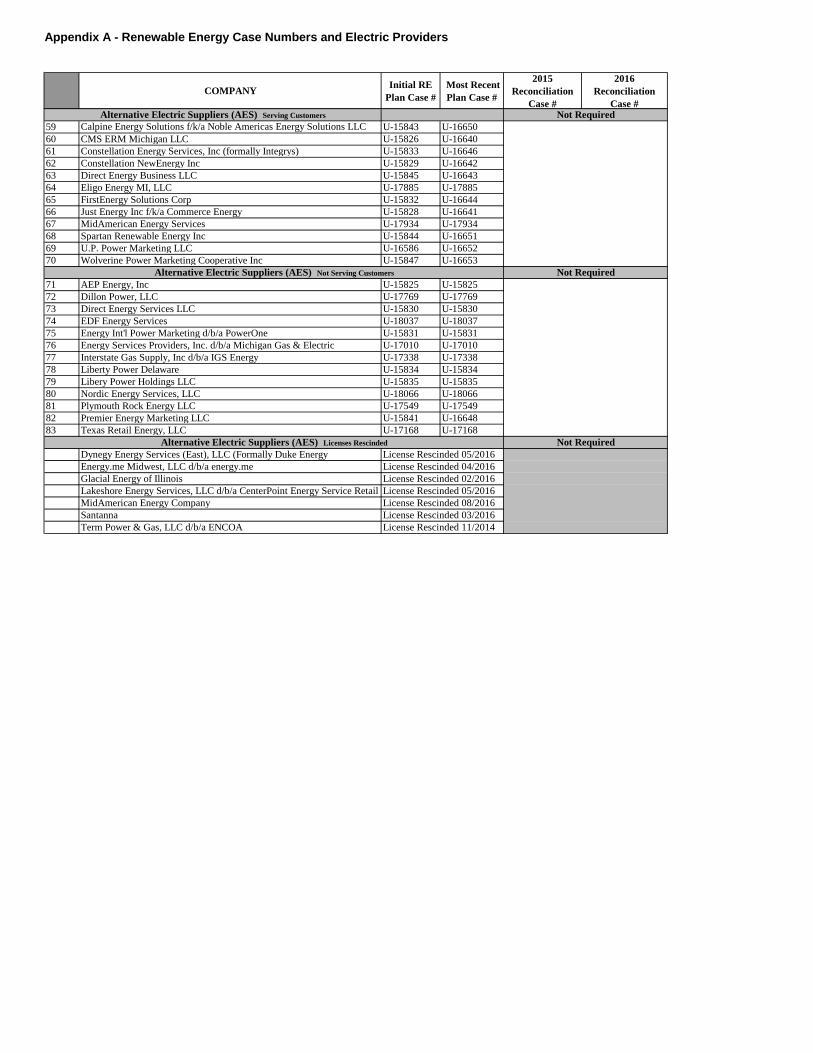
Appendix A - Renewable Energy Case Numbers and Electric Providers
COMPANYInitial RE
Plan Case #
Most Recent
Plan Case #
2015
Reconciliation
Case #
2016
Reconciliation
Case #
59 Calpine Energy Solutions f/k/a Noble Americas Energy Solutions LLC U-15843 U-16650
60 CMS ERM Michigan LLC U-15826 U-16640
61 Constellation Energy Services, Inc (formally Integrys) U-15833 U-16646
62 Constellation NewEnergy Inc U-15829 U-16642
63 Direct Energy Business LLC U-15845 U-16643
64 Eligo Energy MI, LLC U-17885 U-17885
65 FirstEnergy Solutions Corp U-15832 U-16644
66 Just Energy Inc f/k/a Commerce Energy U-15828 U-16641
67 MidAmerican Energy Services U-17934 U-17934
68 Spartan Renewable Energy Inc U-15844 U-16651
69 U.P. Power Marketing LLC U-16586 U-16652
70 Wolverine Power Marketing Cooperative Inc U-15847 U-16653
71 AEP Energy, Inc U-15825 U-15825
72 Dillon Power, LLC U-17769 U-17769
73 Direct Energy Services LLC U-15830 U-15830
74 EDF Energy Services U-18037 U-18037
75 Energy Int'l Power Marketing d/b/a PowerOne U-15831 U-15831
76 Energy Services Providers, Inc. d/b/a Michigan Gas & Electric U-17010 U-17010
77 Interstate Gas Supply, Inc d/b/a IGS Energy U-17338 U-17338
78 Liberty Power Delaware U-15834 U-15834
79 Libery Power Holdings LLC U-15835 U-15835
80 Nordic Energy Services, LLC U-18066 U-18066
81 Plymouth Rock Energy LLC U-17549 U-17549
82 Premier Energy Marketing LLC U-15841 U-16648
83 Texas Retail Energy, LLC U-17168 U-17168
Dynegy Energy Services (East), LLC (Formally Duke Energy
Energy.me Midwest, LLC d/b/a energy.me
Glacial Energy of Illinois
Lakeshore Energy Services, LLC d/b/a CenterPoint Energy Service Retail
MidAmerican Energy Company
Santanna
Term Power & Gas, LLC d/b/a ENCOA
License Rescinded 08/2016
Not RequiredAlternative Electric Suppliers (AES) Not Serving Customers
Not Required
License Rescinded 03/2016
Alternative Electric Suppliers (AES) Licenses Rescinded Not Required
License Rescinded 11/2014
Alternative Electric Suppliers (AES) Serving Customers
License Rescinded 05/2016
License Rescinded 04/2016
License Rescinded 02/2016
License Rescinded 05/2016
CompanyInitial Plan
2017 Plan Docket
2016 REC Requirement
2016 Excess RECs Retired
2016 EO Credit
SubstitutionsMet the 2016
Standard
Current Residential Surcharge $/Month
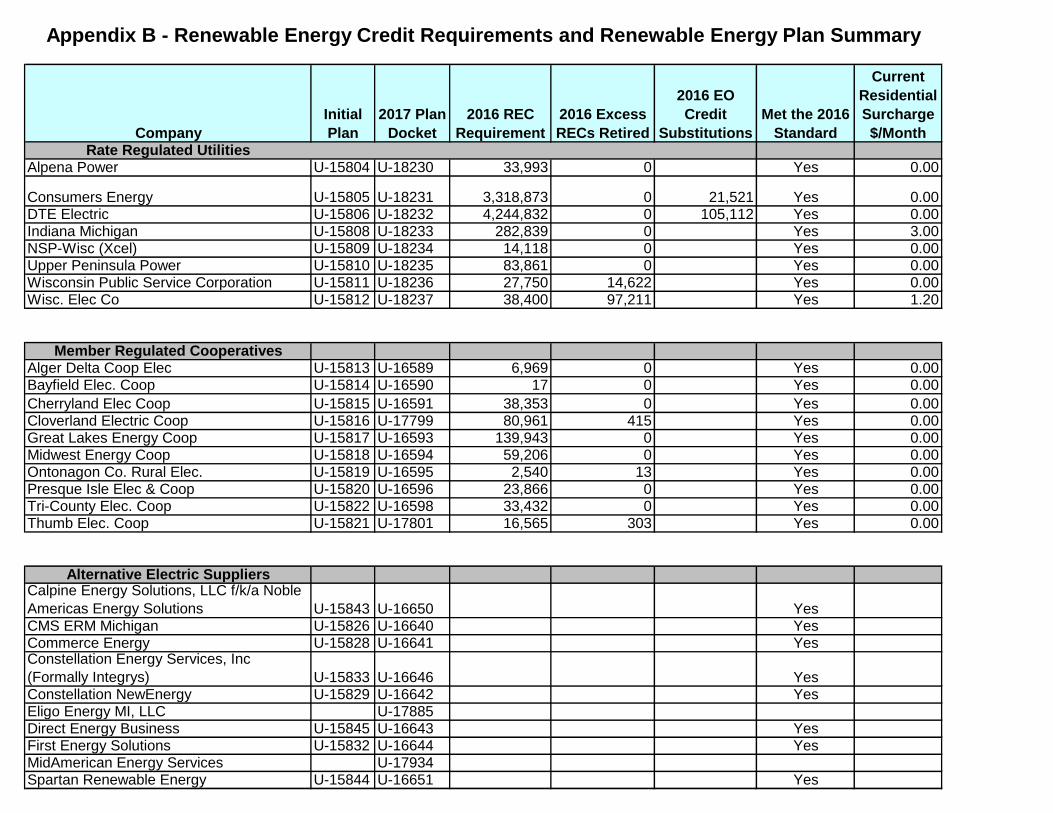
Rate Regulated UtilitiesAlpena Power U-15804 U-18230 33,993 0 Yes 0.00
Consumers Energy U-15805 U-18231 3,318,873 0 21,521 Yes 0.00DTE Electric U-15806 U-18232 4,244,832 0 105,112 Yes 0.00Indiana Michigan U-15808 U-18233 282,839 0 Yes 3.00NSP-Wisc (Xcel) U-15809 U-18234 14,118 0 Yes 0.00Upper Peninsula Power U-15810 U-18235 83,861 0 Yes 0.00Wisconsin Public Service Corporation U-15811 U-18236 27,750 14,622 Yes 0.00Wisc. Elec Co U-15812 U-18237 38,400 97,211 Yes 1.20
Member Regulated CooperativesAlger Delta Coop Elec U-15813 U-16589 6,969 0 Yes 0.00Bayfield Elec. Coop U-15814 U-16590 17 0 Yes 0.00Cherryland Elec Coop U-15815 U-16591 38,353 0 Yes 0.00Cloverland Electric Coop U-15816 U-17799 80,961 415 Yes 0.00Great Lakes Energy Coop U-15817 U-16593 139,943 0 Yes 0.00Midwest Energy Coop U-15818 U-16594 59,206 0 Yes 0.00Ontonagon Co. Rural Elec. U-15819 U-16595 2,540 13 Yes 0.00Presque Isle Elec & Coop U-15820 U-16596 23,866 0 Yes 0.00Tri-County Elec. Coop U-15822 U-16598 33,432 0 Yes 0.00Thumb Elec. Coop U-15821 U-17801 16,565 303 Yes 0.00
Alternative Electric SuppliersCalpine Energy Solutions, LLC f/k/a Noble Americas Energy Solutions U-15843 U-16650 98,682 0 Yes 0.00CMS ERM Michigan U-15826 U-16640 15,296 1,536 Yes 0.00Commerce Energy U-15828 U-16641 1,149 0 Yes 0.00Constellation Energy Services, Inc (Formally Integrys) U-15833 U-16646 265,691 13,521 Yes 0.00
Constellation NewEnergy U-15829 U-16642 175,122 0 Yes 0.00Eligo Energy MI, LLC U-17885Direct Energy Business U-15845 U-16643 43,482 18,510 Yes 0.00First Energy Solutions U-15832 U-16644 287,484 0 Yes 0.00MidAmerican Energy Services U-17934Spartan Renewable Energy U-15844 U-16651 6,802 0 Yes 0.00
Appendix B - Renewable Energy Credit Requirements and Renewable Energy Plan Summary
CompanyInitial Plan
2017 Plan Docket
2016 REC Requirement
2016 Excess RECs Retired
2016 EO Credit
SubstitutionsMet the 2016
Standard
Current Residential Surcharge $/Month
Appendix B - Renewable Energy Credit Requirements and Renewable Energy Plan Summary
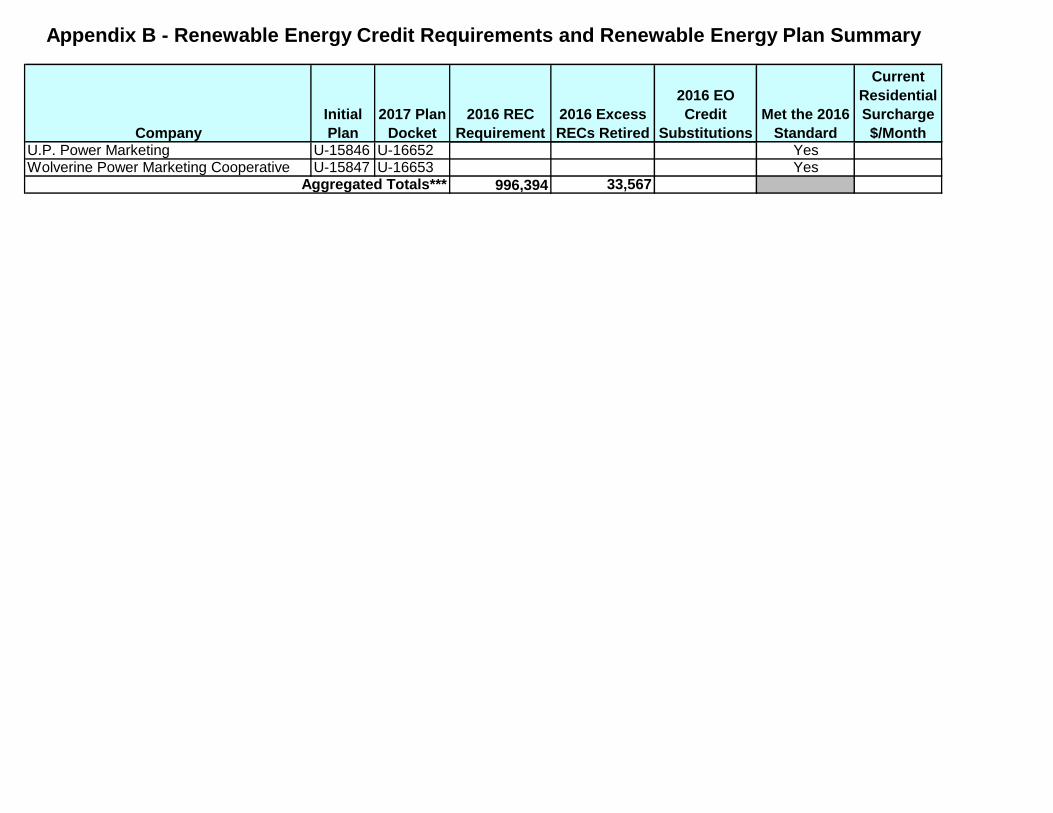
U.P. Power Marketing U-15846 U-16652 3,971 0 Yes 0.00Wolverine Power Marketing Cooperative U-15847 U-16653 98,715 0 Yes 0.00
996,394 33,567Aggregated Totals***
CompanyInitial Plan
2017 Plan Docket
2016 REC Requirement
2016 Excess RECs Retired
2016 EO Credit
SubstitutionsMet the 2016
Standard
Current Residential Surcharge $/Month
Appendix B - Renewable Energy Credit Requirements and Renewable Energy Plan Summary
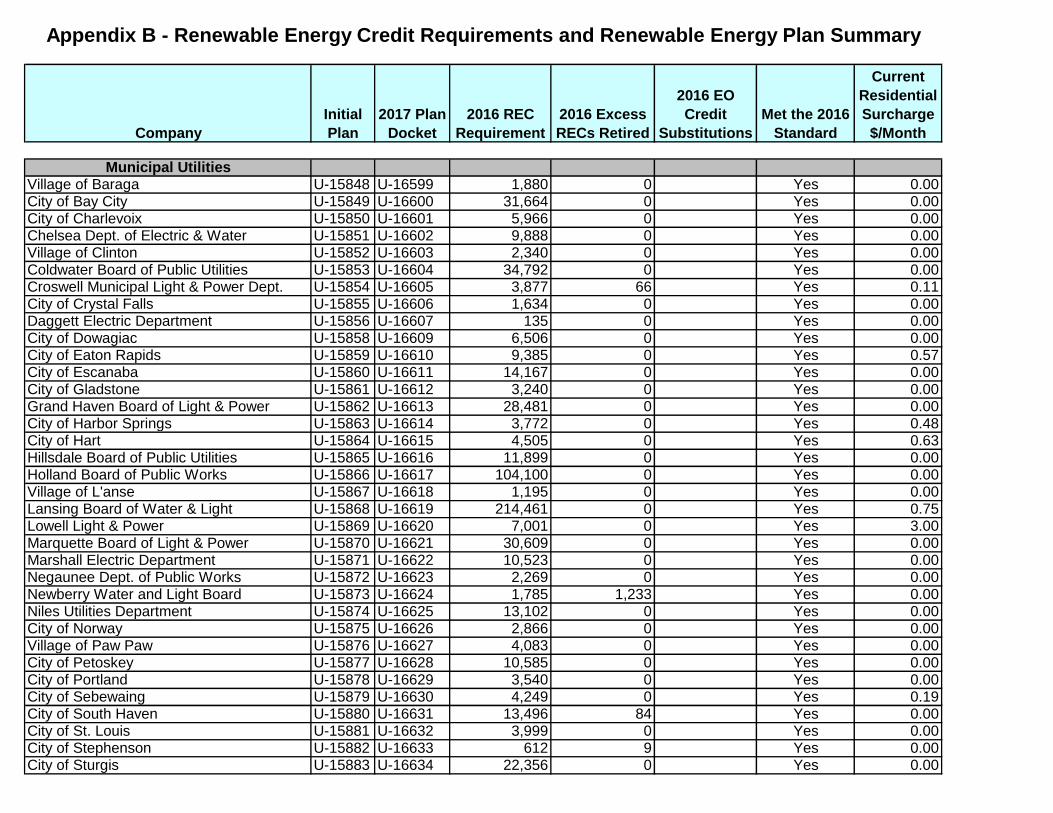
Municipal UtilitiesVillage of Baraga U-15848 U-16599 1,880 0 Yes 0.00City of Bay City U-15849 U-16600 31,664 0 Yes 0.00City of Charlevoix U-15850 U-16601 5,966 0 Yes 0.00Chelsea Dept. of Electric & Water U-15851 U-16602 9,888 0 Yes 0.00Village of Clinton U-15852 U-16603 2,340 0 Yes 0.00Coldwater Board of Public Utilities U-15853 U-16604 34,792 0 Yes 0.00Croswell Municipal Light & Power Dept. U-15854 U-16605 3,877 66 Yes 0.11City of Crystal Falls U-15855 U-16606 1,634 0 Yes 0.00Daggett Electric Department U-15856 U-16607 135 0 Yes 0.00City of Dowagiac U-15858 U-16609 6,506 0 Yes 0.00City of Eaton Rapids U-15859 U-16610 9,385 0 Yes 0.57City of Escanaba U-15860 U-16611 14,167 0 Yes 0.00City of Gladstone U-15861 U-16612 3,240 0 Yes 0.00Grand Haven Board of Light & Power U-15862 U-16613 28,481 0 Yes 0.00City of Harbor Springs U-15863 U-16614 3,772 0 Yes 0.48City of Hart U-15864 U-16615 4,505 0 Yes 0.63Hillsdale Board of Public Utilities U-15865 U-16616 11,899 0 Yes 0.00Holland Board of Public Works U-15866 U-16617 104,100 0 Yes 0.00Village of L'anse U-15867 U-16618 1,195 0 Yes 0.00Lansing Board of Water & Light U-15868 U-16619 214,461 0 Yes 0.75Lowell Light & Power U-15869 U-16620 7,001 0 Yes 3.00Marquette Board of Light & Power U-15870 U-16621 30,609 0 Yes 0.00Marshall Electric Department U-15871 U-16622 10,523 0 Yes 0.00Negaunee Dept. of Public Works U-15872 U-16623 2,269 0 Yes 0.00Newberry Water and Light Board U-15873 U-16624 1,785 1,233 Yes 0.00Niles Utilities Department U-15874 U-16625 13,102 0 Yes 0.00City of Norway U-15875 U-16626 2,866 0 Yes 0.00Village of Paw Paw U-15876 U-16627 4,083 0 Yes 0.00City of Petoskey U-15877 U-16628 10,585 0 Yes 0.00City of Portland U-15878 U-16629 3,540 0 Yes 0.00City of Sebewaing U-15879 U-16630 4,249 0 Yes 0.19City of South Haven U-15880 U-16631 13,496 84 Yes 0.00City of St. Louis U-15881 U-16632 3,999 0 Yes 0.00City of Stephenson U-15882 U-16633 612 9 Yes 0.00City of Sturgis U-15883 U-16634 22,356 0 Yes 0.00
CompanyInitial Plan
2017 Plan Docket
2016 REC Requirement
2016 Excess RECs Retired
2016 EO Credit
SubstitutionsMet the 2016
Standard
Current Residential Surcharge $/Month
Appendix B - Renewable Energy Credit Requirements and Renewable Energy Plan Summary
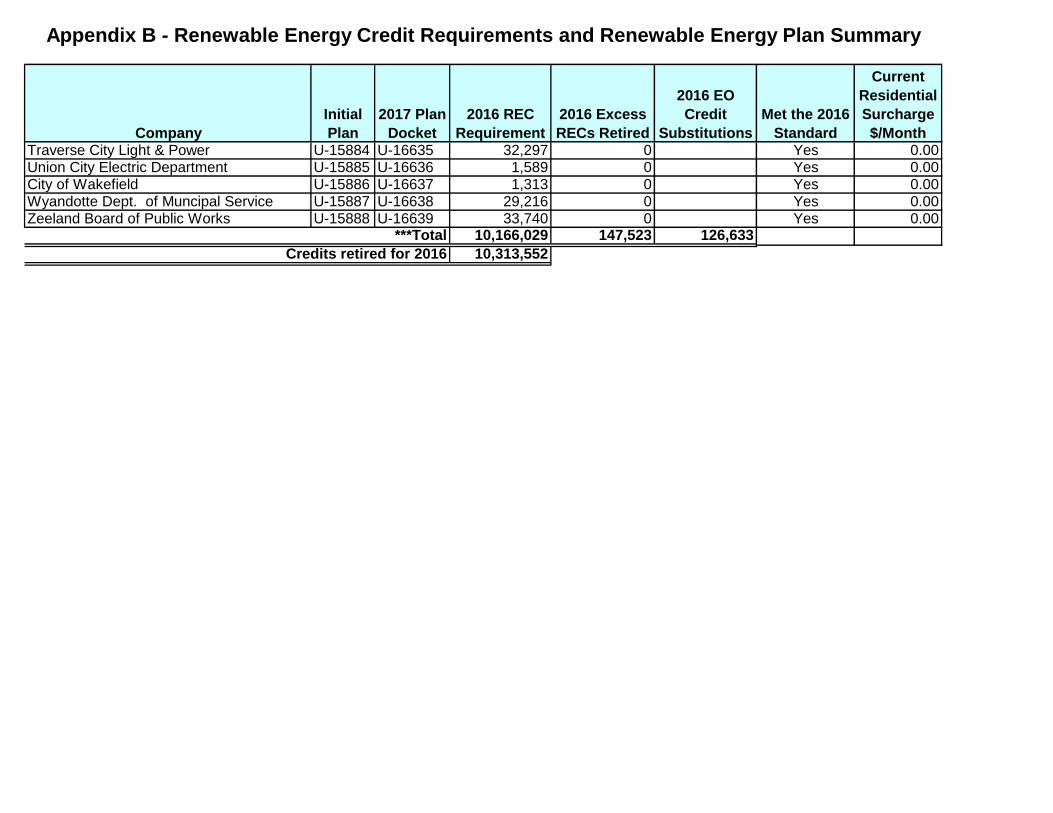
Traverse City Light & Power U-15884 U-16635 32,297 0 Yes 0.00Union City Electric Department U-15885 U-16636 1,589 0 Yes 0.00City of Wakefield U-15886 U-16637 1,313 0 Yes 0.00Wyandotte Dept. of Muncipal Service U-15887 U-16638 29,216 0 Yes 0.00Zeeland Board of Public Works U-15888 U-16639 33,740 0 Yes 0.00
10,166,029 147,523 126,63310,313,552
***TotalCredits retired for 2016
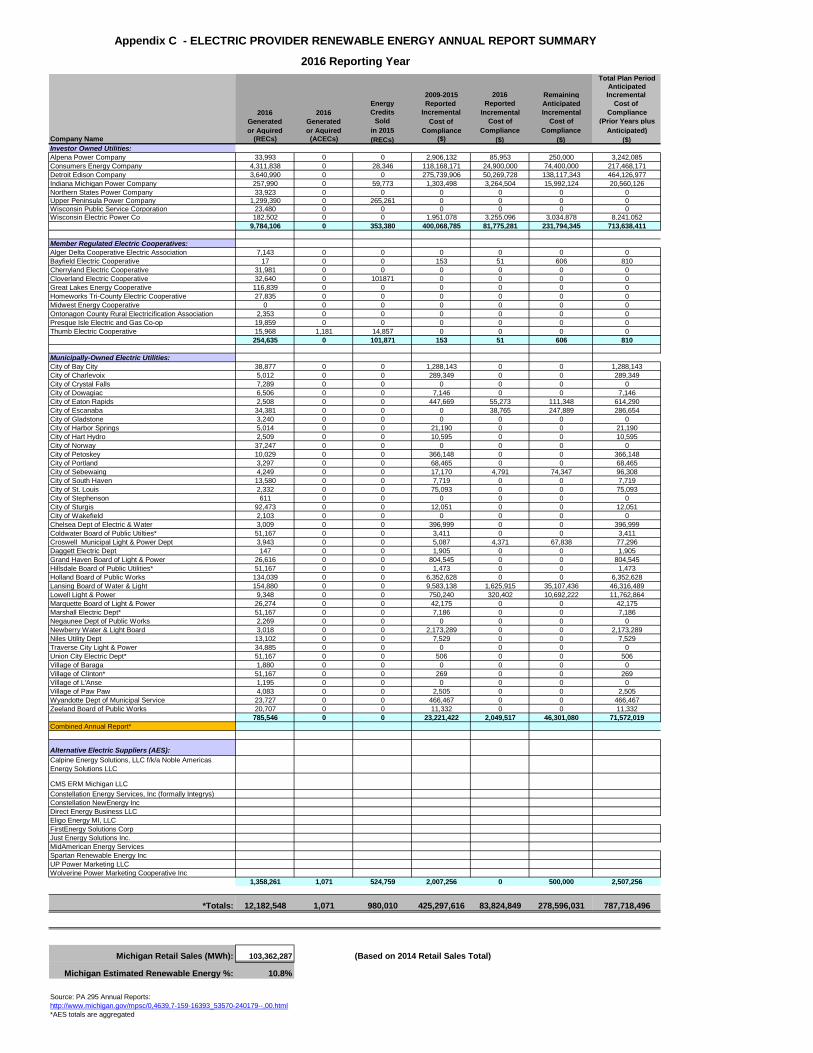
Total Plan PeriodAnticipated
2009-2015 2016 Remaining Incremental Energy Reported Reported Anticipated Cost of
2016 2016 Credits Incremental Incremental Incremental ComplianceGenerated Generated Sold Cost of Cost of Cost of (Prior Years plusor Aquired or Aquired in 2015 Compliance Compliance Compliance Anticipated)
Company Name (RECs) (ACECs) (RECs) ($) ($) ($) ($)Investor Owned Utilities:
Alpena Power Company 33,993 0 0 2,906,132 85,953 250,000 3,242,085Consumers Energy Company 4,311,838 0 28,346 118,168,171 24,900,000 74,400,000 217,468,171Detroit Edison Company 3,640,990 0 0 275,739,906 50,269,728 138,117,343 464,126,977Indiana Michigan Power Company 257,990 0 59,773 1,303,498 3,264,504 15,992,124 20,560,126Northern States Power Company 33,923 0 0 0 0 0 0Upper Peninsula Power Company 1,299,390 0 265,261 0 0 0 0Wisconsin Public Service Corporation 23,480 0 0 0 0 0 0Wisconsin Electric Power Co 182,502 0 0 1,951,078 3,255,096 3,034,878 8,241,052
9,784,106 0 353,380 400,068,785 81,775,281 231,794,345 713,638,411
Member Regulated Electric Cooperatives:
Alger Delta Cooperative Electric Association 7,143 0 0 0 0 0 0Bayfield Electric Cooperative 17 0 0 153 51 606 810Cherryland Electric Cooperative 31,981 0 0 0 0 0 0Cloverland Electric Cooperative 32,640 0 101871 0 0 0 0Great Lakes Energy Cooperative 116,839 0 0 0 0 0 0Homeworks Tri-County Electric Cooperative 27,835 0 0 0 0 0 0Midwest Energy Cooperative 0 0 0 0 0 0 0Ontonagon County Rural Electricification Association 2,353 0 0 0 0 0 0Presque Isle Electric and Gas Co-op 19,859 0 0 0 0 0 0Thumb Electric Cooperative 15,968 1,181 14,857 0 0 0 0
254,635 0 101,871 153 51 606 810
Municipally-Owned Electric Utilities:
City of Bay City 38,877 0 0 1,288,143 0 0 1,288,143City of Charlevoix 5,012 0 0 289,349 0 0 289,349City of Crystal Falls 7,289 0 0 0 0 0 0City of Dowagiac 6,506 0 0 7,146 0 0 7,146City of Eaton Rapids 2,508 0 0 447,669 55,273 111,348 614,290City of Escanaba 34,381 0 0 0 38,765 247,889 286,654City of Gladstone 3,240 0 0 0 0 0 0City of Harbor Springs 5,014 0 0 21,190 0 0 21,190City of Hart Hydro 2,509 0 0 10,595 0 0 10,595City of Norway 37,247 0 0 0 0 0 0City of Petoskey 10,029 0 0 366,148 0 0 366,148City of Portland 3,297 0 0 68,465 0 0 68,465City of Sebewaing 4,249 0 0 17,170 4,791 74,347 96,308City of South Haven 13,580 0 0 7,719 0 0 7,719City of St. Louis 2,332 0 0 75,093 0 0 75,093City of Stephenson 611 0 0 0 0 0 0City of Sturgis 92,473 0 0 12,051 0 0 12,051City of Wakefield 2,103 0 0 0 0 0 0Chelsea Dept of Electric & Water 3,009 0 0 396,999 0 0 396,999Coldwater Board of Public Utilties* 51,167 0 0 3,411 0 0 3,411Croswell Municipal Light & Power Dept 3,943 0 0 5,087 4,371 67,838 77,296Daggett Electric Dept 147 0 0 1,905 0 0 1,905Grand Haven Board of Light & Power 26,616 0 0 804,545 0 0 804,545Hillsdale Board of Public Utilities* 51,167 0 0 1,473 0 0 1,473Holland Board of Public Works 134,039 0 0 6,352,628 0 0 6,352,628Lansing Board of Water & Light 154,880 0 0 9,583,138 1,625,915 35,107,436 46,316,489Lowell Light & Power 9,348 0 0 750,240 320,402 10,692,222 11,762,864Marquette Board of Light & Power 26,274 0 0 42,175 0 0 42,175Marshall Electric Dept* 51,167 0 0 7,186 0 0 7,186Negaunee Dept of Public Works 2,269 0 0 0 0 0 0Newberry Water & Light Board 3,018 0 0 2,173,289 0 0 2,173,289Niles Utility Dept 13,102 0 0 7,529 0 0 7,529Traverse City Light & Power 34,885 0 0 0 0 0 0Union City Electric Dept* 51,167 0 0 506 0 0 506Village of Baraga 1,880 0 0 0 0 0 0Village of Clinton* 51,167 0 0 269 0 0 269Village of L'Anse 1,195 0 0 0 0 0 0Village of Paw Paw 4,083 0 0 2,505 0 0 2,505Wyandotte Dept of Municipal Service 23,727 0 0 466,467 0 0 466,467Zeeland Board of Public Works 20,707 0 0 11,332 0 0 11,332
785,546 0 0 23,221,422 2,049,517 46,301,080 71,572,019Combined Annual Report*
Alternative Electric Suppliers (AES): Include AES figures - then change to white font to Calpine Energy Solutions, LLC f/k/a Noble Americas Energy Solutions LLC 203,149 0 0 40,218 0 0 40,218
CMS ERM Michigan LLC 15,761 1,071 0 43,000 0 500,000 543,000 not disclose on public report.Constellation Energy Services, Inc (formally Integrys) 279,212 0 279,212 0 0 0 0Constellation NewEnergy Inc 175,122 0 175,122 1,570,357 0 0 1,570,357Direct Energy Business LLC 450,000 0 0 189,507 0 0 189,507Eligo Energy MI, LLCFirstEnergy Solutions Corp 287,484 0 0 203,170 0 0 203,170Just Energy Solutions Inc. 1,149 0 0 1,222 0 0 1,222MidAmerican Energy ServicesSpartan Renewable Energy Inc 47,250 0 47,250 0 0 0 0UP Power Marketing LLC 4,108 0 0 0 0 0 0Wolverine Power Marketing Cooperative Inc 98,175 0 23,175 0 0 0 0
1,358,261 1,071 524,759 2,007,256 0 500,000 2,507,256
*Totals: 12,182,548 1,071 980,010 425,297,616 83,824,849 278,596,031 787,718,496
Michigan Retail Sales (MWh): 103,362,287 (Based on 2014 Retail Sales Total)
Michigan Estimated Renewable Energy %: 10.8%
Source: PA 295 Annual Reports:http://www.michigan.gov/mpsc/0,4639,7-159-16393_53570-240179--,00.html*AES totals are aggregated
Appendix C - ELECTRIC PROVIDER RENEWABLE ENERGY ANNUAL REPORT SUMMARY
2016 Reporting Year
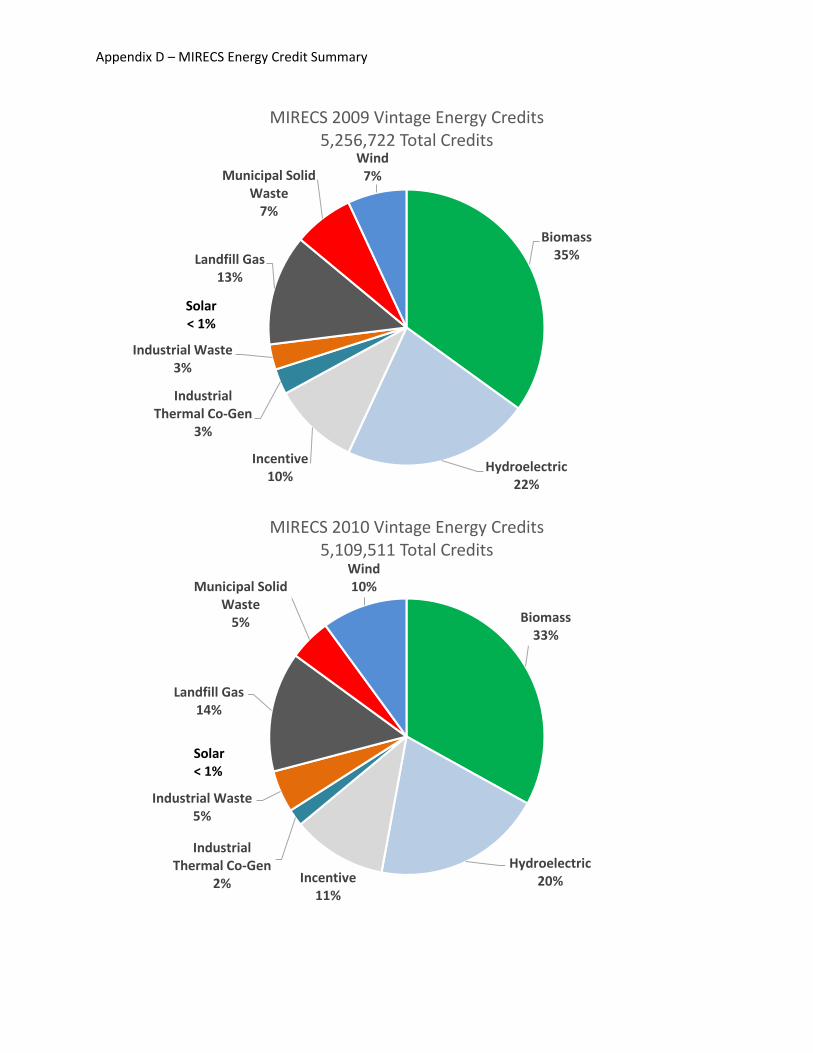
Appendix D – MIRECS Energy Credit Summary
Biomass35%
Hydroelectric22%
Incentive10%
Industrial Thermal Co-Gen
3%
Industrial Waste3%
Landfill Gas13%
Municipal Solid Waste
7%
Wind7%
MIRECS 2009 Vintage Energy Credits5,256,722 Total Credits
Solar< 1%
Biomass33%
Hydroelectric20%Incentive
11%
Industrial Thermal Co-Gen
2%
Industrial Waste5%
Landfill Gas14%
Municipal Solid Waste
5%
Wind10%
MIRECS 2010 Vintage Energy Credits5,109,511 Total Credits
Solar< 1%
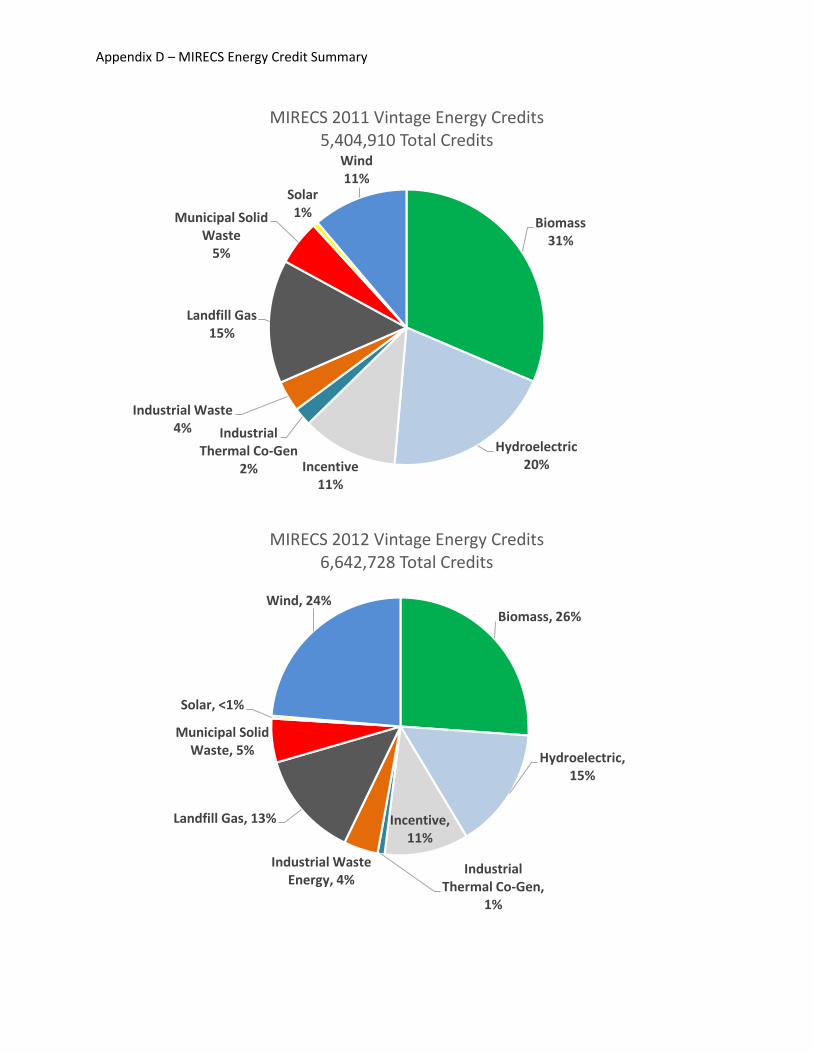
Appendix D – MIRECS Energy Credit Summary
Biomass31%
Hydroelectric20%Incentive
11%
Industrial Thermal Co-Gen
2%
Industrial Waste4%
Landfill Gas15%
Municipal Solid Waste
5%
Solar1%
Wind11%
MIRECS 2011 Vintage Energy Credits5,404,910 Total Credits
Biomass, 26%
Hydroelectric, 15%
Incentive, 11%
Industrial Thermal Co-Gen,
1%
Industrial Waste Energy, 4%
Landfill Gas, 13%
Municipal Solid Waste, 5%
Solar, <1%
Wind, 24%
MIRECS 2012 Vintage Energy Credits 6,642,728 Total Credits
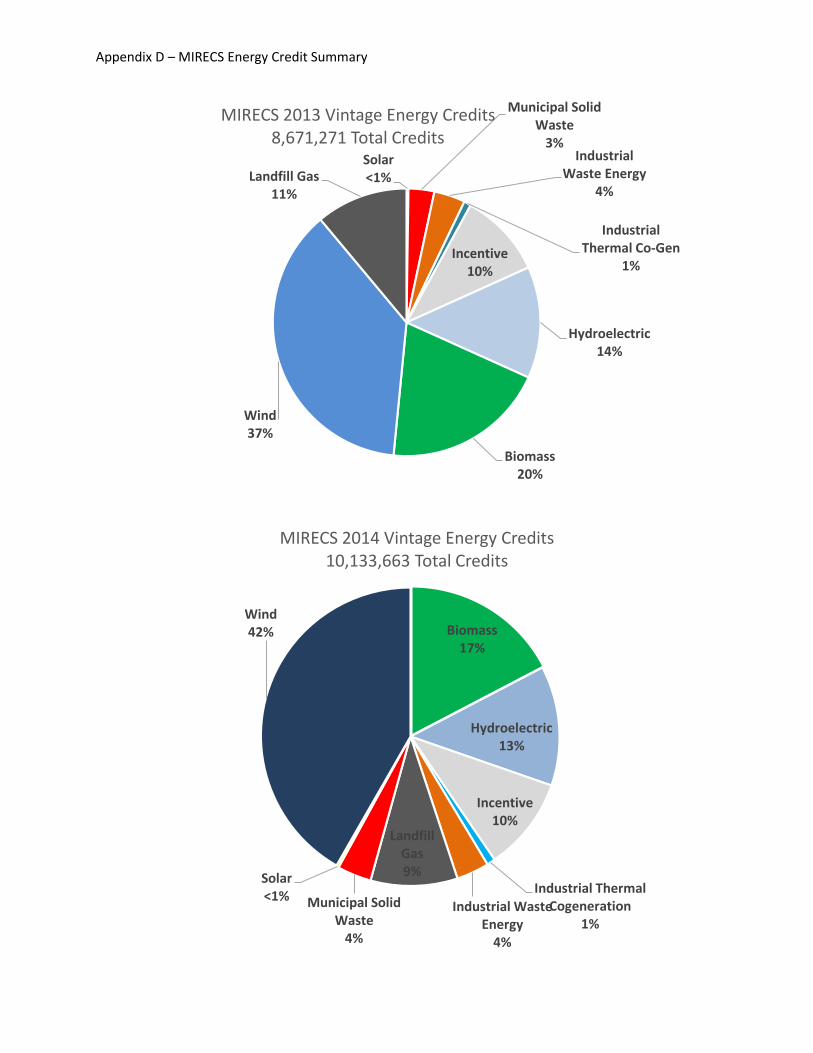
Appendix D – MIRECS Energy Credit Summary
Solar<1%
Municipal Solid Waste
3%Industrial
Waste Energy4%
Industrial Thermal Co-Gen
1%Incentive
10%
Hydroelectric14%
Biomass20%
Wind37%
Landfill Gas11%
MIRECS 2013 Vintage Energy Credits8,671,271 Total Credits
Biomass17%
Hydroelectric13%
Incentive10%
Industrial Thermal Cogeneration
1%Industrial Waste
Energy4%
Landfill Gas9%
Municipal Solid Waste
4%
Solar<1%
Wind42%
MIRECS 2014 Vintage Energy Credits10,133,663 Total Credits
Appendix D – MIRECS Energy Credit Summary
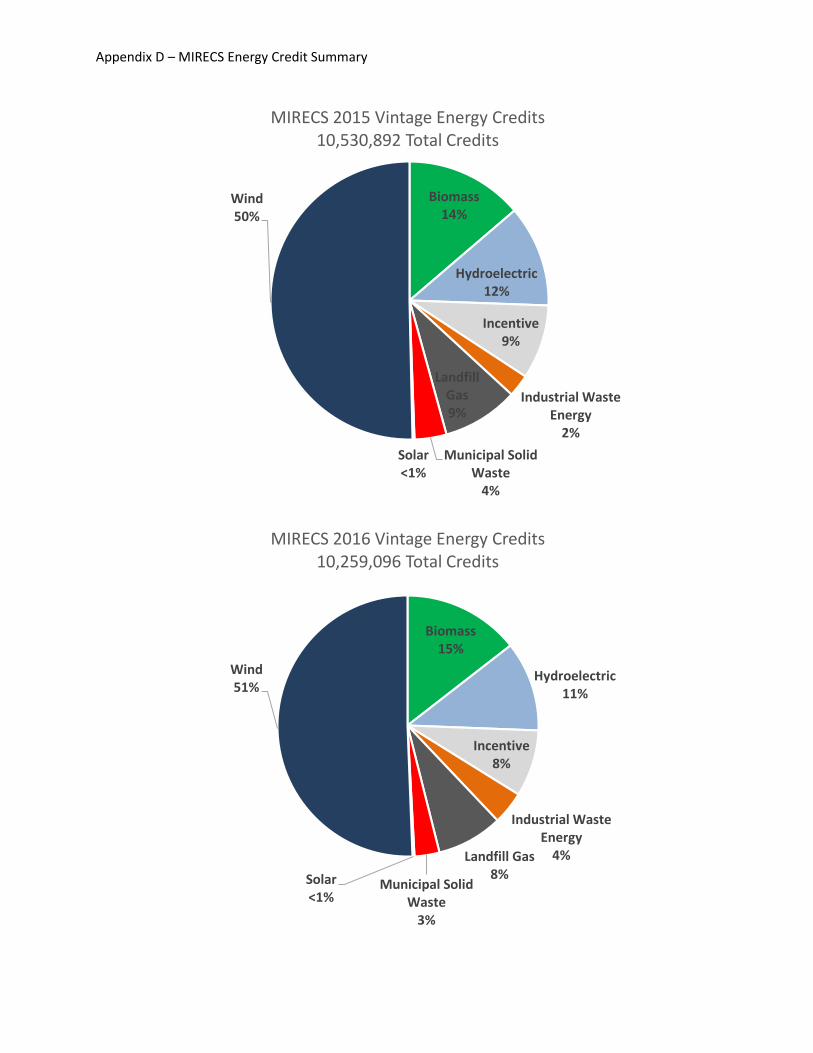
Biomass14%
Hydroelectric12%
Incentive9%
Industrial Waste Energy
2%
Landfill Gas9%
Municipal Solid Waste
4%
Solar<1%
Wind50%
MIRECS 2015 Vintage Energy Credits10,530,892 Total Credits
Biomass15%
Hydroelectric11%
Incentive8%
Industrial Waste Energy
4%Landfill Gas8%
Municipal Solid Waste
3%
Solar<1%
Wind51%
MIRECS 2016 Vintage Energy Credits10,259,096 Total Credits
Appendix D – MIRECS Energy Credit Summary
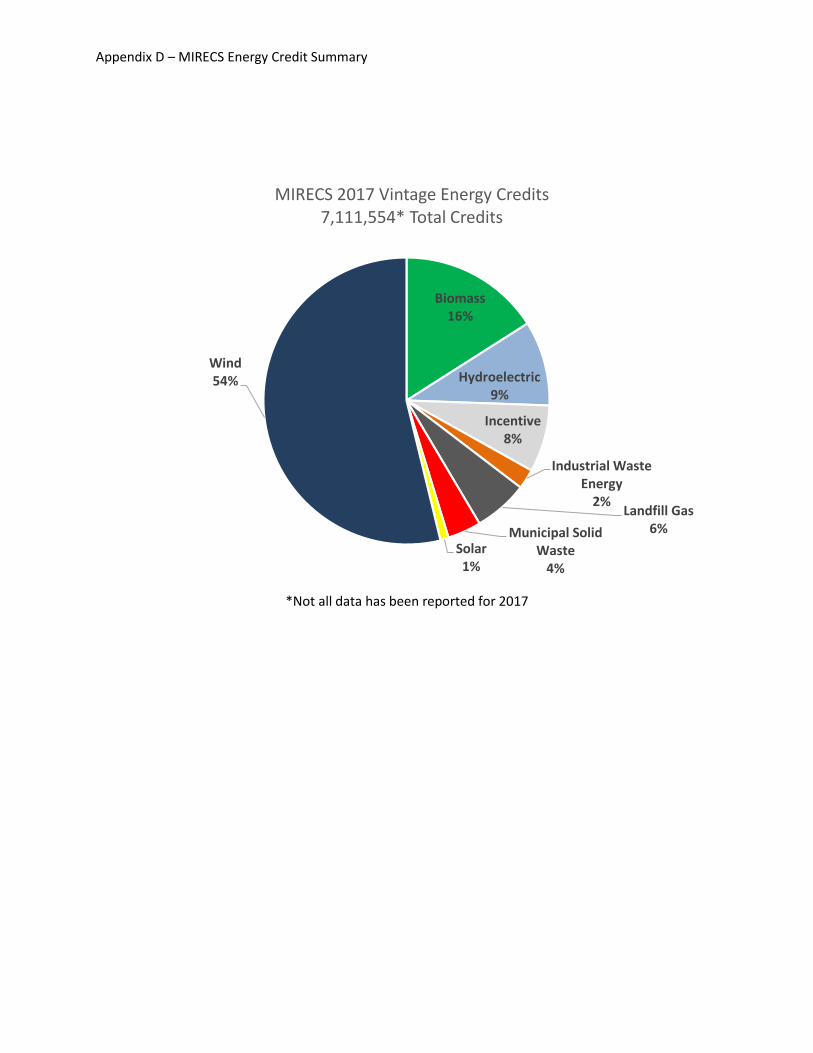
*Not all data has been reported for 2017
Biomass16%
Hydroelectric9%
Incentive8%
Industrial Waste Energy
2%Landfill Gas
6%Municipal Solid Waste
4%
Solar1%
Wind54%
MIRECS 2017 Vintage Energy Credits7,111,554* Total Credits
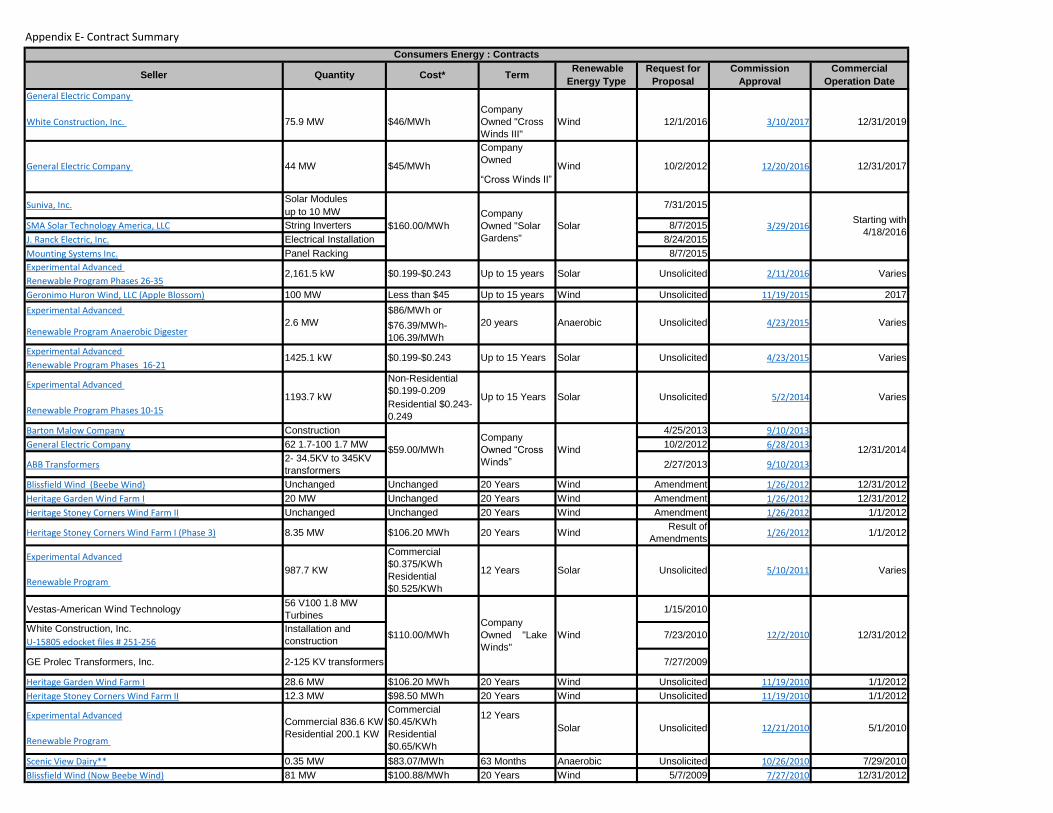
Appendix E- Contract Summary
General Electric Company
White Construction, Inc. 75.9 MW $46/MWhCompany Owned "Cross Winds III"
Wind 12/1/2016 3/10/2017 12/31/2019
Company Owned
“Cross Winds II”
Solar Modules up to 10 MW
SMA Solar Technology America, LLC String Inverters 8/7/2015J. Ranck Electric, Inc. Electrical Installation 8/24/2015Mounting Systems Inc. Panel Racking 8/7/2015Experimental Advanced
Renewable Program Phases 26-35
Geronimo Huron Wind, LLC (Apple Blossom) 100 MW Less than $45 Up to 15 years Wind Unsolicited 11/19/2015 2017Experimental Advanced $86/MWh or
Renewable Program Anaerobic Digester$76.39/MWh-106.39/MWh
Experimental Advanced
Renewable Program Phases 16-21
Experimental Advanced Non-Residential $0.199-0.209
Renewable Program Phases 10-15Residential $0.243-0.249
Barton Malow Company Construction 4/25/2013 9/10/2013
General Electric Company 62 1.7-100 1.7 MW 10/2/2012 6/28/2013
ABB Transformers2- 34.5KV to 345KV transformers 2/27/2013 9/10/2013
Blissfield Wind (Beebe Wind) Unchanged Unchanged 20 Years Wind Amendment 1/26/2012 12/31/2012Heritage Garden Wind Farm I 20 MW Unchanged 20 Years Wind Amendment 1/26/2012 12/31/2012Heritage Stoney Corners Wind Farm II Unchanged Unchanged 20 Years Wind Amendment 1/26/2012 1/1/2012
Heritage Stoney Corners Wind Farm I (Phase 3) 8.35 MW $106.20 MWh 20 Years Wind Result of Amendments 1/26/2012 1/1/2012
Experimental Advanced
Renewable Program
Vestas-American Wind Technology 56 V100 1.8 MW Turbines 1/15/2010
White Construction, Inc. U-15805 edocket files # 251-256
GE Prolec Transformers, Inc. 2-125 KV transformers 7/27/2009
Heritage Garden Wind Farm I 28.6 MW $106.20 MWh 20 Years Wind Unsolicited 11/19/2010 1/1/2012Heritage Stoney Corners Wind Farm II 12.3 MW $98.50 MWh 20 Years Wind Unsolicited 11/19/2010 1/1/2012
Experimental Advanced 12 Years
Renewable Program
Scenic View Dairy** 0.35 MW $83.07/MWh 63 Months Anaerobic Unsolicited 10/26/2010 7/29/2010Blissfield Wind (Now Beebe Wind) 81 MW $100.88/MWh 20 Years Wind 5/7/2009 7/27/2010 12/31/2012
Consumers Energy : Contracts
Seller Quantity Cost* Term Renewable Energy Type
Request for Proposal
Commission Approval
Commercial Operation Date
12/20/2016 12/31/2017
Suniva, Inc.
$160.00/MWh Solar
7/31/2015
3/29/2016Starting with
4/18/2016
General Electric Company 44 MW $45/MWh Wind 10/2/2012
Company Owned "Solar Gardens"
2/11/2016 Varies
2.6 MW 20 years Anaerobic Unsolicited 4/23/2015 Varies
2,161.5 kW $0.199-$0.243 Up to 15 years Solar Unsolicited
4/23/2015 Varies
1193.7 kW Up to 15 Years Solar Unsolicited 5/2/2014 Varies
1425.1 kW $0.199-$0.243 Up to 15 Years Solar Unsolicited
$59.00/MWhCompany Owned “Cross
Winds”
Wind 12/31/2014
987.7 KW
Commercial $0.375/KWh Residential $0.525/KWh
12 Years Solar Unsolicited 5/10/2011 Varies
12/31/2012Installation and construction 7/23/2010
Commercial 836.6 KW Residential 200.1 KW Unsolicited 12/21/2010
Commercial $0.45/KWh Residential $0.65/KWh
Solar
$110.00/MWh Wind 12/2/2010
5/1/2010
Company Owned "Lake Winds"
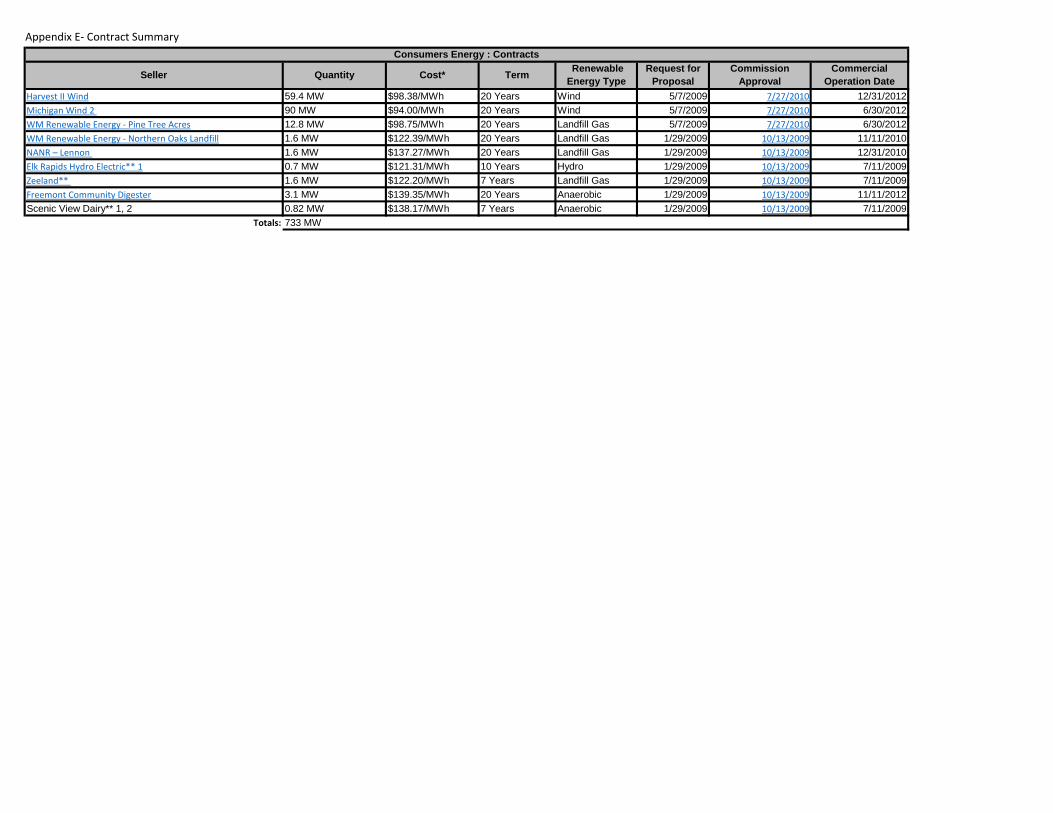
Appendix E- Contract Summary
Harvest II Wind 59.4 MW $98.38/MWh 20 Years Wind 5/7/2009 7/27/2010 12/31/2012Michigan Wind 2 90 MW $94.00/MWh 20 Years Wind 5/7/2009 7/27/2010 6/30/2012WM Renewable Energy - Pine Tree Acres 12.8 MW $98.75/MWh 20 Years Landfill Gas 5/7/2009 7/27/2010 6/30/2012WM Renewable Energy - Northern Oaks Landfill 1.6 MW $122.39/MWh 20 Years Landfill Gas 1/29/2009 10/13/2009 11/11/2010NANR – Lennon 1.6 MW $137.27/MWh 20 Years Landfill Gas 1/29/2009 10/13/2009 12/31/2010Elk Rapids Hydro Electric** 1 0.7 MW $121.31/MWh 10 Years Hydro 1/29/2009 10/13/2009 7/11/2009Zeeland** 1.6 MW $122.20/MWh 7 Years Landfill Gas 1/29/2009 10/13/2009 7/11/2009Freemont Community Digester 3.1 MW $139.35/MWh 20 Years Anaerobic 1/29/2009 10/13/2009 11/11/2012Scenic View Dairy** 1, 2 0.82 MW $138.17/MWh 7 Years Anaerobic 1/29/2009 10/13/2009 7/11/2009
Totals: 733 MW
Seller Quantity Cost* Term Request for Proposal
Renewable Energy Type
Commission Approval
Commercial Operation Date
Consumers Energy : Contracts
Appendix E- Contract Summary
Pine River Wind Energy, LLC 161.3 MW $59.67***Company Owned “Pine
River”
Wind 5/20/2016 12/20/2016 12/31/2018
Innovatus (DTE Solar) Up to 50 MW $113.52/MWh*** Company Owned Solar 6/24/2015 12/11/2015 10/31/2016
1.7MW-100 model turbines up to 50 MW
Aristeo Construction Company Installation and construction 6/20/2014
Rudolf Libbe, Inc 750 kWInovateus Solar, LLC. (SolarCurrents) 504 kWBig Turtle Wind Farm, LLC 20 MW $53/MWh 20 Years Wind Unsolicited 9/24/2013 Expected 2014Pheasant Run Wind, LLC 74.8 MW Up to $49.25/MWh 20 Years Wind Unsolicited 5/17/2013 12/31/2014
Pheasant Run Wind II, LLC 74.8 MW Up to $49.25/MWhCompany Owned “Brookfield”
Wind Unsolicited 5/17/2013 12/31/2014
0.5 MW Non-Residential $0.13/W $0.02/kWh
1.5 MW Residential $0.20/W $0.03/kWh
Tuscola Wind II, LLC 100 MW $49.25/MWh*** 20 Years Wind 5/3/2012 10/31/2012 12/31/2013
General Electric Company1.6MW-100 model turbines up to 110 MW 10/12/2011
Barton Malow CompanyInstallation and construction 4/17/2012
1991Nova Consultants, Inc. Solar EPC Up to $48 Million 2/28/2011
McNaughton-McKay Electric CompanySupply up to 12 MW of Modules 11/10/2011
Inovateus Solar, LLC (SolarCurrents) Supply up to 12MW
General Electric CompanyUp to 69 1.6MW-100 Turbines
Company Owned “Thumb
Wind”
3/9/2011
Barton Malow CompanyInstallation and construction
McKinley, Minden, Sigel 5/6/2011
Tuscola Bay Wind. LLC 120 MW Up to $60.90/MWh 20 Years Wind 11/18/2010 8/25/2011 10/31/2012AmendmentAcquiring Vintage RECsCompany Owned
Nova Consultants (SolarCurrents)Unchanged from original contract
Unchanged from original contract
Company Owned Solar Extension 12/21/2010 12/31/2011
Blue Water Renewables - Smiths Creek Landfill 3.2 MW $99.00/MWh 20 Years Landfill Unsolicited 1/20/2011 12/31/2011110.4 MW $91.43/MWh 20 Years 5/1/201289.6 MW Company Up to $94.43/MWhOwned
Commercial Operation Date
General Electric Company$47/MlWh - $53/MWh
Company Owned “Pinnebog
Wind”
Wind2/17/2014
12/18/2014 12/31/2015
Seller Quantity Cost* Term Renewable Energy Type
Request for Proposal
Commission Approval
DTE Electric Company : Contracts
$52.50/MWhCompany Owned “Echo
Wind”
Wind 9/11/2012 12/31/2013
Apr-15
SolarCurrents Phase IIThrough 8/31/2029 Solar Unsolicited 11/16/2012 Varies
$3,741/kW Company Owned Solar 9/28/2012 7/8/2014
Unsolicited 12/6/2011
Company Owned Solar 12/31/2015
Up to $24 Million 3/24/2011
Michigan Waste Energy, Inc.Up to 65,000 RECs/Year $7.00/REC 13 Years Incinerator
$61-$64/MWh Wind 9/13/2011 12/31/2012
L’Anse Warden Electric Company 110,374 RECs$11.98 (Average of 4 REC/ACEC Contracts)
Biomass 8/18/2009 8/25/2011 7/1/2010
12/31/2012
Gratiot County Wind Wind 8/18/2009 9/14/2010Company Owned 3/31/2012
Gratiot County Wind 12.8 MW additional Unchanged from original contract Wind Amendment 5/10/2011
Appendix E- Contract Summary
WM Renewable Energy - Eagle Valley Landfill 3.2 MW 20 years Landfill 8/18/2009 8/10/2010 6/1/2011
L’Anse Warden Electric Company 17 MW 20 years Biomass 8/18/2009 8/10/2010 7/1/2010
Boyce Hydro**
Nova Consultants (SolarCurrents) Up to 3 MW Up to $18 Million Company Owned Solar 11/23/2009 3/2/2010 12/31/2010
Heritage Sustainable Energy
Stoney Corners Wind Farm
UPPCO** Firm 500,000 RECs 7 Years Hydro 12/23/2009 12/1/2009 10/1/2009
Sterling Planet** Firm 2,500,000 RECs 10 Years MISC 12/23/2009 12/1/2009 10/1/2009
Heritage Sustainable Energy
Stoney Corners Wind Farm
Totals: 1152 MW* Per MWh prices represent levelized costs.** Pre-existing projects prior to 2008 PA 295 - The commercial operation date would refer to the effective date of the contract.***Staff calculated levelized cost
3/16/2010
Commission Approval
Commercial Operation Date
12.2 MW Unchanged from original contract 20 Years Wind Unsolicited 12/1/2009 1/1/2011
4/27/2010
Firm 210,000 RECs w/additional 112,000 RECs dependent on generation
Combined average price of $98.94/MWh
$7.75/ REC 7 Years Hydro 12/23/2009
DTE Electric Company : Contracts
Seller Quantity Cost* Term Renewable Energy Type
Request for Proposal
Unsolicited 4/30/2009 12/21/2009
Combined average price of $12.46/REC
14 MW $116.00/MWh 20 Years Wind
Appendix E- Contract Summary
Seller Quantity Cost Term Renewable Energy Type
Request for Proposal
Commission Approval
Commercial Operation Date
Consumers Energy "Bulk of RECs needed to meet the RPS"
Consumers Energy Company’s Average
Cost of RECs20 Years MISC Unsolicited 9/15/2009 8/4/2009
Seller Quantity Cost Term Renewable Energy Type
Request for Proposal
Commission Approval
Commercial Operation Date
Fowler Ridge Wind Farm II 50 MW (7.5MW for MI) Redacted 20 Years Wind Unsolicited 9/15/2009 2/15/2010
Wind Competitive Solicitation
Wildcat I Wind Farm, LLC
Seller Quantity Cost Term Renewable Energy Type
Request for Proposal
Commission Approval
Commercial Operation Date
Cadillac Renewable Energy. LLC REC-Only Redacted Redacted Redacted Biomass Competitive Solicitation 1/23/2014 Redacted
Wisconsin Electric Power Company (Upper Michigan Energy Resources Corporation) : Contracts
AEP/Indiana Michigan : Contracts
Alpena Power Company : Contracts
8/25/2011 12/31/2012100 MW (60MW for MI) Redacted 20 years
Appendix F - Requests for Proposal (RFP) Summary
Issue Date Type Description Requested CapacityCompany
OwnedApplicable
Technology*
12/1/2016 RFPRequested bids for the Installation of a Utility Owned Wind Farm (Cross Winds II and III) Up to 150 MW Yes Wind
10/2/2012 RFPRequest for Qualifications for 150 MWs of Utility Owned Wind Turbines Up to 150 MW Yes Wind
8/7/2015 RFP Request for Proposal for Solar String Inverters
7/31/2015 RFP Request for Proposal for Solar Modules
8/7/2015 RFP Request for Proposal for Solar Park Racking
8/24/2015 RFP Request for Proposal for Solar Park Construction
RFQ Request for Qualifications for Solar Park
Construction
4/25/2013 RFPRequested bids for the Installation of a Utility Owned Wind Farm (Cross Winds)
2/27/2013 RFPRequested Substation Transformer Bids for Utility Owned Wind Farm (Cross Winds)
10/2/2012 RFPRequested bids for Utility Owned Wind Turbines (Cross Winds)
May-12 RFQRequest for Qualifications for 105 MWs of Utility Owned Wind Turbines N/A Yes Wind
7/23/2010 RFPRequested bids for the Installation of a Utility Owned Wind Farm
1/15/2010 RFP Requested bids for Utility Owned Wind Turbines
7/27/2009 RFPRequested Substation Transformer Bids for Utility Owned Wind Farm
2/19/2010 RFQRequest for Qualifications for the Installation of a 100 MW Utility Owned Wind Farm N/A Yes Wind
7/14/2010 RFQRequest for Qualifications for 100 MWs of Utility Owned Wind Turbines N/A Yes Wind
5/7/2009 RFP Requested CEREC** 100 MW by 2012 / 150 MW by 2014 No All
1/29/2009 RFP Requested CEREC** 17.4 MW No All
Consumers Energy : Request for Proposals/Requests for Information/Pre-Qualifications
100 MW by 2012 Yes Wind
105 MW by Yes Wind
Up to 10 MW Yes Solar
* All=Any Renewable Energy Resource defined by 2008 PA 295; REC=Renewable Energy Credit; ACEC=Advanced Cleaner Energy Credit ** CEREC=Capacity, Energy, and Renewable Energy Attributes
Appendix F - Requests for Proposal (RFP) Summary
Issue Date Type Description Requested CapacityCompany
OwnedApplicable
Technology*
5/20/2016 RFP Wind Ownership Option Up to 150 Yes Solar
6/20/2015 RFPUp to 50 MW Solar Engineering Procurement
and Construction 50 MW Yes Solar
6/20/2014 RFPRequested bids for the Installation of a Utility
Owned Wind Farm
2/17/2014 RFPUp to 100 MW of Utility Owned Wind Turbines
(Pinnebog)
2/6/2013 RFP Phase II Solar Engineering Procurement and
Construction
9/28/2012 RFP Phase I Solar Engineering Procurement and
Construction
5/3/2012 RFP 100 MW of Wind100 MW by 12/31/2013 No Wind
4/17/2012 RFP EPC (Echo) NA Yes Wind
12/7/2011 AuctionRequested RECs* Without the Associated
Energy 2009 and 2010
Vintage No All
10/12/2011 RFP 110 MW of Utility Owned Wind Turbines (Echo)110 MW by 12/31/2013 Yes Wind
5/6/2011 RFP EPC (Thumb) N/A Yes Wind
3/24/2011 RFP Solar Panels 12 MW Yes Solar
3/10/2011 RFP Wind Ownership Option 50 MW by 12/31/2014 Yes All
3/9/2011 RFP109 MW of Utility Owned Wind Turbines
(Thumb)109 MW by 12/31/2012 Yes Wind
2/28/2011 RFPRequested bids for the Installation of Utility
Owned Solar N/A Yes Solar
2/10/2011 RFP O&M Services N/A Yes Wind
11/18/2010 RFP Requested CEREC** 245 MW by 12/31/2014 No All
7/26/2010 Pre-QPre-qualification for 100-200 MW of Utility
Owned Wind Turbines N/A Yes Wind
3/29/2010 SOISolicitation of Interest to Host Utility Owned Solar at the Customers Location N/A Yes Solar
11/23/2009 RFPRequested bids for the Installation of Utility Owned Solar 3 MW Yes Solar
10/23/2009 Pre-QPre-Qualification for the Installation of 3 MW of Utility Owned Solar N/A Yes Solar
8/18/2009 RFP Joint Development for Utility Owned Wind 75 MW by 12/31/2011 Yes Wind
8/18/2009 RFP Requested CEREC** 106 MW by 12/31/2011 No All
5/22/2009 RFIRequest for Information for the Joint Development of Wind Farms N/A Yes Wind
12/23/2008 RFPRequested RECs* and ACECs* Without the Associated Energy 250,000 RECs*/Year No All
DTE Electric Company : Request for Proposals/Requests for Information/Pre-Qualifications
1.25 MW Yes Solar
Yes Wind 100 MW by 12/31/2015
* All=Any Renewable Energy Resource defined by 2008 PA 295; REC=Renewable Energy Credit; ACEC=Advanced Cleaner Energy Credit ** CEREC=Capacity, Energy, and Renewable Energy Attributes
Project Name County Capacity (MW) Turbine Size (MW)
Number of Turbines
Turbine Manufacturer Developer Power Purchaser Commercial Operation
Date
Apple Blossom Huron 100 3.45 29 Geronimo Energy Consumers Energy October 2017
Beebe Gratiot 81 2.4 34 Nordex Exelon & Great Lakes Wind Consumers Energy December 2012
Beebe 1B Gratiot 50.4 2.4 21 Nordex Exelon Municipal Utility December 2014
Big Turtle Huron 20 2.0 10 Gamesa Heritage Sustainable Energy DTE December 2014
Big Turtle II Huron 30 2.0 15 Gamesa Heritage Sustainable Energy December 2016
Brookfield Huron 74.8 1.7 44 GE Energy NextEra Energy DTE February 2014
Cross Winds Tuscola 111 1.7 65 GE Energy Consumers Energy N/A December 2014
CrossWinds II Tuscola 44 2.3 19 GE Energy Consumers Energy N/A January 2018
Crosswinds III Tuscola 76 2.3 33 GE Energy Consumers Energy Expected 2020
Deerfield Wind Huron 150 2 72 Vestas RES Americas Wolverine Power Cooperative January 2017
Echo Huron 112 1.6 70 GE Energy DTE N/A September 2014
Garden I Delta 28 2.0 14 Gamesa Heritage Sustainable Energy Consumers Energy** September 2012
Gratiot County Gratiot 212.8 1.6 133 GE Energy Invenergy & DTE DTE June 2012
Harvest Huron 52.8 1.65 32 Vestas Exelon Wolverine Power Cooperative 2008
Harvest II Huron 59.4 1.8 33 Vestas Exelon Consumers Energy November 2012
Lake Winds Mason 100.8 1.8 56 Vestas Consumers Energy N/A November 2012
Mackinaw City Emmet 1.8 0.9 2 NEG Micon Mackinaw Power Consumers Energy 2001
McKinley Huron 14.4 1.6 9 GE Energy DTE N/A December 2012
Michigan Wind I Huron 69 1.5 46 GE Energy Exelon Consumers Energy 2008
Michigan Wind II Sanilac 90 1.8 50 Vestas Exelon Consumers Energy January 2012
Minden Sanilac 32 1.6 20 GE Energy DTE N/A December 2012
Pheasant Run Wind Huron 74.8 1.7 44 GE Energy NextEra Energy DTE December 2013
Pine River Wind Gratiot, Isabella 161.3 Pine River Wind Energy, LLC DTE December 2018
Pinnebog Huron 51 1.7 30 GE Energy DTE DTE December 2016
Sigel Huron 64 1.6 40 GE Energy DTE N/A December 2012
Stoney Corners Missaukee & Osceola 81 2 - 2.5 29
Repower, Fuhrlander,
Northern Power Systems
Heritage Sustainable Energy
Consumers Energy, DTE, Traverse City
Light & Power2008 - October 2012
Tuscola Bay Wind Tuscola, Bay & Saginaw 120 1.6 75 GE Energy NextEra Energy DTE December 2012
Tuscola Wind II Tuscola & Bay 100.3 1.7 59 GE Energy NextEra Energy DTE November 2013
2,163 MW 1,084 TurbinesOperational Totals 1,925 MW 1,032 Turbines
**Heritage may supply power and RECs from this wind farm to DTE under an “additional supply” provision in a separate contract.
* Prepared by MPSC Staff and includes all wind farms operational, planned or under contract with an MPSC-rate-regulated electric provider. Additional wind farms are included as MPSC Staff becomes aware of the project.
Totals
Bold text indicates the wind farm is operational.
Michigan Utility Scale Wind Farms*Appendix G
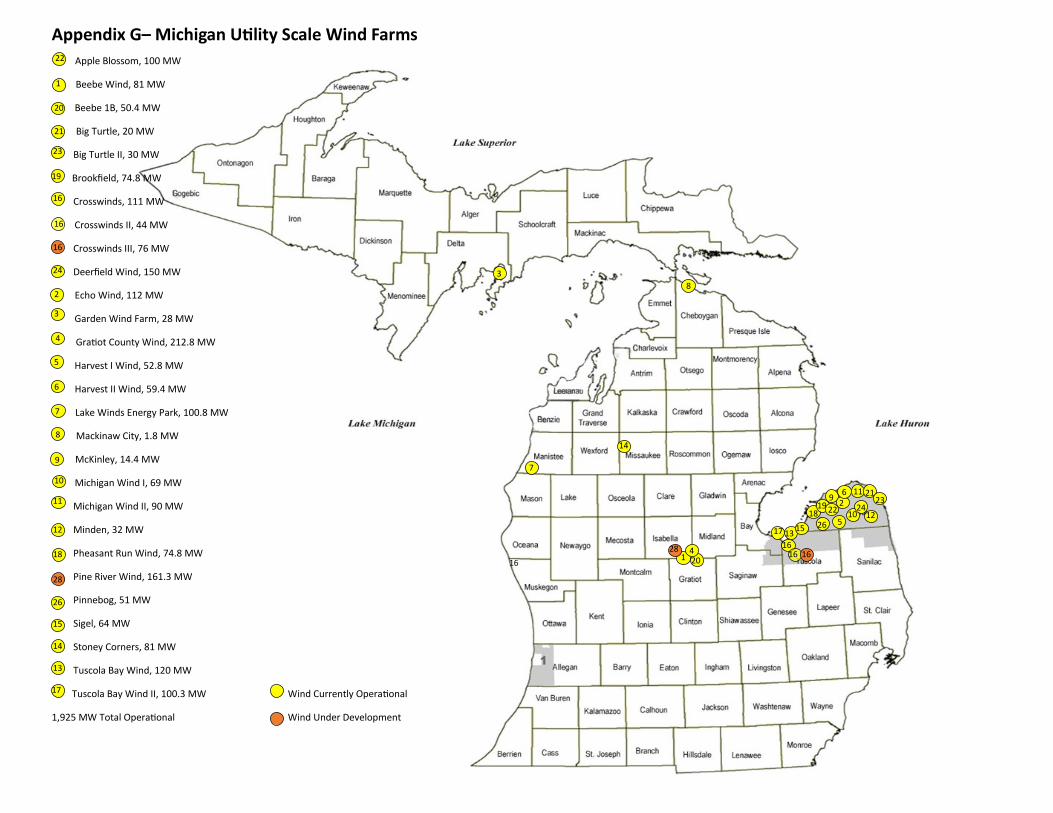
Appendix G– Michigan Utility Scale Wind Farms
Apple Blossom, 100 MW
Beebe Wind, 81 MW
Beebe 1B, 50.4 MW
Big Turtle, 20 MW
Big Turtle II, 30 MW
Brookfield, 74.8 MW
Crosswinds, 111 MW
Crosswinds II, 44 MW
Crosswinds III, 76 MW
Deerfield Wind, 150 MW
Echo Wind, 112 MW
Garden Wind Farm, 28 MW
Gratiot County Wind, 212.8 MW
Harvest I Wind, 52.8 MW
Harvest II Wind, 59.4 MW
Lake Winds Energy Park, 100.8 MW
Mackinaw City, 1.8 MW
McKinley, 14.4 MW
Michigan Wind I, 69 MW
Michigan Wind II, 90 MW
Minden, 32 MW
Pheasant Run Wind, 74.8 MW
Pine River Wind, 161.3 MW
Pinnebog, 51 MW
Sigel, 64 MW
Stoney Corners, 81 MW
Tuscola Bay Wind, 120 MW
Tuscola Bay Wind II, 100.3 MW Wind Currently Operational
1,925 MW Total Operational Wind Under Development
22
1
20
21
23
19
16
16
24
2
3
4
5
6
7
8
9
10
11
12
18
28
26
15
14
13
17
16
3
8
7
14
28 4 20 1
17 13 15
16
16 16 16
18 19
9 11 6 21
23
12 10 26 5
22 2 24


![[PPT]Chapter 18 Renewable Energy 18-1 Renewable …environmentalscienceclass.weebly.com/.../ch_18_notes.ppt · Web viewChapter 18 Renewable Energy 18-1 Renewable Energy Today Renewable](https://img.dokumen.tips/doc/110x75/5b029fb97f8b9a6a2e900bdf/pptchapter-18-renewable-energy-18-1-renewable-envir-viewchapter-18-renewable.jpg)