Embed Size (px)
Citation preview
Vodacom Group Limited Integrated report for the year ended 31 March ’13
Remuneration report
Introduction
This report explains Vodacom’s remuneration policy for non-executive directors, executive directors and prescribed officers.
The Board recommends the fees for non-executive directors to shareholders for approval at the annual general meeting (‘AGM’). The Group’s Remuneration Committee (‘RemCo’) determines the policy for remunerating executive directors on the same basis as other Group executives and prescribed officers.
We have disclosed the individual remuneration of our executive directors as well as that of prescribed officers.
In line with international best practice and emerging local practice, we have segmented this report into two sections: the first section 1 describes the remuneration policy for executive directors and prescribed officers, and the second section 2 discloses actual payments, accruals and awards for the year ended 31 March 2013. The annual non-binding advisory vote by shareholders at the AGM pertains only to section one.
performance management processes. The outcome influences the award of short- and long-term incentives.
The short-term incentive, a yearly cash bonus, is linked to achieving financial and strategic objectives. The pool available for short-term incentives is determined by financial performance against targets. The proportion paid to employees depends on their performance against the operational and strategic objectives in their performance contract. The individual is also assessed in relation to the principles of the Vodacom Way.
The principles of the Vodacom Way.
16
The long-term incentive, a yearly share allocation, encourages loyalty and helps to retain valued employees. It is designed to align executive performance to shareholders’ interests, as a significant portion of the award is subject to Company performance conditions. Participants receive dividends from the award date and the value of the shares can be realised after a three-year vesting period, to the extent that the vesting conditions have been met.
Our Shareholding Guidelines policy for executives, which requires them to build up minimum levels of personal shareholding in the Group, is explained in more detail later in this report.
Section one1Remuneration policy
We aim to attract, retain and motivate executives of the highest calibre, while at the same time aligning their remuneration with shareholder interests and best practice. We reward executives for their contribution to our strategic, operating and financial performance and ensure that remuneration is conducive to developing and retaining top talent, critical skills and intellectual capital.
We take a holistic approach to reward and our employee value proposition, balanced across the following elements:
• a guaranteed package;
• variable pay in the form of short- and long-term incentives;
• reward for performance;
• individual growth and development; and
• a stimulating work environment.
Our yearly review of director and employee remuneration is benchmarked to the market and awarded according to individual performance and potential. This is determined through our talent and
Corporate governance
Remuneration report continued
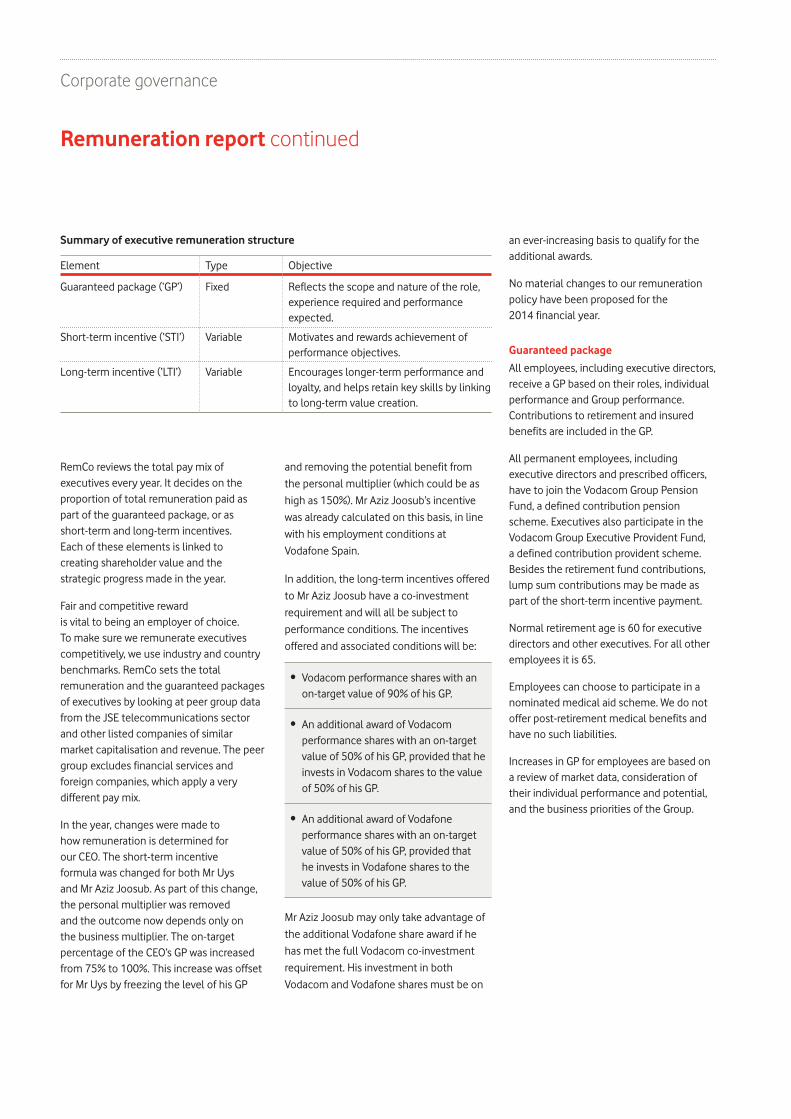
Summary of executive remuneration structure
Element Type Objective
Guaranteed package (‘GP’) Fixed Reflects the scope and nature of the role, experience required and performance expected.
Short-term incentive (‘STI’) Variable Motivates and rewards achievement of performance objectives.
Long-term incentive (‘LTI’) Variable Encourages longer-term performance and loyalty, and helps retain key skills by linking to long-term value creation.
RemCo reviews the total pay mix of executives every year. It decides on the proportion of total remuneration paid as part of the guaranteed package, or as short-term and long-term incentives. Each of these elements is linked to creating shareholder value and the strategic progress made in the year.
Fair and competitive reward is vital to being an employer of choice. To make sure we remunerate executives competitively, we use industry and country benchmarks. RemCo sets the total remuneration and the guaranteed packages of executives by looking at peer group data from the JSE telecommunications sector and other listed companies of similar market capitalisation and revenue. The peer group excludes financial services and foreign companies, which apply a very different pay mix.
In the year, changes were made to how remuneration is determined for our CEO. The short-term incentive formula was changed for both Mr Uys and Mr Aziz Joosub. As part of this change, the personal multiplier was removed and the outcome now depends only on the business multiplier. The on-target percentage of the CEO’s GP was increased from 75% to 100%. This increase was offset for Mr Uys by freezing the level of his GP
an ever-increasing basis to qualify for the additional awards.
No material changes to our remuneration policy have been proposed for the 2014 financial year.
Guaranteed package
All employees, including executive directors, receive a GP based on their roles, individual performance and Group performance. Contributions to retirement and insured benefits are included in the GP.
All permanent employees, including executive directors and prescribed officers, have to join the Vodacom Group Pension Fund, a defined contribution pension scheme. Executives also participate in the Vodacom Group Executive Provident Fund, a defined contribution provident scheme. Besides the retirement fund contributions, lump sum contributions may be made as part of the short-term incentive payment.
Normal retirement age is 60 for executive directors and other executives. For all other employees it is 65.
Employees can choose to participate in a nominated medical aid scheme. We do not offer post-retirement medical benefits and have no such liabilities.
Increases in GP for employees are based on a review of market data, consideration of their individual performance and potential, and the business priorities of the Group.
and removing the potential benefit from
the personal multiplier (which could be as
high as 150%). Mr Aziz Joosub’s incentive
was already calculated on this basis, in line
with his employment conditions at
Vodafone Spain.
In addition, the long-term incentives offered
to Mr Aziz Joosub have a co-investment
requirement and will all be subject to
performance conditions. The incentives
offered and associated conditions will be:
• Vodacom performance shares with an on-target value of 90% of his GP.
• An additional award of Vodacom performance shares with an on-target value of 50% of his GP, provided that he invests in Vodacom shares to the value of 50% of his GP.
• An additional award of Vodafone performance shares with an on-target value of 50% of his GP, provided that he invests in Vodafone shares to the value of 50% of his GP.
Mr Aziz Joosub may only take advantage of
the additional Vodafone share award if he
has met the full Vodacom co-investment
requirement. His investment in both
Vodacom and Vodafone shares must be on
Vodacom Group Limited Integrated report for the year ended 31 March ’13
Short-term incentives
All employees, including executive directors and prescribed officers, but excluding temporary staff and employees on a commission, quarterly or bi-annual bonus structure, participate in a yearly short-term incentive plan. Bonus payments are discretionary and depend on business performance and individual contribution. Payments are made in cash in June each year.
Where annual targets are achieved in full, 100% of the on-target bonus will be paid. In instances where target goals are exceeded, more than 100% of the on-target bonus is paid, but in all cases the cash bonus is capped at a percentage of the GP. Where the bonus targets are not achieved in full, a pro rata bonus is paid only if the threshold performance level has been achieved.
The on-target and bonus cap percentages are set out below:
Role On-target % Maximum %
CEO 100% 200%
Executive directors 75% 200%
Prescribed officers 50% – 60% 150% – 180%
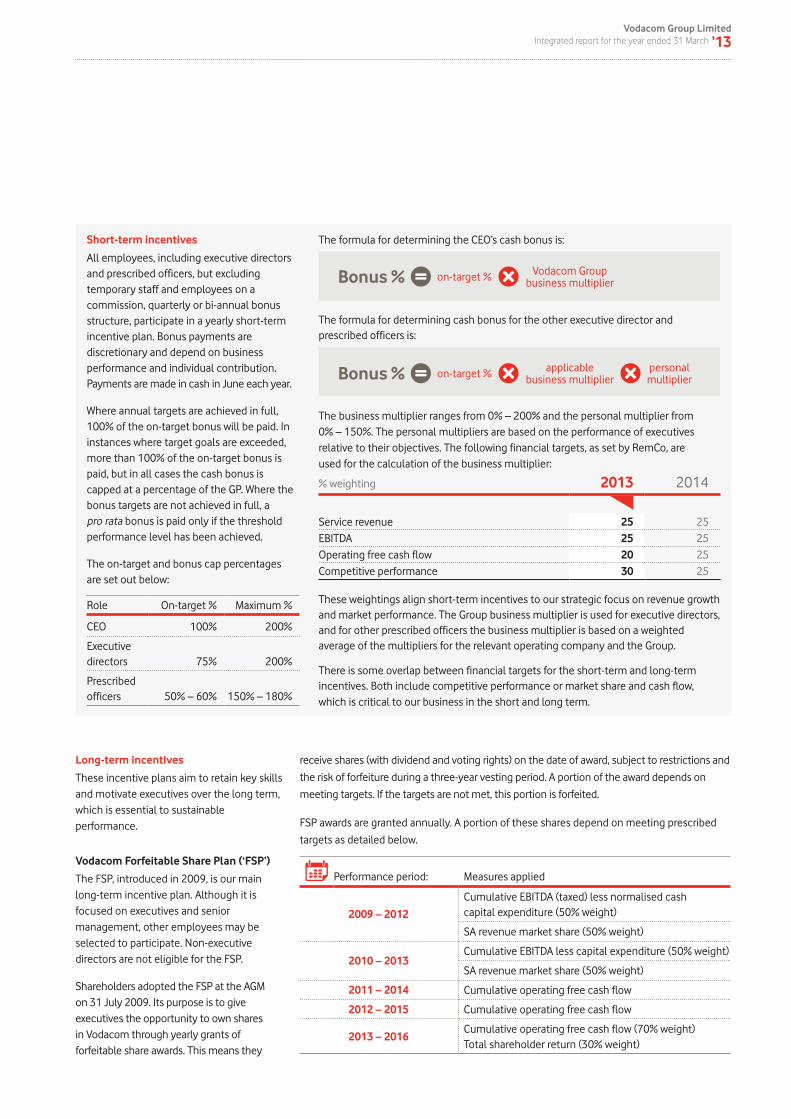
The formula for determining the CEO’s cash bonus is:
The formula for determining cash bonus for the other executive director and prescribed officers is:
The business multiplier ranges from 0% – 200% and the personal multiplier from 0% – 150%. The personal multipliers are based on the performance of executives relative to their objectives. The following financial targets, as set by RemCo, are used for the calculation of the business multiplier:
% weighting 2013 2014
Service revenue 25 25EBITDA 25 25Operating free cash flow 20 25Competitive performance 30 25
These weightings align short-term incentives to our strategic focus on revenue growth and market performance. The Group business multiplier is used for executive directors, and for other prescribed officers the business multiplier is based on a weighted average of the multipliers for the relevant operating company and the Group.
There is some overlap between financial targets for the short-term and long-term incentives. Both include competitive performance or market share and cash flow, which is critical to our business in the short and long term.
Long-term incentives
These incentive plans aim to retain key skills and motivate executives over the long term, which is essential to sustainable performance.
Vodacom Forfeitable Share Plan (‘FSP’)
The FSP, introduced in 2009, is our main long-term incentive plan. Although it is focused on executives and senior management, other employees may be selected to participate. Non-executive directors are not eligible for the FSP.
Shareholders adopted the FSP at the AGM on 31 July 2009. Its purpose is to give executives the opportunity to own shares in Vodacom through yearly grants of forfeitable share awards. This means they
receive shares (with dividend and voting rights) on the date of award, subject to restrictions and
the risk of forfeiture during a three-year vesting period. A portion of the award depends on
meeting targets. If the targets are not met, this portion is forfeited.
FSP awards are granted annually. A portion of these shares depend on meeting prescribed
targets as detailed below.
Performance period: Measures applied
2009 – 2012
Cumulative EBITDA (taxed) less normalised cash capital expenditure (50% weight)
SA revenue market share (50% weight)
2010 – 2013Cumulative EBITDA less capital expenditure (50% weight)
SA revenue market share (50% weight)
2011 – 2014 Cumulative operating free cash flow
2012 – 2015 Cumulative operating free cash flow
2013 – 2016Cumulative operating free cash flow (70% weight) Total shareholder return (30% weight)
Bonus % Vodacom Group business multiplieron-target %
Bonus % applicable business multiplier
personal multiplieron-target %
Corporate governance
Remuneration report continued
The vesting of awards with performance conditions is on a sliding scale of 20% at threshold, 60% at target, and up to 100% at maximum performance. The awards of Vodacom FSPs for the CEO are discussed under the remuneration policy heading. For the other executive director and prescribed officers, the standard expected value of FSP awards (as a percentage of GP at target level) is shown below. The standard awards may be multiplied by 0% – 200% to set an annual award, based on the performance and potential of the individual.
RoleStandard expected
value %
CEO (As described)
Executive directors 48%
Prescribed officers 33%
For the 2013 award, further conditions will be added to the current cumulative operating free cash flow measure. This additional condition will be total shareholder return (‘TSR’) compared to that of the constituents of the INDI 25 Index. The median TSR of this group will be used as the threshold and stretch performance will be set as the upper quartile TSR of the Group. The two conditions will be additive, with a weight of 70% for the operating free cash flow condition, and 30% for the relative TSR condition. RemCo considers these measures and targets to be in line with Group strategy and market conditions.
Vodafone Performance Share Plan
The CEO participates in the Vodafone Performance Share Plan. This plan has two performance conditions: free cash flow and relative TSR performance. Vesting is based on meeting these conditions after a three-year performance period.
More details of this plan can be found in the Vodafone remuneration report, available at www.vodafone.com.
Deferred bonus incentive scheme (‘the scheme’)
This legacy scheme, in use until 2009, was replaced by the FSP. No share allocations have been granted under the scheme since 1 April 2009. Unvested and unexercised allocations remain in effect and will be settled in cash by 2014.
While in operation, all permanent employees were eligible for the scheme. The allocations were subject to a three-year vesting period with a further three years in which to exercise them. The exercise price is based on the Group’s consolidated operating profit after adjusting for certain items.
The YeboYethu Employee Participation Trust (‘the trust’)
In July 2008, YeboYethu acquired 3.44% of Vodacom South Africa in our R7.5 billion BBBEE transaction. All permanent South African employees were able to participate in the trust. Some 75% of the 1.875 billion units available to the trust were allocated to employees in September 2008. The remaining 25% was set aside for future employees on a sliding scale over the next five years. The allocation is weighted 70/30 in favour of black employees. The trust’s seven-year maturity period ends in August 2015. In March 2016, the allocated units will be converted into YeboYethu shares after taking into account the notional vendor financing provided by Vodacom South Africa. We aim to then facilitate the sale of these shares to qualifying members of the South African population.
Shareholding Guidelines
The Board wishes to encourage individual shareholding in the Company by executives, as a tangible demonstration of their commitment to the Company and alignment with shareholder interests. Executives are thus required to hold the following minimum personal shareholdings:
Role Minimum holding
Executive director 1 x GP
Prescribed officers 0.5 x GP
The CEO is required to make substantial investments in Company shares to qualify for his additional co-investment share awards, as described under the remuneration policy heading, thus he is not covered by these Shareholding Guidelines.
As an incentive to exceed the minimum requirements, additional awards of FSP performance shares will be made to executives who exceed the minimum requirements over a three-year cycle. The participants will be granted a performance share for every three additional shares held. This award will be capped so that holdings of no more than double the minimum requirements will be recognised. The time period over which the executives are permitted to build up this shareholding is based on the vesting of three cycles of the annual awards under the FSP plan, so for those executives who were employed by the Group in November 2009, the applicable date is June 2014.
Executives who have a conditional benefit in terms of their previous service contract will have the option to convert a portion or all of their benefit to shares for the purpose of meeting the Shareholding Guidelines. These shares (‘Restricted Shares’) are subject to the same conditions as those of the underlying conditional benefit.
Vodacom Group Limited Integrated report for the year ended 31 March ’13
Executive contracts and policies
Executives have permanent employment contracts with six-month notice periods. This became effective from November 2009. Before this date, executives had two-year rolling contracts entitling them to one year’s guaranteed pay for every four years of service up to a maximum of 16 years on termination of employment. This benefit was subject to a 12-month notice period. The benefits accrued up to 26 November 2009 were based on the number of years of service payable on termination of employment. Apart from money market interest, no further termination benefits accrued after this date.
Non-executive directors
Our business benefits from active non-executive directors who do a lot more than attend meetings. Non-executive directors therefore receive a yearly fee for their services on the Board and committees rather than a fee for meetings attended.
The Board considered the King III recommendation that fees for non-executive directors comprise a base fee as well as an attendance fee per meeting. In light of the current non-executives’ attendance record it has been decided not to change the current policy of a set annual fee. This policy will be reviewed annually with due consideration to attendance records.
If non-executive directors are requested to leave there is no contractual compensation for loss of office. Non-executive directors do not receive short- or long-term incentives.
A sub-committee of the Nomination Committee, comprising the directors from Vodafone (who do not benefit personally from the fees), reviews directors’ fees against market benchmarks and recommends fee levels to the Board. Our memorandum of incorporation states that shareholders must approve these fees at the AGM. The current fee level was approved on 20 July 2012.
The annual fee paid to the Chairman of the Board includes all committee fees. No additional fees are paid for any special Board meetings held.
A sub-committee of the Nomination Committee reviewed non-executive director fees to make sure no one reviewed their own remuneration. A detailed benchmarking study was conducted in the year by PricewaterhouseCoopers which indicated that most Board and committee fee levels were close to the market median. However, the fees for Nomination Committee members were found to be significantly below the market median. Increases ranging from 0% to 4% are proposed for the Board and committee fees that were close to the market median, with a higher increase for the Nomination Committee to better align these fees with the market median.
Fees proposed for approval at the 2013 AGM.
101
Shareholdings
Details of the beneficial interests of directors and prescribed officers in Vodacom’s ordinary shares (excluding interests in the long-term incentive plans) are set out in the directors’ report online on vodacom.com.
Funding of share plans and dilution
Details of the shares used for the FSP and the related dilution are set out in the consolidated annual financial statements and the directors’ report, which are available on vodacom.com. All awards granted under the FSP are settled through the purchase of treasury shares or shares purchased in the market and not by newly issued shares.
Remuneration Committee
Role of RemCo
The Board is responsible for the Group’s remuneration policy and applies it with RemCo’s assistance. RemCo operates according to a charter approved by the Board in February 2009. The charter is reviewed regularly.
RemCo’s role and responsibilities are summarised below:
• determine, agree and develop the Group’s remuneration policy;
• determine and agree the remuneration packages for the CEO, CFO and any other executive director on the Board;
• ensure competitive reward to facilitate the recruitment, motivation and retention of high performance employees at all levels in support of corporate objectives and to safeguard stakeholder interests;
• review and recommend to the Board the relevant performance measures for executives;
• consider other special benefits or arrangements of a substantive financial nature;
• review promotions, transfers and termination of employment policies; and
• ensure compliance with applicable laws and codes.
The RemCo Chairman reports to the Board after each RemCo meeting and attends the AGM to take questions from shareholders on RemCo’s areas of responsibility.
External advisers
In the year, PricewaterhouseCoopers advised RemCo on remuneration matters.
Corporate governance
Remuneration report continued
Key developments
In 2013, RemCo did the following:
• reviewed developments in local and global best practice;
• approved increases and adjustments for executives and senior management, as well as all other employees;
• approved short-term incentives for executives and senior management, as well as all other employees;
• set performance conditions for long- and short-term incentives for 2014;
• approved regular annual grants of long-term incentives (including award levels and performance targets); and
• approved fee levels for non-executive directors.
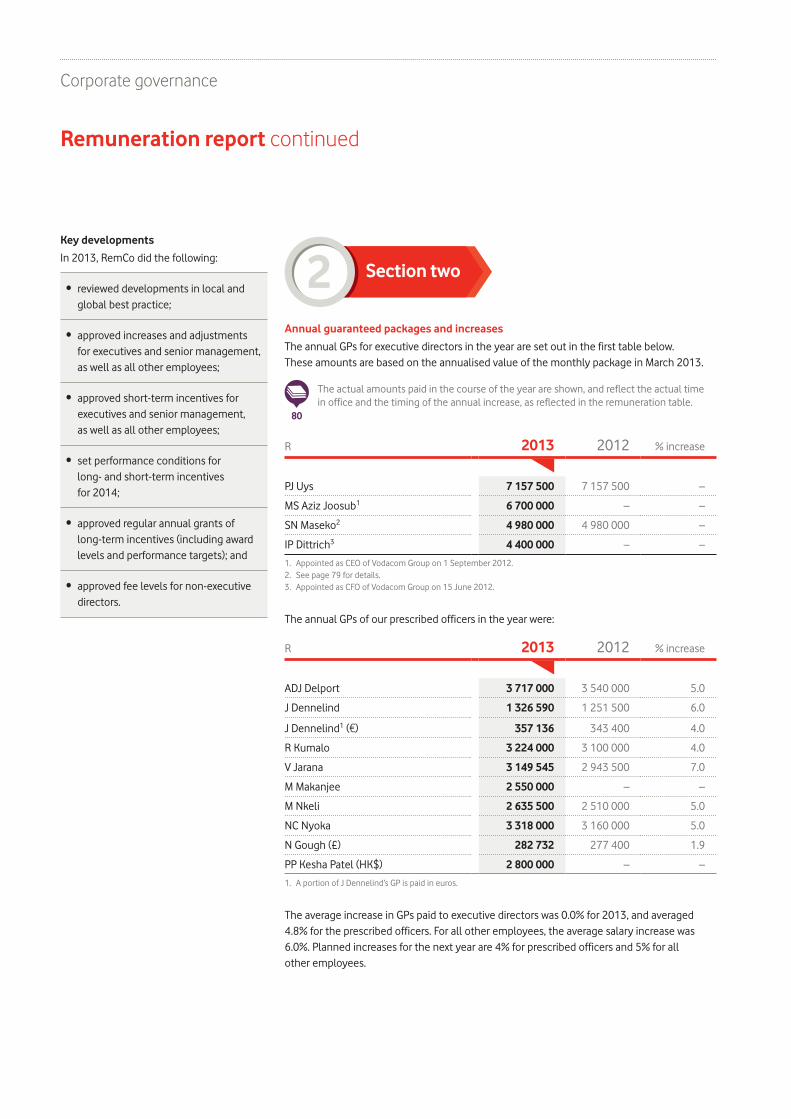
Section two2Annual guaranteed packages and increases
The annual GPs for executive directors in the year are set out in the first table below. These amounts are based on the annualised value of the monthly package in March 2013.
80
The actual amounts paid in the course of the year are shown, and reflect the actual time in office and the timing of the annual increase, as reflected in the remuneration table.
R 2013 2012 % increase
PJ Uys 7 157 500 7 157 500 –
MS Aziz Joosub1 6 700 000 – –
SN Maseko2 4 980 000 4 980 000 –
IP Dittrich3 4 400 000 – –
1. Appointed as CEO of Vodacom Group on 1 September 2012.2. See page 79 for details.3. Appointed as CFO of Vodacom Group on 15 June 2012.
The annual GPs of our prescribed officers in the year were:
R 2013 2012 % increase
ADJ Delport 3 717 000 3 540 000 5.0
J Dennelind 1 326 590 1 251 500 6.0
J Dennelind1 (e) 357 136 343 400 4.0
R Kumalo 3 224 000 3 100 000 4.0
V Jarana 3 149 545 2 943 500 7.0
M Makanjee 2 550 000 – –
M Nkeli 2 635 500 2 510 000 5.0
NC Nyoka 3 318 000 3 160 000 5.0
N Gough (£) 282 732 277 400 1.9
PP Kesha Patel (HK$) 2 800 000 – –
1. A portion of J Dennelind’s GP is paid in euros.
The average increase in GPs paid to executive directors was 0.0% for 2013, and averaged 4.8% for the prescribed officers. For all other employees, the average salary increase was 6.0%. Planned increases for the next year are 4% for prescribed officers and 5% for all other employees.
Vodacom Group Limited Integrated report for the year ended 31 March ’13
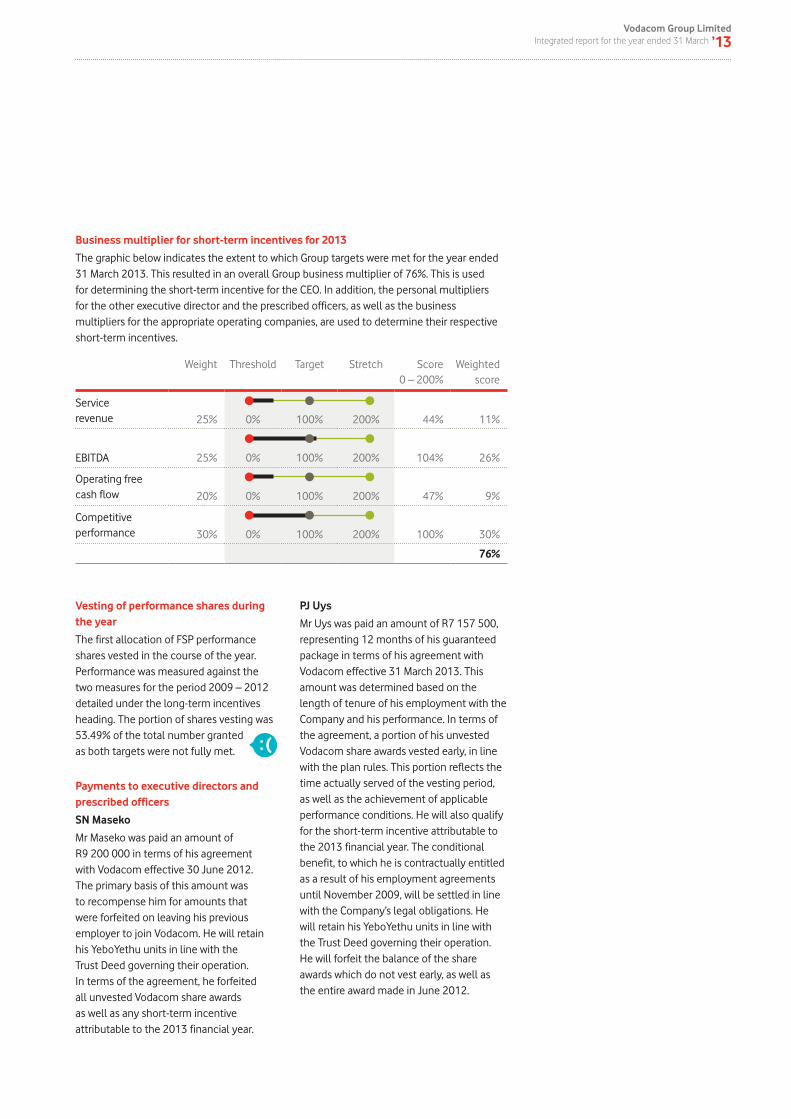
Business multiplier for short-term incentives for 2013
The graphic below indicates the extent to which Group targets were met for the year ended 31 March 2013. This resulted in an overall Group business multiplier of 76%. This is used for determining the short-term incentive for the CEO. In addition, the personal multipliers for the other executive director and the prescribed officers, as well as the business multipliers for the appropriate operating companies, are used to determine their respective short-term incentives.
Weight Threshold Target Stretch Score0 – 200%
Weightedscore
Service revenue 25% 0% 100% 200% 44% 11%
EBITDA 25% 0% 100% 200% 104% 26%
Operating free cash flow 20% 0% 100% 200% 47% 9%
Competitive performance 30% 0% 100% 200% 100% 30%
76%
Vesting of performance shares during the year
The first allocation of FSP performance shares vested in the course of the year. Performance was measured against the two measures for the period 2009 – 2012 detailed under the long-term incentives heading. The portion of shares vesting was 53.49% of the total number granted as both targets were not fully met.
Payments to executive directors and prescribed officers
SN Maseko
Mr Maseko was paid an amount of R9 200 000 in terms of his agreement with Vodacom effective 30 June 2012. The primary basis of this amount was to recompense him for amounts that were forfeited on leaving his previous employer to join Vodacom. He will retain his YeboYethu units in line with the Trust Deed governing their operation. In terms of the agreement, he forfeited all unvested Vodacom share awards as well as any short-term incentive attributable to the 2013 financial year.
PJ Uys
Mr Uys was paid an amount of R7 157 500, representing 12 months of his guaranteed package in terms of his agreement with Vodacom effective 31 March 2013. This amount was determined based on the length of tenure of his employment with the Company and his performance. In terms of the agreement, a portion of his unvested Vodacom share awards vested early, in line with the plan rules. This portion reflects the time actually served of the vesting period, as well as the achievement of applicable performance conditions. He will also qualify for the short-term incentive attributable to the 2013 financial year. The conditional benefit, to which he is contractually entitled as a result of his employment agreements until November 2009, will be settled in line with the Company’s legal obligations. He will retain his YeboYethu units in line with the Trust Deed governing their operation. He will forfeit the balance of the share awards which do not vest early, as well as the entire award made in June 2012.

Corporate governance
Remuneration report continued
Remuneration table
The remuneration of executive directors and prescribed officers is disclosed below:
Remuneration (actual and benefits1)
RGTCE Other2 Short-term
incentive3Total
2013Executive directors
MS Aziz Joosub4 3 831 026 320 267 5 125 500 9 276 793
PJ Uys5 3 147 648 7 167 549 5 457 487 15 772 684
SN Maseko5 1 021 539 9 548 585 – 10 570 124
IP Dittrich6 3 486 154 1 009 979 1 905 429 6 401 562
Prescribed officers
ADJ Delport 3 672 750 6 557 1 364 882 5 044 189
J Dennelind 1 307 818 52 619 1 586 232 2 946 669
J Dennelind (e) 353 702 – 427 035 780 737
R Kumalo 3 193 000 36 962 2 577 072 5 807 034
V Jarana 3 098 034 12 797 1 156 513 4 267 344
M Makanjee 2 125 000 786 725 858 330 3 770 055
M Nkeli 2 604 125 9 879 774 204 3 388 208
NC Nyoka 3 278 500 11 716 1 279 288 4 569 504
N Gough (£) 281 399 37 553 77 172 396 124
N Gough – 902 720 – 902 720
PP Kesha Patel (HK$) 2 100 000 129 638 1 028 160 3 257 798
PP Kesha Patel – 577 423 – 577 423
2012Executive directors
PJ Uys 7 083 750 13 218 9 426 696 16 523 664
RA Shuter7 5 045 625 855 063 6 649 517 12 550 205
SN Maseko8 2 905 000 2 701 092 2 967 378 8 573 470
Prescribed officers
J Dennelind 1 238 635 56 074 1 842 964 3 137 673
J Dennelind (e) 340 883 – 505 692 846 575
ADJ Delport 3 495 875 8 261 2 913 278 6 417 414
NC Nyoka 3 127 444 19 524 2 600 554 5 747 522
R Kumalo 3 100 000 13 534 1 785 823 4 899 357
V Jarana 2 943 500 4 800 2 422 383 5 370 683
M Nkeli 2 482 500 1 448 2 065 630 4 549 578
N Gough (£) 184 933 45 417 109 435 339 785
N Gough – 517 916 – 517 916Notes:1. This table excludes settlement of long-term incentives and benefits.2. This includes mobile phone benefit, subsistence allowance and sign-on bonuses.3. These amounts relate to the bonus payable in June, for the year ending 31 March.4. Included in ‘Other’ is a settling in allowance relating to his relocation from Spain to South Africa.5. Included in ‘Other’ is payment relating to notice period and exit benefits.6. Included in ‘Other’ is a sign-on payment.7. Included in ‘Other’ is assignment allowances relating to his secondment to the Netherlands.8. Included in ‘Other’ is a sign-on payment to compensate for bonus and shares vesting within 12 months of his previous employer which were forfeited.
Vodacom Group Limited Integrated report for the year ended 31 March ’13
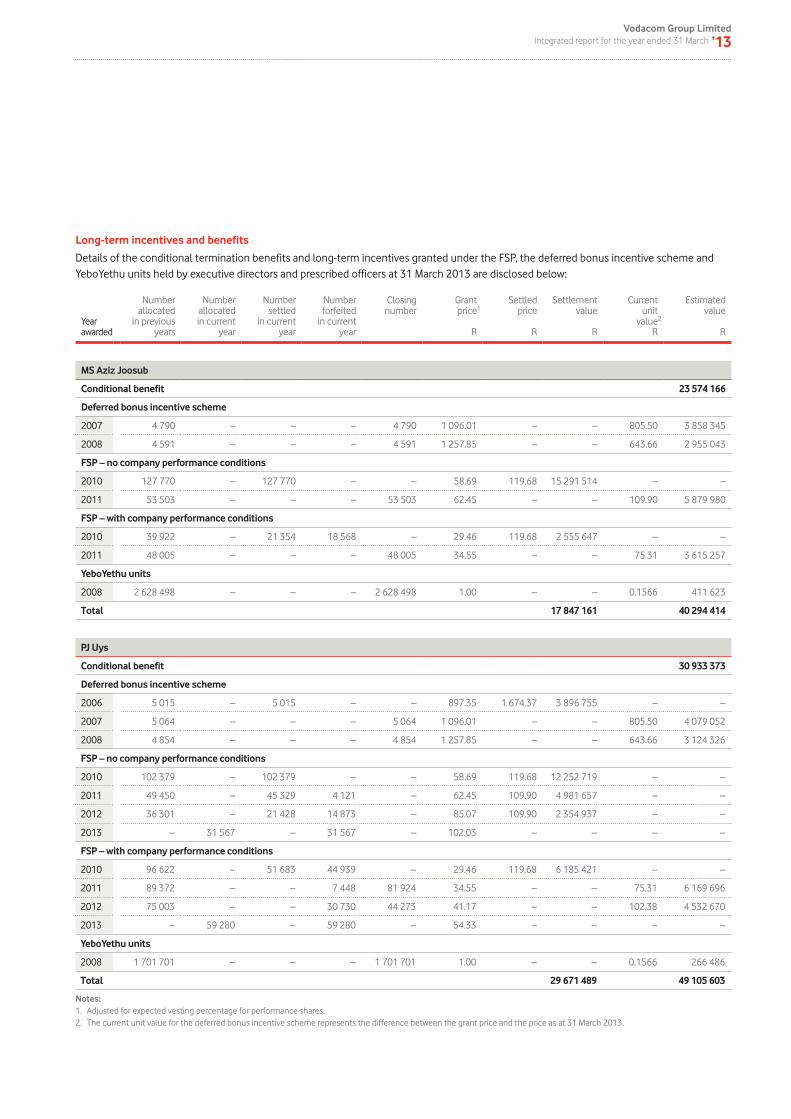
Long-term incentives and benefits
Details of the conditional termination benefits and long-term incentives granted under the FSP, the deferred bonus incentive scheme and YeboYethu units held by executive directors and prescribed officers at 31 March 2013 are disclosed below:
Yearawarded
Number allocated
in previousyears
Number allocated in current
year
Numbersettled
in current year
Numberforfeited
in currentyear
Closingnumber
Grantprice1
R
Settledprice
R
Settlementvalue
R
Currentunit
value2 R
Estimatedvalue
R
MS Aziz Joosub
Conditional benefit 23 574 166
Deferred bonus incentive scheme
2007 4 790 – – – 4 790 1 096.01 – – 805.50 3 858 345
2008 4 591 – – – 4 591 1 257.85 – – 643.66 2 955 043
FSP – no company performance conditions
2010 127 770 – 127 770 – – 58.69 119.68 15 291 514 – –
2011 53 503 – – – 53 503 62.45 – – 109.90 5 879 980
FSP – with company performance conditions
2010 39 922 – 21 354 18 568 – 29.46 119.68 2 555 647 – –
2011 48 005 – – – 48 005 34.55 – – 75.31 3 615 257
YeboYethu units
2008 2 628 498 – – – 2 628 498 1.00 – – 0.1566 411 623
Total 17 847 161 40 294 414
PJ Uys
Conditional benefit 30 933 373
Deferred bonus incentive scheme
2006 5 015 – 5 015 – – 897.35 1 674.37 3 896 755 – –
2007 5 064 – – – 5 064 1 096.01 – – 805.50 4 079 052
2008 4 854 – – – 4 854 1 257.85 – – 643.66 3 124 326
FSP – no company performance conditions
2010 102 379 – 102 379 – – 58.69 119.68 12 252 719 – –
2011 49 450 – 45 329 4 121 – 62.45 109.90 4 981 657 – –
2012 36 301 – 21 428 14 873 – 85.07 109.90 2 354 937 – –
2013 – 31 567 – 31 567 – 102.03 – – – –
FSP – with company performance conditions
2010 96 622 – 51 683 44 939 – 29.46 119.68 6 185 421 – –
2011 89 372 – – 7 448 81 924 34.55 – – 75.31 6 169 696
2012 75 003 – – 30 730 44 273 41.17 – – 102.38 4 532 670
2013 – 59 280 – 59 280 – 54.33 – – – –
YeboYethu units
2008 1 701 701 – – – 1 701 701 1.00 – – 0.1566 266 486
Total 29 671 489 49 105 603
Notes:1. Adjusted for expected vesting percentage for performance shares.2. The current unit value for the deferred bonus incentive scheme represents the difference between the grant price and the price as at 31 March 2013.
Corporate governance
Remuneration report continued
Yearawarded
Number allocated
in previousyears
Number allocated in current
year
Numbersettled
in current year
Numberforfeited
in currentyear
Closingnumber
Grantprice1
R
Settledprice
R
Settlementvalue
R
Currentunit
value2 R
Estimatedvalue
R
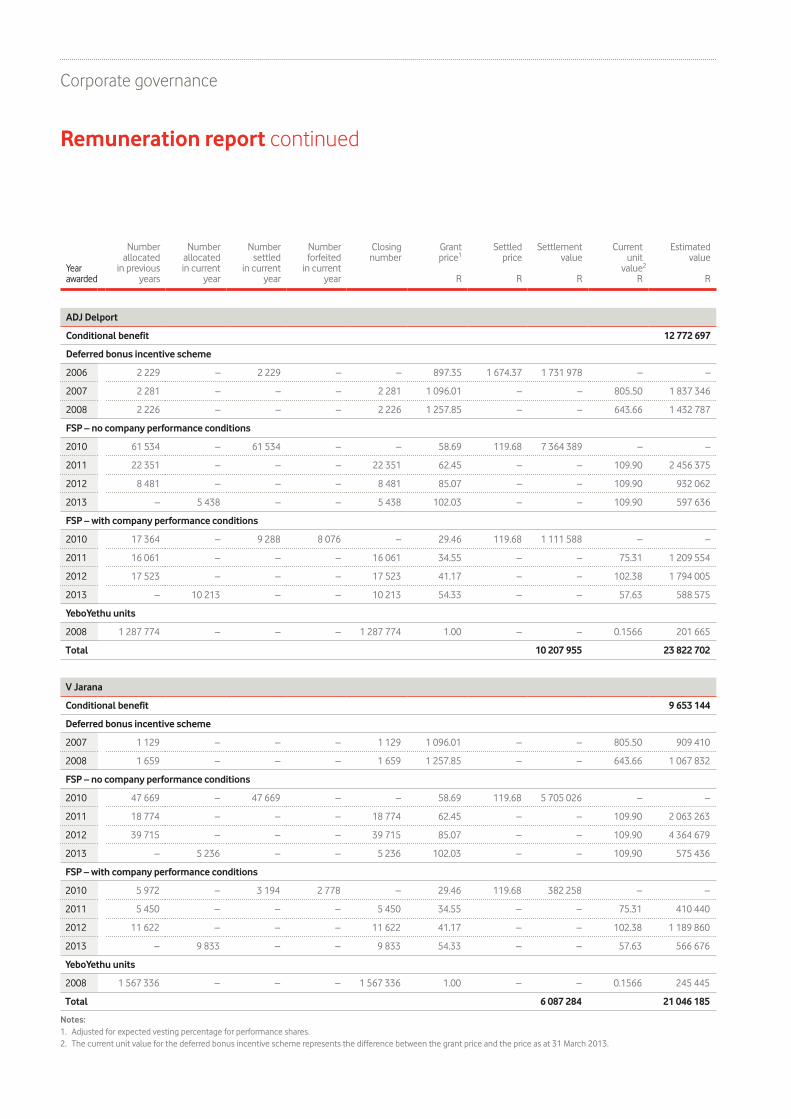
ADJ Delport
Conditional benefit 12 772 697
Deferred bonus incentive scheme
2006 2 229 – 2 229 – – 897.35 1 674.37 1 731 978 – –
2007 2 281 – – – 2 281 1 096.01 – – 805.50 1 837 346
2008 2 226 – – – 2 226 1 257.85 – – 643.66 1 432 787
FSP – no company performance conditions
2010 61 534 – 61 534 – – 58.69 119.68 7 364 389 – –
2011 22 351 – – – 22 351 62.45 – – 109.90 2 456 375
2012 8 481 – – – 8 481 85.07 – – 109.90 932 062
2013 – 5 438 – – 5 438 102.03 – – 109.90 597 636
FSP – with company performance conditions
2010 17 364 – 9 288 8 076 – 29.46 119.68 1 111 588 – –
2011 16 061 – – – 16 061 34.55 – – 75.31 1 209 554
2012 17 523 – – – 17 523 41.17 – – 102.38 1 794 005
2013 – 10 213 – – 10 213 54.33 – – 57.63 588 575
YeboYethu units
2008 1 287 774 – – – 1 287 774 1.00 – – 0.1566 201 665
Total 10 207 955 23 822 702
V Jarana
Conditional benefit 9 653 144
Deferred bonus incentive scheme
2007 1 129 – – – 1 129 1 096.01 – – 805.50 909 410
2008 1 659 – – – 1 659 1 257.85 – – 643.66 1 067 832
FSP – no company performance conditions
2010 47 669 – 47 669 – – 58.69 119.68 5 705 026 – –
2011 18 774 – – – 18 774 62.45 – – 109.90 2 063 263
2012 39 715 – – – 39 715 85.07 – – 109.90 4 364 679
2013 – 5 236 – – 5 236 102.03 – – 109.90 575 436
FSP – with company performance conditions
2010 5 972 – 3 194 2 778 – 29.46 119.68 382 258 – –
2011 5 450 – – – 5 450 34.55 – – 75.31 410 440
2012 11 622 – – – 11 622 41.17 – – 102.38 1 189 860
2013 – 9 833 – – 9 833 54.33 – – 57.63 566 676
YeboYethu units
2008 1 567 336 – – – 1 567 336 1.00 – – 0.1566 245 445
Total 6 087 284 21 046 185
Notes:1. Adjusted for expected vesting percentage for performance shares.2. The current unit value for the deferred bonus incentive scheme represents the difference between the grant price and the price as at 31 March 2013.
Vodacom Group Limited Integrated report for the year ended 31 March ’13
Yearawarded
Number allocated
in previousyears
Number allocated in current
year
Numbersettled
in current year
Numberforfeited
in currentyear
Closingnumber
Grantprice1
R
Settledprice
R
Settlementvalue
R
Currentunit
value2 R
Estimatedvalue
R
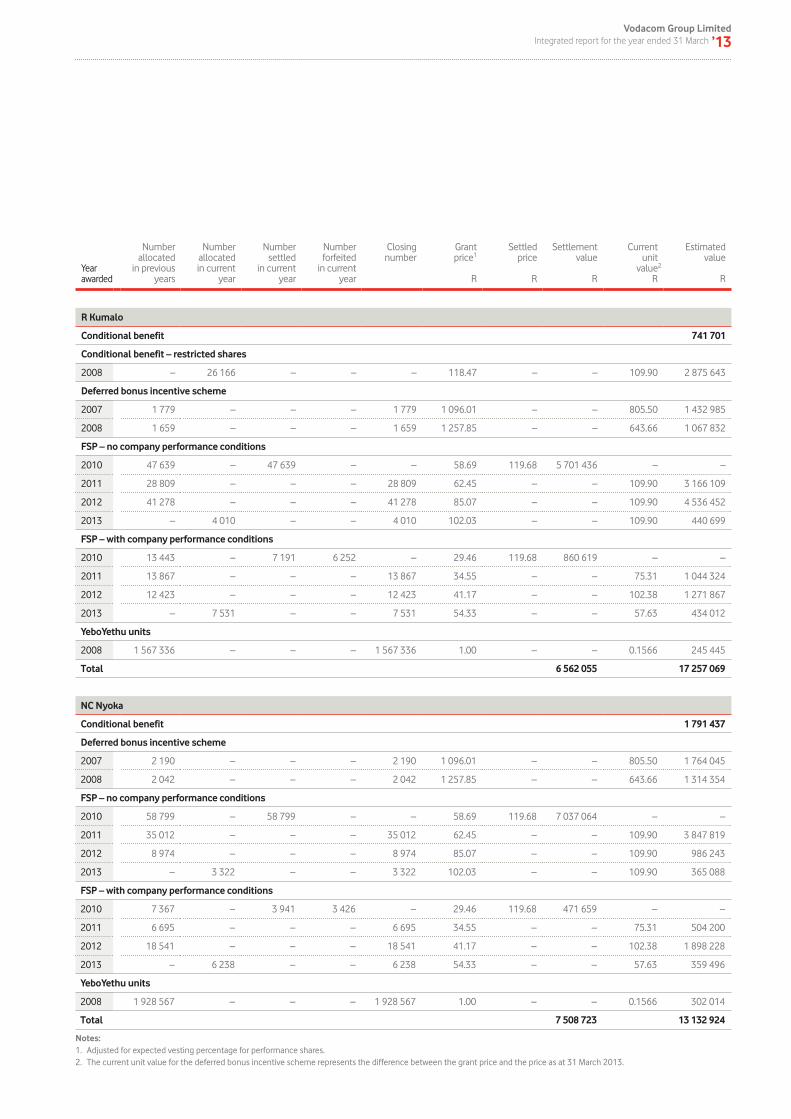
R Kumalo
Conditional benefit 741 701
Conditional benefit – restricted shares
2008 – 26 166 – – – 118.47 – – 109.90 2 875 643
Deferred bonus incentive scheme
2007 1 779 – – – 1 779 1 096.01 – – 805.50 1 432 985
2008 1 659 – – – 1 659 1 257.85 – – 643.66 1 067 832
FSP – no company performance conditions
2010 47 639 – 47 639 – – 58.69 119.68 5 701 436 – –
2011 28 809 – – – 28 809 62.45 – – 109.90 3 166 109
2012 41 278 – – – 41 278 85.07 – – 109.90 4 536 452
2013 – 4 010 – – 4 010 102.03 – – 109.90 440 699
FSP – with company performance conditions
2010 13 443 – 7 191 6 252 – 29.46 119.68 860 619 – –
2011 13 867 – – – 13 867 34.55 – – 75.31 1 044 324
2012 12 423 – – – 12 423 41.17 – – 102.38 1 271 867
2013 – 7 531 – – 7 531 54.33 – – 57.63 434 012
YeboYethu units
2008 1 567 336 – – – 1 567 336 1.00 – – 0.1566 245 445
Total 6 562 055 17 257 069
NC Nyoka
Conditional benefit 1 791 437
Deferred bonus incentive scheme
2007 2 190 – – – 2 190 1 096.01 – – 805.50 1 764 045
2008 2 042 – – – 2 042 1 257.85 – – 643.66 1 314 354
FSP – no company performance conditions
2010 58 799 – 58 799 – – 58.69 119.68 7 037 064 – –
2011 35 012 – – – 35 012 62.45 – – 109.90 3 847 819
2012 8 974 – – – 8 974 85.07 – – 109.90 986 243
2013 – 3 322 – – 3 322 102.03 – – 109.90 365 088
FSP – with company performance conditions
2010 7 367 – 3 941 3 426 – 29.46 119.68 471 659 – –
2011 6 695 – – – 6 695 34.55 – – 75.31 504 200
2012 18 541 – – – 18 541 41.17 – – 102.38 1 898 228
2013 – 6 238 – – 6 238 54.33 – – 57.63 359 496
YeboYethu units
2008 1 928 567 – – – 1 928 567 1.00 – – 0.1566 302 014
Total 7 508 723 13 132 924
Notes:1. Adjusted for expected vesting percentage for performance shares.2. The current unit value for the deferred bonus incentive scheme represents the difference between the grant price and the price as at 31 March 2013.
Corporate governance
Remuneration report continued
Yearawarded
Number allocated
in previousyears
Number allocated in current
year
Numbersettled
in current year
Numberforfeited
in currentyear
Closingnumber
Grantprice1
R
Settledprice
R
Settlementvalue
R
Currentunit
value R
Estimatedvalue
R
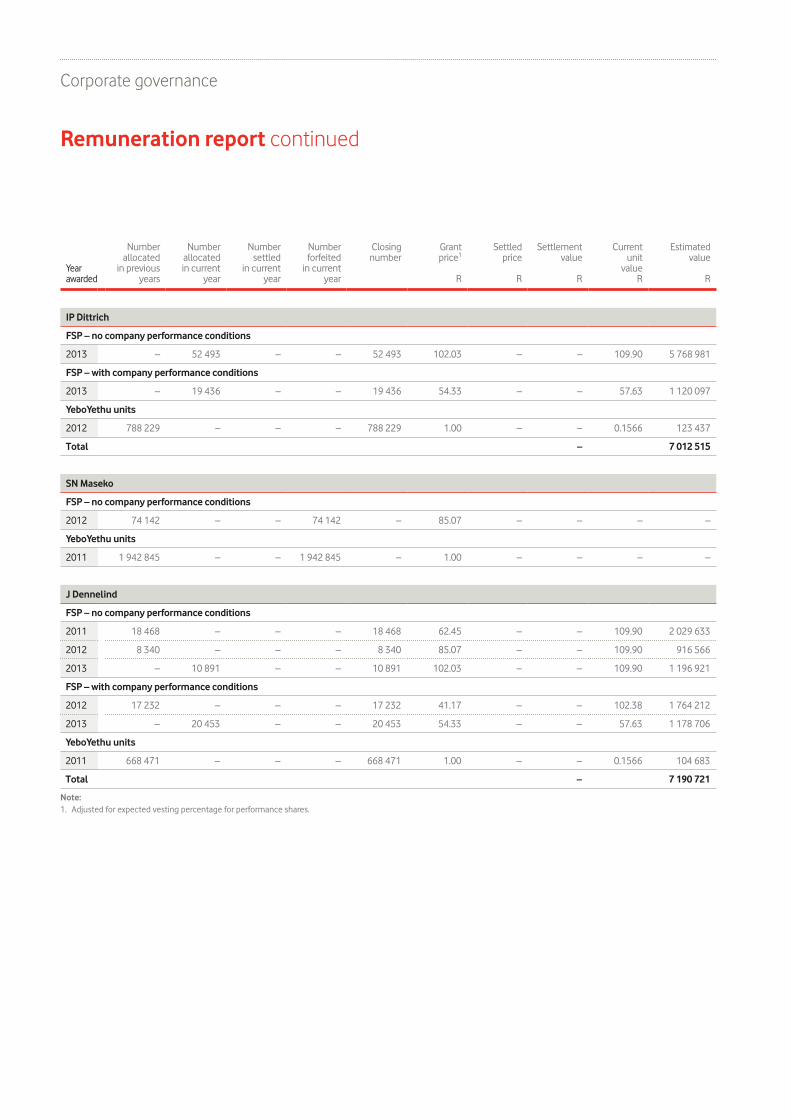
IP Dittrich
FSP – no company performance conditions
2013 – 52 493 – – 52 493 102.03 – – 109.90 5 768 981
FSP – with company performance conditions
2013 – 19 436 – – 19 436 54.33 – – 57.63 1 120 097
YeboYethu units
2012 788 229 – – – 788 229 1.00 – – 0.1566 123 437
Total – 7 012 515
SN Maseko
FSP – no company performance conditions
2012 74 142 – – 74 142 – 85.07 – – – –
YeboYethu units
2011 1 942 845 – – 1 942 845 – 1.00 – – – –
J Dennelind
FSP – no company performance conditions
2011 18 468 – – – 18 468 62.45 – – 109.90 2 029 633
2012 8 340 – – – 8 340 85.07 – – 109.90 916 566
2013 – 10 891 – – 10 891 102.03 – – 109.90 1 196 921
FSP – with company performance conditions
2012 17 232 – – – 17 232 41.17 – – 102.38 1 764 212
2013 – 20 453 – – 20 453 54.33 – – 57.63 1 178 706
YeboYethu units
2011 668 471 – – – 668 471 1.00 – – 0.1566 104 683
Total – 7 190 721
Note:1. Adjusted for expected vesting percentage for performance shares.
Vodacom Group Limited Integrated report for the year ended 31 March ’13
Yearawarded
Number allocated
in previousyears
Number allocated in current
year
Numbersettled
in current year
Numberforfeited
in currentyear
Closingnumber
Grantprice1
R
Settledprice
R
Settlementvalue
R
Currentunit
value R
Estimatedvalue
R
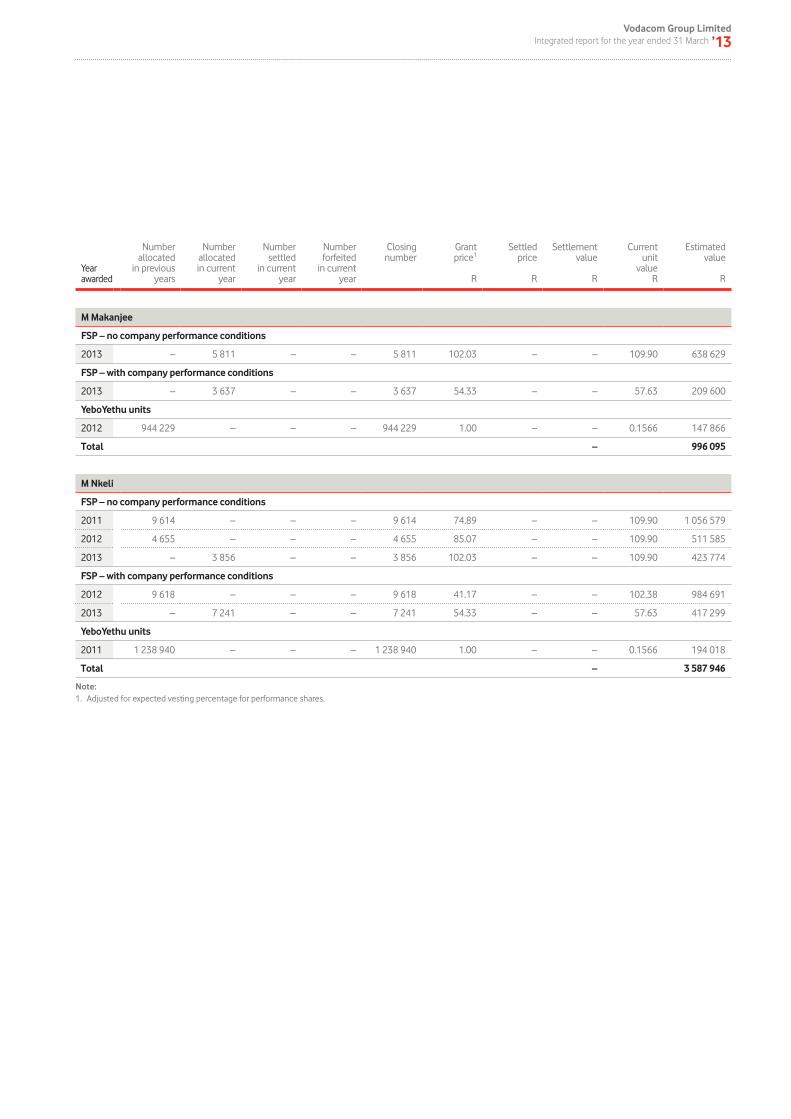
M Makanjee
FSP – no company performance conditions
2013 – 5 811 – – 5 811 102.03 – – 109.90 638 629
FSP – with company performance conditions
2013 – 3 637 – – 3 637 54.33 – – 57.63 209 600
YeboYethu units
2012 944 229 – – – 944 229 1.00 – – 0.1566 147 866
Total – 996 095
M Nkeli
FSP – no company performance conditions
2011 9 614 – – – 9 614 74.89 – – 109.90 1 056 579
2012 4 655 – – – 4 655 85.07 – – 109.90 511 585
2013 – 3 856 – – 3 856 102.03 – – 109.90 423 774
FSP – with company performance conditions
2012 9 618 – – – 9 618 41.17 – – 102.38 984 691
2013 – 7 241 – – 7 241 54.33 – – 57.63 417 299
YeboYethu units
2011 1 238 940 – – – 1 238 940 1.00 – – 0.1566 194 018
Total – 3 587 946
Note:1. Adjusted for expected vesting percentage for performance shares.
Corporate governance
Remuneration report continued
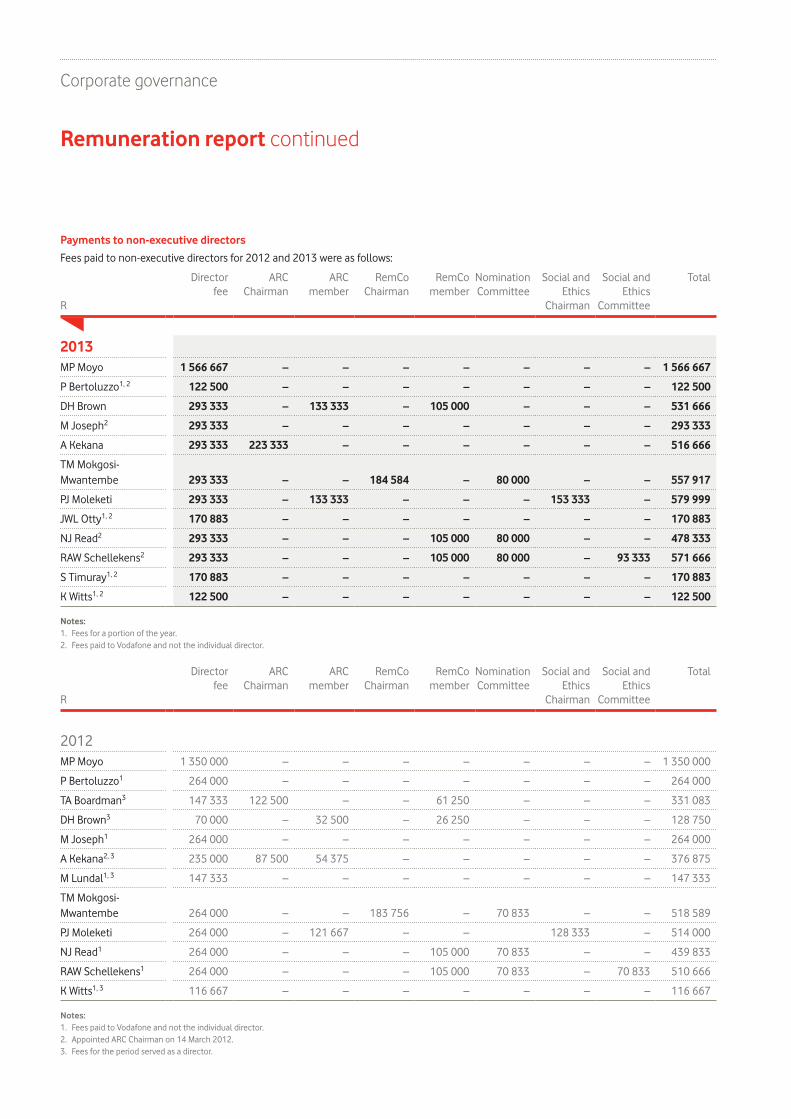
Payments to non-executive directors
Fees paid to non-executive directors for 2012 and 2013 were as follows:
R
Directorfee
ARCChairman
ARCmember
RemCoChairman
RemComember
NominationCommittee
Social andEthics
Chairman
Social andEthics
Committee
Total
2013MP Moyo 1 566 667 – – – – – – – 1 566 667
P Bertoluzzo1, 2 122 500 – – – – – – – 122 500
DH Brown 293 333 – 133 333 – 105 000 – – – 531 666
M Joseph2 293 333 – – – – – – – 293 333
A Kekana 293 333 223 333 – – – – – – 516 666
TM Mokgosi-Mwantembe 293 333 – – 184 584 – 80 000 – – 557 917
PJ Moleketi 293 333 – 133 333 – – – 153 333 – 579 999
JWL Otty1, 2 170 883 – – – – – – – 170 883
NJ Read2 293 333 – – – 105 000 80 000 – – 478 333
RAW Schellekens2 293 333 – – – 105 000 80 000 – 93 333 571 666
S Timuray1, 2 170 883 – – – – – – – 170 883
K Witts1, 2 122 500 – – – – – – – 122 500
Notes:1. Fees for a portion of the year.2. Fees paid to Vodafone and not the individual director.
R
Directorfee
ARCChairman
ARCmember
RemCoChairman
RemComember
NominationCommittee
Social andEthics
Chairman
Social andEthics
Committee
Total
2012MP Moyo 1 350 000 – – – – – – – 1 350 000
P Bertoluzzo1 264 000 – – – – – – – 264 000
TA Boardman3 147 333 122 500 – – 61 250 – – – 331 083
DH Brown3 70 000 – 32 500 – 26 250 – – – 128 750
M Joseph1 264 000 – – – – – – – 264 000
A Kekana2, 3 235 000 87 500 54 375 – – – – – 376 875
M Lundal1, 3 147 333 – – – – – – – 147 333
TM Mokgosi-Mwantembe 264 000 – – 183 756 – 70 833 – – 518 589
PJ Moleketi 264 000 – 121 667 – – 128 333 – 514 000
NJ Read1 264 000 – – – 105 000 70 833 – – 439 833
RAW Schellekens1 264 000 – – – 105 000 70 833 – 70 833 510 666
K Witts1, 3 116 667 – – – – – – – 116 667
Notes:1. Fees paid to Vodafone and not the individual director.2. Appointed ARC Chairman on 14 March 2012.3. Fees for the period served as a director.