Embed Size (px)
Citation preview
Reliability Pricing Model (RPM) Overview
Andrew Ott
PJM
Senior Vice President, Markets
2©2008 PJM
Reliability Pricing Model (RPM)
Methods to satisfy capacity obligation within PJM
1. Self Supply or Bilateral Contract– Self schedule supply into RPM– Unit-specific bilateral contract
2. RPM Auction – Residual auction– Accommodates flexible self-supply
3. Alternative Capacity Plan – utilities submit long term supply plan (5 years) with
specified self-supply or long-term contracts
3©2008 PJM
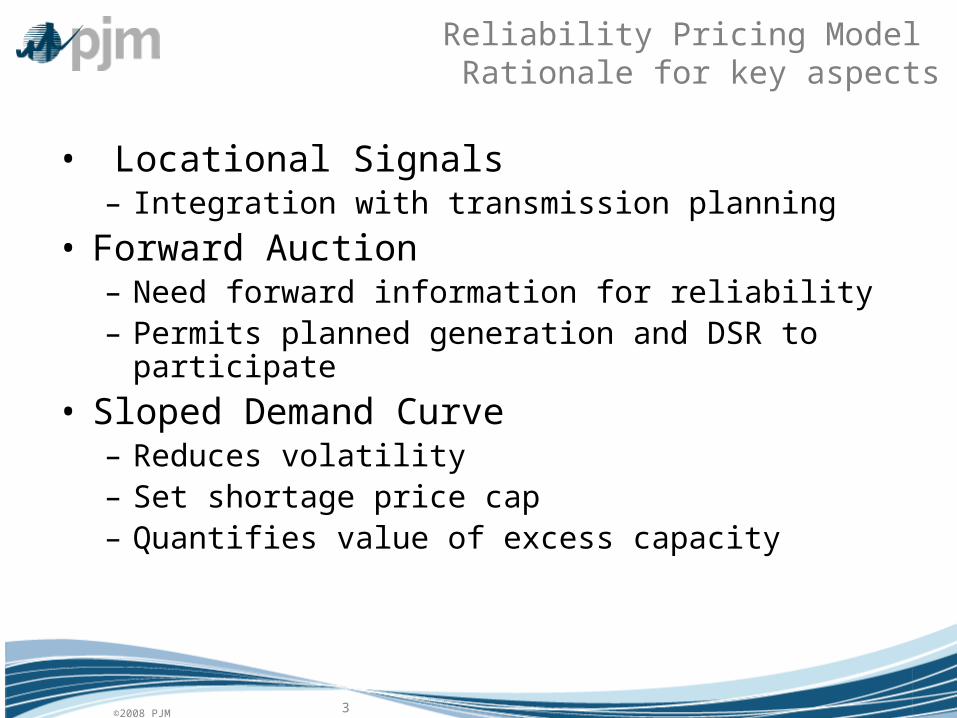
Reliability Pricing Model Rationale for key aspects
• Locational Signals– Integration with transmission planning
• Forward Auction– Need forward information for reliability– Permits planned generation and DSR to participate
• Sloped Demand Curve– Reduces volatility – Set shortage price cap– Quantifies value of excess capacity
4©2008 PJM
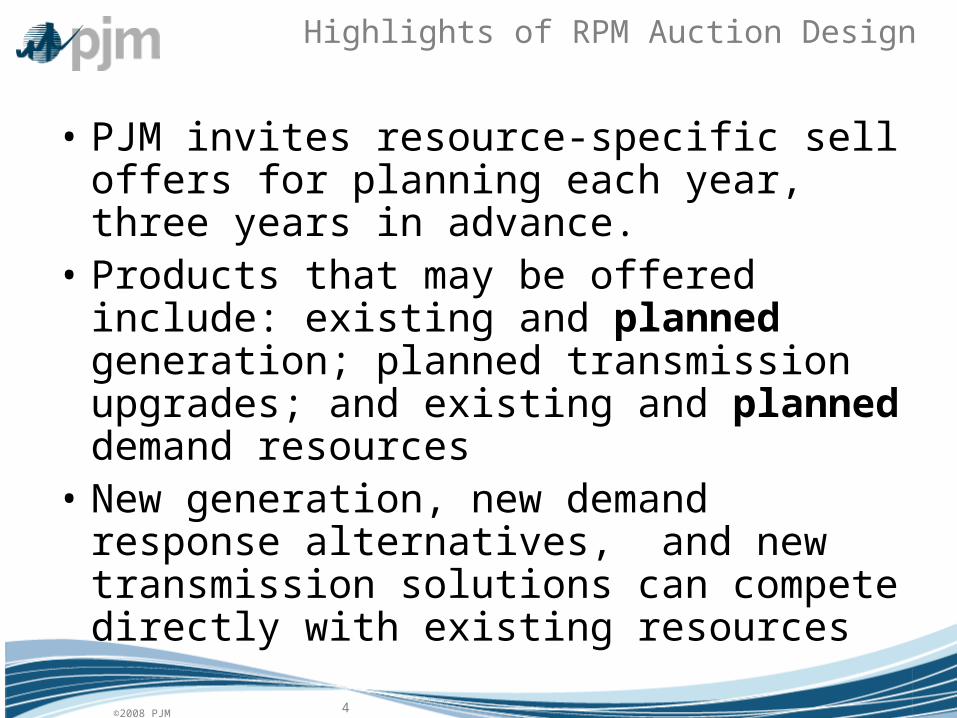
Highlights of RPM Auction Design
• PJM invites resource-specific sell offers for planning each year, three years in advance.
• Products that may be offered include: existing and planned generation; planned transmission upgrades; and existing and planned demand resources
• New generation, new demand response alternatives, and new transmission solutions can compete directly with existing resources
5©2008 PJM
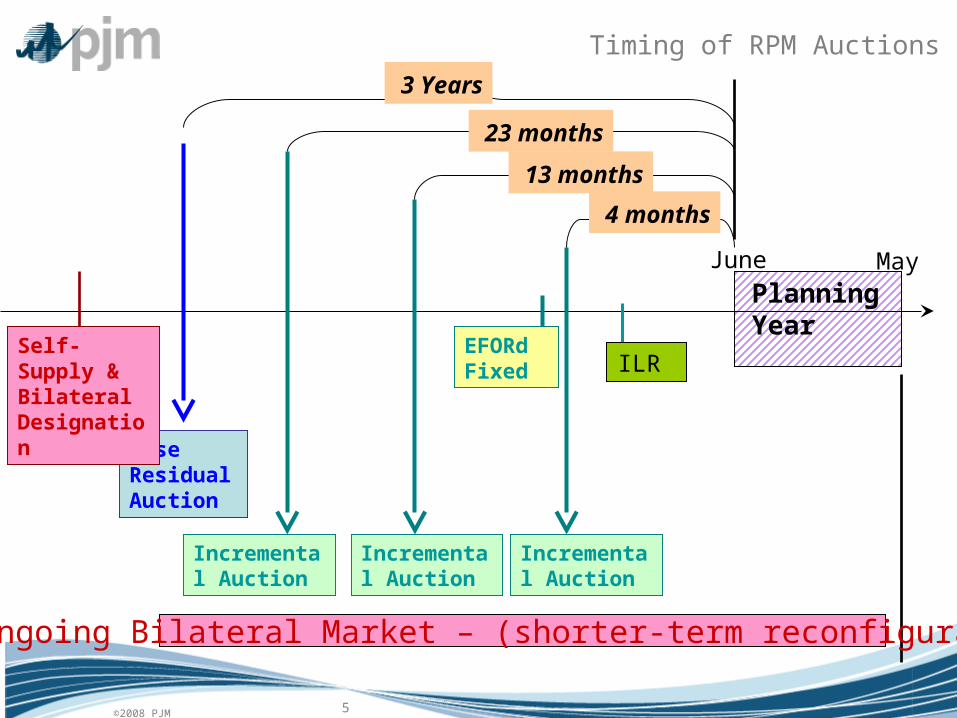
Timing of RPM Auctions
Base Residual Auction
Planning Year
3 Years
Incremental Auction
Incremental Auction
June May
4 months
13 months
Incremental Auction
23 months
EFORd Fixed
Self- Supply & Bilateral Designation
Ongoing Bilateral Market – (shorter-term reconfiguration)
ILR
RPM Auction Results

7©2008 PJM
RPM Results – Capacity Prices
RPM Base Residual Auction Resource Clearing Prices (RCP)
40.8
174.29
110.00
174.29
210.11
237.33
174.29
102.04111.92
191.32
148.80
197.67
188.54
0
50
100
150
200
250
2007/2008 2008/2009 2009/2010 2010/2011 2011/2012
Delivery Year
$/M
W-D
ay
RTO RCP
EMAAC RCP
SWMAAC RCP
8©2008 PJM
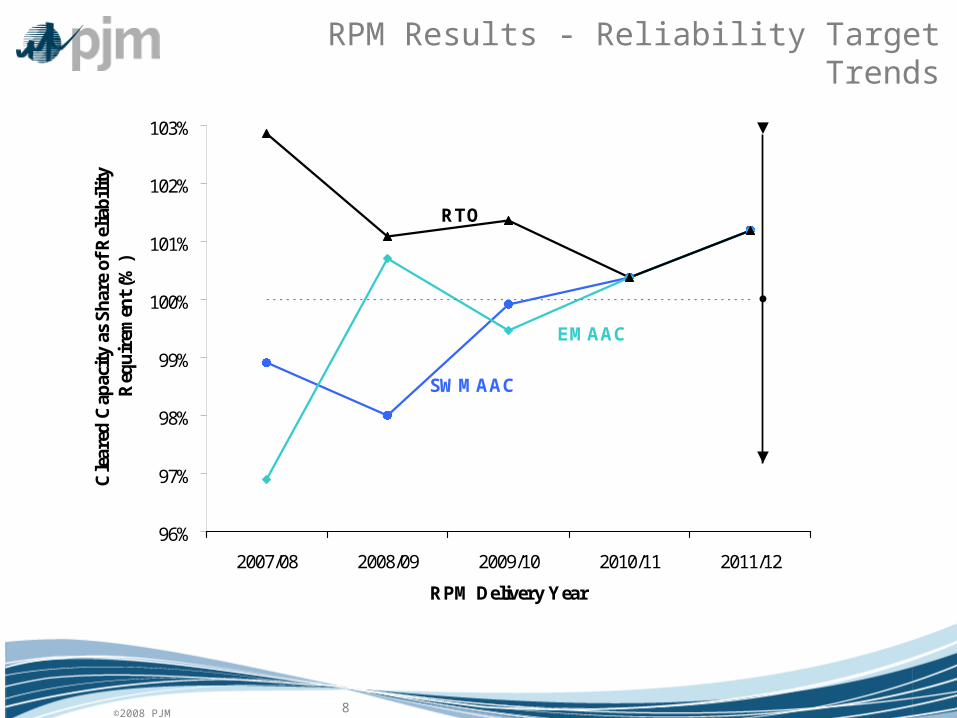
RPM Results - Reliability Target Trends
SWMAAC
EMAAC
RTO
96%
97%
98%
99%
100%
101%
102%
103%
2007/08 2008/09 2009/10 2010/11 2011/12
RPM Delivery Year
Cle
ared
Cap
acit
y as
Sh
are
of R
elia
bil
ity
Req
uir
emen
t (%
)
Source: Brattle analysis of PJM data.
Capacity in Excess of Reliability Target
Capacity Less Than Reliability Target
9©2008 PJM
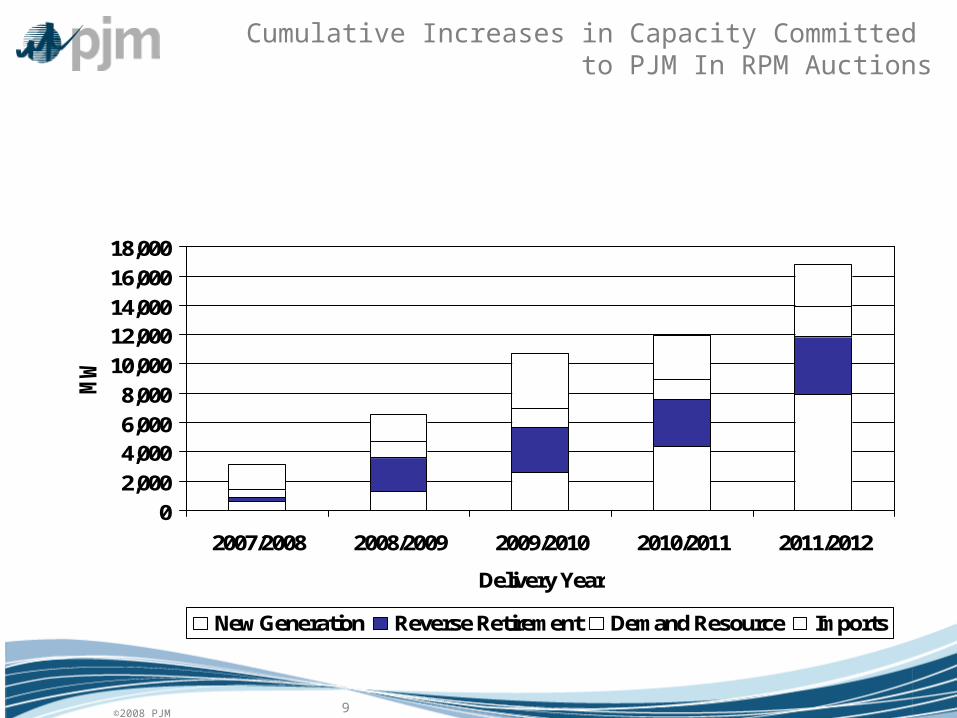
Cumulative Increases in Capacity Committed to PJM In RPM Auctions
0
2,000
4,0006,000
8,000
10,000
12,00014,000
16,000
18,000
2007/2008 2008/2009 2009/2010 2010/2011 2011/2012
Delivery Year
MW
New Generation Reverse Retirement Demand Resource Imports

10©2008 PJM
Demand Response in Capacity Market
0
1000
2000
3000
4000
5000
6000
2005/2006 2006/2007 2007/2008 2008/2009 2009/2010 2010/2011 2011/2012
Delivery Year
MW
Auto. Load Management RPM, Interruptable Load RPM, Demand Resource
RPM Implemented
11©2008 PJM
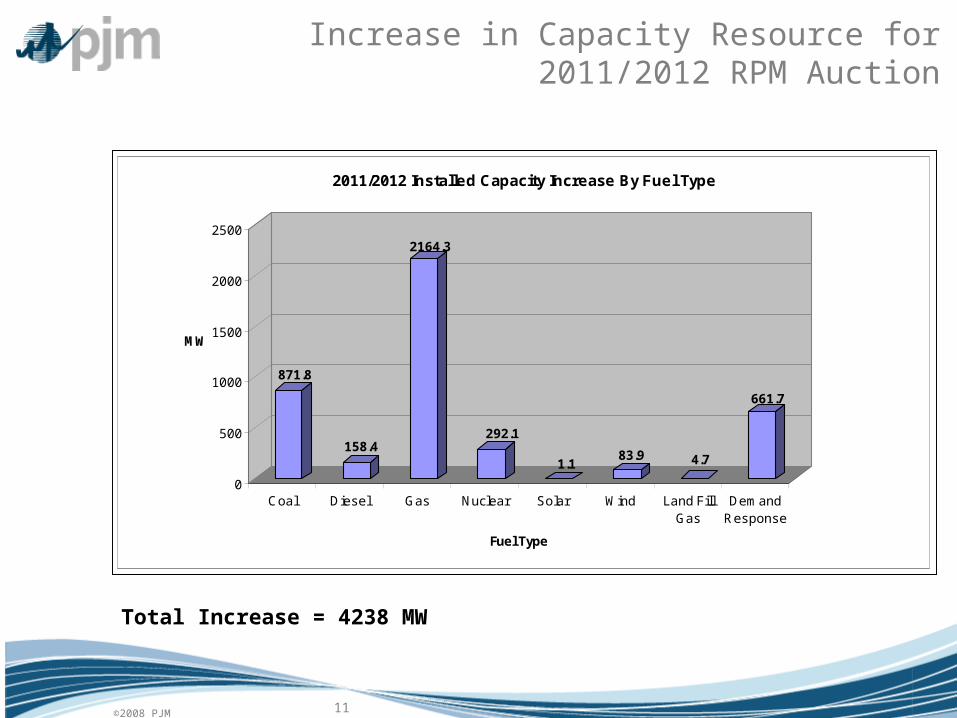
Increase in Capacity Resource for 2011/2012 RPM Auction
871.8
158.4
2164.3
292.1
1.183.9 4.7
661.7
0
500
1000
1500
2000
2500
MW
Coal Diesel Gas Nuclear Solar Wind Land FillGas
DemandResponse
Fuel Type
2011/2012 Installed Capacity Increase By Fuel Type
Total Increase = 4238 MW
12©2008 PJM
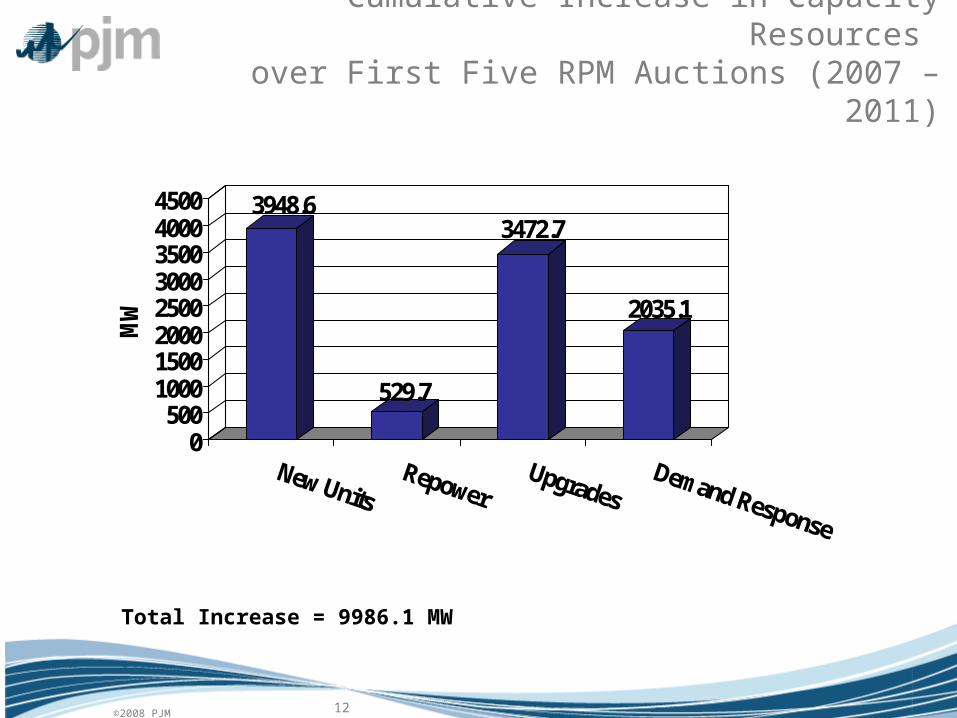
Cumulative Increase in Capacity Resources over First Five RPM Auctions (2007 – 2011)
3948.6
529.7
3472.7
2035.1
0500
10001500200025003000350040004500
MW
New UnitsRepower
UpgradesDemand Response
Total Increase = 9986.1 MW
13©2008 PJM
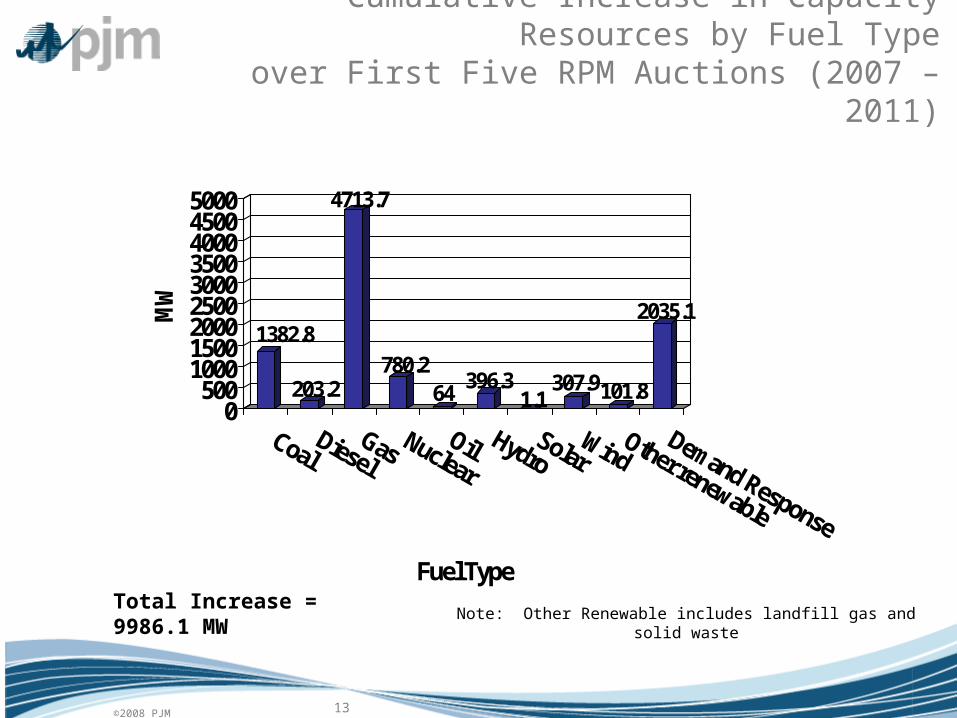
Cumulative Increase in Capacity Resources by Fuel Typeover First Five RPM Auctions (2007 – 2011)
1382.8
203.2
4713.7
780.264
396.31.1
307.9101.8
2035.1
0500
100015002000250030003500400045005000
MW
CoalDiesel
Gas NuclearOil Hydro
SolarWind
Other renewable
Demand Response
Fuel Type
Total Increase = 9986.1 MWNote: Other Renewable includes landfill gas and solid waste
14©2008 PJM
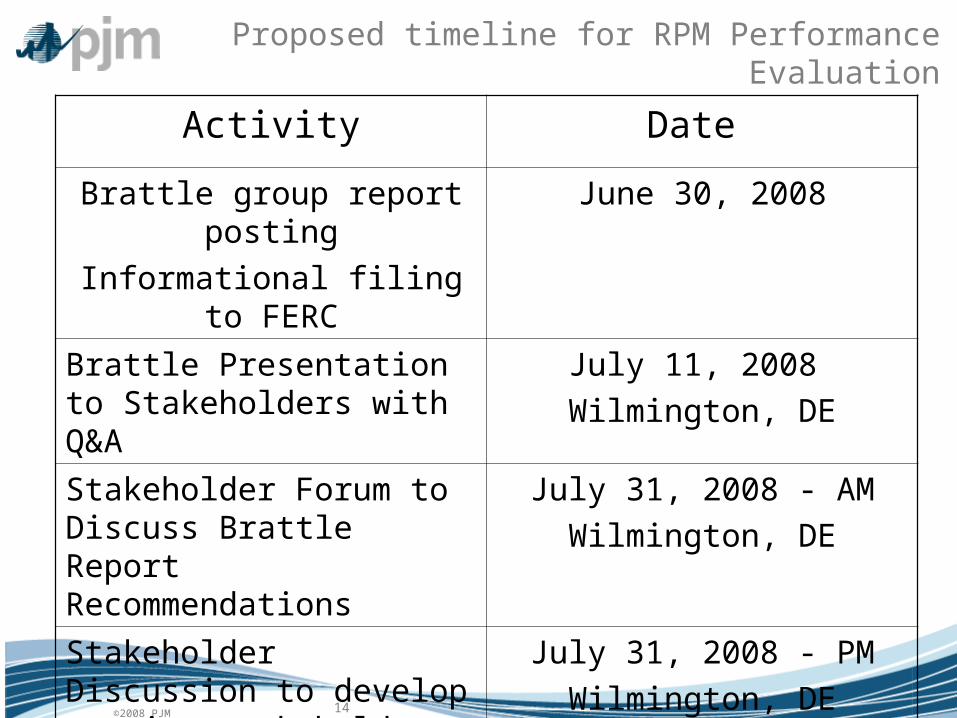
Proposed timeline for RPM Performance Evaluation
Activity Date
Brattle group report posting
Informational filing to FERC
June 30, 2008
Brattle Presentation to Stakeholders with Q&A
July 11, 2008
Wilmington, DE
Stakeholder Forum to Discuss Brattle Report Recommendations
July 31, 2008 - AM
Wilmington, DE
Stakeholder Discussion to develop ongoing stakeholder process timeline, set scope and priorities
July 31, 2008 - PM
Wilmington, DE
15©2008 PJM
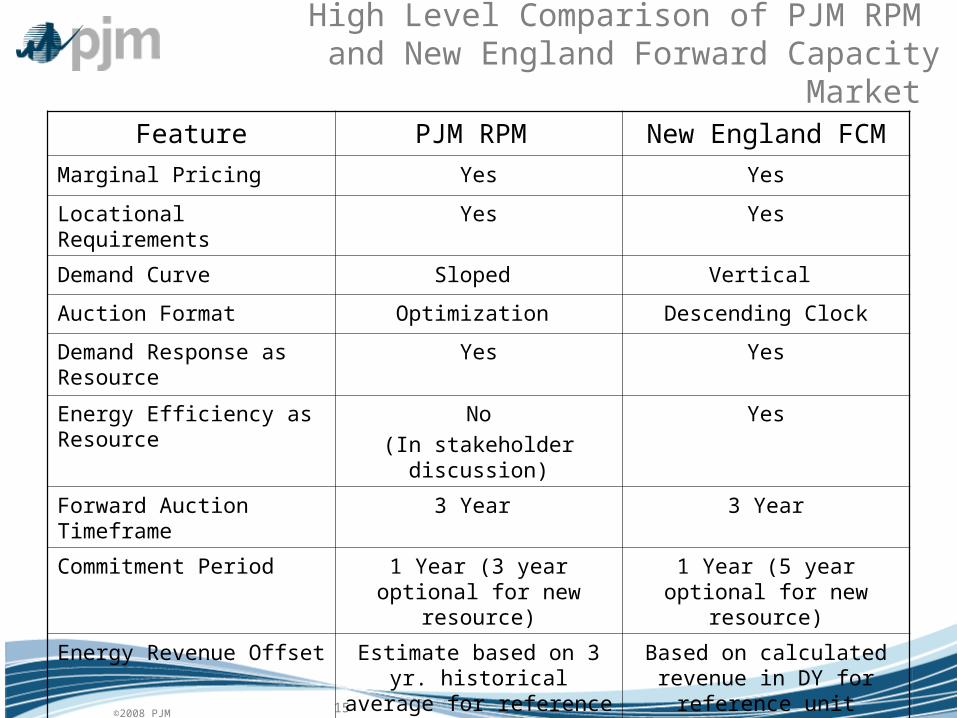
High Level Comparison of PJM RPM and New England Forward Capacity Market
Feature PJM RPM New England FCM
Marginal Pricing Yes Yes
Locational Requirements Yes Yes
Demand Curve Sloped Vertical
Auction Format Optimization Descending Clock
Demand Response as Resource
Yes Yes
Energy Efficiency as Resource
No
(In stakeholder discussion)
Yes
Forward Auction Timeframe 3 Year 3 Year
Commitment Period 1 Year (3 year optional for new resource)
1 Year (5 year optional for new resource)
Energy Revenue Offset Estimate based on 3 yr. historical average for
reference unit
Based on calculated revenue in DY for reference
unit