Embed Size (px)
Citation preview
DELIVERABLE D1.5
Rejuvenation techniques for automotive fuel cells
Ivan Pivac, Frano Barbir (FESB) Quality Assurance: Nadia Yousfi Steiner (UFC)
PUBLIC
Rejuvenation techniques for automotive fuel cells Page 1 of 20
Project acronym: GIANTLEAP
Project title: Giantleap Improves Automation of Non-polluting Transportation with Lifetime Extension of Automotive PEM fuel cells
Project number: 700101
Document date: February 10, 2019
Due date: October 31, 2018
Keywords: Recovery, Rejuvenation, Temporary degradation, Reversible degradation, Regeneration, Restoration, Transient degradation, Refresh shutdown procedure
Abstract: The deliverable presents the obtained measurement and analysis results of the accelerated stress test protocols consisting of voltage cycling, designed to target electrocatalyst degradation, with the intentional recovery periods (so-called soak time steps) every 2500 voltage cycles on an already conditioned 50 cm2 (single) fuel cell provided by ElringKlinger. Before and after every intentional stop, a series of diagnostic methods (polarization curves, electrochemical impedance spectroscopy, cyclic voltammetry, linear sweep voltammetry) were performed. During the conducted durability test, different shutdown procedures, as well as different duration of the soak time period were tested with their impact on performance recovery phenomenon. The results suggest that cause of the reversible degradation could be accumulated water within the cell and/or presence of oxygen within the catalyst layer. The prolonged soak time step reduces recovery effect, while rapid reduction of the cell temperature with ice proved to be counterproductive for performance recovery. Shutdown procedure without shortly-connected resistor has shown no effect on recovery. Shutdown procedure without nitrogen purge proved to be the most effective for performance recovery.
Revision History Date Description Author
31.01.2019 First draft Ivan Pivac (FESB)
08.02.2019 QA Nadia Steiner (UFC)
Rejuvenation techniques for automotive fuel cells Page 2 of 20
Table of Contents
1 Introduction ..................................................................................................................................... 3
2 Literature survey on PEM fuel cell rejuvenation ............................................................................. 5
2.1 Possible causes of recoverable degradation ........................................................................... 5
2.2 Overview of existing recovery procedures .............................................................................. 6
3 Experimental investigation of fuel cell rejuvenation on EK single cell ............................................ 8
3.1 Polarization curves ................................................................................................................ 11
3.2 Electrochemical impedance spectroscopy ............................................................................ 13
3.3 Cyclic voltammetry ................................................................................................................ 14
3.4 Linear sweep voltammetry .................................................................................................... 16
4 Conclusions on fuel cell rejuvenation and future work ................................................................ 18
5 References ..................................................................................................................................... 19
Rejuvenation techniques for automotive fuel cells Page 3 of 20
1 Introduction In literature, degradation (i.e. voltage loss over time) of proton exchange membrane (PEM) fuel cell performance (mechanical, chemical or thermal) mainly refers to irreversible (also called permanent or unrecoverable) performance decay, which could be caused by several degradation mechanisms on various fuel cell components. For automotive fuel cells, typical is degradation of the catalyst layer (CL) caused by carbon corrosion due to frequent starts and stops, loss of catalyst active area caused by platinum (Pt) dissolution and sintering due to frequent voltage cycling, loss of catalyst active area due to adsorption of contaminants from the inlet gases, and/or mechanical degradation due to thermal and humidity cycling induced by the load profile as well as by the environment in which the vehicle operates [1]. However, when the fuel cell exploitation or its durability testing is interrupted due to certain reason, such as equipment maintenance, startup/shutdown procedure, overnight rest, continuous electrochemical in situ testing, etc., a phenomenon of performance recovery could occur, and it has been reported in handful of studies [2–10]. Therefore, some degradation may be recoverable, also called temporary, reversible, regenerative, restorable, or transient performance degradation.
The main reason for this recovery or rejuvenation phenomenon is often a result of transient processes, commonly attributed to non-ideal inner water and heat management [6], i.e. changes in the water balance of the fuel cell [2], where the loss in voltage may be reversed completely or partially by changing the operating conditions (or with the aid of some special in situ recovery procedure), and consequently the cell performance may return or at least it may come closer to pre-degraded levels [3]. Furthermore, during the durability tests, the reversible losses often increase simultaneously and accumulate in time, and the reversible decay rates are often much higher than irreversible decay rates [2,3]. Therefore, the recoverable activity loss in diagnostics should be eliminated from the overall performance degradation or at least minimized in order to correctly evaluate the true performance degradation and to prevent premature failure due to the irreversible degradation. Unfortunately, the most accelerated stress test (AST) protocols, including those from U.S. DOE [11,12], have no descriptions/consideration of the reversible losses or appropriate procedure to eliminate or recover the reversible losses. However, several durability studies have included some recovery/refresh procedures for the removal of reversible voltage losses [4–10,13–17], but they were primarily concentrated on material/component degradations and performance decays, instead of better understanding the real mechanisms of degradation and finding the distinction between reversible and irreversible degradations [9,10], which are still not fully understood and need further analysis. Better understanding the voltage recovery phenomenon after several hours rest and its effect on degradation will help us to check and improve (if needed) the current diagnostic procedures, and consequently improve the reliability and durability of automotive PEM fuel cells in general.
In our preliminary experimental attempts to characterize the recoverable performance degradation, we applied a reported recovery procedure [13] on cell recovery during the common AST with the intentional recovery periods. However, the obtained results of the conducted diagnostic methods during the AST have not showed consistent trends and unambiguous answer on our still open questions regarding the cell rejuvenation. Based on these preliminary results, our further research step was to eliminate the diagnostic procedures as a source of inconsistency. The basic idea of this experimental attempt was to completely isolate the cell from air through the AST. Because of that, the only diagnostics during the same AST with the intentional recovery periods were cyclic voltammetry
Rejuvenation techniques for automotive fuel cells Page 4 of 20
and linear sweep voltammetry. From the obtained results, it seemed that diagnostic methods itself do not affect the recovery.
Based on the conducted literature survey on PEM fuel cell rejuvenation phenomenon, which is given in more detail in the following section, and these preliminary investigations, it seems that the procedure of shutting down the cell has to be more relevant for the fuel cell performance after the recovery period (i.e. soak time step) during which the cell is in the non-operating mode. Moreover, duration of the cell rest is probably not negligible too. Therefore, the main objective in the experimental part of the study was to find answers to the still open questions in literature:
• Does shutdown procedure may have an impact on performance recovery phenomenon after soak time step?
• Does duration of the soak time step may have an impact on performance recovery phenomenon?
The goal of this deliverable thus is to present the impact of shutdown procedure and duration of the resting period on PEM fuel cell rejuvenation. The deliverable presents the obtained measurement and analysis results of the accelerated stress test protocols consisting of voltage cycling, designed to target electrocatalyst degradation, with the intentional recovery periods (so-called soak time steps) every 2500 voltage cycles on an already conditioned 50 cm2 (single) fuel cell provided by ElringKlinger. Before and after every intentional stop, a series of diagnostic methods (polarization curves, electrochemical impedance spectroscopy, cyclic voltammetry, linear sweep voltammetry) were performed. During the conducted durability test, different shutdown procedures, as well as different duration of the soak time period were tested with their impact on performance recovery phenomenon.
Rejuvenation techniques for automotive fuel cells Page 5 of 20
2 Literature survey on PEM fuel cell rejuvenation 2.1 Possible causes of recoverable degradation As it was previously mentioned, recoverable degradation could occur when accumulated water in the electrodes (transported across the membrane from anode and/or locally produced by ORR) partially blocks the mass transport of the reactants to the catalysts and consequently increases concentration overpotential [18], which generally requires the removal of water from the electrodes by flushing with dry gases [10]. On the other side, the reversible degradation could also be related to the decomposition of the polymer membrane and the decrease of the hydrophobicity, i.e. the correlated alteration of the water balance, which mainly affects the performance of the anode, but it could be restored by adding of purging intervals and adapting the periods between purging and the length of the purging intervals [2]. At lower current densities and OCV, possible causes of recoverable degradation could be the formation of surface platinum oxides (PtOx), as coverage of the catalyst that occurs at high cathode potentials (e.g. voltage cycling can cause build-up of PtO on the cathode catalyst [16]) and decreases the electrocatalytic activity determining an increase of the related kinetic losses [8,10], and/or contaminants from ionomer degradation (may block the cathode catalyst and lower the cell performance) [7], which effects could be both reduced with the decrease of the cathode potential (<0.65 V, only possible during the operation at high loads [19]). Moreover, Zhang et al. [9] in their study of performance recovery during the AST designed to target carbon corrosion, has explained the obtained kinetic recovery, i.e. the recovery of electrochemical active surface area (ECSA), with two distinct mechanisms: the reduction of platinum oxide and the re-attachment of detached Pt nanoparticles onto the carbon supports, while the mass transport recovery was attributed to removal of hydrophilic oxide groups on the carbon surface and possible reduction of liquid water in the voids and delamination caused by microstructural change during the AST. Also, degradation at lower current densities could be caused by the formation of pinholes or micro-cracks due to increased gas crossover caused by drying condition and resulting membrane shrinking (may cause mixed potentials at the electrodes), which could be partially recovered by the increase of the cell humidity, i.e. sealing of membrane defects and eliminating the crossover by liquid product water [20], and/or by decrease of the mechanical stress applied to the membrane [10]. Another possible cause of recoverable degradation could be contamination with carbon monoxide (CO) formed during carbon corrosion [8]. CO covers the surface of the anode catalyst and decreases the active catalyst sites, this resulting in decreased hydrogen oxidation kinetics and increasing the mass transport losses at the anode [10]. This degradation could be recovered with the increase of the anodic potential (> 0.6 V is required for the oxidative CO removal [21]) during the cell shutdown. Several groups also reported that the cell performance loss induced by membrane chemical degradation obtained during the open circuit voltage (OCV) holds is at least partially recoverable during the unintentional interruptions [3] due to desorption/removal of sulfate anions accumulation on the Pt catalyst surface which blocks the active sites for oxygen adsorption/reduction [4,5]. Furthermore, recoverable degradation could be also caused by the temporary reduction of the cell temperature, as a combination of several interacting effects connected with the ionomer rehydration [10].
Gazdzick et al. [10] have also investigated the effect of different shutdown parameters on recovery of reversible losses. Their obtained voltage recovery during the shutdown period was attributed to the ionomer effects in the catalyst layer and/or membrane. In their experiment, the cell operation was interrupted by several procedures for approximately 1 h partially imitating conditions that occur during the shutdown. The recovery test procedures, which achieved some recovery effect, were reduction of
Rejuvenation techniques for automotive fuel cells Page 6 of 20
the cell temperature as the most effective (increases humidity and decreases mechanical membrane stress), purging anode with air (increases anode potential to remove contaminants) and purging cathode with nitrogen (decreases cathode potential to reduce platinum oxide and remove contaminants). The sum of the effects due to purging the anode with air and temporarily reducing cell temperature, as the combination of high anode potential for contaminant removal and reduced mechanical stress to the membrane, led almost to the full recovery effect in their study.
2.2 Overview of existing recovery procedures Sugawara et al. [4] employed a water condensation as a recovery operation for flushing out trapped sulfate anions in the membrane electrode assembly (MEA) for 2 h, which led to a partial performance restoration. The anode and cathode flow fields were supplied with 0.5 dm3 min-1 of hydrogen and nitrogen, respectively. The cell temperature was controlled at 50 °C and the humidifier temperature was controlled at 80 °C to allow water to condense in the cell during the OCV hold under low humidity.
Owejan et al. [14] run a periodically voltage recovery step to remove contaminants and Pt oxides from the catalyst surface throughout their experimental protocols for studying the impact of Pt loading on cell performance. They were holding the cell voltage at 0.3 V for 2 h at 40 °C with fully-humidified reactants. However, their procedure target was to improve consistency between diagnostic methods, not to obtain and analyze the recoverable phenomena. Similarly, Dhanushkodi et al. [15,16] introduced a recovery procedure in their studies of carbon corrosion [15] and platinum dissolution [16] in order to remove the excess water present in the catalyst layer and reduce the Pt oxides. During the recovery step, hydrogen was fed to anode and no oxidant gas (only nitrogen at 1 slpm) was passed through the cathode for 20 min [16] or 4 h [15], while the cell load was turned off. Then the flow of air to the cathode was resumed and the cell was conditioned for 2 h before further diagnostics. Again, no details for the recoverable degradation were provided.
Zhang et al. [5] employed a proprietary voltage recovery procedure in situ for 2 h throughout the OCV holds that accelerate the membrane chemical degradation, where the voltage loss was observed to be fully recoverable. The same confidential recovery procedure was used by Kongkanand et al. [7] following the preconditioning in order to remove electrode contamination.
Zhang et al. [8] reported restoration of recoverable activity loss of carbon-supported platinum catalyst by a refreshing operation (treatment with a fresh nitrogen-purged 0.1 M HClO4 solution by cycling the potential between 0 and 1.2 V at a sweep rate of 50 mV s-1 for 50 cycles) conducted ex situ after the AST using a system with three electrodes. The cause of restoration was the removal of the CO formed on the catalyst surface during carbon corrosion.
In the recovery procedure by Zhang et al. [9], the cell voltage was cycled between OCV and 0.2 V with steps of 0.1 V. At each step, the voltage was maintained for 5 min and the current was monitored. After the recovery cycle, the cell performance was characterized again for several cycles until the cell performance had no apparent change.
In order to distinguish between reversible and irreversible degradation phenomena, another performance recovery protocol was proposed in a Science for Policy report by the Joint Research Centre (JRC) [17], as a cell recovery phase during the PEM single cell endurance testing under the FC-DLC driving cycles. It consists of switching off the load, stopping the air flow to the cathode and shutting of the cathode exit, maintaining the minimum fuel flow at anode until cell voltage vanished
Rejuvenation techniques for automotive fuel cells Page 7 of 20
plus 10 minutes and closing the fuel supply, flushing both anode and cathode compartments with nitrogen for safety reasons, flushing anode and cathode with air, letting the cell to cool down to ambient temperature and keeping the cell under ambient conditions for about 16.5 hours, flushing both anode and cathode compartments with nitrogen for safety reasons, and then restarting the setting test operating conditions.
Gazdzick et al. [10] employed a shutdown recovery procedure, which consists of switching off the load, stopping the gas supply, opening gas outlet valves (bringing cell to ambient pressure and allowing air to enter the electrode compartments by diffusion), and letting the cell to cool down to ambient temperature. At the beginning of this procedure, the cell voltage needs to be remained for several minutes at OCV due to the remaining hydrogen and air at anode and cathode, respectively, until it drops to the values close to 0 V with slight fluctuations up to approx. 150 mV, representing air at both electrodes (high electrode potential at anode and cathode). After waiting several hours (typically one night), the cell should be switched on again and the AST may be continued.
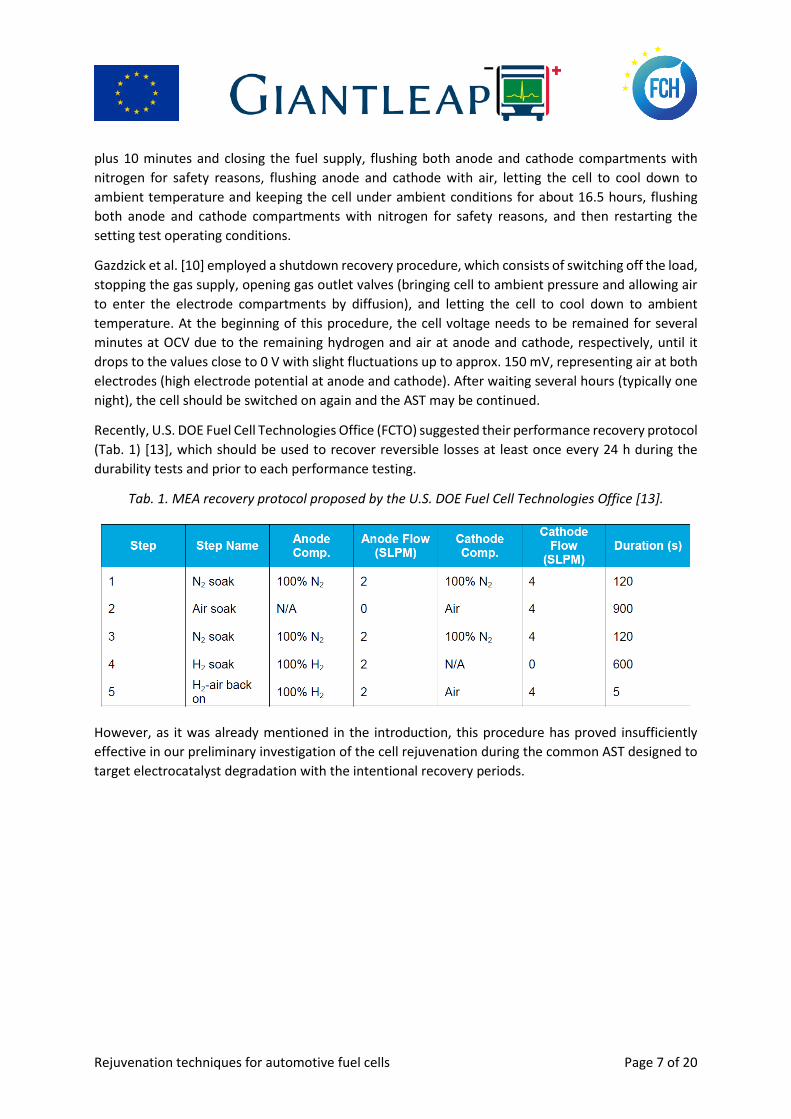
Recently, U.S. DOE Fuel Cell Technologies Office (FCTO) suggested their performance recovery protocol (Tab. 1) [13], which should be used to recover reversible losses at least once every 24 h during the durability tests and prior to each performance testing.
Tab. 1. MEA recovery protocol proposed by the U.S. DOE Fuel Cell Technologies Office [13].
However, as it was already mentioned in the introduction, this procedure has proved insufficiently effective in our preliminary investigation of the cell rejuvenation during the common AST designed to target electrocatalyst degradation with the intentional recovery periods.
Rejuvenation techniques for automotive fuel cells Page 8 of 20
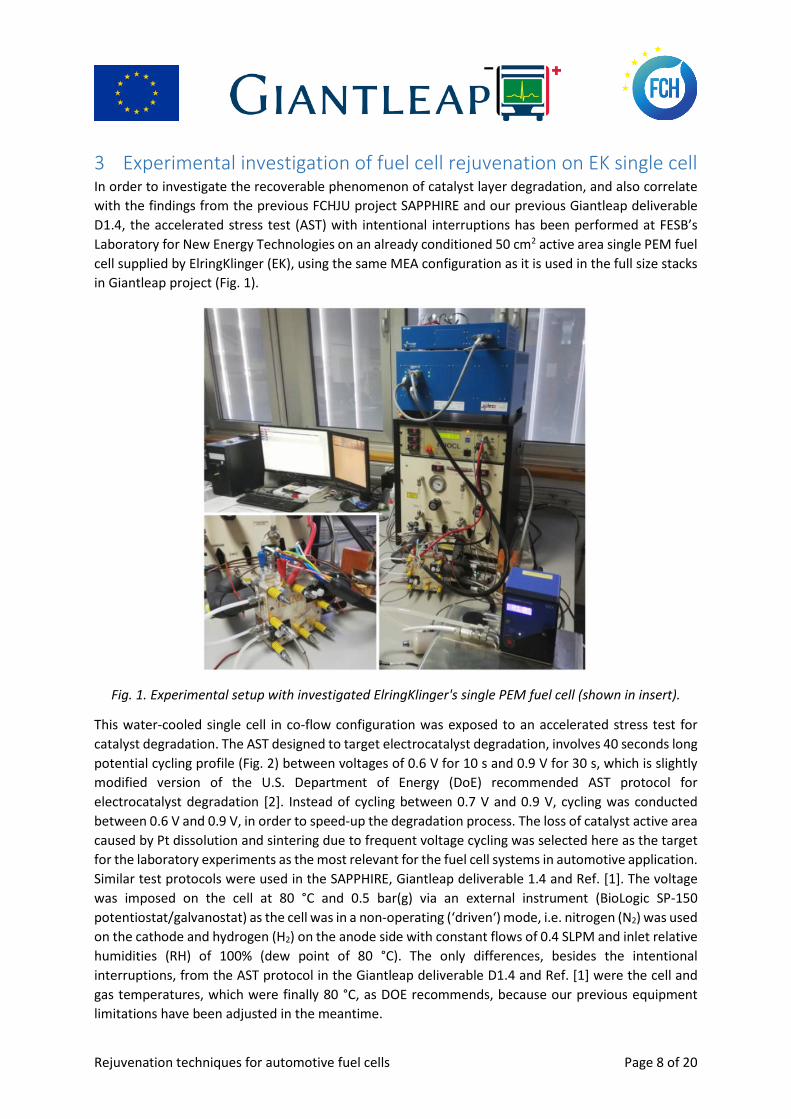
3 Experimental investigation of fuel cell rejuvenation on EK single cell In order to investigate the recoverable phenomenon of catalyst layer degradation, and also correlate with the findings from the previous FCHJU project SAPPHIRE and our previous Giantleap deliverable D1.4, the accelerated stress test (AST) with intentional interruptions has been performed at FESB’s Laboratory for New Energy Technologies on an already conditioned 50 cm2 active area single PEM fuel cell supplied by ElringKlinger (EK), using the same MEA configuration as it is used in the full size stacks in Giantleap project (Fig. 1).
Fig. 1. Experimental setup with investigated ElringKlinger's single PEM fuel cell (shown in insert).
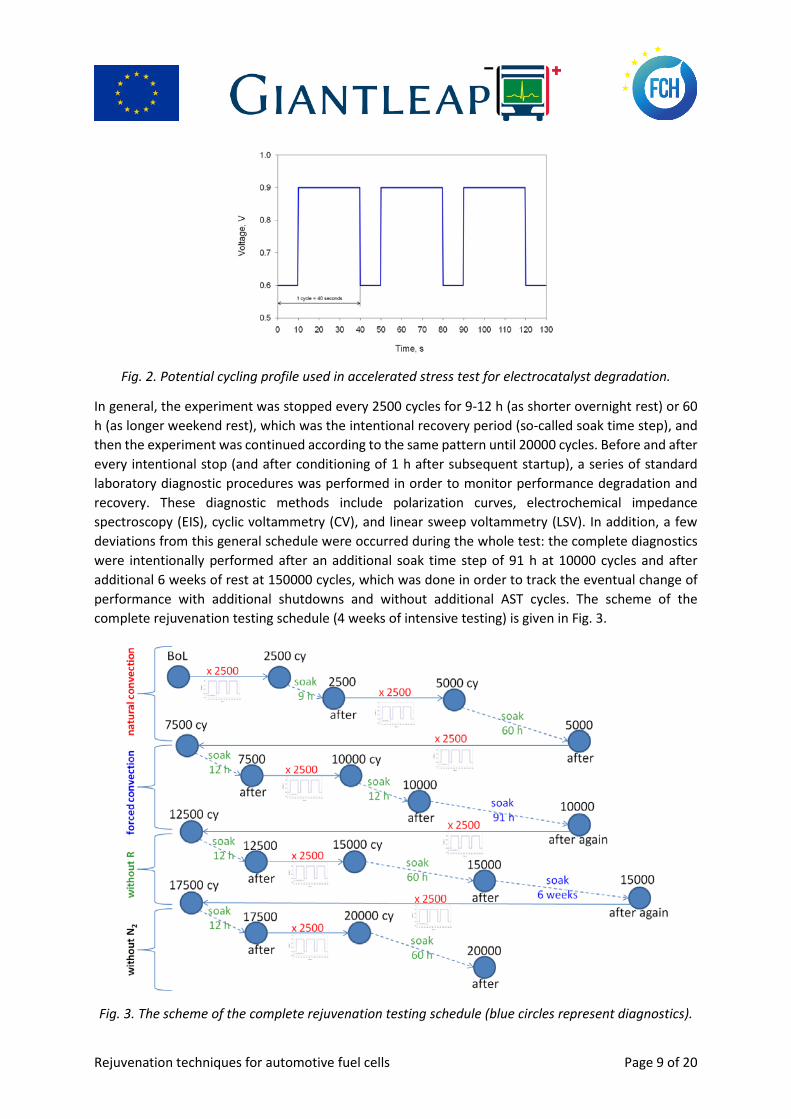
This water-cooled single cell in co-flow configuration was exposed to an accelerated stress test for catalyst degradation. The AST designed to target electrocatalyst degradation, involves 40 seconds long potential cycling profile (Fig. 2) between voltages of 0.6 V for 10 s and 0.9 V for 30 s, which is slightly modified version of the U.S. Department of Energy (DoE) recommended AST protocol for electrocatalyst degradation [2]. Instead of cycling between 0.7 V and 0.9 V, cycling was conducted between 0.6 V and 0.9 V, in order to speed-up the degradation process. The loss of catalyst active area caused by Pt dissolution and sintering due to frequent voltage cycling was selected here as the target for the laboratory experiments as the most relevant for the fuel cell systems in automotive application. Similar test protocols were used in the SAPPHIRE, Giantleap deliverable 1.4 and Ref. [1]. The voltage was imposed on the cell at 80 °C and 0.5 bar(g) via an external instrument (BioLogic SP-150 potentiostat/galvanostat) as the cell was in a non-operating (‘driven‘) mode, i.e. nitrogen (N2) was used on the cathode and hydrogen (H2) on the anode side with constant flows of 0.4 SLPM and inlet relative humidities (RH) of 100% (dew point of 80 °C). The only differences, besides the intentional interruptions, from the AST protocol in the Giantleap deliverable D1.4 and Ref. [1] were the cell and gas temperatures, which were finally 80 °C, as DOE recommends, because our previous equipment limitations have been adjusted in the meantime.
Rejuvenation techniques for automotive fuel cells Page 9 of 20
Fig. 2. Potential cycling profile used in accelerated stress test for electrocatalyst degradation.
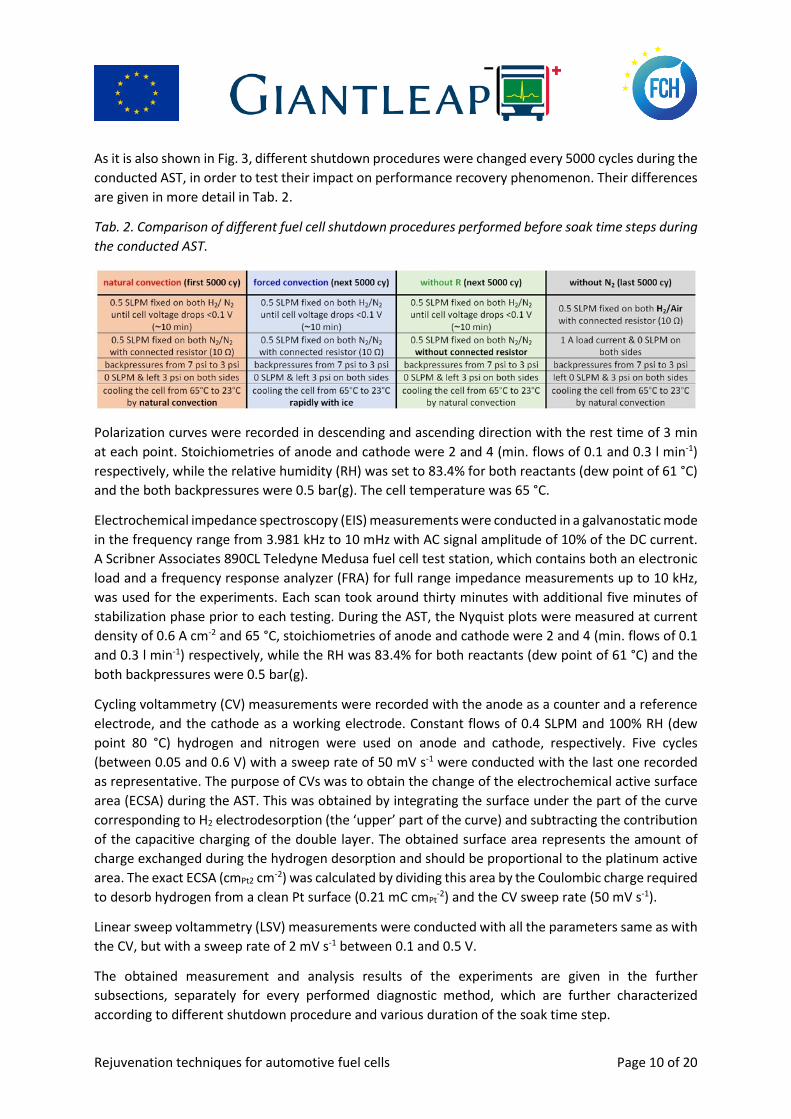
In general, the experiment was stopped every 2500 cycles for 9-12 h (as shorter overnight rest) or 60 h (as longer weekend rest), which was the intentional recovery period (so-called soak time step), and then the experiment was continued according to the same pattern until 20000 cycles. Before and after every intentional stop (and after conditioning of 1 h after subsequent startup), a series of standard laboratory diagnostic procedures was performed in order to monitor performance degradation and recovery. These diagnostic methods include polarization curves, electrochemical impedance spectroscopy (EIS), cyclic voltammetry (CV), and linear sweep voltammetry (LSV). In addition, a few deviations from this general schedule were occurred during the whole test: the complete diagnostics were intentionally performed after an additional soak time step of 91 h at 10000 cycles and after additional 6 weeks of rest at 150000 cycles, which was done in order to track the eventual change of performance with additional shutdowns and without additional AST cycles. The scheme of the complete rejuvenation testing schedule (4 weeks of intensive testing) is given in Fig. 3.
Fig. 3. The scheme of the complete rejuvenation testing schedule (blue circles represent diagnostics).
Rejuvenation techniques for automotive fuel cells Page 10 of 20
As it is also shown in Fig. 3, different shutdown procedures were changed every 5000 cycles during the conducted AST, in order to test their impact on performance recovery phenomenon. Their differences are given in more detail in Tab. 2.
Tab. 2. Comparison of different fuel cell shutdown procedures performed before soak time steps during the conducted AST.
Polarization curves were recorded in descending and ascending direction with the rest time of 3 min at each point. Stoichiometries of anode and cathode were 2 and 4 (min. flows of 0.1 and 0.3 l min-1) respectively, while the relative humidity (RH) was set to 83.4% for both reactants (dew point of 61 °C) and the both backpressures were 0.5 bar(g). The cell temperature was 65 °C.
Electrochemical impedance spectroscopy (EIS) measurements were conducted in a galvanostatic mode in the frequency range from 3.981 kHz to 10 mHz with AC signal amplitude of 10% of the DC current. A Scribner Associates 890CL Teledyne Medusa fuel cell test station, which contains both an electronic load and a frequency response analyzer (FRA) for full range impedance measurements up to 10 kHz, was used for the experiments. Each scan took around thirty minutes with additional five minutes of stabilization phase prior to each testing. During the AST, the Nyquist plots were measured at current density of 0.6 A cm-2 and 65 °C, stoichiometries of anode and cathode were 2 and 4 (min. flows of 0.1 and 0.3 l min-1) respectively, while the RH was 83.4% for both reactants (dew point of 61 °C) and the both backpressures were 0.5 bar(g).
Cycling voltammetry (CV) measurements were recorded with the anode as a counter and a reference electrode, and the cathode as a working electrode. Constant flows of 0.4 SLPM and 100% RH (dew point 80 °C) hydrogen and nitrogen were used on anode and cathode, respectively. Five cycles (between 0.05 and 0.6 V) with a sweep rate of 50 mV s-1 were conducted with the last one recorded as representative. The purpose of CVs was to obtain the change of the electrochemical active surface area (ECSA) during the AST. This was obtained by integrating the surface under the part of the curve corresponding to H2 electrodesorption (the ‘upper’ part of the curve) and subtracting the contribution of the capacitive charging of the double layer. The obtained surface area represents the amount of charge exchanged during the hydrogen desorption and should be proportional to the platinum active area. The exact ECSA (cmPt2 cm-2) was calculated by dividing this area by the Coulombic charge required to desorb hydrogen from a clean Pt surface (0.21 mC cmPt
-2) and the CV sweep rate (50 mV s-1).
Linear sweep voltammetry (LSV) measurements were conducted with all the parameters same as with the CV, but with a sweep rate of 2 mV s-1 between 0.1 and 0.5 V.
The obtained measurement and analysis results of the experiments are given in the further subsections, separately for every performed diagnostic method, which are further characterized according to different shutdown procedure and various duration of the soak time step.
Rejuvenation techniques for automotive fuel cells Page 11 of 20
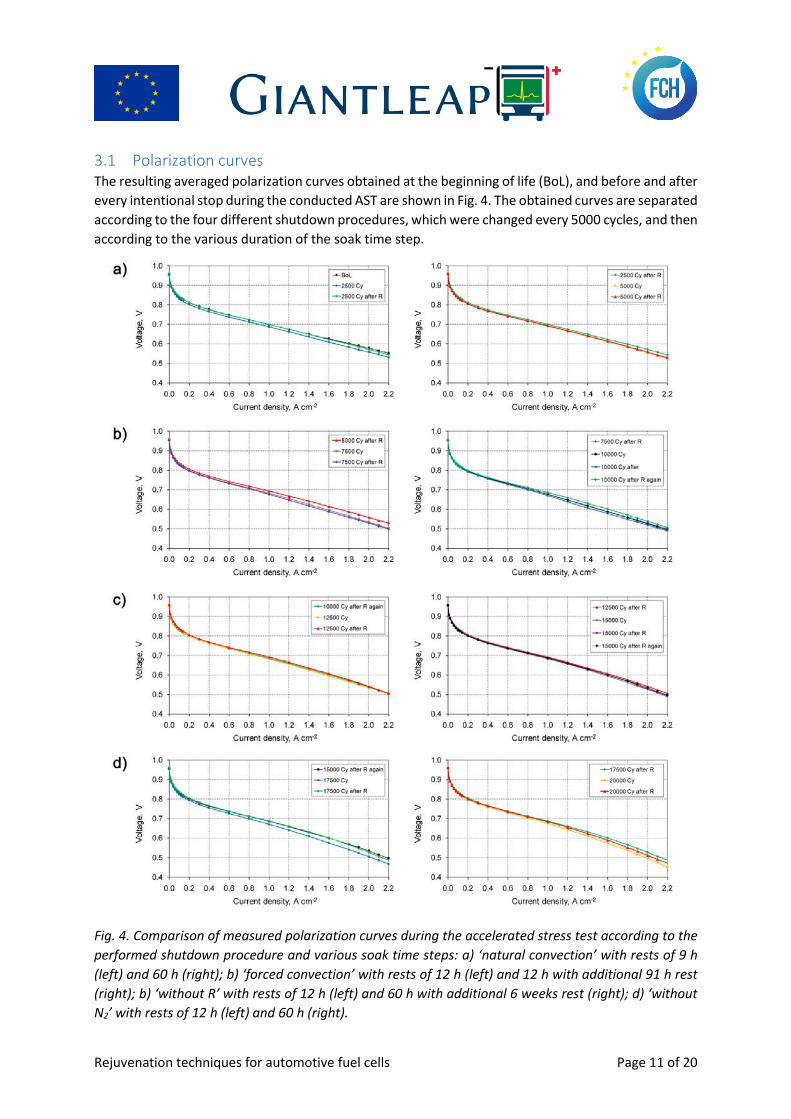
3.1 Polarization curves The resulting averaged polarization curves obtained at the beginning of life (BoL), and before and after every intentional stop during the conducted AST are shown in Fig. 4. The obtained curves are separated according to the four different shutdown procedures, which were changed every 5000 cycles, and then according to the various duration of the soak time step.
Fig. 4. Comparison of measured polarization curves during the accelerated stress test according to the performed shutdown procedure and various soak time steps: a) ‘natural convection’ with rests of 9 h (left) and 60 h (right); b) ‘forced convection’ with rests of 12 h (left) and 12 h with additional 91 h rest (right); b) ‘without R’ with rests of 12 h (left) and 60 h with additional 6 weeks rest (right); d) ‘without N2’ with rests of 12 h (left) and 60 h (right).
Rejuvenation techniques for automotive fuel cells Page 12 of 20
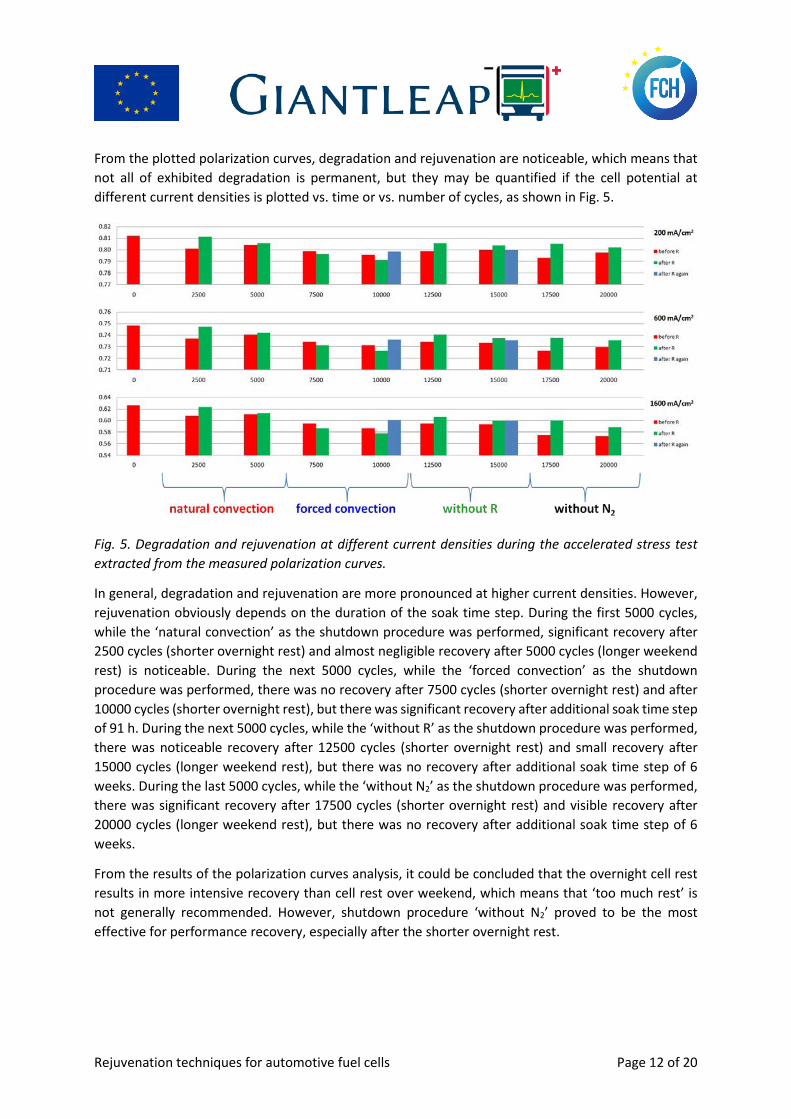
From the plotted polarization curves, degradation and rejuvenation are noticeable, which means that not all of exhibited degradation is permanent, but they may be quantified if the cell potential at different current densities is plotted vs. time or vs. number of cycles, as shown in Fig. 5.
Fig. 5. Degradation and rejuvenation at different current densities during the accelerated stress test extracted from the measured polarization curves.
In general, degradation and rejuvenation are more pronounced at higher current densities. However, rejuvenation obviously depends on the duration of the soak time step. During the first 5000 cycles, while the ‘natural convection’ as the shutdown procedure was performed, significant recovery after 2500 cycles (shorter overnight rest) and almost negligible recovery after 5000 cycles (longer weekend rest) is noticeable. During the next 5000 cycles, while the ‘forced convection’ as the shutdown procedure was performed, there was no recovery after 7500 cycles (shorter overnight rest) and after 10000 cycles (shorter overnight rest), but there was significant recovery after additional soak time step of 91 h. During the next 5000 cycles, while the ‘without R’ as the shutdown procedure was performed, there was noticeable recovery after 12500 cycles (shorter overnight rest) and small recovery after 15000 cycles (longer weekend rest), but there was no recovery after additional soak time step of 6 weeks. During the last 5000 cycles, while the ‘without N2’ as the shutdown procedure was performed, there was significant recovery after 17500 cycles (shorter overnight rest) and visible recovery after 20000 cycles (longer weekend rest), but there was no recovery after additional soak time step of 6 weeks.
From the results of the polarization curves analysis, it could be concluded that the overnight cell rest results in more intensive recovery than cell rest over weekend, which means that ‘too much rest’ is not generally recommended. However, shutdown procedure ‘without N2’ proved to be the most effective for performance recovery, especially after the shorter overnight rest.
Rejuvenation techniques for automotive fuel cells Page 13 of 20
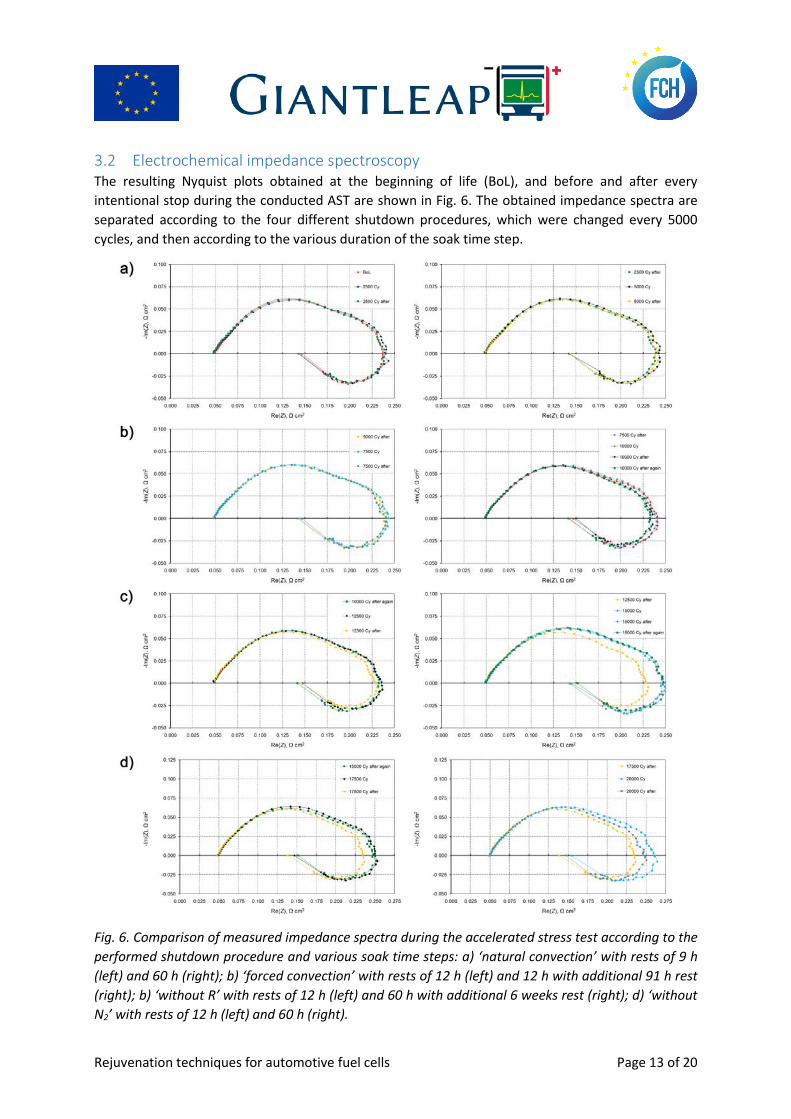
3.2 Electrochemical impedance spectroscopy The resulting Nyquist plots obtained at the beginning of life (BoL), and before and after every intentional stop during the conducted AST are shown in Fig. 6. The obtained impedance spectra are separated according to the four different shutdown procedures, which were changed every 5000 cycles, and then according to the various duration of the soak time step.
Fig. 6. Comparison of measured impedance spectra during the accelerated stress test according to the performed shutdown procedure and various soak time steps: a) ‘natural convection’ with rests of 9 h (left) and 60 h (right); b) ‘forced convection’ with rests of 12 h (left) and 12 h with additional 91 h rest (right); b) ‘without R’ with rests of 12 h (left) and 60 h with additional 6 weeks rest (right); d) ‘without N2’ with rests of 12 h (left) and 60 h (right).
Rejuvenation techniques for automotive fuel cells Page 14 of 20
The results of the EIS measurements taken during the AST have similar trends as the polarization curves, but differences between the all EIS curves in Fig. 6 are almost insignificant for a more detailed discussion. However, the semicircles’ high-frequency branches, in general, are more tilted/distorted with degradation, indicating an increase in the catalyst layer (CL) ionic resistance, while the low-frequency loops, representing mass transport losses, are getting bigger. As a result, the rightmost real-axis intercept on the Nyquist diagram around 0.5 Hz or lower (the point with maximum real impedance and the highest resistive losses), defined as the total resistance (Total R) or LF intercept, increased most significantly (Fig. 7), while the membrane resistance (the leftmost real-axis intercept at high frequencies) showed a slight increase, as the EIS measurements were performed with not fully-hydrated reactants (83.4% RH). Therefore, there is a mixture of increase in activation losses (related to the loss of the cathode electrochemical active surface area, ECSA) and mass transport losses, which concurs also with the findings (at least qualitatively) of cycling voltammetry (subsection 3.3). On the other hand, due to rejuvenation of the fuel cell during the intentional recovery periods, impedance spectra also show some reversibility, i.e. reduction/improvement of the impedance curves, which is mostly pronounced at LF intercept (Fig. 7). Therefore, in Fig. 7 there is an evident increase of LF intercept value after every degradation step, and decrease after every soak time step. Again, shutdown procedure ‘without N2’ proved to be the most effective for performance recovery, especially after the shorter overnight rest.
Fig. 7. Degradation and rejuvenation during the accelerated stress test extracted from the measured impedance spectra at low-frequency intercept.
3.3 Cyclic voltammetry The results of the CV measurements obtained at the beginning of life (BoL), and before and after every intentional stop during the conducted AST are shown in Fig. 8. The obtained cyclic voltammograms with the calculated ECSA values and their loss in percentage during the AST are separated according to the four different shutdown procedures, which were changed every 5000 cycles, and then according to the various duration of the soak time step.
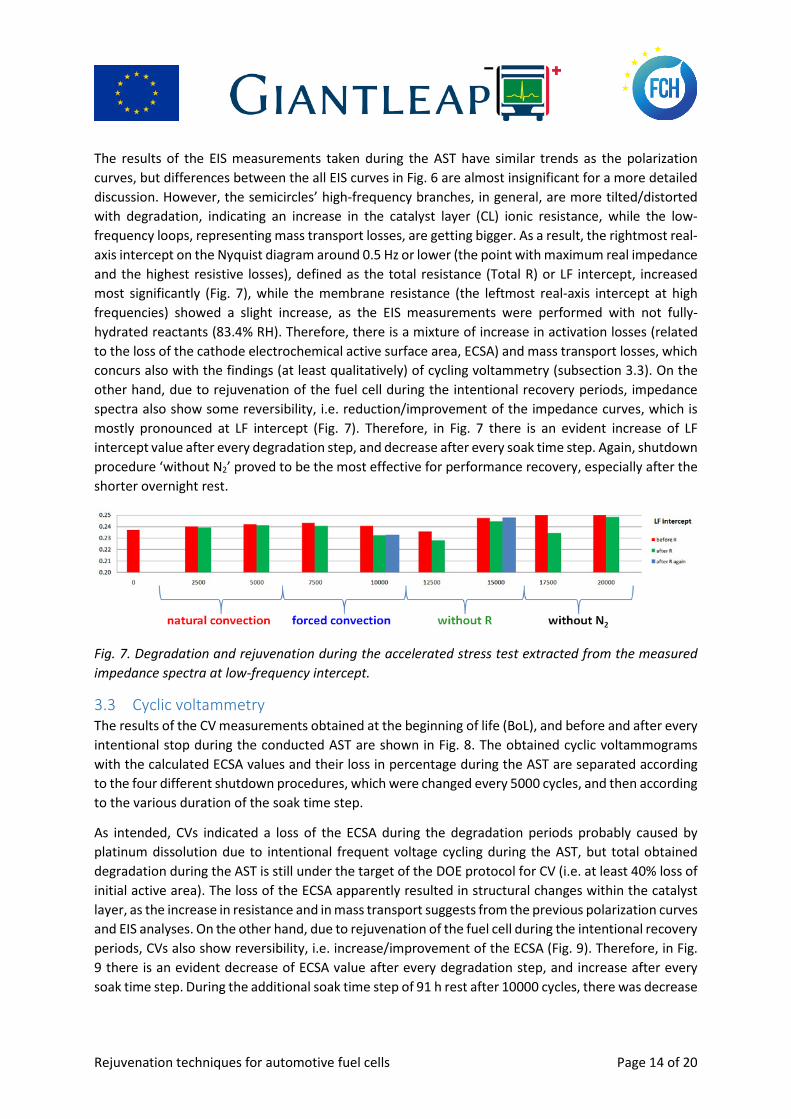
As intended, CVs indicated a loss of the ECSA during the degradation periods probably caused by platinum dissolution due to intentional frequent voltage cycling during the AST, but total obtained degradation during the AST is still under the target of the DOE protocol for CV (i.e. at least 40% loss of initial active area). The loss of the ECSA apparently resulted in structural changes within the catalyst layer, as the increase in resistance and in mass transport suggests from the previous polarization curves and EIS analyses. On the other hand, due to rejuvenation of the fuel cell during the intentional recovery periods, CVs also show reversibility, i.e. increase/improvement of the ECSA (Fig. 9). Therefore, in Fig. 9 there is an evident decrease of ECSA value after every degradation step, and increase after every soak time step. During the additional soak time step of 91 h rest after 10000 cycles, there was decrease

Rejuvenation techniques for automotive fuel cells Page 15 of 20
of ECSA, but during the additional soak time step of 6 weeks rest after 15000 cycles, there was almost no change.
Fig. 8. Comparison of cyclic voltammograms and calculated ECSA values during the accelerated stress test according to the performed shutdown procedure and various soak time steps: a) ‘natural convection’ with rests of 9 h (left) and 60 h (right); b) ‘forced convection’ with rests of 12 h (left) and 12 h with additional 91 h rest (right); b) ‘without R’ with rests of 12 h (left) and 60 h with additional 6 weeks rest (right); d) ‘without N2’ with rests of 12 h (left) and 60 h (right).
Rejuvenation techniques for automotive fuel cells Page 16 of 20
Fig. 9. Change of the ECSA normalized values during the accelerated stress test calculated from the measured cyclic voltammograms.
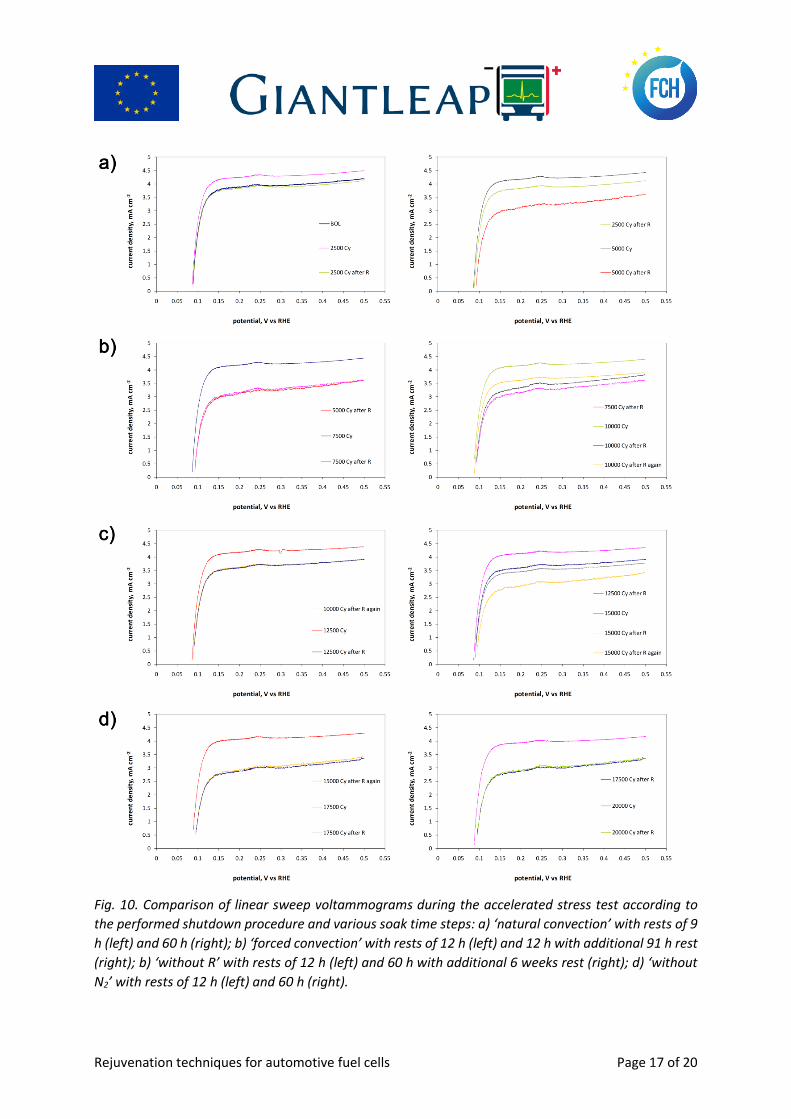
3.4 Linear sweep voltammetry The results of the LSV measurements obtained at the beginning of life (BoL), and before and after every intentional stop during the conducted AST are shown in Fig. 10. The obtained linear sweep voltammograms are separated according to the four different shutdown procedures, which were changed every 5000 cycles, and then according to the various duration of the soak time step.
The results of the LSV measurements, in this kind of AST in general, indicate that hydrogen crossover does not change significantly during the uninterrupted AST, because this kind of AST targeted degradation of the catalyst and there is no reason for hydrogen crossover to change significantly. In Fig. 10, hydrogen crossover was indeed more or less constant around 4 mA cm-2 after every degradation step during the AST. However, conducted AST was intentionally interrupted with the soak time steps every 2500 cycles. Therefore, hydrogen crossover was decreasing after every soak time step during the AST (it was between 3 and 3.5 mA cm-2), which suggest that cause of the reversible degradation could be accumulated water within the cell and/or presence of oxygen within the CL. Also, hydrogen crossover generally showed more intensive decrease after the longer soak time step. During the additional soak time step of 91 h rest after 10000 cycles, there was increase of hydrogen crossover, but during the additional soak time step of 6 weeks rest after 15000 cycles, there was an evident decrease.
Rejuvenation techniques for automotive fuel cells Page 17 of 20
Fig. 10. Comparison of linear sweep voltammograms during the accelerated stress test according to the performed shutdown procedure and various soak time steps: a) ‘natural convection’ with rests of 9 h (left) and 60 h (right); b) ‘forced convection’ with rests of 12 h (left) and 12 h with additional 91 h rest (right); b) ‘without R’ with rests of 12 h (left) and 60 h with additional 6 weeks rest (right); d) ‘without N2’ with rests of 12 h (left) and 60 h (right).
Rejuvenation techniques for automotive fuel cells Page 18 of 20
4 Conclusions on fuel cell rejuvenation and future work The ElringKlinger’s 50 cm2 single cell was exposed to the accelerated ageing test protocols with the intentional recovery periods, in order to investigate a phenomenon of recoverable performance degradation. Four different shutdown procedures and different durations of the soak time step were tested to investigate their impact on performance recovery phenomenon. The cell has shown excellent performance and low degradation rate. However, from the conducted analyses of the several diagnostic measurements, the following can be concluded:
• The obtained results were consistent during the AST, i.e., degradation was obtained during the degradation periods, and recovery was obtained during the soak time periods.
• The cell rejuvenation intensity depends on the performed shutdown procedure and the duration of the soak time step.
• The results of the LSV measurements (reflecting the hydrogen crossover) suggest that cause of the reversible degradation could be accumulated water within the cell and/or presence of oxygen within the catalyst layer.
• The prolonged soak time step reduces recovery effect. • Rapid reduction of the cell temperature with ice proved to be counterproductive for
performance recovery. • Shutdown procedure without shortly-connected resistor has shown no effect on recovery. • Shutdown procedure without nitrogen purge proved to be the most effective for performance
recovery. • LF intercept value extracted from the EIS proved to be efficient and consistent measure of
degradation and recovery effect.
As the part of the future work, further experimental investigations of the voltage recovery phenomenon have to be done, because there is still need for a better understanding the real mechanisms of degradation and rejuvenation, and finding the distinction between reversible and irreversible losses, which are still not fully understood.
Rejuvenation techniques for automotive fuel cells Page 19 of 20
5 References [1] I. Pivac, D. Bezmalinović, and F. Barbir, “Catalyst degradation diagnostics of proton exchange
membrane fuel cells using electrochemical impedance spectroscopy”, Int. J. Hydrogen Energy, vol. 43, no. 29, pp. 13512–13520, 2018.
[2] M. Schulze, N. Wagner, T. Kaz, and K. A. Friedrich, “Combined electrochemical and surface analysis investigation of degradation processes in polymer electrolyte membrane fuel cells”, Electrochim. Acta, vol. 52, no. 6, pp. 2328–2336, 2007.
[3] S. Kundu, M. Fowler, L. C. Simon, and R. Abouatallah, “Reversible and irreversible degradation in fuel cells during Open Circuit Voltage durability testing”, J. Power Sources, vol. 182, no. 1, pp. 254–258, 2008.
[4] S. Sugawara, T. Maruyama, Y. Nagahara, S. S. Kocha, K. Shinohra, K. Tsujita, S. Mitsushima, and K. ichiro Ota, “Performance decay of proton-exchange membrane fuel cells under open circuit conditions induced by membrane decomposition”, J. Power Sources, vol. 187, no. 2, pp. 324–331, 2009.
[5] J. Zhang, B. A. Litteer, F. D. Coms, and R. Makharia, “Recoverable Performance Loss Due to Membrane Chemical Degradation in PEM Fuel Cells”, J. Electrochem. Soc., vol. 159, no. 7, pp. F287–F293, 2012.
[6] F. Wang, D. Yang, B. Li, H. Zhang, C. Hao, F. Chang, and J. Ma, “Investigation of the recoverable degradation of PEM fuel cell operated under drive cycle and different humidities”, Int. J. Hydrogen Energy, vol. 39, no. 26, pp. 14441–14447, 2014.
[7] A. Kongkanand, J. Zhang, Z. Liu, Y.-H. Lai, P. Sinha, E. L. Thompson, and R. Makharia, “Degradation of PEMFC Observed on NSTF Electrodes”, J. Electrochem. Soc., vol. 161, no. 6, pp. F744–F753, 2014.
[8] Y. Zhang, S. Chen, Y. Wang, W. Ding, R. Wu, L. Li, X. Qi, and Z. Wei, “Study of the degradation mechanisms of carbon-supported platinum fuel cells catalyst via different accelerated stress test”, J. Power Sources, vol. 273, pp. 62–69, 2015.
[9] X. Zhang, L. Guo, and H. Liu, “Recovery mechanisms in proton exchange membrane fuel cells after accelerated stress tests”, J. Power Sources, vol. 296, pp. 327–334, 2015.
[10] P. Gazdzick, J. Mitzel, D. Garcia Sanchez, M. Schulze, and K. A. Friedrich, “Evaluation of reversible and irreversible degradation rates of polymer electrolyte membrane fuel cells tested in automotive conditions”, J. Power Sources, vol. 327, pp. 86–95, 2016.
[11] U.S. Department of Energy, “DOE Cell Component Accelerated Stress Test Protocols for PEM Fuel Cells”, 2007.
[12] N. L. Garland, T. G. Benjamin, and J. P. Kopasz, “DOE Fuel Cell Program: Durability Technical Targets and Testing Protocols”, ECS Trans., vol. 11, no. 1, pp. 923–931, 2007.
[13] DOE Fuel Cell Technologies Office, “Multi-Year Research, Development, and Demonstration Plan - 3.4 Fuel Cells”, pp. 1-58, 2016.
[14] J. P. Owejan, J. E. Owejan, and W. Gu, “Impact of Platinum Loading and Catalyst Layer Structure on PEMFC Performance”, J. Electrochem. Soc., vol. 160, no. 8, pp. F824–F833, 2013.
[15] S. R. Dhanushkodi, M. Tam, S. Kundu, M. W. Fowler, and M. D. Pritzker, “Carbon corrosion fingerprint development and de-convolution of performance loss according to degradation mechanism in PEM fuel cells”, J. Power Sources, vol. 240, pp. 114–121, 2013.
[16] S. R. Dhanushkodi, S. Kundu, M. W. Fowler, and M. D. Pritzker, “Study of the effect of temperature on Pt dissolution in polymer electrolyte membrane fuel cells via accelerated stress tests”, J. Power Sources, vol. 245, pp. 1035–1045, 2014.
Rejuvenation techniques for automotive fuel cells Page 20 of 20
[17] G. Tsotridis, A. Pilenga, G. De Marco, and T. Malkow, “EU Harmonised Test Protocols for PEMFC MEA Testing in Single Cell Configuration for Automotive Applications”, JRC Science for Policy report, 2015. EUR 27632 EN; doi 10.2790/54653
[18] N. Yousfi-Steiner, P. Moçotéguy, D. Candusso, D. Hissel, A. Hernandez, and A. Aslanides, “A review on PEM voltage degradation associated with water management: Impacts, influent factors and characterization”, J. Power Sources, vol. 183, no. 1, pp. 260–274, 2008.
[19] S. G. Rinaldo, W. Lee, J. Stumper, and M. Eikerling, “Mechanistic Principles of Platinum Oxide Formation and Reduction”, Electrocatalysis, vol. 5, no. 3, pp. 262–272, 2014.
[20] S. Kreitmeier, M. Michiardi, A. Wokaun, and F. N. Büchi, “Factors determining the gas crossover through pinholes in polymer electrolyte fuel cell membranes”, Electrochim. Acta, vol. 80, pp. 240–247, 2012.
[21] X. Cheng, Z. Shi, N. Glass, L. Zhang, J. Zhang, D. Song, Z. S. Liu, H. Wang, and J. Shen, “A review of PEM hydrogen fuel cell contamination: Impacts, mechanisms, and mitigation”, J. Power Sources, vol. 165, no. 2, pp. 739–756, 2007.