Embed Size (px)
Citation preview

REGUS GROUP PLC3000 HILLSWOOD DRIVEHILLSWOOD BUSINESS PARKCHERTSEYSURREY KT16 0RSUNITED KINGDOM
WWW.REGUS.COM
REGUS GROUP PLC ANNUAL REPORT 2005
CHANGING THE WAY PEOPLE WORK
REGUS GROUP PLCANNUAL REPORT 2005

CONTENTS02 Chairman’s Statement04 Chief Executive’s Review06 Spotlight on Our Regions12 Financial Review14 Board of Directors16 Directors’ Report18 Corporate Governance22 Remuneration Report28 Statement of Directors’ Responsibilities29 Independent Auditors’ Report30 Financial Statements34 Notes to the Accounts60 Parent Company Accounts63 Five Year Summary64 Corporate Directory
As the leading global offi ce outsourcing providerwe continue to pursue selective growth opportunitiesand acquisitions that will bring positive impact to ourbusiness in the future.
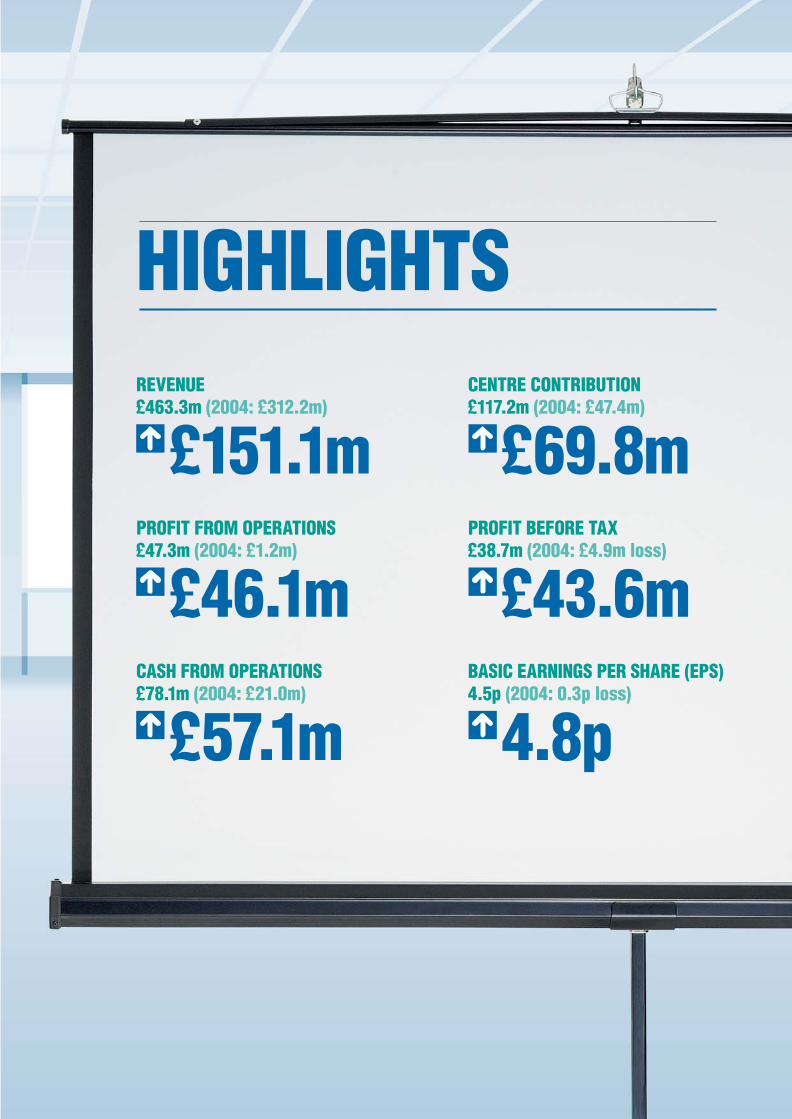
HIGHLIGHTSREVENUE£463.3m (2004: £312.2m)
£151.1mCENTRE CONTRIBUTION£117.2m (2004: £47.4m)
£69.8mPROFIT FROM OPERATIONS£47.3m (2004: £1.2m)
£46.1mPROFIT BEFORE TAX£38.7m (2004: £4.9m loss)
£43.6mCASH FROM OPERATIONS£78.1m (2004: £21.0m)
£57.1mBASIC EARNINGS PER SHARE (EPS)4.5p (2004: 0.3p loss)
4.8p

We will continue to invest in the long term growth ofthe business. Favourable market drivers and strongcash generation have provided a catalyst for the Groupto focus on a disciplined expansion programme.

02Regus Report & Accounts 2005
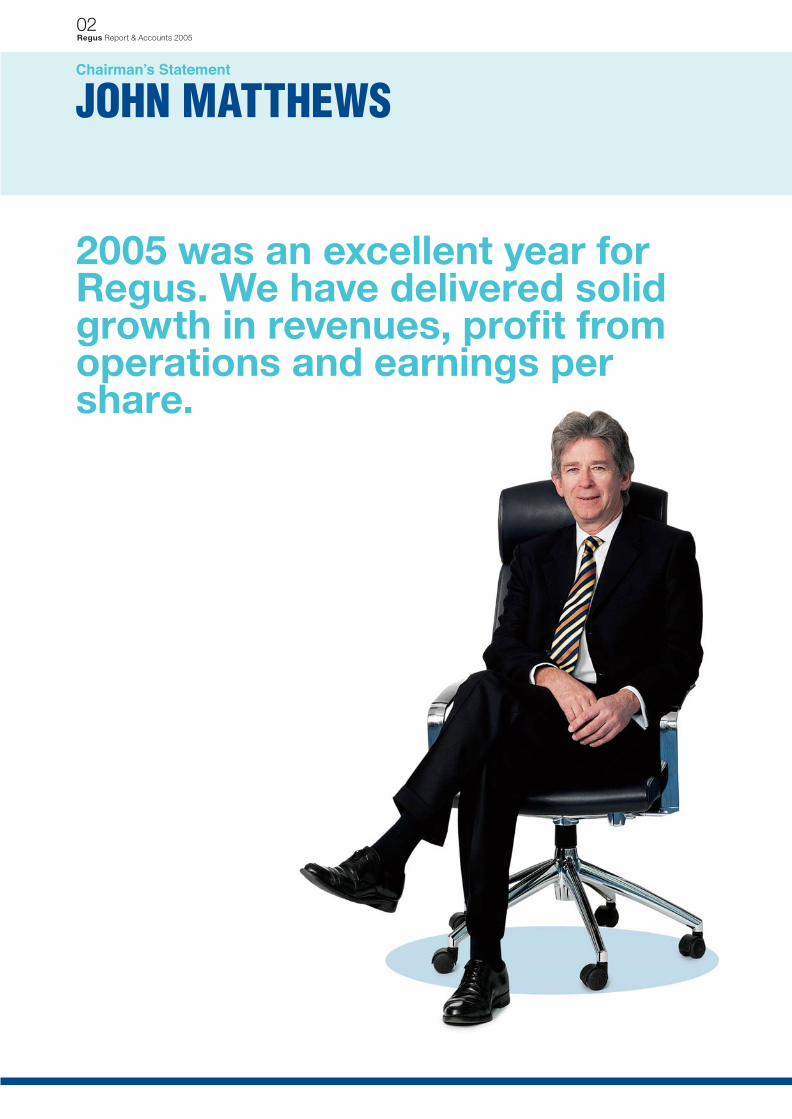
Chairmanʼs Statement
JOHN MATTHEWS
2005 was an excellent year for Regus. We have delivered solid growth in revenues, profi t from operations and earnings per share.
03Regus Report & Accounts 2005
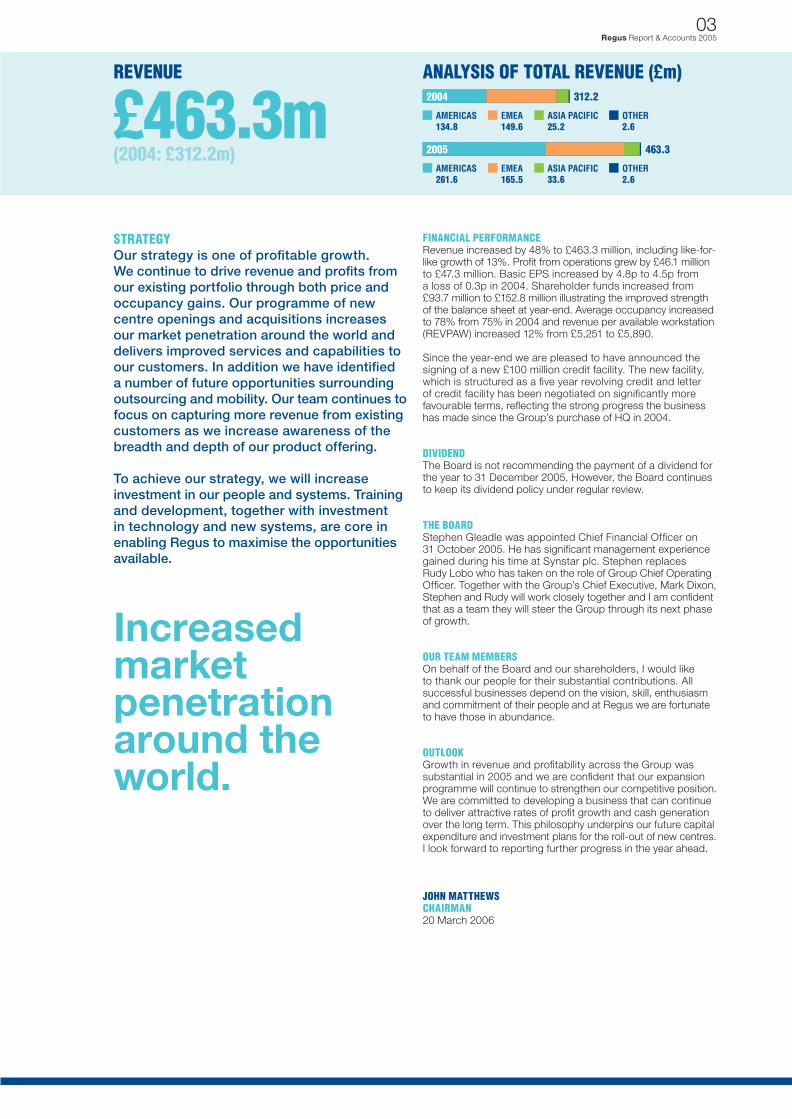
FINANCIAL PERFORMANCERevenue increased by 48% to £463.3 million, including like-for-like growth of 13%. Profi t from operations grew by £46.1 million to £47.3 million. Basic EPS increased by 4.8p to 4.5p froma loss of 0.3p in 2004. Shareholder funds increased from£93.7 million to £152.8 million illustrating the improved strengthof the balance sheet at year-end. Average occupancy increasedto 78% from 75% in 2004 and revenue per available workstation(REVPAW) increased 12% from £5,251 to £5,890.
Since the year-end we are pleased to have announced the signing of a new £100 million credit facility. The new facility, which is structured as a fi ve year revolving credit and letter of credit facility has been negotiated on signifi cantly more favourable terms, refl ecting the strong progress the business has made since the Group’s purchase of HQ in 2004.
DIVIDENDThe Board is not recommending the payment of a dividend for the year to 31 December 2005. However, the Board continues to keep its dividend policy under regular review.
THE BOARDStephen Gleadle was appointed Chief Financial Offi cer on 31 October 2005. He has signifi cant management experience gained during his time at Synstar plc. Stephen replacesRudy Lobo who has taken on the role of Group Chief Operating Offi cer. Together with the Group’s Chief Executive, Mark Dixon,Stephen and Rudy will work closely together and I am confi dentthat as a team they will steer the Group through its next phase of growth.
OUR TEAM MEMBERSOn behalf of the Board and our shareholders, I would like to thank our people for their substantial contributions. All successful businesses depend on the vision, skill, enthusiasm and commitment of their people and at Regus we are fortunate to have those in abundance.
OUTLOOKGrowth in revenue and profi tability across the Group was substantial in 2005 and we are confi dent that our expansionprogramme will continue to strengthen our competitive position.We are committed to developing a business that can continue to deliver attractive rates of profi t growth and cash generationover the long term. This philosophy underpins our future capitalexpenditure and investment plans for the roll-out of new centres.I look forward to reporting further progress in the year ahead.
JOHN MATTHEWSCHAIRMAN20 March 2006
STRATEGYOur strategy is one of profi table growth. We continue to drive revenue and profi ts from our existing portfolio through both price and occupancy gains. Our programme of new centre openings and acquisitions increases our market penetration around the world and delivers improved services and capabilities to our customers. In addition we have identifi ed a number of future opportunities surrounding outsourcing and mobility. Our team continues to focus on capturing more revenue from existing customers as we increase awareness of the breadth and depth of our product offering.
To achieve our strategy, we will increase investment in our people and systems. Trainingand development, together with investment in technology and new systems, are core in enabling Regus to maximise the opportunities available.
REVENUE
£463.3m(2004: £312.2m)
Increased marketpenetration around the world.
OVERVIEW It has been an outstanding year for Regus. Our excellent fi nancial performance stems fromour continued investment in growing our existingbusinesses and our ability to identify and exploitnew opportunities through both organic growth and acquisitions. During the course of the yearwe have continued to invest in all of our regionsand they have all contributed to this strong set of results.
We are constantly looking for ways to expand the business responding to the ever-increasing trend towards outsourcing by companies both large and small. In addition, the growing trend towards home, mobile and remote working is also driving growth in our business. We will constantly evaluate the needs of our customersand ensure we develop products to meet their requirements.
We continue to implement our disciplined expansion strategy, driving the performance of our mature business and opening new centres, which will increase our market penetration as we benefi t from our size and reach.
04Regus Report & Accounts 2005
Chief Executiveʼs Review
MARK DIXON
NEW AND INNOVATIVE PRODUCTSWe are committed to broadening our product offering. During 2005 we launched Network Access which provides immediate, unlimited access to the Regus network of business lounges around the world. Pioneered by Regus, Network Access comprises a unique membership where members can enjoy access to the Regus global network of business centres.
In response to customer demand, we have created specifi c management services tailored to meet individual requirements.One such product is Netspace, a fully outsourced solutiondesigned to assist companies in setting up new sales operations or overseas offi ces. Through this service, Regus sources, negotiates, acquires and leases the workspace, oversees the fi t out and confi gures the workspace to the client’sneeds in addition to manage IT and telecoms procurement and installation.
INVEST IN SYSTEMS AND TECHNOLOGYThe focus of the Regus IT strategy is to provide fast, effective, hassle free technology to ensure we as a business operate effi ciently and our clients achieve business success. We take pride in developing home grown systems that are tailor-made to the business requirements. Currently we are implementing new systems in the areas of inventory, reservations and billing, customer relationship management and fi nancial reporting.
IMPLEMENTING OPERATIONAL EXCELLENCESales and marketingThe Group’s marketing and advertising spend is focused geographically and by customer segment. Marketing is undertaken in regions and we use a number of channels to promote our offer. In November 2005 we signed a signifi cant deal with Delta Airlines Crown Room members where 152,000 members have been provided with Network Access cards toutilise Regus facilities across the globe. The alliance has provedextremely popular with over 10% of members activating theircards and starting to use the Regus network in the fi rst two months. We are in negotiations with a number of other airlines and look forward to signing further deals in the coming months.
Internet bookings During the year we have invested signifi cantly in our website application through the launch of multi-language websites. Further investment to improve our web presence will continue in 2006.
Continued investment in growing our existing businesses.
SPOTLIGHT ON OUR REGIONSTURN TO PAGES 6 AND 7 TO SEE OUR REVIEW OF THE AMERICAS
TURN TO PAGES 8 AND 9 TO SEE OUR REVIEW OF EMEA
TURN TO PAGES 10 AND 11 TO SEE OUR REVIEW OF ASIA PACIFIC
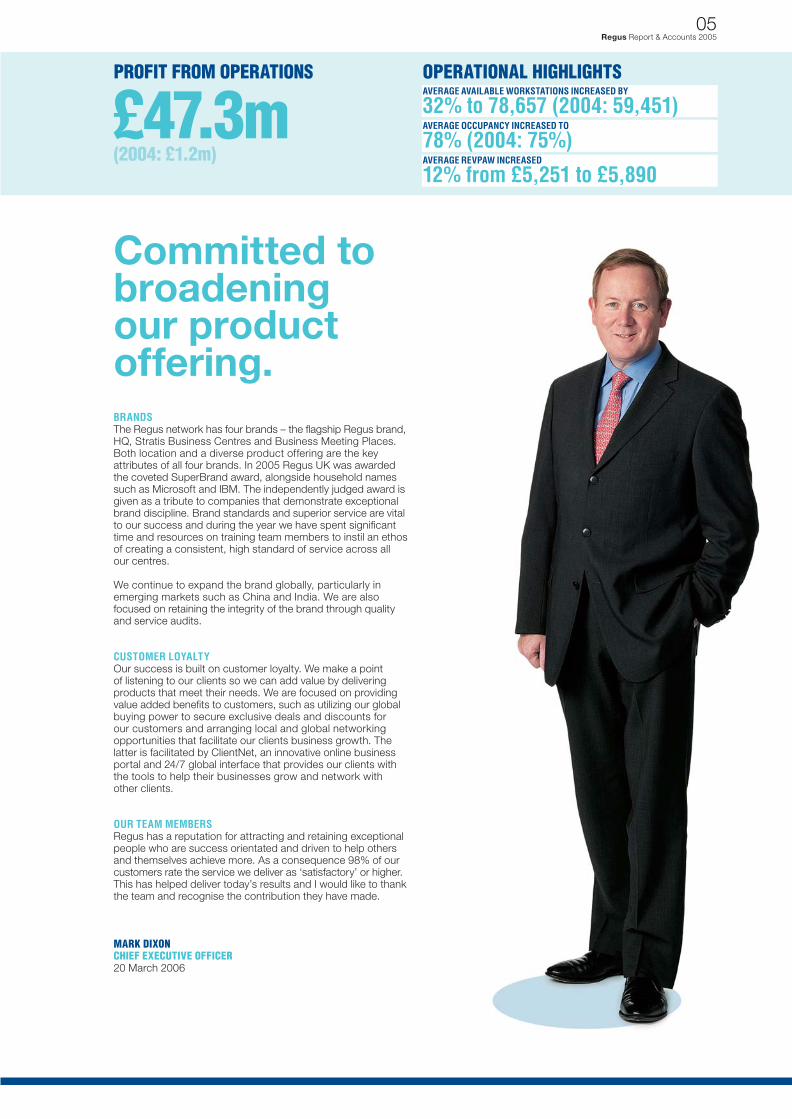
OPERATIONAL HIGHLIGHTSAVERAGE AVAILABLE WORKSTATIONS INCREASED BY
32% to 78,657 (2004: 59,451)AVERAGE OCCUPANCY INCREASED TO
78% (2004: 75%)AVERAGE REVPAW INCREASED
12% from £5,251 to £5,890
05Regus Report & Accounts 2005
BRANDSThe Regus network has four brands – the fl agship Regus brand,HQ, Stratis Business Centres and Business Meeting Places. Both location and a diverse product offering are the key attributes of all four brands. In 2005 Regus UK was awarded the coveted SuperBrand award, alongside household names such as Microsoft and IBM. The independently judged award isgiven as a tribute to companies that demonstrate exceptional brand discipline. Brand standards and superior service are vitalto our success and during the year we have spent signifi cant time and resources on training team members to instil an ethos of creating a consistent, high standard of service across all our centres.
We continue to expand the brand globally, particularly in emerging markets such as China and India. We are also focused on retaining the integrity of the brand through quality and service audits.
CUSTOMER LOYALTYOur success is built on customer loyalty. We make a point of listening to our clients so we can add value by delivering products that meet their needs. We are focused on providingvalue added benefi ts to customers, such as utilizing our global buying power to secure exclusive deals and discounts for our customers and arranging local and global networking opportunities that facilitate our clients business growth. The latter is facilitated by ClientNet, an innovative online business portal and 24/7 global interface that provides our clients with the tools to help their businesses grow and network with other clients.
OUR TEAM MEMBERSRegus has a reputation for attracting and retaining exceptional people who are success orientated and driven to help others and themselves achieve more. As a consequence 98% of ourcustomers rate the service we deliver as ‘satisfactory’ or higher.This has helped deliver today’s results and I would like to thank the team and recognise the contribution they have made.
MARK DIXONCHIEF EXECUTIVE OFFICER20 March 2006
Committed to broadening our product offering.
PROFIT FROM OPERATIONS
£47.3m(2004: £1.2m)

06Regus Report & Accounts 2005
AMERICAS
AMERICAS: AT A GLANCE (a)
(a) Owned centres excluding joint ventures and franchises.
REVIEW The fi rst full year of operations following the HQ acquisition in North America has been very successful. Average occupancy increased from 80% to 81% with growth across all countries. REVPAW grew by an average of 13% year-on-year to £5,529 and we have added a total of 31 new centres in the region. The average number of available workstations has increased by 72% to 47,311 (2004: 27,585), primarily refl ecting the full year impact of the HQ acquisition in August 2004.
In terms of marketing, our most recent campaign “That works for me” has been targeted at both TV and Radio and has been launched to help increase customers awareness of the Regus offering.
“The people make Regus successful and fun to work for. I am very proud to be a member of a company that has such a strong team and vision and will ultimately change the way people work.”LORRAINE VEBER, GLOBAL DIRECTOR SALES OPERATIONS, REGUS

07Regus Report & Accounts 2005

08Regus Report & Accounts 2005
EMEA
EMEA: AT A GLANCE (a)
(a) Owned centres excluding joint ventures, UK associate and franchises.
REVIEW EMEA made strong progress in the year with average occupancy increasing from 68% in 2004 to 73% in 2005. REVPAW improved 17% year-on-year to £6,397. The averagenumber of available workstations has decreased by 6% to 25,871 (2004: 27,431) driven by the closure of underperforming workstations in 2004.
We have strengthened our EMEA management team through recruiting specialised individuals and restructuring the regional organisation.
“Regus gives me a unique opportunity to change the wayour customers are working.It is a great proposition and customers are realising the opportunities we can offer them to help grow their businesses effi ciently and without the risks.”GARRY GÜRTLER, REGIONAL GENERAL MANAGER, REGUS

09Regus Report & Accounts 2005

ASIA PACIFIC10Regus Report & Accounts 2005
ASIA PACIFIC: AT A GLANCE (a)
(a) Owned centres excluding joint ventures and franchises.
REVIEW Asia is our smallest region but continues to grow rapidly with a 33% increase in revenue, driven by strong pricing and occupancyin Japan, Hong Kong and Singapore. Average occupancy fell slightly from 76% to 75% driven by the impact of new centre openings with low starting occupancy. REVPAW grew by 8% year-on-year to £6,137 and we have added a total of 15 new centres. The average number of available workstations has increased by 23% to 5,475 (2004: 4,435).
“As a sales orientated person I feel immensely inspired by the Regus vision, the business model and the great concepts of changing the way people work. The satisfaction comes from not just closing a deal or helping customers fi nd an offi ce, but to tailor a Regus solution applicable to the global needs of different corporations.”ESTHER YEE, BUSINESS DEVELOPMENT DIRECTOR, REGUS

11Regus Report & Accounts 2005
As a percentage of revenue, administrative expenses (before non-recurring items) have fallen slightly to 14.0% of revenue (2004: 14.2%).
NON-RECURRING ITEMSResults for the year include net non-recurring costs of £4.9 million (2004: £8.6 million). In 2005 these costs primarily relate to the integration of HQ. In 2004 they primarily relate to impairment of fi xed assets and provisions on onerous leases.
PROFIT FROM OPERATIONSProfi t from operations was £47.3 million (2004: £1.2 million), representing a margin of 10.2% (2004: 0.3%).
SHARE OF OPERATING LOSS IN JOINT VENTURES AND ASSOCIATEIn the year ended 31 December 2005, the share of joint venture losses attributable to Regus reduced to £0.2 million (2004: £0.7 million) as they benefi ted from better trading conditions.
Our UK associate reported £0.5 million profi t after tax (2004: £7.1 million loss on a restated International Financial Reporting Standard (IFRS) basis) in the 12 month period ended31 December 2005. Our 42% shareholding resulted in a £0.2 million profi t (2004: £3.0 million loss) being credited to our Group profi t and loss account. Improved pricing and cost savings contributed to this performance.
FINANCING COSTSFinancing (or interest) costs can be summarised as follows:
2005 2004 £m £m
Interest payable (5.6) (2.9)Interest receivable 2.2 1.3Finance lease interest (0.9) (0.5)Deferred fi nancing fees (4.3) (0.3)Total (8.6) (2.4)
Net interest payable has risen following the arrangement of a US $155 million loan facility in August 2004 to fund the acquisition of HQ. This has been partially offset by increasing interest receivable following the Group’s strong cash generation,which has driven the average free cash balance up from £40 million in 2004 to £55 million in 2005.
Underlying fi nance lease costs have fallen year on year by £0.8 million after taking account of a one-off adjustment of £1.2 million in 2004. This is consistent with the net movement of fi nance leases.
Deferred fi nancing fees relate to the loan arrangement costs with respect to the US $155 million facility mentioned above. Following the accelerated repayment of the loan and in anticipation of the repayment of the remainder early in 2006 the Group has written off the remaining deferred fi nancing fees consistent with the effective rate method.
TAXATIONAs the business performance has strengthened, it has become necessary to recognise in the profi t and loss account a greater proportion of the value of the tax losses that the Group holds. Accordingly in 2005, £15.0 million has been credited to the profi t and loss account, which has correspondingly increased the deferred tax asset in the balance sheet. This has been partially offset by an £8.9 million (2004: £0.9 million) tax charge which resulted in a net tax credit of £6.1 million (2004: £2.6 million) to the profi t and loss account. Therefore as a
INTRODUCTION2005 saw strong profi t growth driven by the full year impact of the HQ acquisition in 2004 and further strengthening of the underlying business.
The three key operational drivers all improved. The weighted average number of workstations increased by 32% to 78,657 (which includes the full year impact of HQ). At the same time average occupancy increased from 75% to 78% and average revenue per occupied workstation (REVPOW) increased by 8% from £7,001 to £7,551. This results in an increase in our key indicator REVPAW of 12% from £5,251 to £5,890.
Against a relatively fi xed cost base these factors have contributed to a £46.1 million increase in profi t from operations from £1.2 million in 2004 to £47.3 million in 2005.
REVENUE AND CENTRE CONTRIBUTION(BEFORE NON-RECURRING ITEMS)Revenue for the Group rose 48% to £463.3 million (2004: £312.2 million) and centre contribution (before non-recurring items) increased 117% to £117.1 million (2004: £54.0 million).
This year-on-year movement can be analysed as follows:
Centre Revenue contribution % of £m £m revenue
2004 312.2 54.0 17Growth in mature business (a) 31.9 31.3 –Full year impact of centresadded in 2004 (principally HQ) 111.4 30.9 –Centres added in 2005 10.8 (0.1) –Centres closed (3.0) 1.0 –2005 463.3 117.1 25
(a) The mature business defi ned as those centres owned and operated at least 12 months prior to the start of the fi nancial year.
The mature business, defi ned as those centres owned and operated at least 12 months prior to the start of the fi nancial year, increased revenue by £31.9 million driven by occupancy and price. This revenue increase was almost completely refl ectedin contribution gains supported both by a fall in depreciation and the full year effect of cost savings achieved in the mature business following the integration of HQ.
Centres added in 2004 (principally the HQ acquisition) contributed a further £111.4 million of revenue and £30.9 millionof contribution. This was due to both underlying improvements in the performance of these sites and the impact of accounting for them for a full 12 months. New centres added in 2005, both organic and by acquisition, contributed a further £10.8 million of revenue and a small loss of contribution of £0.1 million. This loss refl ects start up costs and low rates of occupation when new centres are opened.
Taking all this together contribution margin improved from 17% to 25%.
ADMINISTRATION EXPENSES (BEFORE NON-RECURRING ITEMS)Administration expenses before non-recurring items have increased by £20.7 million to £64.9 million. The full year effect of HQ together with other acquisitions contributed £11.0 million of the increase. A further £3.3 million relates to the cost of enhancing our business support functions and £6.4 million was spent on growth related activities.
12Regus Report & Accounts 2005
Financial Review
STEPHEN GLEADLE
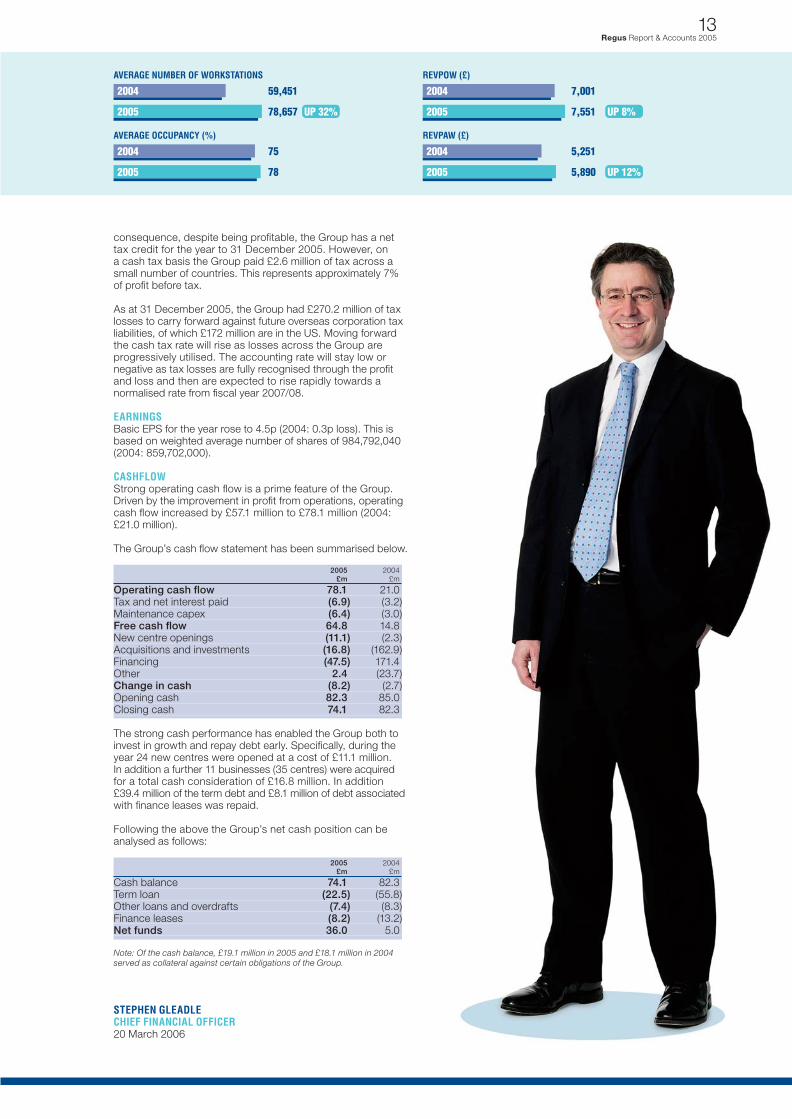
consequence, despite being profi table, the Group has a net tax credit for the year to 31 December 2005. However, on a cash tax basis the Group paid £2.6 million of tax across a small number of countries. This represents approximately 7% of profi t before tax.
As at 31 December 2005, the Group had £270.2 million of tax losses to carry forward against future overseas corporation tax liabilities, of which £172 million are in the US. Moving forward the cash tax rate will rise as losses across the Group are progressively utilised. The accounting rate will stay low or negative as tax losses are fully recognised through the profi t and loss and then are expected to rise rapidly towards a normalised rate from fi scal year 2007/08.
EARNINGSBasic EPS for the year rose to 4.5p (2004: 0.3p loss). This is based on weighted average number of shares of 984,792,040 (2004: 859,702,000).
CASHFLOWStrong operating cash fl ow is a prime feature of the Group. Driven by the improvement in profi t from operations, operatingcash fl ow increased by £57.1 million to £78.1 million (2004: £21.0 million).
The Group’s cash fl ow statement has been summarised below.
2005 2004 £m £m
Operating cash fl ow 78.1 21.0Tax and net interest paid (6.9) (3.2)Maintenance capex (6.4) (3.0)Free cash fl ow 64.8 14.8New centre openings (11.1) (2.3)Acquisitions and investments (16.8) (162.9)Financing (47.5) 171.4Other 2.4 (23.7)Change in cash (8.2) (2.7)Opening cash 82.3 85.0Closing cash 74.1 82.3
The strong cash performance has enabled the Group both to invest in growth and repay debt early. Specifi cally, during the year 24 new centres were opened at a cost of £11.1 million. In addition a further 11 businesses (35 centres) were acquired for a total cash consideration of £16.8 million. In addition £39.4 million of the term debt and £8.1 million of debt associatedwith fi nance leases was repaid.
Following the above the Group’s net cash position can be analysed as follows:
2005 2004 £m £m
Cash balance 74.1 82.3Term loan (22.5) (55.8)Other loans and overdrafts (7.4) (8.3)Finance leases (8.2) (13.2)Net funds 36.0 5.0
Note: Of the cash balance, £19.1 million in 2005 and £18.1 million in 2004 served as collateral against certain obligations of the Group.
STEPHEN GLEADLECHIEF FINANCIAL OFFICER20 March 2006
13Regus Report & Accounts 2005

BOARD OF DIRECTORS14Regus Report & Accounts 2005
MARK DIXONCHIEF EXECUTIVE OFFICERChief Executive and Founder, Mark (46) is one of Europe’s best-known entrepreneurs. Since founding Regus in Brussels in 1989, he has achieved a formidable reputation for leadershipand innovation. Prior to Regus he established businesses in the retail and wholesale food industry. Recipient of two major awards for enterprise, Mark’s vision of the future of work has revolutionised the way business approaches its property needs.
STEPHEN GLEADLECHIEF FINANCIAL OFFICERStephen (47) joined Regus as Chief Financial Offi cer on 31 October 2005. Stephen was Group Financial Controller of Tarmac plc, after which he was Finance Director of Synstar plcand of lastminute.com plc. Stephen replaced Rudy Lobo who has held the post since October 2003. Rudy has taken up the role of Chief Operating Offi cer. Stephen is a Chartered Accountant.
RUDY LOBOCHIEF OPERATING OFFICERRudy (50) joined Regus in 1992 as Chief Financial Offi cer and reassumed the role in October 2003. In October 2005 he relinquished this role to Stephen Gleadle and took up the role of Chief Operating Offi cer. In this role, he is responsible for commercial operations, human resources and for directing Regus’ IT and e-business strategy. Rudy is also a Director and Trustee of the charity Great Causes Ltd. Previously, Rudy was Head of Finance and Group Company Secretary of Medicom International Ltd, a publisher of medical journals. Rudy is a Certifi ed Accountant.
15Regus Report & Accounts 2005
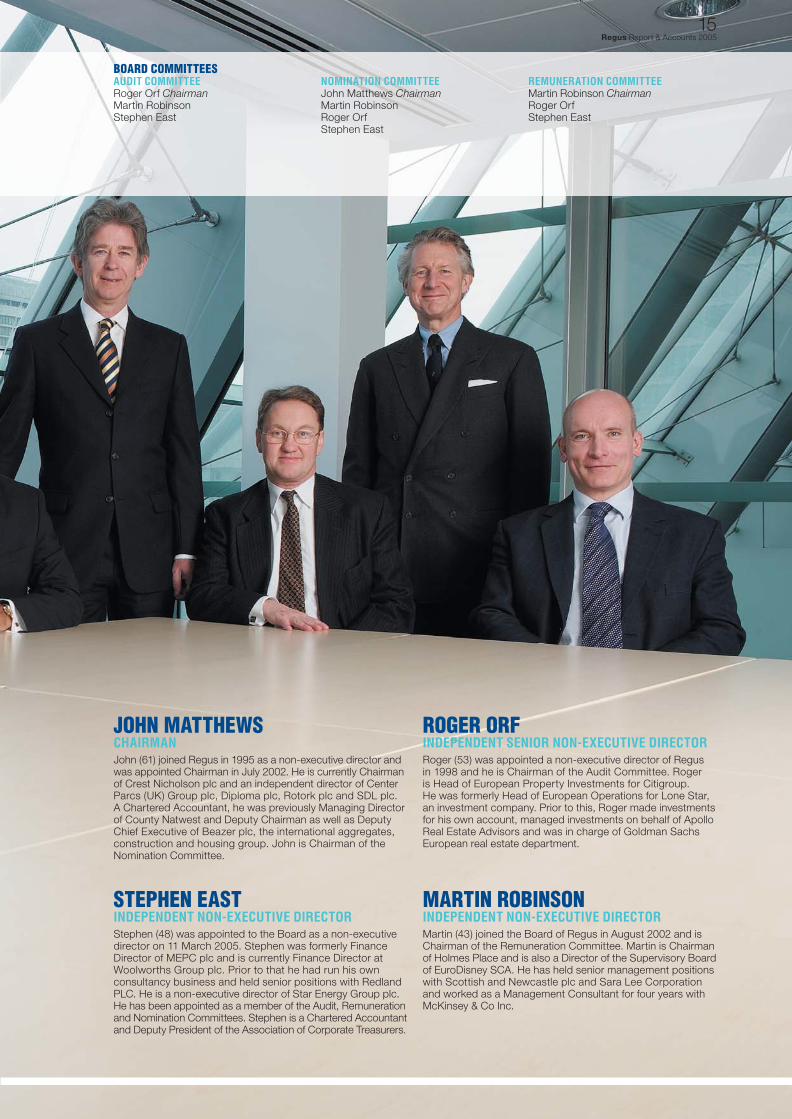
ROGER ORFINDEPENDENT SENIOR NON-EXECUTIVE DIRECTORRoger (53) was appointed a non-executive director of Regus in 1998 and he is Chairman of the Audit Committee. Roger is Head of European Property Investments for Citigroup. He was formerly Head of European Operations for Lone Star, an investment company. Prior to this, Roger made investments for his own account, managed investments on behalf of Apollo Real Estate Advisors and was in charge of Goldman Sachs European real estate department.
MARTIN ROBINSONINDEPENDENT NON-EXECUTIVE DIRECTORMartin (43) joined the Board of Regus in August 2002 and is Chairman of the Remuneration Committee. Martin is Chairmanof Holmes Place and is also a Director of the Supervisory Boardof EuroDisney SCA. He has held senior management positions with Scottish and Newcastle plc and Sara Lee Corporation and worked as a Management Consultant for four years with McKinsey & Co Inc.
BOARD COMMITTEESAUDIT COMMITTEERoger Orf ChairmanMartin RobinsonStephen East
NOMINATION COMMITTEEJohn Matthews ChairmanMartin RobinsonRoger OrfStephen East
REMUNERATION COMMITTEEMartin Robinson ChairmanRoger OrfStephen East
JOHN MATTHEWSCHAIRMANJohn (61) joined Regus in 1995 as a non-executive director andwas appointed Chairman in July 2002. He is currently Chairmanof Crest Nicholson plc and an independent director of Center Parcs (UK) Group plc, Diploma plc, Rotork plc and SDL plc. A Chartered Accountant, he was previously Managing Director of County Natwest and Deputy Chairman as well as Deputy Chief Executive of Beazer plc, the international aggregates, construction and housing group. John is Chairman of the Nomination Committee.
STEPHEN EASTINDEPENDENT NON-EXECUTIVE DIRECTORStephen (48) was appointed to the Board as a non-executive director on 11 March 2005. Stephen was formerly Finance Director of MEPC plc and is currently Finance Director at Woolworths Group plc. Prior to that he had run his own consultancy business and held senior positions with Redland PLC. He is a non-executive director of Star Energy Group plc. He has been appointed as a member of the Audit, Remunerationand Nomination Committees. Stephen is a Chartered Accountantand Deputy President of the Association of Corporate Treasurers.
16Regus Report & Accounts 2005
The directors present their report and the audited fi nancial statements of Regus Group plc for the year ended 31 December 2005.
PRINCIPAL ACTIVITY AND BUSINESS REVIEWThe Group is the world’s leading supplier of global offi ce outsourcing solutions. The Group’s trading results are set out inthe fi nancial statements on pages 30 to 33. Details of the Group’sfuture prospects and review of operations are described in the Chairman’s Statement, Chief Executive’s Review and Operational and Financial Review on pages 2 to 13.
RESULTS AND DIVIDENDSProfi t for the year before tax was £38.7 million (2004: £4.9 millionloss), which after adding back non-recurring items of £4.9 million(2004: £8.6 million) amounted to a profi t of £43.6 million (2004: £3.7 million).
The directors do not recommend the payment of a dividend.
DIRECTORS AND DIRECTORS’ INTERESTSThe directors who held offi ce since the last Annual Report were:
Executive directorsMark Dixon Rudy Lobo Stephen Gleadle (appointed 31 October 2005)
Non-executive directorsJohn Matthews Roger Orf Martin RobinsonStephen East
Biographical details for all current directors are shown on pages 14 and 15.
Details of the directors’ interests and shareholdings are given in the Remuneration Report on pages 22 to 27.
CORPORATE AND SOCIAL RESPONSIBILITY The Board recognises its responsibilities in respect of social, environmental and ethical (SEE) matters. The directors continually monitor risks to its businesses, including SEE risks, which may impact the Group’s short and long term value. During 2005 no signifi cant risks were identifi ed.
PEOPLE AND CULTUREEmployee involvementIt is the Group’s policy to communicate with all employees and to encourage employees to contribute to the management of the business. Communication with employees is carried out through the Company’s intranet, employee newsletters, briefi ngmeetings conducted by senior management and formal and informal discussions. Interim and Annual Reports are available to all staff. Informal communication is further facilitated by the Group’s regional organisational structure.
The workplaceEmpowered employees are key to delivering value for the organisation. Clear accountabilities have been established and reward strategies have been aligned with fi nancial and non-fi nancial performance measures. In our centres we operate
fl exible working practices which give us the edge in retaining experienced and well trained staff and allows us to align our team members’ hours to the evolving needs of the business and our customer requirements.
Equal opportunityThe Group endorses and supports the principal of equalemployment opportunity. It is the policy of the Group to provideequal employment opportunity to all qualifi ed individuals, whichensures that all employment decisions are made, subject to legal obligations, on a non-discriminatory basis. Due consideration is given to the recruitment, promotion, training and working environment of all staff including those with disabilities. It is the Group’s policy to encourage the training and further development of all its employees where this is of benefi t to the individual and to the Group.
HEALTH AND SAFETYThe Board recognises the importance of maintaining high standards of health and safety. This means taking all reasonable and practicable steps to safeguard the health, safetyand welfare of our employees, customers, visitors and other persons who may be affected by our activities. The effective management of health and safety is a legal issue and it is also business critical as it effects reputation, investor confi dence, supplier relationships, staff morale and overall profi tability.
In order to meet these responsibilities the Group:
• Assesses the risks to health and safety• Implements safe systems at work • Provides information, instruction and training• Establishes and maintain emergency procedures• Regularly reviews health and safety policies and procedures.
We are proactive in our approach to health and safety by monitoring proposed changes in legislation and implementing policies accordingly.
THE ENVIRONMENTThe Group does not operate in a business sector which causessignifi cant pollution but the Board recognises that the businessdoes have an impact on the environment. The Board is committed to managing and improving the ways in which our activities affect the environment by:
• Optimising the use of energy – with over 700 locations it is important that we continually identify ways to improve energy effi ciency across all our operations. We have implemented certain initiatives to reduce our energy use. These include, among others, resetting boiler controls, amending time settings for air conditioning and using timing switches for hot water supply.
• Encouraging the re-use and recycling of paper and toner cartridges, mixed offi ce paper, packaging, bottles, aluminium cans and plastic cups.
POLITICAL AND CHARITABLE DONATIONSThe Group made no charitable donations during the year (2004: £nil). It is the Group’s policy not to make political donations either in the UK or overseas.
DIRECTORS’ REPORT
17Regus Report & Accounts 2005
POLICY AND PRACTICE ON PAYMENT OF CREDITORSThe Group does not follow a universal code dealing specifi callywith payments to suppliers but, where appropriate, our practiceis to:
• Agree the terms of payment upfront with the supplier• Ensure that suppliers are made aware of these terms of payment• Pay in accordance with contractual and other legal obligations.
At 31 December 2005, the number of creditor days outstandingfor the Group was 27 days (2004: 35 days) and the Company, nil days (2004: nil days).
GOING CONCERNThe directors, having made appropriate enquiries, have a reasonable expectation that the Group and the Company have adequate resources to continue in operational existence for the foreseeable future. For this reason they continue to adopt the going concern basis in preparing the Accounts on pages 30 to 62.
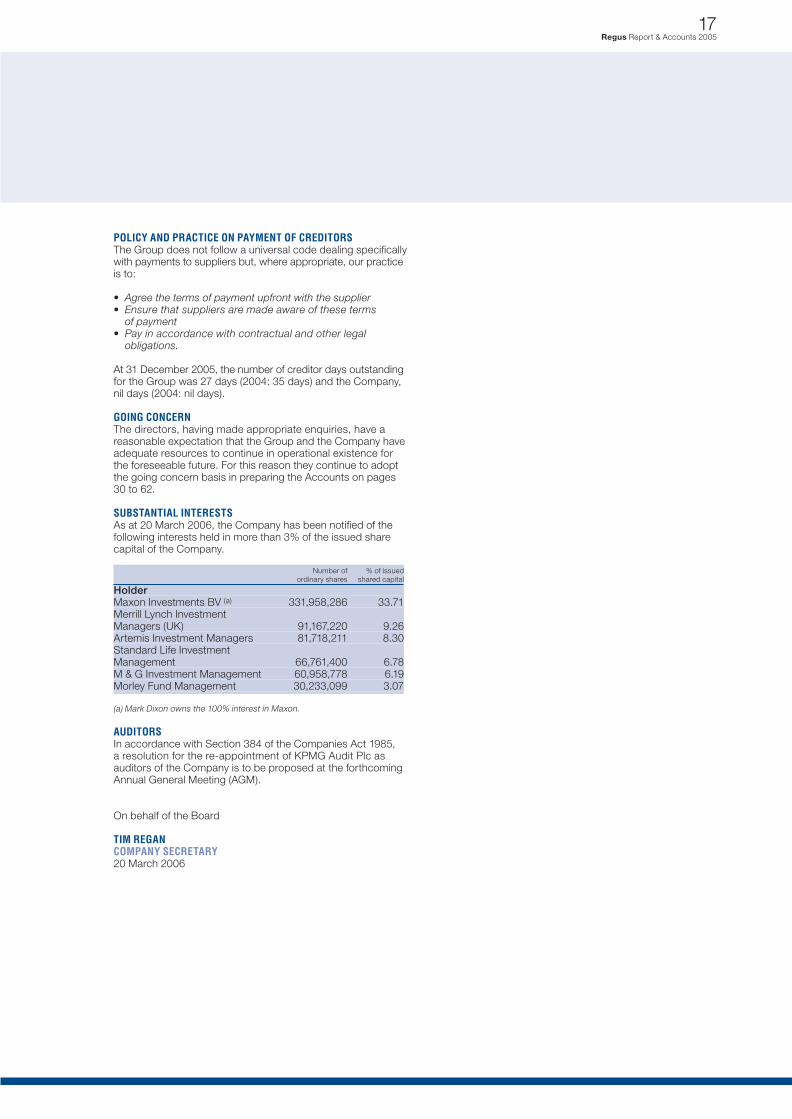
SUBSTANTIAL INTERESTSAs at 20 March 2006, the Company has been notifi ed of the following interests held in more than 3% of the issued share capital of the Company.
Number of % of issued ordinary shares shared capital
HolderMaxon Investments BV (a) 331,958,286 33.71Merrill Lynch InvestmentManagers (UK) 91,167,220 9.26Artemis Investment Managers 81,718,211 8.30Standard Life InvestmentManagement 66,761,400 6.78M & G Investment Management 60,958,778 6.19Morley Fund Management 30,233,099 3.07
(a) Mark Dixon owns the 100% interest in Maxon.
AUDITORSIn accordance with Section 384 of the Companies Act 1985, a resolution for the re-appointment of KPMG Audit Plc as auditors of the Company is to be proposed at the forthcoming Annual General Meeting (AGM).
On behalf of the Board
TIM REGANCOMPANY SECRETARY20 March 2006
The Board has delegated authority to the Remuneration Committee to set the remuneration policy for directors and senior management. The Nomination Committee recommends the appointment of Board directors and has responsibility for succession planning at Board level. The various Board Committees have authority to make decisions in their areas of expertise.
Matters reserved for the Board are considered by the Board and no one individual has unrestricted powers of decision. There are well documented procedures and controls, including a schedule of matters that require the Board’s specifi c approval.This provides the framework for decisions to be taken by the Board and those that are delegated to Committees of the Board. All capital expenditure projects over £1 million require Board approval.
The Chairman and Company Secretary are responsible for ensuring all directors are properly briefed on issues arising at Board meetings and that they have full and timely access to relevant information.
All directors, both executive and non-executive, are encouragedto request inclusion of any unresolved concerns that they may have in the Board minutes.
All directors have access to the advice and services of the Company Secretary, who is responsible for ensuring that Board procedures, corporate governance and regulatory compliance are followed and complied with. Should a director request independent professional advice to carry out his duties,such advice is available to him at the Company’s expense.
The Group’s insurance programme is reviewed annually and appropriate insurance cover is obtained to protect the directorsand senior management in the event of a claim being brought against any of them in their capacity as directors and offi cers of the Company.
ATTENDANCE AT MEETINGSThere were fi ve scheduled Board meetings during 2005 and seven additional meetings to consider matters, which were time critical and not appropriate to be dealt with by way of written resolution.
The number of meetings of the Board and Committees and individual attendance by the directors are shown below.
Main Audit Remuneration Nomination Board Committee Committee Committee
Total meetings 12 3 5 2ExecutiveMark Dixon 11 – – –Stephen Gleadle (a) 2 – – –Rudy Lobo 11 – – –Non-executiveJohn Matthews (b) 10 1 1 2Roger Orf 9 3 3 2Martin Robinson 11 3 5 2Stephen East (c) 9 1 4 1
(a) Appointed 31 October 2005.(b) Resigned from Audit and Remuneration Committees 11 March 2005.(c) Appointed 11 March 2005.
18Regus Report & Accounts 2005
The Board is committed to high standards of corporate governance and has applied the principles of corporate governance recommended in Section 1 of the Combined Code published in July 2003 (the Combined Code) and applicable to all reporting periods beginning after 1 November 2003.
COMPLIANCE WITH THE NEW COMBINED CODEThe Company has complied with the provisions set out in section 1 of the Combined Code throughout the year ended 31 December 2005, with the exception of the following:
• Provision D.1.1 – The senior independent non-executive director, Roger Orf does not have regular meetings with major external shareholders. However he is available to meet them as requested.
THE BOARDThe Board is chaired by John Matthews. At the year-end the Board consisted of three executive directors and four non-executive directors. Biographical details of the directors are set out on pages 14 and 15.
DIVISION OF RESPONSIBILITIESThere is a clear division of responsibilities between the Chairmanand the Chief Executive. John Matthews is responsible for leadership of the Board, setting its agenda and monitoring its effectiveness. He ensures effective communication with shareholders and that the Board is aware of the views of major shareholders. He facilitates both the contribution of the non-executive directors and constructive relations between the executive directors and non-executive directors. He ensures that the Chief Executive develops a strategy which is supportedby the Board as a whole. Mark Dixon is responsible for formulating strategy and for its delivery once agreed by the Board. He creates a framework of strategy, values, organisationand objectives to ensure the successful delivery of key targets, and allocates decision making and responsibilities accordingly.
The Chairman participates in investor meetings and makes himself available for questions, in person, at the time of major announcements. This direct contact, together with feedback from management and from the Company’s two in-house brokers (Dresdner Kleinwort Wasserstein and Credit Suisse First Boston), is used to brief the Board. The Board considers it appropriate for the Chairman to be the main conduit with investors, rather than the senior independent non-executive director. The Chairman regularly updates the Board and particularly the senior independent non-executive director on the results of his meetings and the opinions of investors. On this basis, Regus considers that the senior independent non-executive director is able to gain full awareness of the issues and concerns of major shareholders. Notwithstanding this policy, all directors have a standing invitation to participate in meetings with investors.
ROLE OF THE BOARDThe Board considers that its primary role is to provide leadershipand to develop a coherent long term strategy for the Group. The Board approves the corporate plan and the annual budgetand reviews performance against targets at every meeting.Through the Audit Committee, the directors ensure the integrityof fi nancial information, the effectiveness of fi nancial controls and the internal control and risk management system.
CORPORATE GOVERNANCE
Audit CommitteeRoger Orf ChairmanMartin Robinson Stephen East
The Board has delegated the responsibility for applying an effective system of internal control and compliance, accurate external fi nancial reporting, fulfi lling its obligations under law and the Combined Code, and managing the relationship with the Company’s external auditors to the Audit Committee. The Committee consists entirely of non-executive directors.
The Audit Committee meets at least three times a year with representatives of the external auditors. At the request of the Chairman, the Chief Financial Offi cer, the Company Secretary and the Head of Internal Audit attend each meeting.
SUMMARY TERMS OF REFERENCE:
Financial Reporting – provide support to the Board by monitoring the integrity of and ensuring that the published fi nancial statements of the Group and any formal announcements relating to the Company’s fi nancial performance comply fully with the relevant statutes and accounting standards.
Internal control and risk systems – review the effectiveness of the Group’s internal controls and risk management systems.
Internal audit – monitor and review the annual internal audit programme ensuring that the internal audit function is adequately resourced and free from management restrictions, review and monitor responses to the fi ndings and recommendations of the internal auditors.
External audit – oversee the relationship with the external auditor including (but not limited to) approval of their remuneration, approval of their terms of engagement, assessing annually their independence and objectivity.
Employee concerns – the Committee reviews the Company’s arrangements under which employees may in confi dence raise any concerns regarding possible wrongdoing in fi nancial reporting or other matters. The Committee ensures that these arrangements allow proportionate and independent investigation and appropriate follow up action.
THE FULL TERMS OF REFERENCE CAN BE FOUND ON WWW.REGUS.COM
External auditors – KPMGThe Committee advises the Board on the appointment, re-appointment, removal and remuneration of external auditors.KPMG Audit Plc were the Company’s auditors for the year ended 31 December 2005. For 2006, the Committee has recommended to the Board that a resolution to re-appoint KPMG Audit Plc as the Company’s auditors be proposed at the2006 AGM. The Committee will continue to keep under review the independence and objectivity of the external auditors, the effectiveness of the audit process and the rotation of the lead audit partner.
19Regus Report & Accounts 2005
INDEPENDENCE AND NON-EXECUTIVE DIRECTORSThe Chairman is not deemed to be independent because he has been a non-executive director for more than ten years. All of the other non-executive directors who have served during the year are considered to be independent. The non-executivedirectors bring wide and varied commercial experience to Board and Committee deliberations. They are appointed for an initial three year term, subject to election by shareholders at the fi rst AGM after their appointment.
TRAINING AND PROFESSIONAL DEVELOPMENTAppropriate training is made available for all new directors toassist them in the discharge of their responsibilities. Subsequentto joining, Stephen Gleadle completed a formal induction programme including centre visits and meetings with senior management and external advisers. Training is provided on an ongoing basis to meet particular needs with the emphasis on governance and accounting developments. During the year the Company Secretary, Tim Regan, provided updates to the Board on relevant governance matters, whilst the Audit Committee regularly considers new accounting developments through presentations from management and the external auditors. The Board programme includes presentations from management at every meeting which, together with site visits, increases the non-executive directors understanding of the business and sector.
PERFORMANCE EVALUATIONDuring 2005, a formal annual performance evaluation has beenconducted in respect of the Board and its Committees by meansof an internally produced written questionnaire. The results of these evaluations were presented to the Board and actions to improve the effectiveness of the Board and the Committees were agreed and have been implemented accordingly. Fellow directors conducted a performance evaluation of each of the directors. The results of this process were collated and presented by the Chairman in one to one meetings. Evaluation of the Chairman’s performance was collated by Roger Orf.
RE-ELECTION OF THE BOARDAll directors submit themselves for re-election by shareholders at least every three years and directors appointed during the period are required to seek re-election at the next AGM.
Non-executive directors are subject to the re-election requirements and serve the Company under letters of appointment, which have an initial three year term.
COMPANY SECRETARYThe Company Secretary, Tim Regan, is responsible for advisingthe Board, through the Chairman, on all governance matters. The appointment and removal of the Company Secretary is a matter reserved for the Board.
BOARD COMMITTEES AND TERMS OF REFERENCEThe Board has delegated certain of its governance responsibilities to the Audit, Nomination and Remuneration Committees. The Company Secretary acts as secretary to all of the Board Committees and minutes of meetings are circulated to all Board members. The terms of reference of these Committees have been documented and approved by the Board.
The Committee also meets independently with the Company’sauditors and with the Head of Internal Audit to informally discussmatters of interest.
Policy on non-audit servicesThe scope and extent of non-audit work undertaken bythe Company’s auditor is monitored by and, above certain thresholds, requires prior approval from the Committee to ensure that the provision of non-audit services does not impair their independence or objectivity. During the year, KPMGperformed due diligence work on certain acquisitions. KPMG is prohibited from providing services that would be consideredto jeopardise their independence such as book keeping services,valuations and system design.
Nomination CommitteeJohn Matthews ChairmanMartin RobinsonRoger OrfStephen East
SUMMARY TERMS OF REFERENCE:
Board appointment and composition – to regularly review the structure, size and composition of the Board and make recommendations on the role and nomination of directors for appointment and reappointment to the Board for the purpose of ensuring a balanced Board in respect of skills, knowledge and experience.
Board Committees – to make recommendations to the Board in relation to the suitability of candidates for membership of the Audit and Remuneration Committees. The appointment and removal of directors are matters reserved for the full Board.
Board effectiveness – to assess the role of Chairman and Chief Executive and make appropriate recommendations to the Board.
Board performance – assist the Chairman with the annual performance evaluation to assess the overall and individual performance and effectiveness of the Board.
Leadership – to remain fully informed about strategic issues and commercial matters affecting the Company and to keep under review the leadership needs of the organisation to enable it to compete effectively.
THE FULL TERMS OF REFERENCE CAN BE FOUND ON WWW.REGUS.COM
The Committee meets as required and met during the year to consider the appointment of a new Chief Financial Offi cer to replace Rudy Lobo. Spencer Stuart were appointed to provide assistance in the search and selection procedure of a suitable candidate. Following a rigorous selection process the Committeerecommended to the Board the appointment of Stephen Gleadlewho was duly appointed on the 31 October 2005.
20Regus Report & Accounts 2005
Remuneration CommitteeMartin Robinson ChairmanRoger OrfStephen East
The Remuneration Report is set out on pages 22 to 27.
Disclosure CommitteeThe Disclosure Committee comprises Rudy Lobo (Chairman), Mark Dixon, Stephen Gleadle, Tim Regan and Robert Blyth (Head of Internal Audit). The Committee meets as required to deal with all matters concerning public announcements of the Company and the Company’s compliance with disclosure controls and procedures.
DIALOGUE WITH SHAREHOLDERSRegus reports formally to shareholders twice a year, with the interim results announced normally in September and the preliminary fi nal results announced normally in March. There are programmes for the Chief Executive and Chief Financial Offi cer to give presentations of these results to the Company’sinstitutional shareholders, analysts and media in London and other locations. The Chief Executive and Chief Financial Offi cer maintain a close dialogue with institutional shareholders on the Company’s performance, governance, plans and objectives. These meetings also serve to develop an ongoing understandingof the views and any concerns of the Company’s major shareholders. The non-executive directors are given regular updates as to the views of the institutional shareholders and the Chairman is available to meet with these shareholders on request. The principal communication with private shareholdersis through the Annual Report, the Interim Report and the AGM.
AGMThe AGM is held normally in May in London and is attended, other than in exceptional circumstances, by all members of the Board. Shareholders are invited to ask questions and are given the opportunity to meet the directors informally afterwards.
Notice of the AGM, together with any related documents are mailed to shareholders at least 20 working days before the meeting and separate resolutions are proposed on each issue. The level of proxy votes cast and the balance for and against each resolution, together with the level of abstentions, if any, are announced to the meeting following voting by a show of hands.
INTERNAL CONTROLThe Board has ultimate responsibility for the system of internal control operating throughout the Group and for reviewing its effectiveness.
No system of internal control can provide absolute assurance against material misstatement or loss. The Group’s system is designed to manage rather than eliminate the risk of failure to achieve business objectives, and can only provide reasonable assurance that potential problems will normally be prevented or will be detected in a timely manner for appropriate action.
CORPORATE GOVERNANCE
FINANCIAL AND OTHER INFORMATION IS MADE AVAILABLE ON WWW.REGUS.COM
21Regus Report & Accounts 2005
The Company has had procedures in place throughout the year, and up to 20 March 2006, the date of approval of this Annual Report, which is in accordance with the Internal Control Guidance for Directors on the Combined Code.
The Board conducts regular reviews of the Group’s strategic direction. Country and regional strategic objectives, quarterly plans and performance targets for 2006 have been set by the executive directors and are regularly reviewed by the main Board in the context of the Group’s overall objectives.
There is an ongoing process for identifying, evaluating and managing the risks faced by the Group. Major business risks and their fi nancial implications are appraised by the responsibleexecutives as a part of the budget process and these are endorsed by regional management. Key risks are reported to the Board and the Audit Committee. The appropriateness of controls is considered by the executives, having regard to cost/benefi t, materiality and the likelihood of risks crystallising. Key risks and actions to mitigate those risks are regularly considered by the Board and are formally reviewed and approved by the Board annually.
The control framework and key procedures, which were in place throughout the year ended 31 December 2005, comprise the following:
The Board normally meets every six months together with certain other senior executives to consider Group fi nancial performance, business development and Group managementissues. The directors and offi cers of Group subsidiaries comprise executives with appropriate functional responsibilities.Executives of key operating companies meet regularly to manage their respective businesses.
Country and regional budgets, containing fi nancial and operatingtargets, capital expenditure proposals and performance indicators, are reviewed by the Group executive and must support regional business strategies. The consolidated Group budget is approved by the Board.
Operational and fi nancial reports are prepared and distributed to the Board on a monthly basis. Actual results are reviewed against budget and explanations are received for all material movements. The senior management team are integrally involved in the business and to this extent regularly discuss andaddress issues and opportunities with regional and functional teams. Formal business review meetings, chaired by Mark Dixon,are held with the regional teams and functional heads on a monthly basis.
There is a Group-wide policy governing appraisal and approval of investment, capital expenditure and asset disposals.
Key policies and control procedures (including fi nance, operations, and health and safety) are documented in manuals having Group-wide application. These are available to all staff on the Group’s intranet system.
The Group’s internal audit remit is to report to the Audit Committee on the Group’s worldwide operations. Its resourcingprogramme of work and fi ndings, including any material control issues and resultant actions, are reviewed by the Audit Committee.
To underpin the effectiveness of controls, it is the Group’s policyto recruit and develop appropriately skilled management and staff of high calibre, integrity and with appropriate disciplines.
High standards of business ethics and compliance with laws, regulations and internal policies are demanded from staff at all levels.
The following key mechanisms were available to the Board at various times during the year in the conduct of its review of internal controls:
An ongoing process, through Board meetings, senior management meetings and divisional reviews as well as other management meetings, for the formal identifi cation of signifi cantoperational risks and mitigating control processes.
A series of internal audit reviews of country/regions coveringthe fi nancial, operational and overhead functions. These reviews are based on the identifi ed risks. The fi ndings and recommendations of each review are reported to management and the Audit Committee.
System of reporting the effectiveness of key fi nancial, operational and compliance controls. This is based on a comprehensive internal control self-assessment questionnaire collated and reviewed by Internal Audit. Results and action plans are reviewed by senior management and summarised for the Board.
The report has been prepared by the Remuneration Committee(the “Committee”) of Regus Group plc and approved by the Board of Regus Group plc. The report complies with the UK Directors’ Remuneration Report Regulations 2002 and, in compliance with such regulations, a separate resolution approving this report is being put to shareholders at this years AGM.
Information relating to the emoluments and pension contributions of the directors, directors’ interests in the Company’s shares and under Employee Share Plans has been audited.
UNAUDITED INFORMATIONMEMBERSHIP AND RESPONSIBILITIES OF THE REMUNERATION COMMITTEE The members of the Remuneration Committee throughout the year were the Company’s independent non-executive directors, Roger Orf, Stephen East and, the Chairman of the Committee, Martin Robinson.
The Committee met fi ve times during the year. The Committee has responsibility for making recommendationsto the Board on the compensation of senior executives and determining, within agreed terms of reference, the specifi c remuneration packages for each of the executive directors.
The Board has delegated to the Remuneration Committee responsibility to:
• Make recommendations to the Board in respect of remuneration policy for the executive directors and the Group’s other senior management.
• Approve any new service agreement entered into between the Group and any executive director.
• Make recommendations to the Board on the implementation of the Group’s performance bonus schemes and share schemes.
The Committee has appointed Halliwell Consulting, an external consultancy which has wide experience of executive remuneration in UK listed companies, to advise in developing its performance related remuneration policy. Halliwell Consultinghas no other connection with the Company.
The Committee has also sought advice from the Company’s solicitors, Slaughter and May, in connection with the terms of service contracts for executive directors, other members of senior management and in relation to the operation of the Regus Group plc Co-Investment Plan (the “CIP”) described later in this report.
Directors are not permitted, under Regus Group plc’s Articles of Association, to vote on their own terms and conditions of remuneration.
The members of the Remuneration Committee attend the Company’s AGM and are available to answer shareholders’ questions about directors’ remuneration.
22Regus Report & Accounts 2005
COMPLIANCE WITH THE BEST PRACTICE PROVISIONSIn accordance with the Board’s commitment to maintaining high standards of Corporate Governance, the Committee has complied during the year with all remuneration related aspects of the Code during the year.
REMUNERATION POLICYThe principal objective of the Committee’s remuneration policy is to provide remuneration packages that will attract, retain and motivate people of the highest calibre and experience needed to shape and execute the Company’s strategy and to deliver shareholder value.
The guiding principles which the Committee has regard to and balances as far as is practicable, in determining policy and objectives for 2005 and future years are:
• to ensure that it maintains a competitive package of total compensation, commensurate with comparable packages available with other similar companies operating in similar markets (the Comparator Group);
• to make a signifi cant percentage of potential maximum reward conditional on short and long term performance;
• to ensure that the interests of the executives are closely aligned with those of the Company’s shareholders through the provision of share incentives;
• to link reward to the satisfaction of targeted objectives which are the main drivers of shareholder value; and
• to be sensitive in determining executive directors’ remuneration to pay and employment conditions around the Group.
In order to achieve the above policy, the Committee sets the fi xed elements of the executives’ compensation package at a conservative level, taking into account the median level of salaries in the Comparator Group. This is balanced with the opportunity for overall compensation packages to be in the upper quartile of the Comparator Group dependent upon the degree to which the associated stringent performance conditions attached to the short and long term incentive schemes have been satisfi ed.
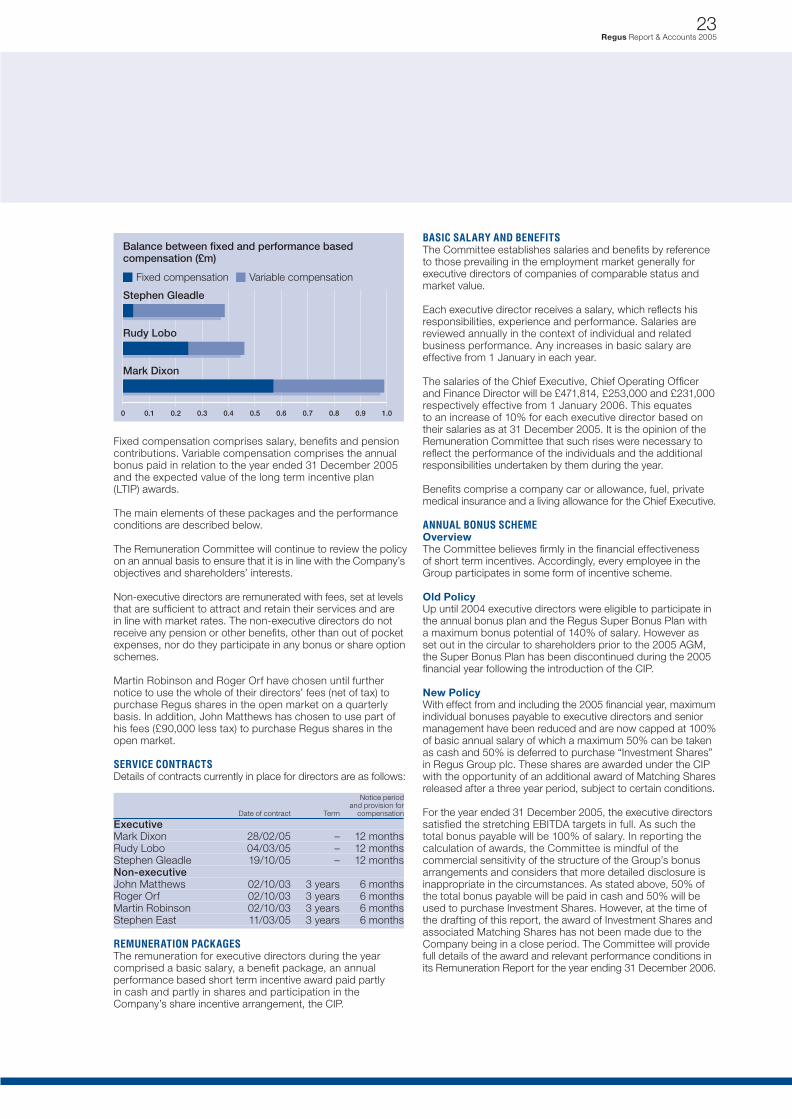
The tables below illustrate the balance between fi xed and performance related (variable) compensation and the total expected value of the remuneration package for each executivedirector for the year ended 31 December 2005 (Stephen Gleadle’s employment having commenced on 31 October 2005):
Mark Dixon Rudy Lobo Stephen Gleadle Chief Executive Offi cer Chief Operating Offi cer Chief Financial Offi cer % % %
Fixed 57.61 53.72 10.26Variable 42.39 46.28 89.74
REMUNERATION REPORT
23Regus Report & Accounts 2005
Fixed compensation comprises salary, benefi ts and pension contributions. Variable compensation comprises the annual bonus paid in relation to the year ended 31 December 2005 and the expected value of the long term incentive plan (LTIP) awards.
The main elements of these packages and the performance conditions are described below.
The Remuneration Committee will continue to review the policy on an annual basis to ensure that it is in line with the Company’sobjectives and shareholders’ interests.
Non-executive directors are remunerated with fees, set at levelsthat are suffi cient to attract and retain their services and are in line with market rates. The non-executive directors do not receive any pension or other benefi ts, other than out of pocket expenses, nor do they participate in any bonus or share option schemes.
Martin Robinson and Roger Orf have chosen until further notice to use the whole of their directors’ fees (net of tax) to purchase Regus shares in the open market on a quarterly basis. In addition, John Matthews has chosen to use part of his fees (£90,000 less tax) to purchase Regus shares in the open market.
SERVICE CONTRACTSDetails of contracts currently in place for directors are as follows:
Notice period and provision for Date of contract Term compensation
ExecutiveMark Dixon 28/02/05 – 12 monthsRudy Lobo 04/03/05 – 12 monthsStephen Gleadle 19/10/05 – 12 monthsNon-executiveJohn Matthews 02/10/03 3 years 6 monthsRoger Orf 02/10/03 3 years 6 monthsMartin Robinson 02/10/03 3 years 6 monthsStephen East 11/03/05 3 years 6 months
REMUNERATION PACKAGESThe remuneration for executive directors during the year comprised a basic salary, a benefi t package, an annual performance based short term incentive award paid partly in cash and partly in shares and participation in the Company’s share incentive arrangement, the CIP.
BASIC SALARY AND BENEFITSThe Committee establishes salaries and benefi ts by reference to those prevailing in the employment market generally for executive directors of companies of comparable status and market value.
Each executive director receives a salary, which refl ects his responsibilities, experience and performance. Salaries are reviewed annually in the context of individual and related business performance. Any increases in basic salary are effective from 1 January in each year.
The salaries of the Chief Executive, Chief Operating Offi cer and Finance Director will be £471,814, £253,000 and £231,000 respectively effective from 1 January 2006. This equates to an increase of 10% for each executive director based on their salaries as at 31 December 2005. It is the opinion of the Remuneration Committee that such rises were necessary to refl ect the performance of the individuals and the additional responsibilities undertaken by them during the year.
Benefi ts comprise a company car or allowance, fuel, private medical insurance and a living allowance for the Chief Executive.
ANNUAL BONUS SCHEMEOverviewThe Committee believes fi rmly in the fi nancial effectiveness of short term incentives. Accordingly, every employee in the Group participates in some form of incentive scheme.
Old PolicyUp until 2004 executive directors were eligible to participate in the annual bonus plan and the Regus Super Bonus Plan with a maximum bonus potential of 140% of salary. However as set out in the circular to shareholders prior to the 2005 AGM, the Super Bonus Plan has been discontinued during the 2005 fi nancial year following the introduction of the CIP.
New PolicyWith effect from and including the 2005 fi nancial year, maximumindividual bonuses payable to executive directors and senior management have been reduced and are now capped at 100%of basic annual salary of which a maximum 50% can be taken as cash and 50% is deferred to purchase “Investment Shares” in Regus Group plc. These shares are awarded under the CIP with the opportunity of an additional award of Matching Shares released after a three year period, subject to certain conditions.
For the year ended 31 December 2005, the executive directorssatisfi ed the stretching EBITDA targets in full. As such the total bonus payable will be 100% of salary. In reporting the calculation of awards, the Committee is mindful of the commercial sensitivity of the structure of the Group’s bonus arrangements and considers that more detailed disclosure is inappropriate in the circumstances. As stated above, 50% of the total bonus payable will be paid in cash and 50% will be used to purchase Investment Shares. However, at the time of the drafting of this report, the award of Investment Shares and associated Matching Shares has not been made due to the Company being in a close period. The Committee will provide full details of the award and relevant performance conditions in its Remuneration Report for the year ending 31 December 2006.
The maximum number of awards granted to the executive directors will be based on the price of an ordinary share at the time of the grant and the monetary value will not exceed 50% of the total bonus paid.
Bonus targets are reviewed and agreed by the Committee at the beginning of each fi nancial year. The performance measures for the bonus are reviewed annually by the Committeeto ensure that they are appropriate to the current market conditions and position of the Company, so that they remain challenging. The structure of the bonus targets for the year ending 31 December 2006 will be similar to those operated for 2005.
The maximum bonus potential available for the executive directors for the year ending 31 December 2006 remains the same.
Bonuses are non-pensionable.
Non-executive directors do not receive a bonus.
PENSION BENEFITSThe executive directors participate in the Company’s Money Purchase (Personal Pension) Scheme. The Company matches contributions up to a maximum of 7.5% of basic salary.
The Group does not operate a defi ned benefi t pension scheme and has no plans to introduce such a scheme.
LONG TERM INCENTIVESOverviewDuring the year the Remuneration Committee reviewed its share incentive policy and concluded that the interests of shareholders and executives would be better aligned through a new long term incentive policy, the CIP which was approved by shareholders at the 2005 AGM. In accordance with the new policy, the Remuneration Committee will not grant any further awards under the Company’s existing arrangements to executives who participate in the CIP.
Old PolicyPrior to the change of policy, the Remuneration Committeegranted options under the Regus Group Share Option Scheme.
For grants made in 2004, performance conditions are based on the Company’s earnings per share (EPS) performance over a three year period. The options may be exercised between the third and tenth anniversaries of the date of the grant after which they will lapse.
The Remuneration Committee believed that a sliding scale of EPS growth of 3%-6% per annum in excess of the Retail Price Index was the most appropriate performance target (as the Company had been in loss, a notional starting EPS of 1p pershare was used). This represented a challenging performance condition in light of the Company’s circumstances at the time. The number of options that become exercisable for real growth of 3% per annum will not exceed 50% of salary.
EPS has been selected as the performance measure as it was considered a good indicator of long term corporate performance.
24Regus Report & Accounts 2005
The Company and its predecessor has never retested performance conditions or re-priced options and the Remuneration Committee has no intention of changing their policy. There will be no automatic waiving of performance conditions in the event of a change of control or where grants are ‘rolled over’ on a change in capital structure. No performance targets were waived on the Scheme of Arrangement in 2003.
The Company also adopted the Regus Group Restricted Award Plan at the 2004 AGM. No awards have been made under this Plan.
New PolicyAt the 2005 AGM, shareholders approved the CIP following a review by the Remuneration Committee of long term incentive arrangements for executive directors and other senior executives.
The Committee views the CIP, introduced in 2005, as the most appropriate vehicle for long term incentivisation for the executive directors and other senior executives. Details of the awards made to executive directors during the year are set out below.
There are two elements to the CIP:
The fi rst element operates in conjunction with the annual bonus whereby 50% of any gross bonus payment will be paid in cash, with the other 50% taken as a deferred award of Investment Shares to be released at the end of a three year period.
Matching Shares will be awarded linked to the number of Investment Shares awarded and will vest depending on the Company’s growth in free cash fl ow per share (FCF), EPS and relative total shareholder return (TSR) measured against the FTSE 350 Support Services Index. Matching Shares are awarded at no cost to participants.
The maximum number of Matching Shares which can be awarded to a participant in the CIP is 200% of salary. As such, the maximum number of Matching Shares which can be awarded based on Investment Shares awarded is 4:1 – however this level of award is subject to full payout of the annual bonus. In order to ensure that the executive directors and senior executives are motivated to consistently perform on an annual basis, the maximum matching ratio will only apply to participants who receive a bonus pay-out of 50% of salary or more. For bonus payout of less than 50% of salary the matching participants will only be eligible to receive two Matching Shares to one Investment Share.
The second element is that the Remuneration Committee may also make stand alone whole share awards (“LTIP Awards”) without reference to annual bonus, up to a maximum of 100% of salary per annum under the CIP. Under the LTIP Award, executives are awarded a conditional right over a whole numberof shares with the release being dependent on the extent to which (if at all) the challenging performance conditions set by the Remuneration Committee at the time the LTIP Award is made are satisfi ed.
REMUNERATION REPORT
25Regus Report & Accounts 2005
Grants during the year ending 31 December 2005
Mark Dixon Rudy Lobo Stephen Gleadle
LTIP award face value(% age of salary) 75% 75% 143%Expected value of LTIP award (a) £196,088 £103,383 £189,000Expected value of LTIP award as a % age of salary 47.25% 47.25% 90%
(a) The expected value was calculated by taking the face value of the shares on the date of award and discounting this value by the probability of the performance condition being satisfi ed at this date (in accordance with the principles of IFRS 2).
It should be noted that as part of his recruitment, the LTIP Award granted to Stephen Gleadle was under a stand alone arrangement in accordance with the provisions of 13.13A(b) of the Listing Rules. However this award has been granted on the same terms and conditions as the LTIP Awards made to the other executive directors on the same date.
In addition, it is unlikely that future stand-alone LTIP Awards will be made to existing executive directors unless there are exceptional circumstances.
The performance conditions for the grant of awards under the LTIP are set out in the following table:
EPS (p) for the year ending 31 Dec 2008
11p 12p 13p 14p
Growth in FCFper share10% 6% 13% 19% 25%15% 13% 25% 38% 50%20% 19% 38% 56% 75%25% 25% 50% 75% 100%
Note: % denotes the % of LTIP Award which will be released at the end of the performance period.
In addition, no awards will be released unless the Company’s TSR is at least at the median when compared against that of the companies comprising the FTSE 350 Support Services Sector at the date of grant.
It is recognised by the Remuneration Committee that the additional EPS targets represent a highly challenging goal and consequently in determining whether they have been met the Committee will exercise its discretion. The overall aim is that the relevant EPS targets must have been met on a run rate or underlying basis.
As such an adjusted measure of EPS will be calculated designed to assess the underlying performance of the business.
While the Remuneration Committee reserves the right to adjust EPS as it sees fi t at the time, by way of example, the following adjustments are currently anticipated:
• In a growth company such as Regus, costs are necessarily incurred in one year to drive profi ts in future years. As such it is important to ensure management is not incentivised to cut back on these investments to meet EPS targets in any one year. Accordingly those costs, incurred in the vesting year, which it considers necessary to drive future growth will be excluded from the EPS calculation. These would include, inter alia, the costs of the business development departments, excess marketing expenditures and current year losses from investing in new locations.
• Any one-off or non-recurring items will be excluded.
• It is expected that in the period between 2006 and 2008 the cash tax rate will rise as cumulative tax losses are utilised thereby increasing progressively the challenge of achieving a 14p EPS target. This will then be further complicated by the need to recognise deferred tax assets as the business strengthens reducing the accounting rate of tax in one year and increasing it in the next. To provide greater clarity and incentive to management EPS will be calculated based upon the cash tax rate up to a maximum of 30%.
The Remuneration Committee is of the opinion that the EPS and free cash fl ow performance targets are a transparent and accurate measure of the Company’s performance at this time and are the key corporate metrics for driving long term shareholder value. In addition, the TSR condition will ensure that executives are encouraged to focus on ensuring that the Company’s return to shareholders is competitive compared to comparable companies.
As mentioned above, awards under the CIP in respect of the bonus paid for the year ended 31 December 2005 will be made subsequent to the publication of this report. However the maximum number of awards granted to the executive directors will be based on the price of an ordinary share at the time of grant and the monetary value will not exceed 50% of basic salary. Full details of the levels of award and performance conditions will be disclosed in the Committee’s Remuneration Report for the year ending 31 December 2006.
EXTERNAL APPOINTMENTSExecutive directors are permitted to accept appointments on external boards or committees so long as these are not deemed to interfere with the business of the Group. Any fees received in respect of these appointments are retained directly by the relevant executive director. At 31 December 2005, the executive directors did not hold any external positions for which they receive fees.
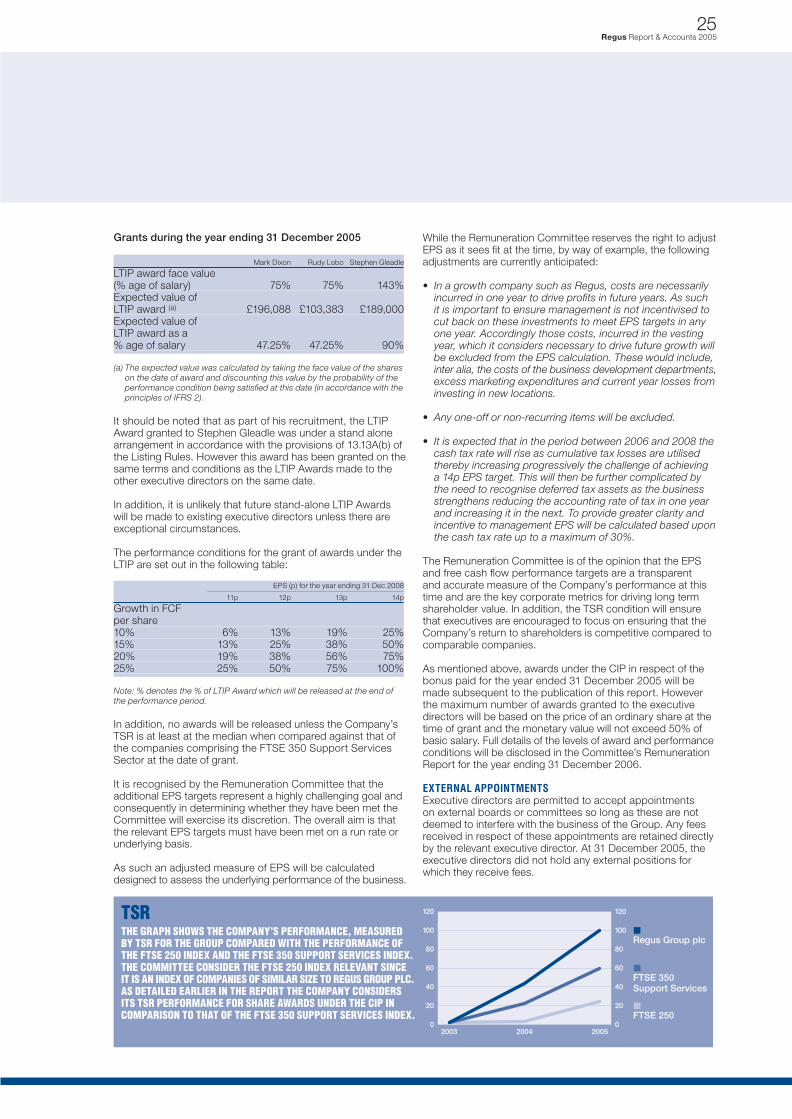
TSRTHE GRAPH SHOWS THE COMPANY’S PERFORMANCE, MEASUREDBY TSR FOR THE GROUP COMPARED WITH THE PERFORMANCE OF THE FTSE 250 INDEX AND THE FTSE 350 SUPPORT SERVICES INDEX. THE COMMITTEE CONSIDER THE FTSE 250 INDEX RELEVANT SINCE IT IS AN INDEX OF COMPANIES OF SIMILAR SIZE TO REGUS GROUP PLC.AS DETAILED EARLIER IN THE REPORT THE COMPANY CONSIDERS ITS TSR PERFORMANCE FOR SHARE AWARDS UNDER THE CIP IN COMPARISON TO THAT OF THE FTSE 350 SUPPORT SERVICES INDEX.
26Regus Report & Accounts 2005
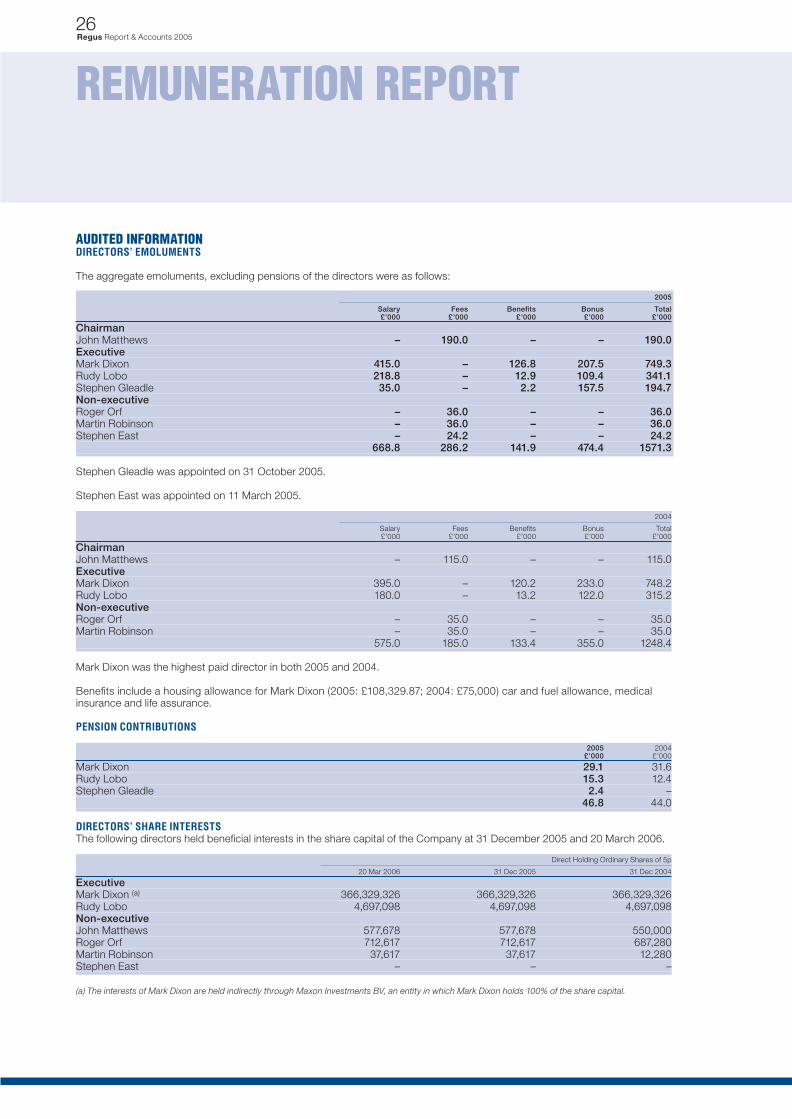
AUDITED INFORMATIONDIRECTORS’ EMOLUMENTS
The aggregate emoluments, excluding pensions of the directors were as follows:
2005
Salary Fees Benefi ts Bonus Total £’000 £’000 £’000 £’000 £’000
ChairmanJohn Matthews – 190.0 – – 190.0ExecutiveMark Dixon 415.0 – 126.8 207.5 749.3Rudy Lobo 218.8 – 12.9 109.4 341.1Stephen Gleadle 35.0 – 2.2 157.5 194.7Non-executiveRoger Orf – 36.0 – – 36.0Martin Robinson – 36.0 – – 36.0Stephen East – 24.2 – – 24.2 668.8 286.2 141.9 474.4 1571.3
Stephen Gleadle was appointed on 31 October 2005.
Stephen East was appointed on 11 March 2005.
2004
Salary Fees Benefi ts Bonus Total £’000 £’000 £’000 £’000 £’000
ChairmanJohn Matthews – 115.0 – – 115.0ExecutiveMark Dixon 395.0 – 120.2 233.0 748.2Rudy Lobo 180.0 – 13.2 122.0 315.2Non-executiveRoger Orf – 35.0 – – 35.0Martin Robinson – 35.0 – – 35.0 575.0 185.0 133.4 355.0 1248.4
Mark Dixon was the highest paid director in both 2005 and 2004.
Benefi ts include a housing allowance for Mark Dixon (2005: £108,329.87; 2004: £75,000) car and fuel allowance, medical insurance and life assurance.
PENSION CONTRIBUTIONS
2005 2004 £’000 £’000
Mark Dixon 29.1 31.6Rudy Lobo 15.3 12.4Stephen Gleadle 2.4 – 46.8 44.0
DIRECTORS’ SHARE INTERESTSThe following directors held benefi cial interests in the share capital of the Company at 31 December 2005 and 20 March 2006.
Direct Holding Ordinary Shares of 5p
20 Mar 2006 31 Dec 2005 31 Dec 2004
ExecutiveMark Dixon (a) 366,329,326 366,329,326 366,329,326Rudy Lobo 4,697,098 4,697,098 4,697,098Non-executiveJohn Matthews 577,678 577,678 550,000Roger Orf 712,617 712,617 687,280Martin Robinson 37,617 37,617 12,280Stephen East – – –
(a) The interests of Mark Dixon are held indirectly through Maxon Investments BV, an entity in which Mark Dixon holds 100% of the share capital.
REMUNERATION REPORT
27Regus Report & Accounts 2005
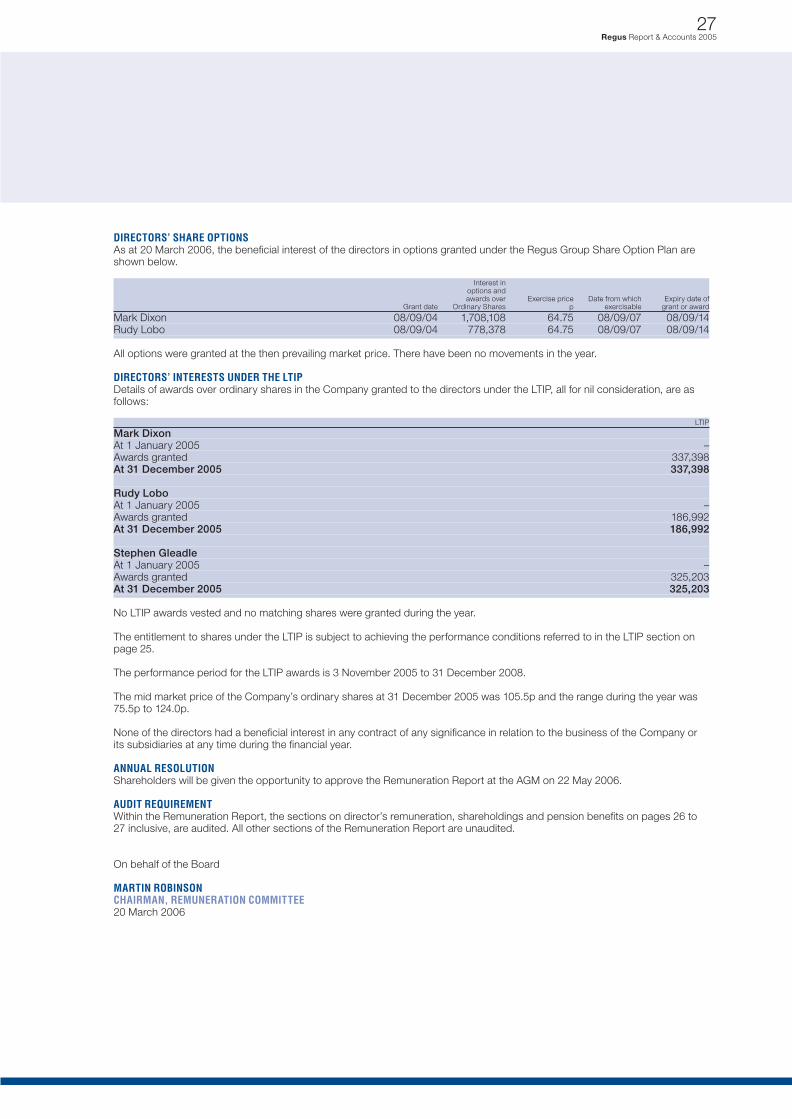
DIRECTORS’ SHARE OPTIONSAs at 20 March 2006, the benefi cial interest of the directors in options granted under the Regus Group Share Option Plan are shown below.
Interest in options and awards over Exercise price Date from which Expiry date of Grant date Ordinary Shares p exercisable grant or award
Mark Dixon 08/09/04 1,708,108 64.75 08/09/07 08/09/14Rudy Lobo 08/09/04 778,378 64.75 08/09/07 08/09/14
All options were granted at the then prevailing market price. There have been no movements in the year.
DIRECTORS’ INTERESTS UNDER THE LTIPDetails of awards over ordinary shares in the Company granted to the directors under the LTIP, all for nil consideration, are as follows:
LTIP
Mark DixonAt 1 January 2005 –Awards granted 337,398At 31 December 2005 337,398
Rudy LoboAt 1 January 2005 –Awards granted 186,992At 31 December 2005 186,992
Stephen GleadleAt 1 January 2005 –Awards granted 325,203At 31 December 2005 325,203
No LTIP awards vested and no matching shares were granted during the year.
The entitlement to shares under the LTIP is subject to achieving the performance conditions referred to in the LTIP section on page 25.
The performance period for the LTIP awards is 3 November 2005 to 31 December 2008.
The mid market price of the Company’s ordinary shares at 31 December 2005 was 105.5p and the range during the year was 75.5p to 124.0p.
None of the directors had a benefi cial interest in any contract of any signifi cance in relation to the business of the Company or its subsidiaries at any time during the fi nancial year.
ANNUAL RESOLUTIONShareholders will be given the opportunity to approve the Remuneration Report at the AGM on 22 May 2006.
AUDIT REQUIREMENTWithin the Remuneration Report, the sections on director’s remuneration, shareholdings and pension benefi ts on pages 26 to27 inclusive, are audited. All other sections of the Remuneration Report are unaudited.
On behalf of the Board
MARTIN ROBINSONCHAIRMAN, REMUNERATION COMMITTEE20 March 2006
The directors are responsible for preparing the Annual Report and the Group and parent company fi nancial statements, in accordance with applicable law and regulations.
Company law requires the directors to prepare Group and parentcompany fi nancial statements for each fi nancial year. Under that law the directors are required to prepare the Group fi nancialstatements in accordance with IFRSs as adopted by the EU and have elected to prepare the parent company fi nancial statements in accordance with UK Accounting Standards.
The Group fi nancial statements are required by law and IFRSs as adopted by the EU to present fairly the fi nancial position and performance of the Group; the Companies Act 1985 provides in relation to such fi nancial statements that references in the relevant part of that Act to fi nancial statements giving a true andfair view are references to their achieving a fair presentation.
The parent company fi nancial statements are required by law to give a true and fair view of the state of affairs of the parent company.
In preparing each of the Group and parent company fi nancial statements, the directors are required to:
• select suitable accounting policies and then apply them consistently;
• make judgments and estimates that are reasonable and prudent;
• for the Group fi nancial statements, state whether they have been prepared in accordance with IFRSs as adopted by the EU;
• for the parent company fi nancial statements, state whether applicable UK Accounting Standards have been followed, subject to any material departures disclosed and explained in the parent company fi nancial statements; and
• prepare the fi nancial statements on the going concern basis unless it is inappropriate to presume that the Group and the parent company will continue in business.
The directors are responsible for keeping proper accounting records that disclose with reasonable accuracy at any time the fi nancial position of the parent company and enable them to ensure that its fi nancial statements comply with the CompaniesAct 1985. They have general responsibility for taking such stepsas are reasonably open to them to safeguard the assets of the Group and to prevent and detect fraud and other irregularities.
Under applicable law and regulations, the directors are also responsible for preparing a Directors’ Report, Directors’ Remuneration Report and Corporate Governance Statement that comply with that law and those regulations.
28Regus Report & Accounts 2005
STATEMENT OF DIRECTORS’ RESPONSIBILITIES
29Regus Report & Accounts 2005
We have audited the Group and parent company fi nancial statements (the ‘‘fi nancial statements’’) of Regus Group plc for the year ended 31 December 2005 which comprise the Group Income Statement, the Group and Parent Company Balance Sheets, the Group Cash Flow Statement, the Group Statement of Change in Shareholders’ Equity and the related notes. These fi nancial statements have been prepared under the accounting policies set out therein. We have also audited the information in the Directors’ Remuneration Report that is described as having been audited.
This report is made solely to the Company’s members, as a body, in accordance with section 235 of the Companies Act 1985. Our audit work has been undertaken so that we might state to the Company’s members those matters we are required to state to them in an auditor’s report and for no other purpose. To the fullest extent permitted by law, we do not accept or assume responsibility to anyone other than the Company and the Company’s members as a body, for our auditwork, for this report, or for the opinions we have formed.
RESPECTIVE RESPONSIBILITIES OF DIRECTORS AND AUDITORSThe directors’ responsibilities for preparing the Annual Report and the Group fi nancial statements in accordance with applicable law and International Financial Reporting Standards (IFRSs) as adopted by the EU, and for preparing the parent company fi nancial statements and the Directors’ Remuneration Report in accordance with applicable law and UK Accounting Standards (UK Generally Accepted Accounting Practice) are set out in the Statement of Directors’ Responsibilities on page 28.
Our responsibility is to audit the fi nancial statements and the part of the Directors’ Remuneration Report to be audited in accordance with relevant legal and regulatory requirements and International Standards on Auditing (UK and Ireland).
We report to you our opinion as to whether the fi nancial statements give a true and fair view and whether the fi nancial statements and the part of the Directors’ Remuneration Report to be audited have been properly prepared in accordance with the Companies Act 1985 and whether, in addition, the Group fi nancial statements have been properly prepared in accordance with Article 4 of the IAS Regulation. We also report to you if, in our opinion, the Directors’ Report is not consistentwith the fi nancial statements, if the Company has not kept proper accounting records, if we have not received all the information and explanations we require for our audit, or if information specifi ed by law regarding directors’ remuneration and other transactions is not disclosed.
We review whether the Corporate Governance Statement refl ects the Company’s compliance with the nine provisions of the 2003 FRC Combined Code specifi ed for our review by the Listing Rules of the Financial Services Authority, and we report if it does not. We are not required to consider whetherthe Board’s statements on internal control cover all risks and controls, or form an opinion on the effectiveness of the Group’s corporate governance procedures or its risk and control procedures.
We read other information contained in the Annual Report and consider whether it is consistent with the audited fi nancial statements. We consider the implications for our report if we become aware of any apparent misstatements or materialinconsistencies with the fi nancial statements. Our responsibilitiesdo not extend to any other information.
BASIS OF AUDIT OPINIONWe conducted our audit in accordance with International Standards on Auditing (UK and Ireland) issued by the Auditing Practices Board. An audit includes examination, on a test basis,of evidence relevant to the amounts and disclosures in the fi nancial statements and the part of the Directors’ RemunerationReport to be audited. It also includes an assessment of the signifi cant estimates and judgments made by the directors in the preparation of the fi nancial statements, and of whether the accounting policies are appropriate to the Group’s and Company’s circumstances, consistently applied and adequatelydisclosed.
We planned and performed our audit so as to obtain all the information and explanations which we considered necessary in order to provide us with suffi cient evidence to give reasonableassurance that the fi nancial statements and the part of the Directors’ Remuneration Report to be audited are free from material misstatement, whether caused by fraud or other irregularity or error. In forming our opinion we also evaluated the overall adequacy of the presentation of information in the fi nancial statements and the part of the Directors’ RemunerationReport to be audited.
OPINIONIn our opinion:
• the Group fi nancial statements give a true and fair view, in accordance with IFRSs as adopted by the EU, of the state of the Group’s affairs as at 31 December 2005 and of its profi t for the year then ended;
• the Group fi nancial statements have been properly prepared in accordance with the Companies Act 1985 and Article 4 of the IAS Regulation;
• the parent company fi nancial statements give a true and fair view, in accordance with UK Generally Accepted Accounting Practice, of the state of the parent company’s affairs as at 31 December 2005; and
• the parent company fi nancial statements and the part of the Directors’ Remuneration Report to be audited have been properly prepared in accordance with the Companies Act 1985.
KPMG AUDIT PLCCHARTERED ACCOUNTANTS AND REGISTERED AUDITORLondon20 March 2006
INDEPENDENT AUDITORS’ REPORT
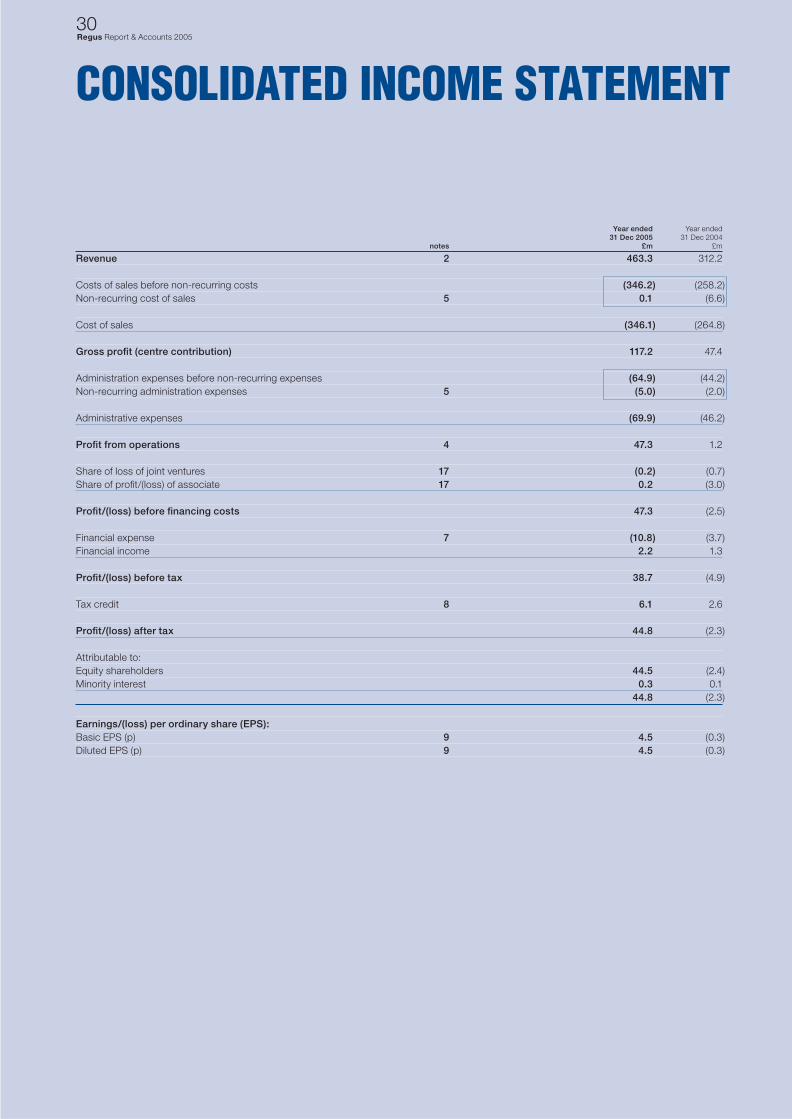
30Regus Report & Accounts 2005
Year ended Year ended 31 Dec 2005 31 Dec 2004 notes £m £m
Revenue 2 463.3 312.2
Costs of sales before non-recurring costs (346.2) (258.2)Non-recurring cost of sales 5 0.1 (6.6)
Cost of sales (346.1) (264.8)
Gross profi t (centre contribution) 117.2 47.4
Administration expenses before non-recurring expenses (64.9) (44.2)Non-recurring administration expenses 5 (5.0) (2.0)
Administrative expenses (69.9) (46.2)
Profi t from operations 4 47.3 1.2
Share of loss of joint ventures 17 (0.2) (0.7)Share of profi t/(loss) of associate 17 0.2 (3.0)
Profi t/(loss) before fi nancing costs 47.3 (2.5)
Financial expense 7 (10.8) (3.7)Financial income 2.2 1.3
Profi t/(loss) before tax 38.7 (4.9)
Tax credit 8 6.1 2.6
Profi t/(loss) after tax 44.8 (2.3)
Attributable to:Equity shareholders 44.5 (2.4)Minority interest 0.3 0.1 44.8 (2.3)
Earnings/(loss) per ordinary share (EPS):Basic EPS (p) 9 4.5 (0.3)Diluted EPS (p) 9 4.5 (0.3)
CONSOLIDATED INCOME STATEMENT
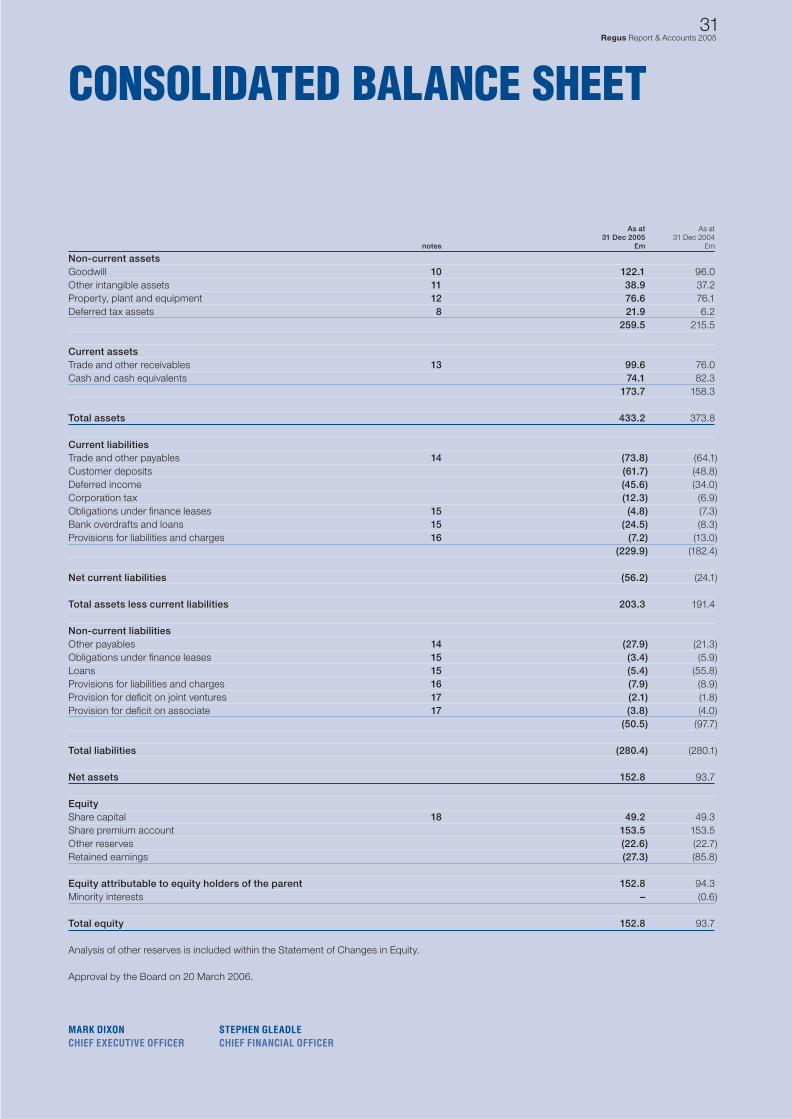
31Regus Report & Accounts 2005
CONSOLIDATED BALANCE SHEET
As at As at 31 Dec 2005 31 Dec 2004 notes £m £m
Non-current assetsGoodwill 10 122.1 96.0Other intangible assets 11 38.9 37.2Property, plant and equipment 12 76.6 76.1Deferred tax assets 8 21.9 6.2 259.5 215.5
Current assetsTrade and other receivables 13 99.6 76.0Cash and cash equivalents 74.1 82.3 173.7 158.3
Total assets 433.2 373.8
Current liabilitiesTrade and other payables 14 (73.8) (64.1)Customer deposits (61.7) (48.8)Deferred income (45.6) (34.0)Corporation tax (12.3) (6.9)Obligations under fi nance leases 15 (4.8) (7.3)Bank overdrafts and loans 15 (24.5) (8.3)Provisions for liabilities and charges 16 (7.2) (13.0) (229.9) (182.4)
Net current liabilities (56.2) (24.1)
Total assets less current liabilities 203.3 191.4
Non-current liabilitiesOther payables 14 (27.9) (21.3)Obligations under fi nance leases 15 (3.4) (5.9)Loans 15 (5.4) (55.8)Provisions for liabilities and charges 16 (7.9) (8.9)Provision for defi cit on joint ventures 17 (2.1) (1.8)Provision for defi cit on associate 17 (3.8) (4.0) (50.5) (97.7)
Total liabilities (280.4) (280.1)
Net assets 152.8 93.7
EquityShare capital 18 49.2 49.3Share premium account 153.5 153.5Other reserves (22.6) (22.7)Retained earnings (27.3) (85.8)
Equity attributable to equity holders of the parent 152.8 94.3Minority interests – (0.6)
Total equity 152.8 93.7
Analysis of other reserves is included within the Statement of Changes in Equity.
Approval by the Board on 20 March 2006.
MARK DIXON STEPHEN GLEADLECHIEF EXECUTIVE OFFICER CHIEF FINANCIAL OFFICER
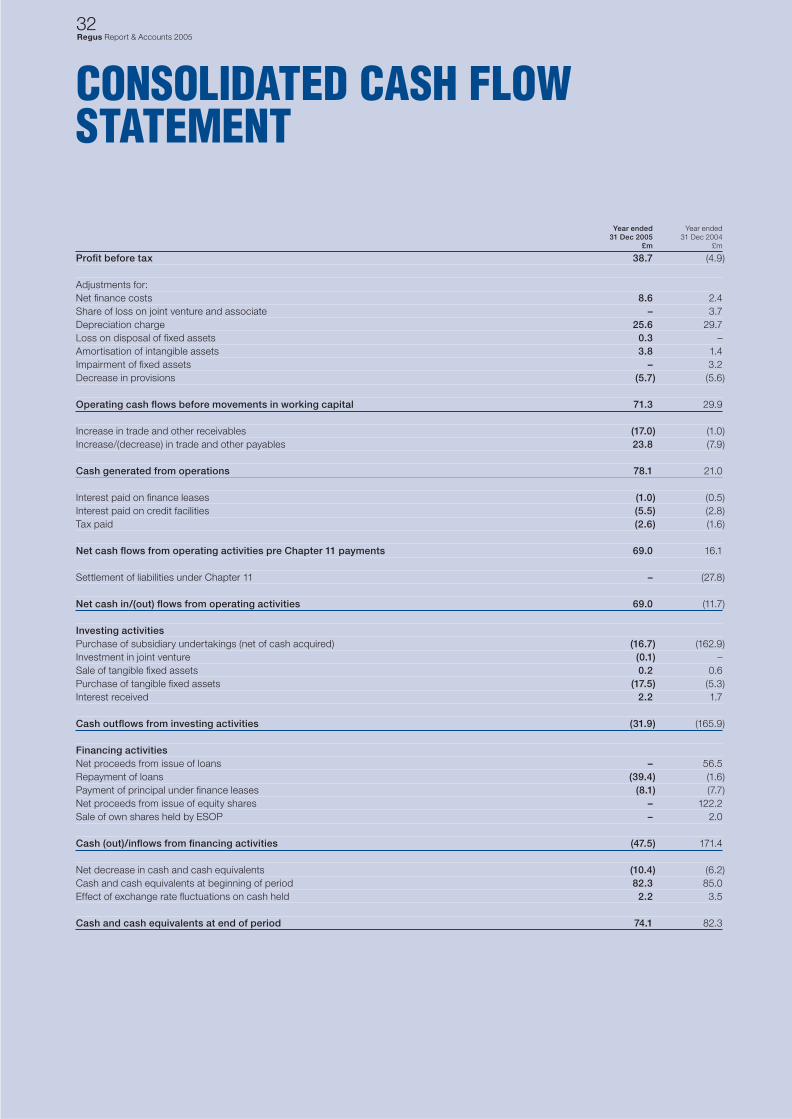
32Regus Report & Accounts 2005
CONSOLIDATED CASH FLOW STATEMENT
Year ended Year ended 31 Dec 2005 31 Dec 2004 £m £m
Profi t before tax 38.7 (4.9)
Adjustments for:Net fi nance costs 8.6 2.4Share of loss on joint venture and associate – 3.7Depreciation charge 25.6 29.7Loss on disposal of fi xed assets 0.3 –Amortisation of intangible assets 3.8 1.4Impairment of fi xed assets – 3.2Decrease in provisions (5.7) (5.6)
Operating cash fl ows before movements in working capital 71.3 29.9
Increase in trade and other receivables (17.0) (1.0)Increase/(decrease) in trade and other payables 23.8 (7.9)
Cash generated from operations 78.1 21.0
Interest paid on fi nance leases (1.0) (0.5)Interest paid on credit facilities (5.5) (2.8)Tax paid (2.6) (1.6)
Net cash fl ows from operating activities pre Chapter 11 payments 69.0 16.1
Settlement of liabilities under Chapter 11 – (27.8)
Net cash in/(out) fl ows from operating activities 69.0 (11.7)
Investing activitiesPurchase of subsidiary undertakings (net of cash acquired) (16.7) (162.9)Investment in joint venture (0.1) –Sale of tangible fi xed assets 0.2 0.6Purchase of tangible fi xed assets (17.5) (5.3)Interest received 2.2 1.7
Cash outfl ows from investing activities (31.9) (165.9)
Financing activitiesNet proceeds from issue of loans – 56.5Repayment of loans (39.4) (1.6)Payment of principal under fi nance leases (8.1) (7.7)Net proceeds from issue of equity shares – 122.2Sale of own shares held by ESOP – 2.0
Cash (out)/infl ows from fi nancing activities (47.5) 171.4
Net decrease in cash and cash equivalents (10.4) (6.2)Cash and cash equivalents at beginning of period 82.3 85.0Effect of exchange rate fl uctuations on cash held 2.2 3.5
Cash and cash equivalents at end of period 74.1 82.3
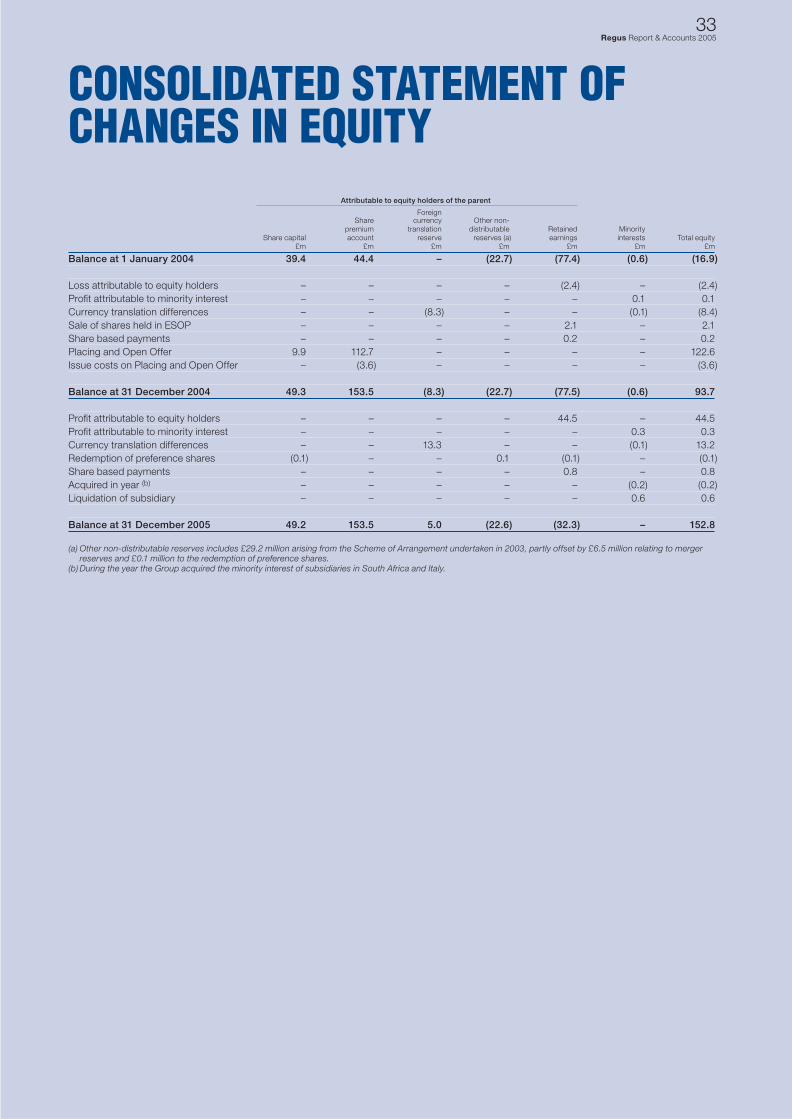
33Regus Report & Accounts 2005
CONSOLIDATED STATEMENT OF CHANGES IN EQUITY Attributable to equity holders of the parent
Foreign Share currency Other non- premium translation distributable Retained Minority Share capital account reserve reserves (a) earnings interests Total equity £m £m £m £m £m £m £m
Balance at 1 January 2004 39.4 44.4 – (22.7) (77.4) (0.6) (16.9)
Loss attributable to equity holders – – – – (2.4) – (2.4)Profi t attributable to minority interest – – – – – 0.1 0.1Currency translation differences – – (8.3) – – (0.1) (8.4)Sale of shares held in ESOP – – – – 2.1 – 2.1Share based payments – – – – 0.2 – 0.2Placing and Open Offer 9.9 112.7 – – – – 122.6Issue costs on Placing and Open Offer – (3.6) – – – – (3.6)
Balance at 31 December 2004 49.3 153.5 (8.3) (22.7) (77.5) (0.6) 93.7
Profi t attributable to equity holders – – – – 44.5 – 44.5Profi t attributable to minority interest – – – – – 0.3 0.3Currency translation differences – – 13.3 – – (0.1) 13.2Redemption of preference shares (0.1) – – 0.1 (0.1) – (0.1)Share based payments – – – – 0.8 – 0.8Acquired in year (b) – – – – – (0.2) (0.2)Liquidation of subsidiary – – – – – 0.6 0.6
Balance at 31 December 2005 49.2 153.5 5.0 (22.6) (32.3) – 152.8
(a) Other non-distributable reserves includes £29.2 million arising from the Scheme of Arrangement undertaken in 2003, partly offset by £6.5 million relating to merger reserves and £0.1 million to the redemption of preference shares.(b) During the year the Group acquired the minority interest of subsidiaries in South Africa and Italy.
1 ACCOUNTING POLICIESRegus Group plc (the “Company”) is a company incorporated in the UK.
Basis of preparationThe Group fi nancial statements consolidate those of the Company and its subsidiaries (together referred to as the “Group”) and equity account the Group’s interest in associates and jointly controlled entities.The parent company fi nancial statements present information about the Company as a separate entity and not about its Group.
The Group fi nancial statements have been prepared and approved by the directors in accordance with International Financial Reporting Standards as adopted by the EU (“Adopted IFRSs”). The Company has elected to prepare its parent company fi nancial statements in accordance with UK GAAP; these are presented on pages 60 to 62.
The accounting policies set out below have, unless otherwise stated, been applied consistently to all periods presented in these Group fi nancial statements and in preparing an opening IFRS balance sheet at 1 January 2004 for the purposes of the transition to Adopted IFRSs.The principal exception is that, as more fully explained below, fi nancial instruments accounting is determined on different bases in 2005 and 2004 due to the transitional provisions of IAS 39.
Judgements made by the directors, in the application of these accounting policies that have signifi cant effect on the fi nancial statements and estimates with a signifi cant risk of material adjustment in the next year are discussed in note 28.
The fi nancial statements are prepared on the historical cost basis.
Transition to Adopted IFRSsThe Group is preparing its fi nancial statements in accordance with Adopted IFRS for the fi rst time and consequently has applied IFRS 1. An explanation of how the transition to Adopted IFRSs has affected the reported fi nancial position, fi nancial performance and cash fl ows of the Group is provided in note 29.
In addition to exempting companies from the requirement to restate comparatives for IAS 39, IFRS 1 grants certain exemptions from the full requirements of IFRSs in the transition period. The following exemptions have been taken in these fi nancial statements:
• Business combinations – Business combinations that took place prior to transition date have not been restated.
• Cumulative translation differences – Cumulative translation differences for all foreign operations have been set to zero at 1 January 2004.
The Group adopted IAS 39 with effect from 1 January 2005. IAS 39 has not had any impact on the accounts.
Adopted IFRSs not yet appliedThe following adopted IFRSs were available for early application but have not been applied by the Group in these fi nancial statements:
IFRS 7 “Financial Instruments: Disclosure” applicable for accounting periods commencing on or after 1 January 2007. The impact on the Group’s fi nancial statement on the initial application of this standard is not expected to be signifi cant as the applicable requirements of this standard are similar to the disclosure requirements of IAS 32, which has already been adopted by the Group.
Amendments to IAS 39: “Financial Guarantee Contracts” applicable for accounting periods commencing on or after 1 January 2006. The impact on the Group’s fi nancial statement of the initial application of this standard is the requirement to recognise the fair value of the guarantees given to landlords.
Basis of consolidationSubsidiaries are entities controlled by the Group. Control exists when the Group has the power, directly or indirectly, to govern the fi nancial and operating policies of an entity so as to obtain benefi ts from its activities. In assessing control, potential voting rights that are currentlyexercisable or convertible are taken into account. The fi nancial statements of subsidiaries are included in the consolidated fi nancial statements from the date that control commences until the date that control ceases.
Associates are those entities in which the Group has signifi cant infl uence, but not control, over the fi nancial and operating policies. The consolidated fi nancial statements include the Group’s share of the total recognised income and expense of associates on an equity accounted basis, from the date that signifi cant infl uence commences until the date that signifi cant infl uence ceases. When the Group’s share of losses exceeds its interest in an associate, the Group’s carrying amount is reduced to nil and recognition of further losses is discontinued except to the extent that the Group has incurred legal or constructive obligations or made payments on behalf of an associate.
Jointly controlled entities are those entities over whose activities the Group has joint control, established by contractual agreement. The consolidated fi nancial statements include the Group’s share of the total recognised gains and losses of jointly controlled entities on an equity accounted basis, from the date that joint control commences until the date that joint control ceases.
GoodwillAll business combinations are accounted for using the purchase method. Goodwill represents the difference between cost of acquisition over the share of the fair value of identifi able net assets (including intangible assets) of a subsidiary, associate or joint venture at the date of acquisition.
Positive goodwill is stated at cost less any provision for impairment in value. An impairment test is carried out annually. Positive goodwill is allocated to cash generating units for the purpose of impairment testing.
ImpairmentThe carrying amounts of the Group’s assets other than deferred tax assets, are reviewed at each balance sheet date to determine whether there is any indication of impairment. If any such indication exists, the asset’s recoverable amount is estimated.
For goodwill, assets that have an indefi nite useful life and intangible assets that are not yet available for use, the recoverable amount is estimated at each balance sheet date.
An impairment loss is recognised whenever the carrying amount of an asset or its cash-generating unit exceeds its recoverable amount. Impairment losses are recognised in the income statement.
Impairment losses recognised in respect of cash-generating units are allocated fi rst to reduce the carrying amount of any goodwill allocated to cash-generating units and then to reduce the carrying amount of
NOTES TO THE ACCOUNTS34Regus Report & Accounts 2005
the other assets in the unit on a pro rata basis. A cash generating unit is the smallest identifi able group of assets that generates cash infl ows that are largely independent of the cash infl ows from other assets or groups of assets.
Goodwill, assets that have an indefi nite useful life and intangible assetsthat are not yet available for use were tested for impairment as at 31 October 2005, even though no indication of impairment existed.
Calculation of recoverable amountThe recoverable amount of relevant assets is the greater of their net selling price and value in use. In assessing value in use, the estimated future cash fl ows are discounted to their present value using a pre-tax discount rate that refl ects current market assessments of the time valueof money and the risks specifi c to the asset. For an asset that does notgenerate largely independent cash infl ows, the recoverable amount is determined for the cash-generating unit to which the asset belongs.
Intangible assetsIntangible assets acquired separately from the business are capitalisedat cost. Intangible assets acquired as part of an acquisition of a business are capitalised separately from goodwill if their fair value can be measured reliably on initial recognition.
Intangible assets are amortised on a straight-line basis over the estimated useful life of the assets as follows:
Brand 20 yearsComputer software 3-5 yearsCustomer lists 1-2 years
Amortisation of intangible assets is expensed through administration expenses in the income statement.
LeasesPlant and equipment leases for which the Group assumes substantiallyall of the risks and rewards of ownership are classifi ed as fi nance leases. All other leases, including all of the Group’s property leases are categorised as operating leases.
Finance leasesPlant and equipment acquired by way of a fi nance lease is capitalised at the commencement of the lease at the lower of its fair value and the present value of the minimum lease payments at inception. Future payments under fi nance leases are included in creditors, net of any future fi nance charges. Minimum lease payments are apportioned between the fi nance charge and the reduction of the outstanding liability. Finance charges are recognised in the income statement over the lease term so as to produce a constant periodic rate of interest on the remaining balance of the liability.
Operating leasesMinimum lease payments under operating leases are recognised in the income statement on a straight-line basis over the lease term. Lease incentives and rent free periods are included in the calculation of minimum lease payments. The commencement of the lease term is the date from which the Group is entitled to use the leased asset. The lease term is the non-cancellable period of the lease, together with any further periods for which the Group has the option to continue to lease the asset and when at the inception of the lease it is reasonably certain that the Group will exercise that option.
Contingent rentals include rent increases based on future infl ation indices or non-guaranteed rental payments based on centre turnover or profi tability and are excluded from the calculation of minimum lease payments. Contingent rentals are recognised in the income statement as they are incurred.
Non-recurring itemsNon-recurring items are those signifi cant items, which are separately disclosed by virtue of their size or incidence to enable a full understanding of the Group’s fi nancial performance. Transactions which may give rise to non-recurring items are restructuring, integration costs and onerous commitments.
Property, plant and equipmentProperty, plant and equipment is stated at cost less accumulated depreciation and any impairment in value. Depreciation is calculated on a straight-line basis over the estimated useful life of the assets as follows:
Fixtures and fi ttings: Over the shorter of the lease term and 10 yearsFurniture: 10 yearsOffi ce equipment and telephones: 5-10 yearsMotor vehicles: 4 yearsComputer hardware: 3-5 years
With effect from 1 January 2005 the Group changed its estimate of the useful economic life of furniture from a period of fi ve years to ten years. This re-lifi ng of furniture has reduced depreciation of furniture in the period by £2.4 million to £8.8 million. Asset lives have also been changed for computer hardware, software and telecoms for which there was no impact in 2005. It is not practical to estimate the future impact of this change in accounting estimate.
RevenueRevenue from the provision of services to customers is measured at the fair value of consideration received or receivable (excluding sales taxes).
WorkstationsWorkstation revenue is recognised when the provision of the service isrendered. Amounts invoiced in advance are deferred and recognised as revenue upon provision of the service.
Customer service incomeService income (including the rental of meeting rooms) is recognised on a monthly basis as services are rendered. In circumstances where Regus acts as an agent for the sale and purchase of goods to customers, only the commission fee earned is recognised as revenue.
Management and franchise feesFees received for the provision of initial and subsequent services are recognised as revenue as the services are rendered. Fees charged for the use of continuing rights granted by the agreement, or for other services provided during the period of the agreement, are recognised as revenue as the services are provided or the rights used.
Employee benefi tsThe Group’s contributions to defi ned contribution plans and other paid and unpaid benefi ts earned by employees are charged to the income statement as incurred.
35Regus Report & Accounts 2005
Share based paymentsThe share option program entitles certain key management and directors to acquire shares of the ultimate parent company; these awards are granted by the ultimate parent. The fair value of options granted is recognised as an employee expense with a correspondingincrease in equity. The fair value is measured at grant date and spreadover the period during which the employees become unconditionallyentitled to the options. The fair value of the options granted is measuredusing Black Scholes valuation model, taking into account the terms and conditions upon which the options were granted. The amount recognised as an expense is adjusted to refl ect the actual number of share options that vest except where forfeiture is due only to share prices not achieving the threshold for vesting.
Share appreciation rights (CIP) are also granted by the Company to certain key employees. The fair value of the amount payable to the employee is recognised as an expense with a corresponding increase in equity. The fair value is initially measured at grant date and spread over the period during which the employees become unconditionally entitled to payment. The fair value of the share appreciation rights is measured based on the Monte Carlo valuation model, taking into account the terms and conditions upon which the instruments were granted. The liability is re-measured at each balancesheet date and at settlement date and any changes in fair value recognised in profi t or loss spread equally over the vesting period.
TaxationTax on the profi t or loss for the year comprises current and deferred tax. Tax is recognised in the income statement except to the extent that it relates to items recognised directly in equity, in which case it is recognised in equity.
Current tax is the expected tax payable on the taxable income for the year, using tax rates enacted or substantively enacted at the balance sheet date, and any adjustment to tax payable in respect of previous years.
Deferred tax is provided on temporary differences between the carrying amounts of assets and liabilities for fi nancial reporting purposes and the amounts used for taxation purposes. The following temporary differences are not provided for: the initial recognition of goodwill; the initial recognition of assets or liabilities that affect neither accounting nor taxable profi t other than in a business combination, and differences relating to investments in subsidiaries to the extent that they will probably not reverse in the foreseeable future. The amountof deferred tax provided is based on the expected manner of realisationor settlement of the carrying amount of assets and liabilities, using tax rates enacted or substantively enacted at the balance sheet date.
A deferred tax asset is recognised only to the extent that it is probable that future taxable profi ts will be available against which the asset can be utilised.
ProvisionsProvisions are recognised when an obligation exists for a future liabilityin respect of a past event and where the amount of the obligation can be reliably estimated.
Restructuring provisions are made for direct expenditures of a businessreorganisation where the plans are suffi ciently detailed and well advanced, and where the appropriate communication to those affected has been undertaken at the balance sheet date.
Provision is made for onerous contracts to the extent that the unavoidable costs of meeting the obligations under a contract exceed the economic benefi ts expected to be delivered, discounted using the Group’s weighted average cost of capital.
Foreign currenciesTransactions in foreign currencies are recorded using the rate of exchange ruling at the date of the transaction. Monetary assets and liabilities denominated in foreign currencies are translated using the closing rate of exchange at the balance sheet date and the gains or losses on translation are taken to the income statement. Non-monetaryassets and liabilities that are measured in terms of historical cost in a foreign currency are translated using the exchange rate at the date of the transaction.
The results and cash fl ows of overseas operations are translated using the average rate for the period. Assets and liabilities, includinggoodwill and fair value adjustments, of overseas operations are translated using the closing rate with all exchange differences arising on consolidation being recognised in the foreign currency translation reserve. Exchange differences are released to the income statement on disposal.
Finance chargesInterest charges and income are accounted for in the income statementon an accruals basis. Deferred fi nance fees are charged to the income statement, through interest using the effective rate method.
Interest bearing borrowingsInterest bearing borrowings are recognized initially at fair value less attributable transaction costs. Subsequent to initial recognition, interestbearing borrowings are stated at amortised cost with any difference between cost and redemption value being recognised in the income statement over the period of the borrowings on an effective interest basis.
Cash and cash equivalentsCash and cash equivalents comprise cash at bank and in hand.
NOTES TO THE ACCOUNTS36Regus Report & Accounts 2005
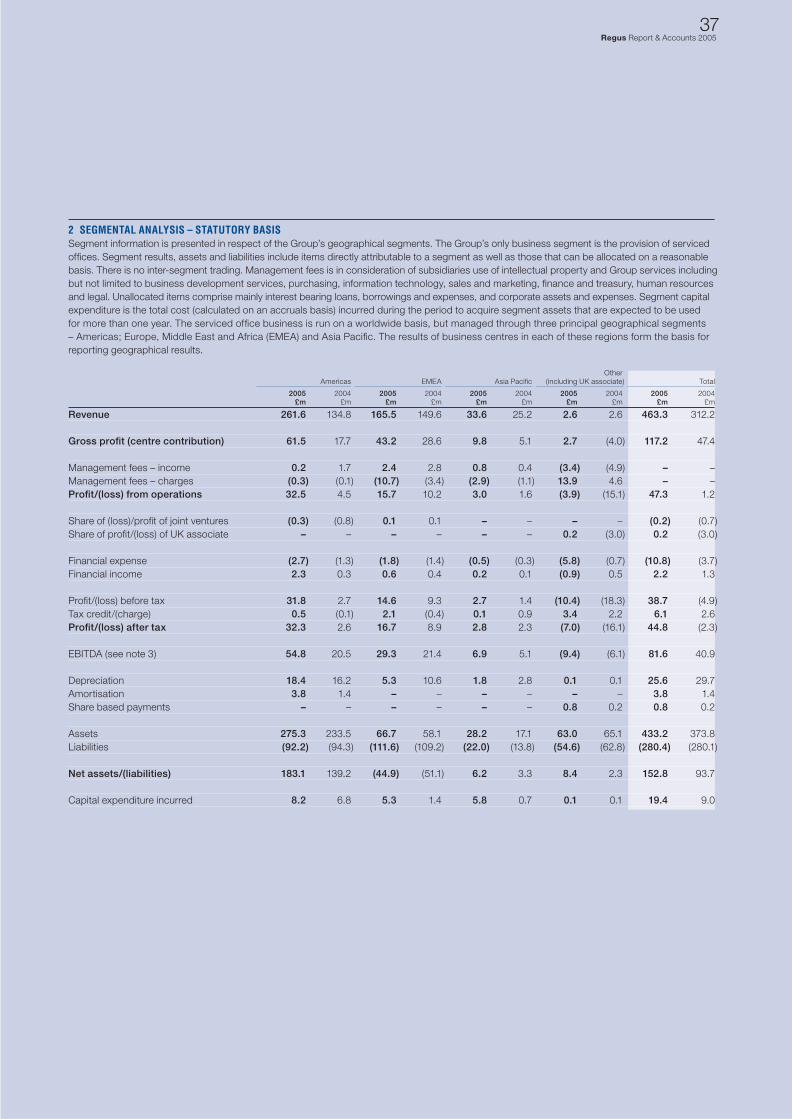
37Regus Report & Accounts 2005
2 SEGMENTAL ANALYSIS – STATUTORY BASISSegment information is presented in respect of the Group’s geographical segments. The Group’s only business segment is the provision of serviced offi ces. Segment results, assets and liabilities include items directly attributable to a segment as well as those that can be allocated on a reasonable basis. There is no inter-segment trading. Management fees is in consideration of subsidiaries use of intellectual property and Group services including but not limited to business development services, purchasing, information technology, sales and marketing, fi nance and treasury, human resources and legal. Unallocated items comprise mainly interest bearing loans, borrowings and expenses, and corporate assets and expenses. Segment capital expenditure is the total cost (calculated on an accruals basis) incurred during the period to acquire segment assets that are expected to be used for more than one year. The serviced offi ce business is run on a worldwide basis, but managed through three principal geographical segments – Americas; Europe, Middle East and Africa (EMEA) and Asia Pacifi c. The results of business centres in each of these regions form the basis for reporting geographical results.
Other Americas EMEA Asia Pacifi c (including UK associate) Total
2005 2004 2005 2004 2005 2004 2005 2004 2005 2004 £m £m £m £m £m £m £m £m £m £m
Revenue 261.6 134.8 165.5 149.6 33.6 25.2 2.6 2.6 463.3 312.2
Gross profi t (centre contribution) 61.5 17.7 43.2 28.6 9.8 5.1 2.7 (4.0) 117.2 47.4
Management fees – income 0.2 1.7 2.4 2.8 0.8 0.4 (3.4) (4.9) – –Management fees – charges (0.3) (0.1) (10.7) (3.4) (2.9) (1.1) 13.9 4.6 – –Profi t/(loss) from operations 32.5 4.5 15.7 10.2 3.0 1.6 (3.9) (15.1) 47.3 1.2
Share of (loss)/profi t of joint ventures (0.3) (0.8) 0.1 0.1 – – – – (0.2) (0.7)Share of profi t/(loss) of UK associate – – – – – – 0.2 (3.0) 0.2 (3.0)
Financial expense (2.7) (1.3) (1.8) (1.4) (0.5) (0.3) (5.8) (0.7) (10.8) (3.7)Financial income 2.3 0.3 0.6 0.4 0.2 0.1 (0.9) 0.5 2.2 1.3
Profi t/(loss) before tax 31.8 2.7 14.6 9.3 2.7 1.4 (10.4) (18.3) 38.7 (4.9)Tax credit/(charge) 0.5 (0.1) 2.1 (0.4) 0.1 0.9 3.4 2.2 6.1 2.6Profi t/(loss) after tax 32.3 2.6 16.7 8.9 2.8 2.3 (7.0) (16.1) 44.8 (2.3)
EBITDA (see note 3) 54.8 20.5 29.3 21.4 6.9 5.1 (9.4) (6.1) 81.6 40.9
Depreciation 18.4 16.2 5.3 10.6 1.8 2.8 0.1 0.1 25.6 29.7Amortisation 3.8 1.4 – – – – – – 3.8 1.4Share based payments – – – – – – 0.8 0.2 0.8 0.2
Assets 275.3 233.5 66.7 58.1 28.2 17.1 63.0 65.1 433.2 373.8Liabilities (92.2) (94.3) (111.6) (109.2) (22.0) (13.8) (54.6) (62.8) (280.4) (280.1)
Net assets/(liabilities) 183.1 139.2 (44.9) (51.1) 6.2 3.3 8.4 2.3 152.8 93.7
Capital expenditure incurred 8.2 6.8 5.3 1.4 5.8 0.7 0.1 0.1 19.4 9.0
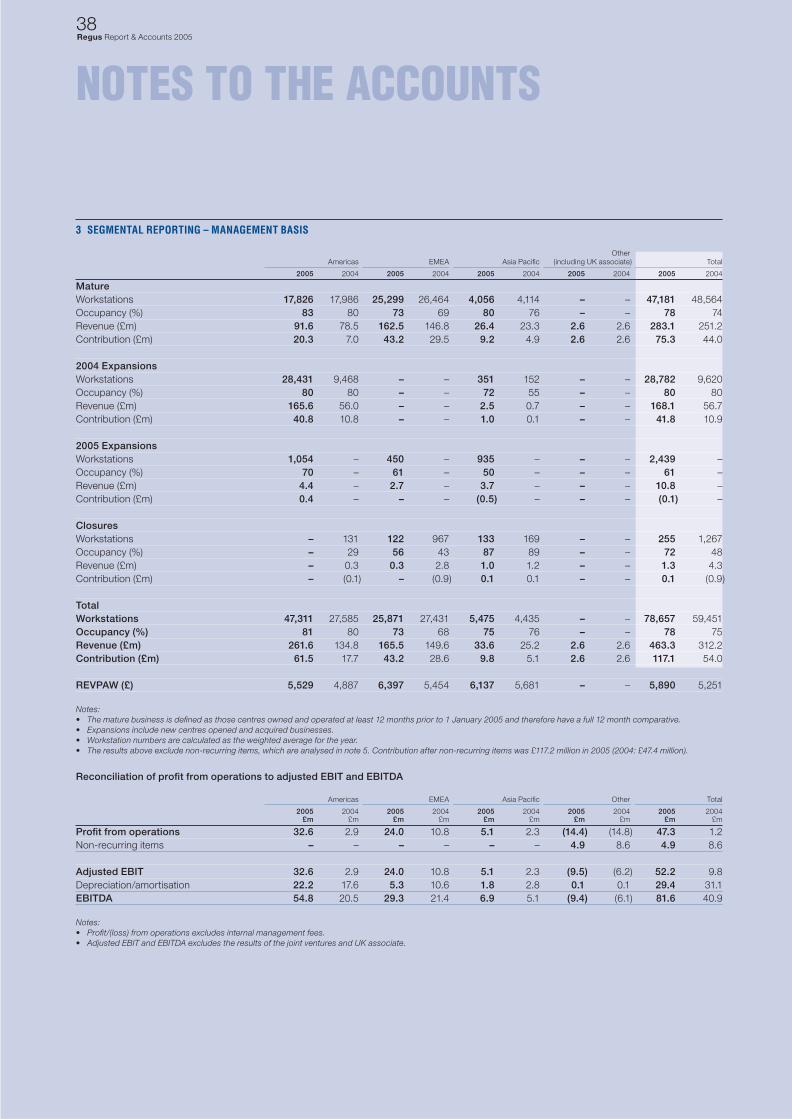
38Regus Report & Accounts 2005
NOTES TO THE ACCOUNTS
3 SEGMENTAL REPORTING – MANAGEMENT BASIS
Other Americas EMEA Asia Pacifi c (including UK associate) Total
2005 2004 2005 2004 2005 2004 2005 2004 2005 2004
MatureWorkstations 17,826 17,986 25,299 26,464 4,056 4,114 – – 47,181 48,564Occupancy (%) 83 80 73 69 80 76 – – 78 74Revenue (£m) 91.6 78.5 162.5 146.8 26.4 23.3 2.6 2.6 283.1 251.2Contribution (£m) 20.3 7.0 43.2 29.5 9.2 4.9 2.6 2.6 75.3 44.0
2004 ExpansionsWorkstations 28,431 9,468 – – 351 152 – – 28,782 9,620Occupancy (%) 80 80 – – 72 55 – – 80 80Revenue (£m) 165.6 56.0 – – 2.5 0.7 – – 168.1 56.7Contribution (£m) 40.8 10.8 – – 1.0 0.1 – – 41.8 10.9
2005 ExpansionsWorkstations 1,054 – 450 – 935 – – – 2,439 –Occupancy (%) 70 – 61 – 50 – – – 61 –Revenue (£m) 4.4 – 2.7 – 3.7 – – – 10.8 –Contribution (£m) 0.4 – – – (0.5) – – – (0.1) –
ClosuresWorkstations – 131 122 967 133 169 – – 255 1,267Occupancy (%) – 29 56 43 87 89 – – 72 48Revenue (£m) – 0.3 0.3 2.8 1.0 1.2 – – 1.3 4.3Contribution (£m) – (0.1) – (0.9) 0.1 0.1 – – 0.1 (0.9)
TotalWorkstations 47,311 27,585 25,871 27,431 5,475 4,435 – – 78,657 59,451Occupancy (%) 81 80 73 68 75 76 – – 78 75Revenue (£m) 261.6 134.8 165.5 149.6 33.6 25.2 2.6 2.6 463.3 312.2Contribution (£m) 61.5 17.7 43.2 28.6 9.8 5.1 2.6 2.6 117.1 54.0
REVPAW (£) 5,529 4,887 6,397 5,454 6,137 5,681 – – 5,890 5,251
Notes:• The mature business is defi ned as those centres owned and operated at least 12 months prior to 1 January 2005 and therefore have a full 12 month comparative.• Expansions include new centres opened and acquired businesses.• Workstation numbers are calculated as the weighted average for the year.• The results above exclude non-recurring items, which are analysed in note 5. Contribution after non-recurring items was £117.2 million in 2005 (2004: £47.4 million).
Reconciliation of profi t from operations to adjusted EBIT and EBITDA
Americas EMEA Asia Pacifi c Other Total
2005 2004 2005 2004 2005 2004 2005 2004 2005 2004 £m £m £m £m £m £m £m £m £m £m
Profi t from operations 32.6 2.9 24.0 10.8 5.1 2.3 (14.4) (14.8) 47.3 1.2Non-recurring items – – – – – – 4.9 8.6 4.9 8.6
Adjusted EBIT 32.6 2.9 24.0 10.8 5.1 2.3 (9.5) (6.2) 52.2 9.8Depreciation/amortisation 22.2 17.6 5.3 10.6 1.8 2.8 0.1 0.1 29.4 31.1EBITDA 54.8 20.5 29.3 21.4 6.9 5.1 (9.4) (6.1) 81.6 40.9
Notes:• Profi t/(loss) from operations excludes internal management fees.• Adjusted EBIT and EBITDA excludes the results of the joint ventures and UK associate.
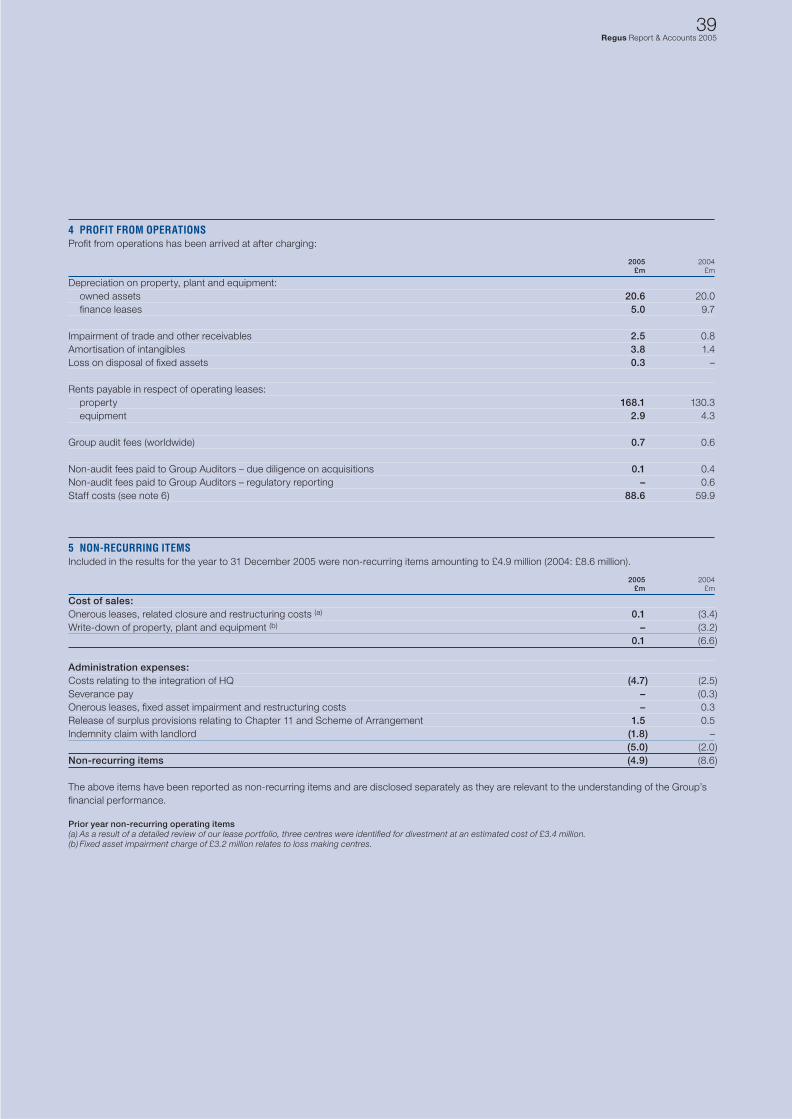
39Regus Report & Accounts 2005
4 PROFIT FROM OPERATIONSProfi t from operations has been arrived at after charging:
2005 2004 £m £m
Depreciation on property, plant and equipment: owned assets 20.6 20.0 fi nance leases 5.0 9.7
Impairment of trade and other receivables 2.5 0.8Amortisation of intangibles 3.8 1.4Loss on disposal of fi xed assets 0.3 –
Rents payable in respect of operating leases: property 168.1 130.3 equipment 2.9 4.3
Group audit fees (worldwide) 0.7 0.6
Non-audit fees paid to Group Auditors – due diligence on acquisitions 0.1 0.4Non-audit fees paid to Group Auditors – regulatory reporting – 0.6Staff costs (see note 6) 88.6 59.9
5 NON-RECURRING ITEMSIncluded in the results for the year to 31 December 2005 were non-recurring items amounting to £4.9 million (2004: £8.6 million).
2005 2004 £m £m
Cost of sales:Onerous leases, related closure and restructuring costs (a) 0.1 (3.4)Write-down of property, plant and equipment (b) – (3.2) 0.1 (6.6)
Administration expenses:Costs relating to the integration of HQ (4.7) (2.5)Severance pay – (0.3)Onerous leases, fi xed asset impairment and restructuring costs – 0.3Release of surplus provisions relating to Chapter 11 and Scheme of Arrangement 1.5 0.5Indemnity claim with landlord (1.8) – (5.0) (2.0)Non-recurring items (4.9) (8.6)
The above items have been reported as non-recurring items and are disclosed separately as they are relevant to the understanding of the Group’sfi nancial performance.
Prior year non-recurring operating items(a) As a result of a detailed review of our lease portfolio, three centres were identifi ed for divestment at an estimated cost of £3.4 million.(b) Fixed asset impairment charge of £3.2 million relates to loss making centres.
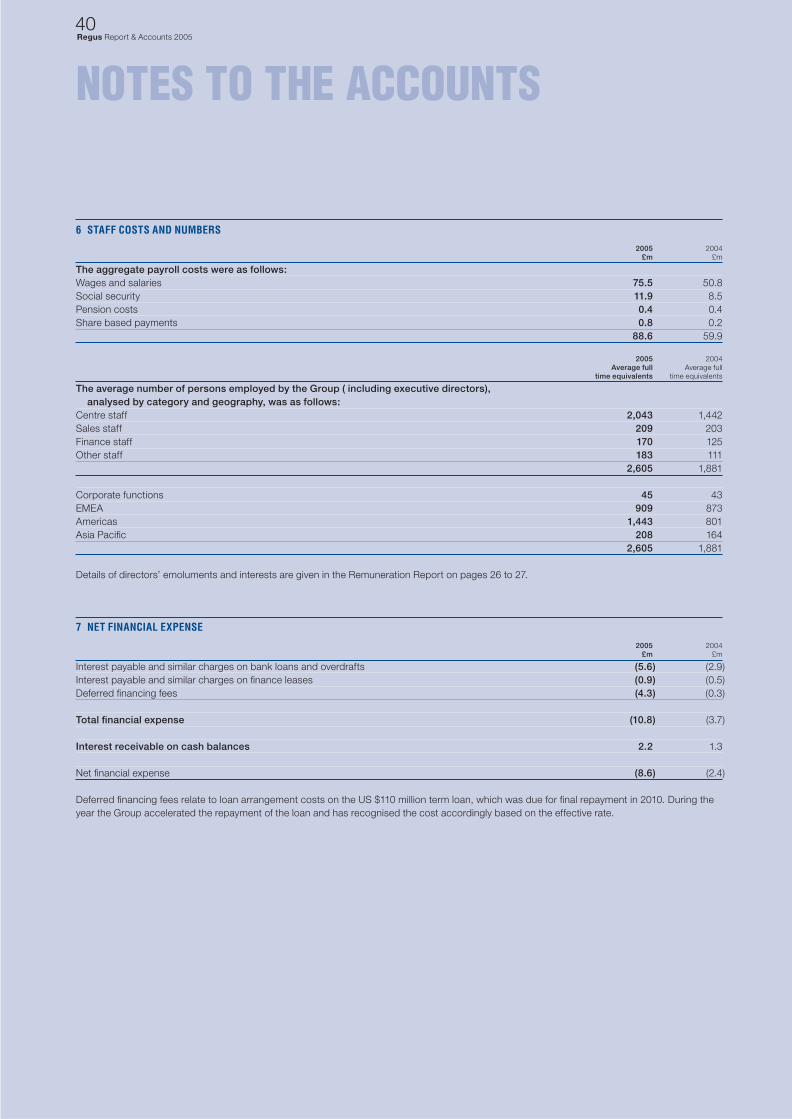
40Regus Report & Accounts 2005
NOTES TO THE ACCOUNTS
6 STAFF COSTS AND NUMBERS
2005 2004 £m £m
The aggregate payroll costs were as follows:Wages and salaries 75.5 50.8Social security 11.9 8.5Pension costs 0.4 0.4Share based payments 0.8 0.2 88.6 59.9
2005 2004 Average full Average full time equivalents time equivalents
The average number of persons employed by the Group ( including executive directors), analysed by category and geography, was as follows:Centre staff 2,043 1,442Sales staff 209 203Finance staff 170 125Other staff 183 111 2,605 1,881
Corporate functions 45 43EMEA 909 873Americas 1,443 801Asia Pacifi c 208 164 2,605 1,881
Details of directors’ emoluments and interests are given in the Remuneration Report on pages 26 to 27.
7 NET FINANCIAL EXPENSE
2005 2004 £m £m
Interest payable and similar charges on bank loans and overdrafts (5.6) (2.9)Interest payable and similar charges on fi nance leases (0.9) (0.5)Deferred fi nancing fees (4.3) (0.3)
Total fi nancial expense (10.8) (3.7)
Interest receivable on cash balances 2.2 1.3
Net fi nancial expense (8.6) (2.4)
Deferred fi nancing fees relate to loan arrangement costs on the US $110 million term loan, which was due for fi nal repayment in 2010. During the year the Group accelerated the repayment of the loan and has recognised the cost accordingly based on the effective rate.
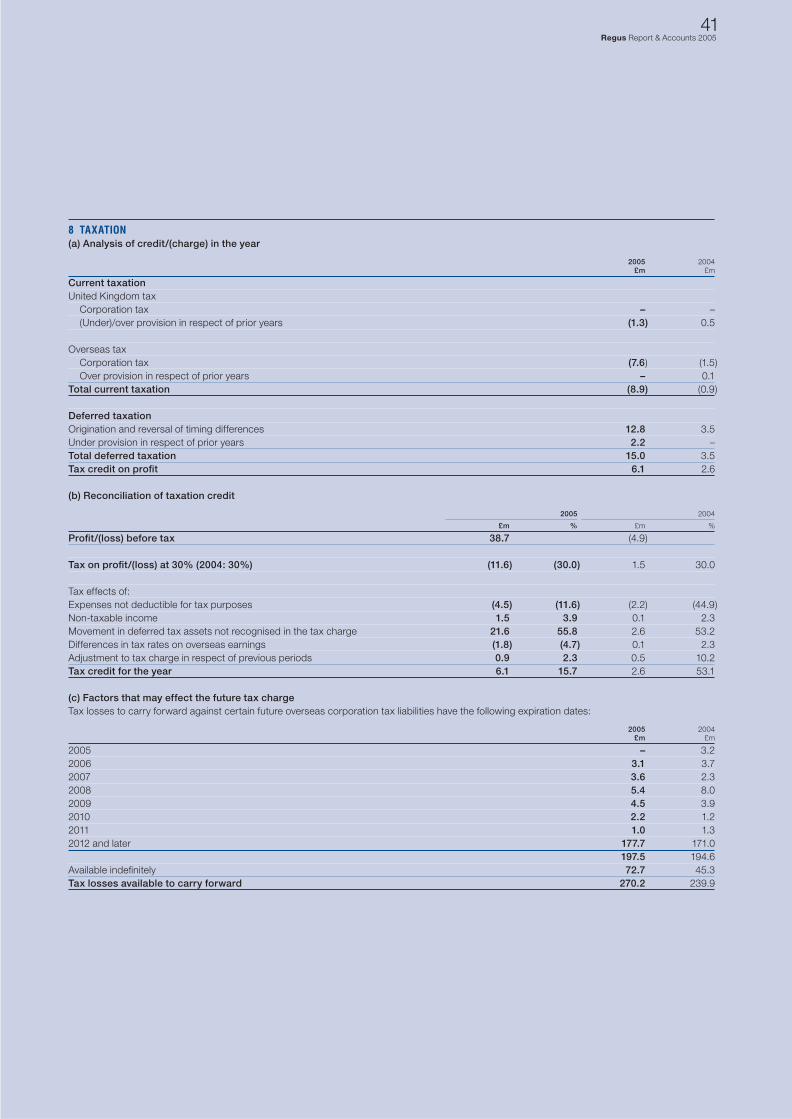
41Regus Report & Accounts 2005
8 TAXATION(a) Analysis of credit/(charge) in the year
2005 2004 £m £m
Current taxationUnited Kingdom tax Corporation tax – – (Under)/over provision in respect of prior years (1.3) 0.5
Overseas tax Corporation tax (7.6) (1.5) Over provision in respect of prior years – 0.1Total current taxation (8.9) (0.9)
Deferred taxationOrigination and reversal of timing differences 12.8 3.5Under provision in respect of prior years 2.2 –Total deferred taxation 15.0 3.5Tax credit on profi t 6.1 2.6
(b) Reconciliation of taxation credit
2005 2004
£m % £m %
Profi t/(loss) before tax 38.7 (4.9)
Tax on profi t/(loss) at 30% (2004: 30%) (11.6) (30.0) 1.5 30.0
Tax effects of:Expenses not deductible for tax purposes (4.5) (11.6) (2.2) (44.9)Non-taxable income 1.5 3.9 0.1 2.3Movement in deferred tax assets not recognised in the tax charge 21.6 55.8 2.6 53.2Differences in tax rates on overseas earnings (1.8) (4.7) 0.1 2.3Adjustment to tax charge in respect of previous periods 0.9 2.3 0.5 10.2Tax credit for the year 6.1 15.7 2.6 53.1
(c) Factors that may effect the future tax chargeTax losses to carry forward against certain future overseas corporation tax liabilities have the following expiration dates:
2005 2004 £m £m
2005 – 3.22006 3.1 3.72007 3.6 2.32008 5.4 8.02009 4.5 3.92010 2.2 1.22011 1.0 1.32012 and later 177.7 171.0 197.5 194.6Available indefi nitely 72.7 45.3Tax losses available to carry forward 270.2 239.9
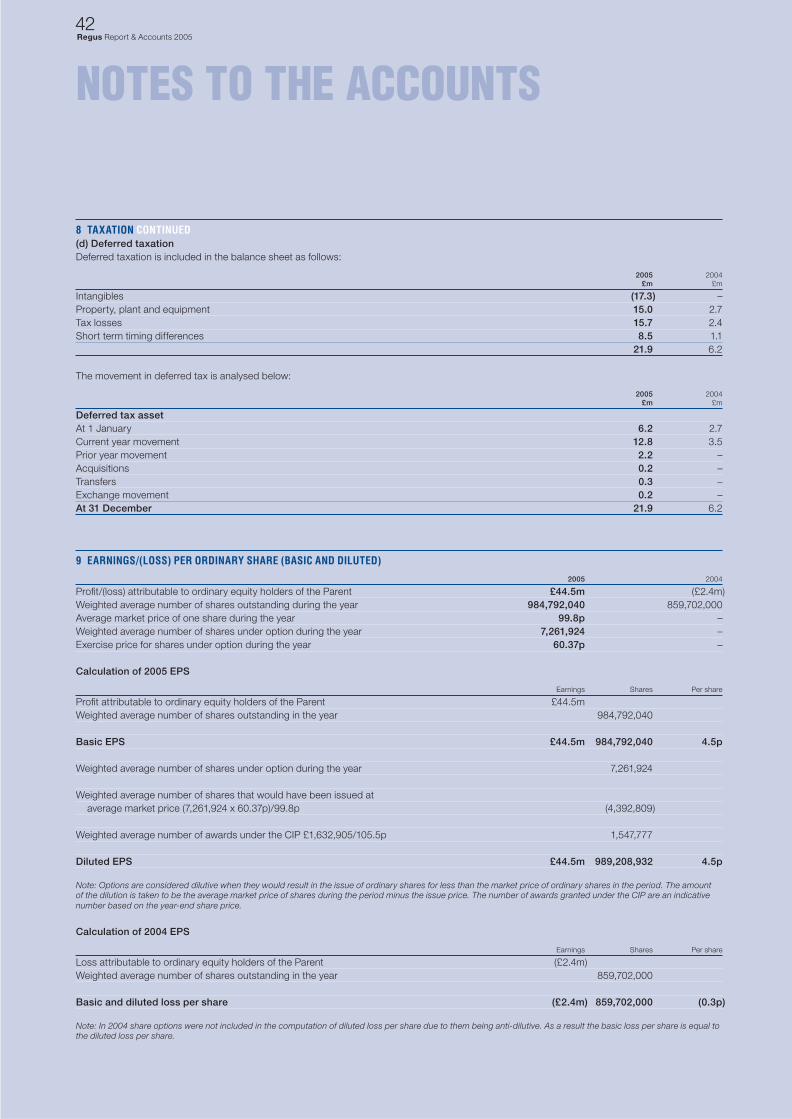
42Regus Report & Accounts 2005
NOTES TO THE ACCOUNTS
8 TAXATION CONTINUED(d) Deferred taxationDeferred taxation is included in the balance sheet as follows:
2005 2004 £m £m
Intangibles (17.3) –Property, plant and equipment 15.0 2.7Tax losses 15.7 2.4Short term timing differences 8.5 1.1 21.9 6.2
The movement in deferred tax is analysed below:
2005 2004 £m £m
Deferred tax assetAt 1 January 6.2 2.7Current year movement 12.8 3.5Prior year movement 2.2 –Acquisitions 0.2 –Transfers 0.3 –Exchange movement 0.2 –At 31 December 21.9 6.2
9 EARNINGS/(LOSS) PER ORDINARY SHARE (BASIC AND DILUTED)
2005 2004
Profi t/(loss) attributable to ordinary equity holders of the Parent £44.5m (£2.4m)Weighted average number of shares outstanding during the year 984,792,040 859,702,000Average market price of one share during the year 99.8p –Weighted average number of shares under option during the year 7,261,924 –Exercise price for shares under option during the year 60.37p –
Calculation of 2005 EPS
Earnings Shares Per share
Profi t attributable to ordinary equity holders of the Parent £44.5mWeighted average number of shares outstanding in the year 984,792,040
Basic EPS £44.5m 984,792,040 4.5p
Weighted average number of shares under option during the year 7,261,924
Weighted average number of shares that would have been issued at average market price (7,261,924 x 60.37p)/99.8p (4,392,809)
Weighted average number of awards under the CIP £1,632,905/105.5p 1,547,777
Diluted EPS £44.5m 989,208,932 4.5p
Note: Options are considered dilutive when they would result in the issue of ordinary shares for less than the market price of ordinary shares in the period. The amount of the dilution is taken to be the average market price of shares during the period minus the issue price. The number of awards granted under the CIP are an indicative number based on the year-end share price.
Calculation of 2004 EPS
Earnings Shares Per share
Loss attributable to ordinary equity holders of the Parent (£2.4m)Weighted average number of shares outstanding in the year 859,702,000
Basic and diluted loss per share (£2.4m) 859,702,000 (0.3p)
Note: In 2004 share options were not included in the computation of diluted loss per share due to them being anti-dilutive. As a result the basic loss per share is equal to the diluted loss per share.
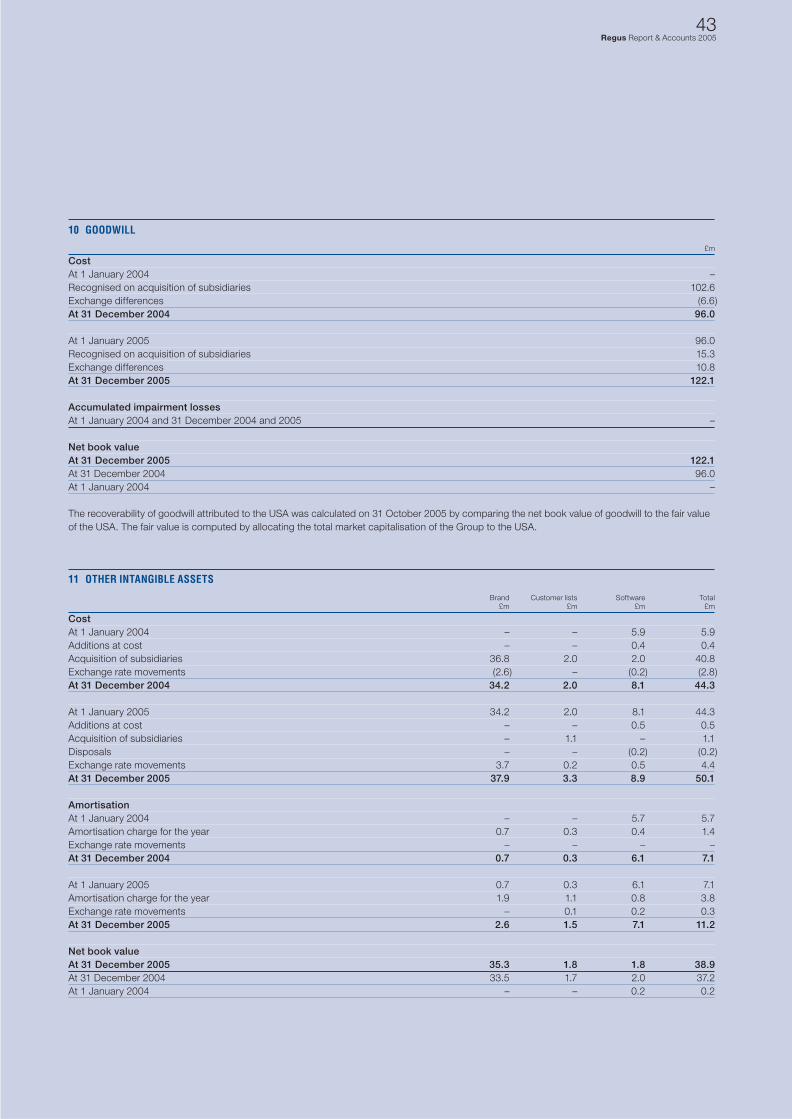
43Regus Report & Accounts 2005
10 GOODWILL
£m
CostAt 1 January 2004 –Recognised on acquisition of subsidiaries 102.6Exchange differences (6.6)At 31 December 2004 96.0
At 1 January 2005 96.0Recognised on acquisition of subsidiaries 15.3Exchange differences 10.8At 31 December 2005 122.1
Accumulated impairment lossesAt 1 January 2004 and 31 December 2004 and 2005 –
Net book valueAt 31 December 2005 122.1At 31 December 2004 96.0At 1 January 2004 –
The recoverability of goodwill attributed to the USA was calculated on 31 October 2005 by comparing the net book value of goodwill to the fair value of the USA. The fair value is computed by allocating the total market capitalisation of the Group to the USA.
11 OTHER INTANGIBLE ASSETS
Brand Customer lists Software Total £m £m £m £m
CostAt 1 January 2004 – – 5.9 5.9Additions at cost – – 0.4 0.4Acquisition of subsidiaries 36.8 2.0 2.0 40.8Exchange rate movements (2.6) – (0.2) (2.8)At 31 December 2004 34.2 2.0 8.1 44.3
At 1 January 2005 34.2 2.0 8.1 44.3Additions at cost – – 0.5 0.5Acquisition of subsidiaries – 1.1 – 1.1Disposals – – (0.2) (0.2)Exchange rate movements 3.7 0.2 0.5 4.4At 31 December 2005 37.9 3.3 8.9 50.1
AmortisationAt 1 January 2004 – – 5.7 5.7Amortisation charge for the year 0.7 0.3 0.4 1.4Exchange rate movements – – – –At 31 December 2004 0.7 0.3 6.1 7.1
At 1 January 2005 0.7 0.3 6.1 7.1Amortisation charge for the year 1.9 1.1 0.8 3.8Exchange rate movements – 0.1 0.2 0.3At 31 December 2005 2.6 1.5 7.1 11.2
Net book valueAt 31 December 2005 35.3 1.8 1.8 38.9At 31 December 2004 33.5 1.7 2.0 37.2At 1 January 2004 – – 0.2 0.2
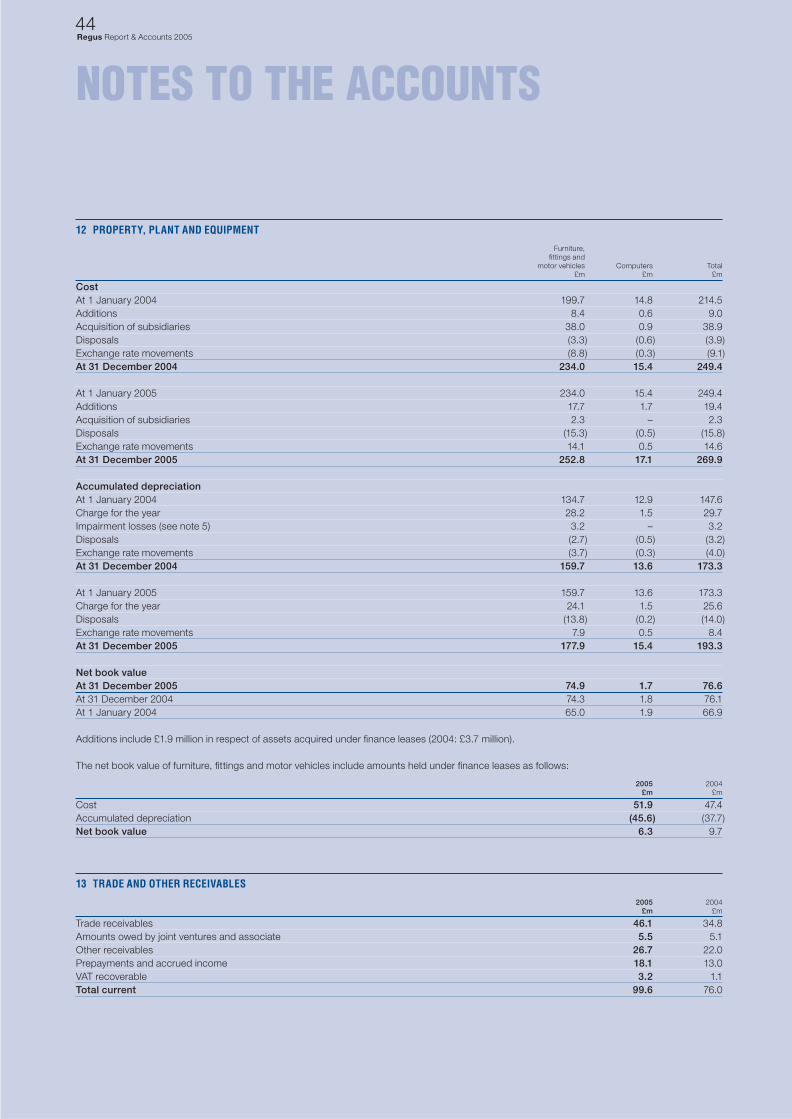
44Regus Report & Accounts 2005
NOTES TO THE ACCOUNTS
12 PROPERTY, PLANT AND EQUIPMENT
Furniture, fi ttings and motor vehicles Computers Total £m £m £m
CostAt 1 January 2004 199.7 14.8 214.5Additions 8.4 0.6 9.0Acquisition of subsidiaries 38.0 0.9 38.9Disposals (3.3) (0.6) (3.9)Exchange rate movements (8.8) (0.3) (9.1)At 31 December 2004 234.0 15.4 249.4
At 1 January 2005 234.0 15.4 249.4Additions 17.7 1.7 19.4Acquisition of subsidiaries 2.3 – 2.3Disposals (15.3) (0.5) (15.8)Exchange rate movements 14.1 0.5 14.6At 31 December 2005 252.8 17.1 269.9
Accumulated depreciationAt 1 January 2004 134.7 12.9 147.6Charge for the year 28.2 1.5 29.7Impairment losses (see note 5) 3.2 – 3.2Disposals (2.7) (0.5) (3.2)Exchange rate movements (3.7) (0.3) (4.0)At 31 December 2004 159.7 13.6 173.3
At 1 January 2005 159.7 13.6 173.3Charge for the year 24.1 1.5 25.6Disposals (13.8) (0.2) (14.0)Exchange rate movements 7.9 0.5 8.4At 31 December 2005 177.9 15.4 193.3
Net book valueAt 31 December 2005 74.9 1.7 76.6At 31 December 2004 74.3 1.8 76.1At 1 January 2004 65.0 1.9 66.9
Additions include £1.9 million in respect of assets acquired under fi nance leases (2004: £3.7 million).
The net book value of furniture, fi ttings and motor vehicles include amounts held under fi nance leases as follows:
2005 2004 £m £m
Cost 51.9 47.4Accumulated depreciation (45.6) (37.7)Net book value 6.3 9.7
13 TRADE AND OTHER RECEIVABLES
2005 2004 £m £m
Trade receivables 46.1 34.8Amounts owed by joint ventures and associate 5.5 5.1Other receivables 26.7 22.0Prepayments and accrued income 18.1 13.0VAT recoverable 3.2 1.1Total current 99.6 76.0
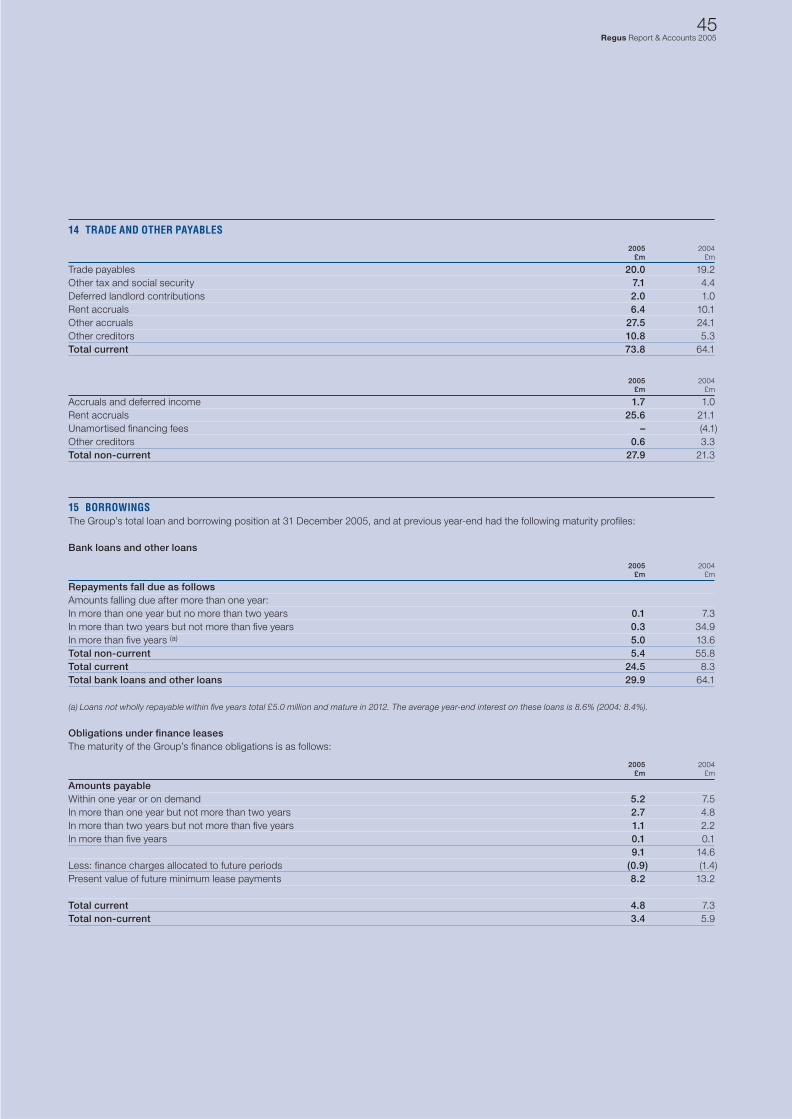
45Regus Report & Accounts 2005
14 TRADE AND OTHER PAYABLES
2005 2004 £m £m
Trade payables 20.0 19.2Other tax and social security 7.1 4.4Deferred landlord contributions 2.0 1.0Rent accruals 6.4 10.1Other accruals 27.5 24.1Other creditors 10.8 5.3Total current 73.8 64.1
2005 2004 £m £m
Accruals and deferred income 1.7 1.0Rent accruals 25.6 21.1Unamortised fi nancing fees – (4.1)Other creditors 0.6 3.3Total non-current 27.9 21.3
15 BORROWINGSThe Group’s total loan and borrowing position at 31 December 2005, and at previous year-end had the following maturity profi les:
Bank loans and other loans
2005 2004 £m £m
Repayments fall due as followsAmounts falling due after more than one year:In more than one year but no more than two years 0.1 7.3In more than two years but not more than fi ve years 0.3 34.9In more than fi ve years (a) 5.0 13.6Total non-current 5.4 55.8Total current 24.5 8.3Total bank loans and other loans 29.9 64.1
(a) Loans not wholly repayable within fi ve years total £5.0 million and mature in 2012. The average year-end interest on these loans is 8.6% (2004: 8.4%).
Obligations under fi nance leasesThe maturity of the Group’s fi nance obligations is as follows:
2005 2004 £m £m
Amounts payableWithin one year or on demand 5.2 7.5In more than one year but not more than two years 2.7 4.8In more than two years but not more than fi ve years 1.1 2.2In more than fi ve years 0.1 0.1 9.1 14.6Less: fi nance charges allocated to future periods (0.9) (1.4)Present value of future minimum lease payments 8.2 13.2
Total current 4.8 7.3Total non-current 3.4 5.9

46Regus Report & Accounts 2005
NOTES TO THE ACCOUNTS
16 PROVISIONS FOR LIABILITIES AND CHARGES
2005 2004 £m £m
At 1 January 21.9 52.6Provided in the period 2.3 2.7Utilised in the period (7.2) (32.1)Provisions released (2.0) (0.6)Exchange differences 0.1 (0.7)
At 31 December 15.1 21.9
Analysed between:Current 7.2 13.0Non-current 7.9 8.9
The above provision is in respect of onerous leases and closure provisions.
17 PROVISION FOR DEFICIT ON JOINT VENTURES AND ASSOCIATE
Investment in Investments UK associate in joint ventures Total £m £m £m
At 1 January 2005 (4.0) (1.8) (5.8)Additions – 0.1 0.1Share of profi t/(losses) 0.2 (0.2) –Exchange rate movements – (0.2) (0.2)At 31 December 2005 (3.8) (2.1) (5.9)
Ownership
2005 2004Entity Country % %
AssociateRegus Holdings (UK) Limited England 42 42Joint venturesRegus Equity Business Centers L.L.C. USA 50 50Skyport International Ing Vastgoed Beleggingen WTC1 Netherlands 50 50Skyport International Ing Vastgoed Beleggingen WTC2 Netherlands 50 –Regus Istanbul Is Merkezi Isletmeciligi AS Turkey 30 –
The following information is given in respect of Regus Holdings (UK) Limited, which became an associate on 31 December 2002. 2004 is restated under IFRS.
The Group’s interest in the ordinary shares of the associate equates to 42%. The results stated below are the results of the UK associate and do not represent the effective share of 42%.
2005 2004 £m £m
UK associateIncome statementTurnover 161.4 156.4Profi t/(loss) before tax 0.5 (7.9)Tax – 0.7Profi t/(loss) after tax 0.5 (7.2)
Net liabilitiesFixed assets 36.2 41.9Current assets 72.6 66.2Current liabilities (116.0) (114.0)Non-current liabilities (1.9) (3.8)Net liabilities (9.1) (9.7)
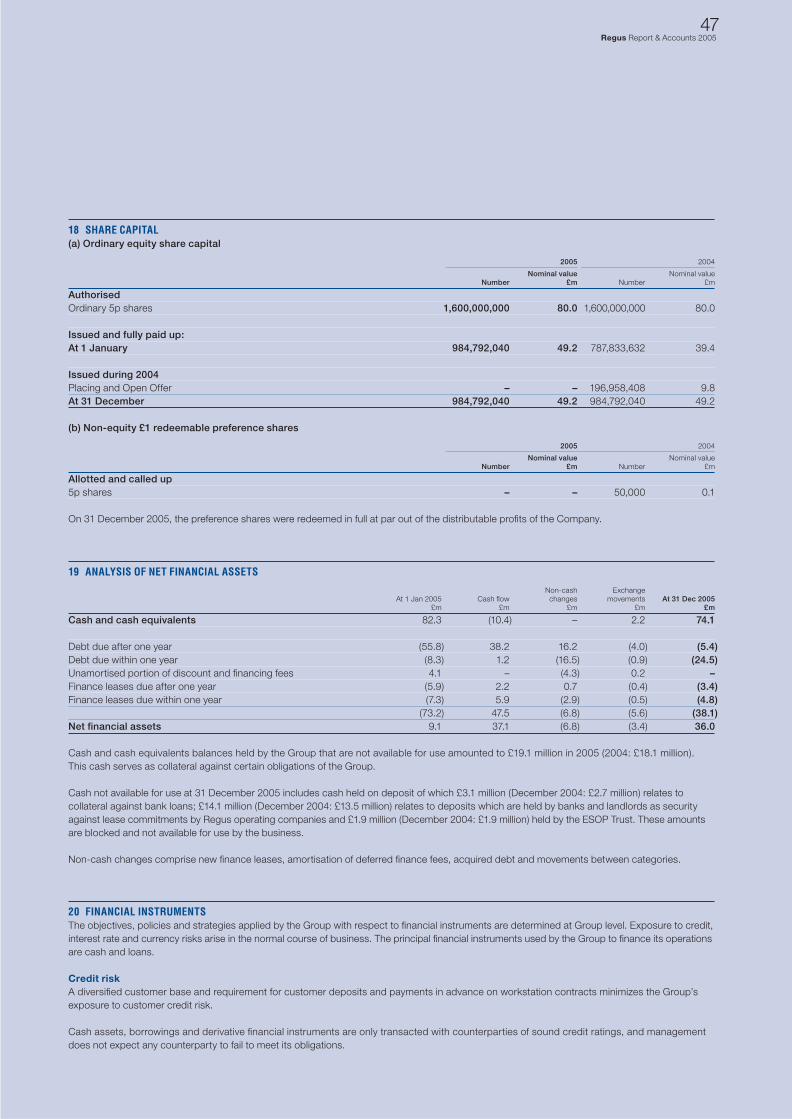
47Regus Report & Accounts 2005
18 SHARE CAPITAL(a) Ordinary equity share capital
2005 2004
Nominal value Nominal value Number £m Number £m
AuthorisedOrdinary 5p shares 1,600,000,000 80.0 1,600,000,000 80.0
Issued and fully paid up:At 1 January 984,792,040 49.2 787,833,632 39.4
Issued during 2004Placing and Open Offer – – 196,958,408 9.8At 31 December 984,792,040 49.2 984,792,040 49.2
(b) Non-equity £1 redeemable preference shares
2005 2004
Nominal value Nominal value Number £m Number £m
Allotted and called up5p shares – – 50,000 0.1
On 31 December 2005, the preference shares were redeemed in full at par out of the distributable profi ts of the Company.
19 ANALYSIS OF NET FINANCIAL ASSETS
Non-cash Exchange At 1 Jan 2005 Cash fl ow changes movements At 31 Dec 2005 £m £m £m £m £m
Cash and cash equivalents 82.3 (10.4) – 2.2 74.1
Debt due after one year (55.8) 38.2 16.2 (4.0) (5.4)Debt due within one year (8.3) 1.2 (16.5) (0.9) (24.5)Unamortised portion of discount and fi nancing fees 4.1 – (4.3) 0.2 –Finance leases due after one year (5.9) 2.2 0.7 (0.4) (3.4)Finance leases due within one year (7.3) 5.9 (2.9) (0.5) (4.8) (73.2) 47.5 (6.8) (5.6) (38.1)Net fi nancial assets 9.1 37.1 (6.8) (3.4) 36.0
Cash and cash equivalents balances held by the Group that are not available for use amounted to £19.1 million in 2005 (2004: £18.1 million). This cash serves as collateral against certain obligations of the Group.
Cash not available for use at 31 December 2005 includes cash held on deposit of which £3.1 million (December 2004: £2.7 million) relates to collateral against bank loans; £14.1 million (December 2004: £13.5 million) relates to deposits which are held by banks and landlords as security against lease commitments by Regus operating companies and £1.9 million (December 2004: £1.9 million) held by the ESOP Trust. These amounts are blocked and not available for use by the business.
Non-cash changes comprise new fi nance leases, amortisation of deferred fi nance fees, acquired debt and movements between categories.
20 FINANCIAL INSTRUMENTSThe objectives, policies and strategies applied by the Group with respect to fi nancial instruments are determined at Group level. Exposure to credit, interest rate and currency risks arise in the normal course of business. The principal fi nancial instruments used by the Group to fi nance its operations are cash and loans.
Credit riskA diversifi ed customer base and requirement for customer deposits and payments in advance on workstation contracts minimizes the Group’s exposure to customer credit risk.
Cash assets, borrowings and derivative fi nancial instruments are only transacted with counterparties of sound credit ratings, and management does not expect any counterparty to fail to meet its obligations.
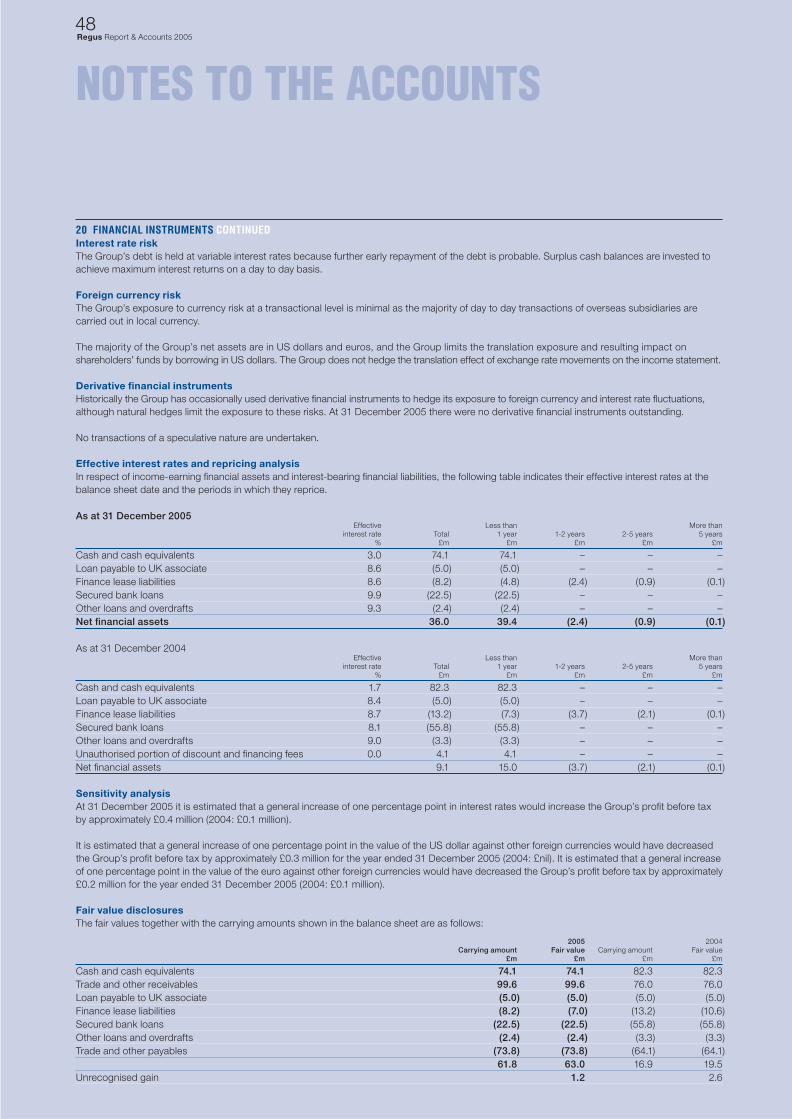
48Regus Report & Accounts 2005
NOTES TO THE ACCOUNTS
20 FINANCIAL INSTRUMENTS CONTINUEDInterest rate riskThe Group’s debt is held at variable interest rates because further early repayment of the debt is probable. Surplus cash balances are invested to achieve maximum interest returns on a day to day basis.
Foreign currency riskThe Group’s exposure to currency risk at a transactional level is minimal as the majority of day to day transactions of overseas subsidiaries are carried out in local currency.
The majority of the Group’s net assets are in US dollars and euros, and the Group limits the translation exposure and resulting impact on shareholders’ funds by borrowing in US dollars. The Group does not hedge the translation effect of exchange rate movements on the income statement.
Derivative fi nancial instrumentsHistorically the Group has occasionally used derivative fi nancial instruments to hedge its exposure to foreign currency and interest rate fl uctuations, although natural hedges limit the exposure to these risks. At 31 December 2005 there were no derivative fi nancial instruments outstanding.
No transactions of a speculative nature are undertaken.
Effective interest rates and repricing analysisIn respect of income-earning fi nancial assets and interest-bearing fi nancial liabilities, the following table indicates their effective interest rates at the balance sheet date and the periods in which they reprice.
As at 31 December 2005 Effective Less than More than interest rate Total 1 year 1-2 years 2-5 years 5 years % £m £m £m £m £m
Cash and cash equivalents 3.0 74.1 74.1 – – –Loan payable to UK associate 8.6 (5.0) (5.0) – – –Finance lease liabilities 8.6 (8.2) (4.8) (2.4) (0.9) (0.1)Secured bank loans 9.9 (22.5) (22.5) – – –Other loans and overdrafts 9.3 (2.4) (2.4) – – –Net fi nancial assets 36.0 39.4 (2.4) (0.9) (0.1)
As at 31 December 2004 Effective Less than More than interest rate Total 1 year 1-2 years 2-5 years 5 years % £m £m £m £m £m
Cash and cash equivalents 1.7 82.3 82.3 – – –Loan payable to UK associate 8.4 (5.0) (5.0) – – –Finance lease liabilities 8.7 (13.2) (7.3) (3.7) (2.1) (0.1)Secured bank loans 8.1 (55.8) (55.8) – – –Other loans and overdrafts 9.0 (3.3) (3.3) – – –Unauthorised portion of discount and fi nancing fees 0.0 4.1 4.1 – – –Net fi nancial assets 9.1 15.0 (3.7) (2.1) (0.1)
Sensitivity analysisAt 31 December 2005 it is estimated that a general increase of one percentage point in interest rates would increase the Group’s profi t before tax by approximately £0.4 million (2004: £0.1 million).
It is estimated that a general increase of one percentage point in the value of the US dollar against other foreign currencies would have decreased the Group’s profi t before tax by approximately £0.3 million for the year ended 31 December 2005 (2004: £nil). It is estimated that a general increase of one percentage point in the value of the euro against other foreign currencies would have decreased the Group’s profi t before tax by approximately £0.2 million for the year ended 31 December 2005 (2004: £0.1 million).
Fair value disclosuresThe fair values together with the carrying amounts shown in the balance sheet are as follows:
2005 2004 Carrying amount Fair value Carrying amount Fair value £m £m £m £m
Cash and cash equivalents 74.1 74.1 82.3 82.3Trade and other receivables 99.6 99.6 76.0 76.0Loan payable to UK associate (5.0) (5.0) (5.0) (5.0)Finance lease liabilities (8.2) (7.0) (13.2) (10.6)Secured bank loans (22.5) (22.5) (55.8) (55.8)Other loans and overdrafts (2.4) (2.4) (3.3) (3.3)Trade and other payables (73.8) (73.8) (64.1) (64.1) 61.8 63.0 16.9 19.5Unrecognised gain 1.2 2.6
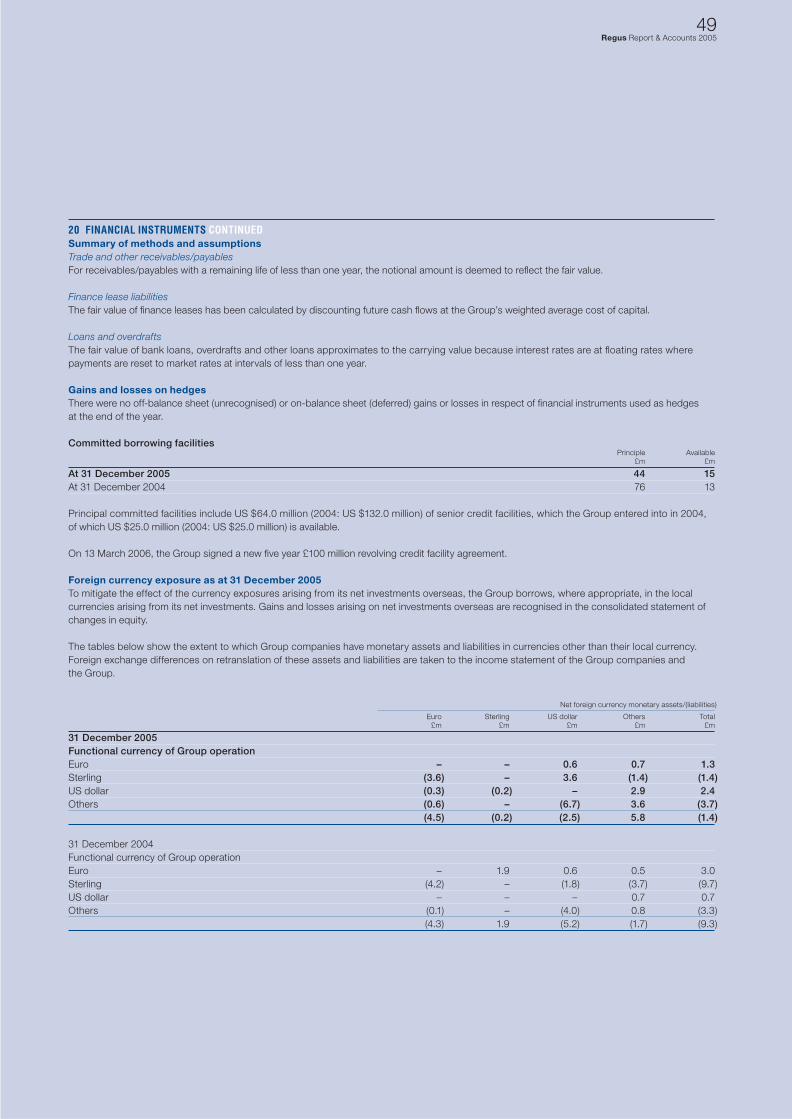
49Regus Report & Accounts 2005
20 FINANCIAL INSTRUMENTS CONTINUEDSummary of methods and assumptionsTrade and other receivables/payablesFor receivables/payables with a remaining life of less than one year, the notional amount is deemed to refl ect the fair value.
Finance lease liabilitiesThe fair value of fi nance leases has been calculated by discounting future cash fl ows at the Group’s weighted average cost of capital.
Loans and overdraftsThe fair value of bank loans, overdrafts and other loans approximates to the carrying value because interest rates are at fl oating rates where payments are reset to market rates at intervals of less than one year.
Gains and losses on hedgesThere were no off-balance sheet (unrecognised) or on-balance sheet (deferred) gains or losses in respect of fi nancial instruments used as hedges at the end of the year.
Committed borrowing facilities Principle Available £m £m
At 31 December 2005 44 15At 31 December 2004 76 13
Principal committed facilities include US $64.0 million (2004: US $132.0 million) of senior credit facilities, which the Group entered into in 2004, of which US $25.0 million (2004: US $25.0 million) is available.
On 13 March 2006, the Group signed a new fi ve year £100 million revolving credit facility agreement.
Foreign currency exposure as at 31 December 2005To mitigate the effect of the currency exposures arising from its net investments overseas, the Group borrows, where appropriate, in the local currencies arising from its net investments. Gains and losses arising on net investments overseas are recognised in the consolidated statement of changes in equity.
The tables below show the extent to which Group companies have monetary assets and liabilities in currencies other than their local currency. Foreign exchange differences on retranslation of these assets and liabilities are taken to the income statement of the Group companies and the Group.
Net foreign currency monetary assets/(liabilities)
Euro Sterling US dollar Others Total £m £m £m £m £m
31 December 2005Functional currency of Group operationEuro – – 0.6 0.7 1.3Sterling (3.6) – 3.6 (1.4) (1.4)US dollar (0.3) (0.2) – 2.9 2.4Others (0.6) – (6.7) 3.6 (3.7) (4.5) (0.2) (2.5) 5.8 (1.4)
31 December 2004Functional currency of Group operationEuro – 1.9 0.6 0.5 3.0Sterling (4.2) – (1.8) (3.7) (9.7)US dollar – – – 0.7 0.7Others (0.1) – (4.0) 0.8 (3.3) (4.3) 1.9 (5.2) (1.7) (9.3)
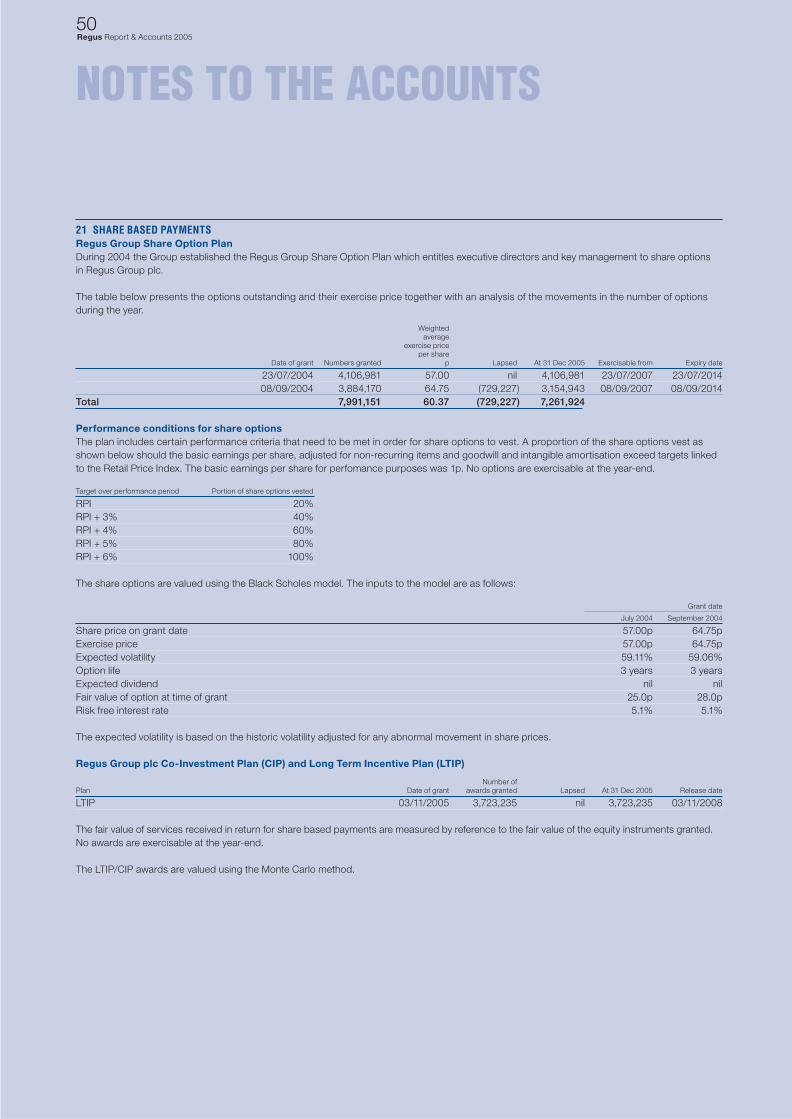
50Regus Report & Accounts 2005
NOTES TO THE ACCOUNTS
21 SHARE BASED PAYMENTSRegus Group Share Option PlanDuring 2004 the Group established the Regus Group Share Option Plan which entitles executive directors and key management to share options in Regus Group plc.
The table below presents the options outstanding and their exercise price together with an analysis of the movements in the number of options during the year.
Weighted average exercise price per share Date of grant Numbers granted p Lapsed At 31 Dec 2005 Exercisable from Expiry date
23/07/2004 4,106,981 57.00 nil 4,106,981 23/07/2007 23/07/2014 08/09/2004 3,884,170 64.75 (729,227) 3,154,943 08/09/2007 08/09/2014Total 7,991,151 60.37 (729,227) 7,261,924
Performance conditions for share optionsThe plan includes certain performance criteria that need to be met in order for share options to vest. A proportion of the share options vest as shown below should the basic earnings per share, adjusted for non-recurring items and goodwill and intangible amortisation exceed targets linked to the Retail Price Index. The basic earnings per share for perfomance purposes was 1p. No options are exercisable at the year-end.
Target over performance period Portion of share options vested
RPI 20%RPI + 3% 40%RPI + 4% 60%RPI + 5% 80%RPI + 6% 100%
The share options are valued using the Black Scholes model. The inputs to the model are as follows:
Grant date
July 2004 September 2004
Share price on grant date 57.00p 64.75pExercise price 57.00p 64.75pExpected volatility 59.11% 59.06%Option life 3 years 3 yearsExpected dividend nil nilFair value of option at time of grant 25.0p 28.0pRisk free interest rate 5.1% 5.1%
The expected volatility is based on the historic volatility adjusted for any abnormal movement in share prices.
Regus Group plc Co-Investment Plan (CIP) and Long Term Incentive Plan (LTIP)
Number ofPlan Date of grant awards granted Lapsed At 31 Dec 2005 Release date
LTIP 03/11/2005 3,723,235 nil 3,723,235 03/11/2008
The fair value of services received in return for share based payments are measured by reference to the fair value of the equity instruments granted. No awards are exercisable at the year-end.
The LTIP/CIP awards are valued using the Monte Carlo method.
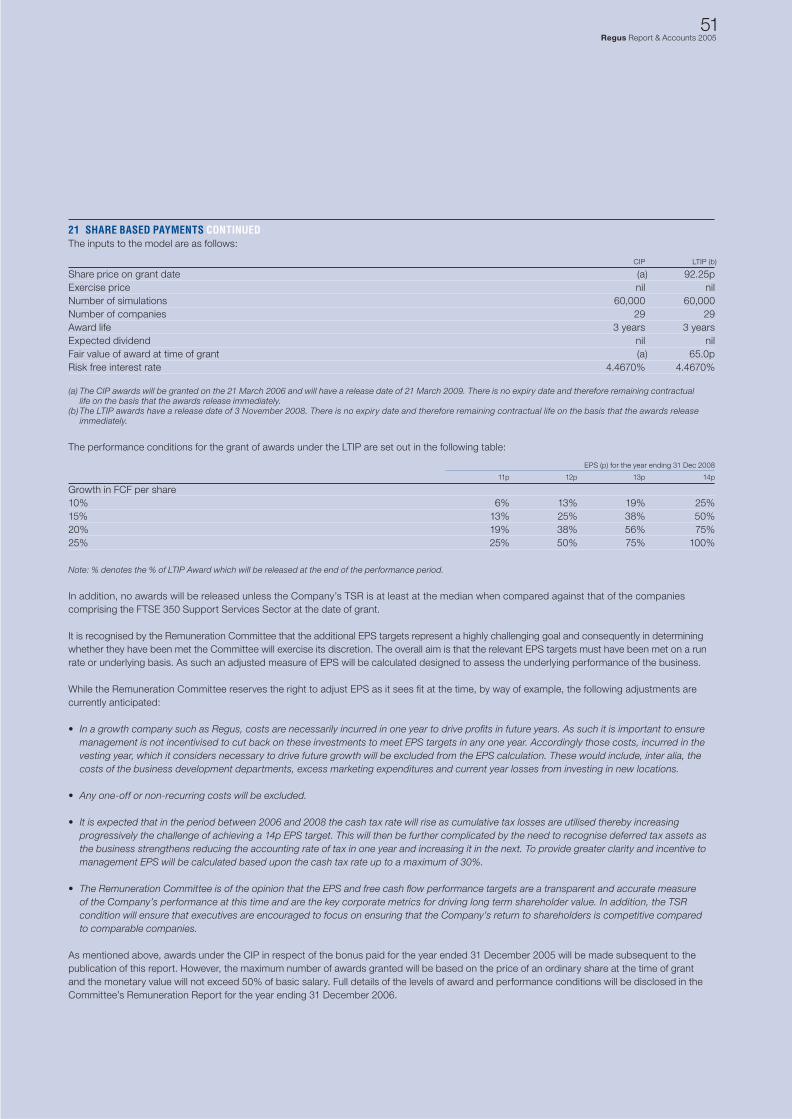
51Regus Report & Accounts 2005
21 SHARE BASED PAYMENTS CONTINUEDThe inputs to the model are as follows:
CIP LTIP (b)
Share price on grant date (a) 92.25pExercise price nil nilNumber of simulations 60,000 60,000Number of companies 29 29Award life 3 years 3 yearsExpected dividend nil nilFair value of award at time of grant (a) 65.0pRisk free interest rate 4.4670% 4.4670%
(a) The CIP awards will be granted on the 21 March 2006 and will have a release date of 21 March 2009. There is no expiry date and therefore remaining contractual life on the basis that the awards release immediately.(b) The LTIP awards have a release date of 3 November 2008. There is no expiry date and therefore remaining contractual life on the basis that the awards release immediately.
The performance conditions for the grant of awards under the LTIP are set out in the following table:
EPS (p) for the year ending 31 Dec 2008
11p 12p 13p 14p
Growth in FCF per share10% 6% 13% 19% 25%15% 13% 25% 38% 50%20% 19% 38% 56% 75%25% 25% 50% 75% 100%
Note: % denotes the % of LTIP Award which will be released at the end of the performance period.
In addition, no awards will be released unless the Company’s TSR is at least at the median when compared against that of the companies comprising the FTSE 350 Support Services Sector at the date of grant.
It is recognised by the Remuneration Committee that the additional EPS targets represent a highly challenging goal and consequently in determining whether they have been met the Committee will exercise its discretion. The overall aim is that the relevant EPS targets must have been met on a run rate or underlying basis. As such an adjusted measure of EPS will be calculated designed to assess the underlying performance of the business.
While the Remuneration Committee reserves the right to adjust EPS as it sees fi t at the time, by way of example, the following adjustments are currently anticipated:
• In a growth company such as Regus, costs are necessarily incurred in one year to drive profi ts in future years. As such it is important to ensure management is not incentivised to cut back on these investments to meet EPS targets in any one year. Accordingly those costs, incurred in the vesting year, which it considers necessary to drive future growth will be excluded from the EPS calculation. These would include, inter alia, the costs of the business development departments, excess marketing expenditures and current year losses from investing in new locations.
• Any one-off or non-recurring costs will be excluded.
• It is expected that in the period between 2006 and 2008 the cash tax rate will rise as cumulative tax losses are utilised thereby increasing progressively the challenge of achieving a 14p EPS target. This will then be further complicated by the need to recognise deferred tax assets as the business strengthens reducing the accounting rate of tax in one year and increasing it in the next. To provide greater clarity and incentive to management EPS will be calculated based upon the cash tax rate up to a maximum of 30%.
• The Remuneration Committee is of the opinion that the EPS and free cash fl ow performance targets are a transparent and accurate measure of the Company’s performance at this time and are the key corporate metrics for driving long term shareholder value. In addition, the TSR condition will ensure that executives are encouraged to focus on ensuring that the Company’s return to shareholders is competitive compared to comparable companies.
As mentioned above, awards under the CIP in respect of the bonus paid for the year ended 31 December 2005 will be made subsequent to the publication of this report. However, the maximum number of awards granted will be based on the price of an ordinary share at the time of grant and the monetary value will not exceed 50% of basic salary. Full details of the levels of award and performance conditions will be disclosed in the Committee’s Remuneration Report for the year ending 31 December 2006.
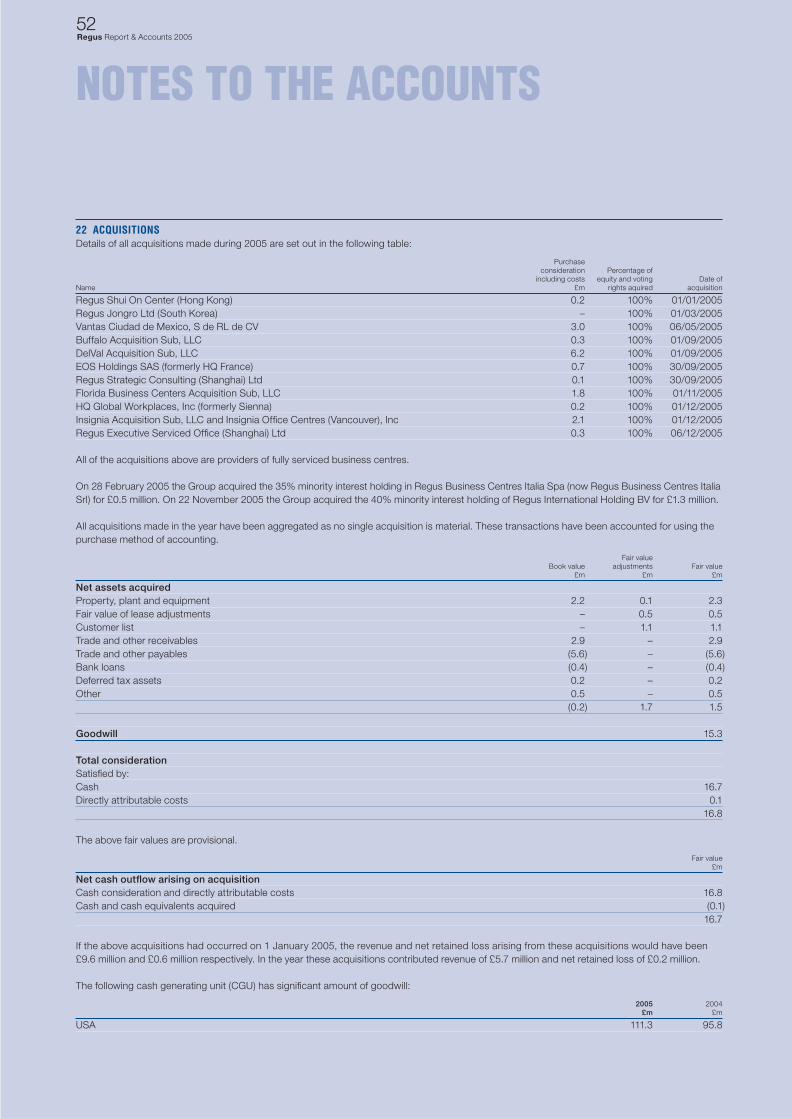
52Regus Report & Accounts 2005
NOTES TO THE ACCOUNTS
22 ACQUISITIONSDetails of all acquisitions made during 2005 are set out in the following table:
Purchase consideration Percentage of including costs equity and voting Date ofName £m rights aquired acquisition
Regus Shui On Center (Hong Kong) 0.2 100% 01/01/2005Regus Jongro Ltd (South Korea) – 100% 01/03/2005Vantas Ciudad de Mexico, S de RL de CV 3.0 100% 06/05/2005Buffalo Acquisition Sub, LLC 0.3 100% 01/09/2005DelVal Acquisition Sub, LLC 6.2 100% 01/09/2005EOS Holdings SAS (formerly HQ France) 0.7 100% 30/09/2005Regus Strategic Consulting (Shanghai) Ltd 0.1 100% 30/09/2005Florida Business Centers Acquisition Sub, LLC 1.8 100% 01/11/2005HQ Global Workplaces, Inc (formerly Sienna) 0.2 100% 01/12/2005Insignia Acquisition Sub, LLC and Insignia Offi ce Centres (Vancouver), Inc 2.1 100% 01/12/2005Regus Executive Serviced Offi ce (Shanghai) Ltd 0.3 100% 06/12/2005
All of the acquisitions above are providers of fully serviced business centres.
On 28 February 2005 the Group acquired the 35% minority interest holding in Regus Business Centres Italia Spa (now Regus Business Centres Italia Srl) for £0.5 million. On 22 November 2005 the Group acquired the 40% minority interest holding of Regus International Holding BV for £1.3 million.
All acquisitions made in the year have been aggregated as no single acquisition is material. These transactions have been accounted for using the purchase method of accounting.
Fair value Book value adjustments Fair value £m £m £m
Net assets acquiredProperty, plant and equipment 2.2 0.1 2.3Fair value of lease adjustments – 0.5 0.5Customer list – 1.1 1.1Trade and other receivables 2.9 – 2.9Trade and other payables (5.6) – (5.6)Bank loans (0.4) – (0.4)Deferred tax assets 0.2 – 0.2Other 0.5 – 0.5 (0.2) 1.7 1.5
Goodwill 15.3
Total considerationSatisfi ed by:Cash 16.7Directly attributable costs 0.1 16.8
The above fair values are provisional.
Fair value £m
Net cash outfl ow arising on acquisitionCash consideration and directly attributable costs 16.8Cash and cash equivalents acquired (0.1) 16.7
If the above acquisitions had occurred on 1 January 2005, the revenue and net retained loss arising from these acquisitions would have been £9.6 million and £0.6 million respectively. In the year these acquisitions contributed revenue of £5.7 million and net retained loss of £0.2 million.
The following cash generating unit (CGU) has signifi cant amount of goodwill:
2005 2004 £m £m
USA 111.3 95.8
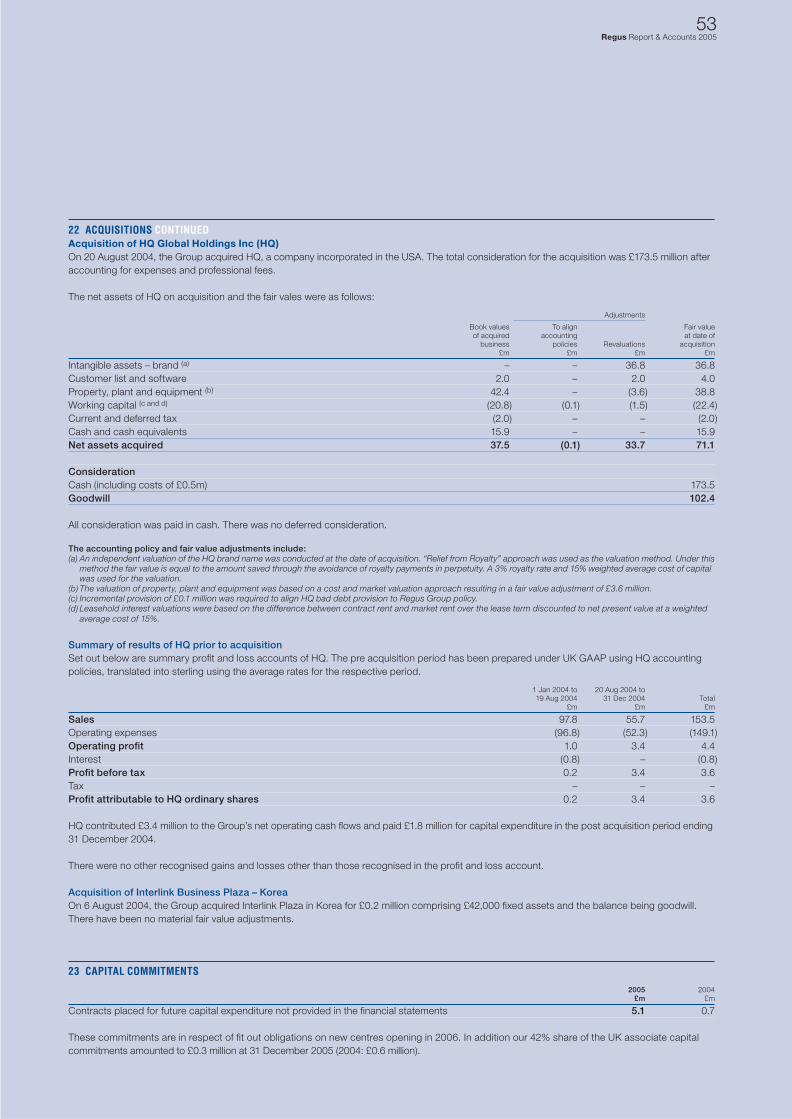
53Regus Report & Accounts 2005
22 ACQUISITIONS CONTINUEDAcquisition of HQ Global Holdings Inc (HQ)On 20 August 2004, the Group acquired HQ, a company incorporated in the USA. The total consideration for the acquisition was £173.5 million after accounting for expenses and professional fees.
The net assets of HQ on acquisition and the fair vales were as follows:
Adjustments
Book values To align Fair value of acquired accounting at date of business policies Revaluations acquisition £m £m £m £m
Intangible assets – brand (a) – – 36.8 36.8Customer list and software 2.0 – 2.0 4.0Property, plant and equipment (b) 42.4 – (3.6) 38.8Working capital (c and d) (20.8) (0.1) (1.5) (22.4)Current and deferred tax (2.0) – – (2.0)Cash and cash equivalents 15.9 – – 15.9Net assets acquired 37.5 (0.1) 33.7 71.1
ConsiderationCash (including costs of £0.5m) 173.5Goodwill 102.4
All consideration was paid in cash. There was no deferred consideration.
The accounting policy and fair value adjustments include:(a) An independent valuation of the HQ brand name was conducted at the date of acquisition. “Relief from Royalty” approach was used as the valuation method. Under this method the fair value is equal to the amount saved through the avoidance of royalty payments in perpetuity. A 3% royalty rate and 15% weighted average cost of capital was used for the valuation.(b) The valuation of property, plant and equipment was based on a cost and market valuation approach resulting in a fair value adjustment of £3.6 million.(c) Incremental provision of £0.1 million was required to align HQ bad debt provision to Regus Group policy.(d) Leasehold interest valuations were based on the difference between contract rent and market rent over the lease term discounted to net present value at a weighted average cost of 15%.
Summary of results of HQ prior to acquisitionSet out below are summary profi t and loss accounts of HQ. The pre acquisition period has been prepared under UK GAAP using HQ accounting policies, translated into sterling using the average rates for the respective period.
1 Jan 2004 to 20 Aug 2004 to 19 Aug 2004 31 Dec 2004 Total £m £m £m
Sales 97.8 55.7 153.5Operating expenses (96.8) (52.3) (149.1)Operating profi t 1.0 3.4 4.4Interest (0.8) – (0.8)Profi t before tax 0.2 3.4 3.6Tax – – –Profi t attributable to HQ ordinary shares 0.2 3.4 3.6
HQ contributed £3.4 million to the Group’s net operating cash fl ows and paid £1.8 million for capital expenditure in the post acquisition period ending 31 December 2004.
There were no other recognised gains and losses other than those recognised in the profi t and loss account.
Acquisition of Interlink Business Plaza – KoreaOn 6 August 2004, the Group acquired Interlink Plaza in Korea for £0.2 million comprising £42,000 fi xed assets and the balance being goodwill. There have been no material fair value adjustments.
23 CAPITAL COMMITMENTS
2005 2004 £m £m
Contracts placed for future capital expenditure not provided in the fi nancial statements 5.1 0.7
These commitments are in respect of fi t out obligations on new centres opening in 2006. In addition our 42% share of the UK associate capital commitments amounted to £0.3 million at 31 December 2005 (2004: £0.6 million).
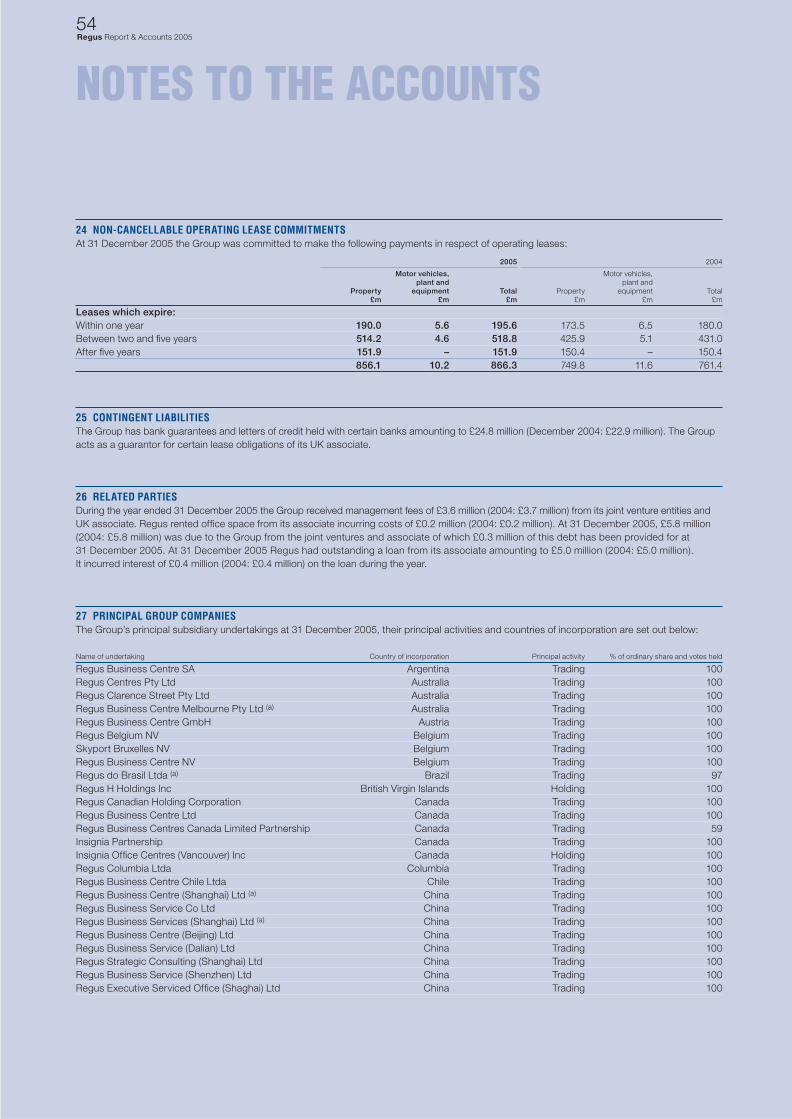
54Regus Report & Accounts 2005
NOTES TO THE ACCOUNTS
24 NON-CANCELLABLE OPERATING LEASE COMMITMENTSAt 31 December 2005 the Group was committed to make the following payments in respect of operating leases:
2005 2004
Motor vehicles, Motor vehicles, plant and plant and Property equipment Total Property equipment Total £m £m £m £m £m £m
Leases which expire:Within one year 190.0 5.6 195.6 173.5 6.5 180.0Between two and fi ve years 514.2 4.6 518.8 425.9 5.1 431.0After fi ve years 151.9 – 151.9 150.4 – 150.4 856.1 10.2 866.3 749.8 11.6 761.4
25 CONTINGENT LIABILITIESThe Group has bank guarantees and letters of credit held with certain banks amounting to £24.8 million (December 2004: £22.9 million). The Group acts as a guarantor for certain lease obligations of its UK associate.
26 RELATED PARTIESDuring the year ended 31 December 2005 the Group received management fees of £3.6 million (2004: £3.7 million) from its joint venture entities and UK associate. Regus rented offi ce space from its associate incurring costs of £0.2 million (2004: £0.2 million). At 31 December 2005, £5.8 million (2004: £5.8 million) was due to the Group from the joint ventures and associate of which £0.3 million of this debt has been provided for at 31 December 2005. At 31 December 2005 Regus had outstanding a loan from its associate amounting to £5.0 million (2004: £5.0 million). It incurred interest of £0.4 million (2004: £0.4 million) on the loan during the year.
27 PRINCIPAL GROUP COMPANIESThe Group’s principal subsidiary undertakings at 31 December 2005, their principal activities and countries of incorporation are set out below:
Name of undertaking Country of incorporation Principal activity % of ordinary share and votes held
Regus Business Centre SA Argentina Trading 100Regus Centres Pty Ltd Australia Trading 100Regus Clarence Street Pty Ltd Australia Trading 100Regus Business Centre Melbourne Pty Ltd (a) Australia Trading 100Regus Business Centre GmbH Austria Trading 100Regus Belgium NV Belgium Trading 100Skyport Bruxelles NV Belgium Trading 100Regus Business Centre NV Belgium Trading 100Regus do Brasil Ltda (a) Brazil Trading 97Regus H Holdings Inc British Virgin Islands Holding 100Regus Canadian Holding Corporation Canada Trading 100Regus Business Centre Ltd Canada Trading 100Regus Business Centres Canada Limited Partnership Canada Trading 59Insignia Partnership Canada Trading 100Insignia Offi ce Centres (Vancouver) Inc Canada Holding 100Regus Columbia Ltda Columbia Trading 100Regus Business Centre Chile Ltda Chile Trading 100Regus Business Centre (Shanghai) Ltd (a) China Trading 100Regus Business Service Co Ltd China Trading 100Regus Business Services (Shanghai) Ltd (a) China Trading 100Regus Business Centre (Beijing) Ltd China Trading 100Regus Business Service (Dalian) Ltd China Trading 100Regus Strategic Consulting (Shanghai) Ltd China Trading 100Regus Business Service (Shenzhen) Ltd China Trading 100Regus Executive Serviced Offi ce (Shaghai) Ltd China Trading 100
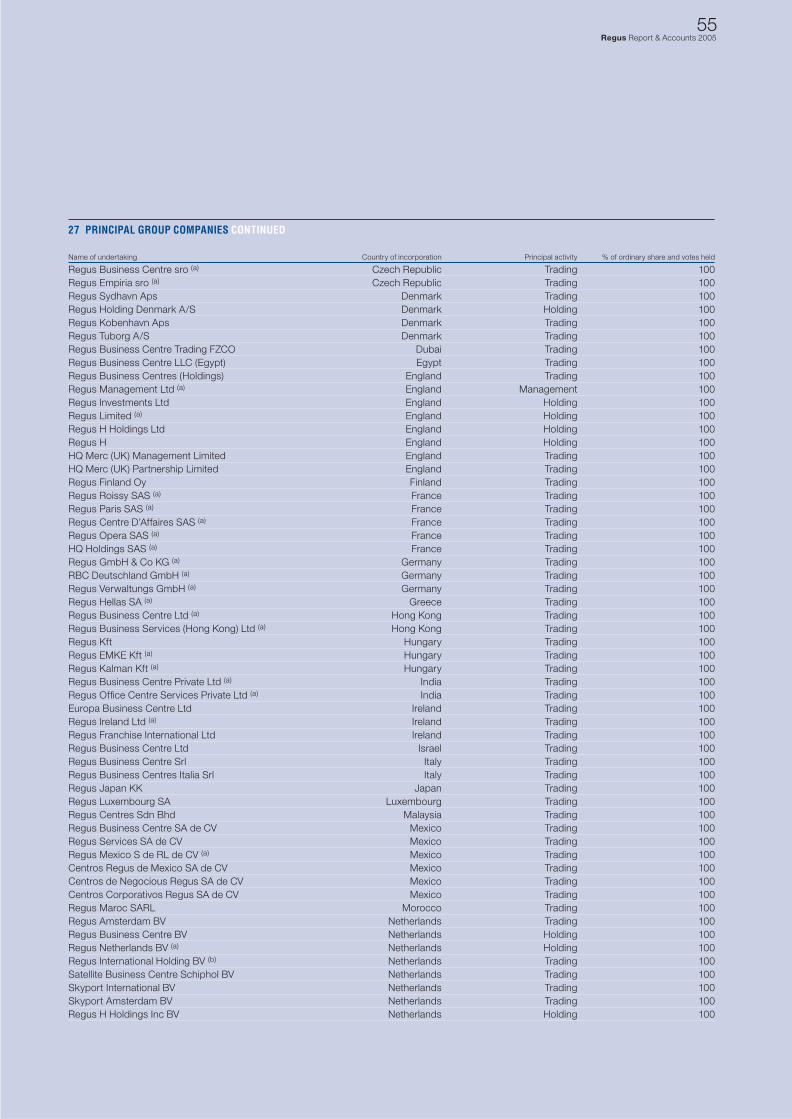
55Regus Report & Accounts 2005
27 PRINCIPAL GROUP COMPANIES CONTINUED
Name of undertaking Country of incorporation Principal activity % of ordinary share and votes held
Regus Business Centre sro (a) Czech Republic Trading 100Regus Empiria sro (a) Czech Republic Trading 100Regus Sydhavn Aps Denmark Trading 100Regus Holding Denmark A/S Denmark Holding 100Regus Kobenhavn Aps Denmark Trading 100Regus Tuborg A/S Denmark Trading 100Regus Business Centre Trading FZCO Dubai Trading 100Regus Business Centre LLC (Egypt) Egypt Trading 100Regus Business Centres (Holdings) England Trading 100Regus Management Ltd (a) England Management 100Regus Investments Ltd England Holding 100Regus Limited (a) England Holding 100Regus H Holdings Ltd England Holding 100Regus H England Holding 100HQ Merc (UK) Management Limited England Trading 100HQ Merc (UK) Partnership Limited England Trading 100Regus Finland Oy Finland Trading 100Regus Roissy SAS (a) France Trading 100Regus Paris SAS (a) France Trading 100Regus Centre D’Affaires SAS (a) France Trading 100Regus Opera SAS (a) France Trading 100HQ Holdings SAS (a) France Trading 100Regus GmbH & Co KG (a) Germany Trading 100RBC Deutschland GmbH (a) Germany Trading 100Regus Verwaltungs GmbH (a) Germany Trading 100Regus Hellas SA (a) Greece Trading 100Regus Business Centre Ltd (a) Hong Kong Trading 100Regus Business Services (Hong Kong) Ltd (a) Hong Kong Trading 100Regus Kft Hungary Trading 100Regus EMKE Kft (a) Hungary Trading 100Regus Kalman Kft (a) Hungary Trading 100Regus Business Centre Private Ltd (a) India Trading 100Regus Offi ce Centre Services Private Ltd (a) India Trading 100Europa Business Centre Ltd Ireland Trading 100Regus Ireland Ltd (a) Ireland Trading 100Regus Franchise International Ltd Ireland Trading 100Regus Business Centre Ltd Israel Trading 100Regus Business Centre Srl Italy Trading 100Regus Business Centres Italia Srl Italy Trading 100Regus Japan KK Japan Trading 100Regus Luxembourg SA Luxembourg Trading 100Regus Centres Sdn Bhd Malaysia Trading 100Regus Business Centre SA de CV Mexico Trading 100Regus Services SA de CV Mexico Trading 100Regus Mexico S de RL de CV (a) Mexico Trading 100Centros Regus de Mexico SA de CV Mexico Trading 100Centros de Negocious Regus SA de CV Mexico Trading 100Centros Corporativos Regus SA de CV Mexico Trading 100Regus Maroc SARL Morocco Trading 100Regus Amsterdam BV Netherlands Trading 100Regus Business Centre BV Netherlands Holding 100Regus Netherlands BV (a) Netherlands Holding 100Regus International Holding BV (b) Netherlands Trading 100Satellite Business Centre Schiphol BV Netherlands Trading 100Skyport International BV Netherlands Trading 100Skyport Amsterdam BV Netherlands Trading 100Regus H Holdings Inc BV Netherlands Holding 100
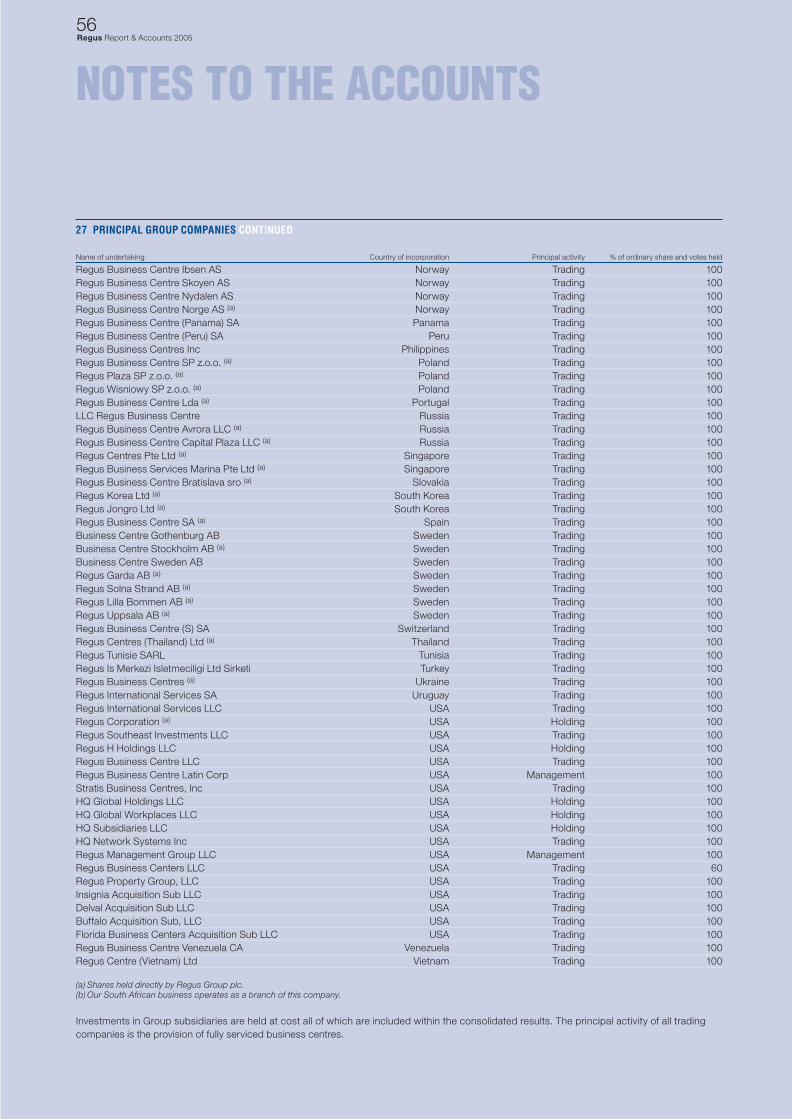
56Regus Report & Accounts 2005
NOTES TO THE ACCOUNTS
27 PRINCIPAL GROUP COMPANIES CONTINUED
Name of undertaking Country of incorporation Principal activity % of ordinary share and votes held
Regus Business Centre Ibsen AS Norway Trading 100Regus Business Centre Skoyen AS Norway Trading 100Regus Business Centre Nydalen AS Norway Trading 100Regus Business Centre Norge AS (a) Norway Trading 100Regus Business Centre (Panama) SA Panama Trading 100Regus Business Centre (Peru) SA Peru Trading 100Regus Business Centres Inc Philippines Trading 100Regus Business Centre SP z.o.o. (a) Poland Trading 100Regus Plaza SP z.o.o. (a) Poland Trading 100Regus Wisniowy SP z.o.o. (a) Poland Trading 100Regus Business Centre Lda (a) Portugal Trading 100LLC Regus Business Centre Russia Trading 100Regus Business Centre Avrora LLC (a) Russia Trading 100Regus Business Centre Capital Plaza LLC (a) Russia Trading 100Regus Centres Pte Ltd (a) Singapore Trading 100Regus Business Services Marina Pte Ltd (a) Singapore Trading 100Regus Business Centre Bratislava sro (a) Slovakia Trading 100Regus Korea Ltd (a) South Korea Trading 100Regus Jongro Ltd (a) South Korea Trading 100Regus Business Centre SA (a) Spain Trading 100Business Centre Gothenburg AB Sweden Trading 100Business Centre Stockholm AB (a) Sweden Trading 100Business Centre Sweden AB Sweden Trading 100Regus Garda AB (a) Sweden Trading 100Regus Solna Strand AB (a) Sweden Trading 100Regus Lilla Bommen AB (a) Sweden Trading 100Regus Uppsala AB (a) Sweden Trading 100Regus Business Centre (S) SA Switzerland Trading 100Regus Centres (Thailand) Ltd (a) Thailand Trading 100Regus Tunisie SARL Tunisia Trading 100Regus Is Merkezi Isletmeciligi Ltd Sirketi Turkey Trading 100Regus Business Centres (a) Ukraine Trading 100Regus International Services SA Uruguay Trading 100Regus International Services LLC USA Trading 100Regus Corporation (a) USA Holding 100Regus Southeast Investments LLC USA Trading 100Regus H Holdings LLC USA Holding 100Regus Business Centre LLC USA Trading 100Regus Business Centre Latin Corp USA Management 100Stratis Business Centres, Inc USA Trading 100HQ Global Holdings LLC USA Holding 100HQ Global Workplaces LLC USA Holding 100HQ Subsidiaries LLC USA Holding 100HQ Network Systems Inc USA Trading 100Regus Management Group LLC USA Management 100Regus Business Centers LLC USA Trading 60Regus Property Group, LLC USA Trading 100Insignia Acquisition Sub LLC USA Trading 100Delval Acquisition Sub LLC USA Trading 100Buffalo Acquisition Sub, LLC USA Trading 100Florida Business Centers Acquisition Sub LLC USA Trading 100Regus Business Centre Venezuela CA Venezuela Trading 100Regus Centre (Vietnam) Ltd Vietnam Trading 100
(a) Shares held directly by Regus Group plc.(b) Our South African business operates as a branch of this company.
Investments in Group subsidiaries are held at cost all of which are included within the consolidated results. The principal activity of all trading companies is the provision of fully serviced business centres.
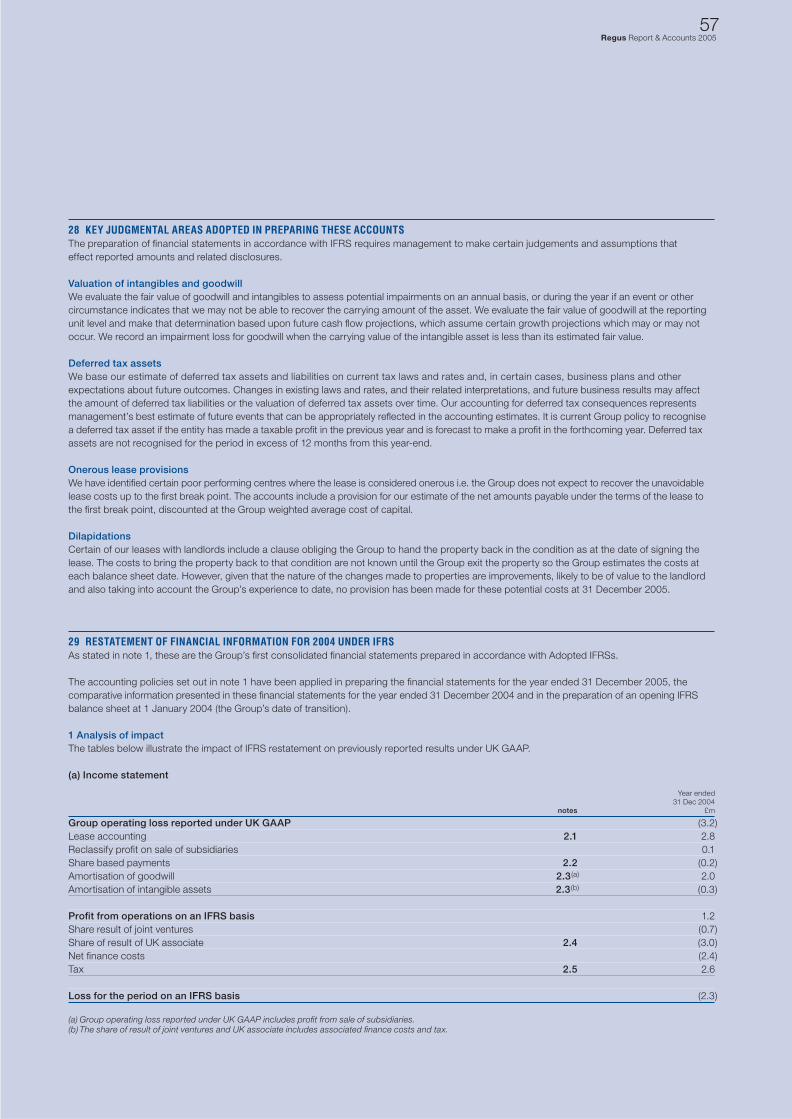
57Regus Report & Accounts 2005
28 KEY JUDGMENTAL AREAS ADOPTED IN PREPARING THESE ACCOUNTSThe preparation of fi nancial statements in accordance with IFRS requires management to make certain judgements and assumptions that effect reported amounts and related disclosures.
Valuation of intangibles and goodwillWe evaluate the fair value of goodwill and intangibles to assess potential impairments on an annual basis, or during the year if an event or other circumstance indicates that we may not be able to recover the carrying amount of the asset. We evaluate the fair value of goodwill at the reporting unit level and make that determination based upon future cash fl ow projections, which assume certain growth projections which may or may not occur. We record an impairment loss for goodwill when the carrying value of the intangible asset is less than its estimated fair value.
Deferred tax assets We base our estimate of deferred tax assets and liabilities on current tax laws and rates and, in certain cases, business plans and other expectations about future outcomes. Changes in existing laws and rates, and their related interpretations, and future business results may affect the amount of deferred tax liabilities or the valuation of deferred tax assets over time. Our accounting for deferred tax consequences represents management’s best estimate of future events that can be appropriately refl ected in the accounting estimates. It is current Group policy to recognise a deferred tax asset if the entity has made a taxable profi t in the previous year and is forecast to make a profi t in the forthcoming year. Deferred tax assets are not recognised for the period in excess of 12 months from this year-end.
Onerous lease provisionsWe have identifi ed certain poor performing centres where the lease is considered onerous i.e. the Group does not expect to recover the unavoidable lease costs up to the fi rst break point. The accounts include a provision for our estimate of the net amounts payable under the terms of the lease to the fi rst break point, discounted at the Group weighted average cost of capital.
DilapidationsCertain of our leases with landlords include a clause obliging the Group to hand the property back in the condition as at the date of signing the lease. The costs to bring the property back to that condition are not known until the Group exit the property so the Group estimates the costs at each balance sheet date. However, given that the nature of the changes made to properties are improvements, likely to be of value to the landlord and also taking into account the Group’s experience to date, no provision has been made for these potential costs at 31 December 2005.
29 RESTATEMENT OF FINANCIAL INFORMATION FOR 2004 UNDER IFRSAs stated in note 1, these are the Group’s fi rst consolidated fi nancial statements prepared in accordance with Adopted IFRSs.
The accounting policies set out in note 1 have been applied in preparing the fi nancial statements for the year ended 31 December 2005, the comparative information presented in these fi nancial statements for the year ended 31 December 2004 and in the preparation of an opening IFRS balance sheet at 1 January 2004 (the Group’s date of transition).
1 Analysis of impactThe tables below illustrate the impact of IFRS restatement on previously reported results under UK GAAP.
(a) Income statement
Year ended 31 Dec 2004 notes £m
Group operating loss reported under UK GAAP (3.2)Lease accounting 2.1 2.8Reclassify profi t on sale of subsidiaries 0.1Share based payments 2.2 (0.2)Amortisation of goodwill 2.3 (a) 2.0Amortisation of intangible assets 2.3 (b) (0.3)
Profi t from operations on an IFRS basis 1.2Share result of joint ventures (0.7)Share of result of UK associate 2.4 (3.0)Net fi nance costs (2.4)Tax 2.5 2.6
Loss for the period on an IFRS basis (2.3)
(a) Group operating loss reported under UK GAAP includes profi t from sale of subsidiaries.(b) The share of result of joint ventures and UK associate includes associated fi nance costs and tax.
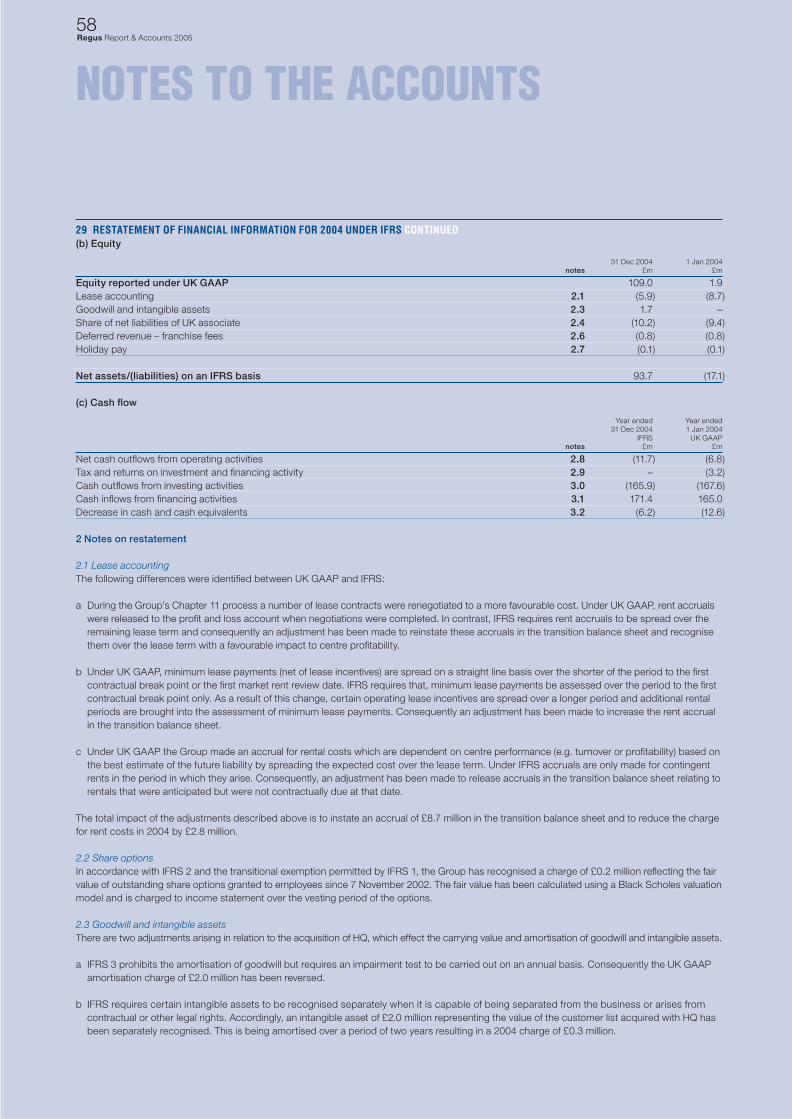
58Regus Report & Accounts 2005
NOTES TO THE ACCOUNTS
29 RESTATEMENT OF FINANCIAL INFORMATION FOR 2004 UNDER IFRS CONTINUED(b) Equity
31 Dec 2004 1 Jan 2004 notes £m £m
Equity reported under UK GAAP 109.0 1.9Lease accounting 2.1 (5.9) (8.7)Goodwill and intangible assets 2.3 1.7 –Share of net liabilities of UK associate 2.4 (10.2) (9.4)Deferred revenue – franchise fees 2.6 (0.8) (0.8)Holiday pay 2.7 (0.1) (0.1)
Net assets/(liabilities) on an IFRS basis 93.7 (17.1)
(c) Cash fl ow
Year ended Year ended 31 Dec 2004 1 Jan 2004 IFRS UK GAAP notes £m £m
Net cash outfl ows from operating activities 2.8 (11.7) (6.8)Tax and returns on investment and fi nancing activity 2.9 – (3.2)Cash outfl ows from investing activities 3.0 (165.9) (167.6)Cash infl ows from fi nancing activities 3.1 171.4 165.0Decrease in cash and cash equivalents 3.2 (6.2) (12.6)
2 Notes on restatement
2.1 Lease accountingThe following differences were identifi ed between UK GAAP and IFRS:
a During the Group’s Chapter 11 process a number of lease contracts were renegotiated to a more favourable cost. Under UK GAAP, rent accruals were released to the profi t and loss account when negotiations were completed. In contrast, IFRS requires rent accruals to be spread over the remaining lease term and consequently an adjustment has been made to reinstate these accruals in the transition balance sheet and recognise them over the lease term with a favourable impact to centre profi tability.
b Under UK GAAP, minimum lease payments (net of lease incentives) are spread on a straight line basis over the shorter of the period to the fi rst contractual break point or the fi rst market rent review date. IFRS requires that, minimum lease payments be assessed over the period to the fi rst contractual break point only. As a result of this change, certain operating lease incentives are spread over a longer period and additional rental periods are brought into the assessment of minimum lease payments. Consequently an adjustment has been made to increase the rent accrual in the transition balance sheet.
c Under UK GAAP the Group made an accrual for rental costs which are dependent on centre performance (e.g. turnover or profi tability) based on the best estimate of the future liability by spreading the expected cost over the lease term. Under IFRS accruals are only made for contingent rents in the period in which they arise. Consequently, an adjustment has been made to release accruals in the transition balance sheet relating to rentals that were anticipated but were not contractually due at that date.
The total impact of the adjustments described above is to instate an accrual of £8.7 million in the transition balance sheet and to reduce the charge for rent costs in 2004 by £2.8 million.
2.2 Share optionsIn accordance with IFRS 2 and the transitional exemption permitted by IFRS 1, the Group has recognised a charge of £0.2 million refl ecting the fair value of outstanding share options granted to employees since 7 November 2002. The fair value has been calculated using a Black Scholes valuation model and is charged to income statement over the vesting period of the options.
2.3 Goodwill and intangible assetsThere are two adjustments arising in relation to the acquisition of HQ, which effect the carrying value and amortisation of goodwill and intangible assets.
a IFRS 3 prohibits the amortisation of goodwill but requires an impairment test to be carried out on an annual basis. Consequently the UK GAAP amortisation charge of £2.0 million has been reversed.
b IFRS requires certain intangible assets to be recognised separately when it is capable of being separated from the business or arises from contractual or other legal rights. Accordingly, an intangible asset of £2.0 million representing the value of the customer list acquired with HQ has been separately recognised. This is being amortised over a period of two years resulting in a 2004 charge of £0.3 million.
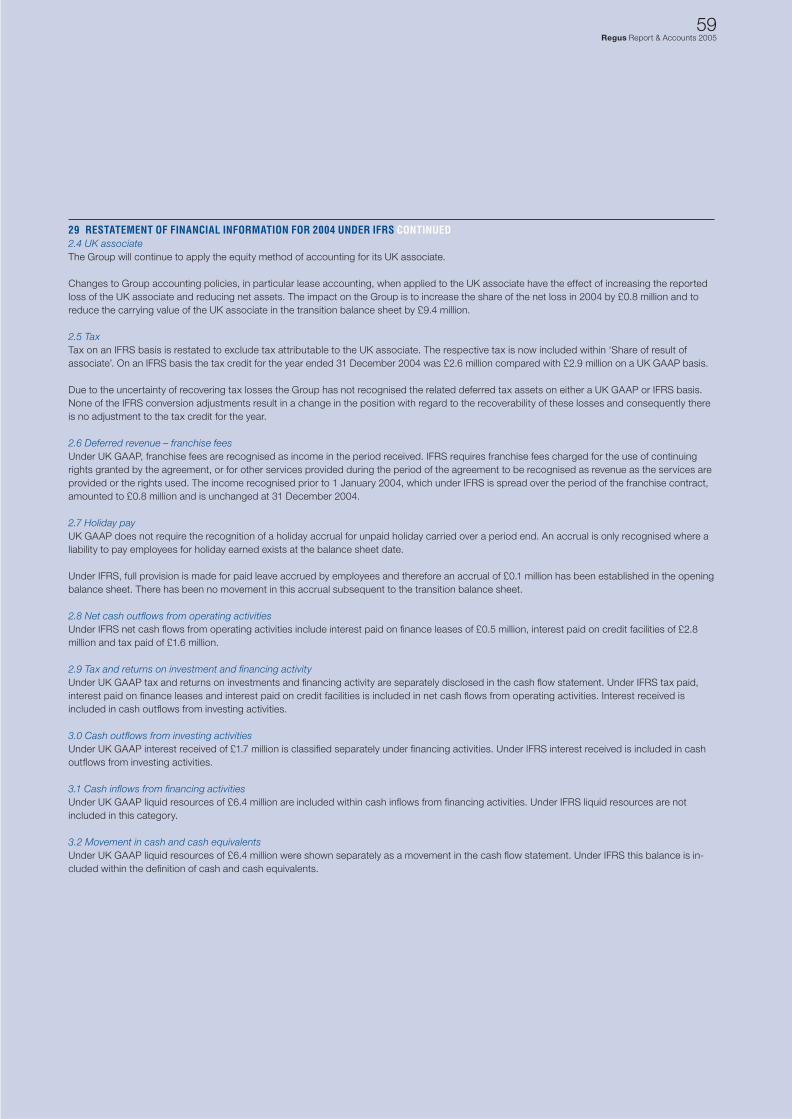
59Regus Report & Accounts 2005
29 RESTATEMENT OF FINANCIAL INFORMATION FOR 2004 UNDER IFRS CONTINUED2.4 UK associateThe Group will continue to apply the equity method of accounting for its UK associate.
Changes to Group accounting policies, in particular lease accounting, when applied to the UK associate have the effect of increasing the reported loss of the UK associate and reducing net assets. The impact on the Group is to increase the share of the net loss in 2004 by £0.8 million and to reduce the carrying value of the UK associate in the transition balance sheet by £9.4 million.
2.5 TaxTax on an IFRS basis is restated to exclude tax attributable to the UK associate. The respective tax is now included within ‘Share of result of associate’. On an IFRS basis the tax credit for the year ended 31 December 2004 was £2.6 million compared with £2.9 million on a UK GAAP basis.
Due to the uncertainty of recovering tax losses the Group has not recognised the related deferred tax assets on either a UK GAAP or IFRS basis. None of the IFRS conversion adjustments result in a change in the position with regard to the recoverability of these losses and consequently there is no adjustment to the tax credit for the year.
2.6 Deferred revenue – franchise feesUnder UK GAAP, franchise fees are recognised as income in the period received. IFRS requires franchise fees charged for the use of continuing rights granted by the agreement, or for other services provided during the period of the agreement to be recognised as revenue as the services are provided or the rights used. The income recognised prior to 1 January 2004, which under IFRS is spread over the period of the franchise contract, amounted to £0.8 million and is unchanged at 31 December 2004.
2.7 Holiday payUK GAAP does not require the recognition of a holiday accrual for unpaid holiday carried over a period end. An accrual is only recognised where a liability to pay employees for holiday earned exists at the balance sheet date.
Under IFRS, full provision is made for paid leave accrued by employees and therefore an accrual of £0.1 million has been established in the opening balance sheet. There has been no movement in this accrual subsequent to the transition balance sheet.
2.8 Net cash outfl ows from operating activitiesUnder IFRS net cash fl ows from operating activities include interest paid on fi nance leases of £0.5 million, interest paid on credit facilities of £2.8 million and tax paid of £1.6 million.
2.9 Tax and returns on investment and fi nancing activityUnder UK GAAP tax and returns on investments and fi nancing activity are separately disclosed in the cash fl ow statement. Under IFRS tax paid, interest paid on fi nance leases and interest paid on credit facilities is included in net cash fl ows from operating activities. Interest received is included in cash outfl ows from investing activities.
3.0 Cash outfl ows from investing activitiesUnder UK GAAP interest received of £1.7 million is classifi ed separately under fi nancing activities. Under IFRS interest received is included in cash outfl ows from investing activities.
3.1 Cash infl ows from fi nancing activitiesUnder UK GAAP liquid resources of £6.4 million are included within cash infl ows from fi nancing activities. Under IFRS liquid resources are not included in this category.
3.2 Movement in cash and cash equivalentsUnder UK GAAP liquid resources of £6.4 million were shown separately as a movement in the cash fl ow statement. Under IFRS this balance is in-cluded within the defi nition of cash and cash equivalents.
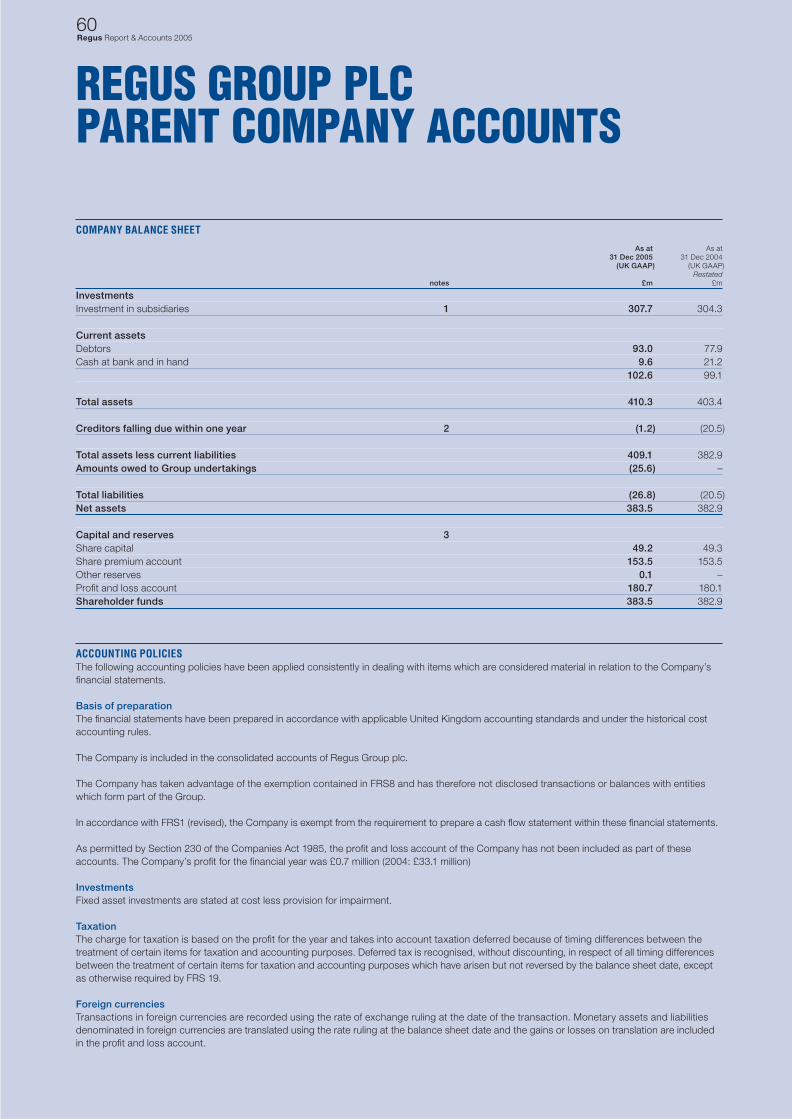
60Regus Report & Accounts 2005
REGUS GROUP PLCPARENT COMPANY ACCOUNTS
COMPANY BALANCE SHEET
As at As at 31 Dec 2005 31 Dec 2004 (UK GAAP) (UK GAAP) Restated notes £m £m
InvestmentsInvestment in subsidiaries 1 307.7 304.3
Current assetsDebtors 93.0 77.9Cash at bank and in hand 9.6 21.2 102.6 99.1
Total assets 410.3 403.4
Creditors falling due within one year 2 (1.2) (20.5)
Total assets less current liabilities 409.1 382.9Amounts owed to Group undertakings (25.6) –
Total liabilities (26.8) (20.5)Net assets 383.5 382.9
Capital and reserves 3Share capital 49.2 49.3Share premium account 153.5 153.5Other reserves 0.1 –Profi t and loss account 180.7 180.1Shareholder funds 383.5 382.9
ACCOUNTING POLICIESThe following accounting policies have been applied consistently in dealing with items which are considered material in relation to the Company’s fi nancial statements.
Basis of preparationThe fi nancial statements have been prepared in accordance with applicable United Kingdom accounting standards and under the historical cost accounting rules.
The Company is included in the consolidated accounts of Regus Group plc.
The Company has taken advantage of the exemption contained in FRS8 and has therefore not disclosed transactions or balances with entities which form part of the Group.
In accordance with FRS1 (revised), the Company is exempt from the requirement to prepare a cash fl ow statement within these fi nancial statements.
As permitted by Section 230 of the Companies Act 1985, the profi t and loss account of the Company has not been included as part of these accounts. The Company’s profi t for the fi nancial year was £0.7 million (2004: £33.1 million)
InvestmentsFixed asset investments are stated at cost less provision for impairment.
TaxationThe charge for taxation is based on the profi t for the year and takes into account taxation deferred because of timing differences between the treatment of certain items for taxation and accounting purposes. Deferred tax is recognised, without discounting, in respect of all timing differences between the treatment of certain items for taxation and accounting purposes which have arisen but not reversed by the balance sheet date, except as otherwise required by FRS 19.
Foreign currenciesTransactions in foreign currencies are recorded using the rate of exchange ruling at the date of the transaction. Monetary assets and liabilities denominated in foreign currencies are translated using the rate ruling at the balance sheet date and the gains or losses on translation are included in the profi t and loss account.
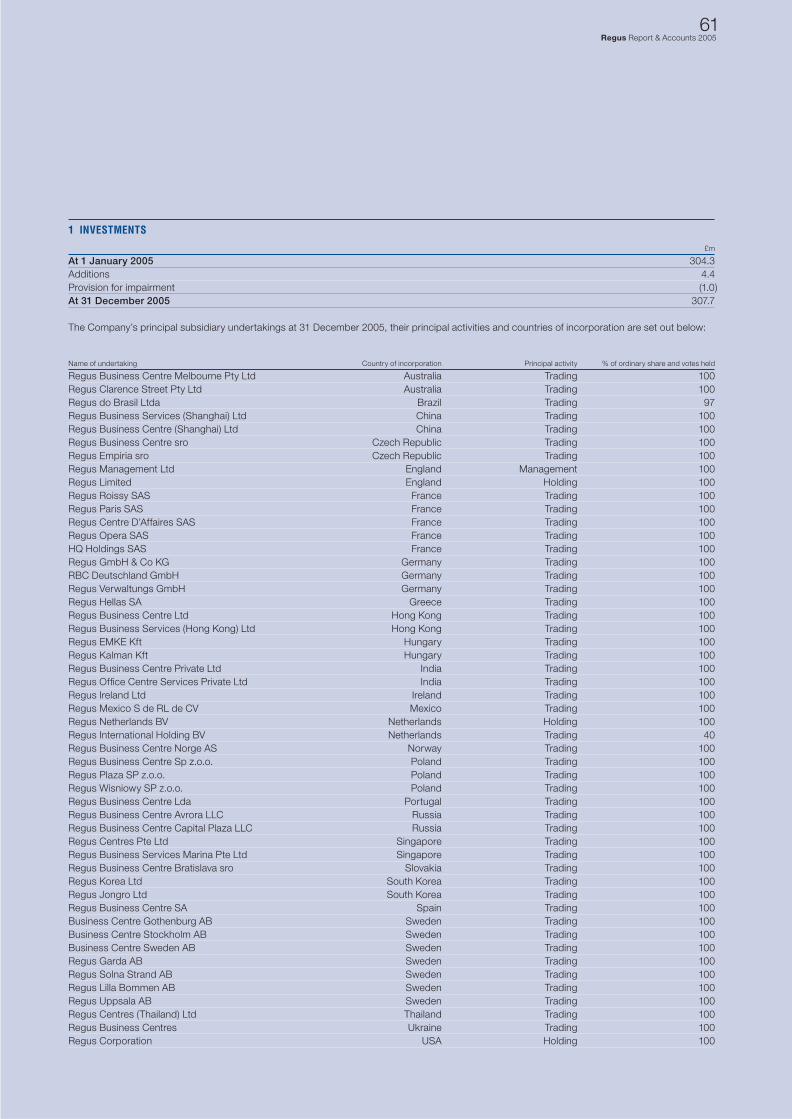
61Regus Report & Accounts 2005
1 INVESTMENTS
£m
At 1 January 2005 304.3Additions 4.4Provision for impairment (1.0)At 31 December 2005 307.7
The Company’s principal subsidiary undertakings at 31 December 2005, their principal activities and countries of incorporation are set out below:
Name of undertaking Country of incorporation Principal activity % of ordinary share and votes held
Regus Business Centre Melbourne Pty Ltd Australia Trading 100Regus Clarence Street Pty Ltd Australia Trading 100Regus do Brasil Ltda Brazil Trading 97Regus Business Services (Shanghai) Ltd China Trading 100Regus Business Centre (Shanghai) Ltd China Trading 100Regus Business Centre sro Czech Republic Trading 100Regus Empiria sro Czech Republic Trading 100Regus Management Ltd England Management 100Regus Limited England Holding 100Regus Roissy SAS France Trading 100Regus Paris SAS France Trading 100Regus Centre D’Affaires SAS France Trading 100Regus Opera SAS France Trading 100HQ Holdings SAS France Trading 100Regus GmbH & Co KG Germany Trading 100RBC Deutschland GmbH Germany Trading 100Regus Verwaltungs GmbH Germany Trading 100Regus Hellas SA Greece Trading 100Regus Business Centre Ltd Hong Kong Trading 100Regus Business Services (Hong Kong) Ltd Hong Kong Trading 100Regus EMKE Kft Hungary Trading 100Regus Kalman Kft Hungary Trading 100Regus Business Centre Private Ltd India Trading 100Regus Offi ce Centre Services Private Ltd India Trading 100Regus Ireland Ltd Ireland Trading 100Regus Mexico S de RL de CV Mexico Trading 100Regus Netherlands BV Netherlands Holding 100Regus International Holding BV Netherlands Trading 40Regus Business Centre Norge AS Norway Trading 100Regus Business Centre Sp z.o.o. Poland Trading 100Regus Plaza SP z.o.o. Poland Trading 100Regus Wisniowy SP z.o.o. Poland Trading 100Regus Business Centre Lda Portugal Trading 100Regus Business Centre Avrora LLC Russia Trading 100Regus Business Centre Capital Plaza LLC Russia Trading 100Regus Centres Pte Ltd Singapore Trading 100Regus Business Services Marina Pte Ltd Singapore Trading 100Regus Business Centre Bratislava sro Slovakia Trading 100Regus Korea Ltd South Korea Trading 100Regus Jongro Ltd South Korea Trading 100Regus Business Centre SA Spain Trading 100Business Centre Gothenburg AB Sweden Trading 100Business Centre Stockholm AB Sweden Trading 100Business Centre Sweden AB Sweden Trading 100Regus Garda AB Sweden Trading 100Regus Solna Strand AB Sweden Trading 100Regus Lilla Bommen AB Sweden Trading 100Regus Uppsala AB Sweden Trading 100Regus Centres (Thailand) Ltd Thailand Trading 100Regus Business Centres Ukraine Trading 100Regus Corporation USA Holding 100
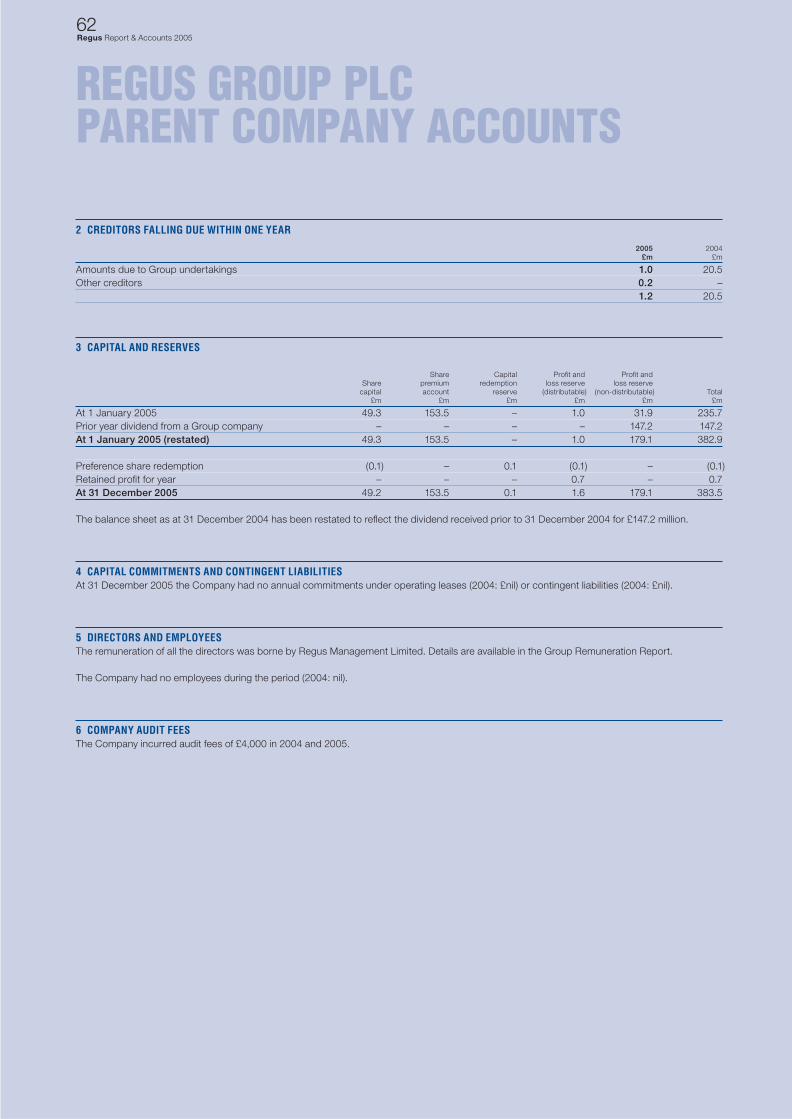
62Regus Report & Accounts 2005
REGUS GROUP PLCPARENT COMPANY ACCOUNTS
2 CREDITORS FALLING DUE WITHIN ONE YEAR
2005 2004 £m £m
Amounts due to Group undertakings 1.0 20.5Other creditors 0.2 – 1.2 20.5
3 CAPITAL AND RESERVES
Share Capital Profi t and Profi t and Share premium redemption loss reserve loss reserve capital account reserve (distributable) (non-distributable) Total £m £m £m £m £m £m
At 1 January 2005 49.3 153.5 – 1.0 31.9 235.7Prior year dividend from a Group company – – – – 147.2 147.2At 1 January 2005 (restated) 49.3 153.5 – 1.0 179.1 382.9
Preference share redemption (0.1) – 0.1 (0.1) – (0.1)Retained profi t for year – – – 0.7 – 0.7At 31 December 2005 49.2 153.5 0.1 1.6 179.1 383.5
The balance sheet as at 31 December 2004 has been restated to refl ect the dividend received prior to 31 December 2004 for £147.2 million.
4 CAPITAL COMMITMENTS AND CONTINGENT LIABILITIESAt 31 December 2005 the Company had no annual commitments under operating leases (2004: £nil) or contingent liabilities (2004: £nil).
5 DIRECTORS AND EMPLOYEESThe remuneration of all the directors was borne by Regus Management Limited. Details are available in the Group Remuneration Report.
The Company had no employees during the period (2004: nil).
6 COMPANY AUDIT FEESThe Company incurred audit fees of £4,000 in 2004 and 2005.
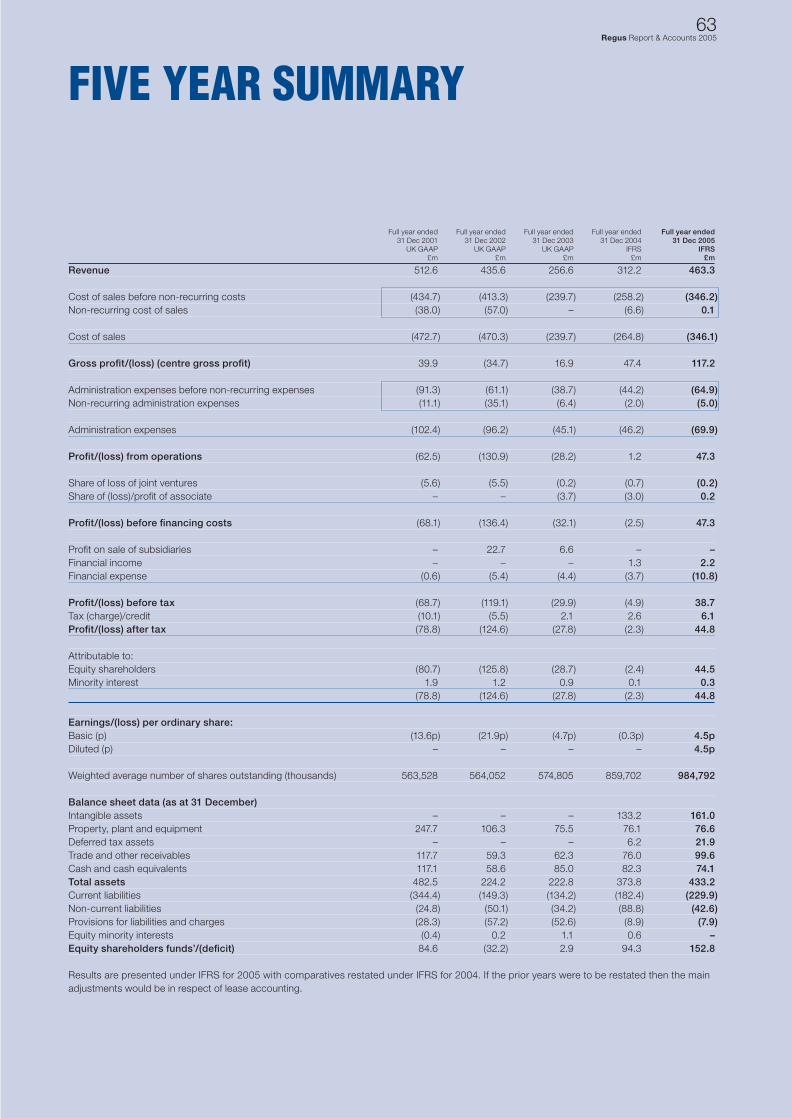
63Regus Report & Accounts 2005
Full year ended Full year ended Full year ended Full year ended Full year ended 31 Dec 2001 31 Dec 2002 31 Dec 2003 31 Dec 2004 31 Dec 2005 UK GAAP UK GAAP UK GAAP IFRS IFRS £m £m £m £m £m
Revenue 512.6 435.6 256.6 312.2 463.3
Cost of sales before non-recurring costs (434.7) (413.3) (239.7) (258.2) (346.2)Non-recurring cost of sales (38.0) (57.0) – (6.6) 0.1
Cost of sales (472.7) (470.3) (239.7) (264.8) (346.1)
Gross profi t/(loss) (centre gross profi t) 39.9 (34.7) 16.9 47.4 117.2
Administration expenses before non-recurring expenses (91.3) (61.1) (38.7) (44.2) (64.9)Non-recurring administration expenses (11.1) (35.1) (6.4) (2.0) (5.0)
Administration expenses (102.4) (96.2) (45.1) (46.2) (69.9)
Profi t/(loss) from operations (62.5) (130.9) (28.2) 1.2 47.3
Share of loss of joint ventures (5.6) (5.5) (0.2) (0.7) (0.2)Share of (loss)/profi t of associate – – (3.7) (3.0) 0.2
Profi t/(loss) before fi nancing costs (68.1) (136.4) (32.1) (2.5) 47.3
Profi t on sale of subsidiaries – 22.7 6.6 – –Financial income – – – 1.3 2.2Financial expense (0.6) (5.4) (4.4) (3.7) (10.8)
Profi t/(loss) before tax (68.7) (119.1) (29.9) (4.9) 38.7Tax (charge)/credit (10.1) (5.5) 2.1 2.6 6.1Profi t/(loss) after tax (78.8) (124.6) (27.8) (2.3) 44.8
Attributable to:Equity shareholders (80.7) (125.8) (28.7) (2.4) 44.5Minority interest 1.9 1.2 0.9 0.1 0.3 (78.8) (124.6) (27.8) (2.3) 44.8
Earnings/(loss) per ordinary share:Basic (p) (13.6p) (21.9p) (4.7p) (0.3p) 4.5pDiluted (p) – – – – 4.5p
Weighted average number of shares outstanding (thousands) 563,528 564,052 574,805 859,702 984,792
Balance sheet data (as at 31 December)Intangible assets – – – 133.2 161.0Property, plant and equipment 247.7 106.3 75.5 76.1 76.6Deferred tax assets – – – 6.2 21.9Trade and other receivables 117.7 59.3 62.3 76.0 99.6Cash and cash equivalents 117.1 58.6 85.0 82.3 74.1Total assets 482.5 224.2 222.8 373.8 433.2Current liabilities (344.4) (149.3) (134.2) (182.4) (229.9)Non-current liabilities (24.8) (50.1) (34.2) (88.8) (42.6)Provisions for liabilities and charges (28.3) (57.2) (52.6) (8.9) (7.9)Equity minority interests (0.4) 0.2 1.1 0.6 –Equity shareholders funds’/(defi cit) 84.6 (32.2) 2.9 94.3 152.8
Results are presented under IFRS for 2005 with comparatives restated under IFRS for 2004. If the prior years were to be restated then the main adjustments would be in respect of lease accounting.
FIVE YEAR SUMMARY
Secretary and Registered Offi ceTim Regan, Company SecretaryRegus Group plc3000 Hillswood Drive Hillswood Business ParkChertsey Surrey KT16 0RS
Registered Number 4868977
Registrars Capita IRG PLCBourne House 34 Beckenham Road BeckenhamKent BR3 4TU
Auditor KPMG Audit Plc 8 Salisbury Square London EC4Y 8BB
Legal advisers to the Company as to English law Slaughter and May One Bunhill Row London EC1Y 8YY
Legal advisers to the Company as to US law Davis Polk & Wardwell 99 Gresham Street London EC2V 7NG
Advisers on corporate acquisitionsBear, Stearns & Co. Inc.383 Madison AvenueNew YorkNY 10179
Corporate Stockbrokers Dresdner Kleinwort Wasserstein 20 Fenchurch StreetLondon EC3P 3DB
Credit Suisse First BostonOne Cabot SquareLondon E14 4QJ
ReservationsUK telephone: 0870 880 8484US telephone: 1.877.REGUS.87 or 001 954 331 1647
Websiteswww.regus.comwww.hq.comwww.stratisnet.comwww.businessmeetingplaces.com
64Regus Report & Accounts 2005
CORPORATE DIRECTORY

Designed & produced by www.forepoint.co.ukPrinted by St Ives Westerham Press
The Regus Group Network