Embed Size (px)
Citation preview

Regulation of excitatory synapsedevelopment by the RhoGEF Ephexin5
The Harvard community has made thisarticle openly available. Please share howthis access benefits you. Your story matters
Citation Salogiannis, John. 2013. Regulation of excitatory synapsedevelopment by the RhoGEF Ephexin5. Doctoral dissertation,Harvard University.
Citable link http://nrs.harvard.edu/urn-3:HUL.InstRepos:11181183
Terms of Use This article was downloaded from Harvard University’s DASHrepository, and is made available under the terms and conditionsapplicable to Other Posted Material, as set forth at http://nrs.harvard.edu/urn-3:HUL.InstRepos:dash.current.terms-of-use#LAA
Regulation of excitatory synapse development by the RhoGEF Ephexin5
A dissertation presented
by
John Salogiannis
to
The Division of Medical Sciences
in partial fulfillment of the requirements
for the degree of
Doctor of Philosophy
in the subject of
Neurobiology
Harvard University
Cambridge, Massachusetts
June, 2013

© 2013 – John Salogiannis
All rights reserved

iii
Dissertation Advisor: Michael E. Greenberg John Salogiannis
Regulation of excitatory synapse development by the RhoGEF Ephexin5
Abstract
The neuronal synapse is a specialized cell-cell junction that mediates communication
between neurons. The formation of a synapse requires the coordinated activity of signaling
molecules that can either promote or restrict synapse number and function. Tight regulation of
these signaling molecules is critical to ensure that synapses form in the correct number, time and
place during brain development. A number of molecular mechanisms that promote synapse
formation have been elucidated, but specific mechanisms that restrict synapse formation are less
well understood. The findings presented within this dissertation focus on how a specific Rho
guanine nucleotide exchange factor (GEF) Ephexin5 functions to restrict early synaptic
development and how perturbations in Ephexin5 signaling may lead to human
neurodevelopmental disease.
We find that Ephexin5 loss-of-function leads to an increase in the number of functional
excitatory synapses in the hippocampus. Ephexin5 overexpression restricts excitatory synapse
number and this restriction requires the GEF activity of Ephexin5. Interestingly, a de novo
mutation in human Ephexin5 in an individual with infantile epileptic encephalopathy reduces its

iv
GEF activity, suggesting that perturbing Ephexin5 signaling may have functional consequences
in vivo. Indeed, Ephexin5 heterozygote mice have increased susceptibility to seizures and
heightened anxiety.
We also uncovered two mechanisms that underlie Ephexin5-mediated synapse restriction.
First, we find that EphB receptor tyrosine phosphorylation of Ephexin5 triggers degradation of
Ephexin5 protein by the Angelman-syndrome associated ubiquitin ligase, UBE3A. In contrast to
Ephexin5, EphB receptors promote synapse formation, and therefore Ephexin5 signaling may
serve to limit EphB-mediated synapse formation. Second, we identified a number of
serine/threonine phosphorylation sites in Ephexin5, two of which are reduced in vivo during later
stages of synapse development and adulthood. A subset of these phosphorylation sites are
required for Ephexin5-mediated synapse restriction. This suggests that reducing Ephexin5
serine/threonine phosphorylation may be an important mechanism for inhibiting its activity in
adulthood. Taken together, we hypothesize that Ephexin5 serves as a brake during early synapse
development and that precise control of Ephexin5 activity via degradation and phosphorylation
are critical mechanisms to ensure that synapses form in the correct number, time, and place.
.
v
Table of Contents
Abstract...........................................................................................................................................iii
List of Figures................................................................................................................................vii
List of Tables..................................................................................................................................ix
Acknowledgments...........................................................................................................................x
Attributions....................................................................................................................................xii
1 Introduction 1
1.1 Postsynaptic excitatory synapse development and the actin cytoskeleton.............................4
1.2 Rho-family GTPase signaling and synapse development.....................................................13
1.3 Rho-family GEFs: Mechanisms and Regulation..................................................................21
1.4 RhoGEFs in Synapse Development......................................................................................28
1.5 The Ephexin family...............................................................................................................31
1.6 Summary of dissertation.......................................................................................................39
2 EphB-mediated degradation of the RhoA GEF Ephexin5 relieves a developmental
brake on excitatory synapse formation 43
2.1 Abstract.................................................................................................................................44
2.2 Background and Rationale....................................................................................................45
2.3 Results...................................................................................................................................48
2.4 Discussion.............................................................................................................................91
2.5 Materials and Methods..........................................................................................................97
3 Human ArhGEF15/Ephexin5 mutations in epileptic encephalopathy 107
3.1 Abstract...............................................................................................................................108
3.2 Background and Rationale..................................................................................................109
3.3 Identification of a de novo mutation in ArhGEF15/Ephexin5 reduces GEF activity.........111

vi
3.4 Behavioral model of epilepsy and comorbidity: analysis of Ephexin5 +/- mice...............119
3.5 Discussion...........................................................................................................................122
3.6 Material and Methods.........................................................................................................125
4 Phospho-regulation of Ephexin5 during brain development 128
4.1 Abstract...............................................................................................................................129
4.2 Identification and analysis of serine/threonine Ephexin5 phosphorylation........................130
4.3 Discussion...........................................................................................................................143
4.4 Materials and Methods.......................................................................................................146
5 Conclusion 152
Bibliography 157
vii
List of Figures
1.1 Dendritic spines are enriched with actin.................................................................................5
1.2 GEFs, GAPs, and GDIs regulate GDP- and GTP-bound forms of GTPases........................14
1.3 Rac1, Cdc42, and RhoA downstream signaling cascades....................................................16
1.4 Dbs exchange factor in complex with Cdc42.......................................................................24
1.5 The murine Ephexin family of RhoGEFs.............................................................................34
1.6 Model for bimodal inhibition of Ephexins by N-terminal repression..................................40
2.1 Ephexin5 interacts with EphB2............................................................................................49
2.2 Generation of Ephexin5 knockout mice and validation.......................................................52
2.3 Ephexin5 is a guanine nucleotide exchange factor that activates RhoA..............................56
2.4 Ephexin5 QSRL mutant does not affect GEF activity.........................................................59
2.5 Ephexin5 knockdown by shRNA….....................................................................................60
2.6 Ephexin5 negatively regulates excitatory synapse number..................................................63
2.7 Ephexin5 negatively regulates synapses in vivo...................................................................67
2.8 Ephexin5 restricts EphB2 control of synapse formation......................................................71
2.9 EphB2 phosphorylates Ephexin5 at tyrosine-361................................................................72
2.10 Specificity of EphB-mediated phosphorylation at tyrosine-361..........................................75
2.11 EphB2-mediated degradation of Ephexin5 is kinase and proteasome dependent................78
2.12 EphB2-mediated degradation of endogenous Ephexin5 is kinase dependent......................82
2.13 EphB2-mediated degradation of Ephexin5 requires Ube3a.................................................86
2.14 Structure and alignment of Ephexin5 UBD.........................................................................89
2.15 Model of EphB- and Ephexin5-dependent synapse formation............................................92
3.1 Human Ephexin5 protein alignment reveals conserved site at Arg.604.............................112
3.2 De novo Arg to Cys mutations in Ephexin5 reduce RhoA GEF activity............................113
3.3 Ephexin5-R612C has reduced RhoA GEF activity by RBD pulldown..............................115
3.4 Ephexin5 mouse model has enhanced audiogenic seizure susceptibility...........................120

viii
3.5 Increased anxiety in Ephexin5 mouse model......................................................................121
4.1 Ephexin5 knockout mouse have increased spine density at P15 but not in adulthood.......131
4.2 Reduction of Ephexin5 phosphorylation during postnatal brain development..................134
4.3 Identification of Ephexin5 phosphorylation sites by mass spectrometry............................135
4.4 Validation of p.S107/109 antibody......................................................................................137
4.5 Serine-107/109 is reduced during postnatal brain development..........................................139
4.6 Ephexin5 serine/threonine phosphorylation is critical for synapse restriction....................141

ix
List of Tables
3.1 Clinical Summary of Proband G with Arhgef15 mutation

x
Acknowledgements
Many people have contributed to my dissertation work. I am grateful to everyone that
helped me scientifically and emotionally throughout this process. A number of these individuals
were published collaborators and are acknowledged throughout my thesis or in the attributions
section.
Most importantly, I would like to thank my thesis advisor Michael Greenberg for the
constant support, encouragement and mentorship. Mike has the amazing capability to pick me
up when I am struggling and to let it ride when things are going well. He recognizes my
strengths and weaknesses better than anyone I have ever encountered, including people I have
known my whole life, and he has continued to help me wrestle my demons both in science and in
life. I hope to continue my relationship with him scientifically and personally as I move through
my career. I also learned a number of things from Mike but most importantly, I learned when to
use the phrase “a number of things.” If I completed my PhD work in another lab, I would have
probably said “an amount of things.”
I was fortunate to work very closely with three individuals during my time in graduate
school. I would like to thank Caleigh Mandel-Brehm for all the scientific and emotional support
she provided throughout this process. Seth Margolis mentored me during the first few years in
the lab and taught me a tremendous amount about what it takes to make it in this business. I also
had the opportunity to mentor Asa Barth-Maron. He has a bright future ahead of him and always
keeps me on my scientific toes, occasionally to the point where I do not know who is mentoring
whom.

xi
Shannon Robichaud, our lab manager, fielded more of my questions than everyone else
in this acknowledgements section combined and somehow had an answer to every single one of
them. Heartfelt thanks to fellow graduate student lab members Caleigh, Athar Malik, Nikhil
Sharma, Milena Andzelm, Mike Soskis, and Alan Mardinly for providing a fun environment
throughout the years and giving me thoughtful advice. I would like to thank Milena and
Harrison Gabel for helpful advice in the writing of this thesis. Harrison has also been a great
friend, mentor, and soccer teammate (although not such a great PS3 FIFA player).
PiN program chair Rick Born along with administrators Karen Harmin and Gina
Conquest kept me on track throughout this process. My Dissertation Advisory Committee
members John Blenis, Beth Stevens, and Thomas Schwarz provided me with invaluable advice
for which I am grateful. I want to particularly thank Tom Schwarz for serving as my Thesis
Defense chair and for being my first scientific mentor in Boston. He gave me the opportunity
eight years ago to work as a technician in his lab. I learned a great deal from his endless supply
of scientific knowledge and his thoughtful perspectives on life. I would also like to thank my
undergraduate advisor, Eric Haag, who sparked my interest in molecular biology and instilled
confidence in my abilities. In addition, thank you to Pascal Kaeser, Zhigang He, and Li-Huei
Tsai for taking time out of their busy schedules to serve on my Defense committee.
I would like to thank Joanne Makredes for her thoughtfulness over the past ten months;
she has always been there when I needed advice and inspiration, and I am grateful for her
support. Lastly my parents George and Eugenia Salogiannis provided their unwavering
emotional and financial support throughout my years in graduate school. They grew up without
a formal education and I am eternally grateful for all the sacrifices they made to put me in this
position. Their work ethic and focus throughout life has been a constant source of inspiration.

xii
Attributions
In Chapter 1, Figure 1.1 is from Tolias et al., 2011; Figure 1.2 is from Huveneers &
Danen, 2009. Figure 1.3 is from Govek et al., 2005. Figure 1.4 from Rossman et al., 2005;
Figure 1.5 is from Sahin et al., 2005. Figure 1.6 is from Yohe et al., 2008.
Chapter 2 is re-formatted from “Margolis, S.S.*, Salogiannis, J.*, Lipton, D.M.,
Mandel-Brehm, C., Wills, Z.P., Mardinly, A.R., Hu, L., et al. (2010). EphB-mediated
degradation of Ephexin5 relieves a developmental brake on synapse formation. Cell 143, 442-
455. *authors contributed equally to this work
Chapter 2: Ephexin5 knockout mice were generated by Mustafa Sahin and Tam
Thompson in the Children’s Hospital Boston core facility. All immunostaining and dendritic
spine assays were performed in collaboration with Seth Margolis, Zak Wills David Lipton.
Dissociated culture physiology was conducted by Seth Margolis. Acute slice physiology was
performed by Caleigh Mandel-Brehm. Ephexin5 and tyrosine-361 antibodies were generated by
Linda Hu. I performed all other cell biological, molecular, and biochemical assays under the
supervision of Michael Greenberg.
Table 3.1, and Figure 3.1 are re-formatted from “Veeramah, K.R., Johnstone, L., Karafet,
T.M., Wolf, D., Sprissler, R., Salogiannis, J. et al (2013). Exome sequencing reveals new causal
mutations in children with epileptic encephalopathies. Epilepsia 54(5).
Chapter 3: Whole exome sequencing of Probands and de novo mutation identification
were performed by Michael Hammer and colleagues at the University of Arizona. Behavior
experiments were performed in collaboration with Caleigh Mandel-Brehm. I performed all other

xiii
experiments with technical help from Asa Barth-Maron and under the guidance of Michael
Greenberg.
Chapter 4: I generated phospho-specific antibodies in collaboration with Linda Hu. Mass
spectrometry was conducted at the Taplan Mass Spectrometry facility Harvard Medical School
with technical help from Ross Tamaino. I performed all other experiments in this chapter with
technical help from Asa Barth-Maron and under the guidance of Michael Greenberg.

1
Chapter 1
Introduction

2
The human brain endows us with the ability to perceive the world around us. Its
enormous capacity to store and compute information relies on the communication between
highly interconnected networks of approximately 100 billion nerve cells (i.e., neurons)
(Drachman, 2005). The majority of this communication (i.e., neurotransmission) occurs at
points of contact between two neurons known as synapses. During development, our genome
provides the blueprint for the formation of this interconnected network and the structure of
synapses within the network. Genetic mutations that perturb the growth of a synapse underlie
neurodevelopmental disorders such as autism, epilepsy, and intellectual disability (Ebert &
Greenberg, 2013). A major focus of neuroscience research has been on the identification and
characterization of genetic components that are critical for the development of a synapse.
Excitatory synapses begin to form as early as embryonic day 16 (Konig et al., 1975) and
continue to develop throughout postnatal life. Dendritic spines (referred to as spines) are the
sites of postsynaptic contact for the majority of excitatory neurotransmission in the brain. Spines
are protrusions rich in filamentous-actin (F-actin) that exhibit highly dynamic structural changes
throughout development (Matus, 2005; Tada & Sheng, 2006). During early postnatal
development, they can appear as long, thin, and highly motile filopodia that can contact
presynaptic axonal partners and initiate synaptic contact (Jontes & Smith, 2000). This period is
followed by the development of mature, mushroom-shaped spines that are either maintained or
eliminated in adulthood. In adulthood, dendritic spines can actively remodel in response to
sensory-experience (Holtmaat et al., 2006; Matsuzaki et al., 2004). All stages of postnatal
synapse development involve the regulation of the actin cytoskeleton (Matus, 2005; Dillion &
Goda, 2005). Regulation of the actin cytoskeleton depends on a subset of small cytosolic G-
proteins called RhoGTPases, which are activated by Rho-family GEFs (RhoGEFs). RhoGTPase

3
signaling and the RhoGEFs, including RhoA and the Ephexins, have been implicated in synapse
development and disease (Govek et al., 2005; Rossman et al., 2005) For these reasons,
understanding GTPase signaling has been a major focus in neuroscience research. This
dissertation focuses on elucidating the mechanism of the RhoGEF Ephexin5, and its function in
synapse development and disease.

4
1. 1 Synapse Development and the actin cytoskeleton
Mature excitatory synapses are rich in F-actin
The mammalian excitatory synapse in the central nervous system is a specialized junction
composed of a presynaptic axonal terminal (or bouton), and a postsynaptic dendritic spine that is
separated by a synaptic cleft. Mature dendritic spines are small (<2 µm) mushroom-shaped
protrusions characterized by a head and a thin neck that contacts the dendrite at its base (Figure
1.1; Tashiro & Yuste, 2004). Excitatory synapses contain two types of actin, free actin
monomers (G-actin) and filamentous actin (F-actin), whose equilibrium dictates the shape and
size of pre- and post-synaptic compartments during development (Penzes & Cahill, 2012). In the
presynaptic terminal F-actin surrounds synaptic vesicle clusters and is present in the active zone
where it may help regulate the availability of the reserve pool of synaptic vesicles (Dillion &
Goda, 2005). In the dendritic spine, F-actin is thought to play two key roles: First, it tethers to
the postsynaptic density (PSD), and regulates the stability of AMPA, NMDA receptors, and cell
surface receptors (Allison et al., 1998; Penzes & Cahill, 2012). Second, its assembly and
disassembly plays a critical role in spine morphogenesis, which is required for the maturation of
a functional mushroom-shaped spine.
Postsynaptic filopodial protrusions are precursors to mature dendritic spines
Before the emergence of mature dendritic spines, the majority of dendritic protrusions
are thin, long, and extremely motile filopodia (Dailey & Smith, 1996; Dunaevsky & Mason,
2003; Tolias et al., 2012) that can grow and retract within minutes, a process that is blocked by
the actin-polymerization inhibitor Cytochalasin-D. (Fischer et al., 1998; Wong & Wong, 2000).
Early work examining the movement of growing spines demonstrated that during growth and
5
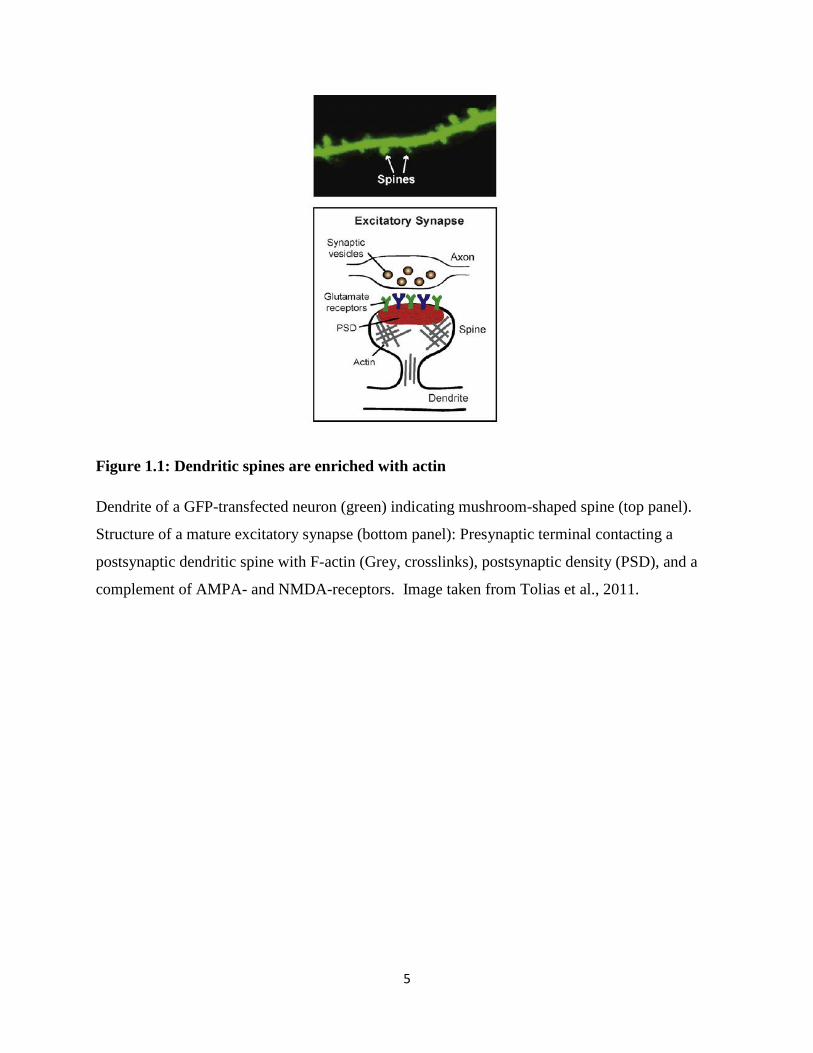
Figure 1.1: Dendritic spines are enriched with actin
Dendrite of a GFP-transfected neuron (green) indicating mushroom-shaped spine (top panel).
Structure of a mature excitatory synapse (bottom panel): Presynaptic terminal contacting a
postsynaptic dendritic spine with F-actin (Grey, crosslinks), postsynaptic density (PSD), and a
complement of AMPA- and NMDA-receptors. Image taken from Tolias et al., 2011.

6
retraction, filopodia contact axons (Ziv & Smith, 1996; Lohmann & Bonhoeffer, 2008). These
observations led to the hypothesis that filopodia sample their extracellular environment during
early development, and are stabilized into mature dendritic spines via axo-dendritic contact
(Jontes & Smith, 2000; Dunaevsky & Mason, 2003; Yuste & Bonhoeffer, 2004). Such contact is
a stochastic event in which some protrusions are stabilized and others removed (Berglund &
Augustine, 2008). Protrusions have a higher probability of becoming stabilized when they
exhibit three characteristics: longer-lasting axo-dendritic contacts (more than an hour), contact to
axons of excitatory neurons, and a display of an increase in the frequency of local calcium
transients at the head of the filopodia (Lohmann & Bonhoeffer, 2008). Stabilization of a
protrusion leads to an increase in spine head width, and a concomitant reduction of spine length.
Simultaneously, presynaptic vesicular packets (Ahmari et al., 2000; Zhai et al., 2001; Matus,
2005), and postsynaptic clusters including the neurotransmitter subunits NR1, and scaffolding
proteins PSD95 and Shank2/3 are delivered to nascent synaptic sites (Okabe et al., 2001; Ebihara
et al., 2003; Bresler et al., 2004). The recruitment of pre- and postsynaptic components can occur
within minutes (Bresler et al., 2004; Zito et al., 2009). Adding latrunculin A, a toxin that
prevents G-actin monomers from polymerizing with actin filaments, results in a loss of
presynaptic markers bassoon and synaptophysin, and also unhinges the postsynaptic density
(PSD) (Zhang & Benson, 2001). This suggests a critical role for actin in the recruitment and
stabilization of components at a newly formed central synapse.
Two modes of neuronal activity in spine motility and early synapse formation
It is hypothesized that neuronal activity is dispensable for these early stages of excitatory
synapse development (Verhage et al., 2000; Varoqueaux et al., 2003). Mutations in mice that
lack neurotransmitter release throughout embryonic development have normal neuronal

7
proliferation, migration, and differentiation. Importantly, these neurons have the normal
abundance of synaptic proteins and normal ultrastructure of excitatory synapses at embryonic
day 18. Since the mice die at an early age due to respiratory failure, the investigators cultured
these neurons; the proper formation of excitatory synapses still occurred (Varoqueaux et al.,
2003). This data suggested that the initiation of synapse development does not require neuronal
activity. Another study found that cerebellar Purkinje cells formed normal mature dendritic
spines despite not having axonal innervation from cerebellar granule cells, their main source of
presynaptic contact (Sotelo, 1991). Of course in this latter study, Purkinje cells also lacked axo-
dendritic contact. This implies that perhaps some neurons have cell-intrinsic differences in their
ability to form a dendritic spine (Matus, 2005).
Some studies, however, offer alternative hypotheses to the filopodia-first, activity-
independent model of early synapse development. In cortical pyramidal neurons, pulses of
glutamate are sufficient to induce de novo spine formation (Kwon & Sabatini, 2011).
Importantly, glutamate-induced spinogenesis did not go through a filopodial stage and was
dependent on NMDAR (ligand-gated N-methyl-D-aspartate-type glutamate receptor)-activation
of protein kinase A (PKA) signaling.
In the brain in vivo depriving sensory stimulation reduced filopodia/spine motility in the
somatosensory cortex but did not have any effect on their number or morphology (Lendvai et al.,
2000). The reduced motility only occurred in a specific time window between rat postnatal day
11-13 (P11-13), and not in young (P8-P10) or older (P14-P16) animals. Other studies found that
sensory deprivation in the visual cortex also led to reduced motility but no reduction in size or
density (Majewska et al., 2003; Konur & Yuste, 2004). The conclusion made from these studies
is that although experience did not alter the growth of dendritic protrusions (i.e., spines and
8
filopodia), it served to rearrange synaptic connections critical for sensory maps later in life
(Lendvai et al., 2000; Majewska et al., 2003). Taken together, these data suggest that there are
two distinct modes of early spine development: One mode may involve activity-independent
filopodia that eventually transition into mature spines and the other may involve experience-
dependent motility during later phases of postnatal development (Matus, 2005).
Activity-dependent synapse elimination
After the establishment of synaptic contacts, activity-dependent refinement is important
for shaping a functional neural circuit. During postnatal development, a subset of synapses are
maintained and strengthened, while others are eliminated. The best characterized model of
mammalian synapse elimination is at the neuromuscular junction (NMJ) (Sanes & Lichtman,
1999). At central synapses, elimination has been extensively studied at the climbing fiber (CF)
to Purkinje cell synapse (PC) in the cerebellum and at the retinal ganglion cell (RGC)-lateral
geniculate nucleus (LGN) synapse in the thalamus (Kano & Hashimoto, 2009). At the CF-PC
synapse, weak synaptic inputs innervate a single PC within the first postnatal week. During this
time period, some CF-PC synapses become stronger, while others weaken. By the third
postnatal week, only one strong CF-PC synapse remains. At the LGN synapse, as many as 20
weak RGC inputs innervate the LGN during the first two weeks of postnatal development and
only 1-3 remain after four weeks (Chen & Regehr, 2000). In this case, spontaneous activity
drives an early phase of synaptic refinement in the LGN and it is followed by a phase that is
dependent on visual experience (Hooks & Chen, 2006).
Mature dendritic spines are plastic and can undergo morphological changes in adulthood

9
Long-term potentiation (LTP) leads to the formation of spines and the enlargement of
preexisting spines (Matsuzaki et al., 2004; Tada & Sheng, 2005). LTP-induced spine growth is
blocked by drugs that inhibit actin dynamics (Matus, 2005). In support of this, LTP induction
leads to an increase in actin polymerization and selective recruitment of AMPA receptors to the
stimulated spine in vivo (Fukazawa et al., 2003). Conversely, long-term depression (LTD) leads
to a reduction in spine turnover and spine shrinkage/retraction (Matus, 2005; Tada & Sheng,
2005). These data highlight the importance of the actin cytoskeleton on morphological plasticity
during neuronal activity.
In vivo, spines are relatively stable in adulthood compared to postnatal development
(Grutzendler et al., 2002; Trachtenberg et al., 2002). Despite this, a subset still remains motile
and can change their length within minutes. One pioneering study investigated the role of
prolonged sensory experience on the stability of spines in adulthood (Holtmaat et al., 2006).
They found that prolonged whisker removal stabilized new spines in rat somatosensory cortex,
and eliminated a subset of pre-existing spines. Subsequent studies found that novel sensory
experience and behavioral learning paradigms can induce the rapid formation of new stable
spines, and the elimination of pre-existing spines (Xu et al., 2009; Yang et al., 2009; Roberts et
al., 2010) Importantly, in all these paradigms newly formed stable spines incorporated into the
pre-existing circuit, suggesting that dendritic spines are a structural basis for memory storage.
Synaptogenic organizers: EphB receptors and other cell adhesion molecules
Excitatory synapse development requires that an axonal growth cone reaches its target
area and selects amongst a number of postsynaptic partners. This is followed by a rapid growth
and stabilization of pre- and post-synaptic elements. Considerable effort has been made to
10
identify molecules that can coordinate both phases in this process (Brose, 2009). Cell adhesion
proteins have emerged as likely synaptogenic candidates for their ability to induce recruitment of
synaptic markers and their capacity for bidirectional signaling into pre- and post-synaptic
compartments (Dalva et al., 2007).
Neuroligin1 and 2 are postynaptically localized cell adhesion proteins. When expressed
in nonneuronal cells and co-cultured with neurons, they are able to induce morphological and
functional presynaptic differentiation (Scheiffele et al., 2000). Conversely, the neurexins, which
are presynaptic adhesion proteins that bind neuroligins, are able to induce postsynaptic
specializations (Graf et al., 2004). Cell adhesion molecule pairs with synaptogenic activity
include SynCAMs/Necls, EphB/EphrinBs, netrin G/NGL, and the LRRTM receptors (Dalva et
al., 2007; Linhoff et al., 2009).
Interestingly, EphB-receptor tyrosine kinases are not only critical for triggering
synaptogenic organization, but also for regulating filopodial motility during early synapse
formation (Kayser et al., 2008). They can promote aspects of activity-independent and
dependent synapse formation, suggesting that they are an ideal synaptogenic organizer (Dalva et
al., 2000; Takasu et al., 2002; Henkemeyer et al., 2003; Dalva et al., 2007).
Eph receptors are the largest family of receptor-tyrosine kinases and are characterized by
an extracellular ligand (ephrin)-binding domain and an intracellular tyrosine kinase domain
(Flanagan & Vanderhaeghen, 1998). Ephs can be divided into two classes, EphA and EphB,
based on their ability to bind the ligands EphrinA and EphrinB, respectively (reviewed in
Flanagan & Vanderhaeghen, 1998). EphBs are expressed postsynaptically on the surface of
developing dendrites, while their cognate ligands, the EphrinBs, are expressed on both the

11
developing axon and dendrite (Grunwald et al., 2004; Grunwald et al., 2001; Lim et al., 2008).
During the initial stages of synapse development, the EphrinB/EphB interaction triggers a
cascade of forward signaling events through the EphB receptor and a cascade of reverse
signaling events through the ephrinB ligand, both of which are critical for promoting excitatory
synapse development (Dalva et al., 2000). The forward signaling pathway comprises two main
signaling events: One is the activation of the EphB receptor tyrosine kinase and the second is the
recruitment of a Src family member to an EphB and NMDAR complex that is independent of
kinase activity (Flanagan & Vanderhaeghen, 1998; Dalva et al., 2000). EphB-mediated
NMDAR clustering at the developing post-synaptic specialization leads to the calcium-mediated
phosphorylation of the RhoGEF, Tiam1, as well as other synaptic molecules critical for
promoting dendritic spine and synapse maturation (Dalva et al., 2000; Tolias et al., 2005; Tolias
et al., 2007; Dalva et al., 2007). Forward signaling through the Eph tyrosine kinase domain can
phosphorylate RhoGEFs and other molecules critical for actin remodeling and excitatory synapse
development (Noren et al., 2004; Klein, 2009; also discussed in Section 1.4). However, new data
demonstrates that Eph-kinase activity is dispensable for excitatory synapse formation in
dissociated cortical culture (Soskis et al., 2012). This suggests that EphBs may only regulate
early phases of synapse development through kinase-independent mechanisms perhaps through
NMDARs or by recruitment of Src family kinases.
Taken together, EphBs are synaptogenic factors important for promoting the development
of excitatory synapses through three distinct domains: reverse signaling via Ephrin ligands into
the presynaptic terminal, signaling via extracellular interactions with other membrane receptors,
and tyrosine kinase signaling. In Chapter 2 of this dissertation, we hypothesize that neurons
might have evolved mechanisms to restrict EphB-mediated synapse formation. Chapter 2

12
focuses on the characterization of an EphB-dependent signaling pathway that interacts with the
RhoGEF Ephexin5 to regulate excitatory synapse development.

13
1.2 Rho GTPase signaling during synapse development
Given the prominent role of actin in all stages of synapse development, elucidating the
function of RhoGTPase signaling has received much attention. The mammalian Rho-family
GTPases (RhoGTPases) consist of 22 members, which comprise a branch of the Ras superfamily
of small (~21 kDa) cytosolic G-proteins (Schmidt & Hall, 2002). GTPases are hydrolase
enzymes that bind and hydrolyze guanosine triphosphate (GTP) (Schmidt & Hall, 2002).
RhoGTPases are implicated in actin-dependent processes as diverse as endosomal trafficking,
neurite outgrowth, cell morphogenesis, and synapse formation (Govek et al., 2005). They have
been described in two ways: classically activated and atypical (Heasman & Ridley, 2008). 12 of
the 22 members are classically activated, acting as bi-molecular switches between an inactive
GDP-bound form and an active GTP-bound form. In contrast, atypical RhoGTPases are
constitutively GTP bound and not thought to be regulated by GEFs. Cycling between GDP- and
GTP-bound forms of classically activated GTPases is catalyzed by three classes of regulatory
molecules: GTPase activating proteins (GAPs), guanine nucleotide dissociation inhibitors (GDIs)
and guanine-nucleotide exchange factors (GEFs) (Bos et al., 2007; Cherfil & Zhegouf, 2013).
GAPs accelerate the intrinsic GTP hydrolysis from GTP to GDP, GDIs sequester the GDP-bound
form away from the plasma membrane, and GEFs catalyze the exchange of GDP for GTP.
Therefore, GAPs and GDIs effectively inhibit by promoting a GDP-bound GTPase, while
RhoGEFs activate by promoting a GTP-bound form (Figure 1.2).
Rac1, Cdc42, and RhoA are the most extensively studied RhoGTPases. When activated
in NIH 3T3 cells and other fibroblast cell lines, Rac1 induces lamellipodia (membrane
ruffles),Cdc42 induces filopodia (micro-spikes) and RhoA induces stress fibers by actomyosin

14
Figure 1.2: GEFs, GAPs, and GDIs regulate GDP- and GTP-bound forms of GTPases
Inactive GDP-bound and active GTP-bound forms of the small cytosolic G-proteins are regulated
by three proteins: Guanine nucleotide exchange factors (GEFs) catalyze the exchange of GDP to
GTP, GTPase-activating proteins (GAPs) accelerate the intrinsic hydrolysis of GTPases and
promote GDP, and guanine-dissociation inhibitors (GDIs) sequester GDP-bound GTPases away
from the plasma membrane. Image taken from Huveneers & Danen, 2009.
15
filaments (Schmidt & Hall, 2002). In the nervous system, these molecules regulate a number of
neurodevelopmental processes including axon guidance, neuronal migration, dendritogenesis,
and synapse development. It is generally thought that Rac1 and Cdc42 promote these events,
while RhoA restricts them.
Once activated, RhoGTPases can sometimes translocate to the plasma membrane and are
capable of recognizing downstream effectors important for actomyosin contractility,
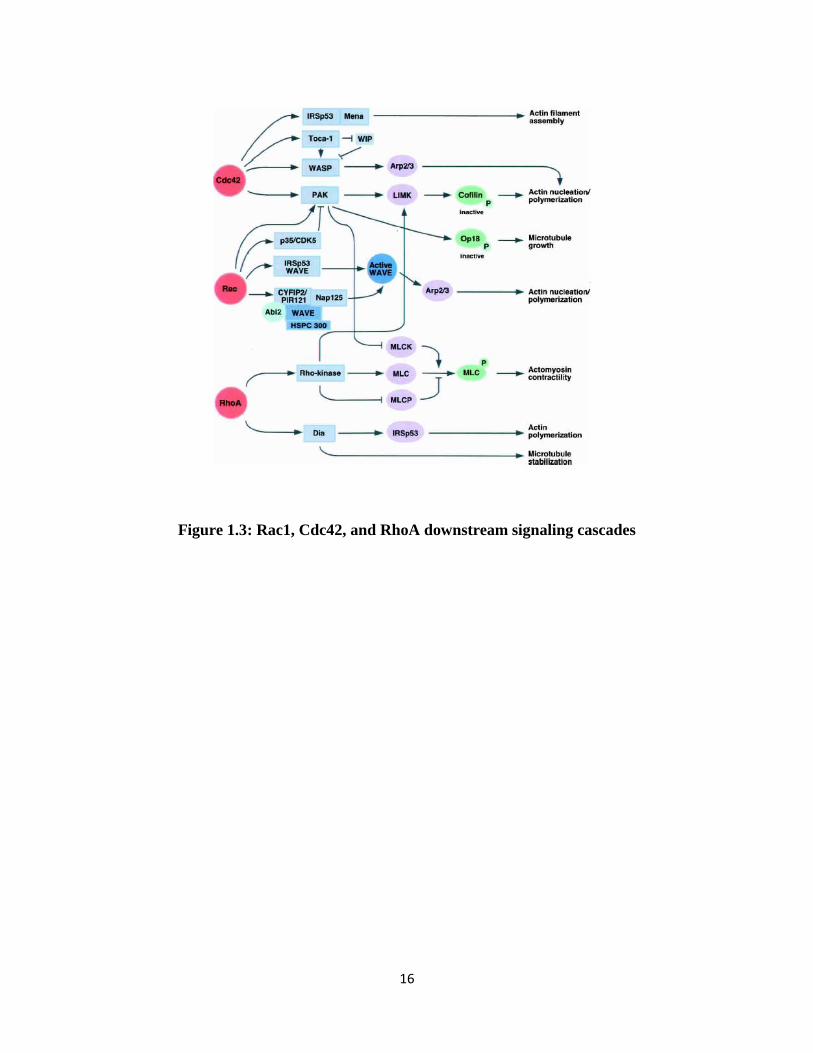
polymerization, and filament assembly (Figure 1.3; Michaelson et al., 2001; Govek et al., 2005).
GTP-bound RhoA can bind and activate Rho kinase (ROCK), which subsequently
phosphorylates myosin-light chain (MLC) and promotes actomyosin contractility. Rac1 and
Cdc42 promote actin nucleation and polymerization by activating and recruiting proteins such as
PAK (p21-activated kinase), IRSp53, WASP, and Arp2/3. Rho-signaling cascades also regulate
gene expression. For example, RhoA-signaling can turn on serum-response factor (SRF), a
transcription factor that activates genes such as c-fos and Jun (Hill et al., 1995; Sotiropolous et
al., 1999), leading to transciptional changes in cell morphogenesis.
Since RhoGTPases are ubiquitously expressed (Hall, 1994), they rely on upstream
regulators such as the GEFs and GAPs to activate or suppress their activity in a spatial, temporal
and cell-specific manner. It is hypothesized that these upstream activators dictate which
downstream partners a particular GTPase will activate (ie., ROCK, mDIA, WASP). This is
likely due to compartmentalization or subcellular localization of the signals necessary to activate
them. At excitatory synapses, a variety of cell surface receptors, neurotransmitter receptors, and
scaffolding proteins are capable of locally activating GTPases and their effector proteins to
sculpt specific dendritic spines and synapses.
16
Figure 1.3: Rac1, Cdc42, and RhoA downstream signaling cascades
17
RhoA negatively regulates dendritic spine and excitatory synapse development
In general, RhoA restricts (i.e., negatively regulates) the formation and maintenance of
dendritic spines and synapses. Initial studies ascertained this role by expressing a constitutively
active (CA) form of RhoA (CA RhoA or RhoAV14) where the GTP is non-hydrolyzable
(Tashiro et al., 2000; Nakayama et al., 2000; Pipel & Segal, 2004). Overexpression of CA RhoA
in cultured mouse and rat hippocampus reduces the density and length of dendritic spines on
pyramidal neurons. Addition of the ROCK inhibitor Y-27632 reversed this effect, suggesting
that RhoA signals through ROCK to regulate spine formation (Nakayama et al., 2000). This is
likely due to the ability of RhoA-ROCK to induce actomyosin contractility (Govek et al., 2005)
CA RhoA overexpression also causes a reduction in the colocalization of the presynaptic marker
synaptophysin and postsynaptic marker spinophilin, indicating that overall excitatory synapse
number is perturbed (Pipel & Segal, 2004). Transfection of C3-transferase, a botulinum toxin
that specifically inhibits the RhoA-subfamily proteins RhoA, RhoB, and RhoC, increases the
density of immature filopodia, and results in increased dendritic spine length and width in the
hippocampus (Tashiro et al., 2000; Nakayama et al., 2000). C3 and Y-27632 addition also
increase the number of excitatory synapses in hippocampal cultures (Wills et al., 2012).
However, there are conflicting reports on C3 and Y-27632’s effects on overall density of spines;
some studies report a reduction, some report an increase, while others report no change (Tashiro
et al., 2000; Nakayama et al., 2000; Pipel & Segal, 2004). This discrepancy could be due to what
is classified as a spine in these studies, differences in the duration of the manipulation or
differences in the developmental age of the cultures (Govek et al., 2005). In fact, Yuste and
colleagues demonstrated that the age of the cultures can affect how cultures respond to C3 and
Y-27632 (Tashiro et al., 2000; Tashiro & Yuste, 2004). The discrepancies in spine/filopodial
18
densities observed in the C3 and Y-27632 could also be because of distinct Rho-dependent
signaling events. C3 inhibits RhoA while Y-27632 only inhibits the downstream effector
ROCK. It has been proposed that RhoGTPase signaling is responsible for distinct developmental
events during spine development that may require different downstream mechanisms (Tashiro &
Yuste, 2004). In particular, there are two processes to highlight: First, RhoA activation can
restrict overall spine growth regardless of type during initial stages of spine development
(Tashiro et al., 2000; Nakayama et al., 2000). This is likely through Rho-ROCK-MLC-mediated
actomyosin contractility. Second, RhoA signaling actively deconstructs mature spines into
immature filopodia during the maintenance phase of spine formation (Nakayama et al., 2000;
Tashiro & Yuste, 2004). In this scenario, the conversion of mature to immature spines would
require actin polymerization along the length of the spine, and depolymerization along the width.
This process could rely on the Rho-ROCK-LimK pathway, the Rho-DIA pathway, or Rho-
ROCK-MLC pathway (Shi et al., 2009; see Figure 1.3). Both of these events are consistent with
the observations that C3 and Y-27632 addition enhances the colocalization of pre- and post-
synaptic markers (Wills et al., 2012). On the other hand, it is possible that RhoA coordinates
with other GTPases to convert long immature spines into mature ones. RhoA has been reported
to promote certain aspects of spine development (Tashiro & Yuste, 2004; Pipel & Segal, 2004;
Shi et al., 2009).
Rac1 and Cdc42 promote mature spine formation in synapse development
The GTPases Rac1 and Cdc42 have been shown to promote the formation and
maintenance of excitatory synapses, thus antagonizing the effects of RhoA. Dominant-negative
Cdc42 and Cdc42 RNAi inhibit spine formation (Irie & Yamaguchi, 2002; Wegner et al., 2008).
Transgenic mice overexpressing constitutively active Rac1 (CA Rac1 or Rac1V12) in cerebellar

19
Purkinje cells have increased spine numbers, but a decrease in overall spine size (Luo et al.,
1996). Subsequent studies using hippocampal cultures demonstrated that CA Rac1 enhances the
number of lamellopodial-like ruffles or “mini-spines” (Tashiro et al., 2000; Nakayama et al.,
2000; Pipel & Segal, 2004). These mini-spines often contained super-numerary synapses by
electron microscopy and a concomitant upregulation of PSD95 to spines, which is consistent
with Rac1 being a promoter of excitatory synapse number (Luo et al., 1996; Nakayama et al.,
2000). When overexpressed in older cultures, CA Rac1 can also induce an increase in spine
head size of more mature spines (Tashiro & Yuste, 2004). Conversely, inhibition of Rac1 by a
dominant-negative construct (DN Rac1) leads to a reduction in spine density and an increase in
the number of long immature spines (Nakayama et al., 2000; Tashiro & Yuste, 2004).
Real-time imaging of RhoA and Cdc42 activation during synaptic activity reveals the
highly dynamic nature of GTPase signaling
The preferential appearance and loss of individual spines during synapse development,
and the observation that spines quickly respond to neuronal activity, suggests that signaling to
the actin cytoskeleton is a relatively local process. Work by Yasuda and colleagues examining
the coordination of RhoA and Cdc42 signaling in mature neurons undergoing LTP at single
spines in real time, recently demonstrated important aspects of activity-dependent spine
dynamics (Murakoshi et al., 2011). To induce LTP-dependent plasticity, they uncaged glutamate
at single spines which resulted in an initial swelling of the spine volume up to 300%, followed by
a sustained increase of about 75% over the course of 30 minutes. To visualize the
spatiotemporal dyamics of RhoA and Cdc42 activity, they created a fluorescence resonance
energy transfer (FRET)-based sensor consisting of a mEGFP-tagged GTPase and an mRFP
tagged effector. RhoA and Cdc42 activity increases rapidly within a minute of stimulation,
20
decayed over 3-5 minutes, and sustained for 30 minutes, a profile reminiscent of the
morphological changes in LTP-induced spines. However, the spatial profiles of the two
GTPases differed; whereas Cdc42 was compartmentalized within the spine and persistently
activated, RhoA diffused out of the spine and spread out along the dendrite. Inhibition of Rho
proteins with C3-transferase as well as inhibition of ROCK reduced both the transient and
sustained phases of spine growth. Interestingly, Cdc42 and downstream Pak1 inhibition only
reduced the sustained phase of spine growth. This suggests that RhoA can initiate enhanced
spine growth in mature neurons but coordinates with Cdc42 to sustain this increase.
Taken together, these data highlight the importance of GTPase signaling in all stages of
synapse development and the importance of local biochemical signaling on regulating local
synaptic morphogenesis. It also illustrates that there is significant cross-talk between the RhoA,
Rac1 and Cdc42 pathways, which can make it difficult to ascribe a specific GTPase signaling
cascade to a particular biological process (see Figure 1.2). For example, EphB-receptors
activate focal-adhesion kinase signaling through a RhoA-ROCK-LimK pathway thought to be
critical for actin polymerization and spine growth (Shi et al., 2009). However, this result is
difficult to interpret because EphBs can activate Rac1/Cdc42-dependent pathways as well, and
implies there is significant cross-talk between GTPases downstream of Eph signaling. For these
reasons, a major research focus in GTPase signaling is in understanding how upstream activators
of GTPases, the RhoGEFs can influence signaling at the synapse.

21
1.3 RhoGEFs: Mechanism and Regulation
Given the important role for RhoGTPases in regulating the morphogenesis and dynamics
of dendritic spines it is important to understand the molecular mechanisms that lead to the
activation and suppression of these signaling molecules. Since RhoGTPases are ubiquitously
expressed (Hall, 1994), they rely on upstream regulators such as the GEFs and GAPs to regulate
their activity in a spatial, temporal and cell-specific manner. The majority of studies elucidating
the mechanisms of RhoGTPases during synapse development use constitutively active, dominant
negative constructs, or pan-inhibitors. These approaches are problematic because they can
sequester key activators/inhibitors within the cell, and they may activate indirect pathways not
required for synapse development. There is also evidence suggesting that precise balance
between GTPases is critical for proper spine morphogenesis (Murakoshi et al., 2011; Penzes &
Cahill, 2012). In fact, prolonged Rac1 activity in vivo can inhibit spine morphogenesis instead of
promoting it. Therefore, it may be necessary for GTPases to properly cycle between GDP- and
GTP-bound states in these hyperactivation paradigms (Hayashi-Takagi et al., 2010). For these
reasons, recent research has focused on the regulators of GTPase signaling, most notably, the
guanine nucleotide exchange factors.
The Rho-family GEFs are critical for activating the Rho-family GTPases by catalyzing
the exchange of GDP for GTP. There are 2 classes of GEFs in mammals: 69 members
containing a Dbl-homology (DH) domain and 11 members containing a Dock-Homology Region
(DHR) (reviewed in Cote & Vuori, 2007). The DH-containing GEFs have been studied in
greater detail than the DHRs. Since the focus of the dissertation is on the DH-containing GEF,
Ephexin5, I will only highlight literature pertaining to this subclass of GEFs.
22
RhoGTPases including Cdc42, RhoA, and Rac1, are regulators of the actin cytoskeleton,
gene transcription and cell-cycle progression (Heasman & Ridley, 2008). Consequently,
RhoGEFs have been implicated in diverse cellular processes including cell adhesion, migration,
growth, survival, and polarization (Schmidt & Hall, 2002). In the nervous system they are key
regulators of neurite outgrowth, axon guidance, growth cone dynamics, and synapse
development. Not suprisingly then, perturbations in RhoGEF signaling is prevalent in a diverse
set of diseases such as human cancers, skeletal malformations, intellectual disability and viral
pathogenesis (Newey et al., 2005).
History of RhoGEFs
The first RhoGEF, Dbl, was isolated from a human B-cell lymphoma line in a screen for
transformation activity in NIH 3T3 cells (Eva & Aaronson, 1985). Dbl contains a region of
homology to the yeast protein Cdc24Sc, previously shown to interact with the GTP-binding
protein Cdc42Sc (Ron et al., 1991). A putative function for the Cdc24Sc/Cdc42Sc interaction
was first described when Dbl was shown to stimulate the dissociation of GDP from Cdc42 (Hart
et al., 1991). The region of homology between Cdc24Sc and Dbl was subsequently termed the
Dbl (DH) homology domain. The DH domain is invariably followed by an adjacent Pleckstrin
homology (PH) domain which is can regulate cellular targeting and in some cases, modulate
enzymatic activity. The tandem DH-PH domain is considered the minimal structural unit
required for RhoGEF exchange activity in vivo. There are 69 DH-containing mammalian genes
and only 12 classically hydrolyzing RhoGTPases (Heasman & Ridley, 2008). At first glance this
~6 to 1 ratio seems redundant and unnecessary. Research over the past decade however,
indicates that RhoGEFs have differential selectivity for GTPases, they differ in their spatial and
temporal expression, and they can be activated by a variety of extracellular cues. These diverse

23
modes of regulation lead to tight control of RhoGTPase function, the actin cytoskeleton, and
cellular morphogenesis.
Mechanism of catalytic GEF exchange
GEFs catalyze the release of GDP bound to small GTPases. The affinity of GDP/GTP
for a GTPase is extremely high, and without GEFs the release of GDP would be in the range of
hours, not the minutes required for effective signaling in vivo. Due to the higher intracellular
ratio of GTP:GDP, rebinding of a new nucleotide favors GTP. Thus the activity of the GEFs to
remove GDP serves to replenish GTP active forms of GTPases and promote G protein mediated
activity.
Crystal structures of either RhoGEFs alone or GEF-bound to their cognate GTPases
clarified how this mechanism works (Aghazadeh et al., 1998; Liu et al., 1998; Soisson et al.,
1998; Snyder et al., 2002; reviewed in Rossman et al., 2005). The DH domain causes a
conformational change in two GTPase regions (switch 1 and switch 2) that subsequently eject the
bound nucleotide (Bos et al., 2007). The DH domain comprises a bundle of 10-15 alpha-helices
containing three highly conserved regions (CR1-CR3) and other critical C-terminal residues
termed the “seat-back” region. CR1/CR3 regions extensively contact the switch 1 region of the
GTPase, while the CR3/seat-back regions contact switch 2 and a variable GTPase interface
located between the switch regions (Figure 1.4; Rossman et al., 2005). Mutations in CR1/CR3
of Dbl and other RhoGEFs will abolish all catalytic activity (Zhu et al., 2000).
GEF selectivity in vitro
Although RhoGEFs utilize the CR1/CR3 domains via similar mechanisms, studies have
shown that the highly variable seat-back/GTPase interface dictates GEF-selectivity towards

24
Figure 1.4: Dbs exchange factor in complex with Cdc42
Dbs DH domain (yellow) and PH domain (blue) contacting the GTPase interface of Cdc42
(green). CR1 and CR3 regions (magenta) contact switch 1 (S1) and switch 2 (S2) regions (red)
of Cdc42. Also the “seat-back” region (gray outline) forms complementary interfaces with
Cdc42 and is responsible for selectivity. Image taken from Rossman et al., 2005. In Chapter 2,
we abolished GEF activity with a mutation in Ephexin5 that specifically targeted the CR3 region.
In Chapter 4, we suggest that an epilepsy mutation may disrupt the integrity of the DH-PH
structure.
25
specific GTPase family members (Cheng et al., 2002; Snyder et al., 2002). For example, FGD1
and Intersectin are specific to Cdc42 (Zheng et al., 1996; Snyder et al., 2002). Lfc and Lbc are
RhoA specific (Glaven et al., 1996). Tiam1 and Trio preferentially activate Rac1 (Rossman et
al., 2005). Vav1, Vav2, and Ephexin1 are able to activate RhoA, Rac1, and Cdc42 (Abe et al.,
2000; Sahin et al., 2005). Dbl and Dbs can activate RhoA and Cdc 42, but not Rac1. Numerous
studies have demonstrated that mutations in the seat-back regions can alter GEF selectivity
(Cherfils & Zhegouf, 2013).For instance, structure/function mutagenesis of the Dbs seat-back
region altered its GEF activity by keep the RhoA interaction intact while abolishing Cdc42
activity, and vice-versa (Snyder et al., 2002; Cheng et al., 2002). The RhoA interface contains a
glutamic acid (Glu-54) that interacts with a basic residue at Lys-758 of Dbs. In contrast to
RhoA, Cdc42 contains a threonine (Thr-52) at the equivalent site, which is not predicted to
engage Lys-758. The contact between Lys-758 and Glu-54, but not Thr-52, would suggest that
the Lys-758 interaction is only important for RhoA. Indeed, mutating this residue (K758A)
alters Dbs-activation of RhoA, but not Cdc42 (Snyder et al., 2002). Similar approaches were
used for the Cdc42-specifc RhoGEF Intersectin. By mutating two residues (G1368L/M1369L)
in the seat back region, Intersectin ectopically activated RhoA (Snyder et al., 2002).
While previous data demonstrates that the DH domain, specifically CR1, CR3, and the
seat-back regions, are necessary for GEF exchange and selectivity, most of these studies
elucidating the mechanisms of GEF activity were conducted in cell-free in vitro assays.
Additional complexity arises when GEFs are expressed in mammalian cells. Discrepancies have
been reported between in vitro activity and activity in mammalian cells (Schmidt and Hall,
2002). For example, Tiam1 can activate Rac1, Cdc42, and RhoA in vitro but only Rac1 in the
cell. There are few potential reasons for this discrepancy: First, activation in vitro is measured

26
within minutes after GEF addition, compared to a cell transfection, which measures the
activation after a couple of days. Second, due to technical issues with recombinant protein
purification, most in vitro assays are conducted with truncated forms of the GEF, many times
with just the DH-PH domains. As discussed below, other modular domains are critical for
regulating the DH-PH domain. Third, RhoGEFs display significant diversity in protein
functional domains, which can contribute to cell-intrinsic regulation and signaling. In these
cases, protein interactions and upstream activation via posttranslational modification can alter the
specificity of GEF activity.
Taken together, studies in vitro have provided invaluable insight into how the
GEF/GTPase complexes form and how GEF selectivity is occurs. It is clear, however, that GEFs
require more than their core catalytic activity to achieve cellular specific functions.
Complementary approaches in vivo should help clarify GEF specific regulatory mechanisms that
fine tune this core catalytic activity.
PH domain regulation
The majority (~95%) of RhoGEFs contain a PH-domain adjacent to the DH-domain.
RhoGEFs utilize the PH domain in a variety of ways. Traditionally they are known for binding
to phosphoinositides (PIPs) (Haslam et al., 1993). It is proposed that a major function of the PH
domain is to target the RhoGEF to the plasma membrane, as well as to anchor the DH domain in
proper orientation for GEF activation. In certain cases, PH domain deletions result in loss of
NIH 3T3 fibroblast transformation activity (Rossman et al., 2005; Cherfils & Zhegouf, 2013). In
the cases of Sos1, Tiam1, and Vav however, the PH domain is not sufficient for cellular targeting
and RhoGEFs may rely on other protein domains for this function (Snyder et al., 2001). In these
27
instances, the PH domain may serve a modulatory role for additional membrane anchoring or for
allosteric interaction (Rossman et al., 2005). It is also possible that they directly function in
catalytic exchange. In support of the latter, some bacterially expressed DH-PH domains have
enhanced GEF activity compared to the DH alone (Rossman & Campbell, 2000). In fact, Dbs
and Sos both utilize their PH domains for catalytic exchange, albeit by different mechanisms.
The PH domain of Dbs directly contacts Cdc42 and RhoA (Rossman et al., 2002; Snyder et al.,
2002). In the case of Sos1, the PH domain binds to the seat-back region and occludes Rac1
binding (Sondermann et al., 2004). While there is no rule of thumb that guides PH signaling, the
activity is indispensable in many if not all cases, thus the DH/PH tandem is considered the
minimal structural unit required for GEF activity in vivo.
Other modes of regulation
Outside of the DH/PH domains, RhoGEFs display significant diversity in protein
functional domains (Schmidt & Hall, 2002). RhoGEFs such as the Ephexins, and Vavs contain
Src-homology domain 2 and 3 (SH2 and SH3) and PDZ domains, which contribute to subcellular
targeting and diverse protein-protein interactions. Sos, RasGRF2, and Aslin also contain
additional GEF domains that confer catalytic exchange selectivity towards other Ras superfamily
GTPases including Ras and Ran. Dual function RhoGEFs such as Kalirin, Trio and BCR contain
serine/threonine kinase domains. Taken together, diverse functional domain couple RhoGEFs to
specific upstream and downstream signaling pathways (reviewed in Rossman et al., 2005).
One common mode of regulation is autoinhibition of GEF activity from regions outside
the DH-PH domain, usually near the N-terminus. N-terminal truncations of some RhoGEFs
including Vav1, Ephexin1, TIM, Tiam, Ect2, Asef, and Sos1 leads to constitutive activation of

28
GEF activity (Schmidt & Hall, 2002). C-terminal truncations in p115RhoGEF and Lbc also lead
to constitutive activation. In most of these cases, it is hypothesized that relief of autoinhibition
occurs via posttranslational modifications such as phosphorylation, or intermolecular protein
binding. In most cases, however, mechanistic analysis demonstrating how this occurs has not
been performed (Bos et al., 2007).
TIM, Asef, and Intersectin are autoinhibited by SH3 domains that bind directly to the DH
domains or in nearby regulatory sequences (Yohe et al., 2008; Cherfils & Zhegouf, 2013). In the
case of Intersectin, a neuronally expressed Cdc42-specifc GEF involved in the formation of
clathrin-coated vesicles, the relief of SH3-autoinhibition may occur by the binding of N-WASP
in vivo (Hussain et al., 2001; Tsyba et al., 2011). A similar mechanism has also been proposed
for the Ephexin family member TIM (discussed in Section 1.6).
Probably the best characterized mechanism of autoinhibition comes from the RhoGEF
Vav. The Vav family consists of three proteins, Vav1, Vav2, and Vav3 that can activate Cdc42,
Rac1, and RhoA (Rossman et al., 2005). N-terminal truncations lead to cellular transformation
in fibroblasts (Katsav et al., 1989). Vav signaling is involved in the development of immune
cells, the nervous system, and hematopoietic cells (Bustelo et al., 2001; Cowan et al., 2005).
They contain eight domains: calponin homology (CH), acidic (Ac), DH/PH domains, Zinc
Finger (ZF), SH2, and two SH3 domains. Deletion of the Ac or CH domains on the N-terminus
of Vav1 enhances its GEF activity (Katsav et al., 1989; Bustelo, 2001; Yu et al., 2010).
Structural studies demonstrate that the Ac domain binds to the DH active site and blocks GTPase
binding (Abe et al., 1999; Yu et al., 2010). Subsequently, the CH domain contacts both the Ac
and DH domain and enhances Ac/DH repression. Rosen and colleagues suggest a stepwise relief
of this autoinhibition (Yu et al., 2010). The CH domain is phosphorylated at residues Tyr-142,
29
and Tyr-160, which removes contact from the Ac/DH domains. This event leaves Vav more
accessible to Src- and Syk-family kinases, which are now able to phosphorylate the Ac domain at
Tyr-174 and remove the Ac/DH interaction. This multidomain mechanism could ensure that
GEF activity is generally repressed within the cell, only to be activated in specific subcellular
locales that contain the signaling components necessary for activation. A similar step-wise
activation model has been proposed for the Ephexins (see Section 1.6).
In an interesting study, Yeh et al. demonstrated that autoinhibition of the DH domain can
be used modularly to regulate the GEF activity of heterologous proteins (Yeh et al., 2007). They
took the DH-PH domains of five different RhoGEFs including the Cdc42-specific Intersectin and
the Rac1-specific Trio, and synthesized new autoinhibitory domains. By fusing a DH-PH
domain to an N-terminal PDZ domain and a C-terminal kinase recognition site, they were able to
introduce a new regulatory activity to the fusion protein, allowing for modulation the newly
synthesized GEF by protein kinase A (PKA). They added the PKA activator forskolin to
fibroblast cells overexpressed with the GEF, and were able to artificially induce lamellopodial
ruffling and filopodial spikes. This suggests that protein domains in the RhoGEFs evolved a
flexible, combinatorial framework to function in a variety of cellular environments, and that a
range of regulation has been acquired based on which regulatory module is linked to the DH-PH
domains.
30
1.4 RhoGEFs during synapse development
Excitatory synapses contain a variety of cell surface receptors, neurotransmitter receptors,
and scaffolding proteins capable of transducing extracellular stimuli into intracellular signaling
(Nimchinsky et al., 2002). Section 1.1 – 1.3 outlined how excitatory synapses are dynamic
throughout development and are regulated by changes in the actin cytoskeleton. GTPases,
critical mediators of the actin cytoskeleton play an important role in synapse development:
Cdc42 and Rac1 promote aspects of excitatory synapse development, while RhoA restricts this
process (Penzes & Cahill, 2012). Since GTPases are ubiquitously expressed throughout the cell
and since their functions involve many cytoskeletal processes including dendritogenesis, neurite
outgrowth andendosomal trafficking, it is hypothesized that the RhoGEFs provide the
spatiotemporal activation required for local GTPase signaling (Tolias et al., 2011). Section 1.4
suggested GEFs rely on a variety of protein functional domains for GEF activation and
regulation. At the synapse, they respond to a diverse set of extracellular cues critical for
dendritic spine morphogenesis and excitatory synapse development. RhoGEFs have differential
expression patterns in the brain and somewhat nonoverlapping roles during the activity-
independent and activity-dependent phases of synapse development. This suggests that they are
the good candidates for spatial and temporal refinement of the actin cytoskeleton during synapse
development (Tolias et al., 2011). Below is a summary of synaptic RhoGEFs, their function, and
regulation during synapse development.
Rac1-specific GEFs Kalirin-7 and Tiam1 promote synapse development
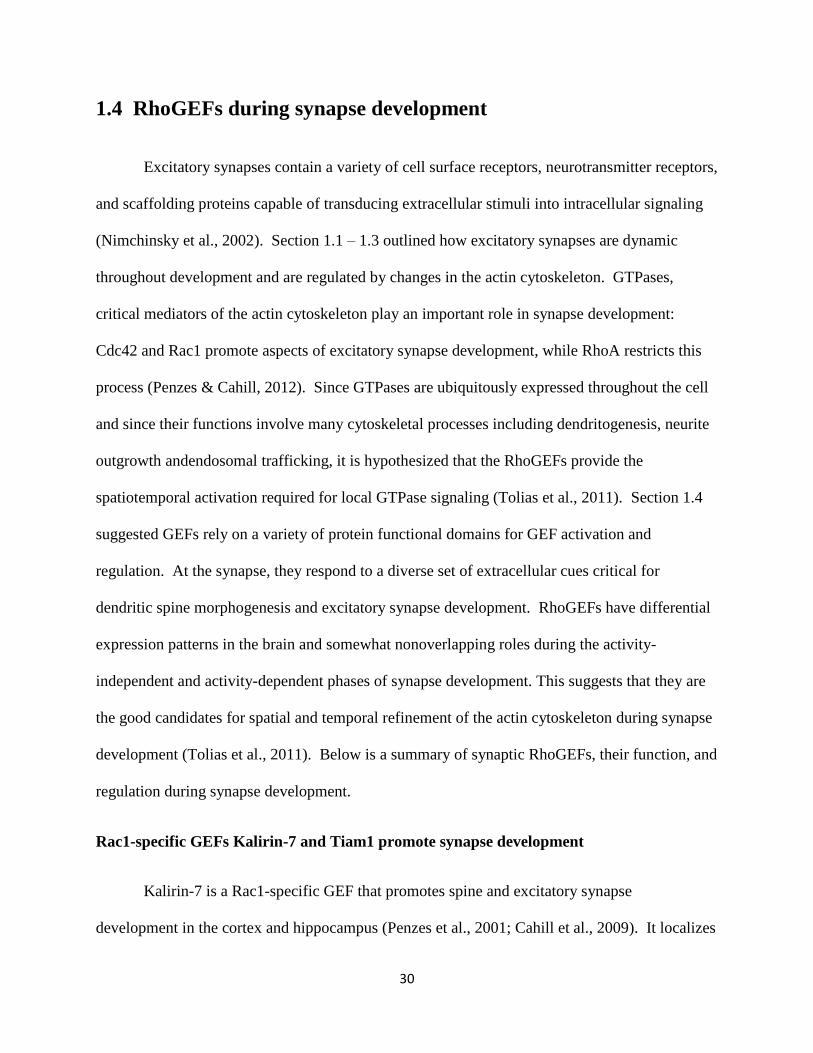
Kalirin-7 is a Rac1-specific GEF that promotes spine and excitatory synapse
development in the cortex and hippocampus (Penzes et al., 2001; Cahill et al., 2009). It localizes
31
to the dendritic spine where it interacts with PSD proteins including PSD95 and SAP102 via its
PDZ-domain (Penzes et al., 2000; Penzes et al., 2001). EphB2- and N-cadherin-dependent
clustering of Kalirin-7 is required for spine morphogenesis (Penzes & Cahill, 2012). Three
pieces of evidence suggest that Kalirin-7 functions predominantly during the activity-dependent
phase of excitatory synapse formation (Penzes & Cahill, 2012). First, Kalirin-7 protein
expression begins around P10-P15 after many activity-independent processes have already taken
place. Second, NMDA-stimulation induces calcium-dependent phosphorylation and this event is
required for spine enlargement, but not spine formation (Xie et al., 2007). Third, early excitatory
synapse development appears normal in Kalirin-7 knockouts, are only defective after 3 weeks in
cortical culture (Cahill et al., 2009).
Similar to Kalirin-7, the Rac1 GEF Tiam1 also promotes excitatory synapse number, and
is required for EphB- and activity-induced spine morphogenesis (Tolias et al., 2005; Tolias et al.,
2007). EphB-tyrosine phosphorylation of Tiam1 at Tyr-829 enhances its Rac1 activation and
provides a link between Eph-receptor signaling and excitatory synapse development (Miyamoto
et al., 2006; Tolias et al., 2007). In the case of Tiam1, it is not clear whether it functions in early
or later phases of synaptic development. Given that it is expressed much earlier in brain
development than Tiam1 (Tolias et al., 2005) its intriguing to speculate that they activate Rac1
during nonoverlapping phases of synapse development.
β-Pix and Intersectin promote synapses on opposite sides of Eph-signaling
Intersectin is a Cdc42-specific GEF that interacts with N-WASP to regulate EphB-
dependent signaling (Irie & Yamaguchi, 2002). β-Pix is a Cdc42/Rac1 GEF that localizes to the
synapse and complexes with the scaffolding protein GIT1 (Tolias et al., 2012). Similar to

32
Kalirin-7, Tiam1, and intersectin, β-Pix is dynamically phosphorylated in response to NMDAR-
stimulation (Tolias et al., 2011). Unlike them however, β-Pix seems to play a role in EphrinB-
reverse signaling where it regulates EphrinB presynaptic signaling (Klein., 2009). This suggests
that postsynaptic EphB signaling through Rac1 and Cdc42 require Tiam1, Intersectin, and
Kalirin-7 whereas presynaptic differentiation requires β-Pix.
RhoA-specific GEFs Lfc, Ephexin1, and Ephexin5 restrict excitatory synapse development
Lfc is a RhoA-specific GEF that is highly expressed in the PSD and dendrite (Ryan et al.,
2005; Kang et al., 2009). When overexpressed, Lfc activates RhoA in neurons and reduces the
size and density of dendritic spines (Ryan et al., 2005; Kang et al., 2009). There are two
conflicting reports on the how it achieves this: One model suggests that activity induces
dendritically localized Lfc to the spine and the other model suggests that it is poised at the PSD
Nonetheless, one key feature is consistent: Lfc restricts activity-dependent spine morphogenesis
(Ryan et al., 2005; Kang et al., 2009). This finding suggests that Lfc is a molecular mechanism
required to fine-tune synaptic structure during bouts of neuronal activity.
RhoA-GEFs Ephexin1 and Ephexin5 also negatively regulate spine and synapse
formation in the hippocampus (Fu et al., 2007; Margolis et al., 2010; also see Chapter 2 and 4).
Section 1.5 discusses Ephexin subfamily of RhoGEFs and their mechanisms in greater detail.

33
1.5 The Ephexin family
The murine Ephexin (Eph interacting exchange protein) subfamily of RhoGEFs consists
of five members (Shamah et al., 2001; Rossman et al., 2005) (Figure 1.5). They are expressed
in a wide range of tissues including heart, lung, brain and a variety of human cancer cell lines
(Sahin et al., 2005; Xie et al., 2005). Ephexin1 is predominantly expressed in the brain and
muscle. Ephexin2, Ephexin3, and Ephexin4 are expressed in the lungs, intestine and kidney
(Sahin et al., 2005). Ephexin5 is the only other member highly enriched in the brain, but is also
expressed in the heart, kidney, lungs, and endothelial cells (Okita et al., 2003; Sahin et al., 2005;
Takase et al., 2012). The Ephexins are characterized by a tandem DH/PH/SH3 domain and are
intimately tied to Eph receptor signaling through known Eph dependent phosphorylation and
interaction (Sahin et al., 2005; Xie et al., 2005; Fu et al., 2007; Yohe et al., 2008). Therefore, the
Ephexin family could link upstream Eph receptor signaling, and perhaps receptor tyrosine
kinases in general, to downstream actin-mediated cell morphogenesis. In addition, variability in
the length and primary sequence of the N-terminus may dictate specificity to a particular receptor
subclass, or it may dictate differential intramolecular regulation of GEF activity. Thus while
initial studies of the Ephexin family of GEFs have given basic mechanistic insight into how they
function, further study of the Ephexin subfamily is needed to understand possible mechanisms
and functions for this diverse and important subfamily of GEFs.
Ephexin1/NGEF
Ephexin1 (human homolog called NGEF) is a central mediator that links EphA signaling
to actin dynamics (Shi et al., 2010). Ephexin1/Ngef was first characterized and cloned from an
adult mouse brain cDNA library (Rodrigues et al., 2000). It was found to be highly enriched in

34
Figure 1.5: The murine Ephexin family of RhoGEFs
Ephexin family contains tandem DH/PH/SH3 domains and N-termini of variable length. Dbl-
homology = DH, Pleckstrin homology = PH, Src-homology 3 = SH3. Pink bar indicates
conserved tyrosine phosphorylation site (Sahin et al., 2005).

35
the brain, specifically in the caudate nucleus, hippocampus, and amygdala. In preliminary
experiments, Rodrigues et al. demonstrated that Ephexin1 has transformation potential in
NIH3T3 fibroblasts presumably via its DH/PH domain.
A better understanding of Ephexin1 signaling came when it was identified in a systematic
yeast-two hybrid screen searching for cytosolic interacting partners with the EphA4 receptor
tyrosine kinase (Shamah et al., 2001). EphA4 signaling induces growth cone collapse in
developing neurons, which is important for proper guidance of axonal tracts during development
(Frisen et al., 1999). Under baseline conditions, Ephexin1 can activate RhoA, Rac1, and Cdc42.
However, upon EphA4-induced tyrosine phosphorylation, Ephexin1 increases its activation
towards RhoA and decreases its preference for Rac1/Cdc42 (Shamah et al., 2001; Sahin et al.,
2005). In this way, Ephexin1 links upstream EphA4 signaling to downstream RhoA-mediated
actin dynamics and axonal pathfinding.
A similar mechanism occurs during synapse development both in the hippocampus and
neuromuscular junction (NMJ). EphA4-mediated dendritic spine retraction in the hippocampus
requires Ephexin1 (Fu et al., 2007). Specifically, EphA4 induces the tyrosine phosphorylation
and recruitment of cyclin-dependent kinase 5 (Cdk5), a process that enhances Cdk5’s kinase
activity (Zukerberg et al., 2000). In turn, the EphA4/Cdk5 complex enhances the GEF activity
of Ephexin1 via Cdk5-dependent phosphorylation (Fu et al., 2007).
At the NMJ, post-synaptic Ephexin1 induces RhoA-mediated dissociation and
disassembly of acetylcholine receptor clusters from the actin cytoskeleton (Shi et al., 2010).
This process can be stimulated by EphA receptors and it requires Ephexin1 phosphorylation. In
support of this finding, Ephexin1 knockout mice have altered NMJ morphology, impaired NMJ
36
synaptic transmission, and exhibit severe muscle weakness.(Shi et al., 2010). At the Drosophila
NMJ, pre-synaptic Ephexin modulates homeostatic vesicle release by activating Cdc42
downstream of pre-synaptic Eph receptors (Frank et al, 2009). In the latter case, the mechanism
is difficult to discern because there is only one Ephexin family member in Drosophila and there
is no distinction between EphB or EphA receptor subclasses. Nonetheless, it suggests that the
link to Eph receptor signaling may be conserved across species.
Ephexin2/WGEF/Arhgef19
Ephexin2 (human homolog called WGEF) has GEF activity towards RhoA and Cdc42,
and can induce stress-fiber and filopodial formation, respectively (Wang et al., 2004; Smith et
al., 2005). Similar to Ephexin1, the RhoA activity of WGEF can be induced by Src- and EphA4-
mediated phosphorylation (Yohe et al., 2008). The literature on WGEF/Ephexin2 is sparse, but
it suggests that WGEF may play a role earlier in development than other Ephexin members,
perhaps during cell differentiation. For example, it was shown to complex with Dishelleved and
Frizzled-7 receptor in the Wnt-mediated planar cell polarity pathway during notochord
development in Xenopus embryos (Tanegashima et al., 2008). In addition, the genomic locus of
WGEF was shown to be de-methylated during adipocyte differentiation, but its role in this
process is unclear (Horii et al., 2009).
Ephexin3/TIM/Arhgef5
Ephexin3 (human homolog called TIM) was isolated from a human mammary epithelial
cell cDNA library that was screening for novel oncogenes with transforming activity in NIH3T3
cells (Chan et al., 1994). TIM only activates the RhoA subfamily of GTPases (RhoA, RhoB,
RhoC) in vitro, but seems to also have some activity towards Cdc42 and Rac1 when

37
overexpressed in vivo in a mammalian cell line (Yohe et al., 2007; Xie et al., 2005; Debily et al.,
2004). Interestingly, five truncating isoforms of TIM are specifically upregulated in breast
carcinoma cell lines. Some of these variants seem to only have GEF activity towards
Cdc42/Rac1, and do not seem to activate RhoA-induced stress fibers in these cells (Debily et al.,
2004). It is possible that the discrepancy over which GTPases TIM can activate may be due to
the specific isoform of TIM being expressed in each experiment and/or cell-type specific
signaling of the cell line used in each experiment.
Ephexin4/Neuroblastoma/Arhgef16
Ephexin4 (human homolog known as Neuroblastoma or Arhgef16) activates Cdc42, but
not Rac1 or RhoA in vitro (Oliver et al., 2011). Interestingly, Ephexin4 is the only member that
does not activate RhoA in vitro or in a cell-line. In addition, unlike TIM, Ephexin4 activates
RhoG, a Rac subfamily GTPase that acts upstream of Rac1 (Hiramoto-Yamaki et al., 2010).
Ephexin4 complexes with EphA2 in breast-cancer cells and activates RhoG, This process
recruits a Dock-family GEF, DOCK4, that is capable of activating Rac1 (Hiramoto-Yamaki et
al., 2010; Harada et al., 2011). Through this mechanism, Ephexin4 is thought to be a central
mediator of EphA2-dependent cell migration in breast cancer cells.
Ephexin5/Arhgef15/VsmRhoGEF
Aside from Ephexin1, Ephexin5 (human homolog known as Arhgef15 or VsmRhogef) is
the only other Ephexin member highly expressed in the brain (Sahin et al., 2005). VsmRhoGEF
is necessary for EphA4-mediated RhoA activation and stress fiber formation (Ogita et al., 2003).
ARHGEF15/Ephexin5 was also shown to be required for VEGF-induced Cdc42 activation,
although these effects were modest (Kusuhara et al., 2012). At the initiation of my dissertation
work, the biological roles and underlying mechanisms of Ephexin5 were not well understood.

38
Bimodal regulation by N-terminal autoinhibition and tyrosine phosphorylation
The activity of the ephexin family of GEFs towards RhoA and Cdc42 GTPases can be
activated by Eph and Src family tyrosine kinases. How might tyrosine phosphorylation modulate
the Ephexins? EphA4 phosphorylation of Ephexin1 at tyrosine 87 (Y87) enhanced its activity
towards RhoA (Sahin et al., 2005). Interestingly, truncating Ephexin1’s N-terminus (including
Y87) activated RhoA to a similar extent as a phosphorylated, full-length Ephexin1. This
suggested that the N-terminus of Ephexin1 serves as an auto-inhibitory constraint on its GEF
activity and tyrosine phosphorylation might be one way to relieve this constraint. This tyrosine
residue is conserved amongst all Ephexins, suggesting a common regulatory mechanism (see
Figure 1.5).
Yohe et al provide additional insight into this process by studying two intramolecular
motifs on the N-terminus of TIM (Yohe et al., 2007; Yohe et al., 2008). Similar to Ephexin1,
they find that truncating or mutating the first 22 amino acids (Δ22) on the N-terminus can
increase TIM’s RhoA activity. They find that tyrosine phosphorylation at the conserved tyrosine
residue (Y19) is responsible for relieving the constraint on TIM’s RhoA activity. Interestingly,
they were able to inhibit the activities of both Ngef/Ephexin1 and Wgef/Ephexin2 by adding an
unphosphorylated peptide consisting of TIM’s first 22 amino acids. This suggests that even
though there is low conservation between the N-termini of Ephexins, a short, conserved N-
terminal motif may be a common way to inhibit DH-PH function.
A second mode of N-terminal regulation has also been suggested.
VsmRhoGEF/Ephexin5, Ephexin1/NGEF and Ephexin2/WGEF all have conserved polyproline
rich regions proximal to their DH-PH domains. Intramolecular binding between this polyproline

39
rich region and the C-terminal SH3 domain autoinhibits TIM, NGEF, and WGEF activity (Yohe
et al., 2008). This finding suggests a mechanism where binding of an unknown poly-proline rich
protein with high affinity for the SH3 domain may activate the protein by competing with the N-
terminus for binding. This unknown protein could be Src itself, which can then tyrosine
phosphorylate the conserved residue and relieve repression.
Taken together, a sequential stepwise relief model of Ephexin activation has been
proposed (Figure 1.6). Initially, an N-terminal inhibitory helix (amino acid 1-22) is bound to the
DH domain and an N-terminal polyproline region is bound to the SH3 domain. Unknown
protein X binds to the SH3 domain, which effectively out-competes the N-terminal poly-proline
region. Subsequently, this opens the N-terminus to phosphorylation at the conserved tyrosine
residue and relieves a secondary constraint on GEF activity. In this way, bimodal regulation of
the Ephexins could tightly regulate their activity within the cell. Additional mechanisms of
inhibition may also exist. For instance, Cdk5 is able to phosphorylate Ephexin1 at four
serine/threonine residues on its N-terminus (Fu et al., 2007). It is possible that this also relieves
N-terminal inhibition, adding additional complexity to the regulation of Ephexin1. At the outset
of this dissertation nothing was known about Ephexin5
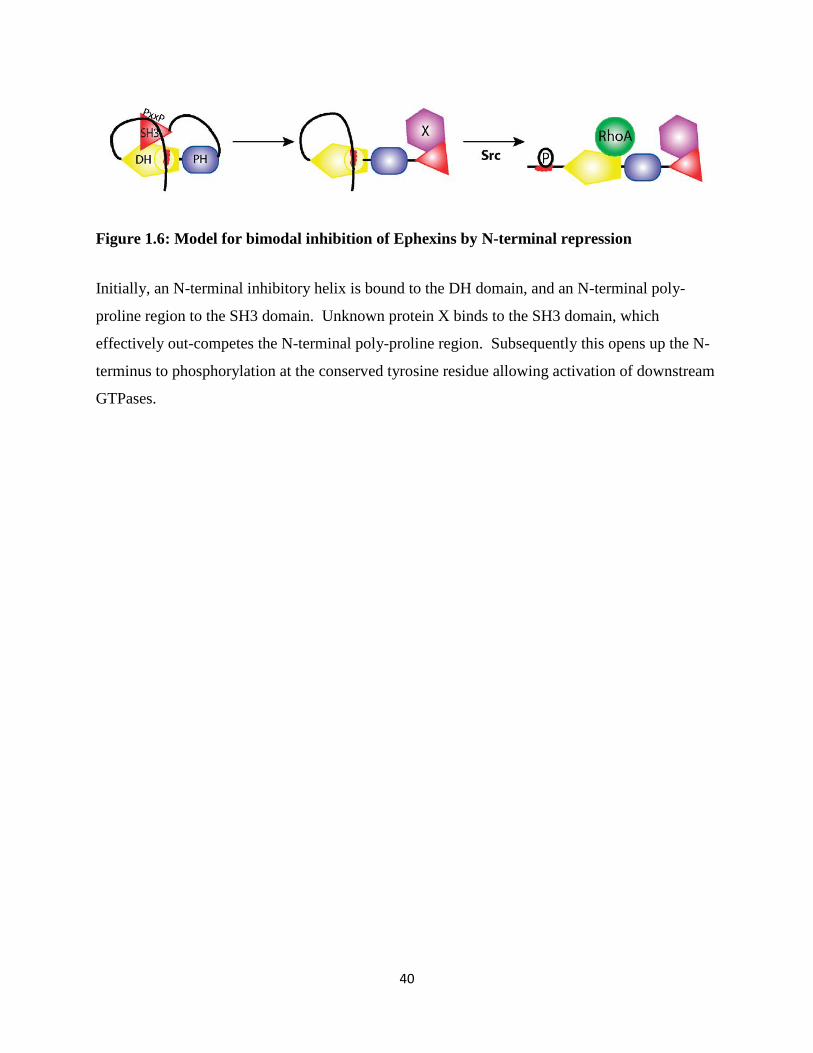
40
Figure 1.6: Model for bimodal inhibition of Ephexins by N-terminal repression
Initially, an N-terminal inhibitory helix is bound to the DH domain, and an N-terminal poly-
proline region to the SH3 domain. Unknown protein X binds to the SH3 domain, which
effectively out-competes the N-terminal poly-proline region. Subsequently this opens up the N-
terminus to phosphorylation at the conserved tyrosine residue allowing activation of downstream
GTPases.
41
1.6 Summary of Dissertation
The mechanisms that promote excitatory synapse formation have been extensively study,
and several well understood models have been described. In contrast, although molecules that
restrict the synapse have been identified, specific molecular mechanisms are not well understood.
We were interested in identifying novel mechanisms that restrict the synapse. One restrictive
pathway is through RhoA, which has been shown to negatively regulate many aspects of cellular
morphogenesis including dendritic spine and synapse formation. Since the Ephexin family
activates RhoA, and since Ephexin5 is expressed in the brain, at the outset of this dissertation we
sought to explore its role during synapse development.
In Chapter 2, we describe efforts to elucidate a role for Ephexin5 during Eph-dependent
synapse development. We find that Ephexin5 activates RhoA both in a mammalian cell-line and
in vivo. It restricts excitatory synapse number through its GEF activity and serves to limit EphB-
dependent synapse formation. Upon EphB2 activation, Ephexin5 is tyrosine phosphorylated at
the analogous tyrosine residue found in Ephexin1 (Y361). Unlike Ephexin1 and other Ephexins
however, EphB2-dependent phosphorylation leads to the degradation of Ephexin5 protein.
Degradation of Ephexin5 requires the E3 ubiquitin ligase, UBE3A, and ube3A knockout mice
show increased levels of Ephexin5. Loss of UBE3A activity in the brain leads to Angelman
syndrome is a neurodevelopmental disorder characterized by profound speech impairments,
severe intellectual disability, motor dysfunction, frequent seizures, and a prevalence of autism-
related behavior (Williams et al., 2005). Thus this finding suggests that the misregulation of
Ephexin5 in the Angelman syndrome brain may contribute to the eitiology of the disease.
42
In Chapter 3 we find that Ephexin5/Arhgef15 is mutated in a form of infantile epileptic
encephalopathy at Arg.604.Cys (R604C). This R604C mutation resides at a critical residue in
the DH-PH linker domain, and this linker region is thought to provide structural rigidity
necessary for proper GEF activity. Indeed, R604C and the homologous mouse mutation, R612C,
lead to a 45% reduction in GEF activity. We also demonstrate that an Ephexin5
happloinsuffiency mouse model (Ephexin +/-) has increased susceptibility to audiogenic seizures
and increased anxiety. We currently screening for additional Ephexin5 mutations in epilepsy
that may help clarify Ephexin5’s role in vivo and its role in epilepsy disorders.
In Chapter 4, we identified a number of novel serine/threonine phosphorylation sites on
the N-terminus of Ephexin5 that are critical for restricting excitatory synapse density in
dissociated hippocampal cultures. Two of these phosphorylation sites, serine-107/109, are
drastically reduced during postnatal development at the height of synapse formation. We suggest
that phosphoregulation of Ephexin5 may be another critical mechanism underlying Ephexin5-
mediated excitatory synapse restriction during early brain development.
Taken together, the studies described in this dissertation demonstrate an important
biological function for Ephexin5 in excitatory synapse formation and normal brain development.
The mechanisms described in this dissertation not only provide a molecular model for the
function of Ephexin5 but also provide insight into how this function may be disrupted in
neurodevelopmental disease.

43
Chapter 2
EphB-mediated degradation of the RhoA GEF Ephexin5 relieves a
developmental brake on excitatory synapse formation

44
2.1 Abstract
The mechanisms that promote excitatory synapse formation and maturation have been
extensively studied. However, the molecular events that limit excitatory synapse development so
that synapses form at the right time and place and in the correct numbers are less well
understood. We have identified a RhoA guanine nucleotide exchange factor, Ephexin5, which
negatively regulates excitatory synapse development until EphrinB binding to the EphB receptor
tyrosine kinase triggers Ephexin5 phosphorylation, ubiquitination, and degradation. The
degradation of Ephexin5 promotes EphB-dependent excitatory synapse development and is
mediated by Ube3A, a ubiquitin ligase that is mutated in the human cognitive disorder Angelman
syndrome and duplicated in some forms of Autism Spectrum Disorders (ASDs). These findings
suggest that aberrant EphB/Ephexin5 signaling during the development of synapses may
contribute to the abnormal cognitive function that occurs in Angelman syndrome and, possibly,
ASDs.

45
2.2 Background and Significance
A crucial early step in the formation of excitatory synapses is the physical interaction
between the developing presynaptic specialization and the postsynaptic dendrite (Jontes et al.,
2000; Ziv and Smith, 1996). This step in excitatory synapse development is thought to be
mediated by cell surface membrane proteins expressed by the developing axon and dendrite and
appears to be independent of the release of the excitatory neurotransmitter glutamate (reviewed
in Dalva et al., 2007). Several recent studies have revealed an important role for Ephrin cell
surface-associated ligands and Eph receptor tyrosine kinases in this early cell-cell contact phase
that is critical for excitatory synapse formation (Dalva et al., 2000; Ethell et al., 2001;
Henkemeyer et al., 2003; Kayser et al., 2006; Kayser et al., 2008; Lai and Ip, 2009; Murai et al.,
2003).
Ephs can be divided into two classes, EphA and EphB, based on their ability to bind the
ligands EphrinA and EphrinB, respectively (reviewed in Flanagan and Vanderhaeghen, 1998).
EphBs are expressed postsynaptically on the surface of developing dendrites, while their cognate
ligands, the EphrinBs, are expressed on both the developing axon and dendrite (Grunwald et al.,
2004; Grunwald et al., 2001; Lim et al., 2008). When an EphrinB encounters an EphB on the
developing dendrite, EphB becomes autophosphorylated, thus increasing its catalytic kinase
activity (reviewed in Flanagan and Vanderhaeghen, 1998). This leads to a cascade of signaling
events including the activation of guanine nucleotide exchange factors (GEFs) Tiam, Kalirin, and
Intersectin, culminating in actin cytoskeleton remodeling that is critical for excitatory synapse
development (reviewed in Klein, 2009). Consistent with a role for EphBs in excitatory synapse
development, EphB1/EphB2/EphB3 triple knockout mice have fewer mature excitatory synapses
in vivo in the cortex, and hippocampus (Henkemeyer et al., 2003; Kayser et al., 2006). In
46
addition, the disruption of EphB function postsynaptically in dissociated hippocampal neurons
leads to defects in spine morphogenesis and a decrease in excitatory synapse number (Ethell et
al., 2001; Kayser et al., 2006). Conversely, activation of EphBs in hippocampal neurons leads to
an increase in the number of dendritic spines and functional excitatory synapses (Henkemeyer et
al., 2003; Penzes et al., 2003). These findings indicate that EphBs are positive regulators of
excitatory synapse development.
While there has been considerable progress in characterizing the mechanisms by which
EphBs promote excitatory synapse development, it is not known if there are EphB-associated
factors that restrict the timing and extent of excitatory synapse development. We hypothesized
that neurons might have evolved mechanisms which act as checkpoints to restrict EphB-
mediated synapse formation, and that the release from such synapse formation checkpoints might
be required if synapses are to form at the correct time and place and in appropriate numbers.
We considered the possibility that likely candidates to mediate the EphB-dependent
restriction of excitatory synapse formation might be regulators of RhoA, a small G protein that
functions to antagonize the effects of Rac (Tashiro et al., 2000). In previous studies we
identified a RhoA GEF, Ephexin1, which interacts with EphA4 (Fu et al., 2007; Sahin et al.,
2005; Shamah et al., 2001). Ephexin1 is phosphorylated by EphA4 and is required for the
EphrinA-dependent retraction of axonal growth cones and dendritic spines (Fu et al., 2007; Sahin
et al., 2005). While Ephexin1 does not appear to interact with EphB, Ephexin1 is a member of a
family of five closely related GEFs. Of these GEFs, Ephexin5 (in addition to Ephexin1) is highly
expressed in the nervous system. Therefore, we hypothesized that Ephexin5 might function to
restrict the EphB-dependent development of excitatory synapses by activating RhoA.
47
In this study we report that EphB interacts with Ephexin5, that Ephexin5 suppresses
excitatory synapse development by activating RhoA, and that this suppression is relieved by
EphrinB activation of EphB during synapse development. Upon binding EphrinB, EphB
catalyzes the tyrosine phosphorylation of Ephexin5 which triggers Ephexin5 degradation. We
identify Ube3A as the ubiquitin ligase that mediates Ephexin5 degradation, thus allowing
synapse formation to proceed. As UBE3A is mutated in Angelman syndrome and duplicated in
some forms of Autism Spectrum Disorders (ASDs), these findings suggest a possible mechanism
by which the mutation of Ube3A might lead to cognitive dysfunction (Jiang et al., 1998; Kishino
et al., 1997). Specifically, we provide evidence that in the absence of Ube3A, the level of
Ephexin5 is elevated and propose that this may lead to the enhanced suppression of EphB-
mediated excitatory synapse formation, thereby contributing to Angelman syndrome and,
possibly, ASDs.

48
2.3 Results
Ephexin5 interacts with EphB2
To identify mechanisms that restrict the ability of EphBs to promote an increase in
excitatory synapse number, we searched for RhoA guanine nucleotide exchange factors (GEFs)
that specifically activate RhoA signaling, are expressed in the same population of neurons that
express EphB, are expressed at the same time during development as EphB, and interact with
EphB. Structure-function studies of GEFs identified amino acid residues in the activation
domain of Rho family GEFs that specifically identify the GEFs as activators of RhoA rather than
Rac or Cdc42. Applying this criterion, fourteen GEFs were identified that specifically activate
RhoA (Rossman et al., 2005). Of these GEFs we found by in situ hybridization that Ephexin5
has a similar expression pattern to EphB in the hippocampus (Figure 2.1A). These findings
raised the possibility that Ephexin5 might mediate the effect of EphB on developing synapses.
We asked if Ephexin5 interacts physically with EphB. We transfected HEK293T (293)
cells with plasmids encoding Myc-tagged Ephexin5, Ephexin1, or a vector control together with
Flag-tagged EphB2 or EphA4 and asked if these proteins co-immunoprecipitate. Extracts were
prepared from the transfected 293 cells and EphA4 or EphB2 immunoprecipitated with Flag
antibodies. The immunoprecipitates were subjected to SDS polyacrylamide gel electrophoresis
(SDS-PAGE) and blotted with anti-Myc antibody (α-Myc). We found that Ephexin5 co-
immunoprecipitates with EphB2 but not with EphA4 (Figure 2.1B). The relatively weak
Ephexin5 interaction with EphA4 is consistent with published experiments (Ogita et al., 2003).
By contrast, Ephexin1 is co-immunoprecipitated by EphA4 but not EphB2 (Shamah et al., 2001).
These findings suggest that Ephexin5 interacts preferentially with EphB2.

49
Figure 2.1: Ephexin5 interacts with EphB2
A) Ephexin5 and EphB2 are expressed in the CA1 region and dentate gyrus (DG) of the
hippocampus at P12. Adjacent 100 nm mouse brain sections were stained for Ephexin5 or
EphB2 using digoxigenin-labeled RNA probes to the anti-sense strand or sense strand as a
control (top). Lower panels show nuclear staining with DAPI.
B) Immunoprecipitation with α-Flag from 293 cell lysates previously transfected with various
combinations of overexpressing plasmids containing Ephexin1-Myc, Ephexin5-Myc, Flag-
EphB2, and Flag-EphA4, followed by immunoblotting with α-Myc or α-Flag. Input protein
levels shown (bottom).

50
Figure 2.1 (continued):
C) Immunoprecipitation of mouse cortical lysates with IgG or α-C-E5, followed by
immunoblotting with α-EphB2 or α-N-E5 (left). Input protein levels shown (right).
D) Dissociated rat hippocampal neurons were stained using α-N-E5 (Blue) and α-EphB2 (Red).
A representative image of overlapped EphB2 and Ephexin5 is shown (left). Arrows indicate
example locations of EphB2/Ephexin5 co-localization. In three independent experiments,
quantification of overlapped EphB2/Ephexin5 puncta was determined at DIV2, DIV4 and DIV8
and is represented as percent of EphB2 overlapped with Ephexin5 (right). Error bars ± SEM; *p
<0.05, non-significant (n.s.).

51
To extend this analysis we investigated whether EphB2 interacts with Ephexin5 in
neurons. Neurons from embryonic day 16 (E16) mouse brains were lysed in RIPA buffer and
the lysates incubated with affinity purified anti-C-terminal Ephexin5 (α-C-E5) or control (IgG)
antibodies. The immunoprecipitates were then resolved by SDS-PAGE and immunoblotted with
affinity purified anti-N-terminal Ephexin5 (α-N-E5) or EphB2 (α-EphB2) antibodies (Figure
2.1C). This analysis revealed that endogenous, neuronal EphB2 is immunoprecipitated by α-C-
E5 but not IgG.
As an independent means of assessing if EphB and Ephexin5 interact with one another,
we used immunofluorescence microscopy to determine if these two proteins co-localize in
neurons. Cultured mouse hippocampal neurons were transfected with a plasmid expressing
green fluorescent protein (GFP). The GFP-expressing neurons were imaged and quantified for
the co-localization of EphB2 and Ephexin5 puncta by staining with α-C-E5 and α-EphB2. This
analysis revealed that EphB2 and Ephexin5 co-localize along dendrites (Figure 2.1D). We find
that 40% of EphB staining overlaps with α-C-E5 staining early during the development of
excitatory synapses. After eight days in vitro (DIV) the overlap of EphB with Ephexin5 within
neuronal dendrites decreases to below the level that would be detected by random chance. This
change suggests that EphB interacts with Ephexin5 early during development, possibly to inhibit
EphB synapse formation.
Ephexin5 is a guanine nucleotide exchange factor that activates RhoA
To determine if Ephexin5 activates RhoA, we transfected 293 cells with a control
plasmid or a plasmid that drives the expression of Myc-tagged mouse Ephexin5. We prepared
extracts from the transfected cells and incubated the extracts with a GST-fusion protein that
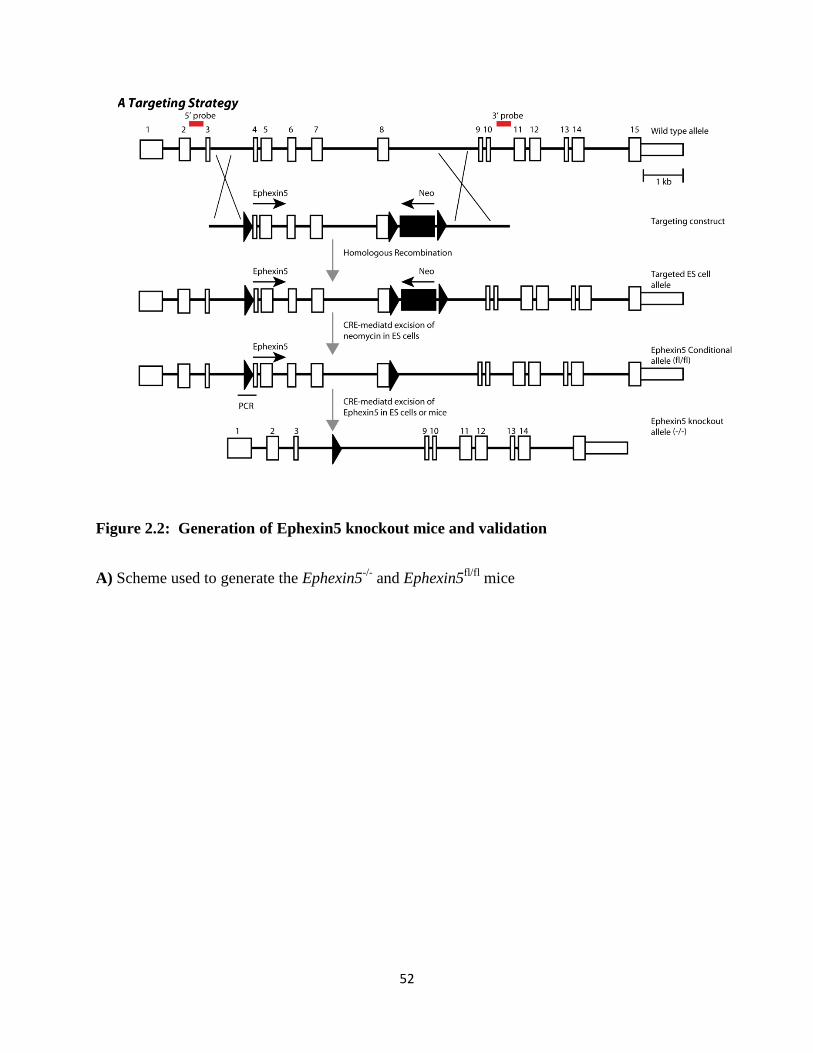
52
Figure 2.2: Generation of Ephexin5 knockout mice and validation
A) Scheme used to generate the Ephexin5-/-
and Ephexin5fl/fl
mice
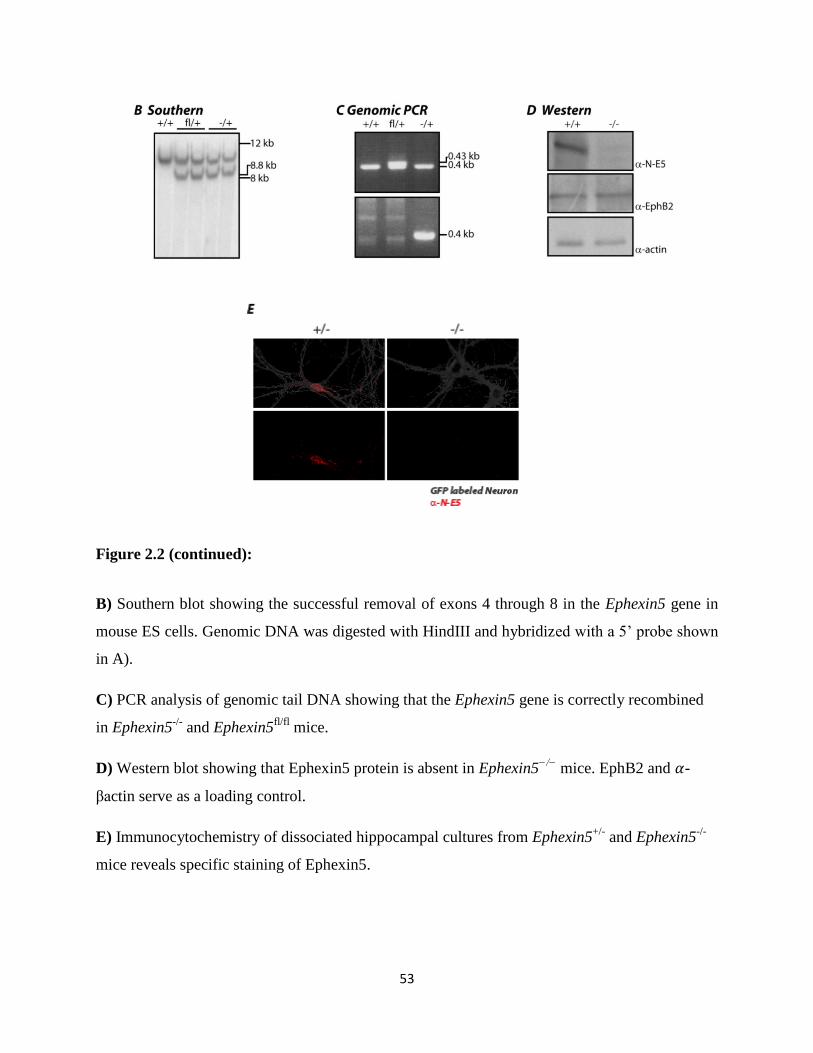
53
Figure 2.2 (continued):
B) Southern blot showing the successful removal of exons 4 through 8 in the Ephexin5 gene in
mouse ES cells. Genomic DNA was digested with HindIII and hybridized with a 5’ probe shown
in A).
C) PCR analysis of genomic tail DNA showing that the Ephexin5 gene is correctly recombined
in Ephexin5-/-
and Ephexin5fl/fl
mice.
D) Western blot showing that Ephexin5 protein is absent in Ephexin5−/−
mice. EphB2 and -
βactin serve as a loading control.
E) Immunocytochemistry of dissociated hippocampal cultures from Ephexin5+/-
and Ephexin5-/-
mice reveals specific staining of Ephexin5.

54
Figure 2.2 (continued):
F) Ephexin5 is enriched in dendrites of hippocampal neurons. Cultured hippocampal neurons
were transfected with GFP at DIV8 and fixed and stained two days later for endogenous
Ephexin5 expression (red) and the dendritic marker Map2 (Blue). Overlapped Map2/GFP
staining indicates dendrites. Subtraction of Map2-positive processes from GFP-labeled neuronal
staining indicates location of axons. To measure Ephexin5 density, the number of Ephexin5
puncta were divided by the area of the GFP dendritic or axonal field. Quantification was done
using MetaMorph.

55
includes the Rhotekin-Binding Domain (GST-RBD), a protein domain that selectively interacts
with active (GTP-bound) but not inactive (GDP-bound) RhoA. Following SDS-PAGE of the
proteins in the extract that bind to GST-RBD, RhoA binding to GST-RBD was measured by
immunoblotting with anti-RhoA antibodies. We found that cells expressing Ephexin5 exhibited
higher levels of activated RhoA compared to cells transfected with a control plasmid, indicating
that Ephexin5 activates RhoA (Figure 2.3A).
When a similar series of experiments were performed using a GST-fusion Pak-Binding
Domain (GST-PBD) which specifically interacts with active forms of two other Rho GTPases,
Rac1 and Cdc42, we found that Ephexin5 does not induce the binding of GST-PBD to Rac1 or
Cdc42. In contrast, Ephexin1-expressing cells displayed enhanced binding of Rac1 and Cdc42
to GST-PBD. We conclude that Ephexin5 activates RhoA but not Rac1 or Cdc42 (Figure 2.3B).
To determine whether Ephexin5 activation of RhoA requires the GEF activity of
Ephexin5, we generated a mutant form of Ephexin5 in which its guanine nucleotide exchange
activity is impaired. To identify the residues required for Ephexin5 guanine nucleotide exchange
activity we compared its Dbl-homology (DH) domain to the DH domain of other RhoA GEFs
(Figure 2.3C) (Snyder et al., 2002). We identified within the α5 helix of Ephexin5’s DH
domain three amino acids that are conserved in other GEFs that like Ephexin5, preferentially
activate RhoA. To generate a form of Ephexin5 predicted to be inactive as a GEF, we mutated
these three conserved amino acids to alanine (i.e., L562, Q566, and R567 (Ephexin5-LQR)).
Using the GST-RBD pull down assay we found that although Ephexin5-WT and Ephexin5-LQR
are expressed at similar levels, the Ephexin5-LQR mutant is significantly impaired relative to
WT in its ability to activate RhoA (Figure 2.3D). As a control, we mutated other conserved
residues within the α5 DH region to alanine (Q547, S548, R554, and L555). When we tested this

56
Figure 2.3: Ephexin5 is a guanine nucleotide exchange factor that activates RhoA
A) Lysates from 293 cells transfected with empty vector (Control) or Ephexin5-Myc
overexpressing vector were assayed for endogenous RhoA activity using the RBD pulldown
assay and analyzed by immunoblotting with an antibody to RhoA (top panel). GTPγS lane is a
positive control for inducing RhoA activity. Increased endogenous RhoA activity is
demonstrated by presence of anti-RhoA signal in RBD pulldown lanes. Input protein levels and
β-actin loading control are shown (Bottom).
B) Lysates from 293 cells transfected with empty vector (Control), Ephexin5-Myc, or Ephexin1-
Myc were assayed for activated Rac1 and Cdc42 using the PBD pulldown assay. Pulldown lanes
were immunoblotted with mouse anti-Rac1 and re-probed with rabbit anti-Cdc42 (top two
panels). GTPγS lane is a positive control for inducing Rac1 and Cdc42 activity. Increased
endogenous Rac1 or Cdc42 activity is demonstrated by presence of anti-Rac1 or anti-Cdc42
signal in PBD pulldown lanes. Input protein levels and β-actin loading control are shown
(Bottom).
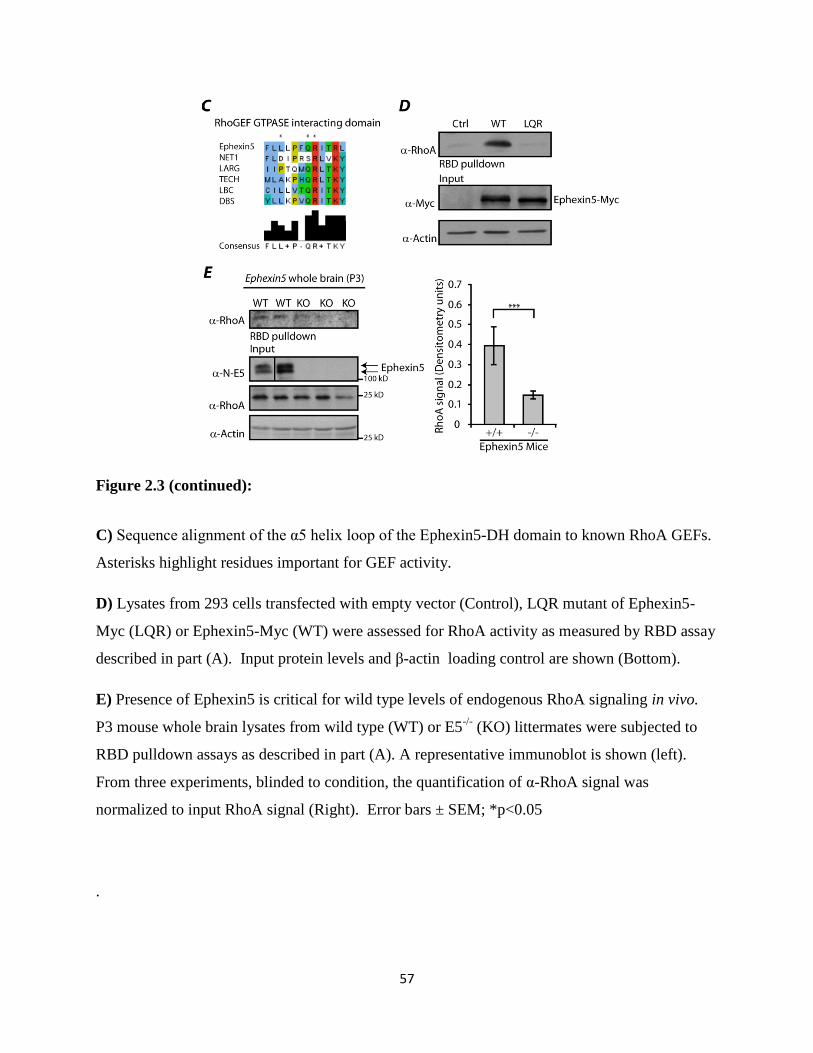
57
Figure 2.3 (continued):
C) Sequence alignment of the α5 helix loop of the Ephexin5-DH domain to known RhoA GEFs.
Asterisks highlight residues important for GEF activity.
D) Lysates from 293 cells transfected with empty vector (Control), LQR mutant of Ephexin5-
Myc (LQR) or Ephexin5-Myc (WT) were assessed for RhoA activity as measured by RBD assay
described in part (A). Input protein levels and β-actin loading control are shown (Bottom).
E) Presence of Ephexin5 is critical for wild type levels of endogenous RhoA signaling in vivo.
P3 mouse whole brain lysates from wild type (WT) or E5-/-
(KO) littermates were subjected to
RBD pulldown assays as described in part (A). A representative immunoblot is shown (left).
From three experiments, blinded to condition, the quantification of α-RhoA signal was
normalized to input RhoA signal (Right). Error bars ± SEM; *p<0.05
.
58
mutant we observed no defect in RhoA activation, suggesting that the Ephexin5-LQR mutation
specifically disrupts the GEF activity of Ephexin5 and that the inability of the LQR mutant to
activate RhoA is not a general consequence of disrupting the α5 region of Ephexin5 (Figure
2.4). Taken together, these findings indicate that Ephexin5 requires an intact conserved GEF
domain to promote RhoA activity in 293 cells, suggesting that Ephexin5 functions as a RhoA
GEF.
We next asked if Ephexin5 expression affects RhoA activity in the brain. We lysed P3
whole brains from wild type or Ephexin5-/-
mice and performed a GST-RBD pull down assay.
This analysis revealed a significant decrease in RhoA activation in brain extracts from Ephexin5-
/- mice compared to wild type mice, suggesting that Ephexin5 is required to maintain wild type
levels of RhoA activity in the brain (Figure 2.3E).
Ephexin5 negatively regulates excitatory synapse number
Our findings indicate that Ephexin5 interacts with EphB2, a key regulator of excitatory
synapse development. Thus, we asked whether Ephexin5 plays a role in the development of
excitatory synapses. We generated two short hairpin RNA constructs that each knocks down
Ephexin5 protein levels when expressed in 293 cells or cultured hippocampal neurons (Figure
2.5A-2.5B). These shRNAs were introduced into cultured hippocampal neurons together with a
plasmid that drives expression of green fluorescent protein (GFP) to allow detection of the
transfected cells. We found by staining with α-N-E5 antibodies that the Ephexin5 shRNAs (E5-
shRNA), but not scrambled hairpin control shRNAs (ctrl-shRNA), efficiently knocked down
Ephexin5 expression in the transfected neurons (Figure 2.5C).
By staining with antibodies that recognize pre- and post- synaptic proteins or by
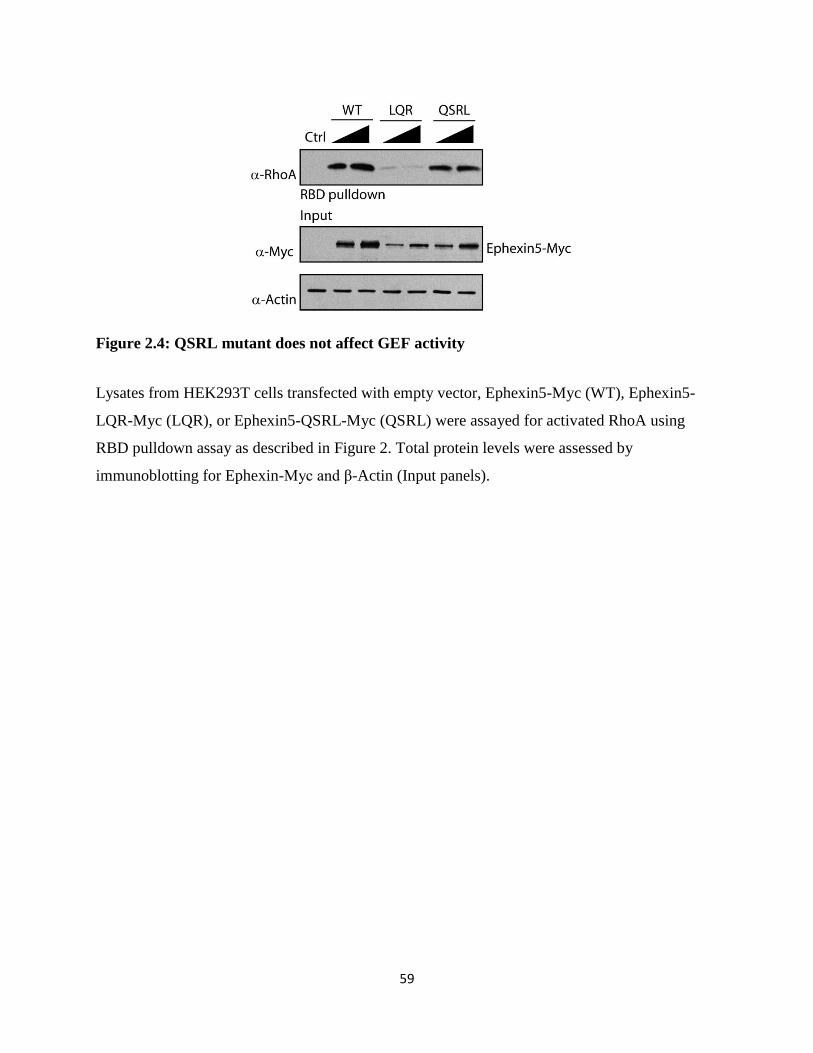
59
Figure 2.4: QSRL mutant does not affect GEF activity
Lysates from HEK293T cells transfected with empty vector, Ephexin5-Myc (WT), Ephexin5-
LQR-Myc (LQR), or Ephexin5-QSRL-Myc (QSRL) were assayed for activated RhoA using
RBD pulldown assay as described in Figure 2. Total protein levels were assessed by
immunoblotting for Ephexin-Myc and β-Actin (Input panels).

60
Figure 2.5 Ephexin5 knockdown by shRNA
A) Genomic structure of the Ephexin5 gene. The genomic location and shRNA sequence used
for Ephexin5 knockdown are shown.
B) Western blot showing that exogenously expressed Ephexin5 protein can be knocked down in
HEK293T cells in the presence of shRNA constructs. Only two of the three shRNA constructs
were capable of knocking down Ephexin5 protein expression.
C) Rat hippocampal neurons were transfected with GFP and shRNA targeted to Ephexin5 gene
at DIV10. At DIV14, neurons were fixed and stained for endogenous Ephexin5 protein.
Immunocytochemistry shows that Ephexin5 shRNA-expressing neurons have a dramatic
decrease in endogenously expressed Ephexin5.
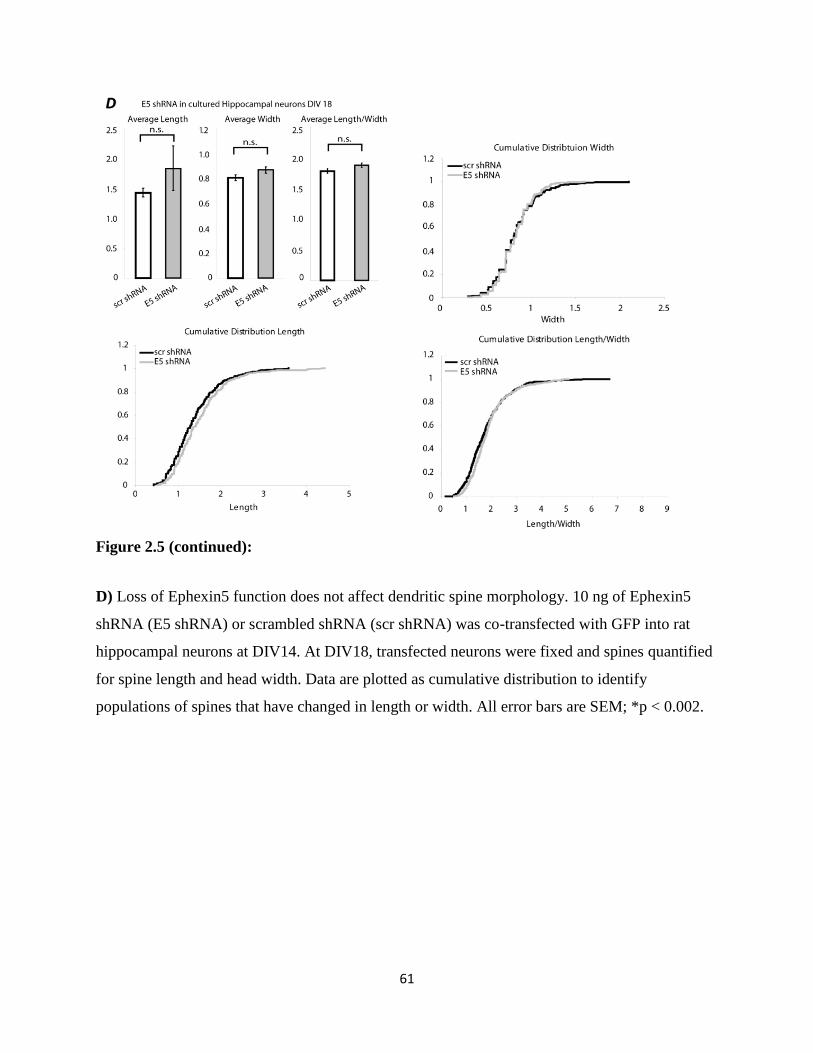
61
Figure 2.5 (continued):
D) Loss of Ephexin5 function does not affect dendritic spine morphology. 10 ng of Ephexin5
shRNA (E5 shRNA) or scrambled shRNA (scr shRNA) was co-transfected with GFP into rat
hippocampal neurons at DIV14. At DIV18, transfected neurons were fixed and spines quantified
for spine length and head width. Data are plotted as cumulative distribution to identify
populations of spines that have changed in length or width. All error bars are SEM; *p < 0.002.

62
visualizing dendritic spines in GFP transfected neurons we observed a significant increase in the
number of excitatory synapses and dendritic spines that are present on the E5-shRNA-expressing
neurons compared to neurons expressing ctrl-shRNAs (Figure 2.6A-2.6B). By contrast, we
failed to detect a significant change in dendritic spine length or width under these conditions
(Figure 2.5D). These findings suggest that Ephexin5 functions to restrict spine/excitatory
synapse number but has no significant effect on spine morphology. Consistent with these
conclusions, we found that overexpression of Ephexin5 in hippocampal neurons leads to a
decrease in the number of excitatory synapses that are present on the Ephexin5-overexpressing
neurons (Figure 2.6C). This ability of Ephexin5 to negatively regulate excitatory synapse
number requires its RhoA GEF activity, as overexpression of Ephexin5-LQR had no effect on
synapse number (Figure 2.6D).
To assess the effect of reducing Ephexin5 levels on the functional properties of excitatory
synapses, we recorded miniature excitatory postsynaptic currents (mEPSCs) from cultured
hippocampal neurons transfected with E5-shRNA or ctrl-shRNA. We observed an increase in
the frequency and amplitude of mEPSCs on neurons expressing E5-shRNA compared to ctrl-
shRNA (Figure 2.6E). This suggests that Ephexin5 can act postsynaptically to restrict excitatory
synapse function. Indeed, the increase in mEPSC frequency could be due to an increase in
presynaptic vesicle release onto the transfected neuron or an increase in the number of excitatory
synapses that are present on the transfected neuron. We favor the latter possibility since our
transfection protocol selectively reduces Ephexin5 levels postsynaptically and also because the
increase in synapse number is most consistent with the increase in co-staining of pre- and post-
synaptic markers that we observe when the level of Ephexin5 is reduced. The possibility that
Ephexin5 functions postsynaptically is further supported by immunofluorescence staining
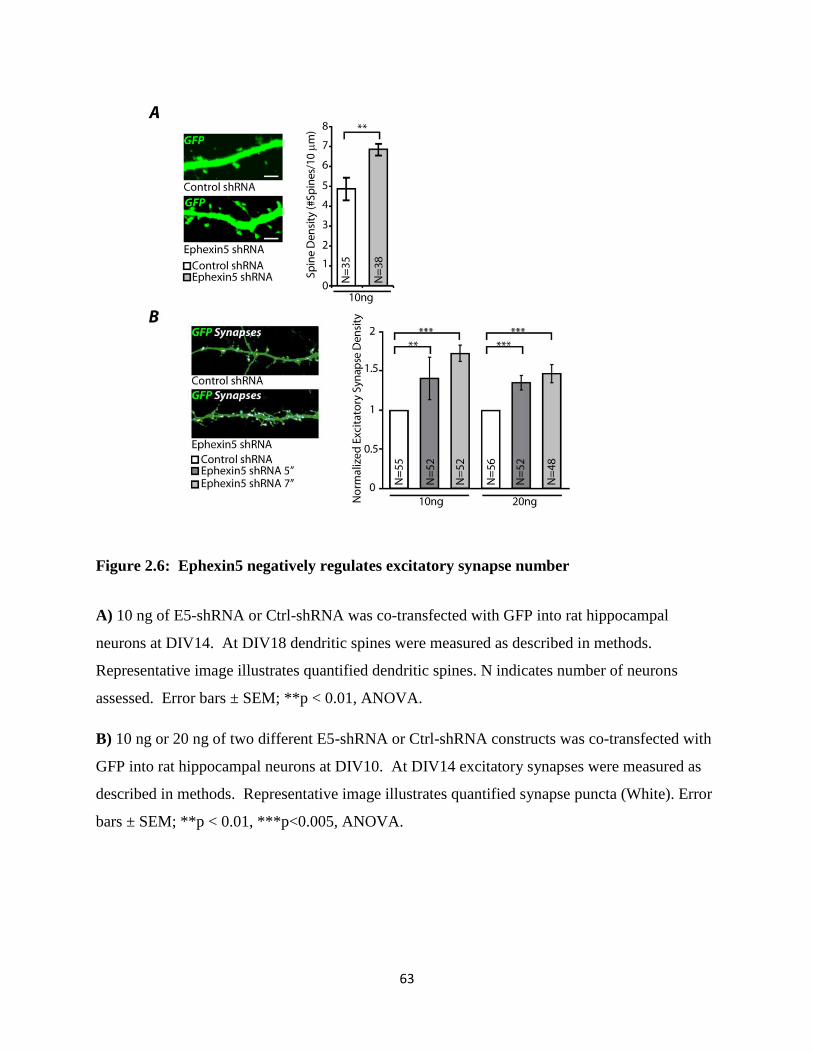
63
Figure 2.6: Ephexin5 negatively regulates excitatory synapse number
A) 10 ng of E5-shRNA or Ctrl-shRNA was co-transfected with GFP into rat hippocampal
neurons at DIV14. At DIV18 dendritic spines were measured as described in methods.
Representative image illustrates quantified dendritic spines. N indicates number of neurons
assessed. Error bars ± SEM; **p < 0.01, ANOVA.
B) 10 ng or 20 ng of two different E5-shRNA or Ctrl-shRNA constructs was co-transfected with
GFP into rat hippocampal neurons at DIV10. At DIV14 excitatory synapses were measured as
described in methods. Representative image illustrates quantified synapse puncta (White). Error
bars ± SEM; **p < 0.01, ***p<0.005, ANOVA.
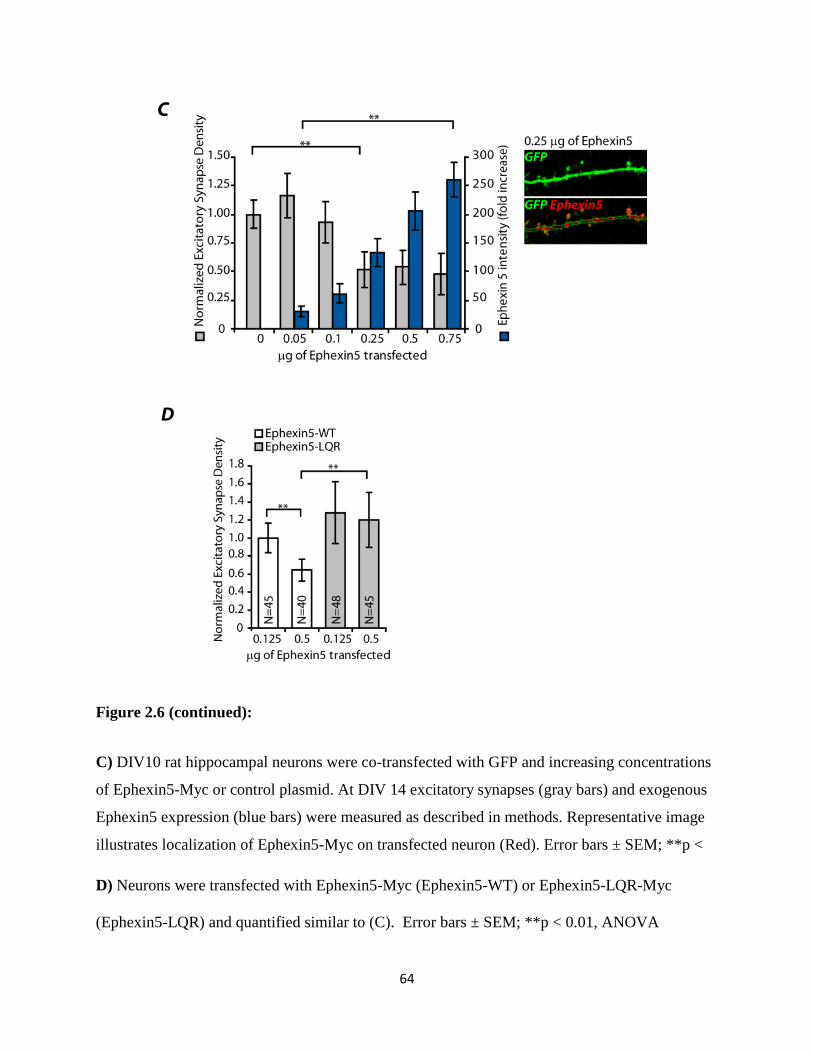
64
Figure 2.6 (continued):
C) DIV10 rat hippocampal neurons were co-transfected with GFP and increasing concentrations
of Ephexin5-Myc or control plasmid. At DIV 14 excitatory synapses (gray bars) and exogenous
Ephexin5 expression (blue bars) were measured as described in methods. Representative image
illustrates localization of Ephexin5-Myc on transfected neuron (Red). Error bars ± SEM; **p <
D) Neurons were transfected with Ephexin5-Myc (Ephexin5-WT) or Ephexin5-LQR-Myc
(Ephexin5-LQR) and quantified similar to (C). Error bars ± SEM; **p < 0.01, ANOVA

65
Figure 2.6 (continued):
E) Quantification of mEPSC inter-event interval and amplitude from hippocampal neurons
transfected as in (B) with 20 ng of shRNA. Cumulative distribution plots, bar graphs and
representative traces are shown. Error bars are standard deviation of the mean, ***p<0.005,
*p<0.05.

66
experiments demonstrating that Ephexin5 is enriched in dendrites relative to axons (Figure
2.2F).
As an independent means of assessing the importance of Ephexin5 in the control of
excitatory synapse number, we cultured hippocampal neurons from Ephexin5-/-
mice or their wild
type littermates for 10 days in vitro and then, following transfection of a GFP-expressing
plasmid into these neurons, quantified the number of excitatory synapses present on the
transfected neuron at DIV14. We observed a three-fold increase in the number of synapses that
are present on Ephexin5-/-
neurons compared to Ephexin5+/-
neurons (Figure 2.7A). Taken
together with the E5-shRNA knockdown and Ephexin5 overexpression analyses, these findings
suggest that Ephexin5 acts postsynaptically to reduce excitatory synapse number.
We next asked if Ephexin5 regulates synapse number in the context of an intact
developing neuronal circuit using conditional Ephexin5 (Ephexin5fl/fl
) animals (Figure 2.2).
Upon introduction of Cre recombinase into Ephexin5fl/fl
cells, exons 4-8 of the Ephexin5 gene are
excised resulting in a cell that no longer produces Ephexin5 protein (data not shown).
Organotypic slices were prepared from the hippocampus of the Ephexin5fl/fl
mice or their wild
type littermates. Using the biolistic transfection method, a plasmid expressing Cre recombinase
was introduced into a low percentage of neurons in the slices. We found that introduction of a
Cre-expressing plasmid into Ephexin5fl/fl
neurons in the hippocampal slice led to a significant
increase in the density of dendritic spines present on the Cre-expressing neurons (Figure 2.7B).
By contrast, expression of Cre in neurons of a wild type hippocampal slice has no effect on
dendritic spine density.
To assess the role of Ephexin5 in hippocampal circuit development in vivo, we performed
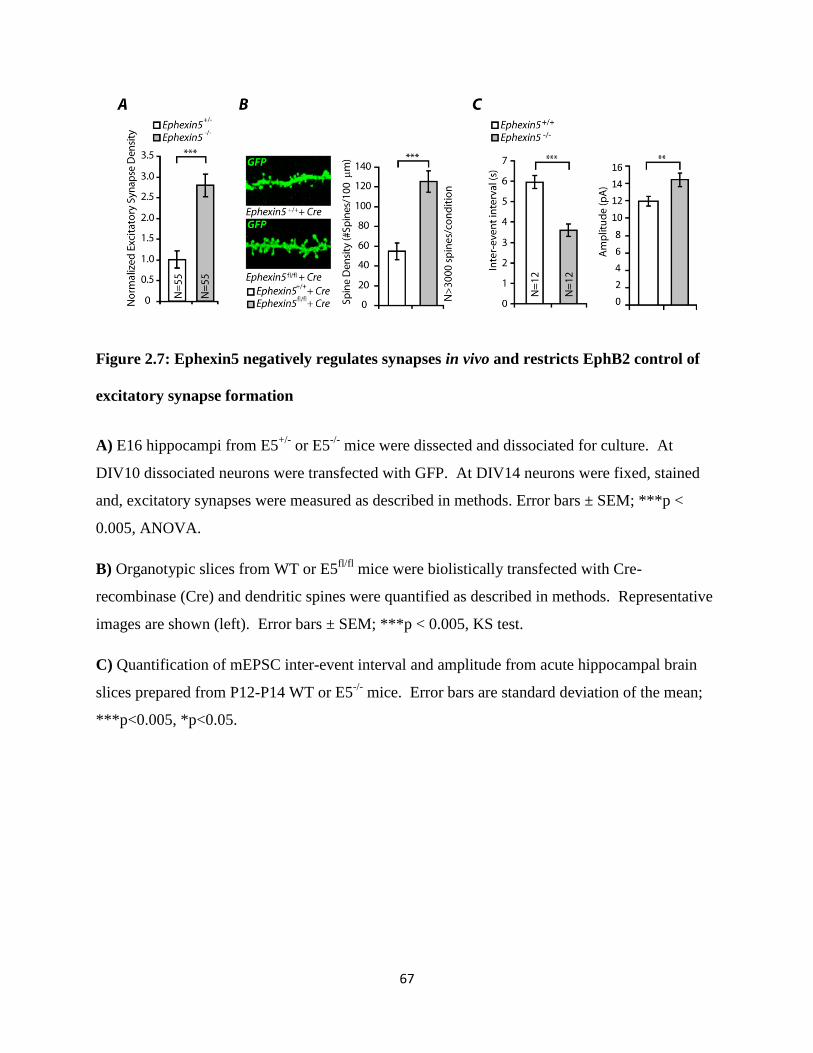
67
Figure 2.7: Ephexin5 negatively regulates synapses in vivo and restricts EphB2 control of
excitatory synapse formation
A) E16 hippocampi from E5+/-
or E5-/-
mice were dissected and dissociated for culture. At
DIV10 dissociated neurons were transfected with GFP. At DIV14 neurons were fixed, stained
and, excitatory synapses were measured as described in methods. Error bars ± SEM; ***p <
0.005, ANOVA.
B) Organotypic slices from WT or E5fl/fl
mice were biolistically transfected with Cre-
recombinase (Cre) and dendritic spines were quantified as described in methods. Representative
images are shown (left). Error bars ± SEM; ***p < 0.005, KS test.
C) Quantification of mEPSC inter-event interval and amplitude from acute hippocampal brain
slices prepared from P12-P14 WT or E5-/-
mice. Error bars are standard deviation of the mean;
***p<0.005, *p<0.05.
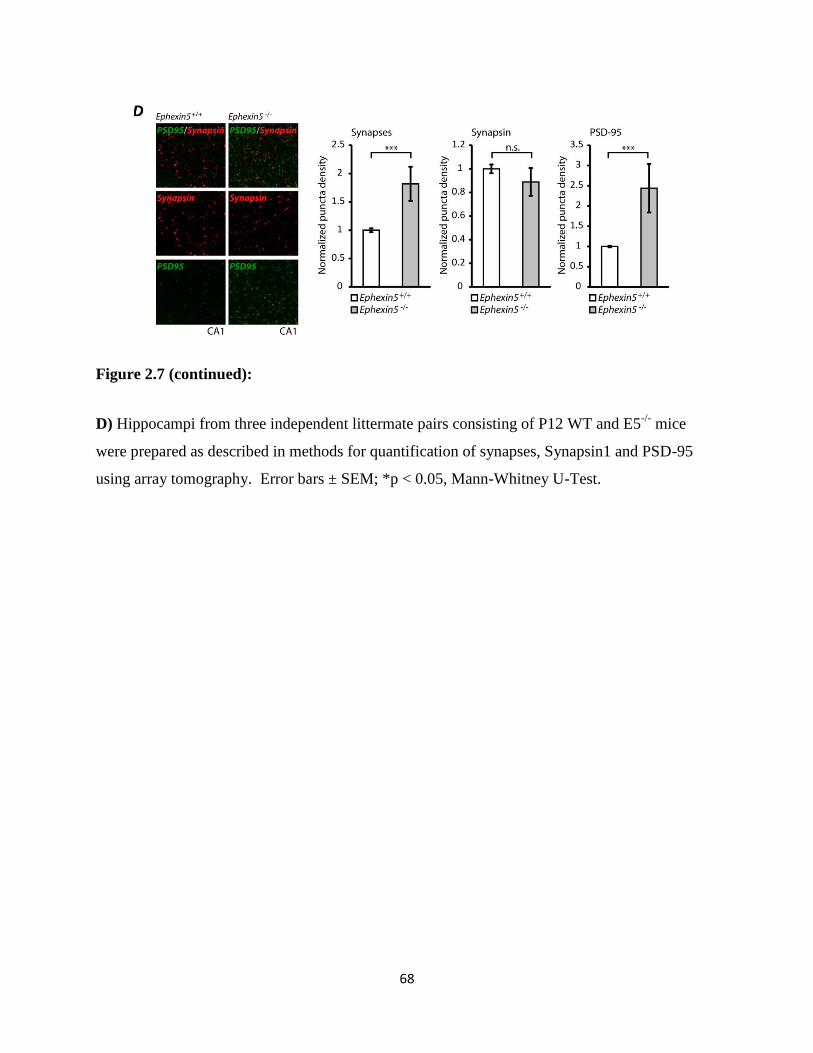
68
Figure 2.7 (continued):
D) Hippocampi from three independent littermate pairs consisting of P12 WT and E5-/-
mice
were prepared as described in methods for quantification of synapses, Synapsin1 and PSD-95
using array tomography. Error bars ± SEM; *p < 0.05, Mann-Whitney U-Test.

69
acute slice physiology experiments in the CA1 region of the hippocampus from wild type or
Ephexin5-/-
mice. We find that relative to wild type neurons, in Ephexin5 knockout CA1
pyramidal neurons there are more frequent excitatory events that have larger amplitude (Figure
2.7C). A possible explanation for these findings is that when Ephexin5 function is disrupted
during in vivo development more excitatory synapses form resulting in more excitatory post-
synaptic events. To test this possibility, we used array tomography to quantify the number of
excitatory synapses that form in the CA1 stratum radiatum of wild type and Ephexin5-/-
mice.
We observed a ~2-fold increase in the number of excitatory synapses within the CA1 region of
the Ephexin5-/-
hippocampus compared to wild type mice (Figure 2.7D). Specifically, the
number of juxtaposed synapsin and PSD-95 puncta was quantified and considered a
measurement of the number of excitatory synapses that form within the CA1 region of the
hippocampus in vivo. This analysis revealed a significant increase in the number of PSD-95
puncta but no change in the number of synapsin puncta density (Figure 2.7D). This suggests
that the increase in excitatory synapse number in the stratum radiatum of Ephexin5-/-
mice is
likely due to the absence of Ephexin5 post-synaptically and that when Ephexin5 is present within
dendrites it functions to negatively regulate synapse number in vivo. On the basis of these
results, we conclude that a key function of Ephexin5 is to restrict excitatory synapse number
during the development of neuronal circuits.
Ephexin5 restricts EphB2 control of excitatory synapse formation
We next considered the possibility that the ability of Ephexin5 to restrict excitatory synapse
number might be controlled by EphB2 signaling. To test this idea, we asked whether reducing
EphB2 signaling eliminates the increase in excitatory synapse number detected when Ephexin5
levels are knocked down by expression of E5-shRNA. To block EphB2 activation, we introduced

70
into neurons a kinase dead version of EphB2 (EphB2-KD) which has been previously shown to
block EphB2 signaling (Dalva et al., 2000). As described above, expression of E5-shRNA in
neurons leads to a significant increase in the number of synapses that are present on the E5-
shRNA-expressing neuron. However, this increase was reversed if the E5-shRNA was co-
transfected with a plasmid that drives expression of EphB2-KD, but was not affected by co-
transfection of a control plasmid (Figure 2.8A). These findings suggest that the increase in
excitatory synapse number that occurs when Ephexin5 levels are reduced requires EphB
signaling. Consistent with this conclusion, we find that if we overexpress wild type EphB2 in
neurons more synapses are present on the EphB-expressing neuron. However, this effect is
reduced if Ephexin5 is overexpressed in neurons together with EphB (Figure 2.8B). It is
possible that the ability of overexpressed Ephexin5 to suppress the synapse-promoting effect of
EphB2 reflects independent actions of these two signaling molecules. However, given that
EphB2 and Ephexin5 interact with one another in neurons, the most likely interpretation of these
results is that Ephexin5 functions directly to restrict the synapse-promoting effects of EphB2. If
this were the case, we would predict that for EphB2 to positively regulate excitatory synapse
development it would be necessary to inactivate and/or degrade Ephexin5.
EphB mediates phosphorylation of Ephexin5 at tyrosine-361
Since EphB2 is a tyrosine kinase, we considered the possibility that it might inhibit the
guanine nucleotide exchange activity or expression of the Ephexin5 protein by catalyzing the
tyrosine phosphorylation of Ephexin5. In support of this possibility, stimulation of dissociated
mouse hippocampal neurons with EphrinB1 for 15 minutes led to an increase in the level of
Ephexin5 tyrosine phosphorylation as detected by probing immunoprecipitated Ephexin5 with
the pan-anti-phosphotyrosine antibody, 4G10 (Figure 2.9A).

71
Figure 2.8: Ephexin5 restricts EphB2 control of synapse formation
A) Increase in excitatory synapse number following loss of Ephexin5 requires EphB2 signaling.
At DIV10, control plasmid (-) or EphB2KD plasmid (+) were co-expressed in dissociated mouse
hippocampal neurons with GFP and either Ctrl-shRNA or E5-shRNA. At DIV14 excitatory
synapses were measured as described in methods. Error bars ± SEM; **p < 0.01, ***p<0.005,
ANOVA.
B) Ephexin5 can suppress an EphB2-mediated increase in excitatory synapse number. At DIV10,
control plasmid (-) or EphB2-expressing plasmid (+) were co-expressed in dissociated mouse
hippocampal neurons with GFP and either control (Ctrl) plasmid or Ephexin5-Myc plasmid. At
DIV14 excitatory synapses were measured as described in methods. Error bars ± SEM; **p <
0.01, ***p<0.005, ANOVA.

72
Figure 2.9: EphB2 phosphorylates Ephexin5 at tyrosine-361
A) Dissociated mouse hippocampal neurons were stimulated with either anti-Fc IgG (Ctrl) or
pre-clustered Fc-EphrinB1 (EB1) for 15 minutes. Neuronal lysates were immunoprecipitated
with α-N-E5, followed by immunoblotting for pan-phosphotyrosine (α-pTyr) and Ephexin5 with
α-N-E5. EphrinB1 stimulation was determined by immunoblotting neuronal lysates for phospho-
Eph (pEph). Input protein levels and β-Actin loading control are shown (Bottom).
B) Ephexin5-Y361 is a conserved residue with Ephexin1-Y87 (Sahin et al., 2005).
C) Immunoprecipitation with α-Myc from 293 cell lysates previously transfected with various
combinations of overexpressing plasmids containing Ephexin5-Myc or Ephexin5 (Y361F)-Myc
and EphB2-Flag, followed by immunoblotting with α-pTyr or α -pY361. Input EphB2 levels are
shown (bottom).
D) Dissociated mouse hippocampal neurons were stimulated with either anti-Fc IgG (Ctrl) for 15
minutes or pre-clustered Fc-EphrinB1 (EB1) for 5 or 15 minutes. Neuronal lysates were
immunoprecipitated with α-N-E5, followed by immunoblotting with α-pY361 and α-N-E5.
Representative immunoblot with input pEph levels is shown (top). Quantification of three
independent experiments are shown as a percent increase in pY361 over Ctrl stimulation
(bottom). Error bars ± SEM; *p<0.05

73
Figure 2.9 (continued):
E) Ephexin5 is phosphorylated at Y361 along developing dendrites. Dissociated rat hippocampal
neurons were transfected with GFP (gray outline) and stimulated with either anti-Fc IgG (Ctrl) or
pre-clustered Fc-EphrinB1 (EB1) for 15 minutes, followed by fixing and staining for endogenous
phosphorylated Ephexin5 using α -pY361 (Red). Representative image shown (left). Four
independent experiments were imaged and analyzed for Ephexin5-Y361 (bar graph). Error bars
± SEM; *p<0.05.
F) Lysates from 293 cells transfected with empty vector (-) or increasing concentrations of
Ephexin5-Myc with or without Flag-EphB2 were assessed for endogenous RhoA activity by
RBD assay (previously described). GTPγS lane is a positive control for inducing RhoA. Input
protein levels and β-Actin loading control are shown (Bottom).
G) WT and EphB2-/-
(B2-/-
) brain lysates were immunoblotted with α -N-E5 and α -pY361
according to methods (left). Quantification of α -N-E5 signal from three independent
experiments is normalized to β-Actin and represented as fold change compared to wild type.
Error bars ± SEM; *p<0.05.

74
We have previously shown that EphrinA1 stimulation of cultured neurons leads to the
tyrosine phosphorylation of Ephexin1 at tyrosine 87 (Sahin et al., 2005). On the basis of this
finding we hypothesized that exposure of neurons to EphrinB1 might promote the
phosphorylation of the analogous tyrosine residue (Y361) on Ephexin5 (Figure 2.9B) and that
phosphorylation at this site might lead to Ephexin5 inactivation. To address test this, we
overexpressed EphB2 in 293 cells together with wild type Ephexin5 or a mutant form of
Ephexin5 in which Y361 is converted to a phenylalanine (Ephexin5-Y361F). Lysates were
prepared from the transfected cells and after SDS-PAGE were immunoblotted with the pan
tyrosine antibody 4G10 (Figure 2.9C). We found that in the presence of EphB2, Ephexin5-WT,
but not Ephexin5-Y361F, becomes tyrosine phosphorylated. These findings suggest that EphB2
catalyzes the tyrosine phosphorylation of Ephexin5 primarily at Y361.
To show definitively that Ephexin5 Y361 is tyrosine phosphorylated, we generated
Ephexin5 phospho-Y361 antibodies (α-pY361). To demonstrate that these antibodies
specifically recognizes the Y361-phosphorylated form of Ephexin5, we immunoblotted cell
lysates prepared from 293 cells that express EphB2 and either Ephexin5-WT or Ephexin5-Y361F
with α-pY361. This analysis demonstrated that the α-pY361 recognizes wild type Ephexin5 but
not Ephexin5-Y361F (Figure 2.9C). Furthermore, using α-pY361 we found that when wild type
EphB2, but not a kinase dead or cytoplasmic truncated version of EphB2, is expressed in 293
cells together with Ephexin5, Ephexin5 becomes tyrosine phosphorylated at Y361 (Figure
2.10A). In contrast, when EphA4 or EphA2 were expressed in 293 cells we detected little to no
phosphorylation of Ephexin5 at Y361 (Figure 2.10B). These findings suggest that EphB2, but
not EphAs, promote Ephexin5 Y361 phosphorylation.
We also found by immunoblotting with the α-pY361 that Ephexin5 is phosphorylated at

75
Figure 2.10: Specificity of EphB-mediated phosphorylation at tyrosine-361
A) Both the EphB2 cytoplasmic domain and kinase domain are necessary for Ephexin5
phosphorylation, but only the EphB2 cytoplasmic domain is required for the EphB2 interaction
with Ephexin5. HEK293T cell lysates from transfected cells with Ephexin5-Myc with either
Flag-EphB2, Flag-EphB2-kinase dead (KD), or Flag-EphB2-Δcyto were immunoprecipitated
with Flag antibody followed by immunoblotting with Flag or with Myc antibodies to assay for
immunoprecipitated Ephs and Ephexin5, respectively. Cell lysates were immunoblotted for Myc
and pY361.
B) Ephexin5 is preferentially phosphorylated by EphB2. HEK293T cell lysates from cells
transfected with the indicated Ephs, with or without Ephexin5-Myc were immunoblotted with
antibodies to Ephexin5-pY361, Myc, and Actin.
C) Ephexin5 is phosphorylated in mouse brain at Y361. Whole brain lysates from P3 wild type
(WT) and Ephexin5-/-
(KO) littermates were lysed and immunoblotted with α-pY361, α-
Ephexin5 (α-N-E5) and α-β-Actin.

76
Y361 in the hippocampus of wild type but not Ephexin5 knockout mice (Figure 2.10C), and that
EphrinB1 stimulation of cultured hippocampal neurons leads to Ephexin5 Y361 phosphorylation
(Figure 2.9D). By immunofluorescence microscopy we detect punctate α-pY361 staining along
the dendrites of EphrinB1-treated wild type neurons, but less staining in untreated neurons
(Figure 2.9E). This result suggests that Ephexin5 becomes phosphorylated at Y361 upon
exposure of hippocampal neurons to EphrinB1.
EphB2-mediated degradation of Ephexin5 is kinase and proteasome dependent
We asked if EphrinB1 stimulation of Ephexin5 Y361 phosphorylation leads to a change
in Ephexin5 activity or expression. To investigate this possibility we asked if EphB suppresses
Ephexin5-dependent RhoA activation in a phosphorylation-dependent manner. We transfected
293 cells with Ephexin5 in the presence or absence of EphB2 and measured RhoA activity using
the RBD pull down assay (Figure 2.9F). We found that Ephexin5-dependent RhoA activation
was reduced in 293 cells expressing EphB2 and Ephexin5 compared to cells expressing
Ephexin5 alone. These findings are consistent with the possibility that EphB2-mediated tyrosine
phosphorylation of Ephexin5 either leads to a suppression of Ephexin5’s ability to activate
RhoA, or alternatively might trigger a decrease in Ephexin5 protein expression resulting in a
decrease in RhoA activation. We found this latter possibility to be the case (Figure 2.9F,
Ephexin5 loading control). Furthermore, when we compared lysates from the brains of wild type
or EphB2-/-
mice, we observed that Ephexin5 phosphorylation at Y361 is decreased while the
levels of Ephexin5 expression are increased in the lysates from EphB2-/-
mice (Figure 2.9G).
These data suggest that EphB2 functions to phosphorylate and degrade Ephexin5. Consistent
with the idea that Ephexin5 expression is destabilized in the presence of EphB2, we observed
that in the dendrites of cultured hippocampal neurons overexpressing EphB2, endogenous
77
Ephexin5 expression levels are reduced compared to control transfected neurons or neurons
transfected with a kinase dead version of EphB2 (Figure 2.11A and 2.12). When neurons were
exposed to EphrinB1 compared to EphrinA1 for 60 minutes, we found by immunoblotting of
neuronal extracts, or immunofluorescence staining with α-N-E5, that exposure to EphrinB1 leads
to a decrease in Ephexin5 expression (Figure 2.11B). The lack of complete loss of Ephexin5
expression by western blot may be due to the fact that EphrinB1 stimulation leads to dendritic
and not somatic loss of Ephexin5 expression. Moreover, immunofluorescence staining revealed
a loss of Ephexin5 puncta specifically within the dendrites of EphrinB1-stimulated neurons,
consistent with the possibility that EphrinB1/EphB-mediated degradation of Ephexin5 relieves
an inhibitory constraint that suppresses excitatory synapse formation on dendrites. In support of
this idea, we find by immunoblotting of extracts from mouse hippocampi with α-N-E5 that
endogenous Ephexin5 protein levels are highest at postnatal day 3 prior to the time of maximal
synapse formation and then decrease as synapse formation peaks in the postnatal period (Figure
2.11C). Northern blotting revealed that this decrease in Ephexin5 protein is not due to a change
in the level of Ephexin5 mRNA expression (Figure 2.11C). Given that Ephexin5 protein levels
decrease dramatically during the time period P7-P21 when synapse formation is maximal, these
findings suggest that Ephexin5 may need to be degraded prior to synapse formation.
We asked whether EphB-mediated degradation of Ephexin5 could be reconstituted in
heterologous cells. When EphB and myc-tagged Ephexin5 were co-expressed in 293 cells we
observed a significant decrease in Ephexin5 protein expression in the presence of EphB2. The
presence of EphB2 had no effect on the level of expression of a related GEF, Ephexin1
(Figure2.11D). We asked whether EphB-mediated degradation of Ephexin5 depends upon
Y361 phosphorylation. We found that in 293 cells overexpressing myc-tagged Ephexin5, the
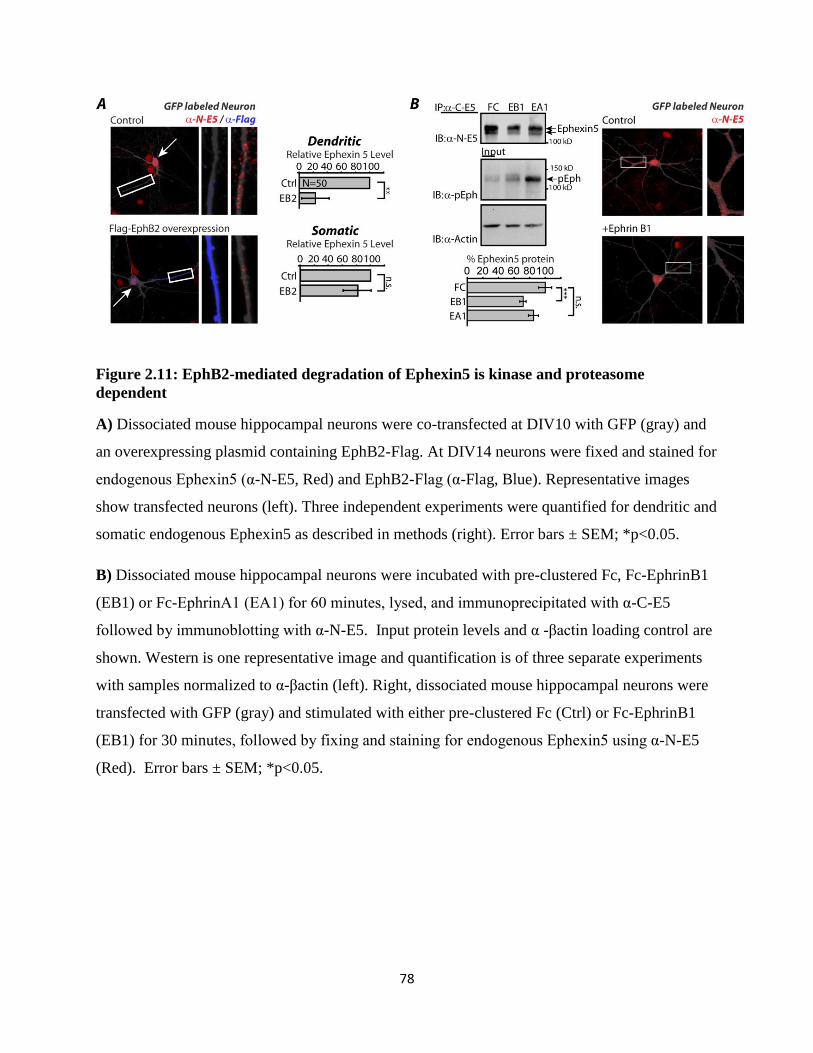
78
Figure 2.11: EphB2-mediated degradation of Ephexin5 is kinase and proteasome
dependent
A) Dissociated mouse hippocampal neurons were co-transfected at DIV10 with GFP (gray) and
an overexpressing plasmid containing EphB2-Flag. At DIV14 neurons were fixed and stained for
endogenous Ephexin5 (α-N-E5, Red) and EphB2-Flag (α-Flag, Blue). Representative images
show transfected neurons (left). Three independent experiments were quantified for dendritic and
somatic endogenous Ephexin5 as described in methods (right). Error bars ± SEM; *p<0.05.
B) Dissociated mouse hippocampal neurons were incubated with pre-clustered Fc, Fc-EphrinB1
(EB1) or Fc-EphrinA1 (EA1) for 60 minutes, lysed, and immunoprecipitated with α-C-E5
followed by immunoblotting with α-N-E5. Input protein levels and α -βactin loading control are
shown. Western is one representative image and quantification is of three separate experiments
with samples normalized to α-βactin (left). Right, dissociated mouse hippocampal neurons were
transfected with GFP (gray) and stimulated with either pre-clustered Fc (Ctrl) or Fc-EphrinB1
(EB1) for 30 minutes, followed by fixing and staining for endogenous Ephexin5 using α-N-E5
(Red). Error bars ± SEM; *p<0.05.

79
Figure 2.11 (continued):
C) Whole brain lysates from wild type mice of indicated ages were assessed for Ephexin5
protein expression by immunoblot with α-N-E5 (top). Immunoblot of brain lysates from WT and
E5-/-
mice is shown. α-βactin was used as loading control. Levels of Ephexin5 RNA from wild
type mice of indicated ages were assessed by northern analysis using an Ephexin5 specific probe.
Schematic of Ephexin5 genomic locus shows location of northern probe (Bottom).
D) Lysates from 293 cells previously transfected with various combinations of overexpressing
plasmids containing Ephexin5-Myc, Ephexin1-Myc and Flag-EphB2 were immunoblotted with α
-Myc, α -Flag, and α -βactin (loading control).
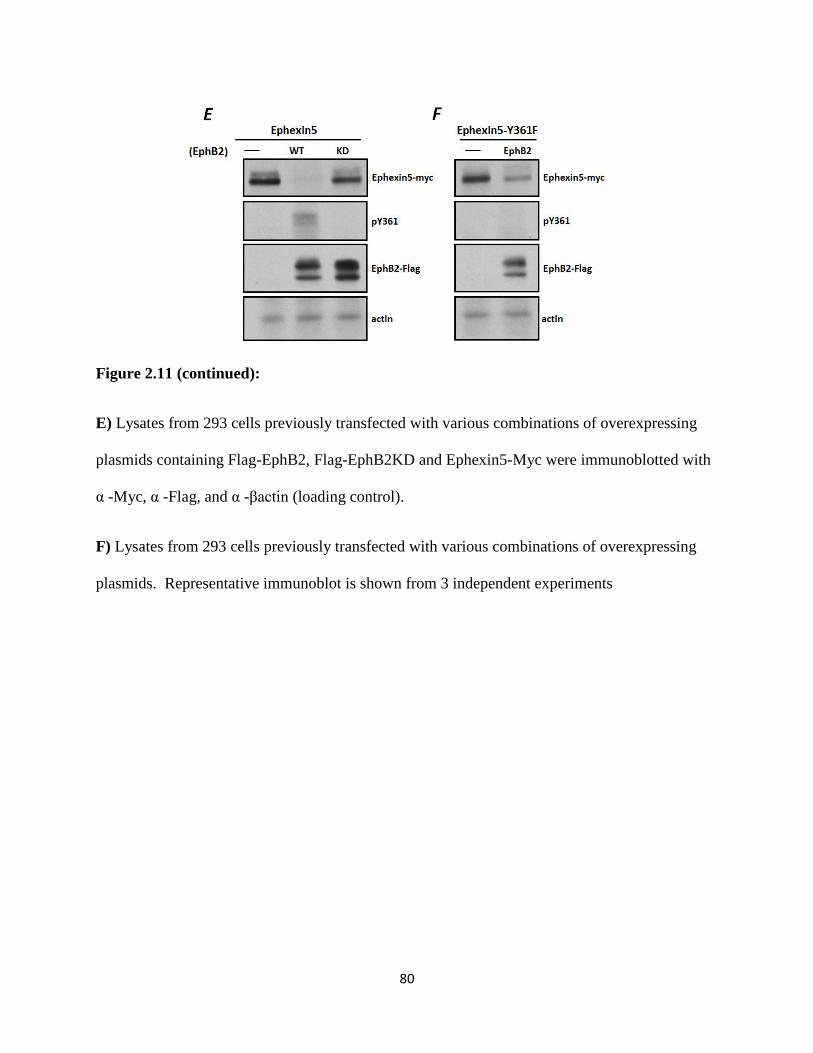
80
Figure 2.11 (continued):
E) Lysates from 293 cells previously transfected with various combinations of overexpressing
plasmids containing Flag-EphB2, Flag-EphB2KD and Ephexin5-Myc were immunoblotted with
α -Myc, α -Flag, and α -βactin (loading control).
F) Lysates from 293 cells previously transfected with various combinations of overexpressing
plasmids. Representative immunoblot is shown from 3 independent experiments
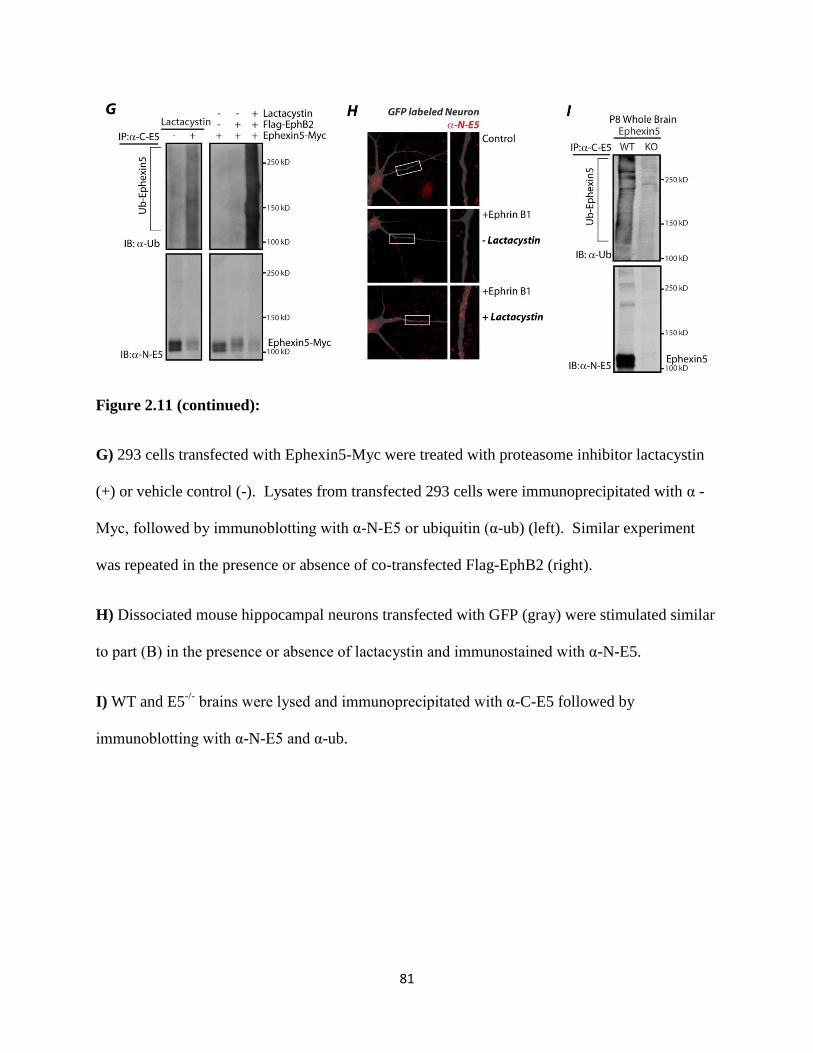
81
Figure 2.11 (continued):
G) 293 cells transfected with Ephexin5-Myc were treated with proteasome inhibitor lactacystin
(+) or vehicle control (-). Lysates from transfected 293 cells were immunoprecipitated with α -
Myc, followed by immunoblotting with α-N-E5 or ubiquitin (α-ub) (left). Similar experiment
was repeated in the presence or absence of co-transfected Flag-EphB2 (right).
H) Dissociated mouse hippocampal neurons transfected with GFP (gray) were stimulated similar
to part (B) in the presence or absence of lactacystin and immunostained with α-N-E5.
I) WT and E5-/-
brains were lysed and immunoprecipitated with α-C-E5 followed by
immunoblotting with α-N-E5 and α-ub.
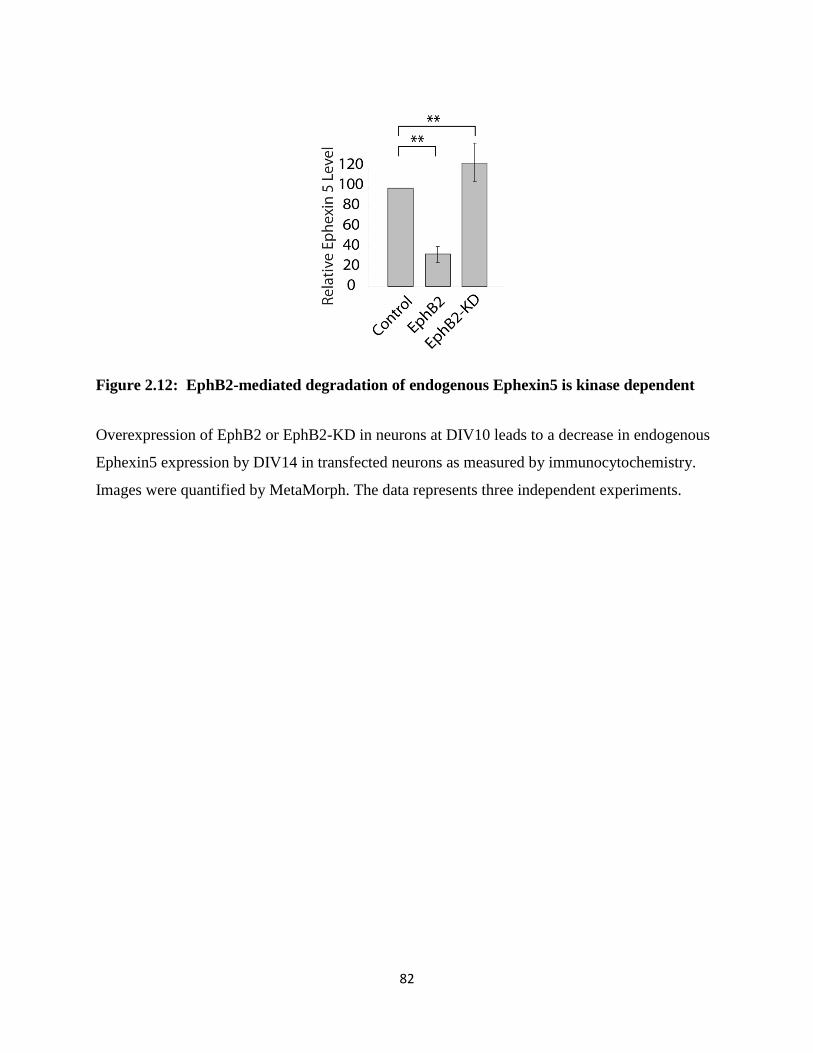
82
Figure 2.12: EphB2-mediated degradation of endogenous Ephexin5 is kinase dependent
Overexpression of EphB2 or EphB2-KD in neurons at DIV10 leads to a decrease in endogenous
Ephexin5 expression by DIV14 in transfected neurons as measured by immunocytochemistry.
Images were quantified by MetaMorph. The data represents three independent experiments.
83
co-expression of EphB2, but not EphB2-KD, resulted in a significant decrease in Ephexin5
levels (Figure 2.11E). This suggests that EphB tyrosine kinase activity is required for Ephexin5
degradation. The EphB-mediated reduction in Ephexin5 levels is partially dependent on Y361
phosphorylation, as the Ephexin5-Y361F levels were suppressed when cotransfected with EphB2
in 293T cells (Figure 2.11F). Taken together, this data suggests that EphB-mediated tyrosine
phosphorylation is required to degrade Ephexin5.
We considered the possibility that the Y361 phosphorylation-dependent decrease in
Ephexin5 protein levels might be due to EphB-dependent stimulation of Ephexin5 proteasomal
degradation. Consistent with this possibility we found that addition of the proteasome inhibitor
lactacystin to 293 cells leads to a reversal of the EphB-dependent decrease in Ephexin5 protein
levels, as measured by an increase in total ubiquitinated Ephexin5 (Figure 2.11G). In addition,
in neuronal cultures the EphrinB1 induced decrease in Ephexin5 protein expression is blocked if
the proteasome inhibitor lactacystin is added prior to EphrinB1 addition (Figure 2.11H).
Notably, in the presence of lactacystin, Ephexin5 is ubiquitinated, further supporting the idea that
Ephexin5 is degraded by the proteasome.
To test whether Ephexin5 is ubiquitinated in the brain, we incubated wild type or
Ephexin5-/-
brain lysates with α-C-E5 and after immunoprecipitation and SDS-PAGE, probed
with anti-ubiquitin antibodies. This analysis detected the presence of ubiquitinated species in α-
C-E5 immunoprecipitates prepared from wild type but not Ephexin5-/-
brain lysates (Figure
2.11I). These findings indicate that Ephexin5 is ubiquitinated in the brain.
We also found by yeast two-hybrid analysis that Ephexin5 binds Ubiquitin-B and
Ubiquitin-C proteins as well as several ubiquitin E2 family members (data not shown).

84
Moreover, the results of a recent unbiased screen for targets of the proteasome identified
Ephexin5 as one of several GEFs targeted by the ubiquitin proteasome (Yen et al., 2008). These
findings, taken together with the observations that Ephexin5 is ubiquitinated, and that lactacystin
treatment blocks the EphrinB1-induced decrease in Ephexin5 expression, suggests that EphB
induction of Ephexin5 Y361 phosphorylation triggers Ephexin5 degradation via the proteasome.
Given the role that Ephexin5 plays in suppressing excitatory synapse development, we next
sought to determine the mechanism by which EphrinB1/EphB-mediated Ephexin5 Y361
phosphorylation triggers Ephexin5 degradation.
EphB2-mediated degradation of Ephexin5 requires Ube3A
During proteasome-dependent degradation of proteins, specificity is conferred by E3
ligases or E2 conjugating enzymes that recognize the substrate to be degraded. The E3 ligase
binds to the substrate and catalyzes the addition of polyubiquitin side chains to the substrate
thereby promoting degradation via the proteasome (Hershko and Ciechanover, 1998). We
considered several E3 ligases that have recently been implicated in synapse development as
candidates that catalyze Ephexin5 degradation. One of these E3 ligases, Cbl-b, has previously
been implicated in the degradation of EphAs and EphBs (Fasen et al., 2008; Sharfe et al., 2003).
A second E3 ligase, Ube3A, has been shown to regulate synapse number. To determine if
Ube3A and/or Cbl-b catalyze Ephexin5 degradation we first asked if either of these E3 ligases
interacts with and degrades Ephexin5 in 293 cells. When these E3 ligases were epitope-tagged
and expressed in 293 cells together with Ephexin5 we found that Ephexin5 co-
immunoprecipitates with Ube3A but not with Cbl-b (Figure 2.13A). The co-
immunoprecipitation of Ube3A with Ephexin5 was specific in that Ube3A was not co-
immunoprecipitated with two other neuronal proteins, Ephexin1 or the transcription factor

85
MEF2. In a previous study we have shown that Ube3A binds to substrates via a Ube3A binding
domain (hereafter referred to as UBD (Greer et al., 2010). Using protein sequence alignment
programs, ClustalW and ModBase, we identified a UBD in Ephexin5, providing further support
for the idea that Ephexin5 might be a substrate of Ube3A (Figure 2.14). Consistent with this
hypothesis, we found that the level of Ephexin5 expression is reduced in 293 cells co-transfected
with Ube3A compared to cells co-transfected with Cbl-b (Figure 2.13B).
We asked if EphrinB1/EphB-mediated Ephexin5 degradation in neurons is catalyzed by
Ube3A. To inhibit Ube3A activity we introduced into neurons a dominant interfering form of
Ube3A (dnUbe3A) that contains a mutation in the ubiquitin ligase domain rendering Ube3A
inactive. We have previously shown that even though dnUbe3A is catalytically inactive it still
binds to E2 ligases and to its substrates and functions in a dominant negative manner to block the
ability of wild type Ube3A to ubiquitinate its substrates (Greer et al., 2010). We found that when
introduced into 293 cells dnUbe3A binds to Ephexin5 (Figure 2.13A). We also found by
immunofluorescence microscopy that when overexpressed in neurons, dnUbe3A, but not WT
Ube3A, blocks EphrinB1/EphB stimulation of Ephexin5 degradation (Figure 2.13C).
EphrinB1/EphB stimulation of Ephexin5 degradation was also attenuated when Ube3A
expression was knocked down by a shRNA that specifically targets the Ube3A mRNA (Figure
2.13D) (Greer et al., 2010)). Notably, the presence of the dnUbe3A did not affect Ephexin5
expression in neurons in the absence of EphrinB stimulation, suggesting that EphrinB
stimulation of Ephexin5 Y361 phosphorylation may be required for Ube3A-mediated
degradation of Ephexin5 (Figure 2.13D).
To determine if Ube3A-dependent degradation of Ephexin5 might be relevant to the
etiology of Angelman syndrome we asked if the absence of Ube3A in a mouse model of

86
Figure 2.13: EphB2-mediated degradation of Ephexin5 requires Ube3A
A) Immunoprecipitation with α-HA from 293 cell lysates previously transfected with various
combinations of overexpressing plasmids containing Ephexin1-Myc, Ephexin5-Myc, HA-
DNUbe3A, HA-MEF2A, HA-Cbl-b, and HA-Ube3A, followed by immunoblotting with α-HA or
α -Myc. Input protein levels and α-βactin loading control are shown (Bottom).
B) Lysates from 293 cells previously transfected with various combinations of overexpressing
plasmids containing Ephexin5-Myc, HA-Ube3A and HA-Cbl-b were immunoblotted with α-
Myc, α-HA, and α-βactin (loading control).

87
Figure 2.13 (continued):
C) Hippocampal mouse neurons were co-transfected with GFP and control, HA-DNUbe3A or
Ube3A-shRNA at DIV10. At DIV14, neurons were incubated with clustered Fc (-) or Fc-
EphrinB1 (+) for 30 minutes. Neurons were fixed and stained for Ephexin5 with α-N-E5 and
quantified according to methods. Quantification is of Ephexin5 staining intensity normalized to
Fc control. Error bars ± SEM; **p < 0.01, ANOVA.
D) Hippocampal mouse neurons were co-transfected with GFP and control, HA-Ube3A or HA-
DNUbe3A at DIV10. At DIV14 Neurons were fixed and stained for Ephexin5 and quantified
according to methods. Quantification is of Ephexin5 staining intensity normalized to control.
Error bars ± SEM; **p < 0.01, ANOVA.

88
Figure 2.13 (continued):
E) Ube3A wild type and maternal-deficient (Ube3A-m/+p
) mouse brains were lysed and
immunoblotted with α-N-E5, α-EphB2, α-MEF2, α-Actin (loading control), and α-Ube3A (Top).
Samples were normalized to α-Actin and quantified as described in methods (bottom). Error
bars ± SEM; *p<0.05, Mann-Whitney.
F) Brain lysates from WT and Ube3A-m/+p
were collected and treated similar to part E,
immunoprecipitated with α-C-E5 and immunoblotted with α-N-E5 and α-ub. Input protein levels
are shown (right).
G) Neurons from WT and Ube3A-m/+p
mice were dissociated, cultured and transfected with GFP
at DIV10. At DIV14, neurons were incubated with pre-clustered Fc or Fc-EphrinB1 (EB1) for
30 minutes. Neurons were fixed and stained for Ephexin5 with α-N-E5 and quantified according
to methods. Error bars ± SEM; **p<0.01.

89
Figure 2.14: Structure and alignment of Ephexin5 UBD
Schematic of Ephexin5 showing Dbl-homology (GEF) domain, PH domain, SH3 domain,
and Y361 phosphorylation site followed by location of predicted UBD. Comparing
Ephexin5 to HHR23A through protein sequence alignment programs, ClustalW
(http://www.ebi.ac.uk/Tools/clustalw2/index.html) and ModBase
(http://modbase.compbio.ucsf.edu/modbase-cgi/search_form.cgi), we identified a UBD in
Ephexin5, consistent with its predicted tertiary structure.

90
Angelman syndrome affects the level of Ephexin5 expression in the brain. We compared the
level of Ephexin5 protein expression in the brains of wild type mice to that expressed in the
brains of mice in which the maternally inherited Ube3A was disrupted (Ube3Am-/p+
). Because
the paternally inherited copy of Ube3A is silenced in the brain due to imprinting, the level of
Ube3A expression in Ube3Am-/p+
neurons is very low. We found that the level of Ephexin5
expression in the brains of Ube3Am-/p+
mice was significantly higher than that detected in the
brains of wild type mice (Figure 2.13E). Moreover, the level of ubiquitinated Ephexin5 in
brains of Ube3Am-/p+
mice was significantly reduced compared to the brains of littermate controls
(Figure 2.13F). In addition we found that when neurons from wild type and Ube3Am-/p+
brains
were cultured and then treated with EphrinB1 the level of Ephexin5 protein was reduced upon
EphrinB1 treatment in wild type but not in Ube3Am-/p+
neurons (Figure 2.13G). Taken together,
these findings suggest that in response to EphrinB treatment Ephexin5 is tyrosine phosphorylated
by an EphB-dependent mechanism, and that this leads to Ephexin5 degradation by a Ube3A-
dependent mechanism. If Ephexin5 degradation is disrupted due to a loss of Ube3A as occurs in
Angelman syndrome the result is an increase in Ephexin5 expression and a disruption of the
proper control of excitatory synapse number during brain development.
91
2.4 Discussion
Previous studies have revealed a role for EphrinB/EphB signaling in the development of
excitatory synapses (Klein, 2009). However, the regulatory constraints that temper EphB-
dependent synapse development so that excitatory synapses form at the right time and place, and
in the correct number were not known. In this study we identify a RhoA GEF, Ephexin5, which
functions to restrict EphB-dependent excitatory synapse development. Ephexin5 interacts with
EphB prior to EphrinB binding, and by activating RhoA serves to inhibit synapse development.
The binding of EphrinB to EphB as synapses form triggers the phosphorylation and degradation
of Ephexin5 by a Ube3A-dependent mechanism. The reduction in Ephexin5 expression may
allow EphB to promote excitatory synapse development by activating Rac and other proteins at
the synapse (Figure 2.15).
The findings that Ephexin5 functions to restrict excitatory synapse number suggests that,
even though EphBs promote excitatory synapse development, there are constraints on the
activity of EphB so that synapse number is effectively controlled. There are several steps in the
process of synapse development where Ephexin5 may function to restrict synapse number. One
possibility is that Ephexin5 functions early in development as a barrier to excitatory synapse
formation by activating RhoA and restricting the motility or growth of dendritic filopodia that
are the sites of contact by the presynaptic neuron. For example, by inhibiting dendritic filopodia
formation or motility, Ephexin5 may decrease the number of contacts the filopodia make with
the presynaptic neuron, thus resulting in the formation of fewer synapses. An alternative
possibility is that Ephexin5 functions to restrict synapse number later in development perhaps to
counterbalance the positive effects of EphB on Rac that promote dendritic spine development.

92
Figure 2.15: Model of EphB and Ephexin5-dependent synapse formation

93
Figure 2.15 (continued):
A) Ephexin5, via its RhoA GEF activity, restricts early spine and synapse formation along the
developing dendrite prior to the EphB-dependent phase of synapse development.
B) Presynaptic EphrinB on the incoming axon contacts postsynaptic EphB receptor tyrosine
kinases along the developing dendrite. Subsequent autophosphorylation of EphBs leads to the
tyrosine phosphorylation and the Ube3a-dependent degradation of Ephexin5 at nascent synaptic
sites. This allows EphB-mediated synapse formation to ensue, in part, through the recruitment
and activation of Rac GEFs.

94
An additional possibility is that Ephexin5 functions after excitatory synapse development as a
regulator of synapse elimination.
Our analyses of Ephexin5 function are most consistent with the possibility that Ephexin5
functions early in the process of synapse development. First, we find that Ephexin5 is expressed,
active, and bound to EphB prior to synapse formation. Second, the interaction of EphrinB with
EphB, a process that is thought to be an early step in excitatory synapse development, triggers
the degradation of Ephexin5. Third, our preliminary time-lapse imaging studies suggest that
Ephexin5 is localized to newly formed filopodia prior to synapse development where it appears
to restrict filopodia motility and growth (Margolis et al. unpublished). Thus, Ephexin5 might
function as an initial barrier to synapse formation until it is degraded upon EphrinB binding to
EphB.
It is possible that through its interaction with EphB, Ephexin5 marks the sites where
synapses will form, and that the degradation of Ephexin5 is a critical early step in excitatory
synapse development. While the mechanisms by which Ephexin5 is degraded are not fully
understood, our studies suggest that the phosphorylation of the N-terminus of Ephexin5 at Y361
triggers the Ube3A-mediated proteasomal degradation of Ephexin5. One possibility is that prior
to Y361 phosphorylation the N- and C-terminal portions of Ephexin5 interact, thereby protecting
Ephexin5 from degradation. The phosphorylation of Ephexin5 at Y361 may relieve this
inhibitory constraint allowing for Ephexin5 ubiquitination and degradation. A similar
mechanism has been shown to regulate the activation of the Rac GEF Vav, (Aghazadeh et al.,
2000)). During EphrinA/EphA signaling it has been proposed that Vav-mediated endocytosis of
the EphrinA/EphA complex may allow the conversion of the initial adhesive interaction between
EphrinA and EphA-expressing cells into a repulsive interaction that result in growth cone

95
collapse and axon repulsion. It is possible that Ephexin5 has a related function during EphB
signaling at synapses. Typically the EphrinB/EphB interaction is thought to be repulsive. This
has been documented in studies of EphB’s role in the process of axon guidance (Egea and Klein,
2007; Flanagan and Vanderhaeghen, 1998). However, during synapse development the
EphrinB/EphB interaction is thought to result in synapse formation, a process that requires an
interaction between the developing pre- and post-synaptic specialization. One possibility is that
when EphrinB and EphB mediate the interaction between the incoming axon and the developing
dendrite, the interaction is facilitated by the degradation of Ephexin5. Since Ephexin5 is a RhoA
GEF, its presence might initially lead to repulsion between the incoming axon and the dendrite.
However, the EphB-dependent degradation of Ephexin5 might convert this initial repulsive
interaction into an attractive one.
The finding that Ube3A is the ubiquitin ligase that controls EphB-mediated Ephexin5
degradation is of interest given the role of Ube3A in human cognitive disorders such as
Angelman syndrome and autism. The absence of Ube3A function in Angelman syndrome would
be predicted to result in an increase in Ephexin5 protein expression, and thus a decrease in
EphB-dependent synapse formation. Consistent with this possibility, we find in a mouse model
for Angelman syndrome that the level of Ephexin5 protein expression is elevated and that in
response to EphrinB treatment, Ephexin5 is not degraded. Likewise, several studies have
indicated that synapse development and function is disrupted in these mice (Cooper et al., 2004;
Dindot et al., 2008; Jiang et al., 1998; Yashiro et al., 2009).
The recent finding that the Ube3A gene lies within a region of chromosome 15 that is
sometimes duplicated in autism raises the possibility that altered levels of Ephexin5 and the
resulting defects in excitatory synapse restriction might also be a mechanism relevant to the

96
etiology of autism (Glessner et al., 2009). If this is the case, a possible therapy for treating
autism might be to reduce the level of Ube3A activity, and thus increase the level of Ephexin5
expression. It is important to consider that in addition to Ephexin5, Ube3A regulates the
abundance of other synaptic proteins. Therefore, the ultimate effect of the aberrant expression of
Ephexin5 and other Ube3A substrates on synapse development and function will require further
study. It seems likely that such studies will provide further understanding of the development of
human cognitive function and new insights into how this process goes awry in disorders such as
Angelman syndrome and autism.

97
2.6 Materials and Methods
DNA Constructs
The full-length mouse Ephexin5 was generated by RT-PCR from RNA isolated from
mouse E16 cortical neurons at 7 days in vitro and subcloned into EcoRI/XhoI sites of the pEF1-
Myc-HisA vector (Invitrogen). Ephexin5 GEF and phosphorylation mutants (LQR, QSRL, and
Y361F) were generated using the QuickChange site-directed mutagenesis kit (Stratagene). All
constructs were verified by DNA sequencing. The following plasmid constructs have been
described previously: Flag-EphB2, Flag-EphB2KD, Flag-EphB2 Cyto (Dalva et al., 2000),
Ephexin1-Myc (Sahin et al., 2005), HA-Ube3A (Greer et al, 2010), HA-Mef2 (Flavell et al.,
2006), HA-Cbl-b (Cowan et al., 2005), eGFP (Paradis et al., 2007), Cre-recombinase (Lin et al.,
2008). The pLenti-Lox-Ephexin5 RNAi constructs were designed as previously described.
Briefly, the following oligonucleotides were annealed with their complimentary sequence and
inserted into the BglII site of pLenti-Lox vector: TAGCCGCCTTATGGATACAAA and
TCCGAAAGCACTTCCTCAAAT (Figure S2). These regions were not homologous to
Ephexin1 or any other known genes as indicated by Blast search.
Generation of Ephexin5−/−
Mice
An Ephexin5 targeting vector was electroporated into 129 J1 ES cells, and positive clones
were identified by Southern hybridization with two separate probes. To obtain constitutive
deletion of the Ephexin5 exons, a Cre-recombinase expressing plasmid (pOG231Cre or pMC-
CreN) was electroporated into ES cells carrying the homologous recombination. Constitutive
knockout and conditional floxed ES cells were identified by replicate plating for G418 sensitivity
98
followed by Southern hybridization and genomic PCR. Positive clones were grown without
G418 and expanded for genotyping.
Antibodies
The following rabbit polyclonal antibodies were generated against the indicated amino
acids of mouse Ephexin5 and then affinity purified: α-N-E5 was raised against a GST-fusion
protein containing amino acids 1-418. α-C-E5 was raised against a C-terminal peptide sequence
corresponding to amino acids 720-732 (EHERRKHLRQHUK). -α-p361 was raised against a
peptide sequence corresponding to amino acids 354-368 (PLQDEPLpYQTYRAAV), in which
tyrosine residue 361 was phosphorylated (denoted as pY in peptide sequence). The specificity of
the Ephexin5 antibodies was tested by western blotting using brain lysates from WT and
Ephexin5 knockout littermates. Rabbit polyclonal α-EphB2) and anti-phospho-Eph (α-pEph)
were used as previously described (Dalva et al., 2000). The following antibodies are
commercially available and used according to manufacturer’s suggestions for western blotting,
immunocytochemistry and immunoprecipitations: α-Myc (Abcam), α-Flag (Sigma), α-RhoA
(Santa Cruz Biotechnology), goat α-EphB2 (Santa Cruz), α-Rac1 (Millipore), α-Cdc42
(Millipore), α-β-actin (Abcam), α-PSD95 (ABR Affinity Bioreagents), αSynapsin (Chemicon),
α-HA (Santa Cruz Biotechnology), α-pan-phosphotyrosine 4G10 (Millipore), α-ubiquitin
(Biomol International), and α-E6AP (Ube3A) (Biomol).
Mice, Cell culture, Transfections, and Ephrin stimulations
Ube3a knockout mice were obtained from The Jackson Laboratory, strain 129-
Ube3atm1Alb
/J, from stock number 004477. HEK293T cells were cultured in DMEM
supplemented with 10% fetal bovine serum, 2 mM glutamine (Sigma), and

99
penicillin/streptomycin (100 U/mL and 100 µg/mL, respectively; Sigma). Rat hippocampal
neurons were prepared from E18 Long-Evans rat embryos (Charles River) as previously
described (Xia et al., 1996). Mouse hippocampal neurons were prepared from E16 C57/B6
mouse embryos as previously described (Tolias et al., 2005). Hippocampal neurons were
maintained in Neurobasal Medium (Invitrogen) supplemented with 2% B27 (Invitrogen),
penicillin/streptomycin (100 U/mL and 100 µg/mL, respectively), and 2 mM glutamine. For
synapse assays using immunofluorescence staining, hippocampal neurons were plated on glia
isolated as previously described (Flavell et al., 2006). Organotypic hippocampal slice cultures
were prepared from P6 Ephexin5 conditional mice as previously described (Stoppini et al.,
1991). Slices were biolistically transfected with a Helios Gene Gun (Biorad) after 2 days. Bullets
for the gene gun were 1.6-μm gold particles coated with 15 μg eGFP and 30 μg Cre. Empty
vector plasmid was added to bring the total DNA to 60 μg in each case. Cultures were fixed,
stained, and quantified for spine number at DIV6. HEK293T cells were transfected for 24 or 48
hours using the calcium phosphate method as previously described (Lois et al., 2002).
Dissociated neurons were transfected using the Lipofectamine method (Invitrogen)
according to the manufacturer’s suggestions. For Ephrin stimulations in dissociated cultured
neurons, mouse EphrinB1-FC (1µg/µL; R & D Systems) was pre-clustered with goat anti-human
IgG FC (1.3 µg/µL; Jackson Immunoresearch) at room temperature in 1x PBS in a 1:3 ratio prior
to stimulation. Pre-clustered EphrinB1-FC was added to Neurobasal/B27 medium at 5 µg/mL
and applied to cultured neurons. For controls, clustered goat anti-human IgG FC in
Neurobasal/B27 was applied to neurons.
100
Cell lysis, immunoprecipitations, GEF pulldown assays and western blots
Whole rat or mouse brains or cultured cells were collected and homogenized in RIPA
buffer (50 mM Tris pH 8.0, 150 mM NaCl, 1% Triton X-100, 0.5% Sodium Deoxycholate, 0.1%
SDS, 5 mM EDTA, 10 mM NaF, complete protease inhibitor cocktail tablet (Roche), 1 mM
sodium orthovanadate, 1 mM β-glycerophosphate). For time course studies, hippocampus was
freshly dissected out of whole brain and homogenized as described above. For
immunoprecipitations, cells were lysed in RIPA buffer and centrifuged at 50,000 x g.
Supernatants were incubated with appropriate antibody (1-3 µg) for 2 hours at 4 °C, followed by
addition of Protein-A or Protein-G beads (Santa Cruz Biotechnology) for 1 hour, and washed
three times with ice-cold RIPA buffer. For the phosphotyrosine detection experiment in
HEK293T cells, samples were boiled for 10 minutes in 1% SDS buffer to disrupt the
Ephexin5/EphB2 interaction and diluted 1:5 in 1.25X RIPA buffer prior to immunoprecipitation
of Ephexin5-Myc. RBD and PBD pulldown assays were conducted according to the
manufacture’s suggestions (Upstate Cell Signaling Solutions). Briefly, HEK293T cells were
grown to ~60% confluence, transfected with plasmids for 48 hours, lysed in Mg2+
/lysis buffer
(25 mM HEPES pH 7.5, 125 mM NaCl, 1% NP-40, 10 mM MgCl2, 1mM EDTA, and 10%
glycerol supplemented with complete protease inhibitor tablets from Roche), and incubated with
either RBD or PBD agarose for 45 minutes at 4 degrees. For western blots, samples were boiled
for 5 minutes in SDS sample buffer, resolved by SDS PAGE, transferred to nitrocellulose, and
immunoblotted.

101
In situ hybridization
To generate probes for in situ hybridization, mouse Ephexin5 and EphB2 cDNA were
subcloned into pBluescript II SK (+). Bluescript plasmids containing Ephexin5 or EphB2 cDNA
were linearized using the restriction enzyme BssHII. Sense and antisense probes were generated
using DIG RNA labeling mix (Roche) according to manufacturer’s instructions. Full-length
DIG-labeled probes were subjected to alkaline hydrolysis as previously described (Wiemers and
Gerfin-Moser, 1993). Probe sizes were checked by running non-hydrolyzed and hydrolyzed
probes on a 1% formaldehyde agarose gel. In situ hybridization was performed as previously
described (Schaeren-Wiemers and Gerfin-Moser, 1993). Briefly, P10 whole brains were
embedded in Tissue-Tec and kept at -20 °C. Tissue sections 14 µm-thick were sectioned onto
Superfrost Plus Slides (Merck), fixed for 10 minutes with 4% paraformaldehyde in PBS, and
subsequently washed 3 times in PBS. Acetylation of tissue sections was performed for 10
minutes with constant stirring in glass staining jars, and subsequently washed 3x with PBS.
Slides were incubated with pre-hybridization solution (50% formamide, 5x SSC, 5x Denhardts
solution (Sigma), Yeast tRNA) at room temperature for 6 hours to overnight. DIG-labeled
probes were hydrolyzed in an alkaline hydrolysis buffer as previously described (Schaeren-
Wiemers and Gerfin-Moser, 1993). Probes were diluted in pre-hybridization buffer at a
concentration of 200 ng/mL and denatured for 5 minutes at 85 °C prior to hybridization. Slides
were incubated in 100 µL, covered by plastic coverslips (Invitrogen), and hybridization was
performed overnight at 72 °C. Color reaction was performed as previously described (Schaeren-
Wiemers and Gerfin-Moser, 1993), except a BCIP/NBT mixture (Roche) was used according to
manufacturer’s instructions. Slides were mounted in Slowfade Gold antifade reagent with DAPI
(Invitrogen) and covered with Glass Coverslides (Fisher). Sections were imaged using a Zeiss
102
Imager.Z1 microscope with a Photometrics CoolSNAP HQ2 camera on a PLAN APO 63x/1.4
objective.
Immunocytochemistry
Neurons were fixed for 8 minutes at 25 °C with 4% paraformaldehyde/4% sucrose in
PBS. For synapse density measurement, fixed neurons were incubated with α-PSD-95 and α-
Synapsin antibodies (1:200 each) in 1× GDB (30 mM phosphate buffer [pH 7.4] containing 0.2%
gelatin, 0.3% Triton X-100, and 0.8 M NaCl) overnight at 4 °C. Goat α-mouse Cy3 and goat α-
rabbit Cy5 (1:200 each in 1× GDB for 1 hour at 25 °C) antibodies were used to visualize the
primary antibodies. For protein co-localization experiments fixed neurons were similarly treated
using α-EphB2 antibodies raised in goat (1:200) and the rabbit anti-N-terminal Ephexin5
antibodies (1:200) or α-pY361-Ephexin5. For over-expression studies, transfected neurons were
fixed and stained as described above using α-Myc and α-N-terminal Ephexin5 antibodies to
visualize overexpressed Ephexin5 protein in the context of the GFP-labeled neurons to visualize
the localization of Ephexin5 protein. Samples on coverslips were mounted on glass slides using
Fluoromount-G (Southern Biotech). Neurons were imaged using a laser scanning Zeiss Pascal
microscope.
Synapse Assays
Our method for introducing shRNAs results in the transfection of a low percentage of the
neurons, thus facilitating quantification of the number of synapses/dendritic spines that are
present on the transfected neuron (Paradis et al., 2007). The number of dendritic spines that are
present on a shRNA-expressing neuron was quantified by first marking each dendritic spine
found on the developing dendrites of the transfected neuron and then using MetaMorph analysis
103
tools to tally the number of marked spines that were present on a given length of dendrite. The
number of excitatory synapses that are present on a shRNA-expressing neuron were determined
by staining with the postsynaptic excitatory synaptic marker PSD-95 and the presynaptic
excitatory synaptic marker Synapsin. Using MetaMorph analysis tools, we quantified the
number of overlapping pre- and post-synaptic puncta on the transfected green fluorescing neuron
to determine excitatory synapse density.
Image analysis and quantification
For dissociated neurons, images were obtained using a Zeiss Pascal confocal microscope,
using a 63× objective with sequential acquisition settings at 1024 × 1024 pixel resolution.
Images for the colocalization analysis were taken with the same exposure parameters. On
average, 5 stacks at 0.5 µm were taken for each neuron image. Images were collected from 10 to
15 neurons per coverslip, with two coverslips required for each condition. Synapse density was
measured using Metamorph software as previously described (Universal Imaging Corporation)
(Paradis et al., 2007). Because synapse density and immunostaining vary significantly between
experiments, it was necessary to normalize each experiment before combining the data from
individual experiments. Normalization and error propagation were performed as previously
described (Paradis et al., 2007). The number of overlapping red and blue puncta greater than 2
pixels in size and localized to the transfected neuron was divided by the total dendritic area being
measured. For Ephexin5 levels, the total intensity of Ephexin5 puncta over the area of the neuron
was used to determine the density of Ephexin5 expression in the neuron. Statistical significance
was determined by Student’s t test.

104
For dendritic spine assays, a z series projection of each neuron was made using
approximately six sections (0.45 μm/section), each averaged four times. To measure spine
density, an experimenter blinded to the condition measured at least three dendritic segments
totaling at least 200 μm of dendritic length/neuron, and the number of spines was counted.
Between eight and ten transfected neurons were chosen randomly for quantification per
experiment, and several pairs of littermates were quantified individually. For quantification of
spine size, images blinded to the experimenter were analyzed using Metamorph (Universal
Imaging Corporation) by manually tracing the length for at least 1000 spines per animal (Pak et
al., 2001). Statistical significance was calculated using Student’s t test or ANOVA. For
densitometry measurements we analyzed western blots in the linear range using ImageJ. Each
western lane is normalized to loading controls.
Array Tomography
Array tomography was performed as described previously (Micheva and Smith, 2007).
In summary, acute hippocampal slices (300 μm thick) were fixed in 4% paraformaldehyde for 1
hour at room temperature and embedded in LR White resin using the benchtop protocol.
Ribbons of between 30-50 serial 100 nm-thick wild type sections prepared from wild type and
Ephexin5 mutant mice were mounted side by side on subbed glass coverslips. Coverslips were
immunostained with α-synapsin1 (ms, Chemicon, 1:100) and α-PSD95 (Rb, ABR Affinity
Bioreagents, 1:100) antibodies as described. Serial sections were imaged using a Zeiss
Imager.Z1 microscope with a Photometrics CoolSNAP HQ2 camera on a PLAN APO 63x/1.4
objective. Tissue volumes were aligned using ImageJ (NIH) with the multistackreg plugin (Brad
Busse). Reconstructed tissue volumes were cropped to include only stratum radiatum of CA1;
and, three dimensional models of the synaptic puncta were built using Bitplane Imaris and
105
analyzed using custom software to count synapses. This software computes the distance from
the center of every synapsin puncta to the center of every PSD-95 puncta, and a synapse was
counted if the distance between the centers was equal to or less than the sum of the radii of the
two puncta plus an empirically determined scaling factor of 0.15 μm. All experiments were
carried out and analyzed blinded to genotype.
Electrophysiology
Whole-cell voltage clamp recordings were obtained using an Axopatch 200B amplifier at
25 °C. Rat hippocampal neurons were transfected with 250 ng of eGFP and 25 ng of shRNA to
Ephexin5 or scrambled shRNA as a control. Four days after transfection, neurons were perfused
with artificial cerebrospinal fluid containing 127 mM NaCl, 25 mM NaHCO3, 1.25 mM
Na2HPO4, 2.5 mM KCl, 2 mM CaCl2, 1 mM MgCl2, 25 mM glucose, and saturated with 95% O2,
5% CO2. The internal solution for mEPSC analysis contained 120 mM cesium methane
sulfonate, 10 mM HEPES, 4 mM MgCl2, 4 mM Na2ATP, 0.4 mM Na2GTP, 10 mM sodium
phosphocreatine and 1 mM EGTA. Osmolarity and pH were adjusted to 300 mOsm and 7.3 with
Millipore water and CsOH, respectively.
The mEPSCs were isolated by exposing neurons to 0.5 µM tetrodotoxin, 50 µM
picrotoxin (Tocris Bioscience), and 10 µM cyclothiazide. Cells with series resistance larger than
25 MΩ during the recordings were discarded. Data were analyzed in IgorPro (Wavemetrics)
using custom-written macros. For each trace, the event threshold was set at 1.5 times the root-
mean-square current. Currents were counted as events if they crossed the event threshold, had a
rapid rise time (1.5 pA ms-1
) and had an exponential decay (τ <50 ms for mEPSC).

106
Statistical significance was determined by two methods. First, 50 random points selected
from each cell were concatenated to describe the cumulative distributions of events in each
condition and then compared by a Kolmogorov–Smirnov test. Second, a Monte Carlo simulation
was performed in which points were randomly sampled from each condition and the mean of
these samples compared at least 1,000 times. P<0.05 from both tests was considered significant.

107
Chapter 3
Human ArhGEF15/Ephexin5 mutations in epileptic encephalopathy

108
3.1 Abstract
Infantile seizures are often the most difficult to control and can be associated with
cognitive impairments and motor deficits. Whole exome sequencing has proven to be a useful
and efficient tool to identify de novo mutations in protein coding exons from individuals with
infantile epileptic encephalopathies. Our collaborators identified a mutation in the human
homolog of Ephexin5 (Arhgef15) at Arg.604.Cys (R604C). Clinical features of this individual,
known as Proband G, include infantile spasms, epileptic encephalopathy, motor delay and
emotional lability. Overexpression of human ArhGEF15-R604C cDNA, and the homologous
mutation in mouse, Ephexin5-R612C, results in a 45-50% reduction in guanine nucleotide
exchange activity (GEF) towards RhoA. Since R604C is a de novo human mutation that only
affects one allele, and since the major protein function of Ephexin5 is its GEF activity, we
reasoned that Ephexin5 heterozygote mice (Ephexin5 +/-) would be a useful model for epilepsy
associated with the Arhgef15 mutation. Indeed, Ephexin5 +/- mice are more susceptible to
audiogenic seizures. We also find that Ephexin5 +/- mice have increased anxiety in both the
light dark box and the elevated plus maze, consistent with comorbid clinical features such as
emotional lability. Taken together, we suggest that studying Ephexin5 signaling will be a useful
tool for understanding the wide array of synaptic deficits associated with epilepsy.
109
3.2 Background and Rationale
Epilepsy is a disorder characterized by recurring seizures of heterogenous origin.
Approximately one quarter of all seizures are caused by brain lesions coming from hypoxic
injury, trauma, tumors, or drug misuse (Meisler et al., 2010). It is estimated that the majority of
seizures have a genetic origin (Meisler et al., 2010). Despite the identification of some of these
genes, in many cases the underlying genetic perturbations are still unknown. Two major goals of
epilepsy research are to identify all candidate genes in order to create a rapid screening platform
for diagnosis, and to elucidate the mechanisms of how these genes contribute to underlying
cellular processes (Bamshad et al., 2011; The Epi4K Consortium, 2012).
Next generation sequencing has made it possible to identify candidate genetic loci that
contribute to epileptic disorders. 323 genes have been identified that are mutated in epilepsy as
the primary phenotype or as a phenotype associated with other neurological diseases (Lemke et
al., 2012). Because of this heterogeneous genetic contribution, epilepsies are often associated
with cognitive impairment, ataxia, or autism as comorbid phenotypic features.
The most common genetic cause of de novo and inherited epilepsy are mutations in the
voltage-gated sodium channel gene, SCN1A (Meisler et al., 2010). SCN1A protein is highly
enriched in GABAergic interneurons, and mutations in these neurons are hypothesized to disrupt
action-potential firing properties by reducing the sodium conductance, which increases overall
net excitation (Meisler et al., 2010). More than 80% of SCN1A mutations are found in
individuals with Dravet Syndrome, a disorder characterized by severe intractable seizures
starting in infancy. Comorbid features of Dravet syndrome include sleeplessness, ataxia, delayed
language, and cognitive impairments (Marini et al., 2011). Mouse models of Dravet syndrome
110
(i.e., Scn1a heterozygotes) have spontaneous seizures and autistic-like features consistent with
the human disorder (Han et al., 2012; Marini et al., 2011). Similar to Scn1a, it is hypothesized
that most genes implicated in epilepsy alter the balance of neuronal excitation/inhibition (E/I),
resulting in a hyperexcitable neuronal circuit (Meisler et al., 2010).
Scn1a is one of 30 known protein-coding genes mutated in a phenotypic class of epilepsy
known as infantile epileptic encephalopathies (Meisler et al., 2010; Lemke et al., 2012). These
genes include transcriptional regulators such as FoxG1, Pnkp andMeCP2, cell-adhesion
molecules such as neurexin1 and Cntnap2, the presynaptic-release machinery molecule Stxbp1,
and cytosolic enzymes such as ArhGEF9, Ube3a, and Mapk10 (Lemke et al., 2012). Recently,
our collaborators identified three new genes mutated in infantile epilepsy (Veeramah et al.,
2013).
Here we report the identification and analysis of a mutation in the guanine-nucleotide
exchange factor (GEF) ARHGEF15/Ephexin5, a negative regulator of synapse development.
We find that this mutation leads to a reduction in RhoA GEF activity, without altering protein
stability. Ephexin5 heterozygote mice display increased susceptibility to seizures and increased
anxiety-like behaviors. Taken together, we suggest that studying Ephexin5 signaling in more
detail will be important for understanding the wide array of synaptic deficits associated with
epilepsy.

111
3.3 Analysis of a de novo mutation in human Ephexin5
Our collaborators at the University of Arizona employed whole exome sequencing to
screen individuals with intractable infantile epilepsies (Probands A-J) and their unaffected
parents (Veeramah et al, 2013). A de novo mutation in Arhgef15, the human homolog of
Ephexin5, was identified. This individual, known as Proband G, had complex, infantile seizures
that were difficult to control with drug interventions. Comorbid clinical features include
infantile spasms, mild motor and speech delay, emotional lability, and compulsive behavior
(Table 3.1).
Proband G possesses a de novo non-synonymous mutation in the gene Rho Guanine
Nucleotide Exchange Factor 15 (ARHGEF15), a human homolog of mouse Ephexin5, resulting
in an Arg604Cys substitution in the protein. Ar604 is conserved in the mouse genome at
Arg.612 and a number of other closely related species (Figure 3.1). While an Ephexin5
mutation has not previously been associated with a human disease, Ephexin5 is highly expressed
in the brain (Sahin et al., 2005) and was recently shown to negatively regulate excitatory synapse
formation during development (Margolis et al., 2010). In particular, Ephexin5 suppresses the
function of EPH receptor B2 (EphB2), a mechanism believed to limit uncontrolled synapse
formation. When EphB2 encounters its ligand Ephrin-B1/2, Ephexin5 is phosphorylated,
ubiquitinated and finally degraded, allowing synapse formation to occur. The process of
degradation is mediated by ubiquitin protein ligase E3A (UBE3A). Interestingly, 90% of patients
diagnosed with Angelman Syndrome, which is highly associated with seizures, lack expression
of UBE3A (Dan, 2009). It has been suggested from studying Angelman Syndrome mouse
models that one mechanism of the disorder is due to a lack of degradation of Ephexin5 by
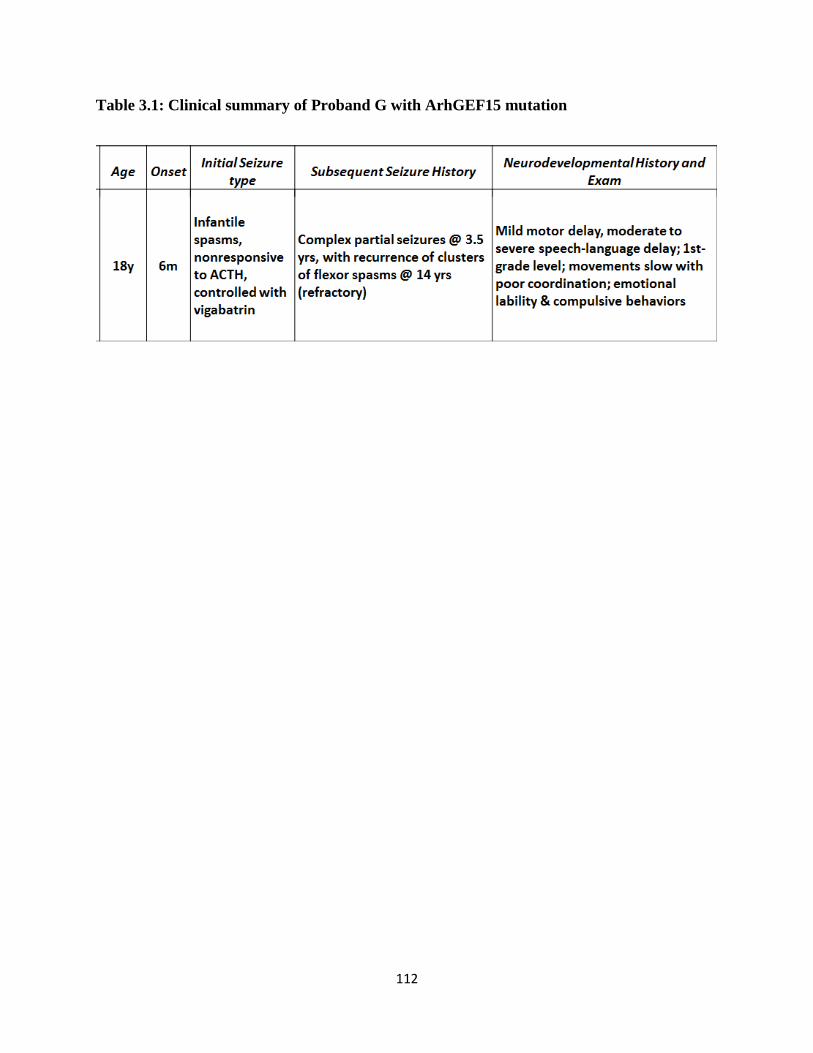
112
Table 3.1: Clinical summary of Proband G with ArhGEF15 mutation

113
Figure 3.1: Human Ephexin5 protein alignment reveals conserved site at Arg.604
ClustalW protein alignment reveals conservation across multiple species of amino acid position
Arg.604 (red rectangle) in human Ephexin5 protein.

114
UBE3A, which leads to a decrease in synaptic formation (Margolis et al., 2010).
Ephexin5’s GEF exchange activity is required to restrict synapse formation (Margolis et
al., 2010; Chapter 2). Since Ephexin5 was previously shown to promote the activation of the
small GTPase RhoA, we hypothesized that a de novo mutation in Ephexin5 may disrupt its GEF
exchange activity towards RhoA. To test this we cloned an Ephexin5 human cDNA containing
the p.Arg604Cys substitution (R604C). We transfected 293 cells with a control plasmid, a
plasmid driving the expression of wild-type (WT) human Ephexin5, or a plasmid driving the
expression of mutant R604C. We prepared extracts from transfected cells, and subjected them to
a calorimetric-based G-LISA RhoA activation assay. We find that RhoA activation by R604C is
reduced by ~46% compared to WT-Ephexin5 (Figure 3.2A). We also find that the homologous
amino acid substitution in mouse Ephexin5 at Arg612Cys (R612C) shows a ~47% reduction as
compared to mouse WT-Ephexin5 protein (Figure 3.2B). As an alternative approach, we lysed
293 cells transfected with control plasmid, WT-Ephexin5 plasmid, or R612C plasmid, and
incubated the lysates with GST-Rhotekin-binding-domain (RBD) agarose. Active RhoA was
determined by immunoblotting the RBD pulldowns with an antibody to RhoA. Lysates from
overexpressed R612C had reduced RhoA activity compared to WT-Ephexin5 (Figure 3.3)
Importantly, we did not detect differences in mutant protein expression compared to the WT
protein in these 293 cell lysates (Figure 3.2C and 3.2D), suggesting that the de novo mutation
causes a deficit in GEF exchange activity, and not protein stability. Taken together, we conclude
that the human R604C mutation may lead to decreased Ephexin5 GEF activity resulting in an
increase in excitatory synapse number in the brain which could be an underlying cause of the
seizures observed in Proband G. It is important to note that Proband G also possesses a
frameshift de novo mutation in the gene HADHB, which is known to cause mitochondria

115
Figure 3.2: De novo Arg to Cys mutations in Ephexin5 reduce RhoA GEF activity
A) Lysates from 293 cells transfected with control plasmid, human WT-Ephexin5, and R604C
were subjected to the G-LISA activation assay. Error bars indicate SEM (n=4) *p < .01,
Student’s T-test.
B) Mouse WT-Ephexin5 and R612C were assayed for RhoA activation similar to A). Error bars
indicate SEM (n=3) *p < .05, Student’s T-test.
C) Representative quantitative Western Blot using LiCor Odyssey IR software from lysates used
in A) and B). Protein samples were run on an SDS-PAGE gel and Ephexin5 protein was
detected using a rabbit polyclonal antibody raised against the N-terminus.
D) Western Blot quantification for all samples. Error bars indicate SEM (n=4 per human
conditions; n=3 per mouse conditions), p > .05, Student’s T-test

116
Figure 3.3: Ephexin5-R612C has reduced RhoA GEF activity by RBD pulldown.
A) HEK 293 cells were transfected with control, WT-Ephexin5, or R612C plasmids. Cell
lysates were incubated with GST-RBD agarose. RBD pulldowns were immunoblotted with α-
RhoA. Total levels of transfected Ephexin5, and RhoA were assessed with α- N-E5, and α-
RhoA, respectively. Representative image.
B) Quantification of A from 3 independent experiments expressed as fold-change over control.
Immunoblot signals were quantified by densitometry and normalized to total RhoA levels. p <
.01, Student’s T-test.

117
trifunctional protein (MTP) deficiency when found in simple homozygous or compound
heterozygous form (Park et al., 2009). However, there were no other variants found in this trio in
HADHB, suggesting that this is not a causative mutation.
We have begun to search for additional rare and pathogenic Arhgef15/Ephexin5 variants
in individuals with epileptic encephalopathies in collaboration with Dr. Poduri at Children’s
Hospital Boston. Poduri and colleagues have access to a list of sequenced genomes from
individuals with epileptic encephalopathies both at Children’s Hospital and part of the Epi4K
consortium, whose stated goal is to sequence at least 500 individuals. Thus far, we have
identified two additional putative Ephexin5 variants (verified by Sanger sequencing) in cases
where the genetic etiology was unknown. One rare variant at Arg.546Pro (R546P) is mutated in
an individual with migrating partial epilepsy. It is a highly conserved amino acid, and predicted
to be deleterious using SIFT software (Poduri, personal communication). It is not clear whether
this variant is a sporadic, de novo mutation because the parental DNA has not been sequenced.
R546P is in the RhoGEF domain and in fact, is the amino acid adjacent to the CR3 domain
predicted to be important for all GTPase interactions (see Section 1.5). This variant is a rare
SNP (<.1% of the control population), however this individual has no other obvious alternate
explanations in known disease-causing genes. The second variant at Arg.105.Gln (R105Q) is
from a girl with autism and early onset epilepsy that resolved. In this case, the variant was
paternally inherited, but given the patient’s mild presentation, the possibility of this variant being
a causative mutation remains open. Interestingly, R105Q lies two amino acids upstream of a
novel, developmentally regulated phosphorylation site at serine-107 (see Chapter 4).
Phosphorylation at S107 is predicted to be a recognition site for the basophilic kinase protein
kinase A (PKA) and mutating this critical Arg residue would inhibit phosphorylation. Therefore,

118
it is worth investigating whether the R105Q variant works in concert with Ephexin5 serine
phosphorylation to regulate aspects of GEF activity and synapse development.

119
3.4 Behavioral mouse model of epilepsy and comorbidity: analysis
of Ephexin5 +/- mice
R604C is a de novo human mutation that only affects a single allele, and since the major
protein function of Ephexin5 is its GEF activity, we reasoned that Ephexin5 heterozygote mice
(Ephexin5 +/-) would be a useful model for epilepsy associated with the Arhgef15 mutation.
Similar haploinsuffiency mouse models have proven useful in elucidating mechanisms in Scn1a
+/- mice (Han et al., 2012; Marini et al., 2011).
First, we sought to determine if Ephexin5 +/- mice are susceptible to seizures.
Audiogenic-induced seizures (AGS) were conducted on P30 Ephexin5 +/- mice and their wild-
type (WT) littermates. Ephexin5 +/- mice take approximately 2.5x longer to recover from AGS
than their WT littermates (Figure 3.4), suggesting that Ephexin5 +/- mice have an increased
susceptibility to seizures.
We were also interested in the comorbid features associated with the Arg.604.Cys
Arhgef15 mutation. In particular, Proband G displayed emotional lability, language and speech
delay, and poor coordination. Emotional lability has previously been related to anxiety-related
behaviors in mouse models (Wei et al., 2004). Ephexin5 +/- mice display an increase in the time
spent in the open arms (Figure 3.5A) compared to WT littermate controls. They also display an
increase in number of open arm entries compared to WT littermate controls (Figure 3.5B).
Next, as an independent means of assessing anxiety, Ephexin5 +/- were assayed in the light/dark
box. Ephexin5 +/- display a reduction in the time spent in the light compared to their WT
littermates (Figure 3.5C). Taken together, these data suggest that Ephexin5 +/- have increased
anxiety-related phenotypes that model emotionally labile behaviors observed in Proband G.
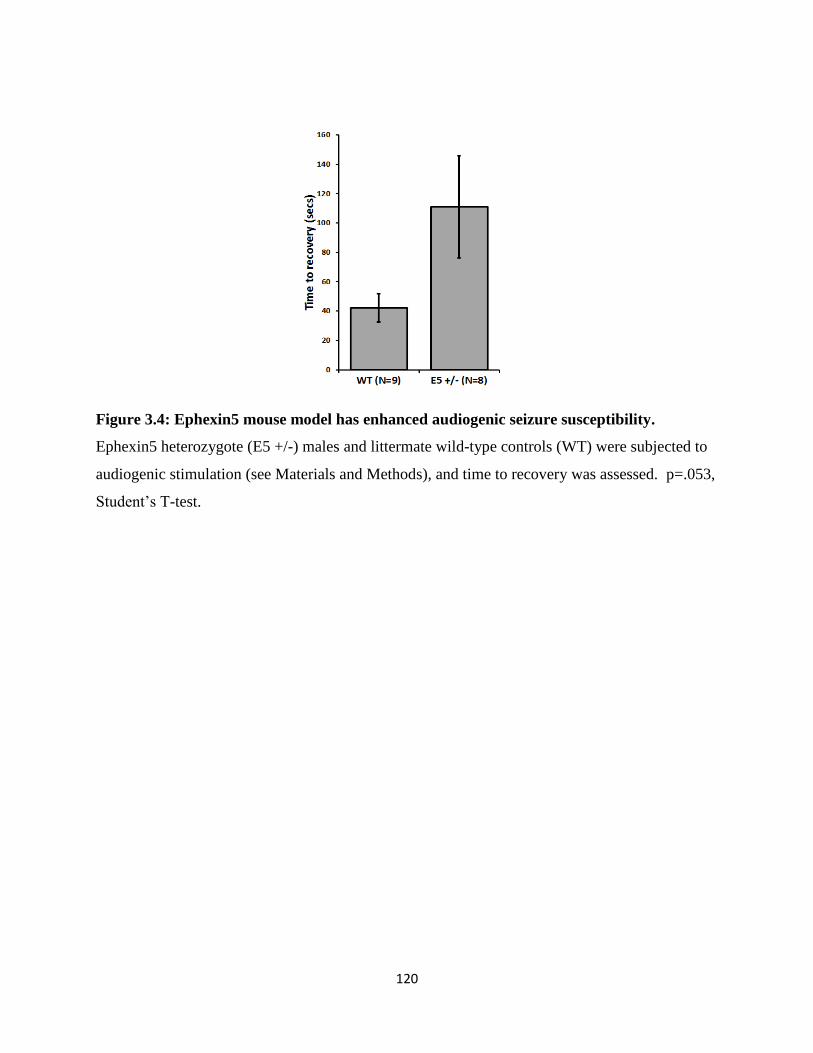
120
Figure 3.4: Ephexin5 mouse model has enhanced audiogenic seizure susceptibility.
Ephexin5 heterozygote (E5 +/-) males and littermate wild-type controls (WT) were subjected to
audiogenic stimulation (see Materials and Methods), and time to recovery was assessed. p=.053,
Student’s T-test.

121
Figure 3.5: Increased anxiety in Ephexin5 mouse model
A) Elevated plus maze for Ephexin5 +/- (n=11) and WT (n=8) littermate controls. Total time
spent in open arms is displayed, Student’s T-test, *p < .05
B) Same as A) except the number of open arm entries was assessed, Student’s T-test, *p < .05
C) Light/Dark Box for Ephexin5 +/- (n=10) and WT (n=9) littermate controls. Total time spent
in light was assessed, *p<.05, Student’s T-test
122
3.5 Discussion
We have analyzed a mutation found in an individual with infantile epileptic
encephalopathy. This mutation resides in the RhoGEF domain of Arhgef15/Ephexin5 and
reduces guanine nucleotide exchange activity towards the small G-protein RhoA. An Ephexin5
happloinsufficiency mouse model (Ephexin5 +/-) has increased susceptibility to audiogenic
seizures. In addition, similar to comorbid phenotypes associated with Scn1a happloinsuffiency
mouse models and human epilepsy disorders, we find that Ephexin5 /- mice have increased
anxiety behaviors.
In the future we will take two approaches to determine the robustness of our Ephexin5
epilepsy model. First, in collaboration with Dr. Poduri and colleagues at Children’s Hospital
Boston, we identified two variants at R105Q and R546P that need to be tested for their ability to
activate RhoA GEF activity and to regulate excitatory synapse development. We will continue
screening for rare variants in individuals with epileptic encephalopathies. Second, we will
screen Ephexin5 +/- mice for additional seizure phenotypes by electroencephalography
recordings (EEGs) or by pentylenetetrazol (PTZ)/kainic acid-induced seizures. Screening for
additional seizure phenotypes is important because it is possible that our audiogenic-induced
seizures are a consequence of specific alterations in the underlying brain stem/auditory pathway
in Ephexin5 +/- mice, and not due to a bona fide alteration in the circuitry underlying
generalizable seizures.
How might seizures arise in the Ephexin5 happloinsuffiency model? Ephexin5
negatively regulates the density of excitatory synapses in the CA1 stratum radiatum subregion of
the hippocampus (Chapter 2). An increase in the number of excitatory synapse density could

123
lead to enhanced excitation and seizure activity. The hippocampal circuit is often involved in
epileptic activity, particularly in temporal lobe epilepsy (TLE) (Avoli, 2007). Two major circuit
pathways have been proposed to underly recurrent seizure activity in TLE. The first is an
enthorinal cortex -> dentate gyrus -> CA3 -> CA1 -> subiculum -> entorhinal cortex pathway,
and the second is a direct entorhinal cortex -> CA1 pathway (Avoli, 2007; Ang et al., 2006). In
future studies, stimulating epileptiform activity in Ephexin5 +/- acute slices containing the intact
cortical/hippocampal circuit may help distinguish between these possible circuit mechanisms.
Ephexin5 is also highly expressed in the cortex (Sahin et al., 2005; Salogiannis,
unpublished observations) and could function to restrict excitatory synapse density in cortical
neurons. Increased synapse number in the cortex has been shown to lead to an increase in
seizure susceptibility. For instance, the immune response protein C1q is a potent negative
regulator of excitatory synapses (Stevens et al., 2007), and C1q KO mice exhibit seizures due to
an increase in neocortical synapse number (Chu et al., 2010). Alternatively, it is plausible that
the seizures in our Ephexin5 +/- model arise from deficits in axon guidance or deficits in
inhibitory synapses. Indeed, Ephexin1 has been shown to regulate axon guidance (Shamah et al.,
2001; Sahin et al., 2005; also see Section 1.5). Additionally, an overwhelming number of genes
mutated in human forms of epilepsy exhibit deficits in either inhibitory synapse number or in
inhibitory neurotransmission. The role of Ephexin5 in inhibitory synaptic function has not been
tested. Preliminary data from the Greenberg lab suggests that Ephexin5 is expressed in
inhibitory neurons in vivo (Spiegel, personal communication).
The R604C (mouse R612C) reduces RhoA GEF activity by 45-50%. We previously
demonstrated that amino acid substitutions at key residues in the GEF/GTPase interaction pocket
lead to a reduction in the GEF activity of Ephexin5. R604 resides in a region of the DH-PH

124
domain outside of the GEF interaction pocket. Specifically, R604C is in a linker region between
the DH and PH domains. This region can provide structural rigidity critical for PH-domain
anchoring to the plasma membrane, as well as for PH-domain autoinhibition during GEF
exchange (Cherfils & Zeghouf, 2013). Studying the R604C mutation in more detail will help
elucidate biophysical mechanisms underlying the GEF activity of Ephexin5.

125
3.6 Materials and Methods
DNA constructs
pCMV-SPORT6-ARHGEF15 was purchased (OpenBiosystems). Ephexin5 mouse
cDNA was previously described (Margolis et al., 2010 and Section 2.5). Human Ephexin5
R604C and mouse R612C were cloned using QuikChange Site Directed Mutagenesis
(Stratagene). All plasmids were sequenced for correct cDNA. N-terminal Ephexin5 antibody
was described previously (Margolis et al., 2010 and Chapter 2 Materials and Methods).
RhoA activation assays and Ephexin5 protein levels
For RhoA/RBD assays, HEK 293 cells were cultured in DMEM supplemented with 10%
fetal bovine serum, 2 mM glutamine (Sigma), and penicillin/streptomycin (100 U/mL and 100
µg/mL, respectively; Sigma). 293 cells were transfected in a 6-well dish (2 mL of media) for 36
hours with 1 ug of indicated plasmids using the calcium phosphate method. For the quantitative
G-LISA RhoA activation assays, 150 ug of protein lysates were subjected to the colorimetric-
format G-LISA RhoA Activation Assay Kit (Cytoskeleton, Inc; Cat# BK124) as per the
manufacturer’s instructions. All lysate samples were run in duplicate and the GloMax Multi-
plate Detection System was used for colorimetric readings. Final values for RhoA activation
were calculated as a fold-change over the plasmid control transfection. For the RBD pulldown
assay, 500 ug of total protein lysates from overexpressed cells was subjected to GST-Rhotekin
pulldown and analyzed by Western Blot. Quantification of active RhoA/Total RhoA was
conducted using Image imaging software to measure densitometry of the immunosignal. To
quantify levels of Ephexin5 protein, LiCor Biosciences Odyssey Infrared detection software was
used on a Western Blot.

126
Audiogenic Seizures
Male Ephexin5 heterozygotes and WT littermate controls were generated by crossing a
pure C57/Bl6 WT males to a 129J backcrossed (at least 10 generations) Ephexin5 +/- female to
create 50:50 (129J:C57/Bl6) hybrid progeny. Protocol for audiogenic seizures was adapted from
a previously described protocol (Jiang et al., 1999). Male mice were placed in a clear, plastic tub
10 inches (?) in diameter and 12 inches in height. After a 5 minute habituation period, audiogenic
seizures were induced by raking a pen for 45 seconds over a cage-top situated above the plastic
tub similar to a previously established protocol (Jiang et al., 1998). Time to recovery was
measured as a step movement of any forelimb or hindlimb. We set a test maximum of 480
seconds. All animals were tested between 2-6pm and genotypes were blinded to the
experimenter.
Elevated Plus Maze and Light/Dark Box
6 to 8 week old 129J Ephexin5 males (backcrossed at least 5 generations) were used for
testing. All animals tested were progeny of an Ephexin5 +/- X Ephexin5 +/- male/female
cross. All behavioral testing was performed between 2pm-6pm at the TUFTS Neuroscience
Behavioral Core with an inverse light/dark cycle; therefore, anxiety tests were performed in the
mice’s nocturnal cycle. A lux lighting level of 100 was used for all experiments. All animals
were habituated at least 30 minutes before testing began to the behavioral testing room. Each
test was 10 minutes. Experimenters were blinded to genotype. For elevated plus maze, the
automated KinderScientific Elevated Plus Maze (http://www.kinderscientific.net/plusmaze.html)
was used. Arms were raised 50 cm off the floor. Open arms were 25 x 5 x 0.5cm and closed
arms were 25 x 5 x 16cm. Closed arm height borders were black. Animals were placed in a 5 x

127
5 x 0.5 cm center platform facing open arms at the beginning of test. Automated beam breaks
(16 beams per arm) were used with MotorMonitor software to analyze mouse movements. The
light/dark box was approximately 44 x 20 x 15 cm. Each compartment (light and dark) took up
1/2 the box. Animals were placed in the middle of the light compartment to start the test.
Animals were able to move between compartments with a 5 x 5 cm hole. No shadows were
allowed at the hole-opening (from experimental lighting) in order to minimize and discourage
crouching behavior near the border between compartments. Each animal was assessed manually
with a stop watch for time spent in open area, and the number of transitions between
compartments was recorded manually by two independent experimenters.

128
Chapter 4
Phospho-regulation of Ephexin5 during brain development

129
4.1 Abstract
The specific molecular mechanisms that restrict excitatory synapse formation are not well
understood. We previously identified the RhoGEF Ephexin5 as a critical negative regulator of
excitatory synapse formation in early brain development. We extend these findings and
demonstrate that Ephexin5 knockout mice have a normal density of dendritic spines in
adulthood. We searched for additional mechanisms that may underlie the preferentially early
developmental deficits associated with Ephexin5. Using mass spectrometry, we identified novel
serine/threonine phosphorylation sites on the N-terminus of Ephexin5 that are critical for
restricting excitatory synapse density in dissociated hippocampal cultures. Two of these
phosphorylation sites, serine-107/109, are drastically reduced during postnatal development at
the height of synapse formation. We conclude that phosphoregulation of Ephexin5 may be
another critical mechanism underlying Ephexin5-mediated excitatory synapse restriction during
early brain development.
130
4.2 Identification and analysis of Ephexin5 phosphorylation
Reduction of Ephexin5 phosphorylation during postnatal brain development
To uncover novel mechanisms of early synapse restriction in vivo, we first sought to
determine the time point in development when Ephexin5 knockout mice had the most drastic
effects on dendritic spine development. A negative regulator of synapse development could
function during early activity independent phases, during later activity-dependent phases, or
perhaps during maintenance and elimination phases. Our results thus far, suggest that Ephexin5
must at least have a role in early synapse development.
To address this, Ephexin5 knockout mice (KOs) and their WT littermates were prepared
for Golgi staining at postnatal day 15 and 90 (P15 vs. P90) (Figure 4.1A). We analyzed
dendritic segments in the stratum radiatum of CA1 hippocampus similar to our previous study.
As expected (although previously not tested) Ephexin5 KOs have an approximate 40% increase
in dendritic spine density at P15 compared to their WT littermate controls (Figure 4.1B).
Interestingly, no differences were detected in dendritic spine density at P90 (Figure 4.1C). This
is consistent with Ephexin5 have a prominent role in restricting synapse number early in
development. To analyze the effects in the adult another way, we utilized the Thy1-GFPm line
(Fang et al., 2000), where there is expression of GFP in a sparse subset of CA1 pyramidal
neurons (Figure 4.1D). No differences were found between Ephexin5 KOs and their littermate
controls at P60.
Since we determined that Ephexin5-mediated synapse restriction was more severe during
postnatal development (~2 weeks) as compared to early adulthood (~6-9 weeks), we were
particularly interested in Ephexin5 protein expression that spans these time points. To address

131
Figure 4.1: Ephexin5 knockout mouse have increased spine density at P15 but not in
adulthood
A) Representative image using to quantify Golgi staining. Image of an apical dendritic segment
in CA1 of the hippocampus at P90 used for Neurolucida tracings (see Materials and Methods).
B) Quantification of dendritic protrusion density in apical region of hippocampal CA1
pyramidal neurons from Ephexin5 knockout (KO) mice (n= 10) versus wild-type (WT) littermate
controls (n=11) at postnatal day 15 (P15) from 2 brains per condition, *p < .05, Student’s T-test
C) Quantification of dendritic protrusion density in apical region of hippocampal CA1
pyramidal neurons from Ephexin5 KO mice (n= 27) versus WT littermate controls (n=26) at
postnatal day 90 (P90) from 3 brains per condition, Student’s T-test n.s. p > 0.5

132
Figure 4.1 (continued):
D) Representative images (left panel) apical dendritic segments of hippocampal CA1 pyramidal
neurons from theThy1-GFPm. Quantification of dendritic protrusion density (right panel) of
Ephexin5 KO mice (n=22) versus WT littermate controls (n=11) at postnatal day 60 (right
panel), not-signficant (p > 0.5) by Student’s T-test
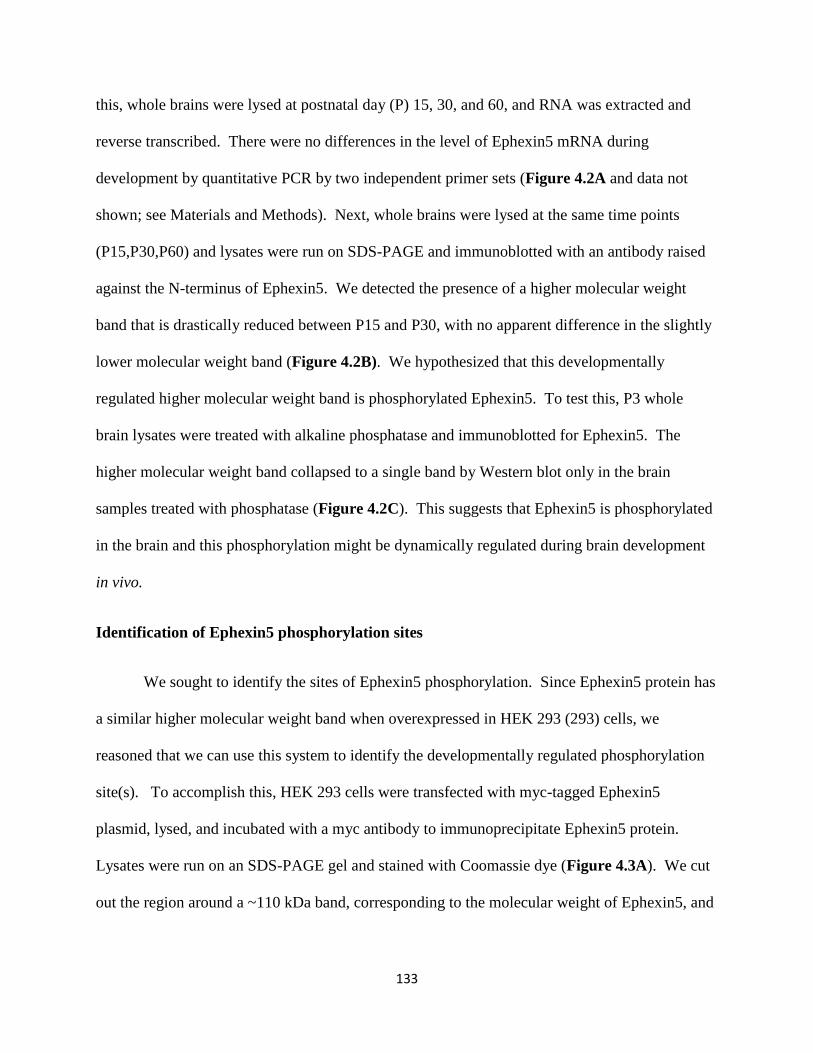
133
this, whole brains were lysed at postnatal day (P) 15, 30, and 60, and RNA was extracted and
reverse transcribed. There were no differences in the level of Ephexin5 mRNA during
development by quantitative PCR by two independent primer sets (Figure 4.2A and data not
shown; see Materials and Methods). Next, whole brains were lysed at the same time points
(P15,P30,P60) and lysates were run on SDS-PAGE and immunoblotted with an antibody raised
against the N-terminus of Ephexin5. We detected the presence of a higher molecular weight
band that is drastically reduced between P15 and P30, with no apparent difference in the slightly
lower molecular weight band (Figure 4.2B). We hypothesized that this developmentally
regulated higher molecular weight band is phosphorylated Ephexin5. To test this, P3 whole
brain lysates were treated with alkaline phosphatase and immunoblotted for Ephexin5. The
higher molecular weight band collapsed to a single band by Western blot only in the brain
samples treated with phosphatase (Figure 4.2C). This suggests that Ephexin5 is phosphorylated
in the brain and this phosphorylation might be dynamically regulated during brain development
in vivo.
Identification of Ephexin5 phosphorylation sites
We sought to identify the sites of Ephexin5 phosphorylation. Since Ephexin5 protein has
a similar higher molecular weight band when overexpressed in HEK 293 (293) cells, we
reasoned that we can use this system to identify the developmentally regulated phosphorylation
site(s). To accomplish this, HEK 293 cells were transfected with myc-tagged Ephexin5
plasmid, lysed, and incubated with a myc antibody to immunoprecipitate Ephexin5 protein.
Lysates were run on an SDS-PAGE gel and stained with Coomassie dye (Figure 4.3A). We cut
out the region around a ~110 kDa band, corresponding to the molecular weight of Ephexin5, and

134
Figure 4.2: Reduction of Ephexin5 phosphorylation during postnatal brain development
A) Quantitative PCR from whole brain lysates at indicated time points. Two distinct, non-
overlapping primer sets were used. Ephexin5 knockouts at P15 (KO(P15)) were used to
demonstrate specificity of primer sets. n=3 per condition.
B) Western blot from whole brain lysates at indicated time points. Arrows indicate Ephexin5
immunosignal. Top band (*) is non-specific. An antibody to βactin was used as a loading
control.
C) Western blot from increasing concentrations of P3 whole brain lysates treated with or
without alkaline phosphatase (AP). Arrows indicate Ephexin5 immunosignal. Top band (*) is
non-specific and persists in the KO of all ages (data not shown)

135
Figure 4.3: Identification of Ephexin5 phosphorylation sites by mass spectrometry
A) 293 cell lysates from Ephexin5-myc transfection was clarified on an SDS-PAGE gel. The
~110 kDa band was cut out and sent for mass spectrometry. Representative image from 3
independent experiments.
B) Mass spectrometry amino acid coverage = 96.3%. Yellow indicates amino acid sequence not
covered. High-confidence sites at S33, S90, S107, S109, S116, and S244 (red); lower
confidence sites at S84, T97, S99, S101 (green); not conserved in human at S83, S166, S169
(light blue)
C) 293 cells overexpressed with indicated WT-Ephexin5 and various phospho-mutant plasmids.
Displayed is a Western blot for α-C-Ephexin5.

136
performed mass spectrometry to search for posttranslational modifications. Our analysis
revealed 12 phosphorylation sites, 10 of which are conserved in humans, and five that were
deemed high-confidence (Figure 4.3B; see Materials and Methods). Interestingly, all 12
phosphorylation sites were located on the N-terminus of Ephexin5. In addition, eight were
clustered within a 32-amino acid stretch spanning from serine-84 to serine-116. non-specific.
Mef2a is used as a control to demonstrate efficiency of alkaline phosphatase (Flavell et al.,
2006).
To identify the Ephexin5 phosphorylation sites that contribute to the developmentally
regulated phosphorylation in the brain, we overexpressed a series of serine to alanine point
mutations in 293 cells, ran cell lysates on an SDS-PAGE gel and monitored the higher molecular
weight band by immunoblotting for Ephexin5. A serine to alanine point mutation at both S107
and S109 (S107A and S109A, respectively), but not the other mutations, were able to collapse
the higher molecular weight band into a single lower band (Figure 4.3C and data not shown).
To determine if these phosphorylation sites are the same sites developmentally regulated in vivo,
we generated phospho-specific rabbit polyclonal antibody raised against pS107/109 (α-
pS107/109). 293 cells were overexpressed with WT-Ephexin5, S107A-Ephexin5, or S109A-
Ephexin5 plasmids, lysed, and immunoblotted with α-pS107/109. We observe an immunosignal
in the WT-Ephexin5 lane, but not S107A or S109A (Figure 4.4A), suggesting that α-pS107/109
specifically recognizes these serine sites. Antibodies raised against the single pS107 and pS109
were unable to recognize wild-type Ephexin5 (data not shown). This observation raises the
possibility that these sites are phosphorylated in tandem. To determine if the α-pS107/109
immunosignal was specific to phosphorylation, 293 cell lysates from a WT-
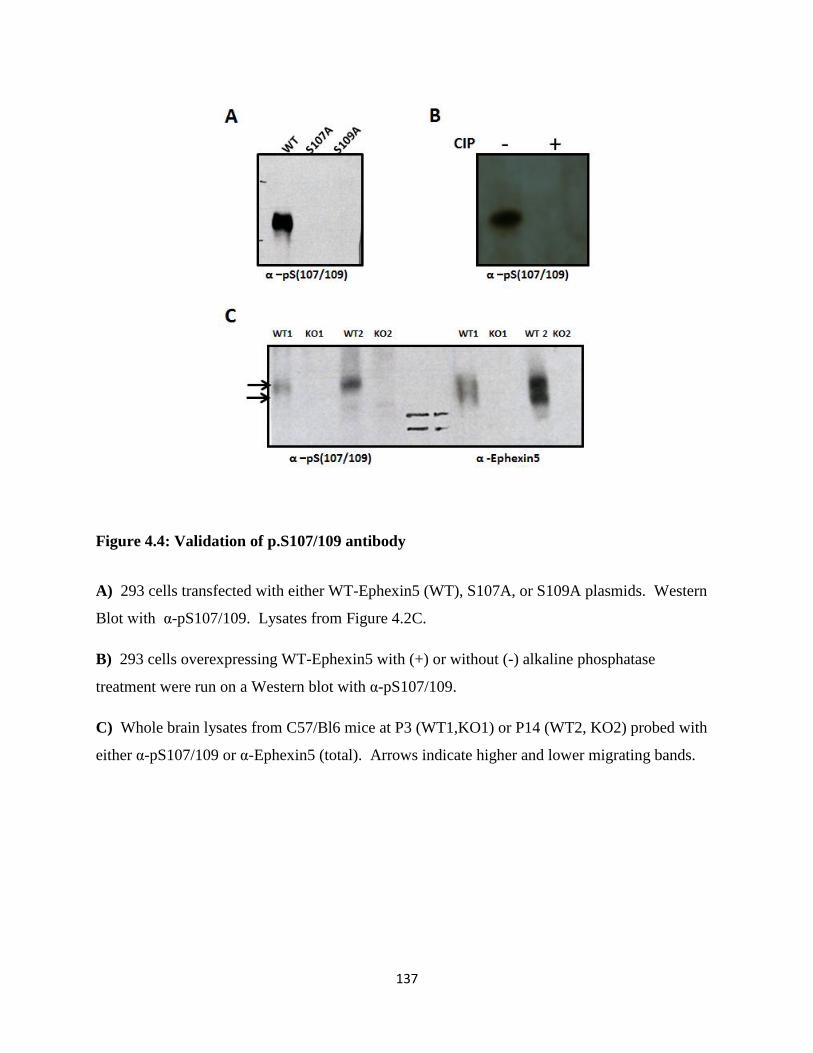
137
Figure 4.4: Validation of p.S107/109 antibody
A) 293 cells transfected with either WT-Ephexin5 (WT), S107A, or S109A plasmids. Western
Blot with α-pS107/109. Lysates from Figure 4.2C.
B) 293 cells overexpressing WT-Ephexin5 with (+) or without (-) alkaline phosphatase
treatment were run on a Western blot with α-pS107/109.
C) Whole brain lysates from C57/Bl6 mice at P3 (WT1,KO1) or P14 (WT2, KO2) probed with
either α-pS107/109 or α-Ephexin5 (total). Arrows indicate higher and lower migrating bands.

138
Ephexin5 transfection were treated with alkaline phosphatase. Western blotting detected a α-
pS107/109 signal in phosphatase-untreated but not treated samples (Figure 4.4B). These data
suggest that the antibody is phospho-specific to S107/109, and not an inability to recognize
S107A and S109A due to the alanine mutation.
To determine if phosphorylation of Ephexin5 at serine-107/109 is indeed the higher
molecular weight band we detect in early brain development, we ran an SDS-PAGE gel with
whole brain lysates from wild-type and Ephexin5 KO brains at P3 and P15. An α-pS107/109
signal was detected in WT, but not KO lysates (Figure 4.4C). Importantly, the α-pS107/109
immunosignal co-migrated with the higher molecular weight Ephexin5 band, but not the lower
band (Figure 4.4C, arrows). Finally, we blotted whole brain lysates at P5, P15, P30, and P60
with α-pS107/109 (Figure 4.5A). Similar to the higher molecular weight band, the
phosphorylation at serine 107/109 is drastically reduced between P15 and P30 (Figure 4.5B).
Taken together, our data suggests that Ephexin5 is specifically phosphorylated at serine-107/109
and these sites are drastically reduced in the brain during early postnatal development.
Phosphorylation is important for the restriction of excitatory synapses
We hypothesized that phosphorylation of Ephexin5 at these sites could protein stability,
protein localization, EphB-dependent signaling, RhoA activity, and/or excitatory synapse
development. Previously, we found that EphB2 receptors can phosphorylate and degrade
Ephexin5. We asked whether the serine/threonine phosphorylation sites we identified play a role
in EphB2/Ephexin5 binding, phosphorylation, and degradation. To accomplish this we
constructed a plasmid with cDNA of Ephexin5- that contains alanine

139
Figure 4.5: Serine-107/109 is reduced during postnatal brain development
A) Whole brain lysates at indicated times were lysed and run on a Western blot for α-
pS(107/109) and α-βactin (loading control). Representative image displayed.
B) Western blot quantification using ImageJ densitometry for P15, P30, and P60 (n=3 per
condition). α-pS(107/109) signal normalized to βactin loading control.

140
mutations at the eight phosphorylation sites (see Figure 4.3B) clustered on the N-terminus
within a 32-amino acid stretch (Ephexin5-8pMut). Ephexin5-8pMut or Ephexin5-WT was
expressed in 293 cells with or without EphB2. There was no difference in the ability for
Ephexin5 WT or 8pMut to bind to EphB2 (Figure 4.6A). In addition, cell lysates (Inputs) were
immunoblotted for α-pY361 and α-Ephexin5 to assess both EphB2-mediated phosphorylation at
Y361 and degradation of Ephexin5 protein, respectively. No differences between WT and
8pMut were observed in either case. Taken together, we conclude that serine/threonine
phosphorylation of Ephexin5 is not mechanistically linked to EphB signaling.
We next asked if Ephexin5 serine/threonine phosphorylation regulates hippocampal
excitatory synapse development. Dissociated mouse hippocampal neurons were sparsely
transfected with a control, Ephexin5-WT or Ephexin5-8pMut plasmid along with a plasmid
expressing GFP and neurons were fixed at DIV10. The number of excitatory synapses was
determined by immunostaining for the postsynaptic excitatory synaptic marker PSD-95 and the
presynaptic excitatory synaptic marker Synapsin, as well as α-GFP to visualize transfected
neurons. Excitatory synapse density was assayed as the colocalization of PSD-95 and Synapsin
along the length of a GFP-transfected dendrite (Figure 4.6B). Similar to our previous study, we
find that Ephexin5-WT reduces excitatory synapse density as compared to a control plasmid
(Figure 4.6C; Margolis et al., 2010). In contrast, Ephexin5-8pMut was unable to restrict
synapse density. We also find that dendritic arborization, localization and expression were
similar across all conditions (Figure 4.6D-4.6F). Taken together, these data suggest that
Ephexin5 serine/threonine phosphorylation is required for excitatory synapse restriction via a
yet, unidentified, mechanism.

141
Figure 4.6: Ephexin5 serine/threonine phosphorylation is critical for synapse restriction
A) 293 cells were cotransfected with Ephexin5-WT with either pCS2-empty control or Flg-
EphB2. Lysates with immunoprecipitated with Flag-beads (Sigma). Immunoprecipitations (IP)
and Inputs were immunoblotted (IB) with α-Ephexin5, and α-Flag. Inputs were also blotted for
α-pY361-Ephexin5 and α-tubulin for a loading control.
B) Mouse dissociated hippocampal neurons were cotransfected with GFP and either pCS2-empty
control (n=25 neurons), WT-Ephexin5 (WT) (n=28 neurons), or 8pMut-Ephexin5 (8pMut) (n=20
neurons). 2 coverslips per condition. Excitatory synapse density was measured as the
colocalization of PSD95 (ms anti-PSD95), Synapsin (rb anti-synapsin) and GFP (chicken anti-
GFP). p < .05, Student’s T-test
C) Representative 63x images for B) of GFP dendritic branch (green), Synapsin (yellow,
pseudocolored), and PSD95 (red).
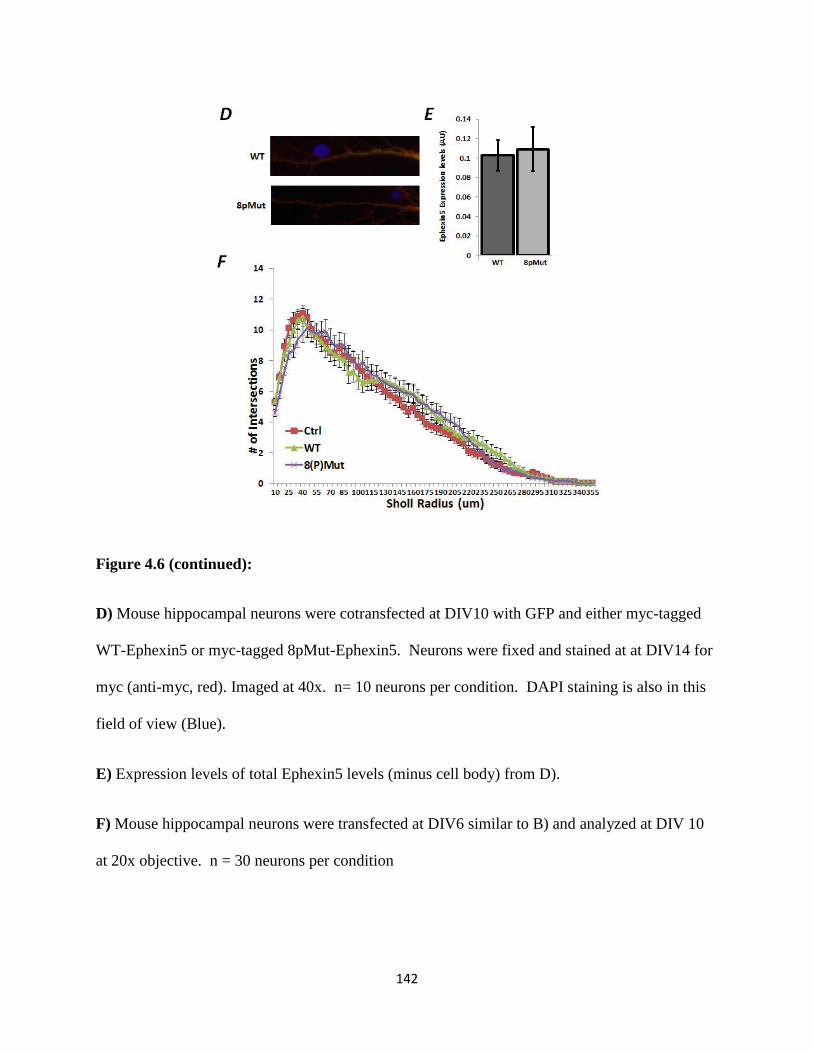
142
Figure 4.6 (continued):
D) Mouse hippocampal neurons were cotransfected at DIV10 with GFP and either myc-tagged
WT-Ephexin5 or myc-tagged 8pMut-Ephexin5. Neurons were fixed and stained at at DIV14 for
myc (anti-myc, red). Imaged at 40x. n= 10 neurons per condition. DAPI staining is also in this
field of view (Blue).
E) Expression levels of total Ephexin5 levels (minus cell body) from D).
F) Mouse hippocampal neurons were transfected at DIV6 similar to B) and analyzed at DIV 10
at 20x objective. n = 30 neurons per condition

143
4.3 Discussion
We find that Ephexin5 knockout mice have defects in early but not late spine
development. This is consistent with our previously published data (Margolis et al., 2010 and
see Chapter 2). We find that S107/109 is phosphorylated in the brain and reduced in adulthood.
S107/109 are two of eight phosphorylation sites clustered on the N-terminus of Ephexin5. We
mutated these sites and found that Ephexin5 was not able to restrict excitatory synapse number in
dissociated hippocampal culture, suggesting that Ephexin5 phosphorylation at these sites is
critical for synapse restriction. A crucial next step is to deconvolve each phosphorylation site
and determine which ones are required for the suppression of synapse restriction.
In Chapter 2 we demonstrated that Ephexin5 knockout mice had an increased number of
functional excitatory synapses onto CA1 pyramidal neurons in the hippocampus at P15. We
extend that in vivo analysis here by demonstrating that Ephexin5 knockout mice display an
increased number of spines at P15. These data are consistent with Ephexin5 playing a role in
early synaptic development. It is still a formal possibility that Ephexin5 regulates some aspect of
synapse maturation or elimination processes during later stages of development. There is data
suggesting that spine abnormalities during critical points in development (usually around 2-3
postnatal weeks) can have consequences on behavioral learning in the adult (Lendvia et al.,
2000; Majewska et al., 2003; Clement et al., 2012; see Chapter 1). For example, SynGAP1, a
negative regulator of synapse development mutated in Intellectual Disability, plays a role in
accelerating mature spine growth during an early developmental time window (Clement et al.,
2012). The conclusions from these studies is that although there are no changes in spine number

144
in the adult, rearrangements in how the spines incorporated into a functional neuronal circuit
may have been affected.
We identified novel serine/threonine phosphorylation sites that may contribute to
Ephexin5’s ability to restrict early synaptic development. It has yet to be determined whether the
additional sites we mutated (8pMut) are developmentally regulated in addition to S107/109. We
would like to test the idea that these sites are determinants for an active Ephexin5 protein. In the
future, we will deconvolve these sites to find the critical residues required for suppression of
synapse restriction and determine if these sites are also developmentally regulated. In addition,
our findings raise the possibility that Ephexin5 is either being de-phosphorylated at these
residues during development, or a kinase is being shut down in later stages of postnatal
development. One possible phosphatase is the developmentally regulated spinophilin/neurabin
complex. It has previously been shown to regulate the RhoA-specific Lfc during activity-
dependent spine restriction (Ryan et al., 2005; Kang et al., 2009).
In addition to identifying developmentally regulated kinases/phosphatases, we would like
to understand the biochemical consequences of this phosphorylation. A likely mechanism is
through its RhoA GEF activity, which was shown in Chapter 2 to be critical for synaptic
restriction. The eight phosphorylation sites clustered around the N-terminus is reminiscent of
Vav acidic residues that are phosphorylated to relieve N-terminal autoinhibition on GEF activity
(Aghazadeh et al., 2000; also see Chapter 1 for discussion). Moreover, the Ephexin family
members have robust N-terminal inhibition mechanisms that are relieved via phosphorylation.
We are currently testing this model in an in vitro cell-free system. Interestingly, our preliminary
data suggests that although it activates RhoA in vitro, activation in mammalian cells (293 cells)

145
is more robust. We are in the process of truncating the N-terminus to look for hyperactivation as
well as identifying kinases that can phosphorylate Ephexin5 in vitro.
Taken together, the data presented in Chapter 4 suggests the intriguing possibility that
constitutive phosphorylation during development activates Ephexin5 protein, an event that is
turned off in adulthood. Finding the possible mechanisms that shutoff these phosphorylation
events, either through autoinhibition or dephosphorylation is a critical next step to understanding
additional mechanisms of synapse restriction in early postnatal development.

146
4.4 Materials and Methods
DNA constructs
pEF-Ephexin5-WT-myc construct was previously described in Materials and Methods
Section 2.5. We used QuikChange Site Directed Mutagenesis (Stratagene) as per the
manufacturer’s instructions for all single phosphorylation mutants (S90A, S107A, S109A,
S116,S244A) using the pEF-Ephexin5-WT-myc as a template. To construct the pEF-Ephexin5-
8pMut-myc plasmid, we synthesized complementary oligos spanning 179-380 of WT-Ephexin5
cDNA with mutations corresponding to S(84,90,T97,S99,S101,S107,S109,S116)A. Oligos were
hybridized and BbsI and PflmI were used to create 5’ and 3’ overhang, respectively. Digested
oligos were subcloned into pEF-Ephexin5 swapping out the WT sites for the 8 phospho
mutations
Mass spectrometry for post-translation modifications
4 10cm2 dishes of 293T cells were transfected with 5ug Ephexin5-WT-myc plasmid at
~50% confluency. Cells were lysed after 48 hours in RIPA buffer (see below for recipe) with
Phosphatase inhibitor cocktail 2 and 3 (Sigma). Myc antibody (9E10 from abcam) was used to
immunoprecipitate Ephexin5. 10-well format 4-12% Bis/Tris gradient gel (Invitrogen) was used
to run samples and band corresponding to Ephexin5 was cut out, placed in an eppendorf in
sterile, distilled water, and sent to Taplan Mass Spectrometry Facility at Harvard Medical School
for analysis. High-confidence targets were deemed as targets whose peptide phosphorylation
sites were easily determined.
Whole brain and HEK 293 cell lysis and CIP treatment

147
Whole brains or HEK293 cells were collected and homogenized in RIPA buffer (50 mM
Tris pH 8.0, 150 mM NaCl, 1% Triton X-100, 0.5% Sodium Deoxycholate, 0.1% SDS, 5 mM
EDTA, 10 mM NaF, complete protease inhibitor cocktail tablet (Roche), 1 mM sodium
orthovanadate, 1 mM β-glycerophosphate). For CIP with P3 whole brain lysates, 40 or 160 ug of
protein (measured by the Bradford method) per condition (no CIP vs. CIP) was diluted in 1x
NEB Buffer 4. 10 units CIP (NEB) added to CIP conditions and all conditions were incubated at
37 deg for 1 hr. For CIP using 293T cell, 6-well dishes at 50% confluency were transfected with
.5 ug of Ephexin5 protein. 24 hours later, cells were lysed in RIPA (see above) and 50 uL of
total lysate was diluted to 1x NEB and processed similar to whole brain lysates.
qPCR
For developmental Ephexin5 mRNA analysis, two sets of exon spanning qPCR primers
(100-125 bps) were constructed by IDT as follows:
Ephexin5 primer Set 1 (Exon spanning 1-2):
F 5’ GAAGGGAGGAGGAAGGATTG
R 5’ CAGCTCCTCTGACAGCACAG
Ephexin5 Primer Set 2:
F 5’ TGACCGACACCTTCGTCCTGAG
R 5’GGAACGAACACGAGACAGCAGT
Each qPCR primer set was validated for one melting curve peak as well as efficacy of
amplification within the dilution range used for each sample. For qPCR, brains were
homogenized in Trizol using a Polytron automated homogenizer (at setting 10 for 10 seconds),
settled on ice for 10 minutes, and supernatant taken and flash frozen for at least 30 minutes (or -
80 for longer). Trizol/homogenized brain mixture is subsequently thawed at room temp for 5
148
minutes, and 200 uL choloform is added for every mL of Trizol. Solution is vigorously mixed
for 20 seconds, and spun at 4 deg for 15 mins. For each sample, 2ug of total RNA was isolated
using the RNAse easy kit (Qiagen) and RNA was on-column digested with DNAseI (Qiagen).
RNA was reverse-transcribed using OligodT amplification using SuperScriptIII reverse
transcriptase (Invitrogen). For transcripts of interest, 1/80th
of result cDNA was assessed by
quantitative real-time PCR using SYBR green detection method (Applied Biosystems).
Antibodies and Western Blots
All antibodies were described in Section 2.5 with the exception of anti-S107/109. The
polyclonal antibody that recognizes S107/109 of Ephexin5 was generated by injecting New
Zealand white rabbits (Convance) with the peptide C- PSPVSRRpSIpSPEPAPC. The antiserum
was affinity-purified by application of a column conjugated with unphosphorylated Ephexin5
peptide. The flow-through was then applied to a column conjugated with phosphorylated
Ephexin5 peptide and the affinity-purified anti-S107/109 antibody was eluted.
For Western Blots, all gels were 8% SDS-PAGE gels. They were run at 70 V through
stacking gel, 120 V through resolving gel and transferred on ice onto nitrocellulose for 2 hrs at
200 mA. Transferred blots were blocked in 5% milk for 1 hr shaking at RT and incubated with
indicated primary antibodies in 5% milk overnight at 4 deg. The following antibody dilutions
were used: rb anti-S107/109 at 1:1000; rb anti-Ephexin at 1:500 in whole brain and 1:10,000 in
293T cells (Margolis et al., 2010); anti-tubulin (abcam) at 1:25,000; ms anti-actin (abcam at
1:2000. Blots were washed 3x in 1x TBST (.05% Tween). Secondary-HRP antibodies were
diluted at 1:15,000 in 5% milk and washed 3x in 1x TBST. Immunosignals were processed on
Kodak Film using the ECL method. For endogenous total Ephexin5, Western Blots were run on

149
a 6% SDS-PAGE gel and transferred overnight for 12 hrs at 60 mA. Primary antibodies were
incubated for 2 hrs shaking at room temp. All other steps were similar.
EphB2/Ephexin5 coprecipitation experiments
Each well of a 6-well dish was transfected with 500 ng Ephexin5 plasmid and either a
pCS2-empty vector or pCS2-Flg-EphB2 (Soskis et al., 2012). Cells were lysed in RIPA buffer
(see above) in 300 ul per well, and two-wells per condition were combined. Lysates were rotated
half-end at 4 deg for 5-10 minutes and subsequently spun at 13K RPM for 10 mins on a table-top
centrifuge at 4 deg. 350 uL of each supernatant was added to 40 uL Flg beads (Sigma) (beads
pre-washed in RIPA 3x) for 2 hrs at 4 deg with full rotation. Beads/antibody/lysate mixture was
washed 3x with 5 mins rotation in between a 3K RPM spin for 3 mins and 30 uL 2x Sample
Buffer was added after last spin. Samples were boiled for 3 mins, spun down at max speed for 1
min, and run for Western Blot analysis.
Synapse and Sholl assays in dissociated culture
Excitatory synapse assays, imaging and analysis were conducted similar to Materials and
Methods section 2.5 with the following exceptions: Neurons were plated at a density of 100K
per well (24-well plate) on a confluent rat glial monolayer (plated 3 days prior). Neurons were
transfected at DIV6 and stained at DIV10. In addition to PSD95 and synapsin antibodies,
neurons were also stained with chicken anti-GFP (Aves Labs) to visualize transfected neurons.
250 ng of eGFP plasmid was transfected. 500 ng of Ephexin5 plasmids or pCS2 control
plasmids was transfected using the Lipofectamine method (Invitrogen).
For Sholl analysis, we used a Zeiss Pascal confocal microscope at 20× objective with
sequential acquisition settings at 1024 × 1024 pixel resolution. On average, 5 stacks at 2 µm

150
each were taken for each neuron image. Images were collected from 8-12 neurons per coverslip
with four coverslips per condition from two independent biological replicates. Images were
exported to ImageJ NIH software, and max projections were converted to gray where they were
traced using NeuronJ software and calculated using the Sholl analysis software PlugIn.
Golgi staining and GFPm (spine imaging and analysis)
Animals were deeply anesthetized using isoflourane. Golgi–Cox staining was performed
using the FD Rapid Golgi Stain Kit (FD NeuroTechnologies, Inc., Ellicott City, MD). Brains
were removed, rinsed with water, and placed directly in a mixture of 1 part Solution A and 1 part
Solution B from the kit (see manufacturer's instructions for solution contents) for 10 days at
room temperature in the dark. The solution was replaced and brains were then moved into
Solution C for 24 hours at 4 °C in the dark. Brains were snap frozen in an isobutanol bath cooled
to −70 °C and embedded in Tissue Freezing Medium (Triangle Biomedical Sciences, Durham,
NC). Brains were coronally sectioned in a cryostat at −25 °C at a thickness of 100 μm and
mounted on superfrost slides. Sections were dried in the dark overnight at room temperature for
1 day before staining. Sections were visualized using a Nikon 80i upright microscope under
bright field at 100X magnification. Spines were manually traced and reconstructed using
Neurolucida 10.3 (MBF Bioscience, MicroBrightField, Inc., Williston, VT). Only secondary
dendrites from a visible primary apical tuft in CA1 hippocampus were analyzed for spine
number. Dendritic lengths were traced and reconstructed with live Bright-field images. All
visible protrusions emanating off the dendritic branch was considered a spine. At least two
dendritic lengths were taken per neuron and dendritic segments length were added together and
total number of spines were divided by dendritic segment to obtain a neuronal protrusion density
calculation.

151
Thy1-GFPm animals (129 background) were obtained from Jackson labs and described
previously (Fang et al., 2000). Thy1-GFPm brains were processed as previously described
(Wills et al., 2012). Briefly, Ephexin5 +/- females were mated with Thy1GFPm
+/+;Ephexin5+/- males so all progeny contain one allele of GFP. Animals were anesthetized with
Ketamine and perfused with 4% PFA in PBS. Following perfusion, brains were post fixed for 1
hour, followed by a 1 hour incubation in 10% sucrose and then submersed in 20% sucrose
overnight at 4 degrees (or until tissue sinks in solution). Brains were mounted with Tissue
Freezing Medium and sectioned coronally at -20 degrees in a cryostat in 100uM slices. Sections
were stained using a floating sections technique, using a 12 well dish with mesh buckets for easy
tissue transfer. Following sectioning, tissue was placed in Block (1X PBS, .025% Triton, Goat
Serum) for 1 hour and then placed in antibody (GFP antibody: Conjugated 488 anti-rb,
Invitrogen) overnight at 4 degrees. Sections were washed 5x in 1xPBS over an hour, mounted on
superfrost slides and coverslipped with Permount. Sections containing dorsal hippocampus were
used for analysis. For Imaging of GFPm, Pascal Confocal was used at 63x objective zoom 2 at
1024 x 1024 resolution with 2-4 times averaging. 488 laser set to 5%, gain with an excitation of
800 and 0 offset. Pinhole was set to 1 airy unit. Z slice was set to 0.5 um per slice with
anywhere between 5-15 slices per dendrite. 2 proximal secondary dendrites coming off main
apical branch (within ~100um of cell body) from each CA1 pyramidal neuron was imaged.
Neurons were taken from at least 3 animals per condition. Spines were analyzed using
Metamorph software similar to Section 2.5.

152
Chapter 5
Conclusion
153
The precise balance between promoting and restricting the synapse is critical to ensure
that synapses form in the proper time, number and place during development. The mechanisms
that promote excitatory synapse formation in the central nervous system are well understood, but
the mechanisms that restrict/negatively regulate excitatory synapse number are largely unknown.
A literature search for negative regulators of spine and synapse formation reveals approximately
15 proteins including SynGAP1 (Vasquez et al., 2004; Clement et al., 2012), MEF2A/D (Flavell
et al., 2006), C1q (Stevens et al., 2007), δ-catenin (Arikkath et al., 2009), RhoA (Nakayama et
al., 2000; Tashiro et al., 2000), Ephexin1 (Fu et al., 2007), EphA4 (Murai et al., 2003) and
Sema3F (Tran et al., 2009); only a subset of these has attributed mechanisms. The findings
within this dissertation suggest that Ephexin5 restricts excitatory synapse formation in early
postnatal development and we provide two potential mechanisms for how this may occur.
During the first two weeks of postnatal development, Ephexin5 knockouts (Chapters 2 &
4) and heterozygotes (data not shown) display an increased density of dendritic spines compared
to wild-type littermates. Interestingly, this increase in spine density does not persist into
adulthood suggesting that Ephexin5 protein is only critical for the early phase of excitatory
synapse development. This is reminiscent of the phenotype in SynGAP1 mutant mice, where the
maturation of dendritic spines are prematurely accelerated during early postnatal development,
but seem to have no discernible differences in adulthood (Clement et al., 2012; Vasquez et al.,
2004). Since both Ephexin5 and SynGAP1 mutant mice display behavioral deficits in adulthood
it is possible that premature acceleration of synapses alters the proper wiring and incorporation
of synapse into a mature neural circuit. Consistent with this, miswiring of spines during early
phases of synapses formation leads to deficits in critical period plasticity and learning in
adulthood (Lendvai et al., 2000; Majewska et al., 2003).

154
Our data is most consistent with Ephexin5 playing a role in regulating the total number of
dendritic protrusions, and not a particular type of spine. This is based on a few observations:
First, Ephexin5 knockdown does not yield differences in the length or width of dendritic spines.
Second, overexpression of constitutively active RhoA in early organotypic slice culture leads to a
reduction in dendritic protrusions (Nakayama et al., 2000; Tashiro et al., 2000). Third,
knockdown of Ephexin5 in early dissociated hippocampal culture (DIV2 to DIV 6) leads to a
striking increase in excitatory synapse number suggesting that it serves as a barrier to the overall
number of synapses.
In Chapter 2, we demonstrate that Ephexin5 can bind to the EphB2 receptor tyrosine
kinase and is tyrosine phosphorylated at Y361. Tyrosine phosphorylation leads to the
degradation of Ephexin5 protein in heterologous cells and along the dendrite. Protein
degradation of Ephexin5 is dependent on the E3 ubiquitin ligase, Ube3a. A few questions
regarding this mechanism still remain unclear: First, what are the specific mechanisms
underlying Ephexin5 Y361 phosphorylation and degradation? Second, can the synaptic
EphB2/Ephexin5 interaction be explained by tyrosine-kinase independent mechanisms?
Overexpression of WT-EphB2, but not a kinase-dead version, reduces the amount of
Ephexin5 protein in heterologous cells and in neurons. Ephexin5 tyrosine-361 is a major site of
EphB-dependent phosphorylation. However, mutating this site to phenylalanine only partially
suppressed EphB2-mediated degradation in heterologous cells. This suggests that additional
sites on Ephexin5 may be required for its degradation. Alternate routes of degradation could be
explained by either other tyrosine residues or by other residues downstream of EphB-dependent
signaling events independent of receptor tyrosine kinase activation. Our data is most consistent
with the second possibility, since Ephexin5 Y361 is the major site of tyrosine phosphorylation in

155
vitro (unpublished observations) and in heterologous cells (Chapter 2). In addition, there is
evidence suggesting that the receptor tyrosine kinase domain of EphB2 is dispensable for proper
synapse formation (Soskis et al., 2012). Since knockdown of EphBs drastically reduces the
number of excitatory synapses, this suggests that EphBs may require other functional domains at
the synapse.
Upon binding of EphrinB, EphBs multimerization results in the recruitment and
clustering of molecules at the synapse including NMDAR’s, Src-family kinases, and RacGEFs
such as Tiam and Kalirin (Dalva et al., 2000; Klein et al., 2009). Our preliminary in vitro data
demonstrates that Ephexin5 is tyrosine phosphorylated in response to Src stimulation. Src-
family kinases can be activated by EphBs and NMDARs through calcium-dependent signaling
(Klein et al., 2009), suggesting that Ephexin5 could be degraded through EphB-kinase
independent processes at the synapse. In support of this, unpublished data from Karen Zito and
colleagues suggests that treating organotypic cultures with bicucilline (ie, increased synaptic
activity) reduces dendritic expression of Ephexin5 protein. Conversely, treating cells with
tetrodotoxin increases Ephexin5 expression (unpublished observations). Future experiments
elucidating the role of neuronal activity on Ephexin5 protein levels should shed insight into the
interplay between receptor tyrosine kinase and calcium-dependent processes.
In Chapter 4, we demonstrated that Ephexin5 is serine/threonine phosphorylated in the
brain during early postnatal development. These sites are required for restricting excitatory
synapse number in dissociated culture, suggesting that dephosphorylation of Ephexin5 may be a
critical event to reduce its activity. These phosphorylation events seem to be independent of
EphB signaling in heterologous cells. Whether this is the case in neurons has yet to be
determined. As outlined in the Chapter 4 Discussion Section, the priority of future experiments

156
will be to determine the kinases/phosphatases that regulate these phosphorylation events and to
determine whether other serine/threonine sites are developmentally regulated.
Taken together, the results within this dissertation suggest that Ephexin5 serves as a
brake during early synapse development and that precise control of Ephexin5 activity via
degradation and phosphorylation are critical mechanisms to ensure that synapses form in the
correct number, time, and place. Ephexin5 has been linked to early developmental disorders
such as epilepsy (Chapter 3) and Angelman syndrome (Chapter 2). Future studies focusing on its
role in early brain development may be critical for understanding the etiology of
neurodevelopmental disorders and normal cognitive function.

157
Bibliography

158
(2012). "Epi4K: gene discovery in 4,000 genomes." Epilepsia 53(8): 1457-1467.
Abe, K., K. L. Rossman, et al. (2000). "Vav2 is an activator of Cdc42, Rac1, and RhoA." J Biol
Chem 275(14): 10141-10149.
Abe, K., I. P. Whitehead, et al. (1999). "Involvement of NH(2)-terminal sequences in the
negative regulation of Vav signaling and transforming activity." J Biol Chem 274(43):
30410-30418.
Aghazadeh, B., W. E. Lowry, et al. (2000). "Structural basis for relief of autoinhibition of the
Dbl homology domain of proto-oncogene Vav by tyrosine phosphorylation." Cell 102(5):
625-633.
Aghazadeh, B., K. Zhu, et al. (1998). "Structure and mutagenesis of the Dbl homology domain."
Nat Struct Biol 5(12): 1098-1107.
Ahmari, S. E., J. Buchanan, et al. (2000). "Assembly of presynaptic active zones from
cytoplasmic transport packets." Nat Neurosci 3(5): 445-451.
Ang, C. W., G. C. Carlson, et al. (2006). "Massive and specific dysregulation of direct cortical
input to the hippocampus in temporal lobe epilepsy." J Neurosci 26(46): 11850-11856.
Avoli, M. (2007). "The epileptic hippocampus revisited: back to the future." Epilepsy Curr 7(4):
116-118.
Bamshad, M. J., S. B. Ng, et al. (2011). "Exome sequencing as a tool for Mendelian disease gene
discovery." Nat Rev Genet 12(11): 745-755.
Berglund, K. and G. J. Augustine (2008). "Calcium helps neurons identify synaptic targets
during development." Neuron 59(2): 186-187.
Bos, J. L., H. Rehmann, et al. (2007). "GEFs and GAPs: critical elements in the control of small
G proteins." Cell 129(5): 865-877.
Bresler, T., M. Shapira, et al. (2004). "Postsynaptic density assembly is fundamentally different
from presynaptic active zone assembly." J Neurosci 24(6): 1507-1520.
Brose, N. (2009). "Synaptogenic proteins and synaptic organizers: "many hands make light
work"." Neuron 61(5): 650-652.
Bustelo, X. R. (2001). "Vav proteins, adaptors and cell signaling." Oncogene 20(44): 6372-6381.
Cahill, M. E., Z. Xie, et al. (2009). “Kalirin regulates cortical spine morphogenesis and disease-
related behavioral phenotypes.” Proc Natl Acad Sci U.S.A. 106(31): 13058-13063.

159
Chan, A. M., E. S. McGovern, et al. (1994). "Expression cDNA cloning of a novel oncogene
with sequence similarity to regulators of small GTP-binding proteins." Oncogene 9(4):
1057-1063.
Chen, C. and W. G. Regehr (2000). "Developmental remodeling of the retinogeniculate
synapse." Neuron 28(3): 955-966.
Cherfils, J. and M. Zeghouf (2013). "Regulation of small GTPases by GEFs, GAPs, and GDIs."
Physiol Rev 93(1): 269-309.
Chu, Y., X. Jin, et al. (2010). "Enhanced synaptic connectivity and epilepsy in C1q knockout
mice." Proc Natl Acad Sci U S A 107(17): 7975-7980.
Clement, A.C., M. Aceti, et al. (2012). "Pathogenic SYNGAP1 mutations impair cognitive
developmentby disrupting maturation of dendritic spine synapses." Cell 151(4): 709-723.
Cooper, E. M., A. W. Hudson, et al. (2004). "Biochemical analysis of Angelman syndrome-
associated mutations in the E3 ubiquitin ligase E6-associated protein." J Biol Chem
279(39): 41208-41217.
Cote, J. F. and K. Vuori (2007). "GEF what? Dock180 and related proteins help Rac to polarize
cells in new ways." Trends Cell Biol 17(8): 383-393.
Cowan, C. W., Y. R. Shao, et al. (2005). "Vav family GEFs link activated Ephs to endocytosis
and axon guidance." Neuron 46(2): 205-217.
Dailey, M. E. and S. J. Smith (1996). "The dynamics of dendritic structure in developing
hippocampal slices." J Neurosci 16(9): 2983-2994.
Dalva, M. B., A. C. McClelland, et al. (2007). "Cell adhesion molecules: signalling functions at
the synapse." Nat Rev Neurosci 8(3): 206-220.
Dalva, M. B., M. A. Takasu, et al. (2000). "EphB receptors interact with NMDA receptors and
regulate excitatory synapse formation." Cell 103(6): 945-956.
Dan, B. (2009). "Angelman syndrome: current understanding and research prospects." Epilepsia
50(11): 2331-2339.
Debily, M. A., A. Camarca, et al. (2004). "Expression and molecular characterization of
alternative transcripts of the ARHGEF5/TIM oncogene specific for human breast
cancer." Hum Mol Genet 13(3): 323-334.
Dindot, S. V., B. A. Antalffy, et al. (2008). "The Angelman syndrome ubiquitin ligase localizes
to the synapse and nucleus, and maternal deficiency results in abnormal dendritic spine
morphology." Hum Mol Genet 17(1): 111-118.

160
Drachman, D. (2005). "Do we have brain to spare?" Neurology 64(12): 2004-2005.
Dunaevsky, A. and C. A. Mason (2003). "Spine motility: a means towards an end?" Trends
Neurosci 26(3): 155-160.
Ebert, D.H. and M.E. Greenberg (2013). "Activity-dependent neuronal signalling and autism
spectrum disorder." Nature 493(7432): 327-337.
Egea, J. and R. Klein (2007). "Bidirectional Eph-ephrin signaling during axon guidance." Trends
Cell Biol 17(5): 230-238.
Ethell, I. M., F. Irie, et al. (2001). "EphB/syndecan-2 signaling in dendritic spine
morphogenesis." Neuron 31(6): 1001-1013.
Eva, A. and S. A. Aaronson (1985). "Isolation of a new human oncogene from a diffuse B-cell
lymphoma." Nature 316(6025): 273-275.
Fasen, K., D. P. Cerretti, et al. (2008). "Ligand binding induces Cbl-dependent EphB1 receptor
degradation through the lysosomal pathway." Traffic 9(2): 251-266.
Fischer, M., S. Kaech, et al. (1998). "Rapid actin-based plasticity in dendritic spines." Neuron
20(5): 847-854.
Flanagan, J. G. and P. Vanderhaeghen (1998). "The ephrins and Eph receptors in neural
development." Annu Rev Neurosci 21: 309-345.
Flavell, S. W., C. W. Cowan, et al. (2006). "Activity-dependent regulation of MEF2 transcription
factors suppresses excitatory synapse number." Science 311(5763): 1008-1012.
Frank, C. A., J. Pielage, et al. (2009). "A presynaptic homeostatic signaling system composed of
the Eph receptor, ephexin, Cdc42, and CaV2.1 calcium channels." Neuron 61(4): 556-
569.
Frisen, J., J. Holmberg, et al. (1999). "Ephrins and their Eph receptors: multitalented directors of
embryonic development." EMBO J 18(19): 5159-5165.
Fu, W. Y., Y. Chen, et al. (2007). "Cdk5 regulates EphA4-mediated dendritic spine retraction
through an ephexin1-dependent mechanism." Nat Neurosci 10(1): 67-76.
Fukazawa, Y., Y. Saitoh, et al. (2003). "Hippocampal LTP is accompanied by enhanced F-actin
content within the dendritic spine that is essential for late LTP maintenance in vivo."
Neuron 38(3): 447-460.
Glaven, J. A., I. P. Whitehead, et al. (1996). "Lfc and Lsc oncoproteins represent two new
guanine nucleotide exchange factors for the Rho GTP-binding protein." J Biol Chem
271(44): 27374-27381.
161
Glessner, J. T., K. Wang, et al. (2009). "Autism genome-wide copy number variation reveals
ubiquitin and neuronal genes." Nature 459(7246): 569-573.
Govek, E. E., S. E. Newey, et al. (2005). "The role of the Rho GTPases in neuronal
development." Genes Dev 19(1): 1-49.
Graf, E. R., X. Zhang, et al. (2004). "Neurexins induce differentiation of GABA and glutamate
postsynaptic specializations via neuroligins." Cell 119(7): 1013-1026.
Greer, P. L., R. Hanayama, et al. "The Angelman Syndrome protein Ube3A regulates synapse
development by ubiquitinating arc." Cell 140(5): 704-716.
Grunwald, I. C., M. Korte, et al. (2004). "Hippocampal plasticity requires postsynaptic
ephrinBs." Nat Neurosci 7(1): 33-40.
Grunwald, I. C., M. Korte, et al. (2001). "Kinase-independent requirement of EphB2 receptors in
hippocampal synaptic plasticity." Neuron 32(6): 1027-1040.
Grutzendler, J., N. Kasthuri, et al. (2002). "Long-term dendritic spine stability in the adult
cortex." Nature 420(6917): 812-816.
Hall, A. (1994). "Small GTP-binding proteins and the regulation of the actin cytoskeleton."
Annu Rev Cell Biol 10: 31-54.
Han, S., C. Tai, et al. (2012). "Autistic-like behaviour in Scn1a+/- mice and rescue by enhanced
GABA-mediated neurotransmission." Nature 489(7416): 385-390.
Han, S., F. H. Yu, et al. (2012). "Na(V)1.1 channels are critical for intercellular communication
in the suprachiasmatic nucleus and for normal circadian rhythms." Proc Natl Acad Sci U
S A 109(6): E368-377.
Harada, K., N. Hiramoto-Yamaki, et al. (2011). "Ephexin4 and EphA2 mediate resistance to
anoikis through RhoG and phosphatidylinositol 3-kinase." Exp Cell Res 317(12): 1701-
1713.
Hart, M. J., A. Eva, et al. (1991). "Catalysis of guanine nucleotide exchange on the CDC42Hs
protein by the dbl oncogene product." Nature 354(6351): 311-314.
Haslam, R. J., H. B. Koide, et al. (1993). "Pleckstrin domain homology." Nature 363(6427): 309-
310.
Hayashi-Takagi, A., M. Takaki, et al. (2010). "Disrupted-in-Schizophrenia 1 (DISC1) regulates
spines of the glutamate synapse via Rac1." Nat Neurosci 13(3): 327-332.

162
Heasman, S. J. and A. J. Ridley (2008). "Mammalian Rho GTPases: new insights into their
functions from in vivo studies." Nat Rev Mol Cell Biol 9(9): 690-701.
Henkemeyer, M., O. S. Itkis, et al. (2003). "Multiple EphB receptor tyrosine kinases shape
dendritic spines in the hippocampus." J Cell Biol 163(6): 1313-1326.
Hershko, A. and A. Ciechanover (1998). "The ubiquitin system." Annu Rev Biochem 67: 425-
479.
Hill, C.S., J. Wynne, et al. (1995). "The Rho family GTPases RhoA, Rac1, and Cdc42Hs
regulate
transcriptional activation by SRF." Cell 81: 1159-1170.
Hiramoto-Yamaki, N., S. Takeuchi, et al. (2010). "Ephexin4 and EphA2 mediate cell migration
through a RhoG-dependent mechanism." J Cell Biol 190(3): 461-477.
Holtmaat, A., L. Wilbrecht, et al. (2006). "Experience-dependent and cell-type-specific spine
growth in the neocortex." Nature 441(7096): 979-983.
Hooks, B. M. and C. Chen (2006). "Distinct roles for spontaneous and visual activity in
remodeling of the retinogeniculate synapse." Neuron 52(2): 281-291.
Horii, T., S. Morita, et al. (2009). "Epigenetic regulation of adipocyte differentiation by a Rho
guanine nucleotide exchange factor, WGEF." PLoS One 4(6): e5809.
Hussain, N. K., S. Jenna, et al. (2001). "Endocytic protein intersectin-l regulates actin assembly
via Cdc42 and N-WASP." Nat Cell Biol 3(10): 927-932.
Huveneers, S. and E. H. Danen (2009). "Adhesion signaling - crosstalk between integrins, Src
and Rho." J Cell Sci 122(Pt 8): 1059-1069.
Irie, F. and Y. Yamaguchi (2002). "EphB receptors regulate dendritic spine development via
intersectin, Cdc42 and N-WASP." Nat Neurosci 5(11): 1117-1118.
Jiang, W., T. M. Duong, et al. (1999). "The neuropathology of hyperthermic seizures in the rat."
Epilepsia 40(1): 5-19.
Jiang, Y. H., D. Armstrong, et al. (1998). "Mutation of the Angelman ubiquitin ligase in mice
causes increased cytoplasmic p53 and deficits of contextual learning and long-term
potentiation." Neuron 21(4): 799-811.
Jontes, J. D., J. Buchanan, et al. (2000). "Growth cone and dendrite dynamics in zebrafish
embryos: early events in synaptogenesis imaged in vivo." Nat Neurosci 3(3): 231-237.
Jontes, J. D. and S. J. Smith (2000). "Filopodia, spines, and the generation of synaptic diversity."
Neuron 27(1): 11-14.

163
Kano, M. and K. Hashimoto (2009). "Synapse elimination in the central nervous system." Curr
Opin Neurobiol 19(2): 154-161.
Katzav, S., D. Martin-Zanca, et al. (1989). "vav, a novel human oncogene derived from a locus
ubiquitously expressed in hematopoietic cells." EMBO J 8(8): 2283-2290.
Kayser, M. S., A. C. McClelland, et al. (2006). "Intracellular and trans-synaptic regulation of
glutamatergic synaptogenesis by EphB receptors." J Neurosci 26(47): 12152-12164.
Kayser, M. S., M. J. Nolt, et al. (2008). "EphB receptors couple dendritic filopodia motility to
synapse formation." Neuron 59(1): 56-69.
Kishino, T., M. Lalande, et al. (1997). "UBE3A/E6-AP mutations cause Angelman syndrome."
Nat Genet 15(1): 70-73.
Klein, R. (2009). "Bidirectional modulation of synaptic functions by Eph/ephrin signaling." Nat
Neurosci 12(1): 15-20.
Konur, S. and R. Yuste (2004). "Developmental regulation of spine and filopodial motility in
primary visual cortex: reduced effects of activity and sensory deprivation." J Neurobiol
59(2): 236-246.
Kusuhara, S., Y. Fukushima, et al. (2012). "Arhgef15 promotes retinal angiogenesis by
mediating VEGF-induced Cdc42 activation and potentiating RhoJ inactivation in
endothelial cells." PLoS One 7(9): e45858.
Kwon, H. B. and B. L. Sabatini (2011). "Glutamate induces de novo growth of functional spines
in developing cortex." Nature 474(7349): 100-104.
Lai, K. O. and N. Y. Ip (2009). "Synapse development and plasticity: roles of ephrin/Eph
receptor signaling." Curr Opin Neurobiol 19(3): 275-283.
Lee, H., S. J. Raiker, et al. (2008). "Synaptic function for the Nogo-66 receptor NgR1: regulation
of dendritic spine morphology and activity-dependent synaptic strength." J Neurosci
28(11): 2753-2765.
Lemke, J. R., E. Riesch, et al. (2012). "Targeted next generation sequencing as a diagnostic tool
in epileptic disorders." Epilepsia 53(8): 1387-1398.
Lim, B. K., N. Matsuda, et al. (2008). "Ephrin-B reverse signaling promotes structural and
functional synaptic maturation in vivo." Nat Neurosci 11(2): 160-169.
Lin, Y., B. L. Bloodgood, et al. (2008). "Activity-dependent regulation of inhibitory synapse
development by Npas4." Nature 455(7217): 1198-1204.

164
Linhoff, M. W., J. Lauren, et al. (2009). "An unbiased expression screen for synaptogenic
proteins identifies the LRRTM protein family as synaptic organizers." Neuron 61(5):
734-749.
Lohmann, C. and T. Bonhoeffer (2008). "A role for local calcium signaling in rapid synaptic
partner selection by dendritic filopodia." Neuron 59(2): 253-260.
Lois, C., E. J. Hong, et al. (2002). "Germline transmission and tissue-specific expression of
transgenes delivered by lentiviral vectors." Science 295(5556): 868-872.
Luo, Z. P., G. R. Buttermann, et al. (1996). "Determination of spinal facet joint loads from extra
articular strains--a theoretical validation." J Biomech 29(6): 785-790.
Majewska, A. and M. Sur (2003). "Motility of dendritic spines in visual cortex in vivo: changes
during the critical period and effects of visual deprivation." Proc Natl Acad Sci U S A
100(26): 16024-16029.
Margolis, S. S., J. Salogiannis, et al. (2010). "EphB-mediated degradation of the RhoA GEF
Ephexin5 relieves a developmental brake on excitatory synapse formation." Cell 143(3):
442-455.
Marini, C., I. E. Scheffer, et al. (2011). "The genetics of Dravet syndrome." Epilepsia 52 Suppl
2: 24-29.
Matsuzaki, M., N. Honkura, et al. (2004). "Structural basis of long-term potentiation in single
dendritic spines." Nature 429(6993): 761-766.
Matus, A. (2005). "Growth of dendritic spines: a continuing story." Curr Opin Neurobiol 15(1):
67-72.
Meisler, M. H., J. E. O'Brien, et al. (2010). "Sodium channel gene family: epilepsy mutations,
gene interactions and modifier effects." J Physiol 588(Pt 11): 1841-1848.
Melendez, J., M. Grogg, et al. (2011). "Signaling role of Cdc42 in regulating mammalian
physiology." J Biol Chem 286(4): 2375-2381.
Melendez, J., K. Stengel, et al. (2011). "RhoA GTPase is dispensable for actomyosin regulation
but is essential for mitosis in primary mouse embryonic fibroblasts." J Biol Chem
286(17): 15132-15137.
Michaelson, D., J. Silletti, et al. (2001). "Differential localization of Rho GTPases in live cells:
regulation by hypervariable regions and RhoGDI binding." J Cell Biol 152(1): 111-126.
Micheva, K. D. and S. J. Smith (2007). "Array tomography: a new tool for imaging the
molecular architecture and ultrastructure of neural circuits." Neuron 55(1): 25-36.

165
Murai, K. K., L. N. Nguyen, et al. (2003). "Control of hippocampal dendritic spine morphology
through ephrin-A3/EphA4 signaling." Nat Neurosci 6(2): 153-160.
Murakoshi, H., H. Wang, et al. (2011). "Local, persistent activation of Rho GTPases during
plasticity of single dendritic spines." Nature 472(7341): 100-104.
Nakayama, A. Y., M. B. Harms, et al. (2000). "Small GTPases Rac and Rho in the maintenance
of dendritic spines and branches in hippocampal pyramidal neurons." J Neurosci 20(14):
5329-5338.
Nakayama, A. Y. and L. Luo (2000). "Intracellular signaling pathways that regulate dendritic
spine morphogenesis." Hippocampus 10(5): 582-586.
Newey S.E., V. Velamoor, et al. (2005). "RhoGTPases, denritic structure, and mental
retardation." J
Neurobio 64(1): 58-74.
Nimchinsky, E.A., B.L. Sabatini, et al. (2002). "Structure and function of dendritic spines."
Annu Rev
Physiol 64: 313-354.
Noren, N. K. and E. B. Pasquale (2004). "Eph receptor-ephrin bidirectional signals that target
Ras and
Rho proteins." Cell Signal 16(6): 655-666.
Ogita, H., S. Kunimoto, et al. (2003). "EphA4-mediated Rho activation via Vsm-RhoGEF
expressed specifically in vascular smooth muscle cells." Circ Res 93(1): 23-31.
Okabe, S., A. Miwa, et al. (2001). "Spine formation and correlated assembly of presynaptic and
postsynaptic molecules." J Neurosci 21(16): 6105-6114.
Oliver, A. W., X. He, et al. (2011). "The HPV16 E6 binding protein Tip-1 interacts with
ARHGEF16, which activates Cdc42." Br J Cancer 104(2): 324-331.
Pak, D. T., S. Yang, et al. (2001). "Regulation of dendritic spine morphology by SPAR, a PSD-
95-associated RapGAP." Neuron 31(2): 289-303.
Paradis, S., D. B. Harrar, et al. (2007). "An RNAi-based approach identifies molecules required
for glutamatergic and GABAergic synapse development." Neuron 53(2): 217-232.
Park, H. D., S. R. Kim, et al. (2009). "Two novel HADHB gene mutations in a Korean patient
with mitochondrial trifunctional protein deficiency." Ann Clin Lab Sci 39(4): 399-404.
Penzes, P., A. Beeser, et al. (2003). "Rapid induction of dendritic spine morphogenesis by trans-
synaptic ephrinB-EphB receptor activation of the Rho-GEF kalirin." Neuron 37(2): 263-
274.

166
Penzes, P. and M. E. Cahill (2012). "Deconstructing signal transduction pathways that regulate
the actin cytoskeleton in dendritic spines." Cytoskeleton (Hoboken) 69(7): 426-441.
Pilpel, Y. and M. Segal (2004). "Activation of PKC induces rapid morphological plasticity in
dendrites of hippocampal neurons via Rac and Rho-dependent mechanisms." Eur J
Neurosci 19(12): 3151-3164.
Ryan, X.P., J. Alldritt, et al. (2005). “The Rho-specific GEF Lfc interacts with neurabin and
spinophilin to regulate dendritic spine morphology.” Neuron 47(1): 85-100.
Roberts, T. F., K. A. Tschida, et al. (2010). "Rapid spine stabilization and synaptic enhancement
at the onset of behavioural learning." Nature 463(7283): 948-952.
Rodrigues, N. R., A. M. Theodosiou, et al. (2000). "Characterization of Ngef, a novel member of
the Dbl family of genes expressed predominantly in the caudate nucleus." Genomics
65(1): 53-61.
Ron, D., M. Zannini, et al. (1991). "A region of proto-dbl essential for its transforming activity
shows sequence similarity to a yeast cell cycle gene, CDC24, and the human breakpoint
cluster gene, bcr." New Biol 3(4): 372-379.
Rossman, K. L. and S. L. Campbell (2000). "Bacterial expressed DH and DH/PH domains."
Methods Enzymol 325: 25-38.
Rossman, K. L., C. J. Der, et al. (2005). "GEF means go: turning on RHO GTPases with guanine
nucleotide-exchange factors." Nat Rev Mol Cell Biol 6(2): 167-180.
Rossman, K. L. and J. Sondek (2005). "Larger than Dbl: new structural insights into RhoA
activation." Trends Biochem Sci 30(4): 163-165.
Rossman, K. L., D. K. Worthylake, et al. (2002). "Functional analysis of cdc42 residues required
for Guanine nucleotide exchange." J Biol Chem 277(52): 50893-50898.
Sahin, M., P. L. Greer, et al. (2005). "Eph-dependent tyrosine phosphorylation of ephexin1
modulates growth cone collapse." Neuron 46(2): 191-204.
Sanes, J. R. and J. W. Lichtman (1999). "Development of the vertebrate neuromuscular
junction." Annu Rev Neurosci 22: 389-442.
Scheiffele, P., J. Fan, et al. (2000). "Neuroligin expressed in nonneuronal cells triggers
presynaptic development in contacting axons." Cell 101(6): 657-669.
Schmidt, A. and A. Hall (2002). "Guanine nucleotide exchange factors for Rho GTPases: turning
on the switch." Genes Dev 16(13): 1587-1609.

167
Shamah, S. M., M. Z. Lin, et al. (2001). "EphA receptors regulate growth cone dynamics through
the novel guanine nucleotide exchange factor ephexin." Cell 105(2): 233-244.
Sharfe, N., A. Freywald, et al. (2003). "Ephrin-A1 induces c-Cbl phosphorylation and EphA
receptor down-regulation in T cells." J Immunol 170(12): 6024-6032.
Shi, L., B. Butt, et al. (2010). "Ephexin1 is required for structural maturation and
neurotransmission at the neuromuscular junction." Neuron 65(2): 204-216.
Shi, L., A. K. Fu, et al. (2010). "Multiple roles of the Rho GEF ephexin1 in synapse
remodeling." Commun Integr Biol 3(6): 622-624.
Shi, Y., C. G. Pontrello, et al. (2009). "Focal adhesion kinase acts downstream of EphB receptors
to maintain mature dendritic spines by regulating cofilin activity." J Neurosci 29(25):
8129-8142.
Smith, W. J., B. Hamel, et al. (2005). "A Cdc42 mutant specifically activated by intersectin."
Biochemistry 44(40): 13282-13290.
Snyder, J. T., K. L. Rossman, et al. (2001). "Quantitative analysis of the effect of
phosphoinositide interactions on the function of Dbl family proteins." J Biol Chem
276(49): 45868-45875.
Snyder, J. T., D. K. Worthylake, et al. (2002). "Structural basis for the selective activation of
Rho GTPases by Dbl exchange factors." Nat Struct Biol 9(6): 468-475.
Soisson, S. M., A. S. Nimnual, et al. (1998). "Crystal structure of the Dbl and pleckstrin
homology domains from the human Son of sevenless protein." Cell 95(2): 259-268.
Sondermann, H., S. M. Soisson, et al. (2004). "Structural analysis of autoinhibition in the Ras
activator Son of sevenless." Cell 119(3): 393-405.
Soskis, M. J., H. Y. Ho, et al. (2012). "A chemical genetic approach reveals distinct EphB
signaling mechanisms during brain development." Nat Neurosci 15(12): 1645-1654.
Sotelo, C. (1991). "Cerebellar synaptogenesis: mutant mice--neuronal grafting." J Physiol (Paris)
85(3): 134-144.
Sotiropoulos, A., D. Gineitis, et al. (1999). "Signal-regulated activation of serum response factor
is
mediated by changes in actin dynamics." Cel, 98: 159-169.
Stevens, B., N. J. Allen, et al. (2007). "The classical complement cascade mediates CNS synapse
elimination." Cell 131(6): 1164-1178.

168
Stoppini, L., P. A. Buchs, et al. (1991). "A simple method for organotypic cultures of nervous
tissue." J Neurosci Methods 37(2): 173-182.
Takasu, M. A., M. B. Dalva, et al. (2002). "Modulation of NMDA receptor-dependent calcium
influx and gene expression through EphB receptors." Science 295(5554): 491-495.
Tanegashima, K., H. Zhao, et al. (2008). "WGEF activates Rho in the Wnt-PCP pathway and
controls convergent extension in Xenopus gastrulation." EMBO J 27(4): 606-617.
Tashiro, A., A. Minden, et al. (2000). "Regulation of dendritic spine morphology by the rho
family of small GTPases: antagonistic roles of Rac and Rho." Cereb Cortex 10(10): 927-
938.
Tashiro, A. and R. Yuste (2004). "Regulation of dendritic spine motility and stability by Rac1
and Rho kinase: evidence for two forms of spine motility." Mol Cell Neurosci 26(3): 429-
440.
Tolias, K. F., J. B. Bikoff, et al. (2005). "The Rac1-GEF Tiam1 couples the NMDA receptor to
the activity-dependent development of dendritic arbors and spines." Neuron 45(4): 525-
538.
Tolias, K. F., J. B. Bikoff, et al. (2007). "The Rac1 guanine nucleotide exchange factor Tiam1
mediates EphB receptor-dependent dendritic spine development." Proc Natl Acad Sci U
S A 104(17): 7265-7270.
Trachtenberg, J. T., B. E. Chen, et al. (2002). "Long-term in vivo imaging of experience-
dependent synaptic plasticity in adult cortex." Nature 420(6917): 788-794.
Tsyba, L., O. Nikolaienko, et al. (2011). "Intersectin multidomain adaptor proteins: regulation of
functional diversity." Gene 473(2): 67-75.
Varoqueaux, F., A. Sigler, et al. (2002). "Total arrest of spontaneous and evoked synaptic
transmission but normal synaptogenesis in the absence of Munc13-mediated vesicle
priming." Proc Natl Acad Sci U S A 99(13): 9037-9042.
Veeramah, K. R., L. Johnstone, et al. (2013). "Exome sequencing reveals new causal mutations
in children with epileptic encephalopathies." Epilepsia.
Verhage, M., A. S. Maia, et al. (2000). "Synaptic assembly of the brain in the absence of
neurotransmitter secretion." Science 287(5454): 864-869.
Wang, L., K. Zhu, et al. (2004). "Oncogenic Dbl, Cdc42, and p21-activated kinase form a ternary
signaling intermediate through the minimum interactive domains." Biochemistry 43(46):
14584-14593.
169
Wegner, A. M., C. A. Nebhan, et al. (2008). "N-wasp and the arp2/3 complex are critical
regulators of actin in the development of dendritic spines and synapses." J Biol Chem
283(23): 15912-15920.
Wei, Q., X. Y. Lu, et al. (2004). "Glucocorticoid receptor overexpression in forebrain: a mouse
model of increased emotional lability." Proc Natl Acad Sci U S A 101(32): 11851-11856.
Williams, C. A. (2005). "Neurological aspects of the Angelman syndrome." Brain Dev 27(2): 88-
94.
Wills, Z. P., C. Mandel-Brehm, et al. (2012). "The nogo receptor family restricts synapse number
in the developing hippocampus." Neuron 73(3): 466-481.
Xia, Z., H. Dudek, et al. (1996). "Calcium influx via the NMDA receptor induces immediate
early gene transcription by a MAP kinase/ERK-dependent mechanism." J Neurosci
16(17): 5425-5436.
Xie, X., S. W. Chang, et al. (2005). "TIM, a Dbl-related protein, regulates cell shape and
cytoskeletal organization in a Rho-dependent manner." Cell Signal 17(4): 461-471.
Xu, T., X. Yu, et al. (2009). "Rapid formation and selective stabilization of synapses for
enduring motor memories." Nature 462(7275): 915-919.
Yang, G., F. Pan, et al. (2009). "Stably maintained dendritic spines are associated with lifelong
memories." Nature 462(7275): 920-924.
Yashiro, K., T. T. Riday, et al. (2009). "Ube3a is required for experience-dependent maturation
of the neocortex." Nat Neurosci 12(6): 777-783.
Yeh, B. J., R. J. Rutigliano, et al. (2007). "Rewiring cellular morphology pathways with
synthetic guanine nucleotide exchange factors." Nature 447(7144): 596-600.
Yen, H. C., Q. Xu, et al. (2008). "Global protein stability profiling in mammalian cells." Science
322(5903): 918-923.
Yohe, M. E., K. Rossman, et al. (2008). "Role of the C-terminal SH3 domain and N-terminal
tyrosine phosphorylation in regulation of Tim and related Dbl-family proteins."
Biochemistry 47(26): 6827-6839.
Yohe, M. E., K. L. Rossman, et al. (2007). "Auto-inhibition of the Dbl family protein Tim by an
N-terminal helical motif." J Biol Chem 282(18): 13813-13823.
Yu, B., I. R. Martins, et al. (2010). "Structural and energetic mechanisms of cooperative
autoinhibition and activation of Vav1." Cell 140(2): 246-256.
Yuste, R. and T. Bonhoeffer (2004). "Genesis of dendritic spines: insights from ultrastructural
and imaging studies." Nat Rev Neurosci 5(1): 24-34.

170
Zhai, R. G., H. Vardinon-Friedman, et al. (2001). "Assembling the presynaptic active zone: a
characterization of an active one precursor vesicle." Neuron 29(1): 131-143.
Zhang, W. and D. L. Benson (2001). "Stages of synapse development defined by dependence on
F-actin." J Neurosci 21(14): 5169-5181.
Zheng, J., S. M. Cahill, et al. (1996). "Identification of the binding site for acidic phospholipids
on the pH domain of dynamin: implications for stimulation of GTPase activity." J Mol
Biol 255(1): 14-21.
Zhu, K., B. Debreceni, et al. (2000). "Identification of Rho GTPase-dependent sites in the Dbl
homology domain of oncogenic Dbl that are required for transformation." J Biol Chem
275(34): 25993-26001.
Zito, K., V. Scheuss, et al. (2009). "Rapid functional maturation of nascent dendritic spines."
Neuron 61(2): 247-258.
Ziv, N. E. and S. J. Smith (1996). "Evidence for a role of dendritic filopodia in synaptogenesis
and spine formation." Neuron 17(1): 91-102.
Zukerberg, L. R., G. N. Patrick, et al. (2000). "Cables links Cdk5 and c-Abl and facilitates Cdk5
tyrosine phosphorylation, kinase upregulation, and neurite outgrowth." Neuron 26(3):
633-646.