Embed Size (px)
Citation preview

Trinity Mirror plcRegistered office: One Canada Square Canary Wharf, London E14 5AP T: 020 7293 3000F: 020 7293 3405www.trinitymirror.com
Company number: 82548

Trinity Mirror plc
Annual Report and Accounts 2005

Powerful brands, journalistic excellence andeffective platforms for advertisers. Trinity Mirror’sessential attributes are as relevant and compelling in today’s digital age as they were when the first copies of our newspapers rolled off the presses more than a century ago.
Our core business is the printed word, and ournewspapers will continue to be highly successful.However, the Group is also becoming a multi-platformpublisher, delivering news, information and advertisingacross a range of digital media.
The media landscape is evolving, and with our leadingnewspaper titles now complemented by a portfolio of digital brands, Trinity Mirror is already beginning to exploit the opportunities this evolution presents.
Chairman’s statement 4 Chief Executive’s statement 6 Business review 10Corporate responsibility 31Board of Directors and Executive Committee 40Corporate governance 44Remuneration report 48Directors’ report 57Group independent auditors’ report 59Accounts and notes 60Unaudited other information 102Holding company accounts and notes 108Investor Relations 116
Contents
1

4x4 Mart / Abergele Visitor / Ad-Mag / Airdrie & Coatbridge Advertiser / Airdrie & Coatbridge World / Anfield Liv/ Barking & Dagenham Yellow Advertiser / Barnet Press Series / Barry Post / Basildon Yellow Advertiser / BedwBirmingham News / Birmingham Post / www.Birmingham.Adzooks.co.uk / Blackmore Vale Magazine / Blairgow& Wembley Leader / Brentwood Yellow Advertiser / Bridgend Post / Bromborough Bebington News / BuckinghBurntwood Chase Post / Canterbury Adscene / Cardiff Post / www.Cardiff.Adzooks.co.uk / Castle Point Yellow/ Chronicle Specials / Citizen / Clyde Weekly News / Coalville & Ashby Echo / www.communitiestoday.co.uk / Communi/ Crawley News / Crewe Chronicle / Crewe Mail / www.cricketbase.com / Crosby Herald / Croydon Advertiser Daily Mirror / Daily Post (Wales) / Daily Record / www.dailyrecord.co.uk / Derby Trader / Dover Express / Dumfrie/ East Kent Gazette / East Kilbride News / East Kilbride World / Ellesmere Port Pioneer / Enfield, Southgate & Ea Job / www.fish4.co.uk / www.fish4.co.uk/cars / www.fish4.co.uk/homes / www.fish4.co.uk/jobs / www.fish4.c& Hammersmith Chronicle / www.gaapweb.com / Gateshead Herald & Post / Gatwick Skyport / Glamorgan GaAdvertiser / Harrow Leader / Harrow Observer / Havering Yellow Advertiser / Heathrow Skyport / Herne Bay &Mail / Horley Post / www.hotrecruit.com / Hounslow Borough Chronicle / Hounslow Informer Series / HoylakeHuddersfield Daily Examiner / Huyton & Roby Star / www.icAyrshire.co.uk / www.icBerkshire.co.uk / www.icBirmi/ www.icCroydon.co.uk / www.icDumfries.co.uk / www.icDunbartonshire.co.uk / www.icEaling.co.uk / www.icEwww.icLanarkshire.co.uk / www.icLichfield.co.uk / www.icLiverpool.co.uk / www.icLoughborough.co.uk / ww/ www.icPerthshire.co.uk/www.icRenfrewshire.co.uk / www.icScotland.co.uk / www.icSefton&Westlancs.co.uk / www./ www.icSurreyOnline.co.uk / www.icSuttoncoldfield.co.uk / www.icTamworth.co.uk / www.icTeesside.co.uk / wwwww.icWestlothian.co.uk / www.icWirral.co.uk / www.icWolverhampton.co.uk / Ilkeston & Ripley Trader / Irvine / www.jobsfinancial.co.uk / www.Jobs-Merseyside.co.uk / www.JobsMidlands.com / www.JobsNorthEast.co.uk / wKenilworth Citizen / Kenilworth Times / Kensington & Chelsea Informer / Kettering Herald & Post / Kilmarnock StandardPost / Liverpool Daily Post / Liverpool Echo / www.Liverpool.Adzooks.co.uk / www.London.Adzooks.co.uk / LonStar / Maidenhead Express / Maidstone Adscene / Market Harborough Herald & Post / Medway Adscene / MeNorth East / Metro Scotland / www.micromart.co.uk / Midweek Advertiser / Midweek Chronicle / Midweek PinMoren Post / www.musicmartonline.co.uk / Neath & Port Talbot Guardian / Neston News / Newbury & ThatchExclusive / North Tyne H&P / North Wales Weekly News / www.NorthWales.Adzooks.co.uk / Northampton Hera/ Ormskirk Advertiser / www.people.co.uk / Perth Advertiser / Perth Shopper / Peterborough Herald & Post / www.plan/ Quids In / www.racingpost.co.uk / www.racingpostgaming.co.uk / www.racingpostpoker.co.uk / Reading Chro& Prestatyn Visitor / Richmond Informer / Royal Leamington Spa Times / RPGaming / Runcorn & Widnwww.secsinthecity.co.uk / Sittingbourne Adscene / Skelmersdale Advertiser / Slough Express / www.smartnewDurham Herald & Post / South Liverpool Merseymart / South London Press / South Tyne H&P / South Wales EStafford Post / Staines Informer / Staines Leader / Stamford Herald & Post / www.stampmart.co.uk / StansteStreatham, Clapham & West Norwood Post / Sunday Mail / Sunday Mercury / Sunday Sun / www.sundaymaEpsom Post Series / Sutton Coldfield News / Tamworth Times / Teesside Herald & Past / www.Teesside.Adzoo/ The Journal / The Lennox / The Mercury / The One Directory Ayrshire / The One Directory Edinburgh / The One Diwww.thegraduate.co.uk / Thurrock Yellow Advertiser / Traders Journal / Tribune / Uxbridge & West Drayton Gaz/ Waltham Forest Yellow Advertiser / Walton & Weybridge Informer / Warwick Times / Wellingborough & RushdeMail / Whitchurch Herald / Willenhall, Wednesbury, Darlaston Adnews / Wimbledon Post / Windsor Express / Wis/ Wots Wot / Wrexham Mail / Your Time / 4x4 Mart / Abergele Visitor / Ad-Mag / Airdrie & Coatbridge Advertise/ Ayrshire World / Bangor & Anglesey Mail / Barking & Dagenham Yellow Advertiser / Barnet Press Series / BarryEvening Mail / Birmingham Forward / Birmingham News / Birmingham Post / www.Birmingham.Adzooks.co.uMidweek News / Bracknell News / Brent & Wembley Leader / Brentwood Yellow Advertiser / Bridgend Post / BBuySell / Caernarfon Herald / Cannock, Burntwood Chase Post / Canterbury Adscene / Cardiff Pwww.Cheshire.Adzooks.co.uk / Chester Chronicles / Chester Mail / Chronicle Specials / Citizen / Clyde WeeklyCorby Herald & Post / Coventry Evening Telegraph / www.Coventry.Adzooks.co.uk / Crawley News / Crewe ChNews / Croydon Post / www.cto.co.uk / Culture Magazine / Cynon Valley Leader / Daily Mirror / Daily Post (WaDumfries & Galloway Today / Ealing Gazette / Ealing Leader / East Grinstead Observer / East Kent Gazette / Edmonton Gazette / Evening Chronicle / Exclusive / Farm Trader / Faversham Times / Find a Job / www.fish
2

verpool Star / Ashford Adscene / Atherstone Tribune / Ayrshire Post / Ayrshire World / Bangor & Anglesey Mailworth Echo / Bexley Borough Mercury / Birkenhead News / Birmingham Evening Mail / Birmingham Forward /
wrie Advertiser / Bootle Times / Brackley & Towcester Post / Bracknell Midweek News / Bracknell News / Brenthamshire Advertiser & Examiner / Burton Trader / Business in Wales / BuySell / Caernarfon Herald / Cannock,
w Advertiser / Chelmsford Yellow Advertiser / www.Cheshire.Adzooks.co.uk / Chester Chronicles / Chester Maility Magazine / Confetti Magazine / Corby Herald & Post / Coventry Evening Telegraph / www.Coventry.Adzooks.co.ukSeries / Croydon Business News / Croydon Post / www.cto.co.uk / Culture Magazine / Cynon Valley Leader /
es & Galloway Standard / Dumfries & Galloway Today / Ealing Gazette / Ealing Leader / East Grinstead ObserverEdmonton Gazette& Edmonton Gazette / Evening Chronicle / Exclusive / Farm Trader / Faversham Times / Findo.uk/lettings / Folkestone & Dover Adscene / Folkestone Herald / Formby Times / Fosseway Magazine / Fulhamazette / Golf North East / Golfers Chronicle / Gwent Gazette / Hamilton Advertiser / Hamilton World / Haringey
& Whitstable Times / Heswall News / Hinckley Herald & Journal / Hinckley Journal / Hinckley Times / Holyheade News / Huddersfield Express & Chronicle / Huddersfield Weekly News / www.Huddersfield.Adzooks.co.uk /ngham.co.uk / www.icBurton.co.uk / www.icCannock.co.uk / www.icCheshireOnline.co.uk / www.icCoventry.co.uk ssex.co.uk / www.icHarrow.co.uk / www.icHounslow.co.uk / www.icHuddersfield.co.uk / www.icKent.co.uk /
ww.icNewcastle.co.uk / www.icNortheast.co.uk / www.icNorthLondonOnline.co.uk / www.icNorthWales.co.uk icSolihull.co.uk / www.icSouthLondon.co.uk / www.icStafford.co.uk / www.icStaines.co.uk / www.icStirlingshire.co.uk
ww.icTheWharf.co.uk / www.icUxbridge.co.uk / www.icWales.co.uk / www.icWalsall.co.uk / www.icWessex.co.uk /Herald / Isle of Thanet Gazette / www.JobsNorthEast.co.uk / www.Jobs-Cheshire.co.uk / www.jobsearch.co.uk
www.Jobs-SouthEast.co.uk / www.JobsWales.co.uk / www.JobsWestYorkshire.co.uk / Journal Specials / Just Jobs /d / Kingston Informer / Leamington Times / Lewisham & Greenwich Mercury / LFC Magazine / Lichfield & Rugelyng Eaton Advertiser / Long Eaton Trader / Loughborough Echo / Loughborough Trader Extra / Maghull & Aintreeedway News / Medway Standard / Merthyr Express / Metro Cardiff / Metro Liverpool / Metro Midlands / Metronk / Midweek Visitor Series / www.mirror.co.uk / Mitcham Post / www.modelmart.co.uk / Molyneux Promoter /am Chronicle / Newcastle Herald & Post / www.Newcastle.Adzooks.co.uk / North Ayrshire World / North East
ald & Post / Northumberland H&P / Northwich Chronicle / Northwich Mail / Nu News / Nuneaton Weekly Tribunenetrecruit.com / Pontypridd & Llantrisant Observer / www.PublicJobs-NorthWest.co.uk / www.PublicJobsWales.co.ukonicle / Redbridge Yellow Advertiser / Redhill Post / Reigate Post / Renfrewshire World / Rhondda Leader / Rhylnes Herald & Post / Runcorn & Widnes Weekly News / www.scotcareers.co.uk / Scottish Recruitment /
whomes.com / www.soccerbase.com / Solihull & Warwickshire Guardian / Solihull News / Solihull Times / SouthEcho / South Wirral News / Southend Yellow Advertiser / Southport Visitor / Space Magazine / Sports Argus /ead Skyport / Stirling Observer Friday / Stirling Observer Wednesday / Stirling Shopper / Strathearn Herald /
ail.co.uk / Sunday Mirror / www.sundaymirror.co.uk / Surrey Herald & Staines News / Surrey Mirror / Sutton &ks.co.uk / Thanet Adscene / Thanet Times / The Community Magazine / The Galloway News / The Glaswegianrectory Fife / The One Directory Lanarkshire / The People / The Reformer / The Wharf / www.thebettingsite.co.uk /zette / Uxbridge Leader / Vale Advertiser / Village Visitor / Wales on Sunday / Wallasey News / Walsall Observern Herald & Post / West Derby & Tuebrook Merseymart / West London Informer / West Lothian Courier / Westernshaw Press / Wishaw World / WM Magazine / Woking Informer / Wolverhampton Ad News / www.workthing.comer / Airdrie & Coatbridge World / Anfield Liverpool Star / Ashford Adscene / Atherstone Tribune / Ayrshire PostPost / Basildon Yellow Advertiser / Bedworth Echo / Bexley Borough Mercury / Birkenhead News / Birmingham
uk / Blackmore Vale Magazine / Blairgowrie Advertiser / Bootle Times / Brackley & Towcester Post / BracknellBromborough Bebington News / Buckinghamshire Advertiser & Examiner / Burton Trader / Business in Wales /Post / www.Cardiff.Adzooks.co.uk / Castle Point Yellow Advertiser / Chelmsford Yellow Advertiser /y News / Coalville & Ashby Echo / www.communitiestoday.co.uk / Community Magazine / Confetti Magazine /hronicle / Crewe Mail / www.cricketbase.com / Crosby Herald / Croydon Advertiser Series / Croydon Businessales) / Daily Record / www.dailyrecord.co.uk / Derby Trader / Dover Express / Dumfries & Galloway Standard /East Kilbride News / East Kilbride World / Ellesmere Port Pioneer / Enfield, Southgate & Edmonton Gazette&
h4.co.uk / www.fish4.co.uk/cars / www.fish4.co.uk/homes / www.fish4.co.uk/jobs / www.fish4.co.uk/lettings /
=8.3million*Source: Nielsen Netratings, Hitbox, internal (January 2006).
Number of unique users
Over the course of a week 19 million people read at least one of our newspapers
of the UK adult populationSource: January-June 2005 VFO/ABC.
*Aggregation of separate network sites.
=40.1%
3
Brands

*On a like-for-like basis, which is before acquisitions, non-recurring items, IAS 39 and for 2004 excludes the additional week’s trading. See reconciliation between statutory and like-for-like results on page 102.
+1.7%+6.7%+8.4%
*operatingprofit
*eps
dividend
Chairman’s statement / Chief Executive’s statement / Business review / Corporate responsibility / Board of Directorsand Executive Committee / Corporate governance / Remuneration report / Directors’ report / Group independent auditors’report / Accounts and notes / Unaudited other information / Holding company accounts and notes / Investor Relations
4

Trinity Mirror delivered a positive performance in 2005. Operating profit* increased by 1.7% to £250.2 millionand profit before tax* improved by 5.9% to £220.9 million. Although on a like-for-like basis revenue declinedby 1.3%, we again improved Group operating margin*, from 21.8% to 22.5%.
Seen in the context of our marketplace, these are good results. The year started with an encouragingadvertising market but, as the economy slowed, reducing consumer confidence, 2005 became increasinglychallenging, particularly for our industry. The weakening economy impacted most advertising categories, with especially difficult conditions for display and recruitment advertising. Further volatility was created by theGeneral Election and the consequential impact on public sector advertising.
Against this background, Trinity Mirror continues to reap the benefit of our ‘Stabilise Revitalise Grow’ strategy.The market conditions resulted in management taking immediate and decisive action from the first quarter tomitigate the effects of the economic downturn and to manage the business on the assumption that tradingwould not improve and might indeed worsen. That action proved timely and our full-year results include thebenefit of exceeding our £35 million cost savings target by £5 million. Further net cost savings of at least£15 million have been targeted for 2006.
At the same time, we actively pursued our digital strategy. We acquired four complementary on-lineadvertising businesses and a small traditional recruitment consultancy business for £92.7 million, includingdeferred consideration of £5.5 million. Despite this cash outflow, and the return of £52.7 million toshareholders under our share buy-back programme, the strong cash flows from our businesses ensured that our net debt for the year rose by merely £37.6 million to £492.5 million.
The pressure on earnings continues as there is as yet no sign of improvement in our traditional advertisingmarkets. But the Board remains confident with the strong cash flow characteristics of our businesses and in thelight of a good performance in 2005 proposes to increase the final dividend by 8.4% to 15.5p per share. Thismeans that our dividend for the year increased to 21.9p per share from 20.2p last year. However, in order tomaintain financial headroom for further investment in our businesses and any prospective acquisitions identified in pursuit of our strategy, the Board will continue the suspension of our £250 million share buy-back programme.
Our industry remains challenged by changing patterns of behaviour, but we believe we have the right strategyto develop opportunities for growth both through acquisition and organically within our existing businesses.The Board is confident that the talent and resources of the Group will enable us to deliver a satisfactoryoutcome for 2006.
For further information, go to ‘webcast’ on
www.trinitymirror.com/ir/results
Chairman’s statement
*Before acquisitions, non-recurring items, IAS 39 and for 2004 excludes the additional week’s trading. See reconciliation between statutory and like-for-like results on page 102.
The strength of our businesses lies in the talent, the commitment and the creativity of our people at alllevels, in management, in operations and in support functions. They have performed wonderfully well indifficult conditions throughout 2005 and I know that they remain very committed to the success of thisGroup. On behalf of the Board, and our shareholders, I would like to thank them for their dedicationand enthusiasm.
Against this background, and on a personal note, it is with mixed feelings that I will step down from theBoard of Trinity Mirror at the Annual General Meeting. My time with the company has been hugely enjoyable,not least because of the tremendous spirit and talent of the people I have had the pleasure to work with.However, one of the most important jobs of the Chairman is to encourage succession planning, includingfor their own position, and I believe that now is the right time to go. There is a solid foundation for thefuture management of the business, and the Group is well placed to meet the challenges that lie ahead.
So, while I will be very sad to leave my colleagues, I will do so with immense confidence in their abilityto deliver the very best for the Group and its shareholders.
Sir Victor Blank

Our three-phase performance-based strategy ‘Stabilise Revitalise Grow’ forms the cornerstone of oursuccess in achieving strong results in the face of the UK’s advertising slowdown. It will continue to providethe foundation for future growth and stability across the Group as we create a sustainable and value-enhancing media business.
The core portfolio performed well during 2005 despite the difficult advertising environment. Our Regionalsdivision improved both operating profit* and margin*, despite extremely difficult revenue conditions whichsaw a sharp decline in recruitment advertising, our most profitable advertising category. Despite theadverse revenue environment we continued to invest in the portfolio, revitalising and relaunching existingtitles to ensure they remain relevant, compelling propositions for both readers and advertisers.
Our commitment to excellence in journalism and marketing saw us conduct the UK’s biggest ever regionalpress survey during 2005. The findings will help shape further product development across the Regionalsportfolio and ensure our products deliver to the needs of our readers and advertisers during 2006 and beyond.
While circulation volumes continue to be challenging the division’s ABC performance remains in line with or ahead of the market.
Our National titles were also impacted by the advertising downturn. However, management mitigated theeffects of reduced revenues through cost initiatives, and the division saw circulation revenue* growth,profit* growth and margin* progression.
In Scotland we continued the development of The One Directory and doubled the number of editions fromtwo to four during the year. Scotcareers, launched in 2004, moved to break-even and has now becomethe number two on-line recruitment site in Scotland.
Chairman’s statement / Chief Executive’s statement / Business review / Corporate responsibility / Board of Directorsand Executive Committee / Corporate governance / Remuneration report / Directors’ report / Group independent auditors’report / Accounts and notes / Unaudited other information / Holding company accounts and notes / Investor Relations
Our Sports division delivered improved revenues* and profit* despite the advertising slowdown. It is welladvanced in plans to maintain the Racing Post’s leadership in the racing and sports betting markets.
We have continued our investment programme in colour presses, in July announcing an £83 millioninvestment over three years in new printing presses. This investment will provide our Nationals print siteswith full colour capability by the start of 2008. Coupled with previous investment this provides full colouracross the Group’s manufacturing network with the exception of Liverpool and Newcastle. We do notenvisage repressing these sites in the medium term. We are also pleased with the progress made on thejoint press investment with GMG Regionals at our Oldham press site. Production using the new equipmentbegan in January 2006.
During 2005, in addition to strengthening our core portfolio, we have focused on driving real growth fromnew initiatives, deepening our presence in our core markets and geographies, both in print and on-line.Further segmentation of our markets through product layering - targeting different products at differentconsumer and advertiser segments - is allowing us to pursue new opportunities via launch and acquisition,while ensuring our existing market-leading positions are maintained in a changing media landscape.
6
Chief Executive’s statement
For further information, go to ‘webcast’ onwww.trinitymirror.com/ir/results
*On a like-for-like basis, which is before acquisitions, non-recurring items, IAS 39 and for 2004 excludes the additional week’s trading.

‘Stabilise RevitaliseGrow’ forms thecornerstone of our success
Chairman’s statement / Chief Executive’s statement / Business review / Corporate responsibility / Board of Directorsand Executive Committee / Corporate governance / Remuneration report / Directors’ report / Group independent auditors’report / Accounts and notes / Unaudited other information / Holding company accounts and notes / Investor Relations
7

Any decision to launch or acquire is carefully considered against a range of factors. Consideration is given to the importance of the sector, our existing brand or market strength and expertise, the competitivenature of the market, the time needed to build a strong position, the scarcity of assets and our return on investment.
In our Regional business, continuing to renew and grow our core portfolio through launch is a key elementof the Regionals strategy. 2005 saw the launch of five weekly newspapers, both paid-for and free, achievingour aims of strengthening our position within existing marketplaces and expanding our publishing footprint.These are all profitable in their first year. 2006 will see the launch of two new Metros in Liverpool and Cardiff,building on the success of the Group’s three existing Metro titles.
2005 also saw continuing development of our digital activities, both via launch and acquisition. Our initiallaunch focus has been in the key classified category of recruitment advertising and during the year welaunched a total of nine local recruitment sites. Our aim is to win strong, profitable positions on-line thatcomplement our print brands. Revenues are being driven from up-selling print to local on-line sites. This complements our national position with Fish4. The launches also enable us to capture local on-lineonly revenues. We also launched ten local community sites focusing on low-end classified “for sale” and“wanted” advertising, a further example of our market-layering approach. Initially revenues are expected to be minimal for these digital launches. However, more importantly, they establish a foothold in newmarkets and revenues will build over time. Progress continues in 2006 with the launch of ten local property sites and five motor sites.
During the year we successfully completed the acquisition of four market-leading digital businesses: the hotgroup, GAAPweb and Secsinthecity in the recruitment classified sector and Smartnewhomes in the property sector. Each acquisition adds scale in key markets and is complementary to our existingprint portfolio, enabling us to expand nationally beyond our existing regional footprint. They also allow usto build upon our print strengths, as is the case with Smartnewhomes, or provide access to new marketsegments where we are less strong in print, as is the case with financial jobs site GAAPweb.
Strong media businesses build a track record of innovation as a means of driving growth, resulting in successful new products that build new revenues and profits. During 2005 we launched a total of 36 new products and services, including weekly paid-for and freenewspapers, on-line brands, directories and shows. These investments continue to be funded from our existing resources.
Chairman’s statement / Chief Executive’s statement / Business review / Corporate responsibility / Board of Directorsand Executive Committee / Corporate governance / Remuneration report / Directors’ report / Group independent auditors’report / Accounts and notes / Unaudited other information / Holding company accounts and notes / Investor Relations
8

Significant progress has been made with the integration of these assets, which now benefit from the scaleand reach the Group provides. We have strengthened their management structures, including theappointment of a Head of Digital Recruitment. Smartnewhomes is now fully integrated into the activities of our Regionals division.
Overall, across the businesses, despite the difficult trading conditions, the year has been characterised bystrong development of the portfolio via both launch and acquisition, coupled with a continued tight focuson cost management. Our strategy remains on course and we believe that our actions during 2005 haveresulted in a stronger business, which is well equipped to meet the challenges of the future.
Board changesIn January 2006 Sir Victor Blank, the Chairman of the Group, announced he will be retiring from the Boardat the Company’s Annual General Meeting in May 2006.
Sir Victor has made a significant contribution over a number of years during which he oversaw the creationof the UK’s largest newspaper group when Mirror Group merged with Trinity in 1999. The Board would liketo thank him for his enthusiasm and dedication and for the support he has given the management team to help develop our business.
The process to recruit a new Chairman is well advanced.
Sly Bailey
Chairman’s statement / Chief Executive’s statement / Business review / Corporate responsibility / Board of Directorsand Executive Committee / Corporate governance / Remuneration report / Directors’ report / Group independent auditors’report / Accounts and notes / Unaudited other information / Holding company accounts and notes / Investor Relations
9
We build a trackrecord of innovationas a means of driving growth

Like-for-like* Statutory
2005 2004 2005 200452 weeks 52 weeks % 52 weeks 53 weeks %
£m £m Change £m £m Change
Revenue 1,112.8 1,127.5 (1.3)% 1,122.0 1,141.7 (1.7)%
Operating profit 250.2 246.1 1.7% 245.4 242.8 1.1%
Profit before tax 220.9 208.5 5.9% 209.5 207.1 1.2%
Earnings per share 52.6p 49.3p 6.7% 50.3p 49.2p 2.2%
Dividend per share† 21.9p 20.2p 8.4%
Net debt 492.5 454.9‡
*Before acquisitions, non-recurring items, IAS 39 and for 2004 excludes the additional week’s trading. See reconciliation between statutory and like-for-like results on page 102.
†Interim dividend and proposed final dividend for the 52 weeks ended 1 January 2006 (2004: 53 weeks ended 2 January 2005).
‡After adoption of IAS 39 on 3 January 2005.
Within the following Business Review all figures are presented on a like-for-like basis (which is excluding the impact
of acquisitions, non-recurring items, IAS 39 and the extra week’s trading in 2004), unless otherwise stated, and reflect
the impact of implementing International Financial Reporting Standards (IFRS) for both 2005 and 2004. A reconciliation
between the like-for-like and statutory numbers is provided on page 102. A full reconciliation of the performance
from IFRS to UK GAAP applicable at 2 January 2005 is shown on pages 104 to 105.
Financial highlights
Chairman’s statement / Chief Executive’s statement / Business review / Corporate responsibility / Board of Directorsand Executive Committee / Corporate governance / Remuneration report / Directors’ report / Group independent auditors’report / Accounts and notes / Unaudited other information / Holding company accounts and notes / Investor Relations
10

Group
Trinity Mirror publishes over 240 Regional newspapers, fiveNational titles and four Sports newspapers. The Group alsooperates more than 100 on-line brands and a specialistMagazines and Exhibitions business.
2005 was characterised by a slowing economy that contributedto a sluggish retail sales environment, limited corporate profitgrowth and increasing unemployment. The combination of theseadverse market conditions resulted in an extremely difficultadvertising environment, which had a negative impact on theGroup’s revenues from March 2005. However, decisivemanagement action throughout the year to maximise advertisingrevenues in a declining market and tight management of costsenabled the Group to deliver a strong performance.
On a like-for-like basis Group operating profits* increased by 1.7% from £246.1 million to £250.2 million despite Grouprevenues* declining by 1.3% from £1,127.5 million to£1,112.8 million. On a statutory basis Group revenues, whichinclude acquisitions during the year, and for 2004 include an extra week’s trading, fell by 1.7% from £1,141.7 million to£1,122.0 million while Group operating profits increased by 1.1% from £242.8 million to £245.4 million.
The 2005 results reflect the continued benefits of theperformance-improving ‘Stabilise Revitalise Grow’ strategy. Even in a declining advertising market the Group has been able to deliver increasing operating profits. Key activities drivingperformance in 2005 included:• Tight cost management. The Group exceeded its cost savings
targets for 2005, with annualised net cost savings of £40 millioncompared to a target of £35 million and net incremental costsavings of £12 million on 2004. In addition, due to the adverseoutlook for the advertising environment the Group hascommenced a further cost reduction programme with targetednet cost savings of at least £15 million in 2006.
• New supplements and improved sales packages to maximiseadvertising revenues in a declining market.
• Investment in editorial content, availability and targetedmarketing to drive circulation volume performance.
• Benefits of reduced operating expenditure as a result of thenetwork approach to Manufacturing.
• Continued growth in on-line revenues and profits.
In the Regionals division our newspaper titles continued to deliverstrong results supported by ongoing improvements from ourMetro titles and Digital activities. While circulation volumesremained under pressure, the Regional titles performed in line withor ahead of the market in most sectors and circulation revenuescontinued to grow.
The National newspapers continued to operate in a highlycompetitive environment driven by heavy marketing spend andprice discounting by competitor titles. Against this backdrop, the division performed robustly in 2005.
In addition to initiatives to improve results in a challenging tradingenvironment, the Group continued to focus on the medium tolonger-term objectives of the ‘Stabilise Revitalise Grow’ strategyand made progress on a number of fronts:• Launch of 36 new print and on-line products supporting and
extending our core businesses.• To deepen and extend our presence in core markets four
complementary on-line businesses were acquired. Thesebusinesses provide strong recruitment and new propertyadvertising platforms and also include a small traditionalrecruitment consultancy business.
• Continuation of the capital and revenue investment programmeto maintain market competitiveness of our businesses and drivefuture revenue growth. Progress included:– the continued roll-out of a new advertising booking system
to improve customer service and drive advertising revenues;– a large-scale readership research programme to support
advertising sales and inform product development;– a further £83 million capital investment programme in our
manufacturing network securing full colour for our all national newspapers and some regional newspapers by early 2008.
• Continuation of our property rationalisation programme resultingin property and land disposal proceeds totalling £4.0 million.
• The return of £52.7 million to shareholders through the sharebuy-back programme. However, to maintain financial headroomfor investment the £250 million share buy-back programme willremain suspended during 2006.
2005 was a year in which management increasingly focused on delivering growth from new areas for the Group, especially in the digital arena.
In the Regionals, management focused on accelerating organicdevelopment in print and on-line. In print, the division launched five new weekly local newspaper titles in the Midlands. On-line, the division launched a network of local recruitment websites and a series of classified listings and community sites around the UK.The recruitment sites complement our national presence withFish4. While revenues from these investments are initially low theyprovide a platform for building incremental revenues closely linkedto our regional newspaper titles and geographical positions.
Total profits from Digital activities in the Regionals showedcontinued growth, following the move into profitability in 2004.
In the Nationals division a new commercial team was recruited to drive the on-line strategy. The newspapers’ companion websiteswere successfully relaunched, resulting in a 76% increase in unique users across the sites and revenues growing to £0.6 million in 2005.
The Sports division formed an innovative partnership with RacingUK to provide a broadband and 3G mobile service offering liveand archive racing coverage and betting information from theRacing Post. In December 2005 the joint venture launched a dedicated website, thebettingsite.co.uk.
Chairman’s statement / Chief Executive’s statement / Business review / Corporate responsibility / Board of Directorsand Executive Committee / Corporate governance / Remuneration report / Directors’ report / Group independent auditors’report / Accounts and notes / Unaudited other information / Holding company accounts and notes / Investor Relations
11
*On a like-for-like basis, which is before acquisitions, non-recurring items, IAS 39 and for 2004 excludes the additional week’s trading. See reconciliation between statutory and like-for-like results on page 102.
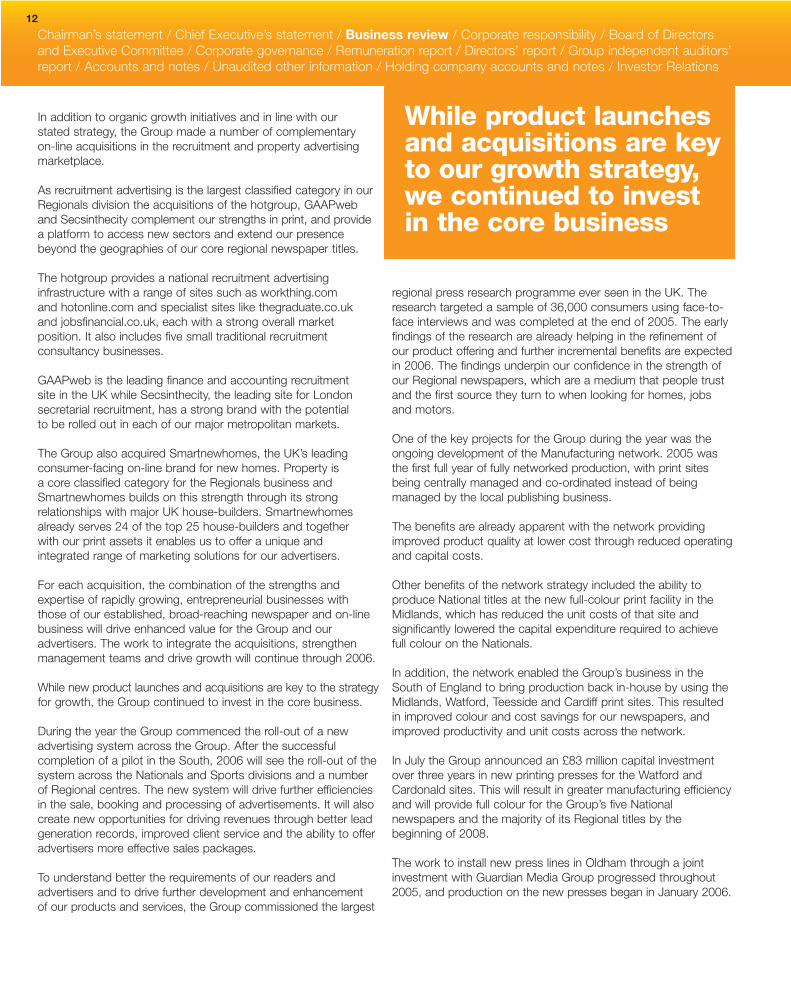
In addition to organic growth initiatives and in line with our stated strategy, the Group made a number of complementary on-line acquisitions in the recruitment and property advertisingmarketplace.
As recruitment advertising is the largest classified category in ourRegionals division the acquisitions of the hotgroup, GAAPweb and Secsinthecity complement our strengths in print, and providea platform to access new sectors and extend our presencebeyond the geographies of our core regional newspaper titles.
The hotgroup provides a national recruitment advertisinginfrastructure with a range of sites such as workthing.com and hotonline.com and specialist sites like thegraduate.co.uk and jobsfinancial.co.uk, each with a strong overall marketposition. It also includes five small traditional recruitmentconsultancy businesses.
GAAPweb is the leading finance and accounting recruitment site in the UK while Secsinthecity, the leading site for Londonsecretarial recruitment, has a strong brand with the potential to be rolled out in each of our major metropolitan markets.
The Group also acquired Smartnewhomes, the UK’s leadingconsumer-facing on-line brand for new homes. Property is a core classified category for the Regionals business andSmartnewhomes builds on this strength through its strongrelationships with major UK house-builders. Smartnewhomesalready serves 24 of the top 25 house-builders and together with our print assets it enables us to offer a unique and integrated range of marketing solutions for our advertisers.
For each acquisition, the combination of the strengths andexpertise of rapidly growing, entrepreneurial businesses with those of our established, broad-reaching newspaper and on-linebusiness will drive enhanced value for the Group and ouradvertisers. The work to integrate the acquisitions, strengthenmanagement teams and drive growth will continue through 2006.
While new product launches and acquisitions are key to the strategyfor growth, the Group continued to invest in the core business.
During the year the Group commenced the roll-out of a newadvertising system across the Group. After the successfulcompletion of a pilot in the South, 2006 will see the roll-out of thesystem across the Nationals and Sports divisions and a numberof Regional centres. The new system will drive further efficienciesin the sale, booking and processing of advertisements. It will alsocreate new opportunities for driving revenues through better leadgeneration records, improved client service and the ability to offeradvertisers more effective sales packages.
To understand better the requirements of our readers andadvertisers and to drive further development and enhancement of our products and services, the Group commissioned the largest
While product launchesand acquisitions are keyto our growth strategy,we continued to investin the core business
regional press research programme ever seen in the UK. Theresearch targeted a sample of 36,000 consumers using face-to-face interviews and was completed at the end of 2005. The earlyfindings of the research are already helping in the refinement ofour product offering and further incremental benefits are expectedin 2006. The findings underpin our confidence in the strength ofour Regional newspapers, which are a medium that people trustand the first source they turn to when looking for homes, jobs and motors.
One of the key projects for the Group during the year was theongoing development of the Manufacturing network. 2005 wasthe first full year of fully networked production, with print sitesbeing centrally managed and co-ordinated instead of beingmanaged by the local publishing business.
The benefits are already apparent with the network providingimproved product quality at lower cost through reduced operatingand capital costs.
Other benefits of the network strategy included the ability toproduce National titles at the new full-colour print facility in theMidlands, which has reduced the unit costs of that site andsignificantly lowered the capital expenditure required to achievefull colour on the Nationals.
In addition, the network enabled the Group’s business in theSouth of England to bring production back in-house by using theMidlands, Watford, Teesside and Cardiff print sites. This resultedin improved colour and cost savings for our newspapers, andimproved productivity and unit costs across the network.
In July the Group announced an £83 million capital investmentover three years in new printing presses for the Watford andCardonald sites. This will result in greater manufacturing efficiencyand will provide full colour for the Group’s five Nationalnewspapers and the majority of its Regional titles by thebeginning of 2008.
The work to install new press lines in Oldham through a jointinvestment with Guardian Media Group progressed throughout2005, and production on the new presses began in January 2006.
Chairman’s statement / Chief Executive’s statement / Business review / Corporate responsibility / Board of Directorsand Executive Committee / Corporate governance / Remuneration report / Directors’ report / Group independent auditors’report / Accounts and notes / Unaudited other information / Holding company accounts and notes / Investor Relations
12
Outlook2006 will see the continuation of the ‘Stabilise Revitalise Grow’strategy with the aim to drive further improvements throughcontinued investment and driving efficiencies. The advertisingmarket is expected to remain difficult, and we also anticipatesignificant cost pressure from newsprint price increases of 7%,increasing energy costs, increased labour costs and otherinflationary cost increases. However, we have already taken stepsto partially mitigate the impact of these difficult trading conditionswith the targeted cost savings of £15 million for 2006. Within the context of a challenging advertising environment the Boardexpects to deliver a satisfactory performance.
Review of financial performance
Group revenues* fell by 1.3% to £1,112.8 million (2004:£1,127.5 million). On a statutory basis, including the benefit of the additional week’s trading in 2004, Group revenues fell by £19.7 million (1.7%) from £1,141.7 million to £1,122.0 million.
2005 2005 2004 200452 weeks 52 weeks 53 weeks 52 weeks
actual like-for-like* actual like-for-like*Revenue by type £m £m £m £m
Advertising 611.7 608.2 644.4 637.9
Circulation 396.4 396.4 395.4 388.6
Other 113.9 108.2 101.9 101.0
Total 1,122.0 1,112.8 1,141.7 1,127.5
2005 2005 2004 200452 weeks 52 weeks 53 weeks 52 weeks
actual like-for-like* actual like-for-like*Revenue by division £m £m £m £m
Regionals 539.6 530.4 540.1 535.7
Nationals 499.1 499.1 519.7 510.8
Sports 50.6 50.6 48.9 48.1
Magazines and Exhibitions 32.7 32.7 31.8 31.7
TM Interactive – – 1.2 1.2
Total 1,122.0 1,112.8 1,141.7 1,127.5
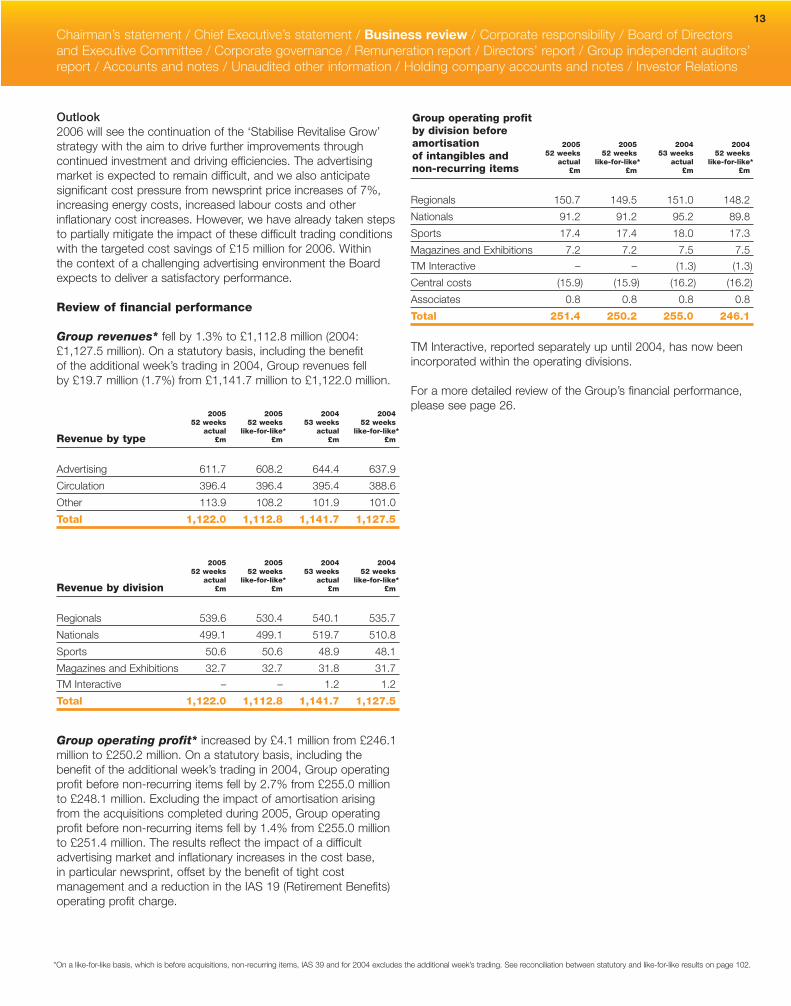
Group operating profit* increased by £4.1 million from £246.1million to £250.2 million. On a statutory basis, including thebenefit of the additional week’s trading in 2004, Group operatingprofit before non-recurring items fell by 2.7% from £255.0 millionto £248.1 million. Excluding the impact of amortisation arisingfrom the acquisitions completed during 2005, Group operatingprofit before non-recurring items fell by 1.4% from £255.0 millionto £251.4 million. The results reflect the impact of a difficultadvertising market and inflationary increases in the cost base, in particular newsprint, offset by the benefit of tight costmanagement and a reduction in the IAS 19 (Retirement Benefits)operating profit charge.
2005 2005 2004 200452 weeks 52 weeks 53 weeks 52 weeks
actual like-for-like* actual like-for-like*£m £m £m £m
Regionals 150.7 149.5 151.0 148.2
Nationals 91.2 91.2 95.2 89.8
Sports 17.4 17.4 18.0 17.3
Magazines and Exhibitions 7.2 7.2 7.5 7.5
TM Interactive – – (1.3) (1.3)
Central costs (15.9) (15.9) (16.2) (16.2)
Associates 0.8 0.8 0.8 0.8
Total 251.4 250.2 255.0 246.1
TM Interactive, reported separately up until 2004, has now beenincorporated within the operating divisions.
For a more detailed review of the Group’s financial performance,please see page 26.
Group operating profitby division beforeamortisation of intangibles andnon-recurring items
Chairman’s statement / Chief Executive’s statement / Business review / Corporate responsibility / Board of Directorsand Executive Committee / Corporate governance / Remuneration report / Directors’ report / Group independent auditors’report / Accounts and notes / Unaudited other information / Holding company accounts and notes / Investor Relations
13
*On a like-for-like basis, which is before acquisitions, non-recurring items, IAS 39 and for 2004 excludes the additional week’s trading. See reconciliation between statutory and like-for-like results on page 102.

Chairman’s statement / Chief Executive’s statement / Business review / Corporate responsibility / Board of Directorsand Executive Committee / Corporate governance / Remuneration report / Directors’ report / Group independent auditors’report / Accounts and notes / Unaudited other information / Holding company accounts and notes / Investor Relations
Regionals division
The Regionals division operates an extensive portfolio of print andon-line brands throughout the UK. Its 240-plus local and regionalnewspapers are complemented by more than 70 websitesoffering news, information and advertising.
In 2005 the division achieved a robust performance in the face ofchallenging market conditions, which impacted the key advertisingrevenue stream for most of the year.
Despite the difficult advertising conditions, the division maintainedits focus on improving profitability, reducing costs and improvingmargin. The difficult trading environment did not inhibitmanagement from investing to grow the business for the future.
A number of initiatives during the year focused on improving thekey advertising revenue stream. A successful pilot of the newadvertising booking system, which facilitates the selling of newpackages and cross-selling while improving account managementand service for clients, was completed in 2005. Further details of this have been provided on page 12.
The Group also invested in extensive and innovative research, the most ambitious programme in the history of regional press.The research provides advertisers with insights into their brandsand into how the Group’s regional media can help them achievetheir marketing objectives.
Customer service has also been improved during the year withclients supplied with electronic proof of advertising rather thanhard-copy vouchers for the first time. Electronic vouchering alsoenabled further cost reductions for the division.
Other activities included a continued focus on advertisingcategory management and forming strong links between print and on-line platforms.
The significant focus on driving revenues and improving clientservice was recognised by the industry with Amra – the Group’snational advertising sales operation for regional press – winningthe industry’s award for best sales house. This was the thirdsuccessive year that Amra had received the award, reflecting itscontinued success and development in serving major advertisersand agencies.
In 2005 the division renewed its focus on developing and growingits leaflets and direct marketing business. National sales for thisoperation were brought together under Amra, and further growthin this area is anticipated for 2006.
The division continued to drive circulation revenue increases whileseeking to improve circulation volume performance. Increases incirculation revenues were achieved through the ongoing policy tosell full-price, value-for-money newspapers and to increase coverprices on a ‘little and often’ basis where appropriate.
Circulation volumes were also encouraging in 2005. The division’stitles performed in line with or ahead of the market in all categoriesin the ABC results for January to June and we anticipate a similarresult in the second half of the year.
During this period the best-performing title in the three keycategories of mornings, metropolitan evenings and BritishSundays was a Trinity Mirror newspaper. The Western Mail wasthe UK’s fastest-growing regional daily following investment in a major relaunch in 2004. However, as with the rest of the UKregional newspaper market, overall volumes remained underpressure and improving circulation performance continued to be a high priority for management.
Editorial quality is a key driver of circulation volume andconsiderable effort was focused on this area in 2005, with anumber of initiatives covering product improvement, newsroomstructures and training.
For example, the division conducted a detailed ‘Reading andNoting’ study, which tracked the reading habits of readers ofseveral key regional titles. The research provided a deepunderstanding of the key triggers of reader interest, and thefindings helped to shape product development plans across the regional portfolio, from story selection and development to headline writing.
To ensure continued journalistic excellence in our newsrooms, the Group signed a long-term contract with PA Group for theprovision of editorial training services, which will guarantee a consistent flow of high-quality journalism trainees.
14

Chairman’s statement / Chief Executive’s statement / Business review / Corporate responsibility / Board of Directorsand Executive Committee / Corporate governance / Remuneration report / Directors’ report / Group independent auditors’report / Accounts and notes / Unaudited other information / Holding company accounts and notes / Investor Relations
Other ongoing activities to improve circulation volumeperformance include:
• Continued improvement in supply chain management, coveringreturns collection and scanning, sales analysis, links with keyretailers and internal transport operations.
• A new model for the extensive home delivery network andseveral major initiatives to transform the effectiveness and cost efficiency of the network during 2006.
2005 saw a number of growth initiatives in the Regionals division,in the form of both organic development and acquisitions.
In particular it was a year of real progress in Digital activities asthe division continued to transform itself into a multi-platformpublishing and advertising business.
Having shown a profit for the first time in 2004, the existing Digitalbusiness – which includes the icNetwork of regional websites andthe partnership in fish4 – went from strength to strength,delivering further strong profit growth in 2005.
The acquisitions of the hotgroup, GAAPweb, Smartnewhomesand Secsinthecity rapidly added scale and provided access to new on-line revenues in core classified categories. As well as further segmenting the division’s product offering in existingnewspaper circulation areas, they bring a presence outside these boundaries and create opportunities in new markets.
The on-line recruitment businesses acquired by the Group include both generalist and niche sites, and significantly extend the division’s potential in the key recruitment classifiedadvertising category.
Alongside the acquisitions programme there was a significantacceleration in organic growth in digital, with the aim of deepeningthe division’s presence in core market segments and geographies.
Local recruitment sites were launched across the UK tocomplement the division’s national strength through Fish4. In addition, a number of other sites were launched and areplanned for 2006, including sites for motors.
In addition to websites linked to the core local newspaper titles2005 saw the development and launch of a network of local freeclassified sites, trials of digital facsimile editions, local on-lineauctions, the development of on-line-only sales capabilities and an on-line ad booking facility for private advertisers.
In parallel with this commercial development, the drive towardstrue multi-media publishing also gained pace within the division’seditorial function. In particular, the North West business madesignificant progress with a pilot project in the Merseysidenewsroom. The aim of the project is to develop an editorialoperation focused on delivering content in whatever formatreaders demand, retaining their attention across a range ofplatforms and increasing overall market penetration.
The Merseyside newsroom also embraced citizen journalism bypublishing – on-line and in print – text and pictures submitted byreaders via mobile phone, and forged a key strategic partnershipto build an integrated customer database to open up newmarketing opportunities across multiple media.
The three-pronged strategy involves print, on-line and mobilephones, and is underpinned by significantly increased cross-promotion between traditional and digital media. In 2005journalists produced the first video reports for the newspapers’companion websites and launched a series of weblogs.
In the core print portfolio, the division launched five entirely newlocal weekly newspapers: the Solihull & Warwickshire Guardian,the Kenilworth Times, the Royal Leamington Spa Times, theAtherstone Tribune and the Warwick Times. The new titles pushout from our core marketplaces to capture a greater share ofadvertising expenditure in these affluent areas of the Midlands.
There were also numerous improvements to existing newspapers,including the relaunch of one of the division’s biggest titles, the Birmingham Mail.
As part of a long-term plan to address circulation declines, theMail received a comprehensive makeover, adopted a more localnews agenda and refined its edition structure to reflect betterthe needs of its readership.
Looking ahead, the focus for the Regionals will be on drivingimprovements in performance and publishing quality whilemaintaining tight control of costs. 2006 will also see further progressin multi-platform publishing as the division maximises the benefitof recent acquisitions and continues its programme of organicdigital development. In addition, 2006 will see the launch of newMetro titles in Liverpool and Cardiff, which will strengthen ourposition in these markets. These build on the success of theMetros presently published in Glasgow, Newcastle and Birmingham.
15

The revenue and operating profit† of the Group’s Regionalsdivision is as follows:
Review of financial performance
The division’s focus on growth in all areas of the business,coupled with strong management action on cost, has helpedmitigate the impact of declines in advertising revenue on operatingprofit and margin.
Revenue and operating profit* On a like-for-like basis,despite revenue declines of £5.3 million (1.0%) the divisionimproved operating profits by £1.3 million (0.9%) from£148.2 million to £149.5 million.
The operating profit* decrease experienced by the core Regionalnewspaper titles was offset by continuing improvements fromMetros and digital media activities. The division’s three Metrosachieved a £0.6 million (46.2%) improvement in operating profit* to £1.9 million, while digital media activities achieved operatingprofit* of £1.8 million, representing an improvement of £1.1 millioncompared to a £0.7 million profit in 2004.
The four acquisitions completed during the year contributedincremental digital revenues of £3.5 million and other revenues of £5.7 million in 2005. Before amortisation of intangible assetsand non-recurring costs the acquisitions contributed £1.2 millionoperating profit in 2005. Amortisation relating to the acquisitionswas £3.3 million in the year and is expected to be £9.7 million in 2006.
Operating margin* Due to decisive action on costs during the year, the impact of the advertising downturn was contained,with operating margin* improving by 0.5% to 28.2%.
Regional newspapers – revenue and operating profit†
2005 2005 2004 200452 weeks 52 weeks 53 weeks 52 weeks Change Change
actual like-for-like* actual like-for-like* actual like-for-like*£m £m £m £m % %
Revenue
Regional newspaper titles 515.2 509.5 522.1 517.7 (1.3)% (1.6)%
Metros 13.3 13.3 11.9 11.9 11.8% 11.8%
Digital media activities 11.1 7.6 6.1 6.1 82.0% 24.6%
Total revenue 539.6 530.4 540.1 535.7 (0.1)% (1.0)%
Operating profit†
Regional newspaper titles 145.9 145.8 149.0 146.2 (2.1)% (0.3)%
Metros 1.9 1.9 1.3 1.3 46.2% 46.2%
Digital media activities 2.9 1.8 0.7 0.7 314.3% 157.1%
Total operating profit pre-amortisation of intangibles† 150.7 149.5 151.0 148.2 (0.2)% 0.9%
Total operating profit post-amortisation of intangibles† 147.4 149.5 151.0 148.2 (2.4)% 0.9%
Margin pre-amortisation of intangibles† 27.9% 28.2% 28.0% 27.7% (0.1)% 0.5%
Chairman’s statement / Chief Executive’s statement / Business review / Corporate responsibility / Board of Directorsand Executive Committee / Corporate governance / Remuneration report / Directors’ report / Group independent auditors’report / Accounts and notes / Unaudited other information / Holding company accounts and notes / Investor Relations
16
*On a like-for-like basis, which is before acquisitions, non-recurring items, IAS 39 and for 2004 excludes the additional week’s trading.†Before non-recurring items.

Advertising revenue* for the Regionals division fell by 2.7% from £415.0 million to £403.7 million reflecting an increase of1.5% in the first half offset by a decline of 7.0% in the secondhalf. By category Display was down by 0.1%, Recruitment wasdown by 14.3%, Property was up by 10.4%, Motors was downby 5.7% and other classified categories were up by 4.6%.
Metros achieved strong advertising* growth of £1.4 million(11.9%), driven by a 16.9% increase in Display, partially offset by an 8.1% decrease in Recruitment.
Digital media activities continued their strong growth trajectorywith advertising revenue* increasing by £1.5 million (31.3%)across all categories other than property. The four acquisitionscompleted during the year achieved advertising revenues of £3.5 million following completion during 2005. On an annualisedbasis the acquisitions achieved advertising revenues of £13.3 million for 2005.
Advertising revenue by category £m
2005 2005 200452 weeks 52 weeks 53 weeks
actual like-for-like* actual£m £m £m
Display 126.5 126.5 128.0
Recruitment 111.9 109.8 128.1
Property 59.6 58.2 52.8
Motors 36.1 36.1 38.6
Other 73.1 73.1 70.3
Total 407.2 403.7 417.8
Circulation revenue* increased by £3.4 million (4.3%) from£79.4 million to £82.8 million. This performance reflects thebenefit of little-and-often cover price increases partially offset by circulation declines. During the year, the division experiencedcirculation volume declines of 5.0% for Evening titles, 2.0% forMorning titles, 4.7% for Weekly titles and 6.3% for Sunday titles.Improving the circulation performance remains a key area of focusfor management.
Largest regional titles
Daily Averagecirculation(A) readers(B)
2005 2005
Morning
Daily Post (Welsh) 39,595 125,117
Western Mail 42,956 150,882
The Journal (Newcastle) 40,945 125,989
Evening
Liverpool Echo 123,584 357,790
Birmingham Evening Mail 85,074 260,880
Evening Chronicle (Newcastle) 87,138 261,871
Sunday
Sunday Mercury (Birmingham) 66,007 184,887
Sunday Sun (Newcastle) 75,499 297,529
(A) Average ABC July to December 2005.(B) JICREG February 2006.
On a like-for-like basis other revenue has increased by £2.6 million (6.3%) from £41.3 million to £43.9 million. Thisincrease has arisen as a result of a growth in contract print, sports publications and niche products of £3.8 million.
Regional division – revenue by type
2005 2005 2004 200452 weeks 52 weeks 53 weeks 52 weeks Change Change
actual like-for-like* actual like-for-like* actual like-for-like*£m £m £m £m % %
Advertising 407.2 403.7 417.8 415.0 (2.5)% (2.7)%
Circulation 82.8 82.8 80.7 79.4 2.6% 4.3%
Other 49.6 43.9 41.6 41.3 19.2% 6.3%
Total revenue 539.6 530.4 540.1 535.7 (0.1)% (1.0)%
Chairman’s statement / Chief Executive’s statement / Business review / Corporate responsibility / Board of Directorsand Executive Committee / Corporate governance / Remuneration report / Directors’ report / Group independent auditors’report / Accounts and notes / Unaudited other information / Holding company accounts and notes / Investor Relations
17
*On a like-for-like basis, which is before acquisitions, non-recurring items, IAS 39 and for 2004 excludes the additional week’s trading.

Nationals division
The Nationals division publishes three UK National titles, the DailyMirror, the Sunday Mirror and The People; two Scottish Nationals,the Daily Record and the Sunday Mail; and The One Directory in Scotland.
The Group’s National newspaper titles continue to operate in an extremely competitive marketplace driven by regional and national cover price activity coupled with high levels of marketing expenditure. In addition to these challenges, 2005 saw considerable additional pressure due to the downturn in advertising markets.
Despite these challenges the division delivered a strongperformance. Although advertising revenue fell significantly due to substantial declines in total volumes across the market, costinitiatives by management enabled operating profits* to increase.
The division achieved growth in circulation revenue (excluding thebenefit of the extra week’s trading in 2004), reflecting the continuedbenefits of the Group’s ‘little and often’ cover price policy.
Significant progress was also made in digital activities in 2005.The division appointed a new Head of Digital in early 2005,leading to a new team and a revitalised strategy for the websitesof all five UK and Scottish titles. The number of unique usersacross the sites increased significantly during the year. Thebusiness delivered a profit for the first time, with improved growthprospects for 2006.
Throughout the year the agenda for the Nationals has been one of continuous development of products and services alongsidestringent management of costs.
UK Nationals
The three UK National titles achieved a strong profit performancein the context of difficult advertising market conditions.
Although circulation volumes remained under pressure, the DailyMirror and The People reduced their rate of decline in 2005 in the face of aggressive marketing competition. This came againstthe backdrop of continuing falls in overall circulation volumesacross the UK tabloid newspaper market. However, in spite of exceptional levels of competitive marketing activity, the SundayMirror’s performance was only slightly below the market.
Throughout the year the management team focused on improvingcirculation volume performance without damaging profitability.Unlike many competitor titles, the Group’s UK Nationals did notchase short-term circulation increases through price-cutting andunsustainable levels of marketing spend.
There was growth in circulation revenue (excluding the benefit of the extra week’s trading in 2004) due to cover price increaseson both Sunday titles in 2005 and the annualised benefit of theincreases on the Daily Mirror during 2004.
The Daily Mirror significantly improved its performance during the year, reducing its rate of circulation decline from 7.7% in thefirst half to 3.4% in the second. The six-monthly market share toDecember (excluding sampling) fell marginally from 19.5% to19.3%.
The improved volume performance was the result of productdevelopment and an increase in the title’s availability at retail.
Editorially the Daily Mirror continued its quiet transformation undereditor Richard Wallace. The Mirror returned to its red-top roots in April 2005, underlining its position firmly in the popular tabloidmarket and gearing its content and campaigning priorities to itscore audience.
The addition of the Your Life section every weekday has improvedthe balance of the paper by increasing and enhancing content forwomen. It has also differentiated the Daily Mirror from its immediatecompetitors by bringing a contemporary publishing mix alreadysuccessful in the magazine sector to a daily tabloid audience.
Further changes included lightening the tone of page two bymoving its traditional political news content and replacing it withan internet-style ‘home page’. The cover price remainedunchanged in 2005.
In an extremely challenging market, heavily influenced bycompetitors’ substantial and very short-term promotional activities,the Sunday Mirror was able to contain its circulation decline,which was marginally behind overall market performance. The six-monthly market share (excluding sampling) to December fell by 0.3% to 15.6%.
The paper’s magazine, Celebs on Sunday, continued to evolveand stemmed the loss of younger women readers seen in 2004.The Sunday Mirror cover price increased from 80p to 85p inJanuary 2005.
Despite very strong marketing opposition, The People improvedits year-on-year circulation decline from 8.6% in 2004 to 7.1% in 2005. Take It Easy, the paper’s magazine, was redesigned in November 2005 to give it a more contemporary feel, and thecover price of The People increased in January from 75p to 80p.
Following the unexpected collapse of demand in March the entiremarket suffered a substantial decline in advertising spendthroughout the rest of 2005. This was compounded by the closureof four major advertisers – Rover, Courts, Time Computers andAllders – which created ongoing revenue shortfalls for the UKNational titles.
The weak advertising demand led to a drop in advertisingvolumes for all three titles with significant year-on-year declines in advertising revenues experienced during 2005. Insert volumes,however, improved in 2005.
Chairman’s statement / Chief Executive’s statement / Business review / Corporate responsibility / Board of Directorsand Executive Committee / Corporate governance / Remuneration report / Directors’ report / Group independent auditors’report / Accounts and notes / Unaudited other information / Holding company accounts and notes / Investor Relations
18
*On a like-for-like basis, which is before acquisitions, non-recurring items, IAS 39 and for 2004 excludes the additional week’s trading.

Despite the challenging competitive nature of the marketplacecirculation revenues continued to grow as a result of a cover priceincrease of 10p to 90p on the Sunday Mail at the start of the yearand an increase of 5p to 50p on the Daily Record Saturdayedition in July.
Further opportunities to increase the cover price as part of the‘little and often’ policy are anticipated in 2006.
Advertising revenue performance was affected by the turbulentcommercial environment, but the declines were partially offset by the launch of an innovative programme of advertising-ledsupplements to generate new revenue from new categories of advertiser.
These included Sustainable Scotland, a 24-page supplementaddressing environmental issues, A Place to Live, a quarterlyproperties supplement, and St Andrew’s Day, a celebration of Scotland’s national day.
The division’s focus on exploiting new revenue streams andgrowth opportunities continued throughout 2005. Scotcareers,the recruitment website launched late in 2004, broke even in itsfirst full year of operation and quickly moved to second place inthe market. The number of unique users increased by 63% to90,000 during the year while page impressions grew by 50% to 1.5 million. The advertising inventory reached 5,800 jobs, a year-on-year increase of 88%.
The division launched two classified directories under The Onebrand in 2004, and this increased to four in 2005, which resultedin a 70% increase in revenues. This expansion was supported byincreased investment in Marketing, Editorial and Sales resources,which strengthened the infrastructure of the directories operationand enabled further development of this new business. Whilelosses were incurred during 2005 the business is expected tomove into profit in 2006.
Looking ahead, the Nationals division will continue to investappropriately in the core titles to drive circulation and advertisingrevenues, while driving new and incremental digital revenues.Alongside this, it will continue to drive cost efficiencies to providethe headroom for investment and improve profitability.
The Nationals divisioncontinues to invest in core titles to drivecirculation andadvertising revenues
Scottish Nationals
The Scottish Nationals division incorporates Scotland’s best-selling and market-leading national newspapers, the Daily Recordand the Sunday Mail. The division also operates the recentlylaunched The One Directory and Scotcareers, the on-linerecruitment website, as well as a free distribution newspaper for Glasgow, The Glaswegian.
The Scottish national newspaper market is widely regarded asone of the world’s most competitive, with widespread cover pricediscounting and heavy marketing activity by rival UK tabloid titles.Coupled with this, 2005 saw extremely challenging advertisingmarket conditions, which had a significant adverse impact onadvertising revenues.
Despite this, the Scottish Nationals maintained its revenues. This was primarily due to increases in circulation revenues drivenby cover price rises and benefits from additional editions of The One Directory during the year.
Both the Daily Record and Sunday Mail titles were the subject ofcontinued development and enhancement, backed by a creativemarketing programme aimed at long-term improvements to thetitles’ positioning and reader appeal.
During the year several editorial initiatives were undertaken tosupport this strategy, including the launch of a football fanzine-style product targeting a younger male audience, a puzzles andcompetition supplement to harness the growing interest in thissector, and the further roll-out of regionalised sports coverage.
The success of this long-term strategy is demonstrated by theproportion of readers who buy no other newspaper (60% for theDaily Record, 61% for the Sunday Mail) compared to other titles in the market. This is the highest in the popular sector andindicates levels of reader loyalty in the core audience unrivalled by any other title in Scotland.
Chairman’s statement / Chief Executive’s statement / Business review / Corporate responsibility / Board of Directorsand Executive Committee / Corporate governance / Remuneration report / Directors’ report / Group independent auditors’report / Accounts and notes / Unaudited other information / Holding company accounts and notes / Investor Relations
19

Review of financial performance
In a difficult advertising trading environment coupled withaggressive price-cutting in the marketplace the Nationals divisionachieved a strong performance in 2005.
Revenue and operating profit* Despite revenue* declines of 2.3% from £510.8 million to £499.1 million, operating profits* for the Nationals division increased by £1.4 million (1.6%) from£89.8 million to £91.2 million.
Although revenue* for the UK Nationals declined by 2.9%, the tightmanagement of costs enabled operating profits* to be increasedby 2.4% from £66.3 million to £67.9 million.
Operating margin* for UK Nationals increased by 0.9% from16.6% to 17.5%.
For the Scottish Nationals, revenue* improved by 0.1% while operating profit* declined by 0.9% from £23.5 million to £23.3 million.
Operating margin* for the Scottish Nationals fell 0.2% from 21.2% to 21.0%, the fall largely reflecting the investment in The OneDirectory. Excluding The One Directory operating margin*increased by 0.6% from 21.3% to 21.9%.
The impact of declining advertising revenues was partially mitigatedby targeted cover price increases, which led to strong circulationrevenue growth, and the development of Scotcareers – the on-linerecruitment site, which broke even in its first full year of trading.
National newspapers – revenue and operating profit†
2005 2004 200452 weeks 53 weeks 52 weeks Change Change
actual actual like-for-like* actual like-for-like*£m £m £m % %
Revenue
UK Nationals 388.3 407.2 400.1 (4.6)% (2.9)%
Scottish Nationals 110.8 112.5 110.7 (1.5)% 0.1%
Total revenue 499.1 519.7 510.8 (4.0)% (2.3)%
Operating profit†
UK Nationals 67.9 70.5 66.3 (3.7)% 2.4%
Scottish Nationals 23.3 24.7 23.5 (5.7)% (0.9)%
Total operating profit† 91.2 95.2 89.8 (4.2)% 1.6%
Margin† 18.3% 18.3% 17.6% 0.0% 0.7%
Total National newspapers – revenue by type2005 2004 2004
52 weeks 53 weeks 52 weeks Change Changeactual actual like-for-like* actual like-for-like*
£m £m £m % %
Circulation 276.6 279.0 274.2 (0.9)% 0.9%
Advertising 176.2 197.5 194.0 (10.8)% (9.2)%
Other 46.3 43.2 42.6 7.2% 8.7%
Total revenue 499.1 519.7 510.8 (4.0)% (2.3)%
Chairman’s statement / Chief Executive’s statement / Business review / Corporate responsibility / Board of Directorsand Executive Committee / Corporate governance / Remuneration report / Directors’ report / Group independent auditors’report / Accounts and notes / Unaudited other information / Holding company accounts and notes / Investor Relations
20
*On a like-for-like basis, which is before acquisitions, non-recurring items, IAS 39 and for 2004 excludes the additional week’s trading.†Before non-recurring items.

Circulation revenue* The Nationals division achievedcirculation revenue* growth of 0.9% despite declining volumes in a very competitive marketplace. This reflects the benefit ofcover price increases partially offset by declining volumes.
Circulation revenues* for the UK Nationals increased by 0.1% from£219.2 million to £219.5 million, reflecting the annualised benefit of the Daily Mirror cover price increase in March 2004 and coverprice increases for both Sunday titles in January 2005.
Editorial investment to create a more appealing product coupledwith investment in product availability enabled the Daily Mirror to reduce its rate of circulation decline from 7.7% in the first half-year to 3.4% in the second. The annual decline in circulationvolumes was 5.5% with the six-monthly market share (excludingsampling) falling by 0.2% from 19.5% in December 2004 to19.3% in December 2005.
In an extremely challenging market, heavily influenced by ourcompetitors’ substantial commitment to very short-termpromotional activities, the Sunday Mirror was able to containcirculation decline to 4.5%, which compares well with a marketaverage decline (excluding sampling) of 4.0%. The paper’s six-monthly market share of sale to December (excluding sampling)dropped by 0.3% to 15.6%.
The year-on-year circulation decline of The People improved from 8.6% in 2004 to 7.1% in 2005. However, significant competitivemarketing activity saw its six-monthly average market share to December (excluding sampling) fall by 0.3% to 9.5%.
In Scotland, circulation revenue* increased by 3.8% from £55.0 million to £57.1 million. The increase in circulation revenuesreflects the benefit of increased cover prices partially offset by reduced circulation volumes.
The Scottish National newspaper market continues to bechallenging with cover price discounting and substantial levels of marketing by competitor UK tabloid newspapers. Thesechallenging market conditions contributed to The Daily Recordand Sunday Mail average circulation volume (Scottish sales only)declining over the 12-month period by 5.2% (4.3% for 2004) and 5.8% (5.1% for 2004) respectively. Whilst the underlyingperformance of the Daily Record has improved year-on-year, the impact of cover price discounting by the competition hasdriven the weaker circulation performance. The Daily Record’ssix-monthly tabloid market share to December fell by 2.0% to 37.1% and that of the Sunday Mail fell by 1.0% to 34.8%.
UK National newspapers – revenue by type2005 2004 2004
52 weeks 53 weeks 52 weeks Change Changeactual actual like-for-like* actual like-for-like*
£m £m £m % %
Circulation 219.5 223.1 219.2 (1.6)% 0.1%
Advertising 127.7 146.9 144.2 (13.1)% (11.4)%
Other 41.1 37.2 36.7 10.5% 12.0%
Total revenue 388.3 407.2 400.1 (4.6)% (2.9)%
Chairman’s statement / Chief Executive’s statement / Business review / Corporate responsibility / Board of Directorsand Executive Committee / Corporate governance / Remuneration report / Directors’ report / Group independent auditors’report / Accounts and notes / Unaudited other information / Holding company accounts and notes / Investor Relations
21
*On a like-for-like basis, which is before acquisitions, non-recurring items, IAS 39 and for 2004 excludes the additional week’s trading.

Advertising revenue* In a challenging marketplace advertisingrevenues* for the Nationals division fell by 9.2% from £194.0 millionto £176.2 million.
Advertising revenues* for the UK Nationals fell by 11.4% from£144.2 million to £127.7 million. Following a first quarter decline of only 0.5% all advertising markets slowed significantly with the second quarter declining by 13.8% and the second half by 16.1%.
The market share of advertising volume across 2005 declinedmarginally for the Daily Mirror, down 0.3% to 19.5% and for thePeople, down 0.1% to 9.0%, but increased marginally for theSunday Mirror, up 0.1% to 13.6%. Whilst yields came underpressure during the year given the lack of supply in the marketplace, management did not materially cut yield to drive volumesand this is reflected in the fall in volume market share during the year.
Advertising revenues* for the Scottish Nationals fell by 2.6% from£49.8 million to £48.5 million. Following an excellent start to theyear, all markets slowed with declines of 4.9% in the second halfcompared to declines of only 0.4% in the first half. Retail activityfell away throughout the year with National clients responding to poor economic activity by cutting marketing expenditure.Classified markets held up well against the UK average with newactivities and product improvements supporting client spend.
The overall performance was supported by our investment in Scotcareers and The One Directory. Scotcareers generated£0.5 million of additional revenue in the year from on-line recruitmentactivity and The One Directory increased revenue* from £1.0 millionto £1.7 million from four directories in 2005 compared to two in 2004.
Other revenue* increased by £3.7 million (8.7%) from£42.6 million to £46.3 million. This has been driven by an increase for the UK Nationals of £4.4 million (12.0%) offset by a decline forthe Scottish Nationals of £0.7 million (11.9%). The UK Nationalsgrowth has arisen from an increase in contract printing, telephoneand sponsorship revenues, and digital activities.
Scottish National newspapers – revenue by type2005 2004 2004
52 weeks 53 weeks 52 weeks Change Changeactual actual like-for-like* actual like-for-like*
£m £m £m % %
Circulation 57.1 55.9 55.0 2.1% 3.8%
Advertising 48.5 50.6 49.8 (4.2)% (2.6)%
Other 5.2 6.0 5.9 (13.3)% (11.9)%
Total revenue 110.8 112.5 110.7 (1.5)% 0.1%
National newspapers – volume, readership and market shareMarket
2005 volume(A) 2004 volume(A) Average share(C)
actual actual Change readers(B) 2005‘000 ‘000 % ‘000 %
Daily Mirror 1,717 1,777 (3.4)% 4,104 19.3%
Sunday Mirror 1,506 1,597 (5.7)% 4,539 15.6%
The People 918 990 (7.3)% 1,979 9.5%
Daily Record(D) 417 439 (5.0)% 1,224 37.1%
Sunday Mail(D) 503 530 (5.1)% 1,415 34.8%
(A) Average circulation for the six months to December.(B) NRS six months to September 2005.(C) Share of tabloid market six months to December 2005 excluding sampling.(D) Within Scottish market only.
Chairman’s statement / Chief Executive’s statement / Business review / Corporate responsibility / Board of Directorsand Executive Committee / Corporate governance / Remuneration report / Directors’ report / Group independent auditors’report / Accounts and notes / Unaudited other information / Holding company accounts and notes / Investor Relations
22
*On a like-for-like basis, which is before acquisitions, non-recurring items, IAS 39 and for 2004 excludes the additional week’s trading.

Sports division
The Sports division publishes the UK’s foremost brands in racingand sports betting information. It operates four market-leadingnewspapers, including the Racing Post, and a growing portfolio of complementary on-line offerings such as RacingPost.co.uk andthebettingsite.co.uk.
The division delivered a creditable performance in 2005 despite a challenging advertising revenue environment in the second halfof the year.
In the core newspaper business, the Racing Post deliveredincreased circulation revenues due to a full year of Sundaypublishing, record sales during key racing festivals and increasesin cover price. Circulation volumes for the Racing Post (Monday to Saturday) declined by 1.5%.
In January 2005 the cover price of the Racing Post was increasedby 10p to £1.30 Monday to Friday and to £1.50 on Saturdaysand Sundays.
During 2005 management strengthened the editorial propositionof the newspaper titles, and this development of the portfolio hascontinued into 2006.
Enhancements to the Racing Post newspaper include expandedsports betting coverage during the week and a dedicated sportsbetting supplement every Saturday, supported by a strongmarketing campaign.
In addition, Racing and Football Outlook was successfullyrelaunched during 2005, achieving a strong circulationperformance in line with 2004.
Increased penetration of broadband internet access is enablinggreater access to racing and betting information on-line, and thishelped to make 2005 a year of significant development for theSports division as it sought to capture the opportunities presentedby new media and markets.
During the year the division entered into a joint venture with RacingUK – the UK’s premier horseracing digital TV channel – to providean innovative broadband and 3G mobile service offering live andarchive pictures from the top 31 UK racecourses together withdetailed cards, form, statistics and analysis from the Racing Post.
The service went live in September on five partner bookmakerwebsites and in December the joint venture launched a dedicatedwebsite, thebettingsite.co.uk. The revenue models for these sitesare still evolving but include a combination of ‘tenancy’ fees frombookmakers, betting revenue commissions, subscription offerings,pay-per-view and 3G mobile telephony revenues.
The expansion of RacingPost.co.uk gained pace with averagemonthly page impressions increasing from 44.3 million to 78.0 million. Towards the end of the year the site launched an on-line bookshop selling titles from the division’s book publishingbusinesses, Raceform and Highdown.
Overall on-line revenues continued to benefit from a contentpayment system together with strong increases from advertisingand profit-sharing affiliate deals from betting and casino games.
Sports titles
Daily circulation
Racing Post(A) 75,908
Racing and Football Outlook No ABCs
Raceform Update No ABCs
Weekender(A) 16,808
(A) ABC July-December 2005.
Sports division – revenue and operating profit†
2005 2004 200452 weeks 53 weeks 52 weeks Change Change
actual actual like-for-like* actual like-for-like*£m £m £m % %
Revenue
Advertising 14.3 14.4 14.2 (0.7)% 0.7%
Circulation 32.6 31.2 30.6 4.5% 6.5%
Other 3.7 3.3 3.3 12.1% 12.1%
Total 50.6 48.9 48.1 3.5% 5.2%
Operating profit† 17.4 18.0 17.3 (3.3)% 0.6%
Margin† 34.4% 36.8% 36.0% (2.4)% (1.6)%
Chairman’s statement / Chief Executive’s statement / Business review / Corporate responsibility / Board of Directorsand Executive Committee / Corporate governance / Remuneration report / Directors’ report / Group independent auditors’report / Accounts and notes / Unaudited other information / Holding company accounts and notes / Investor Relations
23
*On a like-for-like basis, which is before acquisitions, non-recurring items, IAS 39 and for 2004 excludes the additional week’s trading.†Before non-recurring items.

Operating profit* The Sports division delivered a creditableperformance in 2005 despite a challenging advertising revenueenvironment in the second half of the year. Revenues* increasedby 5.2% from £48.1 million to £50.6 million and operating profits*increased marginally by 0.6% from £17.3 million to £17.4 million.The minimal increase in operating profits* was driven by theincrease in the price of newsprint and increased investment during the year.
Circulation revenue* The publication of the Racing Post everySunday excluding Christmas Day (2004: 49 issues) and recordsales during the Cheltenham and Aintree Festivals, combined with cover price increases, resulted in circulation revenue* growth of 6.5% from £30.6 million to £32.6 million.
Advertising revenue* grew by 0.7% from £14.2 million to £14.3 million. This marginal increase was achieved despite consolidation within the bookmaking and gaming industries and a reduction in marketing budgets in the second half of the year.
Book publishing activity Despite attracting higher-profilesporting celebrities and having notable success with some books,revenue performance for book publishing did not show growthcompared to 2004. This was principally due to challenging high-street conditions and ongoing changes in the traditional booksretail sector, which is facing increasing pressure from the majorsupermarkets. The launch of the division’s on-line bookshopensured revenues were in line with 2004. Book publishing net of advertising generated £1.4 million in revenues during 2005(2004: £1.4 million).
On-line activities continued to increase operating profit* as a result of increased on-line revenue generation includingadvertising, content payment and affiliate sales.
Other revenues* increased by £0.4 million (12.1%) from £3.3 million to £3.7 million. The increase was achieved throughthe joint venture with Racing UK and growth in betting shopdisplay revenue.
Chairman’s statement / Chief Executive’s statement / Business review / Corporate responsibility / Board of Directorsand Executive Committee / Corporate governance / Remuneration report / Directors’ report / Group independent auditors’report / Accounts and notes / Unaudited other information / Holding company accounts and notes / Investor Relations
24
*On a like-for-like basis, which is before acquisitions, non-recurring items, IAS 39 and for 2004 excludes the additional week’s trading.

Chairman’s statement / Chief Executive’s statement / Business review / Corporate responsibility / Board of Directorsand Executive Committee / Corporate governance / Remuneration report / Directors’ report / Group independent auditors’report / Accounts and notes / Unaudited other information / Holding company accounts and notes / Investor Relations
25
*On a like-for-like basis, which is before acquisitions, non-recurring items, IAS 39 and for 2004 excludes the additional week’s trading.†Before non-recurring items.
Magazines and Exhibitions
The Magazines and Exhibitions division publishes a number ofspecialist titles and operates both consumer and trade shows.The portfolio includes Inside Housing, the leading magazine forthe social housing sector, and one of the UK’s largest consumerexhibitions, the National Boat, Caravan and Outdoor Show.
In 2005 challenging market conditions in many of the division’soperational areas placed significant pressure on revenue and profit.
Revenue* for the division increased by 3.2% from £31.7 million to £32.7 million, with advertising revenue* declining by £0.7 million(4.8%), circulation revenue* flat at £4.4 million and other revenue*(primarily exhibition revenue) growing by £1.7 million (13.5%). The growth in exhibition revenues reflects the benefit of increasedstand sales at existing shows and the launch of the new LondonCaravan and Outdoor Show during the year.
The challenging revenue environment coupled with investment in new shows and product launches contributed to operatingprofits* falling by 4.0% from £7.5 million to £7.2 million.
Magazines and Exhibitions – revenue and operating profit†
2005 2004 200452 weeks 53 weeks 52 weeks Change Change
actual actual like-for-like* actual like-for-like*£m £m £m % %
Revenue 32.7 31.8 31.7 2.8% 3.2%
Operating profit† 7.2 7.5 7.5 (4.0)% (4.0)%
Operating margin† 22.0% 23.6% 23.7% (1.6)% (1.7)%
Magazines and Exhibitions – revenue by type2005 2004 2004
52 weeks 53 weeks 52 weeks Change Changeactual actual like-for-like* actual like-for-like*
£m £m £m % %
Advertising 14.0 14.7 14.7 (4.8)% (4.8)%
Circulation 4.4 4.5 4.4 (2.2)% 0.0%
Other 14.3 12.6 12.6 13.5% 13.5%
32.7 31.8 31.7 2.8% 3.2%
Principal magazines
Averagesales per edition
Back Street Heroes(1) 25,159
Streetfighters(1) 18,310
Inside Housing(2)(3) 26,512
Micro Mart(2) 22,917
Notes:(1) Monthly titles.(2) Weekly titles.(3) Controlled circulation title.
Principal exhibitions
Number ofattendees
National Boat, Caravan and Outdoor Show 132,480
National Wedding Shows 57,834
A difficult environment for retail magazines resulted in a fall in magazine circulation volumes, although cover price increaseshelped to partially offset the decline in revenue.
Advertising revenue came under pressure in most areas due tounfavourable market conditions, with public sector recruitmentand IT markets particularly difficult.
The exhibitions business saw continued growth in all areas, a strong performance given that the overall exhibitions marketwas at best static in terms of revenue and visitor numbers.
Central costs
During the year central costs decreased by £0.3 million from £16.2 million to £15.9 million.

Chairman’s statement / Chief Executive’s statement / Business review / Corporate responsibility / Board of Directorsand Executive Committee / Corporate governance / Remuneration report / Directors’ report / Group independent auditors’report / Accounts and notes / Unaudited other information / Holding company accounts and notes / Investor Relations
26
*On a like-for-like basis, which is before acquisitions, non-recurring items, IAS 39 and for 2004 excludes the additional week’s trading. See reconciliation between statutory and like-for-like results on page 102.
Non-recurring items before tax of £2.7 million (2004:£9.7 million) were incurred during the year. Non-recurring itemshave been separately disclosed to provide clarity in relation to the underlying performance of the Group as they are one-off innature. The most significant items are explained below with furtherdetailed information provided on other items in note 7 on page 73of the annual report and accounts.
Restructuring costs in 2005 of £7.9 million (2004: £11.0 million)have been incurred in delivery of the £15 million targeted costsavings for 2006. These represent costs in relation to severance of £7.9 million (2004: £10.1 million). The cash outflow in relationto these restructuring costs will be incurred in 2006. £1.0 million(2004: £nil million) of severance costs were also incurred followingthe acquisition of the hotgroup plc. In 2005 the Group disposedof surplus land and buildings realising a profit on disposal of £3.5 million (2004: £1.0 million). This profit reflects the benefit of the continuing plan to reduce the property portfolio and propertycosts. In 2005 the Group disposed of its shareholding in ScottishRadio Holdings realising a profit on disposal of £2.7 million (2004: £nil million).
In 2004 £7.0 million was incurred on the write-down of press fixed assets from the closure of the Chester print site and the re-pressing project at Oldham as part of the process to create the Manufacturing network.
Other non-recurring items in 2004 related to the release of surplusaccruals of £3.5 million, settlement of Maxwell-related claimsresulting in net receipts of £1.3 million, and a profit of £2.5 millionon disposal of the regional newspaper titles in Ireland.
On a statutory basis profit before tax increased by £2.4 million(1.2%) from £207.1 million to £209.5 million. Excludingamortisation of intangibles and the impact of IAS 39, profit beforetax and non-recurring items increased by £5.3 million (2.4%) from£216.8 million to £222.1 million. On a like-for-like* basis, profitbefore tax increased by £12.4 million (5.9%) from £208.5 millionto £220.9 million.
Financial review
Group revenues on a statutory basis fell by 1.7% to£1,122.0 million (2004: £1,141.7 million). On a like-for-like* basis,Group revenues fell by £14.7 million (1.3%) from £1,127.5 millionto £1,112.8 million.
Group operating profit on a statutory basis increased by £2.6 million (1.1%) from £242.8 million to £245.4 million. On a like-for-like* basis Group operating profit increased by 1.7% from £246.1 million to £250.2 million.
The Group’s share of profits from associates was £0.8 million(2004: £0.8 million) and reflects the Group’s share of profits in ThePress Association (PA), net of taxation payable thereon. Includedwithin interest receivable is £nil million (2004: £0.1 million) of theGroup’s share of interest receivable in PA. During the year dividendsof £0.6 million (2004: £3.2 million) were received from PA.
Finance costs, excluding the impact of IAS 19 and IAS 39, fell by £4.3 million from £35.3 million to £31.0 million. Excludingthe additional week’s interest charge in 2004, net interest payablefell by £3.7 million from £34.7 million to £31.0 million. In a largelystable interest rate environment during 2005, this reflects thebenefit of lower average debt levels. Excluding the IAS 19 financecredit of £1.7 million (2004: £2.9 million charge) and the impact of IAS 39, interest is covered 8.0 times by operating profit beforenon-recurring items, an improvement from 7.2 times in 2004. The IAS 39 impact in 2005 was a charge of £6.6 million (2004:£nil million). This reflects the fair value, exchange rate andamortisation adjustments on borrowings and associated financialinstruments accounted for under IAS 39. For 2006 a net IAS 19finance credit of £9.9 million is expected.
2005 200452 weeks 53 weeks
actual actualNon-recurring items £m £m
Restructuring costs 7.9 11.0
Severance costs following acquisition ofthe hotgroup plc 1.0 –
Profit on disposal of land and buildings (3.5) (1.0)
Profit on sale of shares in Scottish Radio Holdings (2.7) –
Maxwell-related recoveries – (1.3)
Write-down of presses in Chester and Oldham – 7.0
Release of old accruals for which no further costs are expected – (3.5)
Non-recurring items within operating profit 2.7 12.2
Profit on sale of subsidiary undertakings – (2.5)
Non-recurring items before tax 2.7 9.7

2005 200452 weeks 53 weeks
actual actual ChangeProfit before tax £m £m %
Group revenue 1,122.0 1,141.7 (1.7)%
Operating costs:
Labour (347.3) (344.5) (0.8)%
Newsprint (144.8) (142.5) (1.6)%
Depreciation (40.1) (41.3) 2.9%
Amortisation of intangibles (3.3) – –
Other costs (339.2) (359.2) 5.6%
Share of results of associates 0.8 0.8 –
Finance costs (excl. IAS 19 and IAS 39 impact†) (31.0) (35.3) 12.2%
IAS 19 finance credit/(charge) 1.7 (2.9) n/a
IAS 39 impact† (6.6) – n/a
Profit before taxand non-recurring items 212.2 216.8 (2.1)%
Non-recurring items (2.7) (9.7) 72.2%
Total 209.5 207.1 1.2%
The Group tax charge for the year of £62.6 million represents29.9% (2004: 29.9%) of profit before tax.
Earnings per share on a like-for-like* basis increased by 6.7%to 52.6p per share. On a statutory basis earnings per shareincreased by 2.2% to 50.3p per share.
Subject to the approval of the shareholders at the Annual GeneralMeeting, the directors propose a final dividend of 15.5 pence pershare to be paid on 9 June 2006 to shareholders on the registerat 5 May 2006. This increase will bring the total annual dividendfor the year to 21.9p per share, an increase of 8.4%.
Acquisitions
During 2005 the Group completed four acquisitions for a totalconsideration, including fees and assumed net borrowings, of £92.7 million.
The acquisition of Smart Media Services Ltd, the owner ofSmartnewhomes, was completed on 18 July 2005. The initialconsideration excluding costs was £11.3 million and a deferredconsideration based on future earnings is capped to a maximumof £5.3 million, all of which will be satisfied in cash and loan notes.
The acquisition of Financial Jobs Online Limited, the owner ofGAAPweb.com, was completed on 15 August 2005 for an initialconsideration excluding costs of £10.5 million and a deferredconsideration based on future earnings capped to a maximum of £2.6 million, all of which will be satisfied in cash.
The acquisition of the hotgroup plc, an AIM-listed company, was declared wholly unconditional on 26 October 2005. The offerprice of 20.25p per hotgroup share was payable in cash andamounted to approximately £50.5 million. Including fees andassumed net borrowings, total consideration amounted to£63.1 million.
The acquisition of Paldonsay Ltd, the parent company of HighStreet Direct Ltd, owner of SecsintheCity.com, was completed on 25 November 2005 for an initial consideration excluding costsof £3.3 million and a deferred consideration based on futurerevenues capped to a maximum of £0.2 million, all of which will be satisfied in cash.
During the 52 weeks ended 1 January 2006, these businessescontributed post acquisition revenue of £9.2 million and operatingprofit of £1.2 million before non-recurring items of £1.0 million and amortisation of intangibles of £3.3 million.
Chairman’s statement / Chief Executive’s statement / Business review / Corporate responsibility / Board of Directorsand Executive Committee / Corporate governance / Remuneration report / Directors’ report / Group independent auditors’report / Accounts and notes / Unaudited other information / Holding company accounts and notes / Investor Relations
27
*On a like-for-like basis, which is before acquisitions, non-recurring items, IAS 39 and for 2004 excludes the additional week’s trading. See reconciliation between statutory and like-for-like results on page 102.†Impact of fair value, exchange rate, and amortisation adjustments on borrowings and associated financial instruments accounted for under IAS 39. References to IAS 39 throughout this document shallhave the same meaning.

Chairman’s statement / Chief Executive’s statement / Business review / Corporate responsibility / Board of Directorsand Executive Committee / Corporate governance / Remuneration report / Directors’ report / Group independent auditors’report / Accounts and notes / Unaudited other information / Holding company accounts and notes / Investor Relations
28
Share buy-back
As part of a three-year share buy-back programme whichcommenced in March 2005, the Group acquired 8.2 millionshares for a total consideration of £52.7 million. In considerationof the cash expended on acquiring shares and expenditure on acquisitions, the Company suspended the share buy-backprogramme in October 2005 and no further buy-back of shares is planned.
2005 2004Balance sheet £m £m
Intangible assets 1,688.9 1,585.9
Deferred tax asset 97.9 106.5
Other non-current assets 395.9 395.3
2,182.7 2,087.7
Total equity 753.7 705.6
Short-term debt net of cash 28.3 (4.5)
Medium-term debt 464.2 458.5
Deferred tax liabilities 547.2 540.9
Long and short-term provisions 21.8 12.8
Net current other liabilities 61.9 52.5
Retirement benefit obligation 305.6 321.9
Total 2,182.7 2,087.7
Non-current assets excluding deferred tax have increased by £103.6 million during the year. This movement reflects an increasein intangible assets of £103.0 million arising from the businessesacquired during 2005 (£106.3 million less amortisation thereon of £3.3 million), and a net £0.5 million decrease in property, plant and equipment.
The investment in The Press Association has increased by £1.1 million from £7.5 million to £8.6 million principally as a resultof a tax refund arising in respect of prior years.
2005 2004Non-current assets (net book value) £m £m
Intangible assets:
Publishing rights and titles 1,579.9 1,579.9
Customer relationships and domain names 36.2 –
Goodwill 72.8 6.0
Property, plant and equipment:
Land and buildings 197.0 197.9
Plant and vehicles 162.1 159.6
Assets under construction 28.2 30.3
Investments:
Investments in associates 8.6 7.5
Deferred tax asset:
Deferred tax asset 97.9 106.5
Net book value of non-current assets 2,182.7 2,087.7
Capital expenditure in 2005 was £37.0 million (2004:£35.5 million) net of disposal proceeds against a depreciationcharge of £40.1 million (2004: £41.3 million). The capitalexpenditure included £16.7 million in relation to the press projectannounced in July 2005 and £2.9 million in relation to the nowcompleted regional press replacement project. Planned capitalexpenditure for 2006 is approximately £80.0 million, including a further £60.0 million in respect of the press investment project.All capital expenditure is forecast to be financed from operatingcash flows.
Smart FinancialMedia Jobs
Services Online hotgroup plc Paldonsay TotalAcquisitions £m £m £m £m £m
Revenue 1.4 0.9 6.9 – 9.2
Operating costs (0.8) (0.5) (6.7) – (8.0)
Operating profit before amortisation and non-recurring items 0.6 0.4 0.2 – 1.2
Amortisation (1.0) (0.8) (1.5) – (3.3)
Operating loss before non-recurring items (0.4) (0.4) (1.3) – (2.1)
Non-recurring items – – (1.0) – (1.0)
Operating loss (0.4) (0.4) (2.3) – (3.1)

Net debt has increased by £37.6 million from £454.9 million after the adoption of IAS 39 on 3 January 2005 to £492.5 millionat 1 January 2006. Net debt comprises loan notes, derivativefinancial instruments, bank overdrafts, short-term loans and finance leases of £525.7 million offset by cash balances of £33.2 million.
2005 2004Net debt maturity profile £m £m
Repayable within one year(including bank overdrafts) 61.5 38.9
Within two to five years 66.3 63.9
After five years 397.9 394.6
Cash balances (33.2) (43.4)
492.5 454.0
Adoption of IAS 39 – 0.9
Total net debt 492.5 454.9
The IAS 19 retirement benefit obligations before theprovision of deferred taxation have fallen by £16.3 million from£321.9 million to £305.6 million. The fall in the obligation reflects a £180.2 million increase in pension scheme assets (net of theasset ceiling effect of £3.1 million) partially offset by an increase in pension scheme liabilities of £163.9 million. The increase in the value of pension scheme assets reflects the improvement in equity markets during 2005 and increased deficit fundingpayments made during the year. The increase in the pensionscheme liabilities arises from increasing future life expectancies aswell as a fall in the real rate of return applied to discount liabilities,from 2.55% at 2 January 2005 to 1.95% at 1 January 2006.
Net retirement benefit obligations, after the provision of deferredtaxation, fell by £11.4 million from £225.3 million to £213.9 million.
During the period the IAS 19 operating profit pension charge for current service fell by £4.0 million to £28.6 million with cashcontributions (excluding past service enhancements) increasing by £10.4 million to £46.3 million.
The IAS 19 defined benefit operating profit current service pensioncharge will increase by £1.8 million from £28.6 million in 2005 toan estimated £30.4 million in 2006. This is due to a reduction inthe net discount rate resulting from lower bond yields comparedto 2004 and an increase in mortality rate assumptions, partiallyoffset by a reduction in the pensionable payroll. The cash fundingfor defined benefit pension schemes is estimated to increase by a further £5.0 million (excluding Pension Protection Fund levy)during 2006.
Total equity at 1 January 2006 was £753.7 million, an increaseof £48.1 million from £705.6 million at 2 January 2005. Theincrease reflects the £146.9 million profit for the financial yearbefore paying dividends of £60.2 million, the £52.7 million expendedon the buy-back of shares, the capitalisation of reserves of£5.7 million relating to the purchase of shares to provide for thepossible awards under the Long Term Incentive Plan launched in2004, and £17.6 million proceeds from the issue of new sharesfor maturing SAYE and Executive share option schemes.
Cash flow and treasury
Cash generated from operating activities has decreased by £12.0 million from £288.8 million to £276.8 million. The reducedcash flow for the Group principally reflects the additional pensioncontributions during the period.
The principal cash outflows in 2005 related to £35.1 million interestpaid on borrowings and finance leases (2004: £36.0 million), nettax paid of £55.5 million (2004: £55.6 million), capital expenditureof £41.0 million (2004: £37.3 million), £86.5 million (2004: £nil)expended on acquisitions, the purchase of 8.2 million shares for£52.7 million under the share buy-back programme, the purchaseof shares for £5.7 million (2004: £6.2 million) to provide for thepossible awards under the new Long Term Incentive Planlaunched in 2004 and the £60.2 million payment of equitydividends (2004: £55.1 million). With the exception of a£9.8 million (2004: £1.8 million) cash inflow from the disposal of land, available-for-sale financial assets and property, plant andequipment, £0.6 million (2004: £3.2 million) dividends receivedfrom associates and the £17.6 million (2004: £12.5 million)proceeds on the issue of new share capital following the exerciseof share options under various schemes, there were no materialcash inflows, other than from operating activities.
During the year the Group’s £269 million bank facility was re-negotiated and extended by two years to 20 June 2009 to takeadvantage of improved margins.
2005 2004Cash flow movements £m £m
Cash generated from operations 276.8 288.8
Interest paid on borrowings and finance leases (35.1) (36.0)
Tax paid (55.5) (55.6)
Net capital expenditure (37.0) (35.5)
Equity dividends paid (60.2) (55.1)
Net cash flow from (acquisitions)/disposals (86.5) 42.8
Purchase of shares under share buy-back (52.7) –
Other sundry movements 12.6 5.3
(Increase)/reduction in net debt before transition to IFRS (37.6) 154.7
Adjustment on transition to IFRS – (3.6)
(Increase)/reduction in net debt (37.6) 151.1
Funding and liquidity At 1 January 2006 committed facilities of£730.7 million were available to the Group, of which £219.5 millionwere undrawn. No new financing facilities were procured in 2005and no debt facilities were repaid other than in accordance withtheir normal maturity date.
Chairman’s statement / Chief Executive’s statement / Business review / Corporate responsibility / Board of Directorsand Executive Committee / Corporate governance / Remuneration report / Directors’ report / Group independent auditors’report / Accounts and notes / Unaudited other information / Holding company accounts and notes / Investor Relations
29

Chairman’s statement / Chief Executive’s statement / Business review / Corporate responsibility / Board of Directorsand Executive Committee / Corporate governance / Remuneration report / Directors’ report / Group independent auditors’report / Accounts and notes / Unaudited other information / Holding company accounts and notes / Investor Relations
30
2005 2004Committed financing facilities £m £m
£269 million syndicated unsecured bank loan 269.0 269.0
US$ and £ private placements 442.5 442.5
Finance leases 18.4 20.2
Acquisition loan notes and other bank loans 0.8 13.9
Total 730.7 745.6
Drawn facilities (including bank guaranteesand before capitalised issue costs) 511.2 482.5
Undrawn facilities 219.5 263.1
Treasury The key risks arising from the Group’s activities and its financing facilities are funding and liquidity, interest rates,foreign currency and covenants. The treasury policies formanaging these risks have been approved by the Board and are summarised below.
Liquidity risk The Group’s policy is to ensure continuity offunding and flexibility. Debt maturities are spread over a widerange of dates, thereby ensuring that the Group is not exposed to excessive refinancing risk in any one year. The maturity profileof debt outstanding at 1 January 2006 is summarised above. The Group’s liquidity risk arises from timing differences betweencash inflows and outflows. The Group manages these risks throughunutilised committed and uncommitted credit facilities. It is theGroup’s policy to maintain sufficient cash balances and committedfacilities to meet anticipated funding requirements for the next twoyears. These resources, together with the expected future cashflows to be generated by the business, are regarded as sufficientto meet the anticipated funding requirements of the Group for at least the next 12 months.
Financing and interest rate risk The Group’s exposure to interest rate risk is managed through the use of interest rateswaps, options, caps and forward rate agreements. Hedgingtransactions are undertaken after a review of the effect on profitafter tax of a range of interest rate assumptions and probabilities,determined by reference to the general economic climate andmarket forecasts for interest rates. In view of the significantlyreduced debt levels and forecast low interest rate environment, no debt is hedged at 1 January 2006.
Foreign currency risks Less than 1% of the Group’s turnoverand operating costs are generated in currencies other thansterling. Given the minimal impact on profit after tax of fluctuationsin foreign currencies, the Group trades foreign currencies at spotrates. The payment of interest and capital on borrowingsdenominated in foreign currencies are all fully hedged throughcross-currency interest rate swaps.
Covenant risk The Group seeks to maintain standard terms forall its financial covenants where possible. The Group’s covenantsare monitored on an ongoing basis with formal testing of financialcovenants at each half year end. During the year the financialcovenants of the bank facility were revised following the extensionof the bank facility to 2009. The Company continues to complywith all borrowing obligations and financial covenant obligations.
Adoption of International Financial Reporting and Accounting Standards (‘IFRS’)
This is the first set of consolidated annual financial statementsprepared in accordance with IFRS adopted for use in theEuropean Union. The adoption of IFRS and the consequentadoption of IAS 39 potentially creates significant volatility in boththe income statement and reported debt levels. To provide claritymoving forward, all adjustments arising from IAS 39 will beidentified and underlying debt levels excluding the impact of IAS39 will continue to be disclosed. The reported net debt includingthe adoption of IAS 39 is shown in note 28. Net debt excludingthe impact of IAS 39, which reflects the underlying position, is shown on page 106. The key differences between the 2005reported results prepared in accordance with IFRS and those that would have been reported under United Kingdom GenerallyAccepted Accounting Practice applicable at 2 January 2005 are explained on pages 104 to 105.

Corporate responsibility review
Chief Executive’s statement
Trinity Mirror is now able to demonstrate a much improved andmore systematic approach to environmental management, as aresult of the initiatives we have put in place over the last threeyears. During 2005 we adopted a new Environmental Policy thatsets out our commitments in relation to the main areas where theCompany has significant potential to affect the environment andthat provides a better framework for managing these issues. At Group level we have established clearer management andreporting lines for environmental affairs. At the sharp end of thebusiness we have made good progress in establishing formalenvironmental management systems at our print sites, and I lookforward to the Oldham print operation successfully achievingcertification to the ISO 14001 standard during 2006.
At the end of last year we set, for the first time, a number ofchallenging environmental targets. I am pleased that we have metour targets in relation to sustainable paper sourcing and energyconsumption. Although our new arrangements for wastemanagement have taken somewhat longer to put in place thanwe anticipated, the initiatives to increase waste recycling arestarting to bear fruit and I am confident that we will be able toconfirm that we have met our recycling target during the first halfof 2006.
We believe that our environmental performance now comparesvery favourably with others in the newspaper sector, but recognise that we need to continue to work hard to meet thetougher environmental standards increasingly required of largepublic companies.
I am particularly pleased that during the year the Company wasawarded the ROSPA Occupational Health and Safety Gold Awardfor its performance in the three years to December 2004. This notonly reflects our continued drive to reduce accidents but is a creditto all our managers and staff. Health and safety is everybody’sresponsibility and the improvements that we have seen could onlyhave been achieved by the whole team playing a part.
2005 was the Year of the Volunteer – Chancellor Gordon Brown’sproject to raise one billion minutes of volunteered time for goodcauses. Trinity Mirror lent its support throughout the year by givingmanagement time to advise on the media strategy, donatingadvertising space in our national and regional titles for the Give ABillion Minutes campaign, and encouraging staff to get involved.
To complement the existing voluntary and community workalready taking place across the Group, we have now begun workon a Group-wide programme to make it easier for our staff tomake a difference in their local communities through volunteering.
Sly BaileyChief Executive
Environmental management
Summary of progress during 2005
During 2005, Trinity Mirror further improved and consolidated its environmental management system arrangements. Building on what has been achieved in recent years to review andcharacterise the Company’s environmental impacts and settargets for improvement, the Executive Committee agreed during2005 to the establishment of:
• A new Environmental Policy• A clearer framework of management responsibilities• New procedures and action plans for delivering against
Policy objectives and targets
The new policy (see pages 38-39) provides a better foundation forenvironmental management within Trinity Mirror. The policy is nowaligned with the important issues and defines the basic principlesgoverning the Company’s approach.
The Executive Committee have joint ownership of environmentalissues within Trinity Mirror’s Risk Management framework, with the Secretary and Group Legal Director and Group ManufacturingDirector as main points of contact. A management framework has now been clearly defined showing specific responsibilitiesallocated to Executive Committee members, Senior Managersand supporting Managers respectively.
Action plans have now been documented, setting out how theCompany intends to achieve its environmental improvementtargets. Progress and performance will be monitored using a newaudit and review procedure that covers compliance with legalrequirements, progress against targets and periodic review bysenior management against the Company’s Policy commitments.
Performance in key areas
Trinity Mirror has met some, but not all, of the environmentaltargets set for 2005. Performance is reported below in the areaswhere Trinity Mirror continues to focus its environmental efforts:
• Paper sourcing, sustainable forestry and recycling• Energy consumption and greenhouse gases• Volatile organic compound (VOC) emissions• Waste management and recycling• Environmental management systems
(a) Paper sourcing and sustainable forestry
The bulk of Trinity Mirror’s supply comes from a spread of theestablished paper suppliers, who source wood fibre mainly fromthe traditional areas of Scandinavia, the Baltic States and NorthAmerica. A proportion of the wood used also comes from otherEuropean countries (Germany, France, Spain, UK, Russia).
Chairman’s statement / Chief Executive’s statement / Business review / Corporate responsibility / Board of Directorsand Executive Committee / Corporate governance / Remuneration report / Directors’ report / Group independent auditors’report / Accounts and notes / Unaudited other information / Holding company accounts and notes / Investor Relations
31

Chairman’s statement / Chief Executive’s statement / Business review / Corporate responsibility / Board of Directorsand Executive Committee / Corporate governance / Remuneration report / Directors’ report / Group independent auditors’report / Accounts and notes / Unaudited other information / Holding company accounts and notes / Investor Relations
32
All of Trinity Mirror’s paper suppliers were sent a questionnaire at the end of 2004, containing a range of questions about their environmental and social responsibility performance. This information was analysed during 2005 to help Trinity Mirrorunderstand more about the sources of paper that it buys and in particular to support the new target on newsprint sourcing.
Target: Trinity Mirror will source 75% of its newsprint from either recycled materials or virgin fibre that has been independentlycertified as coming from well-managed and sustainable forests, by the end of 2005.
Performance:During 2005, Trinity Mirror sourced almost 83% of total supply of newsprint from recycled fibre or fibre from certified forests,against our target of 75%.
The survey of suppliers completed during 2005 has raised further questions about the provenance of timber-sourcing data,the adoption of forestry certification schemes, the traceability of un-certified timber, and suppliers’ own policies on sustainableforestry. We will continue to pursue these issues in collaborationwith our suppliers during 2006.
(b) Energy consumption, greenhouse gases and water
During 2005, the programme of energy reduction initiativesagreed during 2004 has continued. Consolidated energyconsumption for the Group, and associated carbon dioxideemissions, are reported below, distinguishing between ‘internal’operational activities where we have direct management controland those that we contract out, notably the printing of magazinesupplements and product distribution.
Our overall energy consumption from internal activities fell by 3,000 tonnes (5.1%) compared with 2004 and this reflects the benefits of our energy reduction programme (see alsoperformance against our electricity target below).
The numbers presented for contracted activities are based on un-audited information provided by our suppliers. Due to the closureof a major plant, one supplier has been unable to provide actualdata and this has been estimated. We are not yet in a positiontherefore to make reliable year-on-year comparisons for theseelements of our energy balance.
Trinity Mirror energy consumption 2005 and associated CO2 emissions
CO2
conversionConsumption factor
2005 2004
Internal activities1
Electricity consumption 128,051,427(print works and all offices) kWh 0.403 x10⁻³ 51,605 53,196
Gas consumption 30,858,989(print works and all offices) kWh 0.19 x10⁻³ 5,882 6,641
Fuel oil (emergency 91,913generators, all sites) litre 2.69 X 10⁻³ 247 608
Commercial vehicles 11,228,200km 0.267x10⁻³ 2,998 2,935
Business travel (car) 17,071,834km 0.19x10⁻³ 3,244 3,988
Business travel (air) 6,584,005km 0.15x10⁻³ 988 1,101
Total internal 64,964 68,469
Total internal per million pages of printed output 0.39 0.41
Contracted activities2
Electricity for printing (mostly magazine inserts) 0.43x10⁻³ 7,410
Gas for printing (mostly magazine inserts) 0.19x10⁻³ 6,154
Electricity for distribution 3,967,662warehousing kWh 0.43x10⁻³ 1,706
Gas for distribution 7,551,600warehousing kWh 0.19x10⁻³ 1,435
Fuel for road transport 4,500,555distribution litre 2.63x10⁻³ 11,836
Total contracted (estimate) 28,541
Total Group 93,505
Total Group per million pages of printed output 0.56
1. Internal activities are those undertaken on Company premises and/or by Company staff, over which Trinity Mirror has direct management control.
2. Contracted activities refer to those aspects of the Company’s operations which are undertakenby external contractors and over which Trinity Mirror does not have direct control. The activitiesconcerned are the printing of magazine supplements and the distribution of printed products.The numbers given above are estimates only based on information provided by suppliers. All numbers in italics are or include estimates.
90
80
70
69
50
40
30
20
10
0Target Actual
Percent
CO2 emissions (tonnes)

Target: Trinity Mirror will reduce its internal electricity consumption by 3% by the end of 2005 (against a 2003 baseline).
Performance:As a result of the energy-saving initiatives that we have pursued,we are able to report a steady reduction in the electricityconsumption of our print works and offices over the past threeyears. By the end of 2005 our internal electricity consumption had fallen by 21,900,000 kWh compared with 2003, representinga reduction of 14.6% (versus the target of 3% reduction).
Trinity Mirror Internal Electricity Consumption 2005
Our main print sites have participated for a number of years in the government’s printing sector Climate Change Levy Scheme,that rewards companies achieving specified energy savingtargets. In the light of the further improvements that we haveachieved, we have now also decided to apply for accreditationunder the Carbon Trust Energy Efficiency Scheme. The CarbonTrust are currently assessing our energy policies, performancedata, arrangements for staff training and involvement and wehope successfully to achieve accreditation early in 2006.
The water consumption of the Group’s ‘core’ sites during 2005 was 217,500 cubic metres.
(c) Volatile Organic Compound emissions (VOCs)
Last year, we were able to report a significant reduction inemissions to the atmosphere of solvent fumes (VOCs) from ourprint sites. These reductions have been achieved through acombination of plant improvements and initiatives to introducewater-based inks and other printing chemicals. During 2005 wehave addressed some of the few remaining areas of high VOCconsumption and our total VOC consumption has fallen by a further 54%. We are confident that we are now close to industrybest-practice levels of VOC emissions in relation to the volume of production.
160,000,000
140,000,000
120,000,000
100,000,000
80,000,000
60,000,000
40,000,000
20,000,000
02003 2004 2005
Internal electricity consumption (kWh)
Estimated annual consumption of Volatile OrganicCompounds (VOCs) by Trinity Mirror print sites operational at the end of 2005
Estimated annual consumption of VOCs (kg)Print site 2005 2004
Watford 3,221 14,620
Oldham 400 2,147
Cardonald 298 19,890
Cardiff 10,939 12,150
Teesside 0 3,000
Fort Dunlop 0 230
Newcastle 19,000 19,000
Liverpool 0 6,000
Blantyre 2,500 2,820
Group total 36,358 79,857
(d) Waste management & recycling
During 2005, the new contractual arrangements for handlinggeneral wastes agreed at the end of 2004 have beenprogressively rolled out across the Group, focusing on the 28 largest sites that collectively account for around 90% ofCompany total waste generation. A number of site audits were carried out in the first half of 2005 to determine recyclingpotential at print sites and these, together with a pilot project at our major print site at Oldham, have been used to developimproved systems for segregating recyclable materials from the general waste stream. Significant opportunities have beenidentified for recycling wooden pallets, that have previouslymade up a significant proportion of general waste removed to landfill, as well as other items, notably polythene wrappingand plastic bandings, aluminium cans, plastic cups and bottles and printer cartridges.
Target:Trinity Mirror will recycle 12% by weight of all general wastearising by the end of 2005.
Performance:Implementation of our new segregation and recyclingarrangements for general wastes got off to a slower start andhas taken longer than we anticipated. As a result we do not yethave comprehensive data on recycling rates across the Company.Nevertheless preliminary information from our largest seven printsites indicates that by the end of 2005 we were achieving at leasta 15% recycling rate.
During the first half of 2006 we will re-audit our general wasteminimisation and segregation arrangements and this process will generate better data against our recycling target. We willcontinue to work with our contractors during 2006 towards an objective of zero materials to landfill for all Trinity Mirror sites.
Chairman’s statement / Chief Executive’s statement / Business review / Corporate responsibility / Board of Directorsand Executive Committee / Corporate governance / Remuneration report / Directors’ report / Group independent auditors’report / Accounts and notes / Unaudited other information / Holding company accounts and notes / Investor Relations
33

Chairman’s statement / Chief Executive’s statement / Business review / Corporate responsibility / Board of Directorsand Executive Committee / Corporate governance / Remuneration report / Directors’ report / Group independent auditors’report / Accounts and notes / Unaudited other information / Holding company accounts and notes / Investor Relations
34
The improvements we are beginning to make in recycling ofgeneral waste complement the high levels of recovery of Special(i.e. hazardous) wastes and manufacturing paper wastes that we have achieved over the past three years.
Trinity Mirror Special (hazardous) waste generation and recycling 2005
Total waste Total recovered/ % recovered/generated recycled recycled
Liquid wastes (litre) 1,152,340 1,064,067 92.6
Solid wastes (kg) 263,417 232,338 88.2
(e) Environmental management systems
During 2005 a programme was commenced, in conjunction with the Groundwork Trust, to develop formal environmentalmanagement systems for each of the Company’s nine print sites.The strategy is to seek full certification to ISO 14001 at theOldham site on a pilot basis, whilst simultaneously developingenvironmental management systems in line with the BS8555standard at the other eight sites. The ultimate goal will be to achieve full certification to ISO 14001 at all sites.
Target:Trinity Mirror will achieve certification to the ISO 14001environmental management system standard at the Trinity Mirror Printing Oldham site by the end of 2005, with a view subsequently to achieving certification at all of the Company’s print sites.
Performance:Construction activities at Oldham have resulted in some delays to the implementation of the environmental management system.This has meant that the site did not meet the target of achievingcertification to ISO 14001 by the end of 2005. Nevertheless,considerable progress has been made in developing themanagement system and we expect the site to be ready for thefirst assessment by independent external certifiers during the first half of 2006.
The other print sites have all made progress in working through Phase 1 of their environmental management systemimplementation plans, including:
• Establishing EMS teams• Completing baseline assessments• Identifying improvement initiatives• Developing site awareness training plans
Health and safety
The year started positively with the news that Trinity Mirror had been awarded the ROSPA Occupational Health and SafetyGold Award for its performance in the three years leading up to December 2004. In this period the number of reportableaccidents was substantially reduced as a result of local andgroup health and safety initiatives (see table below).
2004 2003 2002
Fatalities – – –
RIDDOR* major injuries 9 10 11
RIDDOR over three-day injuries 41 52 75
RIDDOR occupational ill health/
diseases/conditions 3 1 2
RIDDOR dangerous occurrences 0 1 2
Total – All accidents 754 870 931
RIDDOR events frequency rate† 0.27 0.28 0.39
All accidents frequency rate† 3.8 3.85 4.1
Total days lost – accidents and
occupational ill health‡ 1,498 1,378 2,137
(a) 2005 health and safety initiatives
The Board continues to be kept informed of importantdevelopments in health and safety through the Secretary and GroupLegal Director. The following activities took place during the year:
• A Group Health and Safety Forum was established to allow Health and Safety Managers to work together, sharing knowledge, experience and good practice. Members are also involved in promoting a common approach to health and safety through new and updated policies and procedures.
• New policies and procedures relating to the selection and control of contractors and the management of engineering and construction projects were introduced.
• In addition to the ongoing programme of workplace safety inspections, health and safety audits were carried out at each of the print sites. These audits are helping to improve and maintain standards and ensure compliance with statutory regulations.
• A specialist consultant completed a programme of building surveys to identify the location and condition of asbestos-containing materials. This has resulted in asbestos registers for buildings containing asbestos. Training has also been provided for local Building Service Managers so that they are competent to manage in this area.
• Arrangements for safety during all work at height were reviewed to ensure conformity with the Working at Height Regulations 2005. Where appropriate risk assessments and systems of workwere improved and staff were given safety briefings.
• The installation of new presses and ancillary equipment commenced at the Oldham printing plant. Progress to date has been good, though the project is not scheduled for completion until the summer of 2006.
• Old printing presses were safely removed from the plants that were located in Cardiff, Chester and Huddersfield.

(b) Group health and safety statistics
The table below briefly illustrates accident statistics for the Group in 2005. Analysis of the data reveals that the overall number ofaccidents, including those reportable under RIDDOR, was downon the previous year, though in the case of reportable accidents bya much smaller margin than previously. There was also a welcomereduction in the number of working days lost. However, thesepositive gains are tempered by the fact that there has been anincrease in RIDDOR major injuries, contributed to substantially by accidents involving slips, trips and falls. The total number ofaccidents involving slips, trips and falls has in fact fallen comparedto 2004, but unfortunately they have more often resulted inreportable injury. There is clearly scope for further improvement in this area during 2006.
Health and safety performance indicator 2005 2004
Fatalities – –
RIDDOR* major injuries 12 9
RIDDOR over three-day injuries 35 41
RIDDOR occupational ill health/
diseases/conditions 1 3
RIDDOR dangerous occurrences 3 0
Total number of accidents 484 754
RIDDOR events frequency rate† 0.26 0.27
All accidents frequency rate† 2.7 3.8
Total days lost – accidents and
occupational ill health‡ 1,109 1,498
(0.04%) (0.05%)
*RIDDOR = Reporting of Injuries, Diseases and Dangerous Occurrences Regulations 1995.†Frequency Rate = number of accidents per 100,000 hours worked.‡Figure in brackets represents the percentage of total days worked by all employees in the Group.
Chairman’s statement / Chief Executive’s statement / Business review / Corporate responsibility / Board of Directorsand Executive Committee / Corporate governance / Remuneration report / Directors’ report / Group independent auditors’report / Accounts and notes / Unaudited other information / Holding company accounts and notes / Investor Relations
35
Breakdown of accidents by type of event
(All percentages rounded to the nearest half decimal point)
RIDDOR All RIDDOR Allaccidents accidents accidents accidents2005 (%) 2005 (%) 2004 (%) 2004 (%)
Slips and falls (same level) 62 23 27 19.5
Lifting and handling of materials 15 12 21 16.5
Contact with machinery 6 6.5 11 4
Falls from a height 6 1.5 9.5 1.5
Stepping on or striking fixed object – 14.5 7.5 19
Struck by moving vehicle – – 4 1
Contact with sharp/abrasive material 4.5 21 2 11
Struck by flying or falling object 2.5 5.5 2 6
Contact with hazardous substance – 2.5 2 5
Contact with hot material/substance – 1 2 3
Object collapsing or overturning – – 2 0.5
Use of hand tools – 1.5 – 4
Contact with electricity – – – 1
Others 4 11 10 8
Total 100 100 100 100

Chairman’s statement / Chief Executive’s statement / Business review / Corporate responsibility / Board of Directorsand Executive Committee / Corporate governance / Remuneration report / Directors’ report / Group independent auditors’report / Accounts and notes / Unaudited other information / Holding company accounts and notes / Investor Relations
36
Charities
The Company’s policy with regard to charitable donationsand other such payments is as follows:
‘Trinity Mirror believes that it can best support charities throughthe pages of its newspapers. This support will either be throughappeals to readers for donations or through editorial content,describing the aims and activities of various charities. In everycase the decision as to whether or not to support a charityappeal or whether to run editorial comment will be one forthe editor of each newspaper.
Trinity Mirror plc will make direct cash donations to charitiesin certain limited circumstances. The Company will, at a Grouplevel, support various charities connected with or associatedwith the newspaper, printing or advertising industries.
A second category of direct cash support will be to charitiesoperating in the communities immediately surrounding TrinityMirror’s offices and print sites. The charities that are likely toreceive support are smaller community-based charities wherea modest donation will make a big impact. It is unlikely thata major national charity that just happens to be based veryclose to one of our offices would receive a donation.
There will be a further limited general pool of funds out of whichdonations will be made to legitimate and supportable causesthat fall outside the above two criteria. There will, however, needin each case to be a demonstrable business/commercial reasonwhy such support should be given.
Each of our regional newspaper companies will have a smallbudget out of which they will make direct cash donationsto charities working in the community in which the newspaperis based. Scottish Daily Record and Sunday Mail Limited willsimilarly make a number of donations to appropriate charitiesbased in Scotland.
The National titles of the Daily Mirror, Sunday Mirror andThe People are most unlikely to make direct cash donations.They will do so only where they are asked to make a paymentto charity in lieu of a fee for an interview or some form of support.Any “corporate” donations requested from the National titlesare likely to be redirected to the Group, as the Company’sheadquarters share the same office location as that of theNational titles.
All “Group” donations need the prior agreement of the Secretaryand Group Legal Director. Any local business donations requirethe prior agreement of the relevant Managing Director.In addition to cash donations, the Company is active in makingdonations in kind in the form of used computer equipment,furniture, books, etc. Through its community involvementprogrammes, the Company makes available membersof its staff for volunteering and mentoring programmes.’
The three most common types of reportable accidents withinTrinity Mirror consistently remain:
• Slips, trips and falls (same level)• Lifting and handling of materials• Contact with machinery
(c) Health and safety enforcement activity
Health and safety enforcing officers visited our businesses in pursuance of their duties on 26 separate occasions during the course of 2005, compared to eleven such visits in 2004. The majority of these visits involved routine inspections. No enforcement notices were issued against the Company or itssubsidiaries and there were no prosecutions brought against us.
(d) Future initiatives
The Company remains committed to achieving furtherimprovements in health and safety performance.
Ethics
For many years the Company has had a policy on Standardsof Business Conduct which we regularly review. The introductionto the current policy states:
‘Trinity Mirror plc is the largest newspaper publisher in the UKand a major UK plc. The continuing development and well-beingof our business depends on all of us maintaining the higheststandards of integrity and personal conduct in all matters whichinvolve the Company.
The Company recognises its obligations to those with whomit has dealings, namely its employees, shareholders, readers andadvertisers, suppliers and the communities in which its businessesoperate. Its reputation is one of the most vital resources of theCompany, and depends for its protection upon the honestyand integrity of each and every one of us. This documentgives guidance on how the essential standards of integrity andconduct are to be maintained. It is not intended as a statementof new beliefs or the creation of new rules of conduct. Rather,it is a reaffirmation of our continuing values and practices.Finally, this document should be read in conjunction with anyspecific code issued to individual groups of employees (e.g.Financial Dealings by Journalists) or any provisions of individualcontracts of employment.’
The policy itself is available on the Company’s website andgives guidance on conflicts of interest, the acceptance of giftsand entertainment, confidential information, insider information,and political and civic activities.

Community engagement
Community engagement is at the heart of our local businesses,forming part of the everyday activities of our titles. The best way to describe the sort of work undertaken is through examples of key projects across the Group.
In the North East, our specially built media centres helped another17,000 school children improve their literacy. The two Newspapersin Education Newsrooms worked closely to produce the first of 12 regional youth publications as part of the ASPIRE campaign,which is designed to raise the aspirations of young people. NERD(North East Really Delivers) World is written and designed by young people for young people and 100,000 copies are delivered to all secondary schools across the region three times a year.
Trinity Mirror is a long-standing supporter of Business in theCommunity – a charitable organisation that works with businessesto improve their positive impact on society. In 2005, our NorthWest and Coventry businesses extended their volunteeringcommitment by joining Liverpool Cares and Coventry Cares. Theseinitiatives are now integrated into their training and developmentprogrammes, and have been extended across all departments.
The Sunday Mail’s appeal with the Scottish Society for Autismhelped raise £1.8 million to open New Struan, Scotland’s firstpurpose-built school for children with autism.
The Chester Chronicle’s ‘Miles of Smiles’ charity has notched up£500,000 over the past 15 years to provide holidays to DisneylandParis for sick, disabled and underprivileged children.
The Coventry Evening Telegraph’s ‘Snowball Appeal’ has beenrunning for 20 years and has raised more than £20 million for localdisabled children.
It was another year of achievement for The Evening Gazette’s‘Tees Pride’ campaign, which launched two new major initiatives –the Year of Enterprise to encourage entrepreneurial spirit in thecommunity and the Wake Up to Your Health campaign. TheGazette’s first Making A Difference Fund ball also raised thousandsof pounds for local charities.
The Newcastle Evening Chronicle’s ‘Sunshine Fund’ raised£150,000 for vital special equipment for disabled children living inthe North East. Fundraising highlights included the Sunflower Ball,a Celebrity Question of Sport night and the Quayside charity run.
The Birmingham Mail teamed up with ChildLine to launch itsSpeak Out Stop Bullying campaign, sending out anti-bullyingpacks to every junior and senior school in the area.
Throughout the year, the Daily Mirror consistently championed theMake Poverty History campaign. The title also donated advertisingspace to the charity in the run-up to Live 8, and the G8 and WorldTrade Organisation summits.
Now in its eighth year, the Daily Mirror’s Pride of Britain Awardsgives the country’s unsung heroes the recognition they deserve. In addition, most of our local titles continue to host their owncommunity awards.
Through the Prince of Wales’ Seeing Is Believing project, theGroup was able to ensure the survival of the Kids Company – a South London charity for troubled children – which was on theverge of closing due to lack of funding. Our involvement in theproject was singled out for a special mention by Prince Charles.
Having played a key role in their home city winning the title of European Capital of Culture 2008, the Liverpool Echo andLiverpool Daily Post became official partners to the initiative. The deal is worth around £2 million in cash, marketing support and publishing agreements, and underlines our commitment to supporting the cultural and economic life of Liverpool.
Risks and opportunities
Trinity Mirror is not a multinational nor is it engaged in ‘heavy’industry. It is not, therefore, exposed to some of the risks facedby those who operate in developing countries or at the sharpend of environmental exposure. The greatest exposure for theGroup would, therefore, be a systems failure that led to adomestic failure of its environmental, health and safety or ethicalpolicies. It is unlikely that a failure in any of these three areaswould be catastrophic.
The Board believes that the Company’s main exposure wouldbe one of reputational damage. The procedure that the Companyemploys to control and manage these risks is through a regularreview of its standards and systems and through training ofrelevant employees and managers.
The Company’s Standards of Business Conduct are embeddedwithin the culture of the Group. More recently the Company’shealth and safety policies and systems have been put underreview and have been consolidated and codified. More attentionis now being paid than in the past to environmental matters.
The Company believes that opportunities in these areas are,similarly, reputational. We believe that there are advantagesto being seen as the employer of choice for those entering ourindustry, that decision having been made on an assessment,amongst many other things, of our corporate social responsibilityprogrammes. Those programmes will also be key in the retentionof staff. We also believe that there are obvious commercialadvantages from being seen as a socially responsible company.
Comments to:
Paul VickersSecretary and Group Legal DirectorTrinity Mirror plcOne Canada SquareCanary WharfLondon E14 5AP
Chairman’s statement / Chief Executive’s statement / Business review / Corporate responsibility / Board of Directorsand Executive Committee / Corporate governance / Remuneration report / Directors’ report / Group independent auditors’report / Accounts and notes / Unaudited other information / Holding company accounts and notes / Investor Relations
37

Trinity Mirror plc – Environmental Policy
Trinity Mirror is the UK’s largest newspaper publisher, with a portfolio of more than 500 media brands.
This includes some 240 local and regional newspapers and four sports titles, as well as over 60 websites and a variety of magazines, directories and exhibitions.
The Group employs 11,000 people in centres across the UK,including nine major printing sites.
We recognise that all our business activities have the potential to affect the environment and we endeavour to manage these in a responsible manner. This Policy sets out our commitments in relation to the main areas where the Company has significantenvironmental impacts:
• Paper sourcing, sustainable forestry and recycling• Energy consumption and greenhouse gases• Volatile organic compound (VOC) emissions from print works• Waste management and recycling• The purchase of contracted printing and product
distribution services
This Policy has been adopted by the Board of Trinity Mirror, which will ensure that it is progressively implemented through a programme of annual targets and action plans. Progressagainst policy commitments will be regularly audited and reported publicly using appropriate performance indicators.
Paper sourcing, sustainable forestry and recycling
Trinity Mirror is a major purchaser of paper for newspapers andmagazines, and we recognise the potential impact that timberextraction for paper-making may have on forest conservation.
We are committed to ensuring that the wood fibre used toproduce our paper comes from reputable sources. This meansthat we will seek to use either recycled fibre, or ‘virgin’ wood fibrethat comes from well-managed forests. Trinity Mirror supports theconcept of independent third-party certification as a means ofpromoting good forest management practice and we will use ourbuying power to support certification schemes wherever possible.
Chairman’s statement / Chief Executive’s statement / Business review / Corporate responsibility / Board of Directorsand Executive Committee / Corporate governance / Remuneration report / Directors’ report / Group independent auditors’report / Accounts and notes / Unaudited other information / Holding company accounts and notes / Investor Relations
38
It is Trinity Mirror’s policy to:
1.Maximise the proportion of recycled fibre in the paper we use, within the technical constraints of obtaining paper that is fit-for-purpose.
2.Work with our paper suppliers to trace the forests of origin of the virgin wood fibre that goes into the paper we use.
3.Work with our suppliers to identify any forest sources of woodfibre that are unacceptable, either on environmental or socialgrounds, and seek to eliminate these from our supply chain.
4.Wherever possible, purchase paper where the virgin fibrecontent has been independently certified as coming from well-managed forests.
Energy consumption and greenhouse gases
Trinity Mirror recognises that climate change, triggered bygreenhouse gases from burning fossil fuels, poses a significantthreat to the world’s environment. We contribute to the emission of greenhouse gases through the energy we use for printing, for running our offices, distributing our publications and in business travel.
We are committed to measuring and wherever possible reducingthe energy consumption associated with all of the operationalactivities where we have direct management control.
It is Trinity Mirror’s policy to:
1.Measure and report the energy consumption of our printingworks and offices.
2.Measure and report the energy consumption of our in-housevehicle fleet.
3. Identify opportunities for energy saving and set defined actionplans for achieving these savings.

Chairman’s statement / Chief Executive’s statement / Business review / Corporate responsibility / Board of Directorsand Executive Committee / Corporate governance / Remuneration report / Directors’ report / Group independent auditors’report / Accounts and notes / Unaudited other information / Holding company accounts and notes / Investor Relations
39
Volatile organic compound (VOC) emissions
The emission to the atmosphere of solvent vapours – known as ‘Volatile Organic Compounds’ (VOCs) – has traditionally been a major concern for the printing industry. VOCs have been typicallyassociated with the solvent content of important raw materialssuch as inks and cleaning materials used in printing processes.
We have made considerable progress in recent years in reducingthe consumption of raw materials that contain VOCs. In particular,most of our print sites have now moved to low-VOC inks andblanket washes. This means that all of our own print works fallbelow the threshold limits for VOC emissions that would requireauthorisation under European environmental legislation. We arecommitted however to finding alternatives to our remaining uses of VOC-containing materials.
It is Trinity Mirror’s policy to:
1.Measure and report the consumption of VOCs at our printing works.
2.Wherever possible substitute raw materials that contain VOCswith alternatives that contain either reduced or no VOCs.
Waste management and recycling
Trinity Mirror generates significant amounts of waste that requirestreatment or disposal. Major sources of waste from our operationsinclude: paper from printing, packaging materials, office waste,end-of-life equipment and hazardous materials such as waste oils and chemicals.
We are committed to maximising the amount of waste we recycleor re-use. Where disposal is the only option, we will do this in a legal and responsible manner.
It is Trinity Mirror’s policy to:
1. Identify all of the waste streams from our premises.
2. Identify opportunities for recycling or re-using wastes and realisethese through defined action plans.
3.Measure and report the quantities of all of our major wastestreams and the proportion of each waste stream that is recycled or re-used.
Contracted printing and product distribution services
Trinity Mirror recognises that certain operations which arecontracted out – notably the printing of magazine supplementsand the distribution by road of printed products – may havesignificant environmental impacts. Potential impacts include energyconsumption from printing and road transport and VOC emissionsand wastes arising from printing processes.
We expect our major print and distribution contractors to haveenvironmental policies and programmes which are equivalent to our own.
It is Trinity Mirror’s policy to:
1.Do business only with print and distribution suppliers who haveeffective environmental policies and programmes and, whereverpossible, are certified to either the ISO 14001 or EMASenvironmental management system standards.
2.Work with our suppliers to measure and report the energyassociated with contracted printing, contracted productdistribution and business travel.
3.Work with our suppliers to measure and report the consumptionof VOCs attributable to Trinity Mirror publications that are printed externally.
4.Work with our suppliers to measure and report the generation of wastes attributable to Trinity Mirror publications that areprinted externally.

Board of Directors
A B
C
D E
F
G
H
Chairman’s statement / Chief Executive’s statement / Business review / Corporate responsibility / Board of Directors andExecutive Committee / Corporate governance / Remuneration report / Directors’ report / Group independent auditors’report / Accounts and notes / Unaudited other information / Holding company accounts and notes / Investor Relations
40

A. Sly Bailey (44)Chief ExecutiveSly joined the Board in February 2003.She started her media career in advertisingsales at the Guardian and then TheIndependent. In 1989 she joined IPCMedia Limited as Head of ClassifiedAdvertising Sales and joined their Board in 1994 as Advertising Director. In 1997Sly was appointed Managing Director ofIPC tx, the TV listings division. In December1999 she was appointed Chief Executiveof IPC Media Limited and subsequentlyled the sale of the business to AOL TimeWarner. Sly was previously a non-executivedirector of Littlewoods Plc. Currently sheis also a non-executive director at EMI aswell as President of NewstrAid, a charityfor the newstrade.
B. Peter Birch CBE (68)Senior Independent DirectorPeter joined the Board in March 1998 andwas Chairman of Trinity until September1999. He started his commercial career at Nestlé and then moved to Gillette,eventually becoming Managing Director,Gillette UK. He then joined Abbey Nationalwhere he served as Chief Executivebetween 1984 and 1998. He is currentlyChairman of Land Securities PLC andKensington Group plc. He is a director of Travelex plc, Sainsbury’s Bank plc andDah Sing Financial Holdings Limited. He isalso an adviser to N M Rothschild & SonsLimited and Cambridge Place InvestmentManagement LLP.
C. Sir Victor Blank (63)ChairmanSir Victor joined the Board in 1999 havingbeen Chairman of Mirror Group since July 1998. Having originally qualified as a solicitor, Sir Victor became a partnerat Clifford-Turner (now Clifford Chance) in 1969. In 1981 he joined the merchantbank Charterhouse as Head of CorporateFinance, subsequently becoming ChiefExecutive and Chairman and a director of The Royal Bank of Scotland Group plc.He is currently Chairman of GUS plc. He serves on the Council of OxfordUniversity and is Chairman of the charityWellBeing. He is a member of theFinancial Reporting Council.
D. Sir Angus Grossart (68)Non-Executive DirectorSir Angus joined the Board in September1999 having previously been a director of Mirror Group since 1998. He is qualifiedas both a chartered accountant andadvocate and practised for some years at the Scottish bar. He founded and chairsthe Scottish merchant bank Noble Grossart.
He is a former vice chairman of The RoyalBank of Scotland Plc and is a director of Scottish and Newcastle Plc. He is aformer Chairman of the National Galleriesof Scotland and Trustee of the NationalHeritage Memorial Fund. He has been a director of a wide range of publiccompanies in the UK, Canada and theUnited States, involved in investment,investment management, insurance,construction, property, media and other sectors.
E. Gary Hoffman (45)Non-Executive DirectorGary joined the Board in March 2005. He was appointed Chairman, Barclays UK Banking and Chairman, Barclaycard in December 2005 having previously been Chief Executive of Barclaycard since2001. Gary joined Barclays Main Board in January 2004. He began his career inBarclays in 1982 and held various positionsuntil he was appointed Managing Director,Marketing and Distribution in 1998. Garywas responsible for the launch of internetbanking as well as setting up Barclaycall,the telephone banking service. He is aboard member of both Visa Internationaland Visa Europe.
F. David Ross (40)Non-Executive DirectorDavid joined the Board in February 2004.He qualified as a chartered accountantwith Arthur Andersen & Co. He co-founded and is currently Deputy Chairmanof The Carphone Warehouse, Europe’sleading mobile communication retailer. He took a lead role with The CarphoneWarehouse IPO in July 2000. He isChairman of National Express Group Plcand Chairman of Gondola Plc. He alsoholds non-executive directorships atWembley National Stadium Limited, Big Yellow Self Storage Plc and Cosalt Plc.
G. Vijay Vaghela (39)Group Finance DirectorVijay qualified as a chartered accountantand worked in private practice withDeloitte. He joined Mirror Group in 1994as Internal Auditor. He was subsequentlyGroup Treasurer and then Director of Accounting and Treasury. He wasappointed Group Finance Director in May 2003.
H. Paul Vickers (46)Secretary and Group Legal DirectorPaul joined the Board in September 1999having been a director of Mirror Groupsince 1994. He originally qualified as a barrister and was in private practice at the bar. He was legal manager of theLondon Daily News, which he left to jointhe breakfast television company TV-amwhere he subsequently became AssistantManaging Director. He was previously a non-executive director of Virgin Radio.
Chairman’s statement / Chief Executive’s statement / Business review / Corporate responsibility / Board of Directors andExecutive Committee / Corporate governance / Remuneration report / Directors’ report / Group independent auditors’report / Accounts and notes / Unaudited other information / Holding company accounts and notes / Investor Relations
41

From left to rightSteve Bird, Tony Pusey, Rupert Middleton
From left to rightHumphrey Cobbold, Nick Fullagar, Georgina Harvey
From left to rightVijay Vaghela, Sly Bailey, Paul Vickers
42
Chairman’s statement / Chief Executive’s statement / Business review / Corporate responsibility / Board of Directors andExecutive Committee / Corporate governance / Remuneration report / Directors’ report / Group independent auditors’report / Accounts and notes / Unaudited other information / Holding company accounts and notes / Investor Relations
The Executive Committee

43
Chairman’s statement / Chief Executive’s statement / Business review / Corporate responsibility / Board of Directors andExecutive Committee / Corporate governance / Remuneration report / Directors’ report / Group independent auditors’report / Accounts and notes / Unaudited other information / Holding company accounts and notes / Investor Relations
Sly BaileyChief Executive
Vijay Vaghela Group Finance Director
Paul Vickers Secretary and Group Legal Director
The biographies of the above threedirectors are on page 41.
Steve BirdGroup Human Resources DirectorSteve joined Trinity Mirror in 2005.Previously he was Group HR Director atLend Lease Corporation, a global propertybusiness best known in the UK for itsdevelopment of the Bluewater shoppingcentre and the Greenwich peninsula.Steve has also held senior positions at NatWest Group, Glaxo Wellcome and Ford Motor Company.
Humphrey CobboldDirector of Strategic DevelopmentHumphrey joined Trinity Mirror as Directorof Strategic Development in June 2003. He has responsibility for corporate financeand strategy and manages two of theGroup’s specific businesses – Sports andMagazines & Exhibitions. He acts as TrinityMirror’s Board member of fish4, the on-lineclassified business, where he will beChairman during 2005/6. Prior to joiningTrinity Mirror, Humphrey had been a partnerat management consulting firm McKinsey & Co. for six years.
Nick FullagarDirector of CorporateCommunicationsNick joined Mirror Group as a reporter forthe Daily Mirror in 1980. He is responsiblefor Group communications includinginvestor and public relations. He wasappointed to the Executive Committee in 2002.
Georgina HarveyManaging Director, Regional NewspapersGeorgina joined the Company in February2005. She started her media career at Express Newspapers where she wasappointed Advertising Director in 1994.She joined IPC Media in 1995 as GroupAdvertising Sales Director for SouthBankand went on to form IPC Advertising in1998, where she was Managing Director.Georgina became a member of the Board of IPC Media in 2000 and wassubsequently appointed ManagingDirector of Wallpaper* Group in 2003.
Rupert MiddletonDirector of ManufacturingRupert joined Trinity Mirror as GroupDirector of Manufacturing in March 2004.He is responsible for developing anintegrated manufacturing division. Prior tojoining Trinity Mirror, Rupert was previouslyManaging Director of a division within The Stationery Office (TSO).
Tony PuseyGroup Information Technology DirectorTony was appointed Group IT Director in December 2000. Prior to joining TrinityMirror, he was Group CIO and BusinessChange Director at Storehouse plc, which incorporates BHS and Mothercare.

44
The Board is committed to maintaining high standards ofCorporate Governance. This statement, together with theDirectors’ Report and the Remuneration Report set out on pages 48 to 56, describes how the Company has applied the relevant principles of the July 2003 FRC Combined Code. The Board believes that the Company complies with most of the Code. Any exceptions are fully explained.
The Board
The Board is responsible and accountable for the Group’soperations. The Board has a formal schedule of matters reservedto itself, including the Group’s strategic plans, acquisitions or disposals, capital expenditure, all financing matters, annualoperating plan and budget and the Group’s operating andfinancial performance.
The Board meets regularly and a schedule of attendance is shownon page 47.
The Board also delegates specific responsibilities to Committees,each of which has clear written Terms of Reference, as described below.
The Board did not believe that it was necessary to use externalresources to review its performance during 2005 but chose toevaluate its own performance and that of its Committees throughan extensive questionnaire sent to each director. This was aprocess that it had adopted in 2004, having used the services of external consultants in 2003. For 2005 the form of thequestionnaire and the detail of the process itself was reviewedand amended following advice from the independent consultantDr Tracy Long, of Boardroom Review. The questionnaires werereviewed by the Chairman and Secretary and Group LegalDirector, and a report of findings distributed to each director and discussed at a Board meeting.
Following a Corporate Governance review in 2003 it was agreedthat all non-executive directors should serve as members of theNominations, Audit and Remuneration Committees. The Boardbelieves that an increasing amount of work is undertaken by theseCommittees and that a non-executive director can only properlyfulfil his or her responsibilities if they are present during committeemeetings and are able to follow the detail of discussion anddebate held at those meetings. Similarly the Chairman, in additionto chairing the Nominations Committee, is a full member of theRemuneration Committee and attends meetings of the AuditCommittee at the invitation of its Chairman.
As a result of this policy some say that the Company does notcomply with certain parts of the Combined Code in that directorswho may not be regarded externally as independent serve on the Remuneration Committee. After two years of working withthis structure the Board believes that the benefits derived fromthe wider participation of non-executive directors on the Boardcommittees justifies this ‘non-compliance’ and proposes to continue with this practice.
Directors
There are currently eight directors: Chairman, Sir Victor Blank;Chief Executive, Sly Bailey; Senior Independent Director, Peter Birch; two other executive directors; and three other non-executive directors. The directors’ biographies are set out onpage 41 and illustrate the directors’ breadth of experience, whichshould ensure an effective Board to lead and control the Group.
The division of responsibilities between the Chairman and the ChiefExecutive has been set out in writing and approved by the Board.
The non-executive directors are appointed for an initial term of three years and may be invited to serve subsequent terms.Before a non-executive director is proposed for re-election byshareholders, the Nominations Committee meets to considerwhether his or her performance continues to be effective and whether they demonstrate a commitment to the role.The committee meets at least once a year to review theperformance of the Chairman.
The Board believes that all its non-executive directors areindependent. Sir Angus Grossart was until 20 April 2005 non-executive Vice Chairman of The Royal Bank of Scotland, which is one of the Company’s commercial bankers. As Sir Angus hadno executive powers in either company and is not involved in the consideration of the commercial terms of the relationship, the Company does not believe that this former connection affects his independence.
Gary Hoffman is an Executive Director of Barclays Plc. He isChairman of UK Banking and Chairman of Barclaycard. Althoughthe Company has connections with Barclays, most of itsrelationships are in areas outside Mr Hoffman’s direct control andthe Board does not believe that they will affect his independence.
Every director is subject to re-election by shareholders every three years.
An assessment is made of any training needs on a director’sappointment and the appropriate training provided.
All directors have access to the Company Secretary and, in thefurtherance of their duties, may take independent professionaladvice if necessary at the Company’s expense.
The Chairman has declared to the Company his other significantcommitments, notably the Chairmanship of GUS plc. He becamenon-executive deputy Chairman of Lloyds TSB plc on 1 March.He is due to become Chairman of Lloyds TSB after he retires as a director of the Company. He is also Chairman of the charityWellBeing, on the Council of Oxford University and serves onvarious industry and government committees. The Board believesthat he devotes sufficient time to the Company to properly andfully fulfil his responsibilities.
Chairman’s statement / Chief Executive’s statement / Business review / Corporate responsibility / Board of Directors andExecutive Committee / Corporate governance / Remuneration report / Directors’ report / Group independent auditors’report / Accounts and notes / Unaudited other information / Holding company accounts and notes / Investor Relations
Corporate governance

45
Audit Committee
The Audit Committee is chaired by Peter Birch. Sir Angus Grossart,Gary Hoffman and David Ross are members. The Committeemeets to review the Group’s interim and annual financial statementsbefore their submission to the Board, to review the appropriatenessand effectiveness of the Group’s internal controls, accountingpolicies and procedures and financial reporting, and otherwise as necessary. The Group has an internal audit function to enhancethe rolling programme of review and improvement to the Group’sinternal controls.
David Ross is a Chartered Accountant and was Finance Directorof Carphone Warehouse. Peter Birch, Sir Angus Grossart andGary Hoffman each have extensive experience in the financialservices industry.
The Group Finance Director, other directors, the Group’s externalauditors and the internal auditors, as appropriate, attend meetingsof the Committee.
The Committee has formal written terms of reference which are published on the Company’s website. The website and the Company’s intranet also carry details of the Company’s‘whistleblower’ policy, which has been approved andimplemented by the Committee.
During the year the Committee, with the help of the Head ofInternal Audit, followed a process to review and monitor theexternal auditor’s independence and objectivity and theeffectiveness of the audit process. A very extensive questionnairewas sent to the Audit Committee, other Board members andsenior operational and finance managers across the Group. The results were analysed by the Head of Internal Audit and a full report was submitted for review by the Audit Committee.There were no adverse findings. The report as a whole, however, was discussed with the external auditor.
The Committee reviewed the letter from the External Auditorconfirming their independence and objectivity.
The Board has accepted the Committee’s recommendation on a policy on the engagement of the external auditor to supplynon-audit services which is designed to ensure that there is noimpairment of independence.
Remuneration Committee
The Remuneration Committee is chaired by Gary Hoffman.Sir Victor Blank, Peter Birch, Sir Angus Grossart and David Rossare also members. The Committee meets as required during the year to review the Company’s general policy on executiveremuneration, the application of the policy to the remunerationand benefits of the executive directors and to recommend and monitor the level and structure of remuneration for senior management.
The Remuneration Report (set out on pages 48 to 56) contains a more detailed description of the Company’s policies andprocedures for executive remuneration. The Chief Executive, the Secretary and Group Legal Director and Group HR Director,as appropriate, attend meetings of the Committee but they do not participate in discussions on their own remuneration.
The Committee has formal written terms of reference which are published on the Company’s website.
Nomination Committee
The Nomination Committee is chaired by the Chairman. All thenon-executive directors and the Chief Executive are members.The Committee meets as required to select and propose to theBoard suitable candidates of appropriate calibre for appointmentas directors. The Committee would normally expect to use theservices of professional external headhunters to help in thesearch for and selection of candidates. It followed this practice in the case of David Ross and Gary Hoffman.
The Committee has formal written terms of reference which are published on the Company’s website.
Administration Committee
The Administration Committee consists of the Chief Executive,Group Finance Director and Secretary and Group Legal Directorand meets as necessary to deal with administrative matters of a day-to-day nature.
Relations with shareholders
The Company encourages two-way communication with both its institutional and private investors and responds quickly to all queries received orally or in writing. The Chief Executive and the Group Finance Director meet regularly with analysts and institutional shareholders. At the Annual General Meeting all directors, including Committee Chairmen, are available forquestions. Twice a year the Director of Corporate Communications,who also runs the Company’s investor relations programme,produces a formal report for the Board giving details of commentand ‘feedback’ received from analysts and institutional investors.He is present during the Board discussion of this report.
Chairman’s statement / Chief Executive’s statement / Business review / Corporate responsibility / Board of Directors andExecutive Committee / Corporate governance / Remuneration report / Directors’ report / Group independent auditors’report / Accounts and notes / Unaudited other information / Holding company accounts and notes / Investor Relations

46
In 2005 the Chairman wrote to the 16 largest institutional investorsin the Company making it clear that he is available to see them to discuss any issues that they may wish to raise.
The principal communication with private investors is through theprovision of the Annual Report, the interim results and the AGM.Financial and other information is made available on the Company’swebsite, www.trinitymirror.com, which is regularly updated.
Accountability and audit
Through the detailed reviews of the performance and financialposition in the Chief Executive’s statement (page 6), and the Business Review (page 10), together with the Directors’Report (page 57), the Board seeks to present a balanced and understandable assessment of the Group’s position and prospects. The directors’ responsibility for the financialstatements is described on page 57.
Internal control
Internal financial control
The directors are responsible for the Group’s established systemof internal financial control. No system of internal financial controlcan provide absolute assurance against material misstatement or loss. Such a system is designed to provide the directors withreasonable assurance that problems are identified on a timelybasis and dealt with appropriately. The key procedures that have been established and designed to provide effective internalfinancial control are:
• Management and organisational structure – the existingorganisational structure is considered appropriate to the size of the Group. This clearly identifies levels of delegatedresponsibility to operational management. The performance of senior management is regularly evaluated and individual employees’ responsibilities are clearly defined and communicated.
• Financial reporting – part of the comprehensive managementreporting discipline involves the preparation of detailed annualbudgets by all operating units. These budgets are reviewed by the executive management and are ultimately summarisedand submitted to the Board for approval. Weekly revenue andprofit returns are received from all operating units followed bymonthly management accounts, which are prepared promptlyand reported against the approved budget. Consolidatedmonthly management accounts are prepared, includingdetailed profit analysis (with comparisons to budget, latestforecasts, prior year and consensus market opinion), andtreasury report (including comparison to the Group’s financialcovenants), providing relevant, reliable and up-to-datefinancial and other information to the Board. Revised profitand cashflow forecasts for the current year are prepared andsubmitted to the Board at quarterly intervals during the year.
• Investment appraisal – the Group has a clearly definedframework for capital expenditure which is controlled centrally.Appropriate authorisation levels and limits beyond which suchexpenditure requires the prior approval of the Capex Committeeconsisting of the three executive directors and the Director of Group IT or, in certain circumstances, the Board, are clearlyset. There is a prescribed format for capital expenditureapplications which places a high emphasis on the overall Group strategy or logic for the expenditure, and demands a comprehensive and sound financial representation of thebusiness case being put forward. All significant corporateacquisitions or investments are controlled by the Board or a Board sub-committee and are subject to detailedinvestment appraisal and performance of due diligenceprocedures prior to approval by the Board.
• Functional reporting – a number of the Group’s key functions, including treasury, taxation, internal audit and risk management, litigation, IT strategy and development,environmental issues and insurance, are dealt with centrally.Each of these functions reports to the Board on a regularbasis, through the Chief Executive, Group Finance Director or Secretary and Group Legal Director, as appropriate. Thetreasury function operates within the terms of clearly definedpolicy statements. The policy statements exist to ensure thatthe Group is not exposed to any unnecessary risk and thatwhere appropriate there is hedging against foreign currencyand interest rate risks. The Audit Committee reviews reportsfrom management, the internal audit department and theexternal auditors to provide reasonable assurance that controlprocedures are in place and are being followed. Formalprocedures have been established for instituting appropriateaction to correct weaknesses identified from the above reports.
Risk management
An ongoing process for identifying, evaluating and managing the significant risks faced by the Group has remained in placethroughout the financial year and up to the approval date of theAnnual Report and Accounts. The process is subject to regularreview by the Board directly and via the Audit Committee.This accords with the Turnbull guidance on Internal Control for directors, as applicable for this accounting period.
Although the Board’s overall responsibility for internal control is recognised, the positive contribution made by seniormanagement to the establishment and ongoing development of risk management within the Group is acknowledged.
Chairman’s statement / Chief Executive’s statement / Business review / Corporate responsibility / Board of Directors andExecutive Committee / Corporate governance / Remuneration report / Directors’ report / Group independent auditors’report / Accounts and notes / Unaudited other information / Holding company accounts and notes / Investor Relations
Corporate governancecontinued

47
In reviewing the effectiveness of the Group’s system of internalcontrol, the Board has taken into consideration a number of key elements, which include financial and investment controls,management reporting, and the various review, steering, policy and Board committees.
The following illustrate how the risk management process and the system of internal control operated during the 52-week period ended 1 January 2006:
• Group internal audit – The Head of Internal Audit has recruiteda skilled and experienced team to enable the agreed strategyto be fulfilled. The internal audit plan is risk-based and has a focus on those areas which are critical to the achievement of business objectives.
• Audit Committee – The role of the Audit Committee includesthe review, update and approval of the annual internal auditplan; provision of direction to the internal audit function,external auditors and management in the review of internalcontrols; alerting the Board to any emerging issues; andconsideration of the draft papers prepared for the annualreview of effectiveness of the risk management proceduresadopted by the Company prior to being submitted to theBoard for approval.
• Risk Management Group – The Risk Management Group is formed of the Executive Committee together with invitedsenior executives. The Secretary and Group Legal Director has co-ordinated the risk management activities of the RiskManagement Group, working closely with members of the Internal Audit team. The agreed objectives for the riskmanagement framework have been achieved during the yearand the action plans for all significant risks have been reviewed.
• Divisional and Group functional key risks – To enableconsistent and focused monitoring, reporting, evaluation and management of significant Group risks, the Executive
Committee owner of each key risk and the relevant seniormanagers have documented the plans, actions and initiativeswhich have taken place or are underway.
• Year-end compliance reporting – A formal process exists foryear-end risk management compliance reporting, requiringsenior operating company, divisional and Group executivemanagement to confirm their responsibilities for riskmanagement and internal control. Ultimate compliancereporting is required of each and every Board member.
Steps have been taken to embed internal control and riskmanagement further into the operations of the business and todeal with areas of improvement which come to management’s and the Board’s attention. The Group’s systems of internal controlare designed to manage rather than eliminate the risk of failure to achieve business objectives and can only provide reasonableand not absolute assurance against material misstatement or loss.
Further relevant information is included in the CorporateResponsibility Review, published on pages 31 to 39.
Corporate governance compliance statement
The Company has complied throughout the financial year with the provisions set out in the July 2003 FRC Combined Code, withthe exception of the constitution of the Remuneration Committee(Provision B2.1).
Going concern basis
After making enquiries, the directors have formed a judgement, at the time of approving the financial statements, that there is a reasonable expectation that the Group has adequate resources to continue in operational existence for the foreseeable future.
For this reason, the directors continue to adopt the goingconcern basis in preparing the financial statements.
Chairman’s statement / Chief Executive’s statement / Business review / Corporate responsibility / Board of Directors andExecutive Committee / Corporate governance / Remuneration report / Directors’ report / Group independent auditors’report / Accounts and notes / Unaudited other information / Holding company accounts and notes / Investor Relations
Table of attendanceAudit Remuneration
Main Board Committee Committee AGM
Number of meetings in the year 9 3 2 1
Sly Bailey 9 3 2 1
Peter Birch 9 3 2 1
Sir Victor Blank 9 3 2 1
Sir Angus Grossart 8 3 2 1
Penny Hughes* 4 1 – 1
Gary Hoffman* 4 1 1 1
David Marlow* 4 1 1 1
David Ross 8 3 2 1
Vijay Vaghela 9 3 – 1
Paul Vickers 9 3 2 1
*Gary Hoffman was appointed to the Board on 3 March 2005. The dates for the year’s board meetings had been set before his appointment and there was an unavoidable clash on two occasions. Penny Hughes and David Marlow left the Board on 5 May 2005.

48
Unaudited information
The Remuneration Committee and the Board have worked overthe last three years to ensure that the remuneration policy is fullyconsistent with and supportive of the main strategic objectives of the Group. Following Sly Bailey’s appointment in 2003 sheconducted a review of the Group and proposed the ‘StabiliseRevitalise Grow’ strategy that we are currently following. To support that strategy we have tried to foster much more of a performance culture within the Group and, as a part of thatprocess, we introduced the new Long Term Incentive Programmethat received shareholder approval in 2004. The aim of thatprogramme is to provide a better link between managementperformance and reward, to encourage executives to build andmaintain a significant shareholding, to attract suitably qualifiedrecruits to join the Group and retain senior executives once they are with us.
After two years’ operation we believe that the new scheme couldfunction more effectively and we will, therefore, be putting anumber of amendments before shareholders at this year’s AGM.Full details of the proposals are set out in the notes thataccompany the Notice of the Meeting.
During 2005 the Remuneration Committee, with its advisers,reviewed whether its comparator group was appropriate. That group was made up of:
Aegis InformaBSkyB Johnston PressCapital Radio PearsonChrysalis Reed ElsevierDaily Mail & General Trust ReutersEMAP SMGEMI Taylor Nelson SofresHIT Entertainment United Business MediaITV WPP
It was agreed that the FTSE 350 media and entertainment sectorwas a more appropriate group. That list comprised:
Aegis PearsonBSkyB Photo-Me InternationalDaily Mail & General Trust Reed ElsevierEMAP Reuters EMI St. IvesEuromoney Institutional Investor Taylor Nelson SofresGCap Media United Business MediaInforma WPP ITV Yell Johnston Press
Recognising that our competitors for new staff are not just in themedia and entertainment sector, a ‘sense check’ comparator listof pan-sector companies was also created, consisting of companiesof a similar size assessed by market cap, profit and turnover.
In relation to the salaries paid to executive directors and theexecutive committee for 2006, we engaged New Bridge StreetConsultants LLP (the Committee’s principal advisers) to conductan in-depth review of the total remuneration package (and itsmake-up) paid to executive directors and senior executives of our two new comparator groups. In setting the new salaries for2006, however, the work undertaken by New Bridge Street wassimply used as a tool and did not itself lead to the setting ofsalaries. The committee is conscious of and keen to avoid the‘ratchet’ effect that can be created by an over-reliance on such comparative work.
Remuneration Committee
The Remuneration Committee (the ‘Committee’) consists of Gary Hoffman (Chairman), Sir Victor Blank, Peter Birch, Sir Angus Grossart and David Ross.
The Committee is a committee of the Board of Directors and has been established with formal terms of reference approved by the Board. The Committee has authority to determine theappropriate remuneration, benefits and employment conditionsfor the executive directors. The Committee also monitors the level and structure of remuneration for senior management.The Committee sets the remuneration of the Chairman of theBoard (the Chairman does not participate in any discussion of his remuneration).
The Committee fulfils its duties with a combination of both formal meetings and informal consultation with relevant partiesinternally, including the Chief Executive, the Secretary and Group Legal Director and the Director of Group HR. Its principalexternal advisers are New Bridge Street Consultants, who wereappointed by the Committee but who also provide remunerationadvice to the Company. The only other services that New BridgeStreet provide to the Company are in connection with calculationof certain matters in relation to the incentive schemes.
Chairman’s statement / Chief Executive’s statement / Business review / Corporate responsibility / Board of Directors andExecutive Committee / Corporate governance / Remuneration report / Directors’ report / Group independent auditors’report / Accounts and notes / Unaudited other information / Holding company accounts and notes / Investor Relations
Remuneration report

49
Remuneration policy
The aim is to provide remuneration packages to ensure thatdirectors are rewarded competitively in relation to other relevantcompanies, in particular to the chosen comparator group. TheCompany’s policy is to provide remuneration of a median level for median performance and at an upper quartile level for upperquartile performance. The Company has sought to alter thebalance of the ‘package’ for senior executives so that a greaterpercentage of the total is directly related to performance.
The main components of each remuneration package are basicannual salary and benefits, an annual bonus scheme based on performance, share-based incentives and pensions.
In order to fully align the interests of executive directors with the interests of shareholders, a significant proportion of directors’remuneration is performance-related through the use of annualbonus and share option schemes.
Basic annual salary
Basic salaries are reviewed annually by the Committee and areset relative to comparable jobs in selected relevant companiesdrawn from the comparator group.
Annual bonus
The Company operates an annual performance-related bonusscheme for a number of executives, including executive directors.In 2005, this provided for annual cash bonuses up to a maximumof 75% of base salary for Messrs Vaghela and Vickers and 100%for Sly Bailey. For 2006, the maximum potential will be increasedfor Mrs. Bailey and Mr. Vaghela to 110% and 100% respectively.Members of the Executive Committee participate in the schemewith maximum potential of either 50% or 75%. These payments do not form part of pensionable salary.
In 2005 the Executive directors’ targets were linked to growth in operating profit, the achievement of certain cost-saving targetsand the increase in certain operating margins. Performance was such that a payment of 58.15% of potential was made to Mrs. Bailey and Mr. Vickers and of 68.15% to Mr. Vaghela.
Executive Committee members had targets of a similar nature but reflecting their direct operational responsibilities. The targetsfor 2006 are not being disclosed at this stage for reasons ofcommercial sensitivity. Up to 70% of bonus potential will bepayable on targets linked to operating profit. The remaining 30%will be based on the satisfaction of certain key tasks as set by the Remuneration Committee. Each of these key tasks musteither contribute to the achievement of one or more element of the business strategy or move the business forward in a significant way.
The Committee considers that the performance conditionsapplying to the annual bonus scheme are relevant and stretchingand that this results-driven approach is in the interests ofshareholders. The details of bonuses earned by executivedirectors in the period are shown in the table on page 53.
Long Term Incentive Plan 2004 (LTIP)
The 2004 LTIP was approved by shareholders at the AGM in 2004. Under this scheme the Remuneration Committee can recommend the grant of awards of shares to any eligibleemployee. Awards may take the form of either PerformanceShares or Matching Shares.
In any financial year an employee may be granted an awardover Performance Shares, the final vesting of which is subject to continued employment within the Group and satisfaction of a performance condition, as set out in the table below.
Similarly, in any financial year an eligible employee may be grantedan award over Matching Shares which are linked to the investingby an employee of all or a portion of his or her annual post tax bonus (subject to a maximum to be determined by theRemuneration Committee from time to time) in the Company’sshares (Deposited Shares). The ratio for Matching Shares is basedon the gross (pre-tax) equivalent value of the Deposited Shares.
Awards of Performance and Matching Shares may only begranted within 42 days following the announcement by theCompany of its results for any period or the expiry or removal of any restrictions imposed on the Company which may havepreviously prevented an award from being granted.
For Performance Shares the normal maximum award would bean award over shares not exceeding 100% of that person’s baseannual salary. However, to facilitate the recruitment of a particulareligible employee that higher figure is increased to 200% of baseannual salary. The highest awards in 2005 were 80% of baseannual salary, which were made to the executive directors.
For the awards made in 2005 the vesting of Performance Sharesis conditional upon the achievement of two distinct performanceconditions. Up to 50% of an award can vest if earnings per share(EPS) growth exceeds a range of targets above inflation and the remaining 50% can vest if targets measuring the Company’stotal shareholder return (TSR) against the performance of the firstcomparator group set out on page 48 are met. The targets areset out on page 50.
Chairman’s statement / Chief Executive’s statement / Business review / Corporate responsibility / Board of Directors andExecutive Committee / Corporate governance / Remuneration report / Directors’ report / Group independent auditors’report / Accounts and notes / Unaudited other information / Holding company accounts and notes / Investor Relations

50
For awards made in 2005 the percentage of performance sharesover which an award will vest was as follows:
50% of an Award of Performance Shares
Company’s EPS Growth Percentage ofover the performance period shares vesting
Below RPI + 4% p.a. 0%
RPI + 4% p.a. 30%
RPI + 5% p.a 50%
RPI + 6% p.a. 70%
RPI + 7% p.a. 80%
RPI + 8% p.a. 90%
RPI + 9% p.a. 100%
Performance between the various steps Pro rata
50% of an Award of Performance Shares
Rank of the Company’s Total Shareholder Percentage ofReturn (TSR) against comparator companies shares vesting
11th to 19th (below median) 0%
10th median 30%
9th 45%
8th 60%
7th 70%
6th 80%
5th 90%
1st to 4th (upper quintile and above) 100%
The number of Matching Shares over which an award will vest will be a multiple of the number of Gross Deposited Shares.Matching Share awards made in 2005 will vest as follows:
Matching Ratio(Matching Shares:
Company’s EPS Growth Gross Deposited Shares)
Below RPI + 4% p.a. 0
RPI + 4% p.a. 0.6:1
RPI + 5% p.a. 1:1
RPI + 6% p.a. 1.4:1
RPI + 7% p.a. 1.6:1
RPI + 8% p.a. 1.8:1
RPI + 9% p.a. 2:1
Performance between the various steps Pro rata
The performance period for awards over both Performance Sharesand Matching Shares is a single three-year period beginning onthe first day of the financial year in which the award is grantedand ending three years later. An award will lapse at the end of the performance period to the extent the performance conditionshave not been satisfied.
A shareholding expectation was placed on the executive directorsin conjunction with the LTIP. Within five years of the AGM in 2004or of the date of first appointment, senior executives are expectedto build a holding in the Company’s shares equal to the followingvalue of their salaries:
• Chief Executive: 150% of her salary• Other executive directors: 100% of their salaries• Members of the Executive Committee: 30% or 50% of
their salary depending on the level of their bonus potential.
If these targets are not met, a restriction will be placed on the disposal of shares that vest to them under the LTIP.
Share option schemes
The Company operates an Inland Revenue-approved savingsrelated share option scheme. The scheme is open to allemployees, including executive directors.
Although the new LTIP is now in place, this report is required to set out the detail of the existing share option scheme underwhich the Executive Directors hold options. However, no furthergrants will be made under this scheme.
2000 Executive Share Option Scheme
Options are exercisable between three and ten years from thedate of grant subject to the satisfaction of performance conditions.No options will be exercisable unless the Company’s earnings per share growth exceeds inflation, measured by reference to the Retail Prices Index, plus an average of 2% per annum over a period of three years. 50% of each grant of an option to eachindividual is subject to a total shareholder return comparisonagainst the FTSE Mid-250 index of companies on the date of grant. The other 50% is subject to a comparison of totalshareholder return with a group of about 20 other mediacompanies, broadly similar to the first list on page 48. No vestingwill take place on either measure unless the Company’s ranking is at least median. For executive directors and other seniorexecutives options to the value of 75% of base annual salarybecome exercisable at median performance with a sliding scaleto full vesting at 20th percentile performance. If the performancecriteria are not fully satisfied after three years then they can be retested over a period of four, five and six years from the date of grant.
Chairman’s statement / Chief Executive’s statement / Business review / Corporate responsibility / Board of Directors andExecutive Committee / Corporate governance / Remuneration report / Directors’ report / Group independent auditors’report / Accounts and notes / Unaudited other information / Holding company accounts and notes / Investor Relations
Remuneration reportcontinued

51
These performance conditions were chosen because they were felt to most closely align the interests of senior executiveswith the interests of shareholders, by rewarding executives forachieving superior relative total shareholder return performancecompared to direct competitors and the FTSE Mid-250 as awhole, while at the same time requiring above-inflation growth in the underlying business. The calculation of total shareholderreturn is performed independently by New Bridge Street Consultants.
Each of the executive directors holds options under this schemeas set out in the table on page 54.
Directors’ pension arrangements
Paul Vickers participates in the main Trinity contributoryoccupational pension scheme as well as the non-contributoryTrinity Mirror Plc Retirement Plan, which together provide finalsalary-based pensions on retirement at age 60 of up to 2/3 of his pensionable earnings subject to Inland Revenue limits. Vijay Vaghela is a member of the MGN Pension Scheme. This scheme accrues at 1/60th per year of service of salary up to the Inland Revenue earnings cap. It is a contributory scheme.A spouse’s pension is also payable on death and a lump sum ispayable if death occurs in service. Vijay Vaghela and Paul Vickersare subject to the Inland Revenue cap and receive an annualcash sum equivalent to 30% of salary in excess of the cap.
It is proposed that following ‘A’ day on 6 April 2006 the earnings cap applying to the pension benefits of Vijay Vaghelaand Paul Vickers will be maintained by amending the rules of their respective pension schemes. The cap, currently £105,600,will from ‘A’ day be increased every 6 April at the discretion of the Company by reference to the Retail Prices Index forSeptember the previous year. From 6 April 2006 the cap will be £108,600.
Sly Bailey receives an annual cash sum to use for pensionpurposes that is equivalent to 33% of her base salary.
Contracts of service
Each of the executive directors has a service contract with theCompany which can be terminated by either party giving one year’swritten notice. If any executive director leaves service at therequest of the Company (other than for gross misconduct) theywill be entitled to receive predetermined compensation equal to12 months’ base salary and pension loss. Sly Bailey’s contractspecifies that if the Company terminates her contract after six months of any financial year the prescribed sum will include an amount equivalent to her pro-rata bonus entitlement for that period.
Paul Vickers’s contract is dated 28 April 2000, Sly Bailey’s is dated 9 December 2002 and Vijay Vaghela’s is dated 18 April 2003.
Current salaries of the executive directors after the most recentsalary review are: Sly Bailey £700,000, Vijay Vaghela £400,000and Paul Vickers £355,000.
Policy on external appointments
The Company acknowledges that its directors are likely to beinvited to become non-executive directors of other companies.The Committee believes that these non-executive duties canbroaden the directors’ knowledge and experience to the benefitof the Company. Executive directors are, therefore, with theBoard’s permission, allowed to accept one such appointment, as long as there is no conflict of interest, and to retain any fees.
Sly Bailey is a non-executive director of EMI plc for which shereceived a fee in 2005 of £50,000. Neither Mr Vaghela or Mr Vickers currently have external directorships.
Chairman’s statement / Chief Executive’s statement / Business review / Corporate responsibility / Board of Directors andExecutive Committee / Corporate governance / Remuneration report / Directors’ report / Group independent auditors’report / Accounts and notes / Unaudited other information / Holding company accounts and notes / Investor Relations

52
Chairman’s statement / Chief Executive’s statement / Business review / Corporate responsibility / Board of Directors andExecutive Committee / Corporate governance / Remuneration report / Directors’ report / Group independent auditors’report / Accounts and notes / Unaudited other information / Holding company accounts and notes / Investor Relations
Audited information
Directors’ pension entitlements
The following directors were members of defined benefit schemes provided by the Company during the year. Pension entitlements and corresponding transfer values increased as follows during the year.
2005 disclosures of directors’ pensions costsReal Transfer value of
Accrued increase/ real increase in Increase in Accruedpension Transfer value (decrease) Increase accrued pension transfer value pension Transfer value
at 2 January at 2 January in accrued in accrued (less director’s (less director’s at 1 January at 1 January2005(1) 2005(2) pension pension contributions)(3) contributions)(4) 2006(1) 2006(2)
£000 £000 £000 £000 £000 £000 £000 £000
Paul Vickers 17 161 5 6 46 57 23 224
Vijay Vaghela 18 94 2 2 6 28 20 128
Disclosure notes:(1)Pension accruals shown are the amounts which would be paid annually on retirement based on service to the end of the year.(2)Transfer values have been calculated in accordance with guidance note GN11 issued by the actuarial profession.(3)The transfer value of the real increase in accrued pension over the year represents the incremental value to the director of their service during the year. It is based on the accrued pension increase less
the director’s contribution.(4)The increase in the transfer value from 2 January 2005 to 1 January 2006 includes the effect of fluctuations in the transfer value due to factors beyond the control of the Company and directors, such as
stock market movements, and is net of the director’s contribution.(5)Voluntary contributions paid by directors and resulting benefits are not shown.
Remuneration reportcontinued
The above disclosure of directors’ pensions is in line with thelatest Companies Act 1985 requirements. The figures for eachdirector give the accrued pension to which each director wouldhave been entitled had they left service at the end of 2005 (and the equivalent figure for the preceding year and the increasein accrued pension over the year). Also disclosed is the transfervalue of the accrued pension at the end of 2005 (and the precedingyear) and the increase in the transfer value during the year (net of directors’ contributions). The transfer values represent a liabilityof the pension scheme where funded or the Company whereunfunded – they are not sums due to be paid to the directors.
Non-executive directors
The remuneration of non-executive directors is determined by theBoard. No director plays a part in any discussion about his or herown remuneration. The current remuneration consists of annualfees of £40,000 for each non-executive director. The Chairman,Senior Independent Director and Committee Chairmen receiveadditional remuneration for providing these services to theCompany, effective 1 July 2005 as set out in the following table:
£
Chairman 160,000
Senior Independent Director 20,000
Chairman of Audit Committee 15,000
Chairman of Remuneration Committee 10,000
Noble Grossart Limited receives a fee of £10,000 per annum forSir Angus Grossart’s service as Chairman of Scottish Daily Recordand Sunday Mail Limited.
The Chairman and non-executive directors do not have servicecontracts and cannot participate in the annual bonus scheme or the executive share option schemes.
The Board now expects that non-executive directors will acquireshares equal in value to one times their annual fee during a period of three years from the AGM in 2005 or from the date of theirappointment if later.

53
Chairman’s statement / Chief Executive’s statement / Business review / Corporate responsibility / Board of Directors andExecutive Committee / Corporate governance / Remuneration report / Directors’ report / Group independent auditors’report / Accounts and notes / Unaudited other information / Holding company accounts and notes / Investor Relations
The aggregate remuneration of the directors of the Company was as follows:
Total Totalexcluding excluding Pension Pension
Annual Taxable pensions pensions contributions contributionsBasic salary bonuses benefits Compensation* Fees 2005 2004 2005 2004
£000 £000 £000 £000 £000 £000 £000 £000 £000
Executive Directors
Sly Bailey 620 360 11 – – 991 1,056 205 181
Stephen Parker – – – – – – 754 – 64
Vijay Vaghela 380 194 11 – – 585 555 95 78
Paul Vickers 345 150 21 – – 516 582 107 104
Non-Executive Directors
Peter Birch – – – – 70 70 60 – –
Sir Victor Blank(1) – – – – 50 50 188 – –
Sir Angus Grossart(2) – – – – 50 50 45 – –
Gary Hoffman – – – – 40 40 – – –
Penny Hughes – – – – 21 21 45 – –
David Marlow – – – – 23 23 47 – –
David Ross – – – – 40 40 31 – –
Total 1,345 704 43 – 294 2,386 3,363 407 427
Total 2004 1,414 940 55 538 416 3,363 – 427 –
*For loss of office.(1)In 2005 the Company agreed that the Chairman could sacrifice £178,980 of his fee. The fee sacrificed would be paid into his own private defined contribution pension scheme. In order to achieve this
it was necessary for Trinity Mirror plc to adhere to this pension scheme which was done with the approval of the Inland Revenue. During the year a total of £150,000 has been paid to this scheme with £28,980 to be paid in 2006. The arrangement is cost neutral and imposes no additional liability on the Company now or in the future.
(2)The fees for the services of Sir Angus Grossart as non-executive director and as Chairman of Scottish Daily Record and Sunday Mail Limited are invoiced by Noble Grossart Limited.

54
Chairman’s statement / Chief Executive’s statement / Business review / Corporate responsibility / Board of Directors andExecutive Committee / Corporate governance / Remuneration report / Directors’ report / Group independent auditors’report / Accounts and notes / Unaudited other information / Holding company accounts and notes / Investor Relations
Interest in shares
The following directors held options to purchase shares under a number of the Group’s share option schemes:
Directors’ activity 3 January 2005 – 1 January 2006
Balance (Exercised)/ Lapsed BalanceName Option price 3 January 2005 granted in year in year 1 January 2006 Exercisable between
Executive Share Options
Sly Bailey 395.5p 505,689 0 0 505,689 February 2006 to February 2013
Stephen Parker 470.5p 131,774 (131,774) 0 0 August 2004 to July 2005
Vijay Vaghela 544.0p 10,951 0 0 10,951 May 2003 to May 2010
452.5p 14,751 0 0 14,751 April 2004 to April 2011
470.5p 16,737 0 0 16,737 April 2005 to April 2012
488.6p 102,333 0 0 102,333 August 2006 to August 2013
Paul Vickers 544.0p 113,970 0 0 113,970 May 2003 to May 2010
452.5p 140,441 0 0 140,441 April 2004 to April 2011
470.5p 135,069 0 0 135,069 April 2005 to April 2012
488.6p 133,319 0 0 133,319 August 2006 to August 2013
‘Exercisable between’ dates show the first possible exercise date – this does not mean that the options are exercisable as performance conditions have not necessarily been met. The performanceconditions are set out on page 50.
Remuneration reportcontinued
The share price on 21 January 2005 when Stephen Parkerexercised his executive options was 669.5p making a gain of £262,230.
The aggregate gain made by directors before withholdingdeductions on the exercise of share options in 2005 was £nil (2004: £465,885).
LTIPNumber Performance Matching Depositedof shares Share awards Share awards Shares Nominal vesting date
2004
Sly Bailey 70,673 108,896 32,124 3 June 2007
Vijay Vaghela 41,761 30,116 8,884 3 June 2007
Paul Vickers 43,002 20,418 6,023 3 June 2007
2005
Sly Bailey 87,622 – – 11 April 2008
Vijay Vaghela 42,963 23,953 7,066 11 April 2008
Paul Vickers 39,006 15,810 4,664 11 April 2008
None of the awards have either lapsed or vested during theperiod and there have been no withdrawals of deposited shares.

55
Chairman’s statement / Chief Executive’s statement / Business review / Corporate responsibility / Board of Directors andExecutive Committee / Corporate governance / Remuneration report / Directors’ report / Group independent auditors’report / Accounts and notes / Unaudited other information / Holding company accounts and notes / Investor Relations
2 January Granted Exercised 1 JanuarySavings-related options Option price 2005 in year in year 2006 Exercisable between
Paul Vickers 314.0p 3,009 – – 3,009 December 2005 to May 2006
Vijay Vaghela 428.0p 2,365 – (2,365) 0 August 2005 to February 2006
314.0p 1,203 – (1,203) 0 December 2005 to May 2006
The share price on 20 December 2005 when Vijay Vaghelaexercised his SAYE options was 570p making a gain of £6,437.98.
The lowest price of the shares during the year was 563p as at 16 December 2005 and the highest price was 719.5p as at 4 March 2005. The share price as at 30 December 2005 (last business day) was 573p.
Beneficial interests
The interests of the directors, all of which are beneficial, in the ordinary shares of the Company are shown below:
1 January 2 January2006 2005
Executive directors
Sly Bailey(1) 51,505 51,505
Vijay Vaghela(1) 22,105 15,039
Paul Vickers(1) 38,550 33,886
Non-executive directors
Peter Birch 10,000 10,000
Sir Victor Blank (Chairman) 30,000 30,000
Sir Angus Grossart – –
Gary Hoffman – –
Penny Hughes (resigned 5 May 2005) 1,275 1,275
David Marlow (resigned 5 May 2005) 25,000 25,000
David Ross 6,512 2,873
(1)Total includes the following holdings of Deposited Shares in the LTIP: Sly Bailey 32,124; Vijay Vaghela 15,950; Paul Vickers 10,687.
As beneficiaries under the employee benefit trust, the directorsare deemed to be interested in the shares held by the employee benefit trust which, at 1 January 2006, amounted to 90,855ordinary shares.
There have been no changes in the interests of the directors in the ordinary shares of the Company since 1 January 2006, other than that David Ross has increased his holding to 7,202shares as at 24 February 2006.

56
Chairman’s statement / Chief Executive’s statement / Business review / Corporate responsibility / Board of Directors andExecutive Committee / Corporate governance / Remuneration report / Directors’ report / Group independent auditors’report / Accounts and notes / Unaudited other information / Holding company accounts and notes / Investor Relations
Performance graph (unaudited information)
Legislation requires a company’s remuneration report to contain a graph illustrating its performance compared to an appropriate‘broad equity market index’ over the past five years. As Trinity Mirror plc is currently a constituent of the FTSE Mid-250 Index, that index (minus Investment Trusts) is considered the most appropriate form of ‘broad equity market index’ against which the Group’s performance should be graphed. Performance, as required by the legislation, is measured by Total Shareholder Return (share price growth plus dividends paid).
Graph 1 Graph 2
Gary HoffmanChairman of the Remuneration Committee
Valu
e(£
)
2000 2001 2002 2003 2004 2005
Trinity Mirror (Total Return) FTSE Media (Total Return)
40
50
60
70
80
90
100
110
120
Graph 2 shows the value, by the end of 2005, of £100 invested in Trinity Mirror at 31 December 2000 compared with £100 invested in the FTSE All-Share Media & Entertainment Index. The other points plotted are the values at interim financial year-ends.
Valu
e(£
)
2000 2001 2002 2003 2004 2005
Trinity Mirror (Total Return) FTSE 250 (Total Return)
60
70
80
90
100
110
120
130
140
150
160
170
Graph 1 shows the value, by the end of 2005, of £100 invested in Trinity Mirror on 31 December 2000 compared with £100 invested in the FTSE Mid 250 Index (excluding Investment Trusts). The other points plotted are the values at interim financial year-ends.
Remuneration reportcontinued

57
Statement of directors’ responsibilities
The directors are responsible for preparing the Annual Report andthe financial statements. The directors are required to prepareaccounts for the Group in accordance with International FinancialReporting Standards (IFRSs) and have chosen to preparecompany financial statements in accordance with UnitedKingdom Generally Accepted Accounting Practice (UK GAAP).
In the case of UK GAAP accounts, the directors are required toprepare financial statements for each financial year which give a true and fair view of the state of affairs of the Company and of the profit or loss of the Company for that period. In preparingthese financial statements, the directors are required to:
• select suitable accounting policies and then apply them consistently;
• make judgements and estimates that are reasonable andprudent; and
• state whether applicable accounting standards have beenfollowed, subject to any material departures disclosed andexplained in the financial statements.
In the case of IFRS accounts, International Accounting Standard 1requires that financial statements present fairly for each financialyear the Company’s financial position, financial performance andcash flows. This requires the faithful representation of the effects of transactions, other events and conditions in accordance with thedefinitions and recognition criteria for assets, liabilities, income andexpenses set out in the International Accounting Standards Board’s‘Framework for the preparation and Presentation of FinancialStatements’. In virtually all circumstances, a fair presentation will be achieved by compliance with all applicable InternationalFinancial Reporting Standards. Directors are also required to:
• properly select and apply accounting policies;• present information, including accounting policies,
in a manner that provides relevant, reliable, comparable and understandable information; and
• provide additional disclosures when compliance with thespecific requirements in International Financial ReportingStandards is insufficient to enable users to understand theimpact of particular transactions, other events and conditionson the entity’s financial position and financial performance.
The directors are responsible for keeping proper accountingrecords which disclose with reasonable accuracy at any time thefinancial position of the Company, for safeguarding the assets, for taking reasonable steps for the prevention and detection offraud and other irregularities and for the preparation of a directors’report and directors’ remuneration report which comply with therequirements of the Companies Act 1985.
The directors are responsible for the maintenance and integrity of the Company website. Legislation in the United Kingdomgoverning the preparation and dissemination of financialstatements may differ from legislation in other jurisdictions.
Principal activities and future development
The principal activity of the Group is the publication and printingof newspapers, primarily in the United Kingdom. The analyses of revenue and operating profit are included as note 4 to thefinancial statements. A review of the Group’s business andactivities during the period is contained in the statement of theChief Executive on pages 6 to 9, the review of each of theGroup’s principal businesses on pages 10 to 25 and the financialreview on pages 26 to 30.
The Group’s strategic intent is to create a more broadly basedleading media and information group by growing organically, byacquisition and by developing opportunities for expansion in thenew information markets. The directors will develop opportunitiesin print and electronic form.
Results and dividends
The profit for the 52 weeks ended 1 January 2006 after tax and minority interest was £146.9 million (2004: £145.1 million). An interim dividend of 6.4 pence per shares has been paid on theordinary shares. The directors now recommend a final dividend of 15.5 pence per share making a total dividend for the year of21.9 pence per share. Payment of the recommended finaldividend, once approved by shareholders at the Annual GeneralMeeting, will be made on 9 June 2006 to shareholders registeredat the close of business on 5 May 2006. Further details ofdividends paid and proposed are disclosed in note 10 to thefinancial statements.
Charitable and political donations
During the year contributions for charitable purposes totalled£60,000 (2004: £287,000), principally to various charitiesconnected or associated with the newspaper, printing oradvertising industries and local charities serving the communitiesin which the Group operates. No direct political contributionswere paid during the year (2004: £nil).
The editorial stance of the Group’s National titles, and in particularthat of the Daily Mirror and the Daily Record, is politically left ofcentre and often supportive of the Labour Party. Although theGroup does not make direct political donations, it has been in the best interests of the Daily Mirror and Daily Record to sponsor,on commercial terms, certain events in aid of the Labour Party.This is a practice that has been followed for many years. At theCompany’s AGM held in 2004, various of the Group’s subsidiariesreceived authority from shareholders under the Political Parties,Elections and Referendums Act 2000 to make donations topolitical parties of up to £75,000 in aggregate per annum. In 2005 there were no such payments (2004: £10,000).
Chairman’s statement / Chief Executive’s statement / Business review / Corporate responsibility / Board of Directors andExecutive Committee / Corporate governance / Remuneration report / Directors’ report / Group independent auditors’report / Accounts and notes / Unaudited other information / Holding company accounts and notes / Investor Relations
Directors’ report

58
Directors’ reportcontinued
Chairman’s statement / Chief Executive’s statement / Business review / Corporate responsibility / Board of Directors andExecutive Committee / Corporate governance / Remuneration report / Directors’ report / Group independent auditors’report / Accounts and notes / Unaudited other information / Holding company accounts and notes / Investor Relations
Employment policies
The Group pursues a policy of equal opportunities to all employeesand potential employees. The Group has continued its policy ofgiving fair consideration to applications for employment made bydisabled persons bearing in mind the requirements for skills andaptitude for the job. In the areas of planned employee trainingand career development, the Group strives to ensure thatdisabled employees receive maximum possible benefits, includingopportunities for promotion. Every effort is made to ensure thatcontinuing employment and opportunities are also provided foremployees who become disabled. Within the limitations ofcommercial confidentiality and security, it is the policy of theCompany to take views of employees into account in makingdecisions, and, wherever possible, to encourage the involvementof employees in the Group’s performance. Group companiesevolve their own consultative policies. Methods of communicationused include advisory committee meetings, newsletters, bulletins,pension trustee reports and management briefings. The Grouphas operated a savings-related share option scheme since 1987and all eligible employees are encouraged to participate.
Payment of suppliers
The Group has a supplier payment policy which provides forpayment of all suppliers (other than those with agreed alternativeterms) at the month end following the month of receipt of invoice.All companies within the Group are encouraged to make paymentsin accordance with those terms and conditions provided that thesupplier has also complied with them. At 1 January 2006, theCompany had an average of 32 days’ (2004: 23 days’) purchasesoutstanding in trade creditors.
Share capital
Details of the movements in the Company’s share capital areincluded as note 30 to the financial statements.
Substantial shareholdings
So far as is known the only persons interested in 3% or moreof the ordinary shares of the Company at 27 January 2006 were:
Holding Number of shares in Company
Barclays plc 37,557,085 12.82%
Capital Group Companies Inc 29,068,256 9.93%
Harris Associates, L.P. 26,122,500 8.92%
Aviva plc (Morley Fund Management Ltd) 20,999,539 7.17%
Tweedy, Browne Company LLC 14,831,758 5.06%
Standard Life Investments 11,731,465 4.00%
Legal & General InvestmentManagement Ltd 11,312,244 3.86%
Brandes Investment Partners, L.P. 9,063,350 3.09%
Fidelity International Ltd 8,872,747 3.03%
Directors’ and officers’ liability insurance
During the year, the Company has maintained cover for its directorsand officers and those of its subsidiary companies under a directors’ and officers’ liability insurance policy, as permitted by section 310(3) of the Companies Act 1985.
Directors
The directors of the Company who served during the 52 weeksended 1 January 2006 are listed below:
ExecutiveSly BaileyVijay VaghelaPaul Vickers
Non-executiveSir Victor BlankPeter Birch CBESir Angus GrossartGary Hoffman (appointed 3 March 2005)Penny Hughes (retired 5 May 2005)David Marlow (retired 5 May 2005)David Ross
Their remuneration is summarised on page 53 in the remuneration report.
Details of the directors’ beneficial and non-beneficial interests in shares can be found on pages 54 and 55.
In accordance with the Articles of Association, the directors are required to retire every three years.
Sly Bailey and Sir Angus Grossart, who were each last elected in 2003, retire and offer themselves for re-election.
Sir Victor Blank will retire at the conclusion of the AGM.
Auditors
In accordance with section 385 of the Companies Act 1985 aresolution proposing the re-appointment of Deloitte & Touche LLPas auditors to the Company will be put to the Annual GeneralMeeting.
By order of the Board
Paul VickersSecretary and Group Legal Director2 March 2006

59
We have audited the Group financial statements of Trinity Mirror plcfor the 52 weeks ended 1 January 2006 which comprise theconsolidated income statement, the consolidated balance sheet,the consolidated cash flow statement, the consolidated statementof recognised income and expense and the related notes 1 to 38.These group financial statements have been prepared under theaccounting policies set out therein. We have also audited theinformation in the directors’ remuneration report that is describedas having been audited.
We have reported separately on the individual company financial statements of Trinity Mirror plc for the 52 weeks ended1 January 2006.
This report is made solely to the Company’s members, as a body,in accordance with section 235 of the Companies Act 1985. Our audit work has been undertaken so that we might state tothe Company’s members those matters we are required to stateto them in an auditors’ report and for no other purpose. To thefullest extent permitted by law, we do not accept or assumeresponsibility to anyone other than the Company and the Company’s members as a body, for our audit work, for this report, or for the opinions we have formed.
Respective responsibilities of directors and auditorsThe directors’ responsibilities for preparing the annual report, thedirectors’ remuneration report and the Group financial statementsin accordance with applicable law and International FinancialReporting Standards (IFRS) as adopted for use in the EuropeanUnion are set out in the statement of directors’ responsibilities.
Our responsibility is to audit the Group financial statements andthe part of the directors’ remuneration report described as havingbeen audited in accordance with relevant United Kingdom legaland regulatory requirements and International Standards onAuditing (UK and Ireland).
We report to you our opinion as to whether the Group financialstatements give a true and fair view in accordance with therelevant financial reporting framework and whether the Groupfinancial statements and the part of the directors’ remunerationreport described as having been audited have been properlyprepared in accordance with the Companies Act 1985 and Article 4 of the IAS Regulation. We report to you if, in our opinion,the directors’ report is not consistent with the Group financialstatements. We also report to you if we have not received all the information and explanations we require for our audit, or ifinformation specified by law regarding directors’ transactions withthe Company and other members of the Group is not disclosed.
We also report to you if, in our opinion, the Company has notcomplied with any of the four directors’ remuneration disclosurerequirements specified for our review by the Listing Rules of theFinancial Services Authority. These comprise the amount of eachelement in the remuneration package and information on shareoptions, details of long-term incentive schemes, and moneypurchase and defined benefit schemes. We give a statement, to the extent possible, of details of any non-compliance.
We review whether the corporate governance statement reflectsthe Company’s compliance with the nine provisions of the 2003FRC Combined Code specified for our review by the Listing Rules
of the Financial Services Authority, and we report if it does not.We are not required to consider whether the board’s statementon internal control covers all risks and controls, or form anopinion on the effectiveness of the Group’s corporate governanceprocedures or its risk and control procedures.
We read the directors’ report and the other information containedin the annual report for the above year as described in thecontents section including the unaudited part of the directors’remuneration report and we consider the implications for ourreport if we become aware of any apparent misstatements ormaterial inconsistencies with the Group financial statements.
Basis of audit opinionWe conducted our audit in accordance with International Standardson Auditing (UK and Ireland) issued by the Auditing PracticesBoard. An audit includes examination, on a test basis, of evidencerelevant to the amounts and disclosures in the Group financialstatements and the part of the directors’ remuneration reportdescribed as having been audited. It also includes an assessmentof the significant estimates and judgements made by the directorsin the preparation of the Group financial statements, and ofwhether the accounting policies are appropriate to the Company’scircumstances, consistently applied and adequately disclosed.
We planned and performed our audit so as to obtain all theinformation and explanations which we considered necessary in order to provide us with sufficient evidence to give reasonableassurance that the Group financial statements and the part of thedirectors’ remuneration report described as having been auditedare free from material misstatement, whether caused by fraud or other irregularity or error. In forming our opinion we alsoevaluated the overall adequacy of the presentation of informationin the Group financial statements and the part of the directors’remuneration report described as having been audited.
OpinionIn our opinion:• the Group financial statements give a true and fair view, in
accordance with IFRSs as adopted for use in the EuropeanUnion, of the state of the Group’s affairs as at 1 January 2006and of its profit for the 52 weeks then ended; and
• the Group financial statements and the part of the directors’remuneration report described as having been audited havebeen properly prepared in accordance with the Companies Act 1985 and Article 4 of the IAS Regulation.
Separate opinion in relation to IFRS As explained in Note 1 of the Group financial statements, theGroup, in addition to complying with its legal obligation to complywith IFRS as adopted for use in the European Union, has alsocomplied with the IFRS as issued by the International AccountingStandards Board. Accordingly, in our opinion the financialstatements give a true and fair view, in accordance with IFRS, of the state of the Group’s affairs as at 1 January 2006 and of its profit for the 52 weeks then ended.
Deloitte & Touche LLPChartered Accountants and Registered AuditorsLondon2 March 2006
Chairman’s statement / Chief Executive’s statement / Business review / Corporate responsibility / Board of Directors andExecutive Committee / Corporate governance / Remuneration report / Directors’ report / Group independent auditors’report / Accounts and notes / Unaudited other information / Holding company accounts and notes / Investor Relations
Independent auditors’ report to the members of Trinity Mirror plc

60
Chairman’s statement / Chief Executive’s statement / Business review / Corporate responsibility / Board of Directors andExecutive Committee / Corporate governance / Remuneration report / Directors’ report / Group independent auditors’report / Accounts and notes / Unaudited other information / Holding company accounts and notes / Investor Relations
Consolidated income statementfor the 52 weeks ended 1 January 2006 (53 weeks ended 2 January 2005)
2005 2004notes £m £m
Revenue 3 1,122.0 1,141.7Cost of sales (538.8) (533.6)
Gross profit 583.2 608.1Distribution costs (126.5) (140.5)Administrative expenses:
Non-recurring 7 (2.7) (12.2)Amortisation of intangible assets 13 (3.3) –Other (206.1) (213.4)
Share of results of associates 15 0.8 0.8
Operating profit 5 245.4 242.8IAS 19 finance credit/(charge) 8 1.7 (2.9)IAS 39 impact* 8 (6.6) –Other finance costs 8 (31.0) (35.3)Profit on disposal of subsidiary undertakings 7 – 2.5
Profit before tax 209.5 207.1Tax 9 (62.6) (62.0)
Profit for the period 146.9 145.1
Attributable to:Equity holders of the parent 146.9 145.0Minority interest – 0.1
146.9 145.1
Pence Pence
Earnings per share (pence) 11Excluding amortisation of intangibles and IAS 39 impact*Underlying earnings per share 52.9 51.2Non-recurring items (0.2) (2.0)
Adjusted earnings per share – basic 52.7 49.2
Adjusted earnings per share – diluted 52.5 48.7
Including amortisation of intangibles and IAS 39 impact*Underlying earnings per share 50.5 51.2Non-recurring items (0.2) (2.0)
Earnings per share – basic 50.3 49.2
Earnings per share – diluted 50.1 48.7
All revenue and results arose from continuing operations.
*Impact of fair value, exchange rate, and amortisation adjustments on borrowings and associated financial instruments accounted for under IAS 39.References to IAS 39 throughout this document shall have the same meaning.
Consolidated statement of recognised income and expensefor the 52 weeks ended 1 January 2006 (53 weeks ended 2 January 2005)
2005 2004£m £m
Actuarial (losses)/gains on defined benefit pension schemes (net of tax) (1.7) 24.9Gain on revaluation of available-for-sale investments taken to equity 0.3 –Tax on revaluation of available-for-sale investments taken to equity (0.1) –
Net income recognised directly in equity (1.5) 24.9
Transferred to profit or loss on sale of available-for-sale investments (2.7) –Tax on items transferred from equity 0.8 –
Transfers from equity to the income statement (1.9) –
Profit for the period 146.9 145.1
Total recognised income and expense for the period 143.5 170.0
Attributable to:Equity holders of the parent 143.5 169.9Minority interest – 0.1
143.5 170.0

61
Chairman’s statement / Chief Executive’s statement / Business review / Corporate responsibility / Board of Directors andExecutive Committee / Corporate governance / Remuneration report / Directors’ report / Group independent auditors’report / Accounts and notes / Unaudited other information / Holding company accounts and notes / Investor Relations
Consolidated balance sheet at 1 January 2006 (2 January 2005)
2005 2004notes £m £m
Non-current assets
Goodwill 12 72.8 6.0
Other intangible assets 13 1,616.1 1,579.9
Property, plant and equipment 14 387.3 387.8
Investments in associates 15 8.6 7.5
Deferred tax asset 21 97.9 106.5
2,182.7 2,087.7
Current assets
Inventories 16 7.2 6.7
Available-for-sale financial assets 17 0.5 1.3
Trade and other receivables 18 150.9 147.7
Cash and cash equivalents 33.2 43.4
191.8 199.1
Total assets 2,374.5 2,286.8
Non-current liabilities
Borrowings 28 (392.0) (440.8)
Obligations under finance leases 20 (15.6) (17.7)
Retirement benefit obligation 34 (305.6) (321.9)
Deferred tax liabilities 21 (547.2) (540.9)
Long-term provisions 22 (12.2) (8.1)
Derivative financial instruments 27 (56.6) –
(1,329.2) (1,329.4)
Current liabilities
Borrowings 26 (58.7) (36.4)
Trade and other payables 19 (183.0) (175.0)
Current tax liabilities (37.5) (33.2)
Obligations under finance leases 20 (2.8) (2.5)
Short-term provisions 22 (9.6) (4.7)
(291.6) (251.8)
Total liabilities (1,620.8) (1,581.2)
Net assets 753.7 705.6
Equity
Share capital 30 (29.3) (29.7)
Share premium account 31 (1,118.9) (1,101.7)
Revaluation reserve 29 (4.9) (4.9)
Capital redemption reserve 29 (0.8) –
Retained earnings and other reserves 29 400.2 430.7
Equity attributable to equity holders of the parent (753.7) (705.6)
Total equity (753.7) (705.6)
These financial statements were approved by the Board of Directors on 2 March 2006 and signed on its behalf by:
Sly Bailey Chief Executive Vijay Vaghela Group Finance Director

62
Chairman’s statement / Chief Executive’s statement / Business review / Corporate responsibility / Board of Directors andExecutive Committee / Corporate governance / Remuneration report / Directors’ report / Group independent auditors’report / Accounts and notes / Unaudited other information / Holding company accounts and notes / Investor Relations
Consolidated cash flow statementfor the 52 weeks ended 1 January 2006 (53 weeks ended 2 January 2005)
2005 2004notes £m £m
Cash flows from operating activities
Cash generated from operations 25 276.8 288.8
Income tax paid (55.5) (55.6)
Net cash from operating activities 221.3 233.2
Investing activities
Interest received 1.2 0.8
Dividends received from associated undertakings 0.6 3.2
Purchase of shares from minority interests – (4.5)
Proceeds on disposal of available-for-sale financial assets 2.9 –
Proceeds on disposal of land 2.9 –
Net cash balances disposed of with subsidiary undertaking – (2.1)
Proceeds on disposal of subsidiary undertakings – 44.7
Proceeds on disposal of property, plant and equipment 4.0 1.8
Purchases of property, plant and equipment (41.0) (37.3)
Proceeds from sale of motor cycle show business – 0.2
Acquisition of subsidiaries 36 (86.5) –
Net cash (used in)/from investing activities (115.9) 6.8
Financing activities
Dividends paid (60.2) (55.1)
Dividend paid to minority shareholders – (0.1)
Interest paid (33.9) (33.8)
Interest paid on finance leases (1.2) (2.2)
Increase in borrowings 45.0 –
Repayment of borrowings (18.1) (138.2)
Principal payments under finance leases (1.8) (11.0)
Purchase of shares under share buy-back programme (52.7) –
Issue of ordinary share capital 17.6 12.5
Purchase of own shares under Long Term Incentive Plan (5.7) (6.2)
(Decrease)/increase in bank overdrafts (4.6) 3.2
Net cash used in financing activities (115.6) (230.9)
Net (decrease)/increase in cash and cash equivalents (10.2) 9.1
Cash and cash equivalents at the beginning of period 43.4 34.3
Cash and cash equivalents at the end of period 33.2 43.4

63
Chairman’s statement / Chief Executive’s statement / Business review / Corporate responsibility / Board of Directors andExecutive Committee / Corporate governance / Remuneration report / Directors’ report / Group independent auditors’report / Accounts and notes / Unaudited other information / Holding company accounts and notes / Investor Relations
1 General informationTrinity Mirror plc is a limited liability company incorporated in England andWales under the Companies Act 1985 and listed on the London StockExchange. The address of the registered office is One Canada Square,Canary Wharf, London, E14 5AP. The principal activities of the Group are discussed in the Business Review on pages 10 to 30.
These consolidated financial statements were approved for issue by theBoard of Directors on 2 March 2006.
At the date of authorisation of these financial statements, the followingStandards and Interpretations which have not been applied in thesefinancial statements were in issue but not yet effective:
• IFRS 7 Financial Instruments: Disclosures; and the relatedamendment to IAS 1 on capital disclosures.
• IFRIC 4: Determining whether an Arrangement contains a Lease.
The directors anticipate that the adoption of these Standards andInterpretations in future periods will have no material impact on thefinancial statements of the Group except for additional disclosures oncapital and financial instruments when the relevant standards come intoeffect for periods commencing on or after 2 January 2006.
2 Accounting policiesThe principal accounting policies adopted in the preparation of thesefinancial statements are set out below. These policies have beenconsistently applied to all years presented, unless otherwise stated.
Adoption of International Financial Reporting and AccountingStandards (‘IFRS’)This is the first set of consolidated annual financial statements prepared in accordance with IFRS adopted for use in the European Union.
Trinity Mirror plc consolidated financial statements were prepared inaccordance with United Kingdom Generally Accepted Accounting Practice(UK GAAP) until 2 January 2005. UK GAAP differs in some areas from IFRS.In preparing the Trinity Mirror plc 2005 consolidated financial statements,management has amended certain accounting, valuation and consolidationmethods applied in the UK GAAP financial statements to comply with therecognition and measurement criteria of IFRS. The comparative figures inrespect of 2004 are restated to reflect these adjustments.
The Group has adopted Standards and Interpretations issued by theInternational Accounting Standards Board (IASB) and the InternationalFinancial Reporting Interpretations Committee (IFRIC) of the IASB that arerelevant to its operations and effective for accounting periods beginningon 3 January 2005.
Individual standards and interpretations have to be adopted by theEuropean Commission (EC) and the process leads to a delay between the issue and adoption of new standards and interpretations and in some
cases amendments by the EC. Where the Group has applied a newstandard/interpretation in advance of EC adoption this will be noted belowin the relevant policy statement.
The individual company financial statements of Trinity Mirror plc for the 52 weeks ended 1 January 2006, prepared in accordance with applicableUnited Kingdom law and United Kingdom Generally Accepted AccountingPractice, are presented on pages 108 to 115.
First-time Adoption of IFRSFor the 52 weeks to 1 January 2006 the Group has applied the principlesset out in ‘IFRS 1, First-time Adoption of International Financial ReportingStandards’ (IFRS 1), which has been applied in preparing these financial statements.
IFRS 1 sets out the procedures that must be followed when adoptingIFRS for the first time as the basis for preparing the Group’s consolidatedfinancial statements. The Group is required to establish its IFRSaccounting policies and, in general, apply these retrospectively todetermine the IFRS opening balance sheet at the date of transition, 29December 2003. IFRS 1 provides a number of optional exemptions to thisgeneral principle. The most significant of these are set out below, togetherwith a description, in each case, of the exemption adopted by the Group.
• Business Combinations – IFRS 3, Business CombinationsThe Group has elected not to restate the accounting for businesscombinations completed before the date of transition.
• Fair value as ‘deemed’ cost – IAS 16, Property,Plant and Equipment The Group has elected, where appropriate, to use fair value as the‘deemed’ cost of plant, property and equipment on adoption of IFRS.
• Employee Benefits – IAS 19, Employee BenefitsThe Group has elected to recognise all cumulative actuarial gains and losses in relation to employee benefit schemes at the date oftransition. In subsequent periods all actuarial gains and losses will berecognised in full in the period in which they occur in the Statement of Recognised Income and Expense (‘SoRIE’) in accordance with the amendment to IAS 19, issued on 16 December 2004.
• Financial Instruments – IAS 32, Financial Instruments:Disclosure and Presentation and IAS 39, FinancialInstruments: Recognition and MeasurementThe Group has elected to adopt IAS 32 and IAS 39 from 3 January2005. Therefore the comparative financial information in respect of financial instruments set out in note 26 is presented in accordancewith UK GAAP.
• Share-based Payments – IFRS 2, Share-based PaymentsThe Group has elected to apply IFRS 2 to all share-based awards and options granted post 7 November 2002 but not vested at 3 January 2005.
Notes to the financial statements

2 Accounting policies (continued)
The disclosures required by IFRS 1, including the reconciliations anddescriptions of the effect of the transition from UK GAAP to IFRS on theGroup’s equity and its net income and cash flows are provided in note 37.
Adoption of new and revised Standards and InterpretationsIn the current year, the Group has adopted all the new and revisedStandards and Interpretations issued by the International AccountingStandards Board (the IASB) and the International Financial ReportingInterpretations Committee (IFRIC) of the IASB that are relevant to itsoperations and effective for accounting periods beginning on 3 January2005. The adoption of these new and revised Standards andInterpretations has resulted in changes to the Group’s accounting policies in the following areas:
• Amendment to Employee Benefits (IAS 19);
• The amendment to IAS 19 issued in December 2004 is applicable toannual periods beginning on or after 1 January 2006. The Group haselected to early adopt this amendment. The impact on the Group’sfinancial statements will be to report actuarial gains and losses arisingin its defined retirement benefit schemes in the SoRIE and expanddisclosures in relation to those schemes.
Basis of accountingThese financial statements have been prepared in accordance with IFRSand IFRIC interpretations and with those parts of the Companies Act1985 applicable to Groups reporting under IFRS. These are subject toongoing amendment by the IASB and subsequent endorsement by theEuropean Commission and are therefore subject to change. As a result,information contained herein will need to be updated for any subsequentamendment to IFRS or any new Standards that the Group may elect to adopt early. The financial statements have been prepared under the historical cost convention as modified by revaluation of freeholdproperties. A summary of more important Group accounting policies is set out in this note, together with an explanation of where changeshave been made to previous policies on the adoption of IFRS.
Under the accounting Standard on First-time Adoption, IFRS 1, the Group has elected by way of an exemption to apply financial instrumentaccounting under IAS 32 and IAS 39 from 3 January 2005.
In preparing these financial statements, the Group has assumed that the European Commission will endorse the amendment to IAS 19,‘Employee Benefits – Actuarial Gains and Losses, Group Plans andDisclosures’ (IAS 19).
Basis of consolidationThe consolidated financial statements incorporate the financial statementsof Trinity Mirror plc and all entities controlled by it for the 52 weeks ended1 January 2006. Control is achieved where the Company has the powerto govern the financial and operating policies of an entity so as to obtainbenefits from its activities.
On the acquisition of a business, including an interest in an associatedundertaking or a joint venture, fair values are attributed to the Group’sshare of the identifiable assets and liabilities of the business existing at the date of acquisition and reflecting the conditions as at that date.
Results of businesses are included in the consolidated income statementfrom the effective date of acquisition or up to the effective date of relinquishing control as appropriate.
Where necessary, adjustments are made to the financial statements of subsidiaries to bring their accounting policies into line with those used in the preparation of the Group consolidated financial statements. All intra-group transactions, balances, income and expenses areeliminated on consolidation.
Revenue recognitionRevenue is measured at the fair value of Group sales, net of applicablediscounts and value added tax.
Advertising revenue is recognised upon publication and circulationrevenue is recognised at the time of sale. Other revenue is recognised at the time of sale or provision of service.
Business combinationsThe acquisition of subsidiaries is accounted for using the purchasemethod. The cost of the acquisition is measured at the aggregate of the fair values, at the date of completion, of assets acquired, liabilitiesincurred or assumed, and equity instruments issued by the Group inexchange for control of the acquiree, plus any costs directly attributable to the business combination. The acquiree’s identifiable assets, liabilitiesand contingent liabilities that meet the conditions for recognition underIFRS 3 are recognised at their fair values at the acquisition date.
Goodwill arising on acquisition is recognised as an asset and initiallymeasured at cost, being the excess of the cost of the businesscombination over the Group’s interest in the net fair value of the acquiree’sidentifiable assets (including intangible assets other than goodwill),liabilities and contingent liabilities. If, after reassessment, the Group’sinterest in the net fair value of the acquiree’s identifiable assets, liabilitiesand contingent liabilities exceeds the cost of the business combination,the excess is recognised immediately in the income statement. Theinterest of minority shareholders in the acquiree is initially measured at theminority’s proportion of the acquiree’s net fair value of the assets, liabilitiesand contingent liabilities.
Investment in associatesAssociates are all entities over which the Group has significant influencebut not control and are accounted for by the equity method of accounting,initially recognised at cost.
The Group’s share of its associates’ post-acquisition profits or losses is recognised in the income statement, and its share of post-acquisitionmovements in reserves is recognised in reserves.
64
Chairman’s statement / Chief Executive’s statement / Business review / Corporate responsibility / Board of Directors andExecutive Committee / Corporate governance / Remuneration report / Directors’ report / Group independent auditors’report / Accounts and notes / Unaudited other information / Holding company accounts and notes / Investor Relations
Notes to the financial statementscontinued

65
Chairman’s statement / Chief Executive’s statement / Business review / Corporate responsibility / Board of Directors andExecutive Committee / Corporate governance / Remuneration report / Directors’ report / Group independent auditors’report / Accounts and notes / Unaudited other information / Holding company accounts and notes / Investor Relations
Joint venturesThe Group has joint venture arrangements where separate entities havebeen established. In each entity the Group or one of its subsidiaries hasan interest and along with other venturers jointly controls these entities.
Where material, the Group reports its interest in jointly controlled entitiesusing equity accounting and its share of the entities’ profit or loss isaccounted for as a single entry in the Group’s consolidated incomestatement. Where the Group transacts with its jointly controlled entities,unrealised profits and losses are eliminated to the extent of the Group’sinterest in the joint venture.
Other intangible assetsOther intangible assets comprise acquired publishing rights and titles in respect of print publishing activities, and customer relationships anddomain names in respect of on-line activities. On the acquisition of abusiness the cost of the investment is allocated between categories ofassets and liabilities on a fair value basis. The fair value of other intangibleassets is assessed based on discounted cash flows.
Publishing rights and titles are initially recognised as an asset at fair value with an indefinite economic life and subsequently measured at fairvalue less any accumulated impairment losses. They are not subject to amortisation and are tested for impairment. For the purpose ofimpairment testing, publishing rights and titles are tested annually, or more frequently when there is an indication that the recoverableamount is less than the carrying amount. An impairment loss isrecognised in the income statement in the period it occurs and is not reversed in subsequent periods.
Customer relationships and domain names are amortised over theexpected life over which the assets will generate revenues and profits for the Group.
GoodwillGoodwill arising on consolidation represents the excess of the cost ofacquisition over the Group’s interest in the fair value of the identifiableassets and liabilities of a subsidiary, associate or jointly controlled entity at the date of acquisition.
Goodwill is recognised as an asset and reviewed for impairment at leastannually. Any impairment is recognised immediately in the incomestatement and is not subsequently reversed.
On disposal of a subsidiary, associate or jointly controlled entity, the attributable amount of goodwill is included in the determination of the profit or loss on disposal.
Goodwill arising on acquisitions before the date of transition to IFRS hasbeen retained at the previous UK GAAP amounts subject to being testedfor impairment at that date.
Property, plant and equipmentProperty, plant and equipment are stated in the balance sheet at cost lessany subsequent accumulated depreciation and subsequent accumulatedimpairment losses.
Cost includes purchase price and all directly attributable costs of bringingthe asset to its location and condition necessary to operate as intended.
Assets in the course of construction are carried at cost, less anyrecognised impairment loss. Depreciation commences when the assetsare ready for their intended use.
Depreciation is charged so as to write off the cost, other than assetsunder construction, using the straight-line method over the estimateduseful lives detailed below:
Property 15-67 yearsPlant and equipment 3-25 years
Assets held under finance leases are depreciated over their expecteduseful lives on the same basis as owned assets or, where shorter, overthe term of the relevant lease.
Finance leasesLeases are classified as finance leases whenever the terms of the leasetransfer substantially all the risks and rewards of ownership to the Group.Assets held under finance leases are recognised at their fair value at theinception of the lease or, if lower, the present value of the minimum leasepayments. The asset is recognised within Property, plant and equipmentand the corresponding liability to the lessor is included within Obligationsunder finance leases. Lease payments are apportioned between financecharges (which are charged to the income statement) and reductions in the lease obligation.
Operating leasesRentals payable under operating leases are charged to the incomestatement in equal annual amounts over the lease term. Benefits receivedas incentives to enter into the agreement are also spread on a straight- line basis over the lease term.
Foreign currencyTransactions denominated in foreign currencies are translated at theaverage rate applicable to the accounting period. At each balance sheet date, items denominated in foreign currencies are retranslated at the rates prevailing on the balance sheet date. Exchange differencesarising on settlement and on retranslation are included in the incomestatement for the period.
BorrowingsInterest-bearing loans and bank overdrafts are recorded at the proceedsreceived, net of direct issue costs. Finance charges, including premiumspayable on settlement or redemption and direct issue costs, are accounted

2 Accounting policies (continued)
for on an accrual basis to the income statement using the effectiveinterest method and are added to the carrying amount of the instrumentto the extent that they are not settled in the period in which they arise.
Financial instrumentsFinancial assets and financial liabilities are recognised on the Group’sbalance sheet when the Group becomes a party to the contractualprovisions of the instrument.
Derivative financial instruments The Group uses derivative financial instruments, including cross-currencyinterest rate swaps, interest rate swaps and other hedging instruments, to minimise exposure to the financial risks of changes in foreign currencyexchange rates and interest rates. The Group does not use derivativefinancial instruments for speculative purposes.
Since 3 January 2005 derivative financial instruments are now separatelyrecognised at fair value in the financial statements. Changes in the fairvalue of derivative financial instruments are recognised immediately in theincome statement.
Derivatives embedded in commercial contracts are treated as separatederivatives when their risks and characteristics are not closely related tothose of the underlying contracts, with unrealised gains or losses reportedin the income statement.
Financial instruments – comparatives for 2004The comparative numbers for 2004 have been based on UK GAAPmeasurement principles and under IFRS 1 the Group has taken theexemption not to restate these balances. Borrowings and loans arerecorded at cost, any premium or discount being amortised over the lifeof the facility. Interest receipts and payments are accrued to match thenet income or cost with the related finance expense. Borrowings that arehedged with interest rate and cross currency swaps are recorded at theultimate interest and exchange rates payable by the Group after takinginto account the cash flows that are eliminated by hedging derivatives.
Cash and cash equivalentsCash and cash equivalents comprise cash on hand and demand deposits.
Trade receivablesTrade receivables do not carry any interest. Conversion to a readily known amount of cash occurs over a short period and is subject to aninsignificant risk of changes in value. Therefore balances are stated attheir nominal value as reduced by appropriate allowances for estimatedirrecoverable amounts.
Trade payablesTrade payables are not interest-bearing. Payments occur over a shortperiod and are subject to an insignificant risk of changes in value.Therefore balances are stated at their nominal value.
InvestmentsCurrent investments have been classified as available-for-sale financialassets, and are measured at fair value. Gains and losses arising fromchanges in fair value are recognised directly in equity net of deferred tax,until the investment is disposed of or is determined to be impaired, atwhich time the cumulative gain or loss previously recognised in equity is included in the income statement for the period.
InventoriesInventories are stated at the lower of cost and net realisable value. Cost represents materials, direct labour and production overheads.
Software development costsCosts incurred in the development and maintenance of websites areexpensed as incurred, and are only capitalised if the criteria specified in IAS 38, Intangible Assets, are met.
ProvisionsProvisions are recognised when the Group has a present obligation as aresult of a past event, and it is probable that the Group will be required to settle that obligation. Provisions are measured at the directors’ bestestimate of the expenditure required to settle the obligation at the balancesheet date, and are discounted to present value where the effect is material.
Government grantsGovernment grants are recognised in the income statement over the periods necessary to match them with the related costs and are deducted in reporting the related expense.
Tax The tax expense represents the sum of the corporation tax currentlypayable and deferred tax.
The corporation tax currently payable is based on taxable profit for theyear. Taxable profit differs from profit before tax as reported in the incomestatement because it excludes items of income or expense that aretaxable or deductible in other years and it further excludes items that are not taxable or deductible.
Deferred tax is the tax expected to be payable or recoverable ondifferences between the carrying amounts of assets and liabilities in the financial statements and the corresponding tax bases used in thecomputation of taxable profit, and is accounted for using the balancesheet liability method. Deferred tax liabilities are generally recognised forall taxable temporary differences and deferred tax assets are recognisedto the extent that it is probable that taxable profits will be available againstwhich deductible temporary differences can be utilised.
Deferred tax liabilities are recognised for taxable temporary differencesarising on investments in subsidiaries and associates, and interests in jointventures, except where the Group is able to control the reversal of thetemporary difference and it is probable that the temporary difference willnot reverse in the foreseeable future.
66
Chairman’s statement / Chief Executive’s statement / Business review / Corporate responsibility / Board of Directors andExecutive Committee / Corporate governance / Remuneration report / Directors’ report / Group independent auditors’report / Accounts and notes / Unaudited other information / Holding company accounts and notes / Investor Relations
Notes to the financial statementscontinued

67
Chairman’s statement / Chief Executive’s statement / Business review / Corporate responsibility / Board of Directors andExecutive Committee / Corporate governance / Remuneration report / Directors’ report / Group independent auditors’report / Accounts and notes / Unaudited other information / Holding company accounts and notes / Investor Relations
The carrying amount of deferred tax assets is reviewed at each balancesheet date and reduced to the extent that it is no longer probable thatsufficient taxable profits will be available to allow all or part of the asset to be recovered.
Deferred tax is calculated at the tax rates that are expected to apply inthe period when the liability is settled or the asset is realised. Deferred taxis charged or credited in the income statement, except when it relates toitems charged or credited directly to equity, in which case the deferred taxis also dealt with in equity.
Employee benefits – retirement benefits The Group operates a number of funded defined benefit (final salarypension) schemes, all of which have been set up under Trusts that hold their financial assets separately from those of the Group and are controlled by the Trustees.
The liability recognised in the balance sheet in respect of defined benefitpension plans is the present value of the defined benefit obligation at thebalance sheet date less the fair value of scheme assets, together withadjustments for unrecognised actuarial gains or losses and past service costs.The defined benefit obligation is calculated annually by independent actuariesusing the projected unit credit method. The present value of the definedbenefit obligation is determined by discounting the estimated future cashoutflows using interest rates of high-quality corporate bonds approximating to the terms of the related pension liability. Unrealised gains and lossesare recognised in the Statement of Recognised Income and Expense.
Payments to defined contribution retirement benefit schemes are chargedas an expense when they fall due.
Employee benefits – share-based paymentsThe Group has applied the requirements of IFRS 2, Share-based Payments.In accordance with the transitional provisions, IFRS 2 has been applied toall grants of equity instruments after 7 November 2002 that had not vestedas of 3 January 2005. The Group issues equity-settled benefits to certainemployees. These equity-settled share-based payments are measured atfair value (excluding the effect of non-market-based vesting conditions) atthe date of grant. The fair value is determined at the grant date and isexpensed on a straight-line basis over the vesting period, based on theGroup’s estimate of shares that will eventually vest and annually adjusted for the effect of non-market-based vesting conditions.
Fair value is measured by use of a stochastic (Monte-Carlo binomial)model. The expected life used in the model has been adjusted, based on the directors’ best estimates, for the effects of non-transferability,exercise restrictions, and behavioural considerations.
Non-recurring itemsItems which are deemed to be non-recurring by virtue of their nature or size are included under the statutory classification appropriate to theirnature but are separately disclosed on the face of the income statementto assist in understanding the financial performance of the Group.
Libel litigationAccruals are made for legal costs in respect of libel litigation in progress.Provision is made for estimated damages where it is judged probable thatdamages will be payable.
Dividend distributionDividend distribution to the Company’s shareholders is recognised as a liability in the Group’s financial statements in the period in which the dividends are approved.
Share capitalOrdinary shares are classified as equity. Incremental costs directlyattributable to the issue of new shares or options are shown in equity as a deduction from the proceeds, net of tax.
Where the Group’s own shares are purchased the consideration paid,including any directly attributable incremental costs (net of income taxes),is deducted from equity attributable to the Group’s equity holders until the shares are cancelled, reissued or disposed of. The nominal value of shares cancelled is shown in the Capital Redemption Reserve. Where such shares are subsequently sold or reissued any considerationreceived, net of any directly attributable incremental transaction costs and the related income tax effects, is included in equity attributable to the Group’s equity holders.
Critical judgements in applying the Group’s accounting policiesIn the process of applying the Group’s accounting policies, described above,management has made the following judgements that have the mostsignificant effect on the amounts recognised in the financial statements.
AcquisitionsJudgements have been made in respect of the identification of intangibleassets based on pre-acquisition forecasts, analysis and negotiations. The initial valuations of acquired intangible assets will be reviewed for impairment on an annual basis, or more frequently if necessary.
Key sources of estimation uncertaintyThe key assumptions concerning the future, and other key sources ofestimation uncertainty at the balance sheet date, that have a significantrisk of causing a material adjustment to the carrying amounts of assetsand liabilities within the next financial year, are discussed below.
Impairment of intangible assets Determining whether intangible publishing rights and titles in respect of print publishing activities, and intellectual property in respect of on-lineactivities, are impaired requires an estimation of the value in use of thecash-generating units to which these intangible assets have beenallocated. The value in use calculation requires the Group to estimate the future cash flows expected to arise from the cash-generating unit and a suitable discount rate in order to calculate present value.

68
Chairman’s statement / Chief Executive’s statement / Business review / Corporate responsibility / Board of Directors andExecutive Committee / Corporate governance / Remuneration report / Directors’ report / Group independent auditors’report / Accounts and notes / Unaudited other information / Holding company accounts and notes / Investor Relations
52 weeks to 53 weeks to1 January 2 January
2006 20053 Revenue £m £m
Circulation 396.4 395.4
Advertising 611.7 644.4
Other 113.9 101.9
1,122.0 1,141.7
4 Business and geographical segments
For management purposes, the Group is currently organised into the following divisions: Regionals, Nationals, Sports, Magazines and Exhibitions
and Central costs. These divisions are the basis on which the Group reports its primary segment information. The secondary reporting segment
is a geographical destination analysis of revenue.
Principal activities are as follows:
The Regionals division publishes a large portfolio of newspaper and on-line brands across the UK. The Nationals division, comprising the UK and
Scottish Nationals, publishes five daily and Sunday newspapers. The Sports division is a supplier of racing and sports betting information, with four
sports newspapers and related on-line activities. The Magazines and Exhibitions division operates a range of magazines and consumer and trade
shows. Central costs include costs not attributed to specific divisions and TM Interactive, which was reported separately until the end of 2004.
The revenues and costs of each segment are clearly identifiable and allocated according to where they arise.
Segment information for these activities is presented below.
Primary segments – business segment analysis Magazines and
Regionals Nationals Sports Exhibitions Central costs Consolidated2005 2005 2005 2005 2005 2005
52 weeks ended 1 January 2006 £m £m £m £m £m £m
Revenue
Segment sales 542.3 510.7 50.6 32.7 – 1,136.3
Inter-segment sales (2.7) (11.6) – – – (14.3)
Total revenue 539.6 499.1 50.6 32.7 – 1,122.0
Result
Segment result 147.4 91.2 17.4 7.2 (15.9) 247.3
Non-recurring items (2.7)
Share of results of associates 0.8
Operating profit 245.4
IAS 19 finance credit 1.7
IAS 39 impact* (6.6)
Other finance costs (31.0)
Profit before tax 209.5
Tax (62.6)
Profit for the period 146.9
Other information
Capital additions 124.5 20.9 0.4 0.1 1.4 147.3
Depreciation 18.2 20.7 0.4 0.3 0.5 40.1
Amortisation of intangible assets 3.3 – – – – 3.3
Impairment of trade receivables 1.1 0.1 – 0.1 – 1.3
*Impact of fair value, exchange rate, and amortisation adjustments on borrowings and associated financial instruments accounted for under IAS 39.References to IAS 39 throughout this document shall have the same meaning.
Notes to the financial statementscontinued

69
Chairman’s statement / Chief Executive’s statement / Business review / Corporate responsibility / Board of Directors andExecutive Committee / Corporate governance / Remuneration report / Directors’ report / Group independent auditors’report / Accounts and notes / Unaudited other information / Holding company accounts and notes / Investor Relations
4 Business and geographical segments (continued)
Primary segments – business segment analysis (continued)
Balance sheetMagazines and
Regionals Nationals Sports Exhibitions Unallocated Consolidated2005 2005 2005 2005 2005 2005
1 January 2006 £m £m £m £m £m £m
Assets
Segment assets 1,242.2 943.1 48.6 13.7 (12.8) 2,234.8
Investment in associates – – – – 8.6 8.6
Deferred tax asset – – – – 97.9 97.9
Cash and cash equivalents – – – – 33.2 33.2
Total assets 1,242.2 943.1 48.6 13.7 126.9 2,374.5
Liabilities
Segment liabilities (109.5) (111.5) (8.4) (11.8) (1.1) (242.3)
Borrowings – – – – (507.3) (507.3)
Obligations under finance leases – – – – (18.4) (18.4)
Retirement benefit obligation – – – – (305.6) (305.6)
Deferred tax liabilities – – – – (547.2) (547.2)
Total liabilities (109.5) (111.5) (8.4) (11.8) (1,379.6) (1,620.8)
Segment assets consist primarily of intangible assets, property, plant and equipment and trade and other receivables.
Segment liabilities comprise trade and other payables, current tax liabilities and provisions.
Capital additions comprises additions to property, plant and equipment (note 14), and intangible assets (notes 12 and 13), including additions
resulting from acquisitions (note 36).Central costs
Magazines and and TMRegionals Nationals Sports Exhibitions Interactive Consolidated
2004 2004 2004 2004 2004 200453 weeks ended 2 January 2005 £m £m £m £m £m £m
Revenue
Segment sales 540.6 532.5 48.9 31.8 1.2 1,155.0
Inter-segment sales (0.5) (12.8) – – – (13.3)
Total revenue 540.1 519.7 48.9 31.8 1.2 1,141.7
Result
Segment result 151.0 95.2 18.0 7.5 (17.5) 254.2
Non-recurring items (12.2)
Share of results of associates 0.8
Operating profit 242.8
IAS 19 finance charge (2.9)
Other finance costs (35.3)
Profit on disposal of subsidiary undertakings 2.5
Profit before tax 207.1
Tax (62.0)
Profit for the period 145.1
Other information
Capital additions 27.2 8.4 0.3 – 1.4 37.3
Depreciation 17.7 21.3 0.5 0.4 1.4 41.3
Impairment of trade receivables 1.1 – – 0.1 – 1.2

70
Chairman’s statement / Chief Executive’s statement / Business review / Corporate responsibility / Board of Directors andExecutive Committee / Corporate governance / Remuneration report / Directors’ report / Group independent auditors’report / Accounts and notes / Unaudited other information / Holding company accounts and notes / Investor Relations
Notes to the financial statementscontinued
4 Business and geographical segments (continued)
Primary segments – business segment analysis (continued)
Balance sheetMagazines and Unallocated and
Regionals Nationals Sports Exhibitions TM Interactive Consolidated2004 2004 2004 2004 2004 2004
2 January 2005 £m £m £m £m £m £m
Assets
Segment assets 1,129.7 948.7 48.5 13.5 (11.0) 2,129.4
Investment in associates – – – – 7.5 7.5
Deferred tax asset – – – – 106.5 106.5
Cash and cash equivalents – – – – 43.4 43.4
Total assets 1,129.7 948.7 48.5 13.5 146.4 2,286.8
Liabilities
Segment liabilities (82.1) (100.0) (7.0) (11.4) (20.5) (221.0)
Borrowings – – – – (477.2) (477.2)
Obligations under finance leases – – – – (20.2) (20.2)
Retirement benefit obligation – – – – (321.9) (321.9)
Deferred tax liabilities – – – – (540.9) (540.9)
Total liabilities (82.1) (100.0) (7.0) (11.4) (1,380.7) (1,581.2)
Secondary segments – geographical destination segment analysis
The Group’s operations are located in the United Kingdom. The following table provides an analysis of the Group’s revenues by geographical market.
52 weeks to 53 weeks to1 January 2 January
2006 2005£m £m
Revenue analysis
United Kingdom and Republic of Ireland 1,115.5 1,135.5
Continental Europe 6.2 6.1
Rest of world 0.3 0.1
Total 1,122.0 1,141.7

71
Chairman’s statement / Chief Executive’s statement / Business review / Corporate responsibility / Board of Directors andExecutive Committee / Corporate governance / Remuneration report / Directors’ report / Group independent auditors’report / Accounts and notes / Unaudited other information / Holding company accounts and notes / Investor Relations
2005 20045 Operating profit £m £m
Operating profit is arrived at after charging/(crediting)
Staff costs (note 6) 336.5 335.9
Cost of inventories recognised as a cost of sales 145.4 143.1
Depreciation of property, plant and equipment:
– owned assets 36.9 37.6
– under finance leases 3.2 3.7
Amortisation of intangibles (included in Other administrative expenses) 3.3 –
Loss/(profit) on disposal of property, plant and equipment (0.1) –
Operating lease rentals payable:
– plant and equipment 6.8 6.8
– property 8.2 9.3
Trade receivables impairment 1.3 1.2
Non-recurring items (note 7) 2.7 12.2
Auditors’ remuneration:
Audit services
Statutory audit 0.8 0.6
Circulation audit 0.4 0.4
IFRS transition audit – 0.1
Tax services
Advisory services 0.3 0.4
Other services not covered above 0.1 0.2
Other services provided by the auditor relate to the provision of financial reporting and accounting advice. In addition to the amounts shown above,
the auditors received fees of £18,000 (2004: £17,000) for the audit of two of the Group’s pension schemes.
A description of the work of the Audit Committee is set out in the Corporate Governance Report on page 45 and includes an explanation of how
auditor objectivity and independence is safeguarded when non-audit services are provided by the auditors.

72
Chairman’s statement / Chief Executive’s statement / Business review / Corporate responsibility / Board of Directors andExecutive Committee / Corporate governance / Remuneration report / Directors’ report / Group independent auditors’report / Accounts and notes / Unaudited other information / Holding company accounts and notes / Investor Relations
Notes to the financial statementscontinued
6 Staff costs
The average number of persons, including executive directors, employed by the Group in the year was:2005 2004
Number Number
Production and editorial 5,575 6,039
Sales and distribution 3,813 3,529
Administration 1,677 1,583
11,065 11,151
All employees are employed in the United Kingdom and the Republic of Ireland.
The average number of employees for 2005 includes 62 (2004: nil) in respect of businesses acquired during the year.
The above excludes 1,465 (2004: 1,127) casual workers due to the impracticality of determining regular and occasional workers.
2005 2004£m £m
Staff costs, including directors’ emoluments, incurred during the year were:
Wages and salaries 277.8 276.3
Social security costs 24.9 24.6
Share options granted to directors and employees 4.4 1.9
Pension costs – defined contribution plans 0.8 0.5
Pension costs – defined benefit plans 28.6 32.6
336.5 335.9
Disclosure of individual directors’ remuneration, share options, long-term incentives schemes, pension contributions and pension entitlements required
by the Companies Act 1985 and those specified for audit by the Financial Services Authority are shown in the tables in the Remuneration Report
on pages 48 to 56 and form part of these financial statements.

73
Chairman’s statement / Chief Executive’s statement / Business review / Corporate responsibility / Board of Directors andExecutive Committee / Corporate governance / Remuneration report / Directors’ report / Group independent auditors’report / Accounts and notes / Unaudited other information / Holding company accounts and notes / Investor Relations
7 Non-recurring items and profit on sale of subsidiary undertakings2005 2004
Non-recurring items £m £m
Restructuring costs(a) 7.9 11.0
Severance costs following acquisition of the hotgroup plc(b) 1.0 –
Profit on disposal of land and buildings(c) (3.5) (1.0)
Profit on disposal of available-for-sale investments(d) (2.7) –
Maxwell-related recoveries(e) – (1.3)
Write-down of presses in Chester and Oldham(f) – 7.0
Release of old accruals for which no further costs are expected(g) – (3.5)
Non-recurring items 2.7 12.2
(a)Restructuring severance costs of £7.9 million have been incurred in delivery of cost-reduction measures. The 2004 charge of £11.0 million includes£0.9 million relating to the restructure of the TM Interactive division which has been refocused on driving revenues for the Group and is not reportedseparately in 2005.
(b)Severance costs of £1.0 million were incurred following the acquisition of the hotgroup plc (2004: £nil million).(c)In 2005 the Group disposed of surplus land and buildings realising a profit on disposal of £3.5 million (2004: £1.0 million).(d)In 2005 the Group disposed of its shareholding in Scottish Radio Holdings plc realising a profit on disposal of £2.7 million (2004: £nil million).(e)In 2004 the Group recovered £1.3 million from the liquidators of Maxwell-related companies for claims outstanding since 1992.(f) In 2004 costs of £7.0 million were incurred in the write-down of press plant from the closure of the Chester print site and the re-pressing project
at Oldham as part of the Manufacturing Project which was announced in February 2004.(g)In 2004 the Group released old sundry accruals £3.5 million for which no further costs were expected.
2005 2004Profit on sale of subsidiary undertakings £m £m
Profit on sale of subsidiary undertakings – (2.5)
Profit on sale of subsidiary undertakings – (2.5)
In January 2004 the Group disposed of its Irish subsidiaries for a consideration of £46.1 million, realising a profit of £2.5 million, and its Motorcycle Show
business for a consideration of £0.2 million, realising a profit of £nil million.
IAS 19(1) IAS 39(2) Other(3) Total8 Finance costs £m £m £m £m
52 weeks ended 1 January 2006
Income 72.9 – 1.2 74.1
Expense (71.2) (6.6) (32.2) (110.0)
Total finance costs 1.7 (6.6) (31.0) (35.9)
53 weeks ended 2 January 2005
Income 67.4 – 0.8 68.2
Expense (70.3) – (36.1) (106.4)
Total finance costs (2.9) – (35.3) (38.2)
(1)IAS 19 finance income represents expected return on scheme assets net of expected expenses, and IAS 19 finance expense represents the interest cost on scheme liabilities.
(2)Impact of fair value, exchange rate, and amortisation adjustments on borrowings and associated financial instruments accounted for under IAS 39. (3)Other finance costs in 2005 include interest on obligations under finance leases of £1.2 million (2004: £0.8 million).

74
Chairman’s statement / Chief Executive’s statement / Business review / Corporate responsibility / Board of Directors andExecutive Committee / Corporate governance / Remuneration report / Directors’ report / Group independent auditors’report / Accounts and notes / Unaudited other information / Holding company accounts and notes / Investor Relations
Notes to the financial statementscontinued
2005 20049 Tax £m £m
Current tax
Corporation tax charge for the period (56.8) (60.9)
Prior year adjustment (2.0) (2.0)
Current tax charge (58.8) (62.9)
Deferred tax (note 21)
Tax charge for the period (5.3) (2.2)
Prior year adjustment 1.5 3.1
Deferred tax charge (3.8) 0.9
Total tax charge (62.6) (62.0)
Reconciliation of tax charge % %
Standard rate of corporation tax 30.0 30.0
Tax effect of items that are not deductible or not taxable in determining taxable profit 0.2 0.9
Tax effect of share of results of associate (0.3) (0.1)
Tax effect of rolled over and revaluation gains (0.2) (0.3)
Prior year adjustment 0.2 (0.6)
Total tax charge rate 29.9 29.9
The standard rate of corporation tax is the UK prevailing rate of 30% (2004: 30%).
In addition to the amount charged to the income statement, deferred tax relating to the actuarial losses on defined benefit pension schemes
of £0.7 million has been credited directly to equity.
2005 200410 Dividends £m £m
Amounts recognised as distributions to equity holders in the period:
Dividend paid(a) 60.2 55.1
Pence Pence
Dividend paid per share(a) 20.7 18.7
£m £m
Dividend proposed but not paid nor included in the accounting records(b) 45.4 42.4
Pence Pence
Dividend proposed per share(c) 15.5 14.3
(a)The amount of £60.2 million is in respect of the final dividend for the 53 weeks ended 2 January 2005 of 14.3p per share and the interim dividend for the 52 weeks ended 1 January 2006 of 6.4p per share; the amount of £55.1 million is in respect of the final dividend for the 52 weeks ended 29 December 2003 of 12.8p per share and the interim dividend for the 53 weeks ended 2 January 2005 of 5.9p per share.
(b)The amount of £45.4 million represents the proposed final dividend for the 52 weeks ended 1 January 2006, which is subject to approval byshareholders at the Annual General Meeting and as such is not reflected as a liability in these financial statements; the amount of £42.4 millionrepresents the proposed final dividend for the 53 weeks ended 2 January 2005.
(c)The proposed final dividend for the 52 weeks ended 2 January 2006 of 15.5p per share (2004: 14.3p per share) is an addition to the interim dividend of 6.4p per share (2004: 5.9p per share), bringing the total annual dividend for the 52 weeks ended 1 January 2006 to 21.9p per share (2004: 20.2pper share).

75
Chairman’s statement / Chief Executive’s statement / Business review / Corporate responsibility / Board of Directors andExecutive Committee / Corporate governance / Remuneration report / Directors’ report / Group independent auditors’report / Accounts and notes / Unaudited other information / Holding company accounts and notes / Investor Relations
11 Earnings per share2005 2004
Earnings £m £m
Profit after tax before non-recurring items, amortisation of intangibles and IAS 39 impact (underlying) 154.4 151.0
Non-recurring items (after tax)* (0.6) (6.0)
Profit after tax before amortisation of intangibles and IAS 39 impact 153.8 145.0
Amortisation of intangibles (after tax) (2.3) –
IAS 39 impact (after tax) (4.6) –
Basic EPS earnings (profit attributable to equity holders) 146.9 145.0
Number of shares (‘000) (‘000)
Weighted average number of ordinary shares for the purpose of basic EPS 291,900 294,787
Effect of dilutive potential ordinary shares – share options 1,274 3,149
Weighted average number of ordinary shares for the purpose of diluted EPS 293,174 297,936
Basic profit per share is calculated by dividing profit attributable to equity holders by the weighted average number of ordinary shares during the year.
Diluted profit per share is calculated by adjusting the weighted average number of ordinary shares in issue on the assumption of conversion of all
potentially dilutive ordinary shares.
Earnings per share – pence Pence Pence
Excluding amortisation of intangibles and IAS 39 impact:
Underlying earnings per share 52.9 51.2
Non-recurring items* (0.2) (2.0)
Adjusted earnings per share – basic 52.7 49.2
Adjusted earnings per share – diluted 52.5 48.7
Including amortisation of intangibles and IAS 39 impact:
Underlying earnings per share 50.5 51.2
Non-recurring items* (0.2) (2.0)
Earnings per share – basic 50.3 49.2
Earnings per share – diluted 50.1 48.7
Underlying earnings per share is stated inclusive of the following item:Pence Pence
Amortisation of intangibles (0.8) –
The earnings per share for each category of non-recurring items and profit on sale of subsidiary undertakings disclosed in note 7 is as follows:
Pence Pence
Restructuring costs (1.8) (2.5)
Severance costs following acquisition of the hotgroup plc (0.3) –
Profit on disposal of land and buildings 1.2 0.2
Profit on disposal of available-for-sale investments 0.7 –
Maxwell-related recoveries – 0.4
Write-down of presses in Chester and Oldham – (1.9)
Release of old accruals for which no further costs are expected – 1.0
Profit on sale of subsidiary undertakings – 0.8
Earnings per share – non-recurring items* (0.2) (2.0)
*Non-recurring items includes profit on disposal of subsidiary undertakings in 2004.
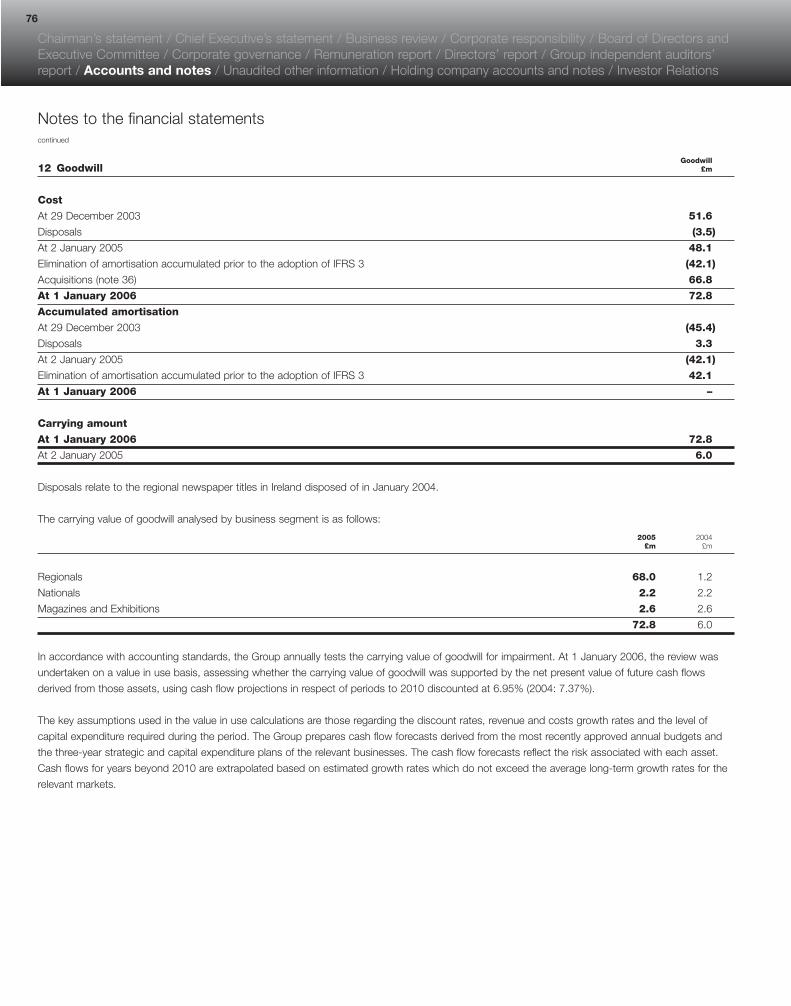
76
Chairman’s statement / Chief Executive’s statement / Business review / Corporate responsibility / Board of Directors andExecutive Committee / Corporate governance / Remuneration report / Directors’ report / Group independent auditors’report / Accounts and notes / Unaudited other information / Holding company accounts and notes / Investor Relations
Notes to the financial statementscontinued
Goodwill12 Goodwill £m
Cost
At 29 December 2003 51.6
Disposals (3.5)
At 2 January 2005 48.1
Elimination of amortisation accumulated prior to the adoption of IFRS 3 (42.1)
Acquisitions (note 36) 66.8
At 1 January 2006 72.8
Accumulated amortisation
At 29 December 2003 (45.4)
Disposals 3.3
At 2 January 2005 (42.1)
Elimination of amortisation accumulated prior to the adoption of IFRS 3 42.1
At 1 January 2006 –
Carrying amount
At 1 January 2006 72.8
At 2 January 2005 6.0
Disposals relate to the regional newspaper titles in Ireland disposed of in January 2004.
The carrying value of goodwill analysed by business segment is as follows:
2005 2004£m £m
Regionals 68.0 1.2
Nationals 2.2 2.2
Magazines and Exhibitions 2.6 2.6
72.8 6.0
In accordance with accounting standards, the Group annually tests the carrying value of goodwill for impairment. At 1 January 2006, the review was
undertaken on a value in use basis, assessing whether the carrying value of goodwill was supported by the net present value of future cash flows
derived from those assets, using cash flow projections in respect of periods to 2010 discounted at 6.95% (2004: 7.37%).
The key assumptions used in the value in use calculations are those regarding the discount rates, revenue and costs growth rates and the level of
capital expenditure required during the period. The Group prepares cash flow forecasts derived from the most recently approved annual budgets and
the three-year strategic and capital expenditure plans of the relevant businesses. The cash flow forecasts reflect the risk associated with each asset.
Cash flows for years beyond 2010 are extrapolated based on estimated growth rates which do not exceed the average long-term growth rates for the
relevant markets.

77
Chairman’s statement / Chief Executive’s statement / Business review / Corporate responsibility / Board of Directors andExecutive Committee / Corporate governance / Remuneration report / Directors’ report / Group independent auditors’report / Accounts and notes / Unaudited other information / Holding company accounts and notes / Investor Relations
Customerrelationships Group
Publishing and domain Totalrights/titles names 2005
13 Other intangible assets £m £m £m
Cost
At 29 December 2003 1,991.2 – 1,991.2
Disposals (36.3) – (36.3)
At 2 January 2005 1,954.9 – 1,954.9
Acquisitions (note 36) – 39.5 39.5
At 1 January 2006 1,954.9 39.5 1,994.4
Accumulated amortisation
At 29 December 2003 (375.0) – (375.0)
At 2 January 2005 (375.0) – (375.0)
Acquisitions – (3.3) (3.3)
At 1 January 2006 (375.0) (3.3) (378.3)
Carrying amount
At 1 January 2006 1,579.9 36.2 1,616.1
At 2 January 2005 1,579.9 – 1,579.9
The disposals relate to the regional newspaper titles in Ireland disposed of in January 2004. The review of the carrying value of the Group’s publishing
rights and titles, undertaken in accordance with IAS 38, has indicated that no impairment charge was required (2004: £nil million) as the net present
value of future cash flows to be derived from these assets discounted at 6.95% (2004: 7.37%) is greater than the carrying value.
The customer relationships and domain names included above have finite estimated useful lives of between five and ten years.
The carrying value of other intangible assets analysed by business segment is as follows:
2005 2004£m £m
Regionals 924.0 887.8
Nationals 647.0 647.0
Sports 42.8 42.8
Magazines and Exhibitions 2.3 2.3
1,616.1 1,579.9
In accordance with accounting standards, the Group annually tests the carrying value of other intangible assets with indefinite economic lives for
impairment. At 1 January 2006, the review was undertaken using a combination of value in use and business valuations to assess whether the carrying
value of publishing rights and titles, customer relationships and domain names was supported either by the net present value of future cash flows
derived from those assets, using cash flow projections in respect of periods to 2054, or by management’s estimate of the valuation of the intangible
assets based on previous market transactions in the sector.
The key assumptions used in the value in use calculations are those regarding the discount rates, growth rates and the level of capital expenditure
required during the period. The discount rate used at 1 January 2006 was 6.95% reflecting a long-term equity and debt mix based on the year-end
Enterprise Value assuming a long-term debt to EBITDA ratio of three times. The Group prepares cash flow forecasts derived from the most recently
approved annual budgets and the three-year strategic and capital expenditure plans of the relevant businesses. The cash flow forecasts reflect past
experience of and the risk associated with each asset. Operating cash flows beyond the three-year strategic plan period are extrapolated based
on estimated growth rates which do not exceed the average long-term growth estimated for the relevant markets. Investment cash flows have been
forecast to reflect the cycle of capital investment required, including printing press replacement. Management believes it is appropriate to forecast
for a period of greater than five years to most appropriately reflect the length of the capital investment cycle.

78
Chairman’s statement / Chief Executive’s statement / Business review / Corporate responsibility / Board of Directors andExecutive Committee / Corporate governance / Remuneration report / Directors’ report / Group independent auditors’report / Accounts and notes / Unaudited other information / Holding company accounts and notes / Investor Relations
Notes to the financial statementscontinued
Land and buildings Plant and Assets under GroupFreehold Leasehold vehicles construction Total
14 Property, plant and equipment £m £m £m £m £m
At cost or valuation
At 29 December 2003 171.8 29.2 368.6 54.9 624.5
Additions 3.8 0.1 19.2 14.2 37.3
Disposals (1.4) – (14.6) – (16.0)
Reclassification 20.4 0.1 24.6 (45.1) –
Write-off of assets – – (1.4) – (1.4)
At 2 January 2005 194.6 29.4 396.4 24.0 644.4
Additions 0.2 0.1 14.8 25.9 41.0
Acquired on acquisition of subsidiary – – 2.9 – 2.9
Disposals (1.1) (2.8) (18.5) – (22.4)
Reclassification 5.2 0.9 15.6 (21.7) –
Write-off of assets – – (2.7) – (2.7)
At 1 January 2006 198.9 27.6 408.5 28.2 663.2
Accumulated depreciation and impairment
At 29 December 2003 9.2 13.0 198.8 – 221.0
Charge for period 3.2 0.9 37.2 – 41.3
Disposals (0.3) – (11.9) – (12.2)
Reclassification – – – – –
Write-off of assets – 0.1 6.4 – 6.5
At 2 January 2005 12.1 14.0 230.5 – 256.6
Charge for period 3.7 0.9 35.5 – 40.1
Acquired on acquisition of subsidiary – – 1.6 – 1.6
Disposals (0.4) (1.0) (18.3) – (19.7)
Reclassification (0.2) 0.4 (0.2) – –
Write-off of assets – – (2.7) – (2.7)
At 1 January 2006 15.2 14.3 246.4 – 275.9
Carrying amount
At 2 January 2005 182.5 15.4 165.9 24.0 387.8
At 1 January 2006 183.7 13.3 162.1 28.2 387.3
Included within the total net book value of property, plant and equipment is £21.3 million (2004: £25.0 million) in respect of assets under finance leases.
Depreciation for the period on those assets was £3.2 million (2004: £3.7 million).

79
Chairman’s statement / Chief Executive’s statement / Business review / Corporate responsibility / Board of Directors andExecutive Committee / Corporate governance / Remuneration report / Directors’ report / Group independent auditors’report / Accounts and notes / Unaudited other information / Holding company accounts and notes / Investor Relations
14 Property, plant and equipment (continued)
Finance leases are secured on the assets leased.
As part of the first-time adoption of IFRS the Group has taken advantage of the option to treat all brought forward costs or valuations as deemed
costs on adoption of IFRS. 2005 2004
£m £m
Capital commitments
Capital expenditure contracted for but not provided in the accounts 34.5 13.0
15 Investments in associatesThe Group has a 21.54% interest in The Press Association Limited, a news agency incorporated in England and Wales.
2005 2004£m £m
Opening balance 7.5 9.9Share of result of associate after tax 0.8 0.8Dividends received (0.6) (3.2)Share of tax refund in respect of prior years 0.9 –
Closing balance 8.6 7.5
2005 2004Press Association £m £m
Total assets 61.6 51.1
Total liabilities (21.5) (16.0)
Net assets 40.1 35.1
Group’s share of net assets 8.6 7.5
Revenue 62.7 58.6
Profit for the period 4.0 3.7
Group’s share of associate’s profit for the period 0.8 0.8
The financial statements of The Press Association Limited are made up to 31 December each year. This is the financial reporting date of theorganisation. For the purposes of applying the equity method of accounting, the financial statements of The Press Association Limited for the yearended 31 December 2004 have been used and appropriate adjustments have been made for the period to 1 January 2006.
2005 200416 Inventories £m £m
Raw materials and consumables 7.2 6.7
The Group consumed £145.4 million (2004: £143.1 million) of inventories during the period.

80
Chairman’s statement / Chief Executive’s statement / Business review / Corporate responsibility / Board of Directors andExecutive Committee / Corporate governance / Remuneration report / Directors’ report / Group independent auditors’report / Accounts and notes / Unaudited other information / Holding company accounts and notes / Investor Relations
Notes to the financial statementscontinued
17 Available-for-sale financial assets
Adoption of IAS 32 and 39As a result of the adoption of IAS 32 and 39 certain assets have been classified as available-for-sale financial assets and valued at fair value with changes in the fair value being recorded as an equity movement.
2005 2004£m £m
Opening balance – cost 1.3 1.2Fair value impact of IAS 32 and 39 adoption on transition 2.4 –Adjusted opening position 3.7 1.2Movement in period (3.2) 0.1Closing balance 0.5 1.3Within current assets 0.5 1.3
Movement in period:Increase in fair value of available-for-sale assets 0.3 –Disposal of available-for-sale assets (3.5) –
(3.2) –
Dealt with in equity:Impact of IAS 32 and 39 adoption on transition 2.4 –Movement in period 0.3 –Deferred tax (0.8) –
1.9 –
2005 200418 Trade and other receivables £m £m
Trade receivables 126.0 127.1Less allowances for doubtful receivables (4.7) (3.4)Trade receivables – net 121.3 123.7Prepayments and accrued income 22.0 21.5Other receivables 7.6 2.5
150.9 147.7
The average credit period taken on sales is 37 days (2004: 36 days).
The directors consider that the carrying amount of trade and other receivables approximates their fair value.
The amounts presented in the balance sheet are net of allowances for doubtful receivables. An allowance for impairment is made where there is anidentified loss event which, based on previous experience, is evidence of a reduction in the recoverability of the cash flows.
The Group has recognised a loss of £1.3 million (2004: £1.2 million) in respect of impairment of trade receivables during the 52 weeks ended 1 January 2006. The loss has been included in Other administrative expenses in the income statement.
2005 200419 Trade and other payables £m £m
Trade payables 42.7 31.3Social security and other taxes 16.0 22.1Accruals and deferred income 108.4 101.1Other payables 15.9 20.5
183.0 175.0
The directors consider that the carrying amount of trade and other payables approximates their fair value.
The average credit period taken for trade purchases is 32 days (2004: 23 days).

81
Chairman’s statement / Chief Executive’s statement / Business review / Corporate responsibility / Board of Directors andExecutive Committee / Corporate governance / Remuneration report / Directors’ report / Group independent auditors’report / Accounts and notes / Unaudited other information / Holding company accounts and notes / Investor Relations
Futureminimumsublease
Present value receiptsMinimum of minimum under non-
lease lease cancellablepayments payments subleases
2005 2004 2005 2004 2005 200420 Obligations under finance leases £m £m £m £m £m £m
Amounts payable under finance leases:
Within one year 2.8 2.5 2.8 2.5 0.4 0.5
Within two to five years 13.9 14.3 10.8 9.7 0.5 1.0
After five years 6.5 9.2 4.8 8.0 – –
23.2 26.0 18.4 20.2 0.9 1.5
Less future finance charges (4.8) (5.8) – –
Present value of lease obligations 18.4 20.2 18.4 20.2
Less amounts due for settlement within 12 months
(shown under Current liabilities) (2.8) (2.5)
Amount due for settlement after 12 months 15.6 17.7
Finance leases relate principally to leasehold properties and press plant.
The average lease term is seven years. For the year ended 1 January 2006 the average effective borrowing rate was 9.0% (2004: 8.9%). Interest rates
are fixed at the contract date, and thus expose the Group to fair value interest rate risk. All leases are on a fixed repayment basis and no arrangements
have been entered into for contingent rental payments.
21 Deferred tax (assets)/liabilities
The following are the major deferred tax liabilities and assets recognised by the Group and movements thereon during the current reporting period:
Other short- Rolled over RetirementAccelerated tax term timing and held benefit Share-based
depreciation differences over gains Intangibles obligations payments Total£m £m £m £m £m £m £m
At 29 December 2003 (restated) 58.7 (2.6) 2.6 474.0 (107.4) (0.4) 424.9
(Credit)/charge to income (0.2) (0.7) (0.3) – 0.4 (0.1) (0.9)
Charge to equity – – – – 10.4 – 10.4
At 2 January 2005 58.5 (3.3) 2.3 474.0 (96.6) (0.5) 434.4
Impact of adoption of IAS 32 and 39 – 0.7 – – – – 0.7
Opening balance at 3 January 2005 58.5 (2.6) 2.3 474.0 (96.6) (0.5) 435.1
Acquisition of subsidiary undertakings – – – 11.8 – – 11.8
(Credit)/charge to income (2.9) 3.7 (0.3) (1.0) 5.6 (1.3) 3.8
Credit to equity – (0.7) – – (0.7) – (1.4)
At 1 January 2006 55.6 0.4 2.0 484.8 (91.7) (1.8) 449.3
Certain deferred tax assets and liabilities have been offset. The following is the analysis of the deferred tax balances for financial reporting purposes:
2005 2004£m £m
Deferred tax liabilities 547.2 540.9
Deferred tax assets (97.9) (106.5)
449.3 434.4
At the balance sheet date, the Group has unused tax losses of £20.3 million (2004: £nil million) and other short-term timing differences of £2.1 million
(2004: £nil million) available for offset against future profits. No deferred tax asset has been recognised in respect of the tax losses of £6.1 million
(2004: £nil million) and other short-term timing differences of £0.6 million (2004: £nil million) due to the unpredictability of future profit streams.

82
Chairman’s statement / Chief Executive’s statement / Business review / Corporate responsibility / Board of Directors andExecutive Committee / Corporate governance / Remuneration report / Directors’ report / Group independent auditors’report / Accounts and notes / Unaudited other information / Holding company accounts and notes / Investor Relations
Notes to the financial statementscontinued
Share-basedpayments Property Restructuring Total
22 Provisions £m £m £m £m
At 2 January 2005 0.3 12.5 – 12.8Additional provisions in the year 0.4 1.4 7.4 9.2Arising on acquisition of subsidiary undertakings – 1.1 – 1.1Utilisation of provisions – (1.3) – (1.3)
At 1 January 2006 0.7 13.7 7.4 21.8
The provisions have been analysed between current and non-current as follows:2005 2004
£m £m
Current 9.6 4.7Non-current 12.2 8.1
21.8 12.8
The share-based payments provision relates to National Insurance obligations attached to the future crystallisation of Long Term Incentive Plan awards.
The property provision relates to onerous property leases and future committed costs related to occupied, let and vacant properties. This provision
will be utilised over the remaining term of the leases. During the year £1.3 million was utilised in respect of this provision.
The restructuring provision relates to the non-recurring restructuring severance costs incurred in delivery of cost-reduction measures.
23 Joint venturesThe Group has the following interests in joint ventures:
a) 23.96% share in fish4 Limited.b) 40% equity holding in The Betting Site Limited.
The Group’s interests in joint ventures have not been accounted for under the equity method on the grounds of immateriality.
24 Principal subsidiaries
A list of the significant investments in subsidiaries and associated undertakings, including name, country of incorporation and proportion of ownership
interest is given in note 15 to the Company’s separate financial statements.

83
Chairman’s statement / Chief Executive’s statement / Business review / Corporate responsibility / Board of Directors andExecutive Committee / Corporate governance / Remuneration report / Directors’ report / Group independent auditors’report / Accounts and notes / Unaudited other information / Holding company accounts and notes / Investor Relations
2005 200425 Notes to the cash flow statement £m £m
Operating profit 245.4 242.8Adjustments for:Depreciation of property, plant and equipment 40.1 49.0Amortisation of intangible assets 3.3 –Share of results of associates (0.8) (0.8)Cost of Long Term Incentive Plan (LTIP) benefits 4.4 1.9Profit on disposal of property, plant and equipment (3.5) (1.0)Profit on disposal of available-for-sale investments (2.7) –Adjustment for IAS 19 pension funding (17.7) (3.1)
Operating cash flows before movements in working capital 268.5 288.8
(Increase)/decrease in inventories (0.5) 0.1Decrease in receivables 16.6 10.1Decrease in payables (7.8) (10.2)
Cash generated by operations 276.8 288.8
Cash and cash equivalents represent the sum of the Group’s bank balances and cash in hand at the balance sheet date as disclosed on the face of the balance sheet.
2005 200426 Borrowings £m £m
Bank overdrafts (17.9) (22.5)Short-term loans (40.0) –Loan notes (392.8) (454.7)Derivative financial instruments (56.6) –
(507.3) (477.2)
The borrowings are repayable as follows:
On demand or within one year (58.7) (36.4)
In the third year (55.5) –
In the fourth year – (60.5)
After five years (393.1) (380.3)
(507.3) (477.2)
Amount due for settlement within 12 months (58.7) (36.4)
Amount due for settlement after 12 months (448.6) (440.8)
(507.3) (477.2)
Loan notesClosing balance at 2 January 2005 (454.7)Impact of IAS 32 and 39 86.3
Restated closing balance at 2 January 2005 after the impact of IAS 32 and 39 (368.4)Impact of IAS 39 (37.2)Issued on acquisition of subsidiary undertakings (0.6)Repayments 13.7Non-cash movements (0.3)
Closing balance at 1 January 2006 (392.8)

84
Chairman’s statement / Chief Executive’s statement / Business review / Corporate responsibility / Board of Directors andExecutive Committee / Corporate governance / Remuneration report / Directors’ report / Group independent auditors’report / Accounts and notes / Unaudited other information / Holding company accounts and notes / Investor Relations
Notes to the financial statementscontinued
2005 200426 Borrowings (continued) £m £m
Composition of loan notes:Commercial rate loan notes (0.8) (13.9)US$350 million loan notes* (206.6) (237.3)US$252 million loan notes* (153.4) (171.5)£22 million loan notes* (22.0) (22.0)£10 million loan notes* (10.0) (10.0)
(392.8) (454.7)
All loan notes and overdrafts are unsecured.
*The US and UK private placement loan notes totalling US$602 million and £32 million were issued in 2001 and 2002. The fixed rate interest and capitalrepayments on the US$ denominated loan notes have been swapped into floating rate sterling through the use of cross-currency interest rate swaps tomanage the Group’s exposure to currency and interest rate movements. As hedge accounting under IAS 39 has not been applied, the loan notes andcross-currency swaps are shown separately under IAS 39. The loan notes are disclosed at amortised cost and translated into sterling at the prevailingperiod-end exchange rate and the cross-currency swaps are disclosed at fair value at the period-end date. These values do not represent the amountsrequired to repay the loan notes or cancel the related cross-currency interest rate swaps.
Comparative periods for the loan notes are disclosed and measured based on UK GAAP as at 2 January 2005. The difference between the UK GAAP
comparatives and IFRS is that under UK GAAP the loan notes were hedged against the related swaps and not restated from US dollars to sterling
at the balance sheet date.
All borrowings are denominated in sterling unless otherwise indicated. At 1 January 2006 the Group had available £222.4 million (2004: £263.1 million)
of undrawn committed borrowing facilities in respect of which all conditions precedent had been met.
The effective interest rates at the balance sheet dates were as follows:2005 2004
% %
Bank overdrafts 5.65 5.40
US$ loan notes 6.66 6.19
£ loan notes 7.06 6.85
Finance leases 6.86 7.15
The directors estimate the fair value of the Group’s borrowings, by discounting their future cash flows at the market rate, to be as follows:
2005 2004£m £m
Bank overdrafts, short-term loans and commercial loan notes (58.7) (36.4)
US$ loan notes (362.8) (338.5)
£ loan notes (33.0) (33.0)
Finance leases (18.4) (20.2)
In estimating the fair value of the loan notes the directors have discounted the future cash flows using the credit ratings applied at the dates
of inception, which they believe to be appropriate discount factors.
The fair value of other financial assets and liabilities (excluding derivative financial instruments – see note 27) are not materially different from
the book values and are not repeated in this analysis.
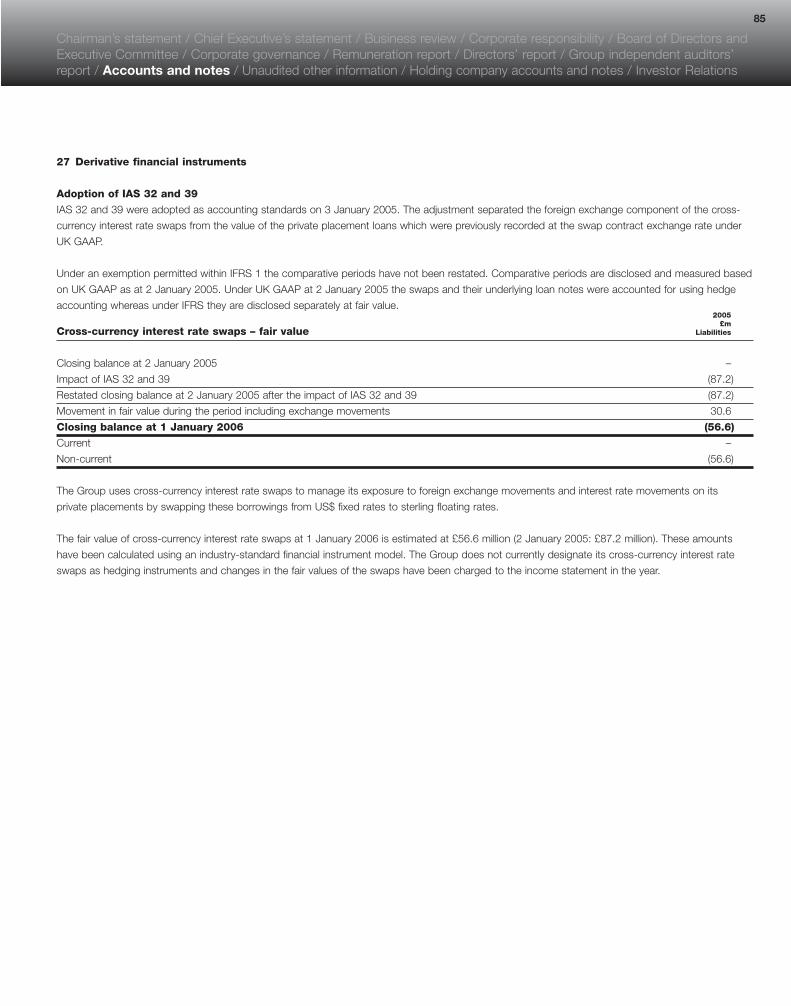
85
Chairman’s statement / Chief Executive’s statement / Business review / Corporate responsibility / Board of Directors andExecutive Committee / Corporate governance / Remuneration report / Directors’ report / Group independent auditors’report / Accounts and notes / Unaudited other information / Holding company accounts and notes / Investor Relations
27 Derivative financial instruments
Adoption of IAS 32 and 39
IAS 32 and 39 were adopted as accounting standards on 3 January 2005. The adjustment separated the foreign exchange component of the cross-
currency interest rate swaps from the value of the private placement loans which were previously recorded at the swap contract exchange rate under
UK GAAP.
Under an exemption permitted within IFRS 1 the comparative periods have not been restated. Comparative periods are disclosed and measured based
on UK GAAP as at 2 January 2005. Under UK GAAP at 2 January 2005 the swaps and their underlying loan notes were accounted for using hedge
accounting whereas under IFRS they are disclosed separately at fair value.2005
£mCross-currency interest rate swaps – fair value Liabilities
Closing balance at 2 January 2005 –
Impact of IAS 32 and 39 (87.2)
Restated closing balance at 2 January 2005 after the impact of IAS 32 and 39 (87.2)
Movement in fair value during the period including exchange movements 30.6
Closing balance at 1 January 2006 (56.6)
Current –
Non-current (56.6)
The Group uses cross-currency interest rate swaps to manage its exposure to foreign exchange movements and interest rate movements on its
private placements by swapping these borrowings from US$ fixed rates to sterling floating rates.
The fair value of cross-currency interest rate swaps at 1 January 2006 is estimated at £56.6 million (2 January 2005: £87.2 million). These amounts
have been calculated using an industry-standard financial instrument model. The Group does not currently designate its cross-currency interest rate
swaps as hedging instruments and changes in the fair values of the swaps have been charged to the income statement in the year.

86
Chairman’s statement / Chief Executive’s statement / Business review / Corporate responsibility / Board of Directors andExecutive Committee / Corporate governance / Remuneration report / Directors’ report / Group independent auditors’report / Accounts and notes / Unaudited other information / Holding company accounts and notes / Investor Relations
Notes to the financial statementscontinued
28 Net debt3 January
2 January 2005 Loans Other2005 adoption IAS 39* drawn/ non-cash 1 JanuaryIFRS of IAS 39* Cash flow impact repaid changes 2006
Net debt £m £m £m £m £m £m £m
Non-current
Loan notes (440.8) 86.3 – (37.2) – (0.3) (392.0)
Derivative financial instruments – (87.2) – 30.6 – – (56.6)
Obligations under finance leases (17.7) – – – 2.1 – (15.6)
(458.5) (0.9) – (6.6) 2.1 (0.3) (464.2)
Current
Bank overdrafts (22.5) – 4.6 – – – (17.9)
Short-term loans – – – – (40.0) – (40.0)
Loan notes (13.9) – – – 13.1 – (0.8)
Obligations under finance leases (2.5) – – – (0.3) – (2.8)
(38.9) – 4.6 – (27.2) – (61.5)
Cash and cash equivalents 43.4 – (10.2) – – – 33.2
Net debt (454.0) (0.9) (5.6) (6.6) (25.1) (0.3) (492.5)
*The US and UK private placement loan notes totalling US$602 million and £32 million were issued in 2001 and 2002. The fixed rate interest and capital
repayments on the US$ denominated loan notes have been swapped into floating rate sterling through the use of cross-currency interest rate swaps.
As hedge accounting under IAS 39 has not been applied, the loan notes and cross-currency swaps are shown separately under IAS 39. The loan notes
are disclosed at amortised cost and translated into sterling at the prevailing period-end exchange rate and the cross-currency swaps are disclosed
at fair value at the period-end date. These values do not represent the amounts required to repay the loan notes or cancel the related cross-currency
interest rate swaps.
Opening position reconciled to UK GAAP as at 2 January 2005UK GAAP at Adjustment IFRS at
2 January on transition 2 January2005 to IFRS 2005
Net debt £m £m £m
Non-current
Loan notes (440.8) – (440.8)
Obligations under finance leases (14.9) (2.8) (17.7)
(455.7) (2.8) (458.5)
Current
Bank overdrafts (22.5) – (22.5)
Loan notes (13.9) – (13.9)
Obligations under finance leases (1.7) (0.8) (2.5)
(38.1) (0.8) (38.9)
Cash and cash equivalents 43.4 – 43.4
Net debt (450.4) (3.6) (454.0)

87
Chairman’s statement / Chief Executive’s statement / Business review / Corporate responsibility / Board of Directors andExecutive Committee / Corporate governance / Remuneration report / Directors’ report / Group independent auditors’report / Accounts and notes / Unaudited other information / Holding company accounts and notes / Investor Relations
RetainedCapital earnings
redemption Share Revaluation and otherShare capital reserve premium reserve reserves Total
29 Share capital and reserves £m £m £m £m £m £m
Closing balance at 29 December 2003 (29.4) – (1,089.5) (5.0) 537.5 (586.4)
Total recognised income and expense for the period – – – – (170.0) (170.0)
Dividends – – – – 55.1 55.1
New share capital subscribed (0.3) – (12.2) – – (12.5)
Investment in shares for LTIP – – – – 6.2 6.2
Expense of the cost of the investment in LTIP shares – – – – (1.8) (1.8)
Movement on revaluation – – – 0.1 – 0.1
Purchase of minority interest – – – – 3.7 3.7
Closing balance at 2 January 2005 (29.7) – (1,101.7) (4.9) 430.7 (705.6)
Impact of adoption of IAS 32 and 39 – – – – (1.7) (1.7)
Opening balance at 3 January 2005 (29.7) – (1,101.7) (4.9) 429.0 (707.3)
Total recognised income and expense for the period – – – – (143.5) (143.5)
Dividends – – – – 60.2 60.2
New share capital subscribed (0.4) – (17.2) – – (17.6)
Buy-back shares cancelled 0.8 (0.8) – – 52.7 52.7
Investment in shares for LTIP – – – – 5.7 5.7
Expense of the cost of the investment in LTIP shares – – – – (3.9) (3.9)
At 1 January 2006 (29.3) (0.8) (1,118.9) (4.9) 400.2 (753.7)
Purchases of shares for LTIP are included in retained earnings and other reserves at £11.9 million (2 January 2005: £6.2 million) and under IFRS
are now classified as Treasury Shares, and are included in other reserves on the balance sheet.
Cumulative goodwill written off to reserves in respect of continuing businesses acquired prior to 1998 is £25.9 million (2004: £25.9 million).
The capital redemption reserve was created when the Company embarked on the share buy-back programme in 2005 and represents the nominal
value of the shares purchased and subsequently cancelled. The revaluation reserve relates to the revaluation surplus on property, plant and equipment
that has been revalued to fair value from its historical cost.

88
Chairman’s statement / Chief Executive’s statement / Business review / Corporate responsibility / Board of Directors andExecutive Committee / Corporate governance / Remuneration report / Directors’ report / Group independent auditors’report / Accounts and notes / Unaudited other information / Holding company accounts and notes / Investor Relations
Notes to the financial statementscontinued
2005 2005 2004 200430 Called up share capital Number £m Number £m
Authorised
Ordinary shares of 10p each 450,000,000 45.0 450,000,000 45.0
2005 2005 2004 2004Number £m Number £m
Allotted, called up and fully paid ordinary shares of 10p each
At beginning of the period 296,493,684 29.7 293,806,948 29.4
Issued on exercise of options 4,494,547 0.4 2,686,736 0.3
Shares bought back (8,209,685) (0.8) – –
At end of the period 292,778,546 29.3 296,493,684 29.7
£17.6 million was raised in 2005 (2004: £12.5 million) on the exercise of share options, including share premium of £17.2 million (2004: £12.2 million).
During the year 8,209,685 shares were bought back for a total consideration of £52.7 million.
Share option schemes
Under the terms of the Group’s various share option schemes, the following options to subscribe for ordinary shares were outstanding:
NumberScheme Grant dates of shares Exercise prices Exercise dates
Executive 1994-1996 24,744 294-438p Apr 1997-Sept 2006
Savings-related 1997-2002 289,459 314-428p Dec 2000-Jun 2006
Executive approved 1997-1999 126,104 426-620p May 2000-Dec 2009
Executive unapproved 1996-1999 307,087 353-620p Jan 1999-Dec 2009
TM Exec Approved 2000-2003 490,477 396-544p May 2003-Aug 2013
TM Exec Unapproved 2000-2003 3,649,808 396-544p May 2003-Aug 2013
An employee benefit trust administered by the trustee Walbrook Trustees (Guernsey) Limited holds shares of the Company for subsequent transfer
to employees under a restricted share plan. At 1 January 2006 the trust held 90,855 shares (2004: 90,855 shares), with a carrying value of £445,523
(2004: £445,523) and a market value of £528,776.10 (2004: £577,838) in the Company of which £nil (2004: £nil) had options granted over them under
the restricted share plan. Dividends on the shares are payable at an amount of 0.01p per share.
Long Term Incentive Plan 2004
The Long Term Incentive Plan 2004 (LTIP) was approved by shareholders at the AGM on 6 May 2004 and an employee benefit trust was established
in Jersey and is administered by the trustees, Bailhache Labesse Ltd. The trust holds shares of the Company for subsequent transfer to employees
under the terms of the LTIP as Performance Share awards or Matching Share awards when they vest on 3 June 2007 and 3 March 2008. As at
1 January 2006 the trust held 1,770,796 shares (2 January 2005: 977,124 shares) with a carrying value of £11,900,000 (2004: £6,200,000) and
a market value of £10,532,473 (2004: £6,214,511).
In addition, as part of the LTIP rules, the trustees purchased and held at 1 January 2006 167,323 deposited shares (2 January 2005: 104,938)
on behalf of employees and to which they are beneficially entitled.
The costs associated with each trust are included in the profit and loss account as they accrue. The lowest price of the shares during the year was 563.0p
(2004: 542.0p) and the highest price was 719.5p (2004: 670.0p). The share price as at 30 December 2005 was 573.0p (31 December 2004: 636.0p).
Shares held by the trust have been excluded from the weighted average number of shares used in the calculation of earnings per share.

89
Chairman’s statement / Chief Executive’s statement / Business review / Corporate responsibility / Board of Directors andExecutive Committee / Corporate governance / Remuneration report / Directors’ report / Group independent auditors’report / Accounts and notes / Unaudited other information / Holding company accounts and notes / Investor Relations
2005 200431 Share premium account £m £m
At beginning of the period 1,101.7 1,089.5
Premium on other ordinary shares allotted in the period 17.2 12.2
At end of the period 1,118.9 1,101.7
32 Operating lease commitments
Commitments under non-cancellable operating leases expiring:Vehicles, Vehicles,plant and plant and
Property equipment Property equipment2005 2005 2004 2004
£m £m £m £m
Within one year 2.1 2.6 2.1 2.6
Later than one and less than five years 7.6 7.1 7.0 8.3
After five years 11.0 – 11.9 –
20.7 9.7 21.0 10.9
33 Share-based payments
Executive Share Option scheme
The Company operates an existing share option scheme under which Executive Directors and senior management are granted options. However,
following the introduction of the Long Term Incentive Plan in 2004 no further options have been granted under this scheme.
Options are exercisable between three and ten years from the date of grant subject to the continued employment of the participant, and achievement
of earnings per share performance. In addition, 50% of each grant of an option to each individual is subject to a total shareholder return comparison
against the FTSE Mid-250 index of companies on the date of grant. The other 50% is subject to a comparison of total shareholder return with a group
of about 20 other media companies. No vesting of options is to take place unless the Company’s ranking is at least median.
Details of the share options outstanding and the weighted average exercise price of those options are as follows:Number Exercise
of options price
Options granted post 7 November 2002:
– 28 February 2003 505,689 395.5p
– 7 August 2003 1,285,368 488.6p
Movements in share options granted post 7 November 2002 during the period are as follows:
28 February 2003 7 August 20032005 2004 2005 2004
Options outstanding as at start of period 505,689 505,689 1,161,505 1,285,368
Granted during the period – – – –
Exercised during the period – – (30,699) (54,658)
Lapsed during the period – – (81,761) (69,205)
Options outstanding as at end of period 505,689 505,689 1,049,045 1,161,505
The weighted average share price at the date of exercise for share options exercised during the period was £6.03 (2004: £6.55).

90
Chairman’s statement / Chief Executive’s statement / Business review / Corporate responsibility / Board of Directors andExecutive Committee / Corporate governance / Remuneration report / Directors’ report / Group independent auditors’report / Accounts and notes / Unaudited other information / Holding company accounts and notes / Investor Relations
Notes to the financial statementscontinued
33 Share-based payments (continued)
The estimated fair values of the options granted are as follows:£
28 February 2003 375,145
7 August 2003 1,456,667
These fair values were calculated using a stochastic model (binomial). The inputs to the model were as follows:
Options granted28 February 7 August
2003 2003
Expected volatility 27% 28%
Expected life (years) 6 6
Expected dividend yield 4.42% 3.56%
Risk free rate 3.9% 4.2%
Expected volatility has been determined by calculating the historical volatility of the Company’s share price over a period prior to grant that is
commensurate with the length of the expected life of the option. The expected life of the options used in the model is a weighted average driven
by simulated share price movements in the model.
Long Term Incentive Plan
Under this scheme, which was first introduced in 2004, the Remuneration Committee can recommend the grant of awards of shares to any eligible
employee. Awards may take the form of either Performance Shares or Matching Shares. Full details of how the scheme operates are explained
on page 49 in the Remuneration Report.
The vesting of Performance Shares is conditional upon the achievement of two performance conditions. Up to 50% of an award can vest provided that
earnings per share growth exceeds a range of targets above inflation. The remaining 50% vests if targets measuring the Company’s total shareholder
return against the performance of a comparator group of companies are met.
Movements in Performance Shares and Matching Shares during the period are as follows:2005 2004
Performance Matching Performance Matching
Awards outstanding as at start of period 679,813 355,748 – –
Granted during the period 707,249 228,317 751,927 380,248
Lapsed during the period (19,221) (16,843) (72,114) (24,500)
Awards outstanding as at end of period 1,367,841 567,222 679,813 355,748
The estimated fair value of the Performance Share and Matching Share awards are as follows:2005 2004
£ £
Performance Shares 3,494,901 3,059,235
Matching Shares 1,469,266 1,881,075

91
Chairman’s statement / Chief Executive’s statement / Business review / Corporate responsibility / Board of Directors andExecutive Committee / Corporate governance / Remuneration report / Directors’ report / Group independent auditors’report / Accounts and notes / Unaudited other information / Holding company accounts and notes / Investor Relations
33 Share-based payments (continued)
These fair values were calculated using a stochastic model. The inputs to the model were as follows:
Awards granted2005 2004
Expected volatility 22.6% 26%
Expected life (years) 3 3
Expected dividend yield 2.9% 3.0%
Risk free rate 4.6% 5.1%
Expected volatility has been determined by calculating the historical volatility of the Company’s share price over the three-year period prior to grant.
As the awards vest three years from the date of grant the expected term is three years for both Performance and Matching Shares.
The Group recognised total expenses of £4.4 million (2004: £1.9 million) related to share-based payment transactions during the period.
34 Retirement benefit schemes
Defined benefit schemes
The Group operates a number of pension schemes. Two of the schemes, namely the Mirror Group Pension Scheme (the ‘Old Scheme’) and the
MGN Past Service Pension Scheme (the ‘Past Service Scheme’) cover the liabilities in respect of service up to 13 February 1992, the date when the
Old Scheme was closed. The Past Service Scheme was established to meet the liabilities for service up to 13 February 1992 for employees and
former employees who worked regularly on the production and distribution of Mirror Group’s newspapers, which are not satisfied by payments from
the Old Scheme and the Maxwell Communications Pension Plan or by the State.
These Schemes have formal actuarial valuations carried out regularly. The actuarial methods and assumptions used to calculate their assets and
liabilities vary according to actuarial and funding policies adjusted by the Trustees. The last formal valuation was carried out as at 31 December 2004 and
showed that the Schemes have insufficient assets to meet their liabilities for members’ benefits. In anticipation of this, agreement was reached with
the Trustees to pay £9.0 million in the Past Service Scheme in 2005 (2004: £3.5 million). For 2006, agreement has been reached with the Trustees
to pay £12.5 million. The next full actuarial valuation is due to be carried out as at 31 December 2007.
In addition to the above schemes, the Group operates a further eight final salary schemes. Formal valuations of schemes are carried out regularly,
the actuarial methods and assumptions used to calculate each scheme’s assets and liabilities varying according to the actuarial and funding policies
adopted by their respective trustees.
The most significant of the schemes are the Trinity Retirement Benefit Scheme (the ‘Trinity Scheme’), the MGN Pension Scheme (the ‘MGN Scheme’)
and the Midland Independent Newspapers Pension Scheme (the ‘MIN Scheme’), which together with the Old Scheme and the Past Service Scheme
represent over 95% of the aggregate market value. The last formal valuation of these schemes was undertaken on 30 June 2003 for the Trinity Scheme,
31 March 2004 for the MIN Scheme and 31 December 2004 for the MGN Scheme. These valuations showed deficits of £25.1 million, £30.8 million
and £55.9 million respectively. All of the schemes are being funded in accordance with the recommendations of the respective actuaries. In 2005,
the employer’s contribution rate to the MGN Scheme was 11.1%. However, this will increase in 2006 to 12%. The employer’s contribution rate
to the Trinity Scheme remained at 14% in 2005. The employer’s contribution rate to the MIN Scheme increased by 1% to 15% in 2005.
During 2002, the decision was taken to close entry to these three defined benefit (final salary pension) schemes to new employees with effect from
1 January 2003. All new employees are entitled to participate in a defined contribution plan, the Trinity Mirror Pension Plan.
Valuations have been performed in accordance with the requirements of IAS 19 with scheme liabilities calculated using a consistent projected unit
valuation method and compared to the market value of the schemes’ assets at 30 December 2005, the last day prior to the period end for which
such values were available.

92
Chairman’s statement / Chief Executive’s statement / Business review / Corporate responsibility / Board of Directors andExecutive Committee / Corporate governance / Remuneration report / Directors’ report / Group independent auditors’report / Accounts and notes / Unaudited other information / Holding company accounts and notes / Investor Relations
Notes to the financial statementscontinued
34 Retirement benefit schemes (continued)
Based on actuarial advice, the financial assumptions used in calculating the schemes’ liabilities and the total value of those liabilities under IAS 19 are:
Principal annual actuarial assumptions used:2005 2004
% %
Discount rate 4.75 5.30Inflation rate 2.80 2.75Expected return on scheme assets 4.00-7.30 5.10-7.80Expected rate of salary increases 4.10 4.00Pension increases:Pre 6 April 1997 pensions 2.80-5.00 2.75-5.00 Post 6 April 1997 pensions 2.80-3.30 2.75-3.25
Actuarial value of scheme liabilities £1,535.5m £1,371.6mActual return on scheme assets £179.7m £91.6m
Post-retirement mortality tables and Future life expectancy (years) for Future life expectancy (years) at age 65future life expectancies at age 65 a pensioner currently aged 65 for a non-pensioner currently aged 55
Male Female Male Female16.9-20.4 19.9-23.5 19.4-21.0 22.3-24.0
Defined benefit schemesThe amount included in the balance sheet arising from the Group’s obligations in respect of its defined benefit retirement schemes is as follows:
2005 2004£m £m
Net scheme liabilities:Present value of funded obligations (1,535.5) (1,371.6)Fair value of schemes’ assets 1,233.0 1,049.7Effect of asset ceiling (3.1) –
Schemes’ deficits (305.6) (321.9)
This amount is presented as follows:Current liabilities – –Non-current liabilities (305.6) (321.9)
(305.6) (321.9)
Movement not recognised in income statement:Actuarial gains 0.7 35.6Effect of asset ceiling (3.1) –
Total included in statement of recognised income and expense(before tax) (2.4) 35.6
Pension scheme assets include direct investments in the Company’s ordinary shares with a fair value of:
£nil £nil
The contributions made during the period totalled £46.9 million (53 weeks to 2 January 2005: £36.5 million). The Group expects to contributeapproximately £51 million to its defined benefit schemes in 2006.
The future contribution rates for the Group’s most significant schemes range from 12% to 20% of pensionable salaries. Under the above projected unit method of valuing scheme liabilities, the cost of the Group’s closed schemes will increase as the schemes’ membership status matures.

93
Chairman’s statement / Chief Executive’s statement / Business review / Corporate responsibility / Board of Directors andExecutive Committee / Corporate governance / Remuneration report / Directors’ report / Group independent auditors’report / Accounts and notes / Unaudited other information / Holding company accounts and notes / Investor Relations
34 Retirement benefit schemes (continued)
Amounts recognised in the income statement2005 2004
£m £m
Current service cost 28.6 32.6
Past service cost 1.3 0.6
Total included in staff costs 29.9 33.2
Expected return on scheme assets (72.9) (67.4)
Interest cost on pension schemes’ liabilities 71.2 70.3
Net finance (credit)/charge (1.7) 2.9
Total included in the income statement 28.2 36.1
2005 2004£m £m
Changes in the fair value of scheme assets are as follows:
Opening fair value of scheme assets 1,049.7 967.3
Expected return 72.9 67.4
Actuarial gains 106.8 24.2
Contributions by employer 46.9 36.5
Employee contributions 8.4 8.9
Benefits paid (51.7) (54.6)
Closing fair value of scheme assets 1,233.0 1,049.7
2005 2004£m £m
Changes in the present value of scheme liabilities are as follows:
Opening present value of scheme liabilities 1,371.6 1,325.2
Current service cost 28.6 32.6
Past service cost 1.3 0.6
Interest cost 71.2 70.3
Actuarial losses/(gains) 106.1 (11.4)
Employee contributions 8.4 8.9
Benefits paid (51.7) (54.6)
Closing present value of scheme liabilities 1,535.5 1,371.6
2005 2004£m £m
The fair value of scheme assets at the balance sheet date is analysed as follows:
UK equities 411.6 374.4
US equities 96.9 75.5
Other overseas equities 220.8 173.7
Property 0.3 0.3
Corporate bonds 180.9 67.5
Fixed interest gilts 126.9 283.9
Index-linked gilts 89.3 53.1
Cash 106.3 21.3
Closing fair value of scheme assets 1,233.0 1,049.7

94
Chairman’s statement / Chief Executive’s statement / Business review / Corporate responsibility / Board of Directors andExecutive Committee / Corporate governance / Remuneration report / Directors’ report / Group independent auditors’report / Accounts and notes / Unaudited other information / Holding company accounts and notes / Investor Relations
Notes to the financial statementscontinued
34 Retirement benefit schemes (continued)2005 2004
% %
The expected rates of return on plan assets at the balance sheet date is analysed as follows:
Equities 8.25 8.50
Property 5.90 6.20
Corporate bonds 4.75 5.30
Fixed interest gilts 4.10 4.50
Index-linked gilts 4.00 4.50
Cash 3.80 3.80
Defined contribution schemes
The Group operates two defined contribution retirement benefit schemes for qualifying employees, one of which is closed to new members. The assets
of the schemes are held separately from those of the Group in funds under the control of trustees.
The total cost charged to income of £0.8 million (2004: £0.5 million) represents contributions payable to these schemes by the Group at rates specified
in the scheme rules. As at 1 January 2006, contributions of £nil million (2 January 2005: £nil million) due in respect of the reporting period then ended
had not been paid over to the schemes.2005 2004
£m £m
Amounts recognised in the income statement:
Current service cost 0.8 0.5
35 Related party transactions
The immediate parent and controlling party of the Group is Trinity Mirror plc. Transactions between the Company and its subsidiaries, which are
related parties of the Company, have been eliminated on consolidation and are not disclosed in this note. Details of other related party transactions
are disclosed below.
Trading transactions
The Group traded with the following associated undertakings and joint ventures: The Press Association Limited, All 4U Limited, fish4 Limited,
Scottish Opinion Limited and The Betting Site Limited. This trade generated sales of £0.2 million (2004: £nil million) and costs for services provided
of £2.7 million (2004: £1.6 million). Financial support of £0.9 million (2004: £1.6 million) was provided during the period. The amounts outstanding
at the year end amounted to £0.2 million (2004: £nil million) owed by associated undertakings and £nil million (2004: £nil million) owed to associated
undertakings and joint ventures.
Sales of goods and services to related parties were made at the Group’s usual list prices, less average volume discounts. Purchases were made at market
prices discounted to reflect volume purchase and the relationship between the parties. Any outstanding amounts will be settled by cash payment.
Compensation of key management personnel
Key management of the Group has been defined as the members of the Executive Committee and their remuneration during the year was as follows:
2005 2004£m £m
Short-term employee benefits 4.1 4.3
Post employment benefits 0.6 0.6
Termination benefits – 0.8
Share-based payments 1.7 0.9
6.4 6.6
The remuneration of directors and other key executives is determined by the Remuneration Committee having regard to competitive market position
and performance of individuals. Further information regarding the remuneration of individual directors is provided in the Remuneration Report
on pages 48 to 56.

95
Chairman’s statement / Chief Executive’s statement / Business review / Corporate responsibility / Board of Directors andExecutive Committee / Corporate governance / Remuneration report / Directors’ report / Group independent auditors’report / Accounts and notes / Unaudited other information / Holding company accounts and notes / Investor Relations
36 Acquisitions of subsidiaries
During the 52 weeks to 1 January 2006 the Group acquired the following companies:Share capital Cost of
acquired acquisitionCompany Principal activity Date of acquisition % £m
Smart Media Services Limited On-line new property advertising 18 July 2005 100 16.8
Financial Jobs Online Limited On-line recruitment services 15 August 2005 100 10.6
the hotgroup plc Recruitment services 25 October 2005 100 56.4
Paldonsay Limited On-line recruitment services 25 November 2005 100 3.6
The net assets acquired in the transactions, and the goodwill arising, are as follows:Acquirees’
carrying amount Fair valuebefore combination adjustments Fair value
Net assets acquired £m £m £m
Property, plant and equipment 1.8 (0.5) 1.3
Current assets 12.2 (1.0) 11.2
Cash and cash equivalents (0.9) – (0.9)
Current liabilities (9.8) (2.9) (12.7)
Obligations under finance leases – (0.1) (0.1)
Borrowings (4.5) 0.1 (4.4)
Non-current liabilities (1.2) (12.1) (13.3)
(2.4) (16.5) (18.9)
Intangible assets 39.5
Goodwill 66.8
Total consideration 87.4
These acquisitions have been aggregated as they are considered individually immaterial to the Group’s results.
Fair value adjustments reflect the assignment of the acquirees’ accounting policies with those of the Group.
£m
Satisfied by:
Cash consideration paid (78.1)
Directly attributable acquisition costs(1) (3.1)
Total cash paid (81.2)
Deferred consideration (5.5)
Loan notes (0.7)
Total consideration (87.4)
(1)Directly attributable acquisition costs included in the cost of acquisition are the direct legal and accounting costs incurred in developing the acquisitioncontracts and performing due diligence activities.
Total expenditure on acquisitions of £92.7 million comprises £87.4 million total consideration detailed above, acquired borrowings of £4.4 million
and cash and cash equivalents of £0.9 million.

96
Chairman’s statement / Chief Executive’s statement / Business review / Corporate responsibility / Board of Directors andExecutive Committee / Corporate governance / Remuneration report / Directors’ report / Group independent auditors’report / Accounts and notes / Unaudited other information / Holding company accounts and notes / Investor Relations
Notes to the financial statementscontinued
36 Acquisitions of subsidiaries (continued)
The goodwill arising on the acquisitions is attributed to the anticipated profitability and market share of the acquirees in their new markets and the
anticipated synergies with other acquisitions.
Net cash outflow arising on acquisition:
Cash consideration paid (81.2)
Cash and cash equivalents (0.9)
Borrowings acquired (4.4)
(86.5)
Contributionto Group postRevenue and profit impact
acquisition(included in continuing operations) £m
Revenue 9.2
Operating loss(1) (3.1)
(1)Operating loss is stated after amortisation costs of £3.3 million and non-recurring severance costs of £1.0 million.
If the acquisitions had been completed on the first day of the financial period, Group revenues for the period would have been £1,170.4 million and
Group operating profit would have been £249.1 million.
The initial accounting for acquisitions has not been finalised, due to uncertainties regarding the valuation of acquired liabilities and provisions at the
acquisition date. These uncertainties are expected to be resolved within one year of the date of each acquisition.
37 Explanation of transition to IFRS
This is the first period that the Group has presented its financial statements under IFRS. The following disclosures are required in the period of
transition. The last financial statements under UK GAAP were for the 53 weeks ended 2 January 2005 and the date of transition to IFRS was therefore
29 December 2003.
Differences between IFRS and UK GAAP
Presentation – IAS 1, Presentation of Financial Statements
The presentation format of IFRS is different from UK GAAP and the illustrative financial information herein is designed to assist the reader
to understand these changes.
Dividends – IAS 10, Events After the Balance Sheet Date
Dividends proposed will be disclosed as a ‘Non-adjusting Event after the Balance Sheet Date’ under IAS 10, Events after the Balance Sheet Date.
Under IFRS dividends are not recognised as liabilities (IAS 37, Provisions, Contingent Liabilities and Contingent Assets) until they are appropriately
approved and are no longer at the discretion of the directors. Accordingly the 2004 proposed dividend amount under UK GAAP is removed from
the IFRS accounts.
Capitalised Leases – IAS 17, Leases
This standard has a wider scope than UK GAAP and has resulted in a small number of short leasehold buildings being capitalised on the Balance Sheet.

97
Chairman’s statement / Chief Executive’s statement / Business review / Corporate responsibility / Board of Directors andExecutive Committee / Corporate governance / Remuneration report / Directors’ report / Group independent auditors’report / Accounts and notes / Unaudited other information / Holding company accounts and notes / Investor Relations
37 Explanation of transition to IFRS (continued)
Employee Option and Performance Share Schemes – IFRS 2, Share-based Payments
All transactions within the scope of IFRS 2 are valued based on the fair value of the option or award at grant date and expensed to the Income
Statement over the vesting period of the scheme.
Pension costs – IAS 19, Employee Benefits
The main difference between IFRS and UK GAAP is the measurement of scheme assets. The IFRS valuation is determined at bid rather than mid-
market price thus increasing the Group’s pension scheme liabilities. In addition, there is a presentational difference with the pension scheme liability
now being shown gross of its deferred tax asset.
Holiday pay – IAS 19, Employee Benefits
IAS 19 requires the recording of a holiday pay accrual. This has been included in the opening IFRS Balance Sheet at 29 December 2003. Although
it is expected that this adjustment will be relatively stable in magnitude from one year to another, when comparing the year end and interim periods
there is a balance sheet movement and income statement impact.
Goodwill – IAS 38, Intangible Assets
Under IAS 38 goodwill is not amortised. Instead it is subject to an annual impairment review. An adjustment has been made to remove the goodwill
amortisation charge.
Associates – IAS 28, Investments in Associates
IFRS requires the share of profit of Associates to be shown post tax (IAS 1). Under UK GAAP this amount is shown before tax with the tax charge
included as part of the Group tax charge.
Deferred Tax – IAS 12, Income Taxes
IAS 12 requires a deferred tax liability to be recognised on all temporary timing differences. A potential liability arises from the difference between the
fair value attributed to publishing rights and titles from previous acquisitions. As the Group has elected, under IFRS 1, not to restate prior acquisitions
at transition date to an IFRS 3 basis then recognition is against equity reserves rather than against goodwill. Also included in this adjustment is the
liability for gains deferred by rollover and held-over relief.
Cash flow
The differences between UK GAAP and IFRS cash flows relate to the reclassification of some of the Group’s UK GAAP operating lease payments
as finance lease payments under IFRS and the IAS 19 finance costs not charged to the Group’s income statement under UK GAAP. There is no impact
on the final cash position nor the movement in the period. The IFRS cash flow with comparative information is presented on page 62.
The reconciliations of equity and profit below, together with the explanations of the changes, are provided to facilitate the understanding of changes
arising from the adoption of IFRS.

98
Chairman’s statement / Chief Executive’s statement / Business review / Corporate responsibility / Board of Directors andExecutive Committee / Corporate governance / Remuneration report / Directors’ report / Group independent auditors’report / Accounts and notes / Unaudited other information / Holding company accounts and notes / Investor Relations
Notes to the financial statementscontinued
37 Explanation of transition to IFRS (continued)
Reconciliation of profit for the 53 weeks ended 2 January 2005Effect of
UK GAAP in transitionIFRS format to IFRS IFRS
£m £m £m
Revenue 1,141.7 – 1,141.7
Cost of sales (533.6) – (533.6)
Gross profit 608.1 – 608.1
Distribution costs (140.5) – (140.5)
Administrative expenses:
Non-recurring (12.2) – (12.2)
Amortisation of intangibles (0.4) 0.4 –
Other (214.1) 0.7 (213.4)
Share of results of associates 1.3 (0.5) 0.8
Operating profit 242.2 0.6 242.8
IAS 19 finance charge (2.7) (0.2) (2.9)
Other finance costs (34.9) (0.4) (35.3)
Profit on disposal of subsidiary undertakings 2.5 – 2.5
Profit before tax 207.1 – 207.1
Tax (63.0) 1.0 (62.0)
Profit for the period 144.1 1.0 145.1
Attributable to:
Equity holders of the parent 144.0 1.0 145.0
Minority interests 0.1 – 0.1
144.1 1.0 145.1

99
Chairman’s statement / Chief Executive’s statement / Business review / Corporate responsibility / Board of Directors andExecutive Committee / Corporate governance / Remuneration report / Directors’ report / Group independent auditors’report / Accounts and notes / Unaudited other information / Holding company accounts and notes / Investor Relations
37 Explanation of transition to IFRS (continued)
Reconciliation of equity at 29 December 2003 (date of transition to IFRS)Effect of
UK GAAP in transitionIFRS format to IFRS IFRS
£m £m £m
Non-current assets
Goodwill 6.2 – 6.2
Other intangible assets 1,616.2 – 1,616.2
Property, plant and equipment 401.0 2.5 403.5
Investments in associates 9.8 – 9.8
Deferred tax asset 11.4 107.8 119.2
2,044.6 110.3 2,154.9
Current assets
Inventories 7.0 – 7.0
Available-for-sale financial assets 1.1 – 1.1
Trade and other receivables 159.8 – 159.8
Cash and cash equivalents 34.3 – 34.3
202.2 – 202.2
Total assets 2,246.8 110.3 2,357.1
Non-current liabilities
Borrowings (554.9) – (554.9)
Obligations under finance leases (22.8) (3.2) (26.0)
Retirement benefit obligation (248.1) (109.8) (357.9)
Deferred tax liabilities (67.5) (476.6) (544.1)
Long-term provisions (12.7) (0.3) (13.0)
(906.0) (589.9) (1,495.9)
Current liabilities
Borrowings (57.3) – (57.3)
Trade and other payables (222.6) 37.1 (185.5)
Current tax liabilities (26.9) – (26.9)
Obligations under finance leases (4.4) (0.7) (5.1)
(311.2) 36.4 (274.8)
Total liabilities (1,217.2) (553.5) (1,770.7)
Net assets 1,029.6 (443.2) 586.4
Equity
Share capital (29.4) – (29.4)
Share premium account (1,089.5) – (1,089.5)
Revaluation reserve (5.0) – (5.0)
Retained earnings and other reserves 98.0 443.2 541.2
Equity attributable to equity holders of the parent (1,025.9) 443.2 (582.7)
Minority interest (3.7) – (3.7)
Total equity (1,029.6) 443.2 (586.4)

100
Chairman’s statement / Chief Executive’s statement / Business review / Corporate responsibility / Board of Directors andExecutive Committee / Corporate governance / Remuneration report / Directors’ report / Group independent auditors’report / Accounts and notes / Unaudited other information / Holding company accounts and notes / Investor Relations
Notes to the financial statementscontinued
37 Explanation of transition to IFRS (continued)
Reconciliation of equity at 2 January 2005 (date of last UK GAAP financial statements)Effect of
UK GAAP in transitionIFRS format to IFRS IFRS
£m £m £m
Non-current assets
Goodwill 5.6 0.4 6.0
Other intangible assets 1,579.9 – 1,579.9
Property, plant and equipment 385.7 2.1 387.8
Investments in associates 7.5 – 7.5
Deferred tax asset 9.6 96.9 106.5
1,988.3 99.4 2,087.7
Current assets
Inventories 6.7 – 6.7
Available-for-sale financial assets 1.3 – 1.3
Trade and other receivables 147.7 – 147.7
Cash and cash equivalents 43.4 – 43.4
199.1 – 199.1
Total assets 2,187.4 99.4 2,286.8
Non-current liabilities
Borrowings (440.8) – (440.8)
Obligations under finance leases (14.9) (2.8) (17.7)
Retirement benefit obligation (222.5) (99.4) (321.9)
Deferred tax liabilities (64.9) (476.0) (540.9)
Long-term provisions (7.8) (0.3) (8.1)
(750.9) (578.5) (1,329.4)
Current liabilities
Borrowings (36.4) – (36.4)
Trade and other payables (216.5) 41.5 (175.0)
Current tax liabilities (33.5) 0.3 (33.2)
Obligations under finance leases (1.7) (0.8) (2.5)
Short-term provisions (4.7) – (4.7)
(292.8) 41.0 (251.8)
Total liabilities (1,043.7) (537.5) (1,581.2)
Net assets 1,143.7 (438.1) 705.6
Equity
Share capital (29.7) – (29.7)
Share premium account (1,101.7) – (1,101.7)
Revaluation reserve (4.9) – (4.9)
Retained earnings and other reserves (7.4) 438.1 430.7
Equity attributable to equity holders of the parent (1,143.7) 438.1 (705.6)
Total equity (1,143.7) 438.1 (705.6)

101
Chairman’s statement / Chief Executive’s statement / Business review / Corporate responsibility / Board of Directors andExecutive Committee / Corporate governance / Remuneration report / Directors’ report / Group independent auditors’report / Accounts and notes / Unaudited other information / Holding company accounts and notes / Investor Relations
38 Adoption of IAS 32 and 39
Reconciliation of equity at 3 January 2005 from opening position to post IAS 32 and 39 adoption
The Group adopted IAS 32 and 39 on 3 January 2005 as permitted under the exemptions of IFRS 1. The impact was limited to the revaluation of
available-for-sale financial assets to fair value from historical cost and accounting for the Group’s private placement loan notes and associated cross-
currency interest rate swaps, which are brought onto the balance sheet at fair value. Under UK GAAP these were treated as a hedge and the related
borrowings were recorded at the future swaps exchange rate. IAS 39 has specific accounting rules for the treatment of hedges previously accounted
for under UK GAAP, which on adoption of the Standard are not accounted for using hedge accounting on an ongoing basis under IFRS. The related
borrowings are now recognised at an ‘adjusted’ amortised cost. This adjustment arises from the adoption date recognition rules where the opening
position is recognised as an accounting hedge. Subsequent measurements will not be under IAS 39 hedge accounting rules but instead will amortise
the adjusted cost at the effective interest rate.IFRS before IFRS afteradoption of Adoption of adoption of
IAS 32 and 39 IAS 32 and 39 IAS 32 and 39£m £m £m
Non-current assetsGoodwill 6.0 – 6.0Other intangible assets 1,579.9 – 1,579.9Property, plant and equipment 387.8 – 387.8Investments in associates 7.5 – 7.5Deferred tax asset 106.5 – 106.5
2,087.7 – 2,087.7Current assetsInventories 6.7 – 6.7Available-for-sale financial assets 1.3 2.4 3.7Trade and other receivables 147.7 – 147.7Cash and cash equivalents 43.4 – 43.4
199.1 2.4 201.5Total assets 2,286.8 2.4 2,289.2Non-current liabilitiesBorrowings (440.8) 86.3 (354.5)Obligations under finance leases (17.7) – (17.7)Retirement benefit obligation (321.9) – (321.9)Deferred tax liabilities (540.9) (0.7) (541.6)Long-term provisions (8.1) – (8.1)Derivative financial instruments – (87.2) (87.2)
(1,329.4) (1.6) (1,331.0)Current liabilitiesBorrowings (36.4) – (36.4)Trade and other payables (175.0) 0.9 (174.1)Current tax liabilities (33.2) – (33.2)Obligations under finance leases (2.5) – (2.5)Short-term provisions (4.7) – (4.7)
(251.8) 0.9 (250.9)Total liabilities (1,581.2) (0.7) (1,581.9)Net assets 705.6 1.7 707.3
EquityShare capital (29.7) – (29.7)Share premium account (1,101.7) – (1,101.7)Revaluation reserve (4.9) – (4.9)Retained earnings and other reserves 430.7 (1.7) 429.0Equity attributable to equity holders of the parent (705.6) (1.7) (707.3)Total equity (705.6) (1.7) (707.3)

102
Chairman’s statement / Chief Executive’s statement / Business review / Corporate responsibility / Board of Directors andExecutive Committee / Corporate governance / Remuneration report / Directors’ report / Group independent auditors’report / Accounts and notes / Unaudited other information / Holding company accounts and notes / Investor Relations
Unaudited other information
(i) Reconciliation of Group statutory results to like-for-like results
Acquisitions
Statutory Non-recurring IAS 39 Like-for-likeresult items Result Amortisation impact result
52 weeks ended 1 January 2006 £m £m(1) £m(2) £m(2) £m(3) £m
Revenue 1,122.0 – (9.2) – – 1,112.8
Operating profit 245.4 2.7 (1.2) 3.3 – 250.2
Profit before tax 209.5 2.7 (1.2) 3.3 6.6 220.9
pence pence pence pence pence pence
Underlying earnings per share 50.5 – (0.3) 0.8 1.6 52.6
Non-recurring items (0.2) 0.2 – – – –
Earnings per share – basic 50.3 0.2 (0.3) 0.8 1.6 52.6
Acquisitions
Statutory Non-recurring Week 53 Like-for-likeresult items Result Amortisation effect result
52 weeks ended 2 January 2005 £m £m(1) £m(2) £m(2) £m(4) £m
Revenue 1,141.7 – – – (14.2) 1,127.5
Operating profit 242.8 12.2 – – (8.9) 246.1
Profit before tax 207.1 9.7 – – (8.3) 208.5
pence pence pence pence pence pence
Underlying earnings per share 51.2 – – – (1.9) 49.3
Non-recurring items (2.0) 2.0 – – – –
Earnings per share – basic 49.2 2.0 – – (1.9) 49.3
(1)Details of non-recurring items are set out in note 7 to the Group financial statements on page 73 and include the profit on disposal of subsidiary
undertakings in 2004.(2)Details of acquisitions are set out in note 36 to the Group financial statements on page 95.(3)Impact of fair value, exchange rate, and amortisation adjustments on borrowings and associated financial instruments accounted for under IAS 39.
References to IAS 39 throughout this document shall have the same meaning.(4)2004 was a 53-week trading period compared to 52 weeks in 2005.

103
Chairman’s statement / Chief Executive’s statement / Business review / Corporate responsibility / Board of Directors andExecutive Committee / Corporate governance / Remuneration report / Directors’ report / Group independent auditors’report / Accounts and notes / Unaudited other information / Holding company accounts and notes / Investor Relations
2005 2004 2003(3) 2002(2) 2001(1)
(restated) (restated)(ii) Group five year summary £m £m £m £m £m
Income statement
Revenue 1,122 1,142 1,095 1,089 1,131
Operating profit before non-recurring items 248 255 213 191 191
Operating profit after non-recurring items
Continuing operations 247 242 101 59 23
Acquisitions (3) – – – –
Share of results of associates 1 1 1 2 –
245 243 102 61 23
IAS 19 finance credits/(charges) 2 (3) (3) 6 11
IAS 39 impact (7) – – – –
Other finance costs (31) (35) (38) (43) (49)
Profit before disposal of businesses and tax 209 205 61 24 (15)
Sale or termination of businesses – 2 – 2 1
Profit before tax 209 207 61 26 (14)
Tax (62) (62) (47) (46) (42)
Profit for the period 147 145 14 (20) (56)
Pence Pence Pence Pence Pence
Underlying earnings per share 50.5 51.2 41.1 37.1 36.5
Non-recurring items (0.2) (2.0) (36.5) (43.7) (55.6)
Earnings per share – basic 50.3 49.2 4.6 (6.6) (19.1)
Dividends per share 21.9 20.2 18.3 17.6 17.6
£m £m £m £m £m
Balance sheet
Intangible assets 1,689 1,585 1,622 1,725 1,867
Property, plant and equipment 387 388 401 390 390
Other assets and liabilities (829) (813) (392) (309) (177)
1,247 1,160 1,631 1,806 2,080
Less net borrowings (493) (454) (605) (666) (735)
Net assets 754 706 1,026 1,140 1,345
Total equity (754) (706) (1,026) (1,140) (1,345)
2001, 2002 and 2003 are stated in accordance with UK GAAP, and 2004 and 2005 are in accordance with IFRS.(1)2001 has been restated for the adoption of FRS 17 Retirement Benefits.(2)2002 includes the restatement of ESOP shares in accordance with UITF Accounting for ESOP Trusts.(3)2003 includes a restatement to reflect Arrow Interactive revenues net of commissions payable to third parties as revenue (previously disclosed
as operating expenses).

104
Chairman’s statement / Chief Executive’s statement / Business review / Corporate responsibility / Board of Directors andExecutive Committee / Corporate governance / Remuneration report / Directors’ report / Group independent auditors’report / Accounts and notes / Unaudited other information / Holding company accounts and notes / Investor Relations
Unaudited other informationcontinued
(iii) Indicative view of UK GAAP*
Reconciliation of profit for the 52 weeks to 1 January 2006 from IFRS to UK GAAP applicable at 2 January 2005
Adjust to IndicativeIFRS UK GAAP UK GAAP 2004
£m £m £m £m
Revenue 1,122.0 – 1,122.0 1,141.7
Cost of sales (538.8) – (538.8) (533.6)
Gross profit 583.2 – 583.2 608.1
Distribution costs (126.5) – (126.5) (140.5)
Administrative expenses:
Non-recurring (2.7) – (2.7) (12.2)
Amortisation of intangible assets (3.3) (0.4)(a) (3.7) (0.4)
Other (206.1) – (b) (206.1) (214.1)
Share of results of associates 0.8 0.5 (c) 1.3 1.3
Operating profit 245.4 0.1 245.5 242.2
IAS 19 finance credit/(charge) 1.7 0.1 1.8 (2.7)
IAS 39 impact (6.6) 6.6 (d) – –
Other finance costs (31.0) 0.3 (e) (30.7) (34.9)
Profit on disposals of subsidiary undertaking – – – 2.5
Profit before tax 209.5 7.1 216.6 207.1
Tax (62.6) (2.4) (f) (65.0) (63.0)
Profit for the period 146.9 4.7 151.6 144.1
Attributable to:
Equity holders of the parent 146.9 4.7 151.6 144.0
Minority interest – – – 0.1
146.9 4.7 151.6 144.1
*United Kingdom Generally Accepted Accounting Practice applicable at 2 January 2005.
The principal adjustments arising in the reconciliation from IFRS to UK GAAP are as follows:
(a)Amortisation of goodwill not permitted under IFRS.(b)A reduction in the Group’s share-based payments charge of £0.5 million under UK GAAP is offset by an increase in operating lease rentals
of £0.5 million on property leases capitalised under IFRS but not under UK GAAP.(c)The Group’s share of results of associates is shown net of tax under IFRS and gross of tax under UK GAAP.(d)Reverses the IAS 39 impact on borrowings that arises under IFRS.(e)Reflects the interest arising on certain property leases capitalised under IFRS but not under UK GAAP.(f)Corporation tax impact of adjustments from IFRS to UK GAAP.
Differences between UK GAAP applicable at 2 January 2005 and UK GAAP as at the date of this report are set out in the accounting policies note
of the Holding Company on page 109.

105
Chairman’s statement / Chief Executive’s statement / Business review / Corporate responsibility / Board of Directors andExecutive Committee / Corporate governance / Remuneration report / Directors’ report / Group independent auditors’report / Accounts and notes / Unaudited other information / Holding company accounts and notes / Investor Relations
(iii) Indicative view of UK GAAP* (continued)
Reconciliation of equity at 1 January 2006 from IFRS to UK GAAP applicable at 2 January 2005Adjust to Indicative
IFRS UK GAAP UK GAAP 2004£m £m £m £m
Non-current assetsGoodwill 72.8 (0.8)(a) 72.0 5.6Other intangible assets 1,616.1 – 1,616.1 1,579.9Property, plant and equipment 387.3 (1.8)(b) 385.5 385.7Investments in associates 8.6 – 8.6 7.5Deferred tax asset 97.9 (92.0)(c) 5.9 9.6
2,182.7 (94.6) 2,088.1 1,988.3Current assetsInventories 7.2 – 7.2 6.7Available-for-sale financial assets 0.5 – 0.5 1.3Trade and other receivables 150.9 – 150.9 147.7Cash and cash equivalents 33.2 – 33.2 43.4
191.8 – 191.8 199.1
Total assets 2,374.5 (94.6) 2,279.9 2,187.4
Non-current liabilitiesBorrowings (392.0) (49.1)(d) (441.1) (440.8)Obligations under finance leases (15.6) 2.3 (e) (13.3) (14.9)Retirement benefit obligations (305.6) 95.5 (c) (210.1) (222.5)Deferred tax liabilities (547.2) 475.9 (f) (71.3) (64.9)Long-term provisions (12.2) 0.6 (11.6) (7.8)Derivative financial instruments (56.6) 56.6 (d) – –
(1,329.2) 581.8 (747.4) (750.9)
Current liabilitiesBorrowings (58.7) – (58.7) (36.4)Trade and other payables (183.0) (45.6)(g) (228.6) (216.5)Current tax liabilities (37.5) (2.1) (39.6) (33.5)Obligations under finance leases (2.8) 0.8 (e) (2.0) (1.7)Short-term provisions (9.6) – (9.6) (4.7)
(291.6) (46.9) (338.5) (292.8)
Total liabilities (1,620.8) 534.9 (1,085.9) (1,043.7)
Net assets 753.7 440.3 1,194.0 (1,143.7)
EquityShare capital (29.3) – (29.3) (29.7)Share premium account (1,118.9) – (1,118.9) (1,101.7)Revaluation reserve (4.9) – (4.9) (4.9)Capital redemption reserve (0.8) – (0.8) –Retained earnings and other reserves 400.2 (440.3) (40.1) (7.4)
Total equity (753.7) (440.3) (1,194.0) (1,143.7)
*United Kingdom Generally Accepted Accounting Practice applicable at 2 January 2005.
The principal adjustments arising in the reconciliation from IFRS to UK GAAP are as follows:
(a)Adjustment for amortisation of goodwill in 2004 and 2005 not permitted under IFRS.(b)Adjustment for leases capitalised under IFRS but not under UK GAAP, representing leasehold properties.(c)The deferred tax asset arising on retirement benefit obligations is shown separately under IFRS but is netted against the obligations under UK GAAP.(d)Effect of IAS 39 on the fair value of borrowings and derivative financial instruments.(e)Adjustment for leasehold properties capitalised under IFRS but not under UK GAAP.(f)Removes the deferred tax liability of £474 million on intangibles arising under IFRS.(g)Relates principally to the £45.4 million 2005 final dividend, which under IFRS is not recognised as a liability until approved by the Board.

106
Chairman’s statement / Chief Executive’s statement / Business review / Corporate responsibility / Board of Directors andExecutive Committee / Corporate governance / Remuneration report / Directors’ report / Group independent auditors’report / Accounts and notes / Unaudited other information / Holding company accounts and notes / Investor Relations
Unaudited other informationcontinued
2005 2004(iv) Analysis of net debt (excluding IAS 39) £m £m
Cash at bank in hand 33.2 43.4
Bank overdrafts (17.9) (22.5)
Net cash balances 15.3 20.9
Debt due within one year (40.8) (13.9)
Debt due after one year (441.1) (440.8)
Finance leases (18.4) (20.2)
Bank loans, bank notes and finance leases (500.3) (474.9)
Net debt (485.0) (454.0)
This note summarises net debt on an IFRS comparable basis excluding the impact of IAS 39 fair value, exchange rate and amortisation adjustments,
illustrated in note 28 to the financial statements.
Reconciliation of net cash flow to movement in net debt
for the 52 weeks ended 1 January 2006 (53 weeks ended 2 January 2005)2005 2004
£m £m
Increase/(decrease) in cash in the year (5.6) 5.9
Cash flow from movement in debt and leasing finance (25.4) 148.8
Change in net debt resulting from cash flows (31.0) 154.7
Opening net debt (450.4) (605.1)
Adjustment on transition to IFRS (3.6) –
Closing net debt (485.0) (450.4)

107
Chairman’s statement / Chief Executive’s statement / Business review / Corporate responsibility / Board of Directors andExecutive Committee / Corporate governance / Remuneration report / Directors’ report / Group independent auditors’report / Accounts and notes / Unaudited other information / Holding company accounts and notes / Investor Relations
We have audited the individual Company financial statements of Trinity
Mirror plc for the 52 weeks ended 1 January 2006 which comprise the
balance sheet and the related notes 1 to 16. These individual company
financial statements have been prepared under the accounting policies
set out therein.
The corporate governance statement and the directors’ remuneration report
are included in the group annual report of Trinity Mirror plc for the 52 weeks
ended 1 January 2006. We have reported separately on the group financial
statements of Trinity Mirror plc for the 52 weeks ended 1 January 2006 and
on the information in the directors’ remuneration report that is described
as having been audited.
This report is made solely to the company’s members, as a body, in
accordance with section 235 of the Companies Act 1985. Our audit work
has been undertaken so that we might state to the company’s members
those matters we are required to state to them in an auditors’ report and
for no other purpose. To the fullest extent permitted by law, we do not
accept or assume responsibility to anyone other than the company and
the company’s members as a body, for our audit work, for this report,
or for the opinions we have formed.
Respective responsibilities of directors and auditors
The directors’ responsibilities for preparing the annual report and the
individual company financial statements in accordance with applicable
law and United Kingdom Accounting Standards (United Kingdom
Generally Accepted Accounting Practice) are set out in the statement
of directors’ responsibilities.
Our responsibility is to audit the individual company financial statements in
accordance with relevant United Kingdom legal and regulatory requirements
and International Standards on Auditing (UK and Ireland).
We report to you our opinion as to whether the individual company financial
statements give a true and fair view in accordance with the relevant financial
reporting framework and whether the individual company financial statements
have been properly prepared in accordance with the Companies Act 1985.
We report to you if, in our opinion, the directors’ report is not consistent with
the individual company financial statements. We also report to you if the
company has not kept proper accounting records, if we have not received
all the information and explanations we require for our audit, or if information
specified by law regarding directors’ remuneration and other transactions
is not disclosed.
We read the directors’ report and the other information contained in the
annual report for the above year as described in the contents section and
consider the implications for our report if we become aware of any apparent
misstatements or material inconsistencies with the individual Company
financial statements.
Basis of audit opinion
We conducted our audit in accordance with International Standards on
Auditing (UK and Ireland) issued by the Auditing Practices Board. An audit
includes examination, on a test basis, of evidence relevant to the amounts
and disclosures in the individual company financial statements. It also
includes an assessment of the significant estimates and judgements made
by the directors in the preparation of the individual company financial
statements, and of whether the accounting policies are appropriate to the
company’s circumstances, consistently applied and adequately disclosed.
We planned and performed our audit so as to obtain all the information and
explanations which we considered necessary in order to provide us with
sufficient evidence to give reasonable assurance that the individual company
financial statements are free from material misstatement, whether caused by
fraud or other irregularity or error. In forming our opinion we also evaluated
the overall adequacy of the presentation of information in the individual
company financial statements.
Opinion
In our opinion:
• the individual Company financial statements give a true and fair
view, in accordance with United Kingdom Generally Accepted
Accounting Practice, of the state of the company's affairs as
at 1 January 2006; and
• the individual Company financial statements have been properly
prepared in accordance with the Companies Act 1985.
Deloitte & Touche LLP
Chartered Accountants and Registered Auditors
London
2 March 2006
Independent auditors’ report to the members of Trinity Mirror plc

108
Chairman’s statement / Chief Executive’s statement / Business review / Corporate responsibility / Board of Directors andExecutive Committee / Corporate governance / Remuneration report / Directors’ report / Group independent auditors’ report /Accounts and notes / Unaudited other information / Holding company accounts and notes / Investor Relations
Holding company balance sheetat 1 January 2006 (2 January 2005)
2005 2004£m £m
notes (restated)*
Fixed assets
Tangible fixed assets 4 0.2 0.2
Investments 5 2,071.9 2,069.1
Deferred tax asset 0.8 –
2,072.9 2,069.3
Current assets
Debtors due within one year 6 1,489.1 1,789.6
Investment 7 – 1.3
Cash at bank and in hand 1.4 1.5
1,490.5 1,792.4
Creditors: amounts falling due within one year
Bank loans, loan notes and overdrafts 8 (48.4) (9.7)
Other creditors 9 (1,351.8) (2,074.7)
(1,400.2) (2,084.4)
Net current assets 90.3 (292.0)
Total assets less current liabilities 2,163.2 1,777.3
Creditors: amounts falling due after more than one year
Bank loans and loan notes 8 (448.6) (440.8)
Net assets excluding net pension scheme liabilities 1,714.6 1,336.5
Pension scheme liabilities 10 (2.5) (3.1)
Net assets including net pension scheme liabilities 1,712.1 1,333.4
Equity capital and reserves
Called up equity share capital 11 29.3 29.7
Share premium account 12 1,118.9 1,101.7
Capital redemption reserve 13 0.8 –
Profit and loss account 13 563.1 202.0
Equity shareholders’ funds 1,712.1 1,333.4
*See note 1.
These financial statements were approved by the Board of directors on 2 March 2006 and signed on its behalf by:
Sly Bailey Chief Executive
Vijay Vaghela Group Finance Director
Notes 1 to 16 form part of these financial statements.

109
Chairman’s statement / Chief Executive’s statement / Business review / Corporate responsibility / Board of Directors and Executive Committee / Corporate governance / Remuneration report / Directors’ report / Group independent auditors’report / Accounts and notes / Unaudited other information / Holding company accounts and notes / Investor Relations
Notes to the 2005 holding company financial statements
1 Accounting policiesThe financial statements are prepared under UK GAAP (United KingdomGenerally Accepted Accounting Practice) and in accordance withapplicable United Kingdom law and accounting standards. The particularaccounting policies adopted are described below and have been appliedon a consistent basis in the current and preceding period.
The following accounting standards have been adopted in these accounts:
• Financial Reporting Standard No. 20 ‘Share-based Payment;• Financial Reporting Standard No. 21 ‘Events after the balance
sheet date’;• Financial Reporting Standard No. 25 ‘Financial Instruments:
Disclosure and presentation’; and• Financial Reporting Standard No. 26 ‘Financial Instruments:
Measurement’.
The adoption of these accounting standards has resulted in the followingrestatement of comparative figures for the 53 weeks ended 2 January 2005:
As previously Impact of Impact of 2 January 2005disclosed FRS 20 adoption FRS 21 adoption restated
£m £m £m £m
Fixed assets 2,068.5 0.8(1) – 2,069.3
Net current assets/(liabilities) 55.1 0.5 (347.6)(2) (292.0)
Total assets less current liabilities 2,123.6 1.3 (347.6) 1,777.3
Creditors due after one year (440.8) – – (440.8)
Pension scheme liabilities (3.1) – – (3.1)
Net assets 1,679.7 1.3 (347.6) 1,333.4
(1)Representing prior year adjustment following the adoption of FRS 20:Share-based Payment.
(2)Comprises £390.0 million proposed 2004 dividends receivable fromother Group companies offset by £42.4 million proposed 2004 dividendspayable to shareholders.
Basis of accountingThese financial statements have been prepared under the historical cost convention.
Pension scheme arrangements – defined benefit schemesUnder FRS 17 pension schemes assets are measured using fair values.Pension scheme liabilities are measured using a projected unit methodand discounted at the current rate of return on a high-quality corporatebond of equivalent term to the liability.
Each pension scheme surplus (to the extent that it is recoverable) ordeficit is recognised in full and presented on the face of the balancesheet. The movement in the scheme surplus/deficit is split betweenoperating and financing items in the profit and loss account.
The full service cost of the pension provision is charged to operatingprofit. Any difference between the expected return on assets and thatactually achieved is reflected in other recognised gains and losses in the period (note 13).
Income from shares in Group undertakingsThese amounts represent dividends from investments. The dividends are recognised in the period in which the cash is received.
Deferred taxationDeferred taxation is provided in full at the anticipated tax rates on timingdifferences arising from the different treatment of items for accounting andtaxation purposes. No provision is made for deferred tax on investmentrevaluations. A deferred tax asset is regarded as recoverable andtherefore recognised only when it can be regarded as more likely than not that there will be suitable taxable profits from which the future reversalof the underlying timing differences can be deducted. The Company has elected not to discount the deferred tax assets and liabilities.
Tangible fixed assetsTangible fixed assets are stated at cost less accumulated depreciation.Depreciation is provided on a straight-line basis in order to write off thetangible fixed assets over their expected useful lives. No depreciation is provided on freehold land. Provision is made if appropriate for anyimpairment in value. Set out below is a summary of the useful lives on which depreciation rates are based:
Freehold buildings 67 years
Fixed asset investmentsFixed asset investments are stated at cost less provision for anyimpairment.
Current asset investmentsListed current asset investments are stated at the lower of cost andmarket value, and other current asset investments are stated at the lowerof cost and net realisable value.
Operating leasesCosts in respect of operating leases are charged on a straight-line basisover the lease term.
Foreign currencyTransactions denominated in foreign currencies are translated at theaverage rate applicable to the accounting period. Other exchangedifferences are taken through the profit and loss account.
Capital instruments
Capital instruments are accounted for in accordance with the principles
of FRS 26, Financial Instruments: Measurement and are classified as
equity share capital, non-equity share capital, minority interest or debt
as appropriate.

110
Chairman’s statement / Chief Executive’s statement / Business review / Corporate responsibility / Board of Directors andExecutive Committee / Corporate governance / Remuneration report / Directors’ report / Group independent auditors’ report/ Accounts and notes / Unaudited other information / Holding company accounts and notes / Investor Relations
1 Accounting policies (continued)
Financial instruments
Any premium or discount associated with the purchase of interest rate and foreign exchange instruments is amortised over the life of the transaction.
Interest receipts and payments are accrued to match the net income or cost with the related finance expense. No amounts are recognised in respect
of future periods. Gains and losses on early termination or on repayment of borrowings, to the extent that they are not replaced, are taken to the profit
and loss account.
Employee Share Option Schemes
Shares held within Employee Share Option Schemes are dealt with in the balance sheet as a deduction from equity shareholders’ funds.
2 Profit for the year
As permitted by section 230 of the Companies Act 1985, the Company has elected not to present its own profit and loss account for the year.
Trinity Mirror plc reported a retained profit for the financial period of £416.8 million (2004 (restated): £69.6 million loss). The audit fee was borne by
another group company in the current and prior period.
3 Staff costs
The average number of persons, including executive directors, employed by the Company in the year was:
2005 2004
Administration 16 16
All employees are employed in the United Kingdom and the Republic of Ireland.
2005 2004£m £m
Staff costs, including directors’ emoluments, incurred during the year were:
Wages and salaries 1.8 1.3
Social security costs 0.4 0.6
Share options granted to directors and employees 1.3 0.4
Pension costs – defined benefit plans 27.0 16.3
30.5 18.6
Disclosure of individual directors’ remuneration, share options, long-term incentives schemes, pension contributions and pension entitlements required
by the Companies Act 1985 and those specified for audit by the Financial Services Authority are shown in the tables in the Remuneration Report
on pages 48 to 56.
Plant andvehicles
4 Tangible fixed assets £m
At cost
At 2 January 2005 and at 1 January 2006 0.4
Accumulated depreciation
At 2 January 2005 and at 1 January 2006 0.2
Written-down book value
At 1 January 2006 0.2
At 2 January 2005 0.2
Notes to the 2005 holding company financial statementscontinued

111
Chairman’s statement / Chief Executive’s statement / Business review / Corporate responsibility / Board of Directors and Executive Committee / Corporate governance / Remuneration report / Directors’ report / Group independent auditors’report / Accounts and notes / Unaudited other information / Holding company accounts and notes / Investor Relations
Shares Investments Total£m £m £m
5 Investments held as fixed assets (restated) (restated)
CostAt 2 January 2005 2,077.0 0.9 2,077.9Capital contribution to subsidiary company – – –Disposals – – –At 1 January 2006 2,077.0 0.9 2,077.9ProvisionsAt 2 January 2005, as previously reported 8.7 0.9 9.6Prior year restatements (see note 1) (0.8) – (0.8)At 2 January 2005, restated 7.9 0.9 8.8Cost of Long Term Incentive Plan in subsidiary companies (2.8) – (2.8)At 1 January 2006 5.1 0.9 6.0Net book valueAt 1 January 2006 2,071.9 – 2,071.9At 2 January 2005 2,069.1 – 2,069.1
2005 2004£m £m
6 Debtors (restated)
Amounts owed by subsidiary companies 1,488.4 1,788.9Other debtors 0.7 0.5Prepayments and other income – 0.2
1,489.1 1,789.6
7 Current asset investmentsThe Company disposed of shares in UK companies with a book value of £1.3 million for proceeds of £1.7 million recognising profit on the sale of £0.4 million.
2005 2005 2004 2004Within After Within After
one year one year one year one year8 Bank loans, loan notes and overdrafts £m £m £m £m
Bank overdrafts 8.4 – 9.7 –Bank loans 40.0 – – –Loan notes – 448.6 – 440.8
48.4 448.6 9.7 440.8
Borrowings2005 2004
£m £m
Bank overdrafts (unsecured) 8.4 9.7Syndicated unsecured bank loan 40.0 –US$350 million unsecured loan notes 206.6 237.3US$252 million unsecured loan notes 153.4 171.5£22 million unsecured loan notes 22.0 22.0£10 million unsecured loan notes 10.0 10.0Derivative financial instruments 56.6 –
497.0 450.5
Due within one year 48.4 9.7Due after more than one year 448.6 440.8
497.0 450.5

112
Chairman’s statement / Chief Executive’s statement / Business review / Corporate responsibility / Board of Directors andExecutive Committee / Corporate governance / Remuneration report / Directors’ report / Group independent auditors’ report/ Accounts and notes / Unaudited other information / Holding company accounts and notes / Investor Relations
Notes to the 2005 holding company financial statementscontinued
8 Bank loans, loan notes and overdrafts (continued)
Syndicated unsecured bank loan
The £40 million unsecured syndicated loan facility has a one month revolving term with a final maturity date of 20 June 2009.
All fees payable to participating banks and costs incurred for the facility are netted off against the amount drawn under the facility and are being
written off over three years.
US$350 million and £22 million unsecured loan notes
On 24 October 2001 the Group issued unsecured loan notes totalling US$350 million and £22 million through a private placing in the United States
and the UK respectively. The placing consisted of five series with different interest rates and maturities as follows:
US$80 million 6.6% fixed rate Series A notes due 24 October 2008.
US$190 million 7.04% fixed rate Series B notes due 24 October 2011.
US$80 million 7.19% fixed rate Series C notes due 24 October 2013.
£16 million 7.3% fixed rate Series D notes due 24 October 2011.
£6 million floating rate series E notes due 24 October 2008.
All the notes are repayable in full on maturity. Both the interest and capital repayments under US$-denominated notes has been swapped into sterling
through the use of cross-currency interest rate swaps. At 1 January 2006, £228.6 million (2004: £259.3 million) (net of costs) remains outstanding
under these loan notes. The costs of the issue are being written off over the term of the notes.
US$252 million and £10 million unsecured loan notes
On 20 June 2002, the Group issued unsecured loan notes totalling $252 million and £10 million through a private placing in the United States
and the UK respectively. The placing consisted of four series with different interest rates and maturities as follows:
US$102 million 7.17% Series A notes due 20 June 2012.
US$50 million 7.27% Series B notes due 20 June 2014.
US$100 million 7.42% Series C notes due 20 June 2017.
£10 million 7.14% Series D notes due 20 June 2014.
All the loan notes are repayable in full on maturity. Both interest and capital payable under the US$ denominated loan notes have been swapped
into sterling through the use of cross currency swaps. At 1 January 2006, £163.4 million (2004: £181.5 million) (net of costs) remains outstanding
under these loan notes. The costs of the issue are being written off over the term of the notes.
Derivative financial instruments
The details of the Company’s derivative financial instruments are the same as those of the Group, and are disclosed in Note 27 in the notes to the
Group financial statements in this report.
2005 2004£m £m
9 Other creditors: amounts falling due within one year (restated)
Amounts owed to subsidiary undertakings 1,341.1 2,059.5
Corporate taxation 1.2 1.2
Other creditors 3.5 6.2
Accruals and deferred income 6.0 7.8
1,351.8 2,074.7

113
Chairman’s statement / Chief Executive’s statement / Business review / Corporate responsibility / Board of Directors and Executive Committee / Corporate governance / Remuneration report / Directors’ report / Group independent auditors’report / Accounts and notes / Unaudited other information / Holding company accounts and notes / Investor Relations
10 Pensions
The Company contributes to a number of the Group’s defined benefit pension schemes and is the sponsoring employer for the Trinity Mirror plc
Retirement Plan. As the Group’s pension schemes operate for employees of a number of Trinity Mirror companies, the Company is unable to identify
its share of the underlying assets/liabilities of the remaining schemes. Under FRS 17 the actual cost of providing pensions to the Company is charged
to the profit and loss account as incurred during the year.
The pension cost charged to the Company’s profit and loss account in 2005 is £0.2 million (2004: £0.3 million).
Based on actuarial advice, the financial assumptions used in calculating the scheme’s liabilities under FRS 17 are:
Assumptions Assumptions Assumptions Assumptionsas at as at as at as at
1 January 2 January 28 December 29 December2006 2005 2003 2002
% % % %
Discount rate 4.75 5.30 5.40 5.60
Inflation rate 2.80 2.75 2.75 2.30
Pension increases:
Pre 6 April 1997 pensions 2.80 2.75 2.75 2.30
Post 6 April 1997 pensions 2.80 2.75 2.75 2.30
Salary progression 4.10 4.00 4.30 4.10
The market value of assets in the Company’s scheme and the expected rates of return on each class of assets are:
Expected Expected Expected Expectedrate of Market rate of Market rate of Market rate of Market
return at value at return at value at return at value at return at value at1 January 1 January 2 January 2 January 28 December 28 December 29 December 29 December
2006 2006 2005 2005 2003 2003 2002 2002% £m % £m % £m % £m
UK equities 8.25 3.6 8.50 2.9 8.50 2.9 8.40 2.8
US equities 8.25 – 8.50 – 8.50 – 8.40 0.3
Other overseas equities 8.25 1.6 8.50 1.3 8.50 1.2 8.70 0.8
Property 5.90 – 6.20 – 6.40 – 6.50 0.1
Corporate bonds 4.75 0.5 5.30 0.4 5.30 0.4 5.60 –
Fixed-interest gilts 4.10 1.9 4.50 – 4.80 – 4.50 0.9
Index-linked gilts 4.00 3.4 4.50 3.3 4.80 3.3 4.50 –
Cash 3.80 0.4 3.80 1.1 3.80 0.7 4.30 1.6
11.4 9.0 8.5 6.5
The overall net deficit between the assets of the Company’s defined benefit pension scheme and the actuarial liabilities of that scheme at
1 January 2006 is as follows:Total as at Total as at Total as at Total as at1 January 2 January 28 December 29 December
2006 2005 2003 2002£m £m £m £m
Fair value of scheme’s assets 11.4 9.0 8.5 6.5
Actuarial value of scheme’s liabilities (15.0) (13.5) (12.4) (10.6)
Scheme deficits (3.6) (4.5) (3.9) (4.1)
Deferred tax 1.1 1.4 1.2 1.2
Net scheme’s liabilities (2.5) (3.1) (2.7) (2.9)

114
Chairman’s statement / Chief Executive’s statement / Business review / Corporate responsibility / Board of Directors andExecutive Committee / Corporate governance / Remuneration report / Directors’ report / Group independent auditors’ report/ Accounts and notes / Unaudited other information / Holding company accounts and notes / Investor Relations
Notes to the 2005 holding company financial statementscontinued
10 Pensions (continued)
The movement in the deficit during the year is analysed below:52 weeks to 53 weeks to 52 weeks to
1 January 2 January 28 December2006 2005 2003
£m £m £m
Opening deficit in the scheme (4.5) (3.9) (4.1)
Current service cost (0.2) (0.2) (0.4)
Past service cost – (0.1) –
Contributions 1.5 1.7 1.5
Finance charge (0.1) (0.1) (0.1)
Actuarial losses (0.3) (1.9) (0.8)
Closing deficit on the pension scheme (3.6) (4.5) (3.9)
The profit and loss reserve is analysed below:As at As at As at
1 January 2 January 28 December2006 2005 2003
£m £m £m(restated)
Profit and loss reserve excluding pension reserve 565.6 205.1 243.2
Pension reserve (2.5) (3.1) (2.7)
Profit and loss reserve 563.1 202.0 240.5
11 Share capital
The details of the Company’s share capital are the same as those of the Group, and are disclosed in Note 30 in the notes to the Group financial
statements in this report.
12 Share premium account
The details of the Company’s share premium account are the same as those of the Group, and are disclosed in Note 31 in the notes to the Group
financial statements in this report.
Capitalredemption Profit and
reserve loss account£m £m
13 Other reserves (restated)
At 2 January 2005, as previously reported – 548.3Prior year restatement (note 1) – (346.3)At 2 January 2005, restated – 202.0Transfer of retained profit for the year – 416.8Buy-back shares cancelled – (52.7)Investment in shares for LTIP – (5.7)Other recognised gains and losses in the period – 2.7Nominal value of shares cancelled under share buy-back programme 0.8 –
At 1 January 2006 0.8 563.1
The capital redemption reserve was created when the Company embarked on the share buy-back programme in 2005 and represents the nominal
value of the shares purchased and subsequently cancelled under the requirements of the Companies Act 1985.
14 Contingent liabilities
The Company has undertaken to provide financial support as required by, and has guaranteed the borrowings of, a number of its subsidiaries.
At 1 January 2006 this amounted to £28.8 million (2 January 2005: £43.3 million).

115
Chairman’s statement / Chief Executive’s statement / Business review / Corporate responsibility / Board of Directors and Executive Committee / Corporate governance / Remuneration report / Directors’ report / Group independent auditors’report / Accounts and notes / Unaudited other information / Holding company accounts and notes / Investor Relations
15 Principal subsidiariesDetails of the Company’s principal subsidiaries at 1 January 2006 are as follows:
Portion of ordinary shares held
Name of entity Principle activity %
Subsidiaries
The Chester Chronicle and Associated Newspapers Limited Newspaper publishing 100.00
Examiner News & Information Services Limited Newspaper publishing 100.00
Gazette Media Company Limited Newspaper publishing 100.00
Inside Communications Limited Magazines and exhibitions 100.00
Trinity Mirror North West & North Wales Limited Newspaper publishing 100.00
AMRA Limited National advertising saleshouse 100.00
MGN Limited Newspaper publishing 100.00
Midland Newspapers Limited Newspaper publishing 100.00
Mirror Group Limited Holding company 100.00
Newcastle Chronicle and Journal Limited Newspaper publishing and commercial contract printers 100.00
Raceform Limited Newspaper publishing 100.00
Scottish Daily Record and Sunday Mail Limited Newspaper publishing 100.00
Scottish and Universal Newspapers Limited Newspaper publishing 100.00
Trinity Mirror Printing Limited Contract printers 100.00
Trinity Mirror Printing (Blantyre) Limited Contract printers 100.00
Trinity Mirror Printing (Cardiff) Limited Contract printers 100.00
Trinity Mirror Printing (Liverpool)Limited Contract printers 100.00
Trinity Mirror Printing (Midlands) Limited Contract printers 100.00
Trinity Mirror Printing (Newcastle) Limited Contract printers 100.00
Trinity Mirror Printing (Oldham) Limited Contract printers 100.00
Trinity Mirror Printing (Saltire) Limited Contract printers 100.00
Trinity Mirror Printing (Teeside) Limited Contract printers 100.00
Trinity Mirror Printing (Watford) Limited Contract printers 100.00
Trinity Mirror Southern Limited Newspaper publishing 100.00
Trinity Mirror Regionals plc Holding company 100.00
Trinity Publications Limited Magazine publishing 100.00
Western Mail & Echo Limited Newspaper publishing 100.00
the hotgroup plc – acquired 26 October 2005 On-line recruitment 100.00
All subsidiary companies are incorporated and operating in the United Kingdom.
Associated undertakings
The Press Association Limited News agency 21.54
16 Events after the balance sheet date
A proposed final dividend of £45.4 million for the 52 weeks ended 1 January 2006, which is subject to approval by shareholders at the Annual General
Meeting, has not been reflected as a liability in these accounts.

116
Chairman’s statement / Chief Executive’s statement / Business review / Corporate responsibility / Board of Directors andExecutive Committee / Corporate governance / Remuneration report / Directors’ report / Group independent auditors’report / Accounts and notes / Unaudited other information / Holding company accounts and notes / Investor Relations
Investor Relations
Our aim is to communicate with the financial community on aregular and ongoing basis to support our stakeholders in theirinvestment decision process. While the Investor Relationsprogramme is driven by statutory reporting requirements, it also contains a strong element of additional communication in the form of meetings and presentations.
Key activitiesIn addition to standard result reporting, key themes in ourcommunication with the financial market in 2005 were ouracquisitions, transition to International Financial ReportingStandards and share buy-back programme. To that end, theCompany made the following announcements during the year:
28 Feb Appointment of Gary Hoffman as non-executive director20 Jun Update to impact of IFRS on Trinity Mirror19 Jul Acquisition of Smart Media Services Limited16 Aug Acquisition of Financial Jobs Online Limited1 Sep Hotgroup plc: Recommended Cash Offer for the
hotgroup plc30 Sep Hotgroup plc: Update on irrevocable undertakings19 Oct Hotgroup plc: offer extended to 25 October 200525 Oct Hotgroup plc: offer declared unconditional31 Oct Update on share buy-back programme28 Nov Acquisition of Paldonsay Ltd
In 2005 the focus of our Investor Relations efforts continued to be on institutional investors and analysts. This year we introduced an investor targeting programme to proactively reach out to newinvestors in the UK and Continental Europe. In addition to thesemarketing efforts, we continued to respond to ad hoc queries and meeting requests from both European and US investors.
In total we held over 120 meetings with both current shareholdersand non-holders. The largest concentration of meetings wasamong UK investors, but there was also interest from investors in the US, France, Spain, Italy, Switzerland and Australia.
This year Sly Bailey also presented at two media conferencesin London and Barcelona, targeting European investors with a focus on current investment and growth initiatives.
Management continued to maintain regular dialogue with the ten largest shareholders through meetings at least twice a year.
Key dates in 20062 March 2006 Preliminary results announcement 3 May 2006 Ex-dividend date 4 May 2006 AGM 5 May 2006 Record date 9 June 2006 Payment of final dividend29 June 2006 Trading statement3 August 2006 Interim results 14 December 2006 Trading statement
Trinity Mirror share price and traded volumes 2005
Trinity Mirror vs. FTSE All Share Media 2005
0
1,000
2,000
3,000
4,000
5,000
6,000
JAN FEB MAR APR MAY JUN JUL AUG SEP OCT NOV DEC560
580
600
620
640
660
680
700
720
TNI – Average weekly price
TNI – Average weekly volume
JAN FEB MAR APR MAY JUN JUL AUG SEP OCT NOV DEC85
90
95
100
105
110
115
Trinity Mirror
FTSE All Share Media £ – price index
Dividend policyOur dividend policy is to increase dividends progressively whilemaintaining a dividend cover (earnings per share/dividend pershare) of at least 2x.
On-line share dealingTrinity Mirror provides an internet-based service called Shareviewthrough Lloyds TSB Registrars. The service allows currentshareholders to sign up for e-communication and receiveshareholder mailings electronically, sell and buy shares on-lineusing Shareview Dealing and send their voting instructionelectronically if they have already registered for Shareview or have received a voting form with an electronic reference.
For more information on the service, please seewww.trinitymirror.com/ir/services/dealing/
Key contactsSly Bailey, Chief ExecutiveVijay Vaghela, Group Finance DirectorPaul Vickers, Secretary and Group Legal DirectorNick Fullagar, Director of Corporate CommunicationsJosefina Tallqvist, Investor Relations Manager
www.trinitymirror.com
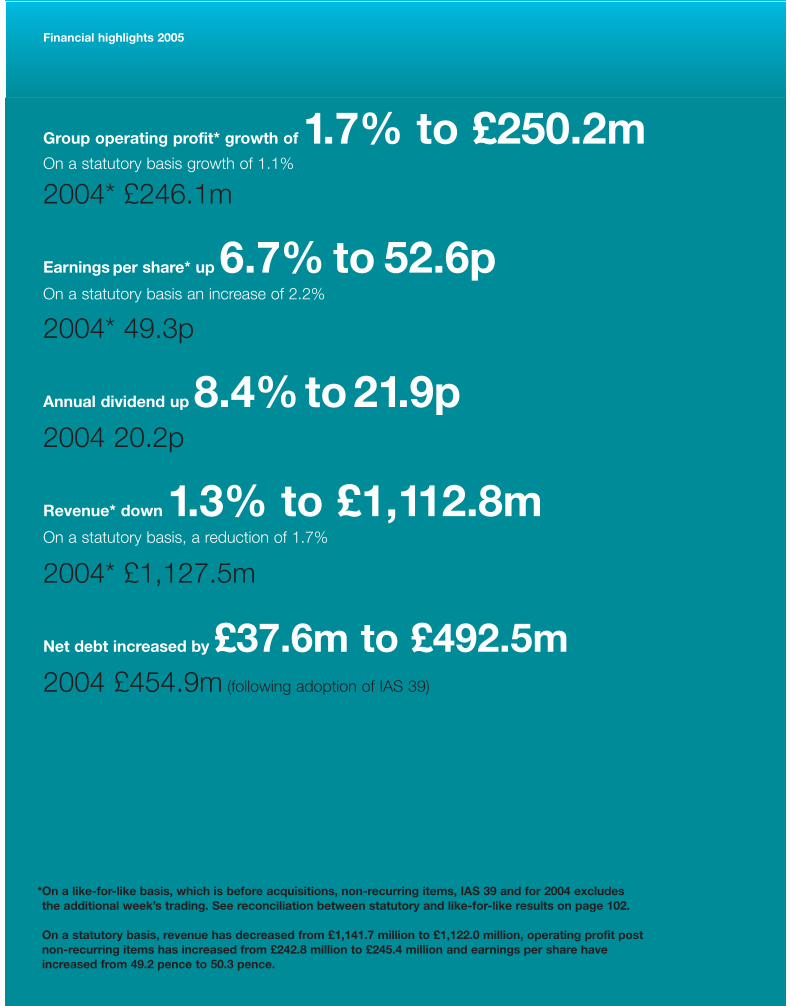
Financial highlights 2005
Group operating profit* growth of 1.7% to £250.2mOn a statutory basis growth of 1.1%
2004* £246.1m
Earnings per share* up 6.7% to 52.6pOn a statutory basis an increase of 2.2%
2004* 49.3p
Annual dividend up 8.4%to21.9p2004 20.2p
Revenue* down 1.3% to £1,112.8mOn a statutory basis, a reduction of 1.7%
2004* £1,127.5m
Net debt increased by £37.6m to £492.5m2004 £454.9m (following adoption of IAS 39)
*On a like-for-like basis, which is before acquisitions, non-recurring items, IAS 39 and for 2004 excludes the additional week’s trading. See reconciliation between statutory and like-for-like results on page 102.
On a statutory basis, revenue has decreased from £1,141.7 million to £1,122.0 million, operating profit post non-recurring items has increased from £242.8 million to £245.4 million and earnings per share have increased from 49.2 pence to 50.3 pence.

Designed and produced by Merchant in collaboration with Lippa Pearce. Type origination by Saffron Digital Production Ltd. Printed by Butler & Tanner.