Embed Size (px)
Citation preview
RReeggiioonnaall TTrraauummaa SSeerrvviicceess
ANNUAL REPORT
April 1, 2006 - March 31, 2007

RReeggiioonnaall TTrraauummaa SSeerrvviicceess ANNUAL REPORT April 1, 2006 - March 31, 2007

Regional Trauma Services 2006/2007
Special Acknowledgement To:
Many professionals have made significant contributions over the year to the information, data, and documents contained in this report. Dr. Ian Anderson Trauma Surgeon Ms. Alma Badnjevic Regional Trauma Services Data Analyst Ms. Dianne Dyer Regional Trauma Services Manager Ms. Christi Findlay Regional Trauma Services Data Analyst Ms. Natalie Hohman Regional Trauma Services Administrative Assistant Dr. Vincent Grant Pediatric Trauma Medical Director Dr. Andrew Kirkpatrick Regional Trauma Services Medical Director Ms. Leanne Kmet Regional Trauma Research Coordinator Dr. Rohan Lall Trauma Surgeon Ms. Joyce Mammel Orthopedic Trauma Clinical Nurse Specialist Ms. Barbara Matiakis Regional Trauma Services Nurse Clinician Specialist Ms. Sherry MacGillivray Regional Pediatric Trauma Coordinator Ms. Michelle Mercado Regional Trauma Services Data Analyst Ms. Maria Vivas Regional Trauma Services Data Analyst Note: • The Regional Trauma Services Project Leads and/or authors will be acknowledged
on the specific reports. • The author(s) of external submissions representing other departments or
organizations will be specifically acknowledged on the report as per their direction.
Special Acknowledgment:
Natalie Hohman, Administrative Assistant, for compilation and formatting of the Trauma Services Annual Report (2006/2007).

Calgary Health Region
Annual Regional Trauma Services Report 2006-2007
Table of Contents
Organization Structure................................................................................................................. i
Vision, Mission, Values, Roles .................................................................................................... ii
Medical Director’s Message ........................................................................................................ iii
Executive Summary..................................................................................................................... 1
Regional Trauma Services Activities ........................................................................................... 11
Regional Trauma & Injury Statistics Summary............................................................................ 25
Major Trauma Statistics & Outcome Data: Foothills Medical Centre .......................................... 29
Performance Indicators: Foothills Medical Centre...................................................................... 48
ACH Pediatric Trauma Program Report ……………………………………………………………..72
Trauma Statistics & Performance/Outcome Data: Peter Lougheed Centre............................... 128
Trauma Statistics & Performance/Outcome Data: Rockyview General Hospital…………………138
An Imperative for Injury Prevention ............................................................................................. 150
City of Calgary Emergency Medical Services (EMS) Annual Report .......................................... 161
Shock Trauma Air Rescue Society (STARS) Report .................................................................. 172
Office of the Chief Medical Examiner Report ............................................................................. 178
Regional Department of Emergency Medicine Report ................................................................ 186
P.A.R.T.Y. Program Report ......................................................................................................... 195
Calgary Firefighters Burn Treatment Centre Report ................................................................... 199
Tertiary Neurorehabilitation Program Reports
Traumatic Brain Injury Population...................................................................................... 206 Traumatic Spinal Cord Injury Population ........................................................................... 214
Appendices
Appendix A: Trauma Research Publications .................................................................... 222
Appendix B: Trauma Research Funding Summary………………………………………….227 Appendix C: Profile of Injuries in the Calgary Health Region Report ............................... 233

Regional Trauma Services 2006/2007
- i -
ORGANIZATIONAL STRUCTURE (April 1st, 2006-March 31st, 2007) Regional Trauma Services personnel include: Southwest Community Portfolio/Regional Trauma Services: Ms. Tracey Wasylak, Vice President, Southwest Community Portfolio Dr. James Silvias, Executive Medical Director, Southwest Community Portfolio Ms. Marg Semel, Director, Inpatient Surgical Services & Trauma Services Dr. Andrew Kirkpatrick, Regional Trauma Services Medical Director Ms. Dianne Dyer, Regional Trauma Services Manager Ms. Natalie Hohman, Regional Trauma Services Administrative Assistant Dr. Kent Ranson, Regional Trauma Services Research Coordinator Ms. Barbara Matiakis, Regional Adult Clinical Nurse Specialist Ms. Sherry MacGillivray, Regional Paediatric Trauma Coordinator Ms. Christi Findlay, Regional Trauma Services Data Analyst Ms. Maria Vivas, Regional Trauma Services Data Analyst Ms. Sukhi Lally, Regional Trauma Services Data Analyst Ms. Michelle Mercado, Regional Trauma Services Data Analyst Ms Alma Badnjevic, Temporary Regional Trauma Services Data Analyst Child & Women’s Health Portfolio: Alberta Children’s Hospital Site (ACH): Ms. Brenda Fischer, Vice President, Child & Women’s Health Dr. Brian Stewart, Executive Medical Director, Child & Women’s Health Ms. Toni MacDonald, Director, Child Health Programs, Child & Women’s Health Dr. Vincent Grant, Pediatric Medical Director Ms. Sherry MacGillivray, Regional Paediatric Trauma Coordinator Ms. Maria Vivas, Regional Trauma Services Data Analyst Adult Trauma/ Clinical Safety Committee Chairpersons: Dr. Andrew Kirkpatrick: FMC Adult Trauma Care Committee Dr. Bruce Rothwell: Peter Lougheed Centre (PLC) Trauma Committee Dr. Nancy Zuzic: Rockyview General Hospital (RGH) Trauma Committee Paediatric Trauma/ Clinical Safety Committee Chairperson: Dr. Vincent Grant, ACH Trauma Committee
Acknowledgment of former personnel: Dr. Robert Abernethy, Executive Medical Director, Southwest Community Portfolio Ms. Monica Rodriguez-Galvez, Administrative Assistant, Regional Trauma Services Ms. Stacey Litvinchuk, Regional Adult Clinical Nurse Specialist (0.6 FTE) Ms. Joanne Bouma, Regional Adult Clinical Nurse Specialist (0.6 FTE) Mr. Laurie Leckie, Regional Paediatric Trauma Coordinator Welcome to New Personnel: Ms. Natalie Hohman, Regional Trauma Services Administrative Assistant Ms. Sherry MacGillivray, Regional Paediatric Trauma Coordinator Ms. Barbara Matiakis, Regional Adult Clinical Nurse Specialist (1.0 FTE) Ms. Alma Badnjevic, Regional Trauma Services Data Analyst Ms. Michelle Mercado, Regional Trauma Services Data Analyst

Regional Trauma Services 2006/2007
- ii -
REGIONAL TRAUMA SERVICES
http://www.calgaryhealthregion.ca/clin/rts/index.htm
Calgary Health Region
Vision: Healthy Communities Mission: Leaders in Health – a partner in Care Values: Caring, respectful relationships, quality and safety, accountability
Regional Trauma Services
Vision: Excellence in trauma service delivery based on adequate financial and human resources, research-based quality improvement and education within a community that values integration, comprehensive rehabilitation and prevention. Mission: To provide and support a comprehensive, integrated and optimal system for the prevention, treatment and rehabilitation of injury focusing on the individual, family and community. Values: • Respect: non-judgmental acknowledgment of the unique contributions, dignity and worth of
individuals, being able to disagree, value diversity. • Caring: sensitivity to and support for the well being of all. • Accountability: willing to give an account of/be responsible for ones autonomy (where
autonomy = actions/decisions taken within ones area/scope of responsibility). • Teamwork: a commitment to work together towards common goals through effective
communication, collaboration and tolerance for differences. • Growth: personal and organization commitment to lifelong learning; continuous improvement;
mentoring and sharing. • Quality/excellence: in care and practice/work; clear standards; continuous improvement. Roles: • Provide care to those affected by trauma within Region 3, Southern Alberta, Southeast British
Columbia, and Southwestern Saskatchewan. • Develop/advance clinical services, education and research at Regional, Provincial and
Federal levels. • Act as a clinical/education resource for rural & other urban communities. • Provide acute care services including emergency care, diagnostic imaging, operative &
critical care, ongoing surgical management & rehabilitation. • Link to, and support disaster planning services, prevention programs, pre-hospital care,
rehabilitation & other trauma programs. • Maintain the trauma registry database and report on patients with ISS > 12 (Foothills Medical
Centre (FMC) and Alberta Children’s Hospital (ACH). • Review/report on injury discharge data and emergency transfers, and maintain the trauma
registry database data and report on patients with ISS > 12 at Rockyview General Hospital (RGH) and Peter Lougheed Centre (PLC).
• Assume a leadership role & active partnership in provincial and federal trauma services planning.
• Facilitate quality monitoring & improvement activities including the review & development of clinical practice guidelines, research initiatives, and the acquisition of applicable educational resources.
• Support the Trauma Association of Canada (TAC) as the TAC Central Office.

Regional Trauma Services 2006/2007
- iii -
INTRODUCTION
Medical Director’s Message
The Calgary Health Region continues to provide comprehensive medical care to one of the most dynamic and rapidly growing populations in Canada. I believe the multi-disciplinary teams we have created in the Calgary Health Region, cross-cutting across professions, disciplines, and sites, have risen to this challenge despite present resource challenges. The Calgary Health Region continues to be a National Leader in both clinical trauma care as well as the systems required to successfully regionalize and rationalize trauma care. This year’s annual report continues to reflect the scale and significance of these activities. The broad coalition of health providers required to provide comprehensive injury control and advance the knowledge of injury is immediately apparent within. The strength of the Calgary Health Region’s Trauma Service delivery of care model is reflected in the continuing dedication to good clinical care measured by accepted benchmarks, complemented by an ever-increasing number of publications and research dollars earned.
The Calgary Health Region Trauma System continues to lead the country in reporting and benchmarking. Calgary’s recognized strengths include comprehensive and coordinated pre-hospital ground and air ambulance services, single coordinated regional Emergency Department and Critical Care Departments, specialized surgical services including the dedicated Trauma Service and leadership in Spine, Orthopaedic, Reconstructive, Neurosurgical, Rehabilitative, and Vascular Surgery services. It is not surprising that the Trauma Association of Canada reflects these strengths in the high accreditation standing as a trauma system. Thus, a notable highlight of trauma care this year included the inaugural meting of the Provincial Trauma Committee. It is hoped that increased province wide communication and the development of improved and comprehensive data collection and analysis will serve to further understand the challenges and priorities for trauma care across the Province. As always the goal is improved patient outcomes. Consistent with the goal of facilitating province and nation-wide communication, the Calgary Health Region continues to be the only region in Canada which strives to display transparency to the Public by publishing comprehensive performance indicators in the public domain. In doing so, we publicly commit to providing a high clinical standard and challenge other trauma care systems to do the same. This is not meant to be competitive or adversarial, only to stimulate good clinical care across the country. The challenge for the future continues to be the need to preserve these successes and to continue to provide excellent care across the clinical continuum for all Albertans despite the continuing systemic stresses accompanying rapid growth. We also hope to increase the already good research and teaching productivity across the multiple-disciplines involved in the delivery of regional trauma care. The Calgary Health Region is of necessity, pursuing an ambitious plan of expansion across the Region, most notable for the construction of the South Hospital. Regional Trauma Services has been actively involved in these discussions focused towards creating the footprint and future staffing to allow this resource to assume an appropriate role in the Regional Trauma Plan.
Andrew W Kirkpatrick CD MD MHSc FACS FRCSC Calgary Health Region

Regional Trauma Services EEXXEECCUUTTIIVVEE SSUUMMMMAARRYY
Compiled By: • Ms. Dianne Dyer, Manager Regional Trauma Services

Regional Trauma Services 2006/2007
- 1 -
EXECUTIVE SUMMARY The Regional Trauma Services Program is dedicated to supporting and evaluating the provision of optimal trauma care to individuals and families affected by traumatic injury across southern Alberta, southeastern British Columbia and southwestern Saskatchewan. Services provided by the program include the provision, ongoing development and advancement of clinical care, education and research pertaining to the trauma continuum from pre-hospital to discharge to the community. The Regional Trauma Services team continues to collaborate with partners and stakeholders, within and external to the trauma system, to address needs, issues and to ensure an efficient, effective integrated system of care. The annual report is a comprehensive summary of team activities, trauma statistics, quality performance measures, trauma research publication information and various interrelated reports from system partners. This report is focused on April 1, 2006 through to March 31, 2007; one exception being the City of Calgary Emergency Medical Services (EMS) report, which is based on their reporting year from January 2006 through to December 2006. Some of the unique features of the report this year include new designs and innovative submissions on the Alberta Children’s Hospital Regional Pediatric Trauma Program; an Injury Prevention and Control report entitled “The Imperative for Injury Prevention”; the City of Calgary Emergency Medical Services (EMS) report; the Shock Trauma Air Rescue Society (STARS) report; and comprehensive reports on the trauma care at the Peter Lougheed Centre and the Rockyview Hospital. 1. Regional Trauma Services Activities
1.1 Clinical The core component of the trauma service is the clinical role to provide, facilitate and evaluate clinical services. The goal is to improve and maintain the highest standard of trauma care through inter-disciplinary team collaboration, education and research. To support this goal clinical practice is enhanced through the development, implementation and evaluation of clinical practice guidelines, technology, quality assurance and clinical collaborative projects. Note: Current protocols and practice guidelines are available to clinical providers on the Regional Trauma Services internal website and the Trauma Orientation Manuals. The external website includes information on programs, services, related links and copies of the annual reports.
Some of the clinical activities this year included: implementing a protocol focused on the management of blunt vascular trauma to the neck; the development of a Family Support pamphlet; implementation of a Blunt Traumatic Aortic Arch protocol; preparing a proposal to improve and support the care of the paediatric trauma patient (age < 14; evaluating the Paediatric Hypothermia protocol; revising the Trauma Team Activation paging process; updating the Regional Trauma Transfer policy; and piloting a Brief Intervention protocol focused on patients involved in alcohol related trauma or with potential alcohol related risk behaviours.
1.2 Education An effective accredited trauma program must promote educational opportunities for clinical providers, managers, support staff and patients. Educational activities this ear included weekly and monthly Trauma Rounds, as well as, various team orientation sessions for new trauma nurses, residents and physicians. The monthly regional adult Grand Trauma Rounds were presented via Telehealth to various rural centres upon request. Monthly Trauma Rounds at ACH were well attended and addressed various topics pertinent to the unique needs of the pediatric trauma population. Some members of the Regional Trauma Services
Regional Trauma Services 2006/2007
- 2 -
team participated in and/or presented at the Trauma Association of Canada Scientific meeting held in Ottawa. Others presented at various international conferences throughout the year. Some team members presented at the P.A.R.T.Y. (Prevention of Alcohol Related Trauma in Youth) program. Trauma Services continued to support the Advance Trauma Life Support (ATLS) program and other surgical teaching programs (e.g. Advanced Trauma Operative Management (ATOM)) offered across North America. 1.3 Quality Improvement The measurement and evaluation of various components of the adult and paediatric trauma system is an important focus of the work of Trauma Services. Throughout the year trauma care providers made referrals to Trauma Services with specific concerns for follow-up. The ACH and FMC trauma and Trauma Clinical Safety committees conducted quarterly and ad hoc reviews of Trauma Registry statistics, performance indicators and audit filters. The PLC and RGH site trauma committees conducted quarterly and ad hoc case reviews and reviews of major trauma charts/reports using Trauma Registry data. Performance indicators and audit filters were reviewed and updated by the Trauma Clinical Safety Committees. Some new clinical practice guidelines and protocols were implemented; updated as appropriate and posted on the Trauma Services internal web site for timely access for providers.
1.4 Research Trauma research and evidence based practice is an essential focus of Trauma Services and an effective trauma system. A fulltime Trauma Research Coordinator was hired in October 2006 to support this important work. This new role provided leadership, consultation and support for research initiatives within the Regional Trauma Services Program as well as projects that related to trauma care across the region and the system. Meetings occurred to support several joint projects with the Vancouver research group, with the Clinical Trauma Trials Collaborative and with various members of the Trauma Association of Canada. This past year Regional Trauma Services became actively involved with Telesat Canada and the Canadian Space Agency in a project that looked at remote telesonography and applications to trauma care. The ultimate goal was to test the technology and assess the future potential benefits to clinical care and providers in Canada’s remote communities in the far north. Work is underway to move the project forward with a target date commencing in July 2007, Images will be transmitted to test the technology from Banff, Alberta to Calgary, Alberta. More detailed information will be provided in the next annual report. Total funds dedicated and received to support trauma related research: $12,369,090.26
A comprehensive list of research publications, projects, funding sources and related
information are included in the appendices section of this annual report.
1.5 Administration Administrative support is essential to the co-ordination and achievement of the various trauma services activities. This year administrative activities included work to implement the Provincial Trauma System proposal. The proposal was approved by Alberta Health and Wellness in February 2007 to a total of 2 million. The goal was an integrated provincial system for trauma in Alberta, aiming to get the injured trauma patient to the right location, the right provider and the right services in a timely manner. Regional Trauma Services worked closely with Capital Health Region Trauma Services and the Alberta Centre for Injury Control and Research (ACICR) over several years to bring the proposal to the attention of government and administrators at the proposed District Centres. Plans are underway for the first inaugural meeting of the Provincial Trauma Committee. Ongoing links were maintained with the Trauma Association of Canada (TAC) including management and coordination of the TAC Central Office and web master of the TAC web site. Funds were acquired to support weekly and monthly Trauma Rounds, the Trauma Nurses Journal Club, educational opportunities for staff and staff resources. External and operational funding was acquired to send team members to the Trauma Association of Canada (TAC) Scientific meeting held in
Regional Trauma Services 2006/2007
- 3 -
Ottawa, Ontario. Trauma Services participated in the planning for the Simulator Education Centre and will be a partner in this Centre in the future. A proposal was submitted to Administration in June 2007 and again in November 2007 to seek funds to improve and support the care of the paediatric trauma patient (age < 14). Support was received and awaiting next steps. A team retreat was planned for June 2007 to provide an opportunity for team building, visioning and planning for the future. Regional Trauma Services moved to their new location at FMC in November 2006. The new location is on the 7th floor of the FMC, next door to PCU 71 (the Trauma Unit).
1.6 Data Management A trauma registry is a requirement of TAC guidelines for an accredited trauma centre. FMC, ACH, PLC and RGH have stand-alone trauma registries. To qualify for the trauma registry a patient must have an ISS > 12 and be admitted to the trauma centre or die in the emergency department of the trauma centre. ISS is an anatomical scoring tool that provides an overall score for patients with single system or multiple system injuries. The higher the ISS, the more severe the patient’s injuries. To ensure all appropriate patients are included into the trauma registry, all injury admissions, discharges and emergency department resuscitations are reviewed at FMC and ACH. This fiscal year, 4139 (3870: 2005/2006) FMC patient records and 760 (798: 2006/2007) ACH patient records were reviewed to determine eligibility for the trauma registry. At the PLC and RGH, patients are selected for review based on discharge diagnosis. More information on these two sites is included in the new comprehensive reports in this report. The Health Information Act (HIA), section 27(1) (g), outlines clearly the parameters whereby Trauma Services is authorized to collect this data. Up to 1300 data elements may be collected for each patient. The performance of the overall trauma system is measured in various ways. One way in the Calgary Health Region is by collection, documentation and review of 42 performance indicators. Thirteen of these are related to patient flow and outcome and twenty-nine to clinical benchmarks. Inclusion or exclusion criteria are clearly defined for each of the individual performance indicators. Other measures of performance include applications of the data to internal quality and safety initiatives, research, resource utilization, education and injury prevention initiatives, and outcome studies. The Trauma Registry supports unique projects by providing the ability to customize the registry and to write queries and reports. Regional Trauma Services worked this past year closely with colleagues in Edmonton to develop and maintain a consistent provincial data dictionary ensuring a comprehensive and comparative data set.
2.0 Trauma Statistics & Outcome Indicators (FMC & ACH)
2.1 Major Trauma Totals The inclusion criteria for major trauma is that the patient must have an Injury Severity Score (ISS) > 12, be admitted to hospital or die in the Emergency Department. The FMC total major trauma patients was 1094 (969: 2005/2006). This was a 12.9% increase in one year. The ACH total major trauma patients was 91 (87: 2005/2006). This was a 4.6% increase over last year. Adding the PLC and RGH major trauma numbers (PLC: 22; RGH: 23) the overall total major trauma patients was 1230 (1109: 2005/2006). The overall total numbers of traumatic injury inpatients was 7631 (7829: 2005/2006). The number of patients with an ISS> 16 was 886 for FMC (805: 2005/2006) and this represents a 41.3% increase over five years (2002/2003: 627). The number of patients with an ISS > 16 at ACH for 2006/2007 was 83 or 91% of the total.
2.2 Mechanism of Injury/Type of Injury As in previous years the mechanism of injury (MOI) or cause of injury was reported using four broad categories: Transportation, Falls, Violence and Other. Transportation continued to be the “number one” MOI for FMC and ACH; 47.1% (42.7%: 2005/2006) and 48% (47%: 2005/2006) respectively. Violent cause of injury comprised 13% (10.2%: 2005/2006) at FMC and 3% (1.1%: 2005/2006) at ACH. There has been an increase in adult incidents of violence
Regional Trauma Services 2006/2007
- 4 -
and a downward trend in pediatric cases from 2002/2003. Blunt trauma continues to be the highest percentage for the type of injury in adults (92.7%) and pediatrics (85%). 2.3 Transports/Transfers 76% of the adult patients were transported by ground ambulance to FMC (67.3%: 2005/2006). 59.3% of the pediatric patients were transported by ground ambulance, a 35% increase over 2005/2006. The ACH Pediatric Trauma report includes new graphs and information on Emergency Department arrival by month, the day of week and time of arrival. 2.4 Physician Services/Surgical Procedures The majority of adult trauma patients were admitted to General Surgery (529), followed by ICU (220), Neurosurgery (206) and Orthopedics (56). The majority of pediatric patients were admitted to the ICU (53), followed by Pediatrics (16) and Pediatric Surgery (14). Orthopedic procedures continued to be the highest number of procedures at FMC (41.7%; 39.2%: 2005/2006). Neurosurgery was the highest number of procedures at ACH followed by plastic surgery. The ACH Pediatric Trauma report includes graphs and information on various non-operative procedures, including procedures performed by Diagnostic Imaging. Five year comparisons are included in some graphs.
2.5 Length of Stay (LOS) The median LOS for adult patients was 8 days; the median for pediatric patients was 5 days. The median LOS for FMC ICU admissions was 5.5 days; the median LOS for ACH ICU admissions was 2 days. 2.6 Outcomes The annual report provides graphs and details on outcomes by age group including deaths and outcomes by ISS. In both adults and pediatrics the majority of survivors were in the 16-25 ISS range. Mortality was highest in the same range for adults; in the 26-35 range for pediatrics. In adults there were 18 survivors in the ISS range of 46-75; in pediatrics there was one survivor in the range of 46-75 and 100% non-survivors in the range beyond ISS 55. The majority of survivors in both populations were discharged home. 2.7 ISS > 16 Major Trauma Population In 1992, the inclusion criterion for the Trauma Registry was an ISS > 16. In 1993, this was to an ISS > 12. At FMC, this year the number of major trauma patients with an ISS > 16 was 805. This represents a 42.2% increase in the number of patients with an ISS > 16 over the last 5 years (2001/2002: 648 patients). The rise in major trauma cases at FMC has resulted in increased pressures on acute care and community resources, with demands for improvements in access to services, performance, technology and efficiency measures.
3.0 Trauma Statistics (PLC & RGH) The major trauma population at RGH and PLC was captured by a review of the monthly injury discharges prepared by Quality Safety Health Information (QSHI). Trauma patients with an ISS >12 are identified through chart audits. In 2006/2007, 22 patients were identifies at PLC (20:2005/2006) and 23 patients were identified at RGH (33:2005/2006). This does not represent patients that arrived to the Emergency Department and were transferred to Trauma centres. The PLC and RGH reports this year includes a detailed presentation of quality performance measures.
4.0 Regional Trauma Statistics Injury Statistics The total number of traumatic injury admissions (any ISS) for the four urban centres for adults was 6480 for 2006/2007. The number for pediatrics at ACH was 705. There was no clear evidence of a peak in admissions in any one month for adults; a peak for pediatrics occurred in August. There was a total, from all four urban sites of 1230 major trauma admissions (ISS > 12)
Regional Trauma Services 2006/2007
- 5 -
or deaths in the Emergency department in 2006/2007. This was a 10.9% increase in overall numbers from 2005/2006 (1109).
5.0 Performance Indicators As part of the Regional Trauma Services quality improvement process, several indicators were monitored on a regular basis as a measure of performance throughout the continuum of care. The following is a summary of these indicators at Foothills Medical Centre and the Alberta Children’s Hospital for patients who met the inclusion criteria for the Alberta Trauma Registry (patients with an ISS > 12 and who were admitted to the hospital or died in the ED). Detailed information on the performance indicators at PLC and RGH is included in their reports for this year.
5.1 Foothills Medical Centre Each performance indicator number was applied to a total population of 1094; at time of publication. The FMC Quality Improvement/Quality Assurance Committee and Trauma Services reviewed the data and charts, and addressed identified issues as appropriate.
5.1.1 Transports/Transfers The number of patients transferred from PLC to FMC increased this year from 25 to 40; number from RGH decreased from 37 to 27. Only one patient was transferred from ACH to FMC. The number of out of province transfers to FMC increased from 72 to 84; 60.2% of the patients transferred from hospitals in British Columbia. The number of patients transferred from a rural District Centre (i.e. Provincial Trauma System) increased from 95 to 105 in this past year. 5.1.2 Pre-Hospital Phase In 2006/2007, the indicator focused on airway interventions for patients with a first recorded scene GCS ≤ 8, was expanded to include laryngeal mask airways and oral and nasopharyngeal airways. This demonstrated an increase from 41.7% compliance to 60.8% compliance for 2006/2007. This indicator was and is under review at the Trauma Clinical Safety Committee meetings.
5.1.3 Resuscitative Phase The Trauma Team Leader (TTL) response time was ≤ 20 minutes 97.1% of the time. Of the 336 patients that met the criteria for Trauma Team activation, activation was initiated in 57.4% (193) of the cases. If a case met the criteria and a trauma team activation was not called, the cases are flagged for quality review by Trauma Services. If the Trauma Team was not activated, trauma was consulted in 44% of the cases. This will continue to be an on-going item for careful review and follow-up in 2007/2008.
5.1.4 Definitive Phase In 2006/2007 the joint relocation indicator was revised to include “attempts at relocation” of the joint within one hour. There was compliance 62.1% of the time (41.2%: 2005/2006). Follow-up of these cases include Emergency and Orthopaedics. Patients with a GCS < 13 had a CT of the head performed within 4 hours, 97.7% of the time. For 2007/2008 the time frame for this indicator will be reduced to “within one hour” of arrival. 93.0% of patients with femur fractures received operative management within 24 hours (87.3%: 2005/2006). 76.2% of the patients with open long bone fractures had operative management within the defined time frame (6 hours: Grade 3, 12 hours: Grade 12) compared to 62.8% in 2005/2006. There was a delayed diagnosis or missed injury in 1.3% of the major trauma patients (2.5%:2005/2006). There were no missed c-spine injuries in 2006/2007. 97.7% of the patients were admitted to a surgeon or intensivist. There were no missed c-spine injuries in 2006/2007.
Regional Trauma Services 2006/2007
- 6 -
35% of the admissions to ICU were unplanned with most due to respiratory compromise. 5% of the patients had unplanned ICU re-admissions. 95.5% of the patients received operative management of facial fractures within 7 days of injury (91.5%: 2005/2006). 94.2% of the patients received operative management of spinal fracture within 7 days of injury (90.2%: 2005/2006). 71.4% of the patients were Category 1 status (hemorrhagic shock) had a laparotomy within one hour of arrival (42.9%: 2005/2006). The median time to laparotomy was 38.5 minutes (59 minutes: 2005/2006). Use of Angiography and the options for angioembolization play a major role in decisions to take the patient to the OR in these cases. 5.1.5 Outcomes 56.4% of all deaths took place within 24 hours of arrival (44.1%: 2005/2006). 10.1% of all patients died in 2006/2007 (13.1%: 2005/2006). For 1995-2007, there were 1.58 more survivors per 100 than would have been expected from the major trauma study. 3.7% of the patients with a probability of survival of 20% died at the FMC (6.1%; 2005/2006).
5.2 Alberta Children’s Hospital Each performance indicator was applied to a total population of 91 patients for the 2006/2007 year. All cases flagged by a performance indicator or an audit filter were reviewed by the ACH Trauma Clinical Safety Committee and Trauma Services to determine appropriateness of care. If the ACH Trauma Clinical Safety Committee identified cases where there were trends or issues, the committee initiated the appropriate follow up on those cases.
5.2.1 Pre-ACH Care 80% of the pediatric patients with a GCS ≤ 8 did not receive a mechanical airway at the scene prior to transport. This is considered the ‘best practice” in pediatric care; rather than delaying care/transfer with attempts at intubation. 42% of pediatric patients spent > 2 hours at a rural site prior to transfer and 46.4% of patients arrived at the trauma centre ≤ 4 hours from the time of injury. If the LOS or delay is not acceptable the Clinical Safety Committee will address the situation via a letter to the rural site or hospital. 18.6% of the patients were transported to ACH via the ACH Transport Team. 5.2.2 Resuscitative Phase The criteria for Trauma Team Activation will be revised in 2007/2008 with links to a more detailed reporting system in the future. 11% of patients were admitted directly (bypassing ED) in 2006/2007. A new policy was written in February 2007 whereby all referred patients are to be assessed in the Emergency Department before admission. A new Trauma ED Record is being developed to improve documentation issues. Trauma Packs, which include Neurological Vital Sign sheets, were located in the ACH Trauma Room. 100% of the patients with a GCS < 12 received a CT of the head within 4 hours of arrival at the ACH. 86.7% of the patients had an ED length of stay ≤ 4 hours. 80% of the patients were admitted to a surgeon or intensivist.
Regional Trauma Services 2006/2007
- 7 -
5.2.3 Definitive Phase 80% of the patients had operative repair of their femur <24 hours from arrival. There were no missed injuries identified after 48 hours and no missed c-spine injuries. 2.2% of the patients had an unplanned admission to ICU (n=2) and 1.8% had an unplanned re-admission to ICU (n=1). 5.2.4 Outcomes 57.1% of patients died within 24 hours of arrival. 7.7% of the patients died at ACH. According to TRISS (Trauma Injury Severity Score) methodology there were no unexpected deaths or unexpected survivors in all age categories at ACH.
6.0 Reports A number of reports were submitted this year from various trauma system partners for inclusion in the annual report. The reports include:
• City of Calgary Emergency Medical Services (EMS) Annual Report • Shock Trauma Air Transport Society (STARS) Report • The Office of the Chief Medical Examiner’s Report • The Regional Department of Emergency Medicine Report • The P.A.R.T.Y. Program Report • The Calgary Firefighters Burn Treatment Centre Report • Two Tertiary Neuro-rehabilitation Program Reports • An Imperative for Injury Prevention • Profile of Injuries in the Calgary Health Region
These reports are an important addition to the annual report and demonstrate and support the complexity and magnitude of the integrated Calgary Health Region trauma system. 7.0 Future Directions These are just a few of the Regional Trauma Services projects planned for the next year:
• A team retreat will be scheduled for June 2008. The focus will be three of the Regional Trauma Services top priorities:
o Pediatric Trauma Program Enhancement o Provincial Trauma System Work o Injury Prevention: Brief Intervention for alcohol related trauma
• The development of a process for statistical / data management on PCU 71 (the Trauma Unit) at FMC. • Explore new ways to track Mortality and Morbidity data through SCM. • Explore new ways to initiate Clinical Nurse Specialist referrals through SCM. • Acquisition of external funding for staff education and Trauma Rounds. • Further development of the trauma research program with the new leadership role. • Establishment of the fulltime Nurse Practitioner role to support clinical practice and quality assurance on the Trauma Unit. • Re-development of the Trauma Services internal and external website, including both Adult and Pediatric protocols, projects and new initiatives. • Participation and leadership in the new integrated Provincial Trauma System. • Establishment of the Brief Intervention for alcohol related trauma project on PCU 71. • Continued support for the enhancement of the Pediatric Trauma Program (more details in the ACH Trauma Program Report). • Continued work on the application of Trauma Registry to the data collection and case review processes at PLC and RGH. • Explore new data management strategies that gather both retrospective and prospective data to support timely quality improvement and clinical care initiatives. • Continued updates and revisions to Trauma Orientation Manuals for FMC and ACH.
Regional Trauma Services 2006/2007
- 8 -
• Begin discussions and work towards Trauma Accreditation in 2010 with the new June 2007 TAC Accreditation Guidelines. • Participation in the planning process for the new South Health Campus. • Seek opportunities to benchmark trauma care with national and international groups. • Continue active participation in the Trauma Association of Canada committees, accreditation processes, research and support for the TAC central office.
Regional Trauma Services will continue to promote the integrated Provincial Trauma System and support system performance through data management and quality improvement projects and initiatives based on current trauma research, clinical evidence and measurement of performance. Note: For additional detailed information on Future Directions for pediatric care please see the ACH Trauma Program report. For more information on the work of Regional Trauma Services visit our web site at:
Trauma Services
http://www.calgaryhealthregion.ca/clin/rts/index.htm
Regional Trauma Services AACCTTIIVVIITTIIEESS Project Lead: • Ms. Dianne Dyer, Manager Regional Trauma Services

Regional Trauma Services 2006/2007
- 11 -
REGIONAL TRAUMA SERVICES ACTIVITIES Regional Trauma Service continues to provide support for trauma care in the following areas: 1. Clinical A primary role of the trauma service is to support, facilitate and evaluate the clinical services provided for trauma patients. The goal is to improve and maintain the highest standard of trauma care through inter-disciplinary team collaboration, education and research. To support this goal, clinical practice is enhanced through the development, implementation and evaluation of clinical practice guidelines, technology, quality assurance activities, and collaborative projects with other services and departments. Note: Current protocols and practice guidelines are available to clinical providers on the Trauma Services internal website and in the Adult Trauma Orientation Manual. The Pediatric Trauma Orientation Manual is currently under review. Clinical activities this year included: • Facilitation of on-going trauma/ clinical safety committee meetings at all sites with the intent to
support the work of the committees, facilitate communication across the system and encourage input and feedback on trauma patient care issues and protocols.
• Collaboration with Surgical Services, Vascular Services, Cardiovascular Services and Diagnostic Imaging to support and evaluate the implementation of a Blunt Traumatic Aortic Arch protocol for trauma patients. The equipment to support the process at FMC was purchased. The protocol supports arch injury medical interventions at the FMC site and is posted on the website.
• Collaboration with multiple partners at the ACH and FMC site to prepare a proposal to improve and support the care of the paediatric trauma patient (age < 14). The proposal was submitted to Administration in June 2007 for funding approval and again in November 2007. • Working to revise the FMC Trauma Resident orientation manual. The goal was to distribute the
manual to the residents prior to arrival for a rotation so that they have information regarding their role and expectations of the rotation. Monthly resident orientation was presented. Work is ongoing on this project.
• Working to revise the Trauma Team Activation process to include a single alphanumeric page for all responders with a text message containing pertinent patient information. The project was evaluated on an on-going basis with introduction of a new activation call-out sheet based on the Emergency Unit Clerk and trauma surgeon input. • Working to continue to evaluate the FMC Trauma Team Activations for major trauma patients as part
of the ongoing quality assurance reviews. If a case met the criteria for activation and the team was not called the case was flagged in Trauma Registry and reviewed. Patterns were identified and recommendations were proposed for action at the Trauma Clinical Safety meetings.
• Facilitation of the review of patient issues through M+M (Morbidity and Mortality) rounds as required and in conjunction with Friday noon teaching rounds. Exploring options for recording M&M information in the SCM system. • Working with Neurosurgery and other stakeholders to finalize the “Guidelines for Neurosurgical Consults”. The guidelines were designed to provide information and support to Emergency Physicians and others related to assessment, monitoring and appropriate interventions / referrals/
consults for patients with head injuries. The guidelines were posted on the website and monitored and evaluated through the quality assurance reviews at the various trauma / clinical safety
committee meetings. • Working to complete a literature review and to develop a guideline for patients flying via Medivac or commercial airline following chest tube removal. Many patients are from out of town, out of province or out of country. Once they are stabilized and able to receive the required healthcare in the area of residence, they are transferred closer, or discharged, to home. This project is ongoing. • Working with regional partners, stakeholders and administration to update the Regional Trauma Transfer policy. The revision was approved at the Regional Trauma Advisory meeting and sent to the Surgical Executive. The process is ongoing and the policy will be posted on the Regional web site once finalized. • Collaborating with Social Work and Addictions Services to implement a project focused on screening
Regional Trauma Services 2006/2007
- 12 -
patients involved in alcohol related trauma or potential alcohol related risk behaviours. This was a new initiative with the hope that clinical providers could make a difference and potentially prevent alcohol related trauma in the future. The intervention was called “Alcohol Screening and Brief Intervention”, from the National Institute on Alcohol Abuse and Alcoholism, USA. The interview tool was designed to help patients relate alcohol use to the trauma event they have experienced in the hope that this insight might prevent future alcohol related traumatic events. Other benefits might include provision of support for those seeking to address their abuse of alcohol. This project was submitted for funding in November 2007, however funding sources must be found. This is a criterion for a Level 1 Trauma Centre as per the Trauma Association of Canada Guidelines revised June 2007.
• Working in partnership with Diagnostic Imaging to refine the day to day processes for timely spinal clearance and reporting. A Regional spinal clearance guideline was finalized and was posted on the website. This continues to be an on-going project. • Meetings underway to explore opportunities for angio-embolization in the FMC Trauma OR (i.e. logistics, funding and support) • Meetings underway to explore opportunities for establishment of arterial lines in FMC ED (i.e.
logistics, training, competencies and support) Note: For detailed information on the Alberta Children’s Hospital Pediatric Trauma Program clinical activities please see the ACH Trauma Program report. 2. Education Educational activities included: • Trauma Rounds on a weekly basis at FMC and on a monthly basis at both FMC and ACH. Rounds were well attended and included internal and external speakers on a variety of pertinent topics. The adult monthly trauma rounds were presented via Telehealth to all acute care sites and rural sites (upon request). • Team member attendance at the 2007 Trauma Association of Canada Scientific Meeting held in
Ottawa. External sources and minimal operations funding was used to support this. Some team members presented papers and posters at the meeting. Regional Trauma Services helped to plan the concurrent Canadian Forces program at the event in conjunction with various members of the Canadian Forces.
• Leadership and clinical guidance for clinical clerks, residents and Fellows during their trauma surgery rotations. The students were from Calgary, other provinces and other countries. • Working closely with the coordinator of the PARTY program to provide instructor support and advisory support for the program. ATLS®
Student Provider Courses: 2006: April 20-22, May 25-27, June 1-3, June 8-10, October 19-21
2007: January 18-20, February 8-10, March 8-10
Instructor Courses: 2007: January 13
Dr. Richard Simons, in BC, is the Region Chief, ATLS®. Dr. Mary van Wijngaarden-Stephens is the Provincial Chair for Alberta. Trauma Surgeon Course leaders include: Dr. Michael Dunham, Dr. John Kortbeek, Dr. Bruce Rothwell, Dr. Jim Nixon, Dr. Jeff Way, Dr. Ian Anderson, Dr. Andrew Kirkpatrick and Dr. Rohan Lall. There are 54 instructors in good standing: Anaesthesia (3), Emergency Department (10), General Surgery (26), Critical Care (2), Orthopaedic Surgery (4), Neurosurgery (1), Family Medicine (3), P.C. (4). ATLS® Coordinators in Calgary: Nancy Biegler RN MN (started in 2004), Sandra Dowkes (started in 1998). Natalie Hohman provided administrative support for the program through the Regional Trauma Services office. The program moved under the leadership of the Department of Surgery, Calgary Health Region, in January 2006. Information provided by: Sandra Dowkes.
Regional Trauma Services 2006/2007
- 13 -
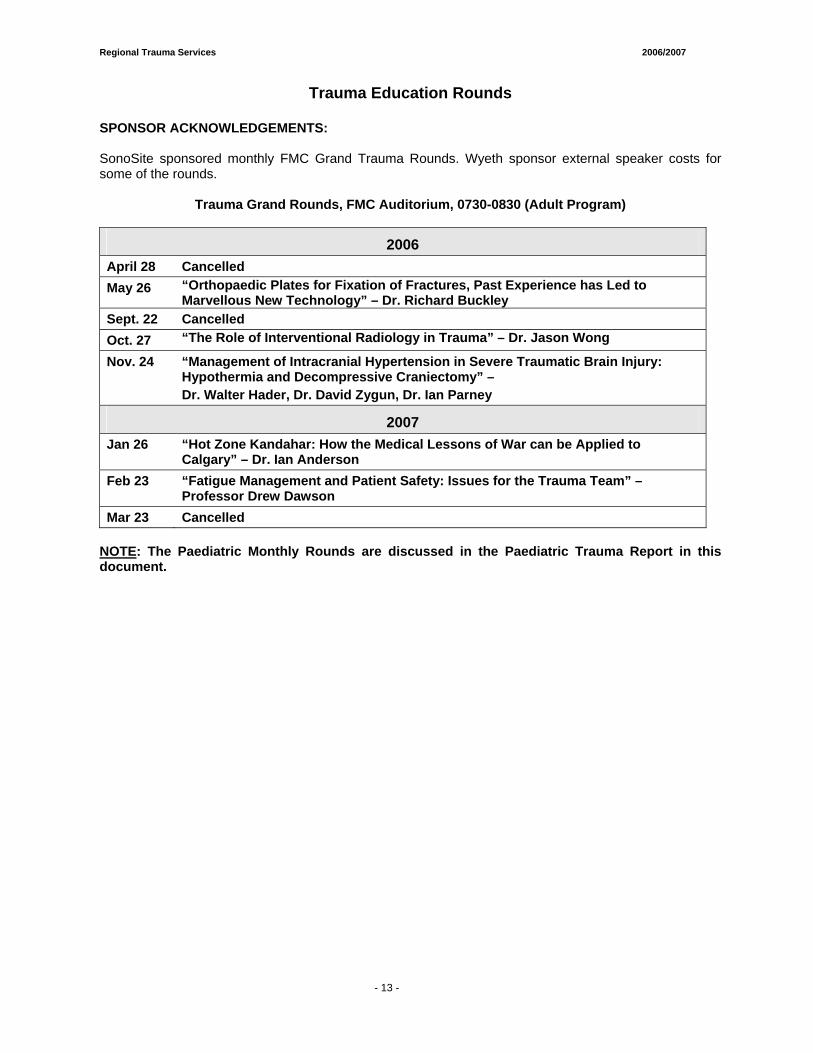
Trauma Education Rounds
SPONSOR ACKNOWLEDGEMENTS: SonoSite sponsored monthly FMC Grand Trauma Rounds. Wyeth sponsor external speaker costs for some of the rounds.
Trauma Grand Rounds, FMC Auditorium, 0730-0830 (Adult Program)
2006 April 28 Cancelled May 26 “Orthopaedic Plates for Fixation of Fractures, Past Experience has Led to
Marvellous New Technology” – Dr. Richard Buckley Sept. 22 Cancelled Oct. 27 “The Role of Interventional Radiology in Trauma” – Dr. Jason Wong
Nov. 24 “Management of Intracranial Hypertension in Severe Traumatic Brain Injury: Hypothermia and Decompressive Craniectomy” – Dr. Walter Hader, Dr. David Zygun, Dr. Ian Parney
2007 Jan 26 “Hot Zone Kandahar: How the Medical Lessons of War can be Applied to
Calgary” – Dr. Ian Anderson Feb 23 “Fatigue Management and Patient Safety: Issues for the Trauma Team” –
Professor Drew Dawson Mar 23 Cancelled
NOTE: The Paediatric Monthly Rounds are discussed in the Paediatric Trauma Report in this document.
Regional Trauma Services 2006/2007
- 14 -
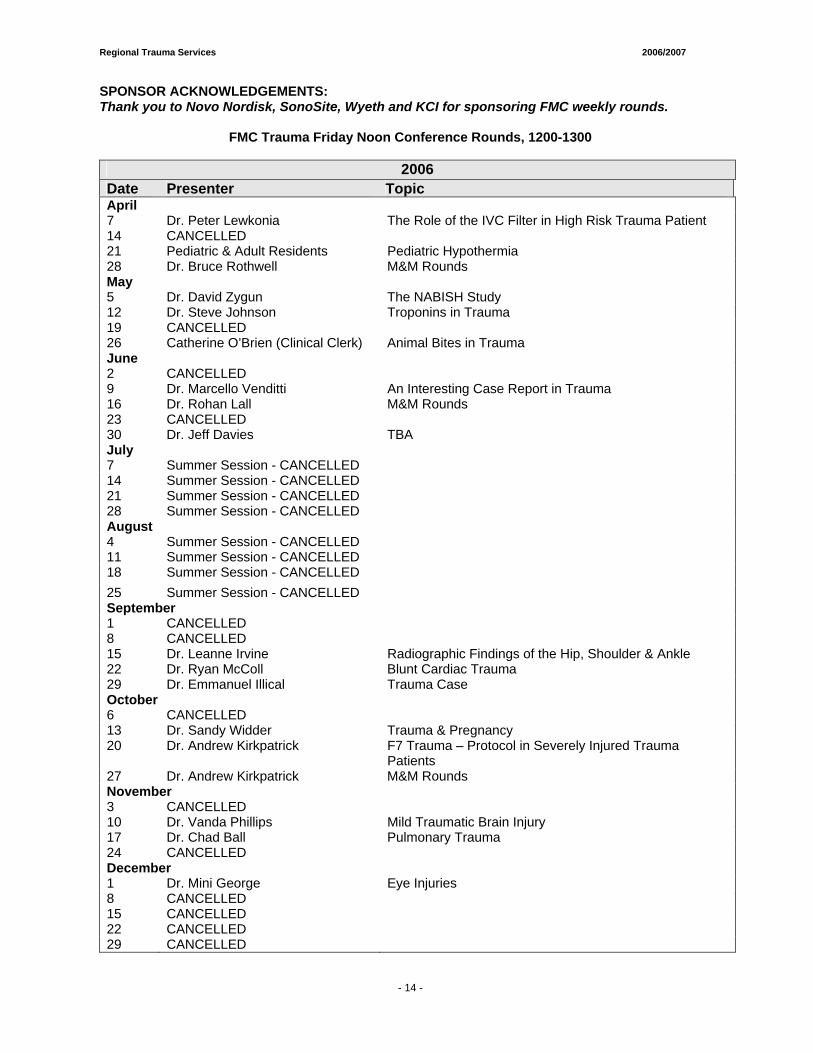
SPONSOR ACKNOWLEDGEMENTS: Thank you to Novo Nordisk, SonoSite, Wyeth and KCI for sponsoring FMC weekly rounds.
FMC Trauma Friday Noon Conference Rounds, 1200-1300
2006 Date Presenter Topic April 7 Dr. Peter Lewkonia The Role of the IVC Filter in High Risk Trauma Patient 14 CANCELLED 21 Pediatric & Adult Residents Pediatric Hypothermia 28 Dr. Bruce Rothwell M&M Rounds May 5 Dr. David Zygun The NABISH Study 12 Dr. Steve Johnson Troponins in Trauma 19 CANCELLED 26 Catherine O’Brien (Clinical Clerk) Animal Bites in Trauma June 2 CANCELLED 9 Dr. Marcello Venditti An Interesting Case Report in Trauma 16 Dr. Rohan Lall M&M Rounds 23 CANCELLED 30 Dr. Jeff Davies TBA July 7 Summer Session - CANCELLED 14 Summer Session - CANCELLED 21 Summer Session - CANCELLED 28 Summer Session - CANCELLED August 4 Summer Session - CANCELLED 11 Summer Session - CANCELLED 18 Summer Session - CANCELLED 25 Summer Session - CANCELLED September 1 CANCELLED 8 CANCELLED 15 Dr. Leanne Irvine Radiographic Findings of the Hip, Shoulder & Ankle 22 Dr. Ryan McColl Blunt Cardiac Trauma 29 Dr. Emmanuel Illical Trauma Case October 6 CANCELLED 13 Dr. Sandy Widder Trauma & Pregnancy 20 Dr. Andrew Kirkpatrick F7 Trauma – Protocol in Severely Injured Trauma
Patients 27 Dr. Andrew Kirkpatrick M&M Rounds November 3 CANCELLED 10 Dr. Vanda Phillips Mild Traumatic Brain Injury 17 Dr. Chad Ball Pulmonary Trauma 24 CANCELLED December 1 Dr. Mini George Eye Injuries 8 CANCELLED 15 CANCELLED 22 CANCELLED 29 CANCELLED
Regional Trauma Services 2006/2007
- 15 -
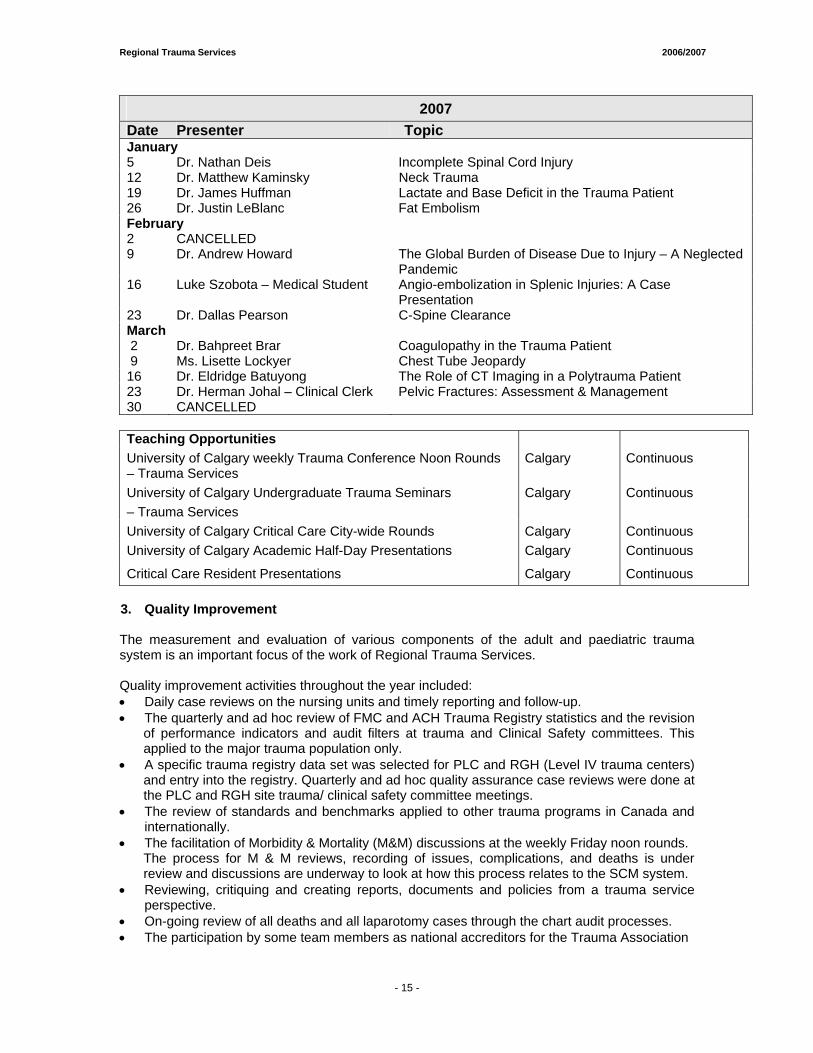
2007 Date Presenter Topic January 5 Dr. Nathan Deis Incomplete Spinal Cord Injury 12 Dr. Matthew Kaminsky Neck Trauma 19 Dr. James Huffman Lactate and Base Deficit in the Trauma Patient 26 Dr. Justin LeBlanc Fat Embolism February 2 CANCELLED 9 Dr. Andrew Howard The Global Burden of Disease Due to Injury – A Neglected
Pandemic 16 Luke Szobota – Medical Student Angio-embolization in Splenic Injuries: A Case
Presentation 23 Dr. Dallas Pearson C-Spine Clearance March 2 Dr. Bahpreet Brar Coagulopathy in the Trauma Patient 9 Ms. Lisette Lockyer Chest Tube Jeopardy 16 Dr. Eldridge Batuyong The Role of CT Imaging in a Polytrauma Patient 23 Dr. Herman Johal – Clinical Clerk Pelvic Fractures: Assessment & Management 30 CANCELLED
Teaching Opportunities University of Calgary weekly Trauma Conference Noon Rounds – Trauma Services
Calgary Continuous
University of Calgary Undergraduate Trauma Seminars – Trauma Services
Calgary Continuous
University of Calgary Critical Care City-wide Rounds Calgary Continuous University of Calgary Academic Half-Day Presentations Calgary Continuous
Critical Care Resident Presentations Calgary Continuous 3. Quality Improvement
The measurement and evaluation of various components of the adult and paediatric trauma system is an important focus of the work of Regional Trauma Services. Quality improvement activities throughout the year included: • Daily case reviews on the nursing units and timely reporting and follow-up. • The quarterly and ad hoc review of FMC and ACH Trauma Registry statistics and the revision
of performance indicators and audit filters at trauma and Clinical Safety committees. This applied to the major trauma population only.
• A specific trauma registry data set was selected for PLC and RGH (Level IV trauma centers) and entry into the registry. Quarterly and ad hoc quality assurance case reviews were done at the PLC and RGH site trauma/ clinical safety committee meetings.
• The review of standards and benchmarks applied to other trauma programs in Canada and internationally. • The facilitation of Morbidity & Mortality (M&M) discussions at the weekly Friday noon rounds.
The process for M & M reviews, recording of issues, complications, and deaths is under review and discussions are underway to look at how this process relates to the SCM system.
• Reviewing, critiquing and creating reports, documents and policies from a trauma service perspective. • On-going review of all deaths and all laparotomy cases through the chart audit processes. • The participation by some team members as national accreditors for the Trauma Association
Regional Trauma Services 2006/2007
- 15 -
of Canada. • The posting of new or revised protocols and guidelines on the internal web site for application
to practice. • The posting of the Trauma Services Annual Report on the internal and external website and the Trauma Association of Canada website. • Working with Capital Health Region to finalize a provincial Data Dictionary for Trauma Registry and with national partners to finalize a national Data Dictionary. • Two members of the Trauma Services team presented a poster at the Trauma Association of
Canada conference in Ottawa. The topic was Trauma Registry: A data source for economic and resource predictions.
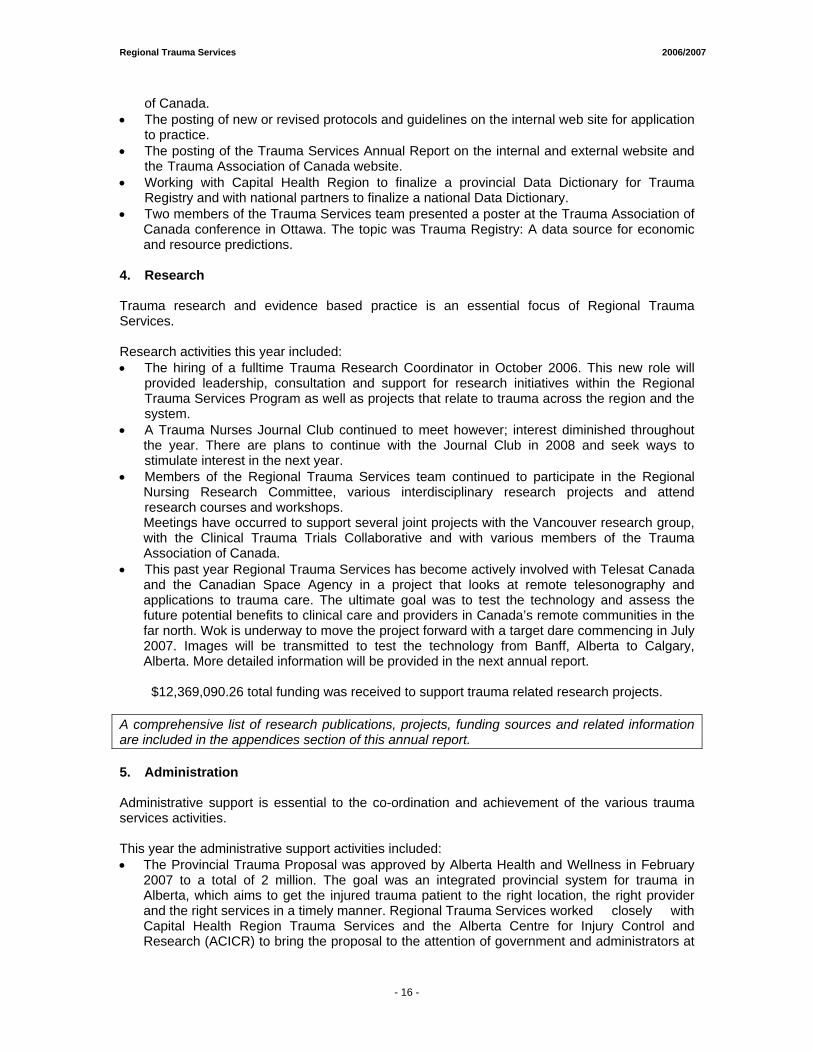
4. Research Trauma research and evidence based practice is an essential focus of Regional Trauma Services. Research activities this year included: • The hiring of a fulltime Trauma Research Coordinator in October 2006. This new role will
provided leadership, consultation and support for research initiatives within the Regional Trauma Services Program as well as projects that relate to trauma across the region and the system.
• A Trauma Nurses Journal Club continued to meet however; interest diminished throughout the year. There are plans to continue with the Journal Club in 2008 and seek ways to stimulate interest in the next year.
• Members of the Regional Trauma Services team continued to participate in the Regional Nursing Research Committee, various interdisciplinary research projects and attend research courses and workshops. Meetings have occurred to support several joint projects with the Vancouver research group, with the Clinical Trauma Trials Collaborative and with various members of the Trauma Association of Canada.
• This past year Regional Trauma Services has become actively involved with Telesat Canada and the Canadian Space Agency in a project that looks at remote telesonography and applications to trauma care. The ultimate goal was to test the technology and assess the future potential benefits to clinical care and providers in Canada’s remote communities in the far north. Wok is underway to move the project forward with a target dare commencing in July 2007. Images will be transmitted to test the technology from Banff, Alberta to Calgary, Alberta. More detailed information will be provided in the next annual report.
$12,369,090.26 total funding was received to support trauma related research projects.
A comprehensive list of research publications, projects, funding sources and related information are included in the appendices section of this annual report. 5. Administration Administrative support is essential to the co-ordination and achievement of the various trauma services activities. This year the administrative support activities included: • The Provincial Trauma Proposal was approved by Alberta Health and Wellness in February
2007 to a total of 2 million. The goal was an integrated provincial system for trauma in Alberta, which aims to get the injured trauma patient to the right location, the right provider and the right services in a timely manner. Regional Trauma Services worked closely with Capital Health Region Trauma Services and the Alberta Centre for Injury Control and Research (ACICR) to bring the proposal to the attention of government and administrators at
- 16 -
Regional Trauma Services 2006/2007
- 15 -
the proposed District Centres. These centres included Lethbridge Regional Hospital, Red Deer Regional Hospital, Medicine Hat Regional Hospital, Queen Elizabeth II Hospital in Grand Prairie and the Northern Lights Regional Hospital in Fort McMurray. The proposal was revised in November 2005 to include a detailed budget, updated references and action plans.
• Maintaining ongoing links with the Trauma Association of Canada (TAC). Ms. Christi Findlay, Data Analyst, sat on the National Executive for the Trauma Registry Information Specialists of Canada (TRISC). Ms. Dianne Dyer sat on the TAC Executive representing the TAC Central Office and as Vice Chairperson for the Canadian Forces Medical Liaison/Disaster Committee. Dr. John Kortbeek, Medical Director for the TAC central office and Dr. Andrew Kirkpatrick (TAC President-Elect) sat on the TAC Executive. Ms. Natalie Hohman, Trauma Services Administrative Assistant, assumed the role of the office coordinator for the TAC Central Office, located as part of the Calgary Regional Trauma Services Office. Ms. Michelle Mercado assumed the position as webmaster for the Trauma Association of Canada and revised the TAC website.
• Acquisition of funding to support weekly and monthly Trauma Rounds, the Trauma Nurses Journal Club, educational opportunities for staff and staff resources. External and operational funding was acquired to send team members to the Trauma Association of Canada (TAC) Scientific meeting held in Ottawa, Ontario.
• Acquisition of funding from the Trauma Association of Canada (TAC) to support the TAC central office coordinator role and webmaster within Regional Trauma Services.
• Acquisition of funding from Advanced Trauma Life Support (ATLS®) to support the ATLS® secretarial support role within Regional Trauma Services.
• Submission of annual reports to Province Wide Services (PWS) and continued meeting with the Regional PWS representative to ensure input into PWS funding allocations.
• Participation in the FMC and Regional Disaster planning meetings to ensure input from Trauma Services and access to updates on new developments. Regional Trauma Services participated actively in the Calgary Health Region disaster plan.
• Monitoring and management of the Trauma Research Fund and smaller research funds under the University of Calgary Peoplesoft Program.
• Continued meetings with the Regional PWS representative to ensure input into PWS funding allocations.
• Participation in the planning for the Simulator Education Centre. Trauma Services will be a partner in this Centre in the future.
• Collaboration with multiple partners at the ACH and FMC site to prepare a proposal to improve and support the care of the paediatric trauma patient (age < 14). The proposal was submitted to Administration for funding in June 2007 and again in November 2007. Support was received. Awaiting next steps.
• A team retreat was planned for June 2007 to provide an opportunity for team building, visioning and planning for the future.
• Regional Trauma Services moved to their new location at FMC in November 2006. The new location is on the 7th floor of the FMC, next door to PCU 71 (the Trauma Unit).
- 17 -

Regional Trauma Services 2006/2007
- 15 -
Committee Representation: Calgary Health Region: • ACH, PLC, RGH and FMC Clinical Safety Trauma Committees • FMC Adult Trauma Care Committee (ATCC) • FMC Trauma Resuscitation Committee • ACH Trauma Committee • SW Portfolio Meetings • Surgical Executive Committee • FMC Site Manager Meetings • City-wide Surgical Managers Meetings • Site Surgical Process Operations Committee (SSPOC) • Regional Disaster Planning Committee • FMC Disaster and Emergency Response Planning Committee • Calgary Injury Prevention Coalition • Intensive Care Unit (ICU) Executive Committee • ICU Quality Council Committee • Regional Nursing Research Committee Provincial: • American College of Surgeons, Alberta Chapter • College and Association of Registered Nurses National: • The TAC Conference Planning Committee • The Canadian Trauma Trials Collaborative (CTTC) • The TAC Accreditation Committee • The TAC Executive Committee • The TAC Abstract Review Panel • The TAC Canadian Forces Medical Liaison/Disaster Committee • The Royal College of Physicians & Surgeons of Canada Test Committee for General Surgery • The Trauma Registry Information Specialists of Canada (TRISC) Committee • Canadian Nurses' Association International: • American College of Surgeons, Alberta Chapter • American College of Surgeons Committee on Trauma & ATLS® Subcommittee • Editorial Review Panel, Journal of Trauma & Injury • Calgary, Critical Care Fellowship Steering Committee
- 18 -
Regional Trauma Services 2006/2007
- 15 -
6. Human Resource Activities
• Ms. Sherry MacGillivray was hired as the fulltime Regional Paediatric Trauma Coordinator commencing on. November 27, 2006.
• The Clinical Nurse Specialist (CNS) position for Adult Trauma was reclassified to fulltime in 2007. Ms. Barbara Matiakis was hired into the CNS role on March 5, 2007.
• Ms. Natalie Hohman was hired as the fulltime Administrative Assistant for Regional Trauma Services on March 19, 2007. This role also includes Office Coordinator for the Trauma Association of Canada central office.
• New funding was acquired for Data Analysts in 2006. Ms. Michelle Mercado was hired as a fulltime Data Analyst on February 19, 2007. Michelle also assumed the role of Webmaster for the Trauma Association of Canada website.
• New funding was acquired for a fulltime Regional Trauma Research Coordinator. Dr. Kent Ranson was hired into this new role on October 16, 2006.
• Ms. Alma Badnjevic was hired as a temporary fulltime Data Analyst to replace Ms. Sukhi Lally for a leave. She commenced in this role on March 19, 2007.
7. Data Management
As part of TAC guidelines, an accredited trauma centre requires a trauma registry. Both FMC and ACH have stand-alone trauma registries, in use since April 1995. The PLC and RGH, although not accredited trauma centres, implemented the registry in the fall of 2005 as part of the Trauma System. The software, Collector, was developed by an American company and is supported by Digital Innovation based out of Maryland, USA. This application is used by over 200 hospitals worldwide including hospitals in Canada, the U.S., Australia, New Zealand and Sweden. It is a complete data management tool and report writing package. To qualify for the trauma registry, a patient must have an Injury Severity Score (ISS) > 12 and be admitted to the trauma centre or die in the emergency department of the trauma centre. ISS is an anatomical scoring tool that provides an overall score for patients with single system or multiple system injuries. Each injury is assigned an Abbreviated Injury Scale (AIS) score and is allocated to one of six body regions (head, including cervical spine; face; chest, including thoracic spine; abdomen, including lumbar spine; extremities, including pelvis; and external). Only the highest AIS score in each body region is used when calculating the ISS. The three most severely injured body regions have their highest score squared and added together to produce the ISS score. The higher the ISS score; the more severe the patient’s injuries. To ensure all appropriate patients are included into the trauma registry, all injury admissions, discharges and emergency department resuscitations are reviewed at FMC and ACH. This fiscal year, 4139 (3870 05/06) FMC patient records and 760 (798 05/06) ACH patient records were reviewed to determine eligibility for the trauma registry. This is an increase of 7% at FMC and a decrease of 4.8% at ACH from last year. Once registry eligibility was determined, data was abstracted from the patient record and manually entered into the trauma registry. At the PLC and RGH, patients are selected for review based on discharge diagnosis. Please see the PLC and RGH Reports for further information. Data collected includes patient demographics, mechanism of injury information, pre-hospital information, sending hospital information, trauma centre emergency department information, trauma centre inpatient information including operative information, injury diagnosis information, outcome information and specific audit filters and performance indicators. The Health Information Act (HIA), section 27(1) (g), outlines clearly the parameters whereby Trauma Services is authorized to collect this data:
27 (l) A custodian may use individually identifying health information in its custody or under its control for the following purposes:
- 19 -
Regional Trauma Services 2006/2007
- 15 -
(g) for internal management purposes, including planning, resource allocation, policy development, quality improvement, monitoring, audit, evaluation, reporting, obtaining or processing payment for health services and human resource management.
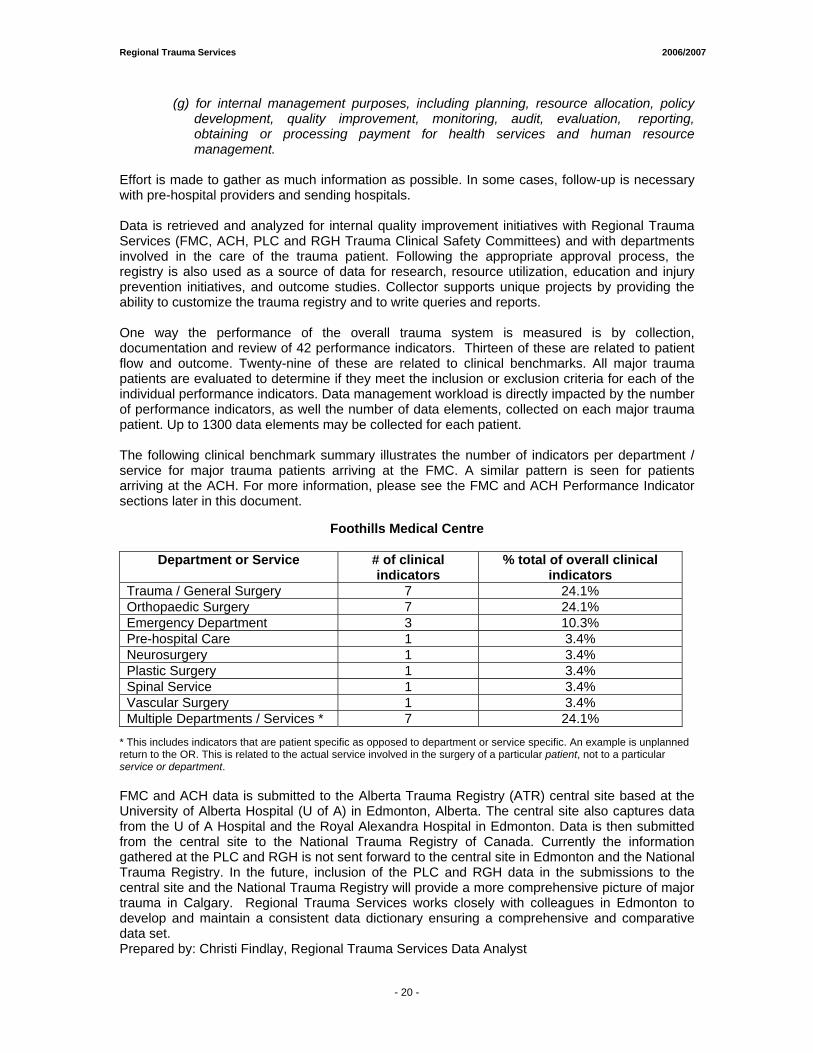
Effort is made to gather as much information as possible. In some cases, follow-up is necessary with pre-hospital providers and sending hospitals. Data is retrieved and analyzed for internal quality improvement initiatives with Regional Trauma Services (FMC, ACH, PLC and RGH Trauma Clinical Safety Committees) and with departments involved in the care of the trauma patient. Following the appropriate approval process, the registry is also used as a source of data for research, resource utilization, education and injury prevention initiatives, and outcome studies. Collector supports unique projects by providing the ability to customize the trauma registry and to write queries and reports. One way the performance of the overall trauma system is measured is by collection, documentation and review of 42 performance indicators. Thirteen of these are related to patient flow and outcome. Twenty-nine of these are related to clinical benchmarks. All major trauma patients are evaluated to determine if they meet the inclusion or exclusion criteria for each of the individual performance indicators. Data management workload is directly impacted by the number of performance indicators, as well the number of data elements, collected on each major trauma patient. Up to 1300 data elements may be collected for each patient. The following clinical benchmark summary illustrates the number of indicators per department / service for major trauma patients arriving at the FMC. A similar pattern is seen for patients arriving at the ACH. For more information, please see the FMC and ACH Performance Indicator sections later in this document.
Foothills Medical Centre
Department or Service # of clinical indicators
% total of overall clinical indicators
Trauma / General Surgery 7 24.1% Orthopaedic Surgery 7 24.1% Emergency Department 3 10.3% Pre-hospital Care 1 3.4% Neurosurgery 1 3.4% Plastic Surgery 1 3.4% Spinal Service 1 3.4% Vascular Surgery 1 3.4% Multiple Departments / Services * 7 24.1%
* This includes indicators that are patient specific as opposed to department or service specific. An example is unplanned return to the OR. This is related to the actual service involved in the surgery of a particular patient, not to a particular service or department. FMC and ACH data is submitted to the Alberta Trauma Registry (ATR) central site based at the University of Alberta Hospital (U of A) in Edmonton, Alberta. The central site also captures data from the U of A Hospital and the Royal Alexandra Hospital in Edmonton. Data is then submitted from the central site to the National Trauma Registry of Canada. Currently the information gathered at the PLC and RGH is not sent forward to the central site in Edmonton and the National Trauma Registry. In the future, inclusion of the PLC and RGH data in the submissions to the central site and the National Trauma Registry will provide a more comprehensive picture of major trauma in Calgary. Regional Trauma Services works closely with colleagues in Edmonton to develop and maintain a consistent data dictionary ensuring a comprehensive and comparative data set. Prepared by: Christi Findlay, Regional Trauma Services Data Analyst
- 20 -
Regional Trauma Services 2006/2007
- 15 -
Current Projects/Future Directions These are just a few of the Regional Trauma Services projects planned for the next year: • A team retreat is scheduled for June 2008. The focus will be three of the Regional Trauma Services top priorities:
o Pediatric Trauma Program Enhancement o Provincial Trauma System Work o Injury Prevention: Brief Intervention for alcohol related trauma
• The introduction of a fourth fulltime Data Analyst and the hiring of a part-time Data Entry Clerk to support the quality/safety data management and reporting, research and new initiatives. These include the introduction of SCM, Trauma ICD-10 Coding, the new AIS Coding and new safety initiatives and to provincial work. Plans are underway for hiring an additional 0.5 FTE Data Analyst to backfill the ACH Data Analyst to allow more dedicated time for the pediatric data management processes.
• The development of a process for statistical/data management on PCU 71 (the Trauma Unit) at FMC.
• Explore new ways to track Mortality and Morbidity data through SCM. • Explore new ways to initiate CNS referrals through SCM. • Acquisition of external funding for staff education and Trauma Rounds. • Further development of the trauma research program with the new leadership role. • Establishment of the fulltime Nurse Practitioner role to support clinical practice and quality
assurance. • Re-development of the Trauma Services internal and external website, including both Adult
and Pediatric protocols, projects and new initiatives. • Regional and Public Communication Projects • Participation and leadership in the new integrated Provincial Trauma System. • Implementation of Brief Intervention for alcohol related trauma project on PCU 71. • Continued support for the enhancement of the Pediatric Trauma Program. (more details in
the ACH Trauma Program Report) • Continued work on the application of Trauma Registry to the data collection and case review
processes at PLC and RGH. • Explore new data management strategies that gather both retrospective and prospective data
to support timely quality improvement and clinical care initiatives. • Continued updates and revisions to Trauma Orientation Manuals for FMC and ACH. • Explore ways to measure patient and family satisfaction within the trauma system and
address concerns once identified. • Begin discussions and work towards Trauma Accreditation in 2010 with the new June 2007
TAC Accreditation Guidelines. • Participation in the planning process for the new South Health Campus. • Seek opportunities to benchmark trauma care with national and international groups. • Continued active participation in the Trauma Association of Canada committees,
accreditation processes, research and management and coordination of the TAC central office.
Regional Trauma Services will continue to promote the integrated Provincial Trauma System proposal and support system performance through data management and quality improvement projects and initiatives based on current trauma research, clinical evidence and measurement of performance. Note: For additional detailed information on Future Directions for pediatric trauma care please see the ACH Trauma Program report.
- 21 -

Regional Trauma & Injury Statistics Summaries FFOOOOTTHHIILLLLSS MMEEDDIICCAALL CCEENNTTRREE AALLBBEERRTTAA CCHHIILLDDRREENN’’SS HHOOSSPPIITTAALL PPEETTEERR LLOOUUGGHHEEEEDD CCEENNTTRREE RROOCCKKYYVVIIEEWW GGEENNEERRAALL HHOOSSPPIITTAALL Project Leads: • Ms. Christi Findlay, Data Analyst Regional Trauma Services • Ms. Maria Vivas, Data Analyst Regional Trauma Services

Regional Trauma Services 2006/2007
Traumatic Injury Inpatient Summary >18 years of age by Site and Month (QSHI)
# of
pat
ient
s
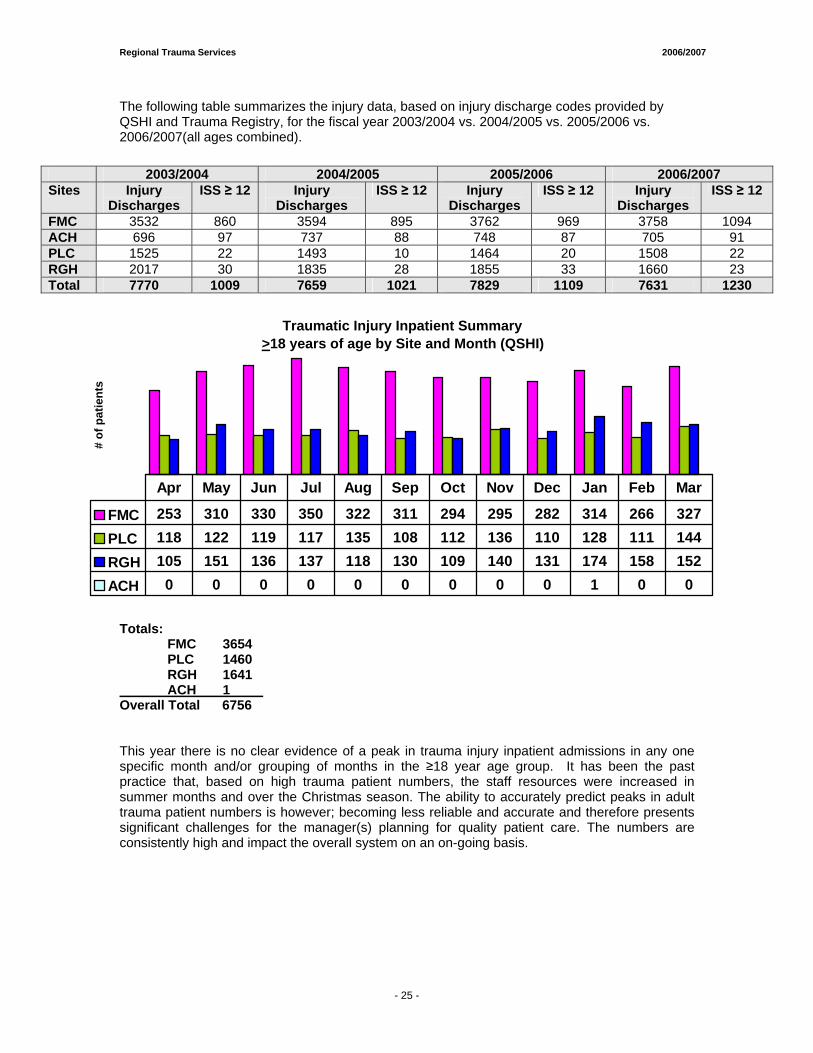
FMC 253 310 330 350 322 311 294 295 282 314 266 327PLC 118 122 119 117 135 108 112 136 110 128 111 144RGH 105 151 136 137 118 130 109 140 131 174 158 152ACH 0 0 0 0 0 0 0 0 0 1 0 0
Apr May Jun Jul Aug Sep Oct Nov Dec Jan Feb Mar
The following table summarizes the injury data, based on injury discharge codes provided by QSHI and Trauma Registry, for the fiscal year 2003/2004 vs. 2004/2005 vs. 2005/2006 vs. 2006/2007(all ages combined).
Totals: FMC 3654 PLC 1460 RGH 1641 ACH 1 Overall Total 6756 This year there is no clear evidence of a peak in trauma injury inpatient admissions in any one specific month and/or grouping of months in the ≥18 year age group. It has been the past practice that, based on high trauma patient numbers, the staff resources were increased in summer months and over the Christmas season. The ability to accurately predict peaks in adult trauma patient numbers is however; becoming less reliable and accurate and therefore presents significant challenges for the manager(s) planning for quality patient care. The numbers are consistently high and impact the overall system on an on-going basis.
2003/2004 2004/2005 2005/2006 2006/2007 Sites Injury
Discharges ISS ≥ 12 Injury
Discharges ISS ≥ 12 Injury
Discharges ISS ≥ 12 Injury
Discharges ISS ≥ 12
FMC 3532 860 3594 895 3762 969 3758 1094 ACH 696 97 737 88 748 87 705 91 PLC 1525 22 1493 10 1464 20 1508 22 RGH 2017 30 1835 28 1855 33 1660 23 Total 7770 1009 7659 1021 7829 1109 7631 1230
- 25 -
Regional Trauma Services 2006/2007
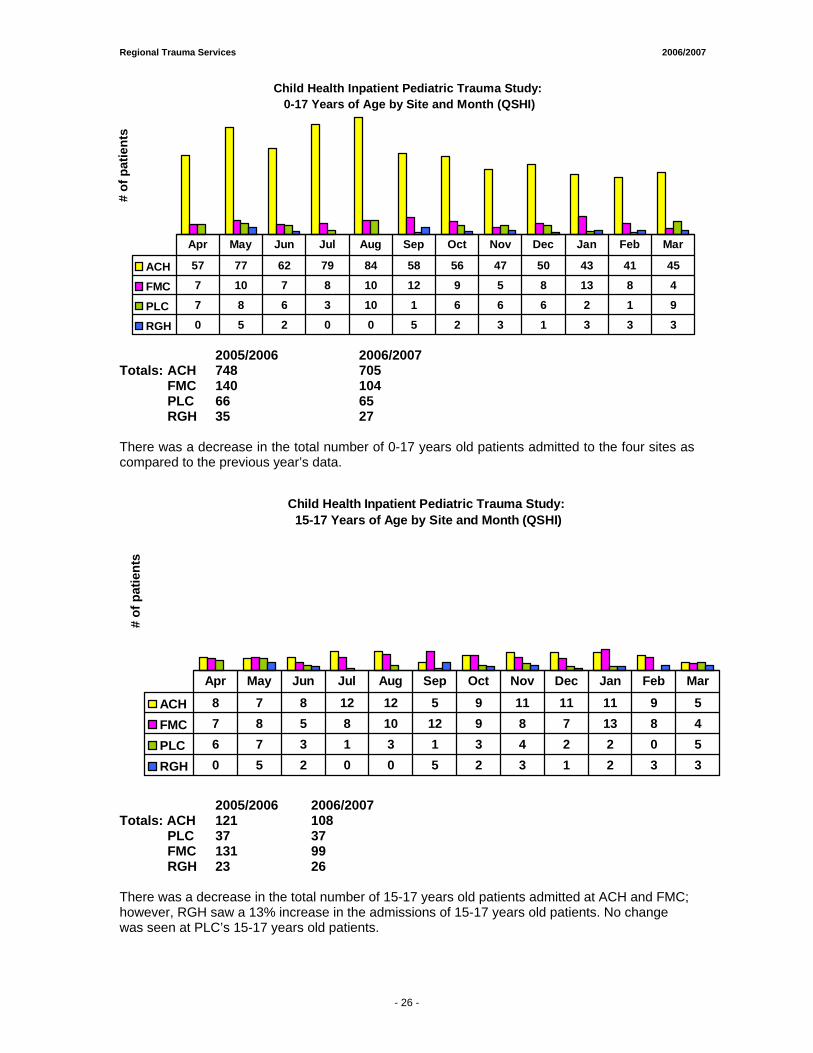
Child Health Inpatient Pediatric Trauma Study: 0-17 Years of Age by Site and Month (QSHI)
# of
pat
ient
s
ACH 57 77 62 79 84 58 56 47 50 43 41 45
FMC 7 10 7 8 10 12 9 5 8 13 8 4
PLC 7 8 6 3 10 1 6 6 6 2 1 9
RGH 0 5 2 0 0 5 2 3 1 3 3 3
Apr May Jun Jul Aug Sep Oct Nov Dec Jan Feb Mar
2005/2006 2006/2007 Totals: ACH 748 705 FMC 140 104 PLC 66 65 RGH 35 27 There was a decrease in the total number of 0-17 years old patients admitted to the four sites as compared to the previous year’s data.
Child Health Inpatient Pediatric Trauma Study: 15-17 Years of Age by Site and Month (QSHI)
# of
pat
ient
s
ACH 8 7 8 12 12 5 9 11 11 11 9 5FMC 7 8 5 8 10 12 9 8 7 13 8 4PLC 6 7 3 1 3 1 3 4 2 2 0 5RGH 0 5 2 0 0 5 2 3 1 2 3 3
Apr May Jun Jul Aug Sep Oct Nov Dec Jan Feb Mar
2005/2006 2006/2007
Totals: ACH 121 108 PLC 37 37 FMC 131 99 RGH 23 26
There was a decrease in the total number of 15-17 years old patients admitted at ACH and FMC; however, RGH saw a 13% increase in the admissions of 15-17 years old patients. No change was seen at PLC’s 15-17 years old patients.
- 26 -
Major Trauma Statistics & Outcome Data FFOOOOTTHHIILLLLSS MMEEDDIICCAALL CCEENNTTRREE Project Lead: • Ms. Christi Findlay, Data Analyst Regional Trauma Services

Regional Trauma Services 2006/2007
- 35 -
MONTHLY TRAUMA TOTALS
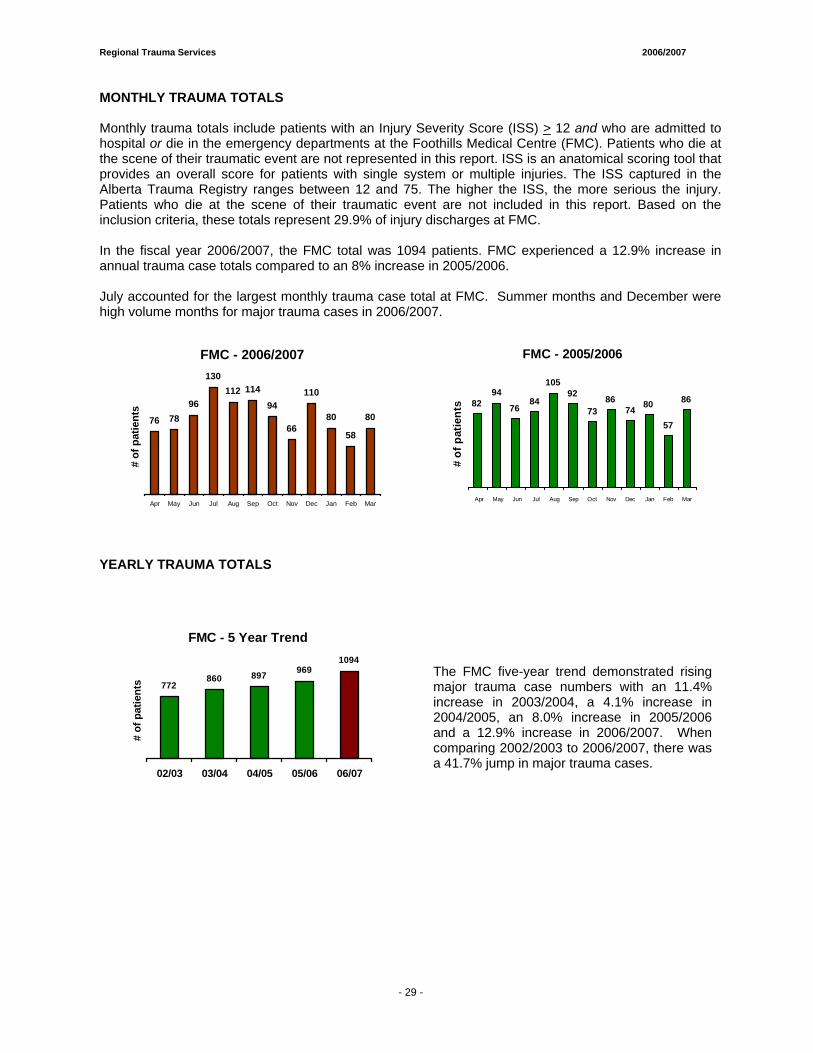
Monthly trauma totals include patients with an Injury Severity Score (ISS) > 12 and who are admitted to hospital or die in the emergency departments at the Foothills Medical Centre (FMC). Patients who die at the scene of their traumatic event are not represented in this report. ISS is an anatomical scoring tool that provides an overall score for patients with single system or multiple injuries. The ISS captured in the Alberta Trauma Registry ranges between 12 and 75. The higher the ISS, the more serious the injury. Patients who die at the scene of their traumatic event are not included in this report. Based on the inclusion criteria, these totals represent 29.9% of injury discharges at FMC. In the fiscal year 2006/2007, the FMC total was 1094 patients. FMC experienced a 12.9% increase in annual trauma case totals compared to an 8% increase in 2005/2006. July accounted for the largest monthly trauma case total at FMC. Summer months and December were high volume months for major trauma cases in 2006/2007.
FMC - 2006/2007
76 7896
130112 114
94
66
110
80
58
80
Apr May Jun Jul Aug Sep Oct Nov Dec Jan Feb Mar
# of
pat
ient
s
FMC - 2005/2006
8294
7684
10592
7386
74 80
57
86
Apr May Jun Jul Aug Sep Oct Nov Dec Jan Feb Mar
# of
pat
ient
s
YEARLY TRAUMA TOTALS
FMC - 5 Year Trend
772860 897 969
1094
02/03 03/04 04/05 05/06 06/07
# of
pat
ient
s
The FMC five-year trend demonstrated rising major trauma case numbers with an 11.4% increase in 2003/2004, a 4.1% increase in 2004/2005, an 8.0% increase in 2005/2006 and a 12.9% increase in 2006/2007. When comparing 2002/2003 to 2006/2007, there was a 41.7% jump in major trauma cases.
- 29 -
Regional Trauma Services 2006/2007
- 35 -
1,050 1,0991,147
1,1961,244 1,293
1,3411,390
1,438
920
1,6111,552
1,4941,435
1,3761,3181,2591,2001,142
1,083
969
790860
767
894
1,2651,2271,1881,1501,1121,073
1,035997958
0
200
400
600
800
1,000
1,200
1,400
1,600
1,800
01/02
02/03
03/04
04/05
05/06
06/07
07/08
08/09
09/10
10/11
11/12
12/13
13/14
14/15
15/16
High Most Likely Low
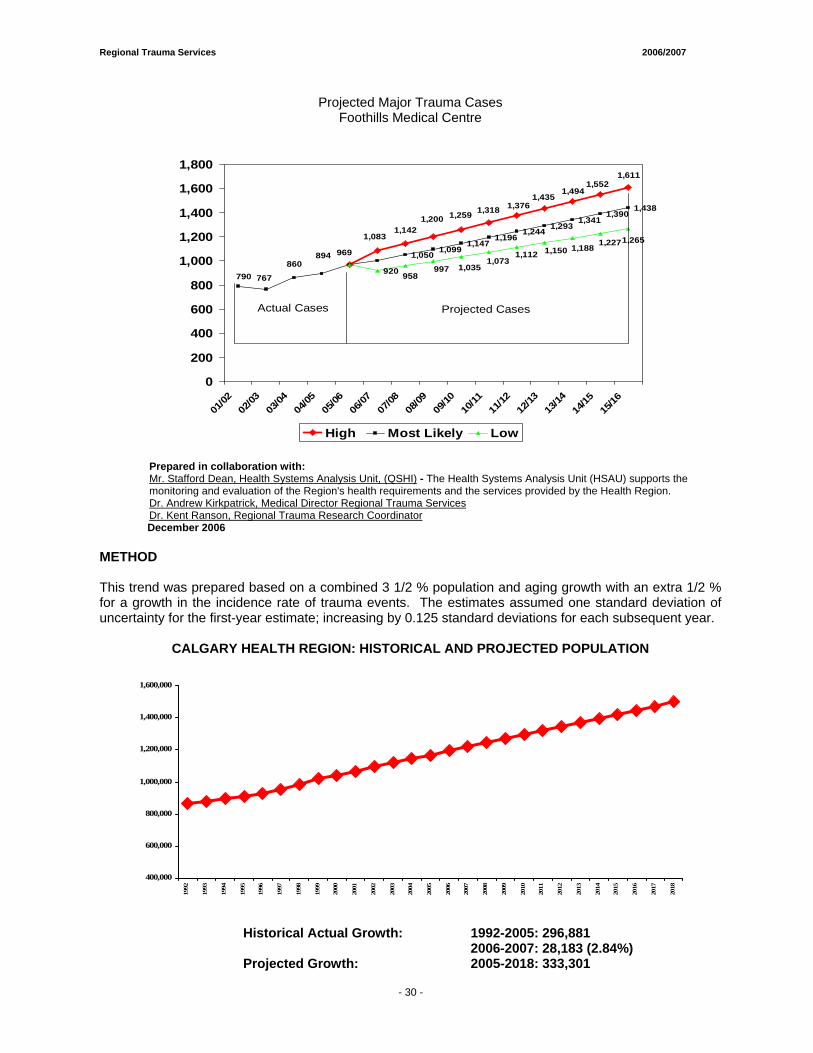
Projected Trauma CasesFoothills Medical Centre
Actual Cases Projected Cases
Prepared in collaboration with: Mr. Stafford Dean, Health Systems Analysis Unit, (QSHI) - The Health Systems Analysis Unit (HSAU) supports the monitoring and evaluation of the Region's health requirements and the services provided by the Health Region. Dr. Andrew Kirkpatrick, Medical Director Regional Trauma Services Dr. Kent Ranson, Regional Trauma Research Coordinator
December 2006 METHOD This trend was prepared based on a combined 3 1/2 % population and aging growth with an extra 1/2 % for a growth in the incidence rate of trauma events. The estimates assumed one standard deviation of uncertainty for the first-year estimate; increasing by 0.125 standard deviations for each subsequent year.
CALGARY HEALTH REGION: HISTORICAL AND PROJECTED POPULATION
Historical Actual Growth: 1992-2005: 296,881 2006-2007: 28,183 (2.84%) Projected Growth: 2005-2018: 333,301
400,000
600,000
800,000
1,000,000
1,200,000
1,400,000
1,600,000
1992
1993
1994
1995
1996
1997
1998
1999
2000
2001
2002
2003
2004
2005
2006
2007
2008
2009
2010
2011
2012
2013
2014
2015
2016
2017
2018
Projected Major Trauma Cases Foothills Medical Centre
- 30 -
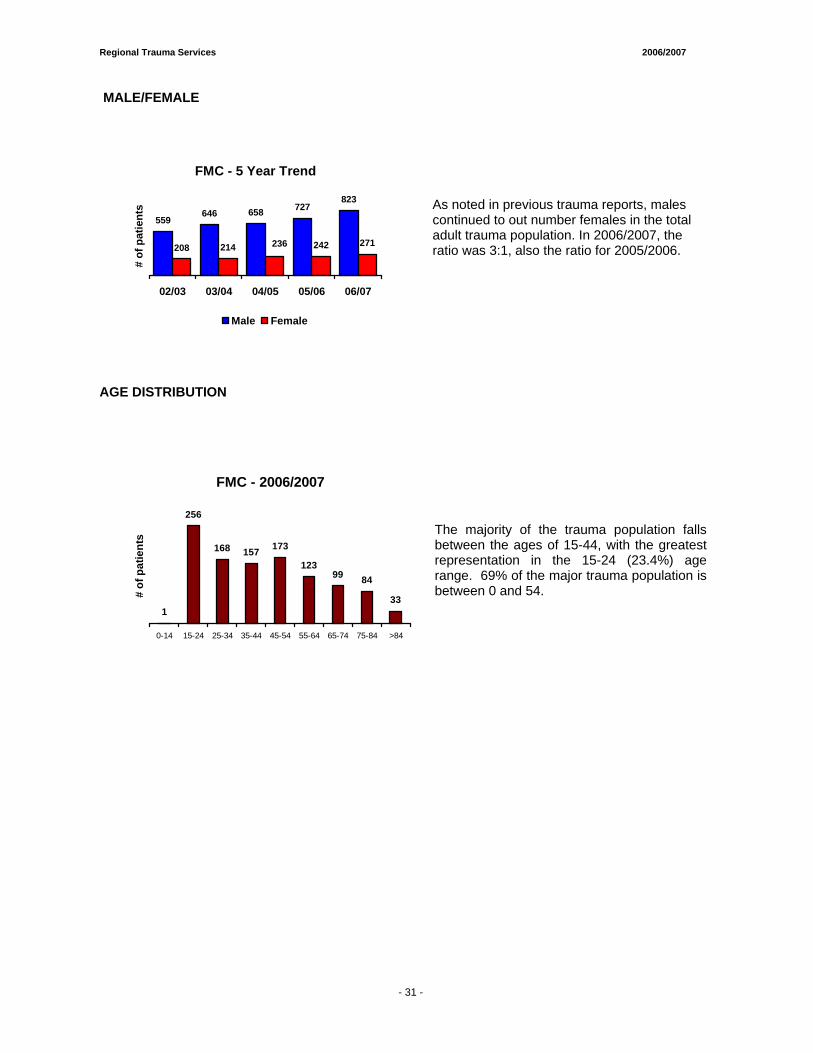
Regional Trauma Services 2006/2007
- 35 -
MALE/FEMALE
FMC - 5 Year Trend
559646 658 727
208 214 242 271
823
236
02/03 03/04 04/05 05/06 06/07
# of
pat
ient
s
Male Female
As noted in previous trauma reports, males continued to out number females in the total adult trauma population. In 2006/2007, the ratio was 3:1, also the ratio for 2005/2006.
AGE DISTRIBUTION
FMC - 2006/2007
1
256
168 157 173
12399 84
33
0-14 15-24 25-34 35-44 45-54 55-64 65-74 75-84 >84
# of
pat
ient
s
The majority of the trauma population falls between the ages of 15-44, with the greatest representation in the 15-24 (23.4%) age range. 69% of the major trauma population is between 0 and 54.
- 31 -
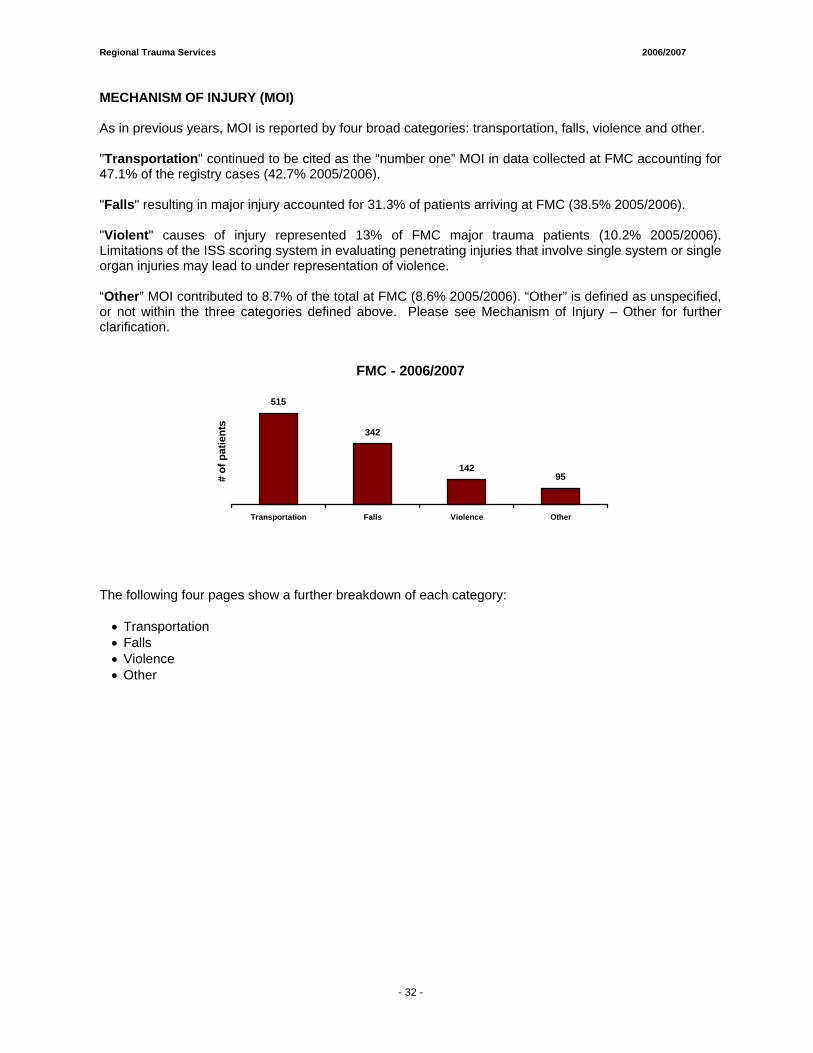
Regional Trauma Services 2006/2007
- 35 -
MECHANISM OF INJURY (MOI) As in previous years, MOI is reported by four broad categories: transportation, falls, violence and other. "Transportation" continued to be cited as the “number one” MOI in data collected at FMC accounting for 47.1% of the registry cases (42.7% 2005/2006). "Falls" resulting in major injury accounted for 31.3% of patients arriving at FMC (38.5% 2005/2006). "Violent" causes of injury represented 13% of FMC major trauma patients (10.2% 2005/2006). Limitations of the ISS scoring system in evaluating penetrating injuries that involve single system or single organ injuries may lead to under representation of violence. “Other” MOI contributed to 8.7% of the total at FMC (8.6% 2005/2006). “Other” is defined as unspecified, or not within the three categories defined above. Please see Mechanism of Injury – Other for further clarification.
FMC - 2006/2007
515
342
14295
Transportation Falls Violence Other
# of
pat
ient
s
The following four pages show a further breakdown of each category:
• Transportation • Falls • Violence • Other
- 32 -
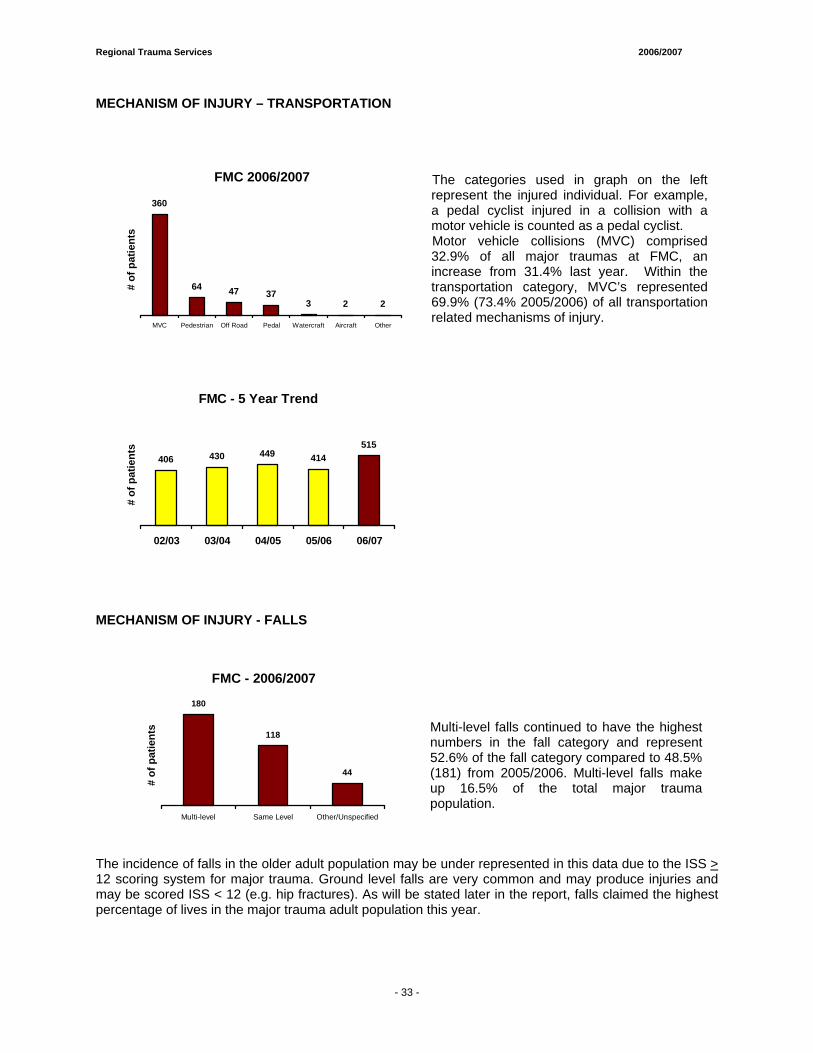
Regional Trauma Services 2006/2007
- 35 -
MECHANISM OF INJURY – TRANSPORTATION
FMC 2006/2007
360
64 47 373 2 2
MVC Pedestrian Off Road Pedal Watercraft Aircraft Other
# of
pat
ient
s
The categories used in graph on the left represent the injured individual. For example, a pedal cyclist injured in a collision with a motor vehicle is counted as a pedal cyclist.
Motor vehicle collisions (MVC) comprised 32.9% of all major traumas at FMC, an increase from 31.4% last year. Within the transportation category, MVC’s represented 69.9% (73.4% 2005/2006) of all transportation related mechanisms of injury.
FMC - 5 Year Trend
406 430 449 414515
02/03 03/04 04/05 05/06 06/07
# of
pat
ient
s
MECHANISM OF INJURY - FALLS
FMC - 2006/2007
180
118
44
Multi-level Same Level Other/Unspecified
# of
pat
ient
s
Multi-level falls continued to have the highest numbers in the fall category and represent 52.6% of the fall category compared to 48.5% (181) from 2005/2006. Multi-level falls make up 16.5% of the total major trauma population.
The incidence of falls in the older adult population may be under represented in this data due to the ISS > 12 scoring system for major trauma. Ground level falls are very common and may produce injuries and may be scored ISS < 12 (e.g. hip fractures). As will be stated later in the report, falls claimed the highest percentage of lives in the major trauma adult population this year.
- 33 -
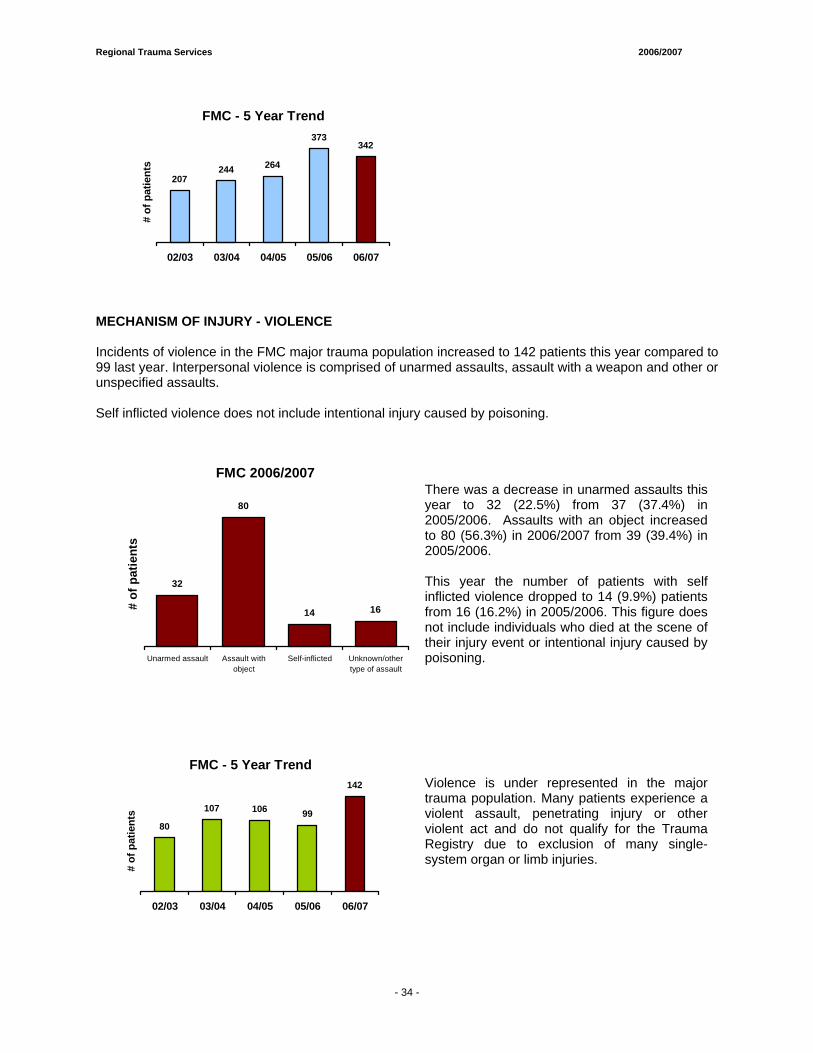
Regional Trauma Services 2006/2007
- 35 -
FMC - 5 Year Trend
207244 264
373342
02/03 03/04 04/05 05/06 06/07
# of
pat
ient
s
MECHANISM OF INJURY - VIOLENCE Incidents of violence in the FMC major trauma population increased to 142 patients this year compared to 99 last year. Interpersonal violence is comprised of unarmed assaults, assault with a weapon and other or unspecified assaults. Self inflicted violence does not include intentional injury caused by poisoning.
FMC 2006/2007
32
80
14 16
Unarmed assault Assault withobject
Self-inflicted Unknown/othertype of assault
# of
pat
ient
s
There was a decrease in unarmed assaults this year to 32 (22.5%) from 37 (37.4%) in 2005/2006. Assaults with an object increased to 80 (56.3%) in 2006/2007 from 39 (39.4%) in 2005/2006. This year the number of patients with self inflicted violence dropped to 14 (9.9%) patients from 16 (16.2%) in 2005/2006. This figure does not include individuals who died at the scene of their injury event or intentional injury caused by poisoning.
FMC - 5 Year Trend
80
107 106 99
142
02/03 03/04 04/05 05/06 06/07
# of
pat
ient
s
Violence is under represented in the major trauma population. Many patients experience a violent assault, penetrating injury or other violent act and do not qualify for the Trauma Registry due to exclusion of many single-system organ or limb injuries.
- 34 -
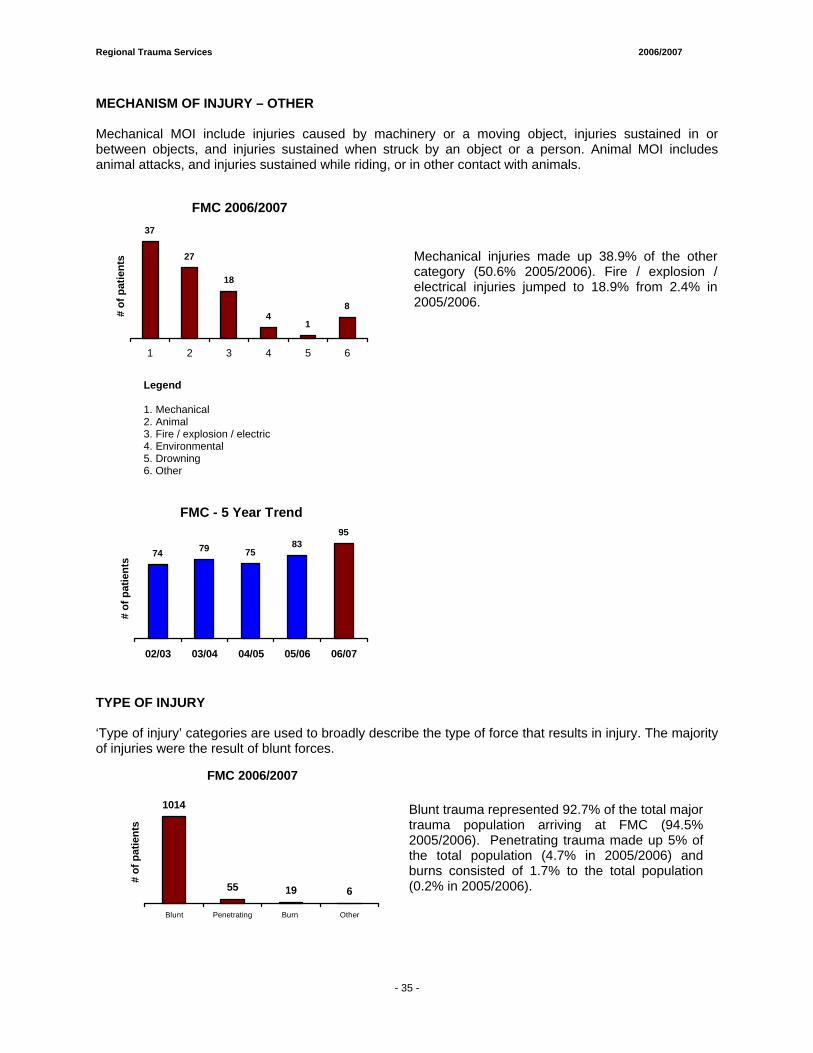
Regional Trauma Services 2006/2007
- 35 -
MECHANISM OF INJURY – OTHER Mechanical MOI include injuries caused by machinery or a moving object, injuries sustained in or between objects, and injuries sustained when struck by an object or a person. Animal MOI includes animal attacks, and injuries sustained while riding, or in other contact with animals.
FMC 2006/200737
27
18
41
8
1 2 3 4 5 6
# of
pat
ient
s
Mechanical injuries made up 38.9% of the other category (50.6% 2005/2006). Fire / explosion / electrical injuries jumped to 18.9% from 2.4% in 2005/2006.
Legend 1. Mechanical 2. Animal 3. Fire / explosion / electric 4. Environmental 5. Drowning 6. Other
FMC - 5 Year Trend
74 79 7583
95
02/03 03/04 04/05 05/06 06/07
# of
pat
ient
s
TYPE OF INJURY ‘Type of injury’ categories are used to broadly describe the type of force that results in injury. The majority of injuries were the result of blunt forces.
FMC 2006/2007
1014
55 19 6
Blunt Penetrating Burn Other
# of
pat
ient
s
Blunt trauma represented 92.7% of the total major trauma population arriving at FMC (94.5% 2005/2006). Penetrating trauma made up 5% of the total population (4.7% in 2005/2006) and burns consisted of 1.7% to the total population (0.2% in 2005/2006).
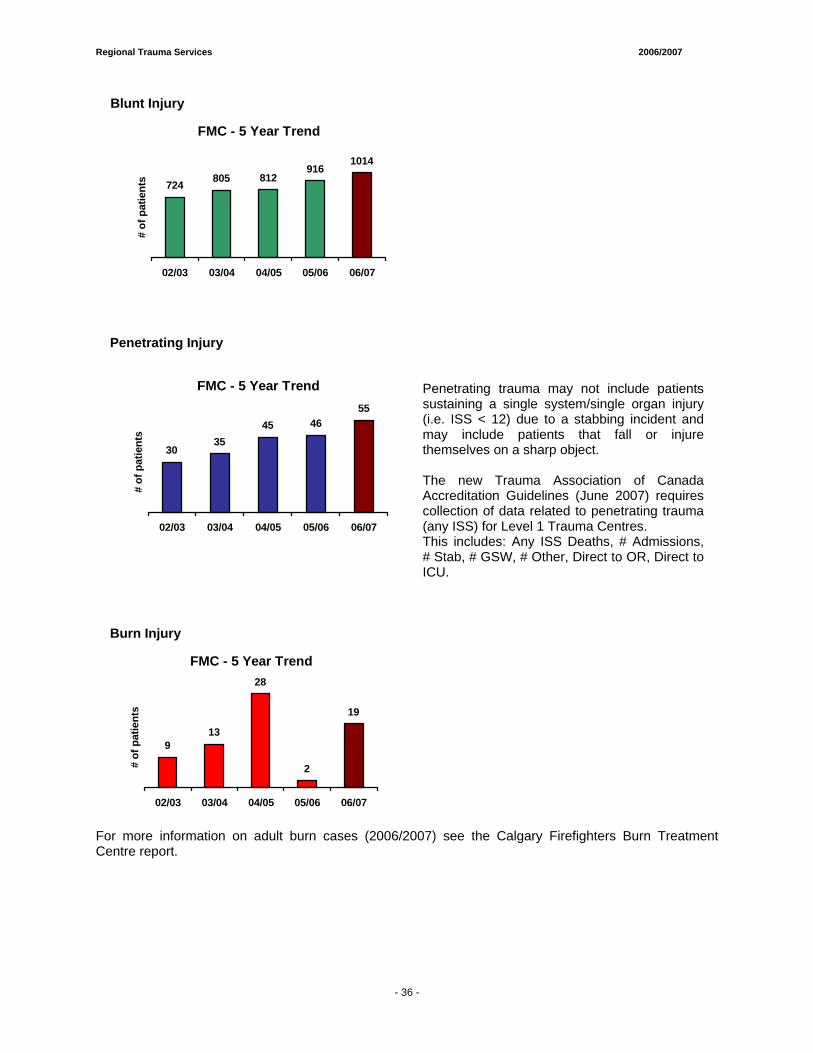
Regional Trauma Services 2006/2007
- 35 -
Blunt Injury
FMC - 5 Year Trend
724 805 812916
1014
02/03 03/04 04/05 05/06 06/07
# of
pat
ient
s
Penetrating Injury
FMC - 5 Year Trend
3035
45 4655
02/03 03/04 04/05 05/06 06/07
# of
pat
ient
s
Penetrating trauma may not include patients sustaining a single system/single organ injury (i.e. ISS < 12) due to a stabbing incident and may include patients that fall or injure themselves on a sharp object. The new Trauma Association of Canada Accreditation Guidelines (June 2007) requires collection of data related to penetrating trauma (any ISS) for Level 1 Trauma Centres. This includes: Any ISS Deaths, # Admissions, # Stab, # GSW, # Other, Direct to OR, Direct to ICU.
Burn Injury
FMC - 5 Year Trend
913
28
2
19
02/03 03/04 04/05 05/06 06/07
# of
pat
ient
s
For more information on adult burn cases (2006/2007) see the Calgary Firefighters Burn Treatment Centre report.
- 36 -

Regional Trauma Services 2006/2007
- 35 -
Other Injury
FMC - 5 Year Trend
4
7
9
56
02/03 03/04 04/05 05/06 06/07
# of
pat
ient
s
DIRECT VS TRANSFER Direct means the patient was transported “directly” from the scene to a trauma centre; whereas, transfer means the patient was initially treated at another facility and then “transferred” to a trauma centre.
Direct vs. Transfer
FMC - 5 Year Trend
661
433
569512511446
400382349321
02/03 03/04 04/05 05/06 06/07
# of
pat
ient
s
Direct Transfer
In 2006/2007, 60.4% of patients were transported directly from the scene to FMC (58.7% 2005/2006) and 39.6% of patients were transferred from another facility (41.3% 2005/2006).
CALGARY INTERHOSPITAL TRANSFERS These patients were the major trauma patients that arrived at one site (e.g. PLC) by pre-hospital care providers, walk-in or private vehicle and were transferred to FMC. The Peter Lougheed Centre (PLC), Rockyview General Hospital (RGH) or the Alberta Children’s Hospital (ACH) may be the first or second hospital prior to transfer to FMC.
FMC 2006/2007
40
27
1
PLC RGH ACH
# of
pat
ient
s
- 37 -
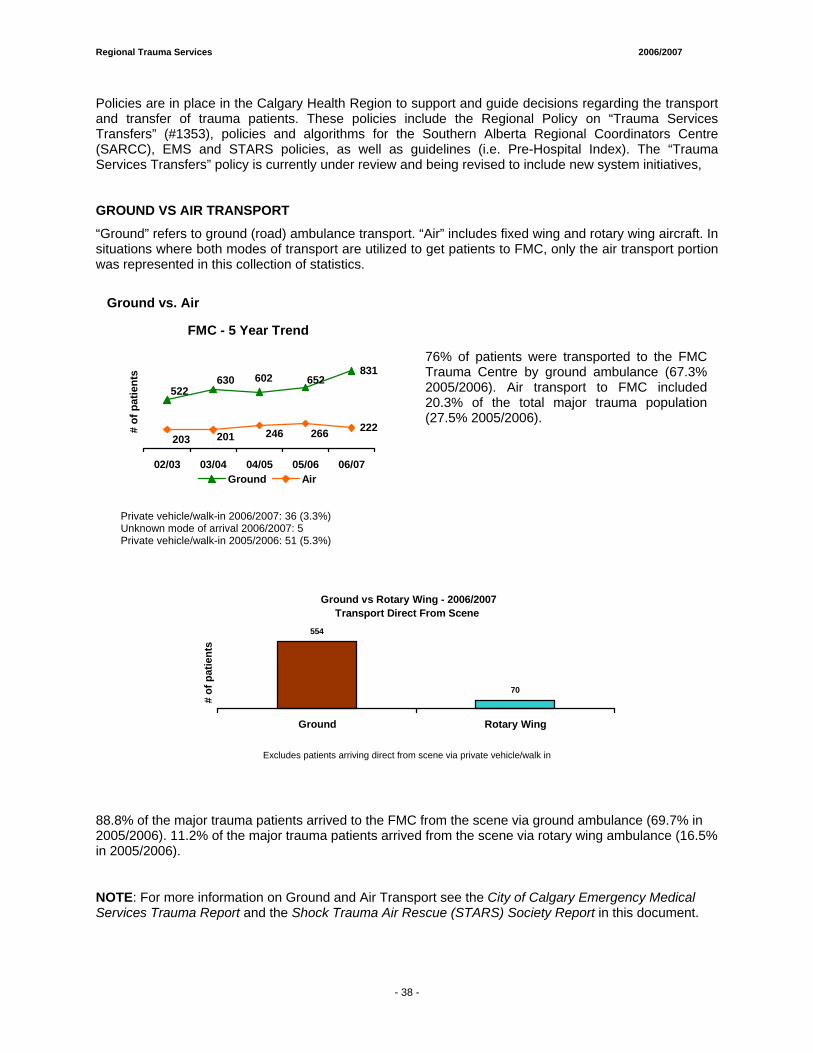
Regional Trauma Services 2006/2007
- 35 -
Policies are in place in the Calgary Health Region to support and guide decisions regarding the transport and transfer of trauma patients. These policies include the Regional Policy on “Trauma Services Transfers” (#1353), policies and algorithms for the Southern Alberta Regional Coordinators Centre (SARCC), EMS and STARS policies, as well as guidelines (i.e. Pre-Hospital Index). The “Trauma Services Transfers” policy is currently under review and being revised to include new system initiatives, GROUND VS AIR TRANSPORT
“Ground” refers to ground (road) ambulance transport. “Air” includes fixed wing and rotary wing aircraft. In situations where both modes of transport are utilized to get patients to FMC, only the air transport portion was represented in this collection of statistics.
Ground vs. Air
FMC - 5 Year Trend
831
222
522630 602 652
203 201 246 266
02/03 03/04 04/05 05/06 06/07
# of
pat
ient
s
Ground Air
76% of patients were transported to the FMC Trauma Centre by ground ambulance (67.3% 2005/2006). Air transport to FMC included 20.3% of the total major trauma population (27.5% 2005/2006).
Private vehicle/walk-in 2006/2007: 36 (3.3%) Unknown mode of arrival 2006/2007: 5 Private vehicle/walk-in 2005/2006: 51 (5.3%)
Ground vs Rotary Wing - 2006/2007Transport Direct From Scene
554
70
Ground Rotary Wing
# of
pat
ient
s
Excludes patients arriving direct from scene via private vehicle/walk in
88.8% of the major trauma patients arrived to the FMC from the scene via ground ambulance (69.7% in 2005/2006). 11.2% of the major trauma patients arrived from the scene via rotary wing ambulance (16.5% in 2005/2006).
NOTE: For more information on Ground and Air Transport see the City of Calgary Emergency Medical Services Trauma Report and the Shock Trauma Air Rescue (STARS) Society Report in this document.
- 38 -
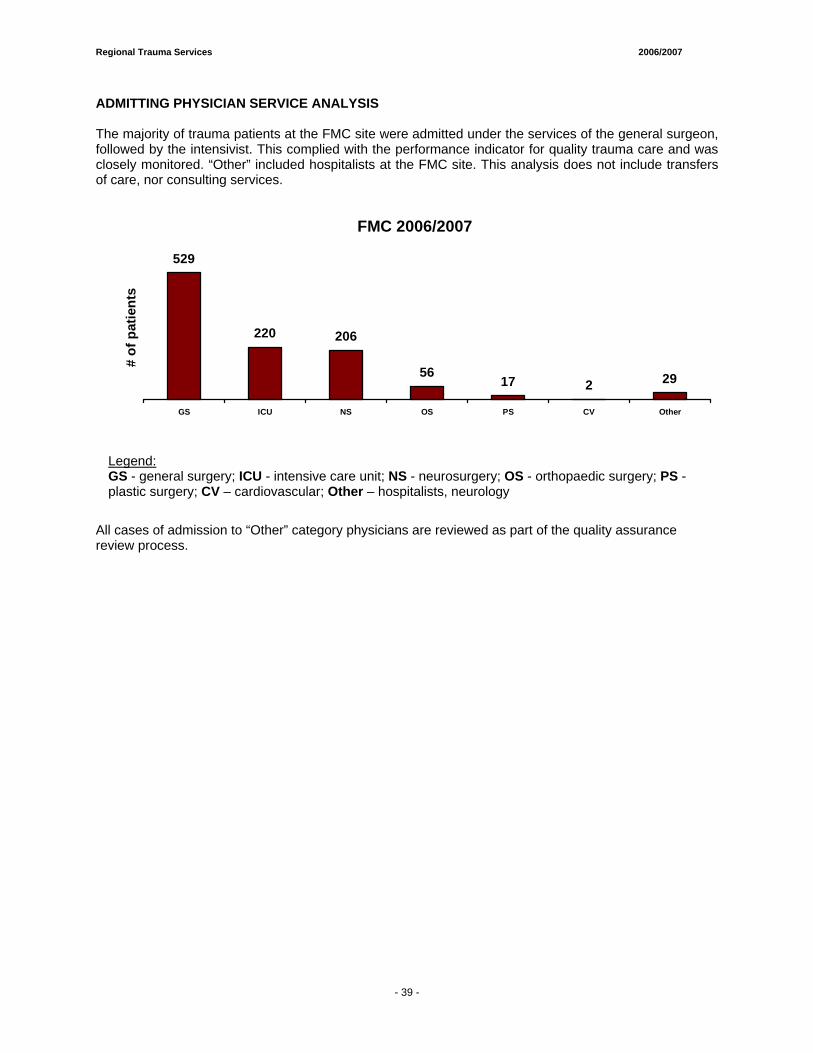
Regional Trauma Services 2006/2007
- 35 -
ADMITTING PHYSICIAN SERVICE ANALYSIS The majority of trauma patients at the FMC site were admitted under the services of the general surgeon, followed by the intensivist. This complied with the performance indicator for quality trauma care and was closely monitored. “Other” included hospitalists at the FMC site. This analysis does not include transfers of care, nor consulting services.
FMC 2006/2007
529
220 206
5617 2 29
GS ICU NS OS PS CV Other
# of
pat
ient
s
Legend: GS - general surgery; ICU - intensive care unit; NS - neurosurgery; OS - orthopaedic surgery; PS - plastic surgery; CV – cardiovascular; Other – hospitalists, neurology
All cases of admission to “Other” category physicians are reviewed as part of the quality assurance review process.
- 39 -
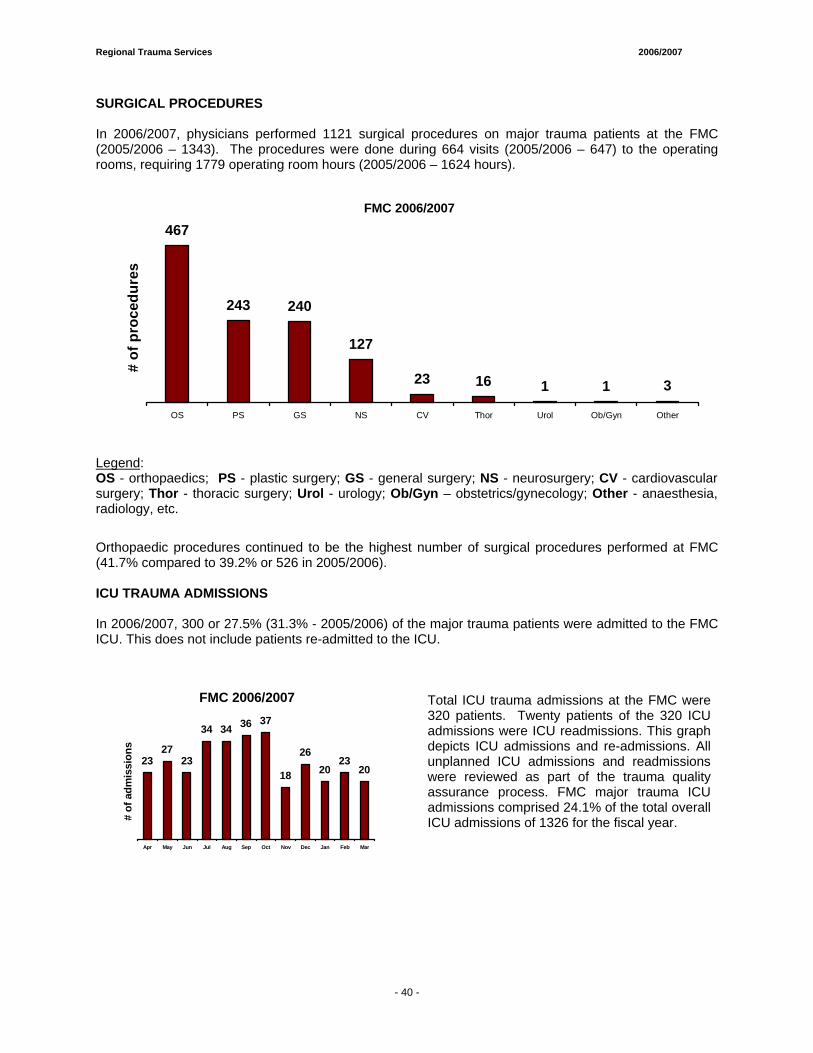
Regional Trauma Services 2006/2007
- 35 -
SURGICAL PROCEDURES In 2006/2007, physicians performed 1121 surgical procedures on major trauma patients at the FMC (2005/2006 – 1343). The procedures were done during 664 visits (2005/2006 – 647) to the operating rooms, requiring 1779 operating room hours (2005/2006 – 1624 hours).
FMC 2006/2007
467
243 240
127
23 16 1 1 3
OS PS GS NS CV Thor Urol Ob/Gyn Other
# of
pro
cedu
res
Legend: OS - orthopaedics; PS - plastic surgery; GS - general surgery; NS - neurosurgery; CV - cardiovascular surgery; Thor - thoracic surgery; Urol - urology; Ob/Gyn – obstetrics/gynecology; Other - anaesthesia, radiology, etc.
Orthopaedic procedures continued to be the highest number of surgical procedures performed at FMC (41.7% compared to 39.2% or 526 in 2005/2006).
ICU TRAUMA ADMISSIONS In 2006/2007, 300 or 27.5% (31.3% - 2005/2006) of the major trauma patients were admitted to the FMC ICU. This does not include patients re-admitted to the ICU.
FMC 2006/2007
2327
23
34 34 36 37
18
2620
2320
Apr May Jun Jul Aug Sep Oct Nov Dec Jan Feb Mar
# of
adm
issi
ons
Total ICU trauma admissions at the FMC were 320 patients. Twenty patients of the 320 ICU admissions were ICU readmissions. This graph depicts ICU admissions and re-admissions. All unplanned ICU admissions and readmissions were reviewed as part of the trauma quality assurance process. FMC major trauma ICU admissions comprised 24.1% of the total overall ICU admissions of 1326 for the fiscal year.
- 40 -
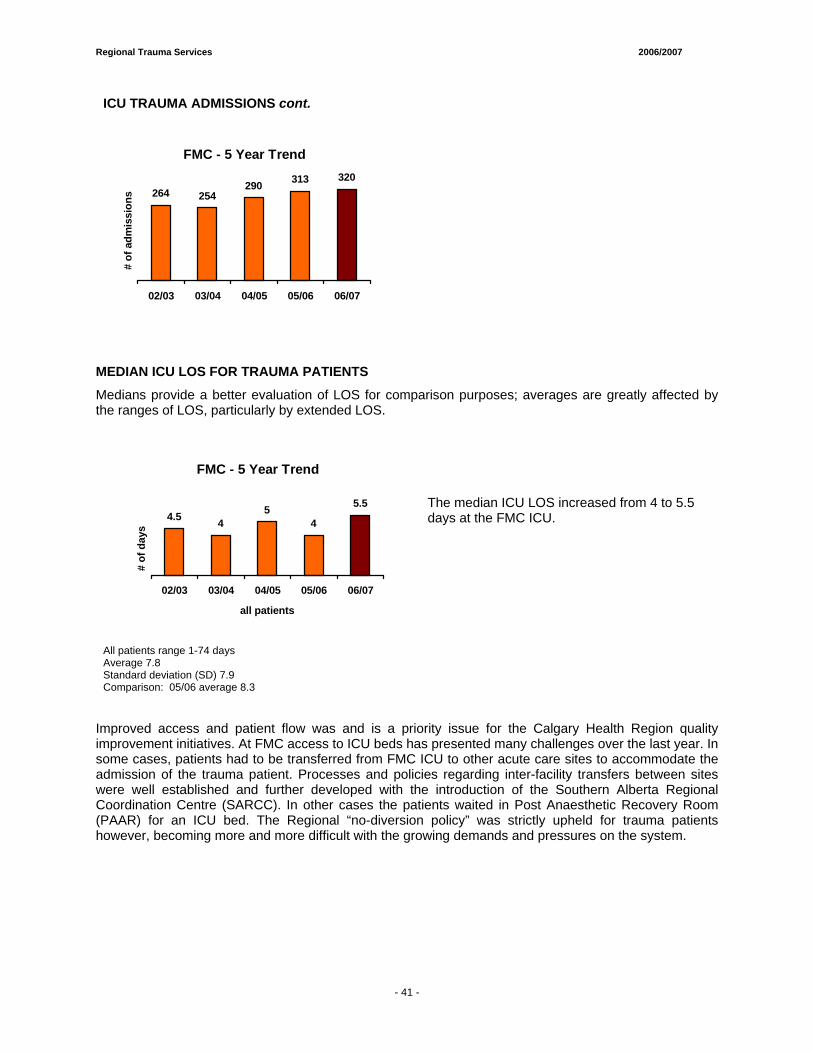
Regional Trauma Services 2006/2007
- 35 -
ICU TRAUMA ADMISSIONS cont.
FMC - 5 Year Trend
264 254290 313 320
02/03 03/04 04/05 05/06 06/07
# of
adm
issi
ons
MEDIAN ICU LOS FOR TRAUMA PATIENTS
Medians provide a better evaluation of LOS for comparison purposes; averages are greatly affected by the ranges of LOS, particularly by extended LOS.
FMC - 5 Year Trend
4.5 45
4
5.5
02/03 03/04 04/05 05/06 06/07
all patients
# of
day
s
The median ICU LOS increased from 4 to 5.5 days at the FMC ICU.
All patients range 1-74 days Average 7.8 Standard deviation (SD) 7.9 Comparison: 05/06 average 8.3
Improved access and patient flow was and is a priority issue for the Calgary Health Region quality improvement initiatives. At FMC access to ICU beds has presented many challenges over the last year. In some cases, patients had to be transferred from FMC ICU to other acute care sites to accommodate the admission of the trauma patient. Processes and policies regarding inter-facility transfers between sites were well established and further developed with the introduction of the Southern Alberta Regional Coordination Centre (SARCC). In other cases the patients waited in Post Anaesthetic Recovery Room (PAAR) for an ICU bed. The Regional “no-diversion policy” was strictly upheld for trauma patients however, becoming more and more difficult with the growing demands and pressures on the system.
- 41 -
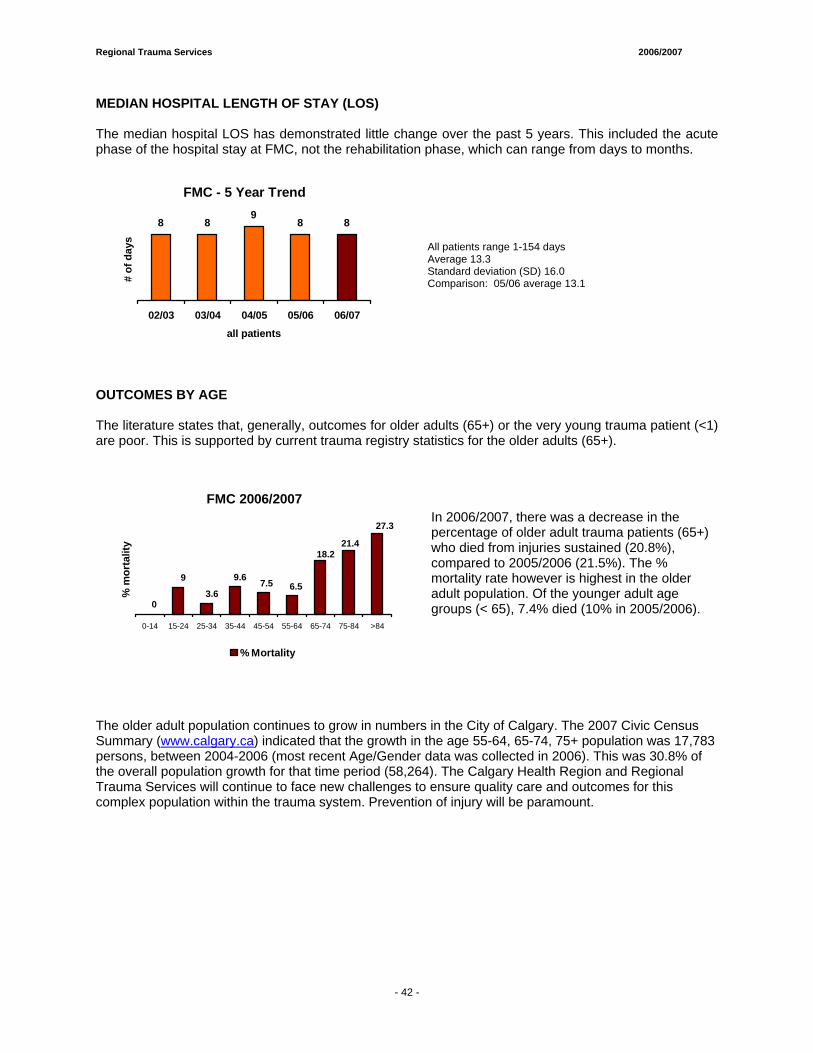
Regional Trauma Services 2006/2007
- 35 -
MEDIAN HOSPITAL LENGTH OF STAY (LOS) The median hospital LOS has demonstrated little change over the past 5 years. This included the acute phase of the hospital stay at FMC, not the rehabilitation phase, which can range from days to months.
FMC - 5 Year Trend
8 89
8 8
02/03 03/04 04/05 05/06 06/07all patients
# of
day
s
All patients range 1-154 days Average 13.3 Standard deviation (SD) 16.0 Comparison: 05/06 average 13.1
OUTCOMES BY AGE The literature states that, generally, outcomes for older adults (65+) or the very young trauma patient (<1) are poor. This is supported by current trauma registry statistics for the older adults (65+).
FMC 2006/2007
21.4
27.3
18.2
6.57.5
0
9
3.6
9.6
0-14 15-24 25-34 35-44 45-54 55-64 65-74 75-84 >84
% m
orta
lity
% Mortality
In 2006/2007, there was a decrease in the percentage of older adult trauma patients (65+) who died from injuries sustained (20.8%), compared to 2005/2006 (21.5%). The % mortality rate however is highest in the older adult population. Of the younger adult age groups (< 65), 7.4% died (10% in 2005/2006).
The older adult population continues to grow in numbers in the City of Calgary. The 2007 Civic Census Summary (www.calgary.ca) indicated that the growth in the age 55-64, 65-74, 75+ population was 17,783 persons, between 2004-2006 (most recent Age/Gender data was collected in 2006). This was 30.8% of the overall population growth for that time period (58,264). The Calgary Health Region and Regional Trauma Services will continue to face new challenges to ensure quality care and outcomes for this complex population within the trauma system. Prevention of injury will be paramount.
- 42 -
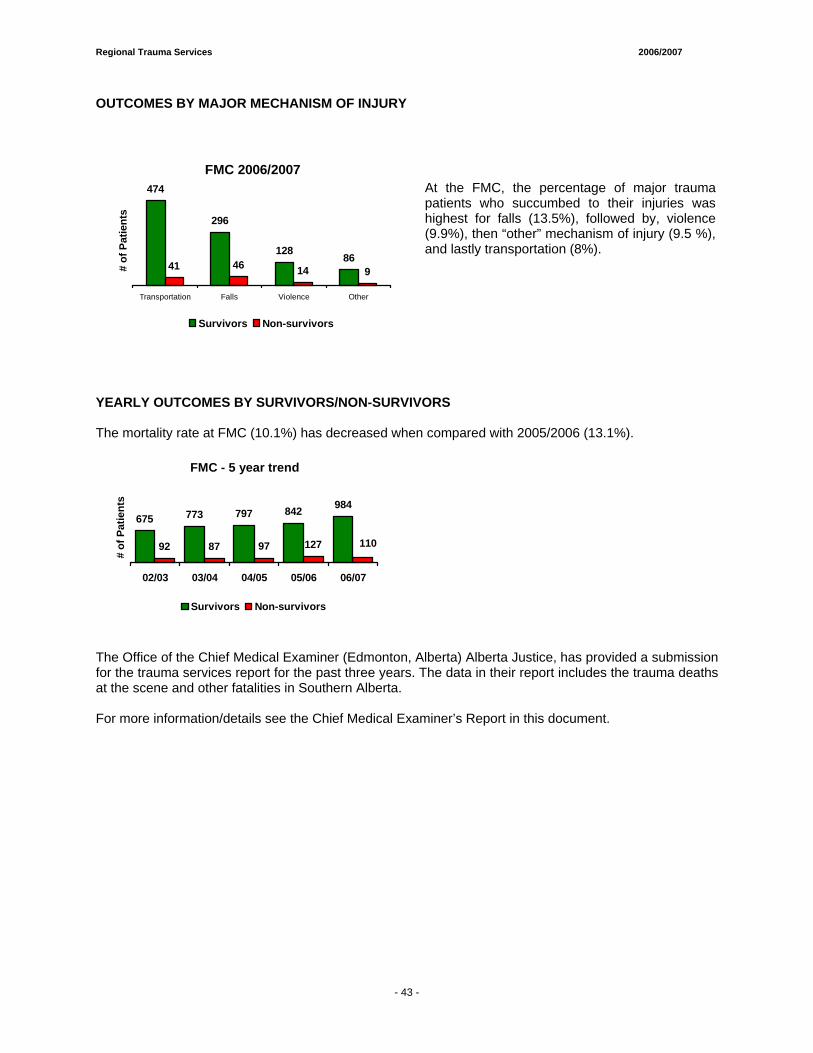
Regional Trauma Services 2006/2007
- 35 -
OUTCOMES BY MAJOR MECHANISM OF INJURY
FMC 2006/2007474
296
12886
41 46 14 9
Transportation Falls Violence Other
# of
Pat
ient
s
Survivors Non-survivors
At the FMC, the percentage of major trauma patients who succumbed to their injuries was highest for falls (13.5%), followed by, violence (9.9%), then “other” mechanism of injury (9.5 %), and lastly transportation (8%).
YEARLY OUTCOMES BY SURVIVORS/NON-SURVIVORS The mortality rate at FMC (10.1%) has decreased when compared with 2005/2006 (13.1%).
FMC - 5 year trend
675 773 797 842 984
92 87 97 127 110
02/03 03/04 04/05 05/06 06/07
# of
Pat
ient
s
Survivors Non-survivors
The Office of the Chief Medical Examiner (Edmonton, Alberta) Alberta Justice, has provided a submission for the trauma services report for the past three years. The data in their report includes the trauma deaths at the scene and other fatalities in Southern Alberta. For more information/details see the Chief Medical Examiner’s Report in this document.
- 43 -
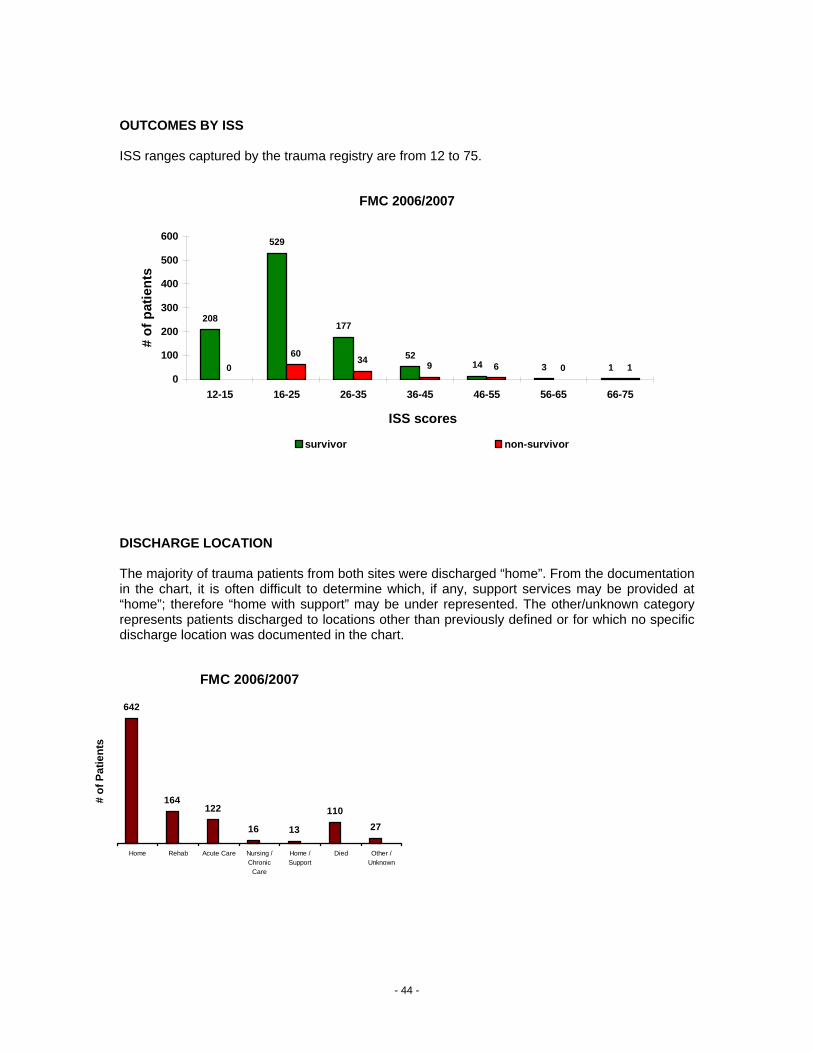
OUTCOMES BY ISS ISS ranges captured by the trauma registry are from 12 to 75.
FMC 2006/2007
208
529
177
5214 3 10
60 34 9 6 0 10
100
200
300
400
500
600
12-15 16-25 26-35 36-45 46-55 56-65 66-75
ISS scores
# of
pat
ient
s
survivor non-survivor
DISCHARGE LOCATION The majority of trauma patients from both sites were discharged “home”. From the documentation in the chart, it is often difficult to determine which, if any, support services may be provided at “home”; therefore “home with support” may be under represented. The other/unknown category represents patients discharged to locations other than previously defined or for which no specific discharge location was documented in the chart.
FMC 2006/2007
642
164122
16 13
11027
Home Rehab Acute Care Nursing /Chronic
Care
Home /Support
Died Other /Unknown
# of
Pat
ient
s
- 44 -
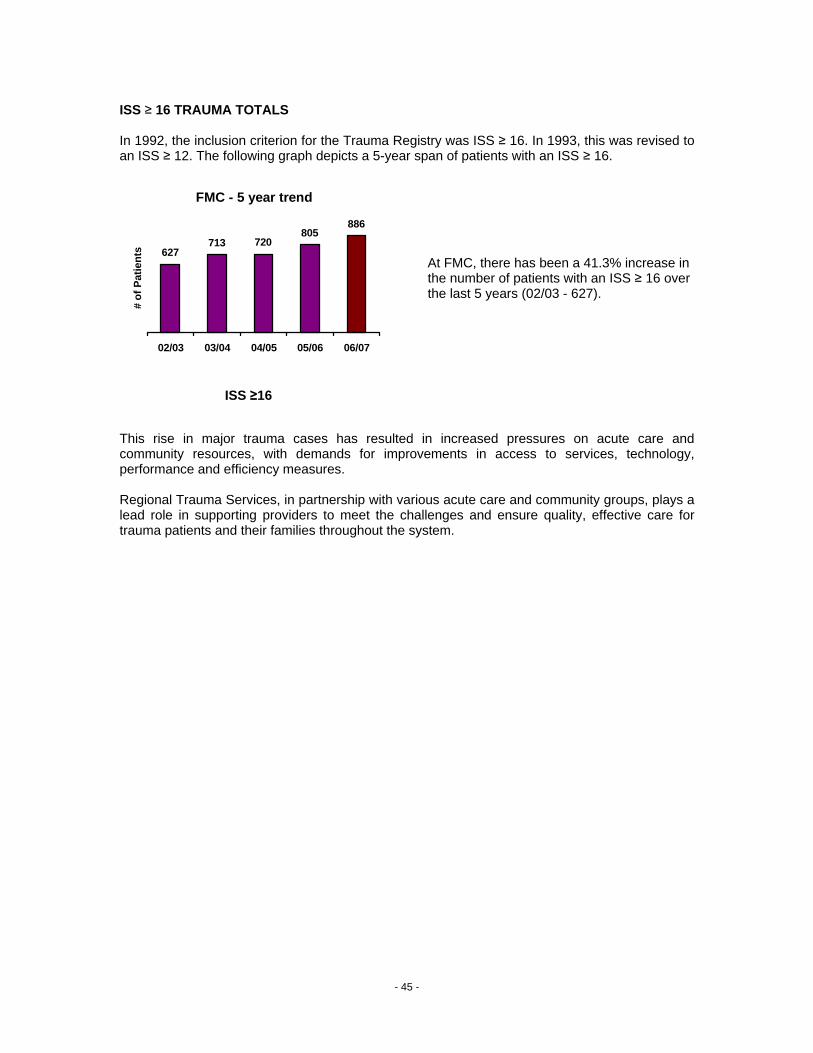
ISS ≥ 16 TRAUMA TOTALS In 1992, the inclusion criterion for the Trauma Registry was ISS ≥ 16. In 1993, this was revised to an ISS ≥ 12. The following graph depicts a 5-year span of patients with an ISS ≥ 16.
At FMC, there has been a 41.3% increase in the number of patients with an ISS ≥ 16 over the last 5 years (02/03 - 627).
This rise in major trauma cases has resulted in increased pressures on acute care and community resources, with demands for improvements in access to services, technology, performance and efficiency measures. Regional Trauma Services, in partnership with various acute care and community groups, plays a lead role in supporting providers to meet the challenges and ensure quality, effective care for trauma patients and their families throughout the system.
FMC - 5 year trend
627713 720
805886
02/03 03/04 04/05 05/06 06/07
# of
Pat
ient
s
ISS ≥16
- 45 -

Foothills Medical Centre PPEERRFFOORRMMAANNCCEE IINNDDIICCAATTOORRSS Project Lead:
• Ms. Christi Findlay, Data Analyst Regional Trauma Services

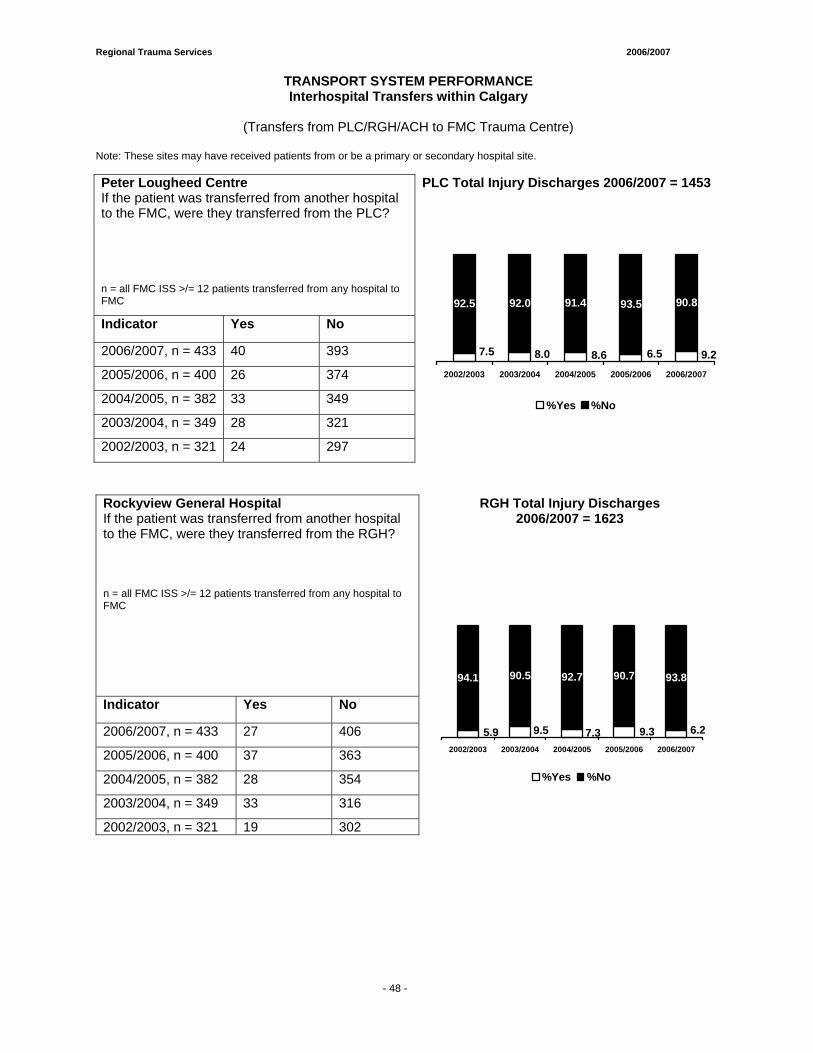
Regional Trauma Services 2006/2007
- 59 -
TRANSPORT SYSTEM PERFORMANCE Interhospital Transfers within Calgary
(Transfers from PLC/RGH/ACH to FMC Trauma Centre)
Note: These sites may have received patients from or be a primary or secondary hospital site. Peter Lougheed Centre If the patient was transferred from another hospital to the FMC, were they transferred from the PLC?
PLC Total Injury Discharges 2006/2007 = 1453
n = all FMC ISS >/= 12 patients transferred from any hospital to FMC
Indicator Yes No
2006/2007, n = 433 40 393
2005/2006, n = 400 26 374
2004/2005, n = 382 33 349
2003/2004, n = 349 28 321
2002/2003, n = 321 24 297
93.5 90.8
9.26.58.67.5 8.0
91.492.092.5
2002/2003 2003/2004 2004/2005 2005/2006 2006/2007
%Yes %No
Rockyview General Hospital If the patient was transferred from another hospital to the FMC, were they transferred from the RGH?
RGH Total Injury Discharges 2006/2007 = 1623
n = all FMC ISS >/= 12 patients transferred from any hospital to FMC
Indicator Yes No
2006/2007, n = 433 27 406
2005/2006, n = 400 37 363
2004/2005, n = 382 28 354
2003/2004, n = 349 33 316
2002/2003, n = 321 19 302
90.7 93.8
6.29.39.55.9 7.3
94.1 90.5 92.7
2002/2003 2003/2004 2004/2005 2005/2006 2006/2007
%Yes %No
- 48 -
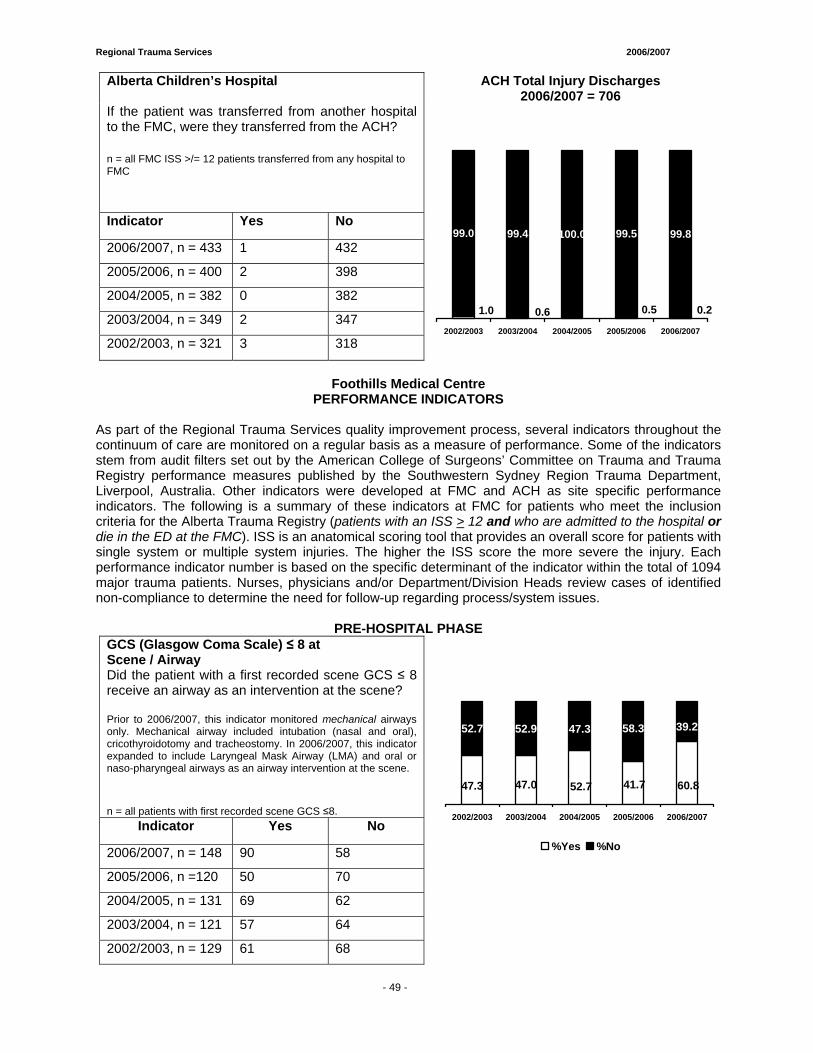
Regional Trauma Services 2006/2007
- 59 -
Alberta Children’s Hospital ACH Total Injury Discharges 2006/2007 = 706
If the patient was transferred from another hospital to the FMC, were they transferred from the ACH?
n = all FMC ISS >/= 12 patients transferred from any hospital to FMC
Indicator Yes No
2006/2007, n = 433 1 432
2005/2006, n = 400 2 398
2004/2005, n = 382 0 382
2003/2004, n = 349 2 347
2002/2003, n = 321 3 318
99.5 99.8
0.20.50.0
0.61.0
100.099.499.0
2002/2003 2003/2004 2004/2005 2005/2006 2006/2007
Foothills Medical Centre PERFORMANCE INDICATORS
As part of the Regional Trauma Services quality improvement process, several indicators throughout the continuum of care are monitored on a regular basis as a measure of performance. Some of the indicators stem from audit filters set out by the American College of Surgeons’ Committee on Trauma and Trauma Registry performance measures published by the Southwestern Sydney Region Trauma Department, Liverpool, Australia. Other indicators were developed at FMC and ACH as site specific performance indicators. The following is a summary of these indicators at FMC for patients who meet the inclusion criteria for the Alberta Trauma Registry (patients with an ISS > 12 and who are admitted to the hospital or die in the ED at the FMC). ISS is an anatomical scoring tool that provides an overall score for patients with single system or multiple system injuries. The higher the ISS score the more severe the injury. Each performance indicator number is based on the specific determinant of the indicator within the total of 1094 major trauma patients. Nurses, physicians and/or Department/Division Heads review cases of identified non-compliance to determine the need for follow-up regarding process/system issues.
PRE-HOSPITAL PHASE
GCS (Glasgow Coma Scale) ≤ 8 at Scene / Airway
Did the patient with a first recorded scene GCS ≤ 8 receive an airway as an intervention at the scene? Prior to 2006/2007, this indicator monitored mechanical airways only. Mechanical airway included intubation (nasal and oral), cricothyroidotomy and tracheostomy. In 2006/2007, this indicator expanded to include Laryngeal Mask Airway (LMA) and oral or naso-pharyngeal airways as an airway intervention at the scene.
n = all patients with first recorded scene GCS ≤8. Indicator Yes No
2006/2007, n = 148 90 58
2005/2006, n =120 50 70
2004/2005, n = 131 69 62
2003/2004, n = 121 57 64
2002/2003, n = 129 61 68
47.0 60.841.747.3 52.7
39.258.352.7 52.9 47.3
2002/2003 2003/2004 2004/2005 2005/2006 2006/2007
%Yes %No
- 49 -
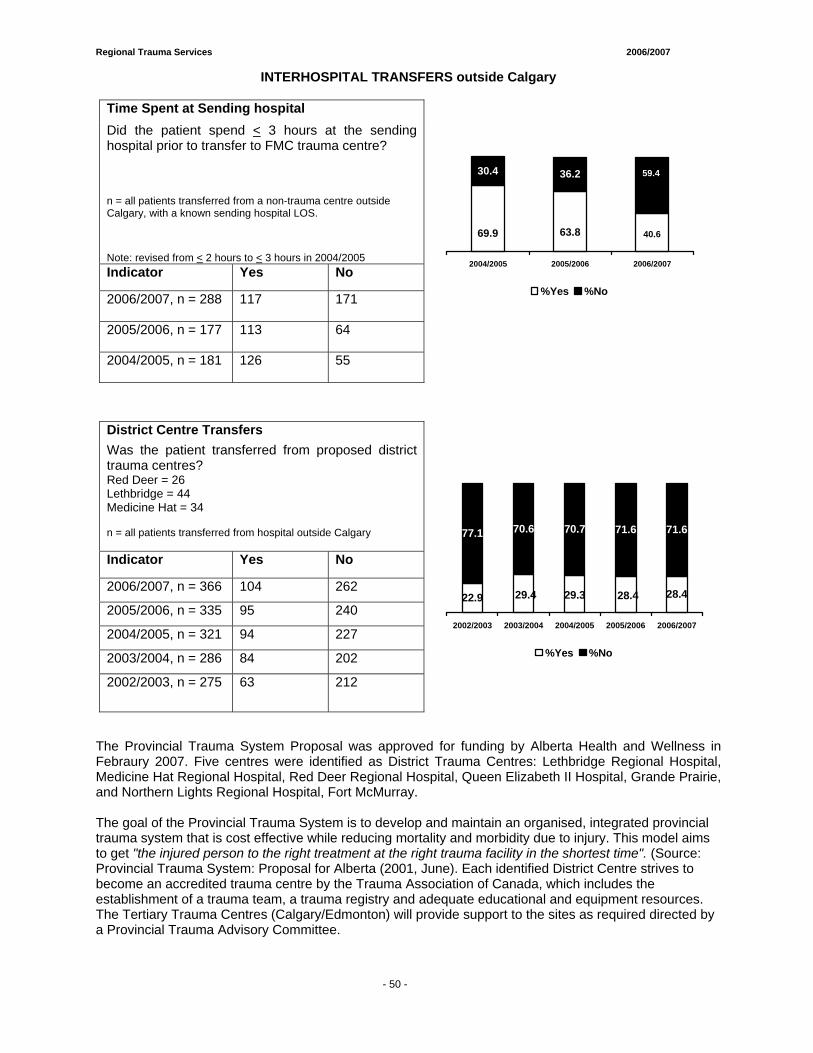
Regional Trauma Services 2006/2007
- 59 -
INTERHOSPITAL TRANSFERS outside Calgary
Time Spent at Sending hospital Did the patient spend < 3 hours at the sending hospital prior to transfer to FMC trauma centre?
n = all patients transferred from a non-trauma centre outside Calgary, with a known sending hospital LOS.
Note: revised from < 2 hours to < 3 hours in 2004/2005 Indicator Yes No
2006/2007, n = 288 117 171
2005/2006, n = 177 113 64
2004/2005, n = 181 126 55
63.869.9 40.6
30.4 36.2 59.4
2004/2005 2005/2006 2006/2007
%Yes %No
District Centre Transfers Was the patient transferred from proposed district trauma centres? Red Deer = 26 Lethbridge = 44 Medicine Hat = 34 n = all patients transferred from hospital outside Calgary
Indicator Yes No
2006/2007, n = 366 104 262
2005/2006, n = 335 95 240
2004/2005, n = 321 94 227
2003/2004, n = 286 84 202
2002/2003, n = 275 63 212
28.4
71.6 71.6
28.429.422.9 29.3
77.1 70.6 70.7
2002/2003 2003/2004 2004/2005 2005/2006 2006/2007
%Yes %No
The Provincial Trauma System Proposal was approved for funding by Alberta Health and Wellness in Febraury 2007. Five centres were identified as District Trauma Centres: Lethbridge Regional Hospital, Medicine Hat Regional Hospital, Red Deer Regional Hospital, Queen Elizabeth II Hospital, Grande Prairie, and Northern Lights Regional Hospital, Fort McMurray. The goal of the Provincial Trauma System is to develop and maintain an organised, integrated provincial trauma system that is cost effective while reducing mortality and morbidity due to injury. This model aims to get "the injured person to the right treatment at the right trauma facility in the shortest time". (Source: Provincial Trauma System: Proposal for Alberta (2001, June). Each identified District Centre strives to become an accredited trauma centre by the Trauma Association of Canada, which includes the establishment of a trauma team, a trauma registry and adequate educational and equipment resources. The Tertiary Trauma Centres (Calgary/Edmonton) will provide support to the sites as required directed by a Provincial Trauma Advisory Committee.
- 50 -
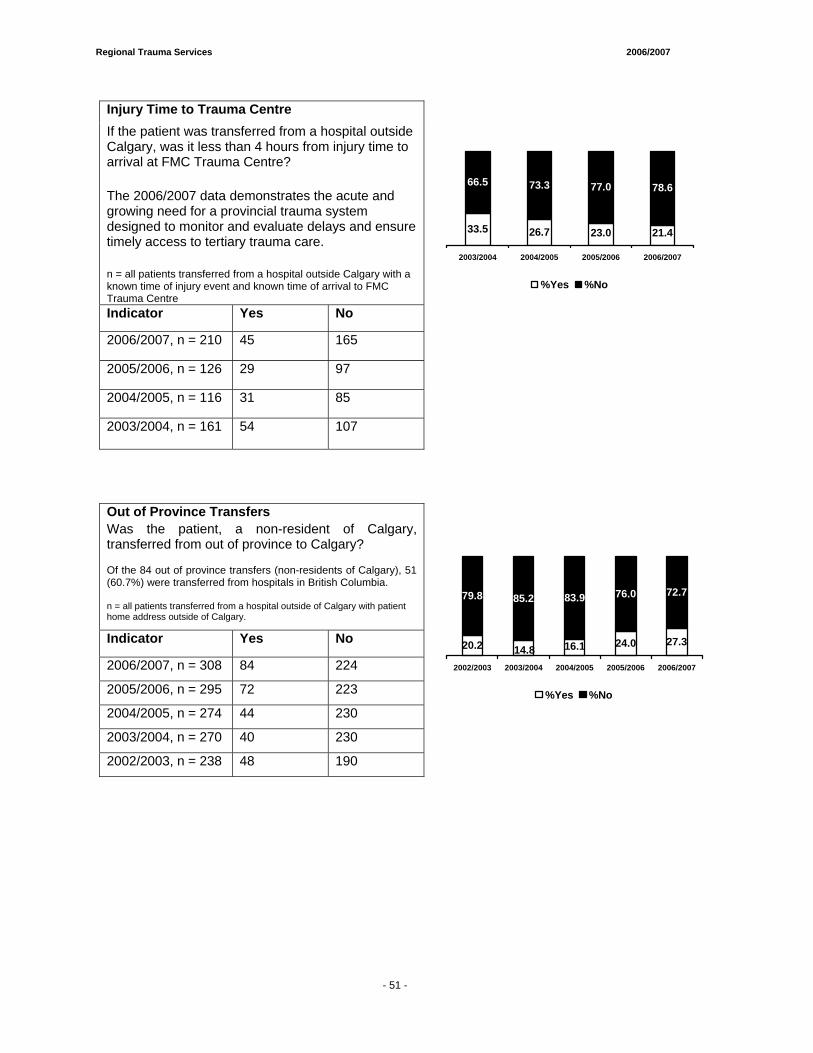
Regional Trauma Services 2006/2007
- 59 -
Injury Time to Trauma Centre If the patient was transferred from a hospital outside Calgary, was it less than 4 hours from injury time to arrival at FMC Trauma Centre?
The 2006/2007 data demonstrates the acute and growing need for a provincial trauma system designed to monitor and evaluate delays and ensure timely access to tertiary trauma care.
n = all patients transferred from a hospital outside Calgary with a known time of injury event and known time of arrival to FMC Trauma Centre Indicator Yes No
2006/2007, n = 210 45 165
2005/2006, n = 126 29 97
2004/2005, n = 116 31 85
2003/2004, n = 161 54 107
26.7 21.4
78.6
33.5 23.0
66.5 73.3 77.0
2003/2004 2004/2005 2005/2006 2006/2007
%Yes %No
Out of Province Transfers Was the patient, a non-resident of Calgary, transferred from out of province to Calgary? Of the 84 out of province transfers (non-residents of Calgary), 51 (60.7%) were transferred from hospitals in British Columbia. n = all patients transferred from a hospital outside of Calgary with patient home address outside of Calgary.
Indicator Yes No
2006/2007, n = 308 84 224
2005/2006, n = 295 72 223
2004/2005, n = 274 44 230
2003/2004, n = 270 40 230
2002/2003, n = 238 48 190
24.0 27.3
76.0 72.7
14.820.2 16.1
79.8 85.2 83.9
2002/2003 2003/2004 2004/2005 2005/2006 2006/2007
%Yes %No
- 51 -
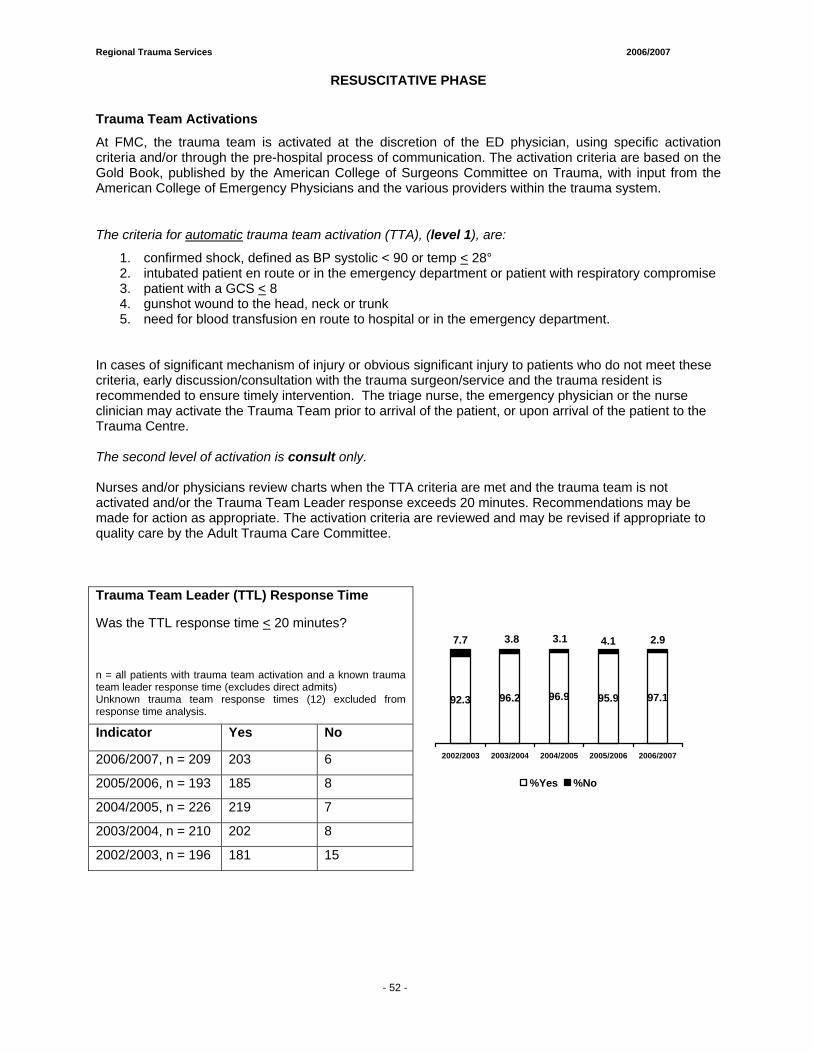
Regional Trauma Services 2006/2007
- 59 -
RESUSCITATIVE PHASE
Trauma Team Activations
At FMC, the trauma team is activated at the discretion of the ED physician, using specific activation criteria and/or through the pre-hospital process of communication. The activation criteria are based on the Gold Book, published by the American College of Surgeons Committee on Trauma, with input from the American College of Emergency Physicians and the various providers within the trauma system.
The criteria for automatic trauma team activation (TTA), (level 1), are:
1. confirmed shock, defined as BP systolic < 90 or temp < 28° 2. intubated patient en route or in the emergency department or patient with respiratory compromise 3. patient with a GCS < 8 4. gunshot wound to the head, neck or trunk 5. need for blood transfusion en route to hospital or in the emergency department.
In cases of significant mechanism of injury or obvious significant injury to patients who do not meet these criteria, early discussion/consultation with the trauma surgeon/service and the trauma resident is recommended to ensure timely intervention. The triage nurse, the emergency physician or the nurse clinician may activate the Trauma Team prior to arrival of the patient, or upon arrival of the patient to the Trauma Centre. The second level of activation is consult only. Nurses and/or physicians review charts when the TTA criteria are met and the trauma team is not activated and/or the Trauma Team Leader response exceeds 20 minutes. Recommendations may be made for action as appropriate. The activation criteria are reviewed and may be revised if appropriate to quality care by the Adult Trauma Care Committee. Trauma Team Leader (TTL) Response Time
Was the TTL response time < 20 minutes? n = all patients with trauma team activation and a known trauma team leader response time (excludes direct admits) Unknown trauma team response times (12) excluded from response time analysis.
Indicator Yes No
2006/2007, n = 209 203 6
2005/2006, n = 193 185 8
2004/2005, n = 226 219 7
2003/2004, n = 210 202 8
2002/2003, n = 196 181 15
96.2 95.9 97.1
4.1 2.9
92.3 96.9
7.7 3.8 3.1
2002/2003 2003/2004 2004/2005 2005/2006 2006/2007
%Yes %No
- 52 -
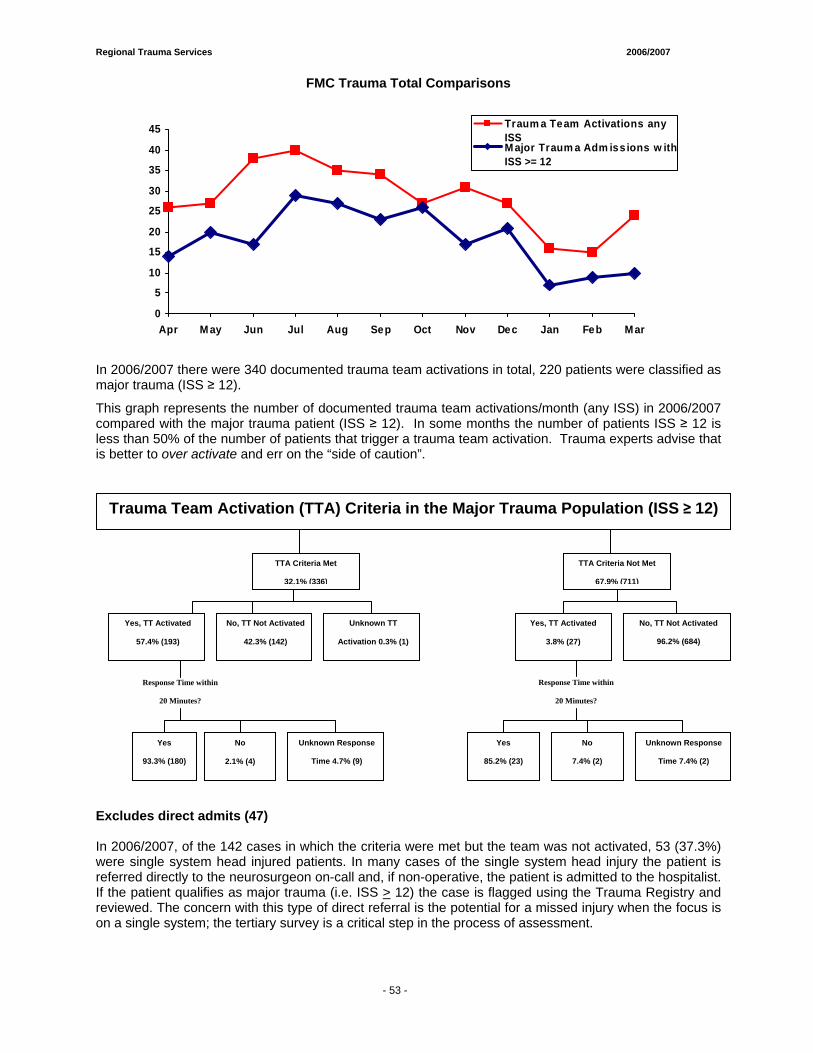
Regional Trauma Services 2006/2007
- 59 -
FMC Trauma Total Comparisons
In 2006/2007 there were 340 documented trauma team activations in total, 220 patients were classified as major trauma (ISS ≥ 12).
This graph represents the number of documented trauma team activations/month (any ISS) in 2006/2007 compared with the major trauma patient (ISS ≥ 12). In some months the number of patients ISS ≥ 12 is less than 50% of the number of patients that trigger a trauma team activation. Trauma experts advise that is better to over activate and err on the “side of caution”.
Excludes direct admits (47) In 2006/2007, of the 142 cases in which the criteria were met but the team was not activated, 53 (37.3%) were single system head injured patients. In many cases of the single system head injury the patient is referred directly to the neurosurgeon on-call and, if non-operative, the patient is admitted to the hospitalist. If the patient qualifies as major trauma (i.e. ISS > 12) the case is flagged using the Trauma Registry and reviewed. The concern with this type of direct referral is the potential for a missed injury when the focus is on a single system; the tertiary survey is a critical step in the process of assessment.
TTA Criteria Met
32.1% (336)
TTA Criteria Not Met
67.9% (711)
Yes, TT Activated
3.8% (27)
No, TT Not Activated
96.2% (684)
Response Time within
20 Minutes?
Yes, TT Activated
57.4% (193)
No, TT Not Activated
42.3% (142)
Response Time within
20 Minutes?
Yes
93.3% (180)
No
2.1% (4)
Unknown Response
Time 4.7% (9)
Yes
85.2% (23)
No
7.4% (2)
Unknown Response
Time 7.4% (2)
Trauma Team Activation (TTA) Criteria in the Major Trauma Population (ISS ≥ 12)
Unknown TT
Activation 0.3% (1)
0
5
10
15
20
25
30
35
40
45
Apr M ay Jun Jul Aug Sep Oct Nov Dec Jan Feb Mar
Traum a Team Activations anyISSM ajor Traum a Adm iss ions w ithISS >= 12
- 53 -
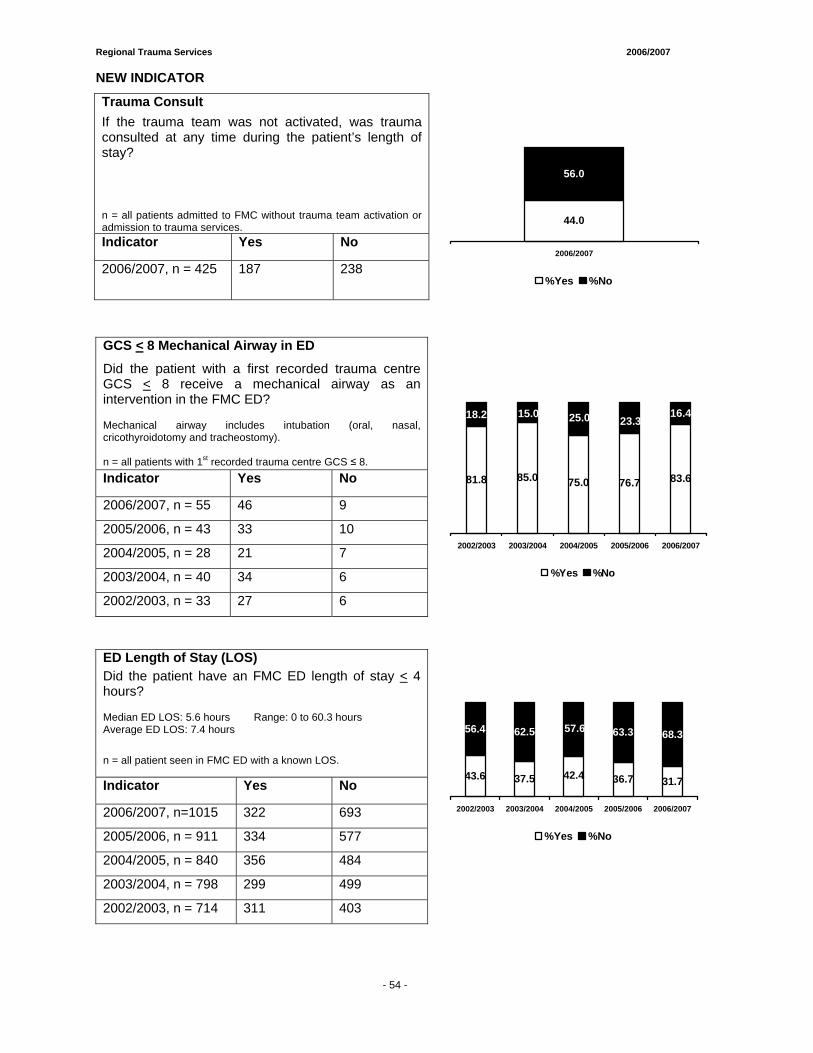
Regional Trauma Services 2006/2007
- 59 -
NEW INDICATOR
Trauma Consult If the trauma team was not activated, was trauma consulted at any time during the patient’s length of stay? n = all patients admitted to FMC without trauma team activation or admission to trauma services. Indicator Yes No
2006/2007, n = 425 187 238
56.0
44.0
2006/2007
%Yes %No
GCS < 8 Mechanical Airway in ED
Did the patient with a first recorded trauma centre GCS < 8 receive a mechanical airway as an intervention in the FMC ED? Mechanical airway includes intubation (oral, nasal, cricothyroidotomy and tracheostomy). n = all patients with 1st recorded trauma centre GCS ≤ 8. Indicator Yes No
2006/2007, n = 55 46 9
2005/2006, n = 43 33 10
2004/2005, n = 28 21 7
2003/2004, n = 40 34 6
2002/2003, n = 33 27 6
85.0 76.7 83.681.8 75.0
23.316.418.2 15.0 25.0
2002/2003 2003/2004 2004/2005 2005/2006 2006/2007
%Yes %No
ED Length of Stay (LOS) Did the patient have an FMC ED length of stay < 4 hours? Median ED LOS: 5.6 hours Range: 0 to 60.3 hours Average ED LOS: 7.4 hours
n = all patient seen in FMC ED with a known LOS.
Indicator Yes No
2006/2007, n=1015 322 693
2005/2006, n = 911 334 577
2004/2005, n = 840 356 484
2003/2004, n = 798 299 499
2002/2003, n = 714 311 403
37.5 36.7 31.7
63.3 68.3
43.6 42.4
56.4 62.5 57.6
2002/2003 2003/2004 2004/2005 2005/2006 2006/2007
%Yes %No
- 54 -
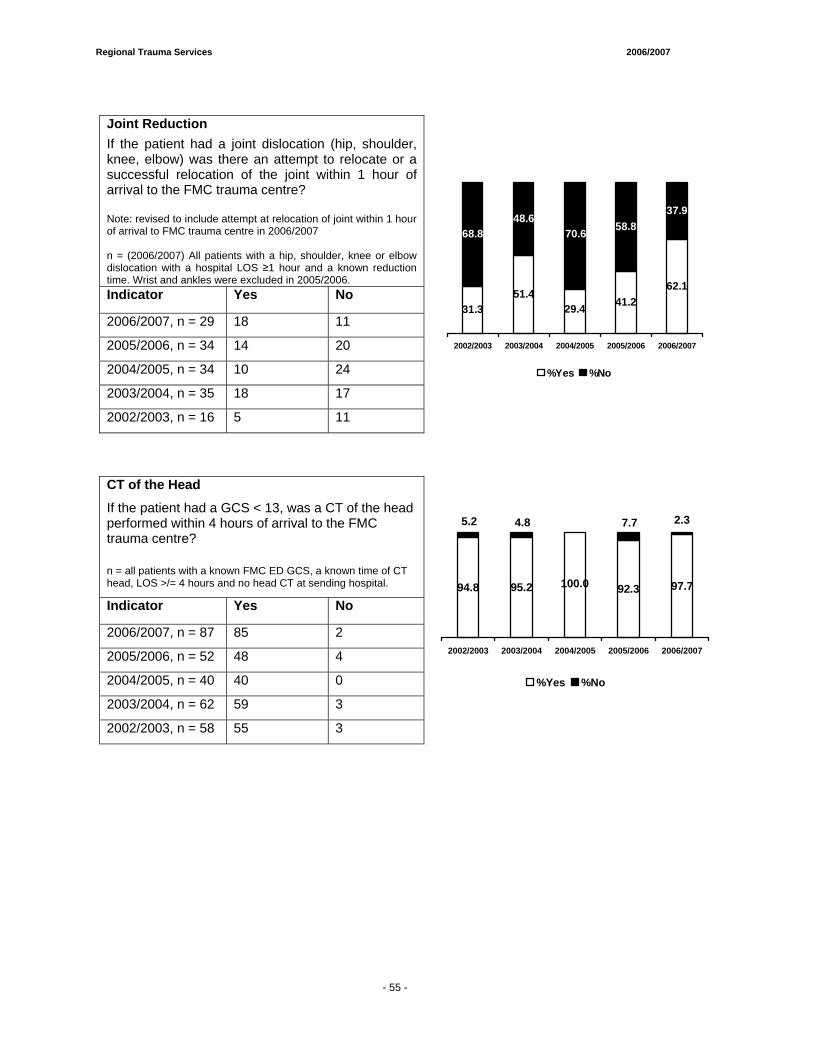
Regional Trauma Services 2006/2007
- 59 -
Joint Reduction If the patient had a joint dislocation (hip, shoulder, knee, elbow) was there an attempt to relocate or a successful relocation of the joint within 1 hour of arrival to the FMC trauma centre? Note: revised to include attempt at relocation of joint within 1 hour of arrival to FMC trauma centre in 2006/2007 n = (2006/2007) All patients with a hip, shoulder, knee or elbow dislocation with a hospital LOS ≥1 hour and a known reduction time. Wrist and ankles were excluded in 2005/2006. Indicator Yes No
2006/2007, n = 29 18 11
2005/2006, n = 34 14 20
2004/2005, n = 34 10 24
2003/2004, n = 35 18 17
2002/2003, n = 16 5 11
51.441.2
62.1
58.837.9
31.3 29.4
68.848.6
70.6
2002/2003 2003/2004 2004/2005 2005/2006 2006/2007
%Yes %No
CT of the Head
If the patient had a GCS < 13, was a CT of the head performed within 4 hours of arrival to the FMC trauma centre?
n = all patients with a known FMC ED GCS, a known time of CT head, LOS >/= 4 hours and no head CT at sending hospital.
Indicator Yes No
2006/2007, n = 87 85 2
2005/2006, n = 52 48 4
2004/2005, n = 40 40 0
2003/2004, n = 62 59 3
95.2 92.3 97.794.8 100.0
2.37.75.2 4.8 0.0
2002/2003 2003/2004 2004/2005 2005/2006 2006/2007
%Yes %No
2002/2003, n = 58 55 3
- 55 -
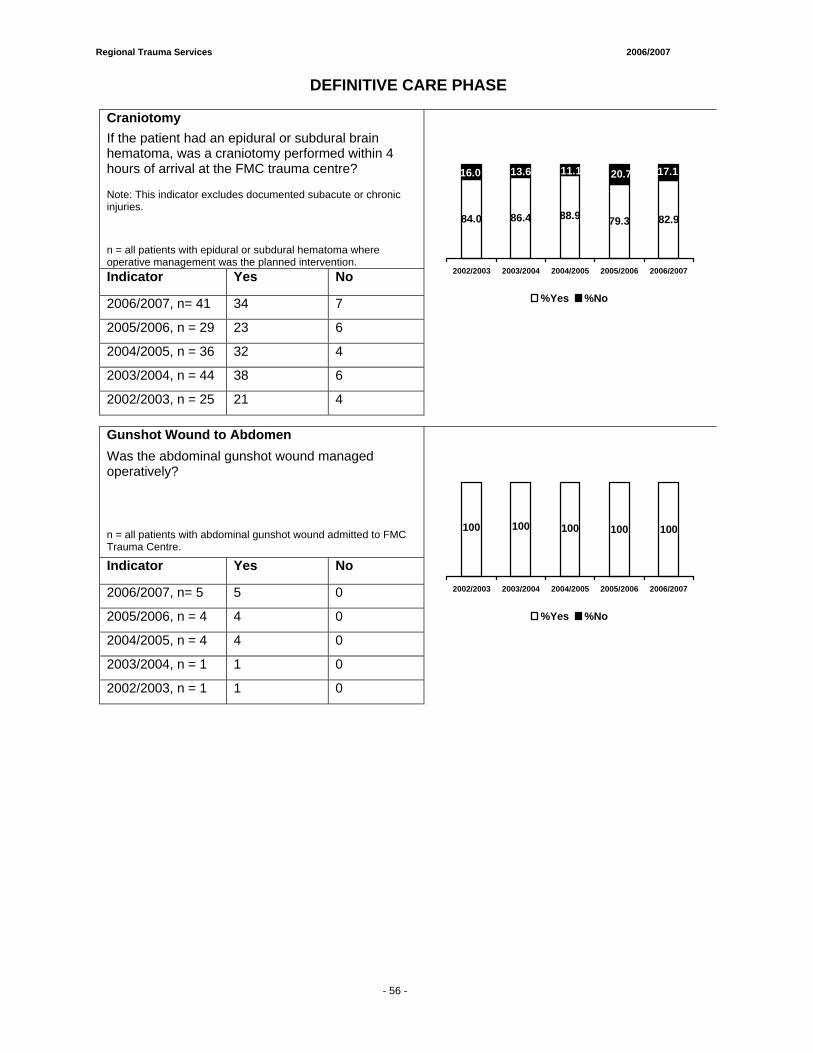
Regional Trauma Services 2006/2007
- 59 -
DEFINITIVE CARE PHASE
Craniotomy If the patient had an epidural or subdural brain hematoma, was a craniotomy performed within 4 hours of arrival at the FMC trauma centre? Note: This indicator excludes documented subacute or chronic injuries.
n = all patients with epidural or subdural hematoma where operative management was the planned intervention. Indicator Yes No
2006/2007, n= 41 34 7
2005/2006, n = 29 23 6
2004/2005, n = 36 32 4
2003/2004, n = 44 38 6
2002/2003, n = 25 21 4
86.4 79.3 82.988.984.0
17.120.711.113.616.0
2002/2003 2003/2004 2004/2005 2005/2006 2006/2007
%Yes %No
Gunshot Wound to Abdomen Was the abdominal gunshot wound managed operatively?
n = all patients with abdominal gunshot wound admitted to FMC Trauma Centre. Indicator Yes No
2006/2007, n= 5 5 0
2005/2006, n = 4 4 0
2004/2005, n = 4 4 0
2003/2004, n = 1 1 0
2002/2003, n = 1 1 0
100 100100 100100
2002/2003 2003/2004 2004/2005 2005/2006 2006/2007
%Yes %No
- 56 -
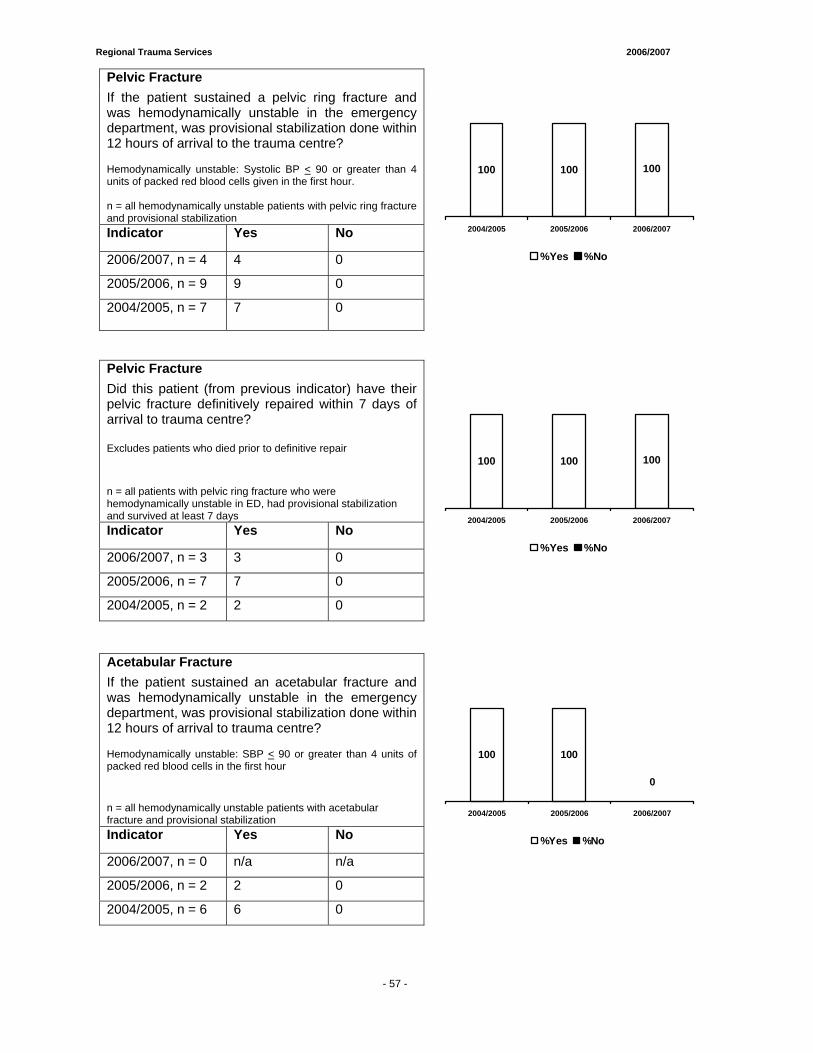
Regional Trauma Services 2006/2007
- 59 -
Pelvic Fracture If the patient sustained a pelvic ring fracture and was hemodynamically unstable in the emergency department, was provisional stabilization done within 12 hours of arrival to the trauma centre? Hemodynamically unstable: Systolic BP < 90 or greater than 4 units of packed red blood cells given in the first hour. n = all hemodynamically unstable patients with pelvic ring fracture and provisional stabilization Indicator Yes No
2006/2007, n = 4 4 0
2005/2006, n = 9 9 0
2004/2005, n = 7
7 0
100 100100
2004/2005 2005/2006 2006/2007
%Yes %No
Pelvic Fracture Did this patient (from previous indicator) have their pelvic fracture definitively repaired within 7 days of arrival to trauma centre? Excludes patients who died prior to definitive repair
n = all patients with pelvic ring fracture who were hemodynamically unstable in ED, had provisional stabilization and survived at least 7 days Indicator Yes No
2006/2007, n = 3 3 0
2005/2006, n = 7 7 0
2004/2005, n = 2 2 0
100 100100
2004/2005 2005/2006 2006/2007
%Yes %No
Acetabular Fracture If the patient sustained an acetabular fracture and was hemodynamically unstable in the emergency department, was provisional stabilization done within 12 hours of arrival to trauma centre? Hemodynamically unstable: SBP < 90 or greater than 4 units of packed red blood cells in the first hour
n = all hemodynamically unstable patients with acetabular fracture and provisional stabilization Indicator Yes No
2006/2007, n = 0 n/a n/a
2005/2006, n = 2 2 0
2004/2005, n = 6 6 0
100100
0 0
0
2004/2005 2005/2006 2006/2007
%Yes %No
- 57 -
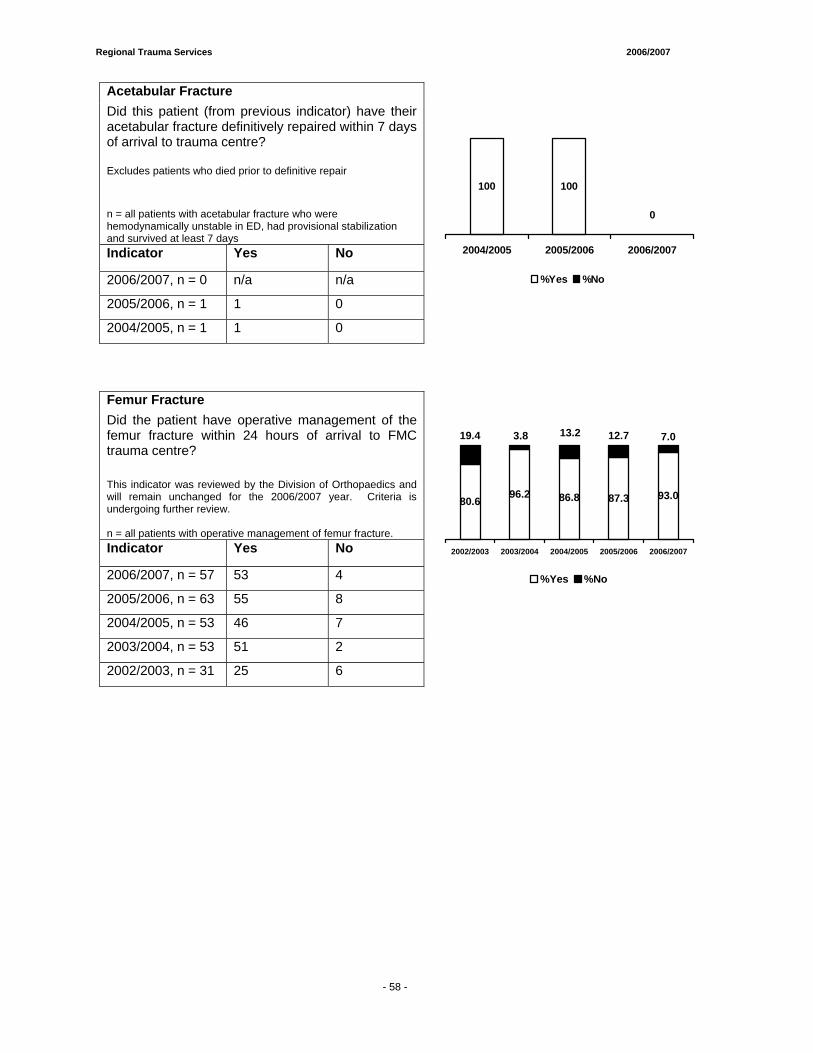
Regional Trauma Services 2006/2007
- 59 -
Acetabular Fracture Did this patient (from previous indicator) have their acetabular fracture definitively repaired within 7 days of arrival to trauma centre? Excludes patients who died prior to definitive repair
n = all patients with acetabular fracture who were hemodynamically unstable in ED, had provisional stabilization and survived at least 7 days Indicator Yes No
2006/2007, n = 0 n/a n/a
2005/2006, n = 1 1 0
2004/2005, n = 1 1 0
100100
0
00
2004/2005 2005/2006 2006/2007
%Yes %No
Femur Fracture Did the patient have operative management of the femur fracture within 24 hours of arrival to FMC trauma centre? This indicator was reviewed by the Division of Orthopaedics and will remain unchanged for the 2006/2007 year. Criteria is undergoing further review. n = all patients with operative management of femur fracture. Indicator Yes No
2006/2007, n = 57 53 4
2005/2006, n = 63 55 8
2004/2005, n = 53 46 7
2003/2004, n = 53 51 2
2002/2003, n = 31 25 6
96.2 87.3 93.080.6 86.8
7.012.719.4 3.8 13.2
2002/2003 2003/2004 2004/2005 2005/2006 2006/2007
%Yes %No
- 58 -
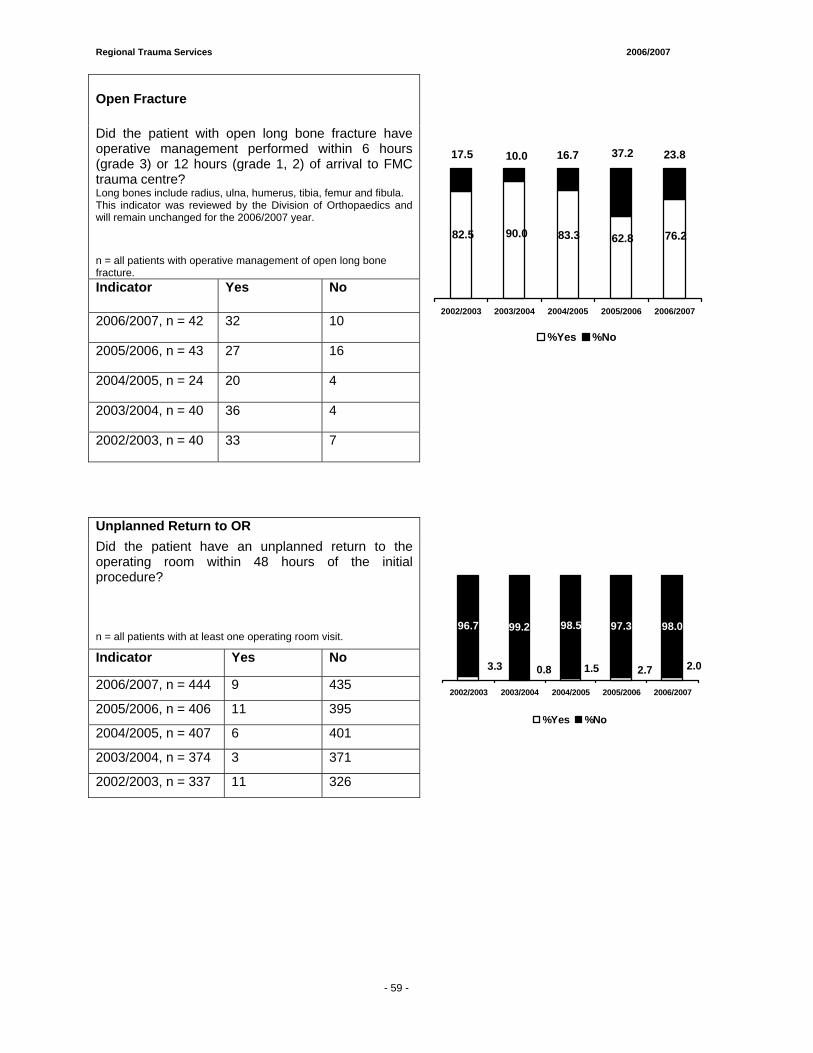
Regional Trauma Services 2006/2007
- 59 -
Open Fracture
Did the patient with open long bone fracture have operative management performed within 6 hours (grade 3) or 12 hours (grade 1, 2) of arrival to FMC trauma centre? Long bones include radius, ulna, humerus, tibia, femur and fibula. This indicator was reviewed by the Division of Orthopaedics and will remain unchanged for the 2006/2007 year.
n = all patients with operative management of open long bone fracture. Indicator Yes No
2006/2007, n = 42 32 10
2005/2006, n = 43 27 16
2004/2005, n = 24 20 4
2003/2004, n = 40 36 4
2002/2003, n = 40 33 7
90.0 62.8 76.282.5 83.3
37.2 23.817.5 10.0 16.7
2002/2003 2003/2004 2004/2005 2005/2006 2006/2007
%Yes %No
Unplanned Return to OR Did the patient have an unplanned return to the operating room within 48 hours of the initial procedure? n = all patients with at least one operating room visit.
Indicator Yes No
2006/2007, n = 444 9 435
2005/2006, n = 406 11 395
2004/2005, n = 407 6 401
2003/2004, n = 374 3 371
2002/2003, n = 337 11 326
97.3 98.0
2.02.70.83.3 1.5
96.7 99.2 98.5
2002/2003 2003/2004 2004/2005 2005/2006 2006/2007
%Yes %No
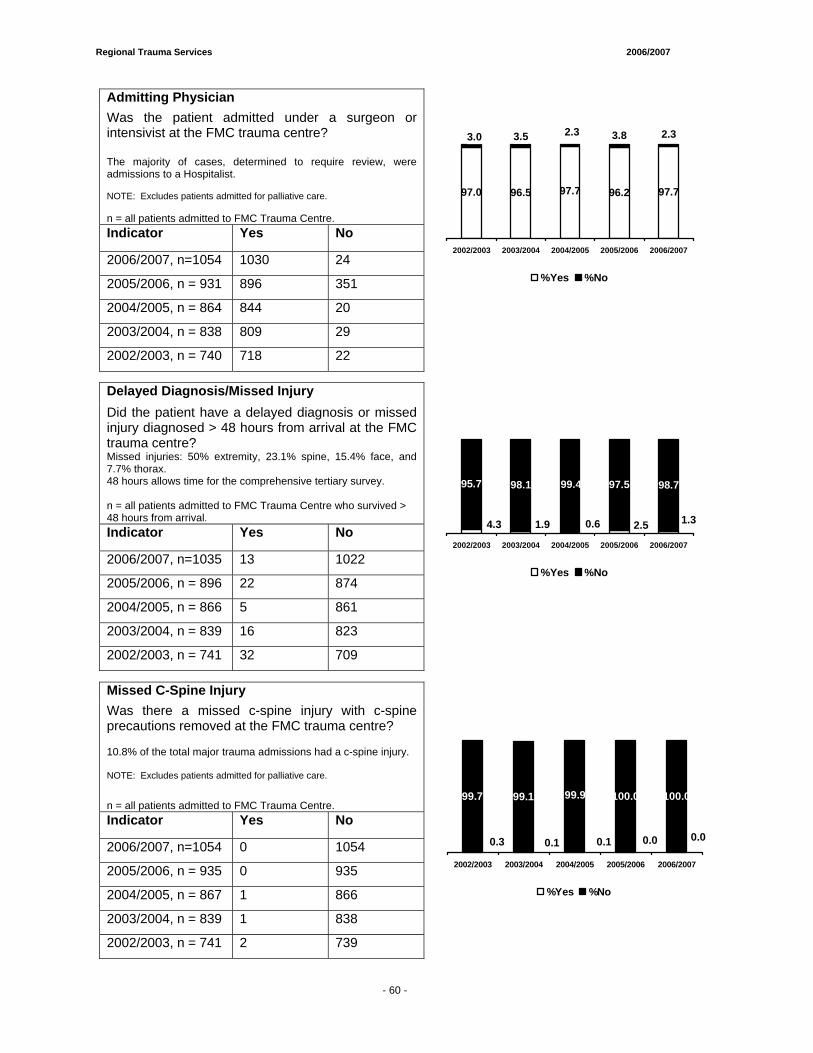
Regional Trauma Services 2006/2007
- 59 -
Admitting Physician Was the patient admitted under a surgeon or intensivist at the FMC trauma centre? The majority of cases, determined to require review, were admissions to a Hospitalist. NOTE: Excludes patients admitted for palliative care. n = all patients admitted to FMC Trauma Centre. Indicator Yes No
2006/2007, n=1054 1030 24
2005/2006, n = 931 896 351
2004/2005, n = 864 844 20
2003/2004, n = 838 809 29
2002/2003, n = 740 718 22
96.5 96.2 97.7
3.8 2.3
97.0 97.7
3.0 3.5 2.3
2002/2003 2003/2004 2004/2005 2005/2006 2006/2007
%Yes %No
Delayed Diagnosis/Missed Injury Did the patient have a delayed diagnosis or missed injury diagnosed > 48 hours from arrival at the FMC trauma centre? Missed injuries: 50% extremity, 23.1% spine, 15.4% face, and 7.7% thorax. 48 hours allows time for the comprehensive tertiary survey. n = all patients admitted to FMC Trauma Centre who survived > 48 hours from arrival. Indicator Yes No
2006/2007, n=1035 13 1022
2005/2006, n = 896 22 874
2004/2005, n = 866 5 861
2003/2004, n = 839 16 823
2002/2003, n = 741 32 709
97.5 98.7
1.32.51.94.3 0.6
95.7 98.1 99.4
2002/2003 2003/2004 2004/2005 2005/2006 2006/2007
%Yes %No
Missed C-Spine Injury Was there a missed c-spine injury with c-spine precautions removed at the FMC trauma centre? 10.8% of the total major trauma admissions had a c-spine injury. NOTE: Excludes patients admitted for palliative care.
n = all patients admitted to FMC Trauma Centre. Indicator Yes No
2006/2007, n=1054 0 1054
2005/2006, n = 935 0 935
2004/2005, n = 867 1 866
2003/2004, n = 839 1 838
2002/2003, n = 741 2 739
100.0 100.0
0.00.00.10.3 0.1
99.7 99.1 99.9
2002/2003 2003/2004 2004/2005 2005/2006 2006/2007
%Yes %No
- 60 -
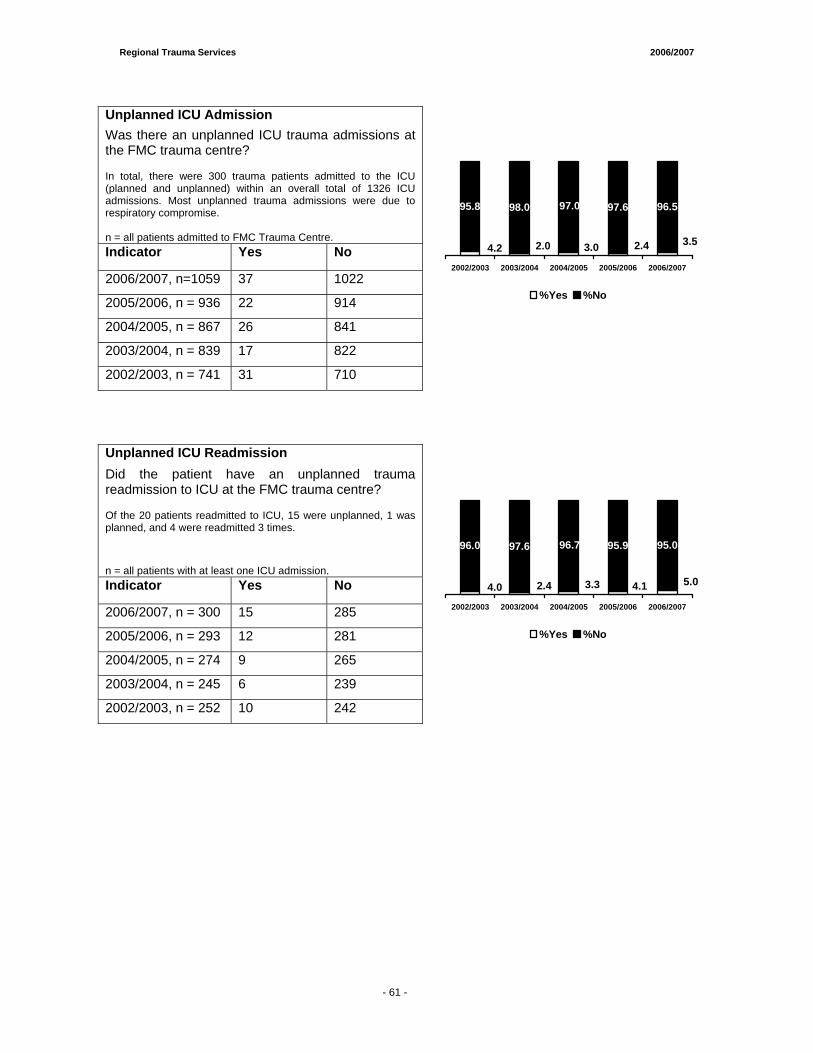
Regional Trauma Services 2006/2007
- 65 -
Unplanned ICU Admission Was there an unplanned ICU trauma admissions at the FMC trauma centre? In total, there were 300 trauma patients admitted to the ICU (planned and unplanned) within an overall total of 1326 ICU admissions. Most unplanned trauma admissions were due to respiratory compromise. n = all patients admitted to FMC Trauma Centre. Indicator Yes No
2006/2007, n=1059 37 1022
2005/2006, n = 936 22 914
2004/2005, n = 867 26 841
2003/2004, n = 839 17 822
2002/2003, n = 741 31 710
97.6 96.5
3.52.42.04.2 3.0
95.8 98.0 97.0
2002/2003 2003/2004 2004/2005 2005/2006 2006/2007
%Yes %No
Unplanned ICU Readmission Did the patient have an unplanned trauma readmission to ICU at the FMC trauma centre? Of the 20 patients readmitted to ICU, 15 were unplanned, 1 was planned, and 4 were readmitted 3 times.
n = all patients with at least one ICU admission. Indicator Yes No
2006/2007, n = 300 15 285
2005/2006, n = 293 12 281
2004/2005, n = 274 9 265
2003/2004, n = 245 6 239
2002/2003, n = 252 10 242
95.9 95.0
5.04.12.44.0 3.3
96.0 97.6 96.7
2002/2003 2003/2004 2004/2005 2005/2006 2006/2007
%Yes %No
- 61 -
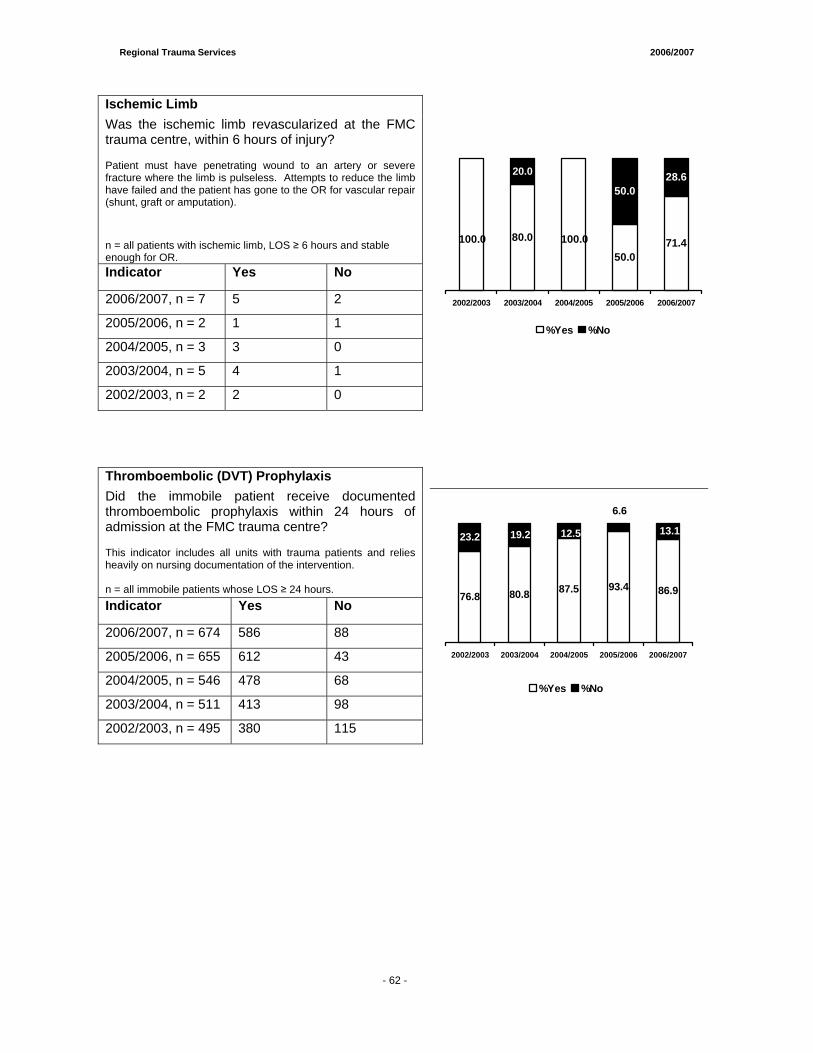
Regional Trauma Services 2006/2007
- 65 -
Ischemic Limb Was the ischemic limb revascularized at the FMC trauma centre, within 6 hours of injury? Patient must have penetrating wound to an artery or severe fracture where the limb is pulseless. Attempts to reduce the limb have failed and the patient has gone to the OR for vascular repair (shunt, graft or amputation).
n = all patients with ischemic limb, LOS ≥ 6 hours and stable enough for OR. Indicator Yes No
2006/2007, n = 7 5 2
2005/2006, n = 2 1 1
2004/2005, n = 3 3 0
2003/2004, n = 5 4 1
2002/2003, n = 2 2 0
80.0
50.071.4
50.028.6
100.0100.0
0.0
20.0
0.0
2002/2003 2003/2004 2004/2005 2005/2006 2006/2007
%Yes %No
Thromboembolic (DVT) Prophylaxis Did the immobile patient receive documented thromboembolic prophylaxis within 24 hours of admission at the FMC trauma centre? This indicator includes all units with trauma patients and relies heavily on nursing documentation of the intervention. n = all immobile patients whose LOS ≥ 24 hours. Indicator Yes No
2006/2007, n = 674 586 88
2005/2006, n = 655 612 43
2004/2005, n = 546 478 68
2003/2004, n = 511 413 98
2002/2003, n = 495 380 115
80.893.4 86.976.8
87.5
13.1
6.6
23.2 19.2 12.5
2002/2003 2003/2004 2004/2005 2005/2006 2006/2007
%Yes %No
- 62 -
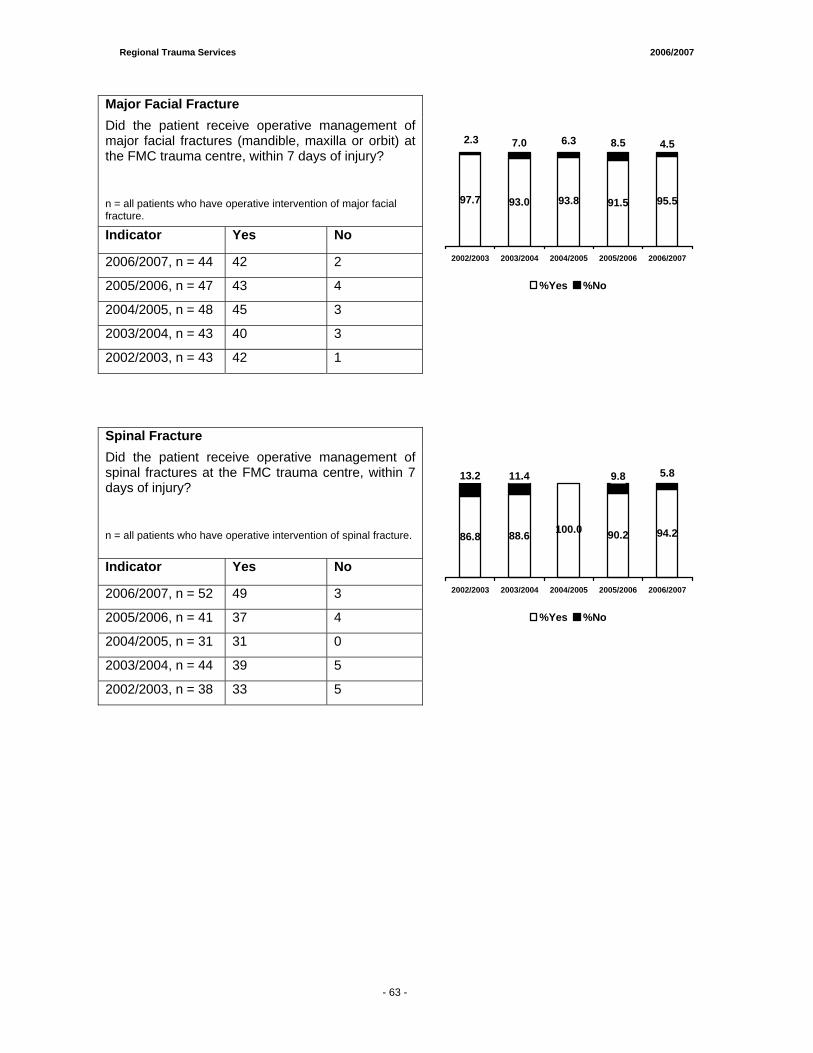
Regional Trauma Services 2006/2007
- 65 -
Major Facial Fracture Did the patient receive operative management of major facial fractures (mandible, maxilla or orbit) at the FMC trauma centre, within 7 days of injury?
n = all patients who have operative intervention of major facial fracture.
Indicator Yes No
2006/2007, n = 44 42 2
2005/2006, n = 47 43 4
2004/2005, n = 48 45 3
2003/2004, n = 43 40 3
2002/2003, n = 43 42 1
93.0 91.5 95.5
4.5
97.7 93.8
8.52.3 7.0 6.3
2002/2003 2003/2004 2004/2005 2005/2006 2006/2007
%Yes %No
Spinal Fracture Did the patient receive operative management of spinal fractures at the FMC trauma centre, within 7 days of injury?
n = all patients who have operative intervention of spinal fracture.
Indicator Yes No
2006/2007, n = 52 49 3
2005/2006, n = 41 37 4
2004/2005, n = 31 31 0
2003/2004, n = 44 39 5
2002/2003, n = 38 33 5
88.6 90.2 94.2100.086.8
5.89.80.011.413.2
2002/2003 2003/2004 2004/2005 2005/2006 2006/2007
%Yes %No
- 63 -
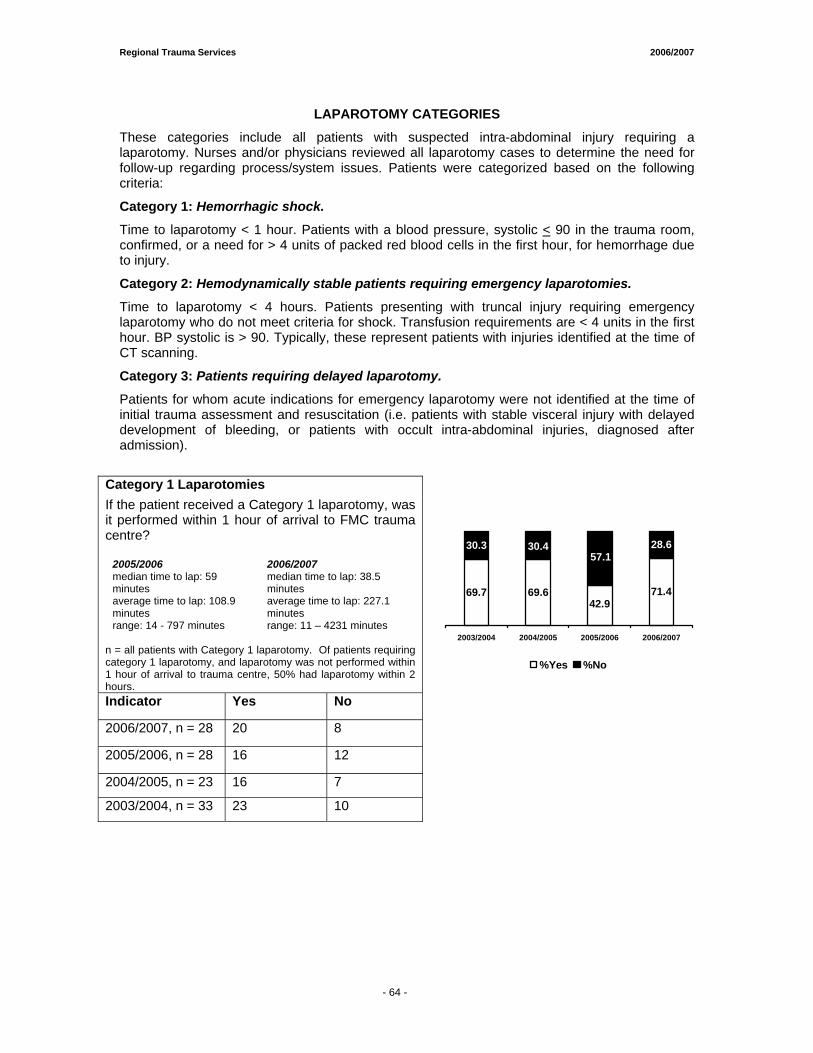
Regional Trauma Services 2006/2007
- 65 -
LAPAROTOMY CATEGORIES
These categories include all patients with suspected intra-abdominal injury requiring a laparotomy. Nurses and/or physicians reviewed all laparotomy cases to determine the need for follow-up regarding process/system issues. Patients were categorized based on the following criteria:
Category 1: Hemorrhagic shock.
Time to laparotomy < 1 hour. Patients with a blood pressure, systolic < 90 in the trauma room, confirmed, or a need for > 4 units of packed red blood cells in the first hour, for hemorrhage due to injury.
Category 2: Hemodynamically stable patients requiring emergency laparotomies.
Time to laparotomy < 4 hours. Patients presenting with truncal injury requiring emergency laparotomy who do not meet criteria for shock. Transfusion requirements are < 4 units in the first hour. BP systolic is > 90. Typically, these represent patients with injuries identified at the time of CT scanning.
Category 3: Patients requiring delayed laparotomy.
Patients for whom acute indications for emergency laparotomy were not identified at the time of initial trauma assessment and resuscitation (i.e. patients with stable visceral injury with delayed development of bleeding, or patients with occult intra-abdominal injuries, diagnosed after admission).
Category 1 Laparotomies If the patient received a Category 1 laparotomy, was it performed within 1 hour of arrival to FMC trauma centre?
2005/2006 2006/2007 median time to lap: 59 minutes
median time to lap: 38.5 minutes
average time to lap: 108.9 minutes
average time to lap: 227.1 minutes
range: 14 - 797 minutes range: 11 – 4231 minutes n = all patients with Category 1 laparotomy. Of patients requiring category 1 laparotomy, and laparotomy was not performed within 1 hour of arrival to trauma centre, 50% had laparotomy within 2 hours. Indicator Yes No
2006/2007, n = 28 20 8
2005/2006, n = 28 16 12
2004/2005, n = 23 16 7
2003/2004, n = 33 23 10
69.6 71.4
28.6
69.742.9
30.3 30.457.1
2003/2004 2004/2005 2005/2006 2006/2007
%Yes %No
- 64 -
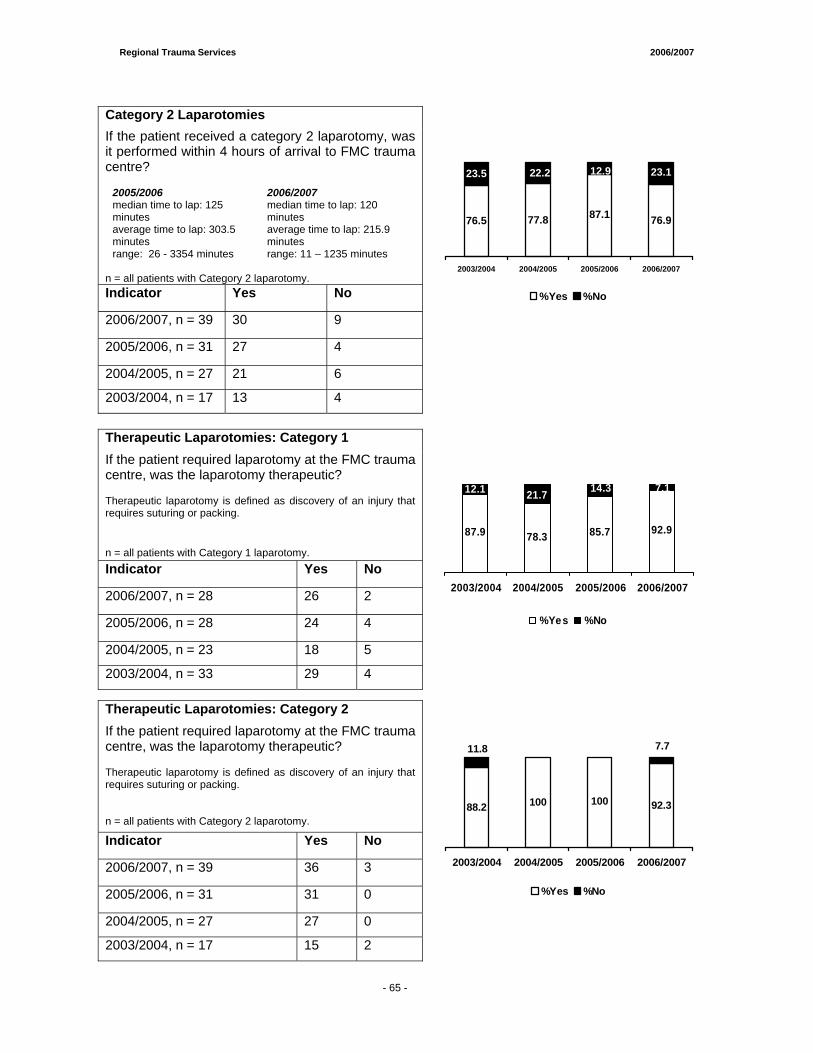
Regional Trauma Services 2006/2007
- 65 -
Category 2 Laparotomies If the patient received a category 2 laparotomy, was it performed within 4 hours of arrival to FMC trauma centre?
2005/2006 2006/2007 median time to lap: 125 minutes
median time to lap: 120 minutes
average time to lap: 303.5 minutes
average time to lap: 215.9 minutes
range: 26 - 3354 minutes range: 11 – 1235 minutes n = all patients with Category 2 laparotomy. Indicator Yes No
2006/2007, n = 39 30 9
2005/2006, n = 31 27 4
2004/2005, n = 27 21 6
2003/2004, n = 17 13 4
77.8 76.9
23.1
76.5 87.1
23.5 22.2 12.9
2003/2004 2004/2005 2005/2006 2006/2007
%Yes %No
Therapeutic Laparotomies: Category 1 If the patient required laparotomy at the FMC trauma centre, was the laparotomy therapeutic? Therapeutic laparotomy is defined as discovery of an injury that requires suturing or packing. n = all patients with Category 1 laparotomy. Indicator Yes No
2006/2007, n = 28 26 2
2005/2006, n = 28 24 4
2004/2005, n = 23 18 5
2003/2004, n = 33 29 4
78.3 92.987.9 85.7
7.112.1 21.7 14.3
2003/2004 2004/2005 2005/2006 2006/2007
%Yes %No
Therapeutic Laparotomies: Category 2 If the patient required laparotomy at the FMC trauma centre, was the laparotomy therapeutic? Therapeutic laparotomy is defined as discovery of an injury that requires suturing or packing. n = all patients with Category 2 laparotomy.
Indicator Yes No
2006/2007, n = 39 36 3
2005/2006, n = 31 31 0
2004/2005, n = 27 27 0
2003/2004, n = 17 15 2
100 92.310088.2
7.7011.811.8
2003/2004 2004/2005 2005/2006 2006/2007
%Yes %No
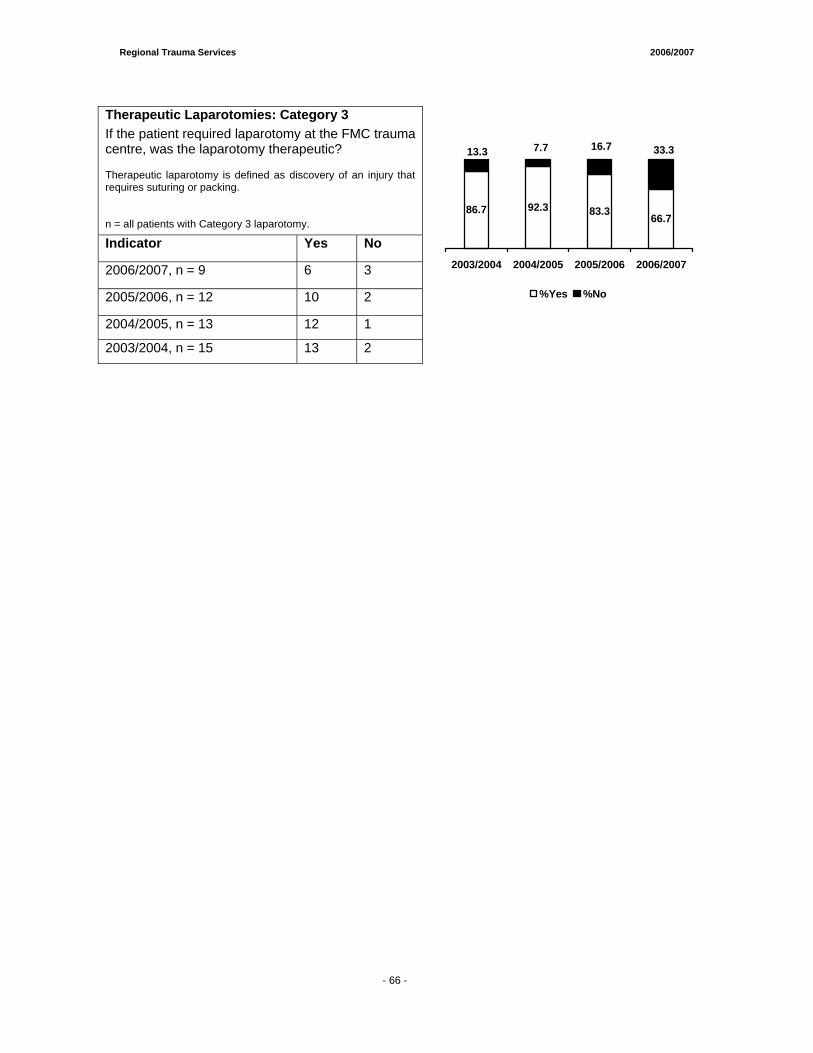
Regional Trauma Services 2006/2007
- 65 -
Therapeutic Laparotomies: Category 3 If the patient required laparotomy at the FMC trauma centre, was the laparotomy therapeutic? Therapeutic laparotomy is defined as discovery of an injury that requires suturing or packing. n = all patients with Category 3 laparotomy.
Indicator Yes No
2006/2007, n = 9 6 3
2005/2006, n = 12 10 2
2004/2005, n = 13 12 1
2003/2004, n = 15 13 2
86.7 92.3 83.3 66.7
33.37.713.3 16.7
2003/2004 2004/2005 2005/2006 2006/2007
%Yes %No
- 66 -
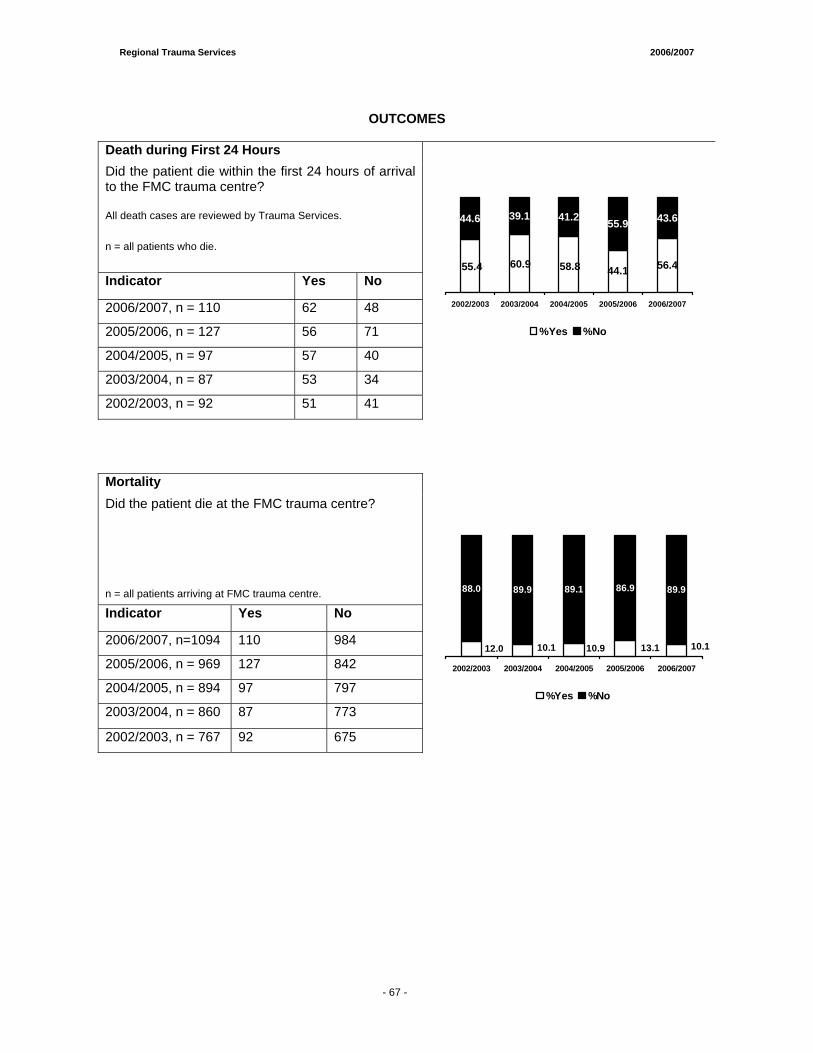
Regional Trauma Services 2006/2007
- 65 -
OUTCOMES
Death during First 24 Hours Did the patient die within the first 24 hours of arrival to the FMC trauma centre? All death cases are reviewed by Trauma Services.
n = all patients who die.
Indicator Yes No
2006/2007, n = 110 62 48
2005/2006, n = 127 56 71
2004/2005, n = 97 57 40
2003/2004, n = 87 53 34
2002/2003, n = 92 51 41
44.1 56.4
55.9 43.6
58.860.955.4
44.6 39.1 41.2
2002/2003 2003/2004 2004/2005 2005/2006 2006/2007
%Yes %No
Mortality Did the patient die at the FMC trauma centre? n = all patients arriving at FMC trauma centre.
Indicator Yes No
2006/2007, n=1094 110 984
2005/2006, n = 969 127 842
2004/2005, n = 894 97 797
2003/2004, n = 860 87 773
86.9 89.9
10.113.110.910.112.0
88.0 89.9 89.1
2002/2003 2003/2004 2004/2005 2005/2006 2006/2007
%Yes %No
2002/2003, n = 767 92 675
- 67 -
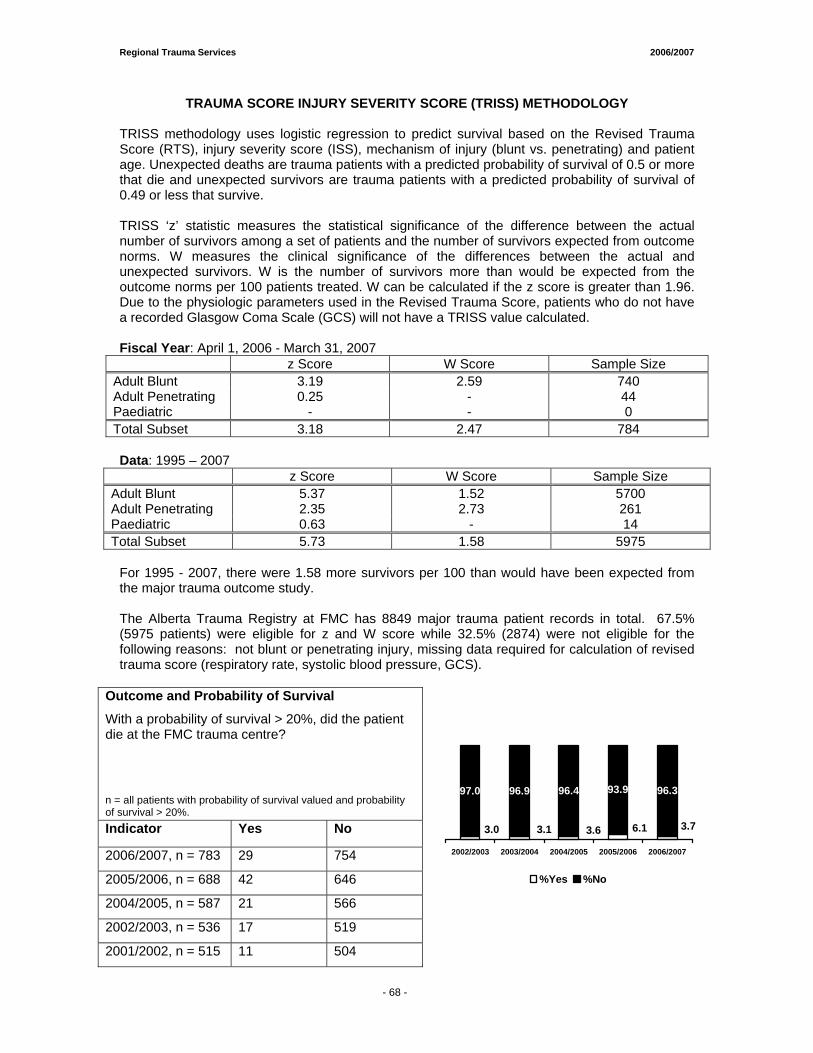
Regional Trauma Services 2006/2007
- 65 -
TRAUMA SCORE INJURY SEVERITY SCORE (TRISS) METHODOLOGY TRISS methodology uses logistic regression to predict survival based on the Revised Trauma Score (RTS), injury severity score (ISS), mechanism of injury (blunt vs. penetrating) and patient age. Unexpected deaths are trauma patients with a predicted probability of survival of 0.5 or more that die and unexpected survivors are trauma patients with a predicted probability of survival of 0.49 or less that survive. TRISS ‘z’ statistic measures the statistical significance of the difference between the actual number of survivors among a set of patients and the number of survivors expected from outcome norms. W measures the clinical significance of the differences between the actual and unexpected survivors. W is the number of survivors more than would be expected from the outcome norms per 100 patients treated. W can be calculated if the z score is greater than 1.96. Due to the physiologic parameters used in the Revised Trauma Score, patients who do not have a recorded Glasgow Coma Scale (GCS) will not have a TRISS value calculated. Fiscal Year: April 1, 2006 - March 31, 2007
z Score W Score Sample Size Adult Blunt 3.19 2.59 740 Adult Penetrating 0.25 - 44 Paediatric - - 0 Total Subset 3.18 2.47 784
Data: 1995 – 2007
z Score W Score Sample Size Adult Blunt 5.37 1.52 5700 Adult Penetrating 2.35 2.73 261 Paediatric 0.63 - 14 Total Subset 5.73 1.58 5975
For 1995 - 2007, there were 1.58 more survivors per 100 than would have been expected from the major trauma outcome study. The Alberta Trauma Registry at FMC has 8849 major trauma patient records in total. 67.5% (5975 patients) were eligible for z and W score while 32.5% (2874) were not eligible for the following reasons: not blunt or penetrating injury, missing data required for calculation of revised trauma score (respiratory rate, systolic blood pressure, GCS).
Outcome and Probability of Survival
With a probability of survival > 20%, did the patient die at the FMC trauma centre? n = all patients with probability of survival valued and probability of survival > 20%. Indicator Yes No
2006/2007, n = 783 29 754
2005/2006, n = 688 42 646
2004/2005, n = 587 21 566
2002/2003, n = 536 17 519
2001/2002, n = 515 11 504
93.9 96.3
3.76.13.63.13.0
97.0 96.9 96.4
2002/2003 2003/2004 2004/2005 2005/2006 2006/2007
%Yes %No
- 68 -

Regional Pediatric Trauma Report AALLBBEERRTTAA CCHHIILLDDRREENN’’SS HHOOSSPPIITTAALL
ACH Trauma Services Staff
Dr. Vincent Grant .....................................................................Medical Director
Sherry MacGillivray ........................... Regional Pediatric Trauma Coordinator
Maria Vivas......................................................................................Data Analyst

Regional Trauma Services 2006/2007
- 72 -
TABLE OF CONTENTS
1. Introduction..................................................................................................73
2. Clinical Care ................................................................................................74
3. Education ....................................................................................................76 4. Research ......................................................................................................77
5. Quality Assurance.......................................................................................78
6. Future Planning ..........................................................................................79
APPENDICES
Appendix A ...............................................................Trauma Quality Indicators
Appendix B ..................................................................Major Trauma Statistics

1. Introduction The year 2006-2007 was a year of significant change for the Pediatric Trauma Program. There were transitions in several positions within the Pediatric Trauma Program. There was a transition between Medical Directors for the Pediatric Trauma Program. Dr. Francois Belanger held the role of interim Medical Director up until June 30, 2006. Dr. Belanger is to be commended for his outstanding leadership of the Pediatric Trauma Program. He oversaw the initial development of a comprehensive proposal to both enhance the current Trauma Program and plan for potential expansion to the 15-17 year old trauma population. He also oversaw a complete overhaul of the trauma audit and review process, allowing for a significant decrease in the length of time before cases could be reviewed by the Trauma Audit Committee. Dr. Vincent Grant assumed the role of Medical Director of Pediatric Trauma as of July 1, 2006. Dr. Grant is a Pediatric Emergency Physician who has undertaken a formal fellowship in Pediatric Trauma and was most recently the Medical Director of Trauma at the Children’s Hospital of Eastern Ontario in Ottawa. There was also a transition in the role of Pediatric Trauma Coordinator. Mr. Laurie Leckie left the position in August of 2006. Mr. Leckie is to be commended for his enthusiasm and commitment to the role of Pediatric Trauma Coordinator. As a result of the most recent TAC accreditation recommendations, the position of Pediatric Trauma Coordinator increased from a 0.5 FTE to a 1.0 FTE. One of the benefits of this increase was that it allowed Mr. Leckie to help revise and implement the new trauma audit and review process. Sherry MacGillivray assumed the position of Trauma Coordinator in November 2006. Ms. MacGillivray has a wealth of trauma experience from work in large volume trauma centres in Calgary, Vancouver and the Middle East and has already proven to be a great addition to the ACH Trauma Program, particularly in the area of trauma education for front-line staff. Our main goals continued to be strong clinical care, excellence and leadership in pediatric trauma education both within the Alberta Children’s Hospital and to our regional partners, on-going advocacy in injury prevention and continued productivity in quality assurance and research. We wish to thank all of the staff at the Alberta Children’s Hospital who have had an impact on the Trauma Program, and who continue to support our goals in caring for critically injured children and youth. In particular, a great deal of thanks goes to the nurses, physicians, respiratory therapists, and other front-line staff who remain devoted to the care of these children and their families, as well as all of the other staff who make excellence in pediatric trauma care at the Alberta Children’s Hospital a veritable “team effort”.
- 73 -
2. Clinical Care Identifying ways to improve the clinical care of the trauma patient at the Alberta Children’s Hospital (ACH) is a major focus of the Pediatric Trauma Program. Over the past year the following activities have been carried out:
i) Trauma Expansion Plan • This extensive plan underwent further review and revision in 2006-07. It was
formally divided into two phases, each with distinctive objectives and timelines. Phase 1 represented enhancements required for clinical excellence in the current patient volume at ACH for the 0-14 year population. These objectives are to be completed by the Spring of 2008, and contain important steps that must be fulfilled prior to entertaining expansion of the trauma population to the 15-17 year population.
• Phase 1 plans (October 2006 - March 2008) include: o Review and revision of current trauma team activation (code 77)
guidelines - revisions currently being reviewed by Trauma Committee o Review and revision of current trauma team composition - revisions
currently being reviewed by Trauma Committee o Implementation of a designated trauma team leader roster - awaiting
funding o Enhancement of surgical services staffing to ensure appropriate response
time for patients requiring urgent OR (16 hrs/day x 7 days/week in-house coverage with appropriate on-call response for other hours) - awaiting funding
o Enhancement of Diagnostic Imaging staffing to ensure appropriate response time for patients requiring urgent CT (16 hrs/day x 7 days/week) in-house CT response (with appropriate on-call response for other hours) - awaiting funding
o Development of in-patient trauma service with appropriate coverage and consultation - under negotiation
o Development of dedicated In-patient Trauma Unit o Development of Trauma / Rehabilitation Nurse Practitioner role - funding
received and position in development o Admission guidelines for trauma patients with respect to admitting service
- under negotiation o Improvements in rehabilitation coverage and services o Development of protocols to address thoracic, vascular surgery and
interventional radiology medical coverage o Enhancement of transfusion medicine services o A written no refusal policy for trauma patients o Enhancement in staff education in pediatric trauma - funding received and
Trauma Nursing Core Courses (TNCC) planned for emergency, critical care and in-patient nurses
ii) Re-organization of the Trauma Room in the Emergency Department
o completed and approved
iii) Revised Trauma Chart for Emergency Department Nursing o currently under development
iv) Revised Drug Manual for Emergency Department
o currently under development
v) Revised Medication Cart for Emergency Department Trauma Room o currently under development
- 74 -
vi) Development of an Advanced Trauma/Resuscitation Orientation
o completed and approved
vii) Development of a Hypothermia Kit with Management Guidelines for the Emergency Department Trauma Room
o completed and approved
viii) Revised Hypothermia Protocol o completed and approved
ix) Direct Admissions Policy o new policy regarding trauma admissions in that all trauma patients should
stop in the emergency department prior to admission (ie. no further direct admissions of trauma patients)
x) Liaising with Regional, Provincial and National Groups
o Trauma Coordinators of Canada - Member o Trauma Association of Canada - Member o Canadian Hospitals Injury Prevention & Reporting Prevention Programs
(CHIRPP)
- 75 -
3. Education
i) Trauma Rounds March 2007, Pediatric Trauma Centres: Are we making a difference? - Dr. V. Grant
ii) Mock Trauma Codes Regular mock trauma codes provided residents, ED physicians, nurses, respiratory therapists, nursing aides and unit clerks with an opportunity to learn from simulated trauma codes (performed weekly from October - December 2006 then bi-weekly)
iii) Emergency Nursing Trauma Education Sessions Monthly trauma education sessions were held for ED nurses on a sign- up basis. Trauma statistics, common mechanisms of injury and trauma assessment was the focus, but round table discussions and procedures were encouraged. These sessions were very well received and will continue in the future.
iv) Emergency Nursing Trauma Simulation Sessions o Monthly trauma simulation sessions were held for ED nurses on a sign-up
basis in conjunction with ED residents. The Human Patient Simulator was used to facilitate the management of trauma patients in real time. These sessions were very well received and will continue in the future.
o A one time simulation was held for emergency nurses for each of the adult sites. In the future there are plans to increase this exposure.
v) Other Nursing Sessions
Trauma education was included in General Nursing Orientation for new PICU and ED nurses at the ACH. In the future, this education will be given to a wider range of new nurses on different units at ACH.
vi) Department of Pediatrics Postgraduate Medical Education
o Academic half-day
vii) University of Calgary Undergraduate Medical Education o Human Development Course Lecture
viii) Advanced Pediatric Life Support Course
o Trauma Lecture
ix) Advanced Trauma Life Support o Dr. V. Grant – Instructor
x) Injury Prevention in Children and Adolescents Symposium o “Innovations in Pediatric Trauma”- Dr. V. Grant
- 76 -
4. Research The following research projects were in progress during 2006/2007:
o Hui C, Joughin E, Goldstein S, Cooper N, Harder J, Kiefer G, Parsons D, Howard J. FEMORAL FRACTURES IN CHILDREN LESS THAN THREE YEARS OLD: THE ROLE OF NON-ACCIDENTAL INJURY.
o Hagel BE, Rowe BH, Cherry N, Jhangri G, Belton K, Dorey A. THE EFFECT OF
BIKE HELMET LEGISLATION ON HELMET USE, HEAD INJURIES AND CYCLING HABITS.
- 77 -
5. Quality Assurance As part of the Regional Trauma Services quality improvement process, several performance indicators throughout the continuum of care are monitored on a regular basis as a measure of performance. Some of the indicators stem from audit filters set out by the American College of Surgeons’ Committee on Trauma and Trauma Registry performance measures published by the South Western Sydney Region Trauma Department, Liverpool, Australia. Other indicators were developed at the ACH as site specific performance indicators. All cases flagged by a performance indicator or audit filter are reviewed by the ACH Trauma Clinical Safety Committee to determine appropriateness of care and follow-up to care providers and trauma systems. The list of performance indicators is listed below. ACH performance indicators for 2006-07 are summarized in Appendix B. Pre-ACH care:
1. Presence of pre-hospital documentation from any phase of patient transport. 2. GCS < 8 at scene with mechanical airway intervention. 3. Length of stay at rural hospital > 2 hours. 4. Injury time to any Trauma Center (TC) <= 4 hours. 5. Utilization of ACH Transport team for transfer.
Resuscitative care: 6. Trauma Team Activation. 7. Direct admission (bypassed the Emergency Department (ED)). 8. GCS <8 at the TC with mechanical airway intervention. 9. Presence of ED nursing documentation every 30 minutes. 10. Presence of sequential neurological documentation in the ED for suspected head/spinal
cord injuries. 11. Hypothermic in the ED (< 35.0˚C). 12. GCS < 12 in the TC with a CT head performed within 4 hours from trauma center arrival
(TCA). 13. Patient stay in the ED less than 4 hours.
Definitive care: 14. Admission to a surgeon or intensivist. 15. Craniotomy within 4 hours after TCA with unstable epidural/subdural hematoma. 16. Missed cervical spine injury after 48 hours from TCA without maintaining spinal
precautions. 17. Any laparotomy procedure performed. 18. Femur fracture to the OR within 24 hours from TCA. 19. Open long bone fracture to the OR within 6-12 hours from TCA (depending on the
severity of #). 20. Unplanned return to the OR within 48 hours of initial procedure. 21. Missed injuries identified after 48 hours from TCA. 22. Reduction of joint dislocation/fracture dislocation after 1 hour from TCA. 23. Revascularization of an ischemic limb within 6 hours from the time of injury. 24. ORIF of facial fractures within 7 days after injury. 25. Operative repair of spinal fractures within 7 days after injury. 26. Pelvic ring fracture/acetabular fracture (with hemodynamic instability) provisional
stabilization > 6 hours from TCA. 27. Definitive treatment of displaced acetabular fracture > 7 days from TCA. 28. Unplanned PICU admission or re-admission.
Outcome: 29. Death during the first 24 hours from TCA. 30. Did the patient die in ACH?
- 78 -
6. Future Planning The 2007-2008 year will focus on the following activities: • Implementation of phase 1 of the Pediatric Trauma Expansion Plan
o Revised trauma code activation and response o Development of a designated trauma team leader roster o Enhancement of surgical services o Enhancement of Diagnostic Imaging services o Development of in-patient trauma service o Development of dedicated In-patient Trauma Unit o Development of Trauma / Rehabilitation Nurse Practitioner role o Improvements in rehabilitation coverage and services o Development of protocols to address thoracic, vascular surgery and
interventional radiology medical coverage o Enhancement of transfusion medicine services o A written no refusal policy for trauma patients o Enhancement in staff education in pediatric trauma
• Improving and enhancing Pediatric Trauma Rounds • Implementation of regular TNCC courses at ACH • Continuing excellence in pediatric trauma education within the ACH • Establishing excellence in pediatric trauma outreach education within the Calgary Health
Region and throughout Southern Alberta and Southeastern British Columbia • Continuing advocacy of injury prevention initiatives • Continuing leadership on a regional, provincial and national level • Development of an active pediatric trauma research program • Continuing excellence in quality assurance leadership • Developing good clinical documentation tools for trauma care providers • Focusing on improving communication with all of the services impacted in trauma delivery
through the Trauma Committee • Establishing and growing connections with other Canadian Pediatric Trauma Programs to
work collaboratively on research, quality assurance projects and improving standards of care for pediatric trauma patients
- 79 -

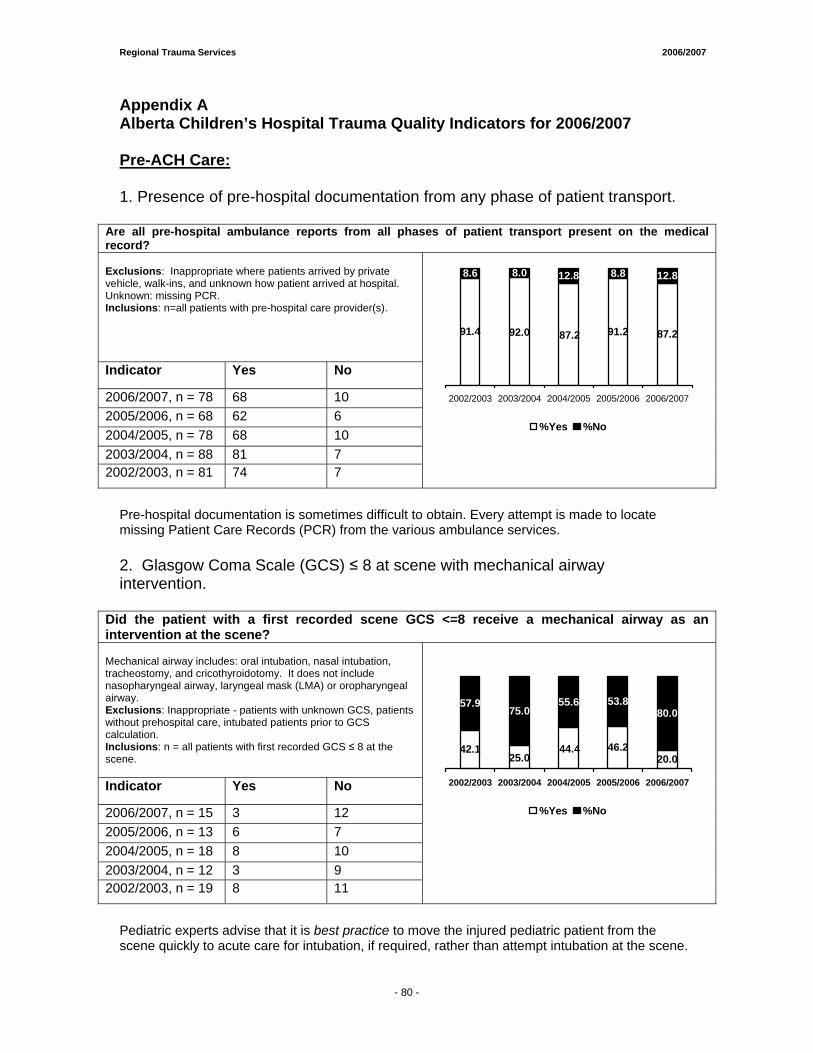
Regional Trauma Services 2006/2007
Appendix A Alberta Children’s Hospital Trauma Quality Indicators for 2006/2007 Pre-ACH Care: 1. Presence of pre-hospital documentation from any phase of patient transport.
Are all pre-hospital ambulance reports from all phases of patient transport present on the medical record? Exclusions: Inappropriate where patients arrived by private vehicle, walk-ins, and unknown how patient arrived at hospital. Unknown: missing PCR. Inclusions: n=all patients with pre-hospital care provider(s).
Indicator Yes No
2006/2007, n = 78 68 10 2005/2006, n = 68 62 6 2004/2005, n = 78 68 10 2003/2004, n = 88 81 7 2002/2003, n = 81 74 7
87.2
8.8 12.8
91.292.091.4 87.2
8.6 8.0 12.8
2002/2003 2003/2004 2004/2005 2005/2006 2006/2007
%Yes %No
Pre-hospital documentation is sometimes difficult to obtain. Every attempt is made to locate missing Patient Care Records (PCR) from the various ambulance services. 2. Glasgow Coma Scale (GCS) ≤ 8 at scene with mechanical airway intervention.
Did the patient with a first recorded scene GCS <=8 receive a mechanical airway as an intervention at the scene? Mechanical airway includes: oral intubation, nasal intubation, tracheostomy, and cricothyroidotomy. It does not include nasopharyngeal airway, laryngeal mask (LMA) or oropharyngeal airway. Exclusions: Inappropriate - patients with unknown GCS, patients without prehospital care, intubated patients prior to GCS calculation. Inclusions: n = all patients with first recorded GCS ≤ 8 at the scene. Indicator Yes No
2006/2007, n = 15 3 12 2005/2006, n = 13 6 7 2004/2005, n = 18 8 10 2003/2004, n = 12 3 9 2002/2003, n = 19 8 11
20.0
53.880.0
46.225.0
42.1 44.4
57.975.0
55.6
2002/2003 2003/2004 2004/2005 2005/2006 2006/2007
%Yes %No
Pediatric experts advise that it is best practice to move the injured pediatric patient from the scene quickly to acute care for intubation, if required, rather than attempt intubation at the scene.
- 80 -
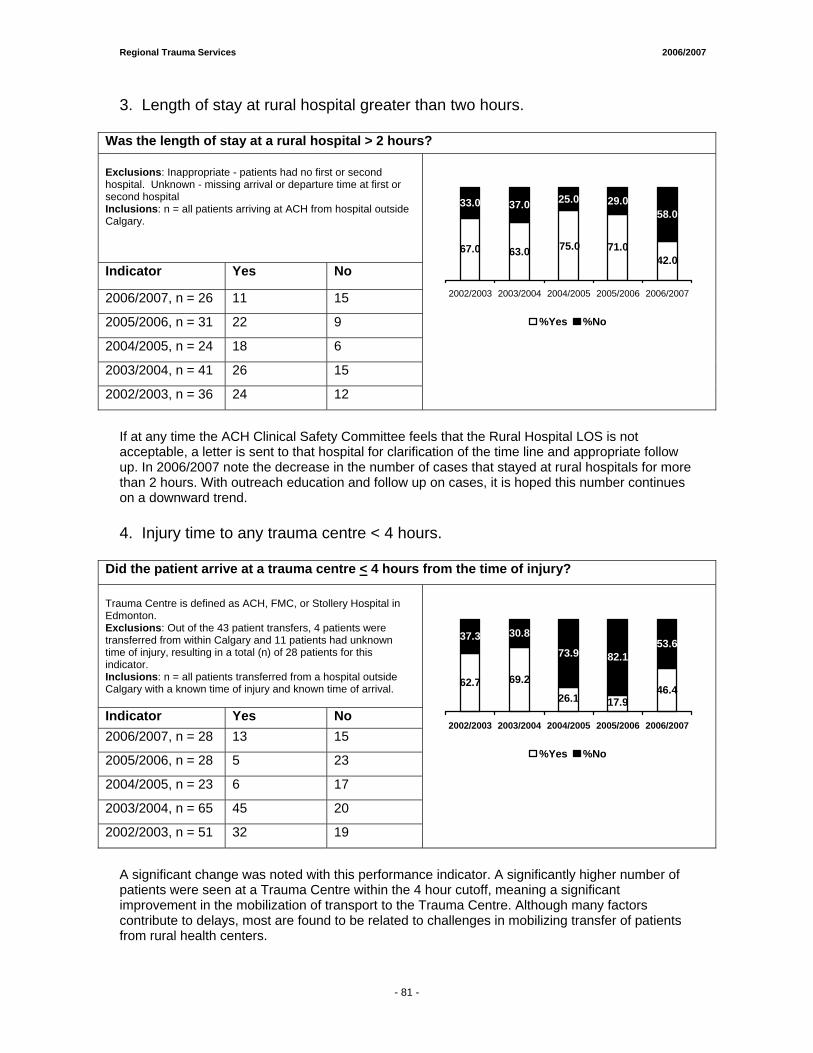
Regional Trauma Services 2006/2007
3. Length of stay at rural hospital greater than two hours.
Was the length of stay at a rural hospital > 2 hours? Exclusions: Inappropriate - patients had no first or second hospital. Unknown - missing arrival or departure time at first or second hospital Inclusions: n = all patients arriving at ACH from hospital outside Calgary.
Indicator Yes No
2006/2007, n = 26 11 15
2005/2006, n = 31 22 9
2004/2005, n = 24 18 6
2003/2004, n = 41 26 15
2002/2003, n = 36 24 12
42.0
29.058.0
71.063.067.0 75.0
33.0 37.0 25.0
2002/2003 2003/2004 2004/2005 2005/2006 2006/2007
%Yes %No
If at any time the ACH Clinical Safety Committee feels that the Rural Hospital LOS is not acceptable, a letter is sent to that hospital for clarification of the time line and appropriate follow up. In 2006/2007 note the decrease in the number of cases that stayed at rural hospitals for more than 2 hours. With outreach education and follow up on cases, it is hoped this number continues on a downward trend. 4. Injury time to any trauma centre < 4 hours.
Did the patient arrive at a trauma centre < 4 hours from the time of injury? Trauma Centre is defined as ACH, FMC, or Stollery Hospital in Edmonton. Exclusions: Out of the 43 patient transfers, 4 patients were transferred from within Calgary and 11 patients had unknown time of injury, resulting in a total (n) of 28 patients for this indicator. Inclusions: n = all patients transferred from a hospital outside Calgary with a known time of injury and known time of arrival. Indicator Yes No 2006/2007, n = 28 13 15
2005/2006, n = 28 5 23
2004/2005, n = 23 6 17
2003/2004, n = 65 45 20
2002/2003, n = 51 32 19
69.246.4
82.153.6
17.9
62.726.1
37.3 30.8
73.9
2002/2003 2003/2004 2004/2005 2005/2006 2006/2007
%Yes %No
A significant change was noted with this performance indicator. A significantly higher number of patients were seen at a Trauma Centre within the 4 hour cutoff, meaning a significant improvement in the mobilization of transport to the Trauma Centre. Although many factors contribute to delays, most are found to be related to challenges in mobilizing transfer of patients from rural health centers.
- 81 -
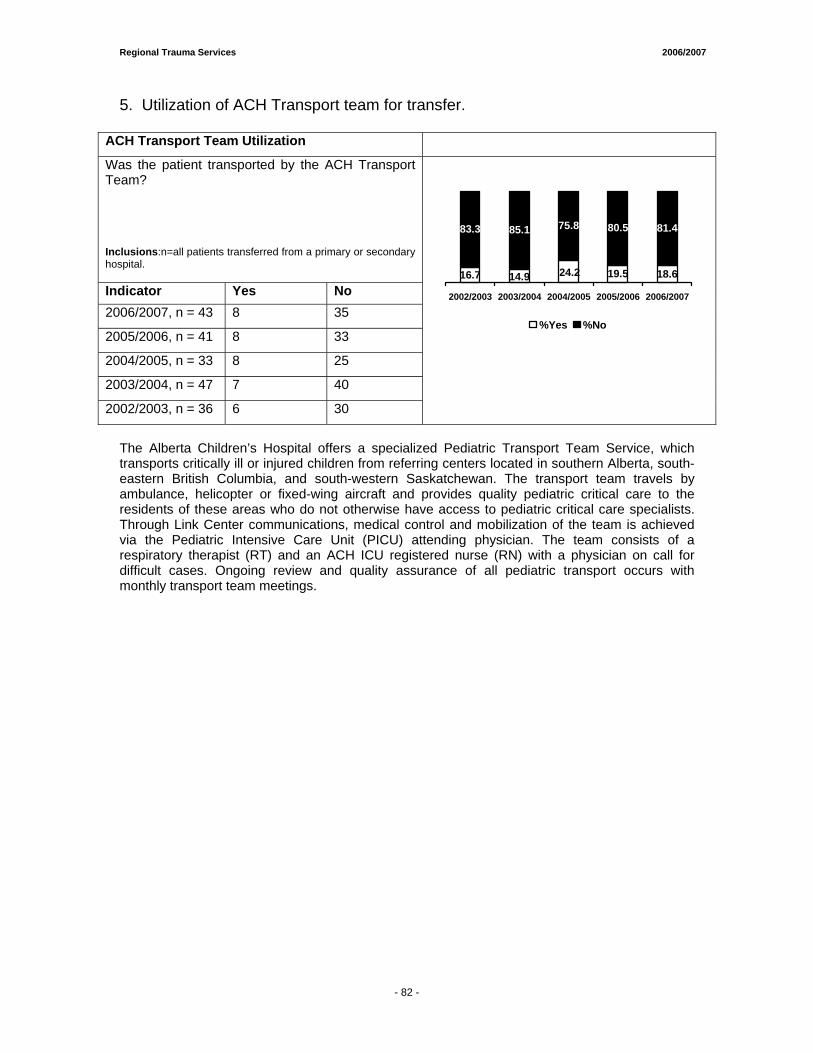
Regional Trauma Services 2006/2007
5. Utilization of ACH Transport team for transfer.
ACH Transport Team Utilization
Was the patient transported by the ACH Transport Team? Inclusions:n=all patients transferred from a primary or secondary hospital. Indicator Yes No 2006/2007, n = 43 8 35
2005/2006, n = 41 8 33
2004/2005, n = 33 8 25
2003/2004, n = 47 7 40
2002/2003, n = 36 6 30
18.6
80.5 81.4
19.514.916.7 24.2
83.3 85.1 75.8
2002/2003 2003/2004 2004/2005 2005/2006 2006/2007
%Yes %No
The Alberta Children’s Hospital offers a specialized Pediatric Transport Team Service, which transports critically ill or injured children from referring centers located in southern Alberta, south-eastern British Columbia, and south-western Saskatchewan. The transport team travels by ambulance, helicopter or fixed-wing aircraft and provides quality pediatric critical care to the residents of these areas who do not otherwise have access to pediatric critical care specialists. Through Link Center communications, medical control and mobilization of the team is achieved via the Pediatric Intensive Care Unit (PICU) attending physician. The team consists of a respiratory therapist (RT) and an ACH ICU registered nurse (RN) with a physician on call for difficult cases. Ongoing review and quality assurance of all pediatric transport occurs with monthly transport team meetings.
- 82 -
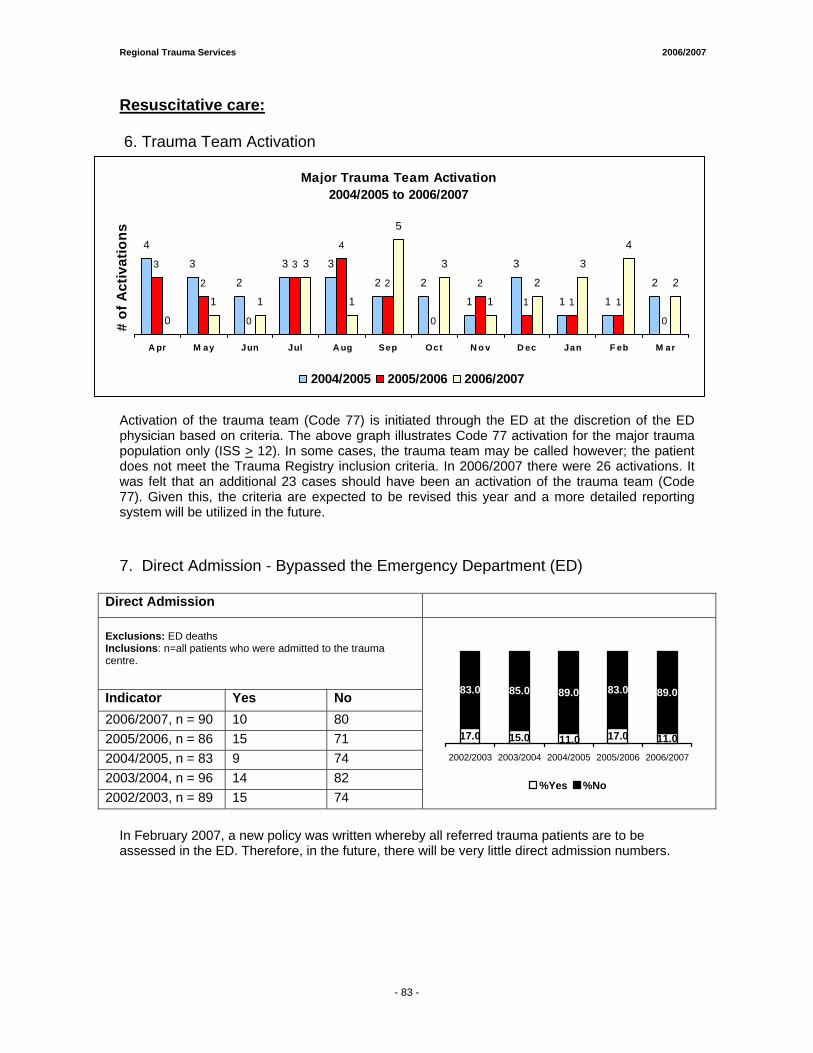
Regional Trauma Services 2006/2007
Resuscitative care: 6. Trauma Team Activation
Activation of the trauma team (Code 77) is initiated through the ED at the discretion of the ED physician based on criteria. The above graph illustrates Code 77 activation for the major trauma population only (ISS > 12). In some cases, the trauma team may be called however; the patient does not meet the Trauma Registry inclusion criteria. In 2006/2007 there were 26 activations. It was felt that an additional 23 cases should have been an activation of the trauma team (Code 77). Given this, the criteria are expected to be revised this year and a more detailed reporting system will be utilized in the future. 7. Direct Admission - Bypassed the Emergency Department (ED)
Direct Admission Exclusions: ED deaths Inclusions: n=all patients who were admitted to the trauma centre.
Indicator Yes No 2006/2007, n = 90 10 80 2005/2006, n = 86 15 71 2004/2005, n = 83 9 74 2003/2004, n = 96 14 82 2002/2003, n = 89 15 74
11.0
83.0 89.0
17.015.017.0 11.0
83.0 85.0 89.0
2002/2003 2003/2004 2004/2005 2005/2006 2006/2007
%Yes %No
In February 2007, a new policy was written whereby all referred trauma patients are to be assessed in the ED. Therefore, in the future, there will be very little direct admission numbers.
Major Trauma Team Activation 2004/2005 to 2006/2007
4
3
2
3 3
2
1 1
2
0
1 1
0
1 1
3
1
5
3
1
2
3
4
2
1
3
2
0
1
22
4
3
0
2
3
A pr M ay Jun Jul A ug Sep Oct N o v D ec Jan F eb M ar
# of
Act
ivat
ions
2004/2005 2005/2006 2006/2007
- 83 -
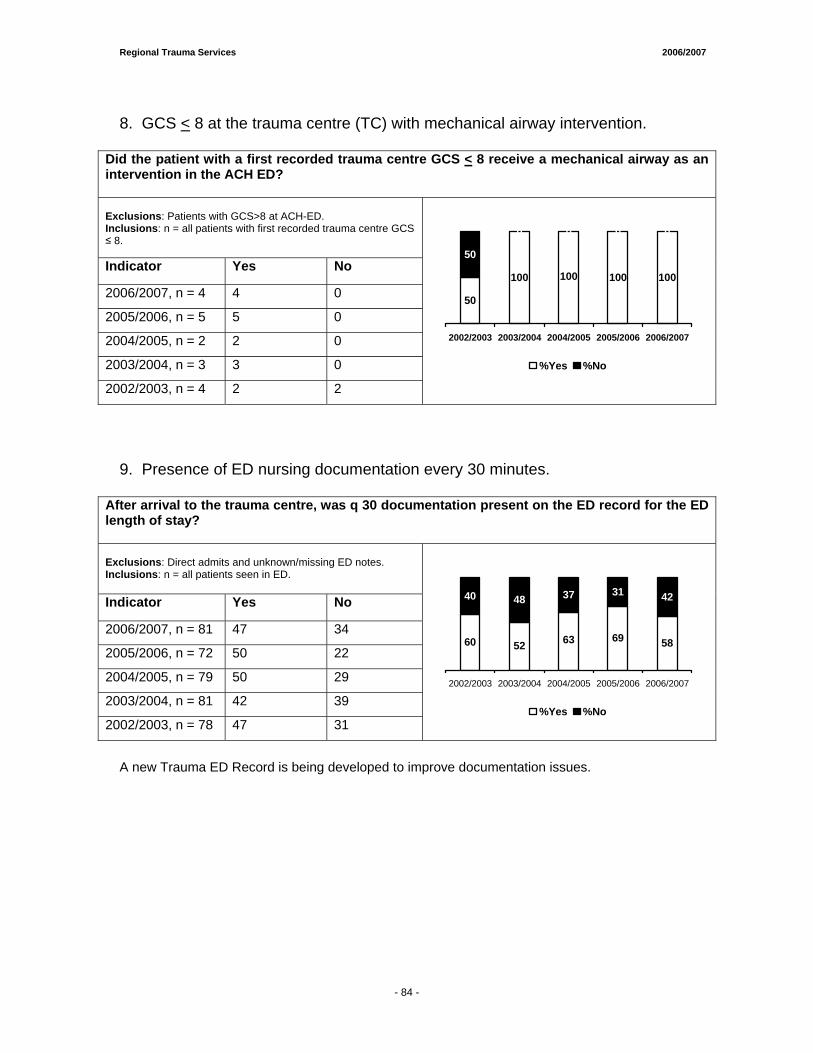
Regional Trauma Services 2006/2007
8. GCS < 8 at the trauma centre (TC) with mechanical airway intervention.
Did the patient with a first recorded trauma centre GCS < 8 receive a mechanical airway as an intervention in the ACH ED? Exclusions: Patients with GCS>8 at ACH-ED. Inclusions: n = all patients with first recorded trauma centre GCS ≤ 8.
Indicator Yes No
2006/2007, n = 4 4 0
2005/2006, n = 5 5 0
2004/2005, n = 2 2 0
2003/2004, n = 3 3 0
2002/2003, n = 4 2 2
100 100 100
0 0
50
100
50
0 0
2002/2003 2003/2004 2004/2005 2005/2006 2006/2007
%Yes %No
9. Presence of ED nursing documentation every 30 minutes.
After arrival to the trauma centre, was q 30 documentation present on the ED record for the ED length of stay? Exclusions: Direct admits and unknown/missing ED notes. Inclusions: n = all patients seen in ED.
Indicator Yes No
2006/2007, n = 81 47 34
2005/2006, n = 72 50 22
2004/2005, n = 79 50 29
2003/2004, n = 81 42 39
2002/2003, n = 78 47 31
5269 58
31 42
60 63
40 48 37
2002/2003 2003/2004 2004/2005 2005/2006 2006/2007
%Yes %No
A new Trauma ED Record is being developed to improve documentation issues.
- 84 -
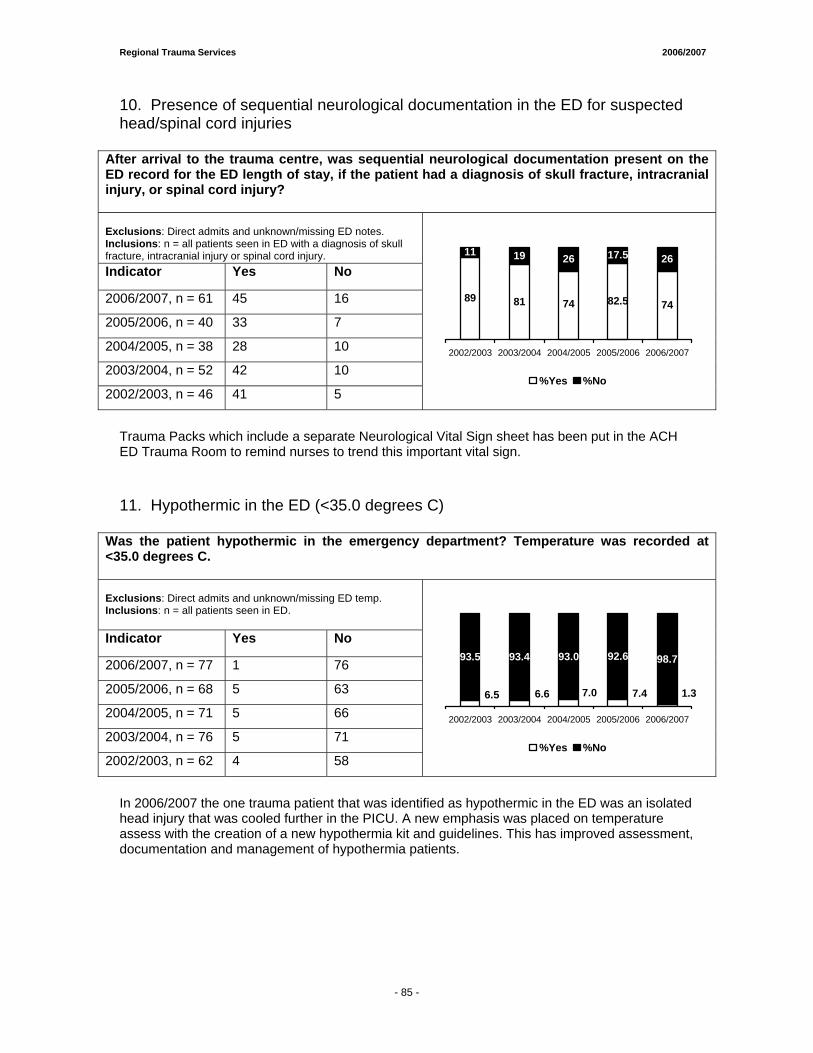
Regional Trauma Services 2006/2007
10. Presence of sequential neurological documentation in the ED for suspected head/spinal cord injuries
After arrival to the trauma centre, was sequential neurological documentation present on the ED record for the ED length of stay, if the patient had a diagnosis of skull fracture, intracranial injury, or spinal cord injury? Exclusions: Direct admits and unknown/missing ED notes. Inclusions: n = all patients seen in ED with a diagnosis of skull fracture, intracranial injury or spinal cord injury. Indicator Yes No
2006/2007, n = 61 45 16
2005/2006, n = 40 33 7
2004/2005, n = 38 28 10
2003/2004, n = 52 42 10
2002/2003, n = 46 41 5
81 82.5 74
17.5 26
89 74
11 19 26
2002/2003 2003/2004 2004/2005 2005/2006 2006/2007
%Yes %No
Trauma Packs which include a separate Neurological Vital Sign sheet has been put in the ACH ED Trauma Room to remind nurses to trend this important vital sign. 11. Hypothermic in the ED (<35.0 degrees C)
Was the patient hypothermic in the emergency department? Temperature was recorded at <35.0 degrees C. Exclusions: Direct admits and unknown/missing ED temp. Inclusions: n = all patients seen in ED.
Indicator Yes No
2006/2007, n = 77 1 76
2005/2006, n = 68 5 63
2004/2005, n = 71 5 66
2003/2004, n = 76 5 71
2002/2003, n = 62 4 58
92.6 98.7
1.37.46.66.5 7.0
93.5 93.4 93.0
2002/2003 2003/2004 2004/2005 2005/2006 2006/2007
%Yes %No
In 2006/2007 the one trauma patient that was identified as hypothermic in the ED was an isolated head injury that was cooled further in the PICU. A new emphasis was placed on temperature assess with the creation of a new hypothermia kit and guidelines. This has improved assessment, documentation and management of hypothermia patients.
- 85 -
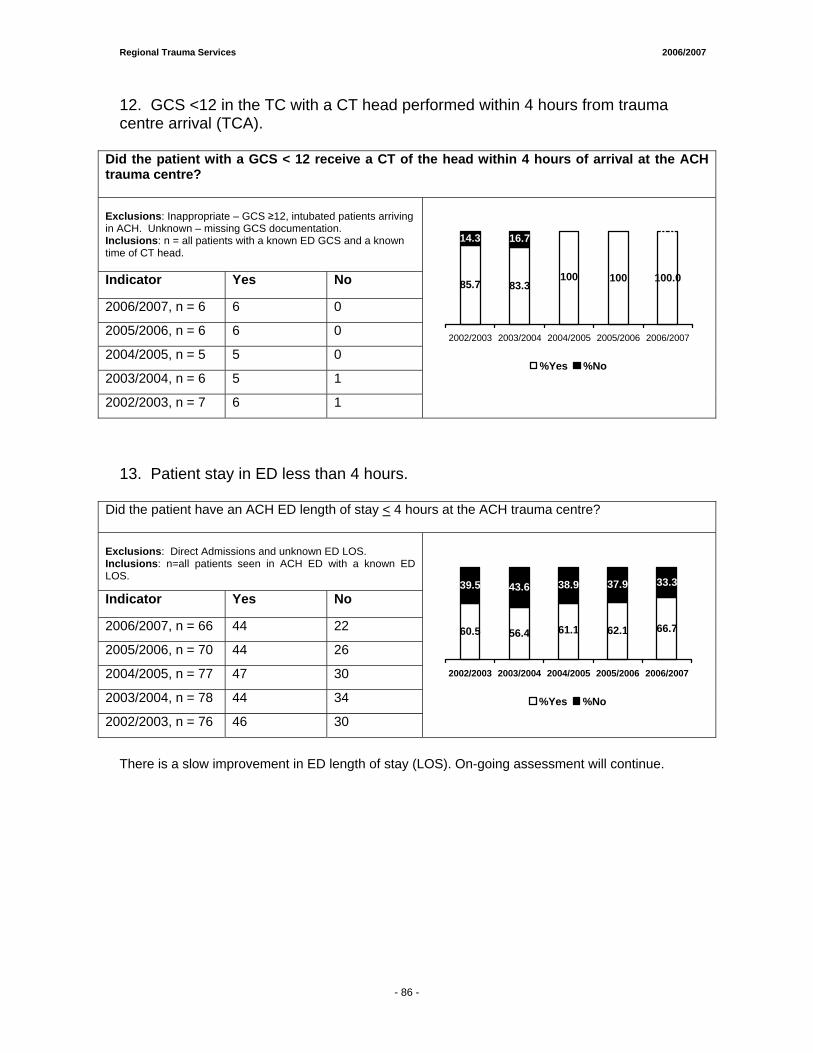
Regional Trauma Services 2006/2007
12. GCS <12 in the TC with a CT head performed within 4 hours from trauma centre arrival (TCA).
Did the patient with a GCS < 12 receive a CT of the head within 4 hours of arrival at the ACH trauma centre? Exclusions: Inappropriate – GCS ≥12, intubated patients arriving in ACH. Unknown – missing GCS documentation. Inclusions: n = all patients with a known ED GCS and a known time of CT head. Indicator Yes No
2006/2007, n = 6 6 0
2005/2006, n = 6 6 0
2004/2005, n = 5 5 0
2003/2004, n = 6 5 1
2002/2003, n = 7 6 1
83.3100.0
0.0
10085.7100
0.0
14.3 16.7
0.0
2002/2003 2003/2004 2004/2005 2005/2006 2006/2007
%Yes %No
13. Patient stay in ED less than 4 hours.
Did the patient have an ACH ED length of stay < 4 hours at the ACH trauma centre? Exclusions: Direct Admissions and unknown ED LOS. Inclusions: n=all patients seen in ACH ED with a known ED LOS.
Indicator Yes No
2006/2007, n = 66 44 22
2005/2006, n = 70 44 26
2004/2005, n = 77 47 30
2003/2004, n = 78 44 34
2002/2003, n = 76 46 30
56.4 62.1 66.7
37.9 33.3
60.5 61.1
39.5 43.6 38.9
2002/2003 2003/2004 2004/2005 2005/2006 2006/2007
%Yes %No
There is a slow improvement in ED length of stay (LOS). On-going assessment will continue.
- 86 -
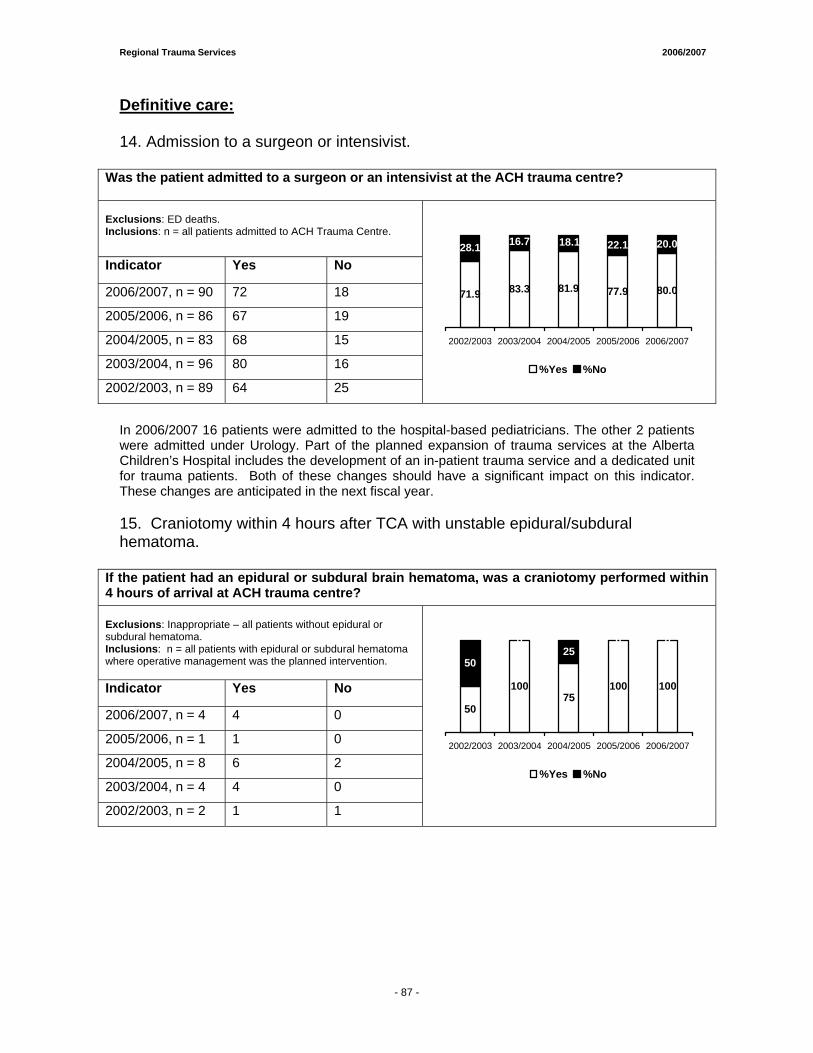
Regional Trauma Services 2006/2007
Definitive care: 14. Admission to a surgeon or intensivist.
Was the patient admitted to a surgeon or an intensivist at the ACH trauma centre? Exclusions: ED deaths. Inclusions: n = all patients admitted to ACH Trauma Centre.
Indicator Yes No
2006/2007, n = 90 72 18
2005/2006, n = 86 67 19
2004/2005, n = 83 68 15
2003/2004, n = 96 80 16
2002/2003, n = 89 64 25
83.3 77.9 80.0
22.1 20.0
71.9 81.9
28.1 16.7 18.1
2002/2003 2003/2004 2004/2005 2005/2006 2006/2007
%Yes %No
In 2006/2007 16 patients were admitted to the hospital-based pediatricians. The other 2 patients were admitted under Urology. Part of the planned expansion of trauma services at the Alberta Children’s Hospital includes the development of an in-patient trauma service and a dedicated unit for trauma patients. Both of these changes should have a significant impact on this indicator. These changes are anticipated in the next fiscal year. 15. Craniotomy within 4 hours after TCA with unstable epidural/subdural hematoma.
If the patient had an epidural or subdural brain hematoma, was a craniotomy performed within 4 hours of arrival at ACH trauma centre? Exclusions: Inappropriate – all patients without epidural or subdural hematoma. Inclusions: n = all patients with epidural or subdural hematoma where operative management was the planned intervention.
Indicator Yes No
2006/2007, n = 4 4 0
2005/2006, n = 1 1 0
2004/2005, n = 8 6 2
2003/2004, n = 4 4 0
2002/2003, n = 2 1 1
50
10075
100 100
0 0
50
025
2002/2003 2003/2004 2004/2005 2005/2006 2006/2007
%Yes %No
- 87 -
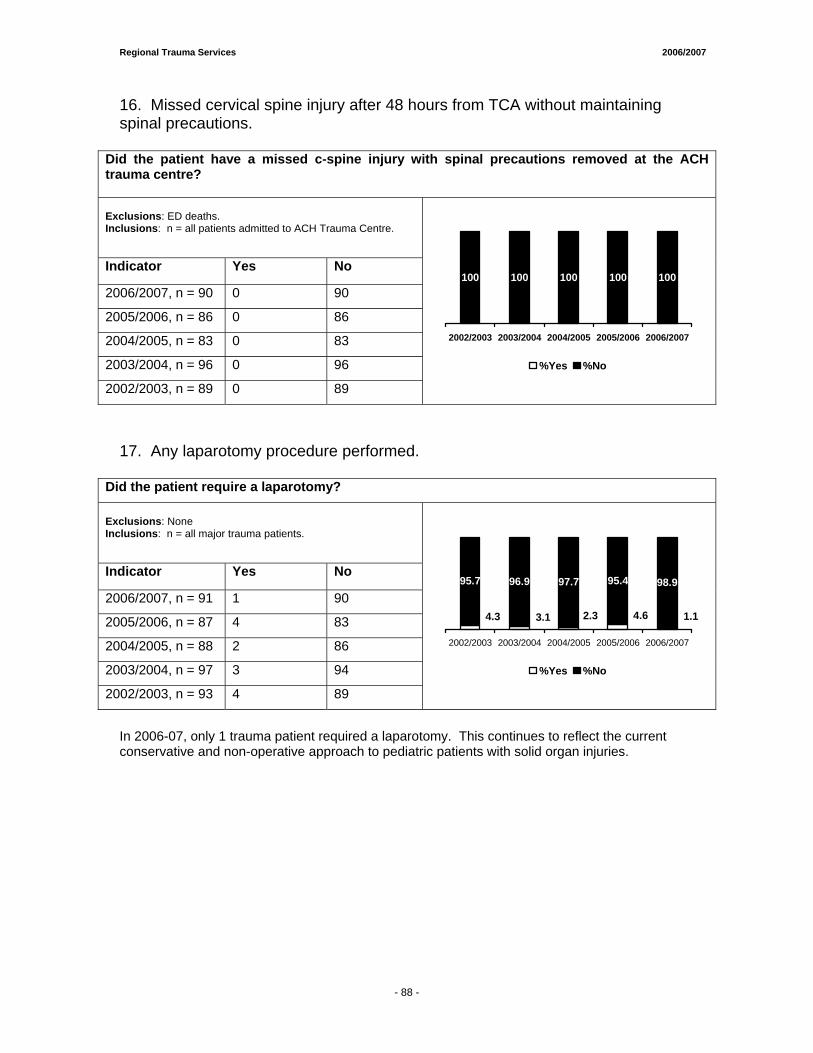
Regional Trauma Services 2006/2007
16. Missed cervical spine injury after 48 hours from TCA without maintaining spinal precautions.
Did the patient have a missed c-spine injury with spinal precautions removed at the ACH trauma centre? Exclusions: ED deaths. Inclusions: n = all patients admitted to ACH Trauma Centre.
Indicator Yes No
2006/2007, n = 90 0 90
2005/2006, n = 86 0 86
2004/2005, n = 83 0 83
2003/2004, n = 96 0 96
2002/2003, n = 89 0 89
100 100100 100 100
2002/2003 2003/2004 2004/2005 2005/2006 2006/2007
%Yes %No
17. Any laparotomy procedure performed.
Did the patient require a laparotomy? Exclusions: None Inclusions: n = all major trauma patients.
Indicator Yes No
2006/2007, n = 91 1 90
2005/2006, n = 87 4 83
2004/2005, n = 88 2 86
2003/2004, n = 97 3 94
2002/2003, n = 93 4 89
95.4 98.9
1.14.62.33.14.3
95.7 96.9 97.7
2002/2003 2003/2004 2004/2005 2005/2006 2006/2007
%Yes %No
In 2006-07, only 1 trauma patient required a laparotomy. This continues to reflect the current conservative and non-operative approach to pediatric patients with solid organ injuries.
- 88 -
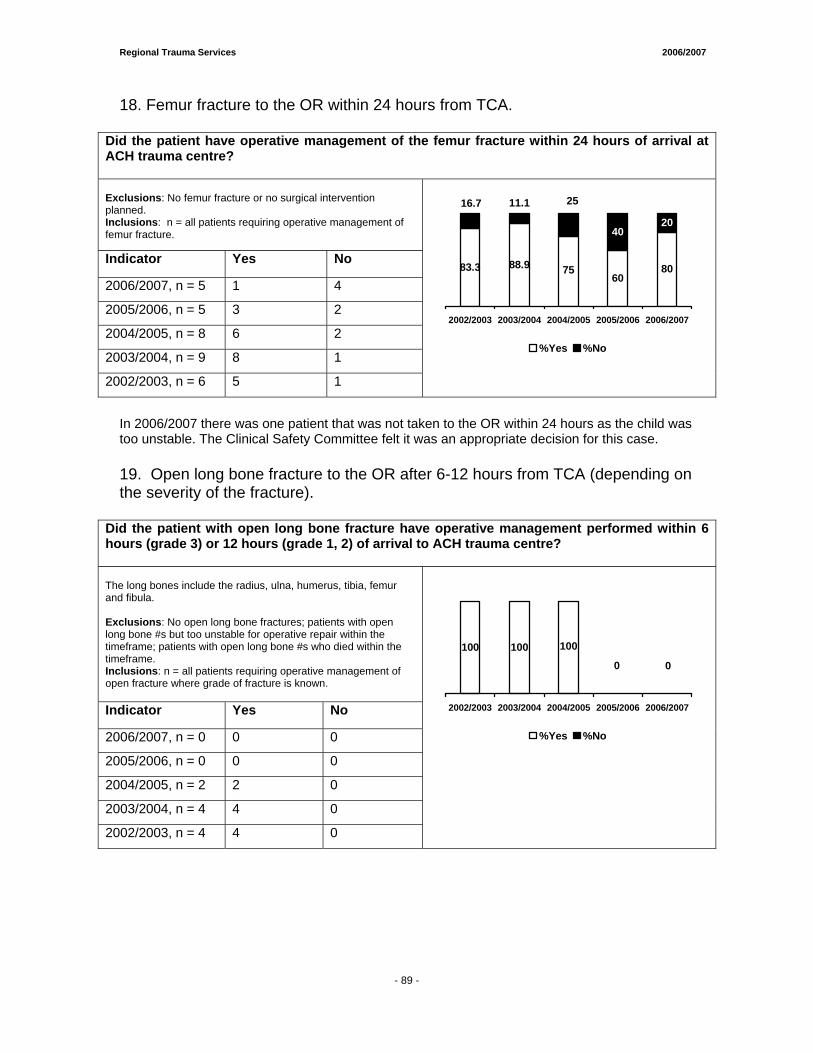
Regional Trauma Services 2006/2007
18. Femur fracture to the OR within 24 hours from TCA.
Did the patient have operative management of the femur fracture within 24 hours of arrival at ACH trauma centre? Exclusions: No femur fracture or no surgical intervention planned. Inclusions: n = all patients requiring operative management of femur fracture.
Indicator Yes No
2006/2007, n = 5 1 4
2005/2006, n = 5 3 2
2004/2005, n = 8 6 2
2003/2004, n = 9 8 1
2002/2003, n = 6 5 1
6080
4020
88.983.3 75
16.7 11.1 25
2002/2003 2003/2004 2004/2005 2005/2006 2006/2007
%Yes %No
In 2006/2007 there was one patient that was not taken to the OR within 24 hours as the child was too unstable. The Clinical Safety Committee felt it was an appropriate decision for this case. 19. Open long bone fracture to the OR after 6-12 hours from TCA (depending on the severity of the fracture).
Did the patient with open long bone fracture have operative management performed within 6 hours (grade 3) or 12 hours (grade 1, 2) of arrival to ACH trauma centre? The long bones include the radius, ulna, humerus, tibia, femur and fibula. Exclusions: No open long bone fractures; patients with open long bone #s but too unstable for operative repair within the timeframe; patients with open long bone #s who died within the timeframe. Inclusions: n = all patients requiring operative management of open fracture where grade of fracture is known. Indicator Yes No
2006/2007, n = 0 0 0
2005/2006, n = 0 0 0
2004/2005, n = 2 2 0
2003/2004, n = 4 4 0
2002/2003, n = 4 4 0
10000
100 100
2002/2003 2003/2004 2004/2005 2005/2006 2006/2007
%Yes %No
- 89 -
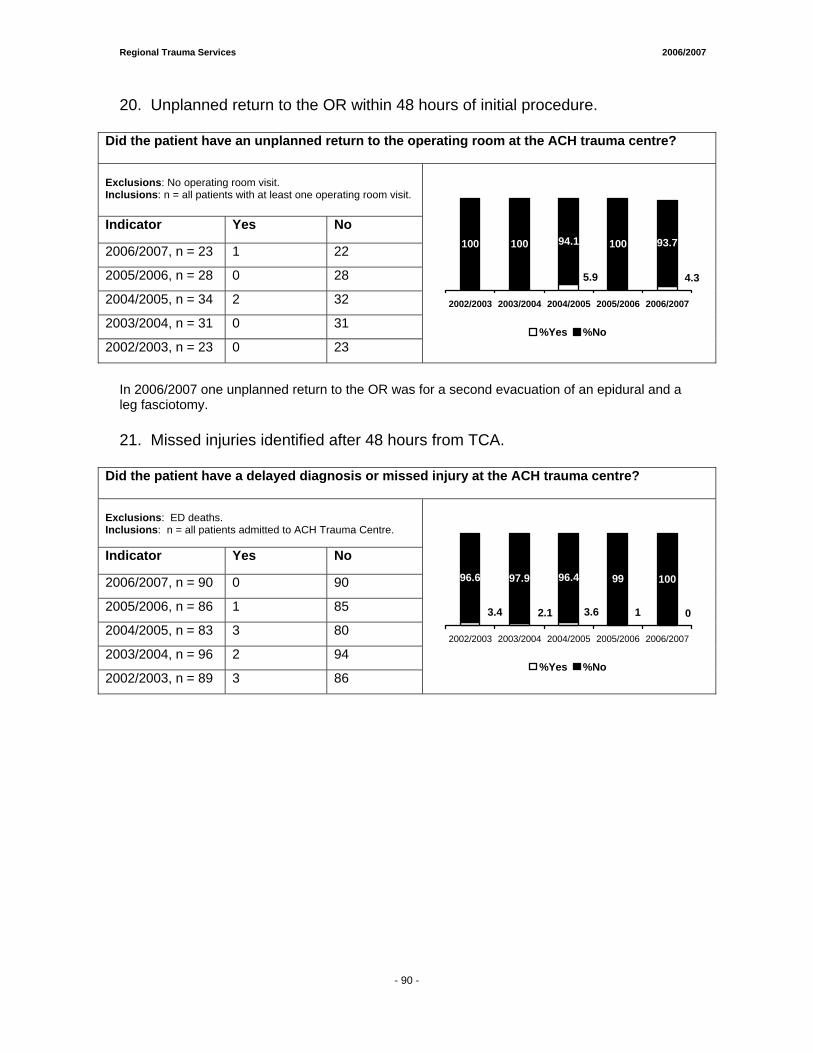
Regional Trauma Services 2006/2007
20. Unplanned return to the OR within 48 hours of initial procedure.
Did the patient have an unplanned return to the operating room at the ACH trauma centre? Exclusions: No operating room visit. Inclusions: n = all patients with at least one operating room visit.
Indicator Yes No
2006/2007, n = 23 1 22
2005/2006, n = 28 0 28
2004/2005, n = 34 2 32
2003/2004, n = 31 0 31
2002/2003, n = 23 0 23
100 93.7
4.35.9
100 100 94.1
2002/2003 2003/2004 2004/2005 2005/2006 2006/2007
%Yes %No
In 2006/2007 one unplanned return to the OR was for a second evacuation of an epidural and a leg fasciotomy. 21. Missed injuries identified after 48 hours from TCA.
Did the patient have a delayed diagnosis or missed injury at the ACH trauma centre? Exclusions: ED deaths. Inclusions: n = all patients admitted to ACH Trauma Centre.
Indicator Yes No
2006/2007, n = 90 0 90
2005/2006, n = 86 1 85
2004/2005, n = 83 3 80
2003/2004, n = 96 2 94
2002/2003, n = 89 3 86
99 100
012.13.4 3.6
96.6 97.9 96.4
2002/2003 2003/2004 2004/2005 2005/2006 2006/2007
%Yes %No
- 90 -
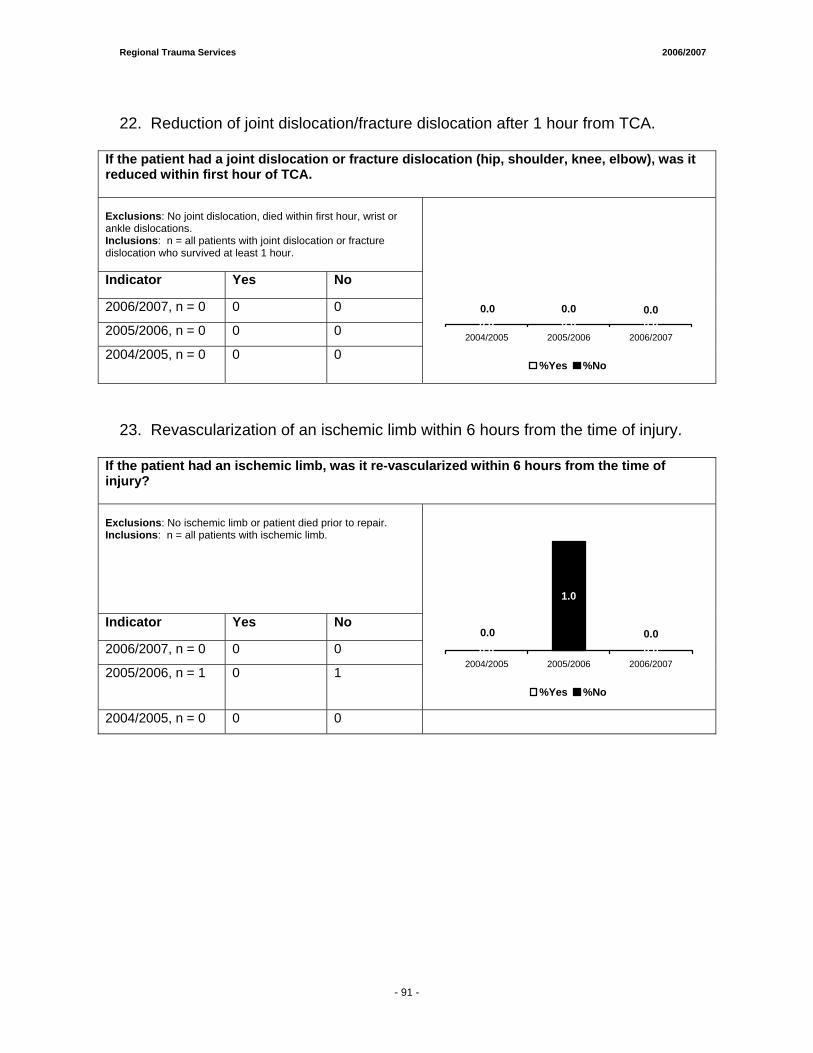
Regional Trauma Services 2006/2007
22. Reduction of joint dislocation/fracture dislocation after 1 hour from TCA.
If the patient had a joint dislocation or fracture dislocation (hip, shoulder, knee, elbow), was it reduced within first hour of TCA. Exclusions: No joint dislocation, died within first hour, wrist or ankle dislocations. Inclusions: n = all patients with joint dislocation or fracture dislocation who survived at least 1 hour. Indicator Yes No
2006/2007, n = 0 0 0
2005/2006, n = 0 0 0
2004/2005, n = 0 0 0
0.00.00.00.0 0.0 0.0
2004/2005 2005/2006 2006/2007
%Yes %No
23. Revascularization of an ischemic limb within 6 hours from the time of injury.
If the patient had an ischemic limb, was it re-vascularized within 6 hours from the time of injury? Exclusions: No ischemic limb or patient died prior to repair. Inclusions: n = all patients with ischemic limb.
Indicator Yes No
2006/2007, n = 0 0 0
2005/2006, n = 1 0 1
0.00.00.00.0
1.0
0.02004/2005 2005/2006 2006/2007
%Yes %No
2004/2005, n = 0 0 0
- 91 -
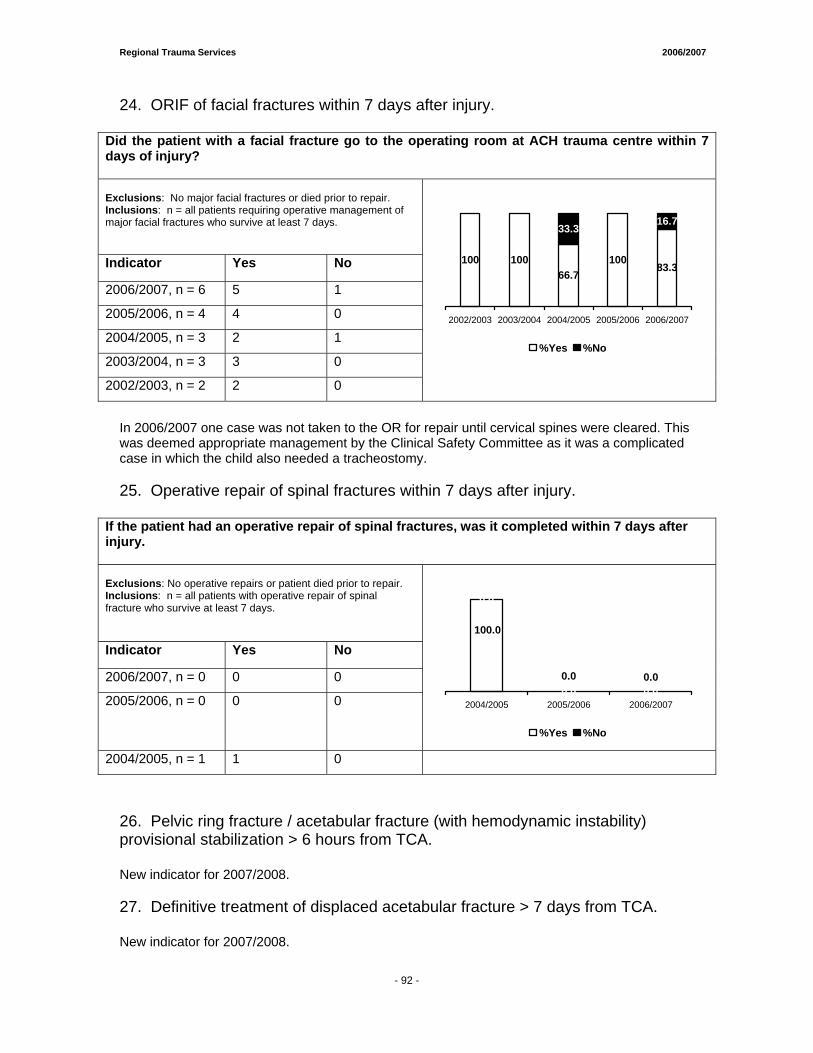
Regional Trauma Services 2006/2007
24. ORIF of facial fractures within 7 days after injury.
Did the patient with a facial fracture go to the operating room at ACH trauma centre within 7 days of injury? Exclusions: No major facial fractures or died prior to repair. Inclusions: n = all patients requiring operative management of major facial fractures who survive at least 7 days.
Indicator Yes No
2006/2007, n = 6 5 1
2005/2006, n = 4 4 0
2004/2005, n = 3 2 1
2003/2004, n = 3 3 0
2002/2003, n = 2 2 0
100 10066.7
10083.3
16.733.3
2002/2003 2003/2004 2004/2005 2005/2006 2006/2007
%Yes %No
In 2006/2007 one case was not taken to the OR for repair until cervical spines were cleared. This was deemed appropriate management by the Clinical Safety Committee as it was a complicated case in which the child also needed a tracheostomy. 25. Operative repair of spinal fractures within 7 days after injury.
If the patient had an operative repair of spinal fractures, was it completed within 7 days after injury. Exclusions: No operative repairs or patient died prior to repair. Inclusions: n = all patients with operative repair of spinal fracture who survive at least 7 days.
Indicator Yes No
2006/2007, n = 0 0 0
2005/2006, n = 0 0 0
0.00.0
100.0
0.0
0.0 0.02004/2005 2005/2006 2006/2007
%Yes %No
2004/2005, n = 1 1 0 26. Pelvic ring fracture / acetabular fracture (with hemodynamic instability) provisional stabilization > 6 hours from TCA. New indicator for 2007/2008. 27. Definitive treatment of displaced acetabular fracture > 7 days from TCA. New indicator for 2007/2008.
- 92 -
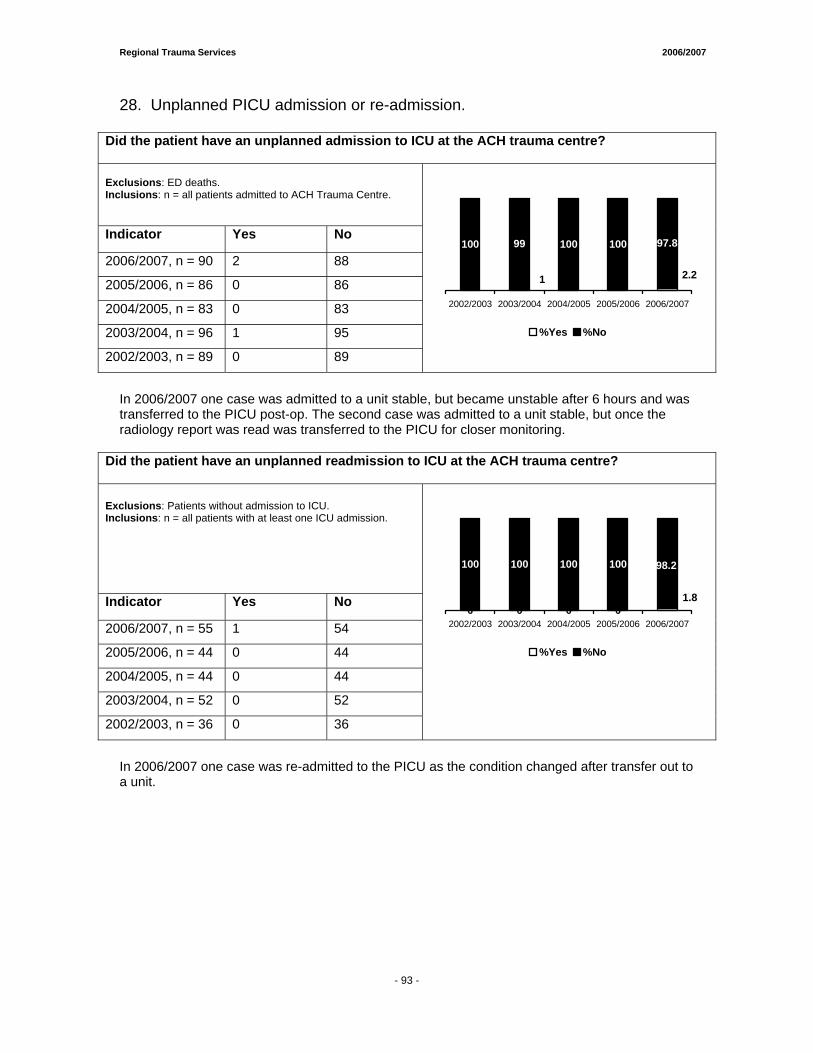
Regional Trauma Services 2006/2007
28. Unplanned PICU admission or re-admission.
Did the patient have an unplanned admission to ICU at the ACH trauma centre? Exclusions: ED deaths. Inclusions: n = all patients admitted to ACH Trauma Centre.
Indicator Yes No
2006/2007, n = 90 2 88
2005/2006, n = 86 0 86
2004/2005, n = 83 0 83
2003/2004, n = 96 1 95
2002/2003, n = 89 0 89
100 97.8
2.21
100 99 100
2002/2003 2003/2004 2004/2005 2005/2006 2006/2007
%Yes %No
In 2006/2007 one case was admitted to a unit stable, but became unstable after 6 hours and was transferred to the PICU post-op. The second case was admitted to a unit stable, but once the radiology report was read was transferred to the PICU for closer monitoring.
Did the patient have an unplanned readmission to ICU at the ACH trauma centre? Exclusions: Patients without admission to ICU. Inclusions: n = all patients with at least one ICU admission.
Indicator Yes No
2006/2007, n = 55 1 54
2005/2006, n = 44 0 44
2004/2005, n = 44 0 44
2003/2004, n = 52 0 52
2002/2003, n = 36 0 36
0 0 0 0
100
1.8
98.2100 100 100
2002/2003 2003/2004 2004/2005 2005/2006 2006/2007
%Yes %No
In 2006/2007 one case was re-admitted to the PICU as the condition changed after transfer out to a unit.
- 93 -
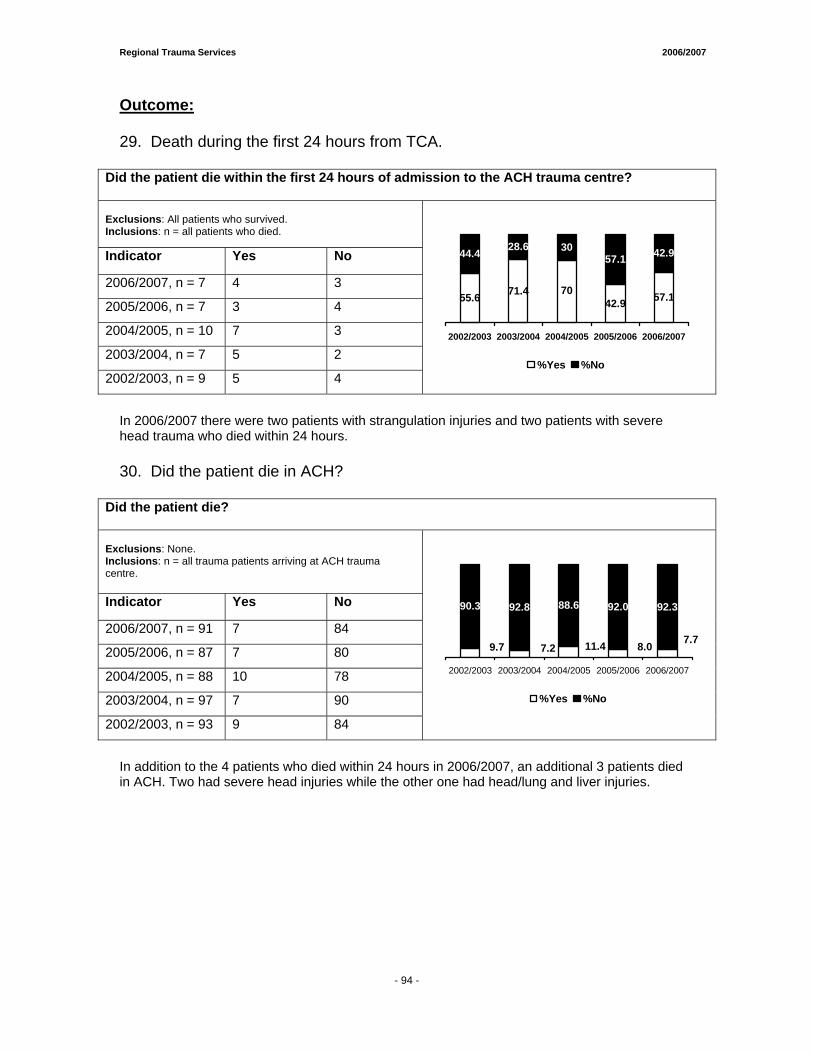
Regional Trauma Services 2006/2007
Outcome: 29. Death during the first 24 hours from TCA.
Did the patient die within the first 24 hours of admission to the ACH trauma centre? Exclusions: All patients who survived. Inclusions: n = all patients who died.
Indicator Yes No
2006/2007, n = 7 4 3
2005/2006, n = 7 3 4
2004/2005, n = 10 7 3
2003/2004, n = 7 5 2
2002/2003, n = 9 5 4
71.442.9 57.1
57.1 42.9
55.6 70
44.4 28.6 30
2002/2003 2003/2004 2004/2005 2005/2006 2006/2007
%Yes %No
In 2006/2007 there were two patients with strangulation injuries and two patients with severe head trauma who died within 24 hours. 30. Did the patient die in ACH?
Did the patient die? Exclusions: None. Inclusions: n = all trauma patients arriving at ACH trauma centre.
Indicator Yes No
2006/2007, n = 91 7 84
2005/2006, n = 87 7 80
2004/2005, n = 88 10 78
2003/2004, n = 97 7 90
2002/2003, n = 93 9 84
92.0 92.3
7.78.07.29.7 11.4
90.3 92.8 88.6
2002/2003 2003/2004 2004/2005 2005/2006 2006/2007
%Yes %No
In addition to the 4 patients who died within 24 hours in 2006/2007, an additional 3 patients died in ACH. Two had severe head injuries while the other one had head/lung and liver injuries.
- 94 -

Regional Trauma Services 2006/2007
APPENDIX B Major Trauma Statistics for 2006/2007
1. General Overview Age Gender
2. Etiology of Injuries Mechanism of Injury Type of Injury Place of Injury
3. Referrals Referrals from Health Regions Mode of Transportation to ACH Ground vs Air Transport ED Arrival By Month, Day and Time of Arrival Disposition from the Emergency Department
4. Patient Care Management Diagnostic Imaging Statistics Day of Week and Time of CT Non-Operative Procedures Performed in ED Surgical Procedures OR Data by Service Time to OR Length of Stay Admitting Physician Service Hospital Discharge Destination Outcomes by Age and ISS TRISS Pre-Charts
- 95 -
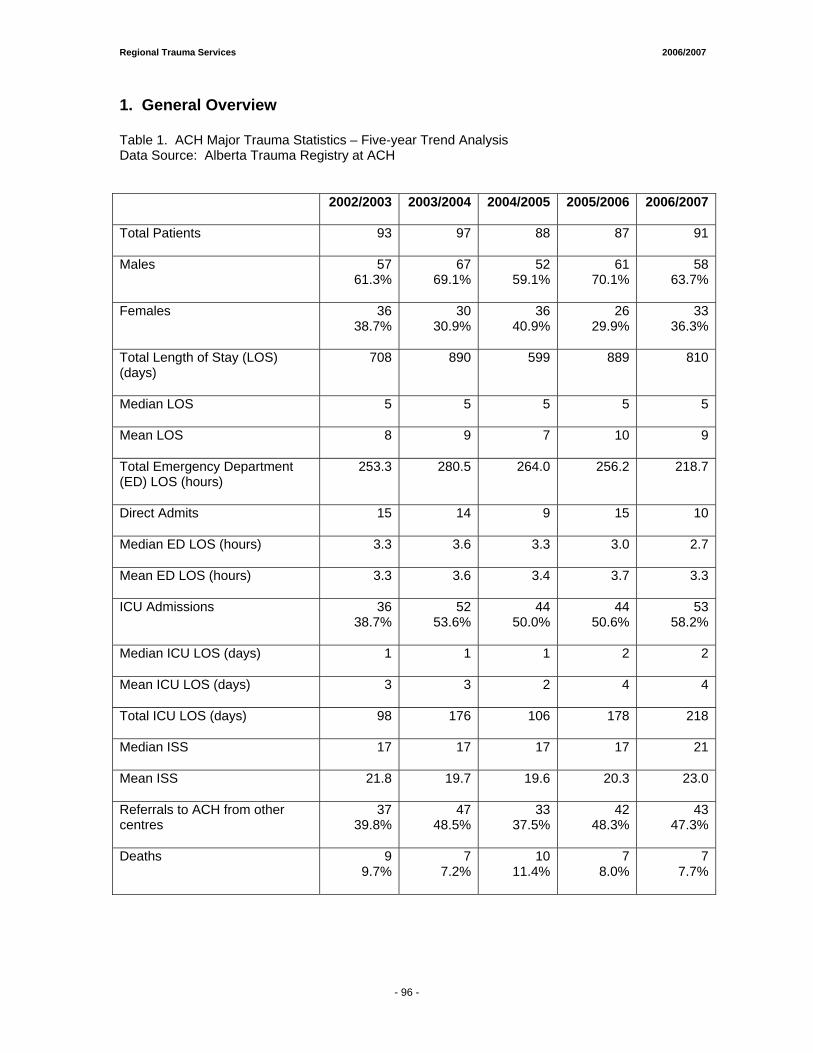
Regional Trauma Services 2006/2007
1. General Overview Table 1. ACH Major Trauma Statistics – Five-year Trend Analysis Data Source: Alberta Trauma Registry at ACH
2002/2003 2003/2004 2004/2005 2005/2006 2006/2007
Total Patients
93 97 88 87 91
Males
5761.3%
6769.1%
5259.1%
61 70.1%
5863.7%
Females
3638.7%
3030.9%
3640.9%
26 29.9%
3336.3%
Total Length of Stay (LOS) (days)
708 890 599 889 810
Median LOS
5 5 5 5 5
Mean LOS
8 9 7 10 9
Total Emergency Department (ED) LOS (hours)
253.3 280.5 264.0 256.2 218.7
Direct Admits
15 14 9 15 10
Median ED LOS (hours)
3.3 3.6 3.3 3.0 2.7
Mean ED LOS (hours)
3.3 3.6 3.4 3.7 3.3
ICU Admissions
3638.7%
5253.6%
4450.0%
44 50.6%
5358.2%
Median ICU LOS (days)
1
1 1 2 2
Mean ICU LOS (days)
3 3 2 4 4
Total ICU LOS (days)
98 176 106 178 218
Median ISS
17 17 17 17 21
Mean ISS
21.8 19.7 19.6 20.3 23.0
Referrals to ACH from other centres
3739.8%
4748.5%
3337.5%
42 48.3%
4347.3%
Deaths
99.7%
77.2%
1011.4%
7 8.0%
77.7%
- 96 -
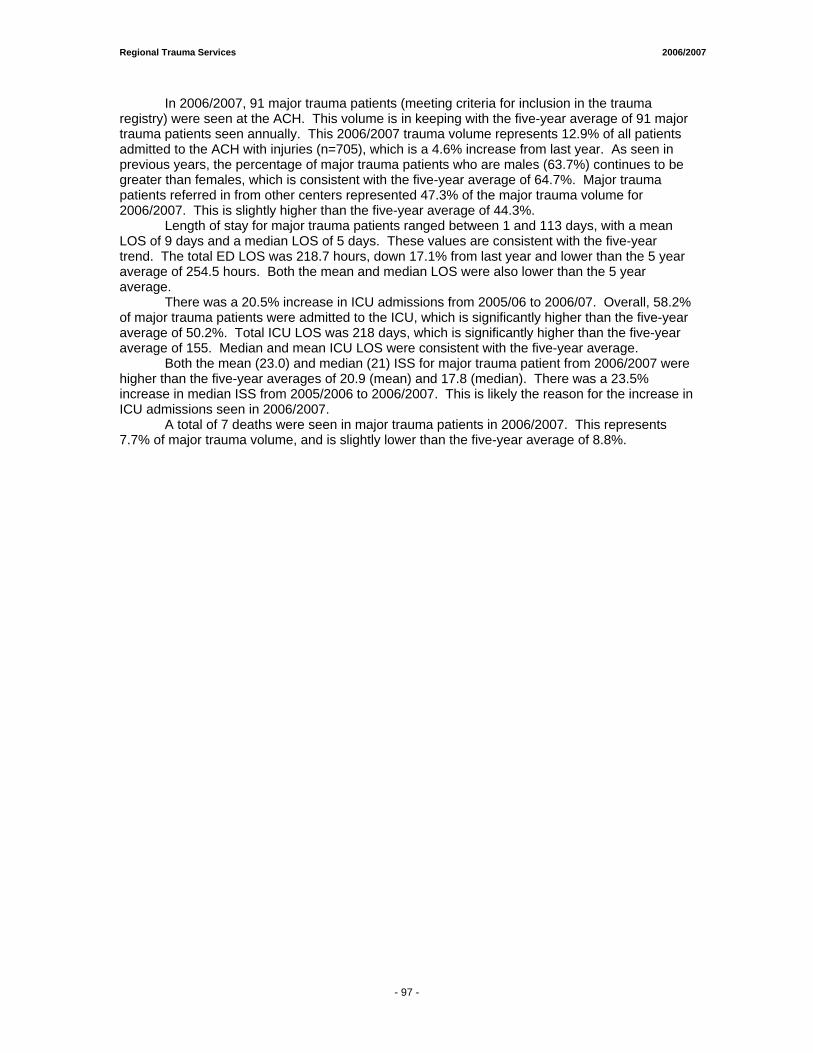
Regional Trauma Services 2006/2007
In 2006/2007, 91 major trauma patients (meeting criteria for inclusion in the trauma registry) were seen at the ACH. This volume is in keeping with the five-year average of 91 major trauma patients seen annually. This 2006/2007 trauma volume represents 12.9% of all patients admitted to the ACH with injuries (n=705), which is a 4.6% increase from last year. As seen in previous years, the percentage of major trauma patients who are males (63.7%) continues to be greater than females, which is consistent with the five-year average of 64.7%. Major trauma patients referred in from other centers represented 47.3% of the major trauma volume for 2006/2007. This is slightly higher than the five-year average of 44.3%.
Length of stay for major trauma patients ranged between 1 and 113 days, with a mean LOS of 9 days and a median LOS of 5 days. These values are consistent with the five-year trend. The total ED LOS was 218.7 hours, down 17.1% from last year and lower than the 5 year average of 254.5 hours. Both the mean and median LOS were also lower than the 5 year average.
There was a 20.5% increase in ICU admissions from 2005/06 to 2006/07. Overall, 58.2% of major trauma patients were admitted to the ICU, which is significantly higher than the five-year average of 50.2%. Total ICU LOS was 218 days, which is significantly higher than the five-year average of 155. Median and mean ICU LOS were consistent with the five-year average.
Both the mean (23.0) and median (21) ISS for major trauma patient from 2006/2007 were higher than the five-year averages of 20.9 (mean) and 17.8 (median). There was a 23.5% increase in median ISS from 2005/2006 to 2006/2007. This is likely the reason for the increase in ICU admissions seen in 2006/2007.
A total of 7 deaths were seen in major trauma patients in 2006/2007. This represents 7.7% of major trauma volume, and is slightly lower than the five-year average of 8.8%.
- 97 -
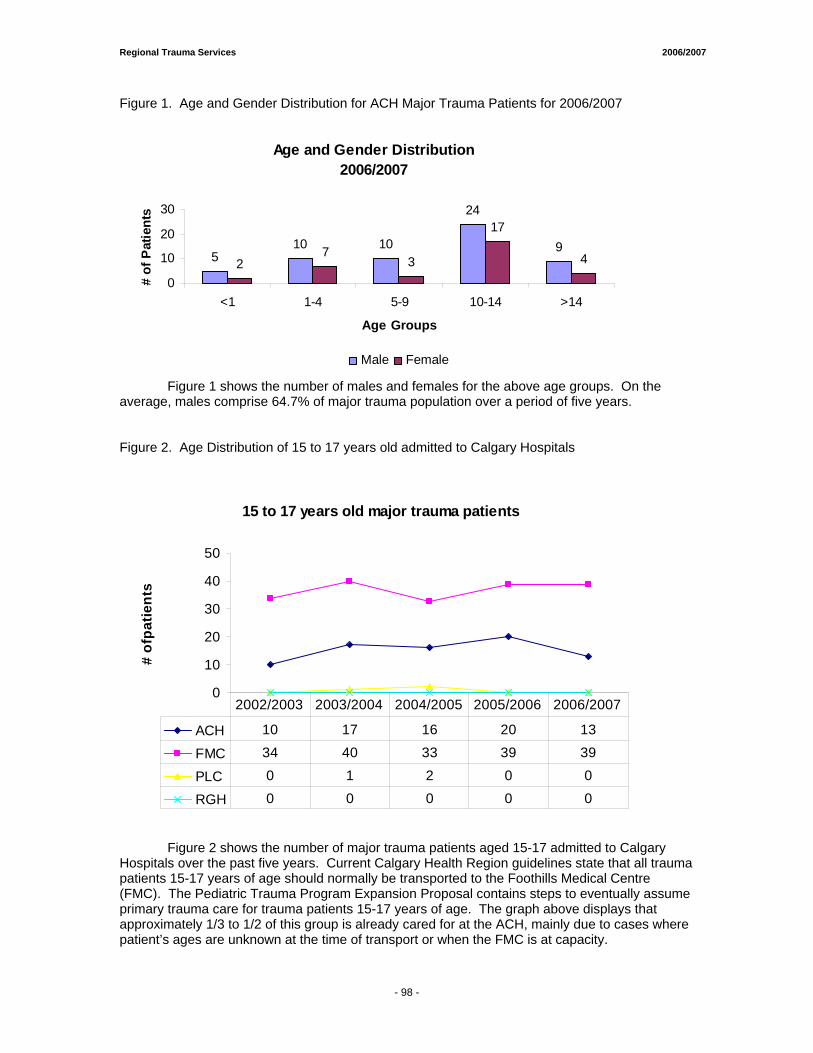
Regional Trauma Services 2006/2007
Figure 1. Age and Gender Distribution for ACH Major Trauma Patients for 2006/2007
Age and Gender Distribution2006/2007
510 10
24
92
73
17
4
0
10
20
30
<1 1-4 5-9 10-14 >14
Age Groups
# of
Pat
ient
s
Male Female
Figure 1 shows the number of males and females for the above age groups. On the average, males comprise 64.7% of major trauma population over a period of five years. Figure 2. Age Distribution of 15 to 17 years old admitted to Calgary Hospitals
15 to 17 years old major trauma patients
0
10
20
30
40
50
# of
patie
nts
ACH 10 17 16 20 13
FMC 34 40 33 39 39
PLC 0 1 2 0 0
RGH 0 0 0 0 0
2002/2003 2003/2004 2004/2005 2005/2006 2006/2007
Figure 2 shows the number of major trauma patients aged 15-17 admitted to Calgary Hospitals over the past five years. Current Calgary Health Region guidelines state that all trauma patients 15-17 years of age should normally be transported to the Foothills Medical Centre (FMC). The Pediatric Trauma Program Expansion Proposal contains steps to eventually assume primary trauma care for trauma patients 15-17 years of age. The graph above displays that approximately 1/3 to 1/2 of this group is already cared for at the ACH, mainly due to cases where patient’s ages are unknown at the time of transport or when the FMC is at capacity.
- 98 -
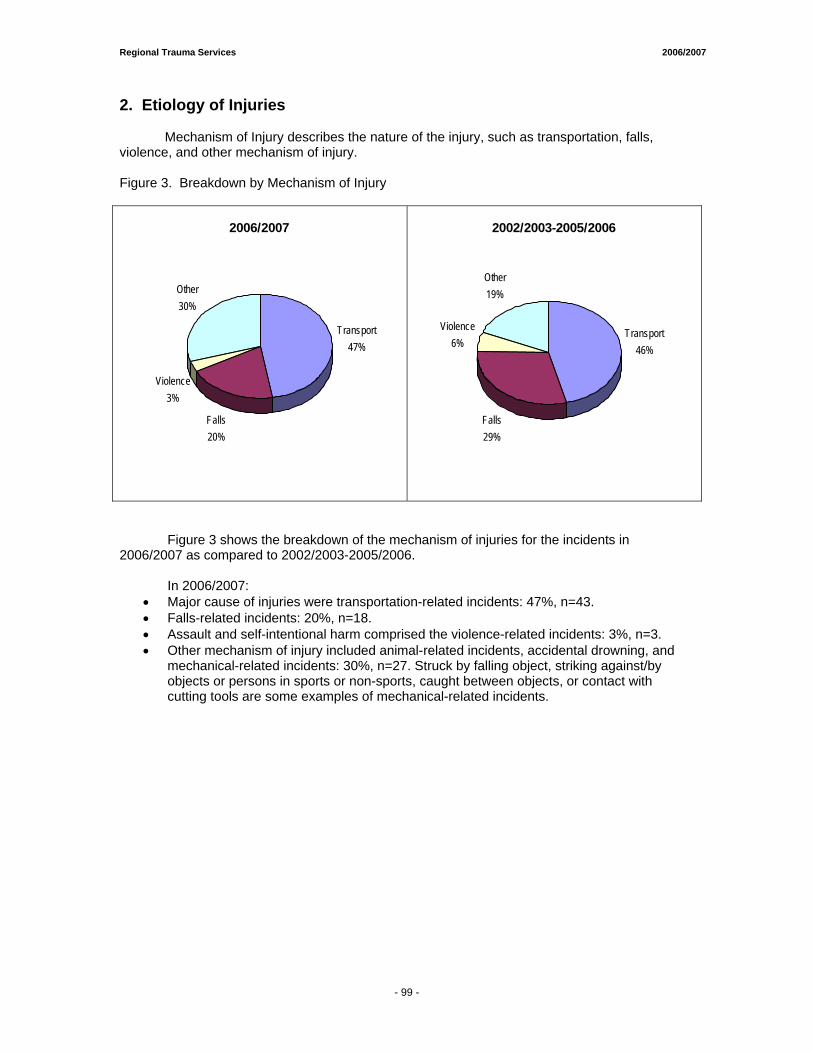
Regional Trauma Services 2006/2007
2. Etiology of Injuries
Mechanism of Injury describes the nature of the injury, such as transportation, falls, violence, and other mechanism of injury. Figure 3. Breakdown by Mechanism of Injury
2006/2007
Falls20%
Violence3%
Other30%
Transport47%
2002/2003-2005/2006
Transport46%
Falls29%
Violence6%
Other19%
Figure 3 shows the breakdown of the mechanism of injuries for the incidents in 2006/2007 as compared to 2002/2003-2005/2006. In 2006/2007:
• Major cause of injuries were transportation-related incidents: 47%, n=43. • Falls-related incidents: 20%, n=18. • Assault and self-intentional harm comprised the violence-related incidents: 3%, n=3. • Other mechanism of injury included animal-related incidents, accidental drowning, and
mechanical-related incidents: 30%, n=27. Struck by falling object, striking against/by objects or persons in sports or non-sports, caught between objects, or contact with cutting tools are some examples of mechanical-related incidents.
- 99 -
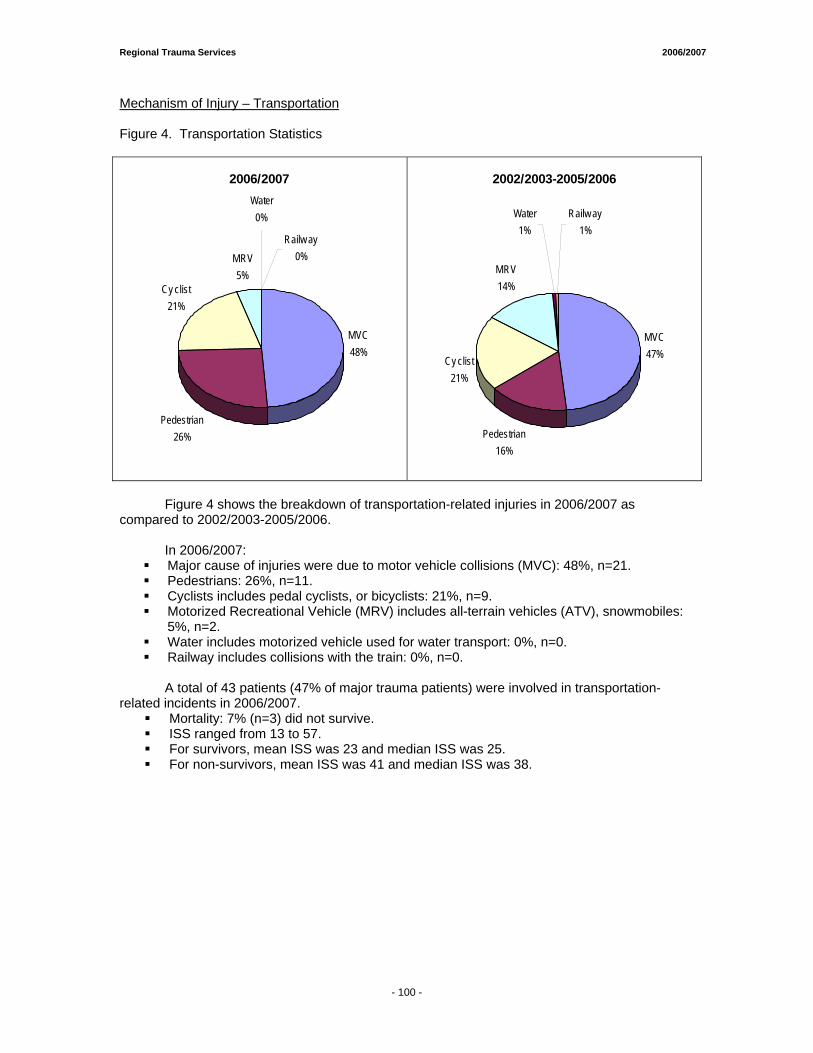
Regional Trauma Services 2006/2007
Mechanism of Injury – Transportation Figure 4. Transportation Statistics
2006/2007
MVC48%
Cy clist21%
MRV5%
Pedestrian26%
Railw ay0%
Water0%
2002/2003-2005/2006
MVC47%Cy clist
21%
MRV14%
Pedestrian16%
Water1%
Railw ay1%
Figure 4 shows the breakdown of transportation-related injuries in 2006/2007 as compared to 2002/2003-2005/2006.
In 2006/2007:
Major cause of injuries were due to motor vehicle collisions (MVC): 48%, n=21. Pedestrians: 26%, n=11. Cyclists includes pedal cyclists, or bicyclists: 21%, n=9. Motorized Recreational Vehicle (MRV) includes all-terrain vehicles (ATV), snowmobiles:
5%, n=2. Water includes motorized vehicle used for water transport: 0%, n=0. Railway includes collisions with the train: 0%, n=0.
A total of 43 patients (47% of major trauma patients) were involved in transportation-
related incidents in 2006/2007. Mortality: 7% (n=3) did not survive. ISS ranged from 13 to 57. For survivors, mean ISS was 23 and median ISS was 25. For non-survivors, mean ISS was 41 and median ISS was 38.
- 100 -
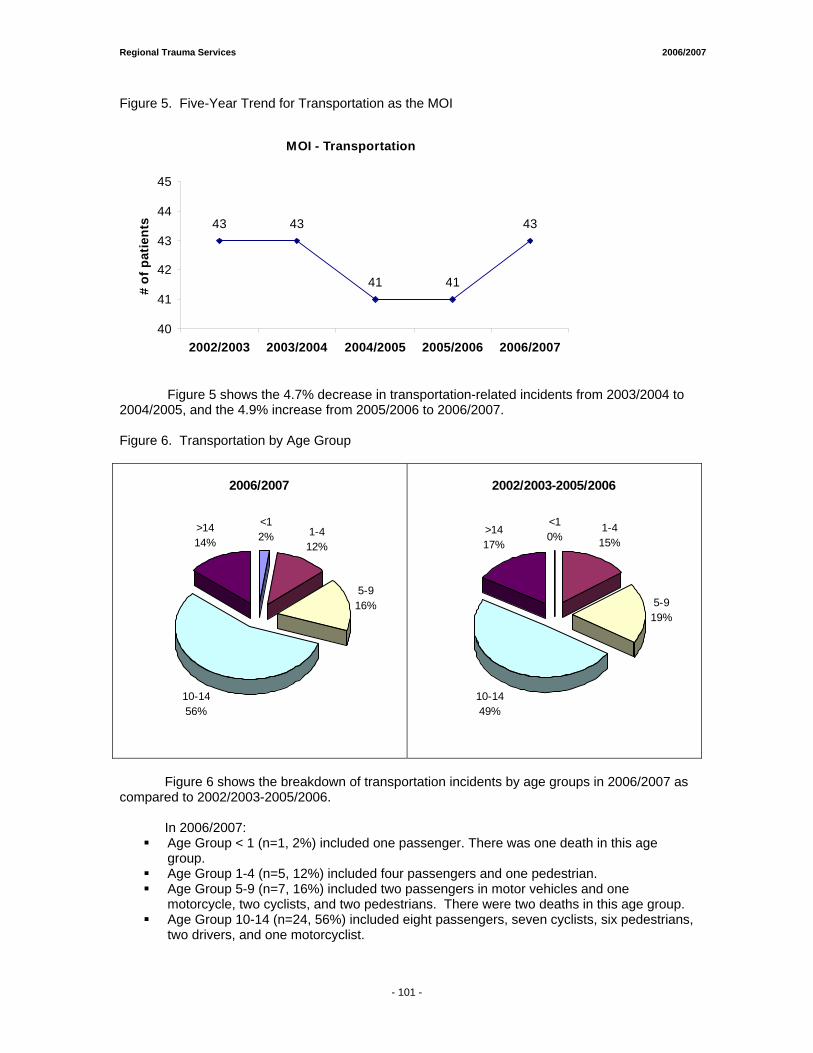
Regional Trauma Services 2006/2007
Figure 5. Five-Year Trend for Transportation as the MOI
MOI - Transportation
43 43
41 41
43
40
41
42
43
44
45
2002/2003 2003/2004 2004/2005 2005/2006 2006/2007
# of
pat
ient
s
Figure 5 shows the 4.7% decrease in transportation-related incidents from 2003/2004 to 2004/2005, and the 4.9% increase from 2005/2006 to 2006/2007. Figure 6. Transportation by Age Group
2006/2007
<12% 1-4
12%
5-916%
10-1456%
>1414%
2002/2003-2005/2006
<10%
1-415%
5-919%
10-1449%
>1417%
Figure 6 shows the breakdown of transportation incidents by age groups in 2006/2007 as compared to 2002/2003-2005/2006.
In 2006/2007:
Age Group < 1 (n=1, 2%) included one passenger. There was one death in this age group.
Age Group 1-4 (n=5, 12%) included four passengers and one pedestrian. Age Group 5-9 (n=7, 16%) included two passengers in motor vehicles and one
motorcycle, two cyclists, and two pedestrians. There were two deaths in this age group. Age Group 10-14 (n=24, 56%) included eight passengers, seven cyclists, six pedestrians,
two drivers, and one motorcyclist.
- 101 -
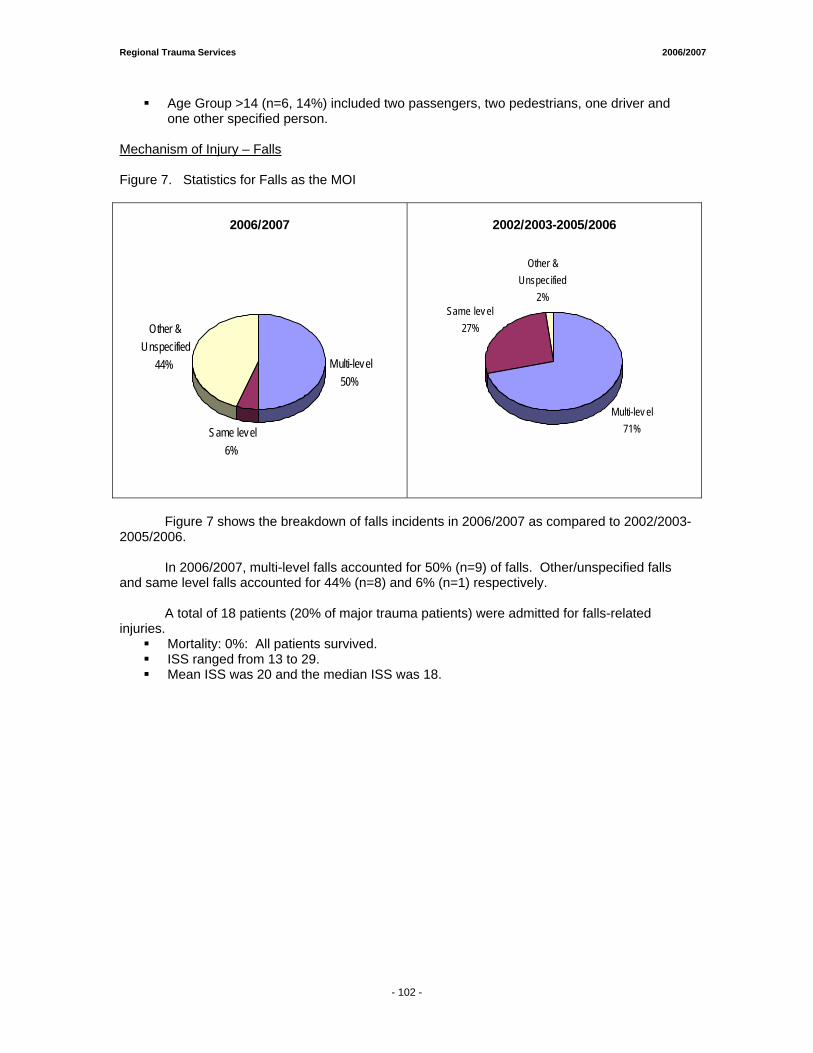
Regional Trauma Services 2006/2007
Age Group >14 (n=6, 14%) included two passengers, two pedestrians, one driver and one other specified person.
Mechanism of Injury – Falls Figure 7. Statistics for Falls as the MOI
2006/2007
Multi-level50%
Same level6%
Other & Unspecified
44%
2002/2003-2005/2006
Multi-lev el 71%
Same lev el27%
Other & Unspecified
2%
Figure 7 shows the breakdown of falls incidents in 2006/2007 as compared to 2002/2003-2005/2006.
In 2006/2007, multi-level falls accounted for 50% (n=9) of falls. Other/unspecified falls
and same level falls accounted for 44% (n=8) and 6% (n=1) respectively. A total of 18 patients (20% of major trauma patients) were admitted for falls-related
injuries. Mortality: 0%: All patients survived. ISS ranged from 13 to 29. Mean ISS was 20 and the median ISS was 18.
- 102 -
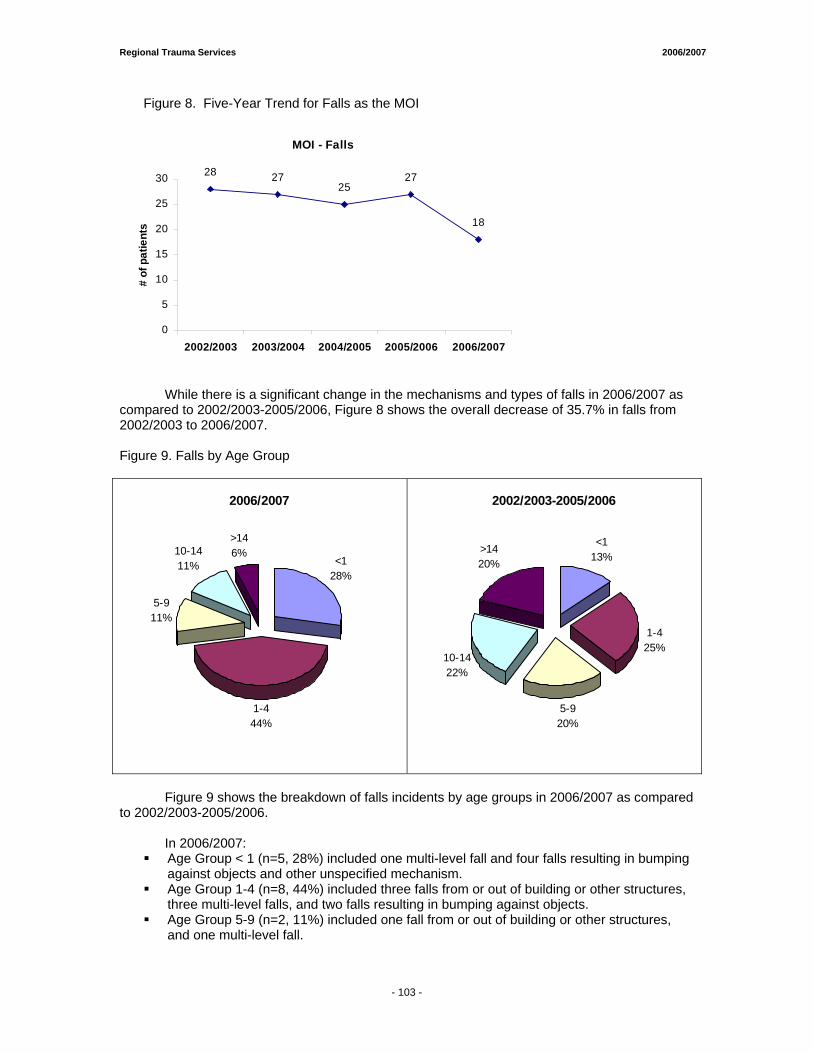
Regional Trauma Services 2006/2007
Figure 8. Five-Year Trend for Falls as the MOI
MOI - Falls
28 2725
27
18
0
5
10
15
20
25
30
2002/2003 2003/2004 2004/2005 2005/2006 2006/2007
# of
pat
ient
s
While there is a significant change in the mechanisms and types of falls in 2006/2007 as compared to 2002/2003-2005/2006, Figure 8 shows the overall decrease of 35.7% in falls from 2002/2003 to 2006/2007. Figure 9. Falls by Age Group
2006/2007
<128%
1-444%
5-911%
10-1411%
>146%
2002/2003-2005/2006
<113%
1-425%
5-920%
10-1422%
>1420%
Figure 9 shows the breakdown of falls incidents by age groups in 2006/2007 as compared to 2002/2003-2005/2006.
In 2006/2007:
Age Group < 1 (n=5, 28%) included one multi-level fall and four falls resulting in bumping against objects and other unspecified mechanism.
Age Group 1-4 (n=8, 44%) included three falls from or out of building or other structures, three multi-level falls, and two falls resulting in bumping against objects.
Age Group 5-9 (n=2, 11%) included one fall from or out of building or other structures, and one multi-level fall.
- 103 -
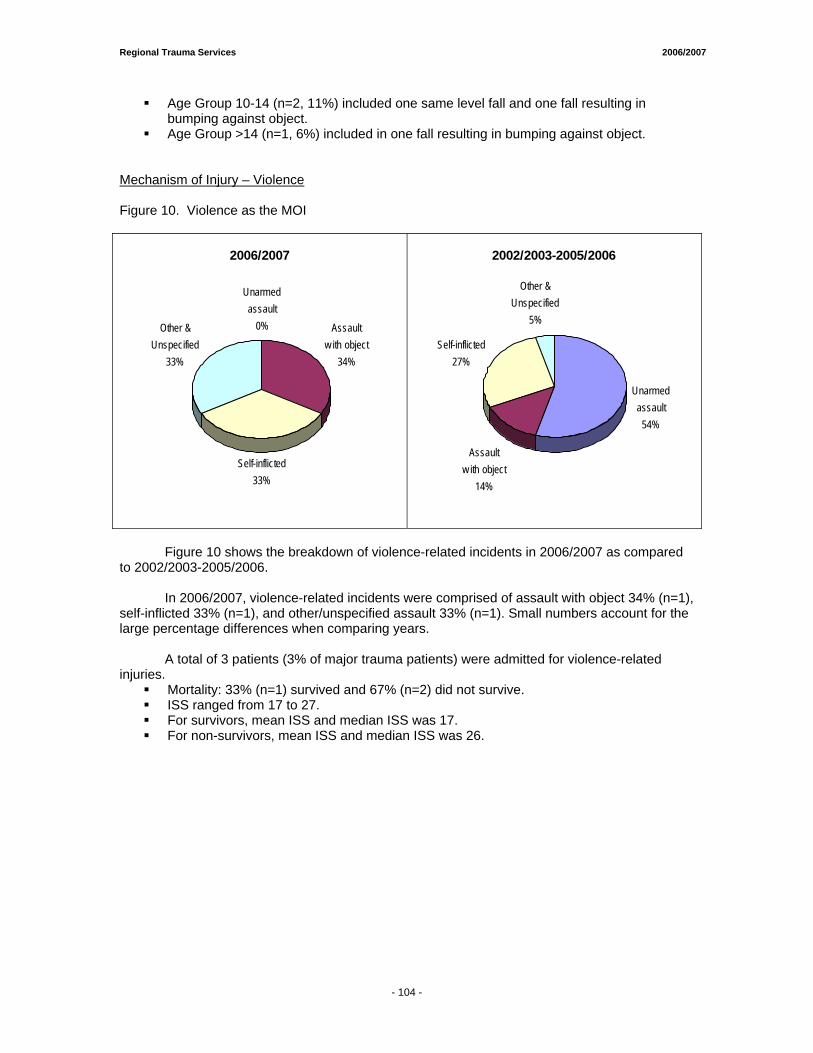
Regional Trauma Services 2006/2007
Age Group 10-14 (n=2, 11%) included one same level fall and one fall resulting in bumping against object.
Age Group >14 (n=1, 6%) included in one fall resulting in bumping against object. Mechanism of Injury – Violence Figure 10. Violence as the MOI
2006/2007
Unarmed assault
0% Assault w ith object
34%
Self-inflicted 33%
Other & Unspecified
33%
2002/2003-2005/2006
Assault w ith object
14%
Self-inflicted 27%
Other & Unspecified
5%
Unarmed assault
54%
Figure 10 shows the breakdown of violence-related incidents in 2006/2007 as compared to 2002/2003-2005/2006.
In 2006/2007, violence-related incidents were comprised of assault with object 34% (n=1),
self-inflicted 33% (n=1), and other/unspecified assault 33% (n=1). Small numbers account for the large percentage differences when comparing years.
A total of 3 patients (3% of major trauma patients) were admitted for violence-related injuries.
Mortality: 33% (n=1) survived and 67% (n=2) did not survive. ISS ranged from 17 to 27. For survivors, mean ISS and median ISS was 17. For non-survivors, mean ISS and median ISS was 26.
- 104 -
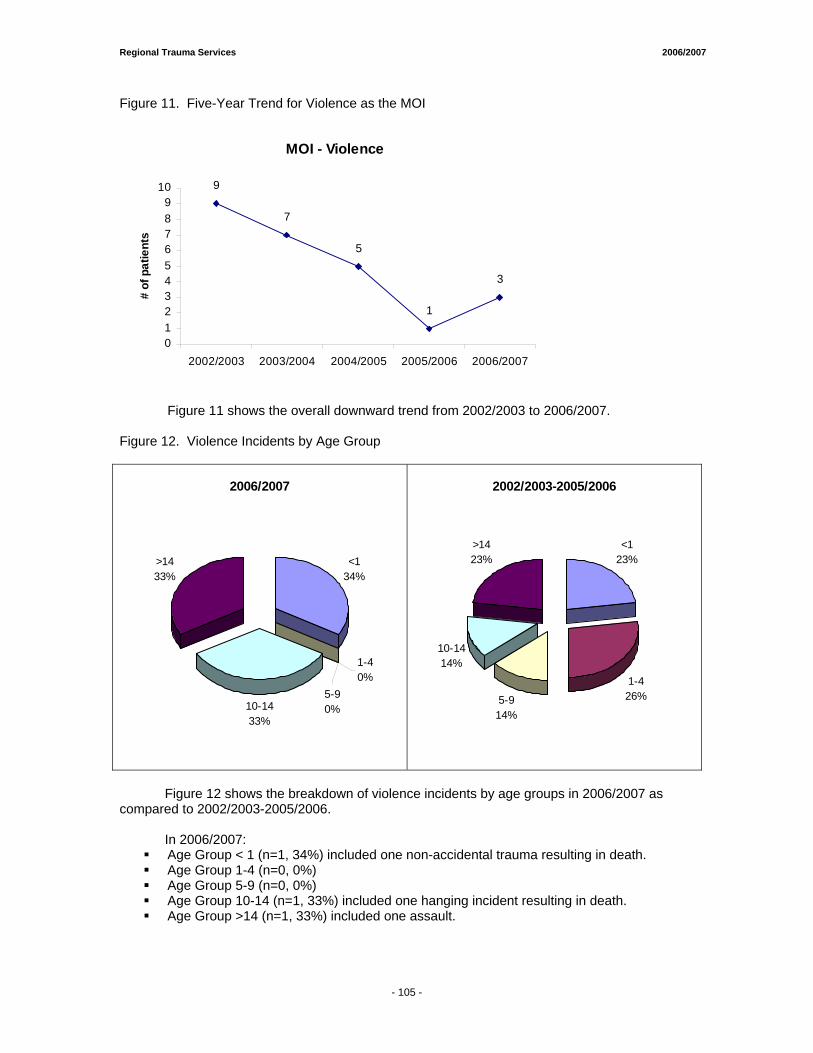
Regional Trauma Services 2006/2007
Figure 11. Five-Year Trend for Violence as the MOI
MOI - Violence
9
7
5
1
3
0123456789
10
2002/2003 2003/2004 2004/2005 2005/2006 2006/2007
# of
pat
ient
s
Figure 11 shows the overall downward trend from 2002/2003 to 2006/2007. Figure 12. Violence Incidents by Age Group
2006/2007
<134%
10-1433%
>1433%
1-40%
5-90%
2002/2003-2005/2006
<123%
1-426%5-9
14%
10-1414%
>1423%
Figure 12 shows the breakdown of violence incidents by age groups in 2006/2007 as compared to 2002/2003-2005/2006.
In 2006/2007:
Age Group < 1 (n=1, 34%) included one non-accidental trauma resulting in death. Age Group 1-4 (n=0, 0%) Age Group 5-9 (n=0, 0%) Age Group 10-14 (n=1, 33%) included one hanging incident resulting in death. Age Group >14 (n=1, 33%) included one assault.
- 105 -
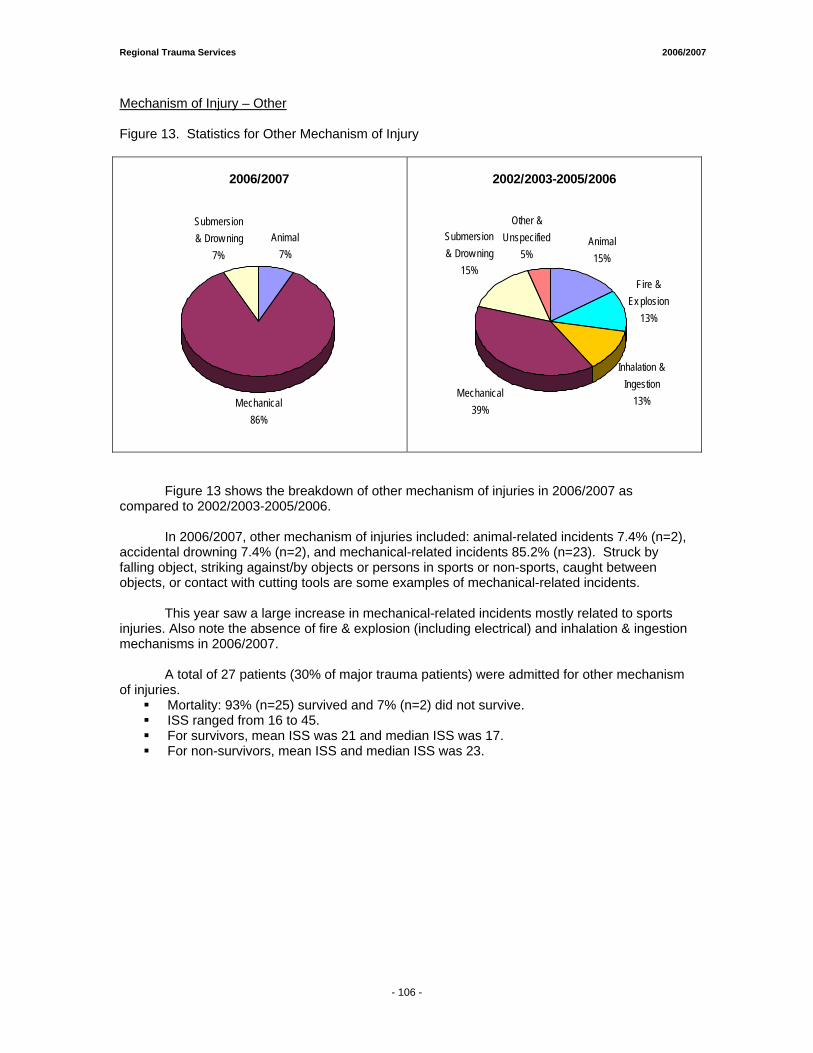
Regional Trauma Services 2006/2007
Mechanism of Injury – Other Figure 13. Statistics for Other Mechanism of Injury
2006/2007
Animal7%
Mechanical86%
Submersion & Drow ning
7%
2002/2003-2005/2006
Animal15%
Fire & Ex plosion
13%
Inhalation & Ingestion
13%Mechanical
39%
Submersion & Drow ning
15%
Other & Unspecified
5%
Figure 13 shows the breakdown of other mechanism of injuries in 2006/2007 as compared to 2002/2003-2005/2006.
In 2006/2007, other mechanism of injuries included: animal-related incidents 7.4% (n=2),
accidental drowning 7.4% (n=2), and mechanical-related incidents 85.2% (n=23). Struck by falling object, striking against/by objects or persons in sports or non-sports, caught between objects, or contact with cutting tools are some examples of mechanical-related incidents.
This year saw a large increase in mechanical-related incidents mostly related to sports
injuries. Also note the absence of fire & explosion (including electrical) and inhalation & ingestion mechanisms in 2006/2007.
A total of 27 patients (30% of major trauma patients) were admitted for other mechanism
of injuries. Mortality: 93% (n=25) survived and 7% (n=2) did not survive. ISS ranged from 16 to 45. For survivors, mean ISS was 21 and median ISS was 17. For non-survivors, mean ISS and median ISS was 23.
- 106 -
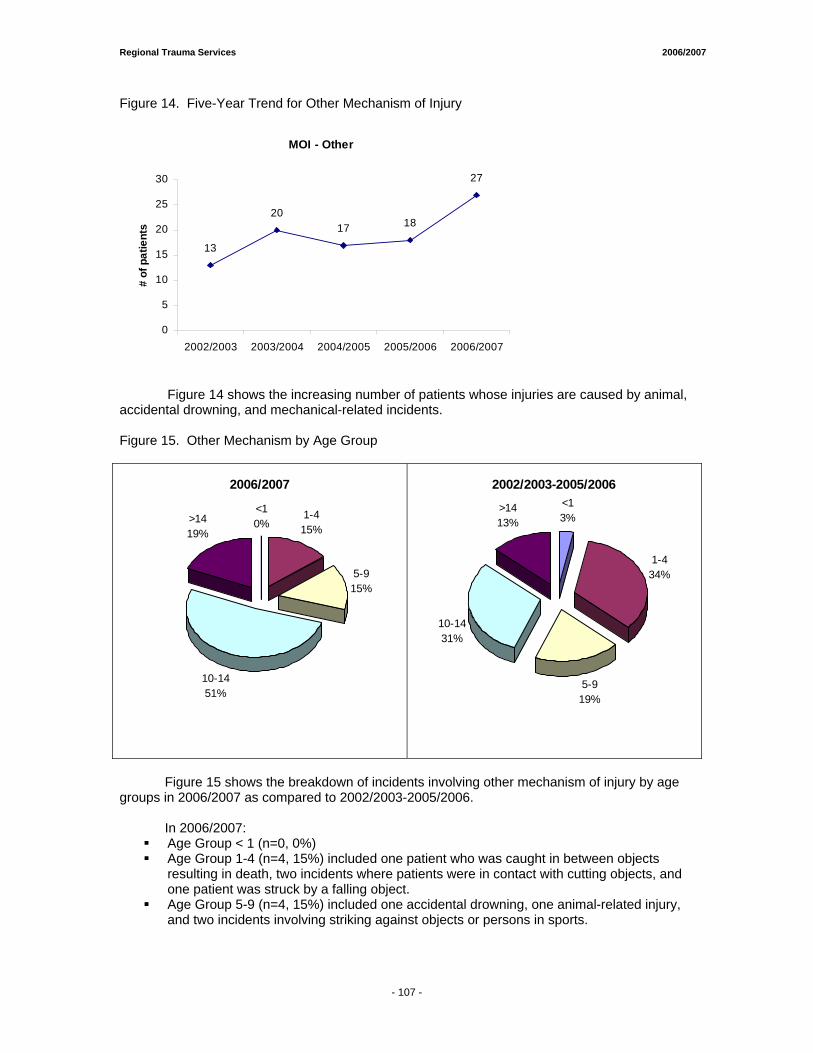
Regional Trauma Services 2006/2007
Figure 14. Five-Year Trend for Other Mechanism of Injury
MOI - Other
13
2017 18
27
0
5
10
15
20
25
30
2002/2003 2003/2004 2004/2005 2005/2006 2006/2007
# of
pat
ient
s
Figure 14 shows the increasing number of patients whose injuries are caused by animal, accidental drowning, and mechanical-related incidents. Figure 15. Other Mechanism by Age Group
2006/2007
<10%
1-415%
5-915%
10-1451%
>1419%
2002/2003-2005/2006<13%
1-434%
5-919%
10-1431%
>1413%
Figure 15 shows the breakdown of incidents involving other mechanism of injury by age
groups in 2006/2007 as compared to 2002/2003-2005/2006. In 2006/2007:
Age Group < 1 (n=0, 0%) Age Group 1-4 (n=4, 15%) included one patient who was caught in between objects
resulting in death, two incidents where patients were in contact with cutting objects, and one patient was struck by a falling object.
Age Group 5-9 (n=4, 15%) included one accidental drowning, one animal-related injury, and two incidents involving striking against objects or persons in sports.
- 107 -
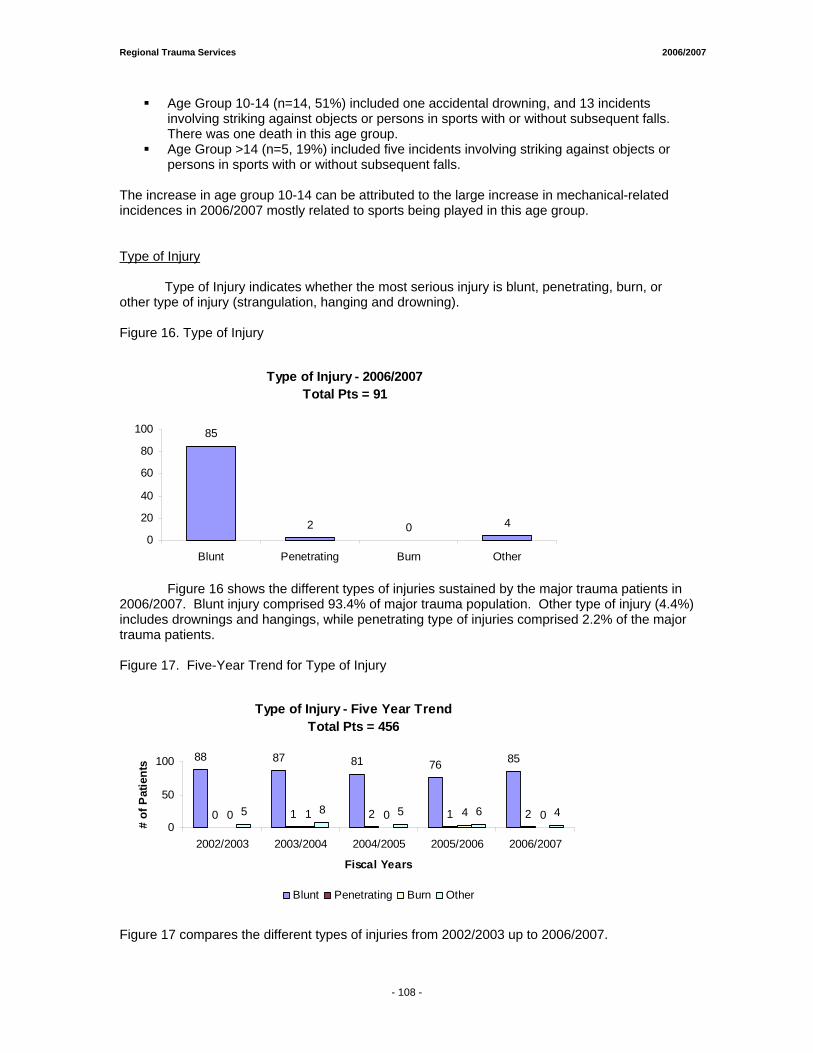
Regional Trauma Services 2006/2007
Age Group 10-14 (n=14, 51%) included one accidental drowning, and 13 incidents involving striking against objects or persons in sports with or without subsequent falls. There was one death in this age group.
Age Group >14 (n=5, 19%) included five incidents involving striking against objects or persons in sports with or without subsequent falls.
The increase in age group 10-14 can be attributed to the large increase in mechanical-related incidences in 2006/2007 mostly related to sports being played in this age group. Type of Injury
Type of Injury indicates whether the most serious injury is blunt, penetrating, burn, or
other type of injury (strangulation, hanging and drowning). Figure 16. Type of Injury
Type of Injury - 2006/2007Total Pts = 91
85
2 0 40
20
40
60
80
100
Blunt Penetrating Burn Other
Figure 16 shows the different types of injuries sustained by the major trauma patients in 2006/2007. Blunt injury comprised 93.4% of major trauma population. Other type of injury (4.4%) includes drownings and hangings, while penetrating type of injuries comprised 2.2% of the major trauma patients. Figure 17. Five-Year Trend for Type of Injury
Type of Injury - Five Year TrendTotal Pts = 456
88 87 81 76 85
0 1 2 1 20 1 0 4 05 8 5 6 40
50
100
2002/2003 2003/2004 2004/2005 2005/2006 2006/2007
Fiscal Years
# of
Pat
ient
s
Blunt Penetrating Burn Other
Figure 17 compares the different types of injuries from 2002/2003 up to 2006/2007.
- 108 -
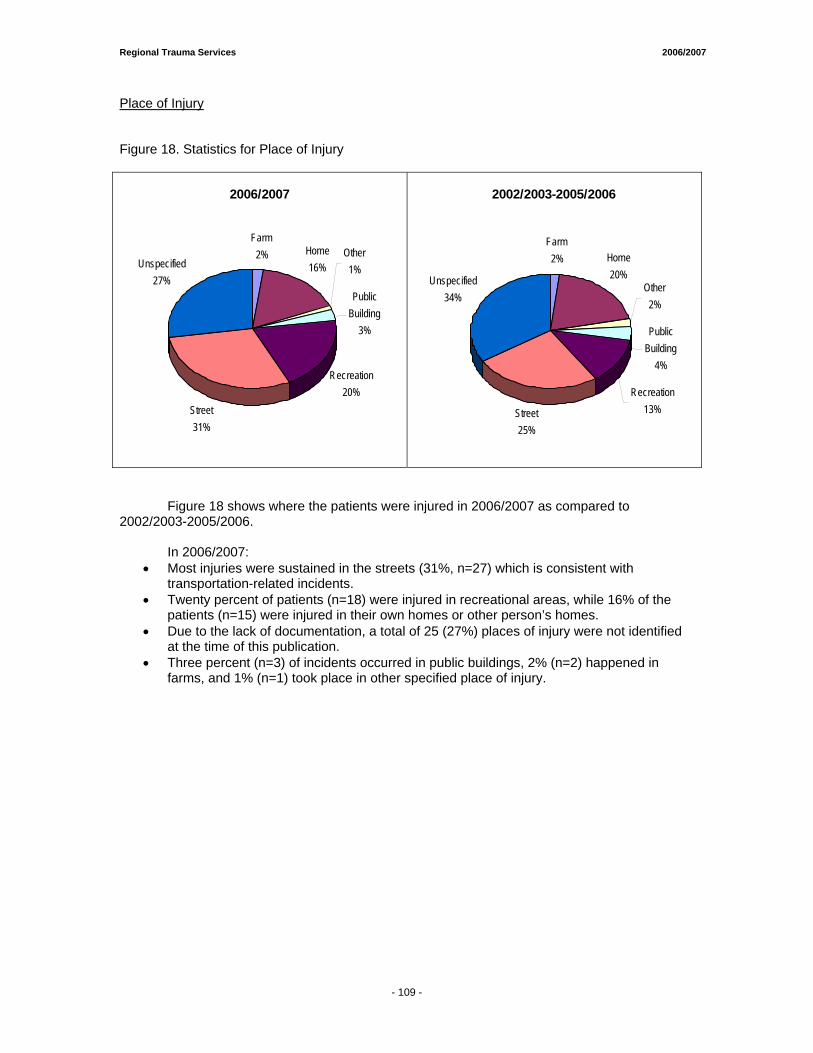
Regional Trauma Services 2006/2007
Place of Injury Figure 18. Statistics for Place of Injury
2006/2007
Farm2% Home
16%Other
1%
Public Building
3%
Recreation20%
Street31%
Unspecified27%
2002/2003-2005/2006
Farm2% Home
20%Other
2%
Public Building
4%
Recreation13%Street
25%
Unspecified34%
Figure 18 shows where the patients were injured in 2006/2007 as compared to 2002/2003-2005/2006. In 2006/2007:
• Most injuries were sustained in the streets (31%, n=27) which is consistent with transportation-related incidents.
• Twenty percent of patients (n=18) were injured in recreational areas, while 16% of the patients (n=15) were injured in their own homes or other person’s homes.
• Due to the lack of documentation, a total of 25 (27%) places of injury were not identified at the time of this publication.
• Three percent (n=3) of incidents occurred in public buildings, 2% (n=2) happened in farms, and 1% (n=1) took place in other specified place of injury.
- 109 -
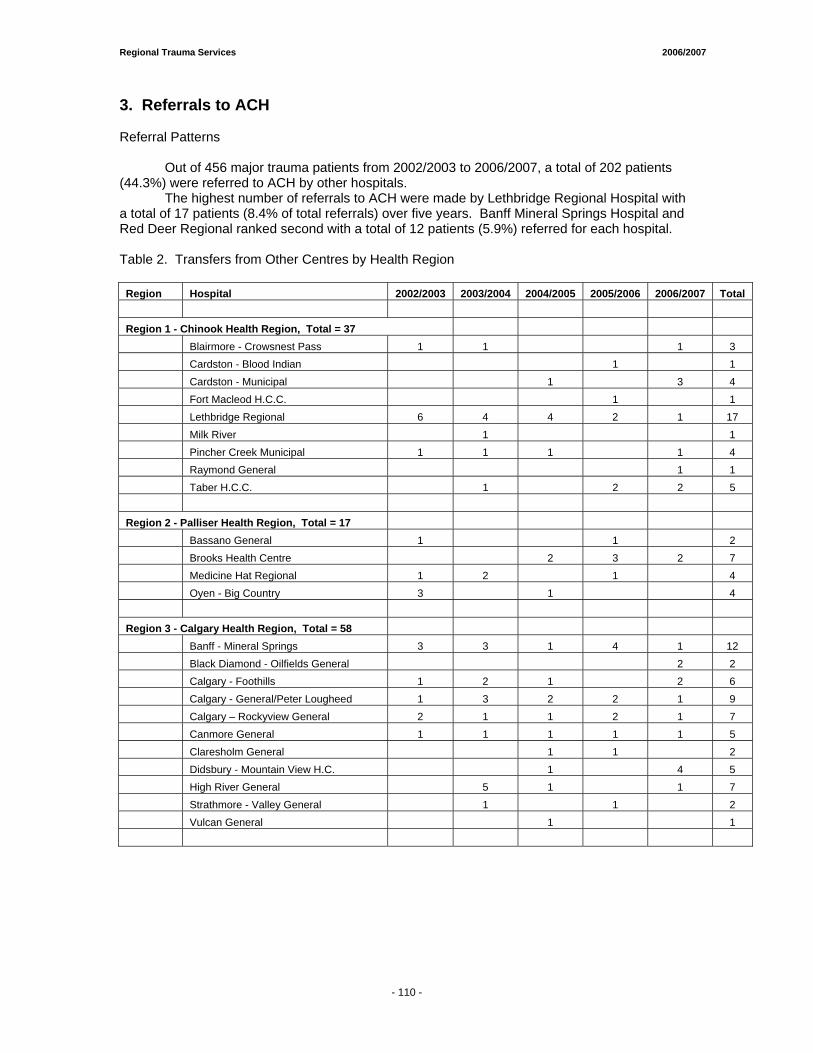
Regional Trauma Services 2006/2007
3. Referrals to ACH Referral Patterns
Out of 456 major trauma patients from 2002/2003 to 2006/2007, a total of 202 patients (44.3%) were referred to ACH by other hospitals.
The highest number of referrals to ACH were made by Lethbridge Regional Hospital with a total of 17 patients (8.4% of total referrals) over five years. Banff Mineral Springs Hospital and Red Deer Regional ranked second with a total of 12 patients (5.9%) referred for each hospital. Table 2. Transfers from Other Centres by Health Region
Region Hospital 2002/2003 2003/2004 2004/2005 2005/2006 2006/2007 Total Region 1 - Chinook Health Region, Total = 37 Blairmore - Crowsnest Pass 1 1 1 3 Cardston - Blood Indian 1 1 Cardston - Municipal 1 3 4 Fort Macleod H.C.C. 1 1 Lethbridge Regional 6 4 4 2 1 17 Milk River 1 1 Pincher Creek Municipal 1 1 1 1 4 Raymond General 1 1 Taber H.C.C. 1 2 2 5 Region 2 - Palliser Health Region, Total = 17 Bassano General 1 1 2 Brooks Health Centre 2 3 2 7 Medicine Hat Regional 1 2 1 4 Oyen - Big Country 3 1 4 Region 3 - Calgary Health Region, Total = 58 Banff - Mineral Springs 3 3 1 4 1 12 Black Diamond - Oilfields General 2 2 Calgary - Foothills 1 2 1 2 6 Calgary - General/Peter Lougheed 1 3 2 2 1 9 Calgary – Rockyview General 2 1 1 2 1 7 Canmore General 1 1 1 1 1 5 Claresholm General 1 1 2 Didsbury - Mountain View H.C. 1 4 5 High River General 5 1 1 7 Strathmore - Valley General 1 1 2 Vulcan General 1 1
- 110 -
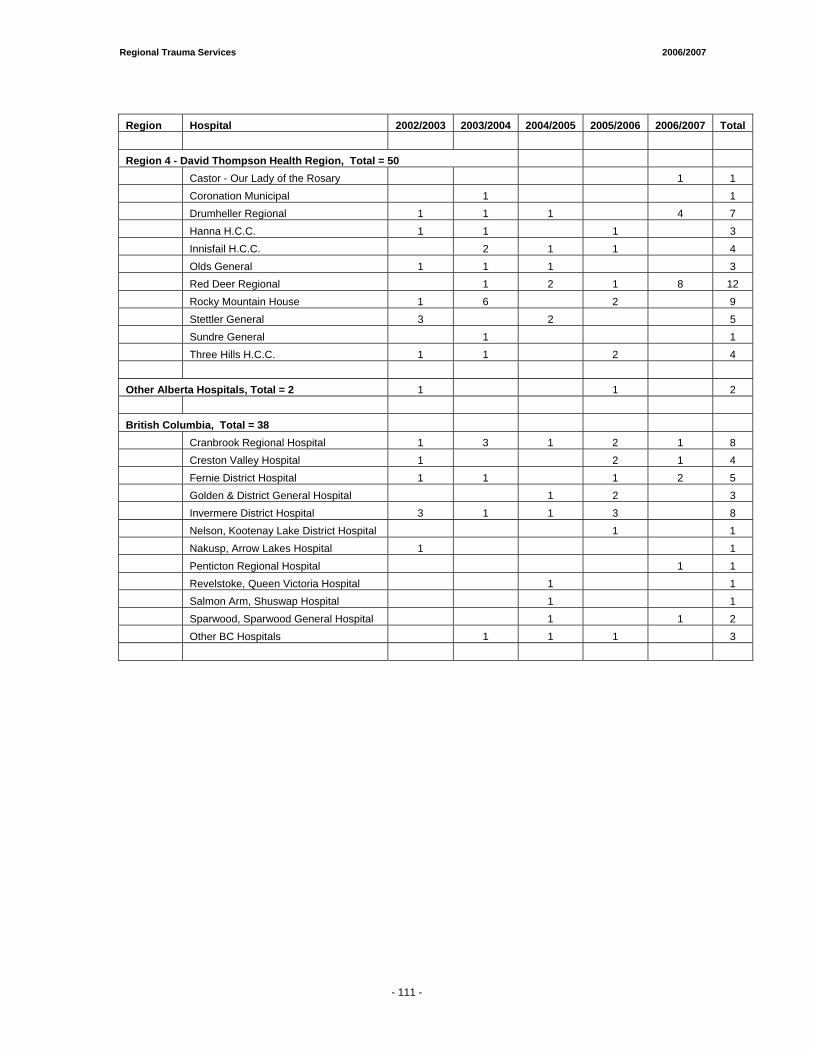
Regional Trauma Services 2006/2007
Region Hospital 2002/2003 2003/2004 2004/2005 2005/2006 2006/2007 Total Region 4 - David Thompson Health Region, Total = 50 Castor - Our Lady of the Rosary 1 1 Coronation Municipal 1 1 Drumheller Regional 1 1 1 4 7 Hanna H.C.C. 1 1 1 3 Innisfail H.C.C. 2 1 1 4 Olds General 1 1 1 3 Red Deer Regional 1 2 1 8 12 Rocky Mountain House 1 6 2 9 Stettler General 3 2 5 Sundre General 1 1 Three Hills H.C.C. 1 1 2 4 Other Alberta Hospitals, Total = 2 1 1 2 British Columbia, Total = 38 Cranbrook Regional Hospital 1 3 1 2 1 8 Creston Valley Hospital 1 2 1 4 Fernie District Hospital 1 1 1 2 5 Golden & District General Hospital 1 2 3 Invermere District Hospital 3 1 1 3 8 Nelson, Kootenay Lake District Hospital 1 1 Nakusp, Arrow Lakes Hospital 1 1 Penticton Regional Hospital 1 1 Revelstoke, Queen Victoria Hospital 1 1 Salmon Arm, Shuswap Hospital 1 1 Sparwood, Sparwood General Hospital 1 1 2 Other BC Hospitals 1 1 1 3
- 111 -
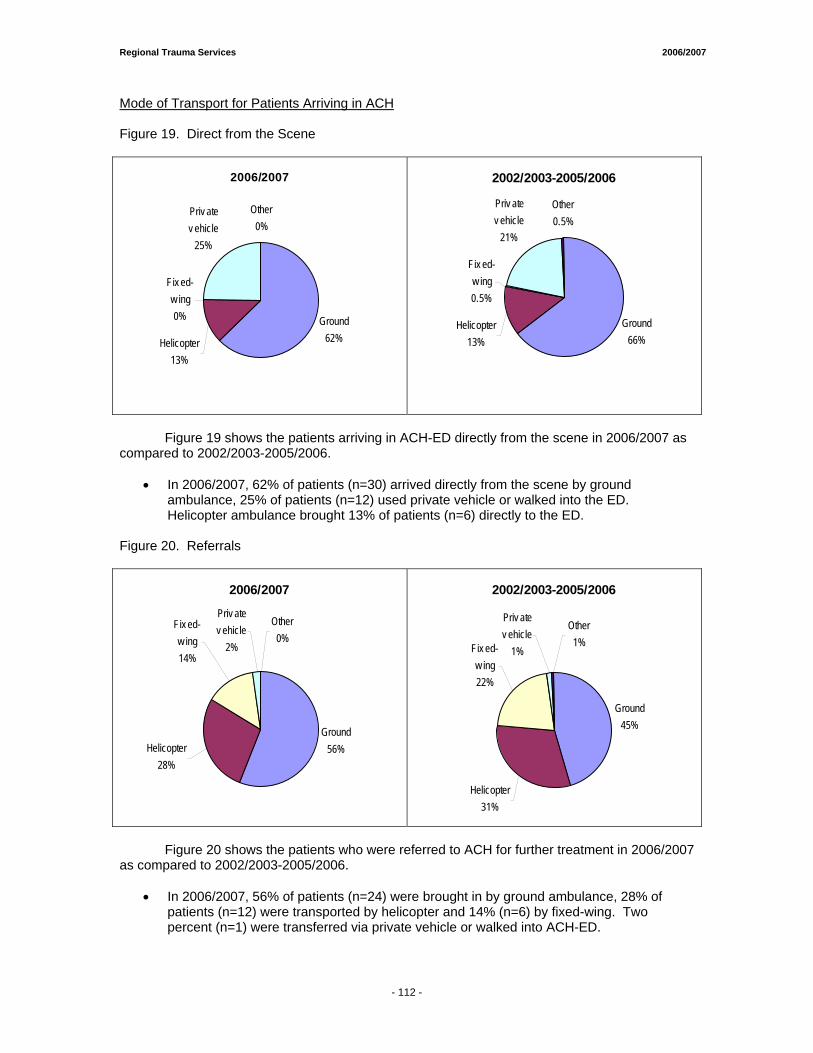
Regional Trauma Services 2006/2007
Mode of Transport for Patients Arriving in ACH Figure 19. Direct from the Scene
2006/2007
Ground 62%Helicopter
13%
Fix ed-w ing0%
Priv ate v ehicle
25%
Other0%
2002/2003-2005/2006
Ground 66%
Helicopter13%
Priv ate v ehicle
21%
Other0.5%
Fix ed-w ing0.5%
Figure 19 shows the patients arriving in ACH-ED directly from the scene in 2006/2007 as compared to 2002/2003-2005/2006.
• In 2006/2007, 62% of patients (n=30) arrived directly from the scene by ground
ambulance, 25% of patients (n=12) used private vehicle or walked into the ED. Helicopter ambulance brought 13% of patients (n=6) directly to the ED.
Figure 20. Referrals
2006/2007
Ground56%
Priv ate v ehicle
2%
Helicopter28%
Fix ed-w ing14%
Other0%
2002/2003-2005/2006
Ground45%
Helicopter31%
Fix ed-w ing22%
Priv ate v ehicle
1%
Other1%
Figure 20 shows the patients who were referred to ACH for further treatment in 2006/2007 as compared to 2002/2003-2005/2006.
• In 2006/2007, 56% of patients (n=24) were brought in by ground ambulance, 28% of
patients (n=12) were transported by helicopter and 14% (n=6) by fixed-wing. Two percent (n=1) were transferred via private vehicle or walked into ACH-ED.
- 112 -
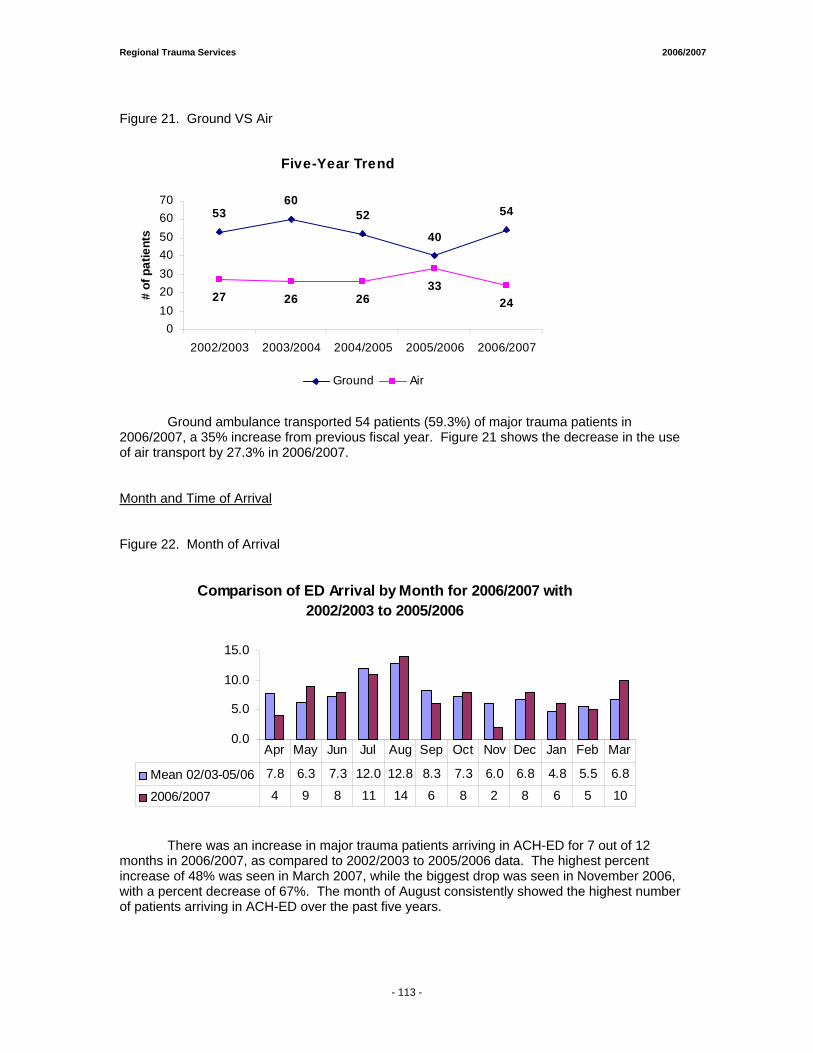
Regional Trauma Services 2006/2007
Figure 21. Ground VS Air
Five-Year Trend
5360
52
40
54
27 26 2633
24
010203040506070
2002/2003 2003/2004 2004/2005 2005/2006 2006/2007
# of
pat
ient
s
Ground Air
Ground ambulance transported 54 patients (59.3%) of major trauma patients in 2006/2007, a 35% increase from previous fiscal year. Figure 21 shows the decrease in the use of air transport by 27.3% in 2006/2007. Month and Time of Arrival Figure 22. Month of Arrival
Comparison of ED Arrival by Month for 2006/2007 with 2002/2003 to 2005/2006
0.0
5.0
10.0
15.0
Mean 02/03-05/06 7.8 6.3 7.3 12.0 12.8 8.3 7.3 6.0 6.8 4.8 5.5 6.8
2006/2007 4 9 8 11 14 6 8 2 8 6 5 10
Apr May Jun Jul Aug Sep Oct Nov Dec Jan Feb Mar
There was an increase in major trauma patients arriving in ACH-ED for 7 out of 12 months in 2006/2007, as compared to 2002/2003 to 2005/2006 data. The highest percent increase of 48% was seen in March 2007, while the biggest drop was seen in November 2006, with a percent decrease of 67%. The month of August consistently showed the highest number of patients arriving in ACH-ED over the past five years.
- 113 -
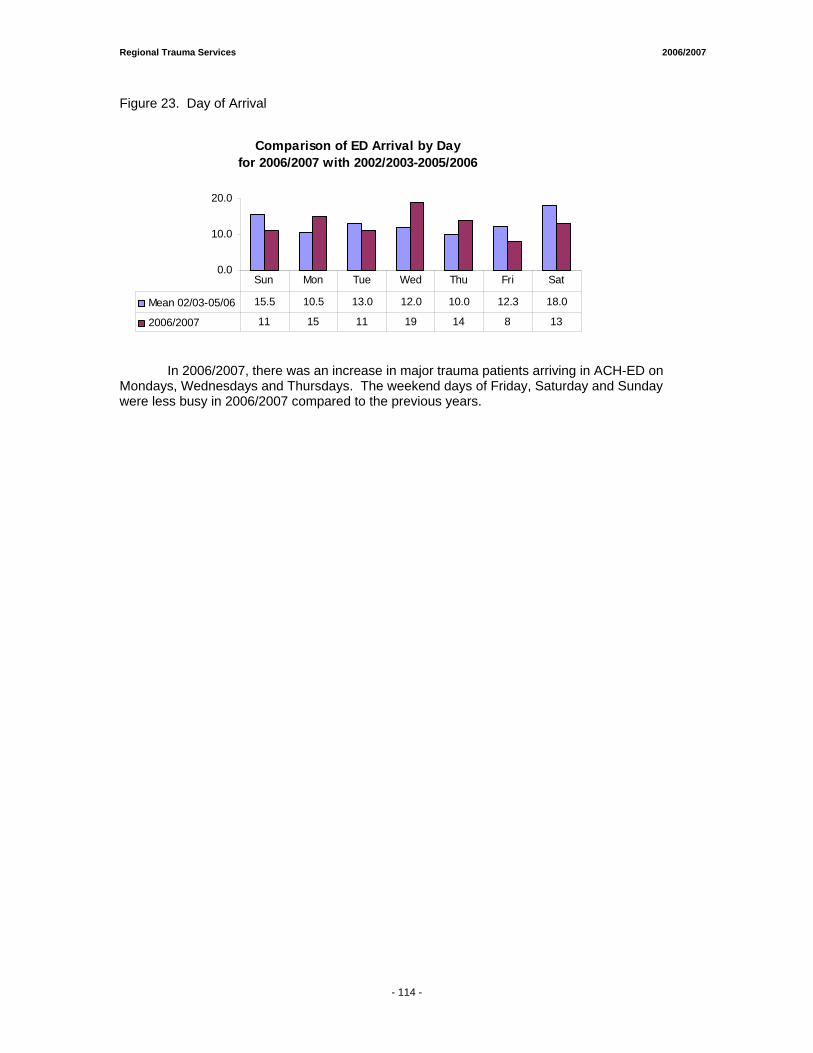
Regional Trauma Services 2006/2007
Figure 23. Day of Arrival
Comparison of ED Arrival by Day for 2006/2007 with 2002/2003-2005/2006
0.0
10.0
20.0
Mean 02/03-05/06 15.5 10.5 13.0 12.0 10.0 12.3 18.0
2006/2007 11 15 11 19 14 8 13
Sun Mon Tue Wed Thu Fri Sat
In 2006/2007, there was an increase in major trauma patients arriving in ACH-ED on Mondays, Wednesdays and Thursdays. The weekend days of Friday, Saturday and Sunday were less busy in 2006/2007 compared to the previous years.
- 114 -
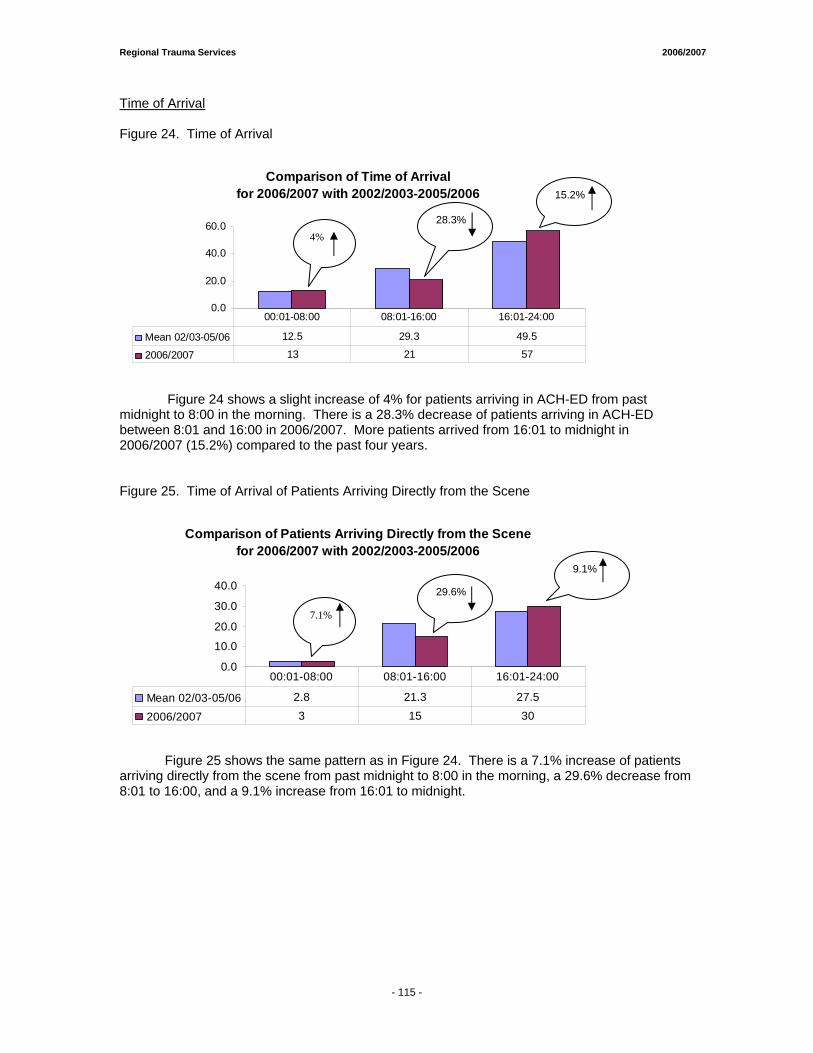
Regional Trauma Services 2006/2007
Time of Arrival Figure 24. Time of Arrival
Comparison of Time of Arrivalfor 2006/2007 with 2002/2003-2005/2006
0.0
20.0
40.0
60.0
Mean 02/03-05/06 12.5 29.3 49.5
2006/2007 13 21 57
00:01-08:00 08:01-16:00 16:01-24:00
Figure 24 shows a slight increase of 4% for patients arriving in ACH-ED from past midnight to 8:00 in the morning. There is a 28.3% decrease of patients arriving in ACH-ED between 8:01 and 16:00 in 2006/2007. More patients arrived from 16:01 to midnight in 2006/2007 (15.2%) compared to the past four years. Figure 25. Time of Arrival of Patients Arriving Directly from the Scene
Comparison of Patients Arriving Directly from the Scene for 2006/2007 with 2002/2003-2005/2006
0.0
10.0
20.0
30.0
40.0
Mean 02/03-05/06 2.8 21.3 27.5
2006/2007 3 15 30
00:01-08:00 08:01-16:00 16:01-24:00
Figure 25 shows the same pattern as in Figure 24. There is a 7.1% increase of patients arriving directly from the scene from past midnight to 8:00 in the morning, a 29.6% decrease from 8:01 to 16:00, and a 9.1% increase from 16:01 to midnight.
15.2%
4%
29.6%
9.1%
7.1%
28.3%
- 115 -
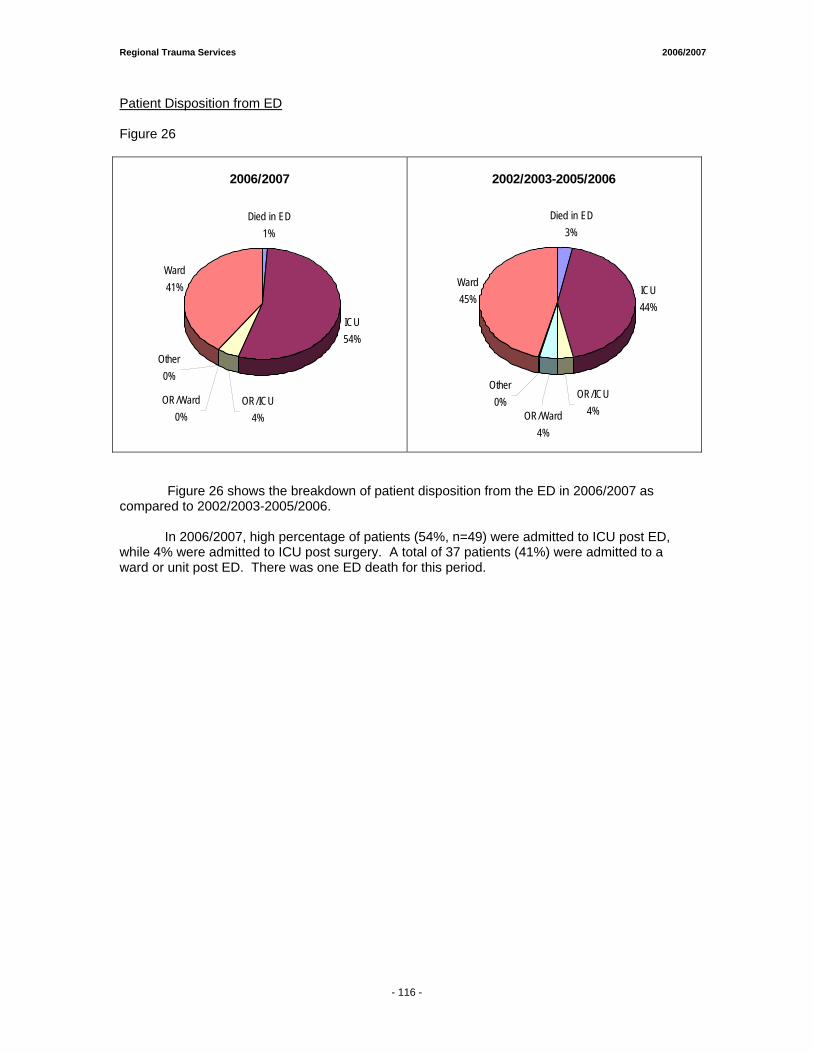
Regional Trauma Services 2006/2007
Patient Disposition from ED Figure 26
2006/2007
Died in ED1%
ICU54%
Ward41%
OR/Ward0%
Other0%
OR/ICU4%
2002/2003-2005/2006
Died in ED3%
ICU44%
Ward45%
OR/Ward4%
Other0%
OR/ICU4%
Figure 26 shows the breakdown of patient disposition from the ED in 2006/2007 as compared to 2002/2003-2005/2006.
In 2006/2007, high percentage of patients (54%, n=49) were admitted to ICU post ED, while 4% were admitted to ICU post surgery. A total of 37 patients (41%) were admitted to a ward or unit post ED. There was one ED death for this period.
- 116 -
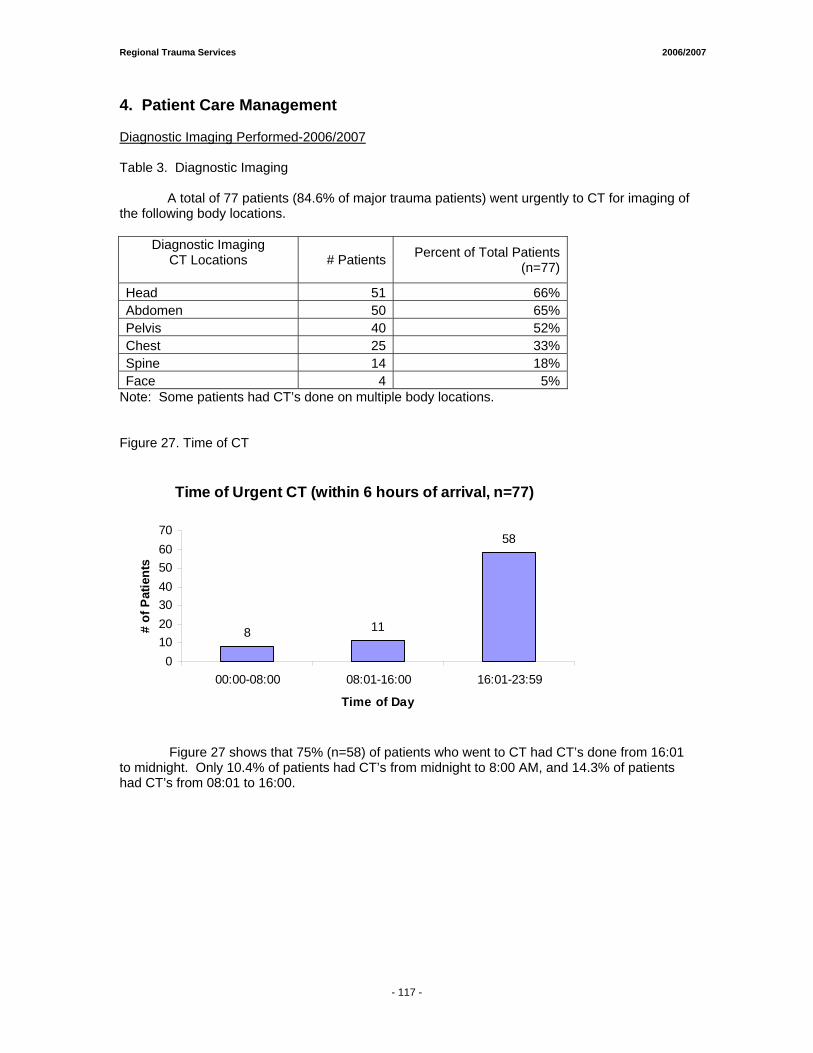
Regional Trauma Services 2006/2007
4. Patient Care Management Diagnostic Imaging Performed-2006/2007 Table 3. Diagnostic Imaging A total of 77 patients (84.6% of major trauma patients) went urgently to CT for imaging of the following body locations.
Diagnostic Imaging CT Locations
# Patients Percent of Total Patients
(n=77)
Head 51 66%Abdomen 50 65%Pelvis 40 52%Chest 25 33%Spine 14 18%Face 4 5%
Note: Some patients had CT’s done on multiple body locations. Figure 27. Time of CT
Time of Urgent CT (within 6 hours of arrival, n=77)
8 11
58
010203040506070
00:00-08:00 08:01-16:00 16:01-23:59
Time of Day
# of
Pat
ient
s
Figure 27 shows that 75% (n=58) of patients who went to CT had CT’s done from 16:01 to midnight. Only 10.4% of patients had CT’s from midnight to 8:00 AM, and 14.3% of patients had CT’s from 08:01 to 16:00.
- 117 -
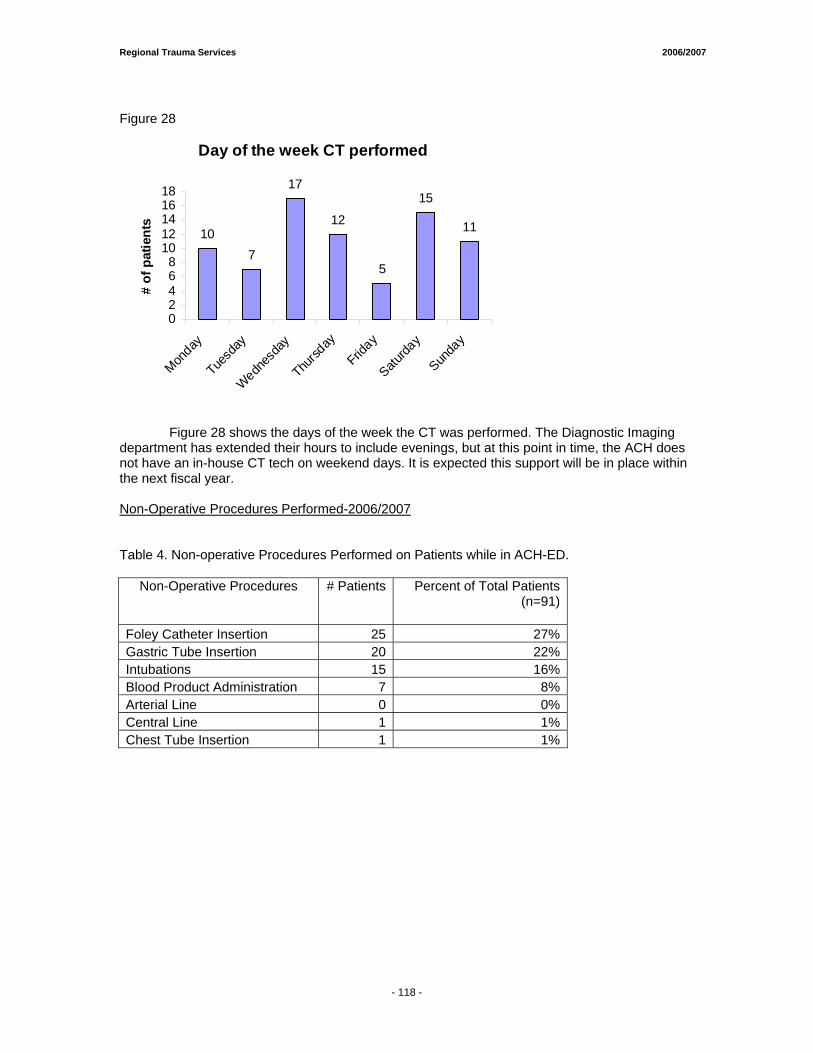
Regional Trauma Services 2006/2007
Figure 28
Day of the week CT performed
107
17
12
5
15
11
02468
1012141618
Monday
Tuesd
ay
Wednes
day
Thursd
ay
Friday
Saturda
y
Sunda
y
# of
pat
ient
s
Figure 28 shows the days of the week the CT was performed. The Diagnostic Imaging department has extended their hours to include evenings, but at this point in time, the ACH does not have an in-house CT tech on weekend days. It is expected this support will be in place within the next fiscal year. Non-Operative Procedures Performed-2006/2007 Table 4. Non-operative Procedures Performed on Patients while in ACH-ED.
Non-Operative Procedures # Patients Percent of Total Patients(n=91)
Foley Catheter Insertion 25 27%Gastric Tube Insertion 20 22%Intubations 15 16%Blood Product Administration 7 8%Arterial Line 0 0%Central Line 1 1%Chest Tube Insertion 1 1%
- 118 -
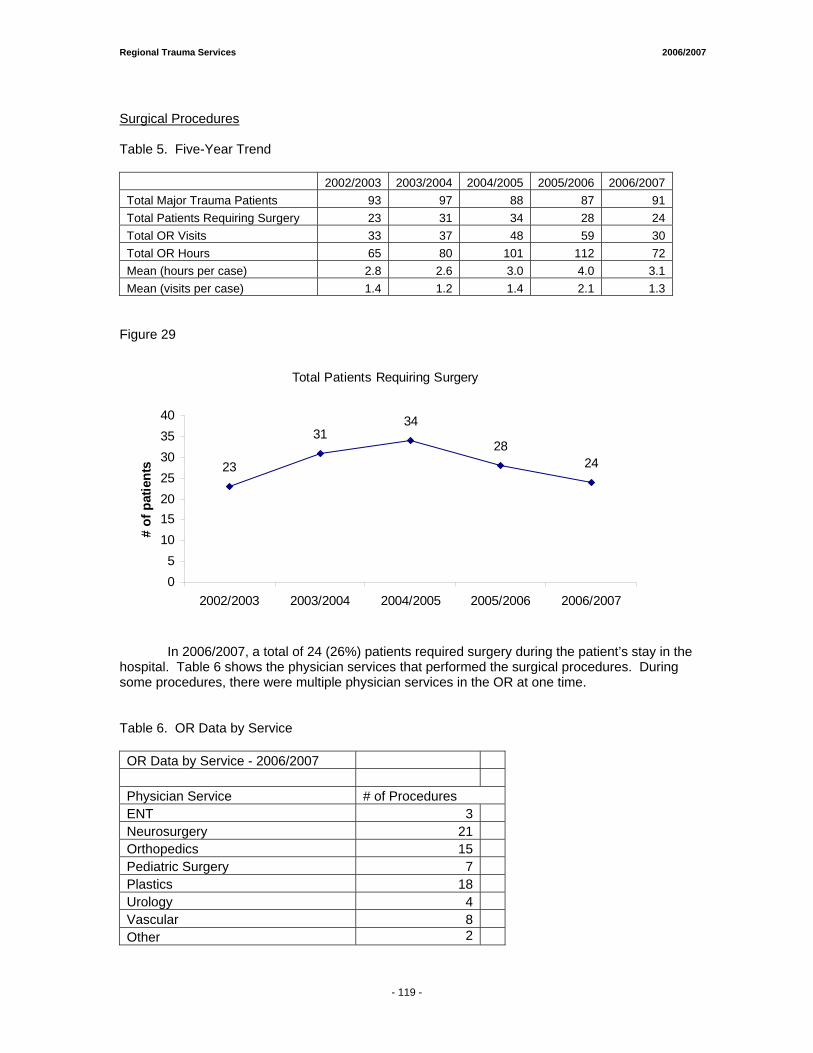
Regional Trauma Services 2006/2007
Surgical Procedures Table 5. Five-Year Trend
2002/2003 2003/2004 2004/2005 2005/2006 2006/2007 Total Major Trauma Patients 93 97 88 87 91 Total Patients Requiring Surgery 23 31 34 28 24 Total OR Visits 33 37 48 59 30 Total OR Hours 65 80 101 112 72 Mean (hours per case) 2.8 2.6 3.0 4.0 3.1 Mean (visits per case) 1.4 1.2 1.4 2.1 1.3
Figure 29
Total Patients Requiring Surgery
23
3134
2824
05
10152025303540
2002/2003 2003/2004 2004/2005 2005/2006 2006/2007
# of
pat
ient
s
In 2006/2007, a total of 24 (26%) patients required surgery during the patient’s stay in the hospital. Table 6 shows the physician services that performed the surgical procedures. During some procedures, there were multiple physician services in the OR at one time. Table 6. OR Data by Service OR Data by Service - 2006/2007 Physician Service # of Procedures ENT 3 Neurosurgery 21 Orthopedics 15 Pediatric Surgery 7 Plastics 18 Urology 4 Vascular 8 Other 2
- 119 -
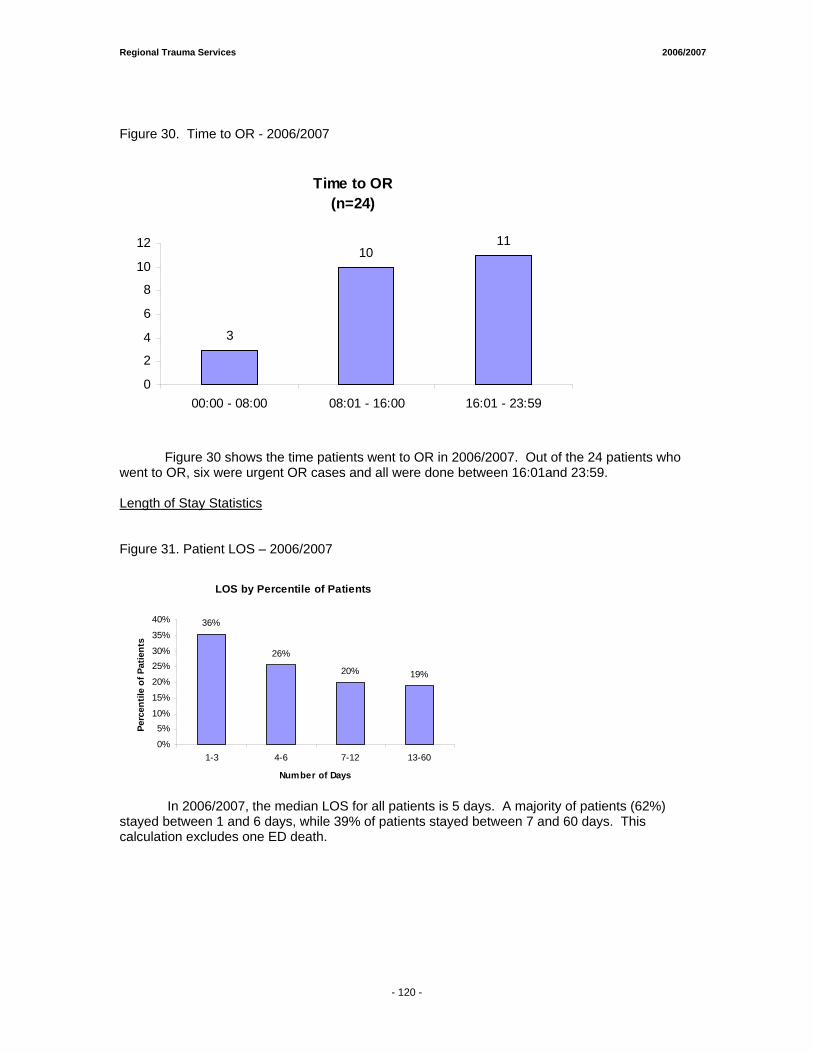
Regional Trauma Services 2006/2007
Figure 30. Time to OR - 2006/2007
Time to OR(n=24)
3
1011
0
2
4
6
8
10
12
00:00 - 08:00 08:01 - 16:00 16:01 - 23:59
Figure 30 shows the time patients went to OR in 2006/2007. Out of the 24 patients who went to OR, six were urgent OR cases and all were done between 16:01and 23:59. Length of Stay Statistics Figure 31. Patient LOS – 2006/2007
LOS by Percentile of Patients
36%
26%
20% 19%
0%
5%10%
15%
20%
25%30%
35%
40%
1-3 4-6 7-12 13-60
Number of Days
Perc
entil
e of
Pat
ient
s
In 2006/2007, the median LOS for all patients is 5 days. A majority of patients (62%) stayed between 1 and 6 days, while 39% of patients stayed between 7 and 60 days. This calculation excludes one ED death.
- 120 -
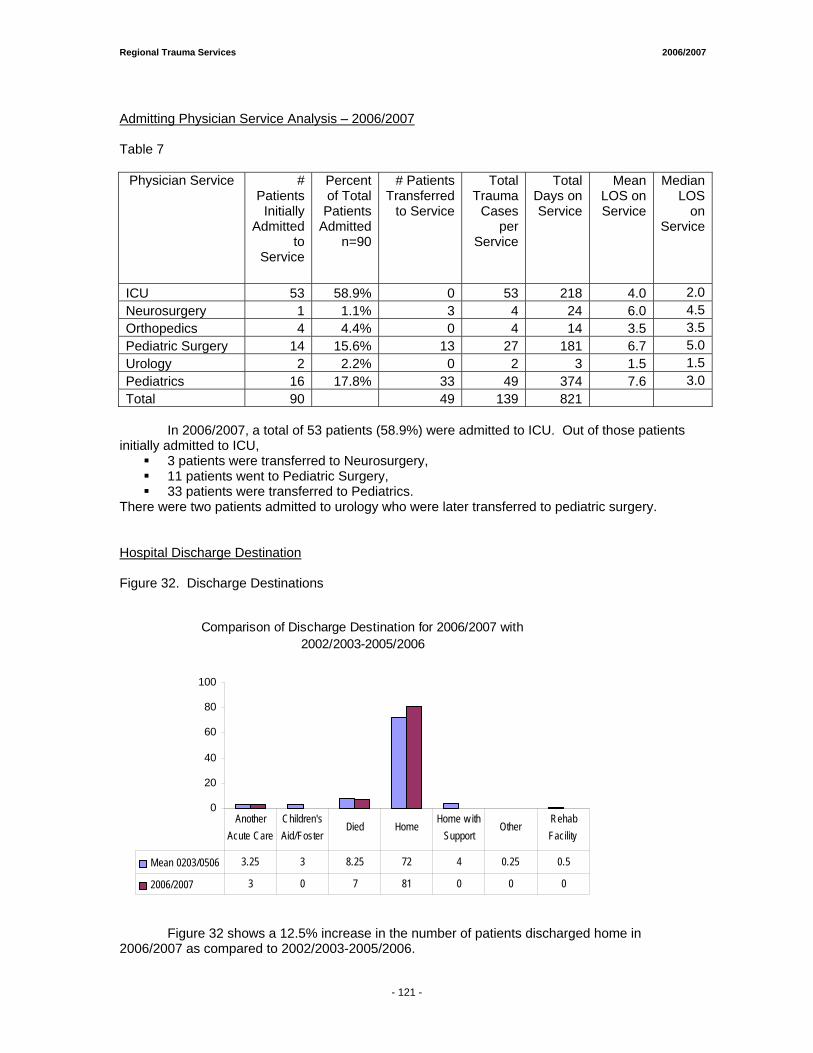
Regional Trauma Services 2006/2007
Admitting Physician Service Analysis – 2006/2007 Table 7
Physician Service # Patients
Initially Admitted
to Service
Percent of Total
Patients Admitted
n=90
# Patients Transferred
to Service
Total Trauma
Cases per
Service
Total Days on Service
Mean LOS on Service
Median LOS
on Service
ICU 53 58.9% 0 53 218 4.0 2.0Neurosurgery 1 1.1% 3 4 24 6.0 4.5Orthopedics 4 4.4% 0 4 14 3.5 3.5Pediatric Surgery 14 15.6% 13 27 181 6.7 5.0Urology 2 2.2% 0 2 3 1.5 1.5Pediatrics 16 17.8% 33 49 374 7.6 3.0Total 90 49 139 821
In 2006/2007, a total of 53 patients (58.9%) were admitted to ICU. Out of those patients initially admitted to ICU,
3 patients were transferred to Neurosurgery, 11 patients went to Pediatric Surgery, 33 patients were transferred to Pediatrics.
There were two patients admitted to urology who were later transferred to pediatric surgery. Hospital Discharge Destination Figure 32. Discharge Destinations
Comparison of Discharge Destination for 2006/2007 with 2002/2003-2005/2006
0
20
40
60
80
100
Mean 0203/0506 3.25 3 8.25 72 4 0.25 0.5
2006/2007 3 0 7 81 0 0 0
Another Acute Care
Children's Aid/Foster
Died HomeHome w ith
Support Other
Rehab Facility
Figure 32 shows a 12.5% increase in the number of patients discharged home in 2006/2007 as compared to 2002/2003-2005/2006.
- 121 -
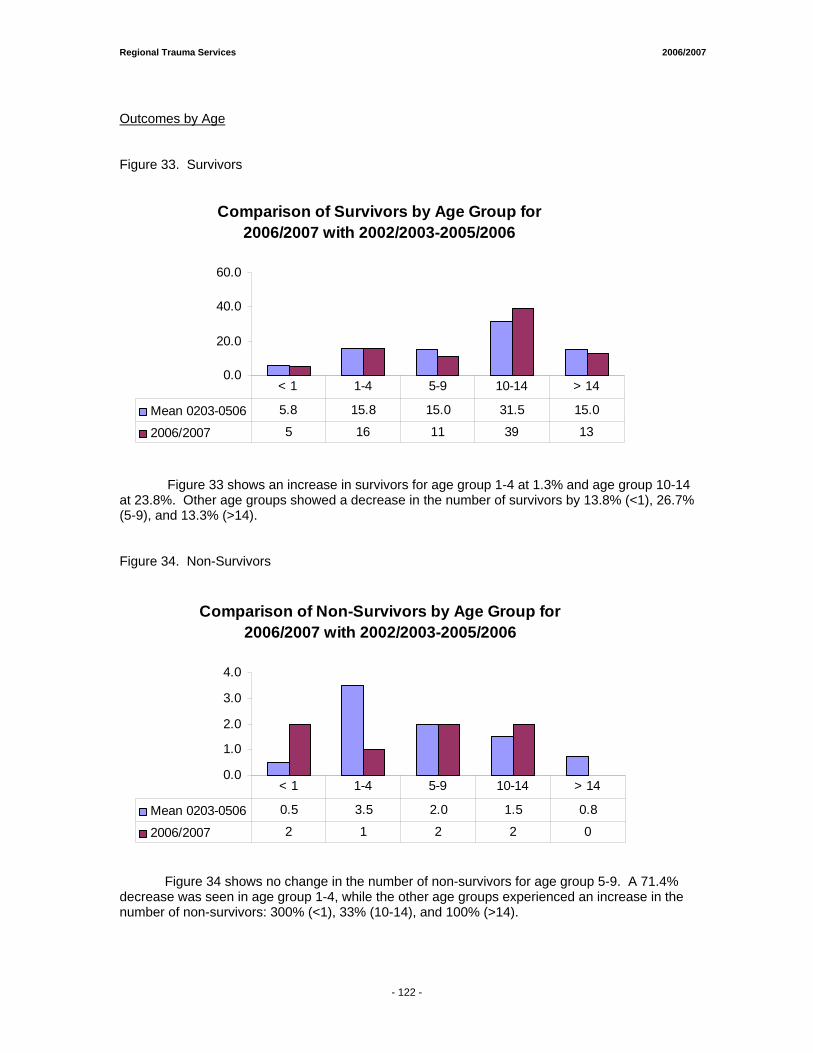
Regional Trauma Services 2006/2007
Outcomes by Age Figure 33. Survivors
Comparison of Survivors by Age Group for 2006/2007 with 2002/2003-2005/2006
0.0
20.0
40.0
60.0
Mean 0203-0506 5.8 15.8 15.0 31.5 15.0
2006/2007 5 16 11 39 13
< 1 1-4 5-9 10-14 > 14
Figure 33 shows an increase in survivors for age group 1-4 at 1.3% and age group 10-14 at 23.8%. Other age groups showed a decrease in the number of survivors by 13.8% (<1), 26.7% (5-9), and 13.3% (>14). Figure 34. Non-Survivors
Comparison of Non-Survivors by Age Group for 2006/2007 with 2002/2003-2005/2006
0.0
1.0
2.0
3.0
4.0
Mean 0203-0506 0.5 3.5 2.0 1.5 0.8
2006/2007 2 1 2 2 0
< 1 1-4 5-9 10-14 > 14
Figure 34 shows no change in the number of non-survivors for age group 5-9. A 71.4% decrease was seen in age group 1-4, while the other age groups experienced an increase in the number of non-survivors: 300% (<1), 33% (10-14), and 100% (>14).
- 122 -
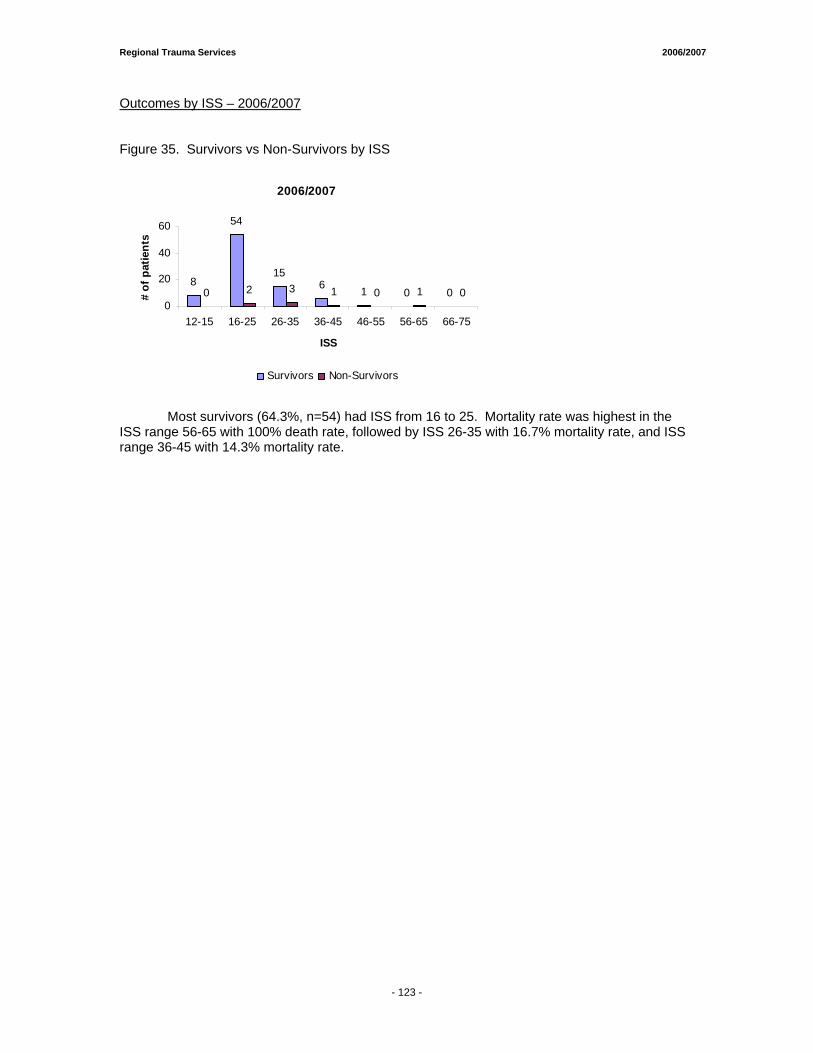
Regional Trauma Services 2006/2007
Outcomes by ISS – 2006/2007 Figure 35. Survivors vs Non-Survivors by ISS
2006/2007
8
54
156 1 0 00 2 3 1 0 1 0
0
20
40
60
12-15 16-25 26-35 36-45 46-55 56-65 66-75
ISS
# of
pat
ient
s
Survivors Non-Survivors
Most survivors (64.3%, n=54) had ISS from 16 to 25. Mortality rate was highest in the ISS range 56-65 with 100% death rate, followed by ISS 26-35 with 16.7% mortality rate, and ISS range 36-45 with 14.3% mortality rate.
- 123 -
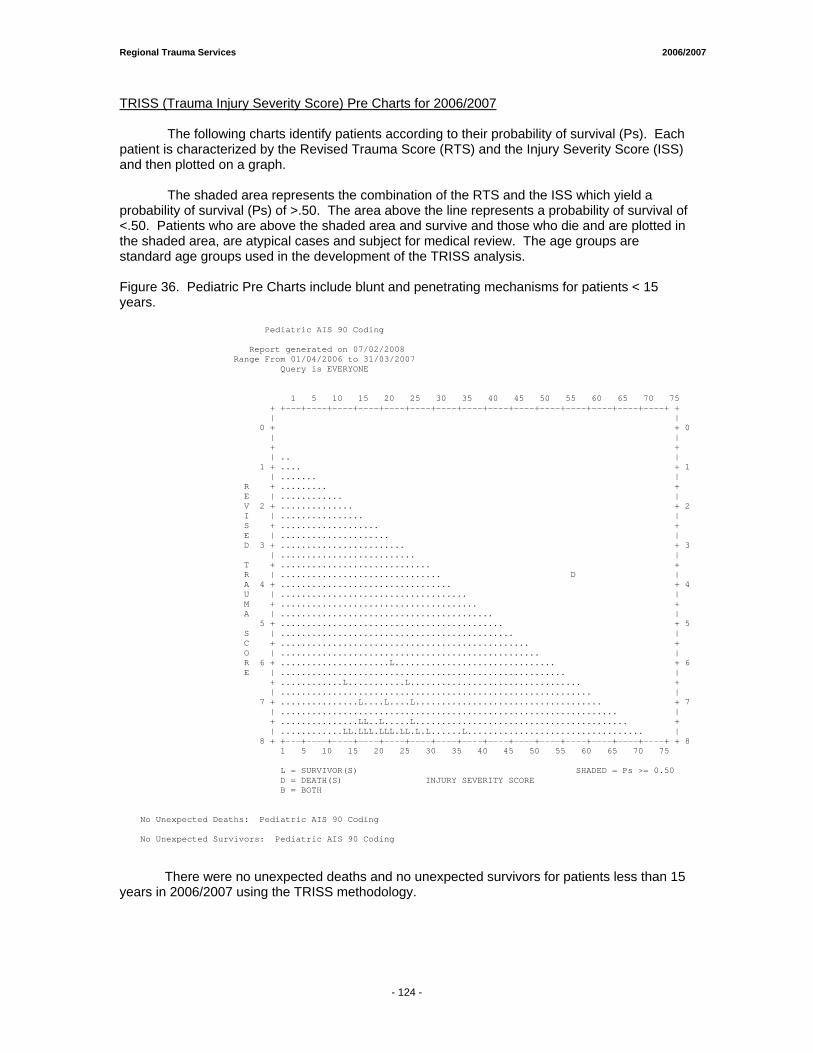
Regional Trauma Services 2006/2007
TRISS (Trauma Injury Severity Score) Pre Charts for 2006/2007 The following charts identify patients according to their probability of survival (Ps). Each patient is characterized by the Revised Trauma Score (RTS) and the Injury Severity Score (ISS) and then plotted on a graph. The shaded area represents the combination of the RTS and the ISS which yield a probability of survival (Ps) of >.50. The area above the line represents a probability of survival of <.50. Patients who are above the shaded area and survive and those who die and are plotted in the shaded area, are atypical cases and subject for medical review. The age groups are standard age groups used in the development of the TRISS analysis. Figure 36. Pediatric Pre Charts include blunt and penetrating mechanisms for patients < 15 years. Pediatric AIS 90 Coding Report generated on 07/02/2008 Range From 01/04/2006 to 31/03/2007 Query is EVERYONE �� 1 5 10 15 20 25 30 35 40 45 50 55 60 65 70 75 + +---+----+----+----+----+----+----+----+----+----+----+----+----+----+----+ + | | 0 + + 0 | | + + | .. | 1 + .... + 1 | ....... | R + ......... + E | ............ | V 2 + .............. + 2 I | ................ | S + ................... + E | ..................... | D 3 + ........................ + 3 | .......................... | T + ............................. + R | ............................... D | A 4 + ................................. + 4 U | .................................... | M + ...................................... + A | ......................................... | 5 + ........................................... + 5 S | ............................................. | C + ................................................ + O | .................................................. | R 6 + .....................L............................... + 6 E | ....................................................... | + ............L...........L................................. + | ............................................................ | 7 + ...............L....L....L.................................... + 7 | ................................................................. | + ...............LL..L.....L......................................... + | ............LL.LLL.LLL.LL.L.L......L.................................. | 8 + +---+----+----+----+----+----+----+----+----+----+----+----+----+----+----+ + 8 1 5 10 15 20 25 30 35 40 45 50 55 60 65 70 75 L = SURVIVOR(S) SHADED = Ps >= 0.50 D = DEATH(S) INJURY SEVERITY SCORE B = BOTH �� No Unexpected Deaths: Pediatric AIS 90 Coding No Unexpected Survivors: Pediatric AIS 90 Coding
There were no unexpected deaths and no unexpected survivors for patients less than 15
years in 2006/2007 using the TRISS methodology.
- 124 -
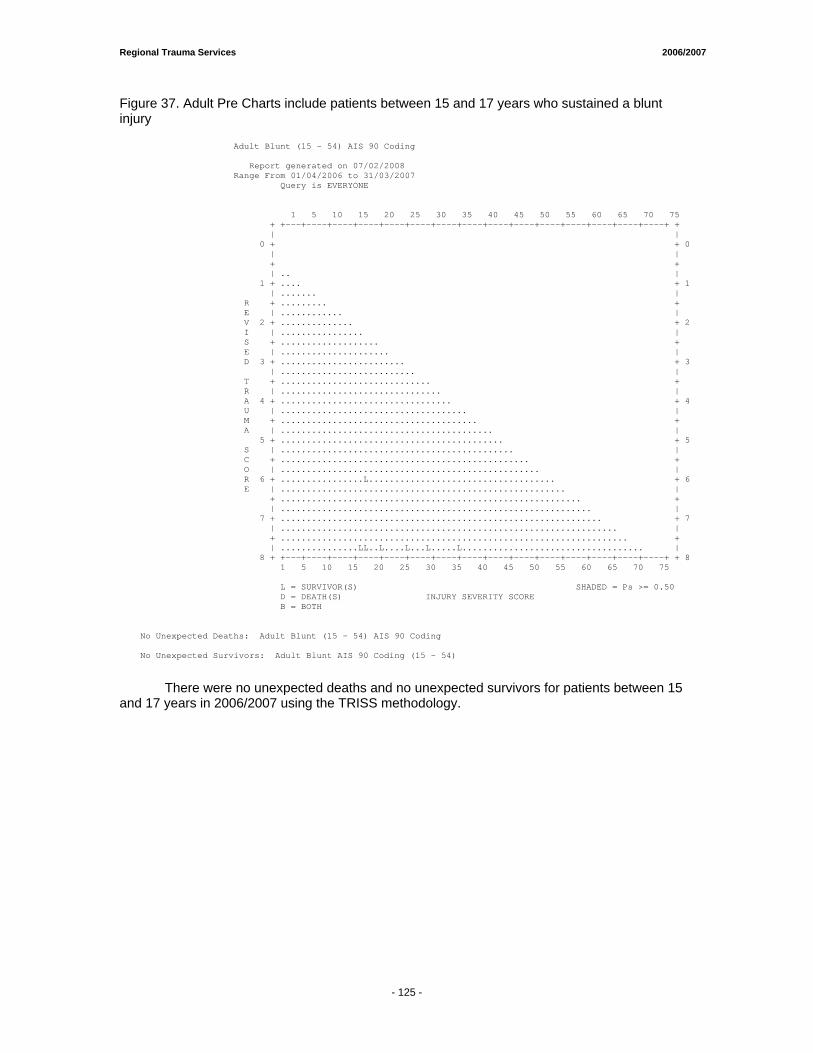
Regional Trauma Services 2006/2007
Figure 37. Adult Pre Charts include patients between 15 and 17 years who sustained a blunt injury Adult Blunt (15 - 54) AIS 90 Coding Report generated on 07/02/2008 Range From 01/04/2006 to 31/03/2007 Query is EVERYONE �� 1 5 10 15 20 25 30 35 40 45 50 55 60 65 70 75 + +---+----+----+----+----+----+----+----+----+----+----+----+----+----+----+ + | | 0 + + 0 | | + + | .. | 1 + .... + 1 | ....... | R + ......... + E | ............ | V 2 + .............. + 2 I | ................ | S + ................... + E | ..................... | D 3 + ........................ + 3 | .......................... | T + ............................. + R | ............................... | A 4 + ................................. + 4 U | .................................... | M + ...................................... + A | ......................................... | 5 + ........................................... + 5 S | ............................................. | C + ................................................ + O | .................................................. | R 6 + ................L.................................... + 6 E | ....................................................... | + .......................................................... + | ............................................................ | 7 + .............................................................. + 7 | ................................................................. | + ................................................................... + | ...............LL..L....L...L.....L................................... | 8 + +---+----+----+----+----+----+----+----+----+----+----+----+----+----+----+ + 8 1 5 10 15 20 25 30 35 40 45 50 55 60 65 70 75 L = SURVIVOR(S) SHADED = Ps >= 0.50 D = DEATH(S) INJURY SEVERITY SCORE B = BOTH �� No Unexpected Deaths: Adult Blunt (15 - 54) AIS 90 Coding No Unexpected Survivors: Adult Blunt AIS 90 Coding (15 - 54)
There were no unexpected deaths and no unexpected survivors for patients between 15 and 17 years in 2006/2007 using the TRISS methodology.
- 125 -

Trauma Statistics & Performance/Outcome Data PPEETTEERR LLOOUUGGHHEEEEDD CCEENNTTRREE RROOCCKKYYVVIIEEWW GGEENNEERRAALL HHOOSSPPIITTAALL Project Lead:
• Ms. Alma Badnjevic, Data Anaylst Regional Trauma Services
• Ms. Michelle Mercado, Data Analyst Regional Trauma Services

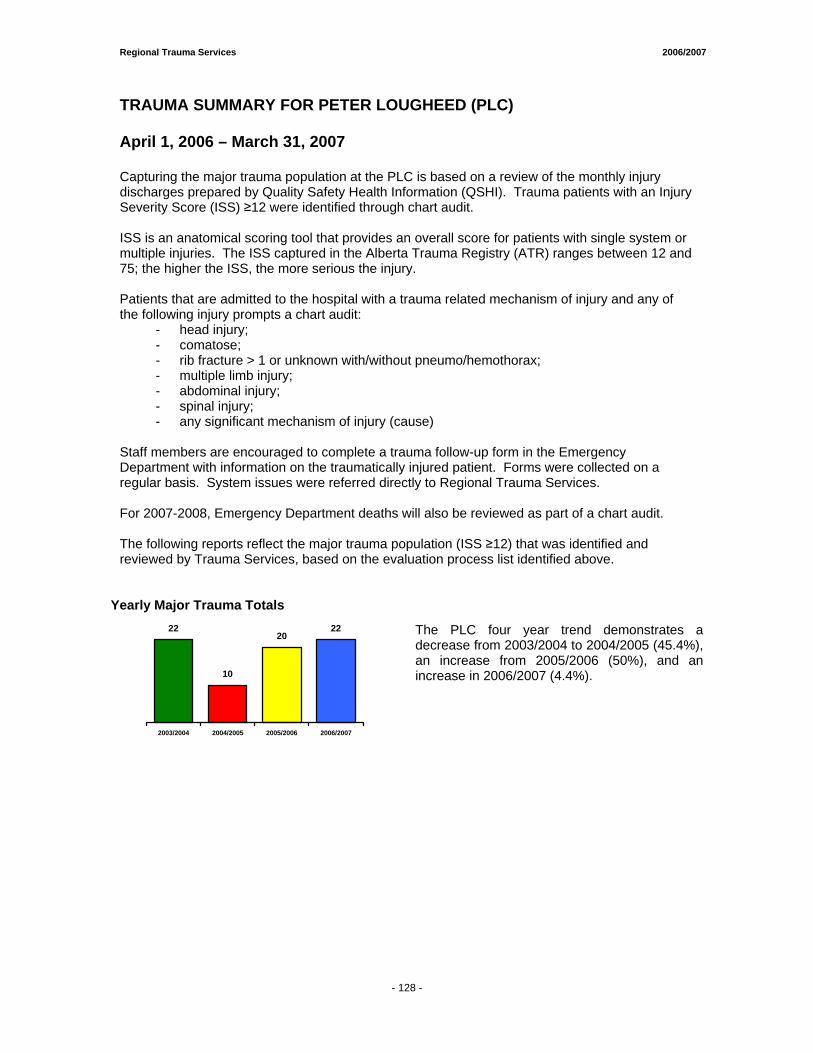
Regional Trauma Services 2006/2007
- 128 -
TRAUMA SUMMARY FOR PETER LOUGHEED (PLC)
April 1, 2006 – March 31, 2007
Capturing the major trauma population at the PLC is based on a review of the monthly injury discharges prepared by Quality Safety Health Information (QSHI). Trauma patients with an Injury Severity Score (ISS) ≥12 were identified through chart audit. ISS is an anatomical scoring tool that provides an overall score for patients with single system or multiple injuries. The ISS captured in the Alberta Trauma Registry (ATR) ranges between 12 and 75; the higher the ISS, the more serious the injury. Patients that are admitted to the hospital with a trauma related mechanism of injury and any of the following injury prompts a chart audit:
- head injury; - comatose; - rib fracture > 1 or unknown with/without pneumo/hemothorax; - multiple limb injury; - abdominal injury; - spinal injury; - any significant mechanism of injury (cause)
Staff members are encouraged to complete a trauma follow-up form in the Emergency Department with information on the traumatically injured patient. Forms were collected on a regular basis. System issues were referred directly to Regional Trauma Services. For 2007-2008, Emergency Department deaths will also be reviewed as part of a chart audit. The following reports reflect the major trauma population (ISS ≥12) that was identified and reviewed by Trauma Services, based on the evaluation process list identified above.
Yearly Major Trauma Totals 22
10
2022
2003/2004 2004/2005 2005/2006 2006/2007
The PLC four year trend demonstrates a decrease from 2003/2004 to 2004/2005 (45.4%), an increase from 2005/2006 (50%), and an increase in 2006/2007 (4.4%).
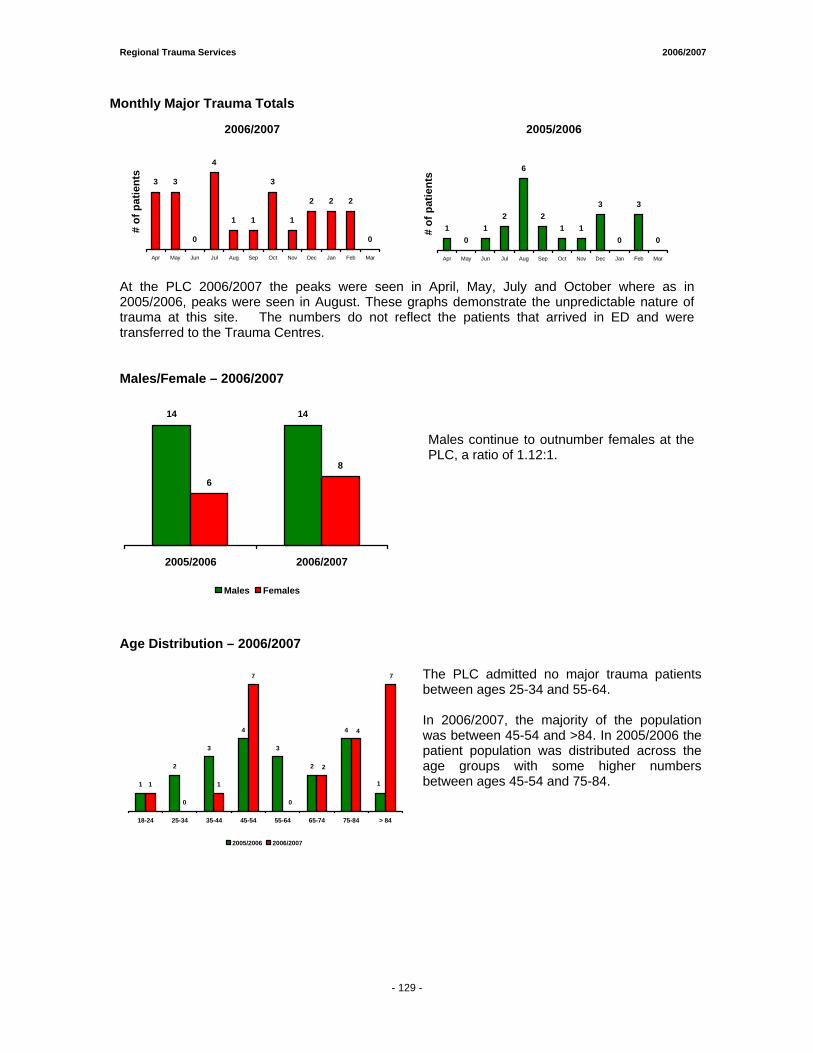
Regional Trauma Services 2006/2007
- 129 -
Monthly Major Trauma Totals
2006/2007
3 3
0
4
1 1
3
1
2 2 2
0
Apr May Jun Jul Aug Sep Oct Nov Dec Jan Feb Mar
# of
pat
ient
s
2005/2006
10
12
6
21 1
3
0
3
0
Apr May Jun Jul Aug Sep Oct Nov Dec Jan Feb Mar
# of
pat
ient
s
At the PLC 2006/2007 the peaks were seen in April, May, July and October where as in 2005/2006, peaks were seen in August. These graphs demonstrate the unpredictable nature of trauma at this site. The numbers do not reflect the patients that arrived in ED and were transferred to the Trauma Centres. Males/Female – 2006/2007
14 14
6
8
2005/2006 2006/2007
Males Females
Males continue to outnumber females at the PLC, a ratio of 1.12:1.
Age Distribution – 2006/2007
1
2
3
4
3
2
4
1
0
1
7
1
7
4
2
0
18-24 25-34 35-44 45-54 55-64 65-74 75-84 > 84
2005/2006 2006/2007
The PLC admitted no major trauma patients between ages 25-34 and 55-64. In 2006/2007, the majority of the population was between 45-54 and >84. In 2005/2006 the patient population was distributed across the age groups with some higher numbers between ages 45-54 and 75-84.
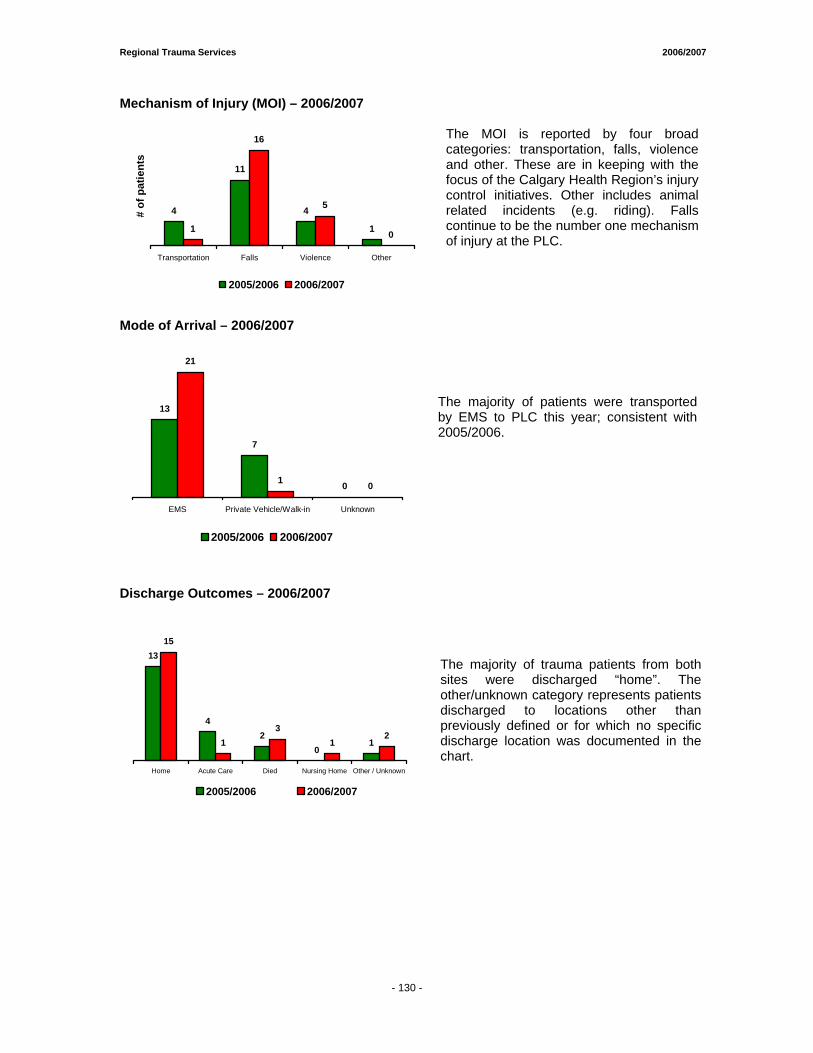
Regional Trauma Services 2006/2007
- 130 -
Mechanism of Injury (MOI) – 2006/2007
4
11
4
11
16
5
0
Transportation Falls Violence Other
# of
pat
ient
s
2005/2006 2006/2007
The MOI is reported by four broad categories: transportation, falls, violence and other. These are in keeping with the focus of the Calgary Health Region’s injury control initiatives. Other includes animal related incidents (e.g. riding). Falls continue to be the number one mechanism of injury at the PLC.
Mode of Arrival – 2006/2007
13
7
01 0
21
EMS Private Vehicle/Walk-in Unknown
2005/2006 2006/2007
The majority of patients were transported by EMS to PLC this year; consistent with 2005/2006.
Discharge Outcomes – 2006/2007
13
42
01
15
13
12
Home Acute Care Died Nursing Home Other / Unknown
2005/2006 2006/2007
The majority of trauma patients from both sites were discharged “home”. The other/unknown category represents patients discharged to locations other than previously defined or for which no specific discharge location was documented in the chart.
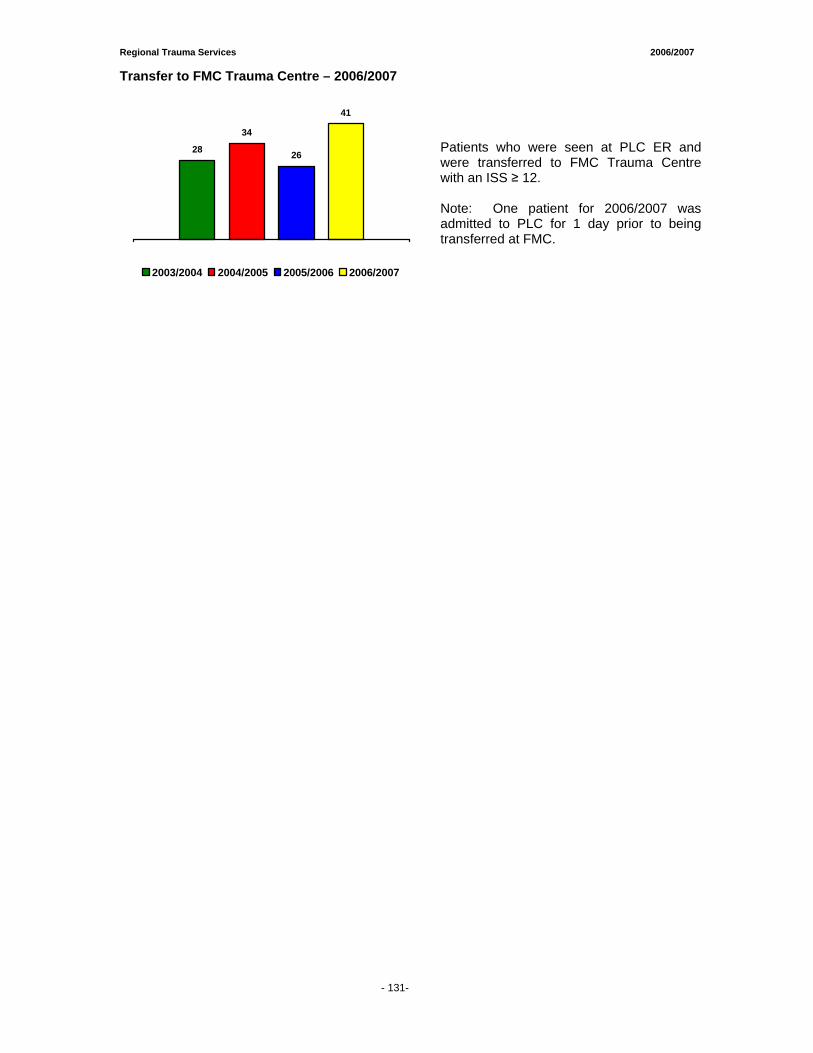
Regional Trauma Services 2006/2007
- 131-
Transfer to FMC Trauma Centre – 2006/2007
28
34
26
41
2003/2004 2004/2005 2005/2006 2006/2007
Patients who were seen at PLC ER and were transferred to FMC Trauma Centre with an ISS ≥ 12. Note: One patient for 2006/2007 was admitted to PLC for 1 day prior to being transferred at FMC.
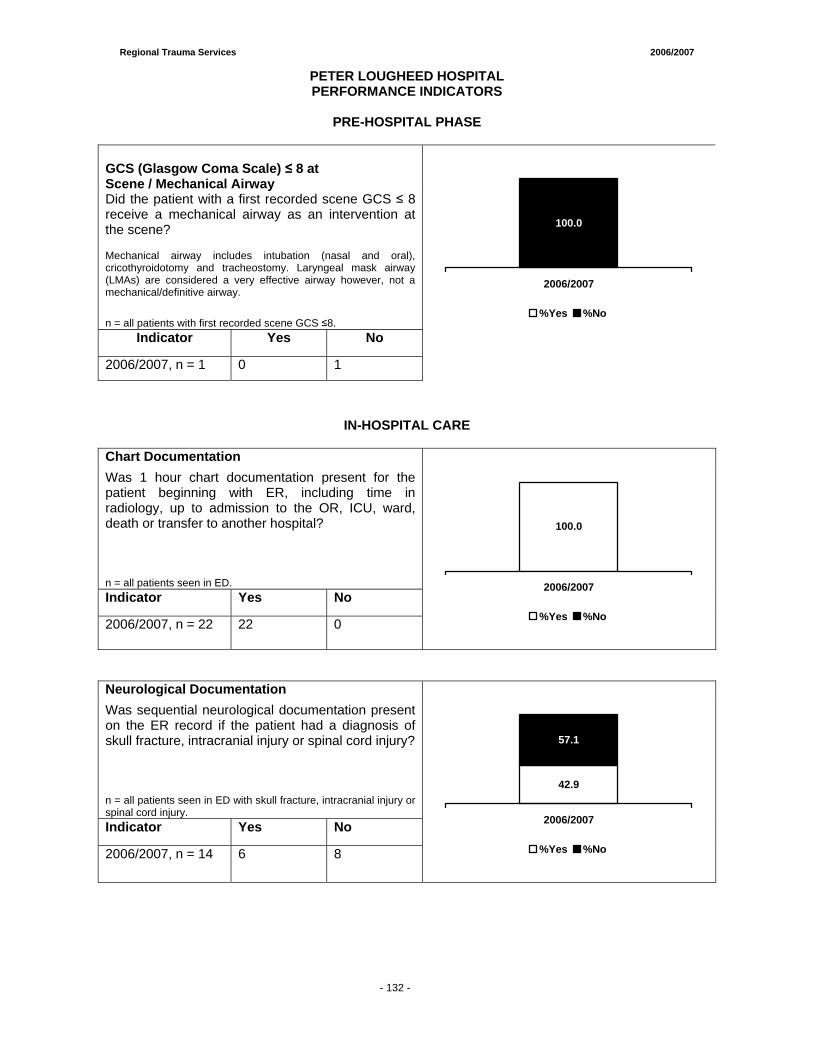
Regional Trauma Services 2006/2007
- 132 -
PETER LOUGHEED HOSPITAL PERFORMANCE INDICATORS
PRE-HOSPITAL PHASE
GCS (Glasgow Coma Scale) ≤ 8 at Scene / Mechanical Airway Did the patient with a first recorded scene GCS ≤ 8 receive a mechanical airway as an intervention at the scene? Mechanical airway includes intubation (nasal and oral), cricothyroidotomy and tracheostomy. Laryngeal mask airway (LMAs) are considered a very effective airway however, not a mechanical/definitive airway.
n = all patients with first recorded scene GCS ≤8. Indicator Yes No
2006/2007, n = 1 0 1
100.0
2006/2007
%Yes %No
IN-HOSPITAL CARE
Chart Documentation Was 1 hour chart documentation present for the patient beginning with ER, including time in radiology, up to admission to the OR, ICU, ward, death or transfer to another hospital? n = all patients seen in ED. Indicator Yes No
2006/2007, n = 22 22 0
100.0
2006/2007
%Yes %No
Neurological Documentation Was sequential neurological documentation present on the ER record if the patient had a diagnosis of skull fracture, intracranial injury or spinal cord injury? n = all patients seen in ED with skull fracture, intracranial injury or spinal cord injury. Indicator Yes No
2006/2007, n = 14 6 8
57.1
42.9
2006/2007
%Yes %No
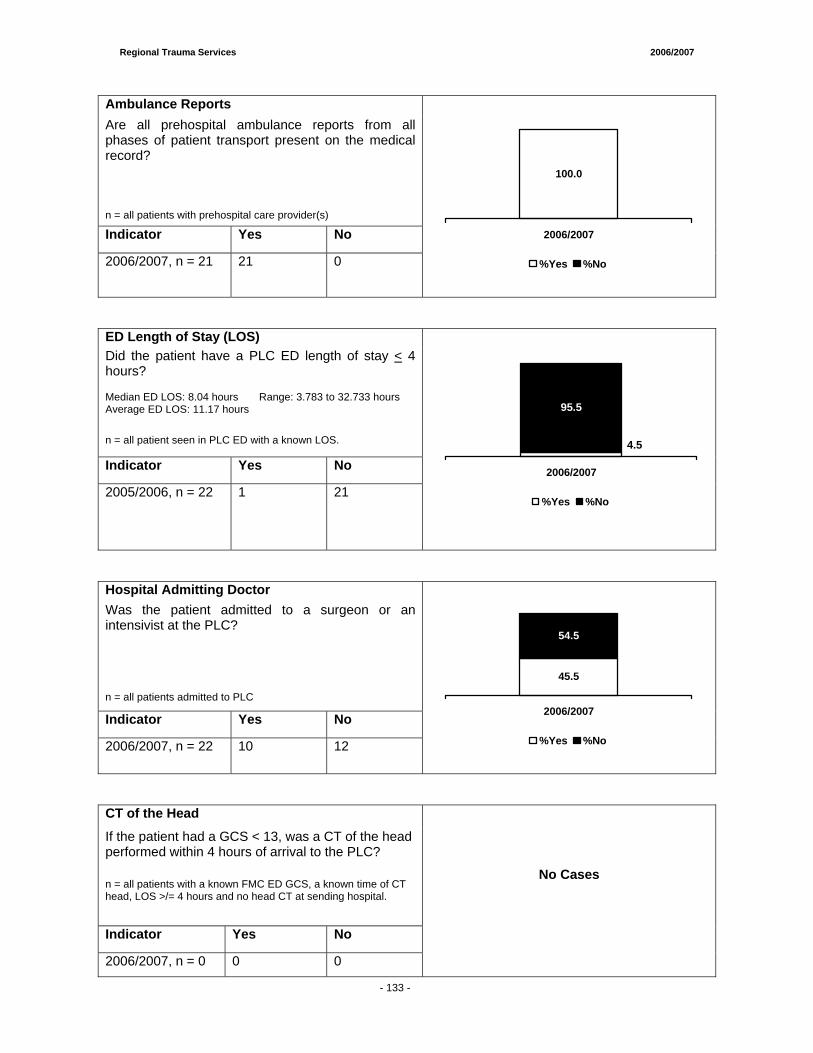
Regional Trauma Services 2006/2007
- 133 -
Ambulance Reports Are all prehospital ambulance reports from all phases of patient transport present on the medical record? n = all patients with prehospital care provider(s)
Indicator Yes No
2006/2007, n = 21 21 0
100.0
2006/2007
%Yes %No
ED Length of Stay (LOS) Did the patient have a PLC ED length of stay < 4 hours? Median ED LOS: 8.04 hours Range: 3.783 to 32.733 hours Average ED LOS: 11.17 hours
n = all patient seen in PLC ED with a known LOS.
Indicator Yes No
2005/2006, n = 22 1 21
4.5
95.5
2006/2007
%Yes %No
Hospital Admitting Doctor Was the patient admitted to a surgeon or an intensivist at the PLC? n = all patients admitted to PLC
Indicator Yes No
2006/2007, n = 22 10 12
54.5
45.5
2006/2007
%Yes %No
CT of the Head
If the patient had a GCS < 13, was a CT of the head performed within 4 hours of arrival to the PLC?
n = all patients with a known FMC ED GCS, a known time of CT head, LOS >/= 4 hours and no head CT at sending hospital.
Indicator Yes No
2006/2007, n = 0 0 0
No Cases
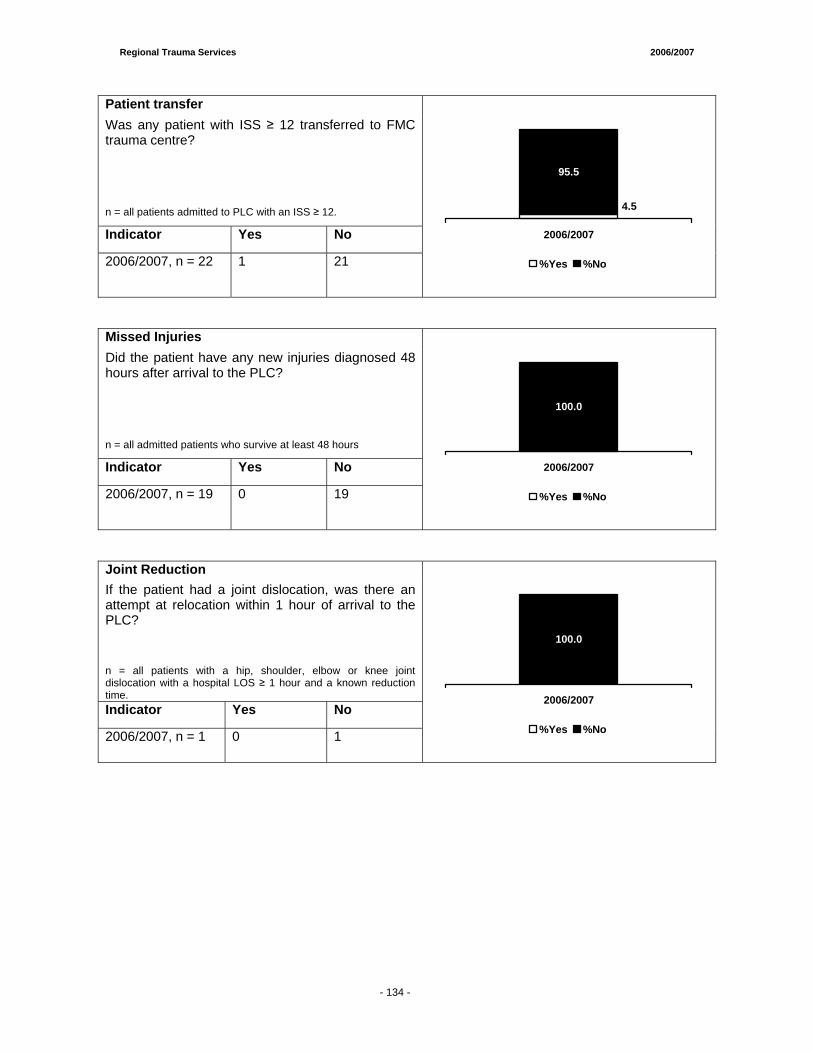
Regional Trauma Services 2006/2007
- 133 -
Patient transfer Was any patient with ISS ≥ 12 transferred to FMC trauma centre? n = all patients admitted to PLC with an ISS ≥ 12.
Indicator Yes No
2006/2007, n = 22 1 21
95.5
4.5
2006/2007
%Yes %No
Missed Injuries Did the patient have any new injuries diagnosed 48 hours after arrival to the PLC? n = all admitted patients who survive at least 48 hours
Indicator Yes No
2006/2007, n = 19 0 19
100.0
2006/2007
%Yes %No
Joint Reduction If the patient had a joint dislocation, was there an attempt at relocation within 1 hour of arrival to the PLC? n = all patients with a hip, shoulder, elbow or knee joint dislocation with a hospital LOS ≥ 1 hour and a known reduction time. Indicator Yes No
2006/2007, n = 1 0 1
100.0
2006/2007
%Yes %No
- 134 -
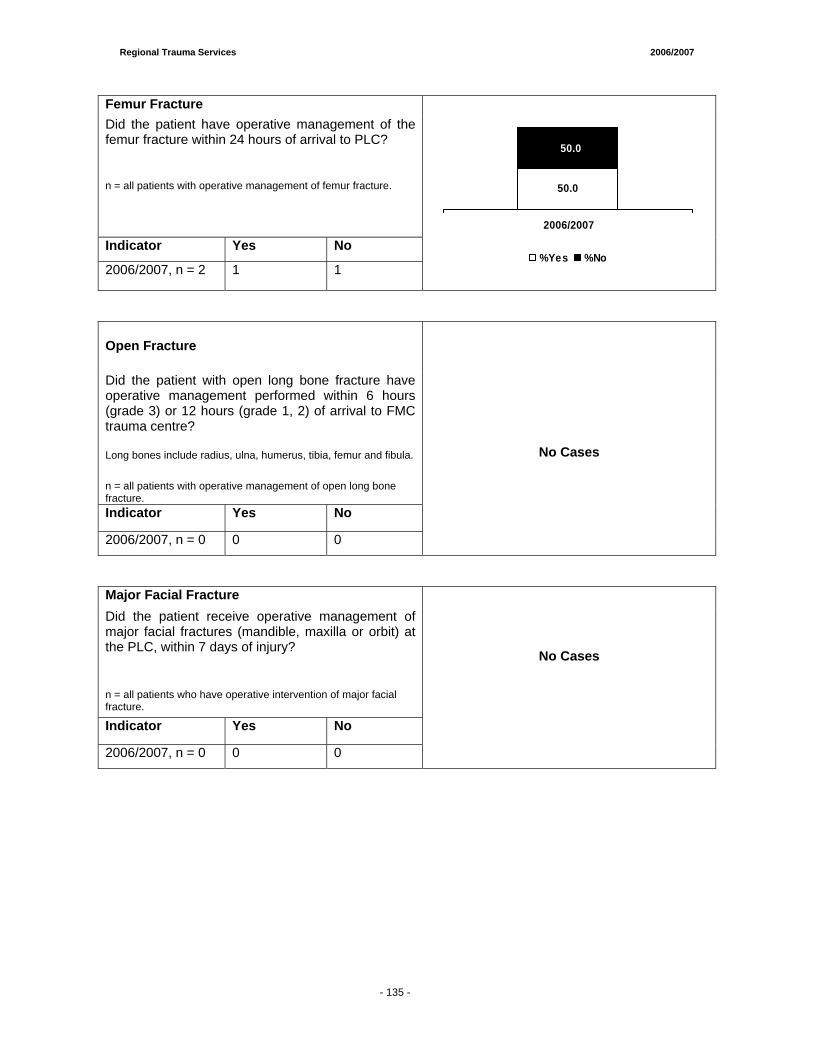
Regional Trauma Services 2006/2007
- 133 -
Femur Fracture Did the patient have operative management of the femur fracture within 24 hours of arrival to PLC? n = all patients with operative management of femur fracture.
Indicator Yes No
2006/2007, n = 2 1 1
50.0
50.0
2006/2007
%Yes %No
Open Fracture
Did the patient with open long bone fracture have operative management performed within 6 hours (grade 3) or 12 hours (grade 1, 2) of arrival to FMC trauma centre? Long bones include radius, ulna, humerus, tibia, femur and fibula.
n = all patients with operative management of open long bone fracture. Indicator Yes No
2006/2007, n = 0 0 0
No Cases
Major Facial Fracture Did the patient receive operative management of major facial fractures (mandible, maxilla or orbit) at the PLC, within 7 days of injury?
n = all patients who have operative intervention of major facial fracture.
Indicator Yes No
2006/2007, n = 0 0 0
No Cases
- 135 -
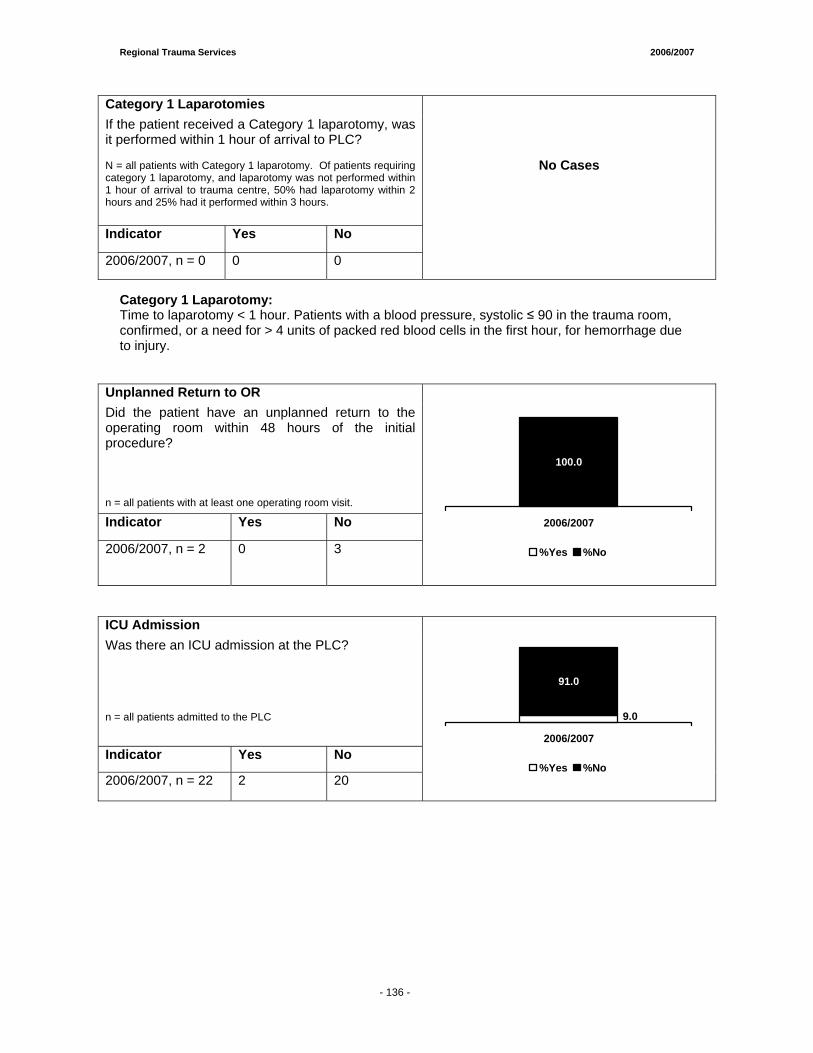
Regional Trauma Services 2006/2007
- 133 -
Category 1 Laparotomies If the patient received a Category 1 laparotomy, was it performed within 1 hour of arrival to PLC? N = all patients with Category 1 laparotomy. Of patients requiring category 1 laparotomy, and laparotomy was not performed within 1 hour of arrival to trauma centre, 50% had laparotomy within 2 hours and 25% had it performed within 3 hours.
Indicator Yes No
2006/2007, n = 0 0 0
No Cases
Category 1 Laparotomy: Time to laparotomy < 1 hour. Patients with a blood pressure, systolic ≤ 90 in the trauma room, confirmed, or a need for > 4 units of packed red blood cells in the first hour, for hemorrhage due to injury.
Unplanned Return to OR Did the patient have an unplanned return to the operating room within 48 hours of the initial procedure? n = all patients with at least one operating room visit.
Indicator Yes No
2006/2007, n = 2 0 3
0.0
100.0
2006/2007
%Yes %No
ICU Admission Was there an ICU admission at the PLC? n = all patients admitted to the PLC
Indicator Yes No
2006/2007, n = 22 2 20
91.0
9.0
2006/2007
%Yes %No
- 136 -
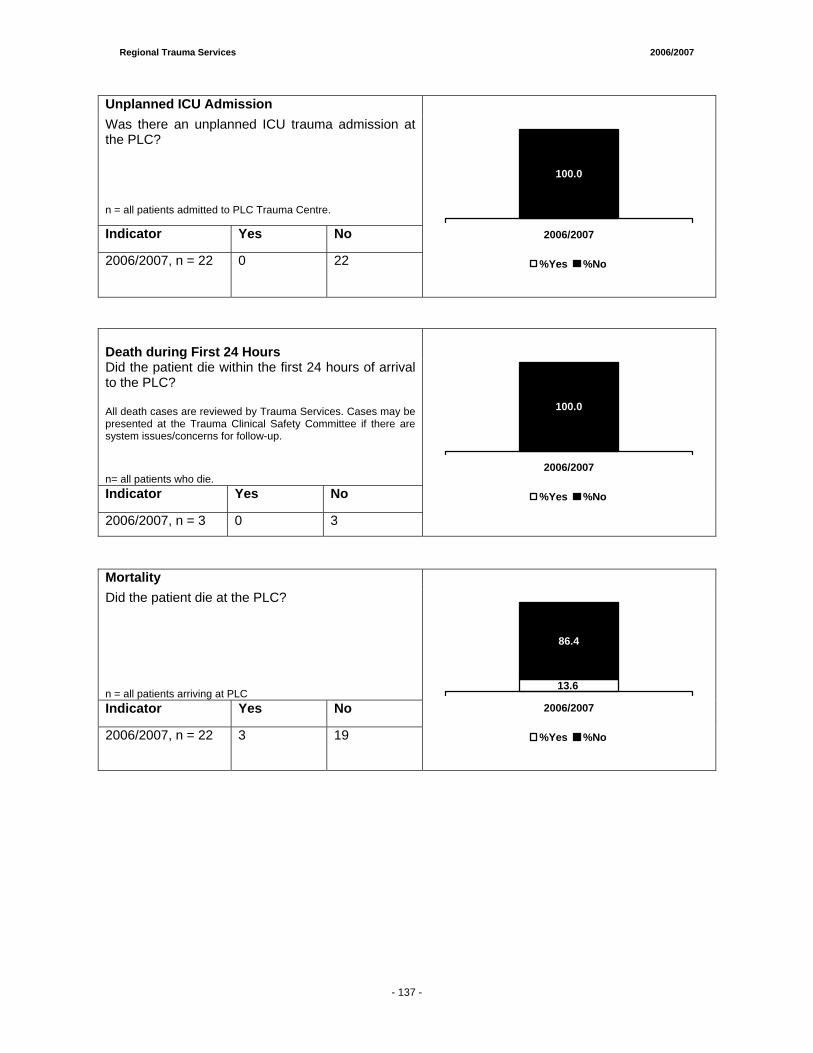
Regional Trauma Services 2006/2007
Unplanned ICU Admission Was there an unplanned ICU trauma admission at the PLC? n = all patients admitted to PLC Trauma Centre.
Indicator Yes No
2006/2007, n = 22 0 22
0.0
100.0
2006/2007
%Yes %No
Death during First 24 Hours Did the patient die within the first 24 hours of arrival to the PLC? All death cases are reviewed by Trauma Services. Cases may be presented at the Trauma Clinical Safety Committee if there are system issues/concerns for follow-up.
n= all patients who die. Indicator Yes No
2006/2007, n = 3 0 3
100.0
2006/2007
%Yes %No
Mortality Did the patient die at the PLC? n = all patients arriving at PLC Indicator Yes No
2006/2007, n = 22 3 19
86.4
13.6
2006/2007
%Yes %No
- 137 -
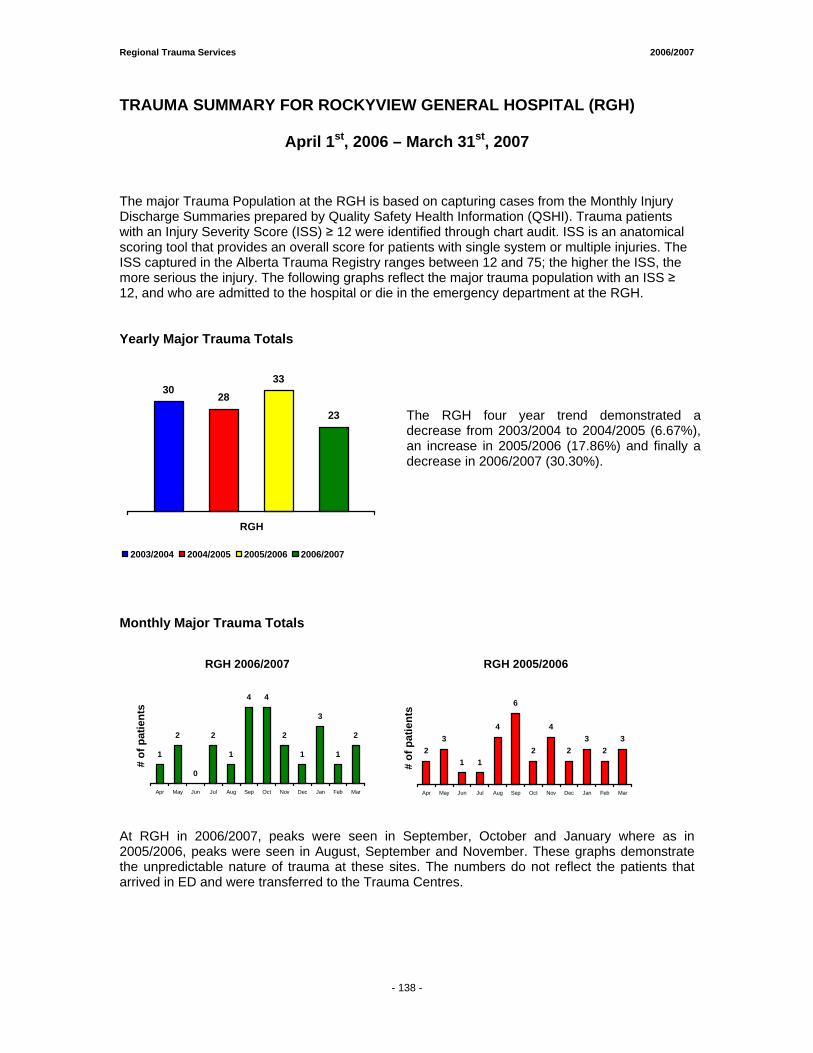
Regional Trauma Services 2006/2007
- 138 -
TRAUMA SUMMARY FOR ROCKYVIEW GENERAL HOSPITAL (RGH)
April 1st, 2006 – March 31st, 2007
The major Trauma Population at the RGH is based on capturing cases from the Monthly Injury Discharge Summaries prepared by Quality Safety Health Information (QSHI). Trauma patients with an Injury Severity Score (ISS) ≥ 12 were identified through chart audit. ISS is an anatomical scoring tool that provides an overall score for patients with single system or multiple injuries. The ISS captured in the Alberta Trauma Registry ranges between 12 and 75; the higher the ISS, the more serious the injury. The following graphs reflect the major trauma population with an ISS ≥ 12, and who are admitted to the hospital or die in the emergency department at the RGH. Yearly Major Trauma Totals
3028
33
23
RGH
2003/2004 2004/2005 2005/2006 2006/2007
The RGH four year trend demonstrated a decrease from 2003/2004 to 2004/2005 (6.67%), an increase in 2005/2006 (17.86%) and finally a decrease in 2006/2007 (30.30%).
Monthly Major Trauma Totals
RGH 2006/2007
1
2
0
2
1
4 4
2
1
3
1
2
Apr May Jun Jul Aug Sep Oct Nov Dec Jan Feb Mar
# of
pat
ient
s
RGH 2005/2006
23
1 1
4
6
2
4
23
23
Apr May Jun Jul Aug Sep Oct Nov Dec Jan Feb Mar
# of
pat
ient
s
At RGH in 2006/2007, peaks were seen in September, October and January where as in 2005/2006, peaks were seen in August, September and November. These graphs demonstrate the unpredictable nature of trauma at these sites. The numbers do not reflect the patients that arrived in ED and were transferred to the Trauma Centres.
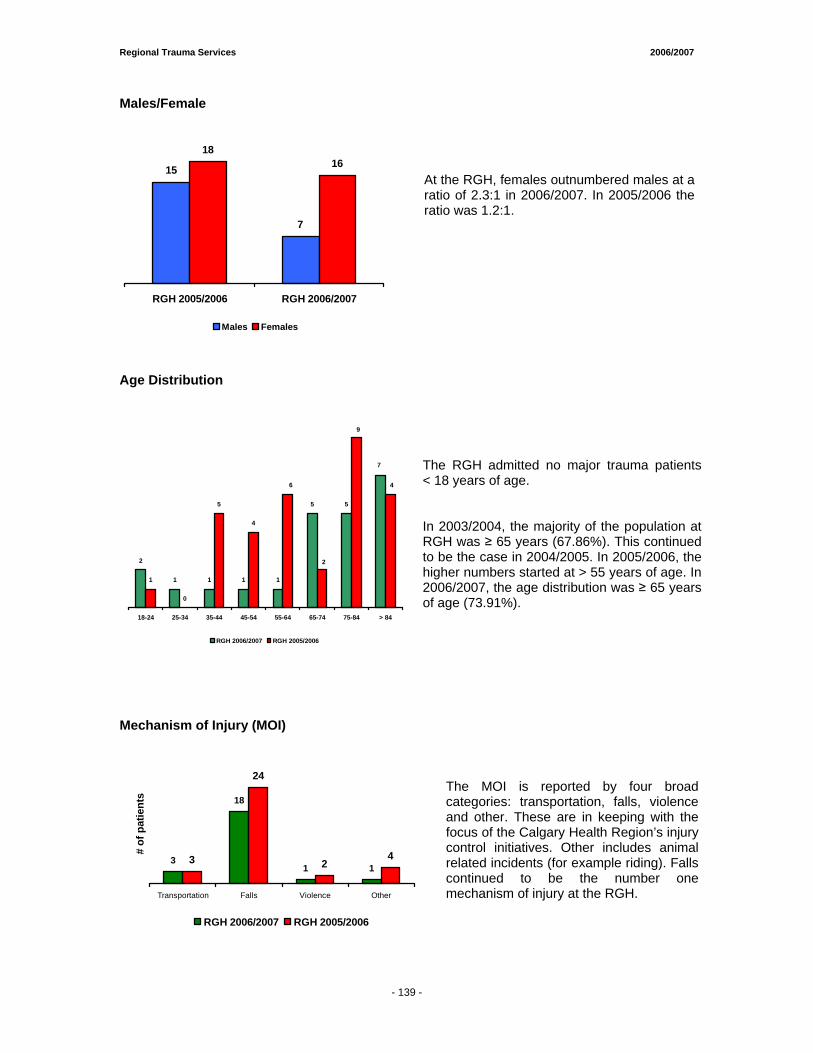
Regional Trauma Services 2006/2007
- 138 -
Males/Female
15
7
1816
RGH 2005/2006 RGH 2006/2007
Males Females
At the RGH, females outnumbered males at a ratio of 2.3:1 in 2006/2007. In 2005/2006 the ratio was 1.2:1.
Age Distribution
2
1 1 1 1
5 5
1
0
5
4
7
4
9
2
6
18-24 25-34 35-44 45-54 55-64 65-74 75-84 > 84
RGH 2006/2007 RGH 2005/2006
The RGH admitted no major trauma patients < 18 years of age. In 2003/2004, the majority of the population at RGH was ≥ 65 years (67.86%). This continued to be the case in 2004/2005. In 2005/2006, the higher numbers started at > 55 years of age. In 2006/2007, the age distribution was ≥ 65 years of age (73.91%).
Mechanism of Injury (MOI)
3
18
1 13
24
24
Transportation Falls Violence Other
# of
pat
ient
s
RGH 2006/2007 RGH 2005/2006
The MOI is reported by four broad categories: transportation, falls, violence and other. These are in keeping with the focus of the Calgary Health Region’s injury control initiatives. Other includes animal related incidents (for example riding). Falls continued to be the number one mechanism of injury at the RGH.
- 139 -
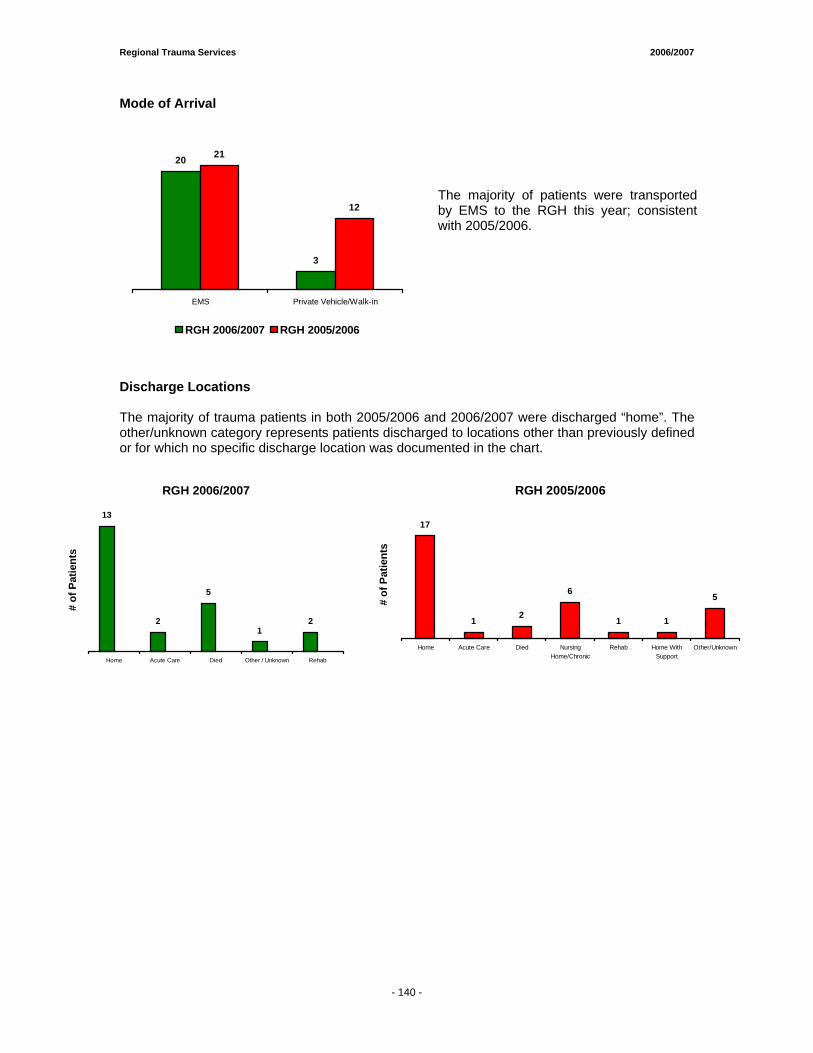
Regional Trauma Services 2006/2007
- 138 -
Mode of Arrival
20
3
12
21
EMS Private Vehicle/Walk-in
RGH 2006/2007 RGH 2005/2006
The majority of patients were transported by EMS to the RGH this year; consistent with 2005/2006.
Discharge Locations The majority of trauma patients in both 2005/2006 and 2006/2007 were discharged “home”. The other/unknown category represents patients discharged to locations other than previously defined or for which no specific discharge location was documented in the chart.
RGH 2006/2007
13
2
5
12
Home Acute Care Died Other / Unknown Rehab
# of
Pat
ient
s
RGH 2005/2006
17
1 2
6
1 1
5
Home Acute Care Died NursingHome/Chronic
Rehab Home WithSupport
Other/Unknown
# of
Pat
ient
s
- 140 -
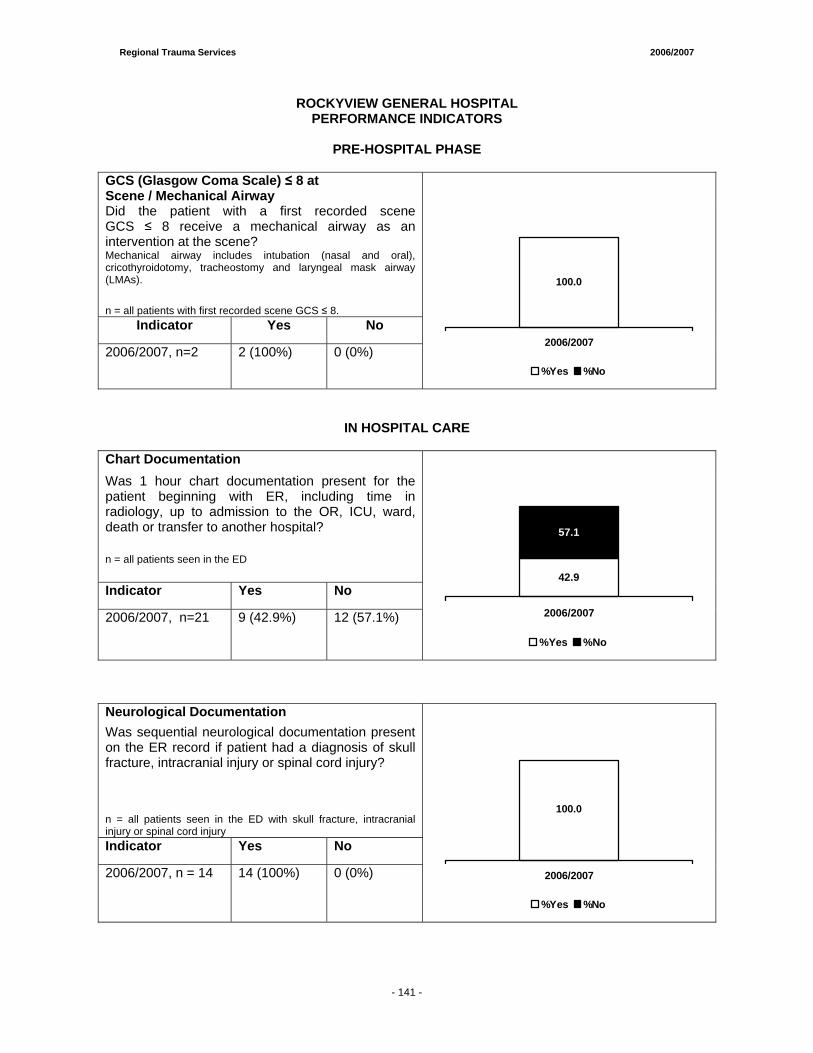
Regional Trauma Services 2006/2007
- 138 -
ROCKYVIEW GENERAL HOSPITAL PERFORMANCE INDICATORS
PRE-HOSPITAL PHASE
GCS (Glasgow Coma Scale) ≤ 8 at Scene / Mechanical Airway
Did the patient with a first recorded scene GCS ≤ 8 receive a mechanical airway as an intervention at the scene? Mechanical airway includes intubation (nasal and oral), cricothyroidotomy, tracheostomy and laryngeal mask airway (LMAs).
n = all patients with first recorded scene GCS ≤ 8. Indicator Yes No
2006/2007, n=2 2 (100%) 0 (0%)
100.0
0.0
2006/2007
%Yes %No
IN HOSPITAL CARE
Chart Documentation Was 1 hour chart documentation present for the patient beginning with ER, including time in radiology, up to admission to the OR, ICU, ward, death or transfer to another hospital?
n = all patients seen in the ED
Indicator Yes No
2006/2007, n=21 9 (42.9%) 12 (57.1%)
42.9
57.1
2006/2007
%Yes %No
Neurological Documentation Was sequential neurological documentation present on the ER record if patient had a diagnosis of skull fracture, intracranial injury or spinal cord injury? n = all patients seen in the ED with skull fracture, intracranial injury or spinal cord injury Indicator Yes No
2006/2007, n = 14 14 (100%) 0 (0%)
100.0
0.0
2006/2007
%Yes %No
- 141 -
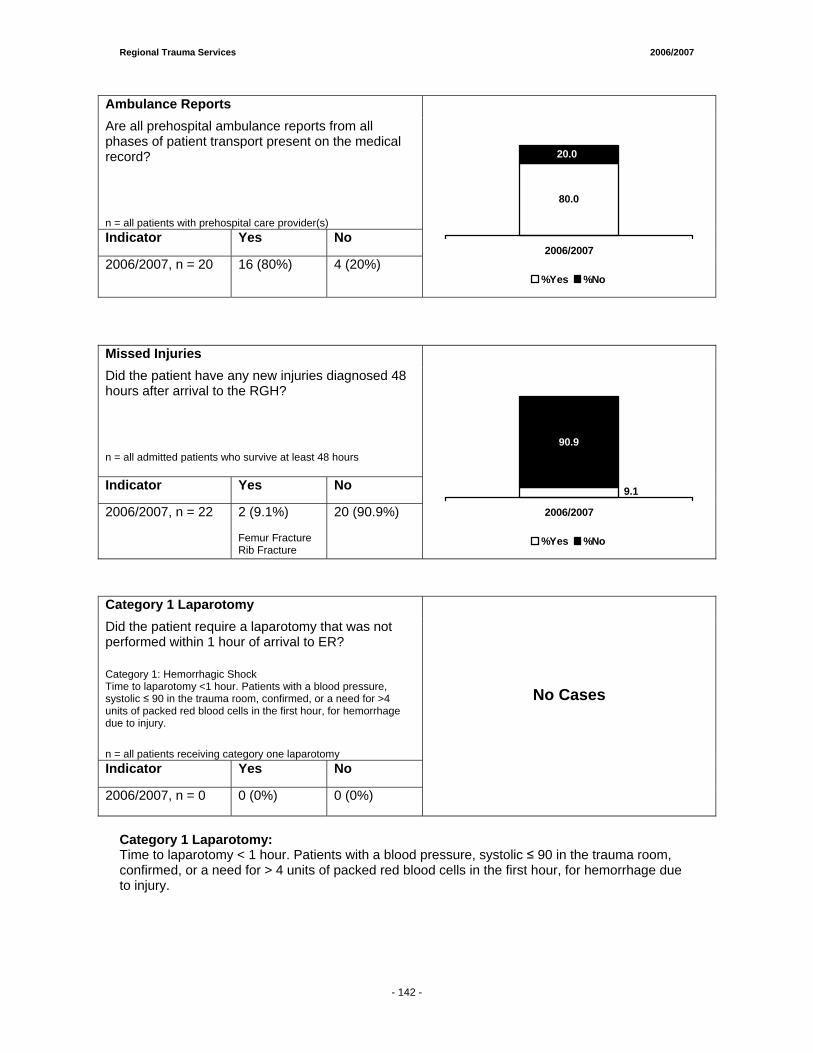
Regional Trauma Services 2006/2007
- 138 -
Ambulance Reports Are all prehospital ambulance reports from all phases of patient transport present on the medical record?
n = all patients with prehospital care provider(s) Indicator Yes No
2006/2007, n = 20 16 (80%) 4 (20%)
80.0
20.0
2006/2007
%Yes %No
Missed Injuries Did the patient have any new injuries diagnosed 48 hours after arrival to the RGH?
n = all admitted patients who survive at least 48 hours
Indicator Yes No
2006/2007, n = 22 2 (9.1%) Femur Fracture Rib Fracture
20 (90.9%)
9.1
90.9
2006/2007
%Yes %No
Category 1 Laparotomy Did the patient require a laparotomy that was not performed within 1 hour of arrival to ER?
Category 1: Hemorrhagic Shock Time to laparotomy <1 hour. Patients with a blood pressure, systolic ≤ 90 in the trauma room, confirmed, or a need for >4 units of packed red blood cells in the first hour, for hemorrhage due to injury.
n = all patients receiving category one laparotomy Indicator Yes No
2006/2007, n = 0 0 (0%) 0 (0%)
No Cases
Category 1 Laparotomy: Time to laparotomy < 1 hour. Patients with a blood pressure, systolic ≤ 90 in the trauma room, confirmed, or a need for > 4 units of packed red blood cells in the first hour, for hemorrhage due to injury.
- 142 -
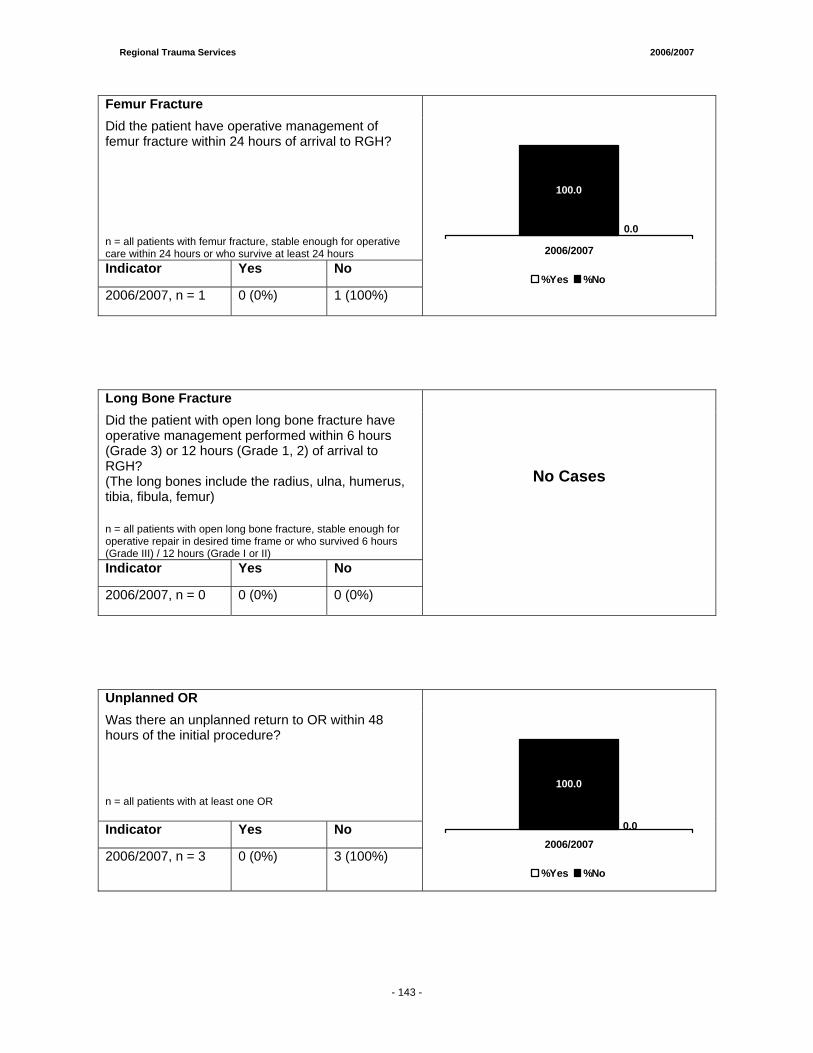
Regional Trauma Services 2006/2007
- 138 -
Femur Fracture Did the patient have operative management of femur fracture within 24 hours of arrival to RGH?
n = all patients with femur fracture, stable enough for operative care within 24 hours or who survive at least 24 hours Indicator Yes No
2006/2007, n = 1 0 (0%) 1 (100%)
0.0
100.0
2006/2007
%Yes %No
Long Bone Fracture Did the patient with open long bone fracture have operative management performed within 6 hours (Grade 3) or 12 hours (Grade 1, 2) of arrival to RGH? (The long bones include the radius, ulna, humerus, tibia, fibula, femur)
n = all patients with open long bone fracture, stable enough for operative repair in desired time frame or who survived 6 hours (Grade III) / 12 hours (Grade I or II) Indicator Yes No
2006/2007, n = 0 0 (0%) 0 (0%)
No Cases
Unplanned OR Was there an unplanned return to OR within 48 hours of the initial procedure?
n = all patients with at least one OR
Indicator Yes No
2006/2007, n = 3 0 (0%) 3 (100%)
0.0
100.0
2006/2007
%Yes %No
- 143 -
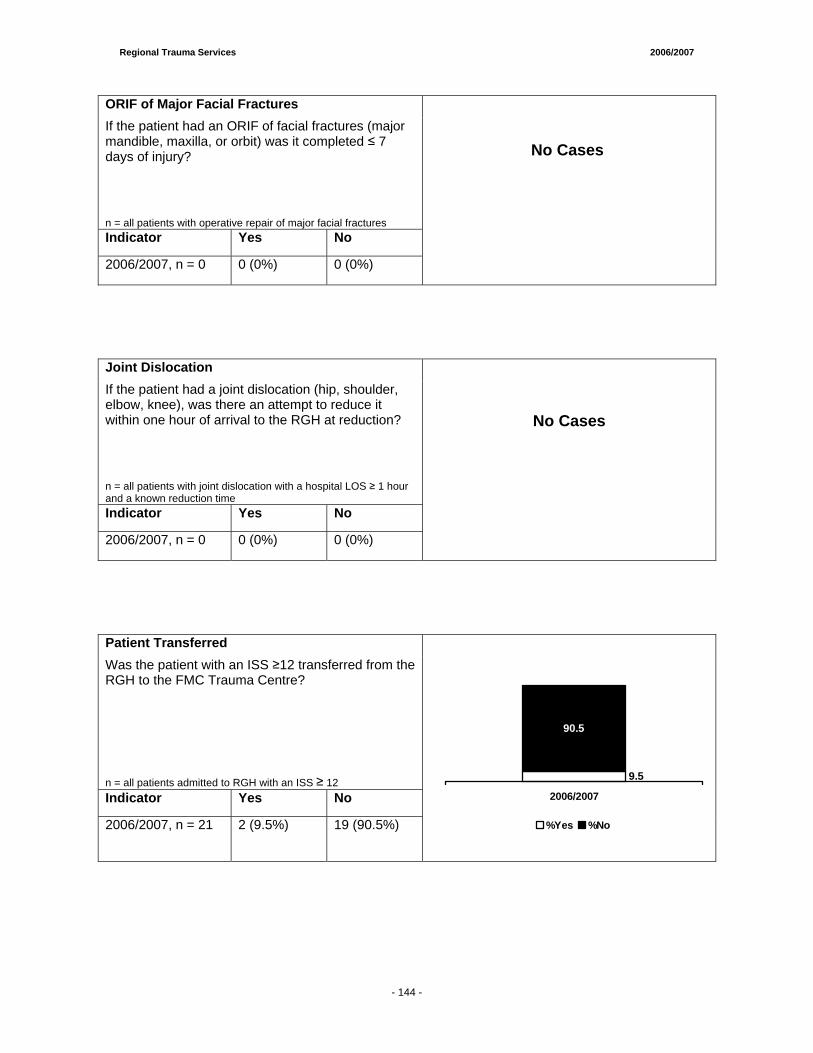
Regional Trauma Services 2006/2007
- 138 -
ORIF of Major Facial Fractures If the patient had an ORIF of facial fractures (major mandible, maxilla, or orbit) was it completed ≤ 7 days of injury?
n = all patients with operative repair of major facial fractures Indicator Yes No
2006/2007, n = 0 0 (0%) 0 (0%)
Joint Dislocation If the patient had a joint dislocation (hip, shoulder, elbow, knee), was there an attempt to reduce it within one hour of arrival to the RGH at reduction?
n = all patients with joint dislocation with a hospital LOS ≥ 1 hour and a known reduction time Indicator Yes No
2006/2007, n = 0 0 (0%) 0 (0%)
No Cases
Patient Transferred Was the patient with an ISS ≥12 transferred from the RGH to the FMC Trauma Centre?
n = all patients admitted to RGH with an ISS ≥ 12 Indicator Yes No
2006/2007, n = 21 2 (9.5%) 19 (90.5%)
9.5
90.5
2006/2007
%Yes %No
No Cases
- 144 -
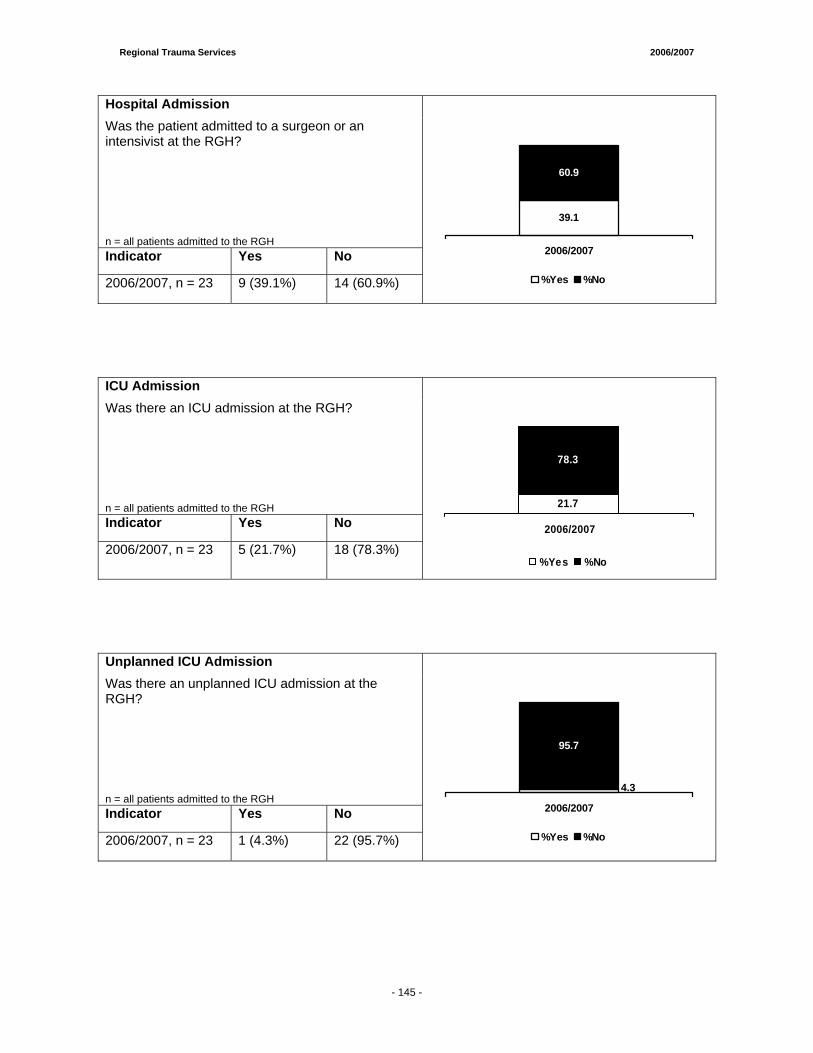
Regional Trauma Services 2006/2007
- 138 -
Hospital Admission Was the patient admitted to a surgeon or an intensivist at the RGH?
n = all patients admitted to the RGH Indicator Yes No
2006/2007, n = 23 9 (39.1%) 14 (60.9%)
39.1
60.9
2006/2007
%Yes %No
ICU Admission Was there an ICU admission at the RGH?
n = all patients admitted to the RGH Indicator Yes No
2006/2007, n = 23 5 (21.7%) 18 (78.3%)
21.7
78.3
2006/2007
%Yes %No
Unplanned ICU Admission Was there an unplanned ICU admission at the RGH?
n = all patients admitted to the RGH Indicator Yes No
2006/2007, n = 23 1 (4.3%) 22 (95.7%)
4.3
95.7
2006/2007
%Yes %No
- 145 -

Regional Trauma Services 2006/2007
- 138 -
CT of the Head If the patient had a GCS<13 (first recorded GCS at the RGH), was the CT of the head performed within 4 hours of arrival to the RGH?
n = all patients with a known RGH ED GCS<13 and a known time of CT head Indicator Yes No
2006/2007, n = 2 2 (100%) 0 (0%)
100.0
0.0
2006/2007
%Yes %No
Length of Stay Did the patient have a RGH ED length of stay ≤ 4 hours at the RGH?
Median: 15.17 hrs Average: 16.21 Range: Minimum = 1.53 hrs, Maximum = 46.07 hrs
n = all patients seen in RGH ED with a known ED LOS. Direct admissions were excluded Indicator Yes No
2006/2007, n = 19 1 (5.3%) 18 (94.7%)
5.3
94.7
2006/2007
%Yes %No
Mortality Did the patient die at the RGH?
n = all patients arriving at the RGH Indicator Yes No
2006/2007, n = 23 5 (21.7%) 18 (78.3%)
21.7
78.3
2006/2007
%Yes %No
- 146 -
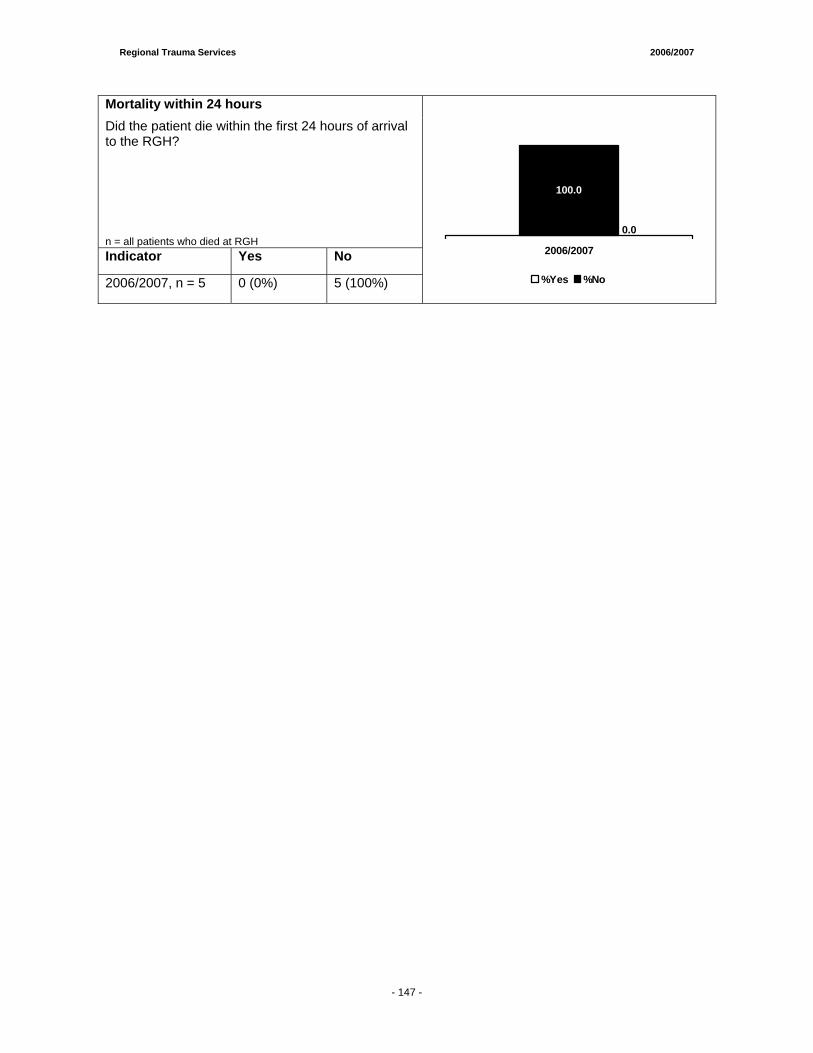
Regional Trauma Services 2006/2007
- 138 -
Mortality within 24 hours Did the patient die within the first 24 hours of arrival to the RGH?
n = all patients who died at RGH Indicator Yes No
2006/2007, n = 5 0 (0%) 5 (100%)
0.0
100.0
2006/2007
%Yes %No
- 147 -
The Imperative for Injury Prevention
Prepared by: Nancy Staniland, Manager Sherry Elnitsky, Research Project Coordinator February, 2008
Injury Prevention and Control Services Healthy Living, Wellness and Citizen Engagement http://www.calgaryhealthregion.ca/injuryprevetion

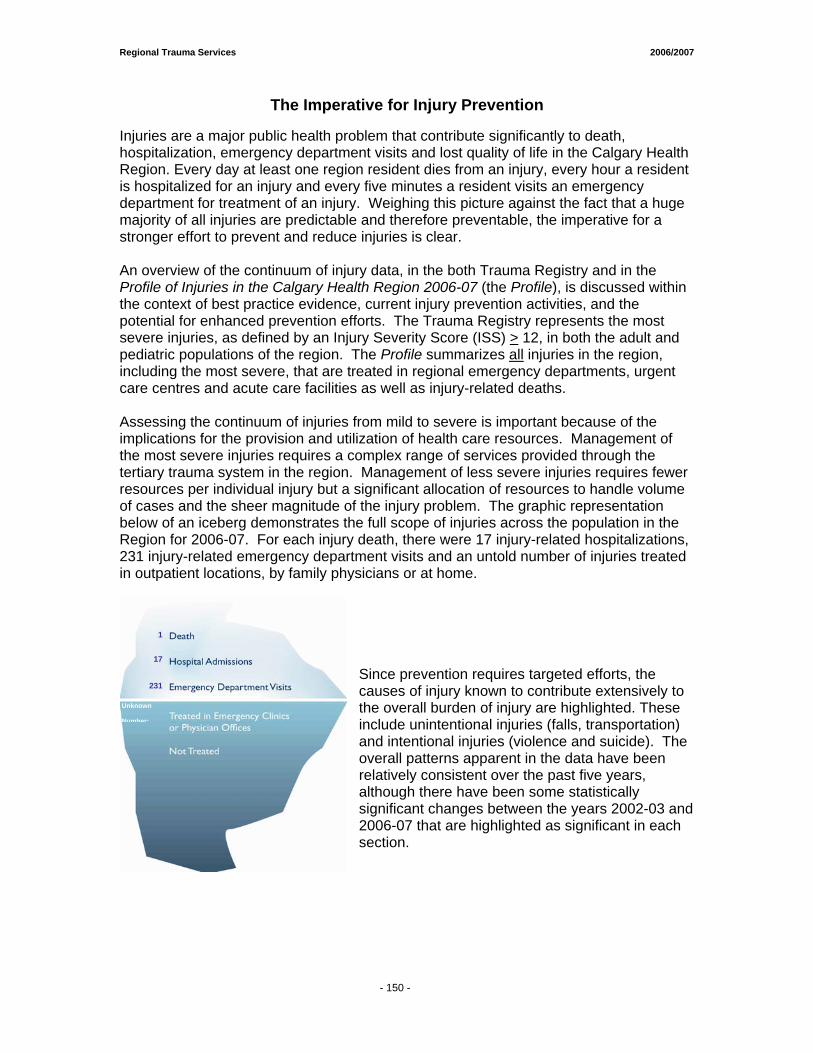
Regional Trauma Services 2006/2007
- 150 -
The Imperative for Injury Prevention
Injuries are a major public health problem that contribute significantly to death, hospitalization, emergency department visits and lost quality of life in the Calgary Health Region. Every day at least one region resident dies from an injury, every hour a resident is hospitalized for an injury and every five minutes a resident visits an emergency department for treatment of an injury. Weighing this picture against the fact that a huge majority of all injuries are predictable and therefore preventable, the imperative for a stronger effort to prevent and reduce injuries is clear. An overview of the continuum of injury data, in the both Trauma Registry and in the Profile of Injuries in the Calgary Health Region 2006-07 (the Profile), is discussed within the context of best practice evidence, current injury prevention activities, and the potential for enhanced prevention efforts. The Trauma Registry represents the most severe injuries, as defined by an Injury Severity Score (ISS) > 12, in both the adult and pediatric populations of the region. The Profile summarizes all injuries in the region, including the most severe, that are treated in regional emergency departments, urgent care centres and acute care facilities as well as injury-related deaths. Assessing the continuum of injuries from mild to severe is important because of the implications for the provision and utilization of health care resources. Management of the most severe injuries requires a complex range of services provided through the tertiary trauma system in the region. Management of less severe injuries requires fewer resources per individual injury but a significant allocation of resources to handle volume of cases and the sheer magnitude of the injury problem. The graphic representation below of an iceberg demonstrates the full scope of injuries across the population in the Region for 2006-07. For each injury death, there were 17 injury-related hospitalizations, 231 injury-related emergency department visits and an untold number of injuries treated in outpatient locations, by family physicians or at home.
Since prevention requires targeted efforts, the causes of injury known to contribute extensively to the overall burden of injury are highlighted. These include unintentional injuries (falls, transportation) and intentional injuries (violence and suicide). The overall patterns apparent in the data have been relatively consistent over the past five years, although there have been some statistically significant changes between the years 2002-03 and 2006-07 that are highlighted as significant in each section.
1
17
231
Unknown Number:
1
17
231
Unknown
Number:
Regional Trauma Services 2006/2007
- 150 -
Unintentional Injuries
Falls Falls have been the leading cause of injury across all age groups in the Region. In the most severe cases of injury, falls were the second leading mechanism after transportation. Fall-related emergency department visits were highest for the youngest and oldest segments of the population. Males were at greater risk in the younger age groups while females were more at risk for a fall-related emergency department visit in the older age groups. Fall-related injuries accounted for 75% of all injury-related hospitalizations for region residents 65 years of age and older and just over one third of these were due to a hip fracture. A hip fracture is a very serious and life altering event for an older adult, but these injuries are not typically represented in the Trauma Registry due to the nature of the injury severity scoring system. While the hospitalization rate related to fall injuries is significantly lower in 2006-07 compared to 2002-03, the emergency department visit rate is significantly higher. Falls result from a complex interaction of individual behavior in the context of the physical environment. Young children are particularly at risk due to their developmental level and the risks of their home and community environments, including the level and appropriateness of the supervision provided by their caregivers. Youth and adults are exposed to fall risks in sport and recreational activities as well as in employment conditions and circumstances. Older adults face a complex array of intrinsic and extrinsic factors which contribute to an increased risk of falls. As the relative proportion of individuals over 65 years of age increases in the Region, the burden of fall-related injuries and requirements for health care services will increase. Prevention of falls and fall-related injuries is not simple or straightforward but requires a range of actions across a variety of levels, from public policy through individual behavior change. For example, buildings that require window guards to prevent young children from falling out of open windows or from dislodging window screens are important and have been shown to be effective.1 Playgrounds that require resilient surfacing and a reduction in the overall height of the play structures also contribute to a reduction in fall injuries for children.2 Fall risks in the home are also significant and parents and caregivers require education and support to make the necessary modifications to keep young children safe through the use of stairgates and other safety equipment. Supervision of young children is an important fall prevention strategy and studies have indicated that many parents have unrealistic expectations about the appropriate level of supervision required.3 Falls and fall-related injury prevention in older adults is an area that has been studied extensively due to the magnitude and severity of the problem. Research has demonstrated that an assessment of an individual’s fall risk, fall history and review of modifiable and non-modifiable fall risk factors followed by a combination of interventions in an individualized care plan is effective.4 A very effective fall prevention strategy for independent, community dwelling older adults is the provision of exercise opportunities to maintain core strength and balance.5 Hip protectors are an important injury prevention strategy, especially for high risk, institutionalized older adults. Despite the benefit for older adults in other settings, hip protectors are not are not widely used.6
- 151 -
Regional Trauma Services 2006/2007
- 150 -
The Region has made a major commitment to fall and fall-related injury prevention in older adults through the establishment of the Regional Falls Project initiated in 2005. The project has designed and implemented a series of pilot projects across the continuum of care for older adults. In acute care, fall risk assessment and individualized care plans have been developed. In Home Care, a falls team has been established to provide specialized assessment and follow up for older adults who have experienced a fall or are at high risk of falling. In the community, core strength and balance exercise programs are being delivered in partnership with the City of Calgary to isolated, low income seniors. The Regional Falls Project has had limited capacity to undertake interventions in regional emergency departments or to support interventions in long term care settings. Additional funding for the project is required to expand the existing strategies and to initiate best practices that have not been implemented to date.
Transportation Transportation-related injuries are a significant problem in the Region, especially for residents between the ages of 15 and 44 years. Males in this age range were at least twice as likely as females to be hospitalized or visit an emergency department for transportation-related injuries. While a variety of transportation-related events (motor vehicle, cycling, pedestrian) contribute to the overall mortality and morbidity, the bulk of the transportation-related injury burden was due to motor vehicle- related events. Transportation-related events were the leading cause of the most severe injury and the second leading cause of injury overall. Utilization of emergency departments for transportation-related injuries is significantly higher in 2006-07 compared to 2002-03. Many factors likely contribute to this finding, including the high number of registered vehicles and drivers in the Region and the impact of motor vehicle use as a component of economic activity. Calgary and its surrounding municipalities have been growing steadily over the past several years with rapidly expanding populations and high levels of economic activity. Safe operation of a motor vehicle is a complex activity where driver behaviors interact with the physical, social and political environments that influence traffic safety. Increasing road users and intensity of economic activity, combined with social and technological influences in the driving environment, such as cell phones, contribute to the complexity and risk. There are a number of actions to reduce motor vehicle collisions which, when applied in combination, have demonstrated a reduction in injuries and deaths. Key strategies are required at both the policy and environmental level that will subsequently set the context for changes in individual driver behavior. Leading international examples, achieved through a combination of aggressive pubic policies, strengthened enforcement efforts, engineering and road design modifications and intensive public education,7 have documented a significant reduction in collisions, deaths and injuries. Policy actions which support safe transportation are a key injury prevention strategy. Opportunities exist to strengthen legislation around occupant restraints by adding demerits to seatbelt violations and by passing booster seat legislation. Both of these policy approaches have been shown to be effective in reducing injuries and deaths related to motor vehicle collisions.8,9 The Region works with diverse traffic safety partners in the Alberta Occupant Restraint Program (AORP) to plan and implement policy strategies. AORP also coordinates broad educational, enforcement and public awareness strategies in support of occupant restraints and the Region is a key contributor to these efforts. The level of sustained action on policy priorities amongst the
- 152 -
Regional Trauma Services 2006/2007
- 150 -
traffic safety partners in Alberta has unfortunately not been adequate to make any real progress in challenging the public policy environment of Alberta. Ironically, the position paper produced by AORP in support of booster seat legislation was successfully utilized in the effort by Prince Edward Island to implement booster seat legislation in that province which came into effect on January 1, 2008. An important opportunity at the provincial level, that would impact the burden of transportation injuries in the Region, is the potential to strengthen Graduated Driver Licensing (GDL), introduced in Alberta in 2003. There has been a documented reduction in collisions and injuries involving new, young drivers since the legislation was introduced.10 The national Traffic Injury Research Foundation (TIRF) has conducted extensive research into the impact of various GDL configurations and has established criteria for best practice in this area.11 A comparison of Alberta’s current GDL legislation with the best practices established by TIRF, completed by the Alberta Centre for Injury Control and Research (ACICR),12 has revealed that the current provincial legislation is lacking in following three key areas:
o a minimum number of supervised hours of driving practice in the Learner Phase o a passenger restriction in the Probationary Phase o a nighttime driving restriction in the Probationary Phase.
Implementation of strengthened GDL in Alberta is an important step towards maximizing the safety environment for new, young drivers in Alberta and an opportunity to achieve a further reduction in injuries and deaths. The Region has engaged with other health regions across the province and other injury prevention stakeholders to mobilize around enhanced GDL. A briefing document has been prepared on this issue for consideration by the newly established Regional Advocacy Advisory Committee. Injury Prevention and Control Services, part of Health Living, is leading the push for formalization of the regional support to strengthen GDL legislation in Alberta through development of a regional position paper and communication from the region to the provincial government. The Region has recently joined a growing number of organizations who have adopted policies banning the use of cell phones or other communication devices, including hands free devices, while driving on organizational business. The region’s Cellular and Cordless Telephone and Two Way Radio Use policy was updated January 1, 2008 to prohibit use of cellular telephone or PDA use by staff, either hand-held or hands-free, while driving a motor vehicle in the performance of their duties. This is an important achievement and sets the stage for further transportation safety related actions by the region. The Region is also working with provincial counterparts to implement the Alberta Traffic Safety Plan developed in 2006. As part of the plan, the provincial government has allocated resources for the establishment of a provincial Office of Traffic Safety and for the hiring of regional traffic safety coordinators in all health regions across the province and for First Nations and Metis Settlements. The Region has taken on the host organization role for the regional traffic safety coordinator position for the Calgary region. This new position will be overseen by the Office of Traffic Safety and will work closely with existing traffic safety stakeholders and networks in the region. Opportunities to advance the priorities of the Traffic Safety Plan in the Calgary region will be the focus of this new role.
- 153 -
Regional Trauma Services 2006/2007
- 150 -
Intentional Injuries
Violence Interpersonal violence is a significant injury mechanism in both the Trauma Registry and in the Regional Profile of Injuries. Violence is the third leading mechanism of injury resulting in an emergency department visit in the region and the fourth leading reason for hospitalization due to injury. Violence-related injuries were highest for residents between the ages of 15 and 44. Compared to females between 15 and 44 years of age, males were three to nine times more likely to be hospitalized for a violence-related injury and two to three times more likely to be seen in the emergency department for an injury resulting from violence. There is a significant increase in these injuries treated at emergency departments between 2002-03 and 2006-07. Calgary is growing into a major urban centre with a rapidly expanding population and there is increasing evidence of the social issues and pressures that accompany large cities. An increase in interpersonal violence is not necessarily surprising or unexpected. The economic surge of the Calgary and region economy is beneficial to many, but it also tends to widen the gap between the most and the least affluent members of the population. The increasing cost of some of the basic necessities of living, such as housing and food, make them unattainable for those living at the lowest economic level. Indicators such as the level of homelessness, poverty, use of shelters and food banks are all showing an upward trend.13 Another impact of the size of the city and the health of the economy is the attraction to known criminal elements that rely on the availability of disposable income to support illegal activities, such as the trafficking and sale of street drugs. Youth experience many influences through the media and popular culture and this may be contributing to the ‘normalization’ of interpersonal violence. Action across all sectors is needed to address the prevention of violence, including such areas as justice, policing, social services, infrastructure, education and health. There are many promising initiatives currently being undertaken such as the Calgary Police Service’s Gang Life Prevention Campaign, the WAIT initiative led by a group of high school students who are challenging their peers to Walk Away, Insure Tomorrow, school based initiatives aimed at identifying and eliminating bullying and urban planning initiatives that work to create safer environments through proactive urban design. The potential to prevent interpersonal violence, especially amongst youth and young adults, may be further strengthened through public policy initiatives which address the availability and consumption of alcohol through such measures as increasing the legal drinking age, controlling hours of operation of bars, nightclubs and liquor stores and the establishment of minimum drink prices.14 Evidence for the effectiveness of these measures has not been firmly established but definitely warrant further research and review.
Suicide In 2006-07, suicide was the second leading cause of injury-related death for region residents up to age 44 and the leading cause of injury-related death for region residents 45 years and over. Males were three times more likely than females to die by suicide. But suicide attempts that required emergency department visits or hospitalizations were higher among females, unlike the gender pattern seen in the other major causes of injury. There is a significant decrease in the use of emergency departments and hospitals for suicide-related injuries between 2002-03 and 2006-07.
- 154 -
Regional Trauma Services 2006/2007
- 150 -
Suicide is a complex issue and a wide variety of factors such as substance abuse, addiction, mental health issues, sexual orientation, culture and family history can all contribute to the risk for suicide in any given individual. The Alberta Suicide Prevention Strategy was developed in 2005 to provide the framework for coordinated action across multiple sectors and with many diverse stakeholders. The strategy identifies eight broad goals which reflect the best evidence for development of a comprehensive system to prevent and limit the impact of suicide across the province. Key goal areas include activities to enhance mental health, improved intervention and treatment for those at risk of suicide or affected by suicide, increasing effort to reduce access to lethal means of suicide and increased research and surveillance.15
The Region has undertaken a number of key initiatives which align with the provincial suicide prevention strategy, including a major focus on suicide postvention and support for survivors. Research indicates that those who have lost a loved one through suicide are at risk for complicated grieving and are themselves at higher risk for suicide.16 Postvention protocols for follow up with survivors are in place within the Mental Health Program areas. A number of resources have been developed such as Hope and Healing: A Practical Guide for Survivors of Suicide which has also been redeveloped into an aboriginal version entitled Healing Your Spirit: Surviving After the Suicide of a Loved One. Processes and connections with key community partners such as bereavement support groups and the medical examiner’s office have been established to facilitate distribution of the postvention support materials. Another current regional focus is on men at risk for suicide, based on the evidence that men complete suicide at a much higher rate than women and also that they do not readily seek help for mental or emotional health issues through the typical channels.17 Other opportunities exist for the region to create a more supportive environment for suicide prevention and intervention, including enhanced screening for suicide risk across all care settings of the region. Availability and accessibility of mental health services, treatment for addictions, affordable counseling and follow up of individuals at risk is a persistent challenge and strategies to increase the system capacity must be found.
Conclusion and Recommendations The development and release of the Alberta Injury Control Strategy18 was the culmination of many months of consultation with a broad range of stakeholders across many sectors. It consolidates the evidence on prevention and control of injuries and provides wide sweeping recommendations for coordinated provincial action on injuries. Since the document was released in June 2003, several attempts have been made to have the strategy formally endorsed at the provincial government level. To date, this endorsement has not been achieved. The document outlines seven strategic goals with corresponding objectives and recommended actions. There are also key responsibilities for the various sectors outlined, including specific responsibilities for health authorities. The Region has made a significant and sustained commitment to injury prevention and control over many years and is fulfilling many of the responsibilities outlined in the strategy, including programs and services to prevent, treat and rehabilitate injuries. There are, however, some responsibilities that the region has not yet undertaken in a significant way.
- 155 -
Regional Trauma Services 2006/2007
- 150 -
The cost of preventing injuries is small compared to the staggering cost of treating and rehabilitating them but preventing injuries cannot be achieved without resource allocation beyond the current level. With the increasing demand for emergency and acute care services in the region and the escalating costs associated with these areas, the region has a prime opportunity to review if the existing investments being made to prevent and limit injuries are adequate for the size and impact of the problem. Based on the Alberta Injury Control Strategy, some distinct areas of responsibility for the region that could reduce the demand on services are as follows:
1. Establish a regional agenda for advocacy on key public policies that would strengthen injury prevention efforts and link these to appropriate municipal, provincial and federal levels of government.
2. Evaluate opportunities to engage in new partnerships and new funding approaches which focus resources on limiting the circumstances that create injury (e.g., joint strategies to reduce impaired driving in collaboration with enforcement groups). Allocate additional financial and human resources to provide effective injury prevention programs in collaboration with other community based injury prevention stakeholders. (e.g., expand the provision of fall prevention exercise programs at the community level for older adults).
3. Evaluate opportunities to integrate primary and secondary injury prevention information and resources into all clinical practice areas and interactions, including injury risk screening and appropriate referral. Formalization of an injury prevention program at the Alberta Children’s Hospital would be an important first step. Another example is the funding and establishment of a Brief Intervention Program on FMC Trauma Unit for the screening for alcohol related injury risk. This program is called “Alcohol Screening and Brief Intervention”, from the National Institute on Alcohol Abuse and Alcoholism, USA and is designed to help patients related alcohol use to the trauma event they have experienced. This type of screening is an accreditation standard for Level 1 Trauma Centres, under the Trauma Association of Canada guidelines.
4. Educate and train the Region workforce to integrate injury prevention strategies into their workplaces, methods of working and personal lives.
5. Engage the evaluation and research resources of the region and of community partners to monitor progress on injury prevention priorities.
- 156 -
Regional Trauma Services 2006/2007
- 150 -
References 1 Pressley, J and Barlow, B. (2005). Child and adolescent injury as a result of falls
from buildings and structures. Injury Prevention: 11 (5), 267-73.
2 Laforest, S., Robitaille, Y., Lesage, D., Dorval, D. (2001). Surface characteristics, equipment height, and the occurrence and severity of playground injuries. Injury Prevention: 7 (1), 35-40.
3 Morrongiello, Barbara (January 2008). Child Injuries are Not “Accidents”: Parent
and Child Factors Affect Risk of Unintentional Injury. Teleconference presentation on unpublished research findings as part of the ACICR teleconference series, January 8, 2008.
4 Campbell, A.J. & Robertson, M.C. (2007). Rethinking individual and community fall prevention strategies: A meta-regression comparing single and multifactorial interventions. Age and Ageing: 36, 656-662.
5 Ibid. 6 Holzer, G. & Holzer, L.A. (2007). Hip protectors and prevention of hip fractures in
older persons. Geriatrics: 62 (18), 15-20.
7 Alberta Government (October 2006). Alberta Traffic Safety Plan: Saving Lives on Alberta’s Roads.
8 Alberta Occupant Restraint Program (AORP). (December 2005). The Introduction
of Demerit Points to Increase Compliance with Seat Belt and Child Safety Seat Legislation in Alberta.
9 Weber, K. (2000). Crash protection for child passengers: A review of best practice. UMTRI Research Review: 31(3).
10 Alberta Infrastructure & Transportation. (2007). Collision Statistics, 2000 through
2006. Retrieved February 1, 2008 from http://www.acicr.ualberta.ca.
11 Alberta Centre for Injury Control and Research. (2007): Comparison of Alberta’s GDL Program with Recommended Best Practices. Retrieved February 1, 2008 from http://www.acicr.ualberta.ca
12 Alberta Centre for Injury Control and Research (2007). Call to Action: Improve Alberta’s GDL Program. Retrieved February 1, 2008 from http://www.acicr.ualberta.ca.
13 Vibrant Communities Calgary (2008). Winter 2008 Newsletter. Volume 4, Issue 1 14 Vingilis E. (2007). Limits on Hours of Sales and Service: Effects on Traffic Safety.
Transportation Research Circular: E-C123, 120-129.
15 Alberta Mental Health Board. (2005). A Call to Action: The Alberta Suicide Prevention Strategy.
- 157 -
Regional Trauma Services 2006/2007
- 150 -
16 Ibid . 17 Centre for Suicide Prevention. (2007). Men and Suicide, Part 1: Risk Factors.
SIEC Alert #65, April.
18 Alberta Centre for Injury Control and Research. (2003). Alberta Injury Control Strategy.
- 158 -

The City of Calgary Emergency Medical Services
TTrraauummaa RReeppoorrtt January 1, 2006 – December 31, 2006

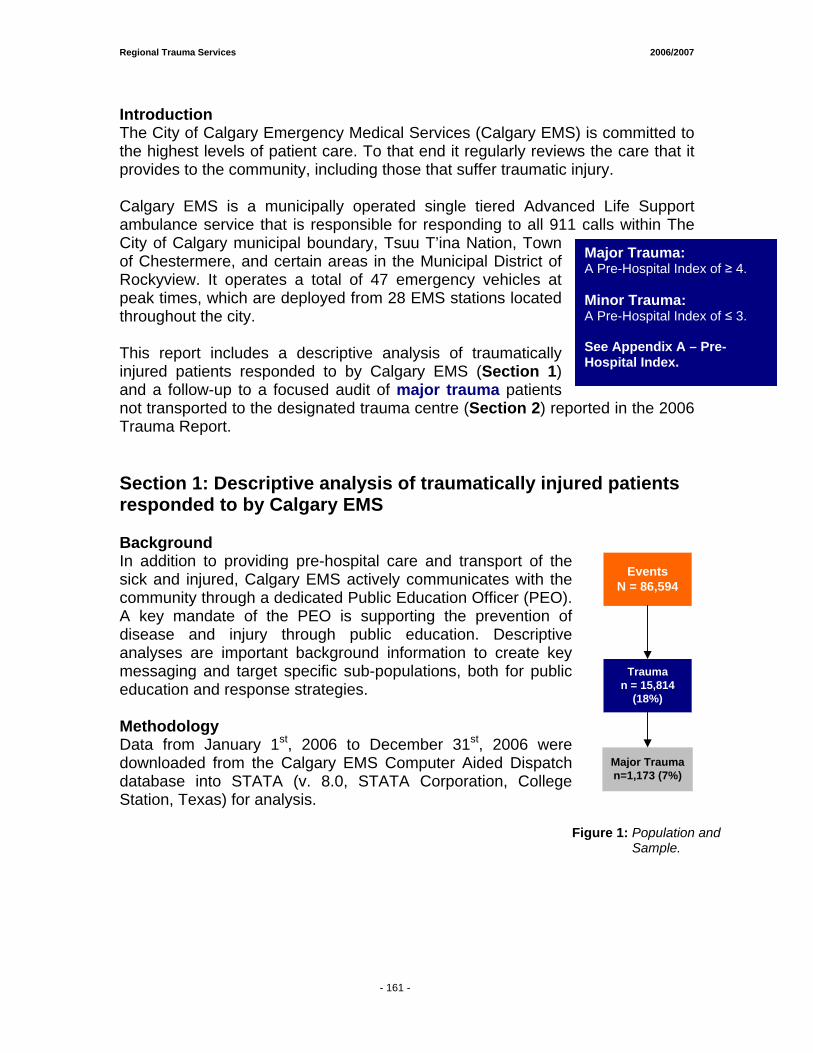
Regional Trauma Services 2006/2007
- 161 -
Introduction The City of Calgary Emergency Medical Services (Calgary EMS) is committed to the highest levels of patient care. To that end it regularly reviews the care that it provides to the community, including those that suffer traumatic injury. Calgary EMS is a municipally operated single tiered Advanced Life Support ambulance service that is responsible for responding to all 911 calls within The City of Calgary municipal boundary, Tsuu T’ina Nation, Town of Chestermere, and certain areas in the Municipal District of Rockyview. It operates a total of 47 emergency vehicles at peak times, which are deployed from 28 EMS stations located throughout the city. This report includes a descriptive analysis of traumatically injured patients responded to by Calgary EMS (Section 1) and a follow-up to a focused audit of major trauma patients not transported to the designated trauma centre (Section 2) reported in the 2006 Trauma Report. Section 1: Descriptive analysis of traumatically injured patients responded to by Calgary EMS Background In addition to providing pre-hospital care and transport of the sick and injured, Calgary EMS actively communicates with the community through a dedicated Public Education Officer (PEO). A key mandate of the PEO is supporting the prevention of disease and injury through public education. Descriptive analyses are important background information to create key messaging and target specific sub-populations, both for public education and response strategies. Methodology Data from January 1st, 2006 to December 31st, 2006 were downloaded from the Calgary EMS Computer Aided Dispatch database into STATA (v. 8.0, STATA Corporation, College Station, Texas) for analysis.
Figure 1: Population and Sample.
Major Trauma: A Pre-Hospital Index of ≥ 4. Minor Trauma: A Pre-Hospital Index of ≤ 3. See Appendix A – Pre-Hospital Index.
EventsN = 86,594
Trauman = 15,814
(18%)
Major Trauman=1,173 (7%)
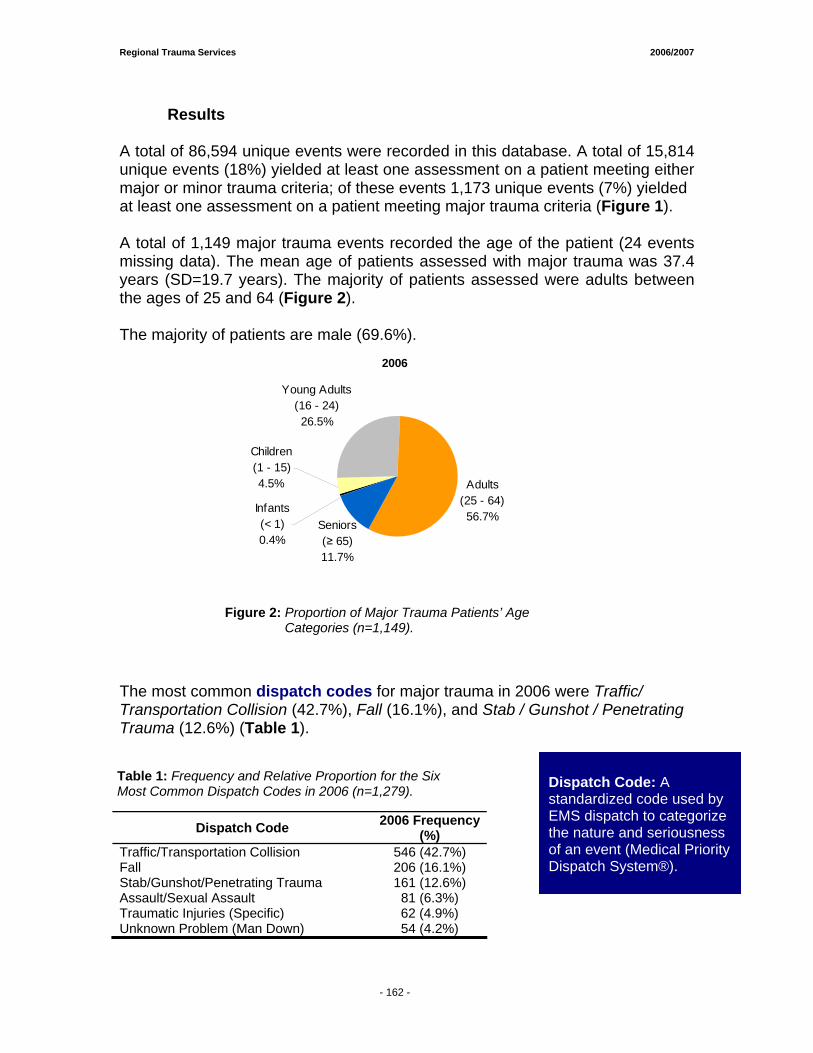
Regional Trauma Services 2006/2007
- 161 -
Results A total of 86,594 unique events were recorded in this database. A total of 15,814 unique events (18%) yielded at least one assessment on a patient meeting either major or minor trauma criteria; of these events 1,173 unique events (7%) yielded at least one assessment on a patient meeting major trauma criteria (Figure 1). A total of 1,149 major trauma events recorded the age of the patient (24 events missing data). The mean age of patients assessed with major trauma was 37.4 years (SD=19.7 years). The majority of patients assessed were adults between the ages of 25 and 64 (Figure 2). The majority of patients are male (69.6%).
2006
Young Adults(16 - 24)26.5%
Adults(25 - 64)56.7%
Infants(< 1)0.4%
Children(1 - 15)4.5%
Seniors (≥ 65)11.7%
The most common dispatch codes for major trauma in 2006 were Traffic/ Transportation Collision (42.7%), Fall (16.1%), and Stab / Gunshot / Penetrating Trauma (12.6%) (Table 1).
Dispatch Code 2006 Frequency (%)
Traffic/Transportation Collision 546 (42.7%) Fall 206 (16.1%) Stab/Gunshot/Penetrating Trauma 161 (12.6%) Assault/Sexual Assault 81 (6.3%) Traumatic Injuries (Specific) 62 (4.9%) Unknown Problem (Man Down) 54 (4.2%)
Table 1: Frequency and Relative Proportion for the Six Most Common Dispatch Codes in 2006 (n=1,279).
Dispatch Code: A standardized code used by EMS dispatch to categorize the nature and seriousness of an event (Medical Priority Dispatch System®).
Figure 2: Proportion of Major Trauma Patients’ Age Categories (n=1,149).
- 162 -
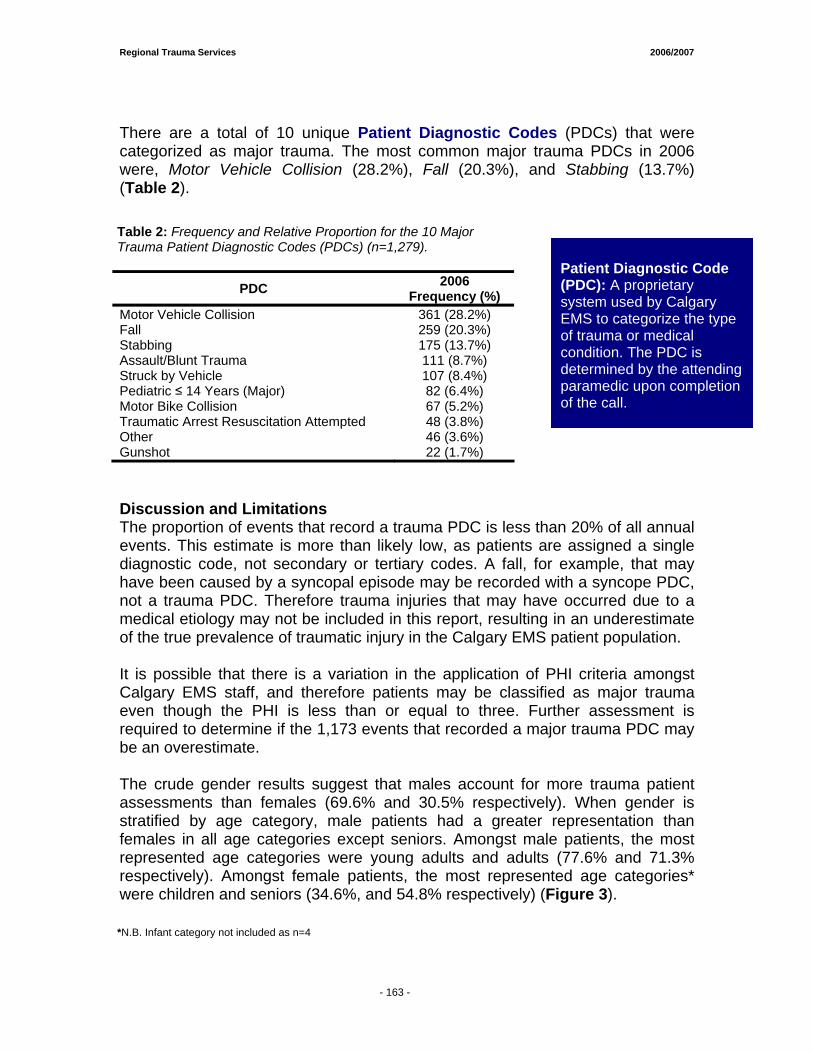
Regional Trauma Services 2006/2007
- 161 -
There are a total of 10 unique Patient Diagnostic Codes (PDCs) that were categorized as major trauma. The most common major trauma PDCs in 2006 were, Motor Vehicle Collision (28.2%), Fall (20.3%), and Stabbing (13.7%) (Table 2).
PDC 2006 Frequency (%)
Motor Vehicle Collision 361 (28.2%) Fall 259 (20.3%) Stabbing 175 (13.7%) Assault/Blunt Trauma 111 (8.7%) Struck by Vehicle 107 (8.4%) Pediatric ≤ 14 Years (Major) 82 (6.4%) Motor Bike Collision 67 (5.2%) Traumatic Arrest Resuscitation Attempted 48 (3.8%) Other 46 (3.6%) Gunshot 22 (1.7%) Discussion and Limitations The proportion of events that record a trauma PDC is less than 20% of all annual events. This estimate is more than likely low, as patients are assigned a single diagnostic code, not secondary or tertiary codes. A fall, for example, that may have been caused by a syncopal episode may be recorded with a syncope PDC, not a trauma PDC. Therefore trauma injuries that may have occurred due to a medical etiology may not be included in this report, resulting in an underestimate of the true prevalence of traumatic injury in the Calgary EMS patient population. It is possible that there is a variation in the application of PHI criteria amongst Calgary EMS staff, and therefore patients may be classified as major trauma even though the PHI is less than or equal to three. Further assessment is required to determine if the 1,173 events that recorded a major trauma PDC may be an overestimate. The crude gender results suggest that males account for more trauma patient assessments than females (69.6% and 30.5% respectively). When gender is stratified by age category, male patients had a greater representation than females in all age categories except seniors. Amongst male patients, the most represented age categories were young adults and adults (77.6% and 71.3% respectively). Amongst female patients, the most represented age categories* were children and seniors (34.6%, and 54.8% respectively) (Figure 3).
Table 2: Frequency and Relative Proportion for the 10 Major Trauma Patient Diagnostic Codes (PDCs) (n=1,279).
Patient Diagnostic Code (PDC): A proprietary system used by Calgary EMS to categorize the type of trauma or medical condition. The PDC is determined by the attending paramedic upon completion of the call.
*N.B. Infant category not included as n=4
- 163 -
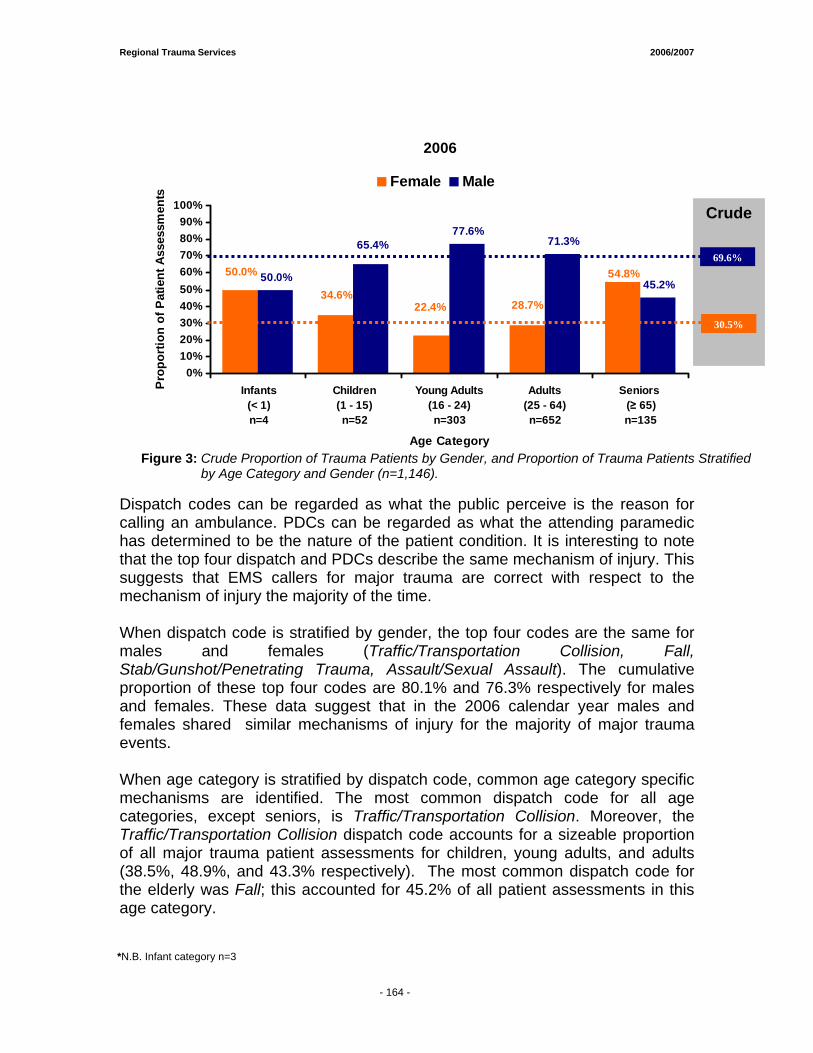
Regional Trauma Services 2006/2007
- 161 -
2006
50.0%
77.6%71.3%
45.2%34.6%
22.4% 28.7%
50.0% 54.8%
65.4%
0%10%20%30%40%50%60%70%80%90%
100%
Infants(< 1)n=4
Children(1 - 15)n=52
Young Adults(16 - 24)n=303
Adults(25 - 64)n=652
Seniors (≥ 65)n=135
Age Category
Pro
port
ion
of P
atie
nt A
sses
smen
ts
Female Male
Dispatch codes can be regarded as what the public perceive is the reason for calling an ambulance. PDCs can be regarded as what the attending paramedic has determined to be the nature of the patient condition. It is interesting to note that the top four dispatch and PDCs describe the same mechanism of injury. This suggests that EMS callers for major trauma are correct with respect to the mechanism of injury the majority of the time. When dispatch code is stratified by gender, the top four codes are the same for males and females (Traffic/Transportation Collision, Fall, Stab/Gunshot/Penetrating Trauma, Assault/Sexual Assault). The cumulative proportion of these top four codes are 80.1% and 76.3% respectively for males and females. These data suggest that in the 2006 calendar year males and females shared similar mechanisms of injury for the majority of major trauma events. When age category is stratified by dispatch code, common age category specific mechanisms are identified. The most common dispatch code for all age categories, except seniors, is Traffic/Transportation Collision. Moreover, the Traffic/Transportation Collision dispatch code accounts for a sizeable proportion of all major trauma patient assessments for children, young adults, and adults (38.5%, 48.9%, and 43.3% respectively). The most common dispatch code for the elderly was Fall; this accounted for 45.2% of all patient assessments in this age category.
Crude
30.5%
*N.B. Infant category n=3
Figure 3: Crude Proportion of Trauma Patients by Gender, and Proportion of Trauma Patients Stratified by Age Category and Gender (n=1,146).
69.6%
- 164 -
Regional Trauma Services 2006/2007
- 161 -
The second most common dispatch code for children and adults was Fall (21.2% and 16.4% respectively). This was not the case, however, for young adults where the second most common dispatch code was Stab/Gunshot/Penetrating Trauma (21.0%). For the elderly, the second most common dispatch code was Traffic/Transportation Collision (22.2%). Conclusions The prevalence of major and minor traumatic injury in the Calgary EMS patient population, when compared to other types of clinical conditions, is sizeable and may be underestimated. Care strategies such as medical control protocols, and continuing medical education for prehospital practitioners should focus on the assessment and treatment of traffic/transportation collisions and fall specific injuries in all age categories, and stab/gunshot/penetrating trauma in young adults. On-going public continuing education programs should be focused on the reduction of the aforementioned injuries with a particular focus on males between the ages of 16 and 64 years.
- 165 -
Regional Trauma Services 2006/2007
- 161 -
Section 2: Follow-up to a focused audit of major trauma patients not transported to the designated trauma centres. Background In the Calgary Health Region certain medical conditions and injuries must be transported to specialized acute care facilities. To that end, Calgary EMS paramedics adhere to a hospital destination policy that describes the optimal destination for specific clinical presentations. The decision to adhere to this policy, however, remains with the lead paramedic (Crew Chief), as there may be situations that are encountered which are not explicitly covered by the policy. The Hospital Destination Policy mandates that all patients who are considered a major trauma by mechanism of injury (MOI) must be transported to Foothills Medical Centre (FMC) if greater than or equal to 16 years old, or Alberta Children’s Hospital (ACH) if less than or equal to 15 years old (Appendix B). Data reported in the 2004/2005 Regional Trauma Services Annual Report suggests that there were 61 instances where patients who were subsequently found to have an Injury Severity Score (ISS) of greater than or equal to 12 were transported to a facility other than FMC and subsequently transferred. In the 2006 Trauma Report, Calgary EMS conducted an audit, which concluded that 6 patients may have been inappropriately transported to a destination other than the designated trauma centre. These six cases were followed-up to determine if they subsequently met criteria for entrance into the Calgary Health Region (CHR) trauma database. Methodology Based on results from the audit reported in the 2006 Trauma Report, six patients were identified as meeting criteria for transport to the trauma centre, but were not transported initially to the trauma centre. The surname, given name, location of transport, and date of transport of these patients were used to search the CHR trauma database. Results Zero of the six patients were located in the CHR trauma database. Conclusions Based on the criteria described in the audit reported in the 2006 Trauma Report, six Calgary EMS patients were identified as receiving inappropriate transport to a facility other than the trauma centre; none of these patients were subsequently registered in the CHR trauma database. This suggests that they did not meet major trauma criteria as outlined by the CHR (Injury Severity Score≥12), and were likely able to be treated appropriately at the original transport destination.
- 166 -
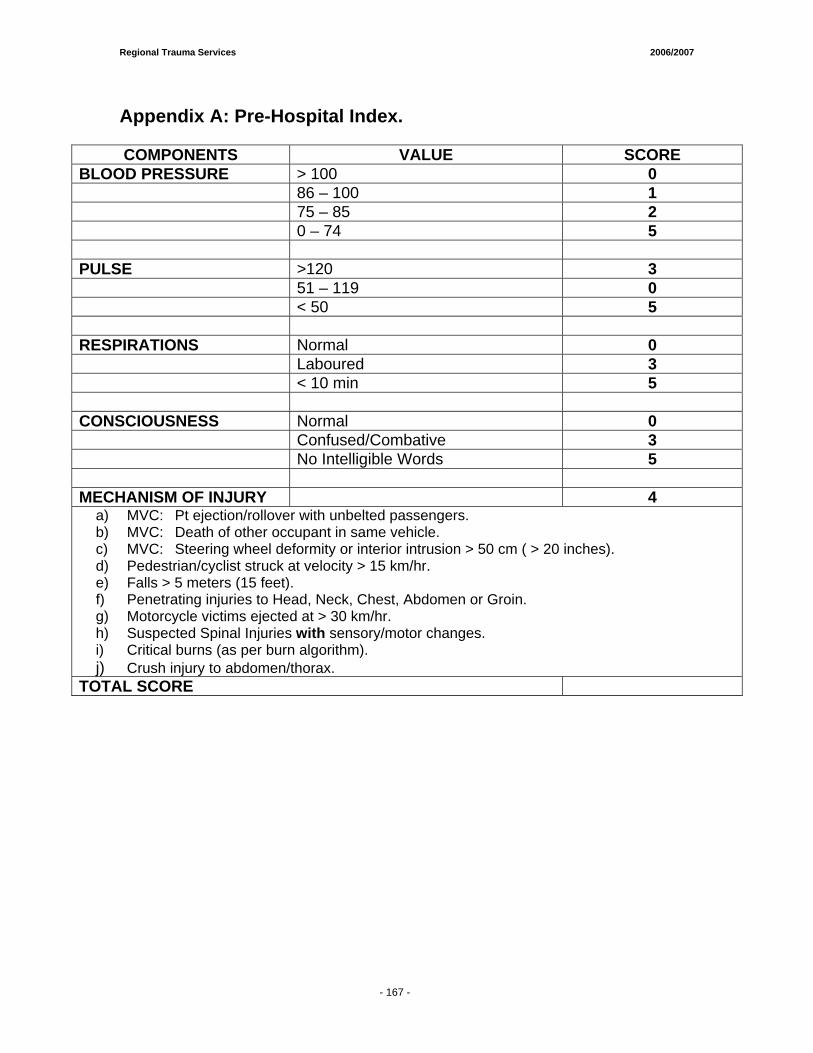
Regional Trauma Services 2006/2007
- 161 -
Appendix A: Pre-Hospital Index. COMPONENTS VALUE SCORE
BLOOD PRESSURE > 100 0 86 – 100 1 75 – 85 2 0 – 74 5 PULSE >120 3 51 – 119 0 < 50 5 RESPIRATIONS Normal 0 Laboured 3 < 10 min 5 CONSCIOUSNESS Normal 0 Confused/Combative 3 No Intelligible Words 5 MECHANISM OF INJURY 4
a) MVC: Pt ejection/rollover with unbelted passengers. b) MVC: Death of other occupant in same vehicle. c) MVC: Steering wheel deformity or interior intrusion > 50 cm ( > 20 inches). d) Pedestrian/cyclist struck at velocity > 15 km/hr. e) Falls > 5 meters (15 feet). f) Penetrating injuries to Head, Neck, Chest, Abdomen or Groin. g) Motorcycle victims ejected at > 30 km/hr. h) Suspected Spinal Injuries with sensory/motor changes. i) Critical burns (as per burn algorithm). j) Crush injury to abdomen/thorax.
TOTAL SCORE
- 167 -
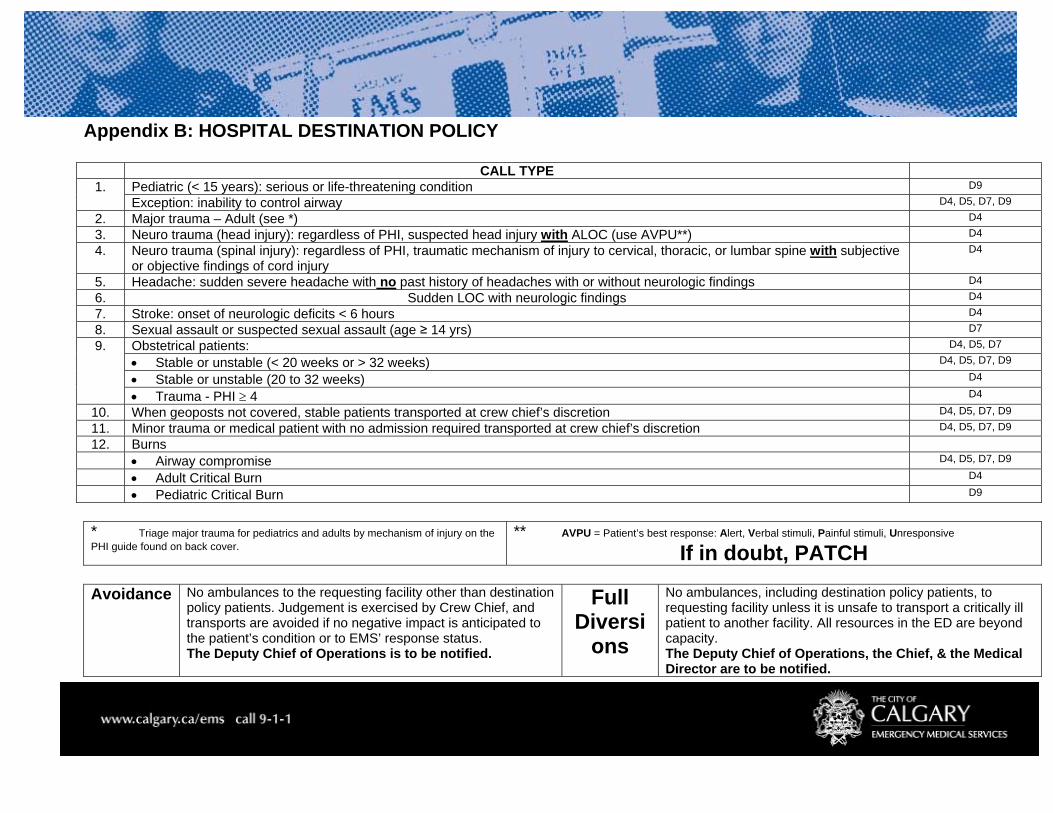
Regional Trauma Services 2006/2007
Appendix B: HOSPITAL DESTINATION POLICY
CALL TYPE 1. Pediatric (< 15 years): serious or life-threatening condition D9
Exception: inability to control airway D4, D5, D7, D9
2. Major trauma – Adult (see *) D4
3. Neuro trauma (head injury): regardless of PHI, suspected head injury with ALOC (use AVPU**) D4
4. Neuro trauma (spinal injury): regardless of PHI, traumatic mechanism of injury to cervical, thoracic, or lumbar spine with subjective or objective findings of cord injury
D4
5. Headache: sudden severe headache with no past history of headaches with or without neurologic findings D4
6. Sudden LOC with neurologic findings D4
7. Stroke: onset of neurologic deficits < 6 hours D4
8. Sexual assault or suspected sexual assault (age ≥ 14 yrs) D7
9. Obstetrical patients: D4, D5, D7
• Stable or unstable (< 20 weeks or > 32 weeks) D4, D5, D7, D9
• Stable or unstable (20 to 32 weeks) D4
• Trauma - PHI ≥ 4 D4
10. When geoposts not covered, stable patients transported at crew chief’s discretion D4, D5, D7, D9
11. Minor trauma or medical patient with no admission required transported at crew chief’s discretion D4, D5, D7, D9
12. Burns
• Airway compromise D4, D5, D7, D9
• Adult Critical Burn D4
• Pediatric Critical Burn D9
* Triage major trauma for pediatrics and adults by mechanism of injury on the PHI guide found on back cover.
** AVPU = Patient’s best response: Alert, Verbal stimuli, Painful stimuli, Unresponsive If in doubt, PATCH
Avoidance No ambulances to the requesting facility other than destination
policy patients. Judgement is exercised by Crew Chief, and transports are avoided if no negative impact is anticipated to the patient’s condition or to EMS’ response status. The Deputy Chief of Operations is to be notified.
Full Diversi
ons
No ambulances, including destination policy patients, to requesting facility unless it is unsafe to transport a critically ill patient to another facility. All resources in the ED are beyond capacity. The Deputy Chief of Operations, the Chief, & the Medical Director are to be notified.
Page 9 of 9
Shock Trauma Air Rescue Society (STARS)
2006/2007
Prepared by:
Michael J. Betzner MD FRCPc Senior Medical Director STARS Emergency Physician, CHR Data mining by: Matthew Pittet STARS data analyst

Regional Trauma Services 2006/2007
- 172 -
Shock Trauma Air Rescue Society (STARS)
The Alberta Shock Trauma Air Rescue Society (STARS) provides critical care level rotary wing transport for trauma patients throughout Alberta and south eastern BC. Two pilots, a paramedic and a nurse are ready 24 hours a day, seven days a week at both bases to provide care and transport to critically ill and injured patients. A referral emergency physician accompanies patients on the helicopter on about 25% of the missions and is available and provides online medical supervision and control throughout all missions. STARS is fully Accredited through the Commission on Accreditation of Medical Transport Systems (CAMTS). The STARS Emergency Link Centre (ELC) is an advanced 24-hour communications centre providing one-call access to a variety of resources. Around the province, the ELC plays several important roles. These roles range from receiving the first call for help from an organization or individual, to being called by a partner in the “Chain of Survival” for assistance with an emergency. In all cases, the ELC's primary job is to connect all of the emergency and medical services into a single conversation to determine the most effective medical response for the patient and the particular situation. This includes the immediate co-ordination of medical advice and transportation as required (regardless of whether rotary resources are used for any particular mission). This "One Call Does it All" is being used by the Calgary Health Region's Rapid Access Line in Calgary providing physicians from rural communities with quick access to patient referral and specialist advice in affiliation with the ELC. In the past year, the communication facilitation available within the ELC, has been further complemented by an excellent working and logistical arrangement with the Southern Alberta Regional Coordination Centre or SARCC (a Calgary Health Region referral, transport, and bed utilization communication service). SARCC helps to make sure patients and consultants are linked together in a fashion that maximizes utilization of available operating room, bed, and critical care resources. This information is now immediately available to assist STARS’ Referral Emergency Physicians in making sure patients are transported to the facility best able to look after them. This has been a very positive development within our health region.
The STARS Quality Management Program (medical component) includes rigorous review of patient care records for appropriateness of patient care and documentation including secondary screens of any patient transport which involves airway management, blood administration, high risk obstetrics, pediatric patients, patients who arrest while in the care of STARS, or does not meet the utilization review criteria. All transports are monitored for adherence to response time thresholds. Any event which meets the criteria in the risk analysis template for moderate to high risk events undergoes a Sentinel Event Review.
The STARS Human Patient Simulator (HPS) Program is the first mobile program of its kind in North America. The HPS is a dynamic, interactive, computerized mannequin. It is used for very specific, guided, intensive contact and analysis of Advanced Medical Care (AMC) critical thinking skills. The HPS mannequin simulates complex medical and traumatic problems over and over again, offering medical personnel an opportunity to test and practice their reactions and skills leading to a high degree of familiarity and confidence. In addition, patient care scenarios in our aircraft mock-up enhance the experience and better prepare our AMC for actual air medical transport events. Our mobile program also allows us to deliver advanced medical care training to rural health providers that use our services. It is an excellent means of ensuring our teams work towards the common goal of superb patient care. We are currently exploring an expanded partnership with a new Calgary Health Region simulation initiative which may allow for an expanded array of training for our colleagues both locally and rurally.
STARS transports trauma patients based on standards and utilization guidelines arrived upon by local consensus and research. All major trauma patients are taken to the Foothills
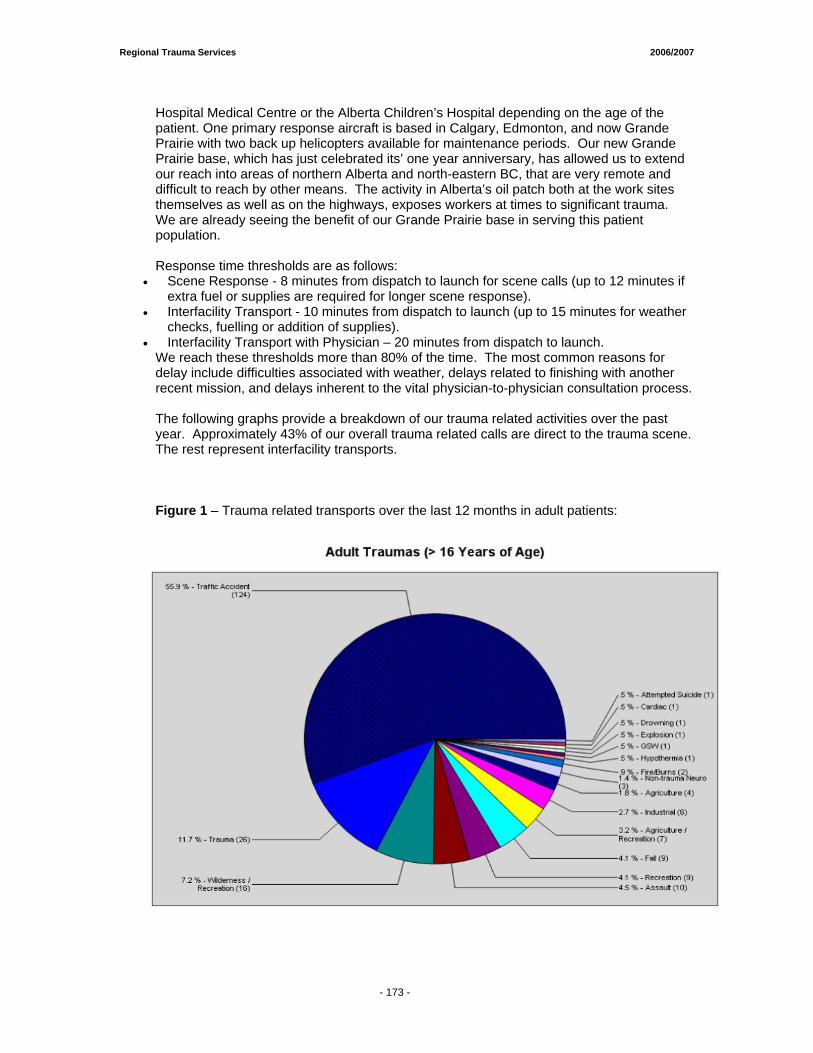
Regional Trauma Services 2006/2007
- 172 -
Hospital Medical Centre or the Alberta Children’s Hospital depending on the age of the patient. One primary response aircraft is based in Calgary, Edmonton, and now Grande Prairie with two back up helicopters available for maintenance periods. Our new Grande Prairie base, which has just celebrated its’ one year anniversary, has allowed us to extend our reach into areas of northern Alberta and north-eastern BC, that are very remote and difficult to reach by other means. The activity in Alberta’s oil patch both at the work sites themselves as well as on the highways, exposes workers at times to significant trauma. We are already seeing the benefit of our Grande Prairie base in serving this patient population. Response time thresholds are as follows:
• Scene Response - 8 minutes from dispatch to launch for scene calls (up to 12 minutes if extra fuel or supplies are required for longer scene response).
• Interfacility Transport - 10 minutes from dispatch to launch (up to 15 minutes for weather checks, fuelling or addition of supplies).
• Interfacility Transport with Physician – 20 minutes from dispatch to launch. We reach these thresholds more than 80% of the time. The most common reasons for delay include difficulties associated with weather, delays related to finishing with another recent mission, and delays inherent to the vital physician-to-physician consultation process.
The following graphs provide a breakdown of our trauma related activities over the past year. Approximately 43% of our overall trauma related calls are direct to the trauma scene. The rest represent interfacility transports. Figure 1 – Trauma related transports over the last 12 months in adult patients:
- 173 -
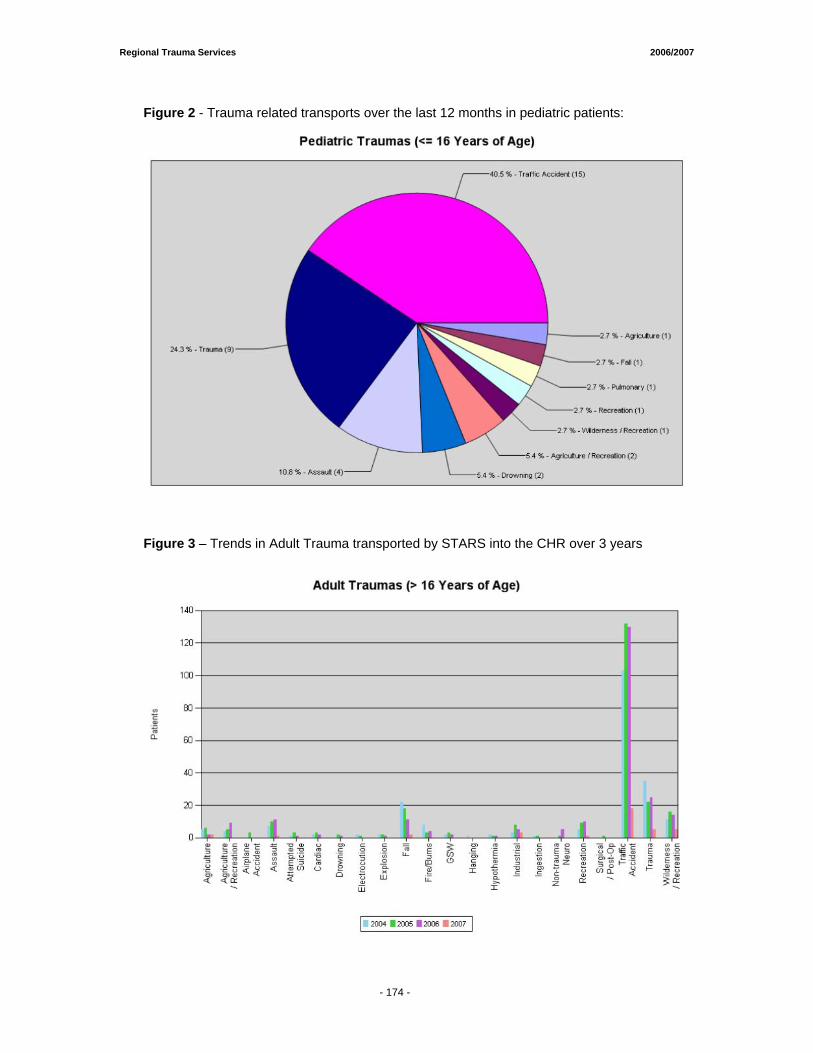
Regional Trauma Services 2006/2007
- 172 -
Figure 2 - Trauma related transports over the last 12 months in pediatric patients:
Figure 3 – Trends in Adult Trauma transported by STARS into the CHR over 3 years
- 174 -
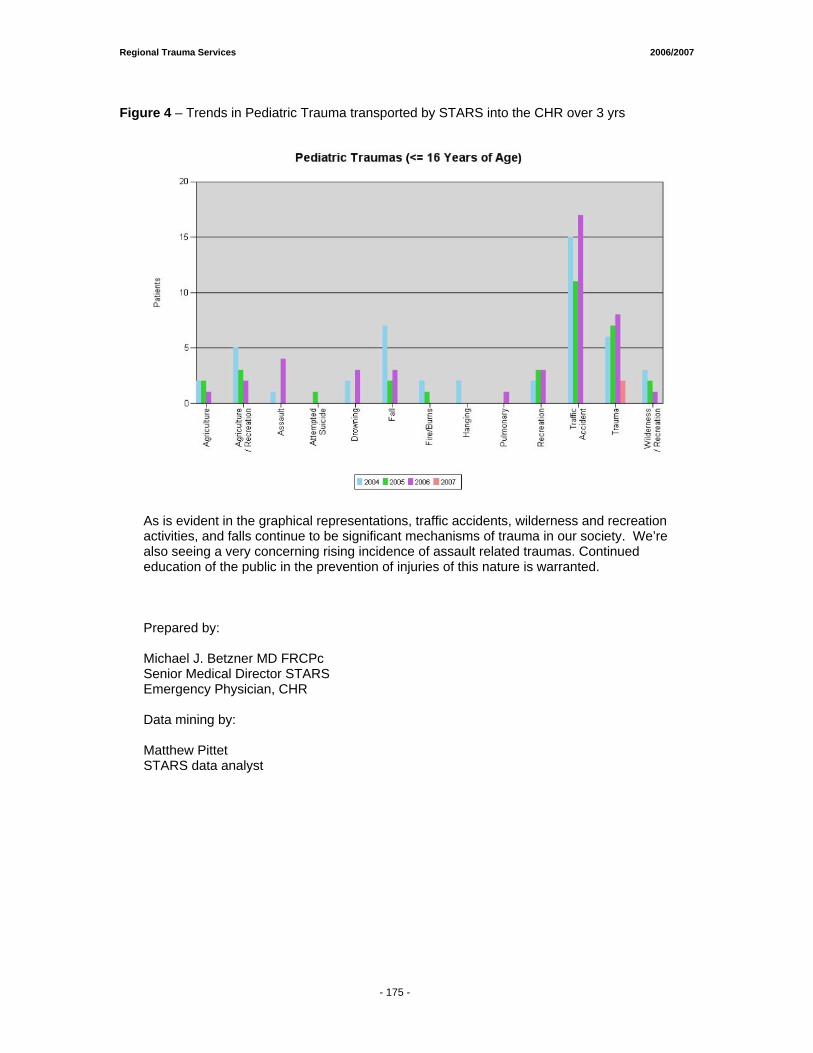
Regional Trauma Services 2006/2007
- 172 -
Figure 4 – Trends in Pediatric Trauma transported by STARS into the CHR over 3 yrs
As is evident in the graphical representations, traffic accidents, wilderness and recreation activities, and falls continue to be significant mechanisms of trauma in our society. We’re also seeing a very concerning rising incidence of assault related traumas. Continued education of the public in the prevention of injuries of this nature is warranted.
Prepared by:
Michael J. Betzner MD FRCPc Senior Medical Director STARS Emergency Physician, CHR Data mining by: Matthew Pittet STARS data analyst
- 175 -
JUSTICE
Report From the Office of the Chief Medical Examiner
Edmonton, Alberta
Data submitted by: Barb Hinman Medical Examiner’s Office 7007 – 116th Street Edmonton, Alberta T6H 5R8
(780) 427-4987
Calgary & South Rural Trauma Deaths Preliminary Data from the Medical Examiner’s Data Base (January 1st/2008) Report reviewed by: Dianne Dyer, Regional Manager, Trauma Services Barb Hinman Medical Examiner’s Office

Regional Trauma Services 2006/2007
- 178 -
Report from the Office of the Chief Medical Examiner (OCME)
The OCME is managed from two regional offices, one located in Edmonton and the other in Calgary. The Edmonton office administers all investigations in the northern part of the province, while the Calgary office administers the geographic area south of a line extending from Jasper to Hobbema and down to Provost. This report provides data related to trauma deaths for the Calgary and South rural areas. The MEDIC database is designed to collect location information on place of injury, circumstances of the death as well as place of death. Traumatic injury deaths include: - Suicides - Homicides - Unintentional intent - Undetermined intent Excludes: natural causes of death. Definitions: Suicide: Death from intentional, self-inflicted injury; includes poisonings except those that are "unclassified"; the majority of the poisonings are unclassified. Homicide: Death purposefully inflicted by other persons without regard to culpability; fatal injuries inflicted by another with the intent to injure or kill by any means, including child battering or other maltreatment, and criminal neglect (e.g. abandonment of children or other helpless persons, the death of an assailant killed in a pursuit by police is homicide). Unclassified: Death in which evidence of alcoholism or any drug misuse is a direct part of the primary medical cause of death; as stated in Part I of the Medical Certificate of Death. Undetermined:
(a) The medical cause of death is unknown (the cause is anatomically and toxicologically unascertainable) or
(b) It is not known if the death was unintentional intent, suicidal, or homicidal, that is there is not enough information to determine the manner of death (e.g. a self inflicted gun-shot wound while hunting may be unknown if it was unintentional intent or suicidal in manner).
Unintentional intent: deaths due to unintentional or unexpected injury, including death due to external causes including environmental factors ('act of God') and other misadventures. Children: less than 18 years of age Note: 60% of the deaths that involve notification to a medical examiner in a year are due to natural causes. All unnatural, unexpected or unexplained deaths in Alberta are investigated by a medical examiner as stated in the Fatality Inquiries Act. If a person dies in hospital, under circumstances or manner of death, which would meet the criteria for a medical examiners investigation, the case is included in the database. In the case of a sudden death of an infant, a full autopsy would be performed. Regardless of whether an external exam or autopsy is completed, the case is included as a medical examiner’s case. If a person is transported to a facility; the place of death is the facility and if the person is determined to have died and is not transported to a facility then the cases is considered death at the scene or enroute.
Regional Trauma Services 2006/2007
- 178 -
The Office of the Chief Medical Examiner must be notified when a death is: 1. An unexplained natural death, 2. An unexpected natural death, when the decedent appeared to be in good health, 3. A natural death where the decedent did not have a physician or had not been seen by a
physician within the last 14 days, 4. A death that occurs during an operative procedure or within 10 days of an operative
procedure, 5. A violent or unnatural death, 6. A death which is alleged to be a result of negligence, 7. A death in custody, 8. A death of an involuntary patient or "ward" of the government, and 9. A maternal death.
If a death occurs unexpectedly at home the local police department should be called. The police will contact the Office of the Chief Medical Examiner.
When a death occurs suddenly or cannot be explained, the Office of the Chief Medical Examiner conducts an investigation. All such deaths in Alberta are investigated under the authority of the Fatality Inquiries Act. The investigation is held to determine:
• Who died? • Where did they die? • When did they die? • Why did they die? • How did they die?
In some cases, a public fatality inquiry is held and recommendations are made to help prevent similar deaths.
Data Summary
The numbers of traumatic deaths reported by the Office of the Chief Medical Examiner for the fiscal years 2003/04 to 2006/07 are shown in Figure 1. From 2004/05 to 2005/06, there was an 11% increase in the number of these deaths (from 606 to 672). A greater increase was observed among children (16%) relative to adults (10%). The numbers stabilized in 2006/07, when a small overall decrease of 1% was observed. This overall decrease was driven by a 28% reduction in the number of pediatric deaths; the number of adult deaths actually increased by 2% in this fiscal year. The case characteristics for the deaths are shown in Table 1. For all trauma deaths combined, males consistently accounted for a higher proportion of the cases than females, though the proportion of females increased to 33% in 2006/07 from 27% to 28% in the previous years. In all years, just under half of the deaths occurred in the city of Calgary. Similarly, the proportions of deaths occurring in-hospital (vs. at the scene or en route) have remained fairly constant, from 27% to 31%. Unintentional deaths accounted for more than half of the deaths in all years. Suicide was consistently the second most common manner of death, accounting for 31% to 37% of the deaths across the years. Homicides and injuries of undetermined intent were the third and fourth most common, accounting for about 4%-6% and 2%-3% of the deaths, respectively. Pediatric deaths consistently accounted for about 6% to 8% of all the traumatic deaths. Slightly higher proportions of in-hospital deaths were noted when compared with all deaths (27% to 31% for all deaths compared with 37% to 41% for pediatric deaths). Unintentional deaths accounted for most deaths among children, ranging from a low of 61% in 2005/06 to a high of 78% in
- 179 -
Regional Trauma Services 2006/2007
- 178 -
2006/07. The relative burden of suicides in this age group decreased from 32% in 2005/06 to 7% in 2006/07, though this comparison warrants cautious interpretation given the small numbers of cases. For the15 in-hospital pediatric deaths in 2003/04, 7 occurred at the Alberta Children’s Hospital (ACH), 4 occurred at the Foothills Medical Centre (FMC) and the remaining 4 occurred at four other hospitals outside of the city. In 2004/05, 10 of the 20 in-hospital pediatric deaths occurred at ACH, 4 occurred at FMC and the remaining 6 occurred at five other hospitals outside of the city. In 2005/06, 7 of the 23 in-hospital pediatric deaths occurred at ACH, 6 occurred at FMC, 2 occurred at the Peter Lougheed Centre, two occurred at the Rockyview General Hospital and 6 occurred at four other hospitals outside of the city.
- 180 -

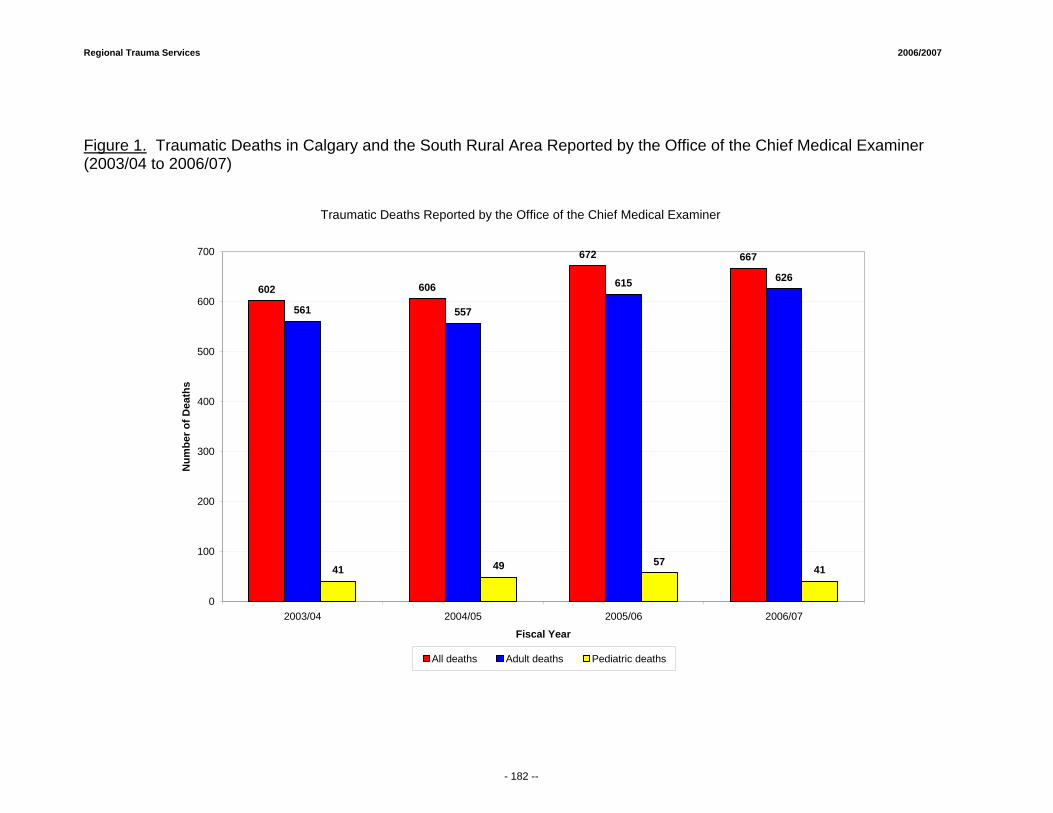
Regional Trauma Services 2006/2007
Figure 1. Traumatic Deaths in Calgary and the South Rural Area Reported by the Office of the Chief Medical Examiner (2003/04 to 2006/07)
Traumatic Deaths Reported by the Office of the Chief Medical Examiner
602 606
672 667
561 557
615 626
41 49 5741
0
100
200
300
400
500
600
700
2003/04 2004/05 2005/06 2006/07
Fiscal Year
Num
ber o
f Dea
ths
All deaths Adult deaths Pediatric deaths
- 182 --
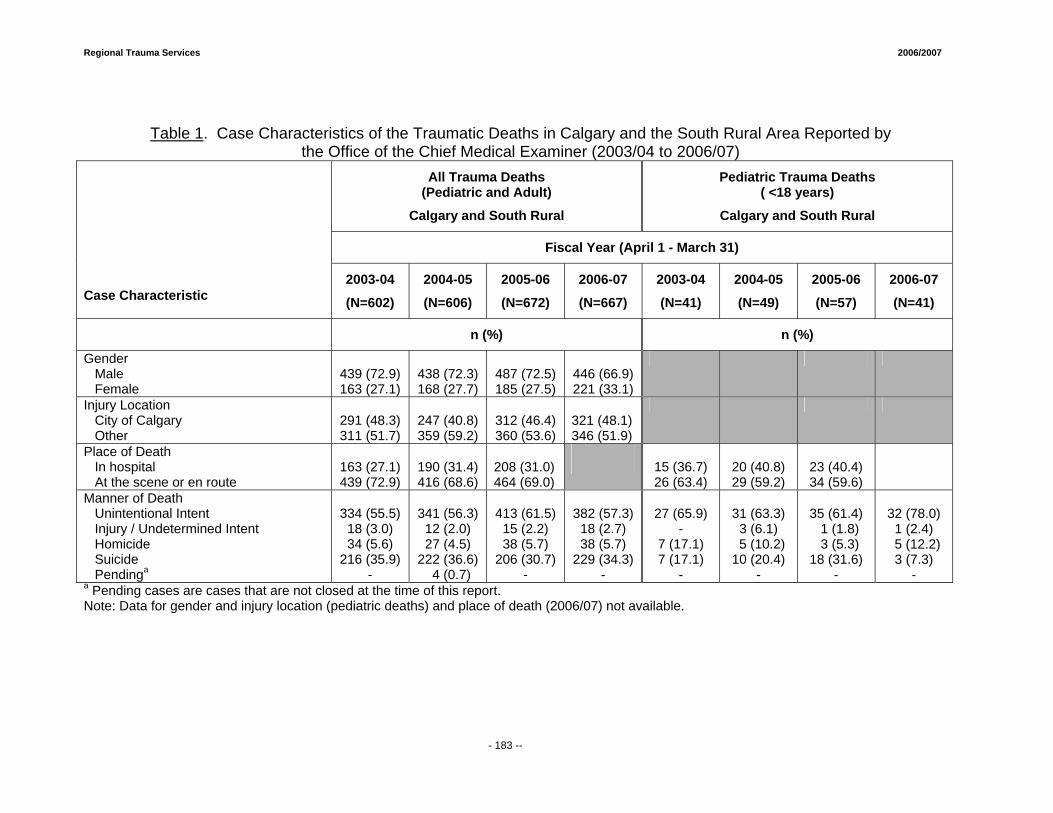
Regional Trauma Services 2006/2007
Table 1. Case Characteristics of the Traumatic Deaths in Calgary and the South Rural Area Reported by the Office of the Chief Medical Examiner (2003/04 to 2006/07)
All Trauma Deaths (Pediatric and Adult)
Calgary and South Rural
Pediatric Trauma Deaths ( <18 years)
Calgary and South Rural
Fiscal Year (April 1 - March 31)
Case Characteristic
2003-04
(N=602)
2004-05
(N=606)
2005-06
(N=672)
2006-07
(N=667)
2003-04
(N=41)
2004-05
(N=49)
2005-06
(N=57)
2006-07
(N=41)
n (%) n (%)
Gender Male Female
439 (72.9) 163 (27.1)
438 (72.3) 168 (27.7)
487 (72.5) 185 (27.5)
446 (66.9) 221 (33.1)
Injury Location City of Calgary Other
291 (48.3) 311 (51.7)
247 (40.8) 359 (59.2)
312 (46.4) 360 (53.6)
321 (48.1) 346 (51.9)
Place of Death In hospital At the scene or en route
163 (27.1) 439 (72.9)
190 (31.4) 416 (68.6)
208 (31.0) 464 (69.0)
15 (36.7) 26 (63.4)
20 (40.8) 29 (59.2)
23 (40.4) 34 (59.6)
Manner of Death Unintentional Intent Injury / Undetermined Intent Homicide Suicide Pendinga
334 (55.5)
18 (3.0) 34 (5.6)
216 (35.9) -
341 (56.3)
12 (2.0) 27 (4.5)
222 (36.6) 4 (0.7)
413 (61.5)
15 (2.2) 38 (5.7)
206 (30.7) -
382 (57.3)
18 (2.7) 38 (5.7)
229 (34.3) -
27 (65.9)
- 7 (17.1) 7 (17.1)
-
31 (63.3)
3 (6.1) 5 (10.2) 10 (20.4)
-
35 (61.4) 1 (1.8) 3 (5.3)
18 (31.6) -
32 (78.0)
1 (2.4) 5 (12.2)
3 (7.3) -
a Pending cases are cases that are not closed at the time of this report. Note: Data for gender and injury location (pediatric deaths) and place of death (2006/07) not available.
- 183 --
Regional Department of Emergency Medicine Report 2006-2007 Submitted by: Regional Emergency Services Calgary Health Region

Regional Trauma Services 2006/2007
- 186 -
Overview The Calgary Health Region’s urban Emergency Departments play an integral role in providing emergency care to residents of Region 3, Southern Alberta, Southeastern British Columbia, Southwestern Saskatchewan and out of province visitors. A population of nearly 1.5 million is served. The Emergency Departments (EDs) provide a unique service to the community and to the hospitals, caring for a large number of patients with diverse and complex health concerns. A full scope of service is provided and ranges from resuscitation to the treatment of patients with non-urgent conditions. The EDs play a key role in partnering with Trauma Services to effectively manage the population of trauma patients. For many trauma patients, the Emergency Department is their first major point of entry to the health care continuum. The Regional Department of Emergency Medicine (RDEM) Services is responsible for the operations of the three urban adult Emergency Departments within the Calgary Health Region including the Foothills Medical Centre (FMC), Peter Lougheed Centre (PLC) and the Rockyview General Hospital (RGH). There are over 200,000 emergency visits each year among these three sites. While the Emergency Department at the Alberta Children’s Hospital (ACH) is administered under the Child & Women’s Health Portfolio, there is a close working relationship with (RDEM). ACH receives approximately 45,000 patient visits each year. The FMC and ACH are the designated adult and pediatric tertiary trauma centres for Southern Alberta respectively, but the PLC and RGH also receive and treat trauma patients as well. The EDs provide 24-hour access to health care for individuals of all ages who have unscheduled health care needs. In order to manage this diverse patient population, all Calgary Health Region EDs use the nationally recognized, standardized triage-scoring system known as the Canadian Triage Acuity Scale (CTAS). Experienced and highly trained ED Nurses assign each patient a priority level based on how they present upon arrival to the ED. The CTAS ratings include 1 (resuscitation), 2 (emergent), 3 (urgent), 4 (semi-urgent) and 5 (non-urgent). It is important to note that the CTAS score is reflective of how the patient presents upon arrival and that their condition may improve or worsen over the course of their ED visit. The following information was excerpted from “Implementation Guidelines for The Canadian Emergency Department Triage and Acuity Scale (CTAS)” which is endorsed by the Canadian Association of Emergency Physicians (CAEP), the National Emergency Nurses Affiliation of Canada (NENA), and L’association des medcins d’urgence du Quebec (AMQU). Please note that we have only presented CTAS Level classification information as it applies to trauma patients. There is a wide range of other types of patients that fall within each CTAS category as well. Trauma patients presenting to the ED are classified as follows:
CTAS Level 1 Resuscitation • Major trauma: severe injury of any single body system or multiple system injury, Head injury
with Glasgow Coma Scale < 10, severe burns, chest/abdominal injury with any or all of: altered mental state, hypotension, tachycardia, severe pain, respiratory signs or symptoms
CTAS Level 2 Emergent • Head injury: This problem appears in several triage levels. The more severe or high-risk
patients require a rapid MD assessment, to determine the requirements for airway protection/CT scanning or neurosurgical intervention. These patients usually have an altered mental state (Glasgow Coma Scale ≤ 13). Severe headache, loss of consciousness, confusion, neck symptoms and nausea or vomiting can be expected. Details regarding the time of impact, mechanism of injury onset and severity of symptoms and changes over time are very important.
• Severe trauma: These patients may have high-risk mechanisms and severe single system symptoms or multiple system involvement with less severe signs and symptoms in each. Generally the physical assessment of these patients should reveal normal or nearly normal
Regional Trauma Services 2006/2007
- 186 -
vital signs (Abnormal VS are CTAS level 1). These patients may have moderate to severe pain and normal mental status (or meet the criteria outlined for level II head injuries).
CTAS Level 3 Urgent • Head injury: these patients may have had a high-risk mechanism. They should be alert (GCS
15) moderate pain (< 8/10) and nausea or vomiting. Should be changed to level 2 if deteriorating or just appears unwell.
• Moderate trauma: Patients with fractures or dislocations or sprains with severe pain (8-10/10). Nursing intervention with splinting/analgesics making it reasonable to have some delay in time to physician assessment/intervention. Dislocations should be reduced within one hour, so physician assessment should occur in ≤ 30 minutes. Patients are “stable” (normal or near normal vital signs).
CTAS Level 4 Semi-Urgent • Head Injury: Minor head injury, alert (GCS 15), no vomiting or neck symptoms and normal
vital signs. May require brief period of observation, depending on time of injury in relation to ED visit. If time interval from accident > 4-6 hours and has remained free of symptoms, a neuro check and head routine sheet may be all that is necessary. The age of the patient and characteristics of the care provider/support at home may also influence the disposition decision or observation period.
• Minor trauma: minor fractures, sprains, contusions, abrasions, and lacerations, requiring investigation or intervention. Normal vital signs, moderate pain (4-7/10).
CTAS Level 5 Non-Urgent • Minor trauma: contusions, abrasions, minor lacerations (not requiring closure by any
means), overuse syndromes (tendonitis), and sprains. Nursing interventions, splinting, cleansing, immunization status, minor analgesics are all expectations of patients in this category.
Trauma Patient Quality Improvement Practices
A series of treatment protocols, standards and guidelines have been developed for managing trauma patients in the ED in close collaboration with the Regional Trauma Services team. Quality Improvement processes are established to monitor and evaluate compliance. The RDEM participates actively on the Calgary Health Region Trauma Committees, which facilitate open communication, collaboration and problem solving. Protocols, standards and policies related to managing trauma patients are reviewed annually and on an ad hoc basis based on current research evidence. The following standards, guidelines, and protocols are monitored by Trauma Services:
• Trauma Team activation based on activation criteria • Trauma Team Leader (TTL) response time </= 20 minutes from patient arrival. • Compliance with Spinal Clearance Protocol based on the Canadian C-spine study • Documentation of vital signs qhour for all trauma patients in the ED • Documentation of sequential neurological vital signs as appropriate • ED length of stay </= 4 hours • Admission of major trauma patients to a non-surgeon or non-intensivist • Use of mechanical airway in ED for patients with a first recorded GCS </= 8 • Attempts at relocation of joint dislocations less than 1 hour of arrival • Time to CT of the head for patients with a GCS < 13 (standard is < 4 hours) • Time to craniotomy for patients with epidural or subdural brain hematoma • Time to laparotomy for patients with suspected or confirmed intra-abdominal injury
- 187 -
Regional Trauma Services 2006/2007
- 186 -
Note: Regional Trauma Services collects data in the Alberta Trauma Registry on all major trauma patients with an ISS >/= 12 who are admitted to hospital or die in the Emergency Department. ISS is an anatomical scoring tool indicating severity of injury. In addition to the above, Emergency Nurse Clinicians have been working closely with Trauma Services to understand the importance of thorough documentation and the subsequent impact on Trauma Registry data. It is also Emergency Department practice for any unusual matters to be brought to the attention of the Trauma Clinical Nurse Specialist. The Emergency Department actively participates in a wide range of Quality Improvement projects, most of which will positively impact the care of all emergency patients, including those who are trauma victims. Some examples include:
• Enhanced triage staffing at all sites and implementation of triage guidelines regarding reassessment of waiting room patients according to CTAS level.
• Credentialing of ED physicians under the Canadian Association for Emergency Physicians (CAEP) to perform FAST (Focused Assessment with Sonography for Trauma) ultrasound in the department for conditions including pericardial tamponade, intrauterine pregnancy, abdominal aortic aneurysm, abdominal trauma and cardiac standstill. FAST is an extension of the clinical assessment and most helpful in trauma patients in shock. A FAST protocol was developed, in conjunction with Trauma Services and Diagnostic Imaging for trauma patients. The credentialed ED physicians and trauma surgeons perform FAST as part of the trauma patient assessment.
• Developing an alphanumeric, one-call paging system to improve timely response from, and communication with, the trauma team.
• Participating in a spinal management project that examined, and aimed, to improve and standardize practices, processes and safe care for patients in the Emergency Department and in the Diagnostic Imaging Department.
• Participating in a review of the equipment/protocol for treatment of hypothermia. • Reviewing trauma patient cases that were identified by Trauma Registry as meeting the
Trauma Team Activation criteria but the team was not activated at the discretion of the emergency physician. Some cases were flagged and reviewed at the FMC Trauma Clinical Safety meetings to identify issues.
- 188 -
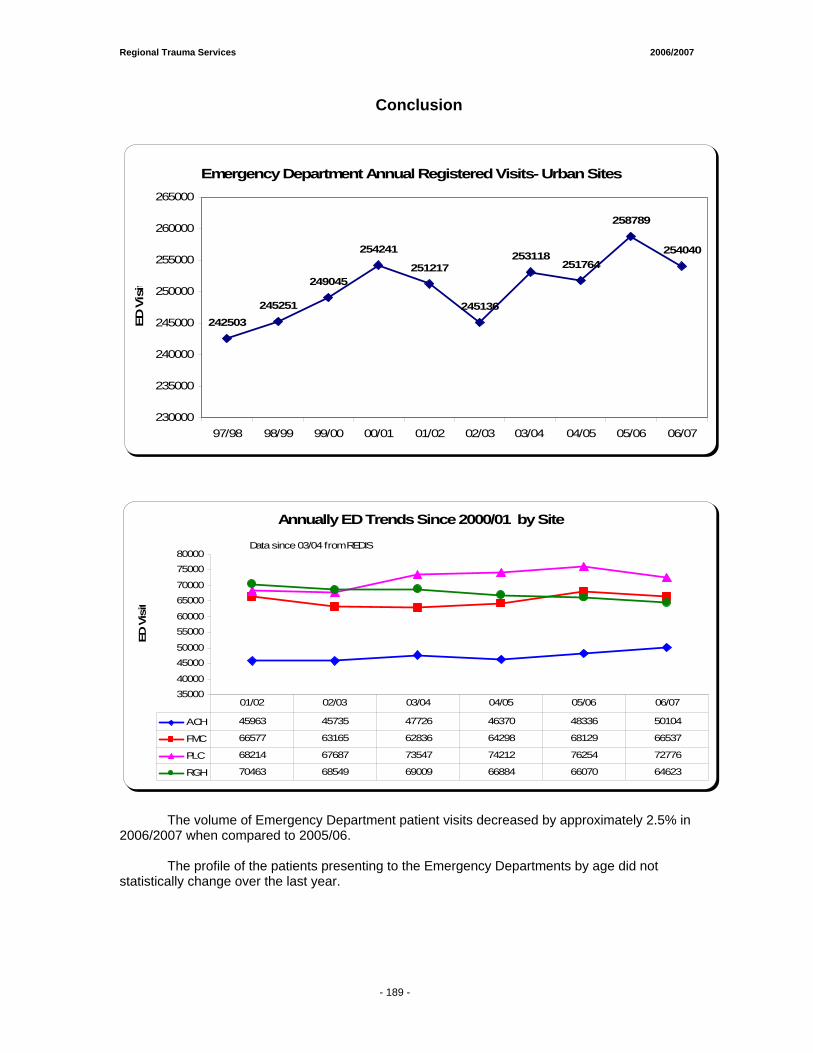
Regional Trauma Services 2006/2007
- 186 -
Conclusion
Emergency Department Annual Registered Visits- Urban Sites
242503245251
249045
254241
251217
245136
253118251764
258789
254040
230000
235000
240000
245000
250000
255000
260000
265000
97/98 98/99 99/00 00/01 01/02 02/03 03/04 04/05 05/06 06/07
ED V
isit
Annually ED Trends Since 2000/01 by Site
3500040000
4500050000
5500060000
6500070000
7500080000
ED V
isit
ACH 45963 45735 47726 46370 48336 50104
FMC 66577 63165 62836 64298 68129 66537
PLC 68214 67687 73547 74212 76254 72776
RGH 70463 68549 69009 66884 66070 64623
01/02 02/03 03/04 04/05 05/06 06/07
Data since 03/04 from REDIS
The volume of Emergency Department patient visits decreased by approximately 2.5% in 2006/2007 when compared to 2005/06.
The profile of the patients presenting to the Emergency Departments by age did not
statistically change over the last year.
- 189 -
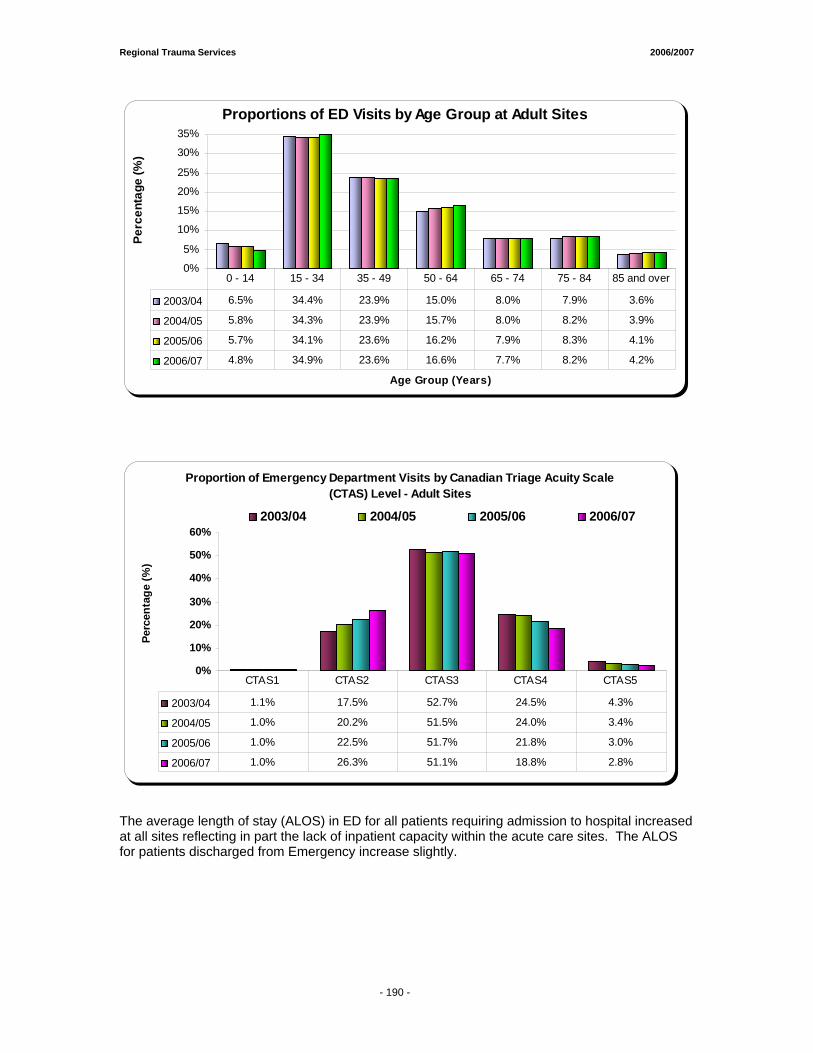
Regional Trauma Services 2006/2007
- 186 -
Proportions of ED Visits by Age Group at Adult Sites
0%
5%
10%
15%
20%
25%
30%
35%
Age Group (Years)
Perc
enta
ge (%
)
2003/04 6.5% 34.4% 23.9% 15.0% 8.0% 7.9% 3.6%
2004/05 5.8% 34.3% 23.9% 15.7% 8.0% 8.2% 3.9%
2005/06 5.7% 34.1% 23.6% 16.2% 7.9% 8.3% 4.1%
2006/07 4.8% 34.9% 23.6% 16.6% 7.7% 8.2% 4.2%
0 - 14 15 - 34 35 - 49 50 - 64 65 - 74 75 - 84 85 and over
Proportion of Emergency Department Visits by Canadian Triage Acuity Scale (CTAS) Level - Adult Sites
0%
10%
20%
30%
40%
50%
60%
Perc
enta
ge (%
)
2003/04 2004/05 2005/06 2006/07
2003/04 1.1% 17.5% 52.7% 24.5% 4.3%
2004/05 1.0% 20.2% 51.5% 24.0% 3.4%
2005/06 1.0% 22.5% 51.7% 21.8% 3.0%
2006/07 1.0% 26.3% 51.1% 18.8% 2.8%
CTAS1 CTAS2 CTAS3 CTAS4 CTAS5
The average length of stay (ALOS) in ED for all patients requiring admission to hospital increased at all sites reflecting in part the lack of inpatient capacity within the acute care sites. The ALOS for patients discharged from Emergency increase slightly.
- 190 -
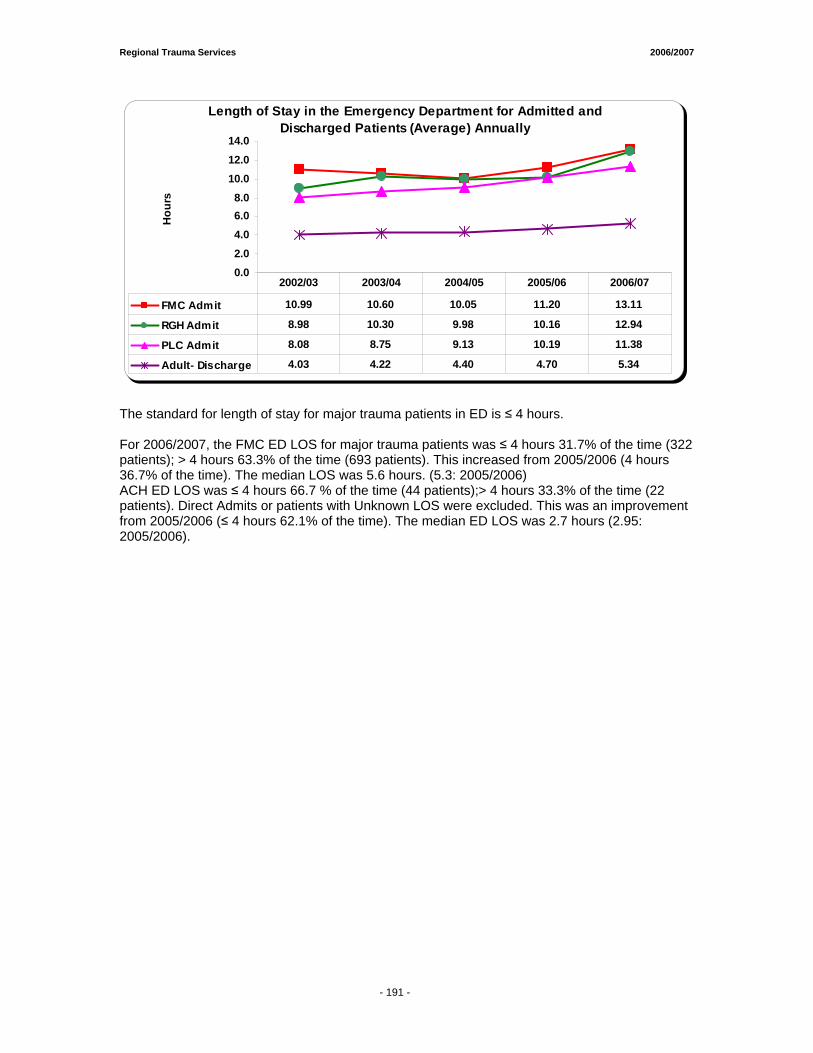
Regional Trauma Services 2006/2007
- 186 -
Length of Stay in the Emergency Department for Admitted and Discharged Patients (Average) Annually
0.02.04.06.08.0
10.012.014.0
Hou
rs
FMC Admit 10.99 10.60 10.05 11.20 13.11
RGH Admit 8.98 10.30 9.98 10.16 12.94
PLC Admit 8.08 8.75 9.13 10.19 11.38
Adult- Discharge 4.03 4.22 4.40 4.70 5.34
2002/03 2003/04 2004/05 2005/06 2006/07
The standard for length of stay for major trauma patients in ED is ≤ 4 hours. For 2006/2007, the FMC ED LOS for major trauma patients was ≤ 4 hours 31.7% of the time (322 patients); > 4 hours 63.3% of the time (693 patients). This increased from 2005/2006 (4 hours 36.7% of the time). The median LOS was 5.6 hours. (5.3: 2005/2006) ACH ED LOS was ≤ 4 hours 66.7 % of the time (44 patients);> 4 hours 33.3% of the time (22 patients). Direct Admits or patients with Unknown LOS were excluded. This was an improvement from 2005/2006 (≤ 4 hours 62.1% of the time). The median ED LOS was 2.7 hours (2.95: 2005/2006).
- 191 -
P.A.R.T.Y. PROGRAM (Prevent Alcohol Related Trauma in Youth) 22000066 --22000077 Submitted by: Lynda Vowell, RN BN P.A.R.T.Y. Coordinator Emergency Services Calgary Health Region

Regional Trauma Services 2006/2007
- 195 -
Goals and Objectives
• Reduce the incidence of risk related trauma in youth. • Provide youth with positive alternatives and strategies to encourage smart choices.
• Expose youth to potential psychosocial and physical impacts that result from traumatic
injury, using reality education.
• Encourage youth to directly apply strategies learned at PARTY.
• Empower youth to recognize risk and make informed, safe choices.
• Identify potentially dangerous situations and behaviors through personal testimony, multi-media presentation and active participation.
• Increase awareness of personal responsibility for choices.
• Encourage youth to examine their attitudes, decisions and behaviors.
• Increase knowledge of the impact of serious injury on quality of life for the individual and
community.
• Encourage youth to think about potential loss of independence, friends, self-esteem and control of their body, as a result of injury.
• Identify the differences between injury recovery and permanent disability.
• Expose youth to a variety of disability issues in the community.
• Promote injury prevention initiatives.
• Demonstrate PARTY Programs’ active participation in promotion of injury prevention
initiatives at a local, provincial, national and international level.
Regional Trauma Services 2006/2007
- 195 -
2006/2007 P.A.R.T.Y PROGRAM
This year marks the 19th year of P.A.R.T.Y Calgary. We continue to be a highly sought after dynamic injury awareness - health promotion program targeting youth in Calgary and surrounding communities since 1988. Our in-hospital presentations reached over 7000 grade nine students, with an additional 6000 attending outreach sessions. On-site programs are offered at the Foothills Medical Centre North Tower in Calgary. Waiting list numbers are consistent from year to year at 3000; (does not include students/schools that have not applied for or requested the program). Our aim is to inform and educate students about the perils of poor choices, risk-taking behaviors, and the consequences that can occur with them. One of the most powerful sessions of the program was at the end of a busy day, when students heard from young people who had been injured through their or someone else’s poor choice. They shared their tragic stories hoping that the choices leading to their event and the horrific consequences might help others make different choices. At the same time their stories left the students in the program, speechless and thoughtful. While the program aimed to ensure that many elements had an impact on these teenagers, it was in fact the personal stories that were often cited by the students as the most powerful and impacting element of the program; they made real all the information the students received during the day. Our grade 12 ‘After the Party’ program gains momentum as we deliver a reinforcing message to senior students around Grad time. The success of this program is inherent on the diverse group of over one hundred dedicated individuals. This group includes volunteers, various professional groups within the Calgary Health Region, as well as Calgary City Police, Calgary Emergency Medical Services, Calgary Fire Department, and a group of injury survivors who share their stories on a regular basis. Robyn Regehr, a defenseman with the Calgary Flames, is our celebrity spokesperson. Students from the Master of Teaching faculty spent time with us in the fall term, as part of their community work place experience Funding for this program is coordinated through the efforts of Calgary Health Trust with operational funding from the Calgary Health Region and ING Foundation with a 3 year funding commitment to increase our outreach component. This donation successfully provided the opportunity to continue to offer outreach sessions to those schools not accommodated in the regular classes due to lack of physical resources. We continue to deliver our rural outreach in High River, offering a full day program in their community utilizing their local resources. Evaluation of the program is on-going with completion of questionnaires by all participants at the end of each session; with on-going analysis and reporting of results to support quality improvements to the program. In 2005/2006, the P.A.R.T.Y. Advisory Committee was reactivated. This committee consisted of various representatives from organizations and groups actively involved in the program including EMS, the Calgary City Police, the Calgary Fire Department, the Calgary Health Trust, the Director of Emergency Services/Urgent Care Services/Health Link, the FMC Emergency Department Patient Care Manager, the Regional Trauma Services Manager, Emergency Physician Representatives, Volunteer Resources and Communications. The focus of this committee was to provide an advisory and support role to the program for quality and change if required. Submitted by: Lynda Vowell RN BN Program Coordinator
- 196 -
CCaallggaarryy FFiirreeffiigghhtteerrss BBuurrnn TTrreeaattmmeenntt CCeennttrree RReeppoorrtt Project Leads:
• Ms. Christi Findlay, Data Analyst Regional Trauma Services • Ms. Maria Vivas, Data Analyst Regional Trauma Services
• Reviewed by Ms. Lucy Weir, Patient Care Manager
PCU 31/32 (Burn Unit)

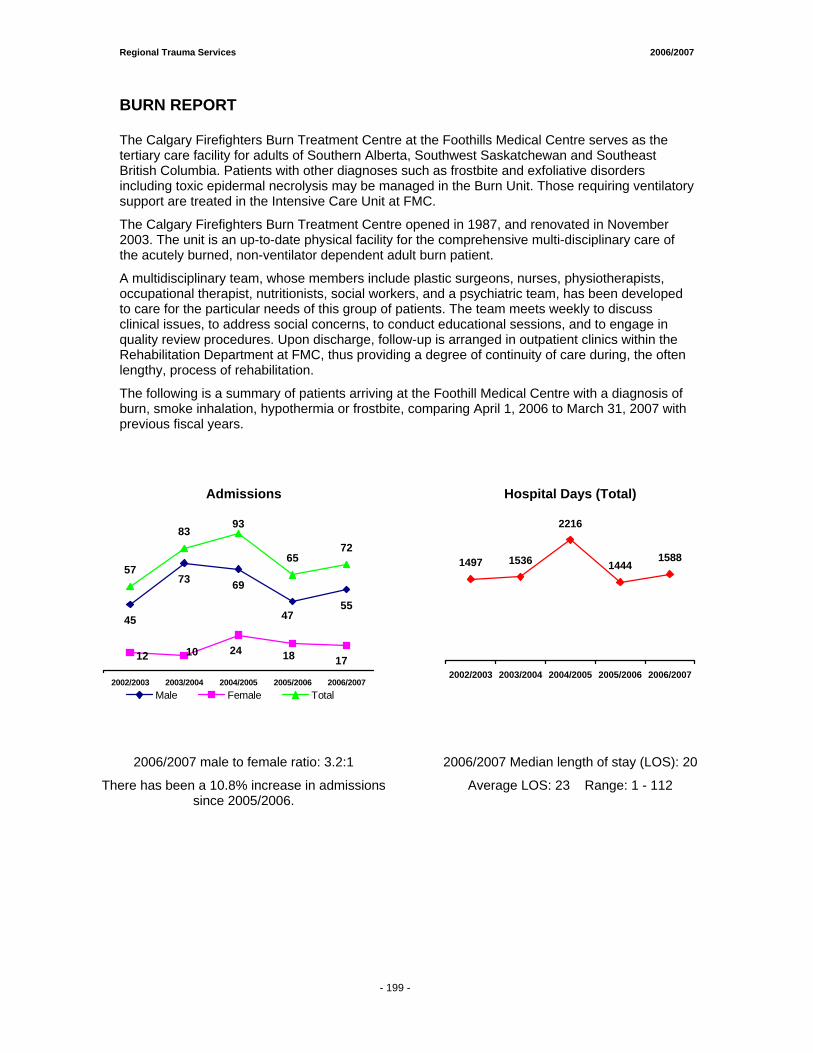
Regional Trauma Services 2006/2007
- 199 -
BURN REPORT
The Calgary Firefighters Burn Treatment Centre at the Foothills Medical Centre serves as the tertiary care facility for adults of Southern Alberta, Southwest Saskatchewan and Southeast British Columbia. Patients with other diagnoses such as frostbite and exfoliative disorders including toxic epidermal necrolysis may be managed in the Burn Unit. Those requiring ventilatory support are treated in the Intensive Care Unit at FMC.
The Calgary Firefighters Burn Treatment Centre opened in 1987, and renovated in November 2003. The unit is an up-to-date physical facility for the comprehensive multi-disciplinary care of the acutely burned, non-ventilator dependent adult burn patient.
A multidisciplinary team, whose members include plastic surgeons, nurses, physiotherapists, occupational therapist, nutritionists, social workers, and a psychiatric team, has been developed to care for the particular needs of this group of patients. The team meets weekly to discuss clinical issues, to address social concerns, to conduct educational sessions, and to engage in quality review procedures. Upon discharge, follow-up is arranged in outpatient clinics within the Rehabilitation Department at FMC, thus providing a degree of continuity of care during, the often lengthy, process of rehabilitation.
The following is a summary of patients arriving at the Foothill Medical Centre with a diagnosis of burn, smoke inhalation, hypothermia or frostbite, comparing April 1, 2006 to March 31, 2007 with previous fiscal years.
Admissions Hospital Days (Total)
45
73 69
55
93
6572
47
1012 24 18 17
57
83
2002/2003 2003/2004 2004/2005 2005/2006 2006/2007Male Female Total
1497 1536
2216
14441588
2002/2003 2003/2004 2004/2005 2005/2006 2006/2007
2006/2007 male to female ratio: 3.2:1
There has been a 10.8% increase in admissions since 2005/2006.
2006/2007 Median length of stay (LOS): 20
Average LOS: 23 Range: 1 - 112
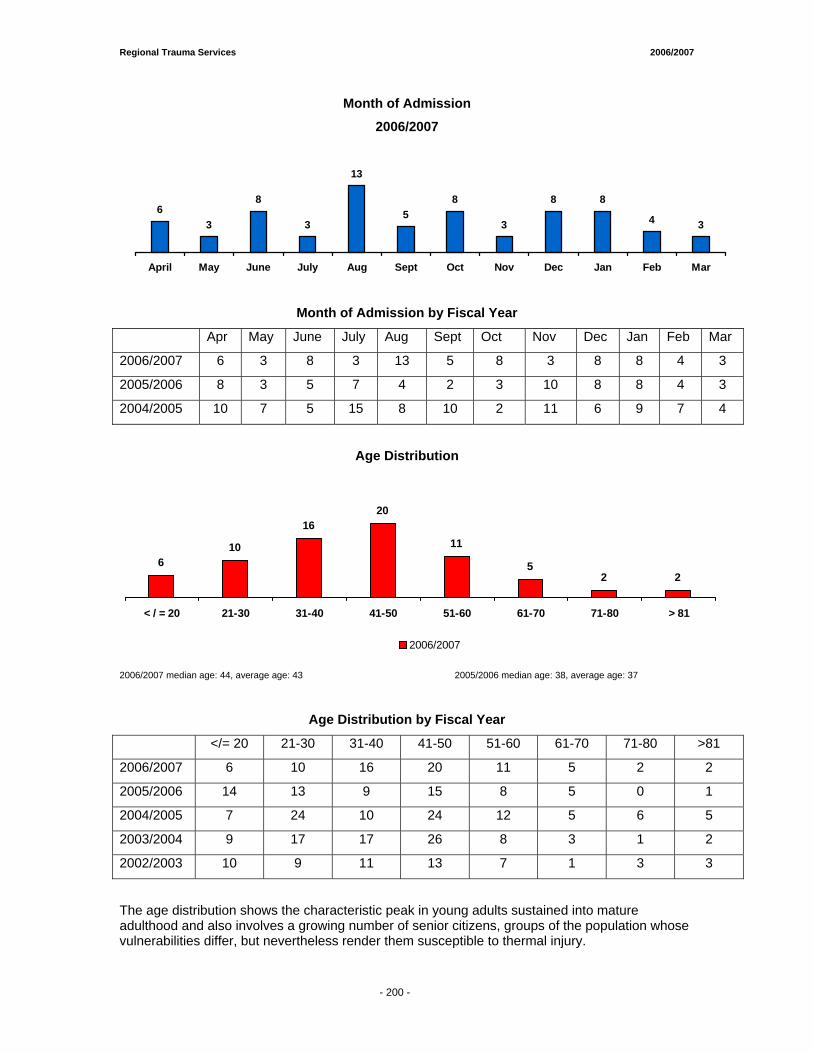
Regional Trauma Services 2006/2007
- 199 -
63
8
3
13
58
3
8 8
4 3
April May June July Aug Sept Oct Nov Dec Jan Feb Mar
Month of Admission
2006/2007
Month of Admission by Fiscal Year
Apr May June July Aug Sept Oct Nov Dec Jan Feb Mar
2006/2007 6 3 8 3 13 5 8 3 8 8 4 3
2005/2006 8 3 5 7 4 2 3 10 8 8 4 3
2004/2005 10 7 5 15 8 10 2 11 6 9 7 4
Age Distribution
610
1620
11
52 2
< / = 20 21-30 31-40 41-50 51-60 61-70 71-80 > 81
2006/2007
2006/2007 median age: 44, average age: 43 2005/2006 median age: 38, average age: 37
Age Distribution by Fiscal Year
</= 20 21-30 31-40 41-50 51-60 61-70 71-80 >81
2006/2007 6 10 16 20 11 5 2 2
2005/2006 14 13 9 15 8 5 0 1
2004/2005 7 24 10 24 12 5 6 5
2003/2004 9 17 17 26 8 3 1 2
2002/2003 10 9 11 13 7 1 3 3
The age distribution shows the characteristic peak in young adults sustained into mature adulthood and also involves a growing number of senior citizens, groups of the population whose vulnerabilities differ, but nevertheless render them susceptible to thermal injury.
- 200 -
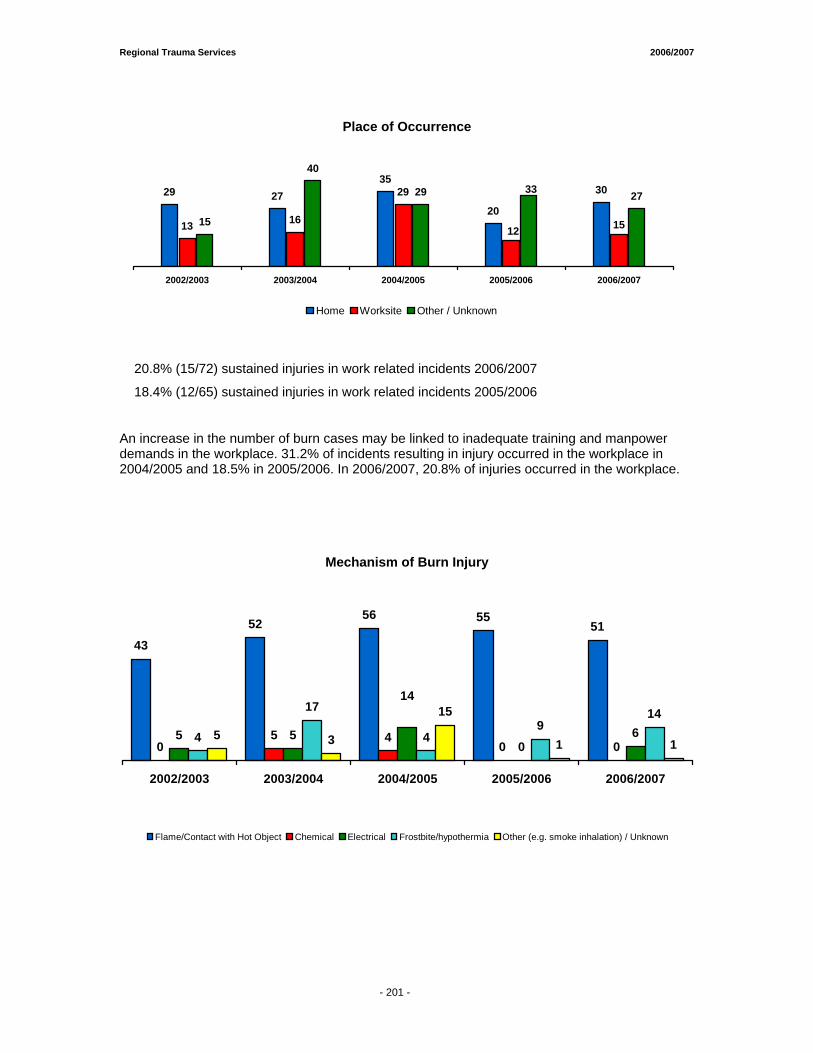
Regional Trauma Services 2006/2007
- 199 -
Place of Occurrence
29 2735
20
30
13 16
29
15
40
29 27
1512
33
2002/2003 2003/2004 2004/2005 2005/2006 2006/2007
Home Worksite Other / Unknown
20.8% (15/72) sustained injuries in work related incidents 2006/2007
18.4% (12/65) sustained injuries in work related incidents 2005/2006
An increase in the number of burn cases may be linked to inadequate training and manpower demands in the workplace. 31.2% of incidents resulting in injury occurred in the workplace in 2004/2005 and 18.5% in 2005/2006. In 2006/2007, 20.8% of injuries occurred in the workplace.
Mechanism of Burn Injury
4352
56 5551
05 4
0 05 5
064
17
49
145 3
15
1 1
14
2002/2003 2003/2004 2004/2005 2005/2006 2006/2007
Flame/Contact with Hot Object Chemical Electrical Frostbite/hypothermia Other (e.g. smoke inhalation) / Unknown
- 201 -
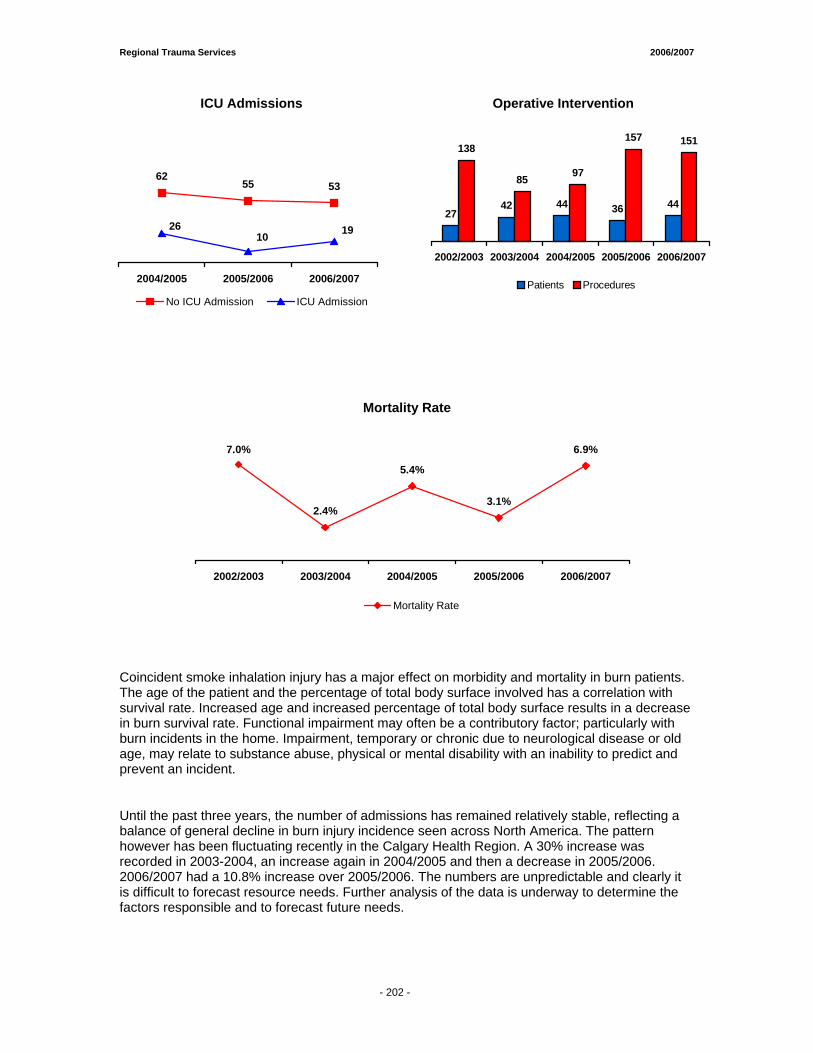
Regional Trauma Services 2006/2007
- 199 -
ICU Admissions Operative Intervention
6255 53
192610
2004/2005 2005/2006 2006/2007
No ICU Admission ICU Admission
2742 44 36 44
138
85 97
157 151
2002/2003 2003/2004 2004/2005 2005/2006 2006/2007
Patients Procedures
Mortality Rate
Coincident smoke inhalation injury has a major effect on morbidity and mortality in burn patients. The age of the patient and the percentage of total body surface involved has a correlation with survival rate. Increased age and increased percentage of total body surface results in a decrease in burn survival rate. Functional impairment may often be a contributory factor; particularly with burn incidents in the home. Impairment, temporary or chronic due to neurological disease or old age, may relate to substance abuse, physical or mental disability with an inability to predict and prevent an incident.
Until the past three years, the number of admissions has remained relatively stable, reflecting a balance of general decline in burn injury incidence seen across North America. The pattern however has been fluctuating recently in the Calgary Health Region. A 30% increase was recorded in 2003-2004, an increase again in 2004/2005 and then a decrease in 2005/2006. 2006/2007 had a 10.8% increase over 2005/2006. The numbers are unpredictable and clearly it is difficult to forecast resource needs. Further analysis of the data is underway to determine the factors responsible and to forecast future needs.
7.0%
2.4%
5.4%
3.1%
6.9%
2002/2003 2003/2004 2004/2005 2005/2006 2006/2007
Mortality Rate
- 202 -
Tertiary Neurorehabilitation Program (Patient Care Unit FMC 58) ♦♦ TTrraauummaattiicc BBrraaiinn IInnjjuurryy
PPooppuullaattiioonn ♦♦ TTrraauummaattiicc SSppiinnaall CCoorrdd IInnjjuurryy
PPooppuullaattiioonn April 1, 2006 to March 31, 2007
Submitted by: Luchie Swinton, B.Sc.O.T. Neuro Rehabilitation Program Facilitator

Regional Trauma Services 2006/2007
- 206 -
Tertiary Neuro Rehabilitation Traumatic Brain Injury Population
2006/2007
Prepared by:
Luchie Swinton, B.Sc.O.T. Neuro Rehabiltation Program Facilitator
November 20, 2007
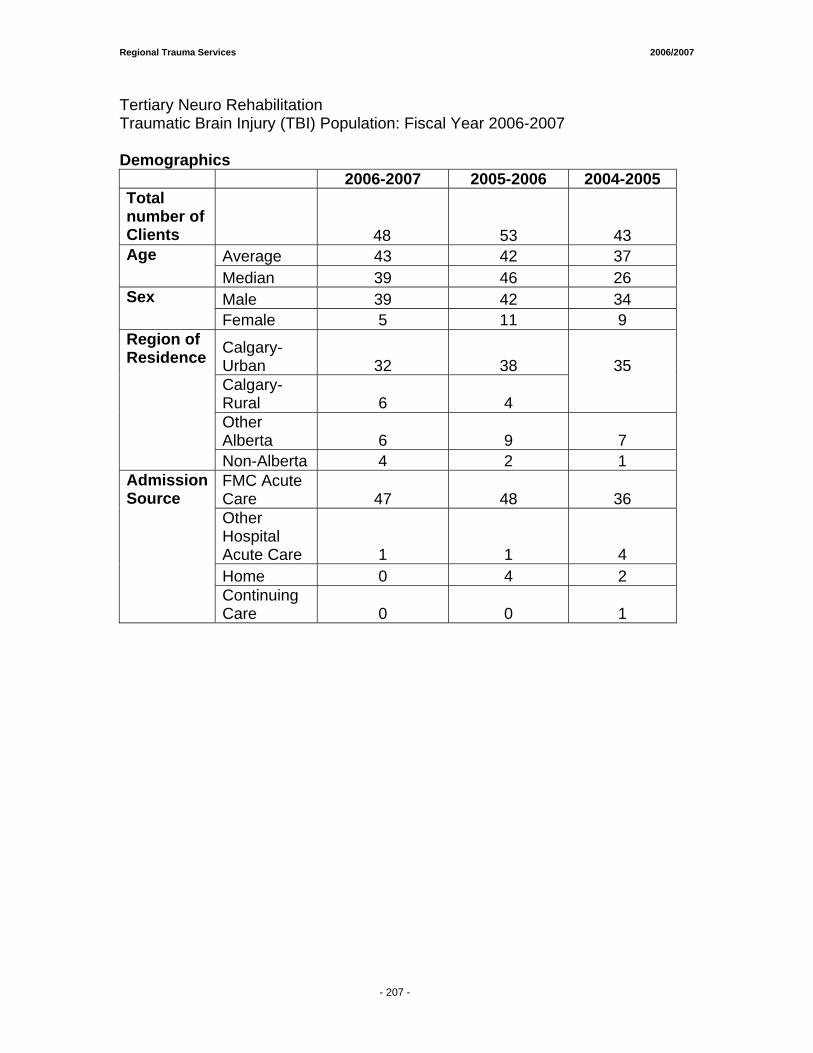
Regional Trauma Services 2006/2007
- 206 -
Tertiary Neuro Rehabilitation Traumatic Brain Injury (TBI) Population: Fiscal Year 2006-2007 Demographics 2006-2007 2005-2006 2004-2005 Total number of Clients
48 53 43 Average 43 42 37 Age Median 39 46 26 Male 39 42 34 Sex
Female 5 11 9
Calgary-Urban 32
38
Calgary-Rural 6 4
35
Other Alberta 6 9 7
Region of Residence
Non-Alberta 4 2 1 FMC Acute Care 47 48 36 Other Hospital Acute Care 1 1 4 Home 0 4 2
Admission Source
Continuing Care 0 0 1
- 207 -
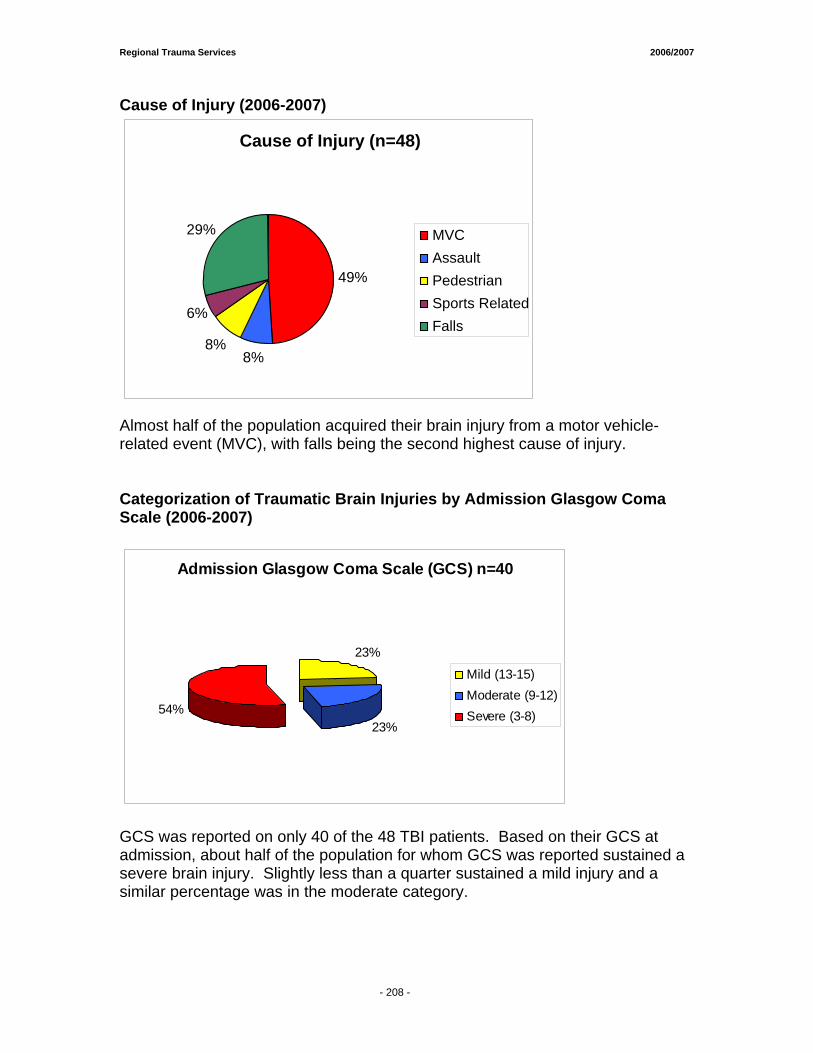
Regional Trauma Services 2006/2007
- 206 -
Cause of Injury (2006-2007)
Almost half of the population acquired their brain injury from a motor vehicle- related event (MVC), with falls being the second highest cause of injury. Categorization of Traumatic Brain Injuries by Admission Glasgow Coma Scale (2006-2007)
Admission Glasgow Coma Scale (GCS) n=40
23%
23%54%
Mild (13-15)Moderate (9-12)Severe (3-8)
GCS was reported on only 40 of the 48 TBI patients. Based on their GCS at admission, about half of the population for whom GCS was reported sustained a severe brain injury. Slightly less than a quarter sustained a mild injury and a similar percentage was in the moderate category.
Cause of Injury (n=48)
49%
8% 8%
6%
29% MVCAssaultPedestrianSports RelatedFalls
- 208 -
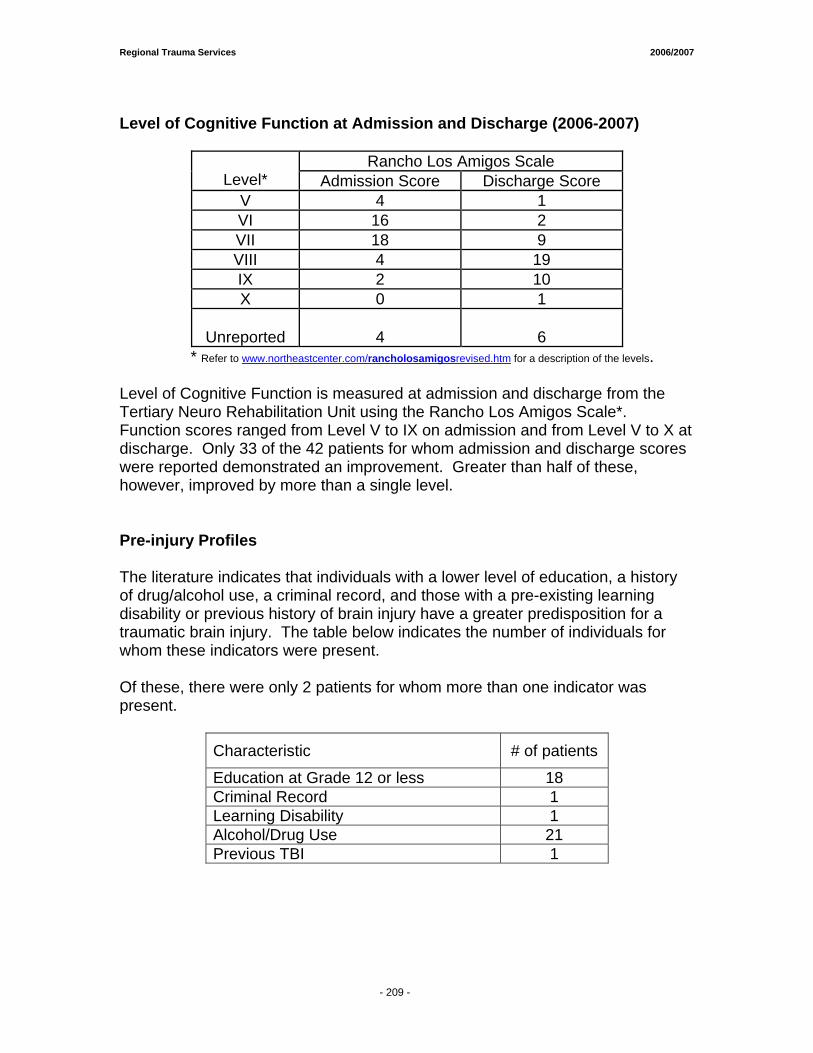
Regional Trauma Services 2006/2007
- 206 -
Level of Cognitive Function at Admission and Discharge (2006-2007)
Rancho Los Amigos Scale Level* Admission Score Discharge Score
V 4 1 VI 16 2 VII 18 9 VIII 4 19 IX 2 10 X 0 1
Unreported 4
6
* Refer to www.northeastcenter.com/rancholosamigosrevised.htm for a description of the levels. Level of Cognitive Function is measured at admission and discharge from the Tertiary Neuro Rehabilitation Unit using the Rancho Los Amigos Scale*. Function scores ranged from Level V to IX on admission and from Level V to X at discharge. Only 33 of the 42 patients for whom admission and discharge scores were reported demonstrated an improvement. Greater than half of these, however, improved by more than a single level. Pre-injury Profiles The literature indicates that individuals with a lower level of education, a history of drug/alcohol use, a criminal record, and those with a pre-existing learning disability or previous history of brain injury have a greater predisposition for a traumatic brain injury. The table below indicates the number of individuals for whom these indicators were present. Of these, there were only 2 patients for whom more than one indicator was present.
Characteristic # of patients
Education at Grade 12 or less 18 Criminal Record 1 Learning Disability 1 Alcohol/Drug Use 21 Previous TBI 1
- 209 -

Regional Trauma Services 2006/2007
- 206 -
Other Brain Injury Rehabilitation Indicators
Mean Median Range Admission FIMTM1 Scores
96
100
18 - 119 Discharge FIMTM Scores
113
117
25 - 124 % change in FIMTM Scores
15%
0% to 137% Acute LOS 28 6 - 133 Rehab LOS 34 8 - 187 days
Total LOS* 61 25 – 302 days
Note: Means not reported for % change in FIMTM scores, acute LOS, rehab LOS or total LOS due to skewing in the data. * Only patients referred from FMC acute units were included in this total. From admission to discharge on the Tertiary Neuro Rehabilitation Unit, the median change in FIMTM Scores1 for patients with traumatic brain injury was 15%. For those referred from a Foothills Medical Centre acute unit, the median total length of hospital stay from acute to tertiary rehabilitation was 61 days.
1 The FIMTM trade mark is owned by Uniform Data System for Medical rehabilitation, a division of U B Foundation Activities, Inc. FIM - The Functional Independence Measure (FIM) is an 18 item rating scale that includes 6 activities of daily living items, 2 bladder and bowel function items, 5 mobility and 5 cognitive/social interaction items.
- 210 -
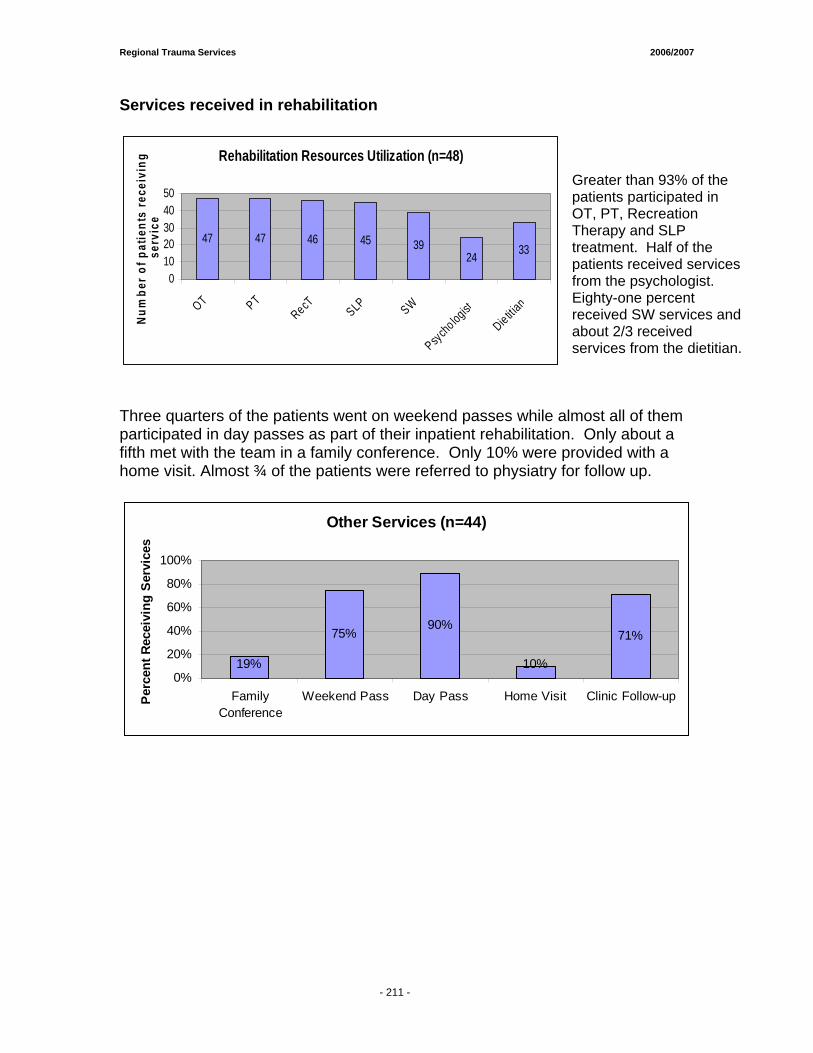
Regional Trauma Services 2006/2007
- 206 -
Services received in rehabilitation
Rehabilitation Resources Utilization (n=48)
47 47 46 45 3924 33
01020304050
OT PTRecT SLP SW
Psycho logist
Die titian
Num
ber o
f pat
ient
s re
ceiv
ing
serv
ice
Three quarters of the patients went on weekend passes while almost all of them participated in day passes as part of their inpatient rehabilitation. Only about a fifth met with the team in a family conference. Only 10% were provided with a home visit. Almost ¾ of the patients were referred to physiatry for follow up.
Other Services (n=44)
19%
75%90%
10%
71%
0%
20%
40%
60%
80%
100%
FamilyConference
Weekend Pass Day Pass Home Visit Clinic Follow-upPerc
ent R
ecei
ving
Ser
vice
s
Greater than 93% of the patients participated in OT, PT, Recreation Therapy and SLP treatment. Half of the patients received services from the psychologist. Eighty-one percent received SW services and about 2/3 received services from the dietitian.
- 211 -
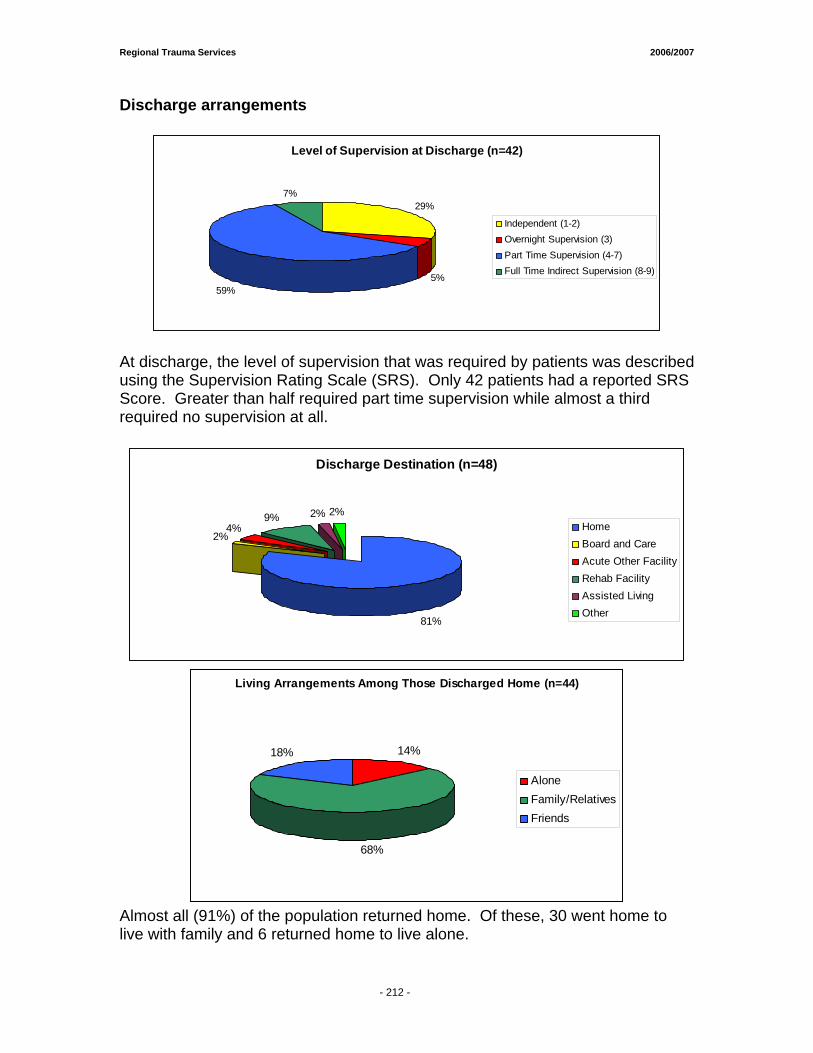
Regional Trauma Services 2006/2007
- 206 -
Discharge arrangements
Level of Supervision at Discharge (n=42)
29%
5%59%
7%
Independent (1-2)Overnight Supervision (3)Part Time Supervision (4-7)Full Time Indirect Supervision (8-9)
At discharge, the level of supervision that was required by patients was described using the Supervision Rating Scale (SRS). Only 42 patients had a reported SRS Score. Greater than half required part time supervision while almost a third required no supervision at all.
Discharge Destination (n=48)
81%
2%4%
9% 2% 2%HomeBoard and CareAcute Other FacilityRehab FacilityAssisted Living Other
Living Arrangements Among Those Discharged Home (n=44)
14%
68%
18%
AloneFamily/RelativesFriends
Almost all (91%) of the population returned home. Of these, 30 went home to live with family and 6 returned home to live alone.
- 212 -

Regional Trauma Services 2006/2007
- 214 -
Tertiary Neuro Rehabilitation
Traumatic Spinal Cord Injury Population
2006/2007
Prepared by:
Luchie Swinton, B.Sc.O.T. Neuro Rehabilitation Program Facilitator
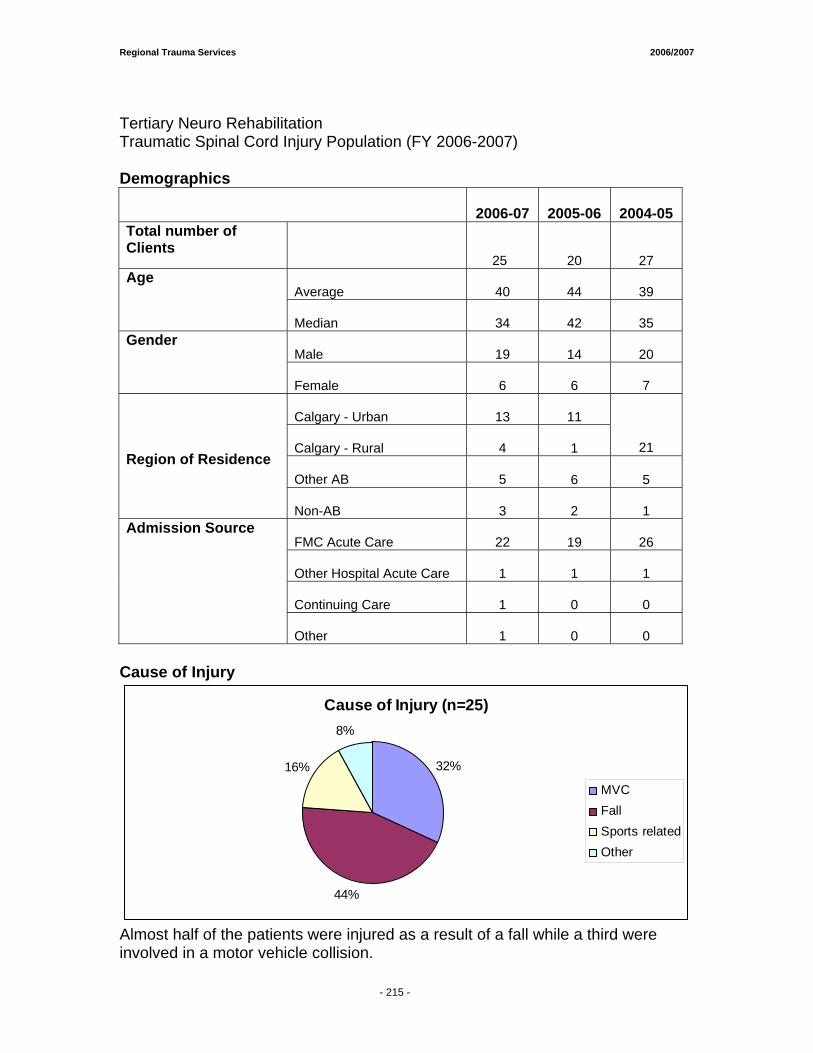
Regional Trauma Services 2006/2007
- 214 -
Tertiary Neuro Rehabilitation Traumatic Spinal Cord Injury Population (FY 2006-2007) Demographics
2006-07 2005-06 2004-05
Total number of Clients
25 20 27 Average
40 44 39
Age
Median
34 42 35
Male
19 14 20
Gender
Female
6 6 7
Calgary - Urban
13 11
Calgary - Rural
4 1 21
Other AB
5 6 5
Region of Residence
Non-AB
3 2 1
FMC Acute Care
22 19 26
Other Hospital Acute Care
1 1 1
Continuing Care
1 0 0
Admission Source
Other
1 0 0
Cause of Injury
Cause of Injury (n=25)
32%
44%
16%
8%
MVCFallSports relatedOther
Almost half of the patients were injured as a result of a fall while a third were involved in a motor vehicle collision.
- 215 -
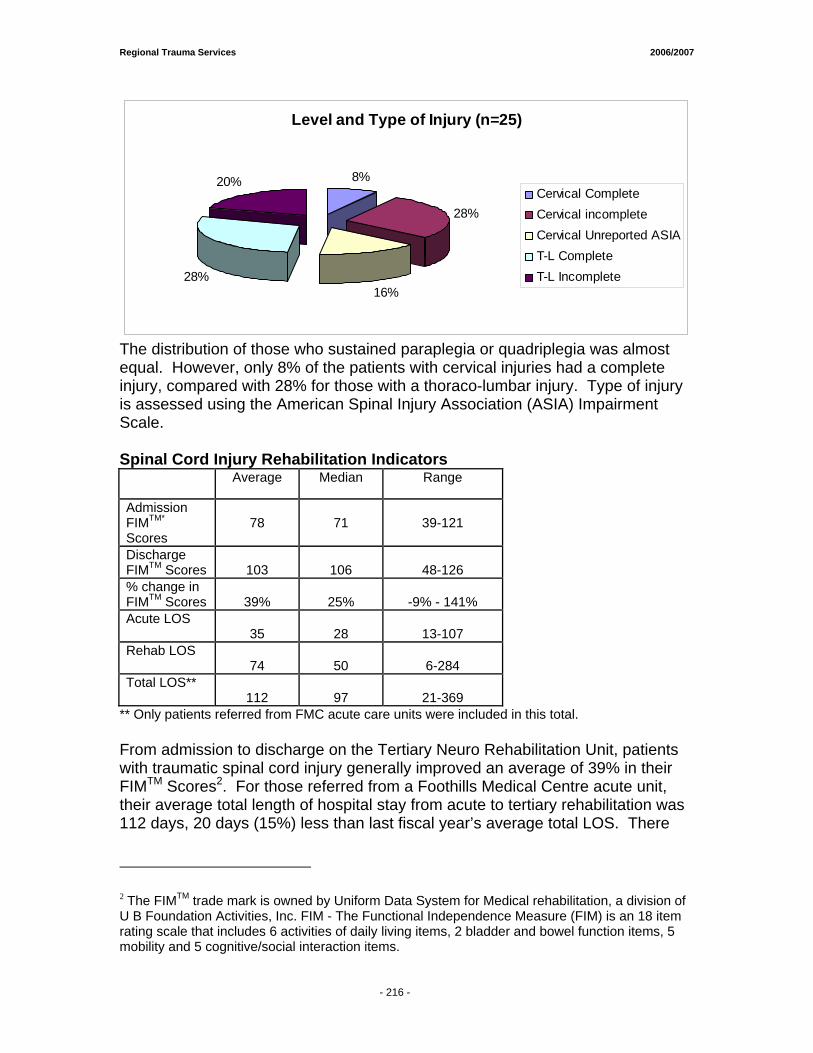
Regional Trauma Services 2006/2007
- 214 -
Level and Type of Injury (n=25)
8%
28%
16%28%
20%Cervical CompleteCervical incompleteCervical Unreported ASIAT-L CompleteT-L Incomplete
The distribution of those who sustained paraplegia or quadriplegia was almost equal. However, only 8% of the patients with cervical injuries had a complete injury, compared with 28% for those with a thoraco-lumbar injury. Type of injury is assessed using the American Spinal Injury Association (ASIA) Impairment Scale. Spinal Cord Injury Rehabilitation Indicators
** Only patients referred from FMC acute care units were included in this total. From admission to discharge on the Tertiary Neuro Rehabilitation Unit, patients with traumatic spinal cord injury generally improved an average of 39% in their FIMTM Scores2. For those referred from a Foothills Medical Centre acute unit, their average total length of hospital stay from acute to tertiary rehabilitation was 112 days, 20 days (15%) less than last fiscal year’s average total LOS. There
2 The FIMTM trade mark is owned by Uniform Data System for Medical rehabilitation, a division of U B Foundation Activities, Inc. FIM - The Functional Independence Measure (FIM) is an 18 item rating scale that includes 6 activities of daily living items, 2 bladder and bowel function items, 5 mobility and 5 cognitive/social interaction items.
Average Median Range
Admission FIMTM* Scores
78
71
39-121
Discharge FIMTM Scores
103
106
48-126
% change in FIMTM Scores
39%
25%
-9% - 141%
Acute LOS 35
28
13-107
Rehab LOS 74
50
6-284
Total LOS** 112
97
21-369
- 216 -
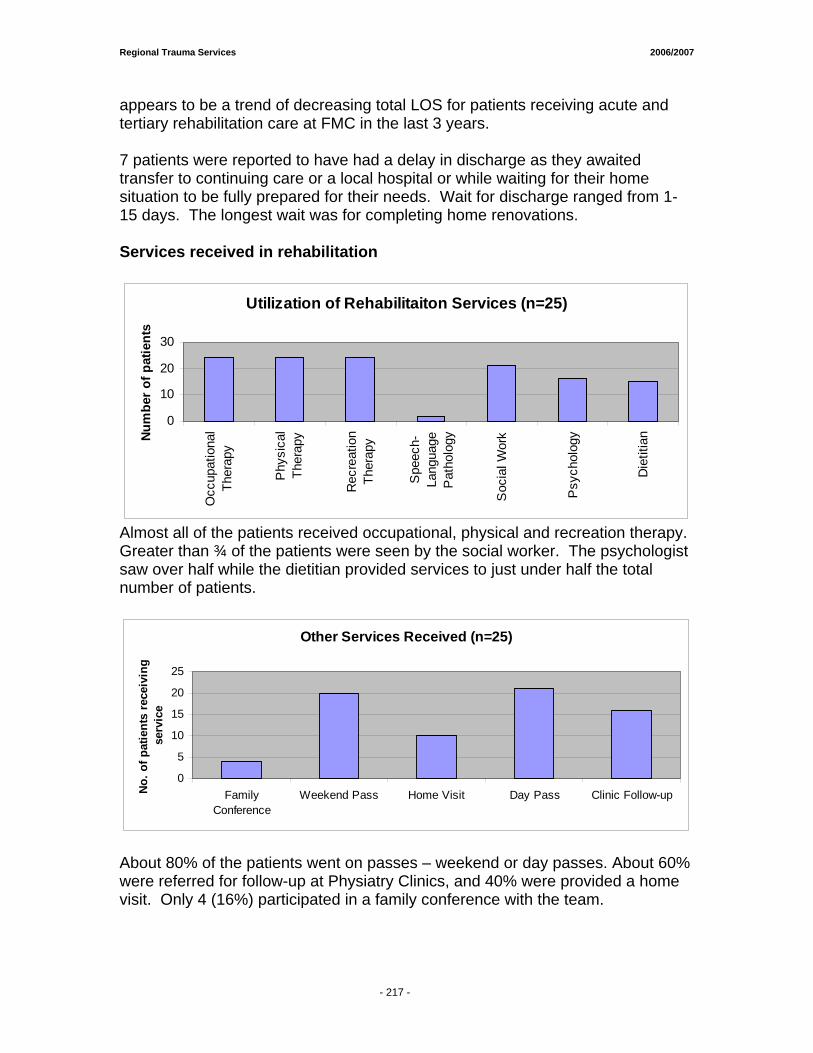
Regional Trauma Services 2006/2007
- 214 -
appears to be a trend of decreasing total LOS for patients receiving acute and tertiary rehabilitation care at FMC in the last 3 years. 7 patients were reported to have had a delay in discharge as they awaited transfer to continuing care or a local hospital or while waiting for their home situation to be fully prepared for their needs. Wait for discharge ranged from 1-15 days. The longest wait was for completing home renovations. Services received in rehabilitation
Utilization of Rehabilitaiton Services (n=25)
0
10
20
30
Occ
upat
iona
lTh
erap
y
Phy
sica
lTh
erap
y
Rec
reat
ion
Ther
apy
Spe
ech-
Lang
uage
Pat
holo
gy
Soc
ial W
ork
Psy
chol
ogy
Die
titia
nNum
ber o
f pat
ient
s
Almost all of the patients received occupational, physical and recreation therapy. Greater than ¾ of the patients were seen by the social worker. The psychologist saw over half while the dietitian provided services to just under half the total number of patients.
Other Services Received (n=25)
0
5
10
15
20
25
FamilyConference
Weekend Pass Home Visit Day Pass Clinic Follow-upNo.
of p
atie
nts
rece
ivin
g se
rvic
e
About 80% of the patients went on passes – weekend or day passes. About 60% were referred for follow-up at Physiatry Clinics, and 40% were provided a home visit. Only 4 (16%) participated in a family conference with the team.
- 217 -
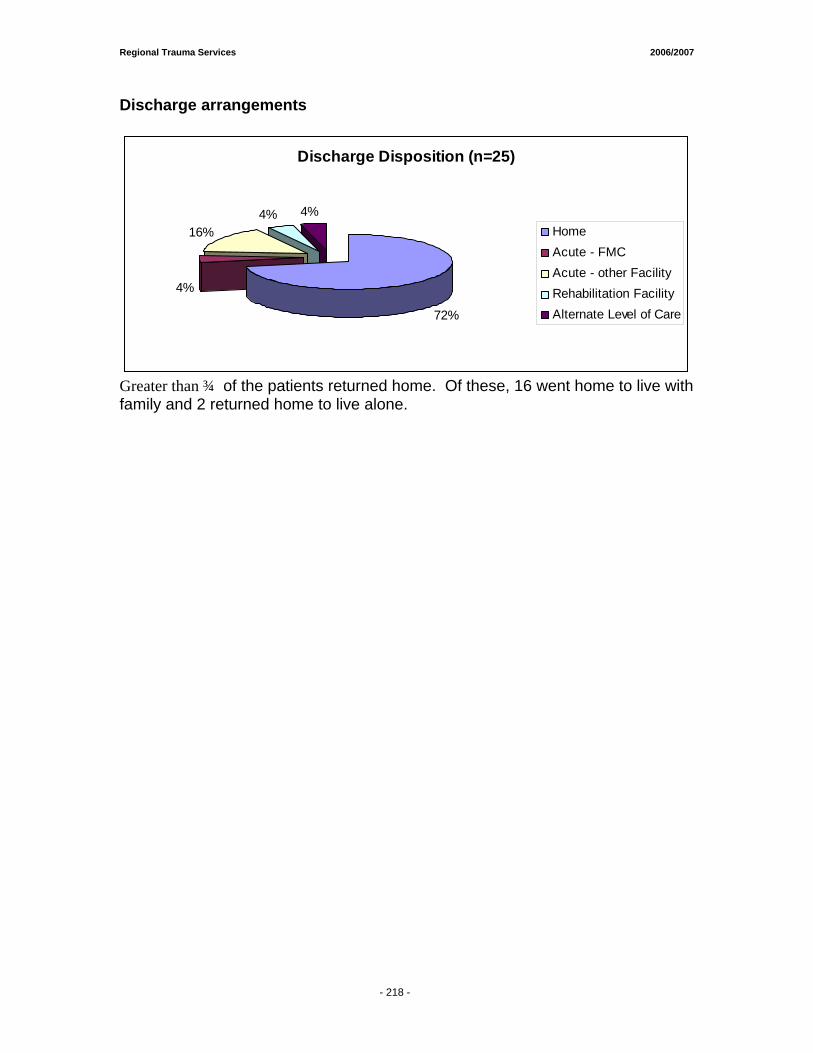
Regional Trauma Services 2006/2007
- 214 -
Discharge arrangements
Discharge Disposition (n=25)
72%
4%
16%4% 4%
HomeAcute - FMCAcute - other FacilityRehabilitation FacilityAlternate Level of Care
Greater than ¾ of the patients returned home. Of these, 16 went home to live with family and 2 returned home to live alone.
- 218 -

22000066 -- 22000077 RREEPPOORRTT Appendices AAPPPPEENNDDIIXX AA :: TTRRAAUUMMAA RREESSEEAARRCCHH PPUUBBLLIICCAATTIIOONNSS
AAPPPPEENNDDIIXX BB:: TTRRAAUUMMAA RREESSEEAARRCCHH FFUUNNDDIINNGG SSUUMMMMAARRYY
AAPPPPEENNDDIIXX CC:: PPRROOFFIILLEE OOFF IINNJJUURRIIEESS IINN TTHHEE CCAALLGGAARRYY HHEEAALLTTHH RREEGGIIOONN RREEPPOORRTT

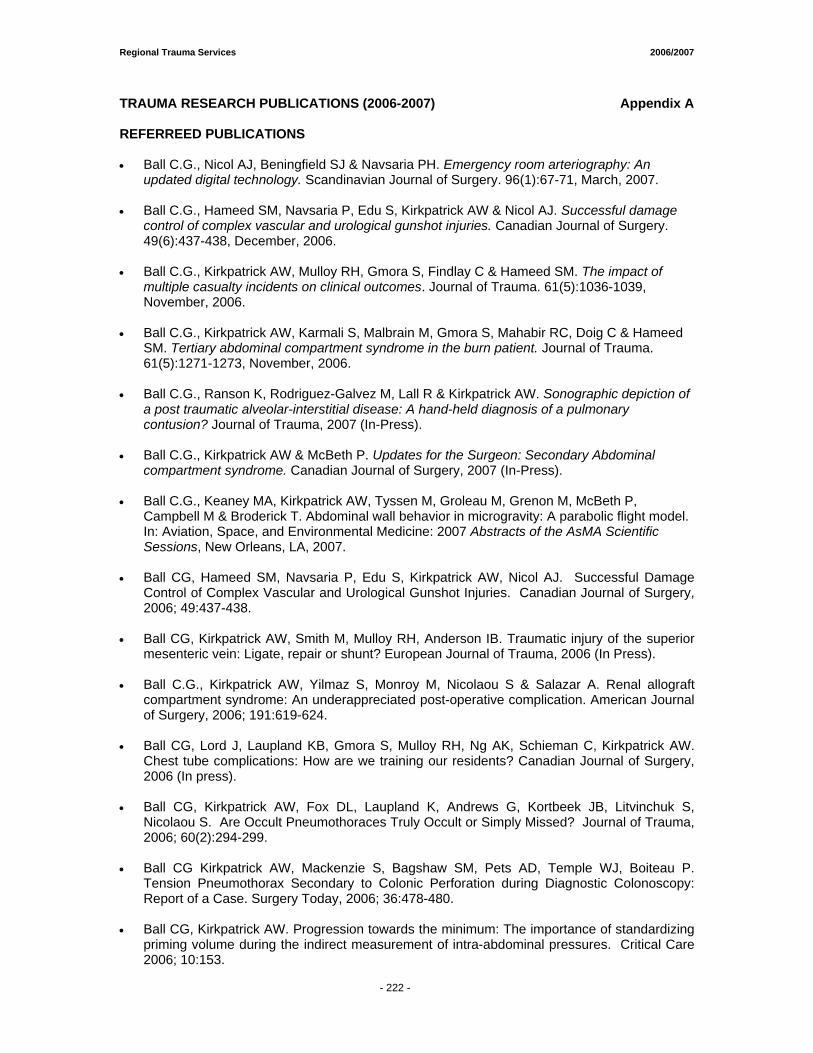
Regional Trauma Services 2006/2007
- 222 -
TRAUMA RESEARCH PUBLICATIONS (2006-2007) Appendix A REFERREED PUBLICATIONS • Ball C.G., Nicol AJ, Beningfield SJ & Navsaria PH. Emergency room arteriography: An
updated digital technology. Scandinavian Journal of Surgery. 96(1):67-71, March, 2007. • Ball C.G., Hameed SM, Navsaria P, Edu S, Kirkpatrick AW & Nicol AJ. Successful damage
control of complex vascular and urological gunshot injuries. Canadian Journal of Surgery. 49(6):437-438, December, 2006.
• Ball C.G., Kirkpatrick AW, Mulloy RH, Gmora S, Findlay C & Hameed SM. The impact of
multiple casualty incidents on clinical outcomes. Journal of Trauma. 61(5):1036-1039, November, 2006.
• Ball C.G., Kirkpatrick AW, Karmali S, Malbrain M, Gmora S, Mahabir RC, Doig C & Hameed
SM. Tertiary abdominal compartment syndrome in the burn patient. Journal of Trauma. 61(5):1271-1273, November, 2006.
• Ball C.G., Ranson K, Rodriguez-Galvez M, Lall R & Kirkpatrick AW. Sonographic depiction of
a post traumatic alveolar-interstitial disease: A hand-held diagnosis of a pulmonary contusion? Journal of Trauma, 2007 (In-Press).
• Ball C.G., Kirkpatrick AW & McBeth P. Updates for the Surgeon: Secondary Abdominal
compartment syndrome. Canadian Journal of Surgery, 2007 (In-Press). • Ball C.G., Keaney MA, Kirkpatrick AW, Tyssen M, Groleau M, Grenon M, McBeth P,
Campbell M & Broderick T. Abdominal wall behavior in microgravity: A parabolic flight model. In: Aviation, Space, and Environmental Medicine: 2007 Abstracts of the AsMA Scientific Sessions, New Orleans, LA, 2007.
• Ball CG, Hameed SM, Navsaria P, Edu S, Kirkpatrick AW, Nicol AJ. Successful Damage
Control of Complex Vascular and Urological Gunshot Injuries. Canadian Journal of Surgery, 2006; 49:437-438.
• Ball CG, Kirkpatrick AW, Smith M, Mulloy RH, Anderson IB. Traumatic injury of the superior
mesenteric vein: Ligate, repair or shunt? European Journal of Trauma, 2006 (In Press). • Ball C.G., Kirkpatrick AW, Yilmaz S, Monroy M, Nicolaou S & Salazar A. Renal allograft
compartment syndrome: An underappreciated post-operative complication. American Journal of Surgery, 2006; 191:619-624.
• Ball CG, Lord J, Laupland KB, Gmora S, Mulloy RH, Ng AK, Schieman C, Kirkpatrick AW.
Chest tube complications: How are we training our residents? Canadian Journal of Surgery, 2006 (In press).
• Ball CG, Kirkpatrick AW, Fox DL, Laupland K, Andrews G, Kortbeek JB, Litvinchuk S,
Nicolaou S. Are Occult Pneumothoraces Truly Occult or Simply Missed? Journal of Trauma, 2006; 60(2):294-299.
• Ball CG Kirkpatrick AW, Mackenzie S, Bagshaw SM, Pets AD, Temple WJ, Boiteau P.
Tension Pneumothorax Secondary to Colonic Perforation during Diagnostic Colonoscopy: Report of a Case. Surgery Today, 2006; 36:478-480.
• Ball CG, Kirkpatrick AW. Progression towards the minimum: The importance of standardizing
priming volume during the indirect measurement of intra-abdominal pressures. Critical Care 2006; 10:153.
Regional Trauma Services 2006/2007
- 222 -
• Ball CG, Kirkpatrick AW, Fox D, Louis L, Laupland K, Kortbeek J, Litvinchuk L, Hameed SM, Nicolaou S. Occult or missed? A retrospective re-review of post-traumatic “occult” pneumothoraces. J Trauma 2006;60:294-299.
• Ball CG, Ball JE, Kirkpatrick AW, Mulloy RH. Equestrian injuries: Prevalence, injury patterns and risk factors for 10 years of major traumatic injuries. Am J Surg 2007;193:636-640.
• Bhidhatghan A, Katz NR, Hudon M, Clark AW, Hurlbert RJ, Zochodne DW. Primary angiitis of the spinal cord presenting as a conus mass: long-term remission. Surg Neurology 66: 622-626, 2006.
• Buckley,R. Canadian Orthopaedic Trauma Society – Reamed versus Unreamed Intramedullary Nailing in the Femur: Comparison of the rate of ARDS in multiple injured patients. Journal of Orthopaedic Trauma, 2006, 20(6), p 384-387.
• Cafferty WB, Yang SH, Duffy PJ, Li S, Strittmatter SM. Functional axonal regeneration through astrocytic scar genetically modified to digest chondroitin sulfate proteoglycans. J Neurosci. 2007 Feb 28; 27(9), p 2176-2185.
• Canadian Orthopaedic Trauma Society – Open Reduction Internal Fixation Compared with Circular Fixator Application for Bicondylar Tibial Plateau Fractures: Results of a Multi-Centre, Prospective Randomized Clinical Trial. JBJSW(A), 2006, 88A, p 2613-2623.
• Dvorak MF, Collins JB, Murnaghan L, Hurlbert RJ, Fehlins MG, Fox R, Hedden D, Ramspersaud YR, Bouchard J, Guy P, Fisher CG. Confidence in Spinal Training among senior neurosurgical and orthopaedic residents. Spine 31(7): 831-837, 2006
• Fong SY, duPlessis SJ, Casha S, Hulbert RJ. Design limitations of Bryan disc arthroplasty. The Science Journal 6:233-241, 2006.
• Goecke ME, Kirkpatrick AW, Laupland KB, Bicanic M, Findlay C. Characteristics and conviction rates of injured alcohol-impaired drivers admitted to a tertiary care Canadian trauma centre. Clin Investigative Med (in press).
• Harrop JS, Vaccaro AR, Hurlert RJ, et al. Intra-rater and inter-rater reliability and validity in the assessment of the mechanism of injury and integrity of the posterior ligamentus complex: a novel injury severity scoring system for thoracolumbar injuries. J of Neurosurgery Spine 4:118-122, 2006.
• Hui C, Jorgensen I, Buckley R, Fick G. Incidence of intramedullary nail removal after femoral shaft fracture healing. Can J Surg. 2007 Feb; 50(1), p. 13-18.
• Hurlbert RJ. Strategies of medical intervention in the management of acute spinal cord injury. Spine 31(11) suppl: S16-S21, 2006
• Hurlbert RJ. The impact of methylprednisolone on lesion severity following spinal cord injury: Point of View. Spine 32(3): 379-380, 2007.
• Hurlbert RJ: Point of View (The impact of methylprednisolone on lesion severity following spinal cord injury). Spine 32(3): 379-380, 2007.
• Karmali S, Evans D, Findlay C , Bergeron E, Laupland KB, Charyk T, Parry N, Khetarpal S, Kirkpatrick AW for the Canadian Trauma Trials Collaborative (CTTC). To close or not to close, that’s one of the questions: Perceptions of Trauma Association of Canada Member surgeons regarding the open abdomen management. J Trauma 2006;60:287-293.
• Kirkpatrick AW, Laupland KB, Karmali S, Bergeron E, Charyk Stewart, Findlay C, Parry N, Khetarpal S, Evans SD. Spill your guts! Perceptions of the Trauma Association of Canada member surgeons regarding the open abdomen and the abdominal compartment syndrome. J Trauma 2006;60:279-286.
• Kirkpatrick AW, Ball CG, Nicolaou S, Ledgerwood A, Lucas C. Ultrasound detection of right
sided diaphragmatic injury; The “Liver Sliding” sign. Am J Emerg Med (first & corresponding author)(Am J Emerg Med 2006;24:251-252).
- 223 -
Regional Trauma Services 2006/2007
- 222 -
• Kirkpatrick AW, Balogh Z, Ball CG, Ahmed N, Chun R, McBeth P, Kirby A, Zygun D. The secondary abdominal compartment syndrome: Iatrogenic or unavoidable? J Am Coll Surg (first & senior author) (2006;202:668-679).
• Kirkpatrick AW, Ball CG, D’Amours SKD, Zygun D, Chun R, Kortbeek JB, Hameed SM. Acute resuscitation of the unstable adult trauma patient: Bedside diagnosis and therapy. Can J Surg (in press).
• Kirkpatrick AW, Melton S, Hamilton DR, Jones J, Campbell MR, Nicolaou S, Dulchavsky S, Beck G, Sargsyan A. Evaluating trauma sonography for operation use in the microgravity environment. Aviat Space Environ Med (in press).
• Kirkpatrick AW, Colistro R, Fox DL, Laupland KB, Konkin D, Kock V, Mayo JR, Nicolaou S. Renal arterial resistive index response to intra-abdominal hypertension in a porcine model. Crit Care Med(in press)
• Kirkpatrick AW, vanWijngaarden-Stephens M, Fabian T. Evidence based reviews in surgery A collaborative project of The Canadian association of General Surgeons & The American College of Surgeons: Treatment of occult pneumothoraces from blunt trauma. Can J Surg 2006;49:358-361.
• Kirkpatrick AW, Ball CG, Rodriguez-Galvez M, Chun R. Sonographic depiction of the needle decompression of a tension hemo/pneumothorax. J Trauma (in press).
• Kirkpatrick AW. Clinician-performed focused trauma sonography for the resuscitation of trauma. Crit Care Med (in press).
• Kirkpatrick AW, Blaivas M, Sustic A. Introduction to the use of ultrasound in critical care medicine. Crit Care Med 2007;35:S123-125.
• Kirkpatrick AW, Laupland KB. “The higher the abdominal pressure the less the secretion of urine”: Another target disease for renal ultrasongraphy? Crit Care Med 2007;35:S206-S207.
• Laupland KB, Zuege D, Kirkpatrick AW, Kortbeek JB. Long-term mortality outcome associated with prolonged admission to the intensive care unit. Chest 2006;129:954-959.
• Laupland KB, Karmali S, Kirkpatrick AW, Crowshoe L, Hameed SM. Distribution and determinants of critical illness among status Aboriginal Canadians. A population-based assessment. J Crit Care 2006;21:243-247.
• Malbrain ML, Cheatham ML, Kirkpatrick A, Sugrue M, Parr M, De Waele J, Balogh Z, Leppaniemia A, Olvera C, Ivatury R, DiAmours S, Wendon J, Hillman K, Johansson K, Kolkman K, Wilmer A. Results from the International Conference of Experts on Intra-abdominal Hypertension and Abdominal Compartment Syndrome. I. Definitions. Int Care Med 2006;32:1722-32.
• Malbrain ML, Cheatham ML, Kirkpatrick A, Sugrue M, Parr M, De Waele J, Balogh Z, Leppaniemia A, Olvera C, Ivatury R, DiAmours S, Wendon J, Hillman K, Johansson K, Kolkman K, Wilmer A. Results from the International Conference of Experts on Intra-abdominal Hypertension and Abdominal Compartment Syndrome. II. Recommendations. Int Care Med 2007 (Epub Mar 22).
• Lim MR, Vaccaro AR, Lee JY, Zeiller S, SanFilippo J, Hurlbert RJ, et al. The throacolumbar injury severity scale and score (TLISS): inter-physician and inter-disciplinary validation of a new paradigm for the treatment of thoracolumbar spine trauma. Coluna/Columna 5(3):157-164, 2006.;1-10, 2006.
• McBeth PB, Zygun DA, Widder S, Cheatham M, Zengerink I, Glowa J, Kirkpatrick AW. The effect of patient positioning on intra-abdominal pressure monitoring. Am J Surg 2007;193:644-647.
• Schieman C, Ball CG, Boucher P, Dixon E, Kirkpatrick AW. Extravasation of intravenous contrast into the mediastinum. Injury Extra 2006;37:173-175.
- 224 -
Regional Trauma Services 2006/2007
- 222 -
• Schneidereit N, Simons RK, Nicolaou S, Brown DR, Kirkpatrick AW, Redekop G, McKevitt E, German E. Utility of screening for blunt vascular neck injuries with computed tomographic angiography. J Trauma 2006;60:209-216.
• Vaccaro AR, Lim M, Hurlbert RJ, et al. Surgical decision making for unstable thoracolumbar spine injuries: results of a consensus panel review by the spine trauma study group. Journal of Spine Disorders and Techniques 19(1)2006.
• Xie J, Hurlbert RJ. Discectomy versus discectomy with fusion versus discectomy with fusion and instrumentation: a perspective randomized study. Neurosurgery 61(1):107-117, 2007.
BOOKS Book Editor • AO Manual of Fracture Management – Internal Fixtures. Author: Michael Wagner, Co-Editor:
Richard Buckley Emanual Gauthier, Michael Schutz, Christoph Sommer. Thieme Publishing with A Publishing, 2006.
Section Editor • The Secondary Abdominal Compartment Syndrome. In: Ivatury R, Chang M, Cheatham M,
Malbrain M, Sugrue M (Editors). The Abdominal Compartment Syndrome, Landes Bioscience, Georgetown TX 2006. Chapters
• AO Principles of Frcture Management. Buckley R, Nork S. Thieme Publishing, 2006. Chapter Title “Calcaneal and Talar Fractures.
• AO Principles of Frcture Management. Buckley R, Johnson E.Thieme Publishing, 2006. Chapter Title: Chronic Infection.
• Casha S, Silvaggio J, Hurlbert RJ. Pharmacotherapy for spinal cord injury in Surgical Management of Spinal Cord Injury: Controversies and Consensus, Amar AP (ed). Blackwell Futura, Malden Mass., 18-33, 2007.
• Kirkpatrick AW, Salazar A, Elliot D, Nicolaou S. The renal allograft compartment syndrome in perspective: An organ specific compartment syndrome with illustrative pathophysiology. In: Ivatury R, Chang M, Cheatham M, Malbrain M, Sugrue M (Editors). The Abdominal Compartment Syndrome, Landes Bioscience, Georgetown, TX, 2006: 203-209.
PUBLISHED ABSTRACTS Abstracts of Papers presented at the Annual Scientific Meeting of the Trauma Association of Canada (May 10-12, 2007) Journal of Trauma March 2007 (63:3 pp.787-804) • Dyer DM, Findlay C. Trauma Registry: A data source for economic and resource
predictions. [abstr] Journal of Trauma, 2007; 62: 804. • Litvinchuk S, Jackson B, Serra K, Taillefer S. Treatment and follow-up of mild traumatic
brain injuries – How do we treat patients with a negative CT? [abstr] Journal of Trauma, 2007: 62: 798.
• Widder S, Zygun D, Ranson K, Knox L, Laupland K, Laird P, Ball C, Kirkpatrick A. Use of near-infrared spectroscopy as a physiologic monitor for intra-abdominal hypertension. [abstr] Journal of Trauma, 2007; 62: 795.
• Zengerink I, McBeth P, Zygun D, Ranson K, Widder S, Ball C, Kirkpatrick A. An abnormal continuous intra-abdominal pressure measurement should be confirmed when the abdominal compartment syndrome is suspect. [abstr] Journal of Trauma, 2007; 62: 791.
- 225 -
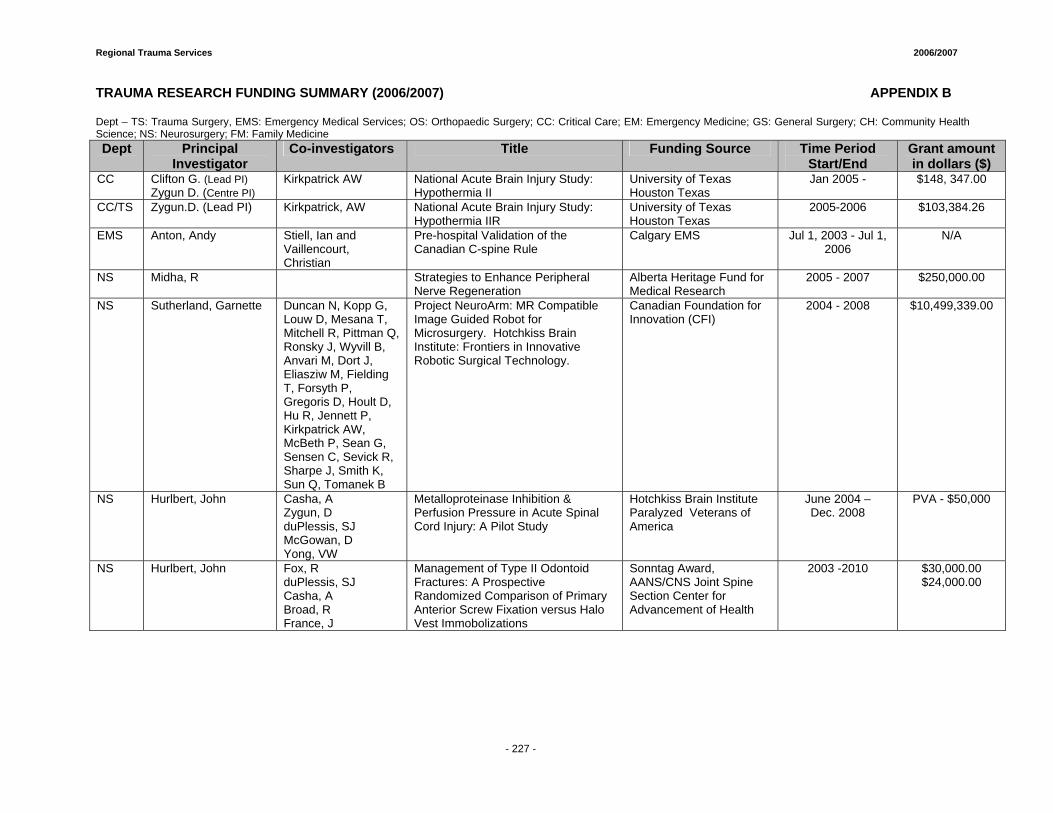
Regional Trauma Services 2006/2007
- 227 -
TRAUMA RESEARCH FUNDING SUMMARY (2006/2007) APPENDIX B Dept – TS: Trauma Surgery, EMS: Emergency Medical Services; OS: Orthopaedic Surgery; CC: Critical Care; EM: Emergency Medicine; GS: General Surgery; CH: Community Health Science; NS: Neurosurgery; FM: Family Medicine Dept Principal
Investigator Co-investigators Title Funding Source Time Period
Start/End Grant amount in dollars ($)
CC Clifton G. (Lead PI) Zygun D. (Centre PI)
Kirkpatrick AW National Acute Brain Injury Study: Hypothermia II
University of Texas Houston Texas
Jan 2005 - $148, 347.00
CC/TS Zygun.D. (Lead PI)
Kirkpatrick, AW National Acute Brain Injury Study: Hypothermia IIR
University of Texas Houston Texas
2005-2006 $103,384.26
EMS Anton, Andy Stiell, Ian and Vaillencourt, Christian
Pre-hospital Validation of the Canadian C-spine Rule
Calgary EMS Jul 1, 2003 - Jul 1, 2006
N/A
NS Midha, R Strategies to Enhance Peripheral Nerve Regeneration
Alberta Heritage Fund for Medical Research
2005 - 2007 $250,000.00
NS Sutherland, Garnette Duncan N, Kopp G, Louw D, Mesana T, Mitchell R, Pittman Q, Ronsky J, Wyvill B, Anvari M, Dort J, Eliasziw M, Fielding T, Forsyth P, Gregoris D, Hoult D, Hu R, Jennett P, Kirkpatrick AW, McBeth P, Sean G, Sensen C, Sevick R, Sharpe J, Smith K, Sun Q, Tomanek B
Project NeuroArm: MR Compatible Image Guided Robot for Microsurgery. Hotchkiss Brain Institute: Frontiers in Innovative Robotic Surgical Technology.
Canadian Foundation for Innovation (CFI)
2004 - 2008 $10,499,339.00
NS Hurlbert, John Casha, A Zygun, D duPlessis, SJ McGowan, D Yong, VW
Metalloproteinase Inhibition & Perfusion Pressure in Acute Spinal Cord Injury: A Pilot Study
Hotchkiss Brain Institute Paralyzed Veterans of America
June 2004 – Dec. 2008
PVA - $50,000
NS Hurlbert, John Fox, R duPlessis, SJ Casha, A Broad, R France, J
Management of Type II Odontoid Fractures: A Prospective Randomized Comparison of Primary Anterior Screw Fixation versus Halo Vest Immobolizations
Sonntag Award, AANS/CNS Joint Spine Section Center for Advancement of Health
2003 -2010 $30,000.00 $24,000.00
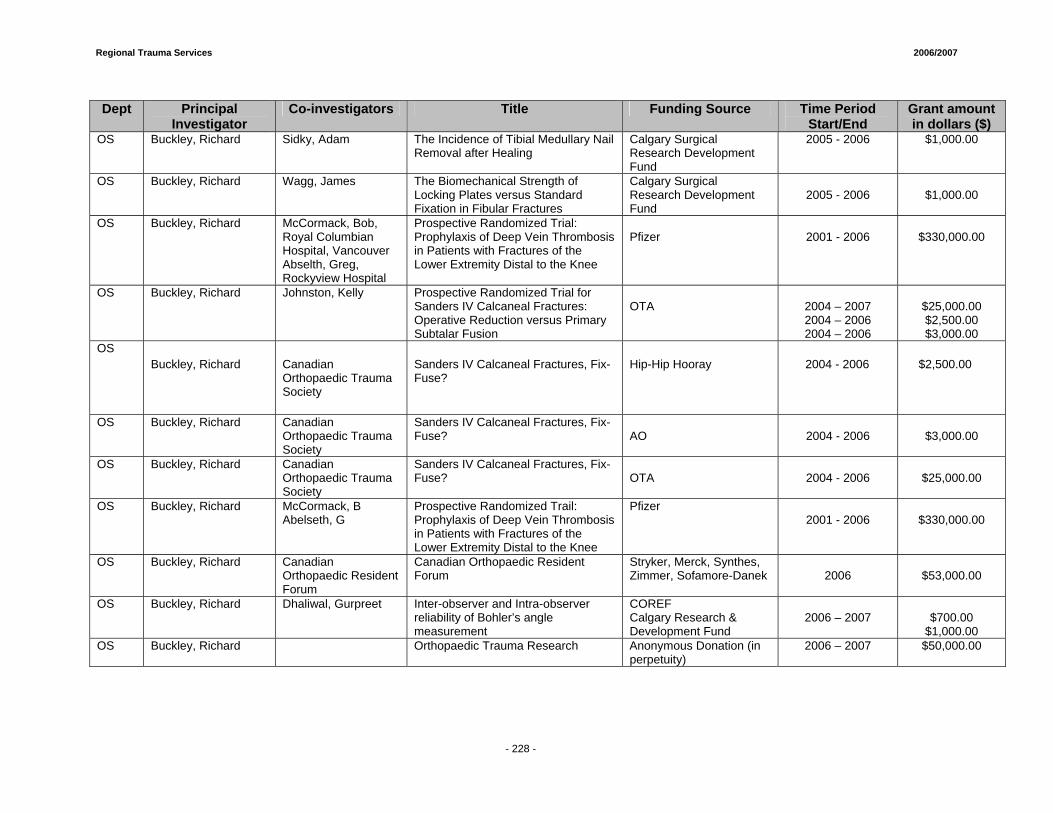
Regional Trauma Services 2006/2007
- 228 -
Dept Principal
Investigator Co-investigators Title Funding Source Time Period
Start/End Grant amount in dollars ($)
OS Buckley, Richard Sidky, Adam The Incidence of Tibial Medullary Nail Removal after Healing
Calgary Surgical Research Development Fund
2005 - 2006 $1,000.00
OS Buckley, Richard Wagg, James The Biomechanical Strength of Locking Plates versus Standard Fixation in Fibular Fractures
Calgary Surgical Research Development Fund
2005 - 2006
$1,000.00
OS Buckley, Richard McCormack, Bob, Royal Columbian Hospital, Vancouver Abselth, Greg, Rockyview Hospital
Prospective Randomized Trial: Prophylaxis of Deep Vein Thrombosis in Patients with Fractures of the Lower Extremity Distal to the Knee
Pfizer
2001 - 2006
$330,000.00
OS Buckley, Richard Johnston, Kelly Prospective Randomized Trial for Sanders IV Calcaneal Fractures: Operative Reduction versus Primary Subtalar Fusion
OTA
2004 – 2007 2004 – 2006 2004 – 2006
$25,000.00 $2,500.00 $3,000.00
OS Buckley, Richard Canadian
Orthopaedic Trauma Society
Sanders IV Calcaneal Fractures, Fix-Fuse?
Hip-Hip Hooray 2004 - 2006 $2,500.00
OS Buckley, Richard Canadian Orthopaedic Trauma Society
Sanders IV Calcaneal Fractures, Fix-Fuse?
AO
2004 - 2006
$3,000.00
OS Buckley, Richard Canadian Orthopaedic Trauma Society
Sanders IV Calcaneal Fractures, Fix-Fuse?
OTA
2004 - 2006
$25,000.00
OS Buckley, Richard McCormack, B Abelseth, G
Prospective Randomized Trail: Prophylaxis of Deep Vein Thrombosis in Patients with Fractures of the Lower Extremity Distal to the Knee
Pfizer 2001 - 2006
$330,000.00
OS Buckley, Richard Canadian Orthopaedic Resident Forum
Canadian Orthopaedic Resident Forum
Stryker, Merck, Synthes, Zimmer, Sofamore-Danek
2006
$53,000.00
OS Buckley, Richard Dhaliwal, Gurpreet Inter-observer and Intra-observer reliability of Bohler’s angle measurement
COREF Calgary Research & Development Fund
2006 – 2007
$700.00
$1,000.00 OS Buckley, Richard Orthopaedic Trauma Research Anonymous Donation (in
perpetuity) 2006 – 2007 $50,000.00
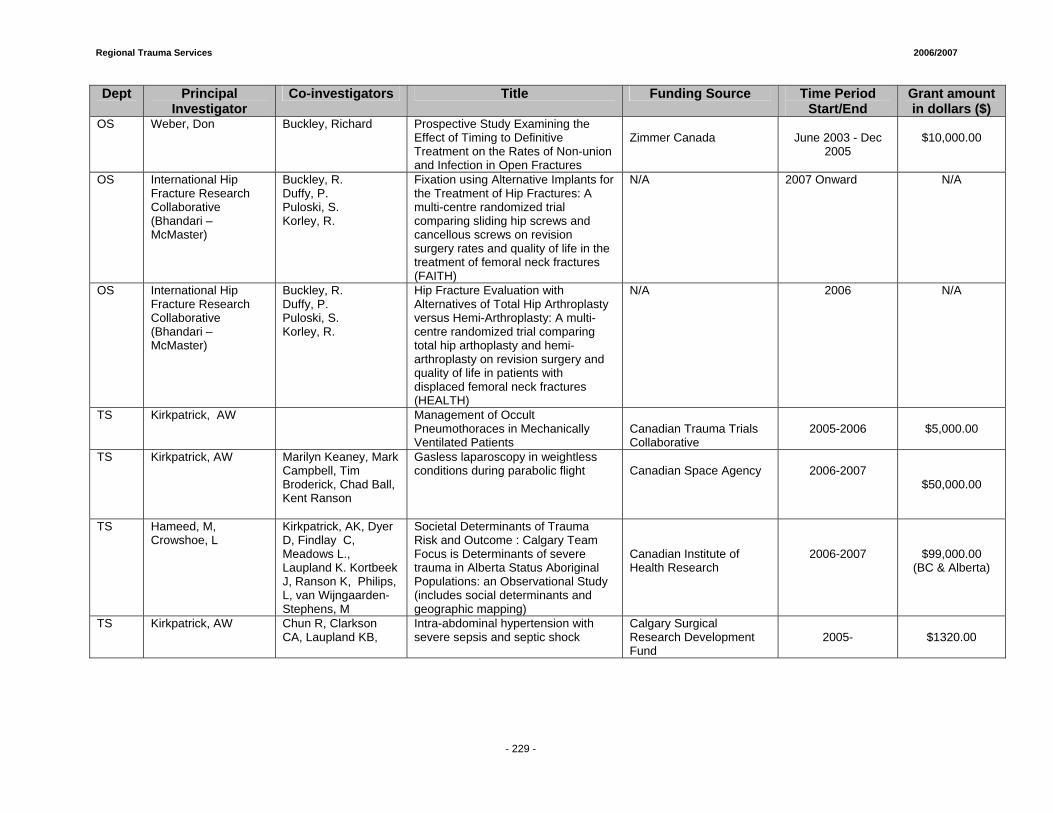
Regional Trauma Services 2006/2007
- 229 -
Dept Principal Investigator
Co-investigators Title Funding Source Time Period Start/End
Grant amount in dollars ($)
OS Weber, Don Buckley, Richard Prospective Study Examining the Effect of Timing to Definitive Treatment on the Rates of Non-union and Infection in Open Fractures
Zimmer Canada
June 2003 - Dec
2005
$10,000.00
OS International Hip Fracture Research Collaborative (Bhandari – McMaster)
Buckley, R. Duffy, P. Puloski, S. Korley, R.
Fixation using Alternative Implants for the Treatment of Hip Fractures: A multi-centre randomized trial comparing sliding hip screws and cancellous screws on revision surgery rates and quality of life in the treatment of femoral neck fractures (FAITH)
N/A 2007 Onward N/A
OS International Hip Fracture Research Collaborative (Bhandari – McMaster)
Buckley, R. Duffy, P. Puloski, S. Korley, R.
Hip Fracture Evaluation with Alternatives of Total Hip Arthroplasty versus Hemi-Arthroplasty: A multi-centre randomized trial comparing total hip arthoplasty and hemi-arthroplasty on revision surgery and quality of life in patients with displaced femoral neck fractures (HEALTH)
N/A 2006 N/A
TS Kirkpatrick, AW Management of Occult Pneumothoraces in Mechanically Ventilated Patients
Canadian Trauma Trials Collaborative
2005-2006
$5,000.00
TS Kirkpatrick, AW Marilyn Keaney, Mark Campbell, Tim Broderick, Chad Ball, Kent Ranson
Gasless laparoscopy in weightless conditions during parabolic flight
Canadian Space Agency
2006-2007
$50,000.00
TS Hameed, M, Crowshoe, L
Kirkpatrick, AK, Dyer D, Findlay C, Meadows L., Laupland K. Kortbeek J, Ranson K, Philips, L, van Wijngaarden-Stephens, M
Societal Determinants of Trauma Risk and Outcome : Calgary Team Focus is Determinants of severe trauma in Alberta Status Aboriginal Populations: an Observational Study (includes social determinants and geographic mapping)
Canadian Institute of Health Research
2006-2007
$99,000.00 (BC & Alberta)
TS Kirkpatrick, AW Chun R, Clarkson CA, Laupland KB,
Intra-abdominal hypertension with severe sepsis and septic shock
Calgary Surgical Research Development Fund
2005-
$1320.00
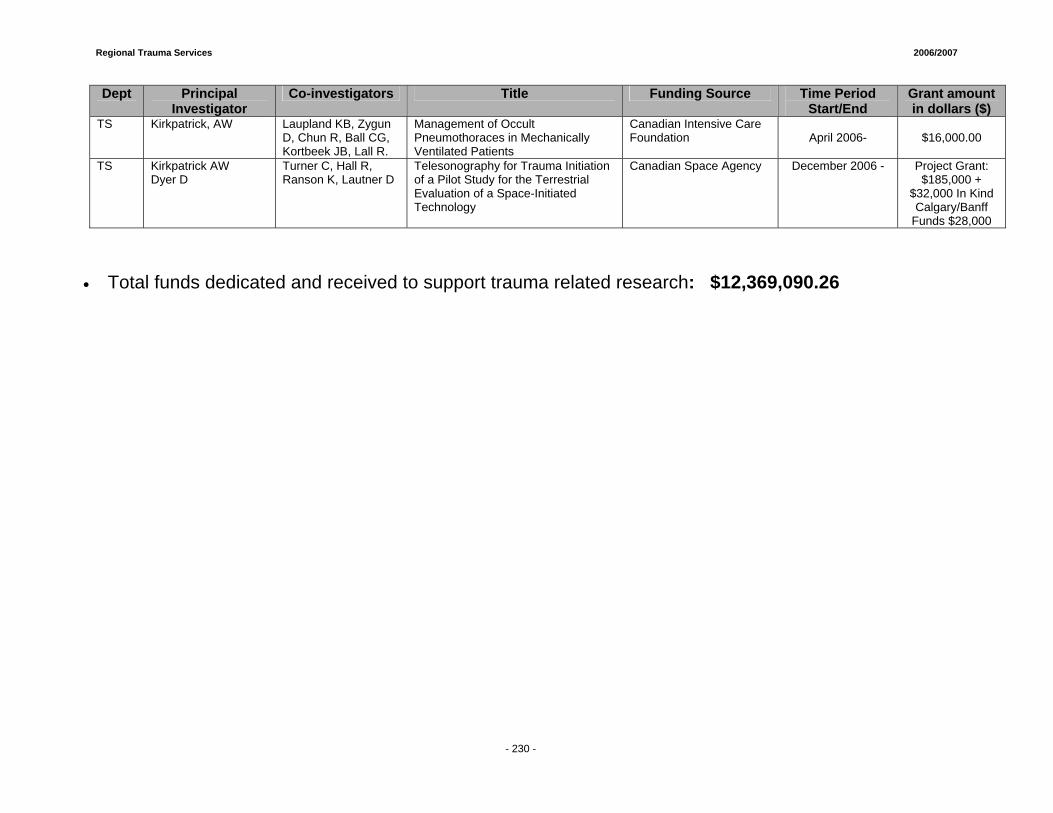
Regional Trauma Services 2006/2007
- 230 -
Dept Principal Investigator
Co-investigators Title Funding Source Time Period Start/End
Grant amount in dollars ($)
TS Kirkpatrick, AW Laupland KB, Zygun D, Chun R, Ball CG, Kortbeek JB, Lall R.
Management of Occult Pneumothoraces in Mechanically Ventilated Patients
Canadian Intensive Care Foundation
April 2006-
$16,000.00
TS Kirkpatrick AW Dyer D
Turner C, Hall R, Ranson K, Lautner D
Telesonography for Trauma Initiation of a Pilot Study for the Terrestrial Evaluation of a Space-Initiated Technology
Canadian Space Agency December 2006 - Project Grant: $185,000 +
$32,000 In Kind Calgary/Banff
Funds $28,000
• Total funds dedicated and received to support trauma related research: $12,369,090.26
Prepared by: Nancy Staniland, Manager Sherry Elnitsky, Research Project Coordinator February, 2008
Injury Prevention and Control Services Healthy Living, Wellness and Citizen Engagement http://www.calgaryhealthregion.ca/injuryprevetion
Profile of Injuries in the Calgary Health Region
April 2006 to March 2007

Regional Trauma Services 2006/2007
- 233 -
Profile of Injuries in the Calgary Health Region
April 2006 to March 2007 Injuries contribute significantly to the mortality and morbidity of region residents and have a significant impact on health care utilization and quality of life. Injury prevention is a priority of the Healthy Living business unit of the Southeast Community Portfolio. The Injury Prevention and Control Services team works across a number of regional programs and services and with diverse community partners to reduce the likelihood, frequency and severity of injuries in the Calgary Health Region. The profile of injuries in the Calgary Health Region (CHR) is updated annually in order to provide timely injury surveillance and to monitor the profile over time. The profile of injuries focuses on population based injury mortality and morbidity data (hospitalizations and emergency department visits). The profile provides an analysis of cause specific injury data by age and gender but underestimates the total burden of injury because it is based only on the most serious of injuries – those resulting in an emergency department visit, hospitalization or death. Data are not available for injuries that are presented at physicians’ offices and clinics or that are treated at home. Methodological Notes1
• All data are based on the regional boundaries as of December 2003 and were selected using ICD-10-CA codes.
• The most recent injury mortality data available from Alberta Health & Wellness Vital Statistics are for the calendar year 2005. The data include deaths to region residents.
• Injury morbidity data were obtained from CHR Health Records and include hospital and emergency department visits at all regional facilities by regional residents for the period April 2006 to March 2007.
• Hospital utilization is defined as the number of discharges or separations from acute care facilities. Emergency department utilization is defined as the number of admissions to emergency departments and, since 2003-04, urgent care visits to 8th & 8th Health Care Centre have been included. Urgent care visits to South Calgary Health Centre are also included after 2004-05.
• Hospital and emergency department data sets are not mutually exclusive. If a visit to an emergency department results in admission to hospital, that visit will be counted in both data sets.
• Workplace injuries are identified by method of payment (i.e., Worker’s Compensation Board payment). As such, workplace injuries are also included in the overall analysis of injury cause.
• Injury rates for 2006-07 are based on projected population estimates because actual population data for this period are not yet available. All rates based on previous fiscal years are defined using Alberta Health and Wellness population registry data.
• Additional historical data (mortality and utilization) are presented where possible. These comparisons are based on age adjusted rates that are calculated using the same standard population (provincial population for the period 2003-04) to reduce the potential confounding effect of age over time. The most recent year is compared statistically to the baseline year of 2002-03.
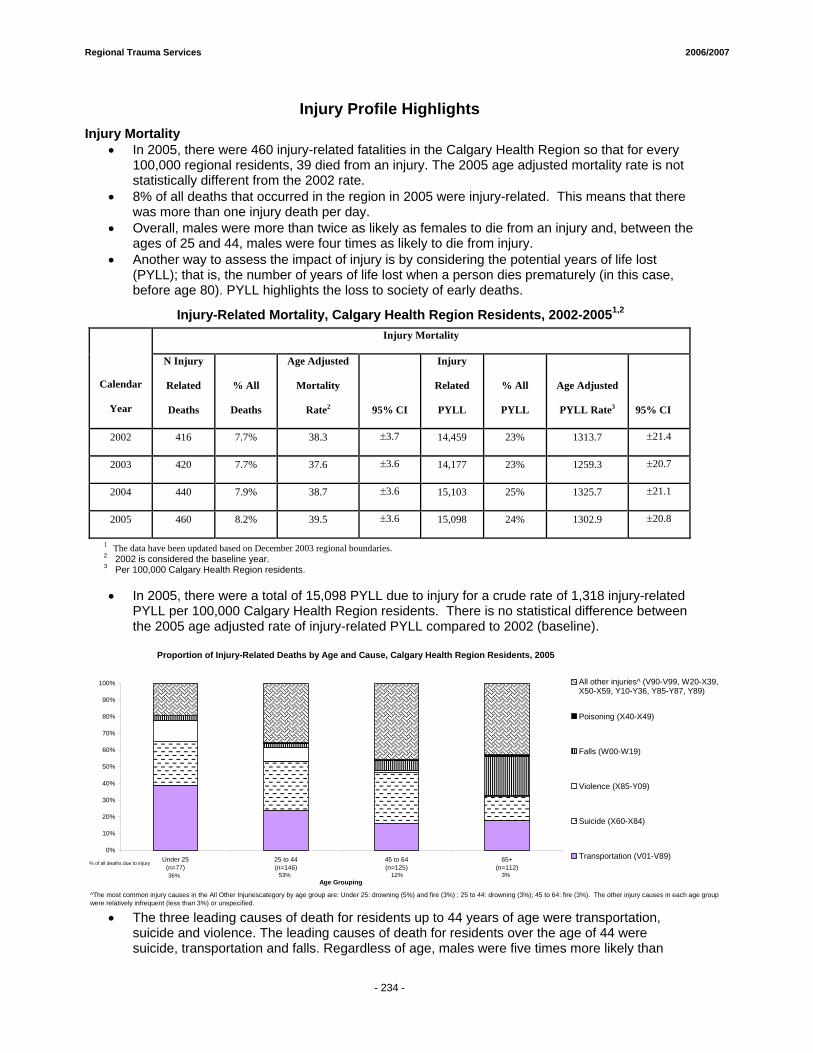
Regional Trauma Services 2006/2007
- 234 -
Injury Profile Highlights Injury Mortality
• In 2005, there were 460 injury-related fatalities in the Calgary Health Region so that for every 100,000 regional residents, 39 died from an injury. The 2005 age adjusted mortality rate is not statistically different from the 2002 rate.
• 8% of all deaths that occurred in the region in 2005 were injury-related. This means that there was more than one injury death per day.
• Overall, males were more than twice as likely as females to die from an injury and, between the ages of 25 and 44, males were four times as likely to die from injury.
• Another way to assess the impact of injury is by considering the potential years of life lost (PYLL); that is, the number of years of life lost when a person dies prematurely (in this case, before age 80). PYLL highlights the loss to society of early deaths.
Injury-Related Mortality, Calgary Health Region Residents, 2002-20051,2 Injury Mortality
Calendar
Year
N Injury
Related
Deaths
% All
Deaths
Age Adjusted
Mortality
Rate2 95% CI
Injury
Related
PYLL
% All
PYLL
Age Adjusted
PYLL Rate3 95% CI
2002 416 7.7% 38.3 ±3.7 14,459 23% 1313.7 ±21.4
2003 420 7.7% 37.6 ±3.6 14,177 23% 1259.3 ±20.7
2004 440 7.9% 38.7 ±3.6 15,103 25% 1325.7 ±21.1
2005 460 8.2% 39.5 ±3.6 15,098 24% 1302.9 ±20.8
1 The data have been updated based on December 2003 regional boundaries. 2 2002 is considered the baseline year. 3 Per 100,000 Calgary Health Region residents. • In 2005, there were a total of 15,098 PYLL due to injury for a crude rate of 1,318 injury-related
PYLL per 100,000 Calgary Health Region residents. There is no statistical difference between the 2005 age adjusted rate of injury-related PYLL compared to 2002 (baseline).
0%
10%
20%
30%
40%
50%
60%
70%
80%
90%
100%
Under 25(n=77)
25 to 44(n=146)
45 to 64(n=125)
65+(n=112)
Age Grouping
All other injuries^ (V90-V99, W20-X39,X50-X59, Y10-Y36, Y85-Y87, Y89)
Poisoning (X40-X49)
Falls (W00-W19)
Violence (X85-Y09)
Suicide (X60-X84)
Transportation (V01-V89)% of all deaths due to injury
3%12%53%36%
^The most common injury causes in the All Other Injuriescategory by age group are: Under 25: drowning (5%) and fire (3%) ; 25 to 44: drowning (3%); 45 to 64: fire (3%). The other injury causes in each age group were relatively infrequent (less than 3%) or unspecified.
Proportion of Injury-Related Deaths by Age and Cause, Calgary Health Region Residents, 2005
• The three leading causes of death for residents up to 44 years of age were transportation,
suicide and violence. The leading causes of death for residents over the age of 44 were suicide, transportation and falls. Regardless of age, males were five times more likely than
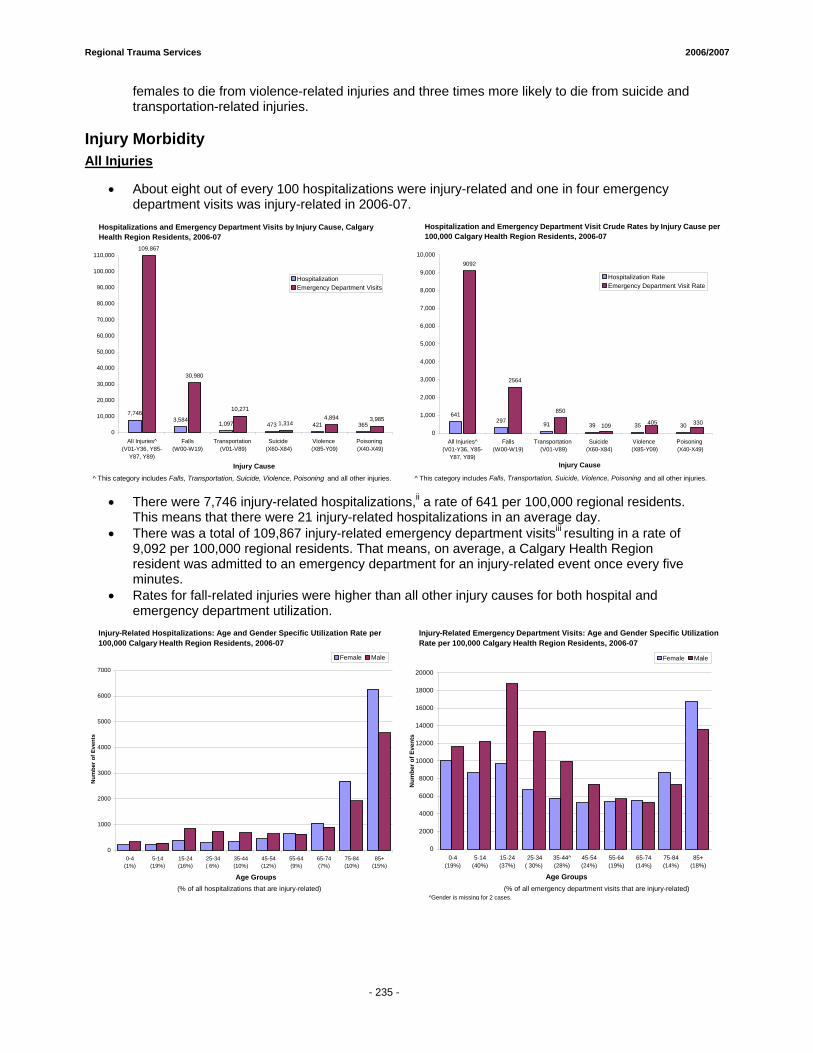
Regional Trauma Services 2006/2007
- 234 -
females to die from violence-related injuries and three times more likely to die from suicide and transportation-related injuries.
Injury Morbidity All Injuries
• About eight out of every 100 hospitalizations were injury-related and one in four emergency department visits was injury-related in 2006-07.
7,7463,584
1,097 473 421 365
109,867
30,980
10,271
1,3144,894 3,985
0
10,000
20,000
30,000
40,000
50,000
60,000
70,000
80,000
90,000
100,000
110,000
All Injuries^(V01-Y36, Y85-
Y87, Y89)
Falls(W00-W19)
Transportation (V01-V89)
Suicide (X60-X84)
Violence (X85-Y09)
Poisoning (X40-X49)
Injury Cause
HospitalizationEmergency Department Visits
641297 91 39 35 30
9092
2564
850
109 405 330
0
1,000
2,000
3,000
4,000
5,000
6,000
7,000
8,000
9,000
10,000
All Injuries^(V01-Y36, Y85-
Y87, Y89)
Falls(W00-W19)
Transportation (V01-V89)
Suicide (X60-X84)
Violence (X85-Y09)
Poisoning (X40-X49)
Injury Cause
Hospitalization RateEmergency Department Visit Rate
Hospitalizations and Emergency Department Visits by Injury Cause, Calgary Health Region Residents, 2006-07
Hospitalization and Emergency Department Visit Crude Rates by Injury Cause per 100,000 Calgary Health Region Residents, 2006-07
^ This category includes Falls, Transportation, Suicide, Violence, Poisoning and all other injuries. ^ This category includes Falls, Transportation, Suicide, Violence, Poisoning and all other injuries.
• There were 7,746 injury-related hospitalizations,ii a rate of 641 per 100,000 regional residents.
This means that there were 21 injury-related hospitalizations in an average day. • There was a total of 109,867 injury-related emergency department visitsiii resulting in a rate of
9,092 per 100,000 regional residents. That means, on average, a Calgary Health Region resident was admitted to an emergency department for an injury-related event once every five minutes.
• Rates for fall-related injuries were higher than all other injury causes for both hospital and emergency department utilization.
0
2000
4000
6000
8000
10000
12000
14000
16000
18000
20000
0-4 (19%)
5-14 (40%)
15-24 (37%)
25-34( 30%)
35-44^ (28%)
45-54 (24%)
55-64 (19%)
65-74 (14%)
75-84 (14%)
85+ (18%)
Age Groups
Num
ber o
f Eve
nts
Female Male
Injury-Related Emergency Department Visits: Age and Gender Specific Utilization Rate per 100,000 Calgary Health Region Residents, 2006-07
0
1000
2000
3000
4000
5000
6000
7000
0-4 (1%)
5-14 (19%)
15-24 (16%)
25-34( 6%)
35-44 (10%)
45-54 (12%)
55-64 (9%)
65-74 (7%)
75-84 (10%)
85+ (15%)
Age Groups
Num
ber o
f Eve
nts
Female Male
Injury-Related Hospitalizations: Age and Gender Specific Utilization Rate per 100,000 Calgary Health Region Residents, 2006-07
(% of all hospitalizations that are injury-related) (% of all emergency department visits that are injury-related)^Gender is missing for 2 cases.
- 235 -
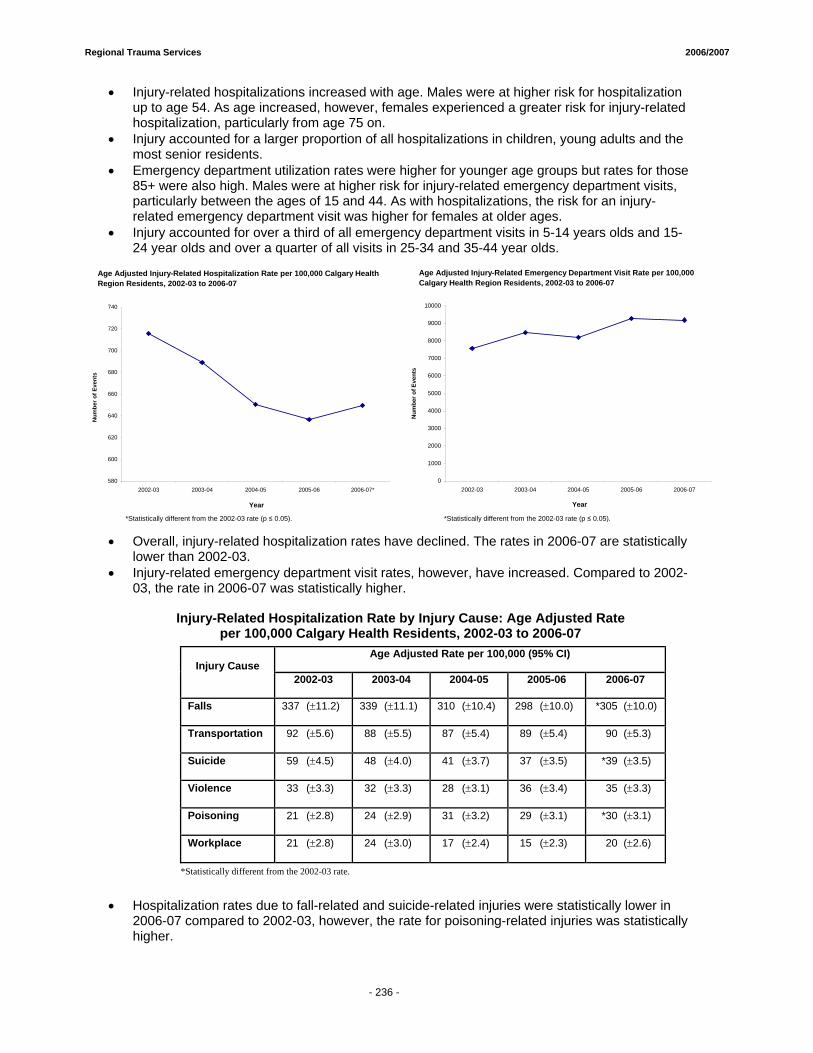
Regional Trauma Services 2006/2007
- 234 -
• Injury-related hospitalizations increased with age. Males were at higher risk for hospitalization up to age 54. As age increased, however, females experienced a greater risk for injury-related hospitalization, particularly from age 75 on.
• Injury accounted for a larger proportion of all hospitalizations in children, young adults and the most senior residents.
• Emergency department utilization rates were higher for younger age groups but rates for those 85+ were also high. Males were at higher risk for injury-related emergency department visits, particularly between the ages of 15 and 44. As with hospitalizations, the risk for an injury-related emergency department visit was higher for females at older ages.
• Injury accounted for over a third of all emergency department visits in 5-14 years olds and 15-24 year olds and over a quarter of all visits in 25-34 and 35-44 year olds.
580
600
620
640
660
680
700
720
740
2002-03 2003-04 2004-05 2005-06 2006-07*
Year
Num
ber o
f Eve
nts
0
1000
2000
3000
4000
5000
6000
7000
8000
9000
10000
2002-03 2003-04 2004-05 2005-06 2006-07
Year
Num
ber o
f Eve
nts
Age Adjusted Injury-Related Emergency Department Visit Rate per 100,000 Calgary Health Region Residents, 2002-03 to 2006-07
Age Adjusted Injury-Related Hospitalization Rate per 100,000 Calgary Health Region Residents, 2002-03 to 2006-07
*Statistically different from the 2002-03 rate (p ≤ 0.05).*Statistically different from the 2002-03 rate (p ≤ 0.05).
• Overall, injury-related hospitalization rates have declined. The rates in 2006-07 are statistically
lower than 2002-03. • Injury-related emergency department visit rates, however, have increased. Compared to 2002-
03, the rate in 2006-07 was statistically higher.
Injury-Related Hospitalization Rate by Injury Cause: Age Adjusted Rate per 100,000 Calgary Health Residents, 2002-03 to 2006-07
Age Adjusted Rate per 100,000 (95% CI) Injury Cause
2002-03 2003-04 2004-05 2005-06 2006-07
Falls 337 (±11.2) 339 (±11.1) 310 (±10.4) 298 (±10.0) *305 (±10.0)
Transportation 92 (±5.6) 88 (±5.5) 87 (±5.4) 89 (±5.4) 90 (±5.3)
Suicide 59 (±4.5) 48 (±4.0) 41 (±3.7) 37 (±3.5) *39 (±3.5)
Violence 33 (±3.3) 32 (±3.3) 28 (±3.1) 36 (±3.4) 35 (±3.3)
Poisoning 21 (±2.8) 24 (±2.9) 31 (±3.2) 29 (±3.1) *30 (±3.1)
Workplace 21 (±2.8) 24 (±3.0) 17 (±2.4) 15 (±2.3) 20 (±2.6)
*Statistically different from the 2002-03 rate.
• Hospitalization rates due to fall-related and suicide-related injuries were statistically lower in
2006-07 compared to 2002-03, however, the rate for poisoning-related injuries was statistically higher.
- 236 -
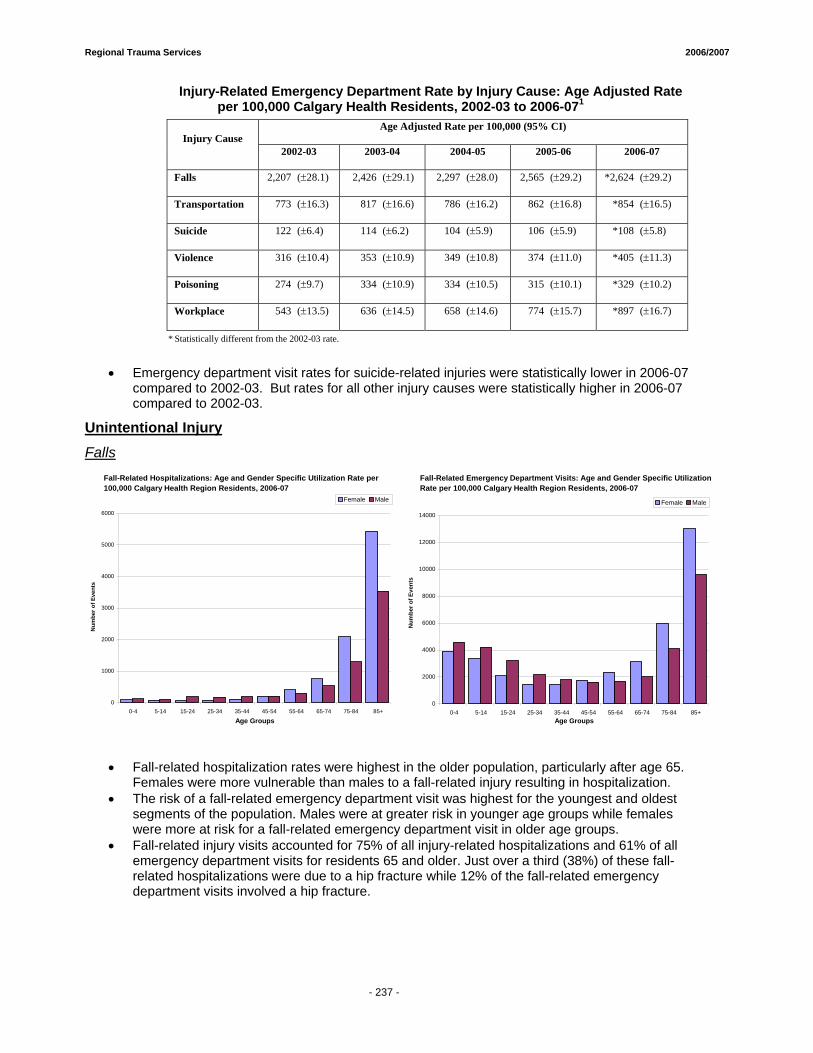
Regional Trauma Services 2006/2007
- 234 -
Injury-Related Emergency Department Rate by Injury Cause: Age Adjusted Rate per 100,000 Calgary Health Residents, 2002-03 to 2006-071
Age Adjusted Rate per 100,000 (95% CI) Injury Cause
2002-03 2003-04 2004-05 2005-06 2006-07
Falls 2,207 (±28.1) 2,426 (±29.1) 2,297 (±28.0) 2,565 (±29.2) *2,624 (±29.2)
Transportation 773 (±16.3) 817 (±16.6) 786 (±16.2) 862 (±16.8) *854 (±16.5)
Suicide 122 (±6.4) 114 (±6.2) 104 (±5.9) 106 (±5.9) *108 (±5.8)
Violence 316 (±10.4) 353 (±10.9) 349 (±10.8) 374 (±11.0) *405 (±11.3)
Poisoning 274 (±9.7) 334 (±10.9) 334 (±10.5) 315 (±10.1) *329 (±10.2)
Workplace 543 (±13.5) 636 (±14.5) 658 (±14.6) 774 (±15.7) *897 (±16.7)
* Statistically different from the 2002-03 rate.
• Emergency department visit rates for suicide-related injuries were statistically lower in 2006-07
compared to 2002-03. But rates for all other injury causes were statistically higher in 2006-07 compared to 2002-03.
Unintentional Injury Falls
0
1000
2000
3000
4000
5000
6000
0-4 5-14 15-24 25-34 35-44 45-54 55-64 65-74 75-84 85+
Age Groups
Num
ber o
f Eve
nts
Female Male
0
2000
4000
6000
8000
10000
12000
14000
0-4 5-14 15-24 25-34 35-44 45-54 55-64 65-74 75-84 85+Age Groups
Num
ber o
f Eve
nts
Female Male
Fall-Related Emergency Department Visits: Age and Gender Specific Utilization Rate per 100,000 Calgary Health Region Residents, 2006-07
Fall-Related Hospitalizations: Age and Gender Specific Utilization Rate per 100,000 Calgary Health Region Residents, 2006-07
• Fall-related hospitalization rates were highest in the older population, particularly after age 65. Females were more vulnerable than males to a fall-related injury resulting in hospitalization.
• The risk of a fall-related emergency department visit was highest for the youngest and oldest segments of the population. Males were at greater risk in younger age groups while females were more at risk for a fall-related emergency department visit in older age groups.
• Fall-related injury visits accounted for 75% of all injury-related hospitalizations and 61% of all emergency department visits for residents 65 and older. Just over a third (38%) of these fall-related hospitalizations were due to a hip fracture while 12% of the fall-related emergency department visits involved a hip fracture.
- 237 -
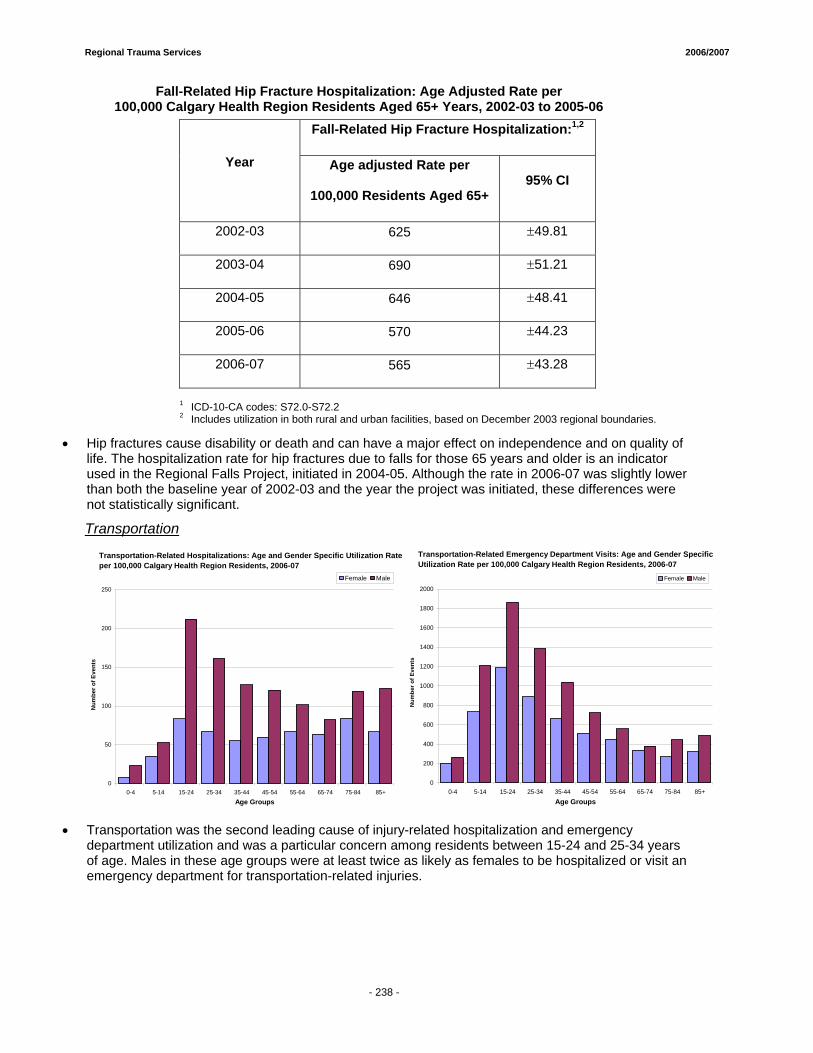
Regional Trauma Services 2006/2007
- 234 -
Fall-Related Hip Fracture Hospitalization: Age Adjusted Rate per 100,000 Calgary Health Region Residents Aged 65+ Years, 2002-03 to 2005-06
1 ICD-10-CA codes: S72.0-S72.2 2 Includes utilization in both rural and urban facilities, based on December 2003 regional boundaries.
• Hip fractures cause disability or death and can have a major effect on independence and on quality of
life. The hospitalization rate for hip fractures due to falls for those 65 years and older is an indicator used in the Regional Falls Project, initiated in 2004-05. Although the rate in 2006-07 was slightly lower than both the baseline year of 2002-03 and the year the project was initiated, these differences were not statistically significant.
Transportation
0
50
100
150
200
250
0-4 5-14 15-24 25-34 35-44 45-54 55-64 65-74 75-84 85+Age Groups
Num
ber o
f Eve
nts
Female Male
0
200
400
600
800
1000
1200
1400
1600
1800
2000
0-4 5-14 15-24 25-34 35-44 45-54 55-64 65-74 75-84 85+
Age Groups
Num
ber o
f Eve
nts
Female Male
Transportation-Related Hospitalizations: Age and Gender Specific Utilization Rate per 100,000 Calgary Health Region Residents, 2006-07
Transportation-Related Emergency Department Visits: Age and Gender Specific Utilization Rate per 100,000 Calgary Health Region Residents, 2006-07
• Transportation was the second leading cause of injury-related hospitalization and emergency
department utilization and was a particular concern among residents between 15-24 and 25-34 years of age. Males in these age groups were at least twice as likely as females to be hospitalized or visit an emergency department for transportation-related injuries.
Fall-Related Hip Fracture Hospitalization:1,2
Year Age adjusted Rate per
100,000 Residents Aged 65+ 95% CI
2002-03 625 ±49.81
2003-04 690 ±51.21
2004-05 646 ±48.41
2005-06 570 ±44.23
2006-07 565 ±43.28
- 238 -
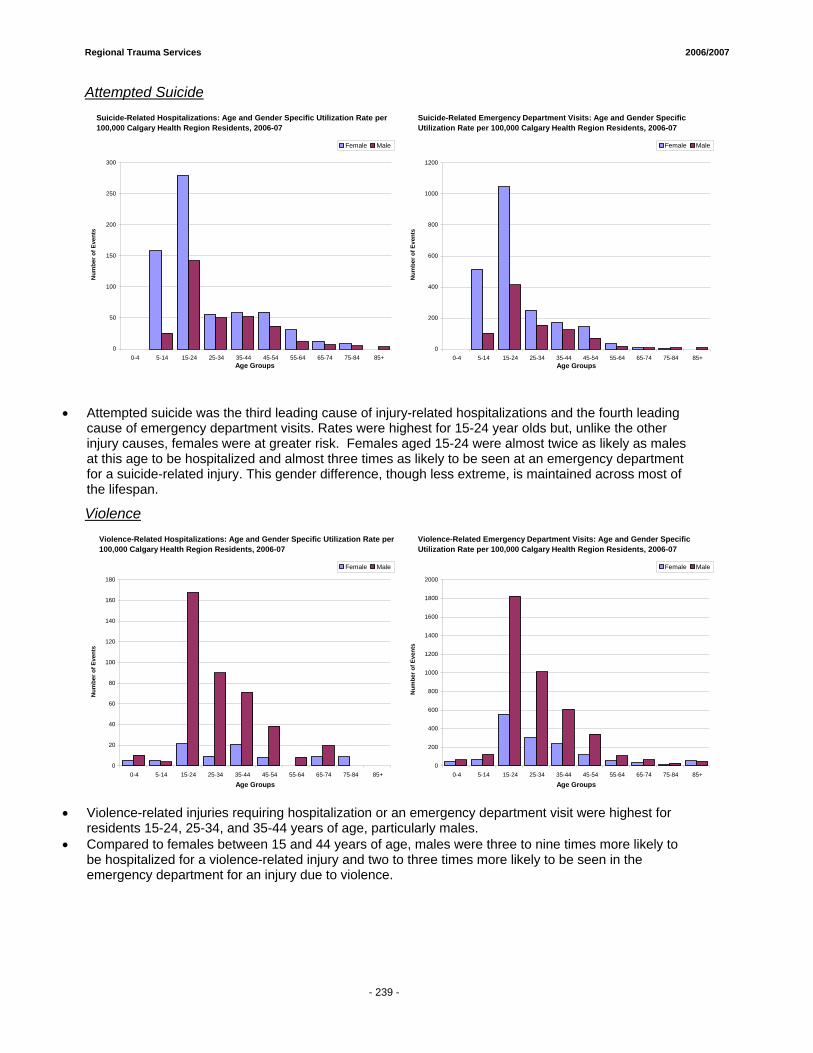
Regional Trauma Services 2006/2007
- 234 -
Attempted Suicide
0
50
100
150
200
250
300
0-4 5-14 15-24 25-34 35-44 45-54 55-64 65-74 75-84 85+Age Groups
Num
ber o
f Eve
nts
Female Male
0
200
400
600
800
1000
1200
0-4 5-14 15-24 25-34 35-44 45-54 55-64 65-74 75-84 85+Age Groups
Num
ber o
f Eve
nts
Female Male
Suicide-Related Emergency Department Visits: Age and Gender Specific Utilization Rate per 100,000 Calgary Health Region Residents, 2006-07
Suicide-Related Hospitalizations: Age and Gender Specific Utilization Rate per 100,000 Calgary Health Region Residents, 2006-07
• Attempted suicide was the third leading cause of injury-related hospitalizations and the fourth leading cause of emergency department visits. Rates were highest for 15-24 year olds but, unlike the other injury causes, females were at greater risk. Females aged 15-24 were almost twice as likely as males at this age to be hospitalized and almost three times as likely to be seen at an emergency department for a suicide-related injury. This gender difference, though less extreme, is maintained across most of the lifespan.
Violence
0
20
40
60
80
100
120
140
160
180
0-4 5-14 15-24 25-34 35-44 45-54 55-64 65-74 75-84 85+
Age Groups
Num
ber o
f Eve
nts
Female Male
0
200
400
600
800
1000
1200
1400
1600
1800
2000
0-4 5-14 15-24 25-34 35-44 45-54 55-64 65-74 75-84 85+
Age Groups
Num
ber o
f Eve
nts
Female Male
Violence-Related Emergency Department Visits: Age and Gender Specific Utilization Rate per 100,000 Calgary Health Region Residents, 2006-07
Violence-Related Hospitalizations: Age and Gender Specific Utilization Rate per 100,000 Calgary Health Region Residents, 2006-07
• Violence-related injuries requiring hospitalization or an emergency department visit were highest for
residents 15-24, 25-34, and 35-44 years of age, particularly males. • Compared to females between 15 and 44 years of age, males were three to nine times more likely to
be hospitalized for a violence-related injury and two to three times more likely to be seen in the emergency department for an injury due to violence.
- 239 -
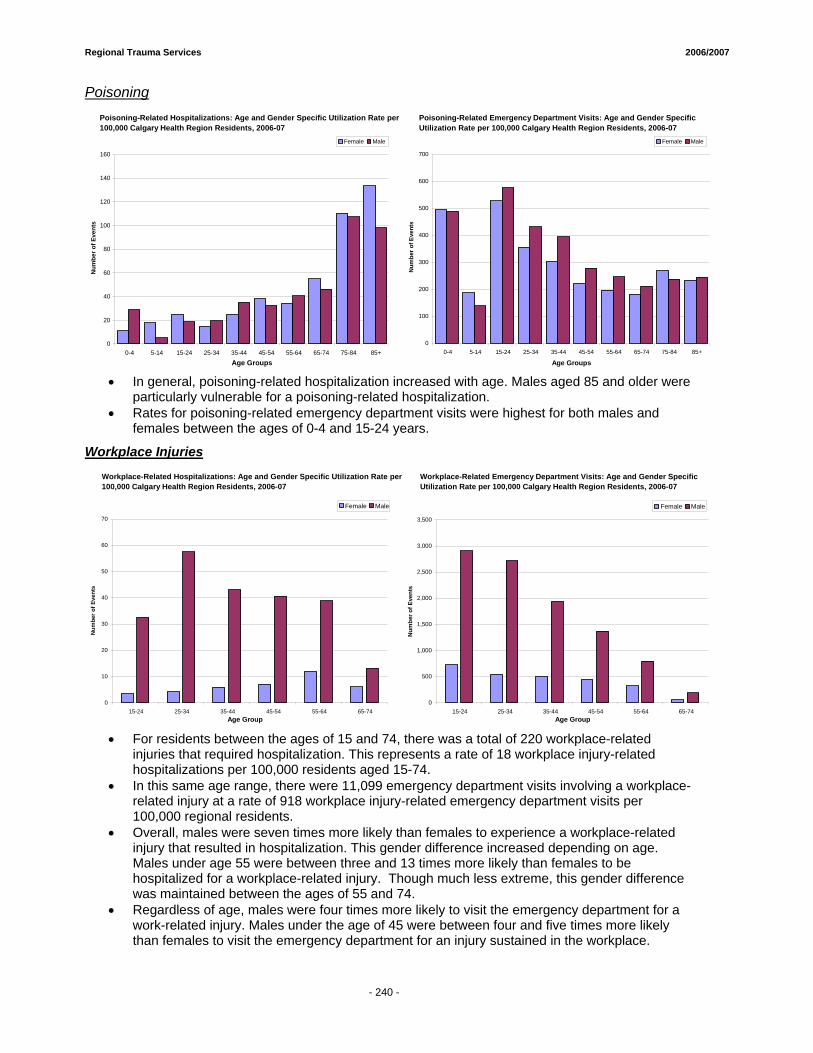
Regional Trauma Services 2006/2007
- 234 -
Poisoning
0
20
40
60
80
100
120
140
160
0-4 5-14 15-24 25-34 35-44 45-54 55-64 65-74 75-84 85+
Age Groups
Num
ber o
f Eve
nts
Female Male
0
100
200
300
400
500
600
700
0-4 5-14 15-24 25-34 35-44 45-54 55-64 65-74 75-84 85+
Age Groups
Num
ber o
f Eve
nts
Female Male
Poisoning-Related Emergency Department Visits: Age and Gender Specific Utilization Rate per 100,000 Calgary Health Region Residents, 2006-07
Poisoning-Related Hospitalizations: Age and Gender Specific Utilization Rate per 100,000 Calgary Health Region Residents, 2006-07
• In general, poisoning-related hospitalization increased with age. Males aged 85 and older were
particularly vulnerable for a poisoning-related hospitalization. • Rates for poisoning-related emergency department visits were highest for both males and
females between the ages of 0-4 and 15-24 years.
Workplace Injuries
0
10
20
30
40
50
60
70
15-24 25-34 35-44 45-54 55-64 65-74Age Group
Num
ber o
f Eve
nts
Female Male
0
500
1,000
1,500
2,000
2,500
3,000
3,500
15-24 25-34 35-44 45-54 55-64 65-74Age Group
Num
ber o
f Eve
nts
Female Male
Workplace-Related Emergency Department Visits: Age and Gender Specific Utilization Rate per 100,000 Calgary Health Region Residents, 2006-07
Workplace-Related Hospitalizations: Age and Gender Specific Utilization Rate per 100,000 Calgary Health Region Residents, 2006-07
• For residents between the ages of 15 and 74, there was a total of 220 workplace-related
injuries that required hospitalization. This represents a rate of 18 workplace injury-related hospitalizations per 100,000 residents aged 15-74.
• In this same age range, there were 11,099 emergency department visits involving a workplace-related injury at a rate of 918 workplace injury-related emergency department visits per 100,000 regional residents.
• Overall, males were seven times more likely than females to experience a workplace-related injury that resulted in hospitalization. This gender difference increased depending on age. Males under age 55 were between three and 13 times more likely than females to be hospitalized for a workplace-related injury. Though much less extreme, this gender difference was maintained between the ages of 55 and 74.
• Regardless of age, males were four times more likely to visit the emergency department for a work-related injury. Males under the age of 45 were between four and five times more likely than females to visit the emergency department for an injury sustained in the workplace.
- 240 -

1 ii This represents 82% of all injury-related hospitalizations in regional facilities; 16% were to non-
residents of the region and 2% had no information about regional status. iii This represents 90% of all injury-related visits to regional facilities; 9% were to non-residents of the
region and 1% had no information about regional status.