Embed Size (px)
Citation preview

Middle East and North Africa telecoms market: trends and forecasts 2016–2021
© Analysys Mason Limited 2016
REGIONAL FORECAST REPORT
MIDDLE EAST AND NORTH AFRICA
TELECOMS MARKET: TRENDS AND
FORECASTS 2016–2021
KARIM YAICI
Middle East and North Africa telecoms market: trends and forecasts 2016–2021
© Analysys Mason Limited 2016
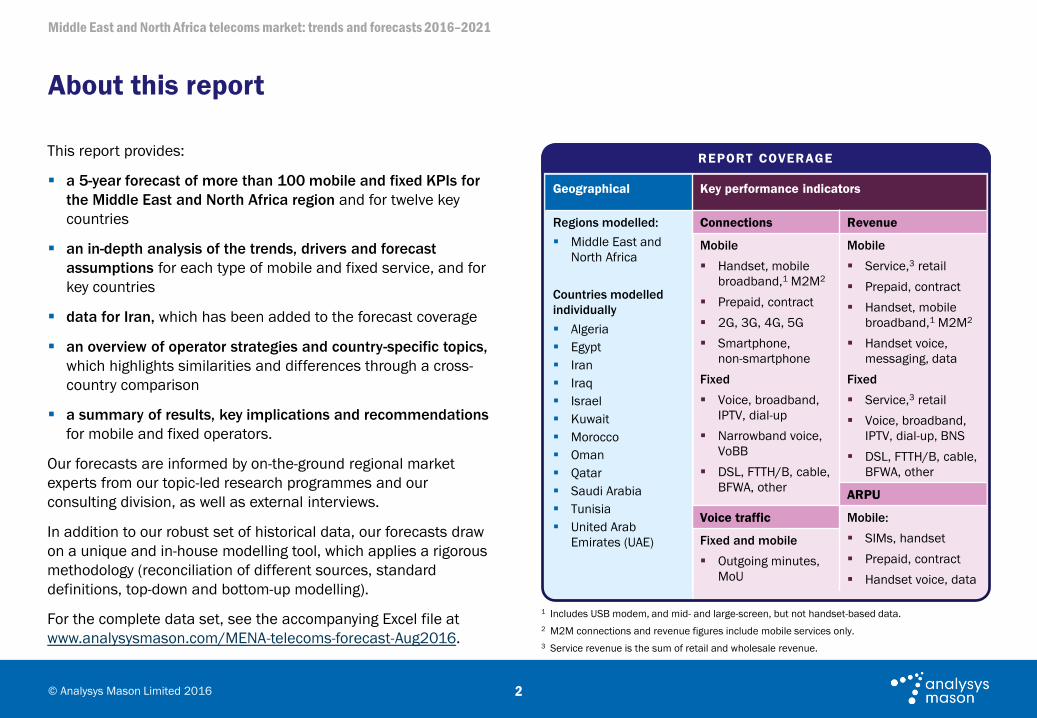
REPORT COVERAGE
Geographical Key performance indicators
Regions modelled:
Middle East and
North Africa
Countries modelled
individually
Algeria
Egypt
Iran
Iraq
Israel
Kuwait
Morocco
Oman
Qatar
Saudi Arabia
Tunisia
United Arab
Emirates (UAE)
Connections Revenue
Mobile
Handset, mobile
broadband,1 M2M2
Prepaid, contract
2G, 3G, 4G, 5G
Smartphone,
non-smartphone
Fixed
Voice, broadband,
IPTV, dial-up
Narrowband voice,
VoBB
DSL, FTTH/B, cable,
BFWA, other
Mobile
Service,3 retail
Prepaid, contract
Handset, mobile
broadband,1 M2M2
Handset voice,
messaging, data
Fixed
Service,3 retail
Voice, broadband,
IPTV, dial-up, BNS
DSL, FTTH/B, cable,
BFWA, other
ARPU
Voice traffic Mobile:
SIMs, handset
Prepaid, contract
Handset voice, data
Fixed and mobile
Outgoing minutes,
MoU
2
This report provides:
a 5-year forecast of more than 100 mobile and fixed KPIs for
the Middle East and North Africa region and for twelve key
countries
an in-depth analysis of the trends, drivers and forecast
assumptions for each type of mobile and fixed service, and for
key countries
data for Iran, which has been added to the forecast coverage
an overview of operator strategies and country-specific topics,
which highlights similarities and differences through a cross-
country comparison
a summary of results, key implications and recommendations
for mobile and fixed operators.
Our forecasts are informed by on-the-ground regional market
experts from our topic-led research programmes and our
consulting division, as well as external interviews.
In addition to our robust set of historical data, our forecasts draw
on a unique and in-house modelling tool, which applies a rigorous
methodology (reconciliation of different sources, standard
definitions, top-down and bottom-up modelling).
For the complete data set, see the accompanying Excel file at
www.analysysmason.com/MENA-telecoms-forecast-Aug2016.
About this report
1 Includes USB modem, and mid- and large-screen, but not handset-based data.
2 M2M connections and revenue figures include mobile services only.
3 Service revenue is the sum of retail and wholesale revenue.

Middle East and North Africa telecoms market: trends and forecasts 2016–2021
© Analysys Mason Limited 2016 3
11. Executive summary
12. The telecoms service market in MENA will grow to USD77.5 billion in 2021,
against the backdrop of a weaker macroeconomic outlook
13. Telecoms retail revenue will increase by USD6.2 billion between 2015 and
2021, driven by mobile handset data and fixed broadband services
14. Fixed or mobile revenue will grow in most countries, but competition,
market saturation and lack of investment will have an impact on some
15. Key trends, drivers and assumptions for the mobile and fixed markets
16. Key implications and recommendations for telecoms operators
17. Regional forecasts and cross-country comparison
18. Geographical coverage: We model twelve telecoms markets, which will
account for 90.7% of telecoms service revenue in MENA in 2021
19. Market context: The twelve modelled countries account for 83.3% of total
population and 92.4% of telecoms service revenue in MENA in 2015
20. Revenue and ARPU: Mobile and fixed data services will drive revenue
growth in the region, but mobile voice revenue will continue to dominate
21. Mobile penetration: Maturing markets and enforced SIM registration have
already led to a slow down in the number of new mobile connections
22. Mobile connections: 44.2% of all connections will be 3G by 2021, while LTE
will account for nearly a quarter of mobile SIMs (excluding M2M)
23. Smartphones and 4G/5G: Israel will have the highest smartphone
penetration and UAE will lead 4G/5G take-up rates over the next 5 years
24. Mobile ARPU: Growth in data will offset the decline from voice and
messaging, thereby lessening the rate of decline of ARPU
25. Fixed services: Broadband market will grow in most countries, driven by
upgrades to access technology and greenfield infrastructure deployment
26. Fixed broadband: Household penetration will grow in all markets, driven by
market competition and supported by national broadband plans
27. Key drivers at a glance for each Middle East and North Africa market
28. Key drivers at a glance table: methodology [1]
29. Key drivers at a glance table: methodology [2]
30. Individual country forecasts
31. Algeria: Retail revenue will grow at a CAGR of 0.6% during 2015–2021,
driven by demand for mobile and fixed broadband services
32. Algeria – mobile: 3G and the upcoming 4G launch will provide the
momentum to drive demand for mobile data services
33. Algeria – fixed: DSL and fixed LTE have great potential for growth, but lack
of investment will be a significant obstacle
34. Egypt: Service revenue will grow at a CAGR of 0.9% to 2021, driven by
demand for fixed broadband and handset data
35. Egypt – mobile: Service revenue is set to decline at a CAGR of –1.1% over
2016–2021, giving a weakened market outlook
36. Egypt – fixed: Strong growth in broadband connections, while price
adjustments and business lines will help slow voice erosion
37. Iran: Lifting of sanctions will improve GDP and encourage investment, while
data services will bolster the mobile segment
38. Iran – mobile: Increased access to 3G and 4G services and the prospect of
new market entrants will underpin future growth
Contents

Middle East and North Africa telecoms market: trends and forecasts 2016–2021
© Analysys Mason Limited 2016 4
39. Iran – fixed: Market development will depend on investment in
infrastructure, amidst competition from mobile to voice services
40. Iraq: The challenging economic and volatile security situations will take
their toll on consumer demand in the short term
41. Iraq – mobile: Political instability and low oil prices will impact the economy,
but data offer some potential for revenue growth
42. Iraq – fixed: Poor fixed line infrastructure and persistent civil war will
contribute to the under-development of the sector
43. Israel: Competition and price erosion will continue to impact mobile
revenue; fixed market liberalisation will spur competition
44. Israel – mobile: Intense competition will result in significant revenue
decline, while 3G share will start to fall from 2016
45. Israel – fixed: Speed upgrades and the introduction of fibre in 2016 will
spur further growth in broadband market revenue
46. Kuwait: Mobile market dynamism and growth are contrasted with a fixed
market that lacks competition and investment
47. Kuwait – mobile: LTE will be central to mobile market competition as
operators aim to increase data usage to stabilise ARPU
48. Kuwait – fixed: Planned privatisation of fixed infrastructure and fixed–
mobile partnerships could unlock broadband potential
49. Morocco: Voice revenue will decline, but still dominate the market, while
mobile handset data will be the fastest-growing sector
50. Morocco – mobile: Strong growth of data revenue will be insufficient to
offset rapidly declining voice revenue
51. Morocco – fixed: Fixed voice market will remain largely resilient, while
broadband adoption will be driven by business and dual-play
52. Oman: Service revenue growth will maintain its rapid rise, driven by very
strong demand for fixed and mobile data
53. Oman – mobile: Very strong data revenue outlook, while a new third entrant
could pose a risk of ARPU and market value erosion
54. Oman – fixed: Fixed voice revenue will decline from 2015, while fibre
competition increases due to ambitious roll-out plans
55. Qatar: Strong economic and population growth will help telecoms services
to generate QAR10 billion in retail revenue by 2021
56. Qatar – mobile: Demand from migrants will sustain growth in connections,
while 4G competition will be based on technology
57. Qatar – fixed: Quasi-ubiquity of fibre creates opportunities for upselling of
TV services, but these will be limited to Ooredoo
58. Saudi Arabia: Broadband data services will drive retail revenue growth, but
competition will reduce short-term market growth
59. Saudi Arabia – mobile: MVNOs will drive subscriber growth in the short
term, while data will capture half of retail revenue by 2021
60. Saudi Arabia – fixed: Voice market recovered in 2015 thanks to the
business segment while broadband outlook appears strong
61. Tunisia: Infrastructure investments and competition will help stimulate
growth amidst political and economic challenges
62. Tunisia – mobile: Steady growth of subscribers from Lycamobile launch,
while demand for data will be key to revenue growth
Contents

Middle East and North Africa telecoms market: trends and forecasts 2016–2021
© Analysys Mason Limited 2016 5
63. Tunisia – fixed: The broadband market will grow slowly due to competition
from mobile, while the telephony market will contract
64. UAE: Economic diversification and population growth will help increase
telecoms retail revenue to AED42.9 billion by 2021
65. UAE – mobile: Increasing contributions from postpaid and data users
should help to drive revenue growth and slow ARPU erosion
66. UAE – fixed: Infrastructure sharing will stimulate competition and
encourage operators to invest in the sector to maintain growth
67. About the author and Analysys Mason
68. About the author
69. Analysys Mason’s consulting and research are uniquely positioned
70. Research from Analysys Mason
71. Consulting from Analysys Mason
Contents

Middle East and North Africa telecoms market: trends and forecasts 2016–2021
© Analysys Mason Limited 2016
Figure 1: Telecoms retail revenue by service type and total service revenue
(retail and wholesale), Middle East and North Africa, 2011–2021
Figure 2: Telecoms retail revenue growth by service type, Middle East and North
Africa, 2015–2021
Figure 3: CAGRs for fixed and mobile retail revenue (2015–2021) and total
retail revenue (2021) by country, Middle East and North Africa
Figure 4: Summary of key trends, drivers and assumptions for the Middle East
and North Africa
Figure 5: Mobile connections by technology generation and NGA penetration of
fixed broadband connections by country, Middle East and North Africa, 2021
Figure 6: Metrics for the twelve countries modelled individually in the Middle
East and North Africa, 2015
Figure 7: Telecoms retail revenue by service type, fixed voice and fixed
broadband ASPU, and mobile ARPU, Middle East and North Africa, 2011–2021
Figure 8: Telecoms retail revenue by service type, total service revenue and
growth rates, Middle East and North Africa, 2015–2021
Figure 9: Connections by type, and growth rates, Middle East and North Africa,
2015–2021
Figure 10: Active mobile SIM penetration by country (excluding M2M), Middle
East and North Africa, 2011–2021
Figure 11: Mobile connections by technology generation (excluding M2M), and
3G, 4G and 5G’s share of connections, Middle East and North Africa, 2011–
2021
6
Figure 12: Smartphones as a percentage of handsets, and 4G/5G share of total
connections (excluding M2M), Middle East and North Africa, 2015 and 2021
Figure 13: Mobile ARPU by country, Middle East and North Africa, 2011–2021
Figure 14: Fixed broadband connections by type, and fixed voice, IPTV and
mobile broadband connections, Middle East and North Africa, 2011–2021
Figure 15: Fixed broadband penetration of households by country, Middle East
and North Africa, 2011–2021
Figure 16: Major forecast drivers: current situation (2015) and future trajectory
(2016–2021) by country, Middle East and North Africa
Figure 17: Methodology for attributing scores to each element in the key drivers
table (current and future) and impact of high scores
Figure 18: Telecoms retail revenue by service type and total service revenue
(retail and wholesale), Algeria, 2011–2021
Figure 19: Telecoms retail revenue by service type, total service revenue and
growth rates, Algeria, 2015–2021
Figure 20: Connections by type, and growth rates, Algeria, 2015–2021
Figure 21: Mobile, smartphone and 4G/5G penetration rates, Algeria, 2011–
2021
Figure 22: Mobile ARPU by type, and mobile ARPU, Algeria, 2011–2021
Figure 23: Summary of key mobile market drivers and assumptions, Algeria
Figure 24: Fixed penetration rates by service type, Algeria, 2011–2021
List of figures

Middle East and North Africa telecoms market: trends and forecasts 2016–2021
© Analysys Mason Limited 2016
Figure 25: Fixed ASPU by service type, Algeria, 2011–2021
Figure 26: Summary of key fixed market drivers and assumptions, Algeria
Figure 27: Telecoms retail revenue by service type and total service revenue
(retail and wholesale), Egypt, 2011–2021
Figure 28: Telecoms retail revenue by service type, total service revenue and
growth rates, Egypt, 2015–2021
Figure 29: Connections by type, and growth rates, Egypt, 2015–2021
Figure 30: Mobile, smartphone and 4G/5G penetration rates, Egypt, 2011–
2021
Figure 31: Mobile ARPU by type, and mobile ARPU, Egypt, 2011–2021
Figure 32: Summary of key mobile market drivers and assumptions, Egypt
Figure 33: Fixed penetration rates by service type, Egypt, 2011–2021
Figure 34: Fixed ASPU by service type, Egypt, 2011–2021
Figure 35: Summary of key fixed market drivers and assumptions, Egypt
Figure 36: Telecoms retail revenue by service type and total service revenue
(retail and wholesale), Iran, 2011–2021
Figure 37: Telecoms retail revenue by service type, total service revenue and
growth rates, Iran, 2015–2021
Figure 38: Connections by type, and growth rates, Iran, 2015–2021
Figure 39: Mobile, smartphone and 4G/5G penetration rates, Iran, 2011–2021
7
Figure 40: Mobile ARPU by type, and mobile ARPU, Iran, 2011–2021
Figure 41: Summary of key mobile market drivers and assumptions, Iran
Figure 42: Fixed penetration rates by service type, Iran, 2011–2021
Figure 43: Fixed ASPU by service type, Iran, 2011–2021
Figure 44: Summary of key fixed market drivers and assumptions, Iran
Figure 45: Telecoms retail revenue by service type and total service revenue
(retail and wholesale), Iraq, 2011–2021
Figure 46: Telecoms retail revenue by service type, total service revenue and
growth rates, Iraq, 2015–2021
Figure 47: Connections by type, and growth rates, Iraq, 2015–2021
Figure 48: Mobile, smartphone and 4G/5G penetration rates, Iraq, 2011–2021
Figure 49: Mobile ARPU by type, and mobile ARPU, Iraq, 2011–2021
Figure 50: Summary of key mobile market drivers and assumptions, Iraq
Figure 51: Fixed penetration rates by service type, Iraq, 2011–2021
Figure 52: Fixed ASPU by service type, Iraq, 2011–2021
Figure 53: Summary of key fixed market drivers and assumptions, Iraq
Figure 54: Telecoms retail revenue by service type and total service revenue
(retail and wholesale), Israel, 2011–2021
Figure 55: Telecoms retail revenue by service type, total service revenue and
growth rates, Israel, 2015–2021
Figure 56: Connections by type, and growth rates, Israel, 2015–2021
List of figures

Middle East and North Africa telecoms market: trends and forecasts 2016–2021
© Analysys Mason Limited 2016
Figure 57: Mobile, smartphone and 4G/5G penetration rates, Israel, 2011–
2021
Figure 58: Mobile ARPU by type, and mobile ARPU, Israel, 2011–2021
Figure 59: Summary of key mobile market drivers and assumptions, Israel
Figure 60: Fixed penetration rates by service type, Israel, 2011–2021
Figure 61: Fixed ASPU by service type, Israel, 2011–2021
Figure 62: Summary of key fixed market drivers and assumptions, Israel
Figure 63: Telecoms retail revenue by service type and total service revenue
(retail and wholesale), Kuwait, 2011–2021
Figure 64: Telecoms retail revenue by service type, total service revenue and
growth rates, Kuwait, 2015–2021
Figure 65: Connections by type, and growth rates, Kuwait, 2015–2021
Figure 66: Mobile, smartphone and 4G/5G penetration rates, Kuwait, 2011–
2021
Figure 67: Mobile ARPU by type, and mobile ARPU, Kuwait, 2011–2021
Figure 68: Summary of key mobile market drivers and assumptions, Kuwait
Figure 69: Fixed penetration rates by service type, Kuwait, 2011–2021
Figure 70: Fixed ASPU by service type, Kuwait, 2011–2021
Figure 71: Summary of key fixed market drivers and assumptions, Kuwait
8
Figure 72: Telecoms retail revenue by service type and total service revenue
(retail and wholesale), Morocco, 2011–2021
Figure 73: Telecoms retail revenue by service type, total service revenue and
growth rates, Morocco, 2015–2021
Figure 74: Connections by type, and growth rates, Morocco, 2015–2021
Figure 75: Mobile, smartphone and 4G/5G penetration rates, Morocco, 2011–
2021
Figure 76: Mobile ARPU by type, and mobile ARPU, Morocco, 2011–2021
Figure 77: Summary of key mobile market drivers and assumptions, Morocco
Figure 78: Fixed penetration rates by service type, Morocco, 2011–2021
Figure 79: Fixed ASPU by service type, Morocco, 2011–2021
Figure 80: Summary of key fixed market drivers and assumptions, Morocco
Figure 81: Telecoms retail revenue by service type and total service revenue
(retail and wholesale), Oman, 2011–2021
Figure 82: Telecoms retail revenue by service type, total service revenue and
growth rates, Oman, 2015–2021
Figure 83: Connections by type, and growth rates, Oman, 2015–2021
Figure 84: Mobile, smartphone and 4G/5G penetration rates, Oman, 2011–
2021
Figure 85: Mobile ARPU by type, and mobile ARPU, Oman, 2011–2021
Figure 86: Summary of key mobile market drivers and assumptions, Oman
Figure 87: Fixed penetration rates by service type, Oman, 2011–2021
List of figures

Middle East and North Africa telecoms market: trends and forecasts 2016–2021
© Analysys Mason Limited 2016
Figure 88: Fixed ASPU by service type, Oman, 2011–2021
Figure 89: Summary of key fixed market drivers and assumptions, Oman
Figure 90: Telecoms retail revenue by service type and total service revenue
(retail and wholesale), Qatar, 2011–2021
Figure 91: Telecoms retail revenue by service type, total service revenue and
growth rates, Qatar, 2015–2021
Figure 92: Connections by type, and growth rates, Qatar, 2015–2021
Figure 93: Mobile, smartphone and 4G/5G penetration rates, Qatar, 2011–
2021
Figure 94: Mobile ARPU by type, and mobile ARPU, Qatar, 2011–2021
Figure 95: Summary of key mobile market drivers and assumptions, Qatar
Figure 96: Fixed penetration rates by service type, Qatar, 2011–2021
Figure 97: Fixed ASPU by service type, Qatar, 2011–2021
Figure 98: Summary of key fixed market drivers and assumptions, Qatar
Figure 99: Telecoms retail revenue by service type and total service revenue
(retail and wholesale), Saudi Arabia, 2011–2021
Figure 100: Telecoms retail revenue by service type, total service revenue and
growth rates, Saudi Arabia, 2015–2021
Figure 101: Connections by type, and growth rates, Saudi Arabia, 2015–2021
Figure 102: Mobile, smartphone and 4G/5G penetration rates, Saudi Arabia
2011–2021
Figure 103: Mobile ARPU by type, and mobile ARPU, Saudi Arabia, 2011–2021
9
Figure 104: Summary of key mobile market drivers and assumptions, Saudi
Arabia
Figure 105: Fixed penetration rates by service type, Saudi Arabia, 2011–2021
Figure 106: Fixed ASPU by service type, Saudi Arabia, 2011–2021
Figure 107: Summary of key fixed market drivers and assumptions, Saudi
Arabia
Figure 108: Telecoms retail revenue by service type and total service revenue
(retail and wholesale), Tunisia, 2011–2021
Figure 109: Telecoms retail revenue by service type, total service revenue and
growth rates, Tunisia, 2015–2021
Figure 110: Connections by type, and growth rates, Tunisia, 2015–2021
Figure 111: Mobile, smartphone and 4G/5G penetration rates, Tunisia, 2011–
2021
Figure 112: Mobile ARPU by type, and mobile ARPU, Tunisia, 2011–2021
Figure 113: Summary of key mobile market drivers and assumptions, Tunisia
Figure 114: Fixed penetration rates by service type, Tunisia, 2011–2021
Figure 115: Fixed ASPU by service type, Tunisia, 2011–2021
Figure 116: Summary of key fixed market drivers and assumptions, Tunisia
Figure 117: Telecoms retail revenue by service type and total service revenue
(retail and wholesale), UAE, 2011–2021
Figure 118: Telecoms retail revenue by service type, total service revenue and
growth rates, UAE, 2015–2021
List of figures

Middle East and North Africa telecoms market: trends and forecasts 2016–2021
© Analysys Mason Limited 2016
Figure 119: Connections by type, and growth rates, UAE, 2015–2021
Figure 120: Mobile, smartphone and 4G/5G penetration rates, UAE, 2011–
2021
Figure 121: Mobile ARPU by type, and mobile ARPU, UAE, 2011–2021
10
Figure 122: Summary of key mobile market drivers and assumptions, UAE
Figure 123: Fixed penetration rates by service type, UAE, 2011–2021
Figure 124: Fixed ASPU by service type, UAE, 2011–2021
Figure 125: Summary of key fixed market drivers and assumptions, UAE
List of figures

Middle East and North Africa telecoms market: trends and forecasts 2016–2021
© Analysys Mason Limited 2016
Figure 5: Mobile connections by technology generation and NGA penetration of fixed broadband connections by country, Middle East and North Africa, 20211
1 For a full list of countries modelled as part of the MENA region, please see the accompanying data annex. Mobile connections exclude M2M connections. NGA share of fixed broadband connections is
calculated as cable, VDSL and FTTH connections (which provide access speeds of 30Mbps or more) divided by the total number of fixed broadband connections.
Geographical coverage: We model twelve telecoms markets, which will
account for 90.7% of telecoms service revenue in MENA in 2021
Mobile connections by
technology generation
NGA share of fixed
broadband connections
2G
3G
4G/5G
KEY
Countries modelled individually
Countries modelled as part of the region
2014
Year of
LTE launch
67%
Source: Analysys Mason
ALGERIA TUNISIA EGYPT ISRAEL IRAQ
UAE QATAR SAUDI ARABIA
MOROCCO
KUWAIT
OMAN
2016
18
IRAN
2016 9% 11%
2016
2013 7%2014 88%
2011 51%
2015 53%
2012 28%2013 100%2011 44%
2016 6%
2011 100%
19%

Middle East and North Africa telecoms market: trends and forecasts 2016–2021
© Analysys Mason Limited 2016
Service type Revenue (USD billion) CAGR
2015 2021 2011–2015 2015–2021
Mobile voice 31.2 29.2 –0.6% –1.1%
Mobile messaging 2.4 1.8 –2.1% –5.0%
Mobile handset data 8.1 13.1 21.2% 8.5%
Mobile broadband2 2.6 3.0 15.9% 2.0%
Mobile M2M 0.10 0.48 60.0% 29.6%
Fixed voice and narrowband3 6.4 5.0 –5.4% –4.0%
Fixed broadband and IPTV 8.6 11.3 12.2% 4.7%
Business network services 5.54 7.30 7.6% 4.7%
Total retail revenue 64.8 71.1 3.2% 1.5%
Total service revenue4 71.9 77.5 2.8% 1.3%
Connection type Connections (million) CAGR
2015 2021 2011–2015 2015–2021
Mobile handsets 458.6 514.8 4.7% 1.9%
Mobile broadband 18.0 23.9 23.4% 4.9%
Mobile M2M 4.9 26.2 67.0% 32.2%
Fixed voice 61.3 63.9 –0.9% 0.7%
Fixed broadband 26.1 36.2 20.2% 5.6%
IPTV 1.5 3.4 24.7% 15.0%
Figure 9: Connections by type, and growth rates, Middle East and North Africa, 2015–2021
20
2 Includes USB modem, and mid- and large-screen, but not handset-based data. 3 Includes narrowband, VoBB and dial-up Internet access. 4 Includes retail and wholesale revenue.
Figure 8: Telecoms retail revenue by service type, total service revenue and growth rates,
Middle East and North Africa, 2015–2021
Revenue and ARPU: Mobile and fixed data services will drive revenue
growth in the region, but mobile voice revenue will continue to dominate
Figure 7: Telecoms retail revenue by service type, fixed voice and fixed broadband ASPU, and
mobile ARPU, Middle East and North Africa, 2011–2021
1 Mobile ARPU is calculated as total mobile service revenue (retail and wholesale), excluding M2M,
divided by total average mobile connections, excluding M2M.
Mobile voice Mobile messaging Retail revenue: Mobile handset data
Mobile broadband Mobile M2M
Fixed voice and narrowband Fixed broadband and IPTV
Business network services
Mobile ARPU1 Fixed voice ASPU Fixed broadband ASPU
0
5
10
15
20
25
30
35
40
45
0
10
20
30
40
50
60
70
80
20
11
20
12
20
13
20
14
20
15
20
16
20
17
20
18
20
19
20
20
20
21
AR
PU
/A
SP
U (
US
D p
er m
on
th)
Rev
enu
e (U
SD
bill
ion
)
Source: Analysys Mason

Middle East and North Africa telecoms market: trends and forecasts 2016–2021
© Analysys Mason Limited 2016
CONTENTS
67
EXECUTIVE SUMMARY
REGIONAL FORECASTS AND CROSS-COUNTRY COMPARISON
INDIVIDUAL COUNTRY FORECASTS
ABOUT THE AUTHOR AND ANALYSYS MASON

Middle East and North Africa telecoms market: trends and forecasts 2016–2021
© Analysys Mason Limited 2016 68
About the author
Karim Yaici (Senior Analyst) leads Analysys Mason’s The Middle East and Africa regional research programme. His primary areas of
specialisation include operators' digital strategies, new telecoms opportunities and challenges, and consumer trends in growth markets. Prior to
joining Analysys Mason, Karim was an associate analyst at Ovum, where he authored reports on mobile accessories and mobile applications.
Prior to that, he worked as a research engineer in the Institute for Communication Systems and Vodafone. Karim holds an MSc in Information
Systems Management from the University of Southampton and a PhD in human–computer interaction from the University of Surrey.

Middle East and North Africa telecoms market: trends and forecasts 2016–2021
© Analysys Mason Limited 2016
Regional
markets
Digital
economy
Consumer
and SME
services
Telecoms
software and
networks
Regulation
and policy
Strategy
and planning
Transaction
support
CONSULTING
We deliver tangible benefits to clients across the telecoms
industry:
communications and digital service providers, vendors,
financial and strategic investors, private equity and
infrastructure funds, governments, regulators,
broadcasters, and service and content providers.
Our sector specialists understand the distinct local challenges
facing clients, in addition to the wider effects of global forces.
We are future-focused and help clients understand the
challenges and opportunities that new technology brings.
RESEARCH
Our dedicated team of analysts track and forecast the
different services accessed by consumers and enterprises.
We offer detailed insight into the software, infrastructure and
technology delivering those services.
Clients benefit from regular and timely intelligence, and direct
access to analysts.
Analysys Mason’s consulting services and research portfolio
69
Analysys Mason’s consulting and research are uniquely positioned

Middle East and North Africa telecoms market: trends and forecasts 2016–2021
© Analysys Mason Limited 2016 70
Research from Analysys Mason
We provide dedicated coverage of developments in the telecoms, media and technology (TMT) sectors, through a
range of research programmes that focus on different services and regions of the world.
70
We provide dedicated coverage of developments in the telecoms, media and technology (TMT) sectors, through a
range of research programmes that focus on different services and regions of the world.
To find out more, please visit www.analysysmason.com/research
Research portfolio
PROGRAMMES
Next-Generation Wireless Networks
Service Assurance
Customer Experience Management
Customer Care
Revenue Management
Analytics
Network Orchestration
Software-Controlled Networking
Service Delivery Platforms
Service Fulfilment
Telecoms Software Market Shares
Telecoms Software Forecasts
PROGRAMMES
Digital Economy Strategies
Digital Economy Platforms
Future Comms and Media
IoT and M2M Solutions
PROGRAMMES
Mobile Services
Mobile Devices
Fixed Broadband and Video
SME Strategies
PROGRAMMES
Convergence Strategies
Fixed Networks
Wireless Networks
Spectrum
Consumer and SME services
Digital economy
Regional markets
Telecoms software
and networks
Network technologies
PROGRAMMES
Global Telecoms Forecasts
Asia–Pacific
The Middle East and Africa
European Country Reports
European Core Forecasts
European Telecoms Market Matrix

Middle East and North Africa telecoms market: trends and forecasts 2016–2021
© Analysys Mason Limited 2016 71
Consulting from Analysys Mason
For 30 years, our consultants have been bringing the benefits of applied intelligence to enable clients around the
world to make the most of their opportunities.
To find out more, please visit www.analysysmason.com/consulting
71
Consulting portfolio
Strategy and planning
Transaction support
EXPERTISE
Commercial due diligence
Regulatory due diligence
Technical due diligence
Regulation
EXPERTISE
Policy development and response
Margin squeeze tests
Analysing regulatory accounts
Expert legal support
Media regulation
Postal sector costing, pricing and regulation
Regulatory economic costing
Net cost of universal service
Performance improvement
EXPERTISE
Market research
Market analysis
Business strategy and planning
Market sizing and forecasting
Benchmarking and best practice
National and regional broadband strategy and implementation
EXPERTISE
Performance analysis
Technology optimisation
Commercial excellence
Transformation services
EXPERTISE
Radio spectrum auction support
Radio spectrum management
Spectrum policy and auction support

Middle East and North Africa telecoms market: trends and forecasts 2016–2021
© Analysys Mason Limited 2016
PUBLISHED BY ANALYSYS MASON LIMITED IN AUGUST 2016
Bush House • North West Wing • Aldwych • London • WC2B 4PJ • UK
Tel: +44 (0)20 7395 9000 • Email: [email protected] • www.analysysmason.com/research • Registered in England No. 5177472
© Analysys Mason Limited 2016. All rights reserved. No part of this publication may be reproduced, stored in a retrieval system or transmitted in any form or by any means – electronic,
mechanical, photocopying, recording or otherwise – without the prior written permission of the publisher.
Figures and projections contained in this report are based on publicly available information only and are produced by the Research Division of Analysys Mason Limited independently of any
client-specific work within Analysys Mason Limited. The opinions expressed are those of the stated authors only.
Analysys Mason Limited recognises that many terms appearing in this report are proprietary; all such trademarks are acknowledged and every effort has been made to indicate them by the
normal UK publishing practice of capitalisation. However, the presence of a term, in whatever form, does not affect its legal status as a trademark.
Analysys Mason Limited maintains that all reasonable care and skill have been used in the compilation of this publication. However, Analysys Mason Limited shall not be under any liability for
loss or damage (including consequential loss) whatsoever or howsoever arising as a result of the use of this publication by the customer, his servants, agents or any third party.