Embed Size (px)
Citation preview
TWENTY-EIGHTH NORTH AMERICAN MEETINGS OF THE REGIONAL SCIENCE ASSOCIATION
REGIONAL DEMAND FOR BUSINESS SERVICES AND INTERREGIONAL SERVICE FLOWS IN A SMALL CANADIAN REGION
Mario Polese*
1. INTRODUCTION Little detailed information exists for the service sector on a regional level,
and even less on interregional trade in services. The objective of this paper is in part empirical: to provide data on service flows based on a survey for a sub- provincial region in Canada (INRS [4]). On a more analytical plane, it attempts to explain the structure of regional service imports. Special emphasis is placed on estimating service flows between establishments belonging to the same firm or organization. It will be shown that such "intra-firm" flows are an important component of total service demand, and in particular of interregional service flows. The service sector is disaggregated into twenty-four activities. After discussing the data base, the service procurement process, which in part "by- passes" the market, is analyzed. Services are classified according to their market or organization orientation. An analysis of intra-firm versus inter-firm flow structures serves to clarify the dichotomy between services according to their mode of procurement. Finally, the spatial pattern and structure of service imports is analyzed.
2. THE DATA BASE Four hundred and eight (408) business establishments were surveyed, based
in part on sampling techniques proposed by Bailly and Paelinck [1]. The establishments (physically distinct units of production, which may be part of a larger firm in the case of a multi-plant, multi-establishment entreprise) are distributed as follows: 127 mining and manufacturing establishments; 130 retailers; 65 wholesalers; and 86 construction firms and business service estab- lishments. The estimated level of representativity varies according to sector between 65% and 75%, relative to total region production and employment. Only private sector establishments are considered.
'The area surveyed, the Eastern townships of Quebec, is a fairly small and compact region (population about 250,000) but with a distinct urban hierarchy and dominant urban pole, which is the town of Sherbrooke with a total population of about 100,000 (including suburbs). Sherbrooke possesses a well developed
* INRS - - Urbanisation, Universit6 du Qurbec ~ Montrral.
152 PAPERS OF THE REGIONAL SCIENCE ASSOCIATION, VOL. 50, 1982
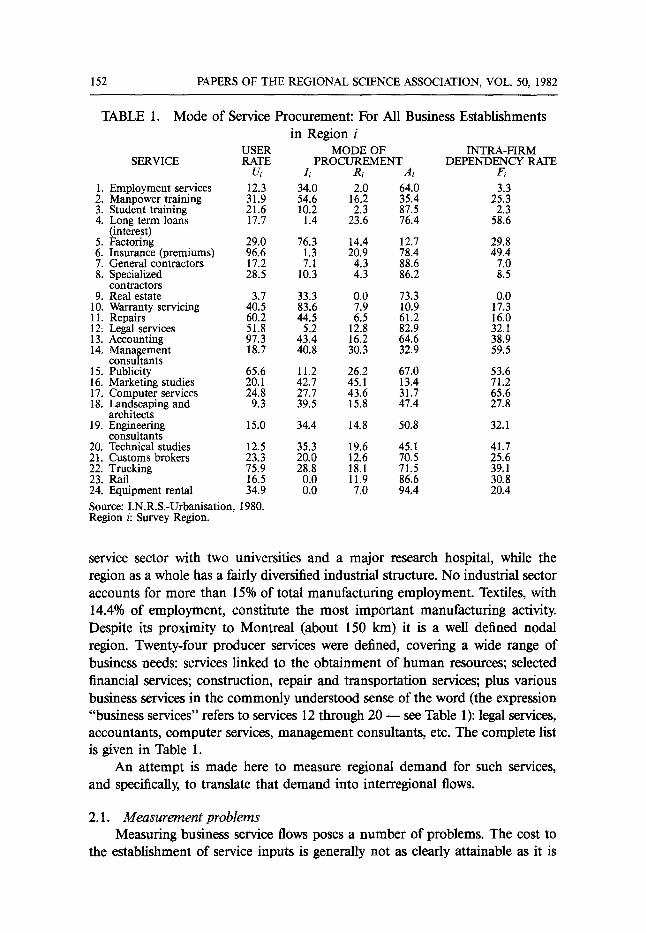
TABLE 1. Mode of Service Procurement: For All Business Establishments in Region i
USER MODE OF INTRA-FIRM SERVICE RATE PROCUREMENT DEPENDENCY RATE
Ui Ii Ri Ai Fi 1. Employment services 12.3 34.0 2.0 64.0 3.3 2. Manpower training 31.9 54.6 16.2 35.4 25.3 3. Student training 21.6 10.2 2.3 87.5 2.3 4. Long term loans 17.7 1.4 23.6 76.4 58.6
(interest) 5. Factoring 29.0 76.3 14.4 12.7 29.8 6. Insurance (premiums) 96.6 1.3 20.9 78.4 49.4 7. General contractors 17.2 7.1 4.3 88.6 7.0 8. Specialized 28.5 10.3 4.3 86.2 8.5
contractors 9. Real estate 3.7 33.3 0.0 73.3 0.0
10. Warranty servicing 40.5 83.6 7.9 10.9 17.3 11. Repairs 60.2 44.5 6.5 61.2 16.0 12: Legal services 51.8 5.2 12.8 82.9 32.1 13. Accounting 97.3 43.4 16.2 64.6 38.9 14. Management 18.7 40.8 30.3 32.9 59.5
consultants 15. Publicity 65.6 11.2 26.2 67.0 53.6 16. Marketing studies 20.1 42.7 45.1 13.4 71.2 17. Computer services 24.8 27.7 43.6 31.7 65.6 18. Landscaping and 9.3 39.5 15.8 47.4 27.8
architects 19. Engineering 15.0 34.4 14.8 50.8 32.1
consultants 20. Technical studies 12.5 35.3 19.6 45.1 41.7 21. Customs brokers 23.3 20.0 12.6 70.5 25.6 22. Trucking 75.9 28.8 18.1 71.5 39.1 23. Rail 16.5 0.0 11.9 86.6 30.8 24. Equipment rental 34.9 0.0 7.0 94.4 20.4
Source: I.N.R.S.-Urbanisation, 1980. Region i: Survey Region.
service sector with two universities and a major research hospital, while the region as a whole has a fairly diversified industrial structure. No industrial sector accounts for more than 15% of total manufacturing employment. Textiles, with 14.4% of employment, constitute the most important manufacturing activity. Despite its proximity to Montreal (about 150 km) it is a well defined nodal region. Twenty-four producer services were defined, covering a wide range of business needs: services linked to the obtainment of human resources; selected financial services; construction, repair and transportation services; plus various business services in the commonly understood sense of the word (the expression "business services" refers to services 12 through 20 - - see Table 1): legal services, accountants, computer services, management consultants, etc. The complete list is given in Table 1.
An attempt is made here to measure regional demand for such services, and specifically, to translate that demand into interregional flows.
2.1. Measurement problems Measuring business service flows poses a number of problems. The cost to
the establishment of service inputs is generally not as clearly attainable as it is
POLESE: BUSINESS SERVICES AND INTERREGIONAL SERVICE FLOWS 153
for material inputs. Precise indicators of cost must be defined: commissions for employment agencies and not the wages of the person hired; premium payments for insurance; consulting fees or computer time for computer services (and not the cost of equipment rental or purchase) and so forth. But, even when the indicators are well defined, many establishments are not aware of the cost of many services. Much service demand is not satisfied via open market transactions but rather via in-house production or, in the case of branch establishments or subsidiaries, via intra-firm service transfers. In the latter case, the local estab- lishment may be totally unaware of costs. For example, for a branch plant, legal services may in part be provided (or purchased) by the head office in Montreal or New York, or may be provided by another of the firm's establishments outside the region. In all these cases this is conceptually equivalent to the region importing legal services, since in rigorous cost-accounting terms the purchase should be imputed to the local establishment, even if it does not explicitly appear in its books.
For this region, the possibility of significant intra-firm service flows cannot be ignored, given the importance of trans-regional firms. About 35% of all establishments surveyed are either branches or subsidiaries of corporations whose head offices are located outside the region and these "'linked" establishments accounted for 76% of total region production (for the sectors surveyed). The survey questionnaire explicitly attempted to measure intra-firm service flows (intra-firm flows are purchases determined by or made by the head office, or another establishment of the same firm, or services directly furnished by the head office), as distinct from inter-firm flows (inter-firm flows are "free" market purchases autonomously determined by the establishment); but this meant accepting a high rate of missing values, given the inability of many local establishments to evaluate intra-firm transfer costs.
Missing values were estimated on the basis of comparable market transac- tions, assuming a simple linear relationship between service costs and the value of production. This assumption was tested and the relationship was found to be significant for most business services, financial services, and transportation; but less so for services linked to human resources (services 1, 2, 3) and construction, repair and real estate services (see Table 1). However, intra-firm transactions, and thus also missing values, were generally found to be of little importance for this latter set of services.
3. DECOMPOSING SERVICE DEMAND AMONG ALTERNATIVE PROCUREMENT POSSIBILITIES Business services may in general be procured through several channels. The
firm has a choice, at least more so than in the case of most material inputs. For most services the firm may choose to: produce the service in-house at the establishment level; purchase the service on the market from another firm; centralize service production (or procurement) at the head-office level in the
154 PAPERS OF THE REGIONAL SCIENCE ASSOCIATION, VOL 50, 1982
case of multi-establishment firms. These procurement possibilities are not nec- essarily mutually exclusive. In the case of highly differentiated services, the establishment may in part procure the "aggregate" service (as defined by us) at all three levels. Computer services may, for example, be both produced in-house, provided by other establishments of the organization and, from time to time, be purchased on the open market.
The type of procurement should influence the level and direction of interregional flows. Table 1 shows the decomposition of procurement choices per service for our region, where:
Us = the user rate: the proportion of establishments which use service i. L = the proportion of user establishments, U, which produce service i in-house.
Rs = the proportion of establishments, U, which obtain service i via intra-firm transfers.
A~ = the proportion of establishments, U, which purchase service i on the market from another firm.
F~ --the intra-firm dependency rate: the proportion of "linked" establishments (subsidiaries or branches) which procure service i via intra-firm transfers.
Table 2 gives the same results, but where each index, U,-through Fs, is weighted by the value of establishment production. Thus, for example, for Us:
U', = the weighted user rate or service i. U~ = C~/C, where C~ = the total value of production of all establishments which use service i. C = the total value of production of all establishments surveyed.
Where Is + R~ + As > 100, service i is being procured simultaneously via various channels by the same establishment. Where the weighted result is greater than the unweighted one, this indicates that the mode of procurement is a positive function of establishment size.
3.1. Service Use and Procurement Orientation A comparison of Tables 1 and 2 shows that in all eases except two U" >
U;, and generally significantly so. This means that the propensity to use services is a positive function of size. As an establishment grows, new service needs appear. This would suggest a greater than linear increase in aggregate service demand as firms in the area grow in size, which would appear to confirm existing trends in business service employment observed in Canada, the U.S. and elsewhere ([5], [6]). The choice between Rs and At (intra-farm versus inter-firm procurement) is now examined. Tables 1 and 2 permit identification of two sets of services in terms of their procurement behavior. For lack of better terms, these are referred to as "organization oriented" services versus "market oriented" services.
Organization oriented services are defined as those for which at least three of the following four conditions hold: R' > 30; F '> 30; R~ > R; and F~ > Fs. The last condition in effect states that the service is more likely to be internalized
POLESE: BUSINESS SERVICES AND INTERREGIONAL SERVICE FLOWS 155
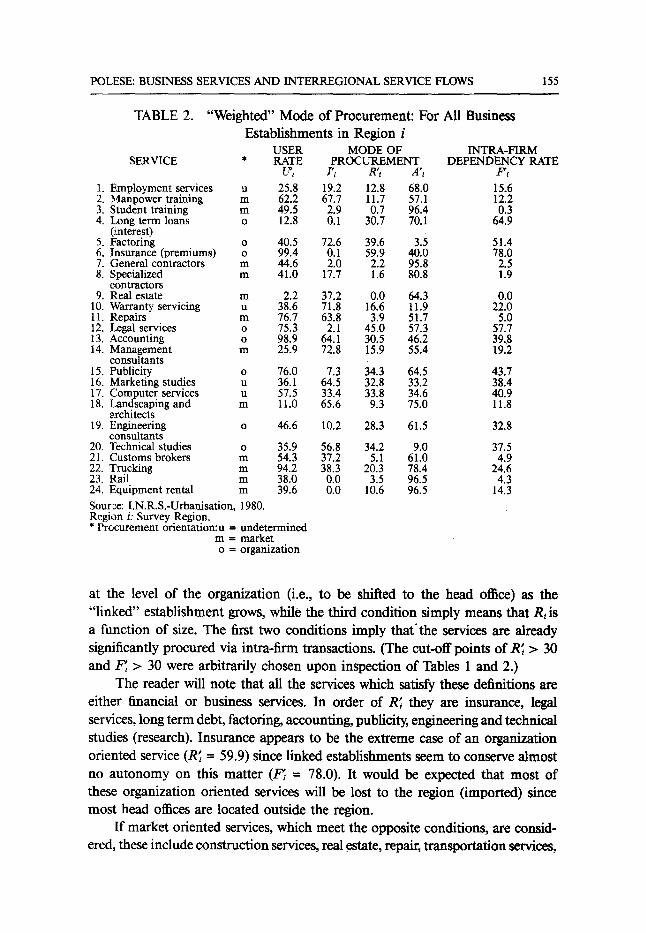
TABLE 2. "Weighted" Mode of Procurement: For All Business Establishments in Region i
USER MODE OF INTRA-FIRM SERVICE * RATE PROCUREMENT DEPENDENCY RATE
U'~ I'~ R'~ A'~ F'~
1. Employment services u 25.8 19.2 12.8 68.0 15.6 2. Manpower training m 62.2 67.7 11.7 57.1 12.2 3. Student training m 49.5 2.9 0.7 96.4 0.3 4. I~ong term loans o 12.8 0.1 30.7 70.1 64.9
(interest) 5. Factoring o 40.5 72.6 39.6 3.5 51.4 6. Insurance (premiums) o 99.4 0.1 59.9 40.0 78.0 7. General contractors m 44.6 2.0 2.2 95.8 2.5 8. Specialized m 41.0 17.7 1.6 80.8 1.9
contractors 9. Real estate m 2.2 37.2 0.0 64.3 0.0
10. Warranty servicing u 38.6 71.8 16.6 11.9 22.0 11. Repairs m 76.7 63.8 3.9 51.7 5.0 12. Legal services o 75.3 2.1 45.0 57.3 57.7 13. Accounting o 98.9 64.1 30.5 46.2 39.8 14. Management m 25.9 72.8 15.9 55.4 19.2
consultants 15. Publicity o 76.0 7.3 34.3 64.5 43.7 16. Marketing studies u 36.1 64.5 32.8 33.2 38.4 17. Computer services u 57.5 33.4 33.8 34.6 40.9 18. Landscaping and m 11.0 65.6 9.3 75.0 11.8
architects 19. Engineering o 46.6 10.2 28.3 61.5 32.8
consultants 20. Technical studies o 35.9 56.8 34.2 9.0 37.5 21. Customs brokers m 54.3 37.2 5.1 61.0 4.9 22. Trucking m 94.2 38.3 20.3 78.4 24.6 23. Rail m 38.0 0.0 3.5 96.5 4.3 24. Equipment rental m 39.6 0.0 10.6 96.5 14.3
Source: I.N.R.S.-Urbanisation, 1980. Region i: Survey Region. �9 Procurement orientation:u = undetermined
m -- market o = organization
at the level of the organization (i.e., to be shifted to the head office) as the "linked" establishment grows, while the third condition simply means that Ri is a function of size. The first two conditions imply that'the services are already significantly procured via intra-firm transactions. (The cut-off points of R' > 30 and F~ > 30 were arbitrarily chosen upon inspection of Tables 1 and 2.)
The reader will note that all the services which satisfy these definitions are either financial or business services. In order of R~ they are insurance, legal services, long term debt, factoring, accounting, publicity, engineering and technical studies (research). Insurance appears to be the extreme case of an organization oriented service (R' = 59.9) since linked establishments seem to conserve almost no autonomy on this matter (F,' = 78.0). It would be expected that most of these organization oriented services will be lost to the region (imported) since mo,;t head offices are located outside the region.
If market oriented services, which meet the opposite conditions, are consid- ered, these include construction services, real estate, repair, transportation services,
156 PAPERS OF THE REGIONAL SCIENCE ASSOCIATION, VOL. 50, 1982
equipment rental, and services linked to student and manpower training; eleven services in all as defined. The only true business services in this group are management consultants and architects. Interregional flow patterns for these services should largely reflect market forces; that is such factors as distance and the relative competitive position of the region.
Only four services fall outside the classification procedure. These are services for which the level of intra-firm procurement is not necessarily positively associated with size. Computer services furnish a good case in point. The level of intra-firm transactions (Ri and Fi) is quite high, but R; < Ri and F$ < Fi, which means that the propensity to procure intra-firm seems to decline with establish- ment size. A priorL this would appear to suggest a promising local market for this service as the region grows.
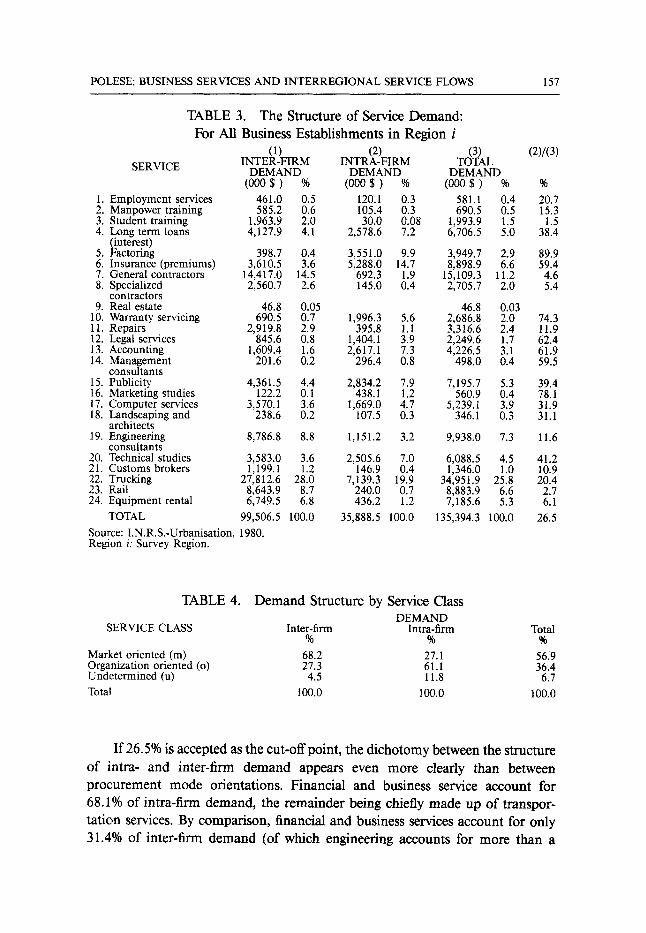
4. THE STRUCTURE OF SERVICE DEMAND Decomposing service demand by mode of procurement facilitates under-
standing of the complexity of service transactions, but it does not measure their relative importance within total service demand. Table 3 gives the structure of service demand, in monetary and percentage terms, for inter-firm flows, intra- firm flows and for total demand. It may be seen that the correspondence between inter-firm flows and market oriented services (or inversely between intra-firm flows and organization oriented services) is not perfect; but it is none the less quite strong (Table 4).
The difference between the two structures is not difficult to understand. Certain services may be basically market oriented, but this does not prevent them from occupying an important place within the intra-firm demand structure and vice versa, if only because of the (monetary) importance of the transactions involved. Thus, trucking, which is classified as market oriented, is important both in the intra- and inter-firm demand structure, in part because it is also the most important service in absolute terms accounting for 25.8% of total demand. Inversely, engineering services, which are classified as being organization oriented in fact generate far more inter-firm demand than intra-firm demand. In this case observed behavior would seem to contradict the classification procedure, but it is much more a reflection of the non-linear nature of engineering service demand.
Table 3 pe.rmits us, in effect, to both clarify and to nuance the dichotomy between organization oriented and market oriented services. Undetermined services such as warranty servicing (10) and marketing studies (16) now appear to be clearly organization oriented, while employment services (1) come out as essentially market oriented; but the basic orientation of computer services still remains in doubt, although intra-firm flows take a share of demand which is slightly above the total sample average (of 26.5%) which would tend to classify this service as being organization oriented.
POLESE: BUSINESS SERVICES AND INTERREGIONAL SERVICE FLOWS 157
TABLE 3. The Structure of Service Demand: For All Business Establishments in Region i
(1) SERVICE INTER-FIRM
DEMAND (000 $ ) %
1. Employment services 461.0 0.5 2. Manpower training 585.2 0.6 3. Student training 1,963.9 2.0 4. Long term loans 4,127.9 4.1
(interest) 5. Factoring 398.7 0.4 6. Insurance (premiums) 3,610.5 3.6 7. General contractors 14,417.0 14.5 8. Specialized 2,560.7 2.6
contractors 9. Real estate 46.8 0.05
10. Warranty servicing 690.5 0.7 11. Repairs 2,919.8 2.9 12. Legal services 845.6 0.8 13. Accounting 1,609.4 1.6 14. Management 201.6 0.2
consultants 15. Publicity 4,361.5 4.4 16. Marketing studies 122.2 0.1 17. Computer services 3,570.1 3.6 18. Landscaping and 238.6 0.2
architects 19. Engineering 8,786.8 8.8
consultants 20. Technical studies 3,583.0 3.6 21. Customs brokers 1,199.1 1.2 22. Trucking 27,812.6 28.0 23. Rail 8,643.9 8.7 24. Equipment rental 6,749.5 6.8
100.0 TOTAL 99,506.5
Source: I.N.R.S.-Urbanisation, 1980. Region i: Survey Region.
(2) (3) (2)/(3) INTRA-FIRM TOTAL
DEMAND DEMAND (000 $ ) % (000 $ ) % %
120.1 0.3 581.1 0.4 20.7 105.4 0.3 690.5 0.5 15.3 30.0 0.08 1,993.9 1.5 1.5
2,578.6 7.2 6,706.5 5.0 38.4
3,551.0 9.9 3,949.7 2.9 89.9 5,288.0 14.7 8,898.9 6.6 59.4
692.3 1.9 15,109.3 11.2 4.6 145.0 0.4 2,705.7 2.0 5.4
46.8 0.03 1,996.3 5.6 2,686.8 2.0 74.3
395.8 1.1 3,316.6 2.4 11.9 1,404.1 3.9 2,249.6 1.7 62.4 2,617.1 7.3 4,226.5 3.1 61.9
296.4 0.8 498.0 0.4 59.5
2,834.2 7.9 7,195.7 5.3 39.4 438.1 1.2 560.9 0.4 78.1
1,669.0 4.7 5,239.1 3.9 31.9 107.5 0.3 346.1 0.3 31.1
1,151.2 3.2 9,938.0 7.3 11.6
2,505.6 7.0 6,088.5 4.5 41.2 146.9 0.4 1,346.0 1.0 10.9
7,139.3 1 9 . 9 34,951.9 25.8 20.4 240.0 0.7 8,883.9 6.6 2.7 436.2 1.2 7,185.6 5.3 6.1
35,888.5 100.0 135,394.3 100.0 26.5
TABLE 4. Demand Structure by Service Class DEMAND
SERVICE CLASS Inter-firm Intra-firm Total % % %
Market oriented (m) 68.2 27.1 56.9 Organization oriented (o) 27.3 61.1 36.4 Undetermined (u) 4.5 11.8 6.7
Total 100.0 100.0 100. 0
If 26.5% is accepted as the cut-off point, the dichotomy between the structure of intra- and inter-firm demand appears even more clearly than between procurement mode orientations. Financial and business service account for 68.1% of intra-firm demand, the remainder being chiefly made up of transpor- tation services. By comparison, financial and business services account for only 31.4% of inter-firm demand (of which engineering accounts for more than a
158 PAPERS OF THE REGIONAL SCIENCE ASSOCIATION, VOL. 50, 1982
third), the main components of inter-firm demand being construction and repair linked services plus transportation and equipment rental.
Inter-firm demand is, in other words, characterized by a large element of "heavy" services related to the physical plant, up-keep, and moving of goods. Their information and human capital content is low, with the notable exception of engineering services. The production of such services does not generally require a complex urban environment, nor are these services which in general travel well. The region should, a priori, conserve a significant portion of this demand.
Convesely, intra-firm demand is characterized by a high level of "light" services which travel well (especially consulting services), are more dependent on urban externalities and possess a high human capital and information content. These are also, in some cases, very "sensitive" services linked to the intra-firm control and management process; as for example, accounting, research and long term debt management. It is not surprising that the head office should often seek to control such services. Correspondingly, it should not be surprising that many of these functions will be imported from outside the region.
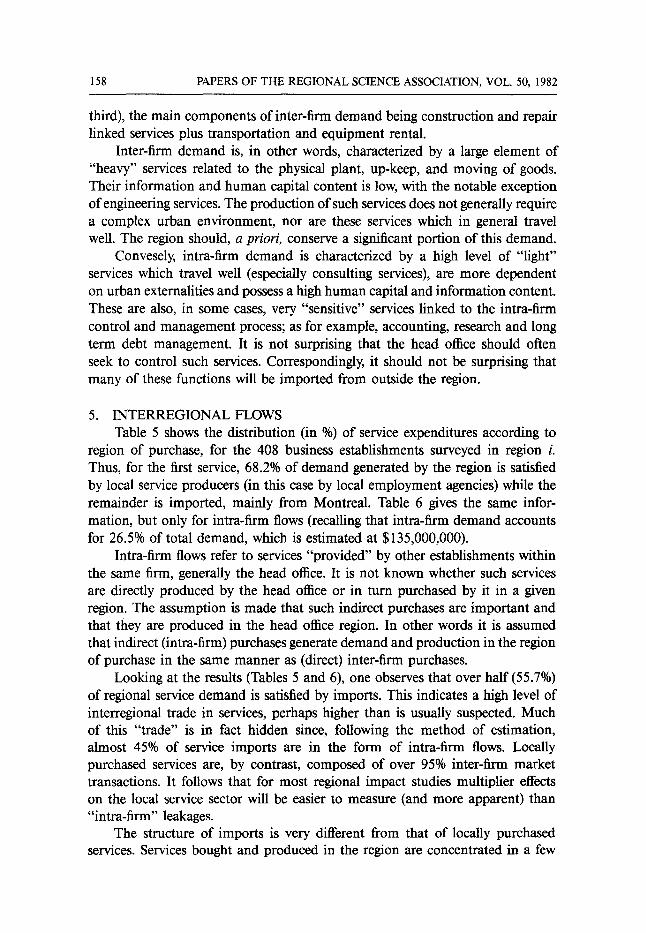
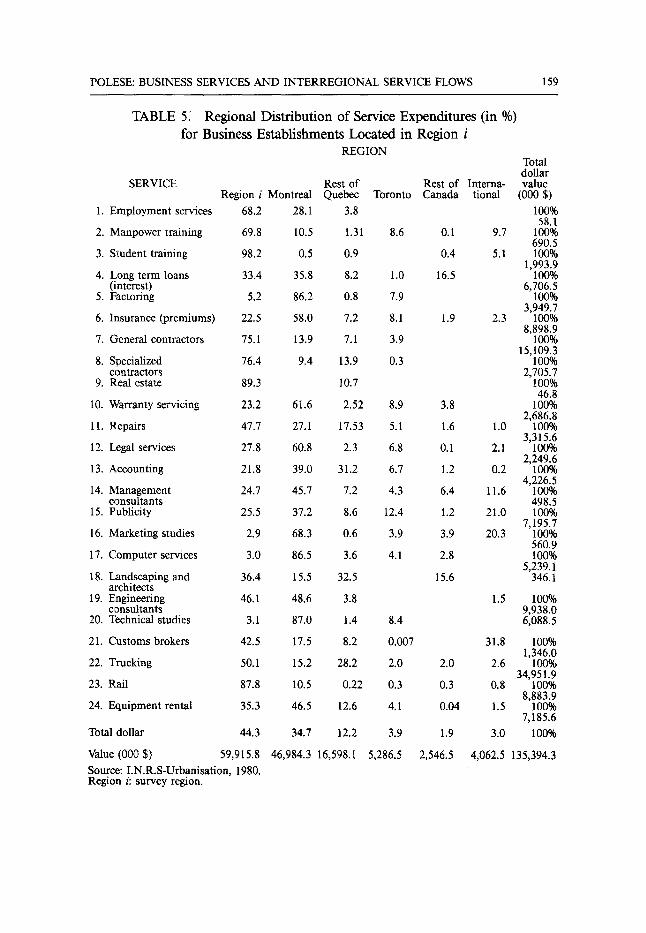
5. INTERREGIONAL FLOWS Table 5 shows the distribution (in %) of service expenditures according to
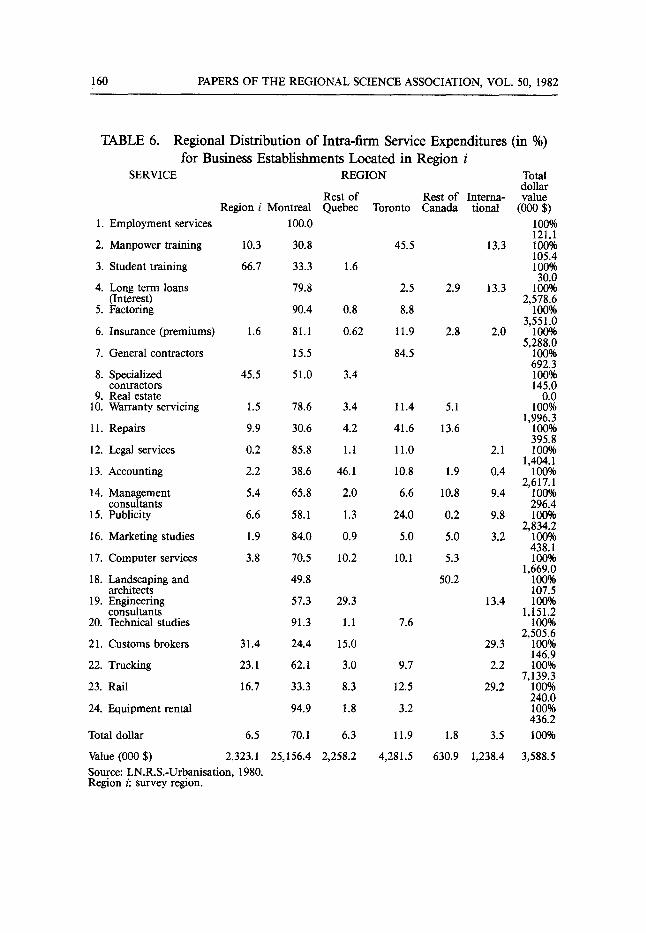
region of purchase, for the 408 business establishments surveyed in region i. Thus, for the first service, 68.2% of demand generated by the region is satisfied by local service producers (in this ease by local employment agencies) while the remainder is imported, mainly from Montreal. Table 6 gives the same infor- mation, but only for intra-firm flows (recalling that intra-firm demand accounts for 26.5% of total demand, which is estimated at $135,000,000).
Intra-firm flows refer to services "provided" by other establishments within the same firm, generally the head office. It is not known whether such services are directly produced by the head office or in turn purchased by it in a given region. The assumption is made that such indirect purchases are important and that they are produced in the head office region. In other words it is assumed that indirect (intra-firm) purchases generate demand and production in the region of purchase in the same manner as (direct) inter-firm purchases.
Looking at the results (Tables 5 and 6), one observes that over half (55.7%) of regional service demand is satisfied by imports. This indicates a high level of interregional trade in services, perhaps higher than is usually suspected. Much of this "trade" is in fact hidden since, following the method of estimation, almost 45% of service imports are in the form of intra-firm flows. Locally purchased services are, by contrast, composed of over 95% inter-firm market transactions. It follows that for most regional impact studies multiplier effects on the local service sector will be easier to measure (and more apparent) than "intra-firm" leakages.
The structure of imports is very different from that of locally purchased services. Services bought and produced in the region are concentrated in a few
POLESE: BUSINESS SERVICES AND INTERREGIONAL SERVICE FLOWS 159
TABLE 5. for Business Establishments Located in Region i
REGION
SERVICE
1. Employment services
2. Manpower training
3. Student training
4. Long term loans (interest)
5. Factoring
6. Insurance (premiums)
7. General contractors
8. Specialized contractors
9. Real estate
10. Warranty servicing
11. Repairs
12. Legal services
13. Accounting
14. Management consultants
15. Publicity
16. Marketing studies
17. Computer services
18. Landscaping and architects
19. Engineering consultants
20. Technical studies
21. Customs brokers
22. Trucking
23. Rail
24. Equipment rental
Total dollar
Value (000 $)
Regional Distribution of Service Expenditures (in %)
Source: I.N.R.S-Urbanisation, 1980. Region i: survey region.
Total dollar
Rest of Rest of Interna- value Region i Montreal Quebec Toronto Canada tional (000 $)
68.2 28.1 3.8 100% 58.1
69.8 10.5 1.31 8.6 0.1 9.7 100% 690.5
98.2 0.5 0.9 0.4 5.1 100% 1,993.9
33.4 35.8 8.2 1.0 16.5 100% 6,706.5
5.2 86.2 0.8 7.9 100% 3,949.7
22.5 58.0 7.2 8.1 1.9 2.3 100% 8,898.9
75.1 13.9 7.1 3.9 100% 15,109.3
76.4 9.4 13.9 0.3 100% 2,705.7
89.3 10.7 100% 46.8
23.2 61.6 2.52 8.9 3.8 100% 2,686.8
47.7 27.1 17.53 5.1 1.6 1.0 100% 3,315.6
27.8 60.8 2.3 6.8 0.1 2.1 100% 2,249.6
21.8 39.0 31.2 6.7 1.2 0.2 100% 4,226.5
24.7 45.7 7.2 4.3 6.4 11.6 100% 498.5
25.5 37.2 8.6 12.4 1.2 21.0 100% 7,195.7
2.9 68.3 0.6 3.9 3.9 20.3 100% 560.9
3.0 86.5 3.6 4.1 2.8 100% 5,239.1
36.4 15.5 32.5 15.6 346.1
46.1 48.6 3.8 1.5 100% 9,938.0
3.1 87.0 1.4 8.4 6,088.5
42.5 17.5 8.2 0.007 31.8 100% 1,346.0
50.1 15.2 28.2 2.0 2.0 2.6 100% 34,951.9
87.8 10.5 0.22 0.3 0.3 0.8 100% 8,883.9
35.3 46.5 12.6 4.1 0.04 1.5 100% 7,185.6
44.3 34.7 12.2 3.9 1.9 3.0 100%
59,915.8 46,984.3 16,598.1 5,286.5 2,546.5 4,062.5 135,394.3
160 PAPERS OF THE REGIONAL SCIENCE ASSOCIATION, VOL. 50, 1982
Regional Distribution of Intra-firm Service Expenditures (in %) TABLE 6. for Business Establishments Located in Region i
SERVICE REGION Total dollar
Rest of Rest of Interna- value Region i Montreal Quebec Toronto Canada tional (000 $)
1. Employment services 100.0 100% 121.1
2. Manpower training 10.3 30.8 45.5 13.3 100% 105.4
3. Student training 66.7 33.3 1.6 100% 30.0
4. Long term loans 79.8 2.5 2.9 13.3 100% (Interest) 2,578.6
5. Factoring 90.4 0.8 8.8 100% 3,551.0
6. Insurance (premiums) 1.6 81.1 0.62 11.9 2.8 2.0 100% 5,288.0
7. General contractors 15.5 84.5 100% 692.3
8. Specialized 45.5 51.0 3.4 100% contractors 145.0
9. Real estate 0.0 10. Warranty servicing 1.5 78.6 3.4 11.4 5.1 100%
1,996.3 11. Repairs 9.9 30.6 4.2 41.6 13.6 100%
395.8 12. Legal services 0.2 85.8 1.1 11.0 2.1 100%
1,404.1 13. Accounting 2.2 38.6 46.1 10.8 1.9 0.4 100%
2,617.1 14. Management 5.4 65.8 2.0 6.6 10.8 9.4 100%
consultants 296.4 15. Publicity 6.6 58.1 1.3 24.0 0.2 9.8 100%
2,834.2 16. Marketing studies 1.9 84.0 0.9 5.0 5.0 3.2 100%
438.1 17. Computer services 3.8 70.5 10.2 10.1 5.3 100%
1,669.0 18. Landscaping and 49.8 50.2 100%
architects 107.5 19. Engineering 57.3 29.3 13.4 100%
consultants 1,151.2 20. Technical studies 91.3 1.1 7.6 100%
2,505.6 21. Customs brokers 31.4 24.4 15.0 29.3 100%
146.9 22. Trucking 23.1 62.1 3.0 9.7 2.2 100%
7,139.3 23. Rail 16.7 33.3 8.3 12.5 29.2 100%
240.0 24. Equipment rental 94.9 1.8 3.2 100%
436.2 Total dollar 6.5 70.1 6.3 11.9 1.8 3.5 100%
Value (000 $) 2,323.1 25,156.4 2,258.2 4 ,281 .5 630 .9 1,238.4 3,588.5 Source: I.N.R.S.-Urbanisation, 1980. Region i: survey region.
POLESE: BUSINESS SERVICES AND INTERREGIONAL SERVICE FLOWS 161
sectors: employment and training services; construction and repair linked services; engineering services; and transportation linked activities. These sectors account for over 80% of locally generated service activity, compared with 51.5% of total generated demand. These are all either market oriented services or services with a below-average component of intra-firm transactions.
By the same token, effects on the local service sector are largely limited to what we have termed "heavy" market oriented services with a low human capital and information content. This impact is nonetheless important in absolute terms, simply because of the importance of construction linked and transport linked services as components of total demand.
The import structure is more diversified. A significant proportion of almost eve1~j service is imported, with the exception of services 3, 9 and 23. The structure of imports is an outcome both of interregional competition for market oriented services and intra-firm linkages. Even for "heavy" obviously market oriented services such as general contracting (7) and trucking (22) a significant proportion of activity is imported. For such market oriented services competition is severely limited by distance. The results reflect the proximity of Montreal, a major service metropolis in Canada, and also of other neighboring regions (in Quebec). In sum, the high level of regional imports must be understood both in terms of the region's relative location and size and in terms of the high level of outside control of its economy.
As Table 6 shows, the intra-firm market almost totally escapes the region as it only retains 6.5% of that market. Intra-firm demand, it may be recalled, comprises a large element of business and financial services. However, intra-firm linkages are not always sufficient to explain the region's performance on these services. For important business services such as publicity, computer services and technical studies (research) intra-service imports explain less than half of inte, r-firm total demand, but this market demand is also largely captured by other regions, chiefly Montreal. For such urban-oriented, high information content services, the region suffers from a clear comparative disadvantage, given its size. The urban orientation of such services may be deduced by the proportion of flows going to Montreal.
For other business services the level of imports can in large part be explained by the level ofintra-firm demand. For legal services, accounting and management consultants, the region retains a share of inter-firm demand which is either close to or above average for inter-firm purchases. The high level of imports may be almost wholly attributed to the "over-representation" of intra-firm flows for these cases. The region possesses a strong accounting and management consulting sector (because of the university-affiliated business school) which ensures the region a competitive position in terms of market flows, but as Table 6 shows, this seems to have little impact on the direction of intra-firm flows. Financial services show a similar behaviour.
162 PAPERS OF THE REGIONAL SCIENCE ASSOCIATION, VOL. 50, 1982
CONCLUSIONS On the basis of survey data it was possible to estimate the structure and
destination of regional business demand for services. A high proportion of services were imported from other regions. The high level of interregional service flows may first be understood in terms of "normal" market competition between regions. The region surveyed did fairly poorly in this competitive context largely because of the classical factors of distance and size. The region is not far (150 km) from a much larger competing urban metropolis, Montreal. Even traditional distance-sensitive services such as construction and trucking were in part im- ported.
However, a large proportion of interregional service flows is hidden and difficult to measure. Much business demand for services is not satisfied by "normal" market purchases, but rather by intra-firm transactions. For the study region, intra-firm transactions were found to account for 26.5% of total service demand and for about 45% of imports. The behavior of establishments in terms of their procurement choice for services (market purchase versus intra-firm transfers) is thus an important factor in explaining interregional flows.
Services may be considered as either "market oriented" or "organization oriented" depending on the propensity of corporate controlled establishments to purchase a service on the market or to receive it via the larger organization. It was found that organization oriented services are generally financial and business services: insurance; accounting; legal services, etc. These are also, in general, services whose demand is clearly a function of size (and where organi- zation orientation is also often a function of size) and which, at least in the case of business services, are growing more rapidly than the service sector in general. Such services were found to be almost entirely imported when acquired via intra-firm transactions.
In sum, if these findings may be generalized to other regions, it should be expected that an increasing proportion of interregional service flows be made up of intra-firm transactions. An increasing number of purchases will in other words be made indirectly via the head office, probably ih its own region. This would tend to lend support to the hypotheses of an "office activity complex" Gad [3], Columbia [2], composed of a head otfice sector, a business service sector and a financial sector. It also means that theories of service flows must necessarily be tied to theories of office location, especially head office location.
REFERENCES
[1] Bailly, A. and J. Paelinck. "Le probleme d'evaluation des flux de biens et de services entre deux regions de cultures differentes; problematiques, echantillonages et propositions." Revue d'Economie Regionale et Urbaine, 1980, no. 1.
[2] Columbia. The Corporate Headquarters Complex in New York City. New York: Conservation of Human Resources Project, Columbia University, 1977.
[3] Gad, Gunter. "Face-to-face linkages and office decentralization potentials: a study of Toronto;' in P. W. Daniel (ed.), Spatial Patterns of Office Growth and Location. New York." John Wiley and Sons, 1979.

POLESE: BUSINESS SERVICES AND INTERREGIONAL SERVICE FLOWS 163
[4] I.N.R.S. Pour developper l'achat regional dans l'Estrie: etude de flux de biens et de services. Montreal: Institut National de la Recherche Scientifique - - Urbanisation. Study published by the Government of Quebec Printing Office, 1980.
[5] Marquand, Judith. The Service Sector and Regional Policy in the United Kingdom. London: Centre for Environmental Studies, Research Series 29, 1979.
[6] O~E.C.D. Regional Policies and the Service Sector. Paris: Organization for Economic Co- operation and Development, 1978.
[7] U.S Department of Commerce. Service Industries, Trends and Prospects. Washington, D.C., 1975.