Embed Size (px)
Citation preview

Region 2000 LGC
Virginia
703 East Main Street • Richmond, Virginia 23219Tel: (804) 786-8223 • www.VirginiaLMI.com
Virginia Employment Commission
Last updated: 4/6/2018 3:38:51 PM
Amherst County • Appomattox County • Bedford County • Campbell County • Bedford city • Lynchburg city

Table of Contents
I. Introduction
II. Demographic Profile
Population by Age Cohort
Population by Race/Ethnicity
Population by Gender
Population Change
Population Projections by Age and Gender
English Language Skills
Commuting Patterns
III. Economic ProfileUnemployment Rates
Employers by Size of Establishment
Employment by Size of Establishment
Employment by Industry
New Hires by Industry
Characteristics of the Insured Unemployed
50 Largest Employers
In-Commuting
Out-Commuting
Unemployment Insurance Payments
. . . . . . . . . . . . . . . . . . .
. . . . . . . . . . . . . . . . . . . . . . . . . . . . . . . . . . . . . . . . . . . . . . . . . . . . .
. . . . . . . . . . . . . . . . . . . . . . . . . . . . . . . . . . . . . . . . . . . .
. . . . . . . . . . . . . . . . . . . . . . . .
. . . . . . . . . . . . . . . . . . . . . . . . . . . . . . . . . . . . . .
. . . . . . . . . . . . . . . . . . . . . . . . . . . . . . . . . . . . . . . . . .
. . . . . . . . . . . . . . . . . . . . . . . . . . . . . . . . . . . . . . . . . . . . . .
. . . . . . . . . . . . . . . . . . . . . . . .
. . . . . . . . . . . . . . . . . . . . . . . . . . . . . . . . . . . . . . . . . . . . . . . . . . . . . . . . . . . . . . . . . . . . . .
. . . . . . . . . . . . . . . . . . . . . . . . . . . . . . . . . . . . . . . . . . . . . .
. . . . . . . . . . . . . . . . .
. . . . . . . . . . . . . . . . .
. . . . . . . . . . . . . . . . . .
. . . . . . . . . . . . . . . . . . . . . . . . . . . . . . . . . . . . . . . . . . . . . . . . . . . . . . . . . . . . . .
. . . . . . . . . . . .
. . . . . . . . . . . . . . . . . . . . . . . . . . . . . . . . . .
. . . . . . . . . . . . . . . . . . . . . . . . . . . . . . . . . . . . . . . .
. . . . . . . . . . . . . . . . . . . . . . . . . . . . . . . . . . . . . . . . . . . .
. . . . . . . . . . . . . . . . . . . . . . . . . . . . . . . . . . . . . . . . . . . .
. . . . . . . . . . . .
. . . . . . . . . . . .
. . . . . . . . . . . . . .
New Startup Firms . . . . . . . . . . . . . . . . . . . . . . . . . . . . . . . . . . . . . . . . . . . . . . . .
10
10
11
11
1213
20
20
22
24
15
21
18
23
6
7
7
8
9
4
5
Population Projections by Race/Ethnicity . . . . . . . . . . . . . . . . . .
9
Virginia Employment Commission Page 2 of 45
ContentsRegion 2000 LGC
Turnover by Industry
Average Weekly Wage by Industry
Age of Workers by Industry
Industry Employment and Projections
Occupation Employment and Projections
Growth Occupations
Declining Occupations
IV. Education ProfileEducational Attainment
Educational Attainment by Age
Educational Attainment by Gender
. . . . . . . . . . . . . . . . . . . . . . . . . . . . . . . . . . . . . . . . . . . . . .
. . . . . . . . . . . .
. . . . . . . . . . . . . . . . . . . . . . . . . . . . . . . . . . . . . . . . . . . . . .
. . . . . . . . . . . . . . . . . . . . . .
. . . . . . . . . . . . . . . . . . . . . . . . . . . . . . . . . . . . . . . . . . . . . .. . . . . . . . . . . . . . . . . . . . . . . . . . . . . . . . . . . . . . . . . . . .
. . . . . . . . . . . . . . . . . .
. . . . . . . . . . . . . . . . . .
. . . . . . . . . . . . . . . . . . . . . . . . . . . . . . . . . . . . . . . . . . . . . . . . . . . . . . . . . . . .
. . . . . . . . . . . . . . . . . . . . . . . . . . . . . . . .
. . . . . . . . . . . . .
. . . . . . . . . . . . .
Consumer Price Index (CPI) . . . . . . . . . . . . . . . . . . . . . . . . . . . . . . . . . . . .
Local Option Sales Tax . . . . . . . . . . . . . . . . . . . . . . . . . . . . . . . . . . . . . . . . . .
25
26
27
28
30
32
33
38
39
40
37
34
35
Educational Attainment by Race/Ethnicity
Graduate Data Trends
. . . . . . . . . . . . . . . .
. . . . . . . . . . . . . . . . . . . . . . . . . . . . . . . . . . . . . . . . . . . .
41
42
Training Providers . . . . . . . . . . . . . . . . . . . . . . . . . . . . . . . . . . . . . . . . . . . . . . . .
43
Virginia Employment Commission Page 3 of 45
ContentsRegion 2000 LGC

This report provides a community profile of Region 2000 LGC. It is intended to complement the information found in our Virginia Workforce Connection application, which can be accessed online at:
www.VirginiaLMI.com
The report is divided into three major sections. The first contains a profile of regional demographic characteristics and trends, the second supplies similar information for the regional economy, and the third provides a profile of regional education characteristics.
I. Introduction
Virginia Employment Commission Page 4 of 45
IntroductionRegion 2000 LGC

II. Demographic Profile
This Demographic Profile provides an in-depth analysis of the population in Region 2000 LGC. Most of the data is produced by the U.S. Census Bureau, and includes demographic characteristics such as age, race/ethnicity, and gender.
Related Terms and DefinitionsOverview
Ability to speak EnglishFor people who speak a language other than English at home, the response represents the person's own perception of his or her ability to speak English. Because census questionnaires are usually completed by one household member, the responses may represent the perception of another household member.
AgeThe age classification is based on the age of the person in complete years as of April 1, 2010. The age of the person usually was derived from their date of birth information. Their reported age was used only when date of birth information was unavailable.
GenderThe data on gender were derived from answers to a question that was asked of all people. Individuals were asked to mark either "male" or "female" to indicate their gender. For most cases in which gender was not reported, it was determined by the appropriate entry from the person's given (i.e., first) name and household relationship. Otherwise, gender was imputed according to the relationship to the householder and the age of the person.
RaceThe concept of race as used by the Census Bureau reflects self-identification by people according to the race or races with which they most closely identify. The categories are sociopolitical constructs and should not be interpreted as being scientific or anthropological in nature. Furthermore, the race categories include both racial and national-origin groups.
Please note: In the past, our population by race/ethnicity data has always excluded the Hispanic ethnicity from each race category. Starting in January 2013, each race category now includes all ethnicities.
Virginia Employment Commission Page 5 of 45
Demographic ProfileRegion 2000 LGC
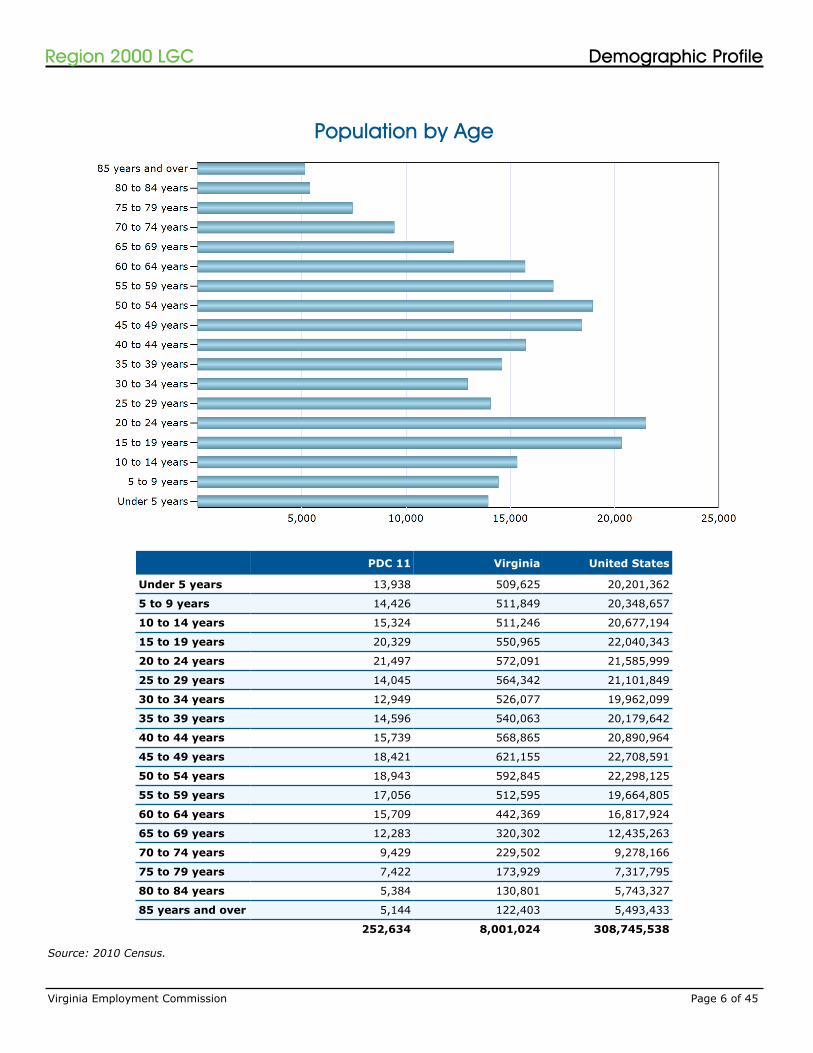
Population by Age
PDC 11 Virginia United States
Under 5 years 13,938 509,625 20,201,362
5 to 9 years 14,426 511,849 20,348,657
10 to 14 years 15,324 511,246 20,677,194
15 to 19 years 20,329 550,965 22,040,343
20 to 24 years 21,497 572,091 21,585,999
25 to 29 years 14,045 564,342 21,101,849
30 to 34 years 12,949 526,077 19,962,099
35 to 39 years 14,596 540,063 20,179,642
40 to 44 years 15,739 568,865 20,890,964
45 to 49 years 18,421 621,155 22,708,591
50 to 54 years 18,943 592,845 22,298,125
55 to 59 years 17,056 512,595 19,664,805
60 to 64 years 15,709 442,369 16,817,924
65 to 69 years 12,283 320,302 12,435,263
70 to 74 years 9,429 229,502 9,278,166
75 to 79 years 7,422 173,929 7,317,795
80 to 84 years 5,384 130,801 5,743,327
85 years and over 5,144 122,403 5,493,433
252,634 8,001,024 308,745,538
Source: 2010 Census.
Virginia Employment Commission Page 6 of 45
Demographic ProfileRegion 2000 LGC
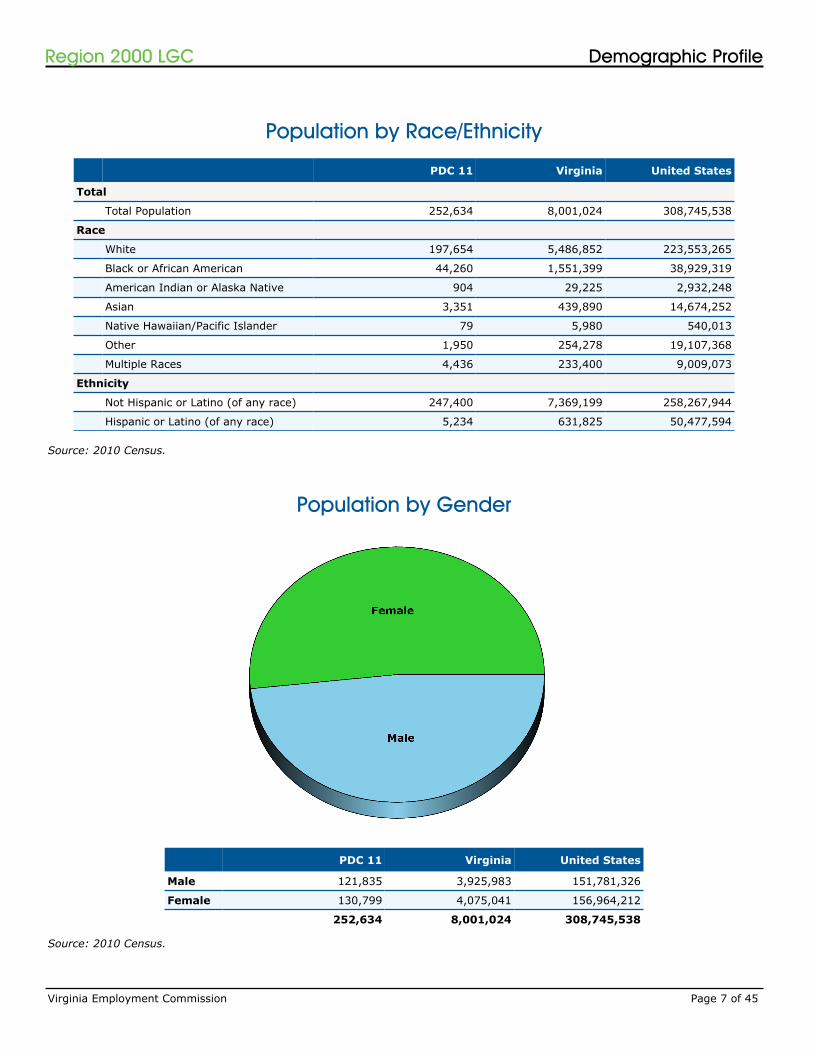
Population by Race/Ethnicity
PDC 11 Virginia United States
Total
Total Population 252,634 8,001,024 308,745,538
Race
White 197,654 5,486,852 223,553,265
Black or African American 44,260 1,551,399 38,929,319
American Indian or Alaska Native 904 29,225 2,932,248
Asian 3,351 439,890 14,674,252
Native Hawaiian/Pacific Islander 79 5,980 540,013
Other 1,950 254,278 19,107,368
Multiple Races 4,436 233,400 9,009,073
Ethnicity
Not Hispanic or Latino (of any race) 247,400 7,369,199 258,267,944
Hispanic or Latino (of any race) 5,234 631,825 50,477,594
Source: 2010 Census.
Population by Gender
PDC 11 Virginia United States
Male 121,835 3,925,983 151,781,326
Female 130,799 4,075,041 156,964,212
252,634 8,001,024 308,745,538
Source: 2010 Census.
Virginia Employment Commission Page 7 of 45
Demographic ProfileRegion 2000 LGC
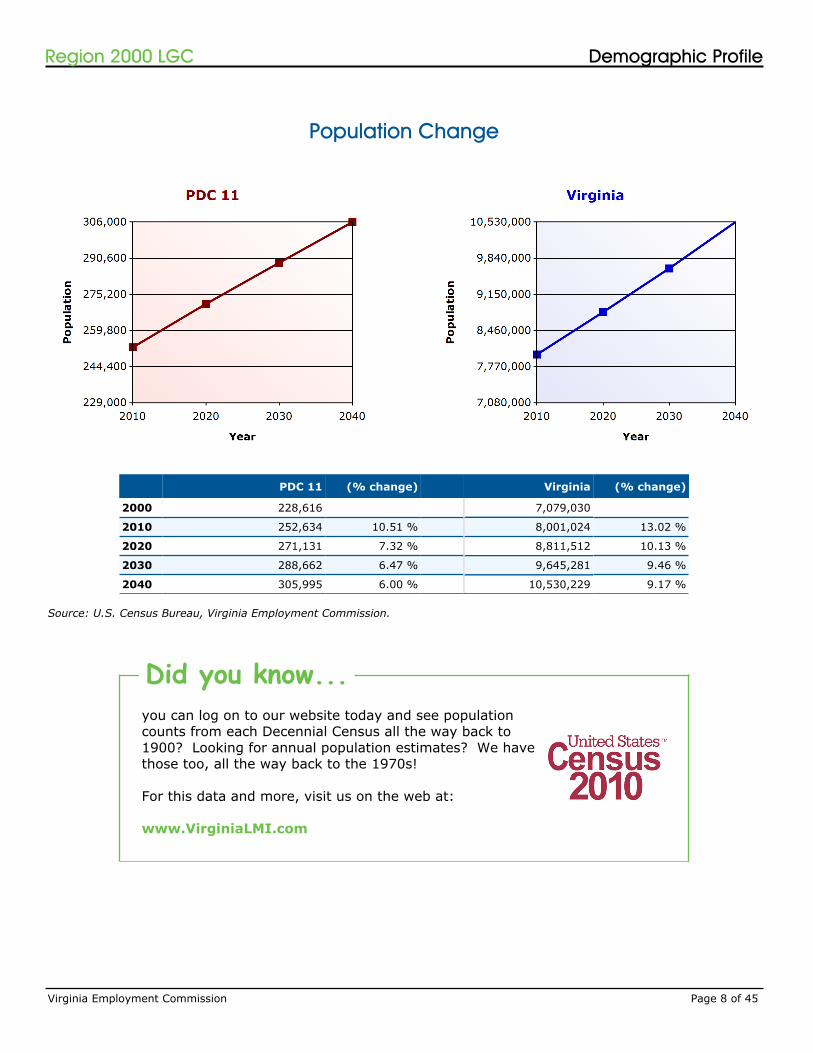
Population Change
PDC 11 (% change) Virginia (% change)
2000 228,616 7,079,030
2010 252,634 10.51 % 8,001,024 13.02 %
2020 271,131 7.32 % 8,811,512 10.13 %
2030 288,662 6.47 % 9,645,281 9.46 %
2040 305,995 6.00 % 10,530,229 9.17 %
Source: U.S. Census Bureau, Virginia Employment Commission.
you can log on to our website today and see population counts from each Decennial Census all the way back to 1900? Looking for annual population estimates? We have those too, all the way back to the 1970s!
For this data and more, visit us on the web at:
www.VirginiaLMI.com
Did you know...
Virginia Employment Commission Page 8 of 45
Demographic ProfileRegion 2000 LGC
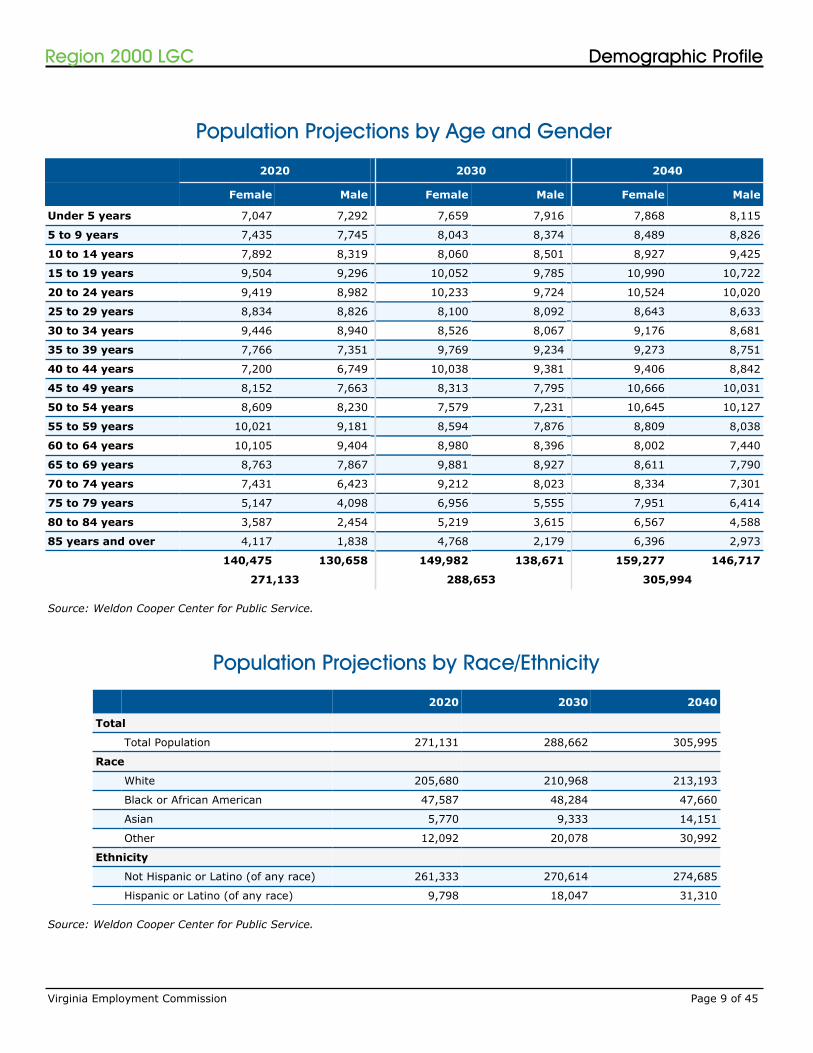
Population Projections by Age and Gender
2020 2030 2040
Female Male Female Male Female Male
Under 5 years 7,047 7,292 7,659 7,916 7,868 8,115
5 to 9 years 7,435 7,745 8,043 8,374 8,489 8,826
10 to 14 years 7,892 8,319 8,060 8,501 8,927 9,425
15 to 19 years 9,504 9,296 10,052 9,785 10,990 10,722
20 to 24 years 9,419 8,982 10,233 9,724 10,524 10,020
25 to 29 years 8,834 8,826 8,100 8,092 8,643 8,633
30 to 34 years 9,446 8,940 8,526 8,067 9,176 8,681
35 to 39 years 7,766 7,351 9,769 9,234 9,273 8,751
40 to 44 years 7,200 6,749 10,038 9,381 9,406 8,842
45 to 49 years 8,152 7,663 8,313 7,795 10,666 10,031
50 to 54 years 8,609 8,230 7,579 7,231 10,645 10,127
55 to 59 years 10,021 9,181 8,594 7,876 8,809 8,038
60 to 64 years 10,105 9,404 8,980 8,396 8,002 7,440
65 to 69 years 8,763 7,867 9,881 8,927 8,611 7,790
70 to 74 years 7,431 6,423 9,212 8,023 8,334 7,301
75 to 79 years 5,147 4,098 6,956 5,555 7,951 6,414
80 to 84 years 3,587 2,454 5,219 3,615 6,567 4,588
85 years and over 4,117 1,838 4,768 2,179 6,396 2,973
140,475 130,658 149,982 138,671 159,277 146,717
271,133 288,653 305,994
Source: Weldon Cooper Center for Public Service.
Population Projections by Race/Ethnicity
Source: Weldon Cooper Center for Public Service.
2020 2030 2040
Total
Total Population 271,131 288,662 305,995
Race
White 205,680 210,968 213,193
Black or African American 47,587 48,284 47,660
Asian 5,770 9,333 14,151
Other 12,092 20,078 30,992
Ethnicity
Not Hispanic or Latino (of any race) 261,333 270,614 274,685
Hispanic or Latino (of any race) 9,798 18,047 31,310
Virginia Employment Commission Page 9 of 45
Demographic ProfileRegion 2000 LGC
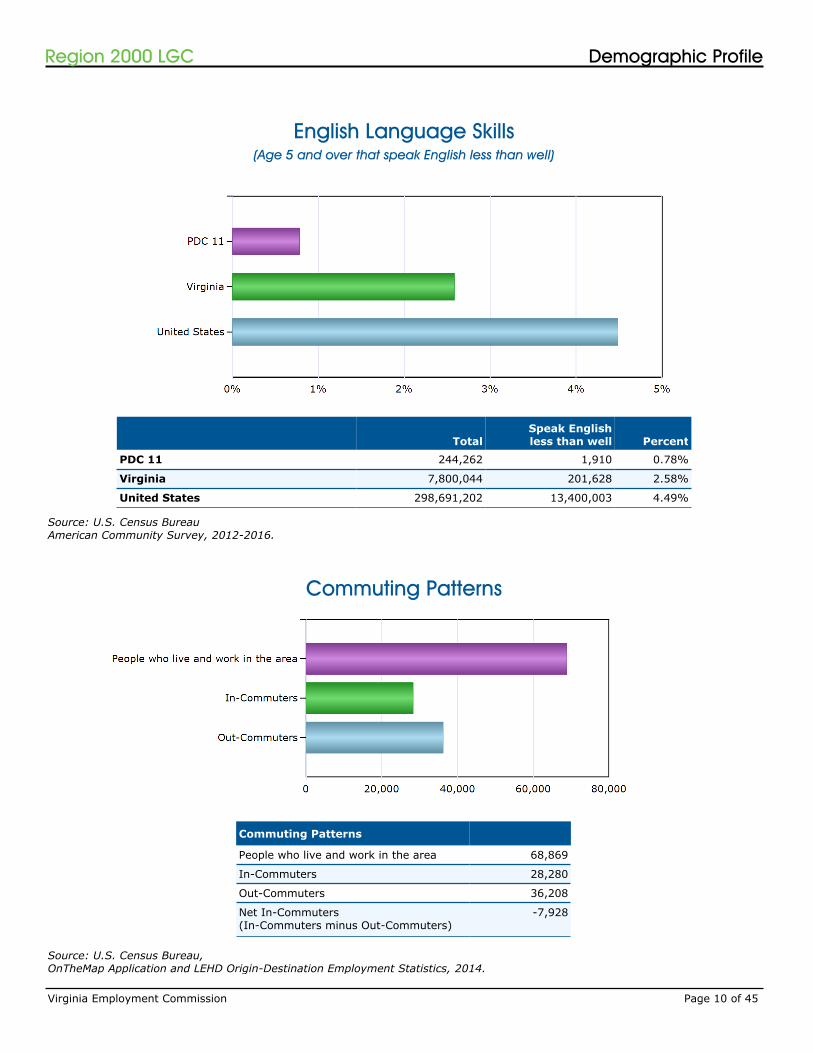
English Language Skills
TotalSpeak Englishless than well Percent
PDC 11 244,262 1,910 0.78%
Virginia 7,800,044 201,628 2.58%
United States 298,691,202 13,400,003 4.49%
Source: U.S. Census BureauAmerican Community Survey, 2012-2016.
(Age 5 and over that speak English less than well)
Commuting Patterns
Commuting Patterns
People who live and work in the area 68,869
In-Commuters 28,280
Out-Commuters 36,208
Net In-Commuters(In-Commuters minus Out-Commuters)
-7,928
Source: U.S. Census Bureau,OnTheMap Application and LEHD Origin-Destination Employment Statistics, 2014.
Virginia Employment Commission Page 10 of 45
Demographic ProfileRegion 2000 LGC
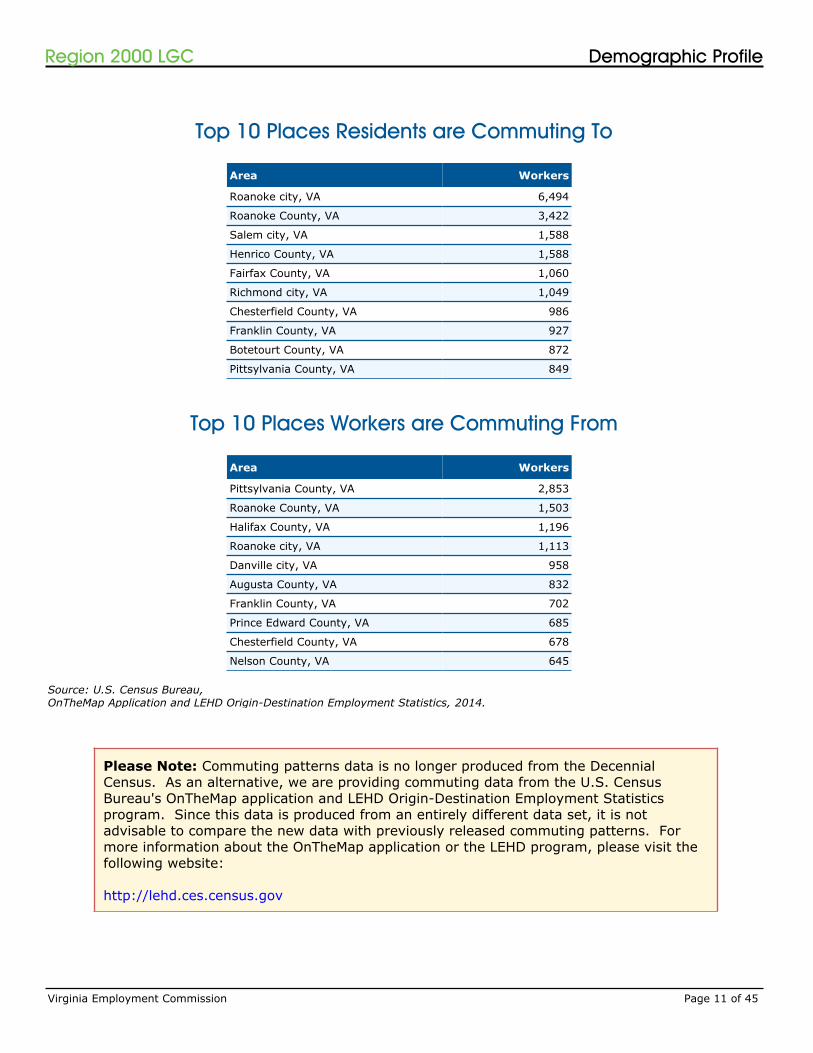
Top 10 Places Residents are Commuting To
Area Workers
Roanoke city, VA 6,494
Roanoke County, VA 3,422
Salem city, VA 1,588
Henrico County, VA 1,588
Fairfax County, VA 1,060
Richmond city, VA 1,049
Chesterfield County, VA 986
Franklin County, VA 927
Botetourt County, VA 872
Pittsylvania County, VA 849
Top 10 Places Workers are Commuting From
Area Workers
Pittsylvania County, VA 2,853
Roanoke County, VA 1,503
Halifax County, VA 1,196
Roanoke city, VA 1,113
Danville city, VA 958
Augusta County, VA 832
Franklin County, VA 702
Prince Edward County, VA 685
Chesterfield County, VA 678
Nelson County, VA 645
Source: U.S. Census Bureau,OnTheMap Application and LEHD Origin-Destination Employment Statistics, 2014.
Please Note: Commuting patterns data is no longer produced from the Decennial Census. As an alternative, we are providing commuting data from the U.S. Census Bureau's OnTheMap application and LEHD Origin-Destination Employment Statistics program. Since this data is produced from an entirely different data set, it is not advisable to compare the new data with previously released commuting patterns. For more information about the OnTheMap application or the LEHD program, please visit the following website:
http://lehd.ces.census.gov
Virginia Employment Commission Page 11 of 45
Demographic ProfileRegion 2000 LGC
III. Economic Profile
The Economic Profile of Region 2000 LGC consists primarily of data produced by the Virginia Employment Commission, U.S. Census Bureau, and the Bureau of Labor Statistics.
Related Terms and DefinitionsOverview
Average Weekly WageComputed as average quarterly wages divided by 13.
Consumer Price Index (CPI)The Consumer Price Index measures the average change over time in the prices paid by urban consumers for a representative market basket of consumer goods and services.
Local Employment Dynamics (LED)The Local Employment Dynamics Program at the Census Bureau, together with its state partners, provides employment information at the county, city, and Workforce Investment Area level. This information tracks workers in different industries by age and gender and provides statistics on job creation, separation, turnover, and wages.
Quarterly Census of Employment & Wages (QCEW)A federal/state cooperative program that collects and compiles employment and wage data for workers covered by state unemployment insurance (UI) laws and the federal civilian workers covered by Unemployment Compensation for Federal Employees (UCFE). These data are maintained at the state in micro and macro levels and also sent to BLS quarterly.
Unemployment Insurance (UI)Unemployment insurance is a program for the accumulation of funds paid by employers to be used for the payment of unemployment insurance to workers during periods of unemployment which are beyond the workers' control. Unemployment insurance replaces a part of the worker's wage loss if he becomes eligible for payments.
Unemployment RateThe number of unemployed people as a percentage of the labor force.
Virginia Employment Commission Page 12 of 45
Economic ProfileRegion 2000 LGC
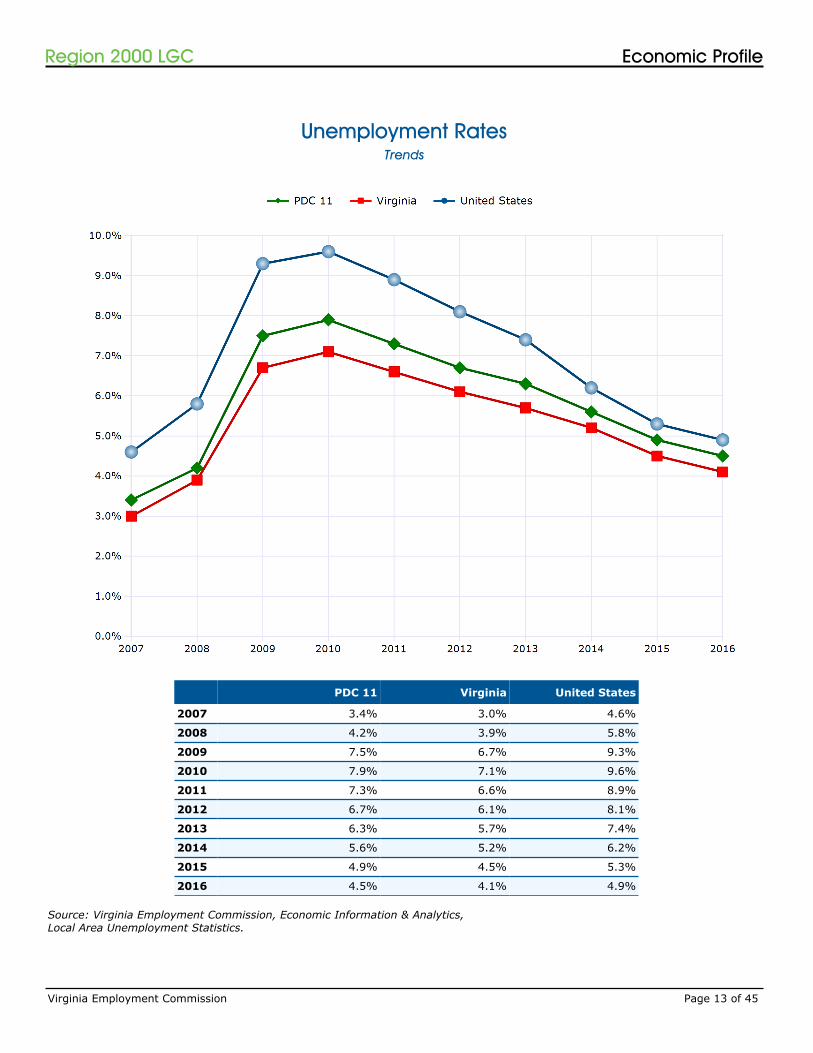
Unemployment Rates
PDC 11 Virginia United States
2007 3.4% 3.0% 4.6%
2008 4.2% 3.9% 5.8%
2009 7.5% 6.7% 9.3%
2010 7.9% 7.1% 9.6%
2011 7.3% 6.6% 8.9%
2012 6.7% 6.1% 8.1%
2013 6.3% 5.7% 7.4%
2014 5.6% 5.2% 6.2%
2015 4.9% 4.5% 5.3%
2016 4.5% 4.1% 4.9%
Source: Virginia Employment Commission, Economic Information & Analytics, Local Area Unemployment Statistics.
Trends
Virginia Employment Commission Page 13 of 45
Economic ProfileRegion 2000 LGC
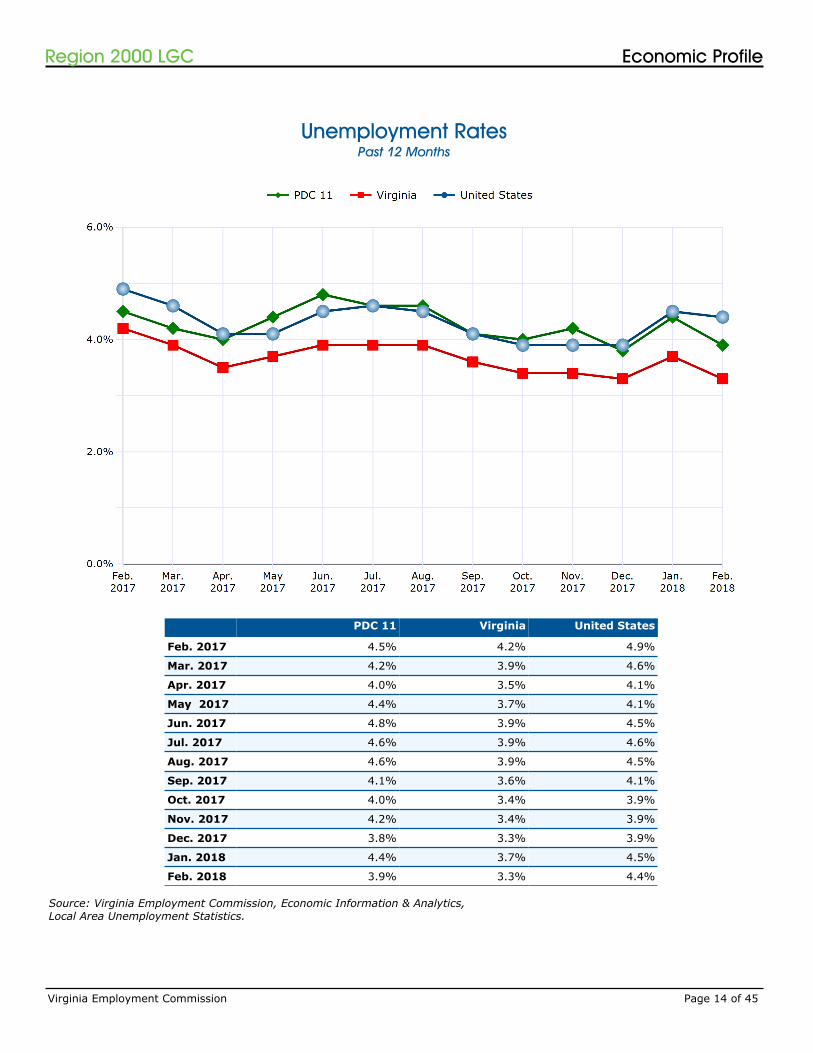
Unemployment Rates
PDC 11 Virginia United States
Feb. 2017 4.5% 4.2% 4.9%
Mar. 2017 4.2% 3.9% 4.6%
Apr. 2017 4.0% 3.5% 4.1%
May 2017 4.4% 3.7% 4.1%
Jun. 2017 4.8% 3.9% 4.5%
Jul. 2017 4.6% 3.9% 4.6%
Aug. 2017 4.6% 3.9% 4.5%
Sep. 2017 4.1% 3.6% 4.1%
Oct. 2017 4.0% 3.4% 3.9%
Nov. 2017 4.2% 3.4% 3.9%
Dec. 2017 3.8% 3.3% 3.9%
Jan. 2018 4.4% 3.7% 4.5%
Feb. 2018 3.9% 3.3% 4.4%
Past 12 Months
Source: Virginia Employment Commission, Economic Information & Analytics, Local Area Unemployment Statistics.
Virginia Employment Commission Page 14 of 45
Economic ProfileRegion 2000 LGC
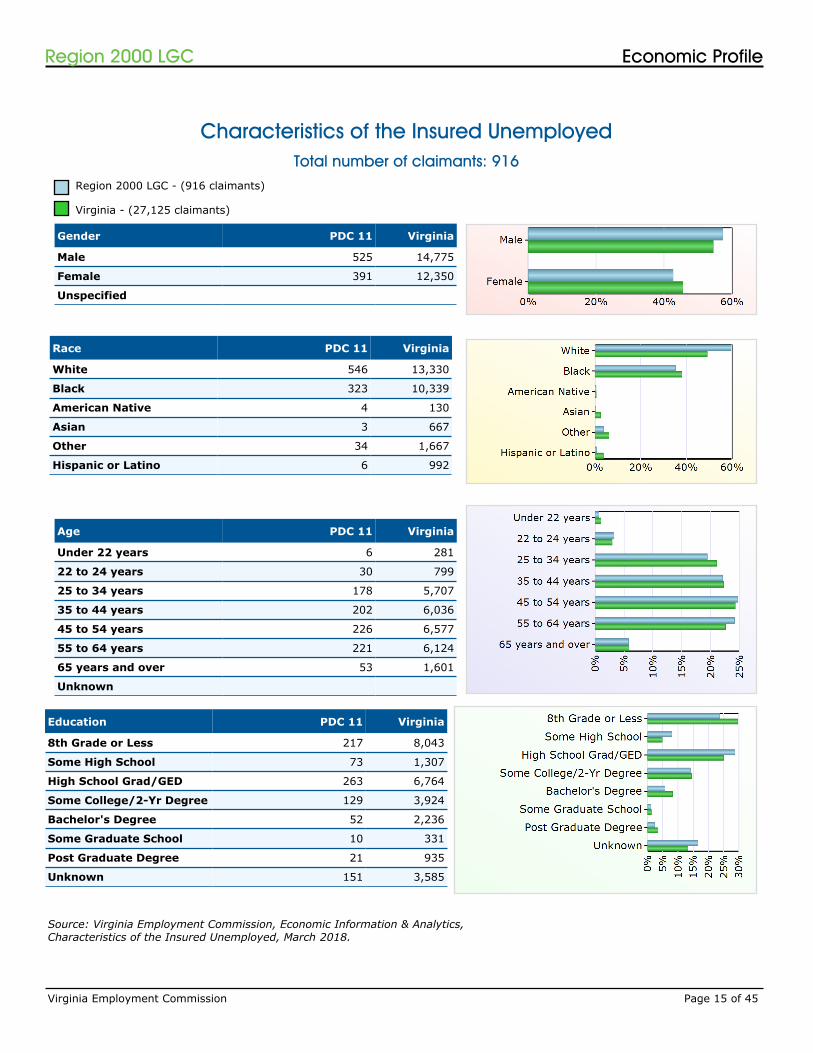
Characteristics of the Insured Unemployed
Age PDC 11 Virginia
Under 22 years 6 281
22 to 24 years 30 799
25 to 34 years 178 5,707
35 to 44 years 202 6,036
45 to 54 years 226 6,577
55 to 64 years 221 6,124
65 years and over 53 1,601
Unknown
Gender PDC 11 Virginia
Male 525 14,775
Female 391 12,350
Unspecified
Race PDC 11 Virginia
White 546 13,330
Black 323 10,339
American Native 4 130
Asian 3 667
Other 34 1,667
Hispanic or Latino 6 992
Education PDC 11 Virginia
8th Grade or Less 217 8,043
Some High School 73 1,307
High School Grad/GED 263 6,764
Some College/2-Yr Degree 129 3,924
Bachelor's Degree 52 2,236
Some Graduate School 10 331
Post Graduate Degree 21 935
Unknown 151 3,585
Region 2000 LGC - (916 claimants)
Virginia - (27,125 claimants)
Source: Virginia Employment Commission, Economic Information & Analytics, Characteristics of the Insured Unemployed, March 2018.
Total number of claimants: 916
Virginia Employment Commission Page 15 of 45
Economic ProfileRegion 2000 LGC
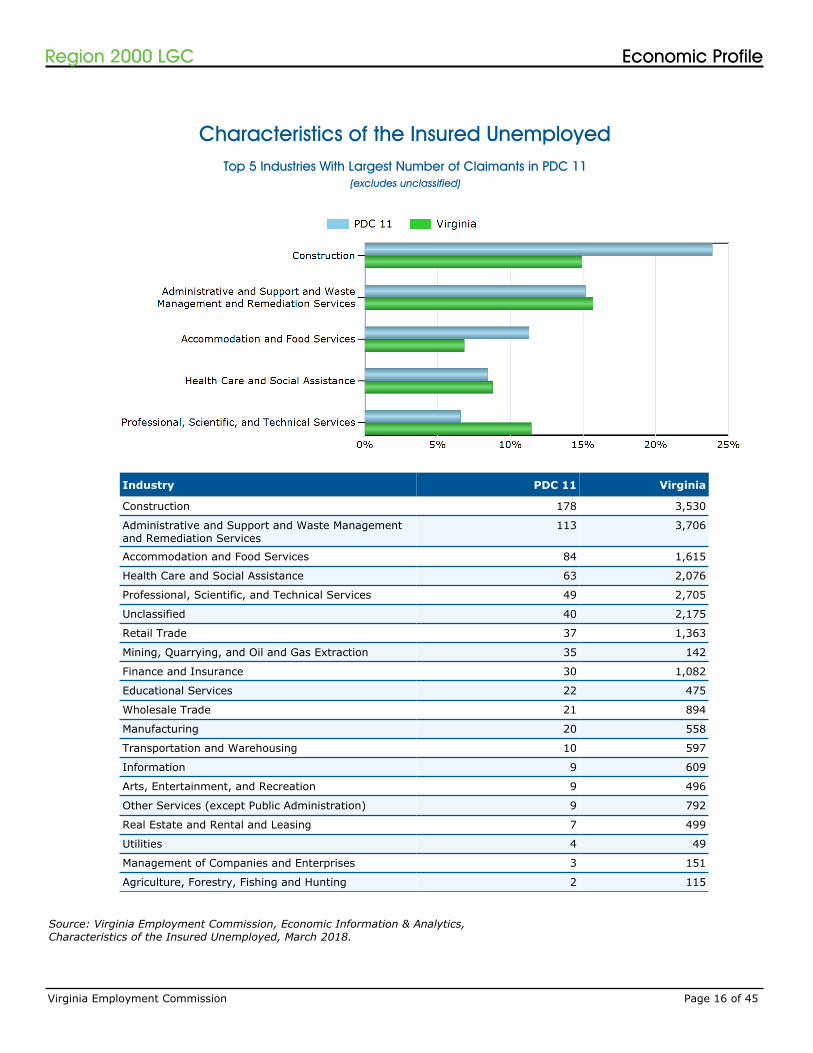
Industry PDC 11 Virginia
Construction 178 3,530
Administrative and Support and Waste Management and Remediation Services
113 3,706
Accommodation and Food Services 84 1,615
Health Care and Social Assistance 63 2,076
Professional, Scientific, and Technical Services 49 2,705
Unclassified 40 2,175
Retail Trade 37 1,363
Mining, Quarrying, and Oil and Gas Extraction 35 142
Finance and Insurance 30 1,082
Educational Services 22 475
Wholesale Trade 21 894
Manufacturing 20 558
Transportation and Warehousing 10 597
Information 9 609
Arts, Entertainment, and Recreation 9 496
Other Services (except Public Administration) 9 792
Real Estate and Rental and Leasing 7 499
Utilities 4 49
Management of Companies and Enterprises 3 151
Agriculture, Forestry, Fishing and Hunting 2 115
(excludes unclassified)
Top 5 Industries With Largest Number of Claimants in PDC 11
Source: Virginia Employment Commission, Economic Information & Analytics, Characteristics of the Insured Unemployed, March 2018.
Characteristics of the Insured Unemployed
Virginia Employment Commission Page 16 of 45
Economic ProfileRegion 2000 LGC
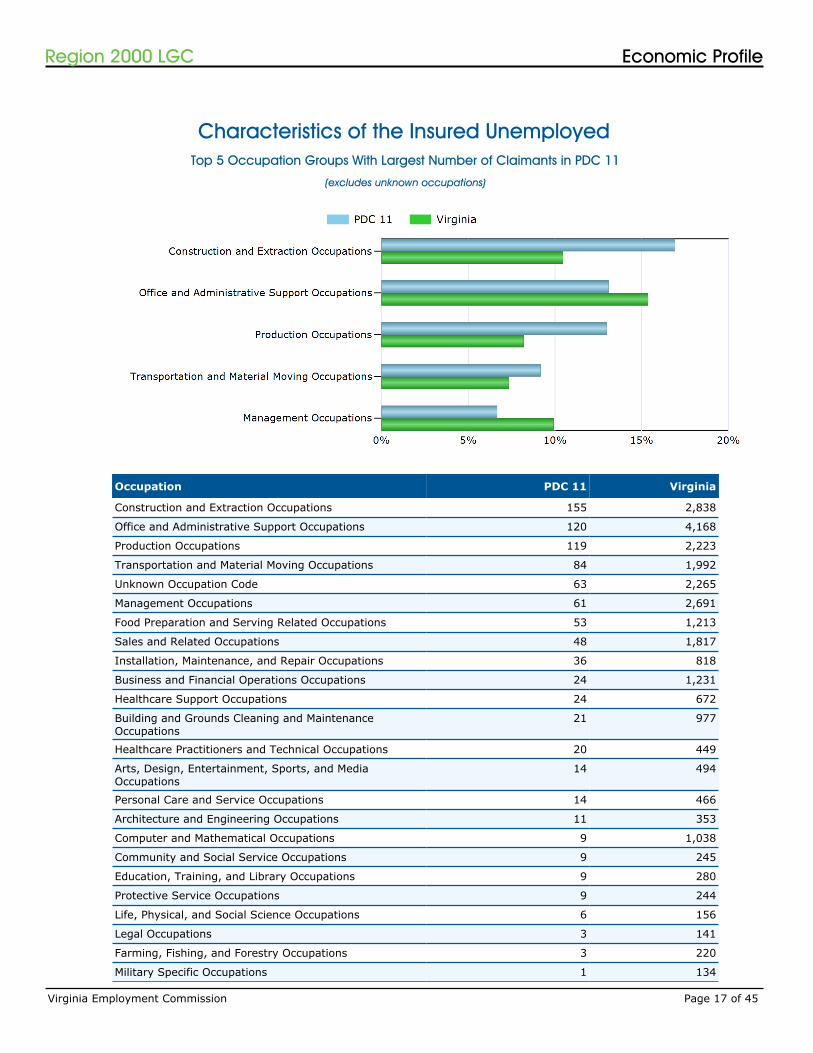
Characteristics of the Insured Unemployed
Occupation PDC 11 Virginia
Construction and Extraction Occupations 155 2,838
Office and Administrative Support Occupations 120 4,168
Production Occupations 119 2,223
Transportation and Material Moving Occupations 84 1,992
Unknown Occupation Code 63 2,265
Management Occupations 61 2,691
Food Preparation and Serving Related Occupations 53 1,213
Sales and Related Occupations 48 1,817
Installation, Maintenance, and Repair Occupations 36 818
Business and Financial Operations Occupations 24 1,231
Healthcare Support Occupations 24 672
Building and Grounds Cleaning and Maintenance Occupations
21 977
Healthcare Practitioners and Technical Occupations 20 449
Arts, Design, Entertainment, Sports, and Media Occupations
14 494
Personal Care and Service Occupations 14 466
Architecture and Engineering Occupations 11 353
Computer and Mathematical Occupations 9 1,038
Community and Social Service Occupations 9 245
Education, Training, and Library Occupations 9 280
Protective Service Occupations 9 244
Life, Physical, and Social Science Occupations 6 156
Legal Occupations 3 141
Farming, Fishing, and Forestry Occupations 3 220
Military Specific Occupations 1 134
(excludes unknown occupations)
Top 5 Occupation Groups With Largest Number of Claimants in PDC 11
Virginia Employment Commission Page 17 of 45
Economic ProfileRegion 2000 LGC

Source: Virginia Employment Commission, Economic Information & Analytics,Characteristics of the Insured Unemployed, March 2018.
Virginia Employment Commission Page 18 of 45
Economic ProfileRegion 2000 LGC
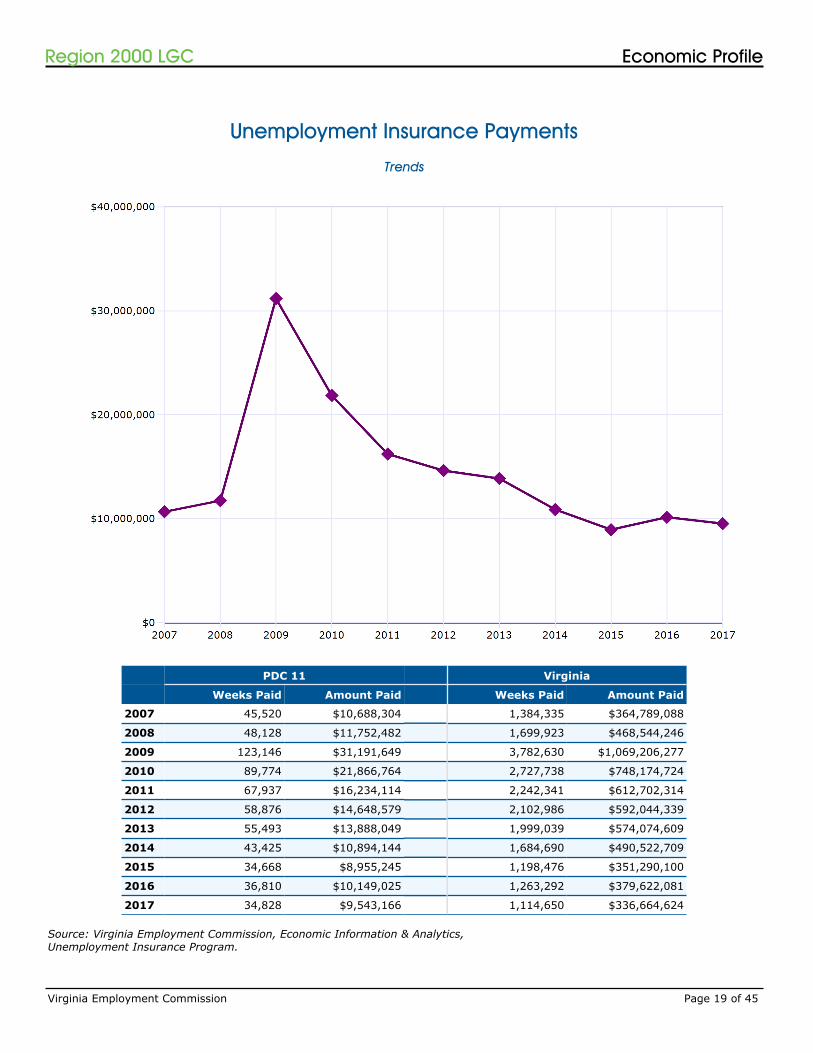
Unemployment Insurance Payments
Source: Virginia Employment Commission, Economic Information & Analytics,Unemployment Insurance Program.
Trends
PDC 11 Virginia
Weeks Paid Amount Paid Weeks Paid Amount Paid
2007 45,520 $10,688,304 1,384,335 $364,789,088
2008 48,128 $11,752,482 1,699,923 $468,544,246
2009 123,146 $31,191,649 3,782,630 $1,069,206,277
2010 89,774 $21,866,764 2,727,738 $748,174,724
2011 67,937 $16,234,114 2,242,341 $612,702,314
2012 58,876 $14,648,579 2,102,986 $592,044,339
2013 55,493 $13,888,049 1,999,039 $574,074,609
2014 43,425 $10,894,144 1,684,690 $490,522,709
2015 34,668 $8,955,245 1,198,476 $351,290,100
2016 36,810 $10,149,025 1,263,292 $379,622,081
2017 34,828 $9,543,166 1,114,650 $336,664,624
Virginia Employment Commission Page 19 of 45
Economic ProfileRegion 2000 LGC
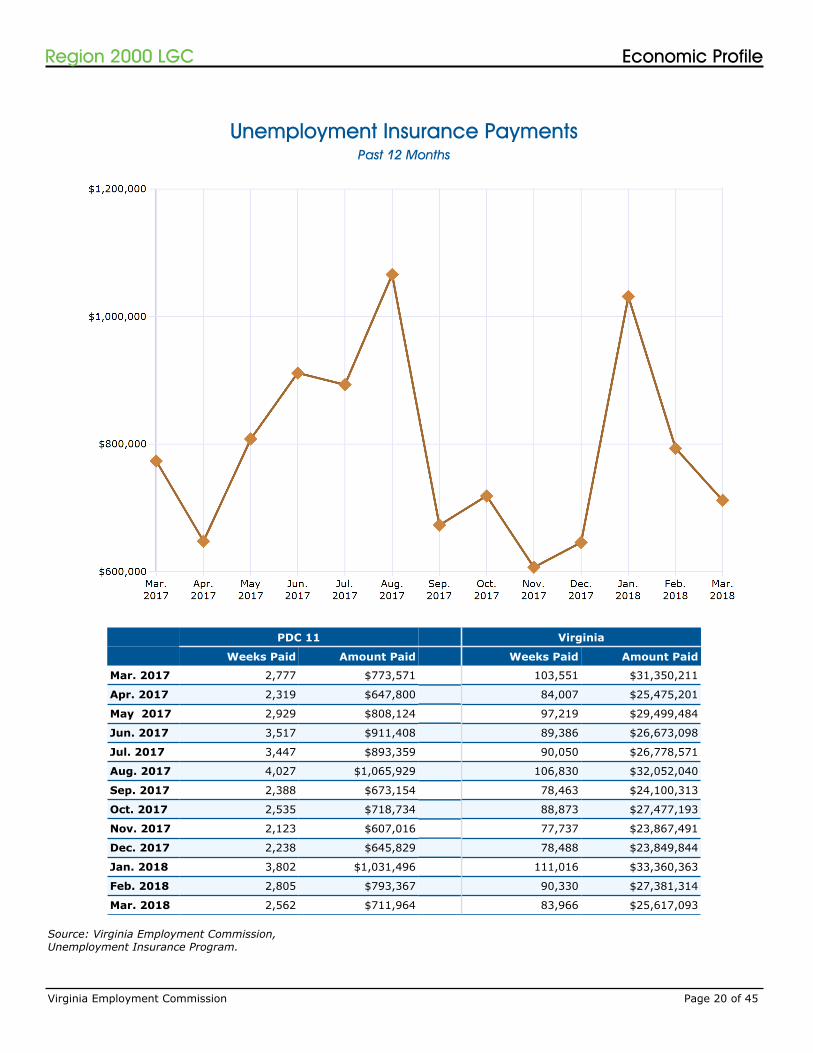
Unemployment Insurance Payments
Source: Virginia Employment Commission,Unemployment Insurance Program.
Past 12 Months
PDC 11 Virginia
Weeks Paid Amount Paid Weeks Paid Amount Paid
Mar. 2017 2,777 $773,571 103,551 $31,350,211
Apr. 2017 2,319 $647,800 84,007 $25,475,201
May 2017 2,929 $808,124 97,219 $29,499,484
Jun. 2017 3,517 $911,408 89,386 $26,673,098
Jul. 2017 3,447 $893,359 90,050 $26,778,571
Aug. 2017 4,027 $1,065,929 106,830 $32,052,040
Sep. 2017 2,388 $673,154 78,463 $24,100,313
Oct. 2017 2,535 $718,734 88,873 $27,477,193
Nov. 2017 2,123 $607,016 77,737 $23,867,491
Dec. 2017 2,238 $645,829 78,488 $23,849,844
Jan. 2018 3,802 $1,031,496 111,016 $33,360,363
Feb. 2018 2,805 $793,367 90,330 $27,381,314
Mar. 2018 2,562 $711,964 83,966 $25,617,093
Virginia Employment Commission Page 20 of 45
Economic ProfileRegion 2000 LGC
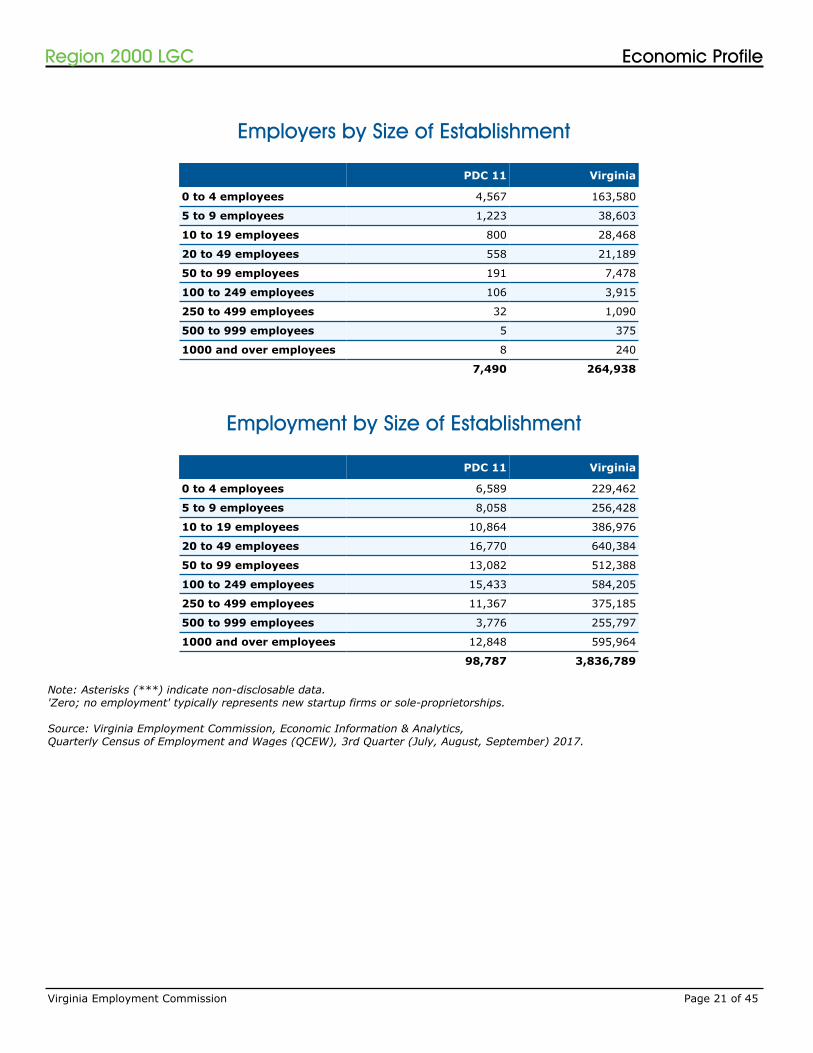
Employers by Size of Establishment
Employment by Size of Establishment
Note: Asterisks (***) indicate non-disclosable data.'Zero; no employment' typically represents new startup firms or sole-proprietorships.
Source: Virginia Employment Commission, Economic Information & Analytics,Quarterly Census of Employment and Wages (QCEW), 3rd Quarter (July, August, September) 2017.
PDC 11 Virginia
0 to 4 employees 4,567 163,580
5 to 9 employees 1,223 38,603
10 to 19 employees 800 28,468
20 to 49 employees 558 21,189
50 to 99 employees 191 7,478
100 to 249 employees 106 3,915
250 to 499 employees 32 1,090
500 to 999 employees 5 375
1000 and over employees 8 240
7,490 264,938
PDC 11 Virginia
0 to 4 employees 6,589 229,462
5 to 9 employees 8,058 256,428
10 to 19 employees 10,864 386,976
20 to 49 employees 16,770 640,384
50 to 99 employees 13,082 512,388
100 to 249 employees 15,433 584,205
250 to 499 employees 11,367 375,185
500 to 999 employees 3,776 255,797
1000 and over employees 12,848 595,964
98,787 3,836,789
Virginia Employment Commission Page 21 of 45
Economic ProfileRegion 2000 LGC
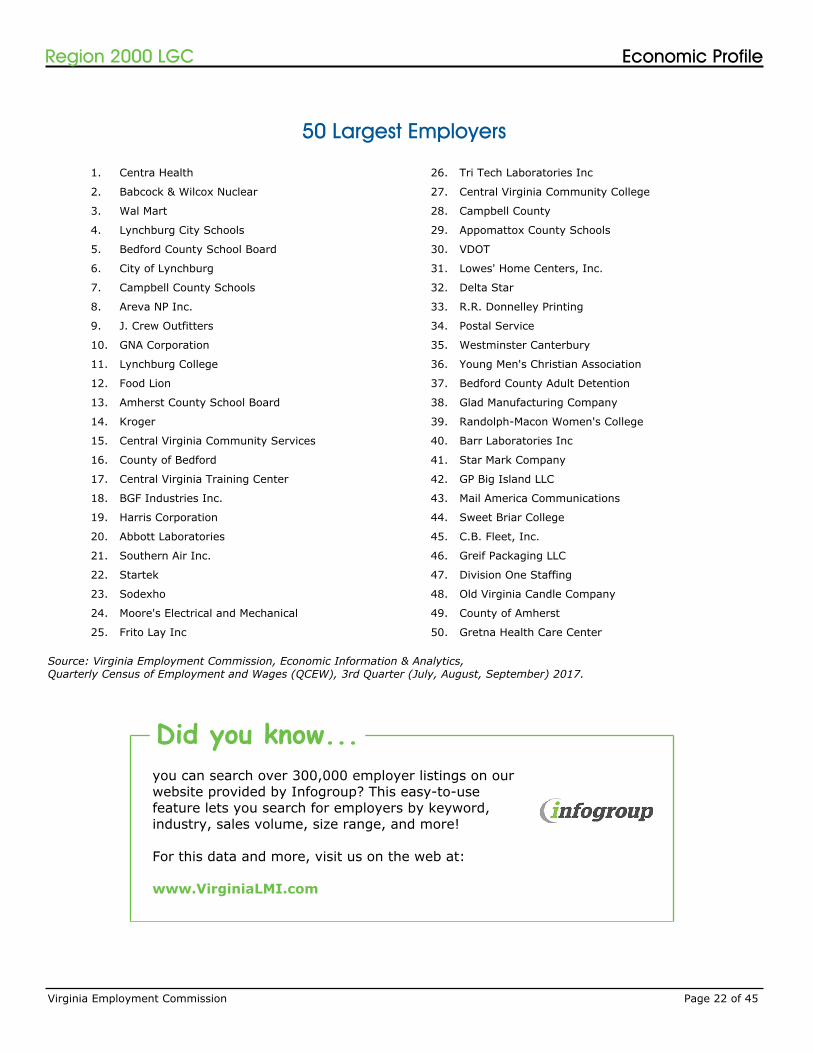
50 Largest Employers
1. Centra Health
2. Babcock & Wilcox Nuclear
3. Wal Mart
4. Lynchburg City Schools
5. Bedford County School Board
6. City of Lynchburg
7. Campbell County Schools
8. Areva NP Inc.
9. J. Crew Outfitters
10. GNA Corporation
11. Lynchburg College
12. Food Lion
13. Amherst County School Board
14. Kroger
15. Central Virginia Community Services
16. County of Bedford
17. Central Virginia Training Center
18. BGF Industries Inc.
19. Harris Corporation
20. Abbott Laboratories
21. Southern Air Inc.
22. Startek
23. Sodexho
24. Moore's Electrical and Mechanical
25. Frito Lay Inc
26. Tri Tech Laboratories Inc
27. Central Virginia Community College
28. Campbell County
29. Appomattox County Schools
30. VDOT
31. Lowes' Home Centers, Inc.
32. Delta Star
33. R.R. Donnelley Printing
34. Postal Service
35. Westminster Canterbury
36. Young Men's Christian Association
37. Bedford County Adult Detention
38. Glad Manufacturing Company
39. Randolph-Macon Women's College
40. Barr Laboratories Inc
41. Star Mark Company
42. GP Big Island LLC
43. Mail America Communications
44. Sweet Briar College
45. C.B. Fleet, Inc.
46. Greif Packaging LLC
47. Division One Staffing
48. Old Virginia Candle Company
49. County of Amherst
50. Gretna Health Care Center
Source: Virginia Employment Commission, Economic Information & Analytics,Quarterly Census of Employment and Wages (QCEW), 3rd Quarter (July, August, September) 2017.
you can search over 300,000 employer listings on our website provided by Infogroup? This easy-to-use feature lets you search for employers by keyword, industry, sales volume, size range, and more!
For this data and more, visit us on the web at:
www.VirginiaLMI.com
Did you know...
Virginia Employment Commission Page 22 of 45
Economic ProfileRegion 2000 LGC
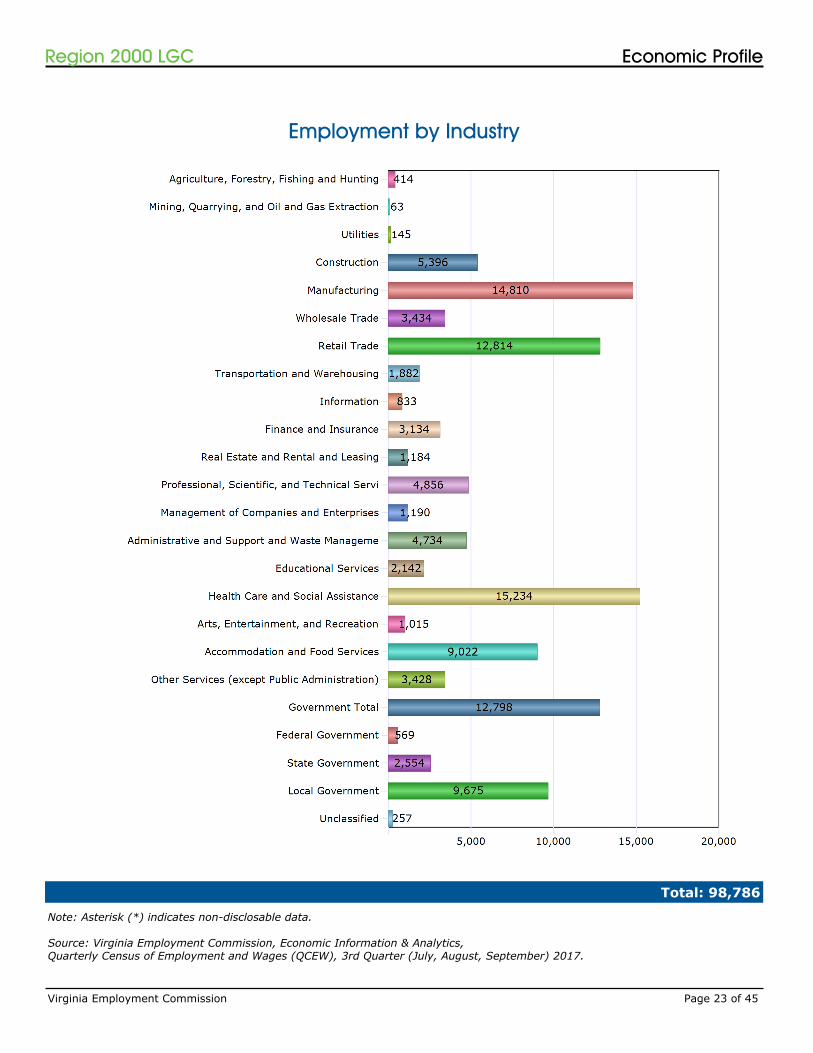
Employment by Industry
Note: Asterisk (*) indicates non-disclosable data.
Source: Virginia Employment Commission, Economic Information & Analytics,Quarterly Census of Employment and Wages (QCEW), 3rd Quarter (July, August, September) 2017.
Total: 98,786
Virginia Employment Commission Page 23 of 45
Economic ProfileRegion 2000 LGC
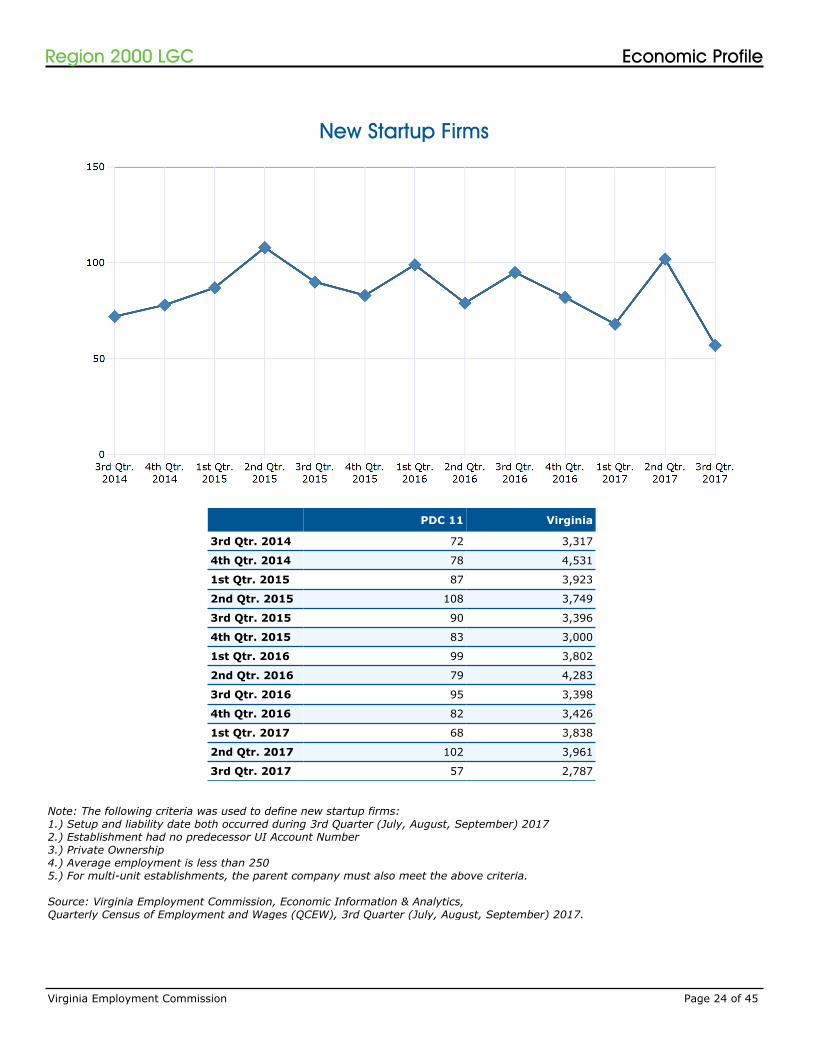
New Startup Firms
PDC 11 Virginia
3rd Qtr. 2014 72 3,317
4th Qtr. 2014 78 4,531
1st Qtr. 2015 87 3,923
2nd Qtr. 2015 108 3,749
3rd Qtr. 2015 90 3,396
4th Qtr. 2015 83 3,000
1st Qtr. 2016 99 3,802
2nd Qtr. 2016 79 4,283
3rd Qtr. 2016 95 3,398
4th Qtr. 2016 82 3,426
1st Qtr. 2017 68 3,838
2nd Qtr. 2017 102 3,961
3rd Qtr. 2017 57 2,787
Note: The following criteria was used to define new startup firms:1.) Setup and liability date both occurred during 3rd Quarter (July, August, September) 20172.) Establishment had no predecessor UI Account Number3.) Private Ownership4.) Average employment is less than 2505.) For multi-unit establishments, the parent company must also meet the above criteria.
Source: Virginia Employment Commission, Economic Information & Analytics,Quarterly Census of Employment and Wages (QCEW), 3rd Quarter (July, August, September) 2017.
Virginia Employment Commission Page 24 of 45
Economic ProfileRegion 2000 LGC
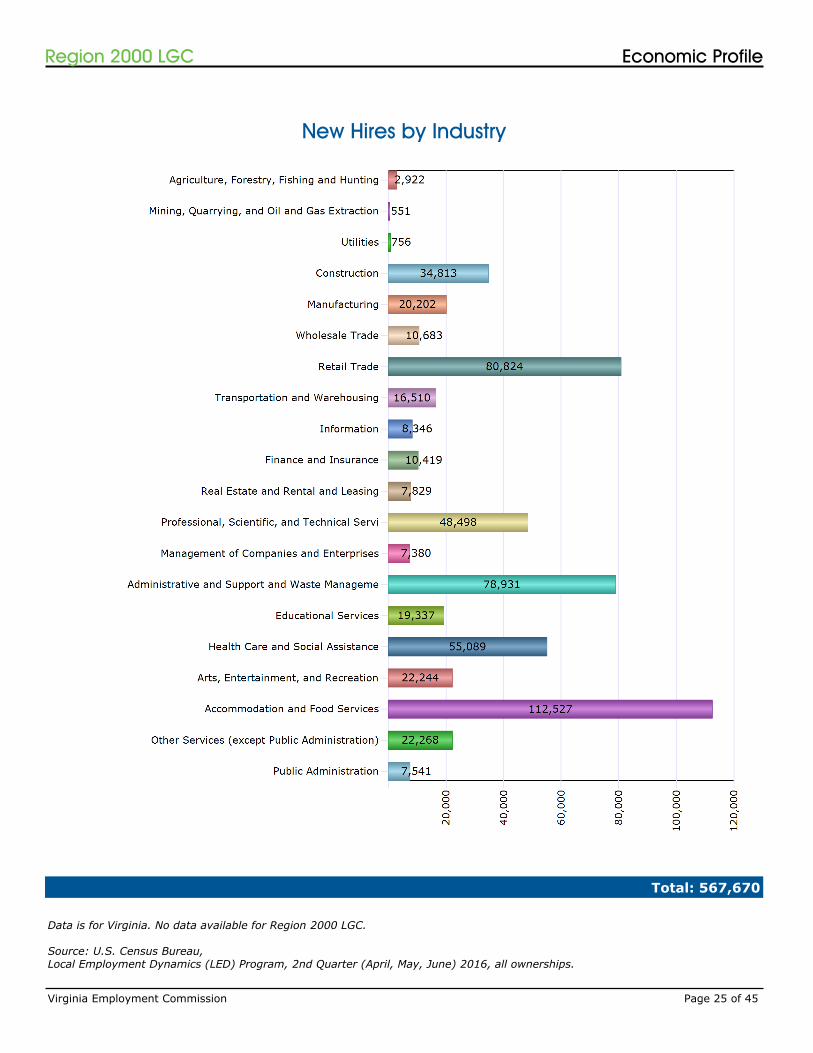
New Hires by Industry
Data is for Virginia. No data available for Region 2000 LGC.
Source: U.S. Census Bureau,Local Employment Dynamics (LED) Program, 2nd Quarter (April, May, June) 2016, all ownerships.
Total: 567,670
Virginia Employment Commission Page 25 of 45
Economic ProfileRegion 2000 LGC
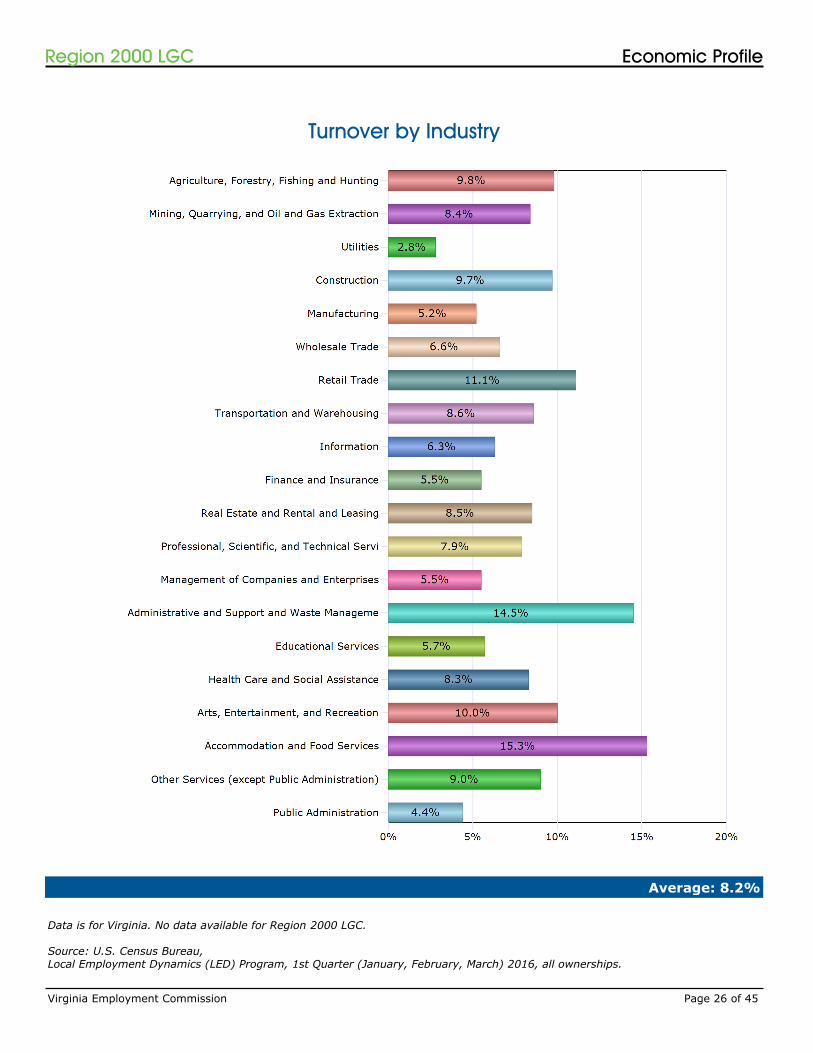
Turnover by Industry
Data is for Virginia. No data available for Region 2000 LGC.
Source: U.S. Census Bureau,Local Employment Dynamics (LED) Program, 1st Quarter (January, February, March) 2016, all ownerships.
Average: 8.2%
Virginia Employment Commission Page 26 of 45
Economic ProfileRegion 2000 LGC
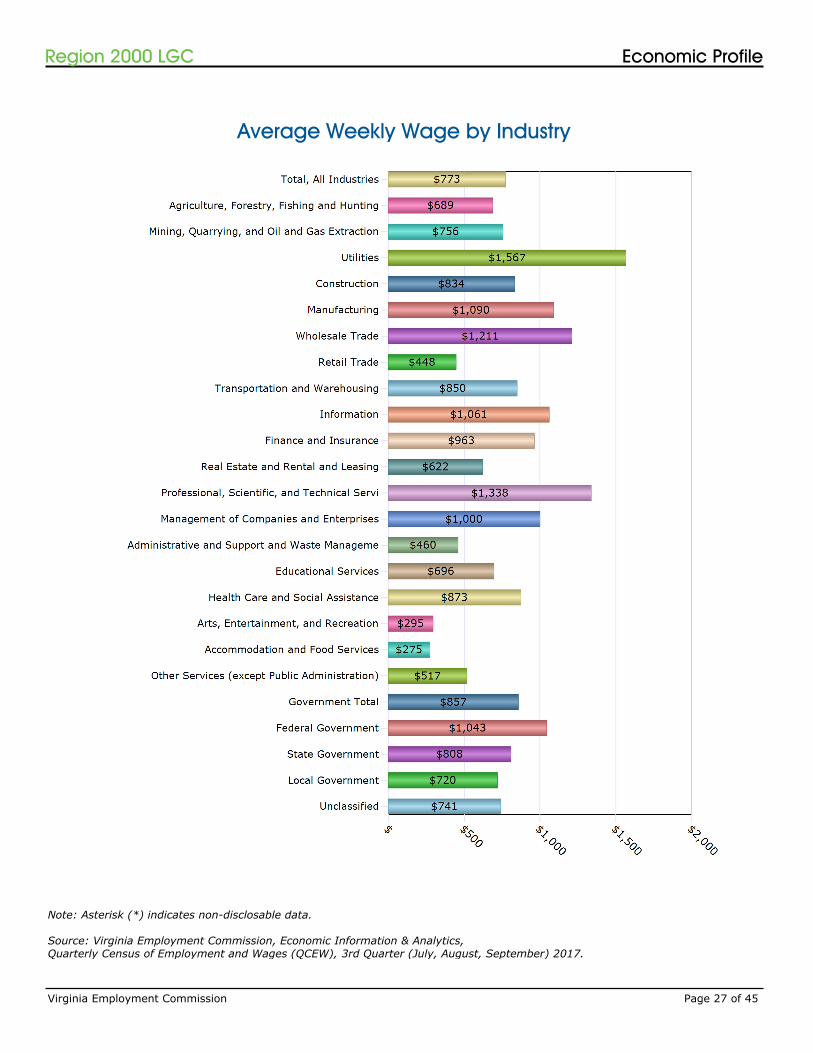
Average Weekly Wage by Industry
Note: Asterisk (*) indicates non-disclosable data.
Source: Virginia Employment Commission, Economic Information & Analytics,Quarterly Census of Employment and Wages (QCEW), 3rd Quarter (July, August, September) 2017.
Virginia Employment Commission Page 27 of 45
Economic ProfileRegion 2000 LGC
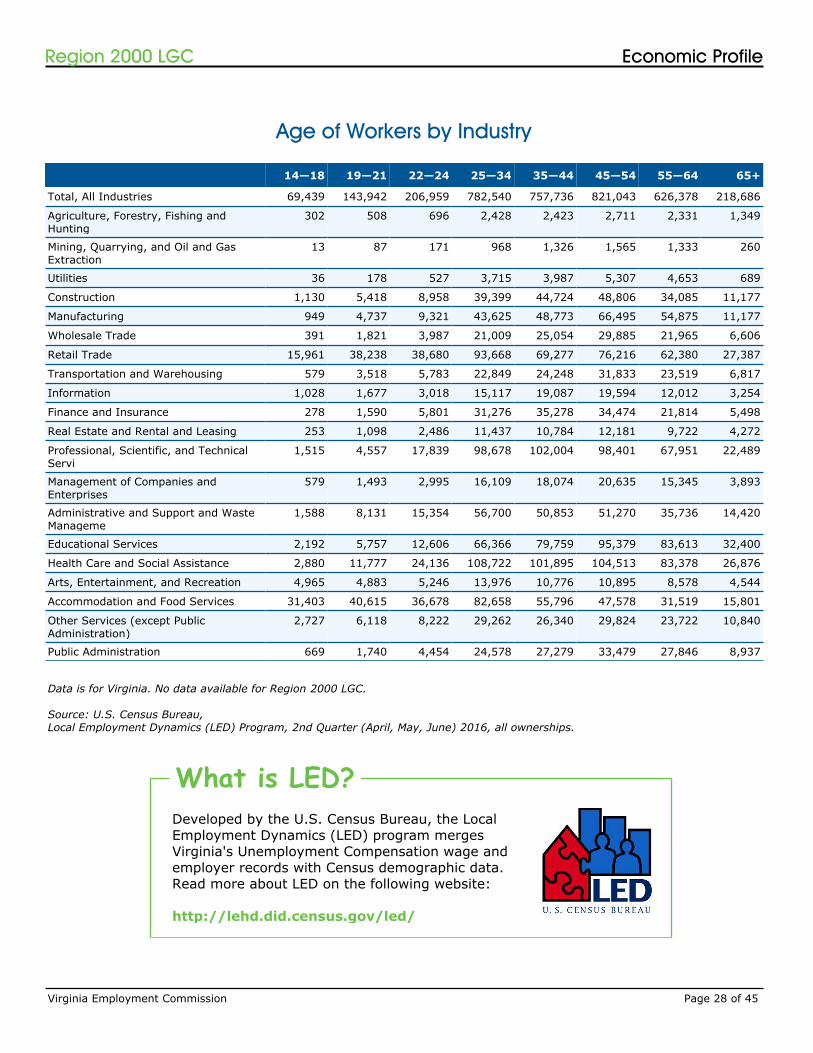
Age of Workers by Industry
14—18 19—21 22—24 25—34 35—44 45—54 55—64 65+
Total, All Industries 69,439 143,942 206,959 782,540 757,736 821,043 626,378 218,686
Agriculture, Forestry, Fishing and Hunting
302 508 696 2,428 2,423 2,711 2,331 1,349
Mining, Quarrying, and Oil and Gas Extraction
13 87 171 968 1,326 1,565 1,333 260
Utilities 36 178 527 3,715 3,987 5,307 4,653 689
Construction 1,130 5,418 8,958 39,399 44,724 48,806 34,085 11,177
Manufacturing 949 4,737 9,321 43,625 48,773 66,495 54,875 11,177
Wholesale Trade 391 1,821 3,987 21,009 25,054 29,885 21,965 6,606
Retail Trade 15,961 38,238 38,680 93,668 69,277 76,216 62,380 27,387
Transportation and Warehousing 579 3,518 5,783 22,849 24,248 31,833 23,519 6,817
Information 1,028 1,677 3,018 15,117 19,087 19,594 12,012 3,254
Finance and Insurance 278 1,590 5,801 31,276 35,278 34,474 21,814 5,498
Real Estate and Rental and Leasing 253 1,098 2,486 11,437 10,784 12,181 9,722 4,272
Professional, Scientific, and Technical Servi
1,515 4,557 17,839 98,678 102,004 98,401 67,951 22,489
Management of Companies and Enterprises
579 1,493 2,995 16,109 18,074 20,635 15,345 3,893
Administrative and Support and Waste Manageme
1,588 8,131 15,354 56,700 50,853 51,270 35,736 14,420
Educational Services 2,192 5,757 12,606 66,366 79,759 95,379 83,613 32,400
Health Care and Social Assistance 2,880 11,777 24,136 108,722 101,895 104,513 83,378 26,876
Arts, Entertainment, and Recreation 4,965 4,883 5,246 13,976 10,776 10,895 8,578 4,544
Accommodation and Food Services 31,403 40,615 36,678 82,658 55,796 47,578 31,519 15,801
Other Services (except Public Administration)
2,727 6,118 8,222 29,262 26,340 29,824 23,722 10,840
Public Administration 669 1,740 4,454 24,578 27,279 33,479 27,846 8,937
Data is for Virginia. No data available for Region 2000 LGC.
Source: U.S. Census Bureau,Local Employment Dynamics (LED) Program, 2nd Quarter (April, May, June) 2016, all ownerships.
Developed by the U.S. Census Bureau, the Local Employment Dynamics (LED) program merges Virginia's Unemployment Compensation wage and employer records with Census demographic data. Read more about LED on the following website:
http://lehd.did.census.gov/led/
What is LED?
Virginia Employment Commission Page 28 of 45
Economic ProfileRegion 2000 LGC
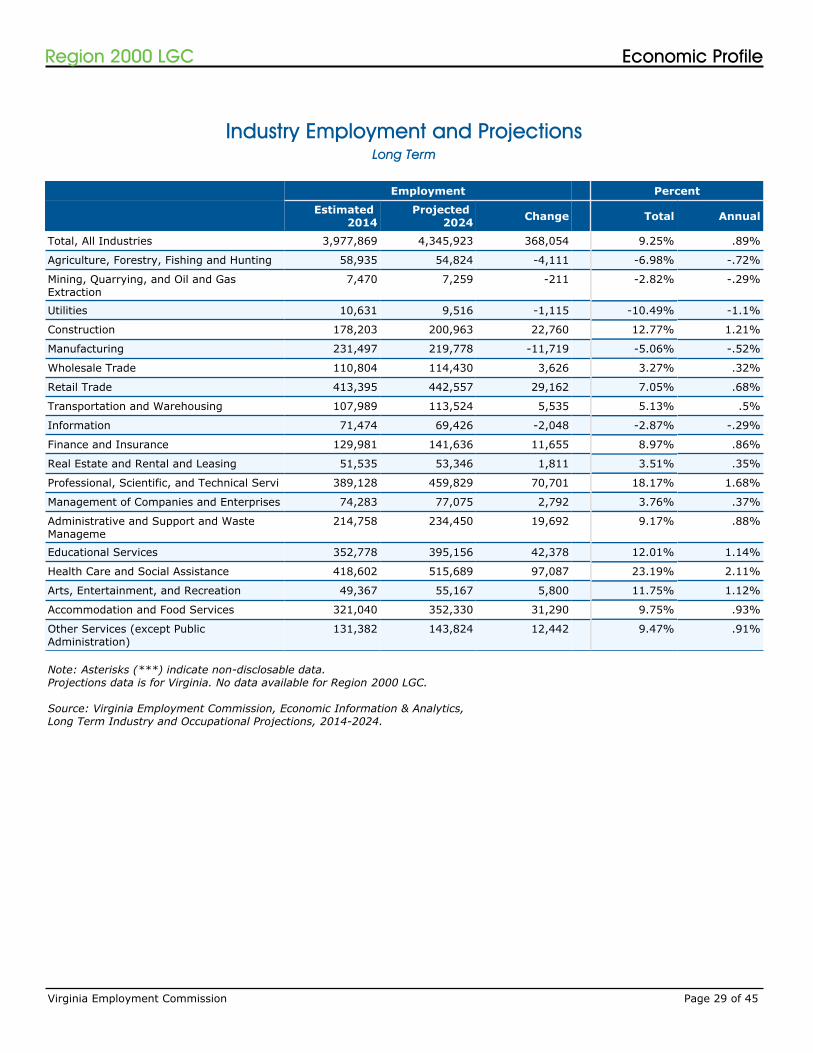
Industry Employment and Projections
Note: Asterisks (***) indicate non-disclosable data.Projections data is for Virginia. No data available for Region 2000 LGC.
Source: Virginia Employment Commission, Economic Information & Analytics,Long Term Industry and Occupational Projections, 2014-2024.
Employment Percent
Estimated 2014
Projected 2024 Change Total Annual
Total, All Industries 3,977,869 4,345,923 368,054 9.25% .89%
Agriculture, Forestry, Fishing and Hunting 58,935 54,824 -4,111 -6.98% -.72%
Mining, Quarrying, and Oil and Gas Extraction
7,470 7,259 -211 -2.82% -.29%
Utilities 10,631 9,516 -1,115 -10.49% -1.1%
Construction 178,203 200,963 22,760 12.77% 1.21%
Manufacturing 231,497 219,778 -11,719 -5.06% -.52%
Wholesale Trade 110,804 114,430 3,626 3.27% .32%
Retail Trade 413,395 442,557 29,162 7.05% .68%
Transportation and Warehousing 107,989 113,524 5,535 5.13% .5%
Information 71,474 69,426 -2,048 -2.87% -.29%
Finance and Insurance 129,981 141,636 11,655 8.97% .86%
Real Estate and Rental and Leasing 51,535 53,346 1,811 3.51% .35%
Professional, Scientific, and Technical Servi 389,128 459,829 70,701 18.17% 1.68%
Management of Companies and Enterprises 74,283 77,075 2,792 3.76% .37%
Administrative and Support and Waste Manageme
214,758 234,450 19,692 9.17% .88%
Educational Services 352,778 395,156 42,378 12.01% 1.14%
Health Care and Social Assistance 418,602 515,689 97,087 23.19% 2.11%
Arts, Entertainment, and Recreation 49,367 55,167 5,800 11.75% 1.12%
Accommodation and Food Services 321,040 352,330 31,290 9.75% .93%
Other Services (except Public Administration)
131,382 143,824 12,442 9.47% .91%
Long Term
Virginia Employment Commission Page 29 of 45
Economic ProfileRegion 2000 LGC
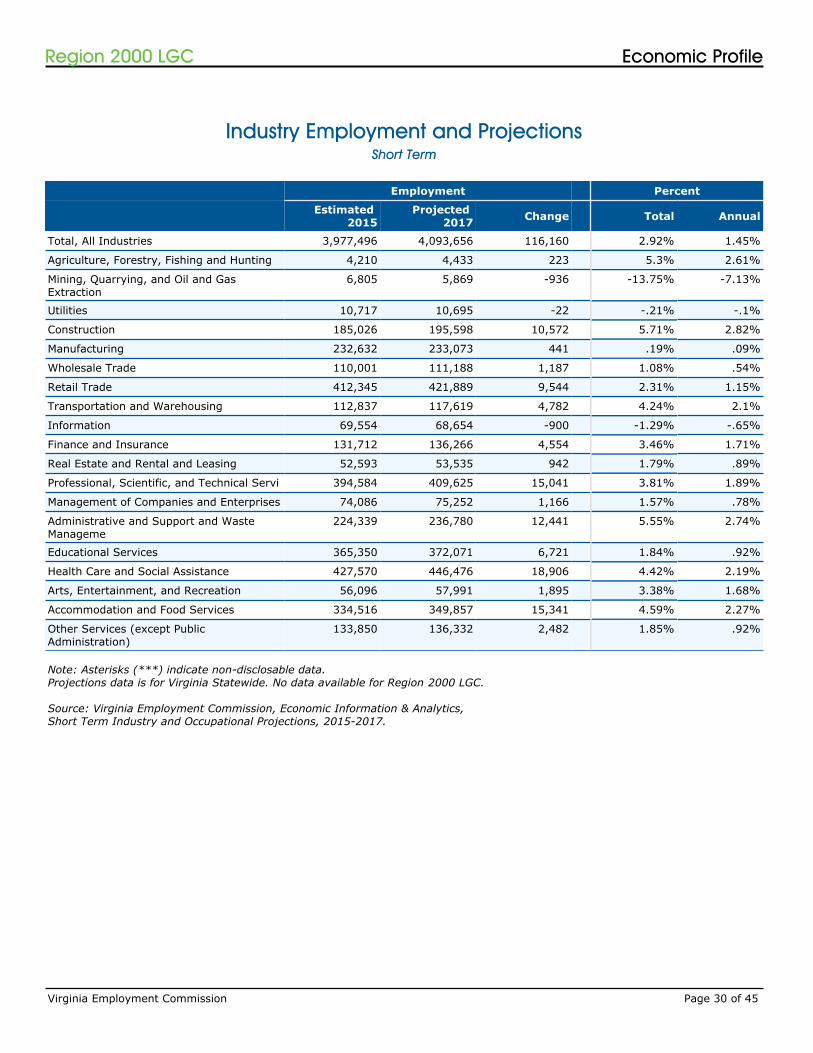
Industry Employment and Projections
Note: Asterisks (***) indicate non-disclosable data.Projections data is for Virginia Statewide. No data available for Region 2000 LGC.
Source: Virginia Employment Commission, Economic Information & Analytics,Short Term Industry and Occupational Projections, 2015-2017.
Employment Percent
Estimated 2015
Projected 2017 Change Total Annual
Total, All Industries 3,977,496 4,093,656 116,160 2.92% 1.45%
Agriculture, Forestry, Fishing and Hunting 4,210 4,433 223 5.3% 2.61%
Mining, Quarrying, and Oil and Gas Extraction
6,805 5,869 -936 -13.75% -7.13%
Utilities 10,717 10,695 -22 -.21% -.1%
Construction 185,026 195,598 10,572 5.71% 2.82%
Manufacturing 232,632 233,073 441 .19% .09%
Wholesale Trade 110,001 111,188 1,187 1.08% .54%
Retail Trade 412,345 421,889 9,544 2.31% 1.15%
Transportation and Warehousing 112,837 117,619 4,782 4.24% 2.1%
Information 69,554 68,654 -900 -1.29% -.65%
Finance and Insurance 131,712 136,266 4,554 3.46% 1.71%
Real Estate and Rental and Leasing 52,593 53,535 942 1.79% .89%
Professional, Scientific, and Technical Servi 394,584 409,625 15,041 3.81% 1.89%
Management of Companies and Enterprises 74,086 75,252 1,166 1.57% .78%
Administrative and Support and Waste Manageme
224,339 236,780 12,441 5.55% 2.74%
Educational Services 365,350 372,071 6,721 1.84% .92%
Health Care and Social Assistance 427,570 446,476 18,906 4.42% 2.19%
Arts, Entertainment, and Recreation 56,096 57,991 1,895 3.38% 1.68%
Accommodation and Food Services 334,516 349,857 15,341 4.59% 2.27%
Other Services (except Public Administration)
133,850 136,332 2,482 1.85% .92%
Short Term
Virginia Employment Commission Page 30 of 45
Economic ProfileRegion 2000 LGC
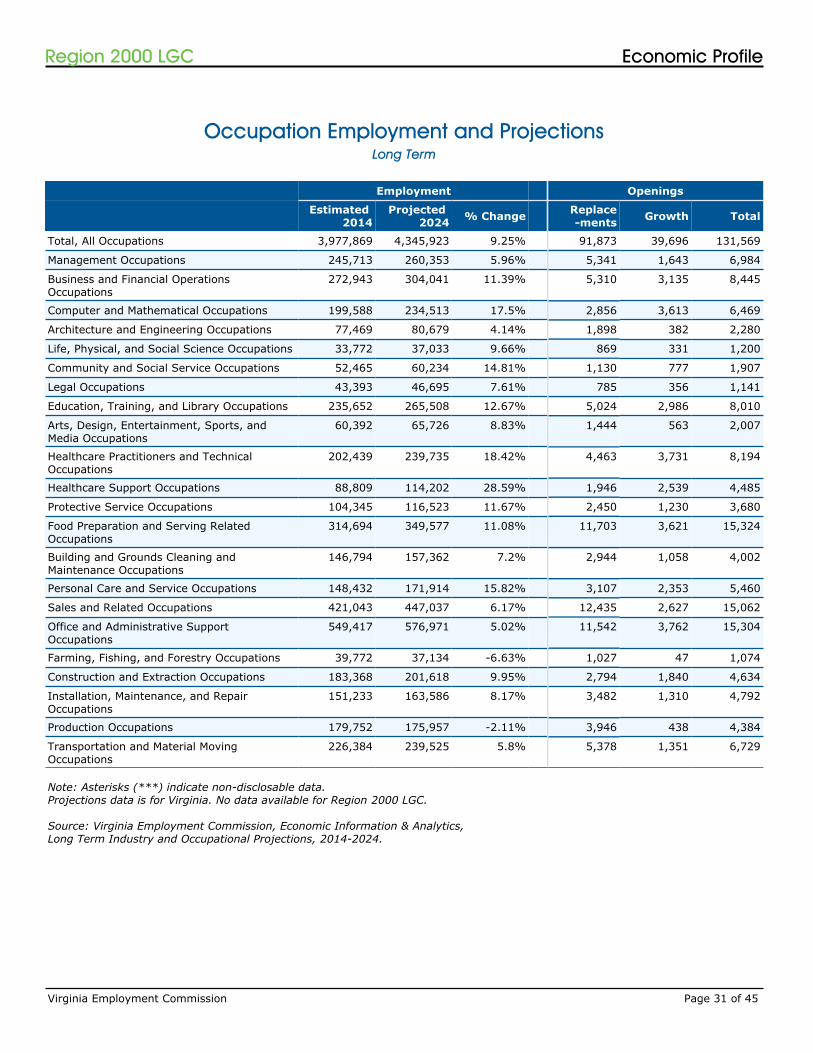
Occupation Employment and Projections
Note: Asterisks (***) indicate non-disclosable data.Projections data is for Virginia. No data available for Region 2000 LGC.
Source: Virginia Employment Commission, Economic Information & Analytics,Long Term Industry and Occupational Projections, 2014-2024.
Employment Openings
Estimated 2014
Projected 2024 % Change Replace
-ments Growth Total
Total, All Occupations 3,977,869 4,345,923 9.25% 91,873 39,696 131,569
Management Occupations 245,713 260,353 5.96% 5,341 1,643 6,984
Business and Financial Operations Occupations
272,943 304,041 11.39% 5,310 3,135 8,445
Computer and Mathematical Occupations 199,588 234,513 17.5% 2,856 3,613 6,469
Architecture and Engineering Occupations 77,469 80,679 4.14% 1,898 382 2,280
Life, Physical, and Social Science Occupations 33,772 37,033 9.66% 869 331 1,200
Community and Social Service Occupations 52,465 60,234 14.81% 1,130 777 1,907
Legal Occupations 43,393 46,695 7.61% 785 356 1,141
Education, Training, and Library Occupations 235,652 265,508 12.67% 5,024 2,986 8,010
Arts, Design, Entertainment, Sports, and Media Occupations
60,392 65,726 8.83% 1,444 563 2,007
Healthcare Practitioners and Technical Occupations
202,439 239,735 18.42% 4,463 3,731 8,194
Healthcare Support Occupations 88,809 114,202 28.59% 1,946 2,539 4,485
Protective Service Occupations 104,345 116,523 11.67% 2,450 1,230 3,680
Food Preparation and Serving Related Occupations
314,694 349,577 11.08% 11,703 3,621 15,324
Building and Grounds Cleaning and Maintenance Occupations
146,794 157,362 7.2% 2,944 1,058 4,002
Personal Care and Service Occupations 148,432 171,914 15.82% 3,107 2,353 5,460
Sales and Related Occupations 421,043 447,037 6.17% 12,435 2,627 15,062
Office and Administrative Support Occupations
549,417 576,971 5.02% 11,542 3,762 15,304
Farming, Fishing, and Forestry Occupations 39,772 37,134 -6.63% 1,027 47 1,074
Construction and Extraction Occupations 183,368 201,618 9.95% 2,794 1,840 4,634
Installation, Maintenance, and Repair Occupations
151,233 163,586 8.17% 3,482 1,310 4,792
Production Occupations 179,752 175,957 -2.11% 3,946 438 4,384
Transportation and Material Moving Occupations
226,384 239,525 5.8% 5,378 1,351 6,729
Long Term
Virginia Employment Commission Page 31 of 45
Economic ProfileRegion 2000 LGC
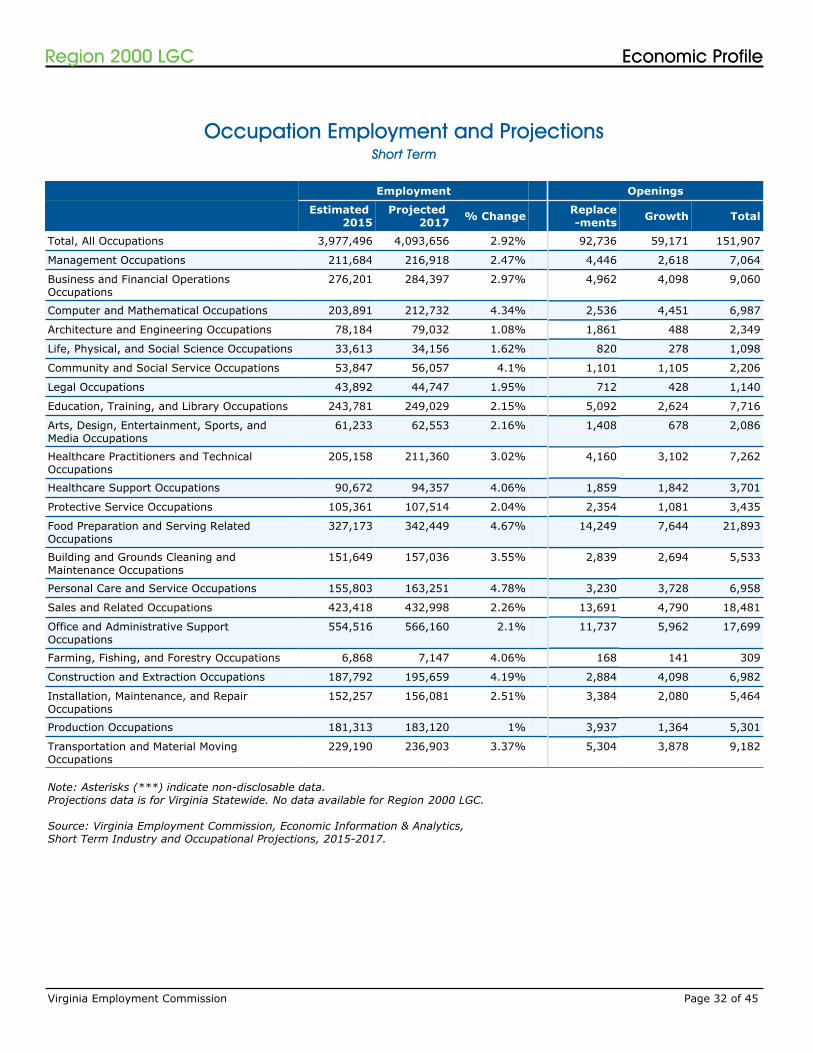
Occupation Employment and Projections
Note: Asterisks (***) indicate non-disclosable data.Projections data is for Virginia Statewide. No data available for Region 2000 LGC.
Source: Virginia Employment Commission, Economic Information & Analytics,Short Term Industry and Occupational Projections, 2015-2017.
Employment Openings
Estimated 2015
Projected 2017 % Change Replace
-ments Growth Total
Total, All Occupations 3,977,496 4,093,656 2.92% 92,736 59,171 151,907
Management Occupations 211,684 216,918 2.47% 4,446 2,618 7,064
Business and Financial Operations Occupations
276,201 284,397 2.97% 4,962 4,098 9,060
Computer and Mathematical Occupations 203,891 212,732 4.34% 2,536 4,451 6,987
Architecture and Engineering Occupations 78,184 79,032 1.08% 1,861 488 2,349
Life, Physical, and Social Science Occupations 33,613 34,156 1.62% 820 278 1,098
Community and Social Service Occupations 53,847 56,057 4.1% 1,101 1,105 2,206
Legal Occupations 43,892 44,747 1.95% 712 428 1,140
Education, Training, and Library Occupations 243,781 249,029 2.15% 5,092 2,624 7,716
Arts, Design, Entertainment, Sports, and Media Occupations
61,233 62,553 2.16% 1,408 678 2,086
Healthcare Practitioners and Technical Occupations
205,158 211,360 3.02% 4,160 3,102 7,262
Healthcare Support Occupations 90,672 94,357 4.06% 1,859 1,842 3,701
Protective Service Occupations 105,361 107,514 2.04% 2,354 1,081 3,435
Food Preparation and Serving Related Occupations
327,173 342,449 4.67% 14,249 7,644 21,893
Building and Grounds Cleaning and Maintenance Occupations
151,649 157,036 3.55% 2,839 2,694 5,533
Personal Care and Service Occupations 155,803 163,251 4.78% 3,230 3,728 6,958
Sales and Related Occupations 423,418 432,998 2.26% 13,691 4,790 18,481
Office and Administrative Support Occupations
554,516 566,160 2.1% 11,737 5,962 17,699
Farming, Fishing, and Forestry Occupations 6,868 7,147 4.06% 168 141 309
Construction and Extraction Occupations 187,792 195,659 4.19% 2,884 4,098 6,982
Installation, Maintenance, and Repair Occupations
152,257 156,081 2.51% 3,384 2,080 5,464
Production Occupations 181,313 183,120 1% 3,937 1,364 5,301
Transportation and Material Moving Occupations
229,190 236,903 3.37% 5,304 3,878 9,182
Short Term
Virginia Employment Commission Page 32 of 45
Economic ProfileRegion 2000 LGC
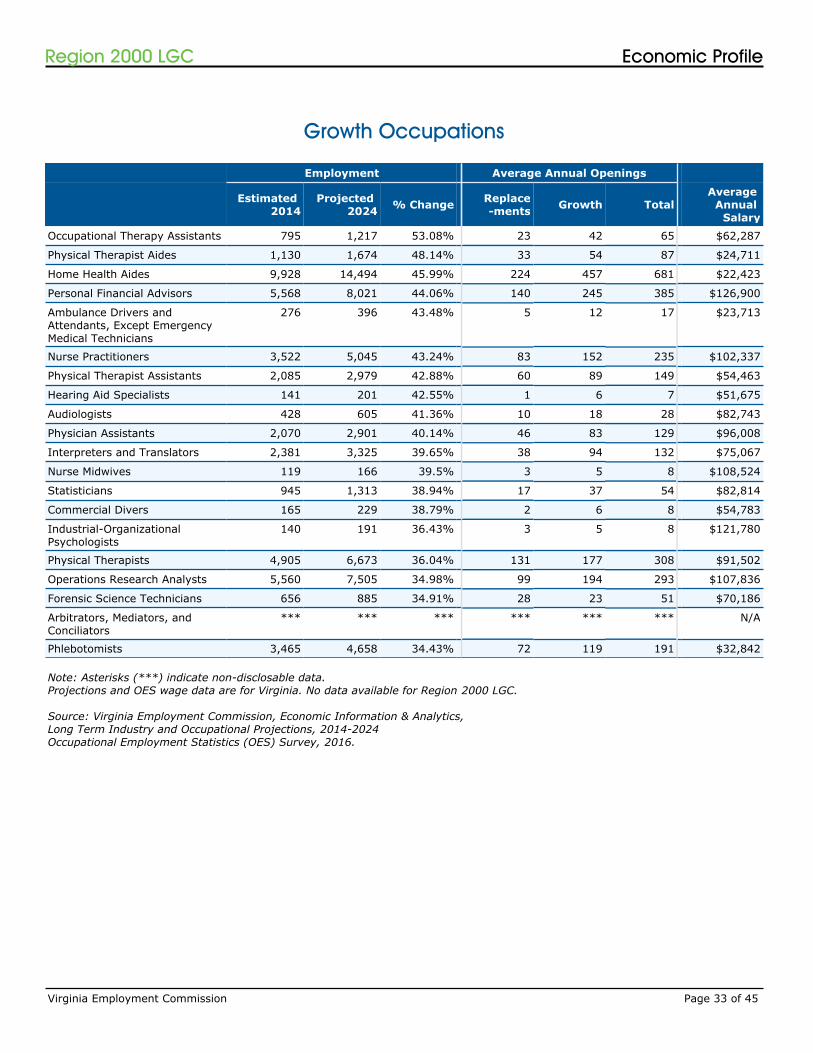
Growth Occupations
Note: Asterisks (***) indicate non-disclosable data.Projections and OES wage data are for Virginia. No data available for Region 2000 LGC.
Source: Virginia Employment Commission, Economic Information & Analytics,Long Term Industry and Occupational Projections, 2014-2024Occupational Employment Statistics (OES) Survey, 2016.
Employment Average Annual Openings
Estimated 2014
Projected 2024 % Change Replace
-ments Growth TotalAverage
Annual Salary
Occupational Therapy Assistants 795 1,217 53.08% 23 42 65 $62,287
Physical Therapist Aides 1,130 1,674 48.14% 33 54 87 $24,711
Home Health Aides 9,928 14,494 45.99% 224 457 681 $22,423
Personal Financial Advisors 5,568 8,021 44.06% 140 245 385 $126,900
Ambulance Drivers and Attendants, Except Emergency Medical Technicians
276 396 43.48% 5 12 17 $23,713
Nurse Practitioners 3,522 5,045 43.24% 83 152 235 $102,337
Physical Therapist Assistants 2,085 2,979 42.88% 60 89 149 $54,463
Hearing Aid Specialists 141 201 42.55% 1 6 7 $51,675
Audiologists 428 605 41.36% 10 18 28 $82,743
Physician Assistants 2,070 2,901 40.14% 46 83 129 $96,008
Interpreters and Translators 2,381 3,325 39.65% 38 94 132 $75,067
Nurse Midwives 119 166 39.5% 3 5 8 $108,524
Statisticians 945 1,313 38.94% 17 37 54 $82,814
Commercial Divers 165 229 38.79% 2 6 8 $54,783
Industrial-Organizational Psychologists
140 191 36.43% 3 5 8 $121,780
Physical Therapists 4,905 6,673 36.04% 131 177 308 $91,502
Operations Research Analysts 5,560 7,505 34.98% 99 194 293 $107,836
Forensic Science Technicians 656 885 34.91% 28 23 51 $70,186
Arbitrators, Mediators, and Conciliators
*** *** *** *** *** *** N/A
Phlebotomists 3,465 4,658 34.43% 72 119 191 $32,842
Virginia Employment Commission Page 33 of 45
Economic ProfileRegion 2000 LGC

Declining Occupations
Note: Asterisks (***) indicate non-disclosable data.Projections data is for Virginia. No data available for Region 2000 LGC.
Source: Virginia Employment Commission, Economic Information & Analytics,Long Term Industry and Occupational Projections, 2014-2024.
Employment Openings
Estimated 2014
Projected 2024 % Change Replace
-ments Growth Total
Locomotive Firers *** *** *** *** *** ***
Electronic Equipment Installers and Repairers, Motor Vehicles
316 160 -49.37% 6 0 6
Telephone Operators 183 112 -38.8% 4 0 4
Postal Service Mail Sorters, Processors, and Processing Machine Operators
2,660 1,761 -33.8% 31 0 31
Switchboard Operators, Including Answering Service
2,189 1,521 -30.52% 26 0 26
Photographic Process Workers and Processing Machine Operators
2,494 1,785 -28.43% 48 0 48
Postmasters and Mail Superintendents *** *** *** *** *** ***
Postal Service Clerks 1,898 1,399 -26.29% 23 0 23
Postal Service Mail Carriers 7,053 5,199 -26.29% 136 0 136
Extruding and Drawing Machine Setters, Operators, and Tenders, Metal and Plastic
1,636 1,208 -26.16% 40 0 40
Textile Knitting and Weaving Machine Setters, Operators, and Tenders
1,316 980 -25.53% 22 0 22
Textile Bleaching and Dyeing Machine Operators and Tenders
288 215 -25.35% 3 0 3
Molding, Coremaking, and Casting Machine Setters, Operators, and Tenders, Metal and Plastic
1,979 1,489 -24.76% 29 0 29
Aircraft Structure, Surfaces, Rigging, and Systems Assemblers
*** *** *** *** *** ***
Rolling Machine Setters, Operators, and Tenders, Metal and Plastic
470 362 -22.98% 12 0 12
Grinding, Lapping, Polishing, and Buffing Machine Tool Setters, Operators, and Tenders, Metal and Plastic
521 405 -22.26% 22 0 22
Textile Cutting Machine Setters, Operators, and Tenders
248 193 -22.18% 4 0 4
Cutting, Punching, and Press Machine Setters, Operators, and Tenders, Metal and Plastic
2,067 1,615 -21.87% 26 0 26
Motion Picture Projectionists 203 159 -21.67% 8 0 8
Forging Machine Setters, Operators, and Tenders, Metal and Plastic
248 195 -21.37% 6 0 6
Virginia Employment Commission Page 34 of 45
Economic ProfileRegion 2000 LGC
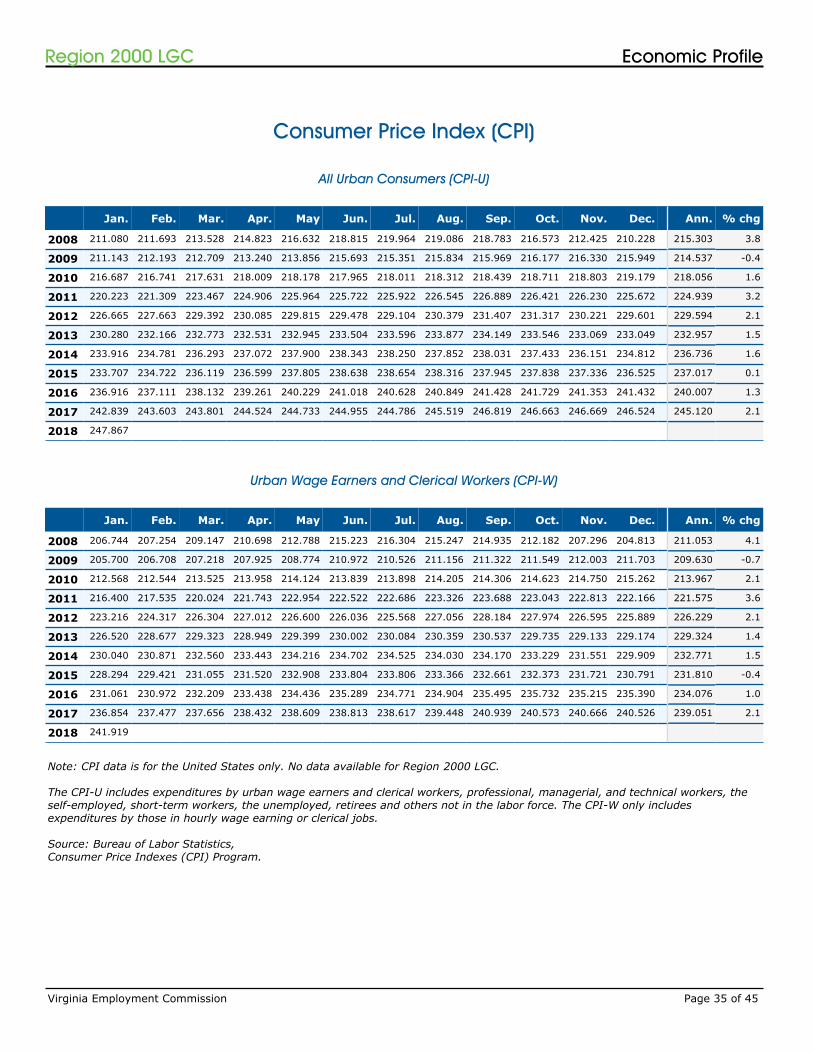
Consumer Price Index (CPI)
Note: CPI data is for the United States only. No data available for Region 2000 LGC.
The CPI-U includes expenditures by urban wage earners and clerical workers, professional, managerial, and technical workers, the self-employed, short-term workers, the unemployed, retirees and others not in the labor force. The CPI-W only includes expenditures by those in hourly wage earning or clerical jobs.
Source: Bureau of Labor Statistics,Consumer Price Indexes (CPI) Program.
Jan. Feb. Mar. Apr. May Jun. Jul. Aug. Sep. Oct. Nov. Dec. Ann. % chg
2008 211.080 211.693 213.528 214.823 216.632 218.815 219.964 219.086 218.783 216.573 212.425 210.228 215.303 3.8
2009 211.143 212.193 212.709 213.240 213.856 215.693 215.351 215.834 215.969 216.177 216.330 215.949 214.537 -0.4
2010 216.687 216.741 217.631 218.009 218.178 217.965 218.011 218.312 218.439 218.711 218.803 219.179 218.056 1.6
2011 220.223 221.309 223.467 224.906 225.964 225.722 225.922 226.545 226.889 226.421 226.230 225.672 224.939 3.2
2012 226.665 227.663 229.392 230.085 229.815 229.478 229.104 230.379 231.407 231.317 230.221 229.601 229.594 2.1
2013 230.280 232.166 232.773 232.531 232.945 233.504 233.596 233.877 234.149 233.546 233.069 233.049 232.957 1.5
2014 233.916 234.781 236.293 237.072 237.900 238.343 238.250 237.852 238.031 237.433 236.151 234.812 236.736 1.6
2015 233.707 234.722 236.119 236.599 237.805 238.638 238.654 238.316 237.945 237.838 237.336 236.525 237.017 0.1
2016 236.916 237.111 238.132 239.261 240.229 241.018 240.628 240.849 241.428 241.729 241.353 241.432 240.007 1.3
2017 242.839 243.603 243.801 244.524 244.733 244.955 244.786 245.519 246.819 246.663 246.669 246.524 245.120 2.1
2018 247.867
All Urban Consumers (CPI-U)
Urban Wage Earners and Clerical Workers (CPI-W)
Jan. Feb. Mar. Apr. May Jun. Jul. Aug. Sep. Oct. Nov. Dec. Ann. % chg
2008 206.744 207.254 209.147 210.698 212.788 215.223 216.304 215.247 214.935 212.182 207.296 204.813 211.053 4.1
2009 205.700 206.708 207.218 207.925 208.774 210.972 210.526 211.156 211.322 211.549 212.003 211.703 209.630 -0.7
2010 212.568 212.544 213.525 213.958 214.124 213.839 213.898 214.205 214.306 214.623 214.750 215.262 213.967 2.1
2011 216.400 217.535 220.024 221.743 222.954 222.522 222.686 223.326 223.688 223.043 222.813 222.166 221.575 3.6
2012 223.216 224.317 226.304 227.012 226.600 226.036 225.568 227.056 228.184 227.974 226.595 225.889 226.229 2.1
2013 226.520 228.677 229.323 228.949 229.399 230.002 230.084 230.359 230.537 229.735 229.133 229.174 229.324 1.4
2014 230.040 230.871 232.560 233.443 234.216 234.702 234.525 234.030 234.170 233.229 231.551 229.909 232.771 1.5
2015 228.294 229.421 231.055 231.520 232.908 233.804 233.806 233.366 232.661 232.373 231.721 230.791 231.810 -0.4
2016 231.061 230.972 232.209 233.438 234.436 235.289 234.771 234.904 235.495 235.732 235.215 235.390 234.076 1.0
2017 236.854 237.477 237.656 238.432 238.609 238.813 238.617 239.448 240.939 240.573 240.666 240.526 239.051 2.1
2018 241.919
Virginia Employment Commission Page 35 of 45
Economic ProfileRegion 2000 LGC
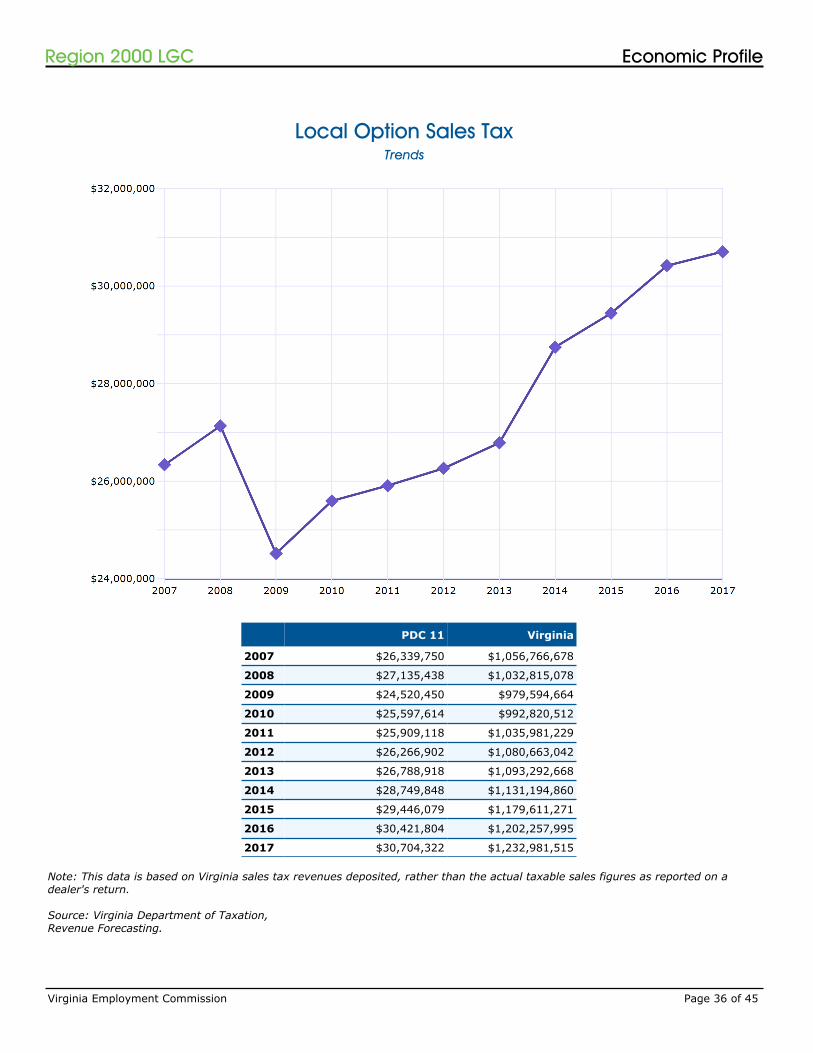
Local Option Sales Tax
PDC 11 Virginia
2007 $26,339,750 $1,056,766,678
2008 $27,135,438 $1,032,815,078
2009 $24,520,450 $979,594,664
2010 $25,597,614 $992,820,512
2011 $25,909,118 $1,035,981,229
2012 $26,266,902 $1,080,663,042
2013 $26,788,918 $1,093,292,668
2014 $28,749,848 $1,131,194,860
2015 $29,446,079 $1,179,611,271
2016 $30,421,804 $1,202,257,995
2017 $30,704,322 $1,232,981,515
Note: This data is based on Virginia sales tax revenues deposited, rather than the actual taxable sales figures as reported on a dealer's return.
Source: Virginia Department of Taxation,Revenue Forecasting.
Trends
Virginia Employment Commission Page 36 of 45
Economic ProfileRegion 2000 LGC

Local Option Sales Tax
Note: This data is based on Virginia sales tax revenues deposited, rather than the actual taxable sales figures as reported on a dealer's return.
Source: Virginia Department of Taxation,Revenue Forecasting.
Past 12 Months
PDC 11 Virginia
Jan. 2017 $2,152,631 $86,952,366
Feb. 2017 $2,278,393 $88,897,947
Mar. 2017 $2,766,017 $105,638,212
Apr. 2017 $2,486,485 $99,591,115
May 2017 $2,579,321 $103,707,666
Jun. 2017 $2,707,283 $110,673,333
Jul. 2017 $2,380,146 $100,656,455
Aug. 2017 $2,524,391 $103,076,183
Sep. 2017 $2,625,771 $104,708,407
Oct. 2017 $2,442,992 $101,947,408
Nov. 2017 $2,653,594 $103,938,560
Dec. 2017 $3,107,298 $123,193,863
Jan. 2018 $2,253,912 $90,794,207
Virginia Employment Commission Page 37 of 45
Education ProfileRegion 2000 LGC

IV. Education Profile
The Education Profile for Region 2000 LGC provides an assortment of data collected from the United States Census Bureau and the National Center for Education Statistics (NCES).
Related Terms and DefinitionsOverview
Associate's degreeAn award that normally requires at least two but less than four years of full-time equivalent college work.
Bachelor's degreeAn award that normally requires at least four but not more than five years of full-time equivalent college-level work.
Post-baccalaureate certificateAn award that requires completion of an organized program of study equivalent to 18 semester credit hours beyond the bachelor's. It is designed for persons who have completed a bachelor's degree, but do not meet the requirements of a master’s degree.
Master's degreeAn award that requires the successful completion of a program of study of at least the full-time equivalent of one but not more than two academic years of work beyond the bachelor's degree.
Post-master's certificateAn award that requires completion of an organized program of study equivalent to 24 semester credit hours beyond the master's degree, but does not meet the requirements of academic degrees at the doctor's level.
Doctor's degreeThe highest award a student can earn for graduate study.
First-professional degreeAn award that requires completion of a program that meets all of the following criteria: (1) completion of the academic requirements to begin practice in the profession; (2) at least two years of college work prior to entering the program; and (3) a total of at least six academic years of college work to complete the degree program, including prior required college work plus the length of the professional program itself.
Virginia Employment Commission Page 38 of 45
Education ProfileRegion 2000 LGC
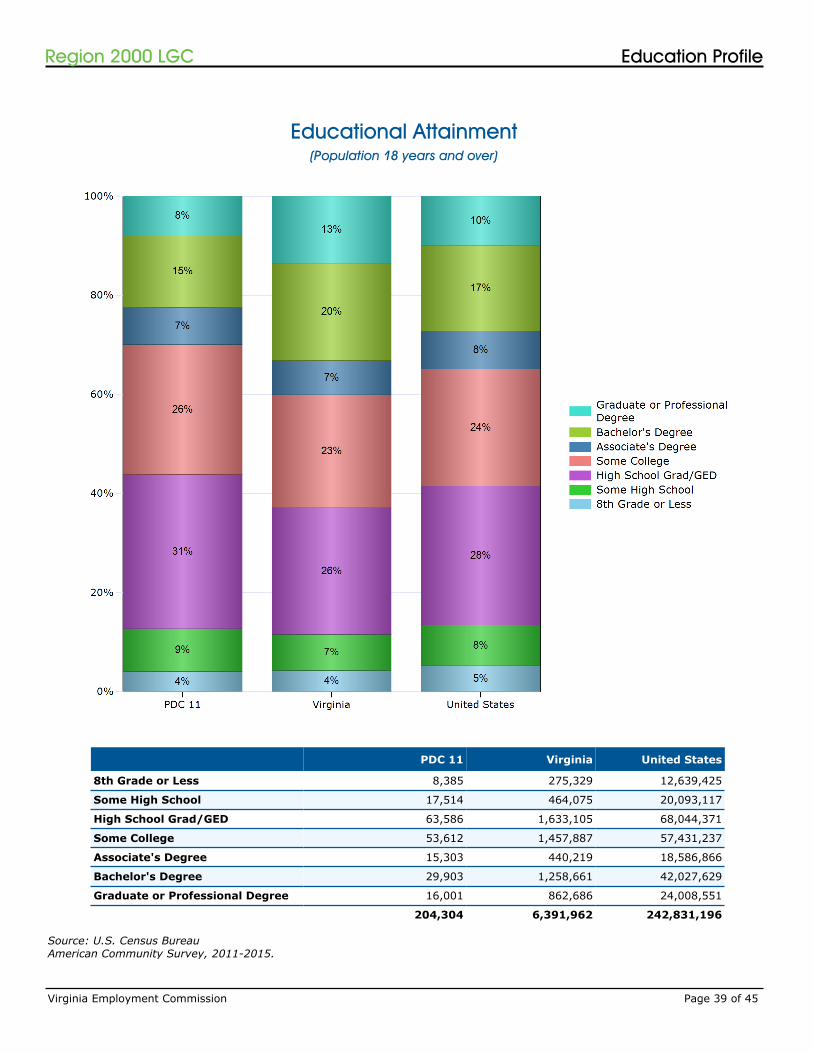
Educational Attainment
Source: U.S. Census BureauAmerican Community Survey, 2011-2015.
(Population 18 years and over)
PDC 11 Virginia United States
8th Grade or Less 8,385 275,329 12,639,425
Some High School 17,514 464,075 20,093,117
High School Grad/GED 63,586 1,633,105 68,044,371
Some College 53,612 1,457,887 57,431,237
Associate's Degree 15,303 440,219 18,586,866
Bachelor's Degree 29,903 1,258,661 42,027,629
Graduate or Professional Degree 16,001 862,686 24,008,551
204,304 6,391,962 242,831,196
Virginia Employment Commission Page 39 of 45
Education ProfileRegion 2000 LGC

Educational Attainment by Age
18 - 24 25 - 34 35 - 44 45 - 64 65+ Total
8th Grade or Less 234 373 308 2,273 5,197 8,385
Some High School 2,579 1,467 1,987 6,139 5,342 17,514
High School Grad/GED 9,890 7,593 8,456 23,158 14,489 63,586
Some College 16,687 7,106 6,884 15,348 7,587 53,612
Associate's Degree 1,403 2,642 3,113 5,878 2,267 15,303
Bachelor's Degree 3,183 6,442 5,171 10,460 4,647 29,903
Graduate or Professional Degree 243 2,778 2,510 6,549 3,921 16,001
34,219 28,401 28,429 69,805 43,450 204,304
Source: U.S. Census BureauAmerican Community Survey, 2011-2015.
Virginia Employment Commission Page 40 of 45
Education ProfileRegion 2000 LGC
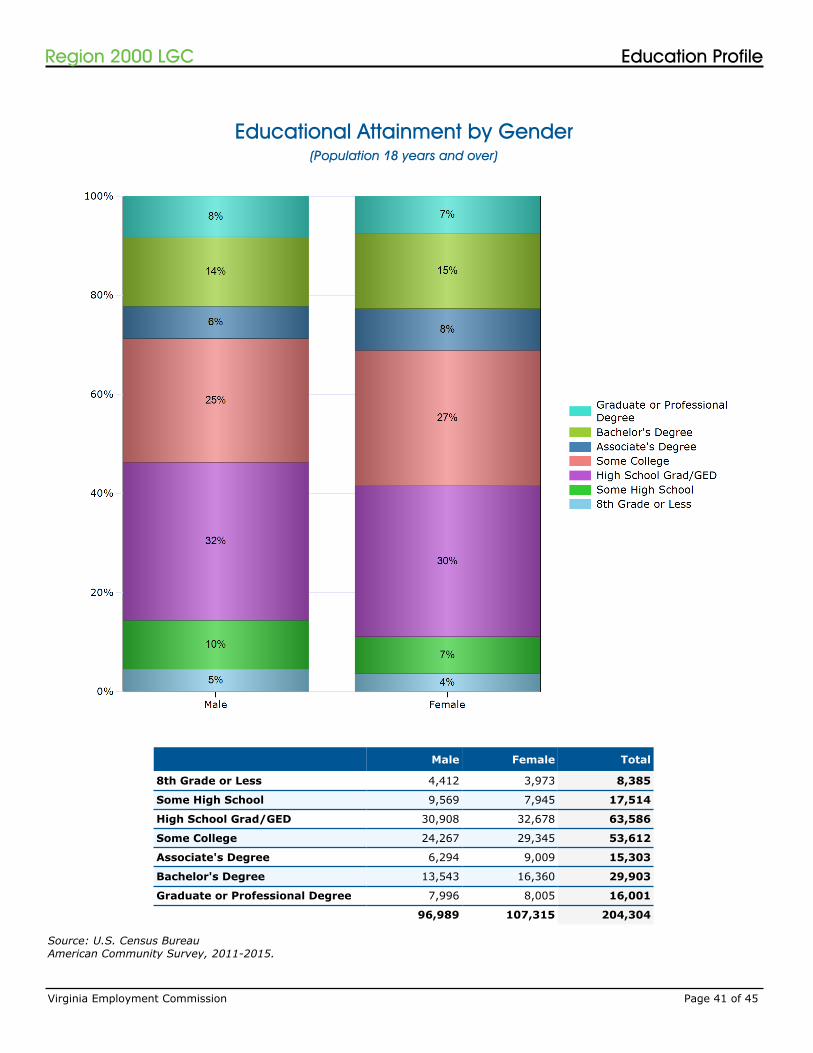
Educational Attainment by Gender
Source: U.S. Census BureauAmerican Community Survey, 2011-2015.
(Population 18 years and over)
Male Female Total
8th Grade or Less 4,412 3,973 8,385
Some High School 9,569 7,945 17,514
High School Grad/GED 30,908 32,678 63,586
Some College 24,267 29,345 53,612
Associate's Degree 6,294 9,009 15,303
Bachelor's Degree 13,543 16,360 29,903
Graduate or Professional Degree 7,996 8,005 16,001
96,989 107,315 204,304
Virginia Employment Commission Page 41 of 45
Education ProfileRegion 2000 LGC

Educational Attainment by Race/Ethnicity
Less than high school diploma
High school grad, GED, or
alternative
Some college or associate's
degree
Bachelor's degree or
higherTotal
Race
White 16,375 41,671 41,886 37,297 137,229
Black or African American 5,708 10,757 7,779 3,220 27,464
American Indian or Alaska Native 41 100 109 100 350
Asian 430 341 344 1,267 2,382
Native Hawaiian/Pacific Islander 22 7 17 11 57
Other 289 199 166 157 811
Multiple Races 221 621 524 426 1,792
Ethnicity
Hispanic or Latino (of any race) 787 599 823 612 2,821
23,873 54,295 51,648 43,090 172,906
(Population 25 years and over)
Source: U.S. Census BureauAmerican Community Survey, 2011-2015.
Virginia Employment Commission Page 42 of 45
Education ProfileRegion 2000 LGC
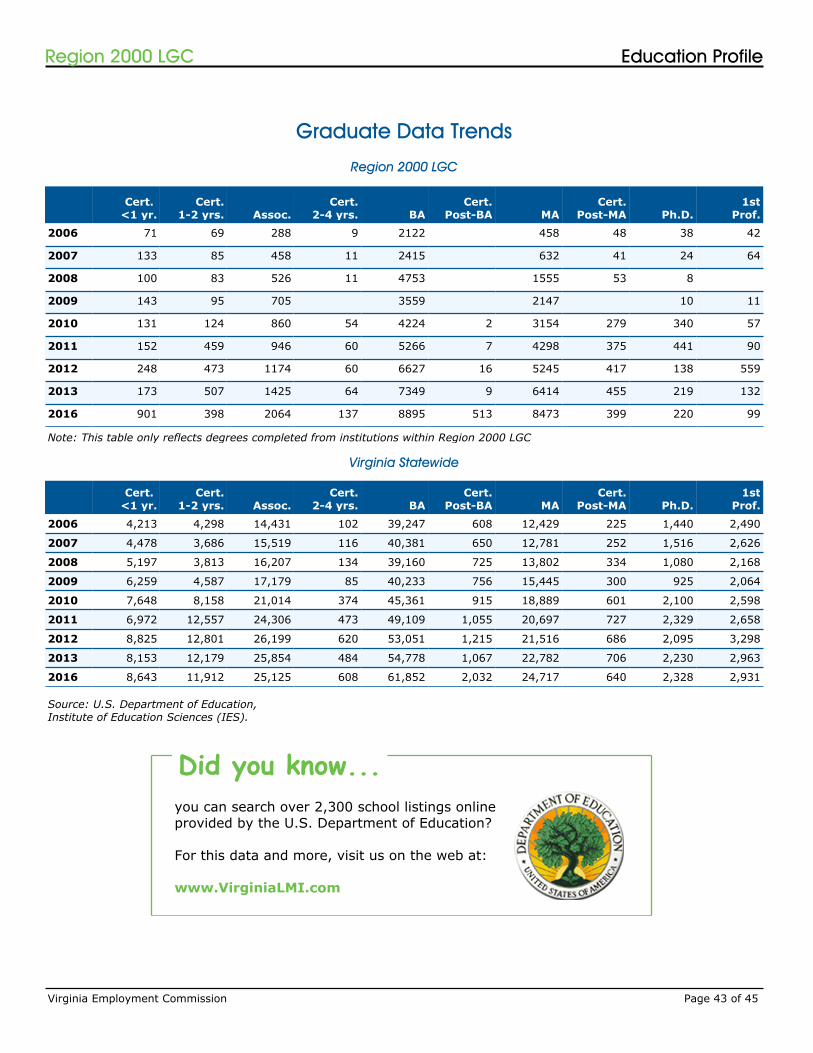
Graduate Data Trends
Cert. <1 yr.
Cert.1-2 yrs. Assoc.
Cert.2-4 yrs. BA
Cert.Post-BA MA
Cert.Post-MA Ph.D.
1stProf.
2006 71 69 288 9 2122 458 48 38 42
2007 133 85 458 11 2415 632 41 24 64
2008 100 83 526 11 4753 1555 53 8
2009 143 95 705 3559 2147 10 11
2010 131 124 860 54 4224 2 3154 279 340 57
2011 152 459 946 60 5266 7 4298 375 441 90
2012 248 473 1174 60 6627 16 5245 417 138 559
2013 173 507 1425 64 7349 9 6414 455 219 132
2016 901 398 2064 137 8895 513 8473 399 220 99
Source: U.S. Department of Education,Institute of Education Sciences (IES).
Region 2000 LGC
Cert. <1 yr.
Cert.1-2 yrs. Assoc.
Cert.2-4 yrs. BA
Cert.Post-BA MA
Cert.Post-MA Ph.D.
1stProf.
2006 4,213 4,298 14,431 102 39,247 608 12,429 225 1,440 2,490
2007 4,478 3,686 15,519 116 40,381 650 12,781 252 1,516 2,626
2008 5,197 3,813 16,207 134 39,160 725 13,802 334 1,080 2,168
2009 6,259 4,587 17,179 85 40,233 756 15,445 300 925 2,064
2010 7,648 8,158 21,014 374 45,361 915 18,889 601 2,100 2,598
2011 6,972 12,557 24,306 473 49,109 1,055 20,697 727 2,329 2,658
2012 8,825 12,801 26,199 620 53,051 1,215 21,516 686 2,095 3,298
2013 8,153 12,179 25,854 484 54,778 1,067 22,782 706 2,230 2,963
2016 8,643 11,912 25,125 608 61,852 2,032 24,717 640 2,328 2,931
Virginia Statewide
Note: This table only reflects degrees completed from institutions within Region 2000 LGC
you can search over 2,300 school listings online provided by the U.S. Department of Education?
For this data and more, visit us on the web at:
www.VirginiaLMI.com
Did you know...
Virginia Employment Commission Page 43 of 45
Education ProfileRegion 2000 LGC
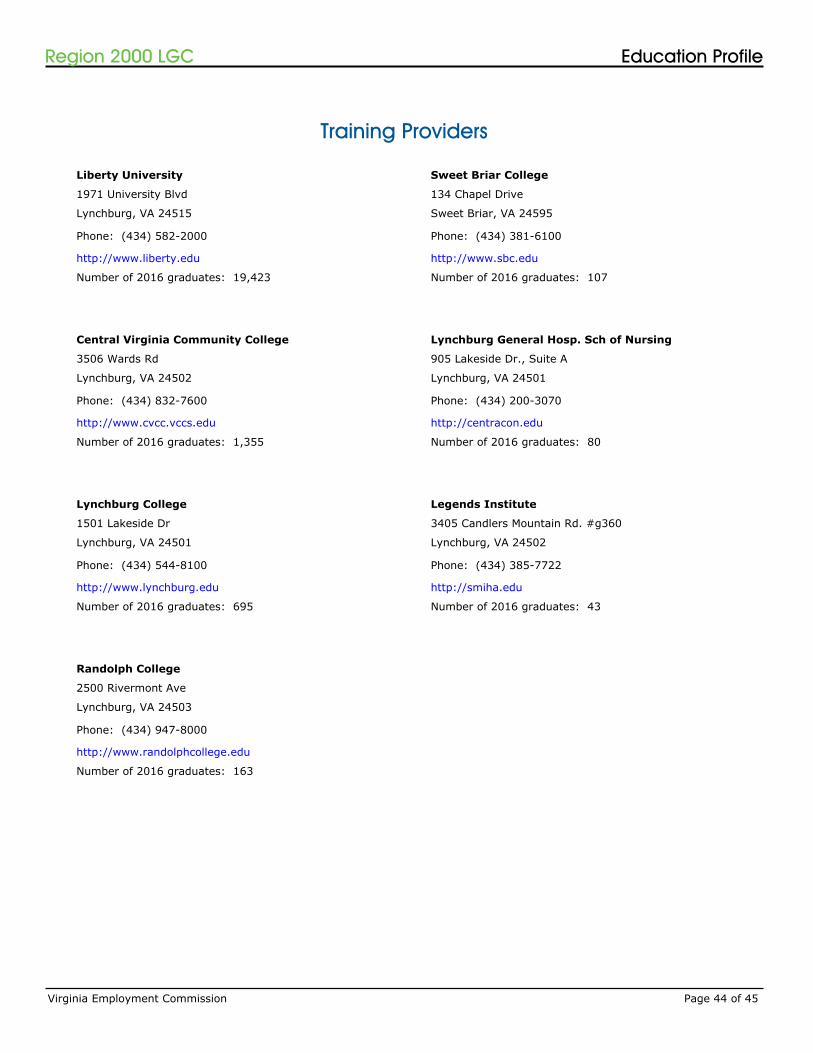
Training Providers
Liberty University
1971 University Blvd
Lynchburg, VA 24515
Phone: (434) 582-2000
http://www.liberty.edu
Number of 2016 graduates: 19,423
Central Virginia Community College
3506 Wards Rd
Lynchburg, VA 24502
Phone: (434) 832-7600
http://www.cvcc.vccs.edu
Number of 2016 graduates: 1,355
Lynchburg College
1501 Lakeside Dr
Lynchburg, VA 24501
Phone: (434) 544-8100
http://www.lynchburg.edu
Number of 2016 graduates: 695
Randolph College
2500 Rivermont Ave
Lynchburg, VA 24503
Phone: (434) 947-8000
http://www.randolphcollege.edu
Number of 2016 graduates: 163
Sweet Briar College
134 Chapel Drive
Sweet Briar, VA 24595
Phone: (434) 381-6100
http://www.sbc.edu
Number of 2016 graduates: 107
Lynchburg General Hosp. Sch of Nursing
905 Lakeside Dr., Suite A
Lynchburg, VA 24501
Phone: (434) 200-3070
http://centracon.edu
Number of 2016 graduates: 80
Legends Institute
3405 Candlers Mountain Rd. #g360
Lynchburg, VA 24502
Phone: (434) 385-7722
http://smiha.edu
Number of 2016 graduates: 43
Virginia Employment Commission Page 44 of 45
Education ProfileRegion 2000 LGC

Source: U.S. Department of Education,Institute of Education Sciences (IES), 2016.
Miller-Motte Technical College
1011 Creekside Lane
Lynchburg, VA 24502
Phone: (434) 239-5222
http://www.miller-motte.edu/
Number of 2016 graduates: 154
Virginia Employment Commission Page 45 of 45
Education ProfileRegion 2000 LGC