Embed Size (px)
Citation preview

Nova Economia
ISSN: 0103-6351
Universidade Federal de Minas Gerais
Brasil
Beccaria, Luis; Maurizio, Roxana
Macroeconomic regime and labor market: the Argentine experience of the past two
decades
Nova Economia, vol. 25, 2015, pp. 863-890
Universidade Federal de Minas Gerais
Belo Horizonte, Brasil
Available in: http://www.redalyc.org/articulo.oa?id=400449413006
How to cite
Complete issue
More information about this article
Journal's homepage in redalyc.org
Scientific Information System
Network of Scientific Journals from Latin America, the Caribbean, Spain and Portugal
Non-profit academic project, developed under the open access initiative

DOI: http://dx.doi.org/10.1590/0103-6351/2227
Macroeconomic regime and labor market: the Argentine experience of the past two decadesRegime macroeconômico e mercado de trabalho: a experiência argentina nas últimas duas décadas
ResumoEste artigo analisa as interações entre regimes macroeconômicos, geração de empregos e a dinâ-mica dos rendimentos laborais na Argentina sob dois regimes macroeconômicos distintos: o regime de currency board dos anos 90, e o subsequente regime de altas taxas reais de câmbio. O primeiro, caracterizado por forte sobrevalorização cambial, teve impacto negativo sobre a atividade econômica e o mercado de trabalho. Entretanto, a manuten-ção de uma taxa real de câmbio competitiva não garante, por si mesma, um desempenho positivo sustentável do mercado de trabalho, como se tor-nou evidente na Argentina durante a década de 2000. Embora desvalorizações significativas do peso – assim como um contexto internacional fa-vorável – favoreceram a expansão do produto e do emprego, a preocupação inicial com a manutenção da taxa real de câmbio em níveis competitivos não foi complementada com políticas voltadas para conter a tendência de apreciação que surgiu al-guns anos após a implementação do novo regime.
Palavras-chavemercado de trabalho; regime macroeconômico; taxa real de câmbio; Argentina.
Códigos JEL E24; E65; J21.
Luis BeccariaUniversidad Nacional de General Sarmiento
Roxana MaurizioUniversidad Nacional de General Sarmiento
AbstractThis document analyzes the interactions between macroeconomic regimes, employment generation and the dynamics of labor incomes in Argentina under two different macroeconomic regimes: the currency board regime of the 1990s and the high real exchange rate regime that followed. The former, characterized by a strong currency overvaluation, had a negative impact on economic activity and the labor market. However, the maintenance of a competitive real exchange rate does not by itself guarantee the sustained positive performance of the labor market, as it became evident in Argentina during the 2000s. Although the sizable depreciation of the peso –together with a positive international context- favored the expansion of output and employment, the initial concern of maintaining the real exchange rate at a competitive level was not continued with policies aimed to counteract the appreciation trend that appeared a few years after the implementation of the new regime.
Keywordslabor market; macroeconomic regime; real exchange rate; Argentina.
JEL Codes E24; E65; J21.
863v.25 n.especial p.863-890 2015 Nova Economia�

Beccaria & Maurizio
1 Introduction
This document analyzes the interactions between macroeconomic regimes, the generation of employment and the dynamics of labor incomes based on the Argentine experience under two different macroeconomic configura-tions: the currency board regime of the 1990s and the high real exchange rate policy that followed after the collapse of the previous regime.
Even though economic instability and its natural negative impact on labor and social indicators has been present in Argentina since the mid-1970s, the structural reforms and macroeconomic changes implemented in the 1990s - in part seeking to revert this process - kept real incomes at really low levels, led to higher levels of labor precariousness and took open unemployment to unprecedented levels. The imbalances accumulated by the regime throughout the decade resulted in a social and economic crisis of unprecedented proportions.
The economic recovery that took place starting in the second half of 2002 was very intense. The consolidation of the growth process was, to a great extent, based on the incentives created by a high real exchange rate1 and a favorable international context, conditions that also charac-terized other South American countries during that period.2 The eco-nomic dynamism led to a rapid expansion of aggregate employment - at a pace that even surpassed output growth- to a certain improvement in the quality of the new occupations, and to higher wages and a better income distribution. The positive performance of labor market variables took place between 2002 and early 2008. After that point, some variables started to decline.
This study aims to contribute to the current debate on macroeconomic regimes and their impacts on labor market performance and income distri-bution in Latin America, by analyzing the structural limitations that these countries face: macroeconomic volatility, low systemic efficiency and pro-ductivity, high dependency on natural resources, a large informal sector and low average remunerations.
In this sense, the Argentine experience of the past two decades allows drawing lessons that can be relevant for the rest of the region. In particular,
1 Throughout this paper, real exchange rate indicates the quantity of pesos per unit of for-eign currency2 See, for example, Frenkel and Rapetti (2011), and Ocampo (2007).
Nova Economia� v.25 n.especial 2015864
Macroeconomic regime and labor market
it is observed that the regimes based on a highly appreciated national cur-rency have negative effects on the labor market.
Also, Argentina’s case provides evidence for those who see the conve-nience of maintaining a high exchange rate to promote economic growth. However, it also shows the need to coordinate exchange rate and fiscal policies in order to preserve the positive effects of such a macroeconomic scheme and reduce its potential negative impacts.
Another lesson from the Argentine experience is the importance of con-ducting policies to encourage increases in productivity and the diversifica-tion of the productive structure since maintaining a high real exchange rate favors the fulfillment of these objectives but does not by itself guarantee these achievements.
This document is structured in three sections. Section 1 presents the stylized facts of the macroeconomic and labor market performance during the convertibility regime of the 1990s. It shows how the fixed exchange rate regime, characterized by an increasing current account deficit and the continuous growth of the external debt stock, was clearly unsustainable and led to negative labor market results. Section 2 analyzes Argentina’s macroeconomic and labor market performance between the early 2000s and 2012. It shows how the economy went through a first period charac-terized by a high real exchange rate -one of the main pillars of the virtu-ous economic cycle- in a context of fiscal and external surpluses, and a second period in which these variables deteriorated, thus showing that the maintenance of such a scheme requires a strong coordination of the main economic variables. Lastly, section 3 presents the conclusions of the study.
2 A decade of currency board regime: economic vul-nerability and labor market deterioration
2.1 Macroeconomic regime
At the beginning of the 1990s, a wide set of structural economic reforms was implemented in Argentina. These reforms not only transformed the macroeconomic dynamics in the short and medium run but they also had a strong impact on the living conditions of the population. After decades of macroeconomic instability, the Convertibility Plan was established in
v.25 n.especial 2015 Nova Economia� 865
Beccaria & Maurizio
1991.The new regime set a fixed exchange rate that worked as a nominal anchor to promote the convergence of domestic inflation to international rates. The financial and trade liberalization program implemented togeth-er with a set of pro-market reforms were intended to contribute to the same objective.
The plan quickly succeeded in decelerating inflation, which remained in very low levels throughout the entire decade. In contrast to the eco-nomic stagnation of the previous decade, the regime also resulted in high GDP growth in its initial stages – annual rate of 7% on average between 1991-1994. However, the accumulation of external imbalances meant that this economic growth path was not sustainable and, in late 2001, after almost four years of economic contraction in which GDP fell by more than 8%, Argentina fell into a macroeconomic crisis of unprec-edented magnitude.
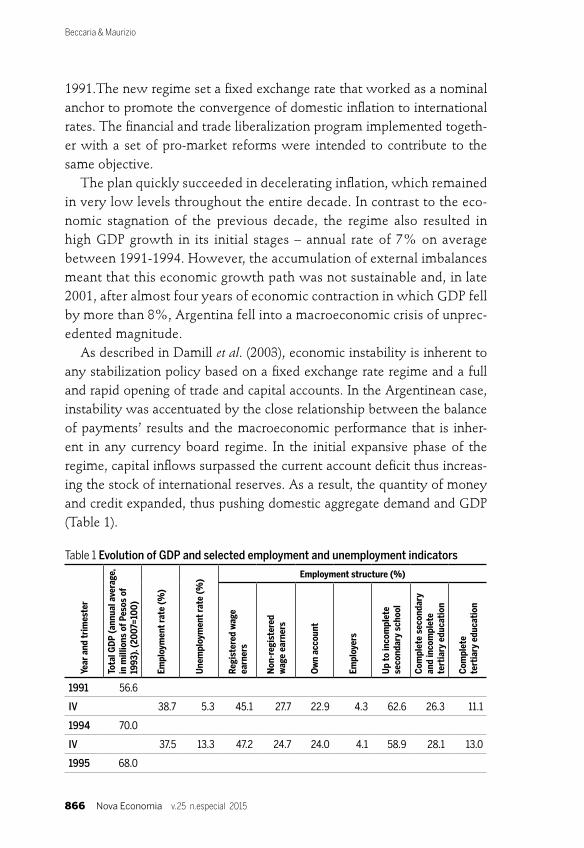
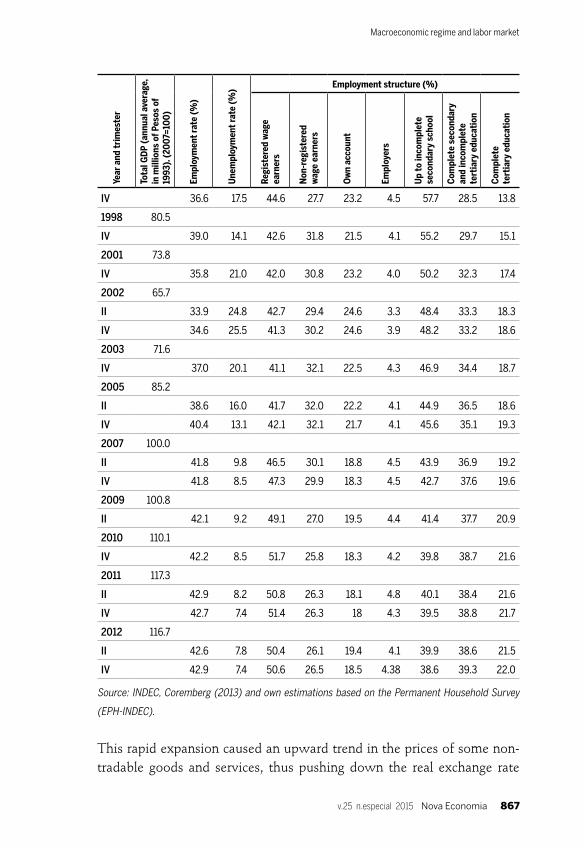
As described in Damill et al. (2003), economic instability is inherent to any stabilization policy based on a fixed exchange rate regime and a full and rapid opening of trade and capital accounts. In the Argentinean case, instability was accentuated by the close relationship between the balance of payments’ results and the macroeconomic performance that is inher-ent in any currency board regime. In the initial expansive phase of the regime, capital inflows surpassed the current account deficit thus increas-ing the stock of international reserves. As a result, the quantity of money and credit expanded, thus pushing domestic aggregate demand and GDP (Table 1).
Table 1 Evolution of GDP and selected employment and unemployment indicators
Year
and
tri
mes
ter
Tota
l GD
P (a
nnua
l ave
rage
, in
mill
ions
of P
esos
of
1993
). (2
007
=10
0)
Empl
oym
ent
rate
(%
)
Une
mpl
oym
ent
rate
(%
) Employment structure (%)
Regi
ster
ed w
age
earn
ers
Non
-reg
iste
red
w
age
earn
ers
Ow
n ac
coun
t
Empl
oyer
s
Up
to in
com
plet
e se
cond
ary
scho
ol
Com
plet
e se
cond
ary
and
inco
mpl
ete
tert
iary
edu
cati
on
Com
plet
e
tert
iary
edu
cati
on
1991 56.6
IV 38.7 5.3 45.1 27.7 22.9 4.3 62.6 26.3 11.1
1994 70.0
IV 37.5 13.3 47.2 24.7 24.0 4.1 58.9 28.1 13.0
1995 68.0
Nova Economia� v.25 n.especial 2015866
Macroeconomic regime and labor market
Year
and
tri
mes
ter
Tota
l GD
P (a
nnua
l ave
rage
, in
mill
ions
of P
esos
of
1993
). (2
007
=10
0)
Empl
oym
ent
rate
(%
)
Une
mpl
oym
ent
rate
(%
) Employment structure (%)
Regi
ster
ed w
age
earn
ers
Non
-reg
iste
red
w
age
earn
ers
Ow
n ac
coun
t
Empl
oyer
s
Up
to in
com
plet
e se
cond
ary
scho
ol
Com
plet
e se
cond
ary
and
inco
mpl
ete
tert
iary
edu
cati
on
Com
plet
e
tert
iary
edu
cati
on
IV 36.6 17.5 44.6 27.7 23.2 4.5 57.7 28.5 13.8
1998 80.5
IV 39.0 14.1 42.6 31.8 21.5 4.1 55.2 29.7 15.1
2001 73.8
IV 35.8 21.0 42.0 30.8 23.2 4.0 50.2 32.3 17.4
2002 65.7
II 33.9 24.8 42.7 29.4 24.6 3.3 48.4 33.3 18.3
IV 34.6 25.5 41.3 30.2 24.6 3.9 48.2 33.2 18.6
2003 71.6
IV 37.0 20.1 41.1 32.1 22.5 4.3 46.9 34.4 18.7
2005 85.2
II 38.6 16.0 41.7 32.0 22.2 4.1 44.9 36.5 18.6
IV 40.4 13.1 42.1 32.1 21.7 4.1 45.6 35.1 19.3
2007 100.0
II 41.8 9.8 46.5 30.1 18.8 4.5 43.9 36.9 19.2
IV 41.8 8.5 47.3 29.9 18.3 4.5 42.7 37.6 19.6
2009 100.8
II 42.1 9.2 49.1 27.0 19.5 4.4 41.4 37.7 20.9
2010 110.1
IV 42.2 8.5 51.7 25.8 18.3 4.2 39.8 38.7 21.6
2011 117.3
II 42.9 8.2 50.8 26.3 18.1 4.8 40.1 38.4 21.6
IV 42.7 7.4 51.4 26.3 18 4.3 39.5 38.8 21.7
2012 116.7
II 42.6 7.8 50.4 26.1 19.4 4.1 39.9 38.6 21.5
IV 42.9 7.4 50.6 26.5 18.5 4.38 38.6 39.3 22.0
Source: INDEC, Coremberg (2013) and own estimations based on the Permanent Household Survey
(EPH-INDEC).
This rapid expansion caused an upward trend in the prices of some non-tradable goods and services, thus pushing down the real exchange rate
v.25 n.especial 2015 Nova Economia� 867

Beccaria & Maurizio
(Figure 1). This currency appreciation in a context of import tariff reduc-tion had a significant negative impact on the local productive structure, particularly on the competitiveness of the national industry. Argentina was an illustrative case of the type of process in which negative results in the balance of trade are compensated by a massive inflow of capital that results in the accumulation of external debt. As a consequence, the factor income account became increasingly negative and as the incapacity of the economy to generate net inflows of foreign currency grew, so did the in-terests that had to be paid on foreign capital.
Figure 1 Multilateral real exchange rate and bilateral real exchange rate to
US dollar Index December 2001=100
Source: own elaboration based on Central Bank of Argentina (BCRA).
In this context, Argentina’s external financial vulnerability increased. The country was negatively affected by the Mexican crisis in 1994, the Rus-sian crisis in 1998 and the Brazilian crisis in 1999. The economy became increasingly dependent on foreign capitals and the rigidity imposed by the currency board regime made it very difficult to correct the overvaluation of the currency under that scheme. As a result, Argentina fell into a reces-sion that finally led to the major economic crisis of late 2001 associated with the abrupt abandonment of the fixed exchange rate regime.
In this context, the deterioration of the government budget was endog-enous to the macroeconomic process since the main tax resource (the val-ue added tax) depends directly and positively on economic activity levels. Given a certain rigidity of current expenditures, the primary balance went from a fiscal surplus of 0.8% of GDP before the beginning of the final re-
0
200
150
100
50
300
250
1991
1992
1993
1994
1995
1996
1997
1998
1999
2000
2001
2002
2003
2004
2005
2006
2007
2008
2009
2010
2011
2012
Dollar real exchange rate Multilateral real exchange rate
Nova Economia� v.25 n.especial 2015868
Macroeconomic regime and labor market
cessionary phase in 1998 to a 1.8% deficit in 2001. In turn, as a result of the growing burden of interest payments on the domestic and external debt, the overall deficit rose from 1.4% to 3.2% of GDP in the same period.
To sum up, the expected expansionary effect of a currency overvalu-ation trough the increase of real incomes and the consequent expansion of domestic demand was more than compensated by the negative impact caused by the loss of competitiveness and the opening of trade. In the end, the above-mentioned trajectory took place: the weak performance of the current account led to the increasing accumulation of external debt and to higher country risk premiums. This on itself produces a contractionary effect that worsens in the face of external negative shocks, like the ones mentioned above. Damill et al. (2002) estimate a model to describe the macroeconomic performance of the currency board regime and find that the monetary base, which was determined by the balance of payments’ result, had a statistically significant effect over GDP movements during that period. They also show how the local interest rate in dollars (deter-mined by the international interest rate plus the country risk premium) had significant effects on the economy and how both the Russian and the Brazilian crises had significant negative impacts as well.
2.2 Deterioration of employment and remunerations3
Despite the rapid expansion of GDP, overall employment grew slowly during the first years of the convertibility regime due to the productive restructuring that resulted from the opening of trade and the currency overvaluation. The latter two factors had at least two effects over em-ployment levels. On the one hand, they reduced the competitiveness of tradable activities, particularly manufactures, resulting in the closure of many production plants with the consequent loss of jobs. On the other hand, they pushed down the relative price of capital goods, which led to a rapid introduction of equipment into a productive structure that had been clearly lagging behind the technological frontier, since the strong macro-
3 Labor market data come from the Permanent Household Survey (EPH), a survey carried out by Argentina’s National Bureau of Statistics and Censuses (INDEC). The survey covers 31 urban centers that represent around 62% of total population and 67% of urban popula-tion (according to the Latin American and Caribbean Demographic Centre – CELADE – and INDEC).
v.25 n.especial 2015 Nova Economia� 869
Beccaria & Maurizio
economic instability of the 1980s had kept investments at very low or even negative levels. While the first effect operated mainly in the industrial sector, the rapid expansion of the capital/labor ratio took place in all eco-nomic activities, although in varying degrees. As a result, between 1991 and 1994, the manufacturing sector had a net loss of 500 thousand jobs,4 becoming the main source of open unemployment growth. The privati-zation of state enterprises, both public utilities (telecommunications, gas, electricity) and industrial and mining companies (steel enterprises and the national oil company, for example) also contributed, although to a lesser extent, to the weak performance of total employment. This slow growth of employment levels together with an increasing supply of labor took unemployment to unprecedented levels (Table 1).
The early appearance of such labor market configuration even in a phase of economic expansion was one of the distinctive features of the period. In the second half of the decade, once the productive structure had adjusted to the new set of relative prices, employment began to show the usual pro-cyclical behavior. However, given the macroeconomic shocks and crises that followed, employment and unemployment rates could never go back to the levels of the previous stage. Moreover, other labor market and wellbeing indicators worsened steadily in those years. Taking the entire period as a whole (1991 to 2001), employment grew at a 0.5% annual rate, which means that the em-ployment-output elasticity was slightly under 0.2. The slow growth in net job creation took the unemployment rate to 21% in urban centers towards the end of 2001. The excess supply of labor not only resulted in higher levels of open unemployment or hourly underemployment but also worsened the quality of employment, which was reflected in a higher proportion of occupations not registered in the social security system (Table 1) in total employment.
Damil et al. (2002) find a positive and statistically significant relation-ship between employment and economic activity levels in the 1990s, and a negative relationship between the former and the change in relative pric-es of capital and labor caused by the currency appreciation.
On the other hand, the macroeconomic performance and the evolution of employment performance had a strong impact on labor incomes. Be-
4 Estimated with the sectoral structure and the employment rates of the PHS that covers 28 urban centers (for the 1995-2001 period) and 10 urban centers (for the 1991-1995 period). These rates were applied to the annual estimations of the country’s total population made by INDEC.
Nova Economia� v.25 n.especial 2015870

Macroeconomic regime and labor market
tween May 1991 and May 1994, the early stages of the convertibility, the purchasing power of labor incomes rose28% favored by the sharp fall of inflation rates. Then, the Tequila crisis in 1994 put an end to this positive trend and between May 1994 and October 1996 real incomes fell by more than 14%. In the following three years, real incomes showed a slight re-covery although they remained below the maximum registered in the first semester of 1994. Lastly, in the final stage of the convertibility, real wages fell again and by October 2001, they were only 8% higher than the value registered at the beginning of the decade, and 14% below the maximum registered in 1994 (Table 2).
Table 2 Evolution of income indicators and inequality
Year Quar-ter
Average real remunerations 1/ Per capita family
income. Average 1/
Gini coefficients Proportion of indivi-
duals living in poor
households (%)
Employed (average)
2/
Registered wage-
-earners
Non- -registered
wage- -earners
Incomes from main
occupation
Per capita family
income
1991 II 89.0 80.5 92.3 71.6 0.42 0.44 34.0
IV 94.2 84.1 93.5 82.2 0.41 0.49 25.4
1994 II 114.3 102.0 118.3 94.4 0.42 0.48 18.9
IV 111.5 98.4 115.8 92.2 0.41 0.50 22.4
1995 IV 104.6 95.9 103.4 86.7 0.44 0.51 29.1
1998 IV 105.2 100.6 101.5 94.3 0.46 0.53 30.6
2001 II 97.4 97.5 100.6 85.9 0.54 0.54 36.8
IV 96.1 100.1 94.1 82.7 0.48 0.53 39.2
2002 II 76.6 80.6 72.0 63.2 0.47 0.56 54.1
IV 68.3 72.1 66.2 57.3 0.50 0.55 58.6
2003 II 68.3 71.5 66.8 60.3 0.49 0.55 55.6
III 71.3 72.8 74.3 65.3 0.48 0.54 49.1
IV 73.1 75.4 78.0 69.3 0.48 0.56 50.7
2005 II 79.8 80.5 85.4 74.4 0.46 0.50 40.5
2007 I 96.7 97.0 99.3 96.6 0.50 0.50 26.6
II 95.5 96.7 97.2 95.5 0.43 0.48 27.3
2008 II 93.7 92.9 95.4 92.3 0.41 0.46 27.5
IV 95.0 96.3 94.3 96.6 0.41 0.46 24.2
2010 IV 100.0 100.0 100.0 100.0 0.40 0.46 22.9
2011 II 101.3 102.6 103.3 105.5 0.40 0.45 21.5
IV 104.6 106.5 105.0 107.7 0.40 0.45 20.4
v.25 n.especial 2015 Nova Economia� 871

Beccaria & Maurizio
Year Quar-ter
Average real remunerations 1/ Per capita family
income. Average 1/
Gini coefficients Proportion of indivi-
duals living in poor
households (%)
Employed (average)
2/
Registered wage-
-earners
Non- -registered
wage- -earners
Incomes from main
occupation
Per capita family
income
2012 II 102.2 105.7 101.7 106.4 0.39 0.43 19.9
IV 100.6 101.7 107.3 105.3 0.37 0.43 18.8
1/ Index base IV 2010=100
2/ Includes nonwage-earners. Source: Authors’ own elaboration based on EPH (INDEC).
The continuous deterioration of competitiveness and increasing vulnerabil-ity to external shocks caused by the currency appreciation in a context of full trade and financial opening had a negative impact on the demand for labor and raised underemployment. More specifically, economic activity and employment levels could not recover after the negative impact of the productive restructuring at the beginning of the period due to these factors.
In this context, no employment policies were implemented to tackle these negative events in the labor market. The line of action was more fo-cused on programs aimed to attend to the situation of low-skilled work-ers, who were suffering the most in terms of labor market performance. However, these measures were not strong enough to produce significant outcomes in terms of employment.5 In this context, as it would be ex-pected, the increase in unemployment and labor informalization had a negative impact on remunerations.6 Both factors, in turn, reduced house-hold incomes, particularly affecting those already at the bottom of the distribution. Workers with lower education, who faced the lowest prob-abilities of finding a job or a good quality job, suffered the largest income reduction. As a result of this process, income poverty went from 25% of the population in 1991 to 39% in 2001. It should be noted that no significant efforts were made in the social policy sphere to mitigate this situation. On the contrary, the programs implemented were scarce and had no significant impact.7
5 The Plan Trabajar, a job creation program that was implemented between 1996 and the early 2000s, reached approximately 100,000 beneficiaries at its maximum point of coverage. This is quite alow coverage, taking into account that unemployment is estimated to have reached 2.5 million people in the last years of the convertibility regime.6 The existence of a significant negative effect of unemployment on wages in Argentina dur-ing that period is estimated, for example, by Damill et al. (2003).7 “The lack of interest on the part of the State to implement a real social reform is reflected
Nova Economia� v.25 n.especial 2015872

Macroeconomic regime and labor market
3 Economic expansion and labor market recovery in the post-convertibility period
3.1 Features of the new macroeconomic regime
Like in previous currency depreciation experiences, for example those in the 1980s, the strong depreciation of the peso after the collapse of the con-vertibility regime led to a sharp increase in domestic prices. However, this time the pass through was relatively low - in June 2002 the real exchange rate had doubled its value- and the period of high inflation was short-lived. This was a result of the very complex social context that prevailed before the change of regime. The magnitude of the economic depression and the labor market situation had weakened the main propagation mechanisms of inflationary impulses that had characterized previous devaluations. The liquidity constraints caused by the restrictions imposed on bank deposit with drawals8, the foreign exchange controls and the reduction of financial assistance to banks, all contributed to reduce both the intensity and dura-tion of the inflationary process after the devaluation.
The effect of high inflation rates at the beginning of 2002 in a context of nominal income stagnation and high uncertainty accentuated the decline of GDP, which fell at a yearly rate of 15% in the first quarter of that year. However, as prices began to stabilize, GDP stopped falling in the second quarter and started to grow again in the third quarter of 2002.
The rise of the real exchange rate was a crucial factor behind the rapid and intense output recovery after the 2001-2002 crisis, since it allowed increasing the competitiveness of tradable sectors. In fact, several sectors of the manufacturing industry that had been negatively affected in the period of trade opening and exchange rate appreciation initiated a process
in the fact that in the expansionary years of the 1990s, social spending was below the level registered in the1986-1987 period, the best period in the 1980s; moreover, in 1996, it was the first time social spending was cut in times of economic expansion. Besides, the structure of social spending in the 1990s was not different from that of the 1980s and its re-composition towards targeted programs was minimal” (Acuña et al., 2002, p. 52)8 In response to the massive capital flight that occurred in the second semester of 2001, restrictions were imposed on bank deposit withdrawals in December of that year. This mea-sure was kept in force by the successive authorities that followed the resignation of the constitutional president in late December. It was only in May 2002 that a voluntary swap was launched to exchange bank deposits for bonds and in December of that year withdrawal restrictions were lifted for cash deposits and small fixed-term deposits (up to USD 7, 000). In January 2003, all deposits were freed.
v.25 n.especial 2015 Nova Economia� 873
Beccaria & Maurizio
of import substitution, and exports began to show a good performance as well. The effects of the Unemployed Household Head Program (Plan Jefes y Jefas de Hogares Desocupados –PJJHD)9, the growth of employment and the implementation of income policies that raised the purchasing power of wages also contributed to a quick economic recovery. Investment in construction also recovered, driven by the wealth effects experienced by foreign currency holders in a context of a lack of alternatives for financial investments and the gradual increase of consumption.
The maintenance of a high and stable real exchange rate was the main feature of the macroeconomic policy, at least until 2007. As it was pointed out, it was a central factor behind the initial economic recovery after the crisis and it also favored the growth process that followed. Figure 1 shows the jump of the real exchange rate at the beginning of the 2000s and how, despite the appreciation process that followed, the average level of the past decade was 80% higher than the value of the previous decade.
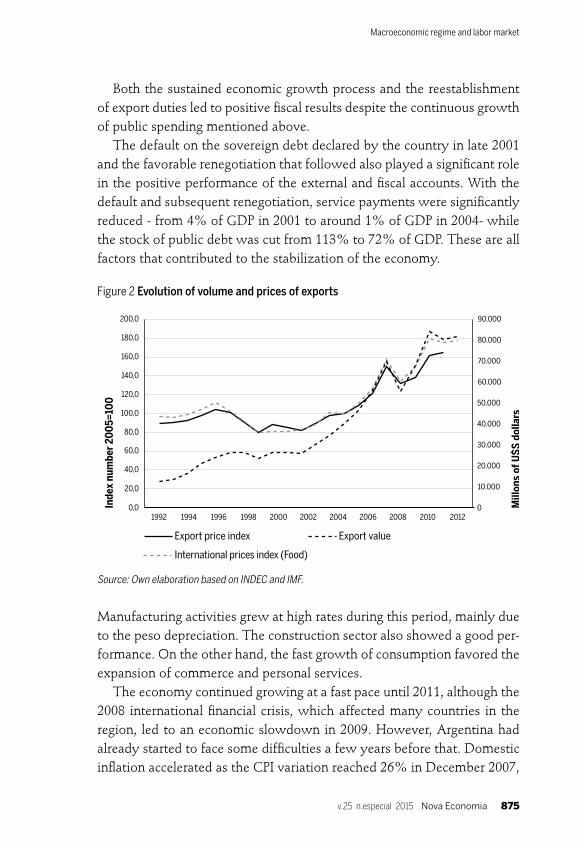
The growth process was also underpinned by a sustained increase in public spending and public investment, and also by several income poli-cies that favored the expansion of private consumption. The performance of private investments on equipment is also to be highlighted, surpassing the levels registered in the 1990s. This allowed the economy to continue expanding once the utilization of idle capacity had reached its maximum levels in certain sectors. The fast expansion of exports pushed aggregate demand and contributed to a significant improvement of external ac-counts. Figure 2 shows the sharp increase in the value of exports observed after the devaluation, which was, to a great extent, due to a rise in the average prices of the goods exported but also to the expansion of quanti-ties. The increase of these prices came as a result of the expansion of some Asian emerging markets, such as China and India, which constitute signifi-cant markets for Latin American products (Lederman et al., 2009; CEPAL, 2008; Ocampo, 2007). In the case of Argentina, the international prices of soybeans and other grains, which have a significant weight in the export basket, showed an upward trend all throughout the 2000s.
9 The PJJHD was implemented in April 2002, in a context of high social conflict. The Plan consisted of a monthly cash transfer initially directed to unemployed household heads that were not covered by the unemployment insurance of the contributory scheme. However, soon after, the Plan was extended to also reach low-income households, independently of their occupational status. In mid-2002 the Plan covered 500 thousand households and in May 2003 it had already reached its maximum of around 2 million households.
Nova Economia� v.25 n.especial 2015874
Macroeconomic regime and labor market
Both the sustained economic growth process and the reestablishment of export duties led to positive fiscal results despite the continuous growth of public spending mentioned above.
The default on the sovereign debt declared by the country in late 2001 and the favorable renegotiation that followed also played a significant role in the positive performance of the external and fiscal accounts. With the default and subsequent renegotiation, service payments were significantly reduced - from 4% of GDP in 2001 to around 1% of GDP in 2004- while the stock of public debt was cut from 113% to 72% of GDP. These are all factors that contributed to the stabilization of the economy.
Figure 2 Evolution of volume and prices of exports
Source: Own elaboration based on INDEC and IMF.
Manufacturing activities grew at high rates during this period, mainly due to the peso depreciation. The construction sector also showed a good per-formance. On the other hand, the fast growth of consumption favored the expansion of commerce and personal services.
The economy continued growing at a fast pace until 2011, although the 2008 international financial crisis, which affected many countries in the region, led to an economic slowdown in 2009. However, Argentina had already started to face some difficulties a few years before that. Domestic inflation accelerated as the CPI variation reached 26% in December 2007,
20,0
100,0
80,0
60,0
40,0
0,0
140,0
120,0
160,0
200,0
180,0
0
10.000
50.000
40.000
30.000
20.000
70.000
60.000
90.000
80.000
Inde
x nu
mbe
r 20
05=
100
Mill
ons
of U
$S d
olla
rs1992 1994 1996 1998 2000 2002 2004 2006 2008 2010 2012
Export price index Export value
International prices index (Food)
v.25 n.especial 2015 Nova Economia� 875

Beccaria & Maurizio
compared to rates that oscillated around 10% in the 2005-2006 period. Since 2010, annual inflation rates fluctuated around 25%.10
A high real exchange rate policy is usually associated with high growth, as is demonstrated for developing countries by, for example, Krugman (2008),11 although some studies then questioned the validity of extend-ing this conclusion to all these countries.12 In the case of Argentina in the 2000s, the positive effect of the high real exchange rate over economic ac-tivity levels was reinforced by the implementation of measures such as the introduction of export taxes, subsidies to public services and cash transfers to families. These measures tended to mitigate the negative impact of a high real exchange rate on wages and tended to accelerate the expansion of public spending. As a result of this process, domestic aggregate demand grew faster than aggregate supply during this period.13
Faced with the inflationary process, the Central Bank, following the government’s instructions, kept the currency devaluation rate below infla-tion levels, leading to a gradual real appreciation trend of the peso. Figure 1 shows that the peso/dollar bilateral exchange rate at the end of 2012 was similar to that registered before the large nominal depreciation of 2002. The multilateral exchange rate was even below the levels reached after the crisis. This appreciation trend after a currency devaluation was also observed in other countries of the region, like Brazil and Uruguay (Damill; Frenkel, 2012; Aboal et al., 2012).
The acceleration of public spending growth - partly due to the continuous increase of consumption subsidies, particularly for transport and energy - and the poor performance of tax collection had a negative impact on the fiscal ac-counts, thus weakening one of the strong pillars of the initial phase. In 2012, after a year of reduction, the primary surplus finally turned negative.
The accumulation of difficulties caused by the exchange rate apprecia-tion and the fiscal constraints finally led to a decline in output in 2012
10 Given the manifest underestimation of inflation as measured by the official CPI index since 2007, we employ the 9-Provinces CPI index, which averages the variations of the CPI indexes calculated by the statistical bureaus of 9 provinces of Argentina.11 For evidence of a positive correlation between economic growth and a high real exchange rate in other countries see, for example, Rodrick (2008).12 Rapetti et al. (2012) find that the positive effect of currency depreciation on economic growth is not monotonous within the group of developing countries but it is greater in the least developed ones.13 Albornoz et al. (2012) mention that investment in equipment rose during the period, but the capital stock grew at a slower pace than GDP.
Nova Economia� v.25 n.especial 2015876

Macroeconomic regime and labor market
and to a reduced growth in 2013 (1.8%), well below the rates of the 2003-2011 period. This economic slowdown occurred in a context of rapid economic expansion in many countries of the region.14 During these years, real wages began to decrease along with the inflationary process (see next section) and despite the already mentioned expansion of public spending, aggregate demand started to decelerate due to the weak performance of investment.15
Difficulties also started to appear in the external front due to the lower competitiveness of certain sectors and a growing energy deficit.16 The trade balance worsened in 2010 and 2011, and the recovery of 2012 was the result of a sharp fall in imports due to the economic slowdown. The his-torically negative result in the balance of trade on services also worsened significantly in 2011 and 2012. Altogether, the current account surplus fell in 2010 and changed its sign in the following year. In response to this, quan-titative controls were introduced in the foreign exchange market in 2012.
The macroeconomic policy of the post-convertibility period, therefore, turned out to be erratic. Initially, the high real exchange rate contributed to a quite rapid economic recovery after the crisis and favored a subsequent economic expansion process of high growth rates and relatively moder-ated and stable inflation. In 2006, the first signs of policy mismanagement appeared as public spending started to grow faster than public revenues, introducing an additional inflationary impulse to a context that is already prone to inflationary pressures due to the high exchange rate scheme. Also, as was mentioned above, the economy began to face some supply constraints as investment grew slower than output (causing reductions of idle capacity and restrictions in the production of gas and oil) and inflation started to accelerate. The boom of international commodity prices regis-
14 While Argentina fell 0.5% in 2012, Peru and Chile grew more than 6%, Venezuela grew 5.3%, Bolivia 5%, Colombia 4.5% and Uruguay 3.8%. In 2013, Argentina’s GDP grew 1.8%, while Bolivia, Peru, Uruguay, Colombia and Chile exhibited rates between 3.2% and 5.2%. Given the overestimation of Argentina’s official growth rates for the 2007-2012 period, the figures employed in this study come from Coremberg (2013).15 Gross domestic fixed investment fell by almost 5 percentage points in 2012, while invest-ment in equipment fell by 7%.16 Between 2004 and 2012, a period in which private consumption grew at fast rates, gas production fell by more than 15% (after reaching its peak in 2004). This situation forced Argentina to increase gas imports and even cut the provision of gas to enterprises. In the case of oil, production began to decrease in 1998 and, between 2004 and 2014, it fell by 19%, thus taking export levels to almost zero (data coming from the Argentine Petroleum and Gas Institute –www.iapg.org.ar/estadisticasnew/).
v.25 n.especial 2015 Nova Economia� 877
Beccaria & Maurizio
tered since 2006 also played a role in the acceleration of domestic inflation, although the impact was probably offset by the implementation of tax and subsidy measures. On the other hand, domestic inflation rates remained high after commodity prices started to fall in mid-2008.
The attempt to maintain and improve real wages in an inflationary con-text - in an economy that was still growing at a fast pace- also contributed to the persistence of the inflationary process. During the 2012 wage ne-gotiations, the government tried to induce unions to accept a suggested ceiling for the annual increase, without any success. However, in 2013 the government got some unions to accept a 22% increase, a figure that was slightly below the inflation rate of the previous year (24%).
While maintaining the pressure on domestic demand, the government’s ‘anti-inflationary’ response consisted of containing inflation via a real ex-change rate appreciation, the increase of subsidies and the implementation of price controls. As a result, important imbalances began to accumulate on the macroeconomic front as the fiscal and external deficits increased. In addition, quantitative restrictions on international trade were also es-tablished. As a result of all these measures, investments began to fall and economic growth started to slow down.
3.2 Performance of labor market variables since 2002
Argentina’s rapid economic recovery after the devaluation and the strong growth process that followed is indeed a remarkable fact. However, even more so is the significant growth of total employment during that period. The employment rate grew more than 9 p.p. between mid-2002 and the end of 2012, which is equivalent to a 3.4% annual growth rate of the total number of workers (excluding those in public employment plans). As a result of this process, the unemployment rate fell from 25% to 7.4% in those years. The employment-output elasticity of the period was quite high, since GDP grew 78% in the same period (6.0% annual growth rate). It is worth mentioning that in the 1991-1998 period, the previous period of sustained growth in Argentina, employment grew at a much slower pace of 1.4% per year, while GDP increased at an average annual rate of 5.2%.
In this context of rapid growth, the performance of employment and activity levels differ between economic sectors. In terms of employment
Nova Economia� v.25 n.especial 2015878
Macroeconomic regime and labor market
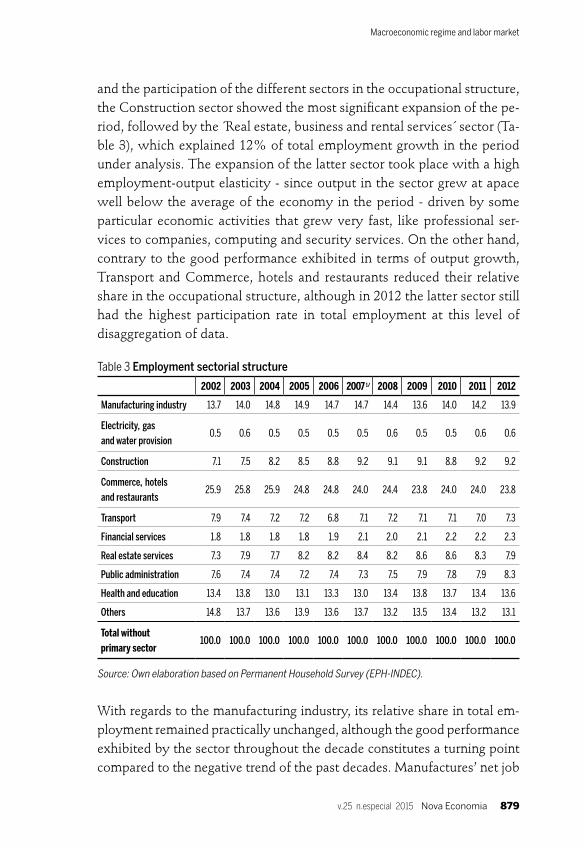
and the participation of the different sectors in the occupational structure, the Construction sector showed the most significant expansion of the pe-riod, followed by the ´Real estate, business and rental services´ sector (Ta-ble 3), which explained 12% of total employment growth in the period under analysis. The expansion of the latter sector took place with a high employment-output elasticity - since output in the sector grew at apace well below the average of the economy in the period - driven by some particular economic activities that grew very fast, like professional ser-vices to companies, computing and security services. On the other hand, contrary to the good performance exhibited in terms of output growth, Transport and Commerce, hotels and restaurants reduced their relative share in the occupational structure, although in 2012 the latter sector still had the highest participation rate in total employment at this level of disaggregation of data.
Table 3 Employment sectorial structure
2002 2003 2004 2005 2006 2007 1/ 2008 2009 2010 2011 2012
Manufacturing industry 13.7 14.0 14.8 14.9 14.7 14.7 14.4 13.6 14.0 14.2 13.9
Electricity, gas and water provision
0.5 0.6 0.5 0.5 0.5 0.5 0.6 0.5 0.5 0.6 0.6
Construction 7.1 7.5 8.2 8.5 8.8 9.2 9.1 9.1 8.8 9.2 9.2
Commerce, hotels and restaurants
25.9 25.8 25.9 24.8 24.8 24.0 24.4 23.8 24.0 24.0 23.8
Transport 7.9 7.4 7.2 7.2 6.8 7.1 7.2 7.1 7.1 7.0 7.3
Financial services 1.8 1.8 1.8 1.8 1.9 2.1 2.0 2.1 2.2 2.2 2.3
Real estate services 7.3 7.9 7.7 8.2 8.2 8.4 8.2 8.6 8.6 8.3 7.9
Public administration 7.6 7.4 7.4 7.2 7.4 7.3 7.5 7.9 7.8 7.9 8.3
Health and education 13.4 13.8 13.0 13.1 13.3 13.0 13.4 13.8 13.7 13.4 13.6
Others 14.8 13.7 13.6 13.9 13.6 13.7 13.2 13.5 13.4 13.2 13.1
Total without primary sector
100.0 100.0 100.0 100.0 100.0 100.0 100.0 100.0 100.0 100.0 100.0
Source: Own elaboration based on Permanent Household Survey (EPH-INDEC).
With regards to the manufacturing industry, its relative share in total em-ployment remained practically unchanged, although the good performance exhibited by the sector throughout the decade constitutes a turning point compared to the negative trend of the past decades. Manufactures’ net job
v.25 n.especial 2015 Nova Economia� 879

Beccaria & Maurizio
creation explained 15% of total employment growth between 2002 and 2012. According to the available evidence, this growth was mostly driven by well-established sectors, some of which had been severely damaged by the 1990s policies. As Fernández Bugna and Porta (2008) point out “the [in-tra] sectoral configuration of the industrial sector has not changed signifi-cantly, while the shift in relative prices seems to have further accentuated preexisting asymmetries inprofitability within the industry. The recovery of industrial employment was driven by the growth of the more labor-intensive branches, but there is no evidence of changes in the production function towards the employment of more labor per unit of output or higher employment quality” (p. 37).
The growth in aggregate employment took place with a persistent increase in the participation of wage earners in total employment. This proportion had remained almost unchanged in the 1990s (Table 1). On the other hand, the participation of own-account employment exhibited a countercyclical behavior, at least until 2010, the year after which it re-mained quite stable. However, perhaps the most outstanding fact in terms of employment behavior is the growth of registered employment within the group of wage earners, which contrasts with the trends that had pre-vailed in the previous decades. All in all, formal employment grew faster than total employment in the period (with an annual rate of 4.7% vs. 3.2% for the latter). The process of labor formalization continued throughout the entire period, even after remunerations (and labor costs) had already recovered its pre-crisis levels. The latter shows that the process of sus-tained economic growth was a main factor behind this phenomenon. In addition, several policies were implemented to reduce tax evasion and in-centivize labor registration, although it is difficult to identify if such poli-cies had a differentiated impact to that of economic growth. In fact, even though the improvement in tax and labor regulation compliance was an important objective after the weak performance of the previous decades, the efforts made in this field usually have positive effects in contexts of employment growth and are less likely to reduce labor precariousness in contexts of economic stagnation or slow growth.17
17 The improvement in the quality of employment is a phenomenon that was observed in other countries of the region that also experienced important economic growth processes with employment expansion during the 2000s. Brazil is perhaps one of the most significant cases, since the proportion of formal employment went from 44% of total employment in 2002 to 49.6% in 2008 (see Berg, 2010).
Nova Economia� v.25 n.especial 2015880

Macroeconomic regime and labor market
The rapid increase of domestic prices after the 2001 devaluation had a direct negative effect on the real value of labor incomes, which fell around 30% between October 2001 and October 2002. However, towards the second part of 2002, nominal remunerations began to grow at a pace simi-lar to prices and in mid-2003, real remunerations started a long and sus-tained recovery process: between the third quarter of 2003 and the fourth quarter of 2012, labor incomes’ purchasing power rose 41%. Thus, the evolution of real remunerations in the period under analysis show a natu-ral asymmetry between the variations in the different phases of the eco-nomic cycle: after the 30% loss registered in only one year (2002), it was only by the end of 2008 that real remunerations reached the previous peak of the last quarter of 2001.
The increase in real incomes was verified for all occupational categories: wage earners, own account workers and employers. Within the group of wage earners, real incomes grew similarly for both registered and non-registered workers (40% and 45%, respectively).
The accelerated growth of labor demand - which explains the evolu-tion of employment - was one of the factors that favored the increase of remunerations. However, the set of income policies implemented by the National Government also played a significant role, particularly at the beginning of the period. When the most drastic effects of the devalu-ation began to dissipate and the trends in the exchange rate, domestic prices and economic contraction began to stabilize, the authorities started to consider the implementation of measures to increase remunerations’ purchasing power. Acknowledging the impossibility to achieve autono-mous wage increases or avoid further reductions in a context of very high unemployment and uncertainty, the authorities established lump sum in-creases for wage earners. In July 2002, when net wages averaged $2,200 for registered employees, an initial $100 increase was established, which was then raised successively until it reached a total of $200. Initially, these additional payments were non-remunerative (they were excluded for the computation of social security contributions) but since mid-2003 they were fully incorporated as part of basic wages. In addition, the policy im-plemented to recover the real value of the minimum wage also operated in the same direction. In contrast to the negative trend of the 1990s, the mini-mum wage’s nominal value doubled during 2003 and the first part of 2004, when the National Council for Employment, Productivity and Wages was
v.25 n.especial 2015 Nova Economia� 881

Beccaria & Maurizio
reestablished. This trend continued throughout the decade, and the real minimum wage of 2012 was 2.5 times that of 2003. Another important policy implemented in the period was the promotion of collective bargain-ing mechanisms. It was precisely thanks to this mechanism that workers were able to translate the increased bargaining power derived from the positive performance of employment into higher real remunerations. As a matter of fact, approximately 1,000 labor agreements were homologated per year in 2006 and 2007, and more than 1,500 were closed between 2007 and 2010. These figures are in stark contrast to the 190 yearly average ne-gotiations of the 1990s. This institution also played an active role during the 2008/09 crisis by maintaining the actualization of nominal remunera-tions activated, thus inhibiting the adjustment mechanism that usually op-erate in recessionary periods.
The income policies briefly mentioned above played an important role in the recovery of registered wage earners’ remunerations, par-ticularly in 2003 and 2004. But some of these measures probably had an additional impact by affecting the criterion used by employers to set the remunerations of non-registered workers, which also grew considerably. On the other hand, the expansionary context must have also favored the expansion of own-account activities, thus favoring the growth of their incomes.
So far, the analysis of labor variables between 2002 and 2012 shows a clear improvement in labor market conditions. However, this was not a linear process and the downturns experienced by the economy in the post- convertibility period had a negative impact on the performance of this market.
Figure 3 shows the deceleration that occurred in some variables since 2007 or 2008, depending on the variable considered. The expansion of em-ployment started to slowdown in early 2007. The average annual growth rate of total employment went from 5.6%, in the 2002 to late 2006 period, to 1.4% between 2007 and 2012.
In order to understand this performance, it is convenient to analyze it in comparison to the evolution of activity levels. It was pointed out above that the average employment-output elasticity was quite high in the pe-riod, but Table 4 shows significant variations observed during these years. Initially, in 2003 and 2004, employment expanded at a pace not much different from that of GDP. In the two following years, the elasticity fell
Nova Economia� v.25 n.especial 2015882

Macroeconomic regime and labor market
sharply but still remained above 0.5, a high level compared to historical values. Then this downward trend persisted and elasticity reached levels between 0.1 and 0.3 in the following years. The negative value registered in 2009 and the very high value of 2012 were associated with periods of negative growth and thus are not relevant to understand the dynamics of employment in the medium and long run (Table 4).
Figure 3 Evolution of main labor market indicators during the 2000s
Source: Own elaboration based on Permanent Household Survey (EPH-INDEC).
Table 4 Employment-output elasticity
2003 /02
2004 /03
2005 /04
2006 /05
2007 /06
2008 /07
2009 /08
2010 /09
2011 /10
2012 /11
Manufacturing industry 0,67 1,01 0,72 0,42 0,37 -0,08 0,90 0,38 0,72 0,34
Electricity, gas and water provision
3,81 -0,65 1,01 -0,99 3,05 3,55 10,38 1,00 3,67 -1,70
Construction 0,40 0,53 0,47 0,50 0,64 0,36 -0,19 -0,46 0,66 -0,53
Commerce, hotels and restaurants 1/
0,60 0,55 0,03 0,64 -0,03 0,72 0,17 0,17 0,27 -0,03
Services 2/ 3,06 0,67 0,76 0,57 0,53 0,27 3,14 0,05 0,16 0,77
Total (excluding agriculture and mining)
0,92 0,74 0,53 0,60 0,38 0,37 -0,44 0,11 0,35 -2,27
Source: Authors’ own elaboration based on INDEC and Coremberg (2013).
1/ Includes repairs
2/ Includes domestic services
90
130
120
110
100
80
140
150
Inde
x nu
mbe
r M
ay 2
010
=10
0
Oct
-91
Oct
-02
3-20
03
1-20
04
3-20
04
1-20
05
3-20
05
1-20
06
3-20
06
1-20
07
4-20
07
2-20
08
4-20
08
2-20
09
4-20
09
2-20
10
4-20
10
2-20
11
4-20
11
Real remunerations Proportion of registered wages
Employment
2-20
12
v.25 n.especial 2015 Nova Economia� 883
Beccaria & Maurizio
The deceleration in the capacity to create new employment is even greater if we take into account that a significant part of the net job creation that took place since 2007 corresponds to jobs in the public sector. This sector explains 33% of the already poor performance exhibited by total employ-ment between late 2006 and late 2012. In those years, total employment grew at an average annual rate of 1.4%, which means that private employ-ment only grew at an average annual rate of 1.1%. Even more so, if the 2008-2012 period is considered, the performance of private employment falls to 0.9% per year in a context of total employment growing 1.3% per year, resulting in a contribution of 44% on the part of the public sec-tor. Therefore, if the performance of the private sector is considered, the downward trend in elasticity becomes even more pronounced.
The evolution of this marginal relationship between employment and output registered since 2007 questions the idea of a structural increase in the capacity of the economy to generate employment. Even though the reduc-tion in the price of labor relative to capital might have initially led to some factor substitution, the subsequent growth of remunerations shows that the set of relative prices registered after the devaluation was not sustainable. Moreover, no significant changes were observed in the contribution of sec-tors with relatively higher employment-output elasticity to total employ-ment, which could have been incentivized by a higher exchange rate. Even though construction was one of the sectors that grew the most between 2002 and 2012, the service sector, that traditionally has a relatively higher marginal demand for labor, grew at a slower pace. Within the industrial sec-tor, the cases were more varied. On the one hand, textiles and other sectors that have a relatively higher marginal demand for labor are indeed among the branches that expanded the most, but other typically capital-intensive branches also grew significantly. More important, the different intensity with which the different sectors expanded could not have been a determi-nant factor of labor-output elasticity since these elasticities increased - and then decreased- for most economic activities (Table 4). Even more so, this was verified for the different branches of manufacturing industry.18
Rather, the performance of the employment-output elasticity in the post-convertibility period seems to have been more like the natural evo-lution of an economy that started with a large idle capacity as a result of
18 Fernández Bugna and Porta (2008).
Nova Economia� v.25 n.especial 2015884

Macroeconomic regime and labor market
the long recession of the end of the convertibility that gradually decreased as production expanded. At least this seems to have been the case of the manufacturing sector, as shown by the available data on capacity utiliza-tion. Figure 4 shows a clear negative association between elasticity and capacity utilization levels in the first years after the 2002 crisis.
Figure 4 Capacity utilization and labor elasticity in the manufacturing industry
Source: Coremberg (2013) and INDEC.
This analysis is not suggesting that elasticity will end up returning to the 1990s levels. Elasticity will probably converge to higher values than those of the previous decade but will still remain at levels that are more similar to those observed in other countries and other periods, certainly well un-der the average levels of the 2002-2012 period (and particularly under the levels registered at the beginning of this period).
Figure 3 also shows that 2007 is a turning point for the evolution of real remunerations. Between the third quarter of 2003 and the second quarter of 2007, this variable grew at an annual rate of 6.9%. Then, as the expan-sion of employment slowed down and inflation started to accelerate, real remunerations grew at a poor 0.9% per year (0.9% and 1.8% in the case of registered and non-registered wage-earners, respectively). Even more so, real remunerations fell between late 2011 and the end of 2012, and more intensely in the case of registered wage earners.
The performance of employment towards the end of the period under analysis (and its impact on remunerations) was not only a reflection of the mentioned changes in the employment-output elasticities but it was also a
62
70
68
66
64
60
74
72
76
-0,2
0
0,8
0,6
0,4
0,2
1,2
1
2003/02 2004/03 2005/04 2006/05 2007/06 2008/07
Employment - output elasticity Capacity utilizatiom
v.25 n.especial 2015 Nova Economia� 885
Beccaria & Maurizio
result of the deceleration in economic growth. This economic slowdown does not seem to have been caused, at least not to a great extent, by the economic difficulties of the industrialized world, since many countries in the region continued growing at a fast pace in 2012.Rather, the evolution of aggregate output seems to have been the result of a persistent accumu-lation of imbalances since 2007. The acceleration of inflation, the increase of the external and fiscal deficits and the loss of competitiveness derived from the currency appreciation led to a macroeconomic context that con-spired against the preservation of investment levels.
Consequently, as long as the foundations for growth are not reestab-lished, the labor market will remain stagnated and it will be very difficult to continue improving the level and quality of employment, as well as remunerations. However, even if the conditions for economic growth are reestablished, the evolution of employment will not be as dynamic as it was at the early stages of the post-convertibility period since the elasticity will be more similar to that registered in the last years.
Most of the increase recorded in the proportion of registered wage earn-ers in total employment took place in the 2005-2007 period.19 Given that a framework of economic expansion and employment growth is essential to achieve improvements in the quality of employment, it will be quite hard to advance in this front in a context of slower growth.
All in all, the positive performance of the labor market at the beginning of the post-crisis period was a result of the strong economic expansion fa-vored by the maintenance of a high real exchange rate in a context of large idle capacity and foreign currency abundance, and also of the implemen-tation of income policies that aimed to improve average remunerations and their distribution. A higher demand for labor in a context of sustained economic growth in the first five years of the new regime, together with the implementation of labor policies, led to an improvement in the quality of jobs through a process of labor formalization. On the contrary, these policies do not seem to have had an impact on the employment-output elasticity, which exhibited a gradual but sustained downward trend in the second part of the period analyzed.
The performance of real remunerations throughout the period fol-lowed the evolution of employment, since usually the expansion of real
19 This period explains 70% of the increase in the proportion of registered wage earners that took place between October 2002 and the fourth quarter of 2012.
Nova Economia� v.25 n.especial 2015886
Macroeconomic regime and labor market
incomes slows down as net job creation decelerates. In addition, this process was also affected by the acceleration of inflation that took place beginning in 2007.
All in all, by 2012 labor market indicators had reverted the negative trends of the convertibility regime and its crisis, and some indicators even surpassed the values of the early 1990s. Yet, the situation of the labor mar-ket is still not satisfactory, as for example, only half of total employment is comprised of jobs registered in the social security system. This is quite worrisome given the mentioned imbalances accumulated in the macro-economic front, which limit the possibilities of resuming a growth path and the expansion of employment in the coming years. In this context, only modest improvements are to be expected in labor market and income distribution indicators in the near future.
4 Conclusions
Argentina’s economic and social history in the 1991-2012 period has been particularly unstable. Even though the regional context has also been traditionally characterized by big fluctuations, Argentina’s expe-rience constitutes a case of particular interest for Latin America, since these two decades were very different than each other in the macroeco-nomic arrangements and the trade, production, labor and income poli-cies implemented.
The contrast is also appreciated in the developments registered in the productive and labor fields. In the 1990s, the economy functioned accord-ing to the characteristics of a currency board regime. The fluctuations in the international market were rapidly and fully transmitted to the domes-tic economy. Also, the regime went through the expected currency ap-preciation trend that ended up affecting the country’s competitiveness and severely damaging the fiscal and external accounts. The structural reforms implemented to improve productivity did not work out. As a result of this process, during its last years the convertibility regime accumulated serious imbalances that took the economy to the 2001crisis, a crisis of unprec-edented magnitude in terms of its severity and social impact.
In contrast, during the first decade of this century, Argentina’s economy grew at a fast pace and this growth had a significant positive impact on
v.25 n.especial 2015 Nova Economia� 887
Beccaria & Maurizio
employment and remunerations. The economic expansion that started to-wards the end of 2002 was enabled by the rapid restoration of an adequate macroeconomic framework, the fast reduction of inflation after the deval-uation and the improvements attained in the fiscal and external fronts. The latter were favored by a sharp increase in terms of trade and the success-ful renegotiation of the defaulted debt. Nevertheless, perhaps the main feature of the post-convertibility scheme was the success in achieving and maintaining a high and stable real exchange rate, at least until 2007. The latter increased the competitiveness of sectors that had been particularly affected by the exchange rate policy of the 1990s and favored import sub-stitution in some sectors. In a context of a large idle capacity at the begin-ning of the period, the economic expansion had a positive impact on the performance of the labor market. The achievements attained in terms of employment and incomes were also favored by an active implementation of labor, social and income policies.
However, the macroeconomic performance and the evolution of employment and incomes declined in the second half of the period un-der analysis. As a result, the Argentine experience in the post-convert-ibility period becomes relevant for the discussions around the relation-ship between the exchange rate and employment. On the one hand, it is a case that supports the voices that highlight the convenience of a high real exchange rate to favor economic growth. However, it also shows the need of coordination between the exchange rate and fiscal policies, given that after a few years public spending began to acceler-ate thus adding demand pressure over a supply that was not expand-ing at the same pace. As a result, inflation accelerated and the foreign exchange surplus shrank. The policy response consisted of making exchange rate adjustments below inflation thus leading to a currency appreciation process.
Another aspect to consider regarding the high and stable real ex-change rate policy, at least for developing countries, is that it appears to be a condition that favors but does not necessarily guarantee the diversification of the productive structure or sufficient productivity improvements to assure a process of sustained growth of output and household incomes. Yet, these productivity gains are precisely a central element to enable a sustainable growth process with improvements in income distribution.
Nova Economia� v.25 n.especial 2015888

Macroeconomic regime and labor market
References
ABOAL, D.; LANZILOTTAAND, B.; REGO, S.Uruguay y la enfermedad holandesa. In: AL-BRIEU, R.; LÓPEZ, A.; ROZENWURCEL, G. (Coord.). Los recursos naturales como palanca del desarrollo en América del Sur: ¿Ficción o Realidad?, Serie Red Mercosur Nro. 23, 2012.
CUÑA, C.; KESSLER, G.; REPETTO, F. Evolución de la política social argentina en la década de los noventa: cambios en su lógica, intencionalidad y en el proceso de hacer la política social. Documento del Proyecto Self-Sustaining Community Development in Comparative Per-spective, Universidad de Texas, Buenos Aires, 2002.
ALBORNOZ, F.; CALVO, P.; COREMBERG,A.; HEYMANN, D.; VICONDOA, A. Patrones de acumulación, comercio exterior y evolución industrial en Argentina. Boletín Techint, Nº 339, p. 47-75, 2002.
BERG, J. Laws or luck? Understanding rising formality in Brazil in the 2000s. MPRA Paper No. 43608, Munich, 2010.
CEPAL. La transformación productiva 20 años después. Viejos problemas, nuevas oportunidades. CEPAL: Santiago de Chile, 2008.
CEPAL. Balance Económico Actualizado de América Latina y el Caribe 2012. CEPAL: Santiago de Chile, 2013.
COREMBERG, A. Measuring Argentina´s GDP Growth: just stylized facts. Trabajo presentado a la XLVIII Reunión Anual de la Asociación Argentina de Economía Política (AAEP), 2013.
DAMILLl, M.; FRENKEL, R.; MAURIZIO, R. Argentina: a Decade of Currency Board: an Analy-sis of Growth, Employment and Income Distribution. International Labour Office (ILO). Employment sector, 2002.
DAMILL, M.; FRENKEL, R.; MAURIZIO, R.Políticas macroeconómicas y vulnerabilidad so-cial. La Argentina en los años noventa. Serie Financiamiento del Desarrollo Nº 135. CEPAL: Chile, 2003.
DAMILL, M.; FRENKEL, R. Macroeconomic Policies, Growth, Employment, and Inequality in Latin America. WIDER Working Paper No. 2012/23, 2012.
FERNÁNDEZ BUGNA, C.; PORTA, F. El crecimiento reciente de la industria argentina. Nue-vo régimen sin cambio estructural. Realidad Económica, n. 233, p. 17-48, 2008.
FRENKEL, R.; RAPETTI, M. Exchange rate regimes in Latin America. In: OCAMPO, J.; ROS, J. (Eds.). The Oxford Handbook of Latin American Economics. Oxford University Press: 2011, p.187-213.
LEDERMAN, D.; OLARREAGAAND, M.; PERRY, G. (Eds.). China’s and India’s challenges to Latin America. Washington: World Bank, 2009.
OCAMPO, J. La macroeconomía de la bonanza económica latinoamericana. Revista de la CEPAL, n. 93, p. 7-29, 2007.
RAPETTI, M.; SKOTAND, P.; RAZMI, A. The real exchange rate and economic growth: Are developing countries different? International Review of Applied Economics, v. 6, p.1–19, 2012.
RODRICK, D. The Real Exchange Rate and Economic Growth. Brookings Papers on Economic Activity, v. 2008, p. 365-412, 2008.
v.25 n.especial 2015 Nova Economia� 889

Beccaria & Maurizio
About the authors
Luis Beccaria - [email protected] Nacional de General Sarmiento, Argentina.
Roxana Maurizio - [email protected] Nacional de General Sarmiento y CONICET, Argentina.
About the articleSubmission received on December 04, 2013. Approved for publication on March 10, 2015.
This article is licensed under a Creative Commons Attribution 4.0 International License.Nova Economia� v.25 n.especial 2015890