Embed Size (px)
Citation preview
Permission to reprint or distribute any content from this presentation requires the prior written approval of Standard & Poor’s.Copyright (c) 2008 Standard & Poor’s, a division of The McGraw-Hill Companies, Inc. All rights reserved.
Thomas ConnellManaging DirectorStandard & Poor’s
FEI Canada Conference
Jasper, AlbertaJune 9-11, 2008
Reflections on Reflections on Reflections on Reflections on
the Credit Crunchthe Credit Crunchthe Credit Crunchthe Credit Crunch
2. Permission to reprint or distribute any content from this presentation requires the prior written approval of Standard & Poor’s.
Reflections on the Credit Crunch
1. Global Capital Markets in Transition
2. The Credit Crunch: Aspects and Outcomes
3. Lessons from the Credit Crunch
4. Where to From Here: Current Credit Market Outlook
3. Permission to reprint or distribute any content from this presentation requires the prior written approval of Standard & Poor’s.
Global Capital Markets
In Transition
4. Permission to reprint or distribute any content from this presentation requires the prior written approval of Standard & Poor’s.
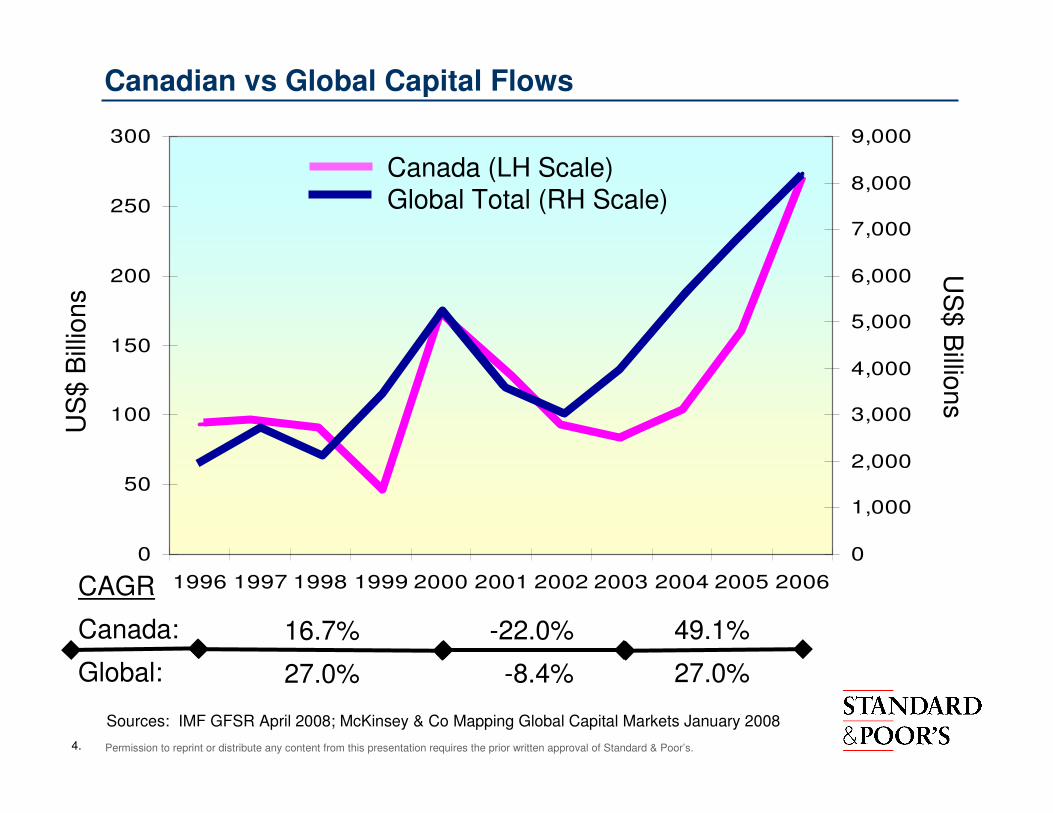
Canadian vs Global Capital Flows
0
50
100
150
200
250
300
1996 1997 1998 1999 2000 2001 2002 2003 2004 2005 2006
0
1,000
2,000
3,000
4,000
5,000
6,000
7,000
8,000
9,000
Canada (LH Scale)Global Total (RH Scale)
US
$ B
illio
ns
US
$ B
illion
s
16.7%
27.0%
-22.0%
-8.4%
49.1%
27.0%
CAGR
Canada:
Global:
Sources: IMF GFSR April 2008; McKinsey & Co Mapping Global Capital Markets January 2008
5. Permission to reprint or distribute any content from this presentation requires the prior written approval of Standard & Poor’s.
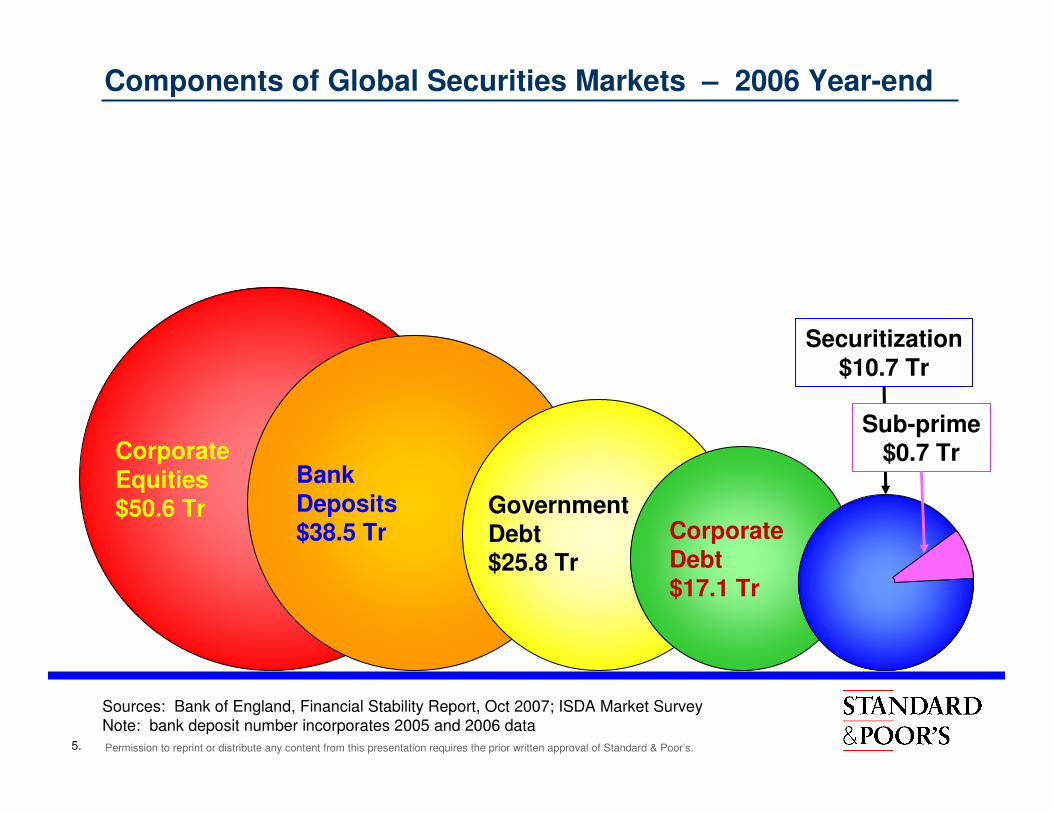
Components of Global Securities Markets – 2006 Year-end
CorporateEquities$50.6 Tr
BankDeposits$38.5 Tr
GovernmentDebt$25.8 Tr
CorporateDebt$17.1 Tr
Sub-prime$0.7 Tr
Securitization$10.7 Tr
Sources: Bank of England, Financial Stability Report, Oct 2007; ISDA Market SurveyNote: bank deposit number incorporates 2005 and 2006 data

6. Permission to reprint or distribute any content from this presentation requires the prior written approval of Standard & Poor’s.
Components of Global Securities Markets – 2006 Year-end
CorporateEquities$50.6 Tr
BankDeposits$38.5 Tr
GovernmentDebt$25.8 Tr
CorporateDebt$17.1 Tr
Sub-prime$0.7 Tr
Securitization$10.7 Tr
Notional Derivatives Outstanding
2006: $327 Tr
2007: $456 Tr
Sources: Bank of England, Financial Stability Report, Oct 2007; ISDA Market SurveyNote: bank deposit number incorporates 2005 and 2006 data
CreditDerivatives Outstanding
2007$62 Tr
7. Permission to reprint or distribute any content from this presentation requires the prior written approval of Standard & Poor’s.
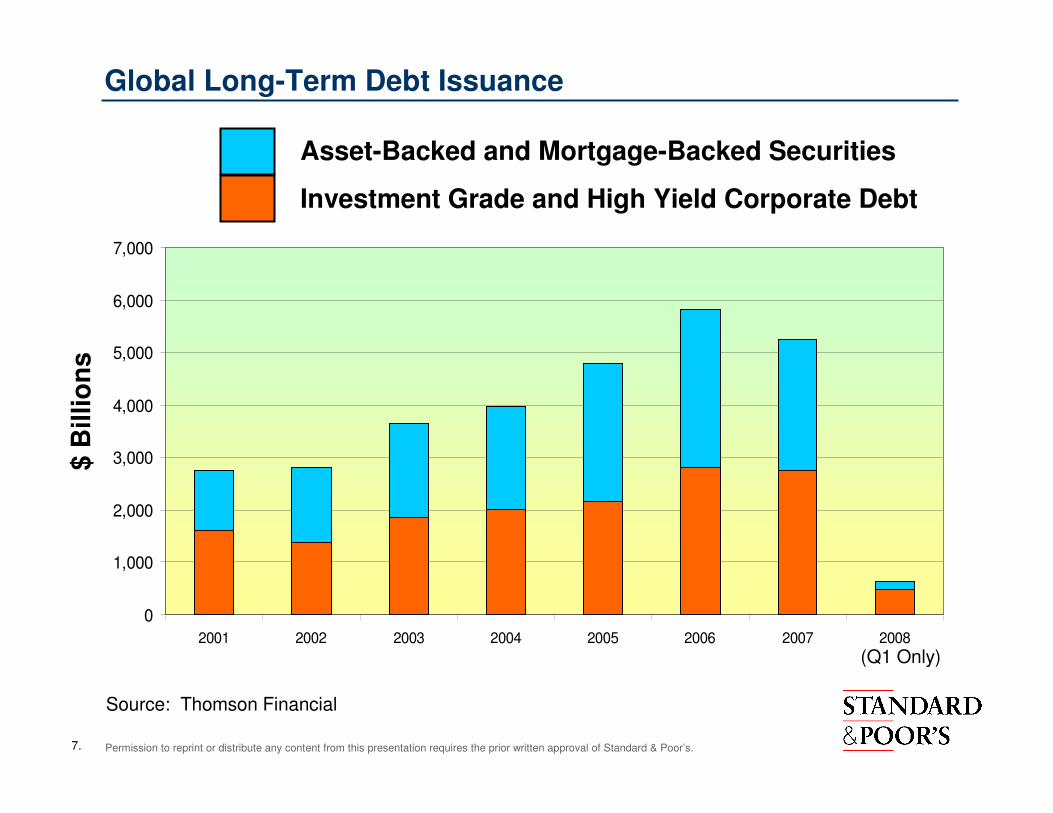
Global Long-Term Debt Issuance
0
1,000
2,000
3,000
4,000
5,000
6,000
7,000
2001 2002 2003 2004 2005 2006 2007 2008
Asset-Backed and Mortgage-Backed Securities
Investment Grade and High Yield Corporate Debt
$ B
illio
ns
Source: Thomson Financial
(Q1 Only)
8. Permission to reprint or distribute any content from this presentation requires the prior written approval of Standard & Poor’s.
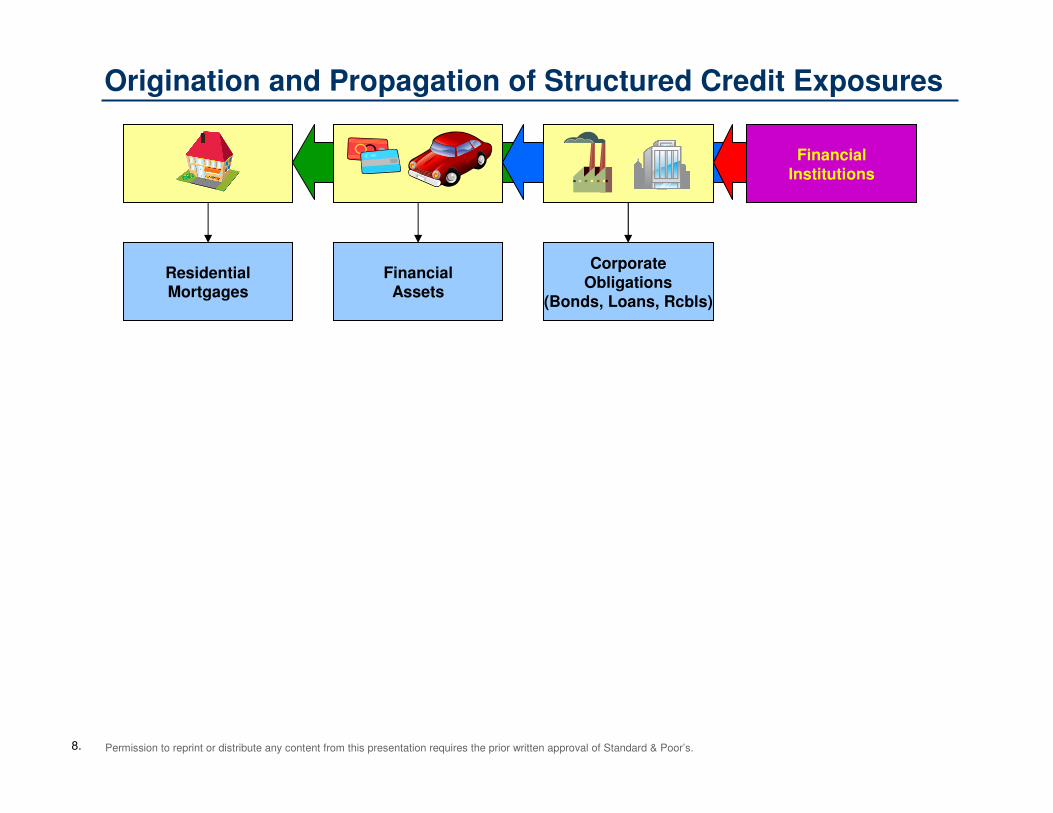
ResidentialMortgages
CorporateObligations
(Bonds, Loans, Rcbls)
FinancialAssets
FinancialInstitutions
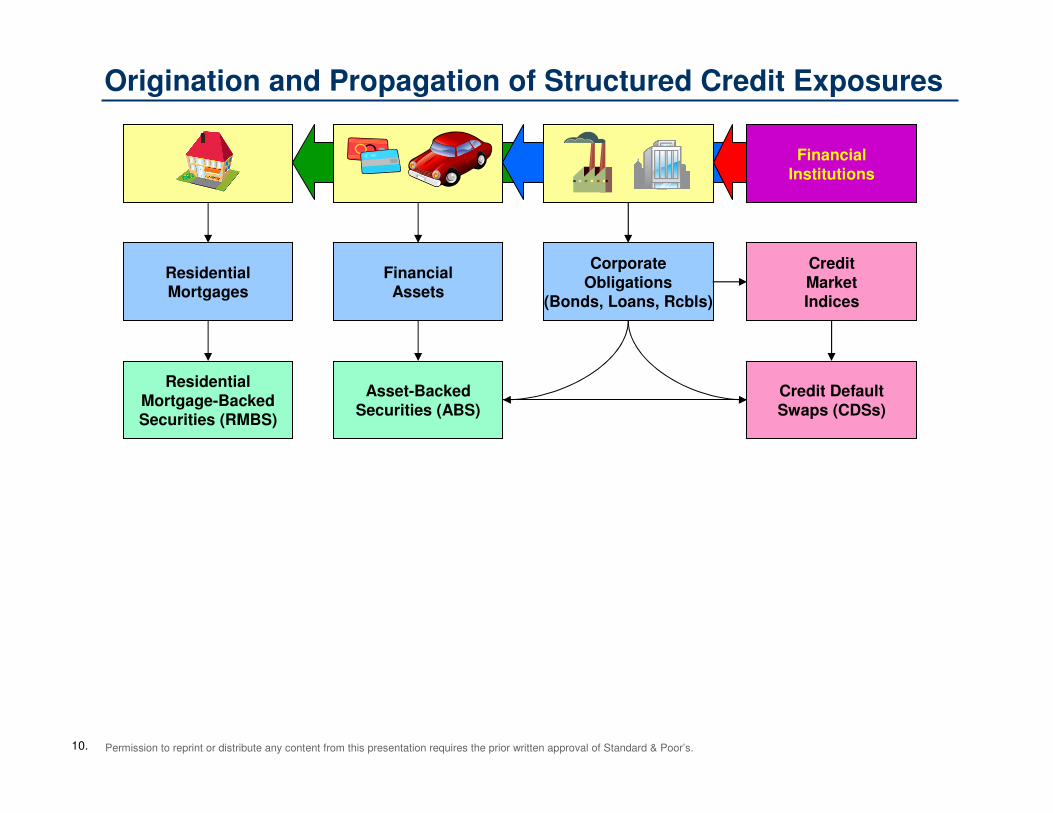
Origination and Propagation of Structured Credit Exposures
9. Permission to reprint or distribute any content from this presentation requires the prior written approval of Standard & Poor’s.
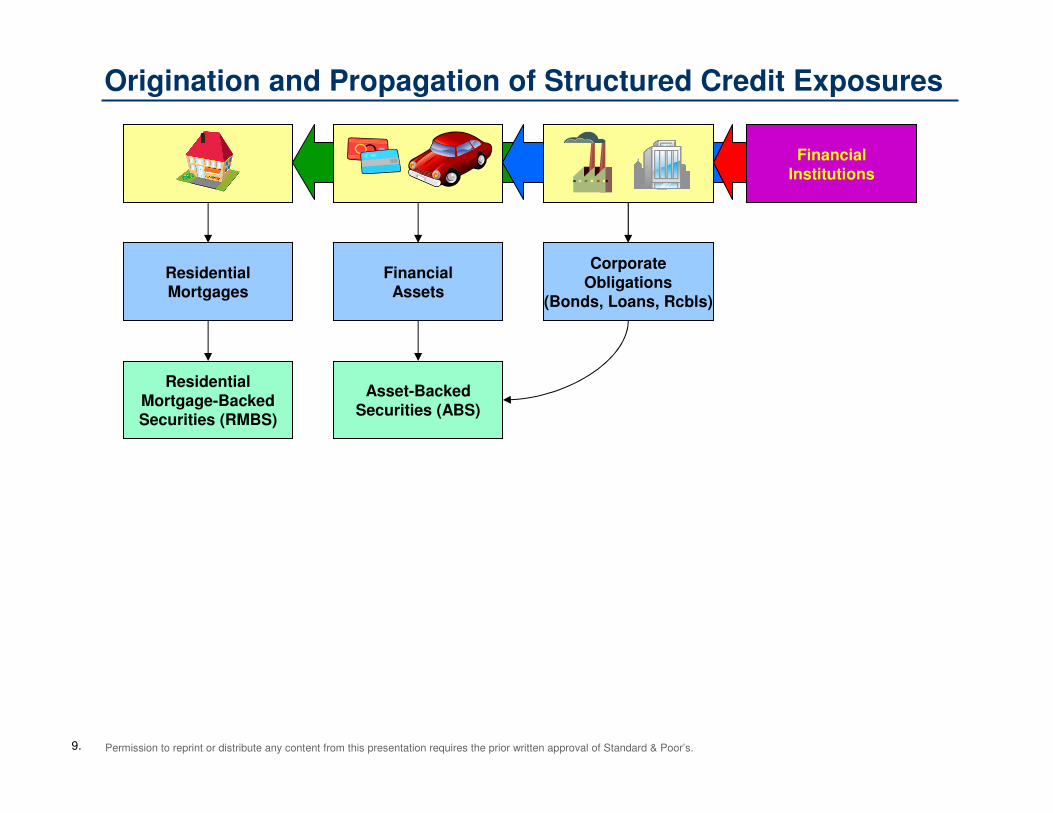
ResidentialMortgage-BackedSecurities (RMBS)
ResidentialMortgages
CorporateObligations
(Bonds, Loans, Rcbls)
Asset-BackedSecurities (ABS)
FinancialAssets
FinancialInstitutions
Origination and Propagation of Structured Credit Exposures
10. Permission to reprint or distribute any content from this presentation requires the prior written approval of Standard & Poor’s.
ResidentialMortgage-BackedSecurities (RMBS)
Credit DefaultSwaps (CDSs)
ResidentialMortgages
CorporateObligations
(Bonds, Loans, Rcbls)
CreditMarketIndices
Asset-BackedSecurities (ABS)
FinancialAssets
FinancialInstitutions
Origination and Propagation of Structured Credit Exposures
11. Permission to reprint or distribute any content from this presentation requires the prior written approval of Standard & Poor’s.
ResidentialMortgage-BackedSecurities (RMBS)
CollateralizedDebt Obligations
(CDOs)
Credit DefaultSwaps (CDSs)
Synthetic CDOs
ResidentialMortgages
CorporateObligations
(Bonds, Loans, Rcbls)
CreditMarketIndices
Asset-BackedSecurities (ABS)
FinancialAssets
CDO2
ABCPEtc.
FinancialInstitutions
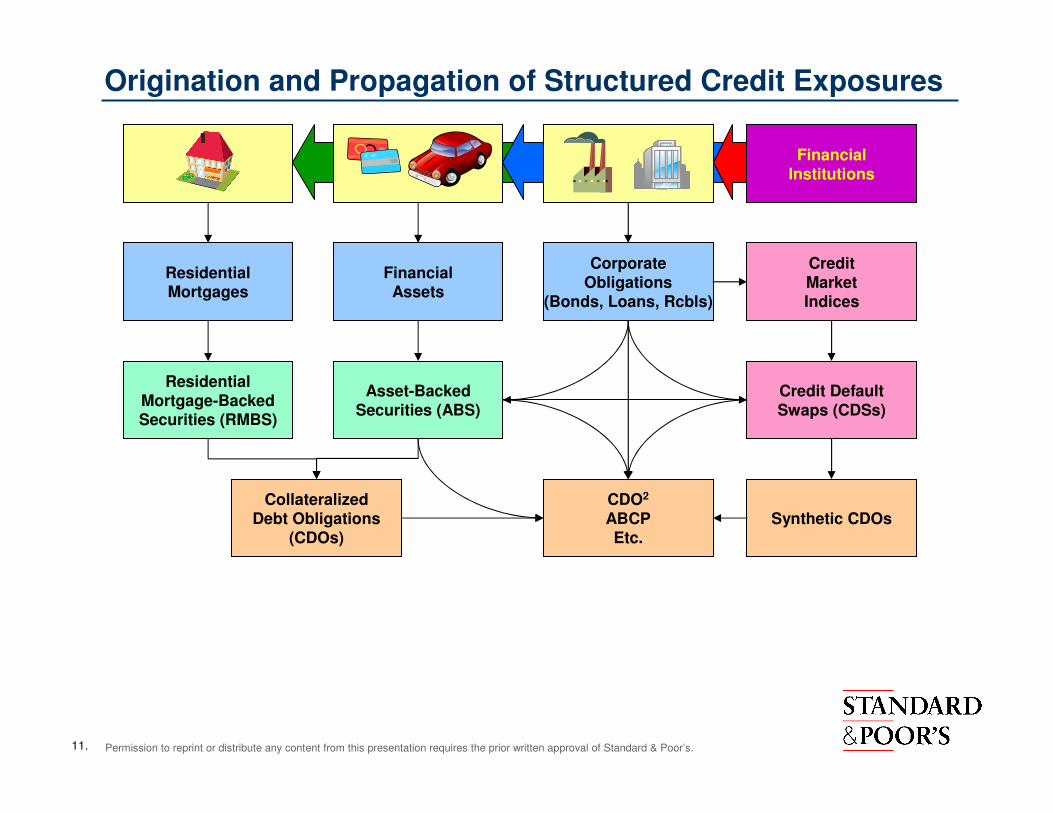
Origination and Propagation of Structured Credit Exposures
12. Permission to reprint or distribute any content from this presentation requires the prior written approval of Standard & Poor’s.
ResidentialMortgage-BackedSecurities (RMBS)
CollateralizedDebt Obligations
(CDOs)
Credit DefaultSwaps (CDSs)
Synthetic CDOs
ResidentialMortgages
CorporateObligations
(Bonds, Loans, Rcbls)
CreditMarketIndices
Asset-BackedSecurities (ABS)
FinancialAssets
CDO2
ABCPEtc.
FinancialInstitutions
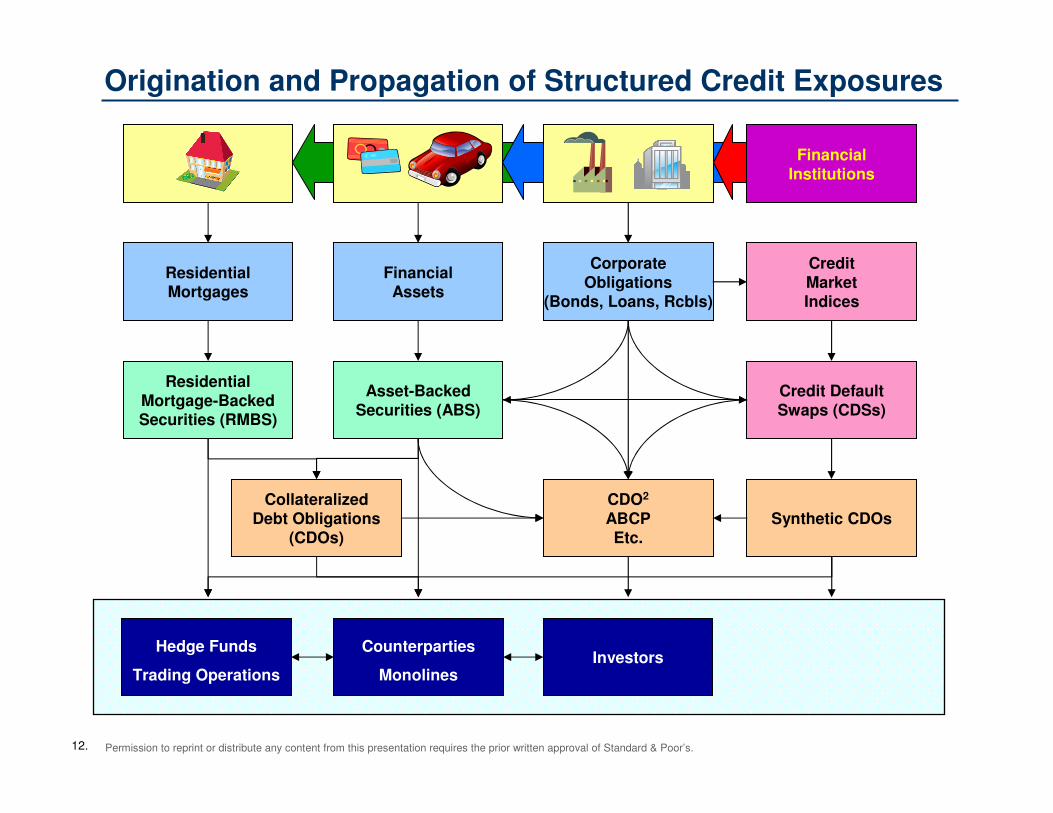
Origination and Propagation of Structured Credit Exposures
Counterparties
MonolinesInvestors
Hedge Funds
Trading Operations
13. Permission to reprint or distribute any content from this presentation requires the prior written approval of Standard & Poor’s.
ResidentialMortgage-BackedSecurities (RMBS)
CollateralizedDebt Obligations
(CDOs)
Credit DefaultSwaps (CDSs)
Synthetic CDOs
ResidentialMortgages
CorporateObligations
(Bonds, Loans, Rcbls)
CreditMarketIndices
Asset-BackedSecurities (ABS)
FinancialAssets
CDO2
ABCPEtc.
FinancialInstitutions
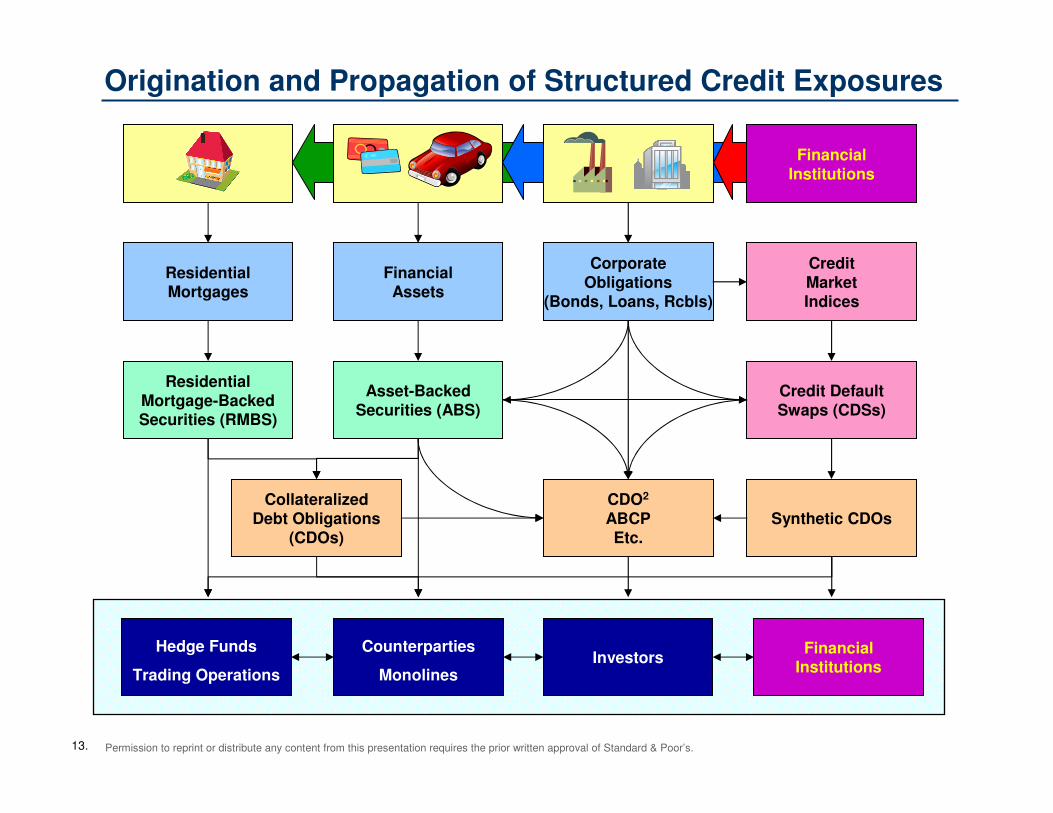
Origination and Propagation of Structured Credit Exposures
Counterparties
Monolines
FinancialInstitutions
InvestorsHedge Funds
Trading Operations

14. Permission to reprint or distribute any content from this presentation requires the prior written approval of Standard & Poor’s.
ResidentialMortgage-BackedSecurities (RMBS)
CollateralizedDebt Obligations
(CDOs)
Credit DefaultSwaps (CDSs)
Synthetic CDOs
ResidentialMortgages
CorporateObligations
(Bonds, Loans, Rcbls)
CreditMarketIndices
Asset-BackedSecurities (ABS)
FinancialAssets
CDO2
ABCPEtc.
FinancialInstitutions
Origination and Propagation of Structured Credit Exposures
Counterparties
Monolines
FinancialInstitutions
InvestorsHedge Funds
Trading Operations
15. Permission to reprint or distribute any content from this presentation requires the prior written approval of Standard & Poor’s.
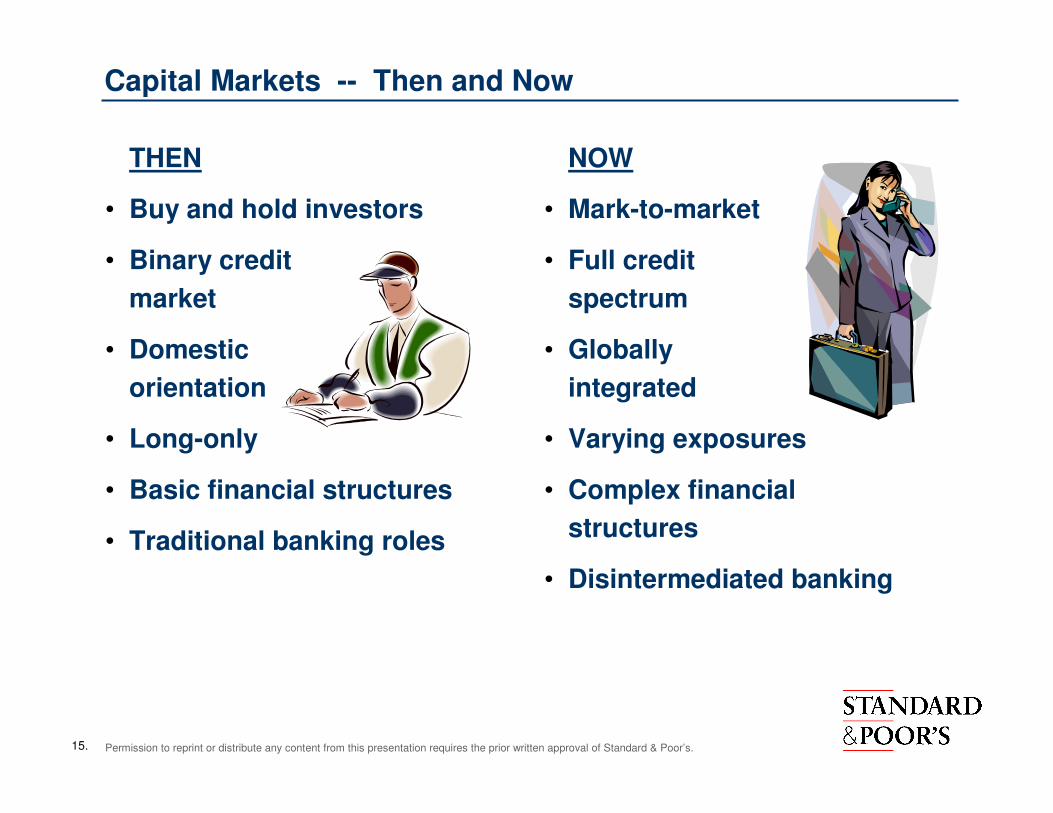
Capital Markets -- Then and Now
THEN
• Buy and hold investors
• Binary credit
market
• Domestic
orientation
• Long-only
• Basic financial structures
• Traditional banking roles
NOW
• Mark-to-market
• Full credit
spectrum
• Globally
integrated
• Varying exposures
• Complex financial
structures
• Disintermediated banking
16. Permission to reprint or distribute any content from this presentation requires the prior written approval of Standard & Poor’s.
Credit Crunch: Aspects and Outcomes
17. Permission to reprint or distribute any content from this presentation requires the prior written approval of Standard & Poor’s.
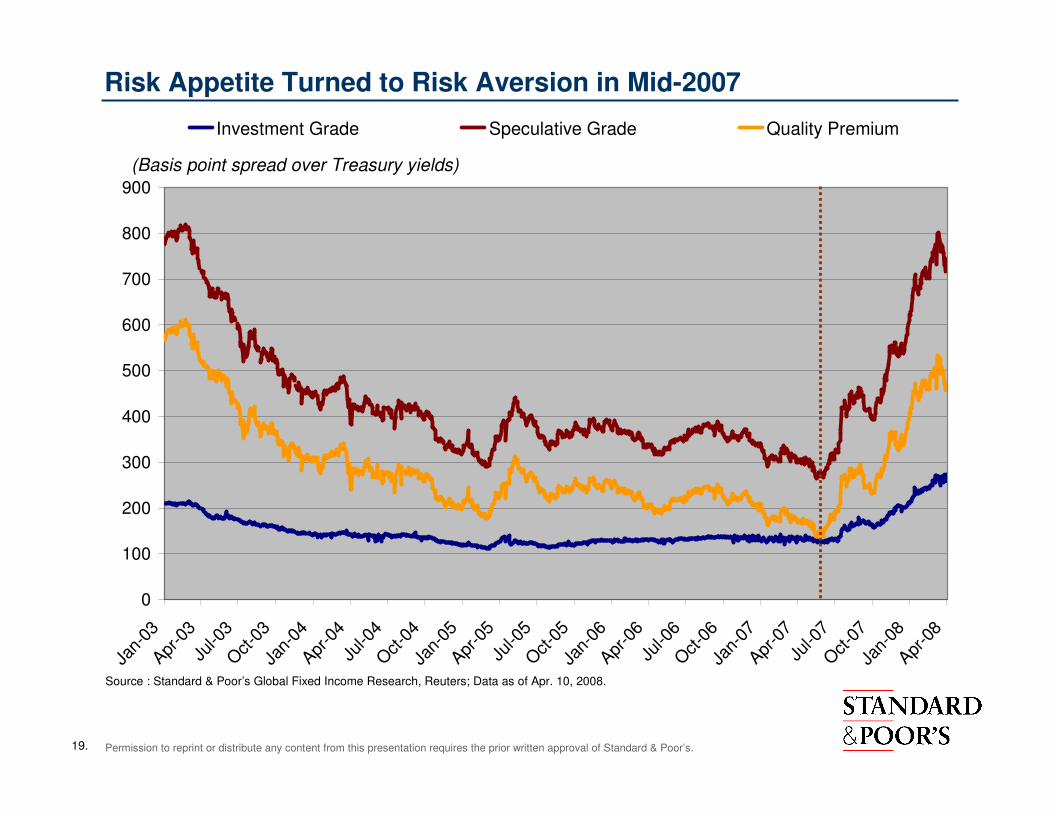
Global Credit Turmoil: Underlying Performance Drivers
• Overall environment: expanding market appetite for risk;
declining risk spreads (2003 through mid-2007)
• 2006/2007: sub-prime mortgage securitization performance
deterioration and rating actions
• Mid-2007: widespread reassessment of risk tolerances,
prompted by U.S. sub-prime RMBS performance
• Consequential (e.g. mark-to-market) impact on structured credit
vehicles and financial intermediaries (banks, hedge funds, bond
insurers, etc.)
• Canadian market impact: primarily ABCP, and entities with
related exposures
18. Permission to reprint or distribute any content from this presentation requires the prior written approval of Standard & Poor’s.
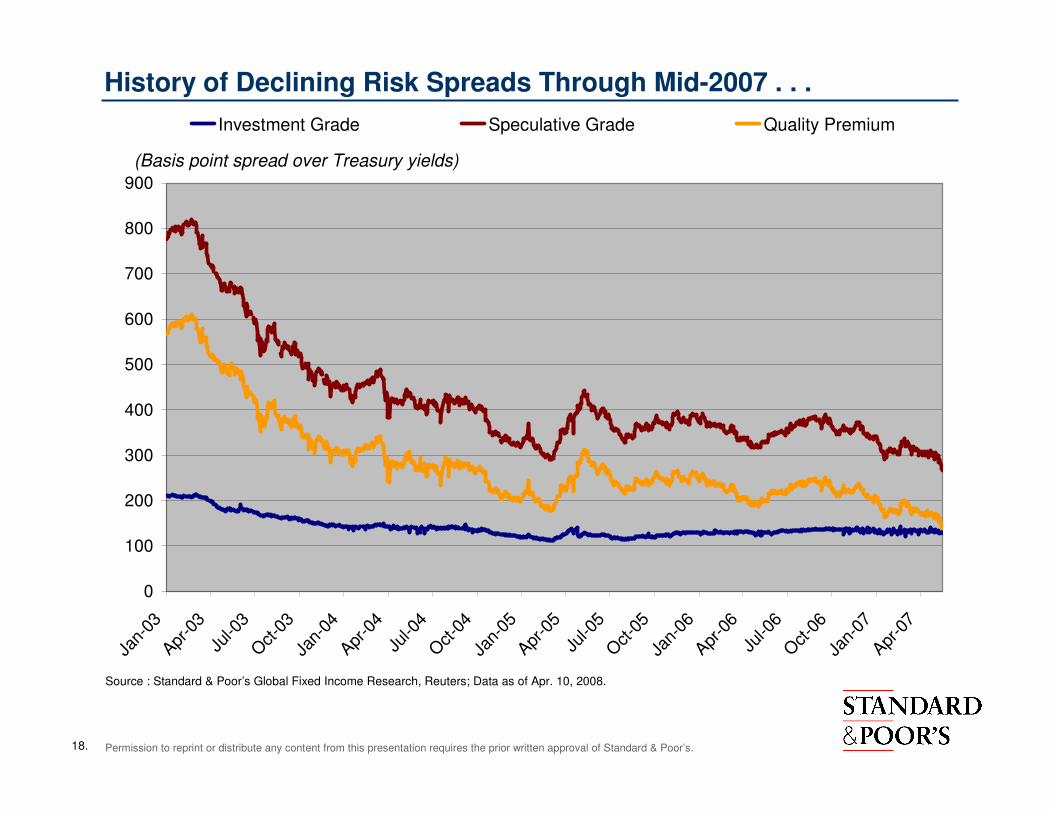
History of Declining Risk Spreads Through Mid-2007 . . .
Source : Standard & Poor’s Global Fixed Income Research, Reuters; Data as of Apr. 10, 2008.
0
100
200
300
400
500
600
700
800
900
Jan-
03Apr
-03
Jul-0
3O
ct-0
3Ja
n-04
Apr-0
4Ju
l-04
Oct
-04
Jan-
05Apr
-05
Jul-0
5O
ct-0
5Ja
n-06
Apr-0
6Ju
l-06
Oct
-06
Jan-
07Apr
-07
Investment Grade Speculative Grade Quality Premium
(Basis point spread over Treasury yields)
19. Permission to reprint or distribute any content from this presentation requires the prior written approval of Standard & Poor’s.
Risk Appetite Turned to Risk Aversion in Mid-2007
Source : Standard & Poor’s Global Fixed Income Research, Reuters; Data as of Apr. 10, 2008.
0
100
200
300
400
500
600
700
800
900
Jan-
03Apr
-03
Jul-0
3O
ct-0
3Ja
n-04
Apr-0
4Ju
l-04
Oct
-04
Jan-
05Apr
-05
Jul-0
5O
ct-0
5Ja
n-06
Apr-0
6Ju
l-06
Oct
-06
Jan-
07Apr
-07
Jul-0
7O
ct-0
7Ja
n-08
Apr-0
8Investment Grade Speculative Grade Quality Premium
(Basis point spread over Treasury yields)
20. Permission to reprint or distribute any content from this presentation requires the prior written approval of Standard & Poor’s.
0
200
400
600
800
1,000
1,200
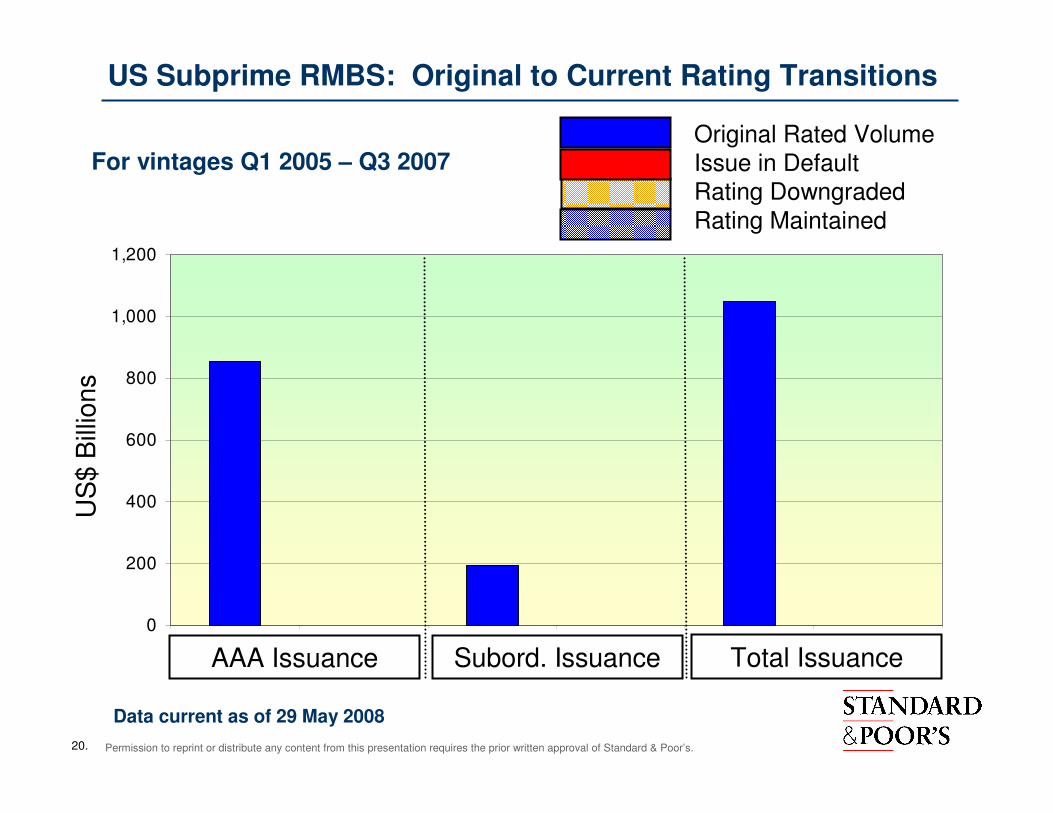
US Subprime RMBS: Original to Current Rating Transitions
For vintages Q1 2005 – Q3 2007
AAA Issuance Subord. Issuance Total Issuance
US
$ B
illio
ns
Data current as of 29 May 2008
Original Rated VolumeIssue in DefaultRating DowngradedRating Maintained
21. Permission to reprint or distribute any content from this presentation requires the prior written approval of Standard & Poor’s.
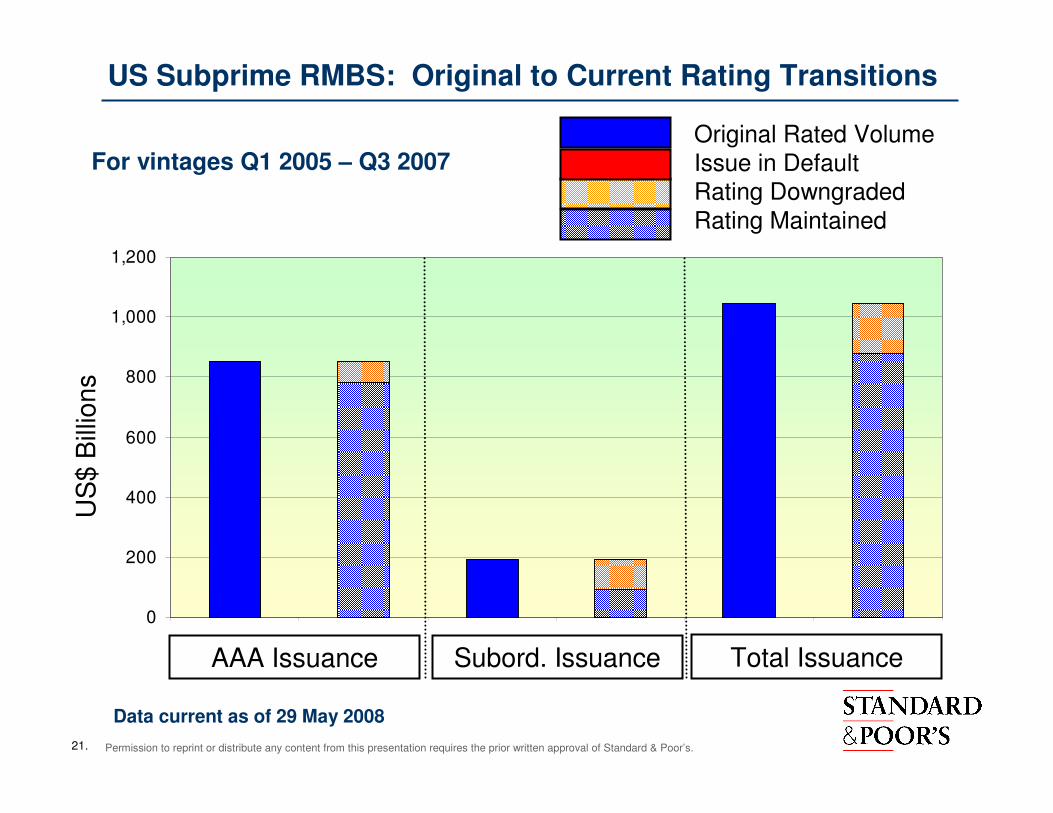
US Subprime RMBS: Original to Current Rating Transitions
0
200
400
600
800
1,000
1,200
AAA AAA' Subord Subord' Total Total'
For vintages Q1 2005 – Q3 2007Original Rated VolumeIssue in DefaultRating DowngradedRating Maintained
AAA Issuance Subord. Issuance Total Issuance
US
$ B
illio
ns
Data current as of 29 May 2008
22. Permission to reprint or distribute any content from this presentation requires the prior written approval of Standard & Poor’s.
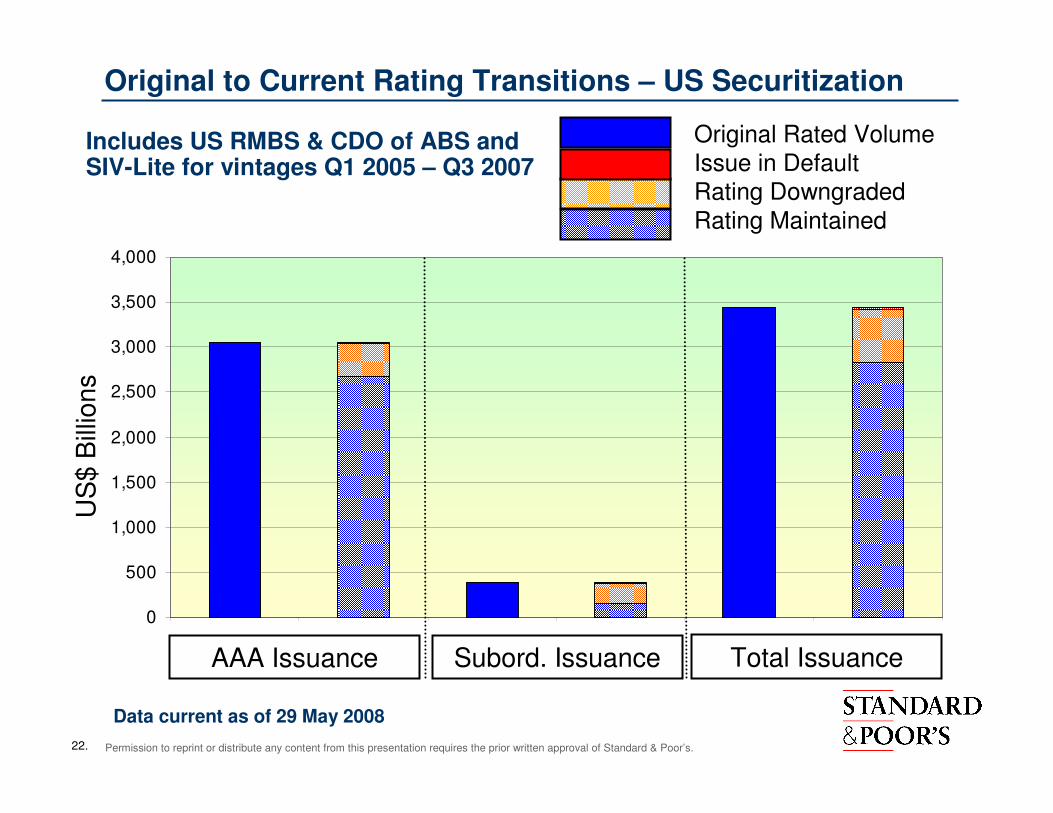
Original to Current Rating Transitions – US Securitization
0
500
1,000
1,500
2,000
2,500
3,000
3,500
4,000
1 2 3 4 5 6
Includes US RMBS & CDO of ABS and SIV-Lite for vintages Q1 2005 – Q3 2007
US
$ B
illio
ns
AAA Issuance Subord. Issuance Total Issuance
Data current as of 29 May 2008
Original Rated VolumeIssue in DefaultRating DowngradedRating Maintained
23. Permission to reprint or distribute any content from this presentation requires the prior written approval of Standard & Poor’s.
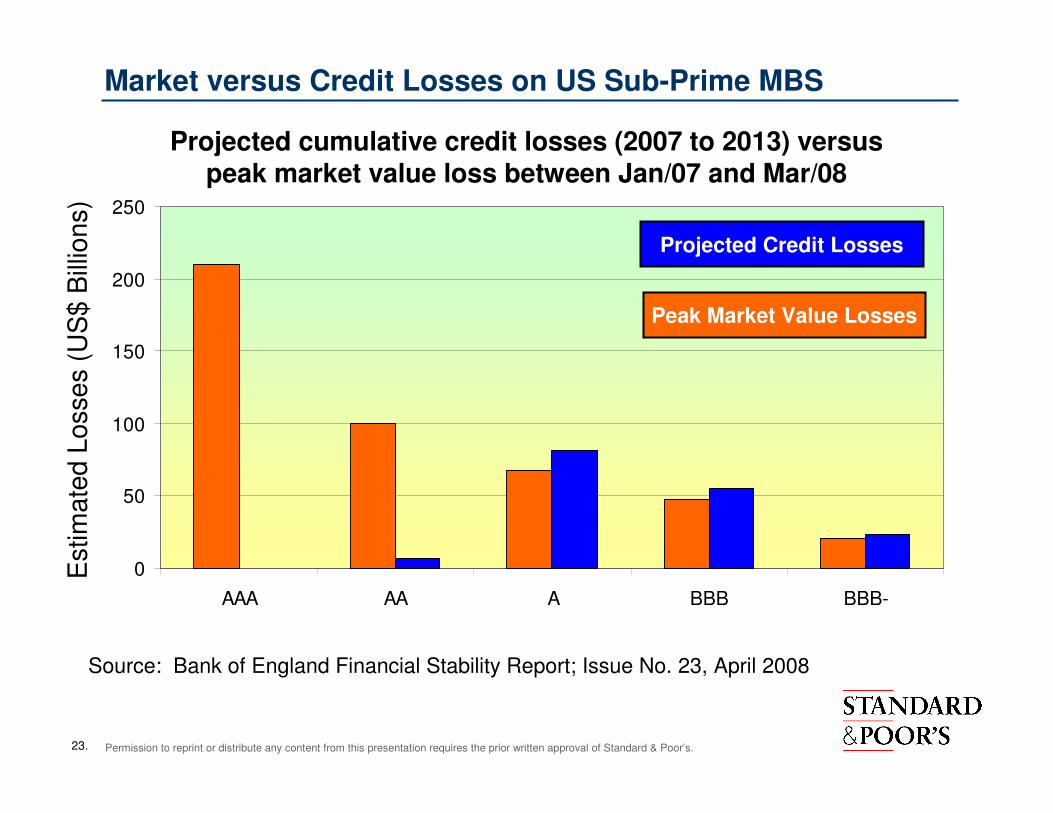
Market versus Credit Losses on US Sub-Prime MBS
0
50
100
150
200
250
AAA AA A BBB BBB-
Estim
ate
d L
osse
s (
US
$ B
illio
ns)
Peak Market Value Losses
Projected Credit Losses
Source: Bank of England Financial Stability Report; Issue No. 23, April 2008
Projected cumulative credit losses (2007 to 2013) versuspeak market value loss between Jan/07 and Mar/08
24. Permission to reprint or distribute any content from this presentation requires the prior written approval of Standard & Poor’s.
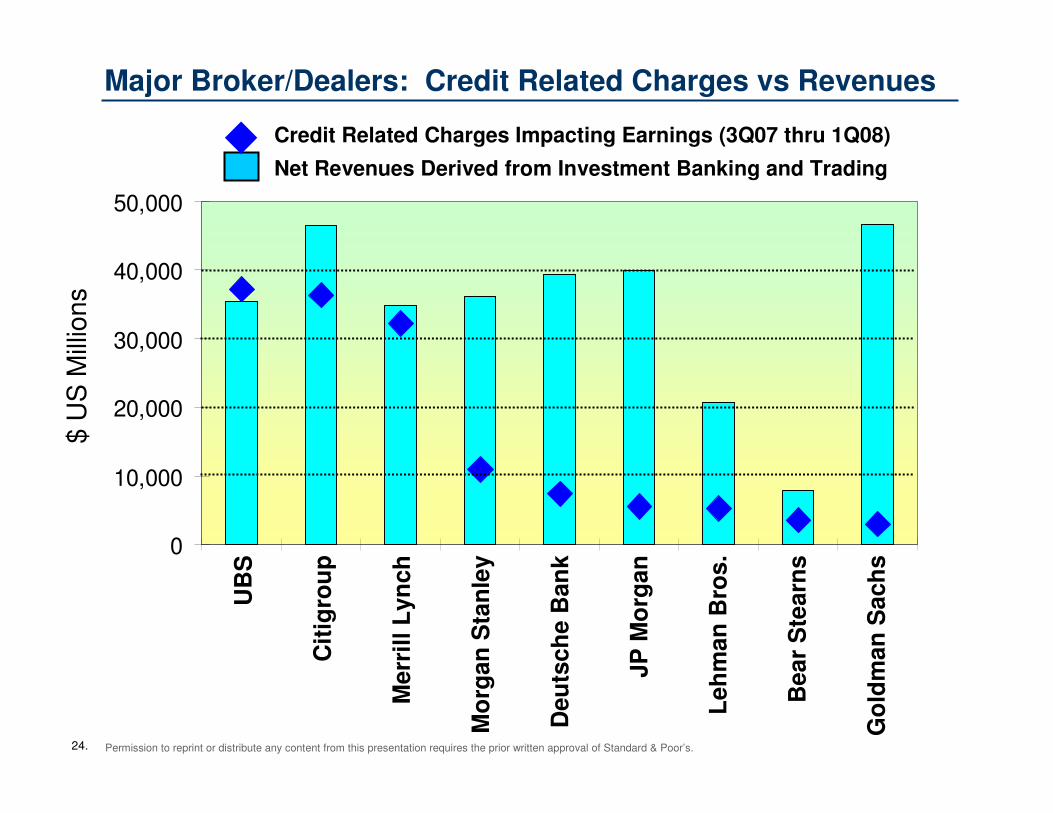
Major Broker/Dealers: Credit Related Charges vs Revenues
0
10,000
20,000
30,000
40,000
50,000
UB
S
Cit
igro
up
Merr
ill
Lyn
ch
Mo
rgan
Sta
nle
y
Deu
tsch
e B
an
k
JP
Mo
rgan
Leh
man
Bro
s.
Bear
Ste
arn
s
Go
ldm
an
Sach
s
$ U
S M
illio
ns
Credit Related Charges Impacting Earnings (3Q07 thru 1Q08)
Net Revenues Derived from Investment Banking and Trading
25. Permission to reprint or distribute any content from this presentation requires the prior written approval of Standard & Poor’s.
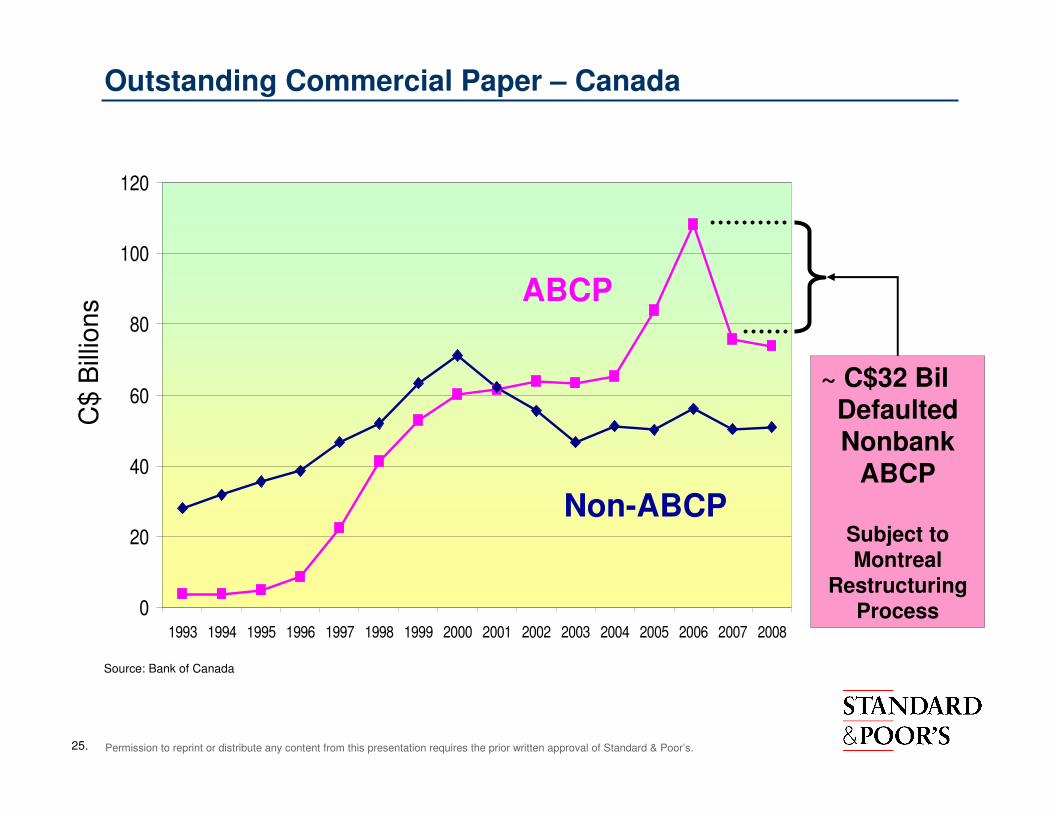
Outstanding Commercial Paper – Canada
Source: Bank of Canada
0
20
40
60
80
100
120
1993 1994 1995 1996 1997 1998 1999 2000 2001 2002 2003 2004 2005 2006 2007 2008
Non-ABCP
ABCP
C$
Bill
ion
s
~ C$32 BilDefaultedNonbank
ABCP
Subject toMontreal
RestructuringProcess
26. Permission to reprint or distribute any content from this presentation requires the prior written approval of Standard & Poor’s.
Lessons from the Credit Crunch
27. Permission to reprint or distribute any content from this presentation requires the prior written approval of Standard & Poor’s.
Lessons Learned: Capital Markets Overall
• Tendencies in “new” financial industry for excessive leverage and
risk creation
• Challenges of risk management practices in complex,
interdependent financial system
• Heightened emphasis on transparency
• Challenges of liquidity management in global capital markets
• Implications of fair value accounting
• Role of credit ratings and related analytics versus in-house risk
review processes
28. Permission to reprint or distribute any content from this presentation requires the prior written approval of Standard & Poor’s.
Lessons Learned: Credit Rating Agencies
• Continue to review and, if necessary, revise assumptions and
methodologies in light of industry developments and ratings
transition/default performance
• Clarify differentiation of default risk (addressed by ratings) from
other risks (market value, issue liquidity) not addressed in ratings
• Examine merits of including a subscript with structured finance
ratings to differentiate them from other (e.g. corporate,
government) credits
• Respond to need for disclosure associated with complex,
structured credits
• Enhance market confidence in rating agency processes
• Work with regulators and other market participants
29. Permission to reprint or distribute any content from this presentation requires the prior written approval of Standard & Poor’s.
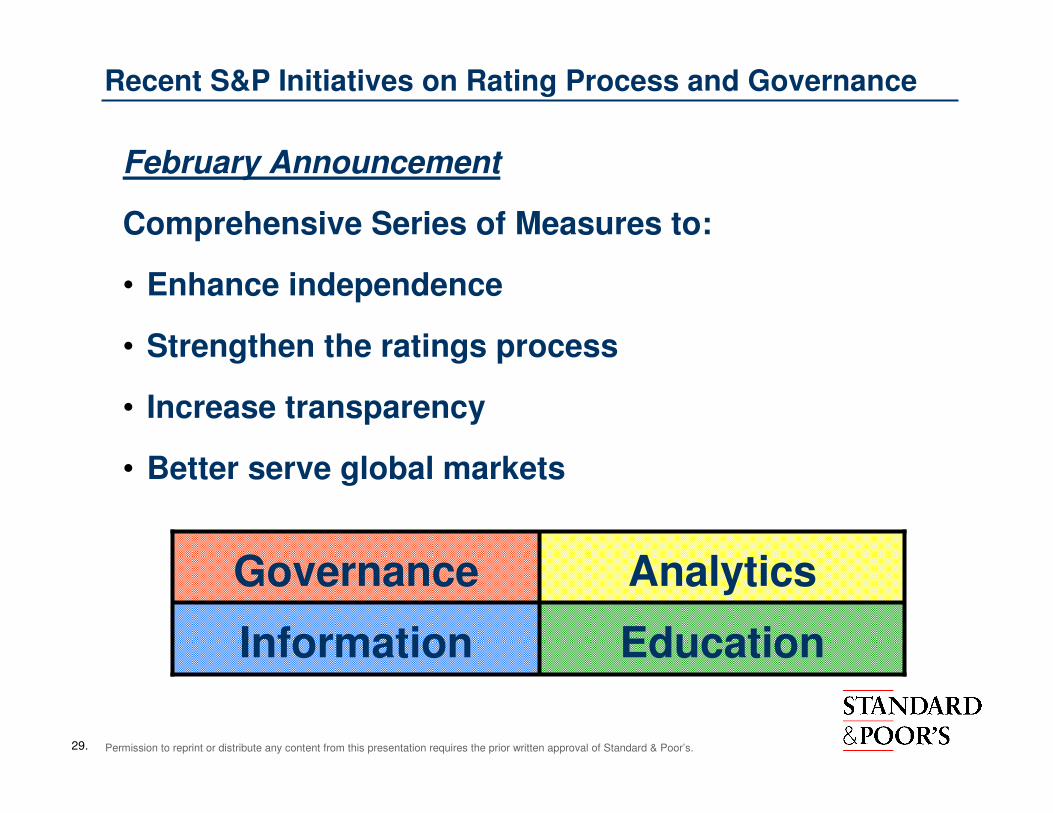
Recent S&P Initiatives on Rating Process and Governance
February Announcement
Comprehensive Series of Measures to:
• Enhance independence
• Strengthen the ratings process
• Increase transparency
• Better serve global markets
EducationInformation
AnalyticsGovernance
30. Permission to reprint or distribute any content from this presentation requires the prior written approval of Standard & Poor’s.
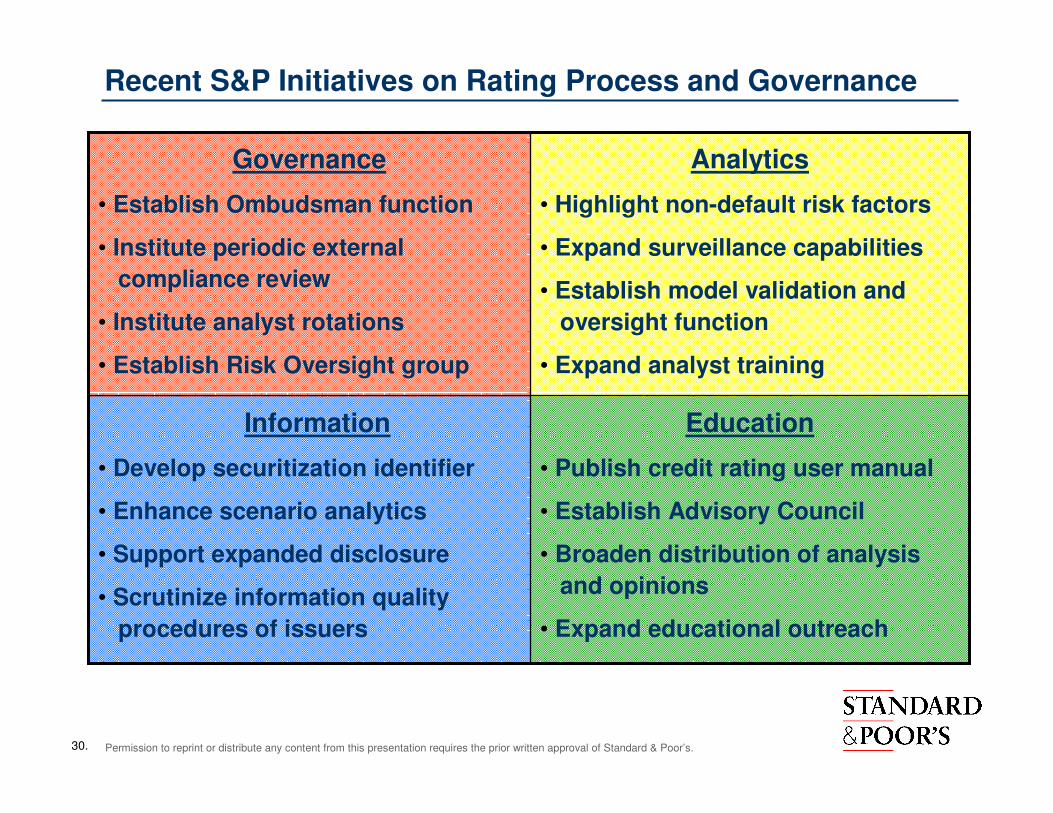
Recent S&P Initiatives on Rating Process and Governance
Education
• Publish credit rating user manual
• Establish Advisory Council
• Broaden distribution of analysis
and opinions
• Expand educational outreach
Information
• Develop securitization identifier
• Enhance scenario analytics
• Support expanded disclosure
• Scrutinize information quality
procedures of issuers
Analytics
• Highlight non-default risk factors
• Expand surveillance capabilities
• Establish model validation and
oversight function
• Expand analyst training
Governance
• Establish Ombudsman function
• Institute periodic external
compliance review
• Institute analyst rotations
• Establish Risk Oversight group
31. Permission to reprint or distribute any content from this presentation requires the prior written approval of Standard & Poor’s.
Credit Outlook
32. Permission to reprint or distribute any content from this presentation requires the prior written approval of Standard & Poor’s.
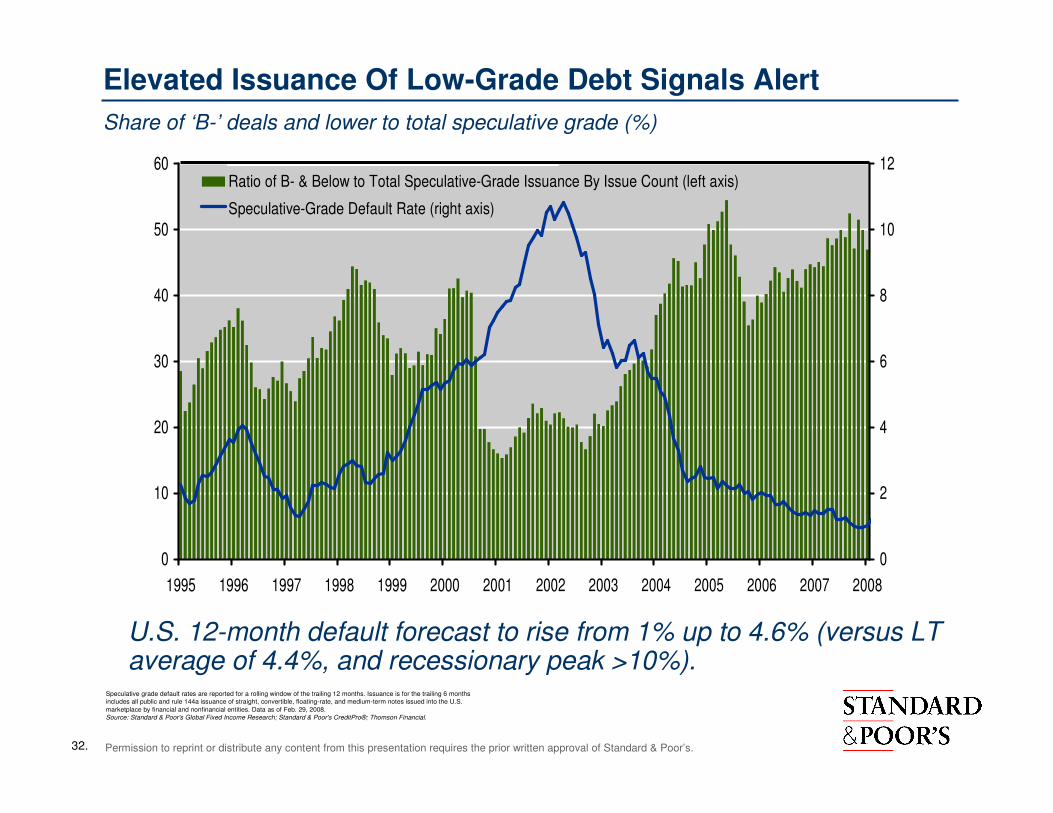
Elevated Issuance Of Low-Grade Debt Signals Alert
Share of ‘B-’ deals and lower to total speculative grade (%)
U.S. 12-month default forecast to rise from 1% up to 4.6% (versus LT average of 4.4%, and recessionary peak >10%).
0
10
20
30
40
50
60
1995 1996 1997 1998 1999 2000 2001 2002 2003 2004 2005 2006 2007 2008
0
2
4
6
8
10
12Speculative-Grade Default Rate (right axis)
Ratio of B- & Below to Total Speculative-Grade Issuance By Issue Count (left axis)
Speculative-Grade Default Rate (right axis)
Speculative grade default rates are reported for a rolling window of the trailing 12 months. Issuance is for the trailing 6 months includes all public and rule 144a issuance of straight, convertible, floating-rate, and medium-term notes issued into the U.S.
marketplace by financial and nonfinancial entities. Data as of Feb. 29, 2008.Source: Standard & Poor's Global Fixed Income Research; Standard & Poor's CreditPro®; Thomson Financial.
33. Permission to reprint or distribute any content from this presentation requires the prior written approval of Standard & Poor’s.
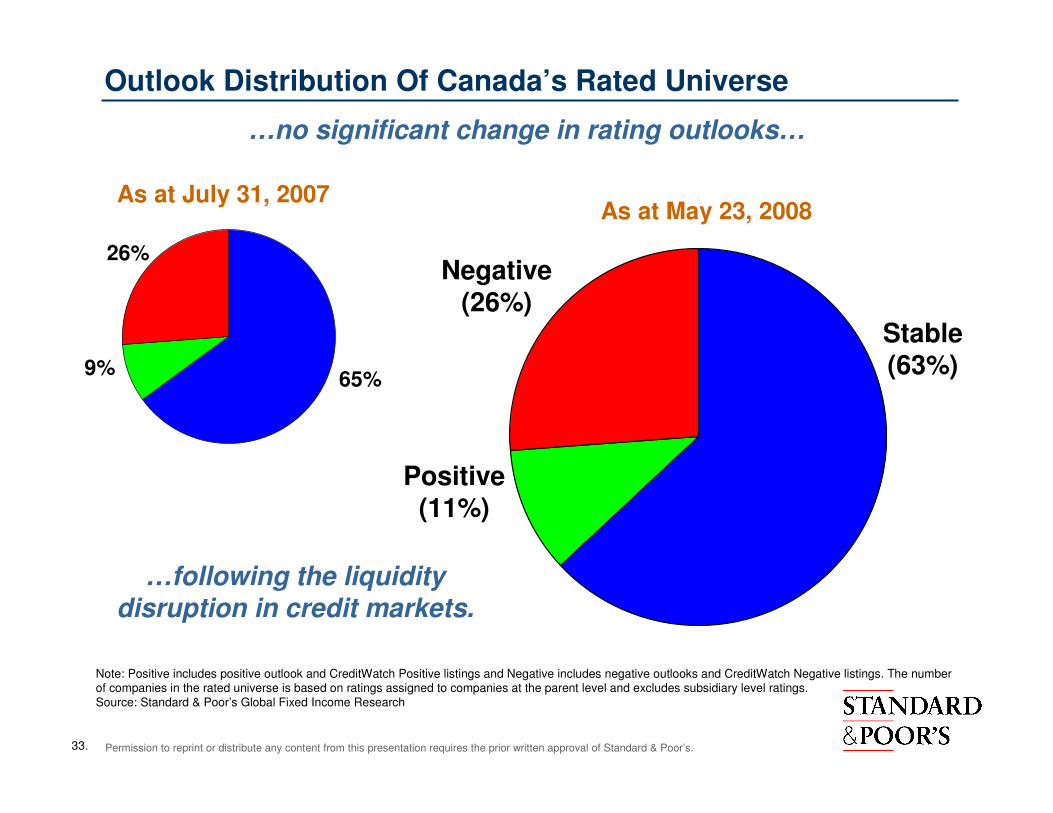
Outlook Distribution Of Canada’s Rated Universe
…no significant change in rating outlooks…
As at July 31, 2007As at May 23, 2008
…following the liquiditydisruption in credit markets.
Note: Positive includes positive outlook and CreditWatch Positive listings and Negative includes negative outlooks and CreditWatch Negative listings. The number of companies in the rated universe is based on ratings assigned to companies at the parent level and excludes subsidiary level ratings.Source: Standard & Poor’s Global Fixed Income Research
Negative(26%)
Stable(63%)
Positive(11%)
26%
9%65%
34. Permission to reprint or distribute any content from this presentation requires the prior written approval of Standard & Poor’s.
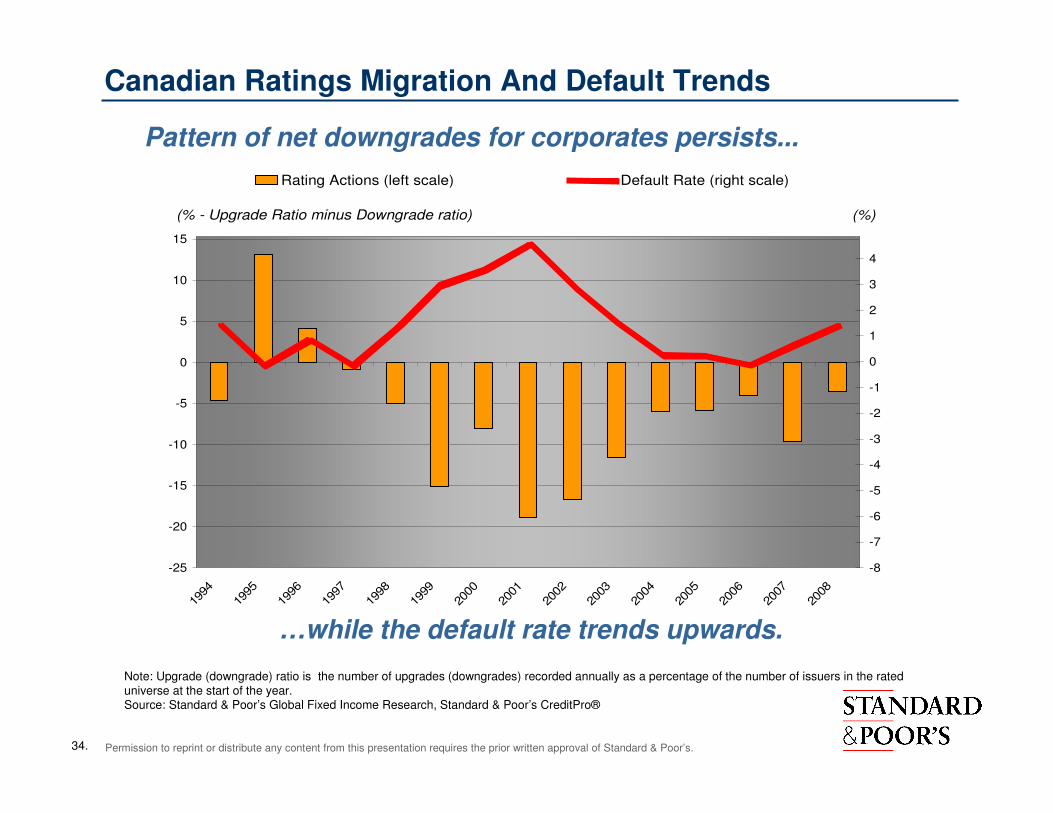
Canadian Ratings Migration And Default Trends
Note: Upgrade (downgrade) ratio is the number of upgrades (downgrades) recorded annually as a percentage of the number of issuers in the rated universe at the start of the year. Source: Standard & Poor’s Global Fixed Income Research, Standard & Poor’s CreditPro®
Pattern of net downgrades for corporates persists...
…while the default rate trends upwards.
-25
-20
-15
-10
-5
0
5
10
15
1994
1995
1996
1997
1998
1999
2000
2001
2002
2003
2004
2005
2006
2007
2008
-8
-7
-6
-5
-4
-3
-2
-1
0
1
2
3
4
Rating Actions (left scale) Default Rate (right scale)
(% - Upgrade Ratio minus Downgrade ratio) (%)
35. Permission to reprint or distribute any content from this presentation requires the prior written approval of Standard & Poor’s.
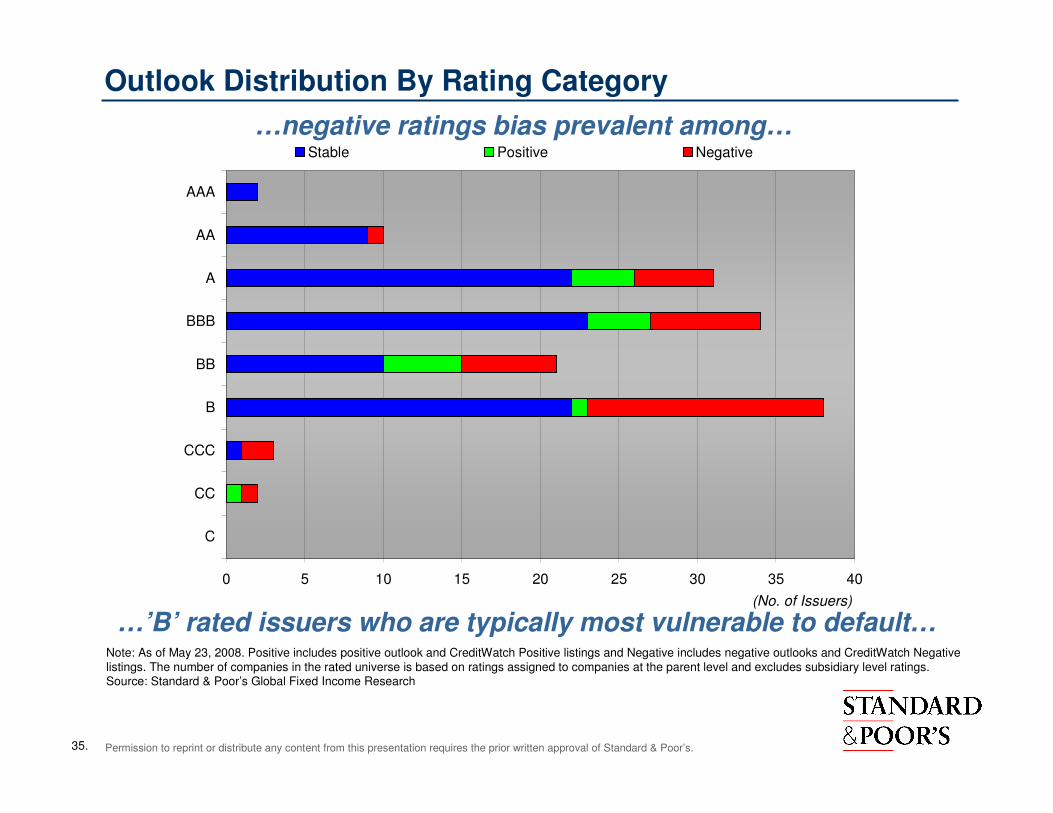
Outlook Distribution By Rating Category
…’B’ rated issuers who are typically most vulnerable to default…
…negative ratings bias prevalent among…
Note: As of May 23, 2008. Positive includes positive outlook and CreditWatch Positive listings and Negative includes negative outlooks and CreditWatch Negative listings. The number of companies in the rated universe is based on ratings assigned to companies at the parent level and excludes subsidiary level ratings.Source: Standard & Poor’s Global Fixed Income Research
0 5 10 15 20 25 30 35 40
AAA
AA
A
BBB
BB
B
CCC
CC
C
Stable Positive Negative
(No. of Issuers)
36. Permission to reprint or distribute any content from this presentation requires the prior written approval of Standard & Poor’s.
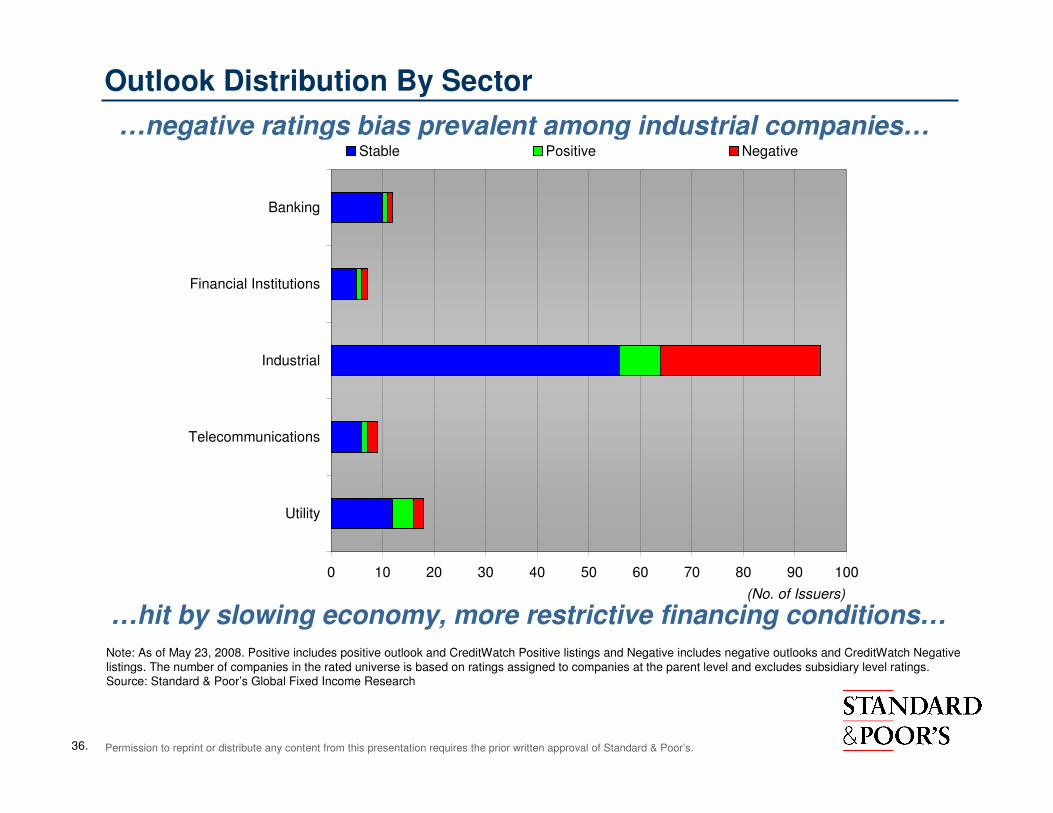
Outlook Distribution By Sector
Note: As of May 23, 2008. Positive includes positive outlook and CreditWatch Positive listings and Negative includes negative outlooks and CreditWatch Negative listings. The number of companies in the rated universe is based on ratings assigned to companies at the parent level and excludes subsidiary level ratings.Source: Standard & Poor’s Global Fixed Income Research
…negative ratings bias prevalent among industrial companies…
…hit by slowing economy, more restrictive financing conditions…
0 10 20 30 40 50 60 70 80 90 100
Banking
Financial Institutions
Industrial
Telecommunications
Utility
Stable Positive Negative
(No. of Issuers)
37. Permission to reprint or distribute any content from this presentation requires the prior written approval of Standard & Poor’s.
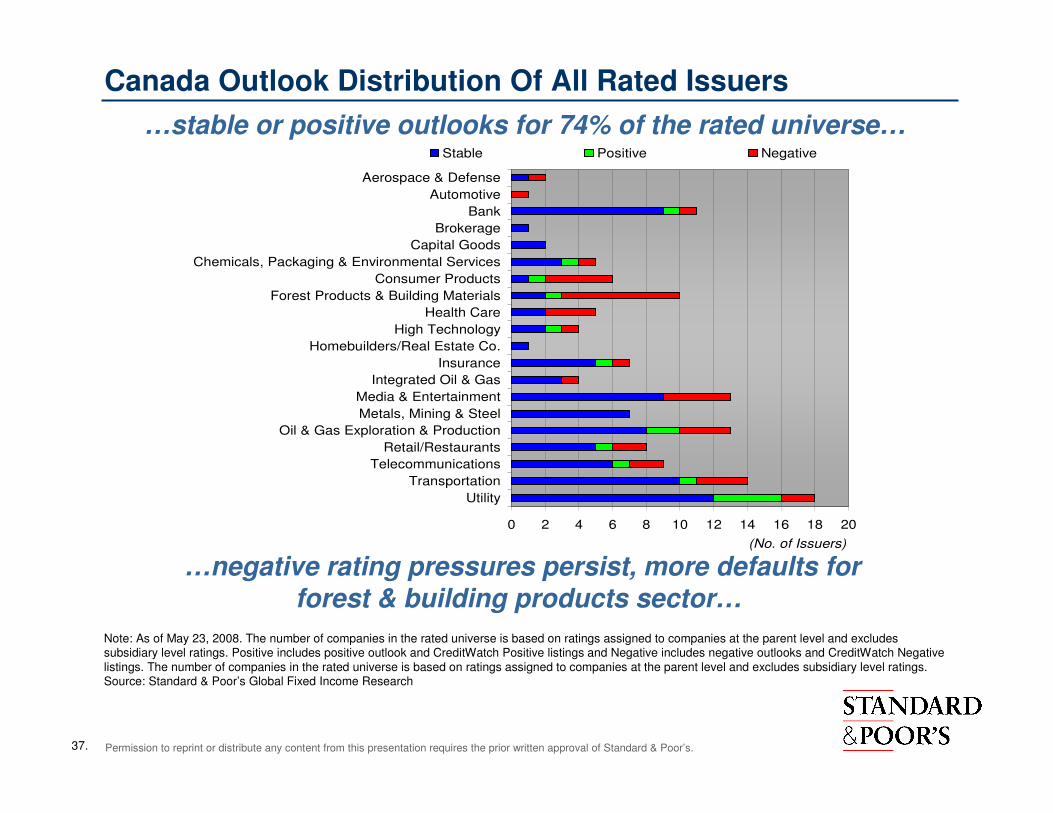
Canada Outlook Distribution Of All Rated Issuers
…stable or positive outlooks for 74% of the rated universe…
…negative rating pressures persist, more defaults for forest & building products sector…
Note: As of May 23, 2008. The number of companies in the rated universe is based on ratings assigned to companies at the parent level and excludes subsidiary level ratings. Positive includes positive outlook and CreditWatch Positive listings and Negative includes negative outlooks and CreditWatch Negative listings. The number of companies in the rated universe is based on ratings assigned to companies at the parent level and excludes subsidiary level ratings. Source: Standard & Poor’s Global Fixed Income Research
0 2 4 6 8 10 12 14 16 18 20
Aerospace & Defense
Automotive
Bank
Brokerage
Capital Goods
Chemicals, Packaging & Environmental Services
Consumer Products
Forest Products & Building Materials
Health Care
High Technology
Homebuilders/Real Estate Co.
Insurance
Integrated Oil & Gas
Media & Entertainment
Metals, Mining & Steel
Oil & Gas Exploration & Production
Retail/Restaurants
Telecommunications
Transportation
Utility
Stable Positive Negative
(No. of Issuers)
38. Permission to reprint or distribute any content from this presentation requires the prior written approval of Standard & Poor’s.
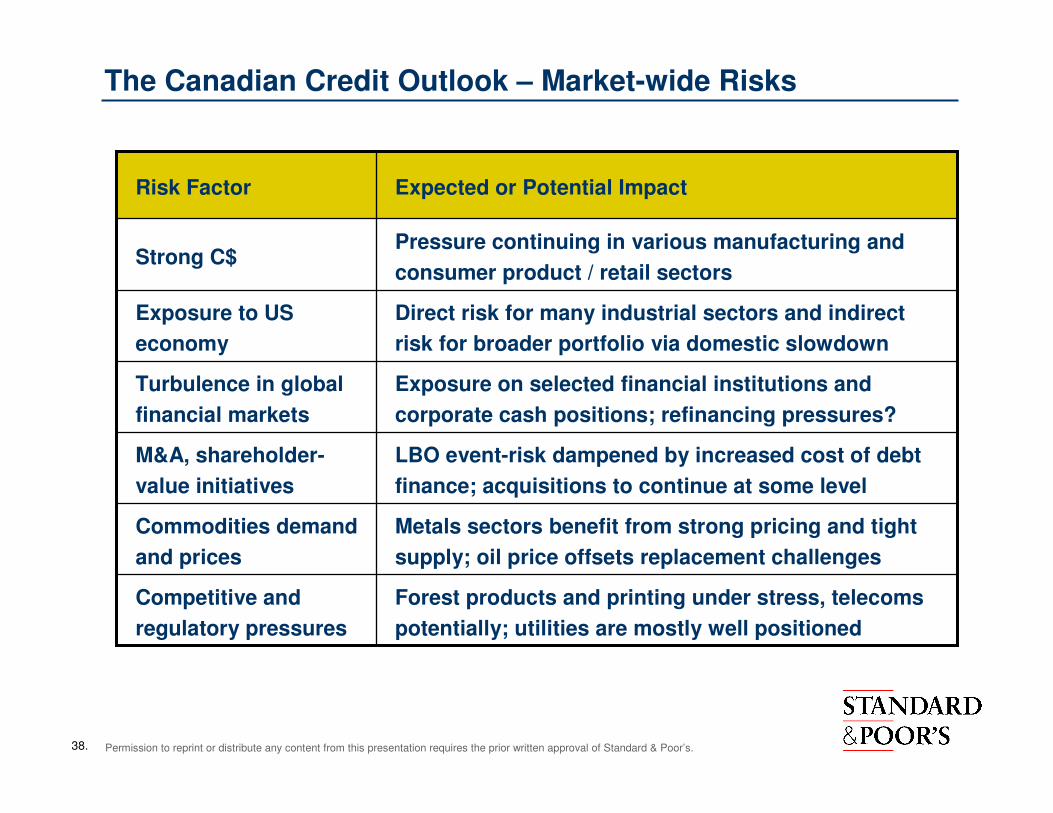
The Canadian Credit Outlook – Market-wide Risks
Direct risk for many industrial sectors and indirect
risk for broader portfolio via domestic slowdown
Exposure to US
economy
Forest products and printing under stress, telecoms
potentially; utilities are mostly well positioned
Competitive and
regulatory pressures
Metals sectors benefit from strong pricing and tight
supply; oil price offsets replacement challenges
Commodities demand
and prices
LBO event-risk dampened by increased cost of debt
finance; acquisitions to continue at some level
M&A, shareholder-
value initiatives
Exposure on selected financial institutions and
corporate cash positions; refinancing pressures?
Turbulence in global
financial markets
Pressure continuing in various manufacturing and
consumer product / retail sectorsStrong C$
Expected or Potential ImpactRisk Factor

39. Permission to reprint or distribute any content from this presentation requires the prior written approval of Standard & Poor’s.
Just about finished . . .
40. Permission to reprint or distribute any content from this presentation requires the prior written approval of Standard & Poor’s.
Key Take-Aways
• Recent credit turmoil reflects adaptation to the more integrated
global capital market that has rapidly embraced complex
technical tools
• Lessons learned from recent experience will strengthen
foundation of global capital markets
• Uncertain when turmoil will subside; possibly in transition to
more conventional credit downturn
• We expect future Canadian credit cycle development will reflect
US economy, among other factors
• S&P governance and process reforms designed to improve
transparency and build greater market confidence in credit
ratings coverage
41. Permission to reprint or distribute any content from this presentation requires the prior written approval of Standard & Poor’s.
Analytic services and products provided by Standard & Poor’s are the result of separate activities designed to preserve the independence and objectivity of each analytic process. Standard & Poor’s has established policies and procedures to maintain the confidentiality of non-public information received during each analytic process.
www.standardandpoors.com


![Credit Crunch[1]](https://img.dokumen.tips/doc/110x75/577d22941a28ab4e1e97c86e/credit-crunch1.jpg)