Embed Size (px)
Citation preview
The 3rd International Conference on Design Engineering and Science, ICDES 2014 Pilsen, Czech Republic, September 1-3, 2014
©
Elastohydrodynamic Lubrication Analysis of Journal Bearings Using CAD
Toshihiro OZASA*1, Akira KINOSHITA*2, Yuji HIROSE*3 and Masatoshi NIIZEKI*4
*1 Department of Mechanical Engineering, Faculty of Engineering, Osaka Electro-Communication University 18-8 Hatsu-cho, Neyagawa-shi, Osaka 572-8530, JAPAN [email protected]
*2 Graduate School of Osaka Electro-Communication University, Now, PSG., Inc. *3 Graduate School of Osaka Electro-Communication University
18-8 Hatsu-cho, Neyagawa-shi, Osaka 572-8530, JAPAN *4 Department of Electro-Mechanical Engineering, Faculty of Engineering,
Osaka Electro-Communication University 18-8 Hatsu-cho, Neyagawa-shi, Osaka 572-8530, JAPAN [email protected]
Abstract In the calculation of the Elastohydrodynamic Lubrication, EHL, of a journal bearing, a compliance matrix which expresses the relation between deformation and oil film pressure on a bearing surface is necessary. However, the derivation and preparation of the compliance matrix is a difficult task. In this study, a method of deriving the compliance matrix using the structural analysis in a Three Dimensional Computer Aided Design software, 3D-CAD, is described and performed using CATIA V5. The EHL analysis of the con-rod bearing using the compliance matrix is performed under the dynamic load of an engine and the deformations and oil film pressure distributions on a bearing surface are obtained over the engine cycle. The stress distributions in the con-rod are studied using the structural analysis in the 3D-CAD. In this case, the pressure distributions on the bearing surface are used to calculate the boundary condition, namely the nodal force distributions on the bearing surface. Finally, the change of the maximum stress in the con-rod under the engine operation is shown for the design of the con-rod. Keywords: elastohydrodynamic lubrication, journal bearing, computer aided design, structural analysis, compliance matrix, stress analysis, con-rod
1 Introduction Deformation of bearings used under high loading
conditions like engines could not be neglected. Therefore the Elastohydrodynamic Lubrication, EHL, analysis of a journal bearing is necessary and the study of EHL has been started [1]. In the calculation of the EHL, a compliance matrix which expresses the relation between deformation and oil film pressure on a bearing surface is derived from a structural analysis and improves calculation efficiency [2]-[6]. However, the derivation and preparation of the compliance matrix take a lot of task. This is an obstacle to apply the EHL to design of a machine with dimensional changes.
In these days, the design of a machine is performed using a Computer Aided Design, CAD, and a recent CAD includes the function of a structural analysis. Therefore in this study, a method of deriving the compliance matrix using the structural analysis in a Three Dimensional
Computer Aided Design software, 3D-CAD, is described and performed using CATIA V5.
The EHL analysis of the con-rod bearing using the compliance matrix is performed under the dynamic load of an engine and the deformations and oil film pressure distributions on a bearing surface are obtained over an engine cycle. The stress distributions in the con-rod are studied using the structural analysis in the 3D-CAD. In this case, the pressure distributions on the bearing surface are used to calculate the boundary condition, namely the nodal force distributions on the bearing surface. Finally, the change of the maximum stress in the con-rod under the engine operation is shown for the design of the con-rod.
2 EHL of journal bearings
In a lubrication analysis, Reynolds equation is used [2]-[5], [7].
thUh
Rph
zp
Rh
R z
21
12121 33
(1)
where h is clearance [m], p is pressure [Pa], R is radius [m], t is time [s], U is velocity on a journal surface [m/s], θ is bearing angle [rad], and μ is viscosity [Pa s]. Share stress τ [Pa] is
hyatyu
(2)
where u [m/s] is velocity of oil at y [m] in oil film thickness.
Fig. 1 Journal bearing and EHL
References [1] Hashimoto H., “Theoretical and experimental
investigation into generation of wrinkling and slip in plastic-films under transportation”, JSME Journal of Advanced Mechanical Design, Systems, and Manufacturing, Vol. 4, No. 1 (2010), pp.238-248.
[2] Hikita S. and Hashimoto H., “Improvement of slippage and wrinkling of transporting webs using micro-grooved rollers”, JSME Journal of Advanced Mechanical Design, Systems, and Manufacturing, Vol. 4, No. 1 (2010), pp. 226-237.
[3] Knox, K. L. and Sweency, T. L., “Fluid effects associated with web handling”, Ind. Eng. Chem. Process Des. Develop., Vol. 10, No. 2 (1971), pp. 201-205.
[4] Eshel, A. and Elrod, H. G., “The theory of the infinitely wide, perfectly flexible, self-acting foil bearing”, Trans. ASME, Journal of Lubr. Technol. (1965), pp. 92-97.
[5] Ducotey, K. S. and Good, J. K., “The importance of traction in web handling”, Trans. ASME, Journal of Tribology, Vol. 117, No. 4 (1995), pp. 679-684.
[6] Ducotey, K. S. and Good, J. K., “The effect of web permeability and side leakage on the air film height between a roller and web”, Trans. ASME, Journal of Tribology, Vol. 120 (1998), pp. 559-565.
[7] Rice, B. S., Muftu, S. and Cole, K. A., “A model for determining the asperity engagement height in relation to web traction over non-vented rollers”, Trans. ASME, Journal of Tribology, Vol. 124 (2002), pp. 584-564.
[8] Hashimoto, H., “Air film thickness estimation in web handling process”, Trans. ASME, Journal of Tribology, Vol. 121 (1999), pp. 50-55.
[9] Hashimoto, H. and Nakagawa, H., “Improvement of web spacing and friction characteristics by two types of stationary guides”, Trans. ASME, Journal of Tribology, Vol. 123 (2001), pp. 509-516.
[10] Patir, N. and Cheng, H. S., “An average flow model for determining effects of three-dimensional roughness on partial hydrodynamic lubrication”, Trans. ASME, Journal of Tribology, Vol. 100 (1978), pp. 12-17.
[11] Hashimoto, H. and Okajima, M., “Theoretical and experimental investigations into spacing characteristics between roller and three types of webs with different permeabilities”, Trans. ASME, Journal of Tribology, Vol. 128, No. 2 (2006), pp. 267-274.
[12] Hashimoto, H, “Friction characteristics between paper and steel roller under mixed lubrication”, Proc. IMechE Part J: Journal of Engineering Tribology, Vol. 226, No. 12 (2012), pp. 1127-1140.
Received on December 31, 2013 Accepted on February 28, 2014
– 165 –
The 3rd International Conference on Design Engineering and Science, ICDES 2014Pilsen, Czech Republic, August 31 – September 3, 2014
– 164 –
mesh points of lubrication, namely E2T . When av is averaged mean vector of deformation
and avT is the transfer matrix of averaged mean of deformation on bearing surface in x and y directions, relative deformation of a bearing is
pΔATTDTE
TE
21av
xyLavavxyL
. (12)
When rT is the transfer matrix of deformation on bearing surface from x and y directions to radial direction, the compliance is expressed with
ΔATTDTETC 21avr . (13)
When rδ is deformation in radial direction, the
deviation vector from a bearing circle is
LpCLL 00 rδ . (14)
This is Eq. (5). Figure 3 shows the flow chart of making the compliance using the 3D-CAD.
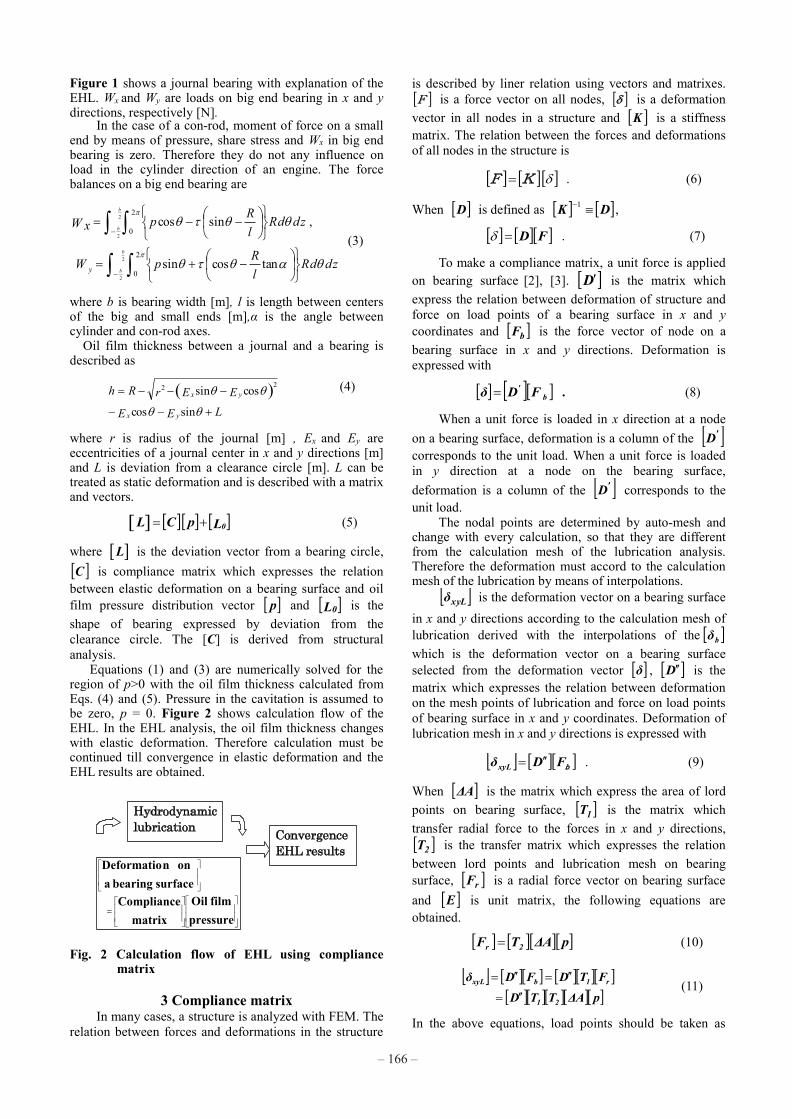
In the practice, the structure is con-rod. Inside of the small end is fixed and the deformations of the surface of big end bearing are calculated in the 3D-CAD when 1 [N] is applied every node on the bearing surface each in x or y direction. Figure 4 shows the dimension of the con-rod. Figure 5 (a) shows the structure model of the 3D-CAD. Figure 5 (b) shows the auto mesh model for the structural analysis in which element size is about 1 [mm].
CAD data
Deformation data
Structural analysis in 3D-CAD
A unit force on
every mesh point on bearing surface
Number of mesh points on lubricating
surface ×2 directions
Interpolation: Deformation on bearing surface adjust to calculation mesh points of lubrication
Compliance matrix
Fig. 3 Flow of making a deformation-pressure matrix, compliance matrix, using structural analysis in Three Dimensional Computer Aided Design Software
The structure analysis was done with the mesh on the
bearing surface which is 72 in circumferential direction and 11 in axial direction. The number of times of the structure analysis is the number of the mesh points in the lubrication analysis times 2 in directions. In this case, it is1584 Con-rod is symmetrical shape in left and right and in front and behind about the rod axis. The product of 37
in circumference, 6 in width and 2 in directions is the number of times of the structure analysis which is reduced to be 444.
4 Results The EHL analysis of the con-rod bearing using the
compliance matrix is performed under the dynamic load of an engine and the deformations and oil film pressure distributions on a bearing surface are obtained over the engine cycle. In the calculations, suction top dead center is defined as crank angle of 0 degrees after top dead center, 0 [°ATDC]. The stress distributions in the con-rod are studied using the structural analysis in the 3D-CAD, CATIA V5, using the nodal forces on the bearing surface as the boundary condition. The nodal force distributions on the bearing surface are derived from the pressure distributions obtained from the EHL analysis.
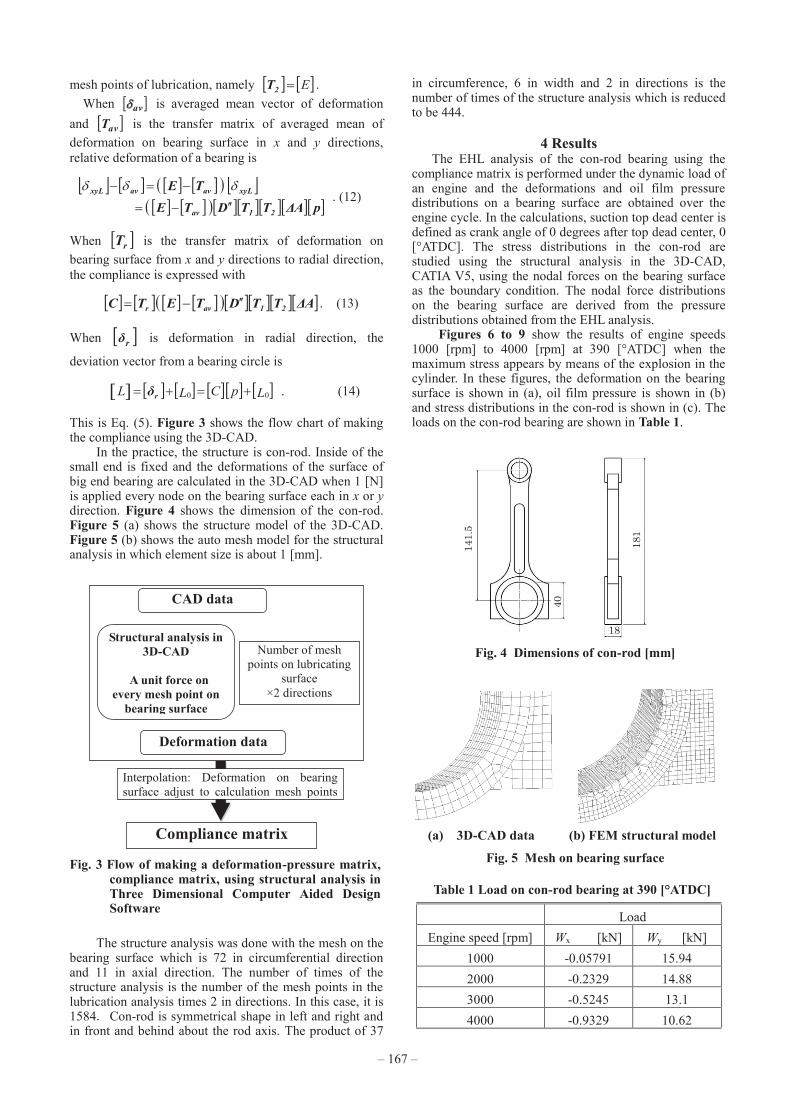
Figures 6 to 9 show the results of engine speeds 1000 [rpm] to 4000 [rpm] at 390 [°ATDC] when the maximum stress appears by means of the explosion in the cylinder. In these figures, the deformation on the bearing surface is shown in (a), oil film pressure is shown in (b) and stress distributions in the con-rod is shown in (c). The loads on the con-rod bearing are shown in Table 1.
18
40
141
.5
18
1
Fig. 4 Dimensions of con-rod [mm]
(a) 3D-CAD data (b) FEM structural model Fig. 5 Mesh on bearing surface
Table 1 Load on con-rod bearing at 390 [°ATDC]
Load Engine speed [rpm] Wx [kN] Wy [kN]
1000 -0.05791 15.94 2000 -0.2329 14.88 3000 -0.5245 13.1 4000 -0.9329 10.62
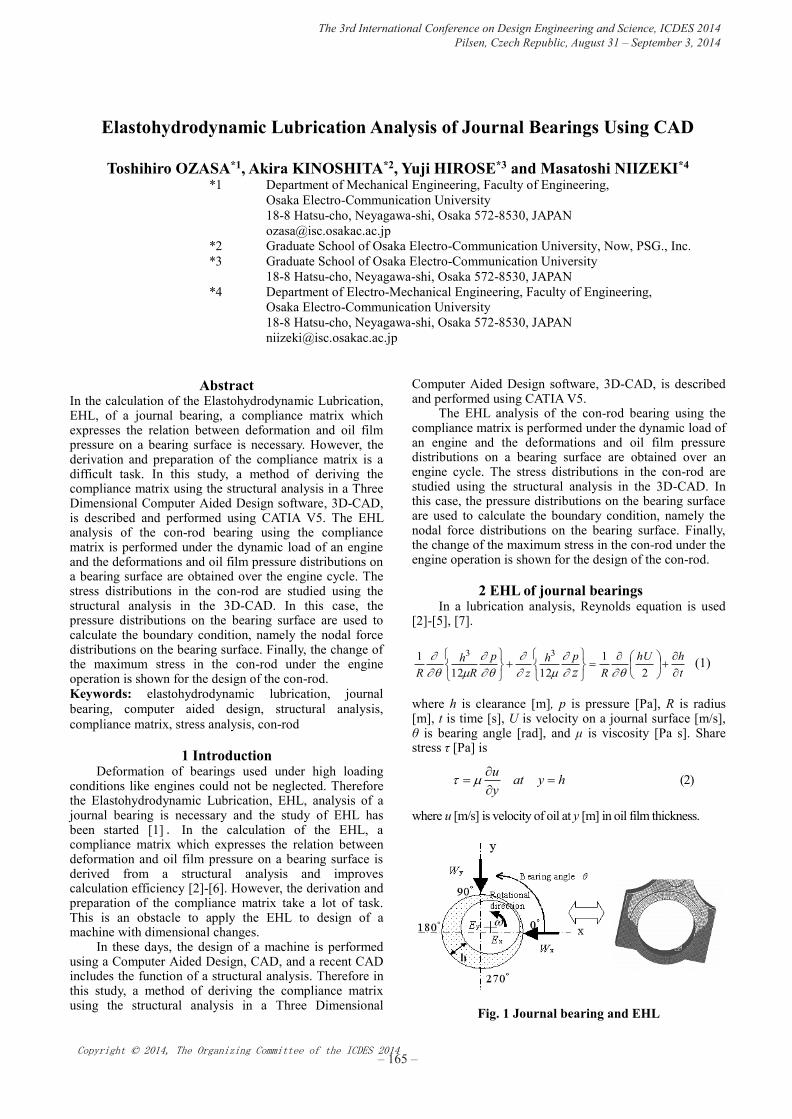
Figure 1 shows a journal bearing with explanation of the EHL. Wx and Wy are loads on big end bearing in x and y directions, respectively [N].
In the case of a con-rod, moment of force on a small end by means of pressure, share stress and Wx in big end bearing is zero. Therefore they do not any influence on load in the cylinder direction of an engine. The force balances on a big end bearing are
zddRlRpW
zddRlRpW x
b
b
b
b
y
2
2
2
2
2
0
2
0
tancossin
,sincos(3)
where b is bearing width [m], l is length between centers of the big and small ends [m],α is the angle between cylinder and con-rod axes.
Oil film thickness between a journal and a bearing is described as
LEE
EErRh
yx
yx
sincos
cossin 22 (4)
where r is radius of the journal [m] , Ex and Ey are eccentricities of a journal center in x and y directions [m] and L is deviation from a clearance circle [m]. L can be treated as static deformation and is described with a matrix and vectors.
LpCL 0 (5)
where L is the deviation vector from a bearing circle, C is compliance matrix which expresses the relation between elastic deformation on a bearing surface and oil film pressure distribution vector p and L0 is the shape of bearing expressed by deviation from the clearance circle. The [C] is derived from structural analysis.
Equations (1) and (3) are numerically solved for the region of p>0 with the oil film thickness calculated from Eqs. (4) and (5). Pressure in the cavitation is assumed to be zero, p = 0. Figure 2 shows calculation flow of the EHL. In the EHL analysis, the oil film thickness changes with elastic deformation. Therefore calculation must be continued till convergence in elastic deformation and the EHL results are obtained.
Convergence EHL results
Hydrodynamic lubrication
pressurefilm Oil
matrixCompliance
surface bearing a onnDeformatio
Fig. 2 Calculation flow of EHL using compliance matrix
3 Compliance matrix
In many cases, a structure is analyzed with FEM. The relation between forces and deformations in the structure
is described by liner relation using vectors and matrixes. F is a force vector on all nodes, is a deformation vector in all nodes in a structure and K is a stiffness matrix. The relation between the forces and deformations of all nodes in the structure is
KF . (6)
When D is defined as DK 1 ,
FD . (7)
To make a compliance matrix, a unit force is applied on bearing surface [2], [3]. D is the matrix which express the relation between deformation of structure and force on load points of a bearing surface in x and y coordinates and bF is the force vector of node on a bearing surface in x and y directions. Deformation is expressed with
b' FDδ . (8)
When a unit force is loaded in x direction at a node on a bearing surface, deformation is a column of the 'D corresponds to the unit load. When a unit force is loaded in y direction at a node on the bearing surface, deformation is a column of the 'D corresponds to the unit load.
The nodal points are determined by auto-mesh and change with every calculation, so that they are different from the calculation mesh of the lubrication analysis. Therefore the deformation must accord to the calculation mesh of the lubrication by means of interpolations.
xyLδ is the deformation vector on a bearing surface in x and y directions according to the calculation mesh of lubrication derived with the interpolations of the bδ which is the deformation vector on a bearing surface selected from the deformation vector δ , D is the matrix which expresses the relation between deformation on the mesh points of lubrication and force on load points of bearing surface in x and y coordinates. Deformation of lubrication mesh in x and y directions is expressed with
FDδxyL . (9)
When ΔA is the matrix which express the area of lord points on bearing surface, 1T is the matrix which transfer radial force to the forces in x and y directions, 2T is the transfer matrix which expresses the relation between lord points and lubrication mesh on bearing surface, rF is a radial force vector on bearing surface and E is unit matrix, the following equations are obtained.
pΔATF 2r (10)
pΔATTD
FTDFDδ
21
r1bxyL
(11)
In the above equations, load points should be taken as
– 167 – – 166 –
mesh points of lubrication, namely E2T . When av is averaged mean vector of deformation
and avT is the transfer matrix of averaged mean of deformation on bearing surface in x and y directions, relative deformation of a bearing is
pΔATTDTE
TE
21av
xyLavavxyL
. (12)
When rT is the transfer matrix of deformation on bearing surface from x and y directions to radial direction, the compliance is expressed with
ΔATTDTETC 21avr . (13)
When rδ is deformation in radial direction, the
deviation vector from a bearing circle is
LpCLL 00 rδ . (14)
This is Eq. (5). Figure 3 shows the flow chart of making the compliance using the 3D-CAD.
In the practice, the structure is con-rod. Inside of the small end is fixed and the deformations of the surface of big end bearing are calculated in the 3D-CAD when 1 [N] is applied every node on the bearing surface each in x or y direction. Figure 4 shows the dimension of the con-rod. Figure 5 (a) shows the structure model of the 3D-CAD. Figure 5 (b) shows the auto mesh model for the structural analysis in which element size is about 1 [mm].
CAD data
Deformation data
Structural analysis in 3D-CAD
A unit force on
every mesh point on bearing surface
Number of mesh points on lubricating
surface ×2 directions
Interpolation: Deformation on bearing surface adjust to calculation mesh points of lubrication
Compliance matrix
Fig. 3 Flow of making a deformation-pressure matrix, compliance matrix, using structural analysis in Three Dimensional Computer Aided Design Software
The structure analysis was done with the mesh on the
bearing surface which is 72 in circumferential direction and 11 in axial direction. The number of times of the structure analysis is the number of the mesh points in the lubrication analysis times 2 in directions. In this case, it is1584 Con-rod is symmetrical shape in left and right and in front and behind about the rod axis. The product of 37
in circumference, 6 in width and 2 in directions is the number of times of the structure analysis which is reduced to be 444.
4 Results The EHL analysis of the con-rod bearing using the
compliance matrix is performed under the dynamic load of an engine and the deformations and oil film pressure distributions on a bearing surface are obtained over the engine cycle. In the calculations, suction top dead center is defined as crank angle of 0 degrees after top dead center, 0 [°ATDC]. The stress distributions in the con-rod are studied using the structural analysis in the 3D-CAD, CATIA V5, using the nodal forces on the bearing surface as the boundary condition. The nodal force distributions on the bearing surface are derived from the pressure distributions obtained from the EHL analysis.
Figures 6 to 9 show the results of engine speeds 1000 [rpm] to 4000 [rpm] at 390 [°ATDC] when the maximum stress appears by means of the explosion in the cylinder. In these figures, the deformation on the bearing surface is shown in (a), oil film pressure is shown in (b) and stress distributions in the con-rod is shown in (c). The loads on the con-rod bearing are shown in Table 1.
18
40
141
.5
18
1
Fig. 4 Dimensions of con-rod [mm]
(a) 3D-CAD data (b) FEM structural model Fig. 5 Mesh on bearing surface
Table 1 Load on con-rod bearing at 390 [°ATDC]
Load Engine speed [rpm] Wx [kN] Wy [kN]
1000 -0.05791 15.94 2000 -0.2329 14.88 3000 -0.5245 13.1 4000 -0.9329 10.62
Figure 1 shows a journal bearing with explanation of the EHL. Wx and Wy are loads on big end bearing in x and y directions, respectively [N].
In the case of a con-rod, moment of force on a small end by means of pressure, share stress and Wx in big end bearing is zero. Therefore they do not any influence on load in the cylinder direction of an engine. The force balances on a big end bearing are
zddRlRpW
zddRlRpW x
b
b
b
b
y
2
2
2
2
2
0
2
0
tancossin
,sincos(3)
where b is bearing width [m], l is length between centers of the big and small ends [m],α is the angle between cylinder and con-rod axes.
Oil film thickness between a journal and a bearing is described as
LEE
EErRh
yx
yx
sincos
cossin 22 (4)
where r is radius of the journal [m] , Ex and Ey are eccentricities of a journal center in x and y directions [m] and L is deviation from a clearance circle [m]. L can be treated as static deformation and is described with a matrix and vectors.
LpCL 0 (5)
where L is the deviation vector from a bearing circle, C is compliance matrix which expresses the relation between elastic deformation on a bearing surface and oil film pressure distribution vector p and L0 is the shape of bearing expressed by deviation from the clearance circle. The [C] is derived from structural analysis.
Equations (1) and (3) are numerically solved for the region of p>0 with the oil film thickness calculated from Eqs. (4) and (5). Pressure in the cavitation is assumed to be zero, p = 0. Figure 2 shows calculation flow of the EHL. In the EHL analysis, the oil film thickness changes with elastic deformation. Therefore calculation must be continued till convergence in elastic deformation and the EHL results are obtained.
Convergence EHL results
Hydrodynamic lubrication
pressurefilm Oil
matrixCompliance
surface bearing a onnDeformatio
Fig. 2 Calculation flow of EHL using compliance matrix
3 Compliance matrix
In many cases, a structure is analyzed with FEM. The relation between forces and deformations in the structure
is described by liner relation using vectors and matrixes. F is a force vector on all nodes, is a deformation vector in all nodes in a structure and K is a stiffness matrix. The relation between the forces and deformations of all nodes in the structure is
KF . (6)
When D is defined as DK 1 ,
FD . (7)
To make a compliance matrix, a unit force is applied on bearing surface [2], [3]. D is the matrix which express the relation between deformation of structure and force on load points of a bearing surface in x and y coordinates and bF is the force vector of node on a bearing surface in x and y directions. Deformation is expressed with
b' FDδ . (8)
When a unit force is loaded in x direction at a node on a bearing surface, deformation is a column of the 'D corresponds to the unit load. When a unit force is loaded in y direction at a node on the bearing surface, deformation is a column of the 'D corresponds to the unit load.
The nodal points are determined by auto-mesh and change with every calculation, so that they are different from the calculation mesh of the lubrication analysis. Therefore the deformation must accord to the calculation mesh of the lubrication by means of interpolations.
xyLδ is the deformation vector on a bearing surface in x and y directions according to the calculation mesh of lubrication derived with the interpolations of the bδ which is the deformation vector on a bearing surface selected from the deformation vector δ , D is the matrix which expresses the relation between deformation on the mesh points of lubrication and force on load points of bearing surface in x and y coordinates. Deformation of lubrication mesh in x and y directions is expressed with
FDδxyL . (9)
When ΔA is the matrix which express the area of lord points on bearing surface, 1T is the matrix which transfer radial force to the forces in x and y directions, 2T is the transfer matrix which expresses the relation between lord points and lubrication mesh on bearing surface, rF is a radial force vector on bearing surface and E is unit matrix, the following equations are obtained.
pΔATF 2r (10)
pΔATTD
FTDFDδ
21
r1bxyL
(11)
In the above equations, load points should be taken as
– 167 – – 166 –
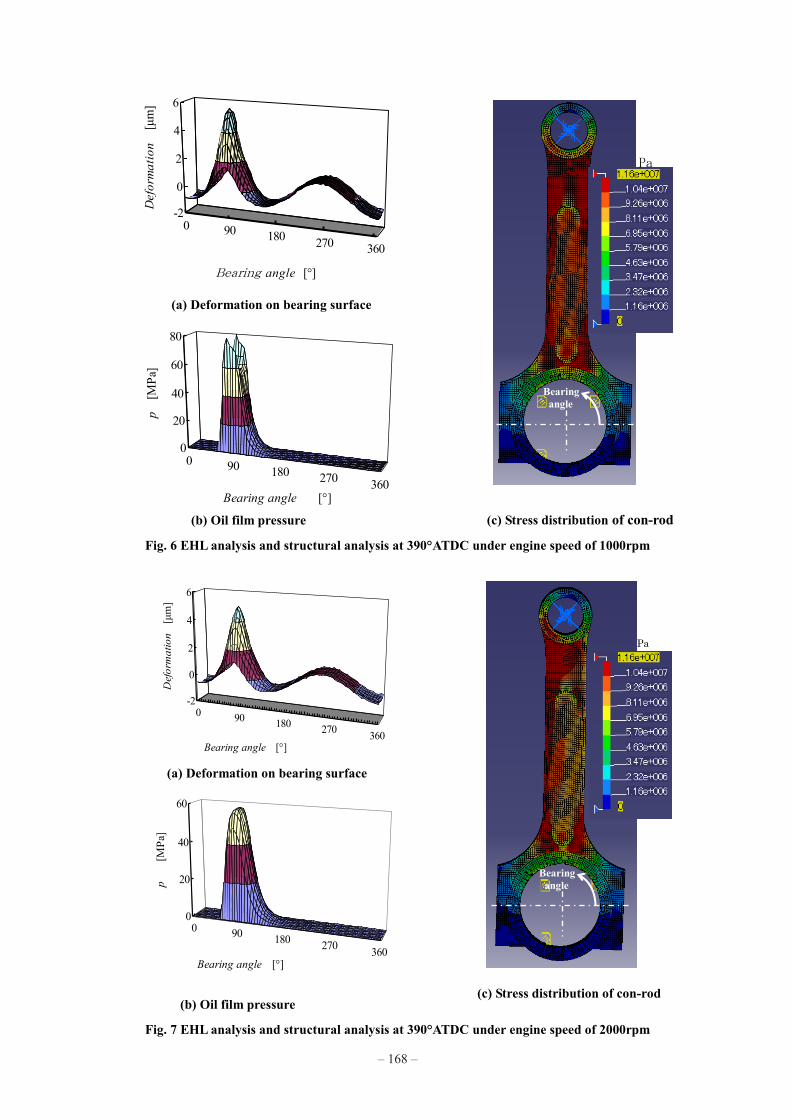
Fig. 8 EHL analysis and structural analysis at 390°ATDC under engine speed of 3000rpm
Fig. 9 EHL analysis and structural analysis at 390°ATDC under engine speed of 4000rpm
0 90 180 270 360
0
20
40
60
p
[MPa
]
Bearing angle [°]
(a) Deformation on bearing surface
(b) Oil film pressure (c) Stress distribution of con-rod
Pa
Bearing angle
0 90 180 270 360
-2
0
2
4
6
Def
orm
atio
n [μ
m]
Bearing angle [°]
0 90 180 270 360
0
20
40
60
p
[M
Pa]
Bearing angle [°](b) Oil film pressure
(a) Deformation on bearing surface
(c) Stress distribution of con-rod
Pa
0 90 180 270 360
-2
0
2
4
6
Def
orm
atio
n
[μm
]
Bearing angle [°]
Fig. 6 EHL analysis and structural analysis at 390°ATDC under engine speed of 1000rpm
Fig. 7 EHL analysis and structural analysis at 390°ATDC under engine speed of 2000rpm
0 90 180 270 360
0
20
40
60
80
p [
MPa
]
Bearing angle [°]
0 90 180 270 360
-2
0
2
4
6
Def
orm
atio
n
[μm
]
Bearing angle [°]
(a) Deformation on bearing surface
(c) Stress distribution of con-rod
Bearing angle
(b) Oil film pressure
0 90 180 270 360
-2
0
2
4
6
Def
orm
atio
n [
μm]
Bearing angle [°]
0 90 180 270 360
0
20
40
60
p
[M
Pa]
Bearing angle [°]
(a) Deformation on bearing surface
(b) Oil film pressure (c) Stress distribution of con-rod
Pa
Bearing angle
– 169 – – 168 –
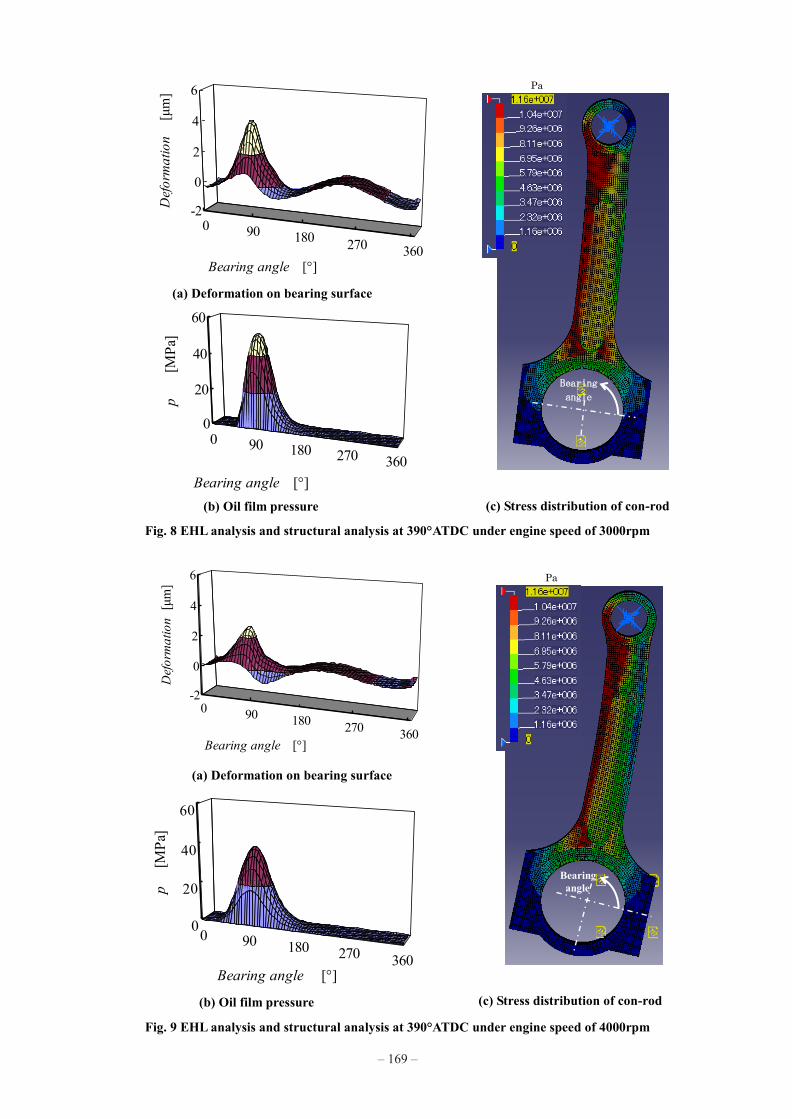
The 3rd International Conference on Design Engineering and Science, ICDES 2014 Pilsen, Czech Republic, September 1-3, 2014
Copyright © 2014, The Organizing Committee of the ICDES 2014
Effect of Heat Sink Structure on Cooling Performance of LED Bulb
T. Kobayashi*1, S. Ishikawa*2, R. Hashimoto*3, H. Kanematsu*4 and Y. Utsumi*5
*1, 2 Department of Electronics & Control Engineering, Tsuyama National College of Technology, Okayama, Japan [email protected]
*3 Collaborative Research Center, Hiroshima University, Hiroshima, Japan [email protected]
*4 Department of Materials Science & Engineering, Suzuka National College of Technology, Mie, Japan [email protected] *5 Laboratory of Advanced Science and Technology for Industry, University of Hyogo, Hyogo, Japan
Abstract
This paper describes the effects of various parameters on the temperature of the LED device to optimize the heat sink structure of LED light bulb, and a design guideline is shown. Although the original efficiency and life of the LED device is excellent, the performance cannot be obtained due to the local temperature rise of LED element and the surrounding polymer molding material. Therefore, heat transfer analysis considering the heat convection and radiation was carried out systematically using finite element method by changing parameters of the heat sink shape. The result has shown that open type structure has advantage, and the proper design guideline for the structure of shape was obtained. Furthermore, an experimental model was prototyped, then the temperature distribution was measured, consequently it has been verified that the analysis results were well consistent with the empirical data. Keywords: light emitting diode bulb, heat sink, heat transfer, finite element method, temperature distribution
1 Introduction In recent years, LEDs have been used for traffic
signals, lighting in road tunnel and lamp for home due to their long life and high efficiency, further the applications to the head lamp and tail lamp of automobile has been started as well [1]-[2]. However, the LEDs are point heat sources, thus the potential efficiency cannot be obtained, because the local temperature of the polymer molding materials [3], peripheral devices and LED element itself increases when LEDs are assembled to LED bulb, namely the heat transfer design issues have been preserved. For example, it is known that the luminous efficiency may decrease 5-8% when the temperature rises 10˚C, life is halved for every 10˚C rise in temperature, furthermore, the specific issues of LED have been reported, such as thermal degradation of the material of the feeding unit and the mounting part of LED element, and the increase of failure rate due to insulation failure and fatigue failure resulting from thermal stress [2], [4], [5].
A group of the authors has reported on the thermal design of the LED lamp using simulation [6]. However, only convection heat transfer was considered due to the
use of simplified geometrical models in the analysis. Further the verification of the theoretical analysis has not been conducted. Therefore, in the present study, both convection and radiation were considered in the heat transfer analysis of LED heat sink using finer geometrical models, then the result was verified by measuring the temperature distribution of a practical proto-typed model.
2Analysis methods and conditions 2.1 Analysis method Three dimensional unsteady-state heat transfer analysis using the finite element method [7] was carried out considering heat convection and radiation and temperature distribution was obtained. Basic model of the LED heat sink is shown in Fig. 1. As shown in Table 1, three levels of condition were set in each of the eight parameters; the presence or absence of the outer cylinder, the number of heat radiation fins, the height of the heat radiation fin, the thickness of the fin, the thickness of the upper plate, the material, the internal temperature of the outer cylinder, and the number of LED tips, then the parameters were allocated in the L18 orthogonal table using Design of Experiments (DOE) as shown in Table 2. The influence of each parameter was quantified by creating a regression equation. 2.2 Analysis conditions The heat generation of the LED bulb was fixed to 6 W as a whole, that is 2 W per element when the number of LED elements are three, and 1 W per element for six LED elements, the influence of the number of LED elements on the maximum temperature was investigated, Assuming a resin molding, the shape of the LED element has a disk shape with a height of 2mm and a diameter of 4mm. The diameter of the mounting substrate of LED element was fixed at 60mm. In addition, the ambient temperature was set at 20˚C, and the heat transfer coefficient was applied to 5 W/m2K to be used in calm condition of a typical convection, and relative emissivity was 0.4. Further, assuming the heat build-up in the outer cylinder, the temperature in the outer cylinder was varied in the range from 20 to 45˚C. As the material of the radiation fin, aluminum alloy, which can be easily formed by die-casting or stamping, and has reasonable cost, was
-5
0
5
10
15
0 60 120 180 240 300 360 420 480 540 600 660 720
Crank angle [°ATDC]
Wx,
Wy
[kN
]
WxWy
(a) Bearing load
0
5
10
15
20
25
0 60 120 180 240 300 360 420 480 540 600 660 720
Crank angle [°ATDC]
σmax
[
MPa
]
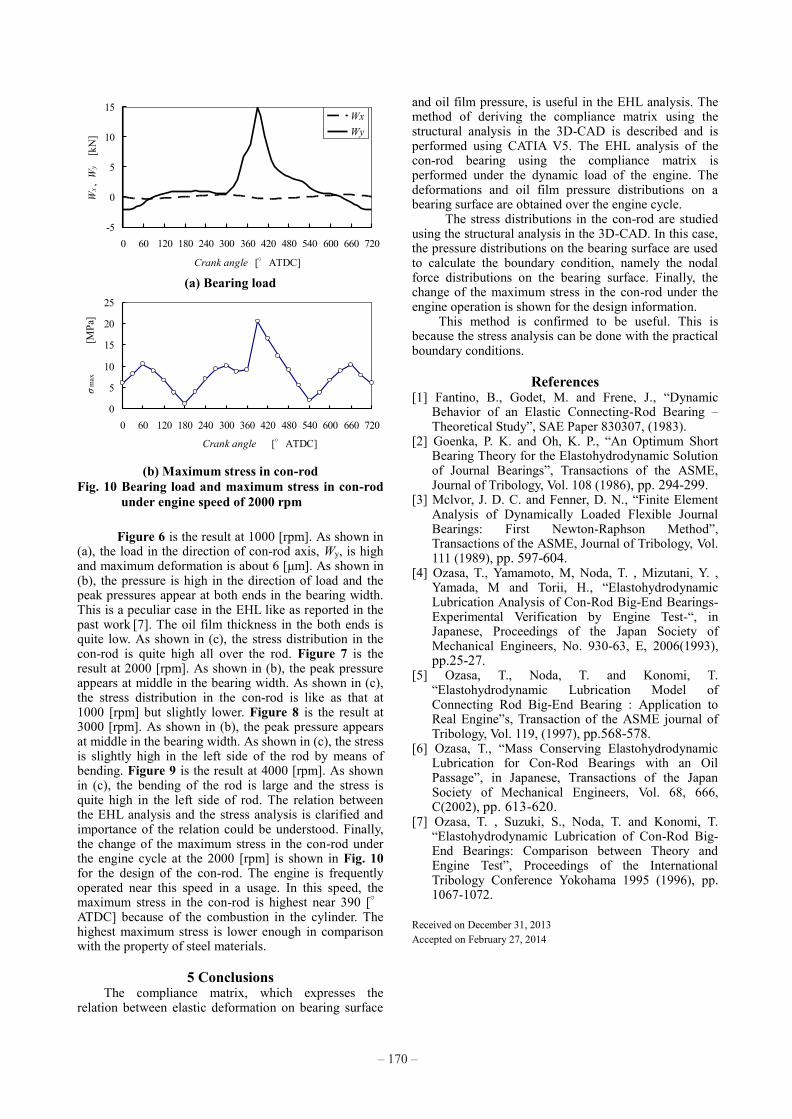
(b) Maximum stress in con-rod Fig. 10 Bearing load and maximum stress in con-rod
under engine speed of 2000 rpm
Figure 6 is the result at 1000 [rpm]. As shown in (a), the load in the direction of con-rod axis, Wy, is high and maximum deformation is about 6 [μm]. As shown in (b), the pressure is high in the direction of load and the peak pressures appear at both ends in the bearing width. This is a peculiar case in the EHL like as reported in the past work [7]. The oil film thickness in the both ends is quite low. As shown in (c), the stress distribution in the con-rod is quite high all over the rod. Figure 7 is the result at 2000 [rpm]. As shown in (b), the peak pressure appears at middle in the bearing width. As shown in (c), the stress distribution in the con-rod is like as that at 1000 [rpm] but slightly lower. Figure 8 is the result at 3000 [rpm]. As shown in (b), the peak pressure appears at middle in the bearing width. As shown in (c), the stress is slightly high in the left side of the rod by means of bending. Figure 9 is the result at 4000 [rpm]. As shown in (c), the bending of the rod is large and the stress is quite high in the left side of rod. The relation between the EHL analysis and the stress analysis is clarified and importance of the relation could be understood. Finally, the change of the maximum stress in the con-rod under the engine cycle at the 2000 [rpm] is shown in Fig. 10 for the design of the con-rod. The engine is frequently operated near this speed in a usage. In this speed, the maximum stress in the con-rod is highest near 390 [°ATDC] because of the combustion in the cylinder. The highest maximum stress is lower enough in comparison with the property of steel materials.
5 Conclusions
The compliance matrix, which expresses the relation between elastic deformation on bearing surface
and oil film pressure, is useful in the EHL analysis. The method of deriving the compliance matrix using the structural analysis in the 3D-CAD is described and is performed using CATIA V5. The EHL analysis of the con-rod bearing using the compliance matrix is performed under the dynamic load of the engine. The deformations and oil film pressure distributions on a bearing surface are obtained over the engine cycle.
The stress distributions in the con-rod are studied using the structural analysis in the 3D-CAD. In this case, the pressure distributions on the bearing surface are used to calculate the boundary condition, namely the nodal force distributions on the bearing surface. Finally, the change of the maximum stress in the con-rod under the engine operation is shown for the design information.
This method is confirmed to be useful. This is because the stress analysis can be done with the practical boundary conditions.
References
[1] Fantino, B., Godet, M. and Frene, J., “Dynamic Behavior of an Elastic Connecting-Rod Bearing – Theoretical Study”, SAE Paper 830307, (1983).
[2] Goenka, P. K. and Oh, K. P., “An Optimum Short Bearing Theory for the Elastohydrodynamic Solution of Journal Bearings”, Transactions of the ASME, Journal of Tribology, Vol. 108 (1986), pp. 294-299.
[3] Mclvor, J. D. C. and Fenner, D. N., “Finite Element Analysis of Dynamically Loaded Flexible Journal Bearings: First Newton-Raphson Method”, Transactions of the ASME, Journal of Tribology, Vol. 111 (1989), pp. 597-604.
[4] Ozasa, T., Yamamoto, M, Noda, T. , Mizutani, Y. , Yamada, M and Torii, H., “Elastohydrodynamic Lubrication Analysis of Con-Rod Big-End Bearings-Experimental Verification by Engine Test-“, in Japanese, Proceedings of the Japan Society of Mechanical Engineers, No. 930-63, E, 2006(1993), pp.25-27.
[5] Ozasa, T., Noda, T. and Konomi, T. “Elastohydrodynamic Lubrication Model of Connecting Rod Big-End Bearing : Application to Real Engine”s, Transaction of the ASME journal of Tribology, Vol. 119, (1997), pp.568-578.
[6] Ozasa, T., “Mass Conserving Elastohydrodynamic Lubrication for Con-Rod Bearings with an Oil Passage”, in Japanese, Transactions of the Japan Society of Mechanical Engineers, Vol. 68, 666, C(2002), pp. 613-620.
[7] Ozasa, T. , Suzuki, S., Noda, T. and Konomi, T. “Elastohydrodynamic Lubrication of Con-Rod Big-End Bearings: Comparison between Theory and Engine Test”, Proceedings of the International Tribology Conference Yokohama 1995 (1996), pp. 1067-1072.
Received on December 31, 2013 Accepted on February 27, 2014
– 171 –
The 3rd International Conference on Design Engineering and Science, ICDES 2014Pilsen, Czech Republic, August 31 – September 3, 2014
– 170 –