Embed Size (px)
Citation preview

Reference Manual Bevi Risk Assessments version 3.1 - Introduction 01-01-2009
page 1 of 6
Reference Manual Bevi Risk Assessments
Introduction
Version Version 3.0
Date 01.01.09
This document is a translation of the document “Handleiding Risicoberekeningen Bevi versie 3.1”, dated 01-01-2009. In case of differences between this translation and the original document, the text in the original document prevails.
Contact: National Institute of Public Health and the Environment (RIVM)
Centre for External Safety P.O. box 1 3720 BA Bilthoven the Netherlands e-mail: [email protected]

Reference Manual Bevi Risk Assessments version 3.1 - Introduction 01-01-2009
page 2 of 6
Contents
1. Introduction............................................................................................................................... 3 1.1 Background ........................................................................................................................................3 1.2 Target audience for Reference Manual ..................................................................................4 1.3 Report structure...............................................................................................................................4 1.4 Information ........................................................................................................................................5
References.......................................................................................................................................... 6

Reference Manual Bevi Risk Assessments version 3.1 - Introduction 01-01-2009
page 3 of 6
1. Introduction 1.1 Background A Quantitative Risk Assessment (hereinafter referred to as: QRA) is used to make decisions about the acceptability of riska in relation to developments for a company or in the area surrounding an establishment or transport route. The criteria for assessing the acceptability of risks for a large number of categories of establishments are set in the External Safety (Establishments) Decree [Besluit externe veiligheid inrichtingen], hereinafter referred to as: Bevi [1]. In order to be able to use the results of a QRA for decisions, they must be verifiable, reproducible and comparable. Consequently, QRAs must be completed based upon the same assumptions, models and basic information. The Committee for the Prevention of Disasters caused by hazardous substances (CPR) has published a number of reports in which the methods for QRA calculations are recorded, in particular the ‘Red Book’, the ‘Yellow Book’, the ‘Green Book’ and the ‘Purple Book’. The ‘Red Book’ describes the methods used to determine and process probabilities [2]. Models are set out in the ‘Yellow Book’ which can be used to determine the outflow and the dispersion of hazardous substances in the surrounding area [3]. The ‘Green Book’ describes the effects of exposure to toxic substances, heat radiation and overpressure on man [4]. All other basic assumptions and details that are needed for the QRA calculation are set out in the ‘Purple Book’ [5]. The QRA calculation method was more or less defined in full with the publication of the coloured books. To check the extent to which QRA calculations have actually been similarly carried out, the Rijksinstituut voor Volksgezondheid en Milieu [National Institute for Public Health and the Environment] (hereinafter referred to as: RIVM) carried out a benchmark study. In this study various consultants have carried out QRA calculations based on the default method. The results of the benchmark study demonstrated that large differences in calculations results are still occurring [6]. Depending on the interpretation of the consultant and the calculation package used, differences amounting to hundreds of meters are possible in the risk contours. With the introduction of the Bevi the need for greater clarity in calculation results increased. This led to two important choices.
− One specific calculation package is stipulated for carrying out the QRA calculations for establishments that fall under the Bevi. This is the SAFETI-NL calculation package by DNV London [7].
− For establishments the Purple Book is replaced by a Reference Manual Bevi Risk Assessments (hereinafter referred to as: Reference Manual).
The combination of the SAFETI-NL calculation package and the present Reference Manual currently represent the calculation method for carrying out a QRA as part of the Bevi, and is referred to hereinafter as the ‘Bevi calculation method’. In article 7 of the Regeling externe veiligheid inrichtingen [External Safety Order], hereinafter referred to as: Revi, use of this calculation method is stipulated for determining location-specific risk and societal risk for the establishments that fall under the Bevi. The Bevi calculation method must be followed to carry out QRA calculations. This calculation method can in principle be used in all situations that present themselves within the scope of the Bevi. A number of choices have been made in the development of the Bevi calculation method. In so doing in each case, an evaluation was made between making the calculation method as clear as
a In the Bevi calculation method, risk is understood to be: the probability of (acute) death as a result of an accident involving hazardous substances. Effects are understood to be: acute death as a result of exposure to toxic substances, heat radiation or overpressure.

Reference Manual Bevi Risk Assessments version 3.1 - Introduction 01-01-2009
page 4 of 6
possible, for which parameters need to be set, and enabling location-specific modelling, for which some freedom of choice needs to be given to the user. The result of this evaluation is that, within the available framework of the calculation method, the user always has the option to modify specific information. For this the precondition applies that all QRA calculations must be worked out using properly substantiated and fully documented evaluations and choices. It may, however, be the case that the characteristics or conditions for a certain specific situation are so special that, in spite of the available freedom of choice, the Bevi calculation method cannot be used effectively. For these cases, articles 8b and 8c of the Revi provide the opportunity to deviate further from the Bevi calculation method. These possible deviations are examined in more detail in module A. 1.2 Target audience for Reference Manual This Reference Manual, which must be read in combination with the documentation on SAFETI-NL, is intended for local authorities in particular, but for employees of other authorities as well. The Reference Manual can also be a good tool for companies and consultants when carrying out calculations within the Bevi framework. 1.3 Report structure This Reference Manual consists of three modules. The legislation and regulations governing external safety are briefly examined in module A, insofar as they are relevant for the use of the Bevi calculation method. It also describes in which cases deviating from the Bevi calculation method is permitted. Module B describes instructions and recommendations for calculating risk contours relevant for all categories of establishments that fall under the Bevi. This concerns information about model parameters and technical documentation. This module also examines the method of reporting. Module C sets out, for the specific categories of establishments which fall under the Bevi, how a QRA, intended for testing against the standards taken from the Bevi, should be carried out. It is in keeping with the assignment of categories of establishments that is observed in the Bevi. It should be noted that for a number of these categories development of a unified calculation method has not yet been completed. For a number of these categories reference can, however, be made to other documents in which information about calculating the QRA is included. A description of the unified calculation method for these categories will be included in this manual within the foreseeable future. Larger industrial establishments, covering a wide diversity of activities, fall under the category of Brzo [Hazards of Major Accidents Decree] establishments [8]. The chapters about Brzo establishments are based on the Purple Book [5] and describe standard modelling for all of these activities. For a number of specific activities this general approach was not sufficient and over the course of the years a more specific model has been developed. This specific approach is explained for each category of establishments in module C. It mainly covers the differences as compared to the generic Brzo approach. The existing calculation methods for specific categories are currently being updated. As soon as an updated calculation method has been finalised it will be included in this Reference Manual. Until then, the Reference Manual will make reference to an existing calculation method. The calculation package to be used is not specified in the existing calculation methods. The use of SAFETI-NL is permitted for these specific categories and is of course recommended.

Reference Manual Bevi Risk Assessments version 3.1 - Introduction 01-01-2009
page 5 of 6
1.4 Information Although the Bevi calculation method has been drawn up as effectively as possible, in practice situations may occur in which its use leads to queries. For this reason a Helpdesk (e-mail address [email protected]) has been set up to answer queries relating to this Reference Manual and the SAFETI-NL calculation package. There is also a web site where relevant information is published: (http://www.rivm.nl/milieuportaal/bibliotheek/modellen/safeti-nl.jsp).

Reference Manual Bevi Risk Assessments version 3.1 - Introduction 01-01-2009
page 6 of 6
References
[1] Besluit externe veiligheid inrichtingen [External Safety (Establishments) Decree]. [2] Publication Series Dangerous Substances 4. Methods for determining and processing
probabilities (Red Book). Ministry of VROM, 2005. [3] Publication Series Dangerous Substances 2. Methods for the calculation of physical effects
(Yellow Book). Ministry of VROM, 2005. [4] Publication Series Dangerous Substances 1. Methods for determining possible damage
(Green Book). Ministry of VROM, 2005. In Dutch [5] Publication Series Dangerous Substances 3. Guidelines for quantitative risk analysis (Purple
Book). Ministry of VROM, 2005. [6] Ale BJM, Golbach GAM, Goos D, Ham K, Janssen LAM, Shield SR. Benchmark risk
analysis models. RIVM report 610066015, 2001. [7] DNV. SAFETI-NL. For information, see
http://www.rivm.nl/milieuportaal/bibliotheek/modellen/safeti-nl.jsp [8] Besluit risico’s zware ongevallen [Hazards of Major Accidents Decree].
Reference Manual Bevi Risk Assessments version 3.0 – Module A 01-01-2009
page 1 of 4
Reference Manual Bevi Risk Assessments
Module A Legal Framework
Version Version 3.1
Date 01.01.09
This document is a translation of the document “Handleiding Risicoberekeningen Bevi versie 3.1”, dated 01-01-2009. In case of differences between this translation and the original document, the text in the original document prevails.
Contact: National Institute of Public Health and the Environment (RIVM)
Centre for External Safety P.O. box 1 3720 BA Bilthoven the Netherlands e-mail: [email protected]

Reference Manual Bevi Risk Assessments version 3.0 – Module A 01-01-2009
page 2 of 4
Contents
1. LEGAL FRAMEWORK 3 1.1 EXTERNAL SAFETY (ESTABLISHMENTS) DECREE ..........................................................................................3 1.2 EXTERNAL SAFETY ORDER (REVI) .................................................................................................................3 1.3 USE OF ANY ALTERNATIVE INPUT DATA AND CALCULATION METHOD ..........................................................3

Reference Manual Bevi Risk Assessments version 3.0 – Module A 01-01-2009
page 3 of 4
1. Legal framework 1.1 External Safety (Establishments) Decree (Bevi) Risk standards relating to external safety, which companies with hazardous substances must comply with, are included in the Bevi. These companies sometimes perform high-risk activities in the vicinity of people or groups of people. The decree aims to limit those risks and thus offer citizens a minimum level of protection. It binds municipalities and regions to legally take account of external safety when granting environmental licences and producing land-use plans. This means, for example, that dwellings must be a certain distance from an establishment that works with hazardous substances. 1.2 External Safety Order (Revi) Regulations for the implementation of the Bevi are stipulated in the Revi, governing the distances to be maintained between companies presenting a risk and the objects that require protection. Thus for particular categories of establishments fixed distances have been included and displayed in tables. It is also specified from and to which point these distances apply. The area of influence is relevant for the societal risk and regulations are also included in the Revi. The Revi came into effect at the same time as the Bevi and have been amended a few times since. In article 7 of the Revi the use of the Bevi calculation method is stipulated for determining location-specific risk and societal risk for the establishments that fall under the Bevi. 1.3 Use of any alternative input data and calculation method The Bevi calculation method can be used for virtually all situations that present themselves within the scope of the Bevi. It may, however, be the case that the characteristics or conditions for a particular situation are so specific that the Bevi calculation method cannot be used or cannot be used effectively. For these cases, articles 8b and 8c of the Revi provide the opportunity to deviate from the calculation method in certain circumstances. This facility to deviate is explained now in more detail. The Bevi calculation method contains models and simplifications. In some specific cases, strict observance of the Reference Manual may lead to results that do not logically tally. Article 8b of the Revi incorporates the possibility to deviate from the input data taken from the Reference Manual Risk Assessments. Where this is the case the competent authority can determine that it is permitted to deviate from the mandatory input data from the Reference Manual, so that relevant input data, according to the specific circumstances of the case, can be used. The decision of the competent authority on the use of alternative input data is not a resolution as defined in the General Administrative Law Act [Algemene wet bestuursrecht or Awb]. It is recommended that advice of the RIVM is sought where applicable. The option is also given in article 8c of the Revi, if the Bevi calculation method is not appropriate due to the specific circumstances of a case, to use a different, more appropriate calculation method. The conditions for using a different calculation method are that it should be properly defined and deliver reproducible results. This is to say that the calculation method is transparent and that input data and assumptions can be verified afterwards. Assessment of the alternative calculation method is made for each situation separately. Article 8d of the Revi governs the generic acceptance of alternatives that are equivalent to SAFETI-NL.

Reference Manual Bevi Risk Assessments version 3.0 – Module A 01-01-2009
page 4 of 4
Use of a different calculation method is subject to the approval of the Minister for Housing, Spatial Planning and the Environment (hereinafter referred to as: VROM), who passes a resolution after advice has been obtained from RIVM. The minister's resolution is a resolution as defined in the Algemene wet bestuursrecht (hereinafter referred to as: Awb). Heading 4.1 Beschikkingen [Provisions] of the Awb applies to the resolution for the approval of the calculation method, or its rejection. Regulations are recorded under this heading with regard amongst other things to the application for approval, the decision-making period and the preparation of the approval or its withdrawal. An objection or appeal may be lodged against the decision for approval or withdrawal. Chapters 6 and 7 of the Awb relating to objection and appeal are therefore applicable in this procedure. Applications for using an alternative calculation method must be sent to the Minister van VROM, attention of RIVM, Centrum Externe Veiligheid, Loket SAFETI-NL, Postbus 1, 3720 BA Bilthoven, the Netherlands. A procedure for such an application and the evaluation procedure can be downloaded from the website of RIVM.

Reference Manual Bevi Risk Assessments version 3.1 – Module B 01-01-2009
page 1 of 42
Reference Manual Bevi Risk Assessments
Module B General Version Version 3.1
Date 01.01.09
This document is a translation of the document “Handleiding Risicoberekeningen Bevi versie 3.1”, dated 01-01-2009. In case of differences between this translation and the original document, the text in the original document prevails.
Contact: National Institute of Public Health and the Environment (RIVM)
Centre for External Safety P.O. box 1 3720 BA Bilthoven the Netherlands e-mail: [email protected]

Reference Manual Bevi Risk Assessments version 3.1 – Module B 01-01-2009
page 2 of 42
Contents
1. INTRODUCTION 3
2. IGNITION SOURCES 4 2.1 INTRODUCTION................................................................................................................................................4 2.2 IGNITION SOURCES ..........................................................................................................................................4 3. MODEL PARAMETERS 6 3.1 INTRODUCTION................................................................................................................................................6 3.2 MODELLING SCENARIOS..................................................................................................................................6 3.3 QRA-SPECIFIC PARAMETERS ..........................................................................................................................8
3.3.1 Position of the outflow............................................................................................................................8 3.3.2 Direction of the outflow .........................................................................................................................9 3.3.3 Roughness length of the pipeline ...........................................................................................................9 3.3.4 Loss of pressure as a result of valves and bends ..................................................................................9 3.3.5 Outflow in a building .............................................................................................................................9 3.3.6 Failure pressure of a BLEVE ............................................................................................................. 10 3.3.7 Time-dependent outflow...................................................................................................................... 10 3.3.8 Tank bund ............................................................................................................................................ 11 3.3.9 Roughness length of the surrounding area ........................................................................................ 11 3.3.10 Meteorological weather station and parameters............................................................................. 12 3.3.11 Distribution inside and outside......................................................................................................... 13 3.3.12 Modelling people for events.............................................................................................................. 13 3.3.13 Ignition sources ................................................................................................................................. 14
3.4 PARAMETERS SPECIFIC FOR A QRA IN THE NETHERLANDS ........................................................................ 14 3.4.1 Averaging time constant...................................................................................................................... 14 3.4.2 Maximum outflow time and exposure time......................................................................................... 14 3.4.3 Blocked outflow................................................................................................................................... 14 3.4.4 Mass involved in a BLEVE ................................................................................................................. 15 3.4.5 Underground tanks with compressed liquefied flammable gases ..................................................... 15 3.4.6 Event tree for flammable substances.................................................................................................. 15 3.4.7 Explosion parameters ......................................................................................................................... 23 3.4.8 Height for calculating the effects........................................................................................................ 23 3.4.9 Lethality ............................................................................................................................................... 23
3.5 SUBSTANCE-SPECIFIC PARAMETERS ............................................................................................................ 25 3.5.1 Probit values for toxic substances ...................................................................................................... 25 3.5.2 Inert substances................................................................................................................................... 26 3.5.3 Oxygen................................................................................................................................................. 27
4. TECHNICAL DOCUMENTATION 28 4.1 INTRODUCTION............................................................................................................................................. 28 4.2 OBLIGATION TO REPORT A QRA TO A COMPETENT AUTHORITY RESPONSIBLE FOR WM............................ 28 5. APPENDIX: ACCOUNT 32
REFERENCES 42

Reference Manual Bevi Risk Assessments version 3.1 – Module B 01-01-2009
page 3 of 42
1. Introduction This module examines the general input data that is required to carry out a QRA within the framework of the Bevi calculation method. The instructions and recommendations set out below are important when using the SAFETI-NL calculation package, but may also be relevant when following existing as yet non-unified calculation methods (see module C). This concerns the inventory of ignition sources (chapter 2), input into the SAFETI-NL calculation package (chapter 3) and the technical documentation required for effective assessment of the QRA (chapter 4).

Reference Manual Bevi Risk Assessments version 3.1 – Module B 01-01-2009
page 4 of 42
2. Ignition sources 2.1 Introduction The presence of people and ignition sources in the area surrounding the establishment should be taken into consideration when calculating societal risk. This chapter provides rules on how to define ignition sources. The population groups to be included in the QRA are set out in chapter 16 of the Societal Risk Accountability Guidelines [Handreiking verantwoordingsplicht groepsrisico] [1]. 2.2 Ignition sources Ignition sources within the establishment are relevant when calculating both the location-specific risk and the societal risk, ignition sources outside the establishment are only relevant when calculating the societal riska. When calculating societal risk, the delayed ignition is caused by the presence of an ignition source. Delayed ignition is modelled as follows: P(t) = Ppresent × (1 − e−ωt) where P(t) the probability of an ignition during the time window 0 to t (-) Ppresent the probability that the source is present when the flammable cloud passes by (-) ω the effectiveness of the ignition (s-1) t time (s). Table 1 indicates the probability of ignition given a time window of one minute for a number of categories. Table 1 Probability of ignition of a flammable cloud during a time window of one minute for a
number of sources Source type Ignition source Probability of
ignition Point source Adjacent process installation 0.5 Flare 1.0 Oven (outside) 0.9 Oven (inside) 0.45 Boiler (outside) 0.45 Boiler (inside) 0.23 Line source high-voltage cable (per 100 m) 0.2 Motor vehicle, train see note 1 Ship 0.5 Population source Households (per person) 0.01 Offices (per person) 0.01
a For the Location-specific Risk it is assumed that a flammable cloud outside the establishment always ignites at the largest cloud size, irrespective of the location of any ignition sources.

Reference Manual Bevi Risk Assessments version 3.1 – Module B 01-01-2009
page 5 of 42
Notes:
1. The probability of an ignition for a motorway or railway in the vicinity of an establishment or transport route is determined by the average traffic density and the probability of ignition per vehicle. For a motorway default values can be assumed to be an average speed of 80 km/h and 1500 motor vehicles per hour (probability of ignition per motor vehicle 0.4 in one minute), and for a railway an average speed of 80 km/h and 8 trains per hour (probability of ignition per train 0.8 in one minute). It is assumed for local roads that they are included in the probability of ignition for households and offices.
2. On the site of the establishment the ignition sources are entered as point sources or as line sources.

Reference Manual Bevi Risk Assessments version 3.1 – Module B 01-01-2009
page 6 of 42
3. Model parameters 3.1 Introduction In a risk assessment using the SAFETI-NL calculation package, a number of selections need to be made and a large number of parameter settings entered. This chapter describes a number of selections in the modelling process and the parameters relevant in the risk assessments. A distinction is made in this description between three types of parameters: Category 1 Parameters the user can modify to align the calculation with the company-specific
and location-specific conditions. These are the QRA-specific parameters and these are set out in paragraph 3.3.
Category 2 Parameters the user cannot modify, but that are characteristic of a QRA calculation in the Netherlands. These are set out in paragraph 3.4.
Category 3 Parameters that are substance-specific. The user cannot modify these parameters for the substances in SAFETI-NL. For substances that have not yet been included in SAFETI-NL, these parameters must be defined. The substance-specific parameters are set out in paragraph 3.5.
In addition, there are other parameters that the user cannot modify, but that belong with the calculation model, and parameters that do not affect the calculation results, but only determine the presentation of (intermediate) results. These parameters are set out in the documentation for the calculation package. 3.2 Modelling scenarios The standard scenarios in SAFETI-NL must be used as indicated in Table 2. Table 2 Scenarios in SAFETI-NL Scenario SAFETI-NLInstantaneous failure Catastrophic ruptureLine rupture (short pipeline) Line ruptureLine rupture (long pipeline) Long pipelineHole in reservoir LeakHole in pipeline Leak10 minutes of outflow (reservoir) Fixed duration30 minutes of outflow (ship) Fixed durationpressure safety Relief valveBLEVE (transport unit) BLEVE (stand-alone model)pool fire Pool fire (stand-alone model) Notes:
1. In addition to the standard scenarios in Table 2, SAFETI-NL also offers the option of entering a ‘user-defined source’. This option is only intended for exceptional cases in which the standard scenarios are demonstrably inaccurate. It must then be explicitly stated in the report why modelling using standard scenarios is incorrect. It must also be indicated on what the ‘user-defined source’ information is based.

Reference Manual Bevi Risk Assessments version 3.1 – Module B 01-01-2009
page 7 of 42
2. When a component fails, such as a vessel, subsequent delivery of other system components that are connected with the vessel may take place. If the quantity that is subsequently delivered is significantb, this needs to be taken into consideration in the scenario. Two situations should be distinguished: a When the content of the vessel is greater than the quantity subsequently delivered, the
scenario is modelled on the basis of the content of the vessel plus the quantity subsequently delivered.
b When the subsequently delivered quantity is greater than the content of the vessel, the combined outflow is measured, in which case the source term for the subsequent delivery is increased to take into account the initial peak.
3. If in the case of pipeline failure an increased pumping rate occurs, this is modelled by
increasing the pumphead until the required flow rate is attained.
4. The effects of measures affecting outflow, such as shutting off valves, can be taken into account. Shutting off a valve after 120 s can be taken into account by reducing the content of a vessel for this scenario so that the outflow stops after 120 seconds.
5. The release of a mixture of a toxic substance and an inert substance is modelled by default
using the source term for only the hazardous substance. Close to the source this may lead to an overestimation of the risk. In special cases improved modelling can be used by defining a mixture.
6. For line rupture, SAFETI-NL provides the choice between the ‘line rupture’ scenario and the
‘long pipeline’ scenario. The ‘line rupture’ scenario is assumed by default. Only for long transport lines between two units on a site is it possible to assume the ‘long pipeline’ scenario. In the ‘long pipeline’ scenario the outflow is calculated based upon the content of the pipeline and a pumping rate. This means that the outflow from a reservoir that may be connected is not included. The ‘long pipeline’ scenario can therefore only be used when the pumping rate and the content of the transport pipeline is critical for the outflow. It is also important that the condition that L/D > 1000 is complied with, where L is the (total) length of the pipeline and D is the diameter of the pipeline.
7. In the case of a line rupture, outflow occurs from both ends of the rupture. There are several
possibilities here: a If the outflow mainly takes place from one end, the scenario can be modelled as a rupture
of one pipeline (‘line rupture’). b If the rupture occurs in a long transport pipeline, the various contributions from both ends
of the rupture are included in the calculation of the outflow. c If the contributions from both ends of the line rupture are relevantc to the outflow, one
effective pipeline diameter must be used in the calculation, for which the outflow rate matches the outflow rate from both ends added together.
b More than 10% of the quantity that is released from the failing component is significant in this. c More than 10% of the outflow rate and quantity of outflow from one end is relevant.

Reference Manual Bevi Risk Assessments version 3.1 – Module B 01-01-2009
page 8 of 42
3.3 QRA-specific parameters The parameters in this category can be modified to align the calculation with the specific conditions of the plant and the surrounding area. 3.3.1 Position of the outflow A position for the outflow is linked to each scenario. The position is determined by the location (x, y) and the height (z) in relation to the surrounding area. The location of the hole in the vessel is also relevant for the outflow rate. If the content of a reservoir is not uniformly equal, as in a distillation column, several outflow positions will need to be modelled. 3.3.1.1 Location of the outflow The location (x, y) of the outflow is determined by the location of a reservoir or the pipeline. The location is considered equal to the centre of the reservoir. When using the calculated intervals or contours, it is important that the accuracy of the mapping material is in keeping with the intended use. Given the fact that the intervals or contours may be significant at land-use plan level, it is advised that the Large-Scale Basic Map of The Netherlands be used. If the use of the intervals or contours permits (for example, if calculations are carried out that are not intended for land-use plans), or due to specific circumstances, the topographical map to a scale of 1:10,000 may be used. To be able to draw up a representative risk contour for long transport lines, failure locations must be selected that are located at a regular distance from one another. The number must be sufficiently high to guarantee that the risk contour does not change significantly when the number of failure locations is increased. An acceptable initial distance between two failure locations is 50 meters. 3.3.1.2 Height of the outflow in relation to the surrounding area The height of the outflow (z) in relation to the surrounding area is determined by the location of the vessel or the pipeline. The height is equal to the location of the pipeline or the bottom of the vessel, given a minimum height of one meter. A height of 0 meters is only assumed for underground pipelines and vessels. 3.3.1.3 Height of the outflow in relation to the reservoir The outflow occurs at the bottom of the reservoir. This means that the outflow is modelled on the basis of the liquid phase, if present, with a liquid head equal to the maximum liquid head at the given filling grade. 3.3.1.4 Outflow from reservoirs with non-uniform content In process vessels and reactor vessels different substances can be present in different phases. A distillation column can contain a toxic substance in its gas phase, whereas a hazardous or non-hazardous solvent may be present in the liquid phase. In such cases the scenarios are defined based on the following standard:
− instantaneous outflow The full contents of the reservoir are instantaneously released. The scenario is modelled as either the release of the entire contents of toxic gas, or the release of the entire contents of

Reference Manual Bevi Risk Assessments version 3.1 – Module B 01-01-2009
page 9 of 42
solvent. The outflow that leads to the largest 1% fatality distance for weather category D5 must be chosen here.
− 10 minutes of outflow
The entire contents of the reservoir are released in 10 minutes. The scenario is modelled as either the release of the entire contents of toxic gas in 10 minutes, or the release of the entire contents of solvent in 10 minutes. The outflow that leads to the largest 1% fatality distance for weather category D5 must be chosen here.
− 10 mm hole
Two different locations are modelled: the top of the reservoir and its base. The failure frequency is distributed between these outflow points.
In some cases it is more realistic to calculate with a mixture, applying average characteristics rather than separate substances. This needs to be assessed on a case-by-case basis. Vessels with a uniform mixture (gas/gas or liquid/liquid) must be calculated as a mixture with average characteristics. 3.3.2 Direction of the outflow The direction of the outflow is horizontald by default with the exception of underground transport lines and underground reservoirs: in this case the direction of the outflow is vertical by default. Where needed it is possible to deviate from the standard outflow direction. In particular, vertical outflow is used in the case of surface pipelines that run vertically. 3.3.3 Roughness length of the pipeline The roughness length of the pipeline is a measure for the internal roughness of the pipe and determines the resistance in the pipeline. The value for the roughness length equals 45 µm by default. 3.3.4 Loss of pressure as a result of valves and bends Loss of pressure in a pipeline due to the presence of valves, connections and bends is not taken into account in the calculation by default. 3.3.5 Outflow in a building In the case of outflow in a building, the way the substance is transported outside through the ventilation must be calculated (in-building release), as well as the effect of the building on its spread (roof/lee effect). The following assumptions must be taken into account in this:
− If the ventilation flow is less than the (vaporous) outflow rate, it must be assumed that the building does not remain intact and the scenario must be modelled as if the entire outflow takes place outside without the effects of the building.
− When a fluid is released in a building, the influence of the building on its spread (roof/lee effect) can only be taken into account when the droplets trappede option has been enabled. This leads to an underestimation of the risk. Consequently, if a proportion of the source term
d In the SAFETI-NL calculation package, a horizontal outflow is always in the direction of the wind e The Droplets trapped option means that only the flash fraction is released outside the building, and additional evaporation in an engine room is not taken into account.

Reference Manual Bevi Risk Assessments version 3.1 – Module B 01-01-2009
page 10 of 42
rains out in the building, it must be determined with a specific calculation what fraction remains in the vapour phase and what fraction is released through the ventilation system. The fraction in the vapour phase must then be entered as the vapour source term. By default it can be assumed that two times as much of the flash fraction is released as is vapour.
− When modelling the ‘roof/lee’ effect, a square building (length = width = √surface area) is assumed and the angle of the wind direction and the angle of the building is equal to zero.
3.3.6 Failure pressure of a BLEVE It is assumed that a BLEVE of a stationary tank occurs as a result of the contents of the tank heating up. The conditions in which the BLEVE occurs are different in this case from the storage conditions. Consequently, the calculation package provides the opportunity to enter the failure pressure and temperature of the BLEVE separately for a scenariof. For stationary tanks the failure pressure for the BLEVE is equal to 1.21 × the opening pressure (absolute) of the safety valve. If no safety valve is present, a failure at the test pressure of the tank must be assumed. For LPG rail tank wagons, a failure pressure of 20.5 bar absolute is assumed as default. For LPG road tankers, a failure pressure of 24.5 bar absolute is assumed as default. 3.3.7 Time-dependent outflow By default SAFETI-NL calculates using a constant outflow rate for a reservoir (or a short pipeline), which is the flow rate at the start of the outflow (t = 0 s). The calculation package provides the option of assuming an alternative outflow rate. It is possible to select a flow rate at a particular time, a flow rate averaged over a specific time window, and a time-dependent flow rate. In the case of the latter, the outflow is divided into a number of time segments with equal mass, and an average flow rate is selected for each segment. By default the calculation with SAFETI-NL must be carried out using a constant outflow rate.
− For a reservoir and short pipeline, the outflow rate is equal to the outflow rate at the start of the outflow (t = 0 s)g.
− For a long pipeline, the outflow rate is equal to the outflow rate averaged over the period 0 - 20 seconds.
In exceptional cases, it is possible to deviate from the approach set out above. In particular, this includes situations in which the duration of outflow is greater than 50 s and the outflow rate reduces significantly in the period from 0 to 1800 s. In such a situation it is possible to assume a time-dependent outflow, in which case at least five segments are definedh. Note:
1. In the standard calculation (no ‘Time Varying Release’), the entire contents of the reservoir flow out. In the case of the ‘Time Varying Release’, the model calculates what proportion of the content is left behind in the reservoir, depending on the location of the hole in relation to the bottom of the reservoir. This can result in the outflow quantity being significantly lower for a ‘Time Varying Release’ compared with a standard calculation, particularly for large-scale storage of gases at (virtually) atmospheric pressure.
f To be entered using the Burst Pressure – Fireball (Gauge) parameter g This means that the Time Varying Release field is not enabled. h The Multiple Rates option is enabled.

Reference Manual Bevi Risk Assessments version 3.1 – Module B 01-01-2009
page 11 of 42
3.3.8 Tank bund When inputting the data for the tank bund, the following information must be taken into account.
− By default it is assumed that the tank bund does not faili, in other words the contents of the tank bund is sufficiently large to contain the entire contents of the reservoir.
− The height of the tank bund is an important parameter; the calculation package assumes that the liquid moves outside the tank bund when the height of the tank bund is less than the calculated height of the droplets on the edge of the tank bund (see Figure 1).
− For a continuous outflow the actual surface area of the tank bund has to be entered for the size of the tank bund, for an instantaneous outflow 1.5 × the surface area.
− The characteristics of the substrate determine the spread of the pool of liquid and the evaporation of the pool. Default values are available in the model for different types of substrate.
Figure 1 The effect of the height of the tank bund. On the left the droplet trajectory is higher
than the tank bund wall, which means that an unlimited pool occurs outside the bund. On the right the tank bund is high enough to retain the liquid inside the tank bund.
3.3.9 Roughness length of the surrounding area The roughness length is an (artificial) measurement of length that indicates the impact of the surrounding area on wind speed. The default roughness length of the surrounding area is 0.3 meters. The roughness length can be adapted based upon the specifications in Table 3. Table 3 Roughness length for different terrains
Short description of the terrain Roughness length Open water, at least 5 km 0.0002 m Mud flats, snow; no vegetation, no obstacles 0.005 m Open, flat terrain; grass, a few isolated objects 0.03 m Low vegetation; large obstacles here and there, x/h > 20 0.10 m High vegetation; distributed large obstacles, 15 < x/h < 20 0.25 m Park, bushes; many obstacles, x/h < 15 0.5 m Strewn with large obstacles (suburb, wood) 1.0 m Town centre with high-rise and low-rise buildings 3.0 m
i The Bund cannot fail option is selected for the Bund Failure parameter

Reference Manual Bevi Risk Assessments version 3.1 – Module B 01-01-2009
page 12 of 42
Notes:
1. x is a typical distance between obstacles upwind and h is the typical height of the obstacles.
2. Roughness lengths of one meter and greater are rough estimates; the aerodynamic roughness length does not take account of dispersion around large obstacles.
3. A typical roughness length for an industrial area is one meter.
4. The roughness length at a particular location can be obtained using the ‘roughness_map’
program [2]. This program is based on data from 1995 – 1997. The average roughness length for a QRA can be calculated as follows. a. Assume a square area around the establishment at the 10-6 contour measuring a
minimum of 100 x 100 m. b. Select the resolution to be equal to the area, so that one average value is generated. c. Select the evaluation height to be 50 meters. d. Do not select the options ‘Reduce number of roughness classes’ or ‘Add orographic
roughness’. 3.3.10 Meteorological weather station and parameters
The meteorological weather station that in terms of location is representative of the establishment must be selected. The user has a choice of weather stations as specified in Table 4. Table 4 Meteorological weather stations
Name Beek Eelde Hoek van Holland Rotterdam Twente Volkel Deelen Eindhoven IJmuiden Schiphol Valkenburg Woensdrecht Den Helder Gilze-Rijen Leeuwarden Soesterberg Vlissingen Ypenburg The Netherlandsj
Default values for a number of meteorological parameters can be found in Table 5. The values are yearly averages. Table 5 Default values for a number of meteorological parameters Parameter Default value
daytimeDefault value
nighttime Ambient temperature 12 °C 8 °C substrate/bund temperature 9.8 °C 9.8 °C Water temperature 9.8 °C 9.8 °C Air pressure 101550 N/m2 101550 N/m2 Humidity 76.5% 86.3% Global radiation 0.25 kW/m2 0 kW/m2 Fraction of a 24 hour period 0.44 (8:00 – 18:30) 0.56 (18:30 – 8:00) Mixing height Note 1
j The ‘Netherlands’ weather station displays the average statistics for the 18 weather stations; this weather station cannot be used for QRA calculations.

Reference Manual Bevi Risk Assessments version 3.1 – Module B 01-01-2009
page 13 of 42
Notes:
1. The default values for the mixing height are included in the model, they are 1500 meters for weather category B3, 300 meters for weather category D1.5, 500 meters for weather category D5 and D9, 230 meters for weather category E5 and 50 meters for weather category F1.5.
3.3.11 Distribution inside and outside The distribution of the population across the inside and outside is set out in Table 6. These values apply to residential and industrial areas, unless other information is available. In relation to recreational areas, the type of recreational activity is critical for the distribution of population inside and outside. Table 6 Distribution of population inside and outside throughout the day and night. Inside Outside Day 0.93 0.07 Night 0.99 0.01 Note:
1. The same distribution across the inside and outside is maintained for the full population in the calculation package. This means that if there is a location with a different distribution inside/outside, such as a recreational area, it must be specifically determined how the population can be best entered.
Example: 100 people are present throughout the day at a recreational area, who are all outside. The risks are determined by exposure to toxic substances, and in the area for the defining scenario the (average) probability of dying outside is equal to Plethal. The number of victims in the recreational area is therefore 100 × Plethal people. The population in the recreational area can then be entered as Neff people with the default distribution of 0.93 inside and 0.07 outside, where Neff is calculated from the calculated number of victims in the recreational area: 100 × Plethal people = (0.93 × 0.1 × Plethal + 0.07 × 1 × Plethal) × Neff people. This gives Neff = 600.
3.3.12 Modelling people for events People that are only present for part of the year (or of the daytime period), such as in recreational areas or for events, must be included in the calculation if the contribution to the societal risk is relevant. The inclusion of such groups is done in SAFETI-NL by defining different rows for periods of time with different numbers of people present, taking into account the required accuracy. Example: In the area surrounding an establishment are a housing estate and a recreation lake. In
the case of the recreation lake, over the three summer months during the daytime there are an average of 200 people present during an eight hour period; at night and outside the summer months there are (virtually) no visitors. In SAFETI-NL this is modelled by working on the basis of three rows: One day row with a factor of 0.08. The population present is the housing estate
(daytime) and the people using the recreational facilities. One day row with a factor of 0.36. The population present is the housing estate
(daytime).

Reference Manual Bevi Risk Assessments version 3.1 – Module B 01-01-2009
page 14 of 42
One night row with a factor of 0.56. The population present is the housing estate (nighttime).
The factor of 0.08 for the day row is calculated from the period that the people are present at the recreation lake, i.e. three months per annum (3/12) and eight hours per day (8/24).
3.3.13 Ignition sources When calculating the location-specific risk the ignition sources on the site of the establishment must be entered, whereas when calculating the societal risk both the ignition sources inside and outside the establishment must be entered. The height of the ignition source is not an input parameter; the location of an ignition source is compared with the flammable cloud at a height of one meter. This means that ignition does not take place if no flammable cloud is present at a height of one meter. A flare at a great height, which is entered as an ignition source, will also lead to the ignition of a cloud at a height of one meter. When entering ignition sources it is therefore important to consider whether the ignition sources present can actually lead to the ignition of a cloud. Expert opinion is needed for this. This applies in particular to a cracking unit where different fractions with different densities can be released that are lighter or heavier than air. Entered population is automatically included in SAFETI-NL as an ignition source using the parameters as set out in paragraph 2.2. 3.4 Parameters specific for a QRA in the Netherlands The parameters in this category cannot be modified. 3.4.1 Averaging time constant Dispersion models are based upon an averaging time constant that is needed to calculate the maximum concentration and the width of the plume. The default values for the averaging time constant tav are: • flammable substances tav = 18.75 s • toxic substances tav = 600 s 3.4.2 Maximum outflow time and exposure time The maximum outflow time equals 1800 s. This also applies to the maximum time for evaporation of the pool. It is assumed that after 1800 s intervention has been successful. The exposure time for heat radiation is a maximum of 20 s. Exposure time is not limited for toxic substances; the possibility of an evacuation is not included in the QRA. 3.4.3 Blocked outflow The outflow can be blocked by the ground surface and objects in close proximity. An unimpeded outflow is assumed in the QRA for an outflow outside.

Reference Manual Bevi Risk Assessments version 3.1 – Module B 01-01-2009
page 15 of 42
3.4.4 Mass involved in a BLEVE The mass involved in the BLEVE is equal to the vapour phase + 3 × the flash fractionk at the failure pressure, with a maximum of the entire system contents. 3.4.5 Underground tanks with compressed liquefied flammable gases It is assumed for underground LPG tanks that a BLEVE cannot occur. This is entered in SAFETI-NL by working on the assumption of the default failure frequency (5 × 10⁻⁷ per annum for instantaneous failures) and enabling the Ignore Fireball Risks field. This has the effect of disabling the branch with BLEVE in the event tree (see Figure 4). This means that for LPG tanks with a content of 10 tonnes or more the effective failure frequency for instantaneous release is equal to 2.5 × 10⁻⁷ per annum, for LPG tanks with a content of between one and 10 tonnes it is equal to 3.25 × 10⁻⁷ per annum, and for LPG tanks with a content smaller than one ton it is equal to 4.3 × 10⁻⁷ per annum. For the instantaneous failure of the underground storage of toxic substances, the failure frequency is equal to 5 × 10⁻⁷ per annum. 3.4.6 Event tree for flammable substances When releasing flammable gases and liquids, different consequential effects are possible, namely a BLEVE and/or fire ball, jet fire, pool fire, vapour cloud explosion and flash fire. The occurrence of these phenomena depends on the substance, the conditions and the scenario. The event trees for the different scenarios are given in this paragraph, including the subsequent probabilitiesl. The effects of the pool fire that occurs as a result of the ignition of the flammable cloud are included in the calculation for a flash firem and a BLEVE. For this purpose the Include effects of late pool fire parameter is enabled. 3.4.6.1 Instantaneous release of a flammable gas The event tree for the instantaneous release of a flammable gas (no rain out) is illustrated in Figure 2.
k The flash fraction is the mass that evaporates if the system expands up to ambient pressure without interaction with the surrounding area l The event trees in this document are meant as an indication. More information can be found in the documentation of SAFETI-NL. m For an explosion, no effects of a pool fire are included

Reference Manual Bevi Risk Assessments version 3.1 – Module B 01-01-2009
page 16 of 42
Instanteous pressurisedgas
Direct ignition
Delayedignition
Explosion
Explosion
Fire ball Fire ball
Explosion
Flash fire
Explosion Flash fire
No effect
Figure 2 Event tree for an instantaneous release of a flammable gas The following probabilities are defined: Pdirect ignition the probability of direct ignition (see paragraph 3.4.6.6) Pdelayed ignition the probability of delayed ignition (see paragraph 3.4.6.7) Ffire ball the fraction modelled as a fire ball (see paragraph 3.4.6.8) Fexplosion the fraction modelled as an explosion (see paragraph 3.4.6.9) Note:
1. For an underground tank it is assumed that the fire ball scenario does not occur and this branch results in ‘no effect’.
3.4.6.2 Continuous release of a flammable gas The event tree for the continuous release of a flammable gas (no rain out) is illustrated in Figure 3. The following probabilities are defined: Pdirect ignition the probability of direct ignition (see paragraph 3.4.6.6) Pdelayed ignition the probability of delayed ignition (see paragraph 3.4.6.7) Fexplosion the fraction modelled as an explosion (see paragraph 3.4.6.9)
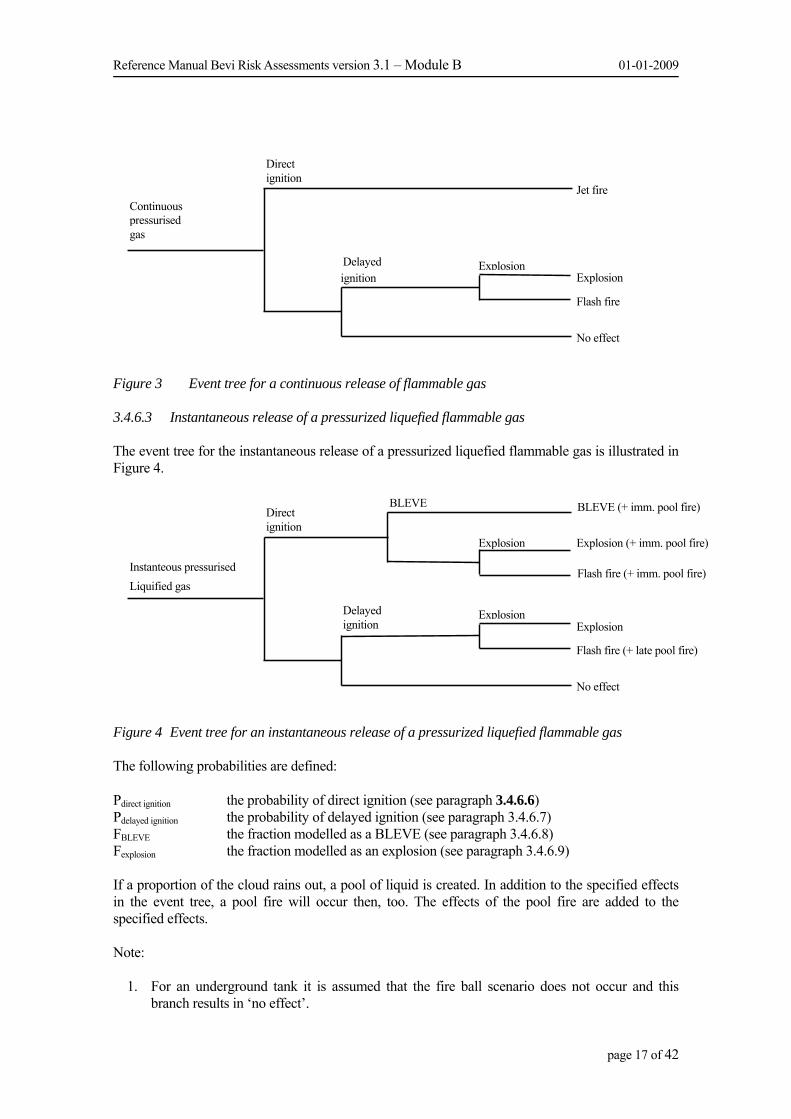
Reference Manual Bevi Risk Assessments version 3.1 – Module B 01-01-2009
page 17 of 42
Continuous pressurised gas
Direct ignition
Delayedignition
Explosion
Jet fire
Explosion Flash fire
No effect
Figure 3 Event tree for a continuous release of flammable gas 3.4.6.3 Instantaneous release of a pressurized liquefied flammable gas The event tree for the instantaneous release of a pressurized liquefied flammable gas is illustrated in Figure 4.
Instanteous pressurisedLiquified gas
Direct ignition
Delayedignition
Explosion
Explosion
BLEVE BLEVE (+ imm. pool fire)
Explosion (+ imm. pool fire)
Flash fire (+ imm. pool fire)
Explosion Flash fire (+ late pool fire)
No effect
Figure 4 Event tree for an instantaneous release of a pressurized liquefied flammable gas The following probabilities are defined: Pdirect ignition the probability of direct ignition (see paragraph 3.4.6.6) Pdelayed ignition the probability of delayed ignition (see paragraph 3.4.6.7) FBLEVE the fraction modelled as a BLEVE (see paragraph 3.4.6.8) Fexplosion the fraction modelled as an explosion (see paragraph 3.4.6.9)
If a proportion of the cloud rains out, a pool of liquid is created. In addition to the specified effects in the event tree, a pool fire will occur then, too. The effects of the pool fire are added to the specified effects. Note:
1. For an underground tank it is assumed that the fire ball scenario does not occur and this branch results in ‘no effect’.

Reference Manual Bevi Risk Assessments version 3.1 – Module B 01-01-2009
page 18 of 42
3.4.6.4 Continuous release of a pressurized liquefied flammable gas The event tree for the continuous release of a pressurized liquefied flammable gas is illustrated in Figure 5.
Continuous pressurised Liquified gas
Direct ignition
Delayedignition
Explosion
Jet fire + (imm.) pool fire
Explosion Flash fire + (late) pool fire
No effect
Figure 5 Event tree for a continuous release of a pressurized liquefied flammable gas The following probabilities are defined: Pdirect ignition the probability of direct ignition (see paragraph 3.4.6.6) Pdelayed ignition the probability of delayed ignition (see paragraph 3.4.6.7) Fexplosion the fraction modelled as an explosion (see paragraph 3.4.6.9)
If a proportion of the cloud rains out, a pool of liquid is created. In addition to the specified effects in the event tree, a pool fire then also occurs. The effects of the pool fire are added to the specified effects. 3.4.6.5 Release of a flammable liquid The event tree for the release of a flammable liquid is illustrated in Figure 6. The following probabilities are defined: Pdirect ignition the probability of direct ignition (see paragraph 3.4.6.6) Pdelayed ignition the probability of delayed ignition (see paragraph 3.4.6.7) Fexplosion the fraction modelled as an explosion (see paragraph 3.4.6.9)

Reference Manual Bevi Risk Assessments version 3.1 – Module B 01-01-2009
page 19 of 42
liquid
Direct ignition
Delayedignition
Explosio
Pool fire (+ jet fire/BLEVE)
Explosion Flash fire + (late) pool fire
No effect
Figure 6 Event tree for a release of a flammable liquid
In the case of a delayed ignition, a pool fire will occur in addition to a flash fire and an explosion. The effects of the pool fire are added to the specified effects. Note:
1. If a flammable liquid escapes, a proportion of the released substance may evaporate before it reaches the ground. If the fraction that rains out is less than one, a jet fire (or BLEVE) is modelled. The mass in the jet fire (or BLEVE) depends on the mass that remains in the vapour phase.
3.4.6.6 Probability of direct ignition, Pdirect ignition The probability of direct ignition depends on the type of installation (stationary installation or transport unit), the substance category and the outflow quantity. The values for stationary installations are given in Table 7, the values for transport units are given in Table 8. The definition of the substance category is given in Table 9. Table 7 Probability of direct ignition for stationary installations Substance category Source term
Continuous Source term Instantaneous
Probability of direct ignition
Category 0 average/ high reactivity
< 10 kg/s 10 – 100 kg/s > 100 kg/s
< 1,000 kg 1000 – 10,000 kg > 10,000 kg
0.2 0.5 0.7
Category 0 low reactivity
< 10 kg/s 10 – 100 kg/s > 100 kg/s
< 1,000 kg 1000 – 10,000 kg > 10,000 kg
0.02 0.04 0.09
Category 1
All flow rates
All quantities
0.065
Category 2
All flow rates
All quantities
0.01
Category 3, 4
All flow rates
All quantities
0

Reference Manual Bevi Risk Assessments version 3.1 – Module B 01-01-2009
page 20 of 42
Table 8 Probability of direct ignition of transport units in a establishment
Substance category
Transport unit Scenario Probability of direct ignition
Category 0 Road tanker Continuous 0.1 Road tanker Instantaneous 0.4 Tank wagon Continuous 0.1 Tank wagon Instantaneous 0.8 Ships – gas tankers Continuous, 180 m3 0.7 Ships – gas tankers Continuous, 90 m3 0.5 Ships – semi-gas tankers Continuous 0.7 Category 1
Road tanker, tank wagon Ships
Continuous, instantaneous
0.065
Category 2
Road tanker, tank wagon ships
Continuous, instantaneous
0.01
Category 3, 4
Road tanker, tank wagon ships
Continuous, instantaneous
0
Table 9 Classification of flammable substances Category WMS category Limits Category 0 Extremely flammable Liquid substances and preparations with a flash point
lower than 0 °C and a boiling point (or the start of a boiling range) less than or equal to 35 °C. Gaseous substances and preparations that may ignite at normal temperature and pressure when exposed to air.
Category 1
highly flammable
Liquid substances and preparations with a flash point below 21 °C, which are not, however, extremely flammable.
Category 2
Flammable
Liquid substances and preparations with a flash point greater than or equal to 21 °C and less than or equal to 55 °C.
Category 3
Liquid substances and preparations with a flash point greater than 55 °C and less than or equal to 100 °C.
Category 4
Liquid substances and preparations with a flash point greater than 100 °C.
Notes: 1. For loading scenarios, the probabilities of ignition are based on Table 7.
2. If the process temperature of category 2, category 3 and category 4 substances is higher than the
flash point, then the direct probability of ignition for category 1 substances is used.

Reference Manual Bevi Risk Assessments version 3.1 – Module B 01-01-2009
page 21 of 42
3. The reactivity of a substance is understood to mean its susceptibility to flame acceleration [3]. This is determined on the basis of information such as the size of the explosion area, minimum ignition area, spontaneous combustion temperature, experimental information and experience in practical situations. By default the probability of ignition for average/high reactivity must be applied. Only when it has been demonstrated that the reactivity of the substance is low, are ignition probabilities for low reactivity applied. Category 0 substances with low reactivity are given in Table 10. Toxic, flammable substances with low reactivity, such as ammonia, are calculated as being pure toxic (see paragraph 3.4.6.10).
Table 10 Category 0 substances with low reactivity. The substances designated with a * are
also toxic and must be calculated as toxic only. Substance CAS No. Methane 74-82-8 Methyl chloride 74-87-3 Ethyl chloride 75-00-3 Ammonia* 7664-41-7 Methyl bromide* 74-83-9 Carbon monoxide* 630-08-0
3.4.6.7 Probability of delayed ignition, Pdelayed ignition The probability of delayed ignition depends on the end point of the calculation and the parameters linked to this of Use free field calculation and Distance to site boundary. Location-specific risk It is assumed in the calculation of the location-specific risk that, if ignition does not occur on the site of the establishment and a flammable cloud forms outside the establishment, ignition always occurs at the biggest cloud size. The Use free field calculation parameter is selected for this purpose. The delayed ignition is determined by the available ignition sources and the development of the cloud in relation to the Distance to site boundary parameter.
− All available ignition sources are assumed to be present at the establishment and therefore capable of causing ignition.
− If ignition does not take place on the site of the establishment, there are two possibilities. o There is no flammable cloud outside the boundary of the establishment, in other
words the distance to the LFL contour (at a height of one meter) is less than the Distance to site boundary parameter. Where this is the case, delayed ignition does not occur.
o The flammable cloud comes outside the boundary of the establishment, in other words the distance to the LFL contour (at a height of one meter) is more than the Distance to site boundary parameter. Where this is the case, delayed ignition always occurs at the maximum cloud size.
Whether an LFL contour develops outside the establishment therefore depends amongst other things on the scenario, the weather class, the ignition sources entered and the Distance to site boundary parameter.
Societal risk Only the available ignition sources, including the population entered, are computed in the calculation of societal risk. The Use free field calculation parameter is not selected for this purpose.
The probability of delayed ignition, Pdelayed ignition, is given in Table 11.

Reference Manual Bevi Risk Assessments version 3.1 – Module B 01-01-2009
page 22 of 42
Table 11 Probability of delayed ignition when calculating the PR and GR Substance category
Probability of delayed ignition for the biggest cloud size, PRn
Probability of delayed ignition, GR
Category 0 1 – Pdirect ignition Ignition sources Category 1 1 – Pdirect ignition Ignition sources Category 2 0 0 Category 3 0 0 Category 4 0 0
For the Distance to site boundary parameter the following applies:
− The Distance to site boundary parameter in the ‘General Risk Parameters’ is the distance between the containment system and the site boundary and is by default set to 10 m.
− For the Distance to site boundary parameter, the minimum distance between the site boundary and the containment systems involving flammable substances can be used in most instances. One exception can be if there are several containment systems that do not all have the same distance to the site boundary. If for the Distance to site boundary the smallest distance is maintained, this may result in an overestimation of the risk of the containment systems where the distance to the site boundary is greater. Where this is the case, additional RunRows must be created that are linked to a second series of parameter files (where the Distance to site boundary is modified). In this way you can model a different distance to the site boundary for different containment systems.
3.4.6.8 BLEVE fraction (fire ball) A BLEVE (+ fire ball) occurs when there is an instantaneous release with direct ignition of a pressurized liquefied gas. The fraction that is modelled as a BLEVE (+ fire ball), given direct ignition, FBLEVE (Ffire ball), is:
− Stationary installations FBLEVE (Ffire ball) = 0.7 − Transport units in an establishment FBLEVE (Ffire ball) = 1.0
3.4.6.9 Explosion fraction Following the ignition of a free gas cloud, an incident occurs demonstrating characteristics of both a flash fire and an explosion. This is modelled as two separate events: as a pure flash fire and a pure explosion. The fraction that is modelled as an explosion, Fexplosion, is equal to 0.4. 3.4.6.10 Substances that are both toxic and flammable Substances with a low reactivity are modelled as a purely toxic substance. This includes allyl chloride (CAS No. 107-05-1), ammonia (CAS No. 7664-41-7), epichlorohydrin (CAS No. 106-89-8), methyl bromide (CAS No. 74-83-9), carbon monoxide (CAS No. 630-08-0) and tetraethyl lead (CAS No. 78-00-2). Substances with average or high reactivity are modelled with two independent events: namely a purely flammable and a purely toxic event. Examples include acrolein (CAS No. 107-02-8), acrylonitrile (CAS No. 107-13-1), allyl alcohol (CAS No. 107-18-6), hydrogen cyanide (CAS No. 74-90-8) and ethylene oxide (CAS No. 75-21-8). The distribution between flammable and toxic is
n If the distance to the LFL contour is greater than the Distance to site boundary parameter

Reference Manual Bevi Risk Assessments version 3.1 – Module B 01-01-2009
page 23 of 42
determined by the probability of direct ignition, Pdirect ignition. A LOC with frequency f is divided into two separate events:
− a purely flammable event after direct ignition with frequency Pdirect ignition × f; − a purely toxic event with frequency (1 − Pdirect ignition) × f.
The probabilities of direct ignition, Pdirect ignition, are set out in paragraph 3.4.6.6. Note:
1. Toxic effects after ignition of the flammable cloud are not included. It is assumed that in this case the plume will rise and at ground level will not cause any further lethal toxic effects.
3.4.7 Explosion parameters When defining the effects of overpressure from a vapour cloud explosion, a TNT equivalence method is used with an explosion efficiency of 10%. 3.4.8 Height for calculating the effects The toxic dose, thermal radiation dose and the pressure effects are calculated at a height of one meter. 3.4.9 Lethality The probability of dying, Plethal, is calculated using a probit, Pr, as
Plethal =0.5× 1+erf Pr−52
⎛ ⎝ ⎜
⎞ ⎠ ⎟
⎡
⎣ ⎢
⎤
⎦ ⎥
where
dtexerfx
t∫ −=0
22)(π
3.4.9.1 Exposure to toxic substances The probit for exposure to toxic substances is indicated using the relationship: Pr=a+bln Cn dt∫( )
where Pr probit associated with the probability of dying (-) a, b, n constants for the toxicity of a substance (-) C concentration at time t (mg m-3) t exposure time (minutes) The minimum value of Plethal that is still included in the calculation is equal to 0.01.
Reference Manual Bevi Risk Assessments version 3.1 – Module B 01-01-2009
page 24 of 42
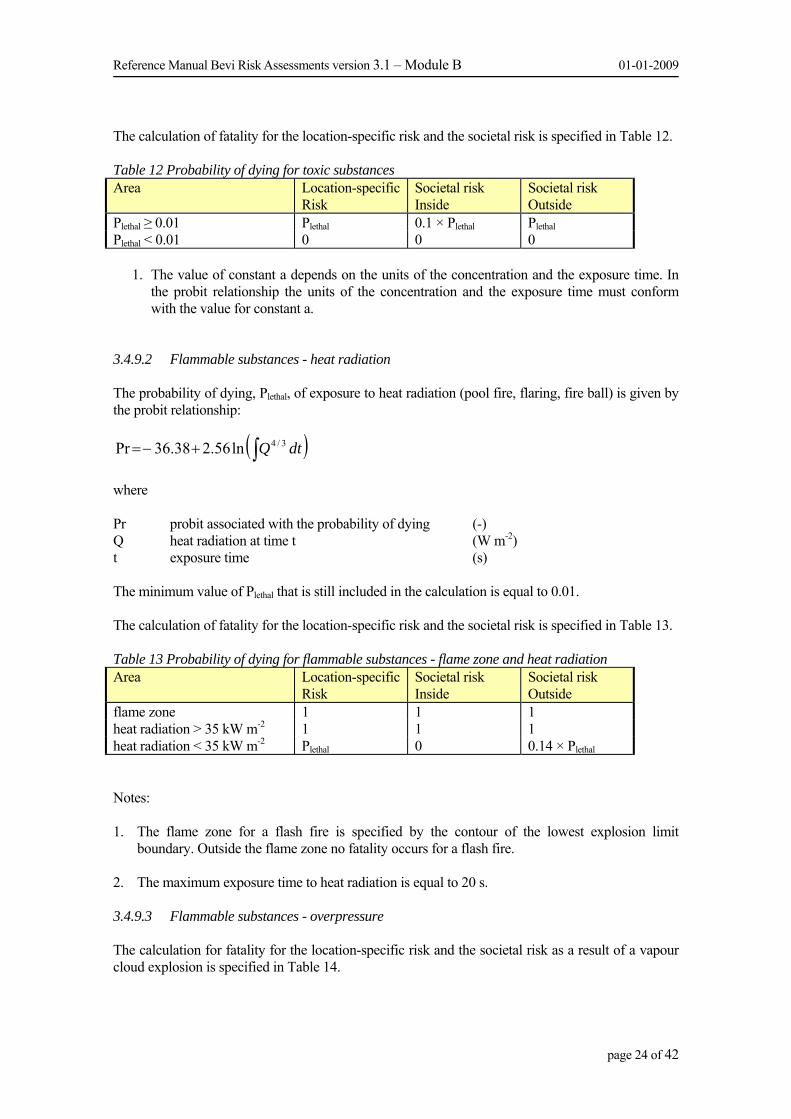
The calculation of fatality for the location-specific risk and the societal risk is specified in Table 12. Table 12 Probability of dying for toxic substances Area Location-specific
Risk Societal risk Inside
Societal risk Outside
Plethal ≥ 0.01 Plethal 0.1 × Plethal Plethal Plethal < 0.01 0 0 0
1. The value of constant a depends on the units of the concentration and the exposure time. In the probit relationship the units of the concentration and the exposure time must conform with the value for constant a.
3.4.9.2 Flammable substances - heat radiation The probability of dying, Plethal, of exposure to heat radiation (pool fire, flaring, fire ball) is given by the probit relationship:
( )∫+−= dtQ 3/4ln56.238.36Pr
where Pr probit associated with the probability of dying (-) Q heat radiation at time t (W m-2) t exposure time (s) The minimum value of Plethal that is still included in the calculation is equal to 0.01. The calculation of fatality for the location-specific risk and the societal risk is specified in Table 13. Table 13 Probability of dying for flammable substances - flame zone and heat radiation Area Location-specific
Risk Societal risk Inside
Societal risk Outside
flame zone 1 1 1 heat radiation > 35 kW m-2 1 1 1 heat radiation < 35 kW m-2 Plethal 0 0.14 × Plethal Notes: 1. The flame zone for a flash fire is specified by the contour of the lowest explosion limit
boundary. Outside the flame zone no fatality occurs for a flash fire.
2. The maximum exposure time to heat radiation is equal to 20 s. 3.4.9.3 Flammable substances - overpressure The calculation for fatality for the location-specific risk and the societal risk as a result of a vapour cloud explosion is specified in Table 14.
Reference Manual Bevi Risk Assessments version 3.1 – Module B 01-01-2009
page 25 of 42
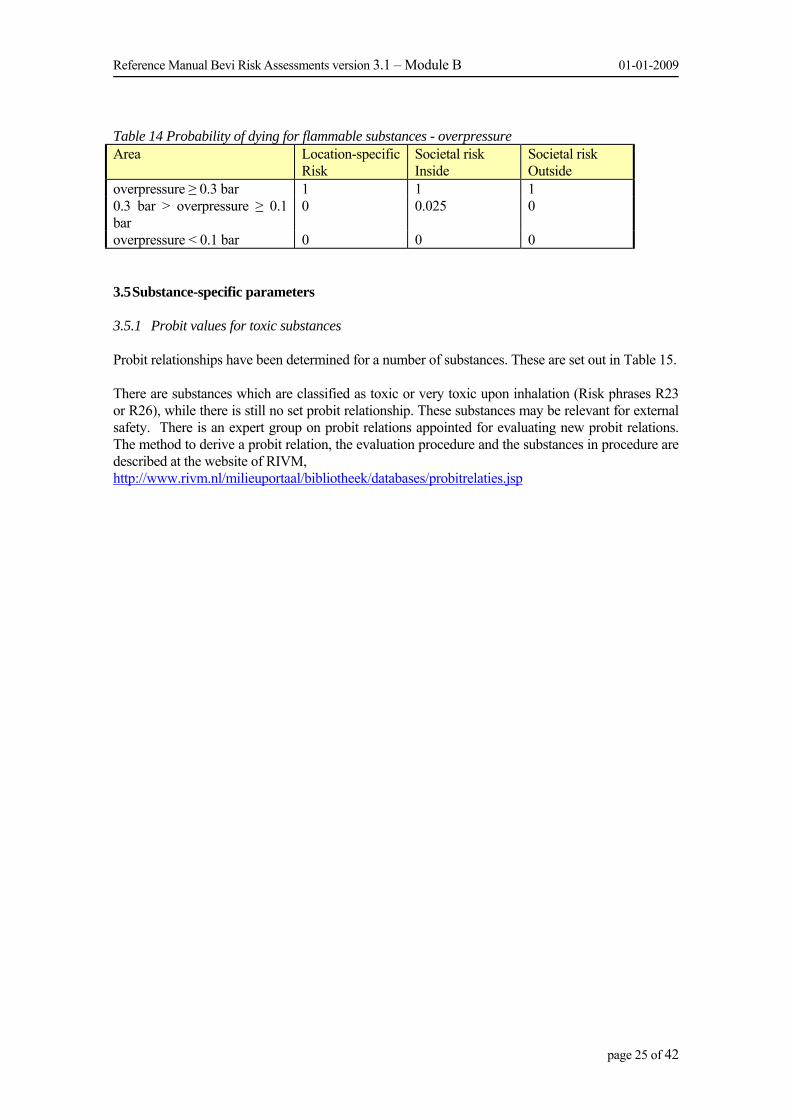
Table 14 Probability of dying for flammable substances - overpressure Area Location-specific
Risk Societal risk Inside
Societal risk Outside
overpressure ≥ 0.3 bar 1 1 1 0.3 bar > overpressure ≥ 0.1 bar
0 0.025 0
overpressure < 0.1 bar 0 0 0 3.5 Substance-specific parameters 3.5.1 Probit values for toxic substances Probit relationships have been determined for a number of substances. These are set out in Table 15. There are substances which are classified as toxic or very toxic upon inhalation (Risk phrases R23 or R26), while there is still no set probit relationship. These substances may be relevant for external safety. There is an expert group on probit relations appointed for evaluating new probit relations. The method to derive a probit relation, the evaluation procedure and the substances in procedure are described at the website of RIVM, http://www.rivm.nl/milieuportaal/bibliotheek/databases/probitrelaties.jsp

Reference Manual Bevi Risk Assessments version 3.1 – Module B 01-01-2009
page 26 of 42
Table 15 Constants for the toxicity of a substance, a, b and n. These values relate to the probit relationship with a concentration of C (in mg m-3 or ppmv) and an exposure time of t (in min.).
Substance Cas No A (C in mg/m3)
A (C in ppmv)
B N
Acrolein 107-02-8 −4.1 −3.22 1 1 Acrylonitrile 107-13-1 −8.6 −7.52 1 1.3 Allyl alcohol 107-18-6 −11.7 −9.86 1 2 Ammonia 7664-41-7 −15.6 −16.21 1 2 Arsine 7784-42-1 −11.2 −8.78 1.61 1.24 Azinphosmethyl 86-50-0 −4.8 1 2 Bromine 7726-95-6 −12.4 −8.54 1 2 Chlorine 7782-50-5 −6.35 −4.81 0.5 2.75 Ethyleneimine 151-56-4 −11.6 −10.36 1.77 1.13 Ethylene oxide 75-21-8 −6.8 −6.16 1 1 Phosphamidon 13171-21-6 −2.8 1 0.7 Phosphine 7803-51-2 −6.8 −6.03 1 2 Phosgene 75-44-5 −10.6 −7.69 2 1 Carbon monoxide 630-08-0 −7.4 −7.21 1 1 Methyl bromide 74-83-9 −7.3 −5.75 1 1.1 Methylisocyanate 624-83-9 −1.2 −0.57 1 0.7 Methylmercaptan 74-93-1 −17.8 −16.33 2.05 0.98 Parathion 56-38-2 −6.6 1 2 Nitrogen dioxide 10102-44-0 −18.6 −16.06 1 3.7 Tetraethyl lead 78-00-2 −9.8 −4.53 1 2 Hydrogen chloride 7647-01-0 -37.3 -35.62 3.69 1 Hydrogen cyanide 74-90-8 -9.8 -9.43 1 2.4 Hydrogen fluoride 7664-39-3 −8.4 −8.62 1 1.5 Hydrogen sulphide 7783-06-4 -11.5 -10.76 1 1.9 Sulphur dioxide 7446-09-5 −19.2 −16.76 1 2.4
It is also possible that substances are not classified as toxic or very toxic upon inhalation (Risk phrases R23 or R26), but are still relevant for external safety. For example, this includes substances that are not classified for inhalation. For any such substances, it must be determined on an individual basis whether the substance needs to be included in the QRA and if so, using which probit relationship. This should be submitted to the Probit Relationships Management Group. 3.5.2 Inert substances The release of large quantities of inert substances such as nitrogen can lead to suffocation. In general the risks associated with the storage of inert gases are negligible. Only in the case of very large storage quantities, for example refrigerated storage facilities for producers, is it sensible to include the release of inert substances in the risk analysis. The following probit relationship can be used for inert substances:
( )∫+−= dtC 2.5ln7.65Pr
where

Reference Manual Bevi Risk Assessments version 3.1 – Module B 01-01-2009
page 27 of 42
Pr probit associated with the probability of dying (-) C concentration at time t (ppmv) t exposure time (minutes) Note:
1. Carbon dioxide is a substance that has toxic effects and is not only active on oxygen replacement.
3.5.3 Oxygen Oxygen is a substance which increases fire hazard, and high concentrations lead to an increased probability of fire in the surrounding area. In general, the risks associated with the storage of oxygen are negligible. Only in the case of very large storage quantities, for example refrigerated storage facilities for producers, is it sensible to include the release of oxygen in the risk analysis. An effective probit relationship cannot be worked out for oxygen. It is necessary to determine whether the storage of oxygen is relevant to external risk based upon the following levels of effect. Plethal = 0.1 for concentrations of oxygen in air greater than 40 vol% Plethal = 0.01 for concentrations of oxygen in air between 30 and 40 vol% Plethal = 0 for concentrations of oxygen in air between 20 and 30 vol% An oxygen concentration of 40 vol% in air corresponds with an additional quantity of oxygen of 24.1 vol% from the dispersion calculation; 30 vol% oxygen in air corresponds with 11.4 vol% from the dispersion calculation.

Reference Manual Bevi Risk Assessments version 3.1 – Module B 01-01-2009
page 28 of 42
4. Technical documentation 4.1 Introduction The risk analysis must be documented in such a way that the competent authority has enough information to be able to effectively assess the risk analysis in terms of content. This means amongst other things that all deviations from standard modelling need to be clearly defined. This chapter describes what documentation needs to be available in order to be able to assess a QRA, as well as specifying in more detail the obligation to report a QRA to a competent authority responsible for the Wm [Environmental Protection Act]. 4.2 Obligation to report a QRA to a competent authority responsible for Wm The items that need to be reported on in a QRA are set out in Table 16 Summary of the items that need to be reported on in a QRA. Sensitive information may be present in the items noted as confidential. You can then weigh up whether to supply a second, public text. The second text must still be sufficient to provide third parties with the opportunity to form an opinion about safety, and where applicable the risks (see note 1). Table 16 specifies the items for an independent QRA. Often a QRA will be part of a comprehensive package of information, such as a Safety Report or a Wm application. In such cases a reference to information included elsewhere in the package will of course be sufficient, e.g. for a process description.
Table 16 Summary of the items that need to be reported on in a QRA Subject Confidential/
public 1 General report information Administrative information:
• name and address of the establishment Public
Reason for drawing up QRA Public Method used
• Bevi calculation method with version numbers Public
QRA set date Public 2 General description of the establishment Purpose of the establishment: main activities and products Public Location and layout of industrial site, based upon scale map(s) more
detailed than 1:10,000. The following is indicated: • entrances and exits, roads • installations (process, storage, loading/unloading) • offices/buildings/locations where people are / might be • North arrow and scale indication • Site boundary
Public
2.1 The workflow description of the calculated installations Purpose of the process Public Reaction equations including:
• secondary reactions • heat effects • reaction speeds
Public

Reference Manual Bevi Risk Assessments version 3.1 – Module B 01-01-2009
page 29 of 42
Process flow diagram (PFD) Explanation: For the second, public text, a simplified PFD is sufficient in which only the important equipment is included. The substitute text for the confidential parts of the workflow description can consist of a general summary.
Confidential
including: • important equipment • control loops • blocking valves
Confidential
Limits outside which there is an increased danger (response-excursion etc.) pressure, temperature and concentration.
Confidential
Description of the relevant physical and chemical characteristics of the hazardous substances, mixtures and reaction products that are present:
• name • composition for mixtures • chemical formula • CAS number • GEVI (hazard identifier) code • danger label
for other matters, refer to information in the TDP. (see note 5)
Public
2.2 The calculated installation and the layout Layout with legend,
Explanation: the layout already set out under 1 can be used here in which the relevant installation is specifically indicated
Public
and on which the following is indicated: • location of the installation parts • layout of storage areas • tank bund
Confidential
Capacity/throughput/number of batches per year Public Permitted quantities of the substance according to licence Public Subdivision of the installation into sections and/or containment
systems, blocked by remote controlled valves. Explanation: A substitute general text needs to be included here too
Confidential
Description of the action of the containment systems (reaction time) Confidential 3 Description of surrounding area Local development and designated purpose for the area
• land-use plans (partly or entirely) inside the 10-6 contour Public
Current topographical map Public A description of the population density around the establishment,
specifying the way in which this description has come about. Public
Possible dangers from outside the establishment which might have an effect on the establishment (neighbouring businesses/activities, flight paths, wind turbines)
Public
Indication of all relevant potential ignition sources, if the flammability of a substance present in the establishment has been the cause for selecting a particular part of the establishment
Public
Roughness length and weather station applied Public

Reference Manual Bevi Risk Assessments version 3.1 – Module B 01-01-2009
page 30 of 42
4 The quantitative risk analysis (QRA) Use the subselection system in accordance with chapter 2 of
Module C of this Reference Manual on containment systems Public
Overview of subselection completed included in (confidential) appendix (see note 3)
Confidential
List of selected installation parts with their assignment numbers as a result of subselection
Public
Description of the implementation of the QRA in accordance with this Reference Manual. Description includes:
• a full list of initial failure scenarios • probabilities and consequential scenarios • (see note 4)
Public
5 Description of possible risks for the environment Summary overview of the results of the QRA, in which at least the
following is included:
Map with calculated location-specific risk, with contours for 10-4, 10-5, 10-6, 10-7 and 10-8
Public
Map with calculated location-specific risk, on the scale of the surrounding land-use plans, with contours for 10-5 and 10-6
Public
FN graph with the societal risk for the establishment: the number of fatal victims is set out on the horizontal axis of the graph, and the cumulative probability up to 10-9 per annum is set out on the vertical axis.
Public
6 Scenarios relevant for external safety Explanation: Provided no specific information is given here about
LODs and the location of the scenarios, then this does not represent sensitive information
summary of installations which mainly contribute to calculated risks for external safety (location-specific risk and societal risk, respectively)
Public
ranking of these installations Confidential Scenarios that mainly determine the calculated risk are specified as
such Confidential
The following is set out for the critical scenarios (see note 2): • substance • scenario frequency • source strength • source duration • damage distances for weather classes F1.5 and D5. (1%
probability of dying in case of exposure)
Public
Applicable preventative and repressive measures specifically included in the QRA are stated or reference is made to somewhere else in the Safety Report or Wm application
Confidential
Notes:
1. The SAFETI-NL study (the psu file) with which the risks are calculated is an integral part of the documentation. This file contains some confidential information. Research must demonstrate whether the non-confidential information present in this file can be sensibly extracted. Working arrangements have been formulated for the interim period which infer

Reference Manual Bevi Risk Assessments version 3.1 – Module B 01-01-2009
page 31 of 42
that the competent authority may view the psu file at the company. In addition the most important characteristics of the QRA must be set out in a separate document. This concerns the subselection and risk assessments in particular. At least the points specified in Table 16 must be included in the document.
The psu file is also the basis for calculating societal risks and therefore an ingredient for recalculating the FN graph as a part of the accountability obligation, for example in the case of a change in a land-use plan. According to the working arrangements that have been made, the relevant company will provide collaborative support in the required recalculation of the FN graph.
2. Critical scenarios are intended to mean:
The scenarios that when added together define at least 90% of the location-specific risk for the 10-6 contour (i.e. the ‘remainder’ that has not been defined in detail is added together as < 10%)
The scenarios that are added together define at least 90% of the societal risk in the intervals 10 – 100 and 100 – 1000.
3. In order to be able to verify a completed subselection, it is necessary for the subselection to
be correctly defined in the documentation. This means that all completed steps are defined including the results and any variations in the systematic approach. The most important parts that need to be included in the documentation are as follows: − Description of the relevant containment systems including the process conditions and
the location. The addition of a layout is strongly recommended in this. − Inventory and subdivision into containment systems. − The maximum effect distances (if calculated) and the minimum distance to the site
boundary per containment system. − The indication numbers A and selection numbers S, including the process factors,
quantities of substance and limit values used, for each containment system and point on the site boundary.
− If the 50% rule is applied, it must be specified for each point on the site boundary which containment systems have been selected and which containment systems with a selection number greater than 1 have not been selected.
− An overview of the containment systems that are included in the QRA. In addition to the containment systems that were selected by means of the subselection, this also relates to containment systems that fall outside the range of the subselection, such as PGS 15 storage sites.
Part of this information can be made available electronically, for example in the form of a spreadsheet.
When determining the relevant containment systems, it is good practice to fit in with a system used within the company that provides a full summary of all vessels, pipelines and similar, for example. This will demonstrate that no containment systems have been forgotten. This must be stated in the documentation.
4. If there is any variation from the standard failure frequencies and/or if a scenario is
modelled as a ‘user defined source’, this must be explicitly stated.
5. Toxic substances without a set probit relationship and mixtures must be stated separately. The probit relationship that is used in the QRA calculation must be included, stating the source for these substances.

Reference Manual Bevi Risk Assessments version 3.1 – Module B 01-01-2009
page 32 of 42
5. Appendix: Account An explanation is included in this chapter for the various chapters in the Reference Manual. 5.1 Chapter 2 Ignition sources 2.2 Ignition sources Ignition sources outside the establishment are only relevant for the societal risk. A detailed table is included in the Purple Book for all types of ignition sources. Because the documentation concerned is very limited, the table has been simplified greatly. The included information is partly copied from the Purple Book (line sources, population), partly from the IPO Reference Manual (establishment, process installation). For railways and motorways, the probability of ignition is calculated using:
d = N E / v
where N the number of passing vehicles per hour (h-1) E length of road or railway section (km) v average vehicle speed (km h-1) If d ≤ 1, then the value of d is equal to the probability that the source is present when the flammable cloud passes by, Ppresent ; the probability of an ignition during the time window 0 to t, P(t), is then equal to: P(t) = d ⋅ (1 − e−ωt) If d ≥ 1, then d is the average number of sources that is present when the flammable cloud passes by; the probability of an ignition during the time window 0 to t, P(t), is then equal to: P(t) = (1 − e−dωt) where the effectiveness of the ignition for one vehicle, ω, is equal to 8.51 × 10⁻³ s-1 for a road and a non-electrified railway line and 26.8 × 10⁻³ s-1 for an electrified railway line. Default values are included in the Reference Manual for motorways, roads and railways for the number of vehicles per hour and the average speed. For motorways, the number of vehicles is a rough estimate based upon the categorisation of motorways in the study ‘Veilig Vervoer over Weg’ [Safe Transportation by Road] [4]. A distinction is made for motorways (dual lane) between three intensities: < 18,000, 18,000 – 30,000 and > 30,000 vehicles per 24 hour period. A distinction is made for motorways (three and four lane) between three intensity categories: < 44,000, 44,000 – 64,000 and > 64,000 vehicles per 24 hour period. 36,000 vehicles is selected as the default value per 24 hour period. The other default values are not well-founded estimates.
The probability of an ignition for a surface area in a residential area during the time window 0 to t, P(t), is given by: P(t) = (1 − e−nωt)

Reference Manual Bevi Risk Assessments version 3.1 – Module B 01-01-2009
page 33 of 42
where: ω effectiveness of the ignition for one person, 0.168× 10⁻³ s-1 n the average number of people in the surface area
It is assumed that the probability of ignition does not depend on the inside – outside distribution. 5.2 Chapter 3 Model parameters 3.2 Modelling scenarios To determine what a significant contribution from subsequent delivery is, a test calculation was completed for a scenario in which 25 tonnes of ammonia is released (under pressure) within 10 minutes. Then the quantity of outflow was raised while the outflow rate stayed the same, in order to simulate subsequent delivery from other parts of the system. The result is given in Table 17. It is evident from this that a subsequent delivery of 20% leads to an increase in the risk distance of 4 – 7%.
No criteria have been laid down to determine what increase in risk distance is significant. If an increase in the risk distance of more than 5 – 10% is maintained as a criterion, this means that a subsequent delivery of more than 10-20% must be included in the QRA calculation. On this basis 10% is maintained. Table 17 Influence of the quantity of outflow of ammonia on the location-specific risk at 200 m and
400 m; the percentage change in location-specific risk (PR) and in distance is illustrated. Quantity Subsequent
delivery Increase at 200 m Increase at 400 m
PR Distance PR Distance 25 tons 0% 0% 0% 0% 0% 30 tons 20% 8% 7% 22% 4% 35 tons 40% 14% 13% 35% 7% 40 tons 60% 18% 17% 47% 10% 50 tons 100% 27% 25% 67% 14%
When selecting between the ‘line rupture’ and ‘long pipeline’ scenario, the Reference Manual indicates that for the ‘long pipeline’ scenario L/D >> 300 where L is the pipe length ‘upstream’ of the hole. This is translated into the long pipe length model being used for (1) only long transport lines between two units on a site and (2) L/D > 1000, where L is the pipe length and D is the pipe diameter. 3.3.1.2 Height of the outflow in relation to the surrounding area A distribution of outflow locations over the height of a vessel was permitted in the Purple Book. As part of a unification of the QRA calculations, one location is now stipulated. The minimum height is set at one meter to prevent a very large proportion of the emission from immediately raining out. It is only proposed to work on the basis of a height of 0 meters for underground reservoirs and pipelines. 3.3.1.3Height of the outflow in relation to the reservoir In the Purple Book, the outflow is stipulated based upon half of the height of the fluid column. The stipulation for the maximum fluid column corresponds with the location of the hole in the reservoir, namely at the bottom.

Reference Manual Bevi Risk Assessments version 3.1 – Module B 01-01-2009
page 34 of 42
3.3.1.4 Outflow from reservoirs with non-uniform This chapter attempts to adopt a practical approach for distillation columns etc. A further splitting of the 10 mm hole over multiple locations is not sensible given the small contribution of this scenario to the overall risk. The substance in the QRA is selected based upon the effect distance for weather class D5. An average weather class is selected, so that the right choice is made for the most common weather classes. 3.3.4Loss of pressure as a result of valves and bends In the default calculation it is assumed that there is no loss of pressure due to the presence of valves and bends in the pipeline. As a result the outflow is slightly overestimated. 3.3.6 Failure pressure of a BLEVE The failure pressure of a BLEVE is important for the heat radiation that is released. It is assumed that a BLEVE occurs as a result of heat radiation in the area surrounding the tank. For LPG tank wagons, the test pressure equals 28 bar. A practical test completed by BAM using a propane tank wagon filled to approximately 20% resulted in a failure pressure of 25 bar [5]. The RBM II calculation program uses a lower failure pressure for a hot BLEVE for a tank wagon, which is 19.5 bar. This value is worked out based upon the test pressure for stationary tanks. There are arguments in favour of using a lower failure pressure than the test pressure for tank wagons. Impairing of the metal wall, for instance, by irradiation of the vapour space above the liquid, may play an important role, as a result of which a BLEVE might occur at a lower pressure. When transporting hazardous substances, there is also the question of whether a pool fire for a flammable liquid tank wagon lasts sufficiently long to heat up the contents to the temperature associated with the failure pressure. In view of the aforementioned, it was decided to adapt the RBMII approach and for tank wagons to assume a failure pressure of 19.5 bar. For road tankers a hot BLEVE is not assumed in RBMII, because the risks of a hot BLEVE (failure as a result of a fire under the tank) are negligible compared to those of a cold BLEVE (failure as a result of a head-on collision). For the LPG refuelling stations distances table, the reference bursting pressure for the road tanker is calculated on the basis of the pressure setting on the tanker safety valve [6]. This pressure setting is equal to 19.25 barg. This results in a failure pressure of 1.21 × 20.25 bara = 24.5 bara. If no safety valve is present, a failure at test pressure must be assumed. This means that the greater the test pressure, the stronger a reservoir will be, and also the greater the calculated effects and risks will be. In practice safety valves will be present for reservoirs that are relevant in terms of external safety, so that this discrepancy is not a problem. 3.3.7 Time-dependent outflow SAFETI-NL provides the facility to calculate using time-dependent outflow. A number of considerations are relevant when choosing the method.
− Entering a time-dependent outflow is more work, because characteristics of the reservoir must also be entered.
− If the duration of the outflow is significantly larger than 1800 s, there is little difference between a time-dependent outflow and a constant outflow, because the flow rate does not change much the first 1800 s.
− If the duration of the outflow is much smaller, in the order of 20 s, then the time-dependent outflow may lead to greater effect distances than the constant outflow. This happens because a transition can take place in the case of a short-lived, constant outflow to a semi-instantaneous outflow, meaning diffusion is also modelled along the wind axis. In the case of

Reference Manual Bevi Risk Assessments version 3.1 – Module B 01-01-2009
page 35 of 42
a time-dependent outflow with several segments, diffusion is not modelled along the wind axis, which results in an overestimation of the concentration.
− If the outflow from a long pipeline is modelled as a time-dependent outflow with five segments (for example), it might happen that fitting a valve in the pipeline results in larger effect distances, and therefore a higher risk. By fitting a valve the outflow ends after a specific, short period of time. Given an unchanged number of segments, this means that the duration of one segment decreases, and therefore the average flow rate of the first segment increases. In this way an increase in the risk is calculated, particularly for flammable substances (where the flow rate of the first segment is important for the risk). This does not play a role if a constant outflow rate is always assumed, based upon the first 20 s, for example.
The choice was made to work on the basis of a constant flow rate with conditions of time t = 0 s (vessel, short pipeline) or a constant flow rate averaged over 0 – 20 s (long pipeline). This is the simplest method of modelling and an effective approach to short (< 50 s) and long (> 1800 s) outflows. This approach will only provide an overestimation of the risks if a reservoir runs dry during the period 50 – 1800 s. For the best possible risk assessment it is therefore permitted in these cases to assume a varying outflow rate with at least five segments. The risk analyst must however provide support for the choice that is made. NB: Given a constant outflow the entire contents of the reservoir flow out, because the conditions
at time t = 0 are used. In the case of time-dependent outflow, the quantity that has flowed out may be smaller because mass is left behind after relieving the pressure down to atmospheric pressure.
3.3.9 Roughness length of the surrounding area The default value of 0.3 meters corresponds with RBM II and is an average across the whole of the Netherlands for transport. In an industrial area buildings are present, and a higher value of 1 meter is used for calculations. 3.3.10 Meteorological weather station and parameters The default values for the meteorological parameters were derived from the KNMI [Royal Netherlands Meteorological Institute] statistics for the normal period of 1971 – 2000, De Bilt station [7]. Because the calculations are completed separately for the day and the night, the default values are now also defined for day and night separately. The following approach was taken:
Temperature KNMI statistics provide the 24-hour average daily temperature (9.8 °C annual average), the daily maximum (13.7 °C annual average) and the daily minimum (5.7 °C annual average). The temperature for the nighttime period is calculated as the average of the daily average and the daily minimum, the temperature for the daytime period is calculated as the average of the daily average and the daily maximum. Because a distribution of 0.44 for the day and 0.56 for the night is observed in the QRA, the daytime temperature is calculated as 9.8 + 0.56 × (13.7 – 9.8) = 12 °C and the nighttime temperature as 9.8 – 0.44 × (9.8 – 5.7) = 8.0 °C. Using this correction the daily average temperature is equal to 0.44 × 12 °C + 0.56 × 8 °C = 9.8 °C. Using an annual average day and night temperature is not, however, very meaningful in the QRA: the variation in temperature between summer and winter is significantly greater than the variation in the annual average daily maximum or minimum. In respect of the temperature of the ground and the water, it is proposed that the annual average is used due to the buffering operation of large-scale (water) masses.

Reference Manual Bevi Risk Assessments version 3.1 – Module B 01-01-2009
page 36 of 42
Air pressure KNMI statistics provide the 24-hour average air pressure. The value is 101550 Pa. This value is used for the daytime period and the nighttime period.
Humidity KNMI statistics provide the 24-hour average humidity (82% annual average) and the humidity at 12 o'clock UT (72.2% annual average). The humidity for the daytime period is calculated as the average of the daily average and the humidity at 12 o'clock UT, in other words 82% – 0.56 × (82% – 72.2%) = 76.5%. The humidity for the nighttime period is such that the 24-hour average is equal to 82%, in other words (82% – 0.44 × 76.5%)/0.56 = 86.3%. Solar radiation KNMI statistics provide the 24-hour total of the overall radiation (950 J/cm2). This value is assigned in full to the daytime period, so that the solar radiation is then equal to (950 J/cm2 × 10,000 cm2/m2)/(10.5 × 3600 s) = 0.25 kW/m2. Mixing layer height The mixing layer height for the various weather classes has been calculated
3.4.3 Blocked outflow The Purple Book prescribes calculating with blocked outflow if two conditions are met, which is if the probability of a blocked outflow is greater than 0.5 averaged over all outflow directions. The criterion for blocked outflow is that the length of the free jet is greater than 3 × the distance between the outflow point and the obstacle. In practice, a blocked outflow is not often used for calculations. For a uniform approach it has therefore now been stipulated that unimpeded outflow is always assumed for an outflow outside. 3.4.4 Mass involved in a BLEVE The Purple Book stipulates that the full mass in the tank must be included in the BLEVE. It is evident from a review of the BLEVE modelling that a value of 3 × the flash fraction for the failure pressure is sufficiently conservative [8]. This value has now been stipulated. 3.4.6.1 Instantaneous release of a flammable gas It has been included in the event tree that, in addition to a fire ball, a flash fire and explosion can also occur in the case of direct ignition of the released flammable gas. This event has a historical background. In earlier reference manuals it has been described that the probability of a BLEVE is equal to 0.7, given direct ignition of an instantaneous release [9]. This means that there is a probability of 0.3 of direct ignition of an instantaneous release without a BLEVE occurring. A good model is not available for this as a BLEVE is the anticipated outcome. This is artificially resolved in the Purple Book by developing and using a separate model for this situation. In this model the cloud expands into the UFL first, after which the (semi-)direct ignition occurs. This results in the flash fire and explosion. 3.4.6.6 Probability of direct ignition, Pdirect The probabilities of ignition are defined in the Purple Book for gases (low reactive and average/high reactive) and K1 liquids. The probabilities of ignition for K0 liquids and K2, K3 and K4 liquids have not been available. The probabilities of ignition have now been defined for all flammable gases and liquids, whereby the definition has been aligned with the WMS [Environmentally Hazardous Substances Act] classification.
Reference Manual Bevi Risk Assessments version 3.1 – Module B 01-01-2009
page 37 of 42
The following approach has been taken: Category 0 Flammable gases fall into category 0. Consequently, the probabilities of ignition for
flammable gases have been maintained for all substances in category 0, thus flammable liquids too.
No probabilities of ignition are defined in the Purple Book for scenarios involving a collision of ships. RBMII was referred to for this.
Category 1 For category 1 liquids the Purple Book defines a direct probability of ignition of 0.065.
For road transport (category LF2, flash point < 23 °C), a direct probability of ignition of 0.13 is used (and 0.87 for no ignition). This is the combination of direct ignition (0.065) and delayed ignition (0.065) with the same effects (pool fire). For rail transport a direct probability of ignition of 0.25 is used (and 0.75 for no ignition) [13].
The Purple Book states that for the Location-Specific Risk a delayed probability of ignition must be assumed that is equal to (1 – probability of direct ignition). For a K1 liquid this means that the total probability of ignition (direct + delayed) equals one. For flammable liquids the flammable cloud is often scarcely greater than the pool: for weather class D5 there is no LFL contour outside the pool if the vapour pressure is less than 550 mbar [10]. The probability of delayed ignition is small and the assumption of a total probability of ignition equal to 1 leads to a conservative approach.
Category 2 No direct probability of ignition has been defined for category 2 liquids in the Purple
Book. For road transport (category LF1, flash point > 23 °C and < 61 °C), the direct probability of ignition is 0.01 (and no delayed ignition). This value has been adopted.
Category 3 Even if a category 3 substance does not have a WMS classification, it satisfies the
definition in the BEVI for a flammable substanceo. Gas oil has a flash point > 55 °C [Chemical Safety Cards] and therefore falls under category 3. Gas oil falls under category LF1 in the S3b method. A probability of ignition of 0.01 is therefore used for category 3 in the calculations for bunker stations [11]. It is now proposed to attribute no probability of ignition to category 3 (and therefore not to include it in the QRA), because the substance does not have a WMS classification. The substance must only be included if the process temperature is greater than the combustion temperature.
Category 4 Even if a category 4 substance does not have a WMS classification, it satisfies the
definition in the BEVI for a flammable substance. It is proposed to attribute no probability of ignition to category 4 (and therefore not to include it in the QRA), because the substance does not have a WMS classification. The substance must only be included if the process temperature is greater than the combustion temperature.
Other points for consideration are:
− The probabilities of ignition for transport units in the Purple Book are independent of the substance. These probabilities of ignition are probably only intended for K0 substances. It is proposed that the same approach is used for non-K0 substances as for stationary installations.
− In the Purple Book a flammable substance is defined within the subselection as a substance with a process temperature equal to or greater than the flash point. In the probabilities of
o flammable hazardous substance: hazardous substance, hazardous waste substance or flammable pesticide that continues to react with air of normal composition and pressure during combustion after the source that caused the ignition has been removed.

Reference Manual Bevi Risk Assessments version 3.1 – Module B 01-01-2009
page 38 of 42
ignition in the Purple Book, no distinction is made in the process temperature in relation to the flash point. It is proposed for category 2 - 4 substances that the probability of ignition for category 1 substances be used if the process temperature is equal to or greater than the flash point.
− The probabilities of ignition for category 0 substances comply with the Purple Book and are dependent on the reactivity of the substance. The definition of low reactive is not properly described. A number of substances with low reactivity are specifically mentioned in the Purple Book. For these substances it has been investigated to what extent the reactivity is relevant in determining the probability of ignition.
o 1-chloro-2,3-epoxypropane (epichlorohydrin, CAS No 106-89-8) This substance is category 2 so its reactivity is not relevant when defining the probability of ignition. The substance is, however, poisonous when inhaled, which means that it must be stated under the substances that are flammable and toxic.
o 1.3-dichloropropane (CAS No 542-75-6) This substance is category 2 and its reactivity is not relevant when defining the probability of ignition. The substance is not poisonous when inhaled.
o 3-chloro-1-propane (synonym allyl chloride, CAS No 107-05-1) This substance is category 1 and its reactivity is therefore not relevant when defining the probability of ignition. The substance is highly toxic when inhaled, which means that it must be stated under the substances that are flammable and toxic.
o ammonia (CAS No 7664-41-7) This substance is category 0. The substance is toxic when inhaled, which means that it must be stated under the substances that are flammable and toxic.
o methyl bromide (CAS No 74-83-9) This substance is category 0. The substance is toxic when inhaled, which means that it must be stated under the substances that are flammable and toxic.
o carbon monoxide (CAS No 630-08-0) This substance is category 0. The substance is toxic when inhaled, which means that it must be stated under the substances that are flammable and toxic.
o chloroethane (synonym ethyl chloride, CAS No 75-00-3) This substance is category 0 which means that its reactivity defines its probability of ignition. The substance is not classified as toxic when inhaled and is therefore specifically stated under the flammable substances.
o chloromethane (synonym methyl chloride, CAS No 74-87-3) This substance is category 0 which means that its reactivity defines its probability of ignition. The substance is not classified as toxic when inhaled and is therefore specifically stated under the flammable substances.
o methane (CAS No 74-82-8) This substance is category 0 which means that its reactivity defines its probability of ignition. The substance is therefore specifically stated under the flammable substances.
o tetraethyl lead (CAS No 78-00-2) This substance is category 3 and its reactivity is not relevant when defining the probability of ignition. The substance is toxic when inhaled, which means that it must be stated under the substances that are flammable and toxic.
3.4.9.2 Flammable substances - heat radiation Fatality for heat radiation is taken from the Purple Book. This means that fatality in the area between the flame zone and the 35 kW/m2 contour is overestimated if the exposure time is (significantly) shorter than 20 seconds. This is particularly relevant in the case of a BLEVE (fire ball). The radius of the fire ball is indicated in Table 18 for a propane BLEVE, as are the duration of the BLEVE, the distance up to 35 kW/m2 and fatality as calculated using the probit relationship based upon the duration of the BLEVE and 35 kW/m2.

Reference Manual Bevi Risk Assessments version 3.1 – Module B 01-01-2009
page 39 of 42
Table 18 Distances for a propane BLEVE (failure pressure 19.5 bar) Mass in BLEVE
Radius Duration 35 kW/m2 contour
Fatality 35 kW/m2
probit relationship
48,000 kg 108 m 14 s 165 m 0.86 10,000 kg 65 m 9 s 90 m 0.52 1,000 kg 31 m 5 s 35 m 0.07 It is evident from Table 18 that for large BLEVEs (more than 50 tons) the duration of the BLEVE amounts to 20 s, meaning there isn't a big difference between the calculation using the probit relationship and the calculation according to the Purple Book. For small BLEVEs (1,000 kg in size), the radius of the fire ball is comparable with the 35 kW/m2 contour, which also means that there isn't a big difference between the calculation using the probit relationship and the calculation according to the Purple Book. Only for BLEVEs with a value amounting to 10 tonnes will the default modelling from the Purple Book result in an overestimation of the risks. The calculations in Table 18 are based on a failure pressure of 19.5 bar. In the case of a lower failure pressure the heat radiation is also lower, which means that the distance to the 35 kW/m2 contour becomes smaller and ends up being located closer to the radius of the fire ball. This results in smaller differences between the default modelling from the Purple Book and a calculation based upon the probit relationship. The calculated differences in Table 18 are acceptable, which means that the current default modelling in the Purple Book (and RBMII) has been used. 3.5.1 Probit values for toxic substances Table 15 gives the probit relationships for a number of toxic substances. The values for a, b and n (units mg/m3 and minutes) have been taken from Part 4 of PGS 1 [4]. The SAFETI-NL calculation package calculates in the units ppmv and minutes. Consequently, the values for a, b and n are also given in the units ppmv and minutes. These are calculated using the following formula:
nMbaa
mmgppm
⎟⎟⎟⎟
⎠
⎞
⎜⎜⎜⎜
⎝
⎛
××+=
2732824.22
ln3/
where M is the molar mass (in g/mol).
Table 2 of PGS 1 – part 4 indicates the set probit values, table 3 of PGS 1 – part 4 indicates the proposed probit values. In Table 15 the set probit values are adopted and the proposed probit values are for the substances without set probit values. The proposed probit values for hydrogen chloride, hydrogen cyanide and hydrogen sulphide are expected to be of better quality than the set values. However, the Probit Relationships Management Group still needs to officially set the new values.
3.5.2 and 3.5.3 Inert gases and oxygen The safety reports by Hoek Loos IJmuiden, Nederlandse Gasunie and Air Products were examined for the modelling of inert gases and oxygen.
− No risk calculations are included in the Safety Report by Hoek Loos IJmuiden [12] because “… it is not possible to carry out the so-called quantitative risk analysis on the substances oxygen, nitrogen and argon.” There are several cryogenic storage tanks; the maximum storage quantity (smallest tank – largest tank) is equal to 570 – 1824 tonnes of oxygen, 17 – 714 tonnes of argon and 2000 – 3200 tonnes of nitrogen.

Reference Manual Bevi Risk Assessments version 3.1 – Module B 01-01-2009
page 40 of 42
ts.
− The risks are outlined for cryogenic storage of nitrogen (19,000 m3) in the Veiligheidsrapport [Safety Report] by the Nederlandse Gasunie [13]. This report states that an oxygen percentage of 6 – 8% for 8 minutes is 100% lethal, for 6 minutes is 50% lethal and for 4 – 5 minutes: after treatment, recovery takes place. Direct lethal effects are associated with 10% oxygen in air. For the subselection 50% nitrogen in air (10.5% oxygen) is considered to be lethal. The probit function used is a = –86.793, b = 1 and n = 6.995 for the concentration in ppmv.
− In the Safety Report by Air Products [14], inert gasses and oxygen are not included in the risk assessmen
TNO has carried out a study on behalf of Hoek Loos into Damage criteria for oxygen and nitrogen [15].
− The damage criteria for oxygen enrichment are fatality of 10% for 40% oxygen for 10 minutes and fatality of 1% for 30% oxygen for 10 minutes. These values are based on the assumption that ignition is required (probability of ignition for a person 0.01 in one minute, approximately 0.1 in 10 minutes), and that clothing cannot be extinguished in time (probability of failure to extinguish is 1 for 40% and 0.1 for 30%).
− The damage criteria for oxygen depletion are fatality of 100% for 10% oxygen for 10 minutes and fatality of 1% for 14% oxygen for 10 minutes.
RIVM is involved in setting the AEGL limit values for suffocation (lack of oxygen). The AEGL-3 value is expected to be in the order of 14 – 16%. It is clear that for inert gases and oxygen an effective probit relationship has not yet been established and proper documentation is not available. In order to still be able to use a uniform calculation method in these cases, a proposal has been worked out for the damage criteria for oxygen and nitrogen.
− For oxygen enrichment the calculation is based upon the TNO approach. The probability of dying is 0.1 for 40% oxygen or more (10 minutes exposure) and 0.01 for 30 % oxygen (10 minutes exposure). For this, 40 (30) vol% of oxygen in air corresponds with an additional quantity of oxygen of 24.1 (11.4) vol% from the dispersion calculation. It is not possible to work out a probit relationship for this, because fatality does not increase for concentrations of 40% or more. It is therefore suggested to calculate using the following damage criteria: − 40% oxygen or more probability of dying 10% − 30% oxygen or more probability of dying 1% − This probability is based on 10 minutes exposure, but is used for all exposure times.
− The probit relationship for nitrogen is calculated based upon two points, namely 1% fatality for the AEGL-3 value of 16% oxygen in air for 60 minutes (23.6 vol% from the dispersion calculation) and 50% fatality for 10% oxygen in air for 10 minutes (52.3 vol% from the dispersion calculation). In this, 50% fatality is favoured over 100% fatality because this correlates more closely with the information from the report by LNG Maasvlakte, where lethal effects start with 10% oxygen.
− It has been found assuming b = 1 that the values a = –17.8 and n = 5.2 effectively describe the two points (concentration of inert gas in vol%, time in minutes). The probit relationship results in the relationship between fatality, concentration and duration as given in Table 19. The values found in this appear to correlate reasonably with the different damage criteria.
Table 19 Relationship between fatality, concentration of oxygen in air and duration based upon the probit relationship where a = –17.8, b = 1 and n = 5.2. Fatality 30 minutes 10 minutes 1 minute 1% 15.4 vol% 14.1 vol% 10.2 vol% 50% 12.2 vol% 10.2 vol% 4.1 vol% 95% 9.0 vol% 6.1 vol% -

Reference Manual Bevi Risk Assessments version 3.1 – Module B 01-01-2009
page 41 of 42
Expressed in the units ppmv and minutes, the probit relationship is a = -65.7, b = 1 and n = 5.2.
5.3 Chapter 4 Technical documentation Agreements were made in the Plenary working group on Unification on 2 November 2007 about how confidential information needs to be handled in the case of a QRA report. The reason for this was the contents of the psu file, in which all input data from a QRA are storedp. It is agreed that the psu file may remain inside the company, but must be available to the competent authority. Access to this file will in any case be necessary for the competent authority in two situations: 1. when assessing the QRA, and 2. when setting the societal risk as a result of changes in the population file. In the same Plenary working group on Unification it was also agreed to research "with sufficient priority" whether the information from the psu file required to comply with accountability can be "separated". At that time an overview of the documentation that needs to be available to be able to assess a QRA was included in the Reference Manual Bevi Risk Assessments. As a result of the working arrangements that have been made, the reporting obligations for a QRA need to be included in the Reference Manual. An attempt is made to fit in with existing materials as much as possible. Ultimately the tables in which the information to be included in a Safety Report is split up into public and (potentially) confidential appear to be a very useful starting point. The contents of these tables have already been coordinated and finalised and, moreover, are sufficiently detailed. These tables are included in the Aanwijzigingen voor implementatie van BRZO 1999, pages 27 - 38 [Instructions for implementation of BRZO 1999] [16] and in the Werkwijzer BRZO [Major-Accidents (Risks) Decree Guideline Policy] (appendix 1 pages: Tab C 3-2 to C 3-24) [17]. When adopting the items in Table 16, the following considerations were included: 1. The chapter "Technical documentation" must refer to an independent QRA, because the
specifications will also have to be suitable for QRAs that do not constitute part of a Safety Report.
2. Bevi links consequences to the location of the 10-5 and 10-6 and therefore these contours must be
presented with an accuracy that corresponds with the relevant land-use plans. 3. The regulations included in earlier versions of this Reference Manual had to be retained.
p This psu file thus represents an important link in the chain for achieving the ultimate goal of Unification, i.e to make QRA calculations reproducible

Reference Manual Bevi Risk Assessments version 3.1 – Module B 01-01-2009
page 42 of 42
References [1] Handreiking Verantwoordingsplicht Groepsrisico www.groepsrisico.nl [2] J.W. Verkaik. Programma Roughness_map. KNMI, 2000. [3] Commissie Preventie Rampen. Methoden voor het berekenen van fysische effecten, tweede
druk CPR 14 (“Gele Boek”). Voorburg: The Ministry for Social Affairs and Employment, 1988.
[4] AVIV. Veiligheid Vervoer over de Weg. Eindrapport deelnota 1. Basisgegevens en kerncijfers zwaar verkeer, 1996.
[5] Untersuchung der versagensgrenzen eines mit Flussiggas gefullten Eisenbahnkesselwagens bei Unterfeuerung. Final report dated 13/9/99
[6] J.M. Ham, A.W.T. van Blanken. Invloed systeemreacties LPG-tankinstallatie op risico LPG-tankstation (ligging PR-contour). TNO report R 2004/107, 2004
[7] KNMI. Klimaatatlas van Nederland – normaalperiode 1971 – 2000. Elmar E.G., Rijswijk, 2002. ISBN 90389 1191 2.
[8] Martinsen, W.E., and Marx, J.D., “An improved model for the prediction of radiant heat from fireballs”, International Conference and Workshop on Modelling the Consequences of Accidental Releases of Hazardous Materials, CCPS, San Francisco, California, September 28 – October 1, pp. 605-621 (1999).
[9] Publicatiereeks Gevaarlijke Stoffen 3. Guidelines for Quantitative Risk Assessment (‘Paarse boek’). Ministry of VROM, 2005
[10] Instrument Domino-effecten. www.rivm.nl [11] P.A.M. Uijt de Haag, J.G. Post. Risicoanalyse brandstofpontons. RIVM report 610066013,
2001. [12] Hoek Loos IJmuiden. Veiligheidsrapport BRZO ’99, 2001. [13] DNV. Veiligheidsrapportage LNG-installatie Maasvlakte, april 2003. [14] Tebodin. Veiligheidsrapport Air Products Nederland B.V. locatie Rotterdam (Botlek), 2001. [15] A. Kruithof, K. Ham. Schadecriteria zuurstof en stikstof. TNO report R 2004/458, 2004
(confidential). [16] Publicatiereeks Gevaarlijke Stoffen 6. Aanwijzigingen voor implementatie van BRZO 1999. [17] Werkwijzer BRZO. See http://www.brzo99.nl under the Producten tab.

Reference Manual Bevi Risk Assessments version 3.1 – Module C 01-01-2009
page 1 of 90
Reference Manual Bevi Risk Assessments
Module C Modeling the specific Bevi categories Version Version 3.1
Date 01.01.09
This document is a translation of the document “Handleiding Risicoberekeningen Bevi versie 3.1”, dated 01-01-2009. In case of differences between this translation and the original document, the text in the original document prevails.
Contact: National Institute of Public Health and the Environment (RIVM)
Centre for External Safety P.O. box 1 3720 BA Bilthoven the Netherlands e-mail: [email protected]

Reference Manual Bevi Risk Assessments version 3.1 – Module C 01-01-2009
page 2 of 90
Contents
1. INTRODUCTION 4
2. BRZO ESTABLISHMENTS AS SET OUT IN ARTICLE 2 UNDER A BEVI - SUBSELECTION 5 2.1 INTRODUCTION...........................................................................................................................................5 2.2 PURPOSE AND SCOPE..................................................................................................................................5
2.2.1 Purpose of the subselection .................................................................................................................5 2.2.2 Scope of the subselection .....................................................................................................................5
2.3 THE SUBSELECTION....................................................................................................................................7 2.3.1 Outline of the subselection...................................................................................................................7 2.3.2 Dividing an establishment into containment systems .........................................................................9 2.3.3 Selection based upon effect distances............................................................................................... 10 2.3.4 Selection based upon selection numbers.......................................................................................... 11 2.3.5 Specific points for consideration when using the subselection ....................................................... 19
2.4 EXAMPLE................................................................................................................................................. 21 2.4.1 Description of establishment and containment systems .................................................................. 21 2.4.2 Calculating the indication number................................................................................................... 22 2.4.3 Calculating the selection number ..................................................................................................... 24
3. BRZO ESTABLISHMENTS AS SET OUT IN ARTICLE 2 UNDER A BEVI - SCENARIOS 26 3.1 INTRODUCTION........................................................................................................................................ 26 3.2 ASSUMPTIONS ......................................................................................................................................... 26
3.2.1 Run-away reactions........................................................................................................................... 26 3.2.2 External damage and domino effects ............................................................................................... 26 3.2.3 Safety management systems.............................................................................................................. 27 3.2.4 Variations of default failure frequencies.......................................................................................... 28 3.2.5 Cut-off limit........................................................................................................................................ 28
3.3 PARTS OF A CONTAINMENT SYSTEM ....................................................................................................... 29 3.4 PRESSURISED STORAGE TANK, ABOVEGROUND...................................................................................... 31
3.4.1 Definition ........................................................................................................................................... 31 3.4.2 Characteristics .................................................................................................................................. 31 3.4.3 Scenarios ........................................................................................................................................... 31
3.5 UNDERGROUND/MOUNDED PRESSURISED STORAGE TANKS................................................................... 33 3.5.1 Definition ........................................................................................................................................... 33 3.5.2 Characteristics .................................................................................................................................. 33 3.5.3 Scenarios ........................................................................................................................................... 33
3.6 ATMOSPHERIC STORAGE TANKS ............................................................................................................. 35 3.6.1 Definition ........................................................................................................................................... 35 3.6.2 Characteristics .................................................................................................................................. 35 3.6.3 Scenarios ........................................................................................................................................... 36
3.7 GAS CONTAINERS.................................................................................................................................... 40 3.7.1 Definition ........................................................................................................................................... 40 3.7.2 Characteristics .................................................................................................................................. 40 3.7.3 Scenarios ........................................................................................................................................... 40
3.8 PIPELINES ................................................................................................................................................ 41 3.8.1 Characteristics .................................................................................................................................. 41 3.8.2 Scenarios ........................................................................................................................................... 41
3.9 REACTOR VESSEL AND PROCESS VESSEL ................................................................................................ 44 3.9.1 Definitions ......................................................................................................................................... 44 3.9.2 Characteristics .................................................................................................................................. 44 3.9.3 Scenarios ........................................................................................................................................... 44
3.10 DISTILLATION COLUMN........................................................................................................................... 46

Reference Manual Bevi Risk Assessments version 3.1 – Module C 01-01-2009
page 3 of 90
3.10.1 Definition...................................................................................................................................... 46 3.10.2 Characteristics ............................................................................................................................. 46 3.10.3 Scenarios ...................................................................................................................................... 46 3.10.4 Example ........................................................................................................................................ 47
3.11 PUMPS AND COMPRESSORS ..................................................................................................................... 49 3.11.1 Characteristics ............................................................................................................................. 49 3.11.2 Scenarios ...................................................................................................................................... 49
3.12 HEAT EXCHANGERS AND CONDENSERS .................................................................................................. 50 3.12.1 Definition...................................................................................................................................... 50 3.12.2 Characteristics and scenarios ..................................................................................................... 50
3.13 PRESSURE RELIEF DEVICE ....................................................................................................................... 52 3.13.1 Definition...................................................................................................................................... 52 3.13.2 Scenarios ...................................................................................................................................... 52
3.14 TRANSPORT UNITS................................................................................................................................... 53 3.14.1 Definition...................................................................................................................................... 53 3.14.2 Characteristics ............................................................................................................................. 53 3.14.3 Scenarios ...................................................................................................................................... 53
3.15 LOADING ACTIVITIES............................................................................................................................... 57 4. BRZO ESTABLISHMENTS AS DEFINED IN ARTICLE 2 UNDER A BEVI - MEASURES AND SYSTEM REACTIONS 58 4.1 INTRODUCTION........................................................................................................................................ 58 4.2 REPRESSION SYSTEMS............................................................................................................................. 58
4.2.1 Bund................................................................................................................................................... 58 4.2.2 Blocking systems ............................................................................................................................... 59 4.2.3 Excess flow valve............................................................................................................................... 61 4.2.4 Non-return valve ............................................................................................................................... 63 4.2.5 Breakaway couplings and immobilisers........................................................................................... 63 4.2.6 Intervention by operators.................................................................................................................. 64 4.2.7 Fire suppression systems (restriction of fire surface area) ............................................................. 65 4.2.8 Other repression systems .................................................................................................................. 65
4.3 SYSTEM REACTIONS ................................................................................................................................ 65 4.3.1 Pumps ................................................................................................................................................ 65
5. STEVEDORING COMPANIES AS SET OUT IN ARTICLE 2.1 UNDER B BEVI 66
6. SHUNTING YARDS AS SET OUT IN ARTICLE 2.1 UNDER C BEVI 67
7. LPG FILLING STATIONS AS SET OUT IN ARTICLE 2.1 UNDER E BEVI 68
8. PGS15 ESTABLISHMENTS AS SET OUT IN ARTICLE 2.1 UNDER F BEVI 69
9. AMMONIA COOLING INSTALLATIONS AS SET OUT IN ARTICLE 2.1 UNDER G BEVI 70
10. MINING ESTABLISHMENTS AS SET OUT IN ARTICLE 2.1.D OR 2.1.H UNDER BEVI 71
11. OTHER CATEGORIES FOR BEVI ART. 2.1D OR 2.1.H 72
12. ACCOUNTABILITY APPENDIX 73
REFERENCES 90

Reference Manual Bevi Risk Assessments version 3.1 – Module C 01-01-2009
page 4 of 90
1. Introduction This module sets out how a QRA is to be carried out for the specific categories of establishments which fall under the Bevi. The design of the module links in with the assignment of categories of establishments that is observed in the Bevi. As part of unifying the calculation methods, the objective is to obtain a more standardised approach towards calculating QRAs for all categories of establishments that are assigned in the Bevi. This unifying process has been completed for three categories: Brzo establishments, LPG filling stations and PGS-15 warehouses. This module also describes extensively for these categories of establishments how a QRA is to be carried out with SAFETI-NL. For the other categories of establishments, new calculation methods will gradually be made available. The specifications for these will be included in module C. In this module guidelines for these other categories of establishments are limited to references made to documents in which additional information for calculating QRAs can be found. These documents thus do represent part of the Bevi calculation method as assigned in the Revi. There is a transition period as regards the use of the SAFETI-NL calculation package. The use of this calculation package has not yet been finalised into a detailed specification for a number of categories of establishments, and for this reason has not yet been made mandatory. This will take place at the same time as the new calculation methods specified above become available.

Reference Manual Bevi Risk Assessments version 3.1 – Module C 01-01-2009
page 5 of 90
2. Brzo establishments as set out in article 2 under a Bevi - Subselection The calculation method for Brzo establishments is set out in chapters 2 to 4. It is indicated in chapters 5 and further, which parts of this Brzo calculation method are also valid for the specific categories described there. 2.1 Introduction The number of containment systemsa inside an establishment for which a QRA needs to be drawn up can be very large. As not all containment systems contribute significantly to the risk, it is not sensible to include all containment systems in the QRA. For this reason a selection method has been developed - the subselection - to indicate which containment systems contribute most to external risk and must therefore be included in the QRA. This method is set out below. 2.2 Purpose and scope 2.2.1 Purpose of the subselection The purpose of the subselection is as follows:
The purpose of the subselection is to indicate which containment systems within an establishment are relevant to the external risk and must therefore be included in the QRA.
This means that the subselection is intended to make a distinction between the containment systems inside a single establishment, so that not all containment systems need to be included in the QRA. The subselection is expressly not intended to conclude based upon the results of the subselection that no QRA needs to be carried out at all for the establishment under consideration. Only if based upon the calculated effect distances it is substantiated that there are no effects extending over the site boundary, is it not necessary to complete a QRA. 2.2.2 Scope of the subselection 2.2.2.1 Responsibility for the subselection and variations The subselection is general in nature and must therefore only be used as a guideline. The containment systems are selected following consultation between the operator and the competent authority. The operator carries out the calculations, but the subselection itself is the responsibility of the competent authority. The competent authority may then decide to have containment systems included in the QRA that have not been selected using the method specified here. Also the party conducting a QRA may deviate from the subselection if conclusive justification is provided for doing so. If, for instance, a plausible case can be made based upon calculated effect distances that the effects of a containment system do not extend outside the site boundary and do not therefore contribute to the external risks, then the containment system does not have to be included in the QRA.
a A containment system is described as being one or several devices, any parts of which are continuously in open contact with one another and are intended to contain one or several substances. For the subselection it is critical that a Loss of Containment in one containment system does not lead to the release of significant quantities of hazardous substance from other containment systems (see paragraph 2.3.2).

Reference Manual Bevi Risk Assessments version 3.1 – Module C 01-01-2009
page 6 of 90
2.2.2.2 Reaction products and toxic combustion products Subselection is not suitable for all types of containment system inside an establishment. Particularly the build-up of unwanted reaction products in run-away reactions and the build-up of toxic combustion products in a fire of packaged hazardous substances in a storage building cannot effectively be included in the subselection and must therefore be considered in the QRA itself, in addition to the selected containment systems.
− Risks of reaction products and run-away feedback When evaluating a possible loss of control, the creation of hazardous reaction products and the occurrence of run-away reactions must be taken into account. The containment systems in which this can occur and the probability of its occurrence must be considered in the QRA (see chapter 3). The creation of unforeseen, hazardous reaction products is not assessed in the subselection.
− Storage of hazardous substances that fall under the PGS 15 directive
In the case of PGS 15 storage locations the main risk is the creation of toxic combustion products during a fire in the relevant storage area. As the contribution of these storage areas can be significant for external risks, these storage locations must always be included in the QRA. A storage facility can be omitted from the QRA if hazardous substances are stored in quantities smaller than 10 tonnes and pesticides are stored in quantities smaller than 400 kg. If it is possible to substantiate that the contribution of a storage facility to the external risk of the establishment is negligible based upon calculated effect distances or using the default risk distances from the Revi [1], then the relevant storage facilities can also be omitted from the QRA.
2.2.2.3 Bulk shipping activities The large quantities of hazardous substances and the (relatively) high failure frequencies for shipping scenarios (see chapter 3), make shipments of bulk quantities a significant contribution to external risk. For this reason the bulk shipment (and the transport units) should in principle always be selected for the QRA, unless it can be demonstrated that the contribution of (part of the) bulk shipment is negligible, based upon effect distances, for example, or by mutual comparison. There are situations in which a tank wagon is only used as a storage tank and a process installation is feeded directly from the transport unit. In these cases the tank wagon should be considered as a storage tank for the subselection and must be included as such in the subselection. 2.2.2.4 Exclusion of certain substances The subselection can only be used for toxic substances, flammable hazardous substances and explosive substances. Limit values are included for these substances (see paragraph 2.3.4.2.3). Subselection is not suitable for indicating other substances, such as the refrigerated storage of (very) large quantities of nitrogen, oxygen or carbon dioxide. If these substances are present, agreements must be made with the competent authority concerning their consideration. As a result it may, for example, be decided that a storage facility for a large quantity of nitrogen is included in the QRA.

Reference Manual Bevi Risk Assessments version 3.1 – Module C 01-01-2009
page 7 of 90
2.3 The subselection 2.3.1 Outline of the subselection Various steps need to be taken to include all containment systems that make a significant contribution to external risk in a QRA. In broad terms the subselection comes down to the following:
1. The establishment is divided into containment systems involving hazardous substances (see paragraph 2.3.2).
2. Based upon effect distances a selection is made of containment systems whose effects extend
outside the site boundaryb (see paragraph 2.3.3). These containment systems contribute to external risks and are included in the QRA.
3. If more than five containment systems are selected using the effect approach, then it is
possible to enter a selection process to reduce the number of containment systems that need to be included in the QRA. This takes place based upon the type and quantity of substance in a containment system and the prevailing process conditions. For each containment system an indication number and selection number are calculated for this purpose (see paragraph 2.3.4).
Establishments with more than 5 containment systems can choose to skip step 2 (the effect approach) and complete the subselection directly using the assignment and selection numbers. It should be made sure, though, that all containment systems are taken into account. It is also possible to opt for inclusion of all containment systems with effect distances outside the site boundary in the QRA, without calculating indication and selection numbers. An illustration of the subselection is displayed in Figure 1.
b On an industrial site several establishments can be present that are closely interrelated with one another. Instead of the border of the establishment, the edge of the industrial site can be observed as the site boundary if the risk on the industrial site is not being included in the evaluation. This means that there are no (limited) vulnerable objects on the industrial site and there are no people present that must be included in the definition of the group risk.

Reference Manual Bevi Risk Assessments version 3.1 – Module C 01-01-2009
page 8 of 90
start
Make an inventory of all containmentsystems containing hazardous substances
Figure 1 Schematic illustration of the subselection. Establishments with more than five containment systems can follow the selection number route directly, as indicated.
Determine maximum effect distance(E) per containment system
Determine minimum distance up to the site boundary (T)
per containment system
Selection of containment systems with maximum effect distancegreater than the minimum distance
to the site boundary
Is E > T ?
Is selection greater than
5?
Include selected containmentsystems in QRA
Calculate the indication numberA per containment system
Is A >1? Do not include in QRA
Select a calculation point
Calculate selection number S per containment system
Is S > 1?
Option to use the 50% rule in case of more
than 5 containment systems
Effect route Selection number route
yes
yes
yes
yes
yes
no
no
no
no
Do not include in QRA

Reference Manual Bevi Risk Assessments version 3.1 – Module C 01-01-2009
page 9 of 90
2.3.2 Dividing an establishment into containment systems 2.3.2.1 Definition of containment system To select the installations and installation components inside an establishment that are relevant for external safety, an establishment is divided into a number of separate containment systems. These containment systems can be considered as separate units in the QRA. The definition of a containment system is based on the following criterion:
A Loss of Containment in one containment system does not lead to the release of significant quantities of hazardous substance from other containment systems.c
In this the term ‘significant’ must be seen in relation to the quantity that is released from the containment system in which the Loss of Containment occurs. 2.3.2.2 Delimiting containment systems In order to achieve a practical definition of containment systems in an establishment, the following guideline can be usedd. A containment system is described as being one or several devices, any parts of which are continuously in open contact with one another and are intended to contain one or several substances. The limits of a containment system are determined by defining the quantity of substance that escapes into the surrounding area in the event of a Loss of Containment of any part of that containment system: if in the event of a Loss of Containment an inflow occurs via valves, pumps and other tools from other areas, then these areas belong to the containment system under consideration. System limiters are all units that in view of their nature and function close the connection with other containment systems inside an installation in the event of the release of the contents of the intended containment system. Without providing an exhaustive list, this includes reciprocating pumps and compressors (non-rotary), control valves that close automatically, intermittent release valves and shut-off valves that are shut off in the event of the characteristic operating state or are remotely shut off within a short period of time. Shut-off valves that are normally opened in full and in a failure situation are not closed cannot therefore be considered as system limiters. Safety shut-off valves that (automatically) block an inflow from other containment systems within a short period of time are considered to be system limiters, even if these safety shut-off valves are fully opened for the characteristic operating state. The approach can also be extended into combinations of units that achieve the same objective with one another. In these situations it must be established by the competent body whether this kind of units can be considered to be a system limiter. Table 1 provides an overview of what is critical for delimiting a containment system.
c Domino effects, for example as a result of fire and explosion, are not included in this. d The guidelines specified here are based on a Shell Nederland procedure

Reference Manual Bevi Risk Assessments version 3.1 – Module C 01-01-2009
page 10 of 90
Notes:
1. An excess flow valve remains open given an outflow rate below the set value. If a flow rate below the set value represents a significant outflow, the excess flow valve is not considered to be a system limiter.
2. It is possible to combine several containment systems into one larger containment
system. Combining containment systems may not, however, result in other containment systems incorrectly not being selected for the QRA.
Table 1 Characteristics of containment systems and their components Containment system One or several devices, any parts of which are continuously in open contact with one another and are intended to contain one or several substances. Definition aid The containment system comprises the areas that are interconnected and that belong to the same pressure level (combination of areas with their own overpressure protection system). System limiter A unit that separates containment systems from one another under operating conditions by maintaining a pressure differential or by inserting a closure, or a unit or a combination of units that (automatically) shuts off any area that has become disintegrated from other areas connected under operating conditions. Examples of system limiters − control valves offering a sealing function − positive displacement compressors (non-rotary), displacement pumps (reciprocating) − shut-off valves that are closed during operation − safety valves, rupture disks, liquid seals − excess flow valves combined with non-return valves − safety shut-off valves that are normally open and within a short time automatically close in
the event of an occurrence of an excessively low pressure upstream or downstream or are closed from a manned control room within a short time (Motor/Remote Operated Valves)
Examples of pressure-resistant components − walls of pressurised devices − valve enclosures, measuring chambers − safety valves − tools that maintain a pressure differential between the containment system and the
atmosphere (air compressors and feed pumps combined with the required non-return valves or safety shut-off valves)
− walls that separate containment systems from one another inside devices (for example, in heat exchangers)
− system limiters that separate pressurised containment systems from one another 2.3.3 Selection based upon effect distances Containment systems that, if a Loss of Containment (LOC) occurs, can give rise to an effecte outside the site boundary of the establishment, contribute to external risks. In addition, it is of course the case that all containment systems that cannot give rise to an effect outside the establishment, do not contribute to external risks.
e acute fatality as a result of exposure to toxic substances, heat radiation or overpressure

Reference Manual Bevi Risk Assessments version 3.1 – Module C 01-01-2009
page 11 of 90
The selection based upon effect distances consists of the following steps:
1. Determine the maximum effect distance (E) for each containment system, in other words the largest distance to 1% fatality. This distance is determined for the meteorological conditions D5 or F1.5f combined with the worst-case scenario, i.e. the instantaneous release of the entire contents of the containment system or the release of its entire contents within 10 minutes. The SAFETI-NL calculation package should preferably be used for this purpose.
2. Determine the minimum distance to the site boundary (T) for each containment system.
3. Compare the maximum effect distance and the minimum distance to the site boundary for
each containment system. If the maximum effect distance is greater than the minimum distance to the site boundary, the relevant containment system is indicated for the QRA. If the maximum effect distance is less than the minimum distance to the site boundary, the containment system does not contribute to external risks and does therefore not need to be included in the QRA.
In this way selection of the containment systems is based upon effect distances. All selected containment systems must be considered in the QRA. If more than five containment systems are indicated, it is possible to opt for calculating the indication and selection numbers in order to reduce the number of indicated containment systems, provided that a minimum of five containment systems must be included in the QRA. 2.3.4 Selection based upon selection numbers 2.3.4.1 Outline of the method For a large number of containment systems a selection can be made based upon type and quantity of substance and process conditions. This selection method consists of three steps:
1. For each containment system the intrinsic danger is determined, which is worked out from
the quantity of the available substance, the process conditions and the hazardous characteristics of the substance. The indication number A is a measurement for the intrinsic danger and is calculated in accordance with the procedure set out in paragraph 2.3.4.2.
2. The danger of a containment system is calculated for a number of points in the vicinity of the
establishment. The danger at any arbitrary point is worked out from the indication number and the distance between that point and the containment system, and is expressed in a selection number S; this number is calculated according to the procedure set out in paragraph 2.3.4.3.
3. Containment systems are assigned for a QRA if the selection number exceeds a particular
value. If the number of assigned containment systems is extensive (greater than five) it is possible to reduce the number of assigned systems using the ‘50% rule’ (see paragraph 2.3.4.4).
f The meteorological situation D5 signifies stability class D and a wind speed of 5 m/s. In general the largest effect distance for toxic substances is found with stable weather, in other words weather class F1.5 (stability class F and a wind speed of 1.5 m/s).

Reference Manual Bevi Risk Assessments version 3.1 – Module C 01-01-2009
page 12 of 90
2.3.4.2 Indication number A The intrinsic danger of a containment system depends on the quantity of substance, the physical and toxic characteristics of the substance and the specific process conditions. The indication number A is used as a measurement for this. The indication number A for a containment system is a dimensionless number for which the following applies:
GOOOQ
A 321 ×××=
where: Q the quantity of the substance present in the containment system (kg) O1, O2, O3 the factors for the process conditions (-) G the limit value (kg). 2.3.4.2.1 Substance quantity Q The substance quantity Q is the total quantity of the substance inside a containment system. The following rules apply:
− Mixtures and preparations can be divided into two groups: (1) a hazardous substance in a non-hazardous solution and (2) a mixture of hazardous substances. 1. If a hazardous substance is dissolved in a non-hazardous substance, it is only necessary
to examine the quantity of the hazardous substance. Examples are ammonia in water and hydrogen chloride in water. Mixtures and preparations of toxic substances must only be considered for the subselection process if they are classified as being (very) toxic.
2. If a mixture of several hazardous substances has its own physical, chemical and toxic characteristics, it must be treated in the same way as pure substances.
− If hazardous substances are stored as small packaging units in one location and if it is
probable that substances will be released simultaneously from a large number of packaging units, the total quantity of the stored substance must be considered.
− Storage tanks can be used to store different substances at different times. The same
substances and quantities of substance need to be calculated in the subselection as in the QRA. The situation that is permitted is critical for the QRA calculation. If large quantities of different substances are stored, example substances are used in the QRA. The permitted substance or the example substance for the most hazardous permitted category is then used in the calculation.
2.3.4.2.2 Process conditions O1 – O3 Three different factors are used to allow for the process conditions: O1 factor for the type of containment system: process or storage O2 factor for the location of the containment system

Reference Manual Bevi Risk Assessments version 3.1 – Module C 01-01-2009
page 13 of 90
O3 factor for the quantity of substance in the vapour phase after release, depending on the process temperature, the atmospheric boiling point, the phase state of the substance and the ambient temperature.
The factors for process conditions only apply to toxic and flammable substances; the following applies in respect of explosive substances: O1 = O2 = O3 = 1. Factor O1 (see Table 2) stands for the type of containment system: process or storage. Table 2 Factor O1 for type of containment system Type O1 Process 1 Storage 0.1
Factor O2 (see Table 3) stands for the location of the containment system and the presence of provisions that counteract the spread of substances in the surrounding area. Table 3 Factor O2 for location of the containment system Position O2 Outside
1
Inside
0.1
Containment system located in a bund, for a process temperature Tp lower than atmospheric boiling point Tboil plus 5°C: Tp ≤ Tboil + 5°C
0.1
Containment system located in a bund, for a process temperature Tp greater than atmospheric boiling point Tboil plus 5°C: Tp > Tboil + 5°C
1
Notes:
1. For storage the process temperature is equal to the storage temperature. 2. The difference between external and internal is determined by the presence and
effectiveness of the housing. Inside means that housing for the containment system must prevent substances from spreading into the surrounding area. This means (a) that the housing must resist the physical pressure that occurs when the content of the containment system is instantaneously released and (b) that the containment housing significantly limits direct emission into the atmosphere. If the housing reduces the emission into the atmosphere by a factor of more than 5 or if it safely discharges the released substances, we consider it an internal position. Otherwise, it is considered to be a containment system located outside. This means, for example, that a containment system with a hazardous gas that has been released in a building with openings to the outside must be considered as being located outside.
3. A bund must prevent liquids from freely spreading into the surrounding area.
4. A second containment housing that can contain the liquid and that resists all possible
stresses, is considered to be a bund: O2 = 0.1. This applies in respect of double

Reference Manual Bevi Risk Assessments version 3.1 – Module C 01-01-2009
page 14 of 90
containment atmospheric tanks, full containment atmospheric tanks, membrane tanks, in-ground atmospheric tanks and mounded atmospheric tanks.
Factor O3 (see Table 4) is a measurement for the quantity of released substance in the gas phase. Table 4 Factor O3 for the process conditions Phase O3 Substance in gas phase
10
Substance in liquid phase - saturation pressure at a process temperature of 3 bar or more
10 - saturation pressure at a process temperature between 1 and 3 bar X + Δ - saturation pressure at a process temperature of less than 1 bar Pi + Δ Substance in solid phase
0.1
Notes:
1. For storage the process temperature is equal to the storage temperature. 2. Pressure values are absolute.
3. Factor X increases on a linear basis from 1 to 10 as the saturation pressure at process
temperature Psat increases from 1 to 3 bar. In terms of a formula, where Psat is expressed in bar:
5.35.4 −×= satPX 4. Pi is equal to the partial vapour pressure (in bar) of the substance at process temperature.
5. If the substance is in its liquid phase, a quantity Δ is added to allow for the additional
evaporation as a result of the heat flow from the surrounding area into the pool of liquid. The value of Δ (see Table 5) is only determined by the atmospheric boiling point Tboil.
Table 5 Added Δ for additional evaporation of the liquid
Δ −25°C ≤ Tboil 0 −75°C ≤ Tboil < –25°C 1 −125°C ≤ Tboil < –75°C 2 Tboil < –125°C 3
For mixtures, the so-called 10% point must be used for the boiling point, in other words the temperature at which 10% of the mixture is distilled over.
6. For hazardous substances in non-hazardous solutions, the partial vapour pressure of the hazardous substance at process temperature counts as the saturation pressure at process temperature. Factor X increases on a linear basis from 1 to 10 if the partial vapour pressure of the hazardous substance at process temperature increases from 1 to 3 bar.

Reference Manual Bevi Risk Assessments version 3.1 – Module C 01-01-2009
page 15 of 90
7. The minimum value for the factor O3 is 0.1 and the maximum value 10. 2.3.4.2.3 Limit value G Limit value G is a measurement for the hazardous characteristics of the substance based on both the physical and the toxic/explosive/flammable characteristics of the substance. Explosive substancesg The limit value for explosive substances is the substance quantity (in kg) with an energy equivalent to that of 1000 kg trinitrotoluene (TNT); the explosive energy of TNT is set at 4600 kJ/kg. In the Netherlands regulations based on effect distances are applied in the case of explosive substances in a number of situations. Using the subselection is not sensible in such cases. Flammable substances The limit value for flammable substances is 10,000 kg. Flammable substances are defined within the subselection as substances that have a process temperature that is greater than or equal to the flash pointh. This means that the classification according to the Wet milieugevaarlijke stoffen (WMS) [Environmentally Hazardous Substances Act] or Chemiekaartenboek [Chemical Safety Cards] cannot always be used. If, for instance, thermic oil appears in a process at a temperature above flash point the oil is considered to be a flammable substance, even though this is not necessarily the case according to the WMS. Toxic substances The limit value for toxic substances (see Table 6) is determined by the lethal concentration LC50(rat, inh., 1h) and the phase state at 25 °C.
g Explosive substances are understood to be: a. 1°. substances and preparations that present a danger of explosion as a result of shock, friction, fire or other ignition causes (risk phrase R2); 2°. pyrotechnic substances. A pyrotechnic substance is understood to be a substance or mixture of substances with the purpose of producing heat, light, sound, gas or smoke or a combination of these phenomena by means of non-explosive, self-propagating exothermic chemical reactions; 3°. explosive or pyrotechnic substances and preparations that are contained in objects; b. substances and preparations that present a serious danger of explosion as a result of shock, friction, fire or other ignition causes (risk phrase R3). h Up to and including 65°C the flash point is determined using Abel-Pensky apparatus; for flash points greater than 65°C the Pensky-Martens apparatus is used.

Reference Manual Bevi Risk Assessments version 3.1 – Module C 01-01-2009
page 16 of 90
Table 6 Limit value G for toxic substances LC50 (rat, inh., 1h) (mg/m3) Phase at 25°C Limit value (kg) LC ≤ 100
gas 3
liquid (VL) 3 liquid (L) 10 liquid (M) 30 liquid (H) 100 liquid (VH) 300 Solid 300 100 < LC ≤ 500
Gas 30
liquid (VL) 30 liquid (L) 100 liquid (M) 300 liquid (H) 1000 liquid (VH) 3000 Solid 3000 500 < LC ≤ 2000
Gas 300
liquid (VL) 300 liquid (L) 1000 liquid (M) 3000 liquid (H) 10.000 liquid (VH) ∞ Solid ∞ 2000 < LC ≤ 20,000
Gas 3000
liquid (VL) 3000 liquid (L) 10.000 liquid (M) ∞ liquid (H) ∞ liquid (VH) ∞ Solid ∞ LC > 20,000
all phases ∞
Notes:
1. The phase state of the substance (gas, liquid and solid) assumes a temperature of 25°C. The following subdivision also applies in respect of liquids:
− Liquid (VL): atmospheric boiling point Tboil < 40°C − Liquid (L): 40°C ≤ atmospheric boiling point Tboil < 80°C − Liquid (M): 80°C ≤ atmospheric boiling point Tboil < 120°C − Liquid (H): 120°C ≤ atmospheric boiling point Tboil < 160°C − Liquid (VH): 160°C ≤ atmospheric boiling point Tboil
2. LC50(rat, inh., 1h) is the LC50 value for rats that are exposed to substances for 1 hour by
means of inhalation. For a number of toxic substances this value can be found in the

Reference Manual Bevi Risk Assessments version 3.1 – Module C 01-01-2009
page 17 of 90
S 1 [4]. substance documents [2] or the information based on Serida [3]. If the value is not available it can be determined using the calculation rules in PG
2.3.4.2.4 Calculating the indication number Indication number Ai for a substance i is calculated as follows:
i
ii G
OOOQA 321 ×××=
where: Qi = the quantity of substance i present in the containment system (in kg) O1 = the factor for the type of containment system (process or storage) (-) O2 = the factor for the location of the containment system: inside, within bund or outside (-) O3 = the factor for the process conditions (-) Gi = the limit value of substance i (in kg).
The following applies in respect of explosive substances: O1 = O2 = O3 = 1 and therefore: A = Q / G. Several substances and process conditions can be present inside one containment system. Where this is the case an indication number Ai,p is calculated for each substance i and for each process condition p. The indication number A for a containment system is the sum of all indication numbers across all substances i and process conditions p: Σi,p Ai,p. This sum is calculated separately for each of the three different substance categories: flammable substances (AF), toxic substances (AT) and explosive substances (AE): AT = Σi,p Ai,p , sum of all toxic substances and process conditions AF = Σi,p Ai,p , sum of all flammable substances and process conditions AE = Σi,p Ai,p , sum of all explosive substances and process conditions A containment system can therefore be given a maximum of three different indication numbers. Note:
1. If a substance belongs to several substance categories, an indication number is calculated separately for each category. Thus, if a substance is both toxic and flammable, two indication numbers Ai,p are calculated: − AT
i,p for the substance as a toxic substance, in which case the total quantity Qi is used, and the limit value GT
i, corresponding with the toxic characteristics. − AF
i,p for the substance as a flammable substance, in which case the total quantity Qi is used, and the corresponding limit value is used for flammable substances, GF
i. To be able to assign a substance to a substance category it is necessary to link in with the QRA calculation. This means, for example, that allyl chloride, ammonia, methyl bromide, carbon monoxide and tetraethyl lead are only classified as toxic in the subselection, and acrolein, acrylonitrile, allyl alcohol, hydrogen cyanide and ethylene oxide are classified as both toxic and flammable (see chapter 6).

Reference Manual Bevi Risk Assessments version 3.1 – Module C 01-01-2009
page 18 of 90
2.3.4.3 Calculating selection number S Selection number S is a measurement for the danger of a containment system at a specific location and is calculated by multiplying the indication number A of a containment system by a factor (100/L)2 for toxic substances and a factor (100/L)3 for flammable or explosive substances:
TT AL
S2100⎟⎠⎞
⎜⎝⎛= for toxic substances
FF AL
S3100⎟⎠⎞
⎜⎝⎛= for flammable substances
EE AL
S3100⎟⎠⎞
⎜⎝⎛= for explosive substances
L is the distance from the containment system to the specific location in meters and is a minimum of 100 m. The selection number must be calculated for each containment system in at least eight places on the site boundary. The distance between two adjacent points should not be greater than 50 meters. The selection number must be calculated for the site boundary of the establishment itself (see footnote b). If the establishment borders on surface water the selection number is calculated on the other side of the water. Note
1. Containment systems are selected on the border of the establishment and on the other side of the water. The selection is intended to determine the most important containment systems for external safety, this is to say outside the site boundary and on the land across the water. This means that the risk contours do not provide a reliable picture of the risk inside the site boundary and on the water.
2.3.4.4 Selection of containment systems A containment system is included in a QRA if:
− the selection number of a containment system is greater than one at a point on the site boundary of the establishment (or on the bank opposite the establishment).
If the number of selected containment systems for an establishment is less than five using the above selection, the five containment systems with the biggest selection numbers must be included in the QRA. If the number of selected containment systems is greater than five using the above selection, then it is possible, using the ‘50% rule’, to reduce the number of containment systems that need to be included in the QRA. The 50% rule is:
− A containment system is included in a QRA if the selection number of a containment system is greater than one at a point on the site boundary of the establishment (or on the bank opposite the establishment) and is greater than 50% of the largest calculated selection number for all containment systems at this point.

Reference Manual Bevi Risk Assessments version 3.1 – Module C 01-01-2009
page 19 of 90
The following rules apply when using this 50% rule:
1. For each point on the site boundary at least threei containment systems with a selection number greater than one are selected.
2. The use of the 50% rule must be made transparent by specifying for each point on the
site boundary which containment systems were selected and which containment systems with a selection number greater than 1 were not selected.
3. Containment systems with a negligibly small failure frequency (less than 1 × 10⁻⁸ per
annum) must be ignored when applying the 50% rule. The same applies in the case of containment systems with negligible effects in terms of external safety as a result of provisions present.
4. For any establishment a minimum of five containment systems are selected for the QRA.
Notes:
1. Effect distances of toxic substances can be significantly larger than the effect distances of flammable substances. It can therefore be the case that at the site boundary the risk is determined by the flammable substances, whereas at a greater distance from the establishment toxic substances can also make a significant contribution to the risk. If using the method described only containment systems with flammable substances are selected, while toxic substances are also present with a selection number of the same order as the maximum calculated (flammable) selection number, then the containment system with toxic substances must also be included in the QRA.
2. If inside an establishment all selection numbers are smaller than 1, it should not be
concluded that a QRA does not need to be carried out at all (see paragraph 2.3.5.2).
3. It is possible to include less than five containment systems in a QRA, if it has been demonstrated for the other containment systems based upon effect calculations that the effects do not extend outside the establishment.
2.3.5 Specific points for consideration when using the subselection 2.3.5.1 Transport pipelines Transport pipelines inside the establishment can contribute greatly to the risk for the establishment because they may be located close to the site boundary of an establishment, have a relatively high probability of failure and may release large quantities of hazardous substance due to their own contents and the feed from the tank. Transport pipelines containing liquids Transport pipelines containing liquids can be included in the subselection. The quantity present is equal to the quantity in the blocked pipeline with a minimum of 250j meters. The factors O1 – O3 apply. A pipeline inside the establishment must be considered as being a process unit, O1 = 1. The
i If there are only one or two containment systems at a particular point on the site boundary with a selection number greater than one, then only those containment systems are selected for that point. j This value is based on a flow speed of 2 m/s and a closing time of 120 s for the blocking valves. If the closing time is significantly longer, the quantity of outflow must be calculated based upon the flow speed and the closing time plus the contents of the pipe.
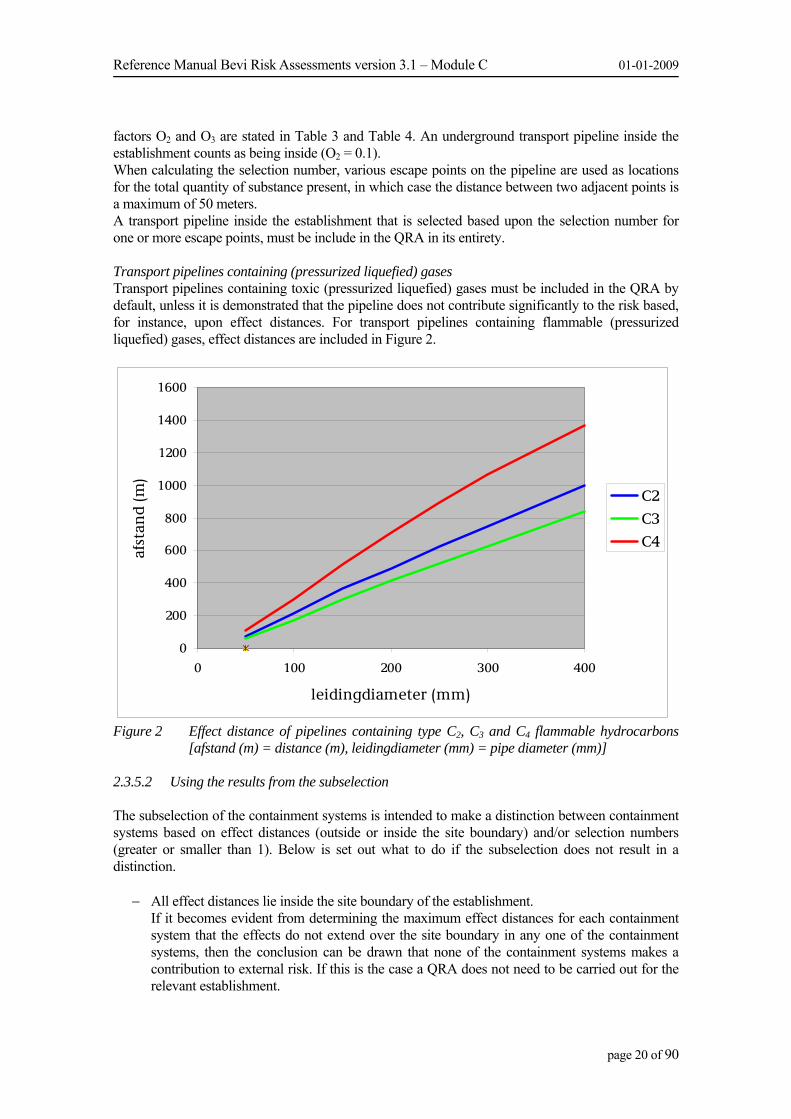
Reference Manual Bevi Risk Assessments version 3.1 – Module C 01-01-2009
page 20 of 90
factors O2 and O3 are stated in Table 3 and Table 4. An underground transport pipeline inside the establishment counts as being inside (O2 = 0.1). When calculating the selection number, various escape points on the pipeline are used as locations for the total quantity of substance present, in which case the distance between two adjacent points is a maximum of 50 meters. A transport pipeline inside the establishment that is selected based upon the selection number for one or more escape points, must be include in the QRA in its entirety. Transport pipelines containing (pressurized liquefied) gases Transport pipelines containing toxic (pressurized liquefied) gases must be included in the QRA by default, unless it is demonstrated that the pipeline does not contribute significantly to the risk based, for instance, upon effect distances. For transport pipelines containing flammable (pressurized liquefied) gases, effect distances are included in Figure 2.
0
200
400
600
800
1000
1200
1400
1600
0 100 200 300 400
leidingdiameter (mm)
afst
and
(m)
C2C3C4
Figure 2 Effect distance of pipelines containing type C2, C3 and C4 flammable hydrocarbons
[afstand (m) = distance (m), leidingdiameter (mm) = pipe diameter (mm)] 2.3.5.2 Using the results from the subselection The subselection of the containment systems is intended to make a distinction between containment systems based on effect distances (outside or inside the site boundary) and/or selection numbers (greater or smaller than 1). Below is set out what to do if the subselection does not result in a distinction.
− All effect distances lie inside the site boundary of the establishment. If it becomes evident from determining the maximum effect distances for each containment system that the effects do not extend over the site boundary in any one of the containment systems, then the conclusion can be drawn that none of the containment systems makes a contribution to external risk. If this is the case a QRA does not need to be carried out for the relevant establishment.

Reference Manual Bevi Risk Assessments version 3.1 – Module C 01-01-2009
page 21 of 90
− All indication numbers and selection numbers are less than or equal to 1. If it is evident from calculating the indication numbers and the selection numbers that the calculated numbers are less than or equal to 1 for all containment systems, then the conclusion should not be drawn that a QRA does not need to be carried out. This is only permitted if the effect distances are inside the site boundary. In this case the results of the subselection can be used to assign the five most important containment systems for completing the effect calculations or for the QRA.
2.4 Example This example shows how the indication numbers and selection numbers need to be calculated for an establishment with five containment systems. Because a minimum of five containment systems need to be included for an establishment, no selection was made. 2.4.1 Description of establishment and containment systems An establishment includes five separate containment systems; the site is rectangular between the point at the bottom left (−400 m, −200 m) and the point at the top right (+300 m, +300 m). The containment systems I1 – I5 are displayed in Table 7. Table 7 Containment systems I1 – I5 on the site No Point Process I1
(200, 200)
Process unit inside, with 2100 kg of pure chlorine at a process temperature of 35°C (vapour pressure of 10 bar)
I2 (0, 0) Process unit outside. The containment system includes various flammable substances for different process conditions:
Ethylene 200,000 kg, liquid at -30°C (vapour pressure of 20 bar) Ethane 100,000 kg, gas at 80°C Butane 10,000 kg, gas at 30°C Propylene 10,000 kg, liquid at -35°C (vapour pressure of 1.75 bar) Propane 50,000 kg, liquid at 80°C (vapour pressure of 31 bar)
I3 (−300, −150)
Storage for pure hydrogen chloride. The storage is located outside and contains 4500 kg at a temperature of 25°C (vapour pressure of 47 bar).
I4 (200, 100) Process unit inside, where 10,000 kg of a 30% hydrochloric acid solution in water is processed at a temperature of 100°C (liquid, partial vapour pressure, hydrogen chloride Pi = 1.1 bar).
I5 (−300, −125) A process unit located outside with pure ammonia (gas, 12,000 kg), a 60% ammonia solution in water (9000 kg solution at 43°C, with a partial vapour pressure of Pi = 9.4 bar). Petrol is used in the containment system (1000 kg) at a temperature of 150°C.
The location of the containment systems and the site boundary are given in Figure 3.

Reference Manual Bevi Risk Assessments version 3.1 – Module C 01-01-2009
page 22 of 90
Figure 3 Location of the containment systems ( I1 – I5) on the site of the establishment and the
points on the border of the establishment (displayed by means of small squares) where the selection numbers are calculated. The locations 1, 2, 3, … correspond with the points in Table 11.
2.4.2 Calculating the indication number 2.4.2.1 Containment system I1 Containment system I1 is a process unit (O1 = 1) in a building (O2 = 0.1). One substance, chlorine, is present in a quantity of Q = 2100 kg. The vapour pressure of chlorine is greater than 3 bar (O3 = 10). Chlorine is a toxic substance; in gas phase at 25°C; LC50(rat, inh., 1h) = 866 mg/m3 [2]. The limit value is G = 300 kg, which means that AT
1 = 7. 2.4.2.2 Containment system I2 Containment system I2 is a process containment system (O1 = 1) outside the building (O2 = 1). There are five different combinations of substances and process conditions, as can be seen in Table 8. Table 8 Combinations of substances and process conditions for Containment system I2 Substance Q O3 G AF Note Ethylene 200,000 kg 10 10,000 kg 200 1 Ethane 100,000 kg 10 10,000 kg 100 2 Butane 10,000 kg 10 10,000 kg 10 3 Propylene 10,000 kg 5.4 10,000 kg 5.4 4 Propane 50,000 kg 10 10,000 kg 50 5
Notes:
1. Ethylene is a flammable substance with a vapour pressure greater than 3 bar under process conditions.

Reference Manual Bevi Risk Assessments version 3.1 – Module C 01-01-2009
page 23 of 90
2. Ethane is a flammable substance in gas phase under process conditions.
3. Butane is a flammable substance in gas phase under process conditions.
4. Propylene is a flammable substance with a vapour pressure Pi of 1.75 bar at process temperature Tp = −35°C. Therefore X = 4.5 × 1.75 − 3.5 = 4.4. Boiling point Tboil is equal to −48°C. Therefore Δ = 1 and O3 = 5.4.
5. Propane is a flammable substance with a vapour pressure greater than 3 bar under
process conditions. 2.4.2.3 Containment system I3 Containment system I3 is intended for storage (O1 = 0.1) and lies outside (O2 = 1). The quantity of hydrogen chloride (Q) present is 4500 kg. The vapour pressure of hydrogen chloride is 47 bar (O3 = 10). Hydrogen chloride is a toxic substance in gas phase at 25°C; LC50(rat, inh., 1h) = 4746 mg/m3 [2] which means that the limit value G = 3000 kg and AT
3 = 1.5. 2.4.2.4 Containment system I4 Hydrochloric acid (30%) is classified as being caustic, and not toxic. Consequently, this solution is not included in the subselection and the QRA. 2.4.2.5 Containment system I5 Containment system I5 is a process containment system (O1 = 1) and is located outside (O2 = 1). Three combinations of substances and process conditions are present. As ammonia is only included in a QRA as being toxic, only the toxic indication number is relevant. The combinations of substances and process conditions are illustrated in Table 9. Table 9 Combinations of substances and process conditions for Containment system I5 Substance Q O3 G AF AT Note Ammonia, pure 12,000 kg 10 3,000 kg 40 1 Ammonia, solution 5400 kg 10 3,000 kg 18 2 Petrol 1000 kg 10 10,000 kg 1 3
Notes:
1. Ammonia is a gas under process conditions. The limit value for this toxic substance is 3000 kg because ammonia is a gas at 25°C; LC50(rat, inh., 1h) = 6000 mg m-3 [2].
2. The quantity of ammonia, Q, in the solution is 60% of 9000 kg = 5400 kg. Given that the
partial vapour pressure is greater than 3 bar, O3 = 10.
3. Petrol is a flammable substance. The process temperature is higher than the 10% point. The vapour pressure at 150°C must be determined. In the example we assume that it is greater than 3 bar, which means that O3 = 10.
2.4.2.6 Overview of indication numbers An overview of the indication numbers is included in Table 10.

Reference Manual Bevi Risk Assessments version 3.1 – Module C 01-01-2009
page 24 of 90
Table 10 Indication numbers for the containment systems Cont
Substance Type O1 O2 O3 Q G Ai
I1 Chlorine T 1 0.1 10 2100 kg 300 kg 7 I2 Ethylene F 1 1 10 200,000 kg 10,000 kg 200 Ethane F 1 1 10 100,000 kg 10,000 kg 100 Butane F 1 1 10 10,000 kg 10,000 kg 10 Propylene F 1 1 5.4 10,000 kg 10,000 kg 5.4 Propane F 1 1 10 50,000 kg 10,000 kg 50 I3 HCl T 0.1 1 1 45,000 kg 3000 kg 1.5 I4 30%-HCl - - - - - - - I5 Ammonia (g) T 1 1 10 12,000 kg 3000 kg 40 Ammonia (l) T 1 1 10 5400 kg 3000 kg 18 Petrol F 1 1 10 1000 kg 10,000 kg 1 The indication numbers for the various containment systems are: containment system I1 AT = 7 containment system I2 AF = 365 containment system I3 AT = 1.5 containment system I5 AT = 58, AF = 1 2.4.3 Calculating the selection number The selection number must be calculated for points on the site boundary. In this case 48 points are selected on the site boundary, with distances of 50 meters in between (see Figure 3). The selection number was calculated for the distance from each point to the containment system (a minimum of 100 meters). The results are shown in Table 11. The containment systems that are selected for each location are displayed in bold. As the minimum number of containment systems for the QRA is equal to five, all four containment systems containing hazardous substances must be included in the QRA unless it can be demonstrated based upon effect calculations that the effects do not fall outside the establishment.

Reference Manual Bevi Risk Assessments version 3.1 – Module C 01-01-2009
page 25 of 90
Table 11 Selection numbers for the selected points no X
(m) Y
(m) S1
A1T = 7
S2 A2
F= 365S3
A3T = 1.5S5
A5T = 58
1 25 300 1.7 13.4 0.0 2.02 75 300 2.7 12.3 0.0 1.83 125 300 4.5 10.6 0.0 1.64 175 300 6.6 8.7 0.0 1.45 225 300 6.6 6.9 0.0 1.36 275 300 4.5 5.4 0.0 1.17 300 275 4.5 5.4 0.0 1.18 300 225 6.6 6.9 0.0 1.29 300 175 6.6 8.7 0.0 1.3
10 300 125 4.5 10.6 0.0 1.411 300 75 2.7 12.3 0.0 1.512 300 25 1.7 13.4 0.0 1.513 300 -25 1.2 13.4 0.0 1.614 300 -75 0.8 12.3 0.0 1.615 300 -125 0.6 10.6 0.0 1.616 300 -175 0.5 8.7 0.0 1.617 275 -200 0.4 9.3 0.0 1.718 225 -200 0.4 13.4 0.1 2.119 175 -200 0.4 19.4 0.1 2.520 125 -200 0.4 27.8 0.1 3.121 75 -200 0.4 37.5 0.1 4.022 25 -200 0.4 44.6 0.1 5.223 -25 -200 0.3 44.6 0.2 7.124 -75 -200 0.3 37.5 0.3 10.325 -125 -200 0.3 27.8 0.5 16.026 -175 -200 0.2 19.4 0.8 27.327 -225 -200 0.2 13.4 1.5 51.628 -275 -200 0.2 9.3 1.5 58.029 -325 -200 0.2 6.6 1.5 58.030 -375 -200 0.1 4.8 1.5 51.631 -400 -175 0.1 4.4 1.4 46.432 -400 -125 0.2 5.0 1.4 58.033 -400 -75 0.2 5.4 1.0 46.434 -400 -25 0.2 5.7 0.6 29.035 -400 25 0.2 5.7 0.4 17.836 -400 75 0.2 5.4 0.2 11.637 -400 125 0.2 5.0 0.2 8.038 -400 175 0.2 4.4 0.1 5.839 -400 225 0.2 3.8 0.1 4.440 -400 275 0.2 3.2 0.1 3.441 -375 300 0.2 3.3 0.1 3.142 -325 300 0.2 4.2 0.1 3.243 -275 300 0.3 5.4 0.1 3.244 -225 300 0.4 6.9 0.1 3.145 -175 300 0.5 8.7 0.1 3.046 -125 300 0.6 10.6 0.1 2.747 -75 300 0.8 12.3 0.1 2.548 -25 300 1.2 13.4 0.1 2.3

Reference Manual Bevi Risk Assessments version 3.1 – Module C 01-01-2009
page 26 of 90
3. Brzo establishments as set out in article 2 under a Bevi - Scenarios The calculation method for Brzo establishments is set out in chapters 2 to 4. It is indicated in chapters 5 and further, which parts of this Brzo calculation method are also valid for the specific categories described there. 3.1 Introduction The scenarios and default failure frequencies are described in this chapter for the various parts of a containment system. A definition is given for each part, followed by a description and the scenarios. In addition, this chapter outlines a number of general assumptions applied in modelling. 3.2 Assumptions Using the default failure frequencies in a QRA it is assumed that the company meets the standards for good business management. This means, amongst other things, that the safety management system (SMS) meets the requirements and sufficient measures have been taken against all foreseen failure mechanisms. 3.2.1 Run-away reactions The effects of run-away reactions must be taken into account in a QRA, such as explosions and the build-up and release of hazardous reaction products. Amongst other things, run-away reactions are understood to mean: uncontrolled reactions of different substances, polymerisation and (explosive) decomposition. The occurrence of run-away reactions is not included in the default failure frequencies. This means that in principle additional scenarios need to be included in the QRA for the occurrence of a run-away reaction. For this purpose an assessment must be made of both the probability of the scenario occurring and of the effects, such as the quantity of the hazardous substances produced. Additional scenarios for run-away reactions do not need to be included in the QRA if at least one of the following conditions is met.
− There are no known run-away reactions for the substances and the processes. − There are known run-away reactions, but potentially lethal effects will not extend outside the
establishment. − There are known run-away reactions, but the business has taken adequate procedural and
technical measures to prevent the occurrence of run-away reactions. This means amongst other things using known techniques such as HAZOP and implementing effective procedures and/or security measures offering sufficient reliability.
The prevention of accidents is a priority. If, for example, it is known that run-away reactions may occur, the solution must be to take adequate preventative measures, so that the default failure frequency can be used in calculations, rather than adding an additional scenario in the QRA. 3.2.2 External damage and domino effects The occurrence of external damage and (internal) domino effects is not included in the default failure frequencies at an establishment. External damage involves the occurrence of a Loss of Containment as a result, for instance, of a collision with a vehicle or crane. Adequate measures need to be taken at an establishment to prevent

Reference Manual Bevi Risk Assessments version 3.1 – Module C 01-01-2009
page 27 of 90
outflow as a result of external damage, such as column guards and speed limits, so that no additional scenarios need to be included in the QRA. Points for consideration are shunting yards as part of an establishment and external damage caused from outside the establishment.
− A Loss of Containment as a result of a collision of a tank wagon containing hazardous substances at a shunting yard must be included in the QRA. Chapter 6 describes the scenarios and the calculation of the failure frequencies. This involves shunting yards with public functions, in other words yards to which (several) transporters have access. If a yard is situated at an establishment and can only be accessed via a siding, the yard scenarios are not included, but only the scenarios for intrinsic failure (see 3.14.3.2).
− A Loss of Containment can also occur as a result of causes from outside the establishment.
An example of this is an establishment that is located in the flight path of an airport. The probability of a Loss of Containment as a result of an airplane crashing can be significant compared with the default probability of failure. Other examples include storage tanks in the vicinity of wind turbines where parts breaking off might penetrate a storage tank, and storage tanks in the vicinity of (high-pressure) natural gas transport lines. Although a company does not have (direct) influence on any such external causes, these do result in a higher probability of failure for the installations. Consequently, a Loss of Containment as a result of a cause from outside must be included in the risk assessment of the establishment.
o A Loss of Containment as a result of a airplane crashing must be included in the QRA if this frequency is greater than 10% of the default frequency of catastrophick failure. In such a case the frequency of instantaneous failure must be increased by the location-specific risk as a result of airplanes crashing in situ.
o A Loss of Containment as a result of the failure of a wind turbine must be included in the QRA if this frequency is greater than 10% of the default frequency of catastrophick failure. An indication of the risks and generic domino distances can be found in [5, 6].
− Internal domino effects occur if the failure of one installation containing hazardous
substances leads to the failure of another installation containing hazardous substances. An example is the occurrence of a BLEVE of a pressurised storage facility as a result of a jet fire or a pool fire. Internal domino effects are not explicitly included in a QRA. Only in the case of a situation in which the failure of one installation clearly leads to the failure of another installation, does an internal domino-effect need to be included in a QRA. An example of such a situation is if two LPG tanks are situated so close to one another that the instantaneous failure of one tank will (probably) lead to the failure of the other tank. Where this is the case, the contents of the biggest tank must be assumed for the scenario of ‘instantaneous failure’ in all cases.
3.2.3 Safety management systems The default failure frequencies apply in respect of an establishment with a good safety management system (SMS). The relationship between a SMS and the probability of an occurrence of a Loss of Containment is difficult to quantify. A very good SMS does not therefore result in the option of using lower failure frequencies. Alternatively, a bad SMS does not result in the obligation to use fixed, higher failure frequencies in the QRA. It can be asserted, however, that in case of insufficient quality of the SMS, a QRA with default failure frequencies will not provide a reliable picture of the actual risks for the establishment.
k The frequency of a ‘catastrophic failure’ is the sum of the frequencies of the ‘instantaneous failure’ and ‘10 minutes of outflow’ scenarios.

Reference Manual Bevi Risk Assessments version 3.1 – Module C 01-01-2009
page 28 of 90
3.2.4 Variations of default failure frequencies The default failure frequencies apply to establishments with state-of-the-art technology. It is possible that technical measures are taken at an establishment that reduce the probability of an accident, such as special heat-resistant coatings and heat shields for the storage of LPG in order to reduce the probability of a BLEVE, and the use of special hoses for loading. If the author of the QRA wishes to use other failure frequencies, he must make a proposal at the outset for the specific failure frequencies in their situation. This proposal must be accompanied by documentary evidence in the form, for example, of causistics or a fault tree analysis. 3.2.5 Cut-off limit Only the scenarios that contribute significantly to the location-specific risk and/or group risk are included in the QRA. This means that only scenarios need to be included in the QRA that satisfy the following two conditions: 1. the frequency of the scenario is greater than or equal to 1 × 10⁻⁹ per annum; 2. lethal injury (1% fatality) can also occur outside the site boundary. In this, a scenario is a combination of Loss of Containment and a system reaction, such as the closure or otherwise of blocking valves.

Reference Manual Bevi Risk Assessments version 3.1 – Module C 01-01-2009
page 29 of 90
3.3 Parts of a containment system An overview is given in Table 12 of the various parts of a containment system that are included in this chapter. Table 12 Overview of the parts of a containment system in the QRA Part Description Pressurised storage a. Aboveground (surface) b. Mounded and underground
See paragraph 3.4 See paragraph 3.5
Atmospheric storage a. single containment b. protective shell c. double containment d. full containment e. membrane tank f. in-ground g. mounded
See paragraph 3.6
Gas containers See paragraph 3.7
Pipelines a. aboveground b. underground
See paragraph 3.8
Reactor vessel a. batch b. continuous
See paragraph 3.9
Process vessel a. distillation column b. filter
See paragraph 3.9 See paragraph 3.10 See paragraph 3.9
Gas cylinder
Gas cylinders are part of chapter 11
Drums
The failure of drums is described in Chapter 8
Connections a. flange b. welding
Failure of connections is included in failure of the pipes, and not described separately (see paragraph 3.8).
Pumps a. centrifugal, single gasket b. centrifugal, twin gasket c. reciprocating pumps
See paragraph 3.11
Compressor a. centrifugal b. piston
See paragraph 3.11

Reference Manual Bevi Risk Assessments version 3.1 – Module C 01-01-2009
page 30 of 90
Heat exchangers a. substance in shell b. substance in pipes c. substance in shell and pipes d. substance in sheet e. condensers
See paragraph 3.12
Pressure relief device a. safety valves b. rupture discs
See paragraph 3.13
Storage facilities a. PGS 15 warehouses b. explosive substances
The scenarios for storage facilities with hazardous substances are described in chapter 8. The approach of the circular letter is maintained for explosive substances [7].
Transport a. road tanker (atm.) b. road tanker (pressurised) c. tank wagon (atm.) d. tank wagon (pressurised) e. ship (single cont. liquid) f. ship (double cont. liquid) g. ship (gas) h. container
See paragraph 3.14 The calculation method still needs to be finalised for containers.
Loading a. hose b. arm
See paragraph 3.15

Reference Manual Bevi Risk Assessments version 3.1 – Module C 01-01-2009
page 31 of 90
3.4 Pressurised storage tank, aboveground 3.4.1 Definition Pressurised storage tanks are used for storing gases and liquefied pressurised gases, such as LPG, ammonia and chlorine. A storage tank is a pressurised storage tank if its maximum permissible pressure is greater than 0.5 bar of overpressure. 3.4.2 Characteristics By default the following items are present in the case of a pressurised tank aboveground for storing pressurised liquefied gases.
− One or several transport pipelines − Vapour return pipe, connected to the vapour phase − Quick-closing valves (present in the liquid pipes, also possible in vapour return pipe) − A pressure relief device in the vapour phase − A drainage pipe with blocking valves − Instrumentation for level, pressure (temperature)
The same items are present to a certain extent for tanks aboveground for storage of gases, in which case all connections are to the gas phase. 3.4.3 Scenarios The scenarios and failure frequencies for a pressurised storage tank aboveground apply to the storage tank including the welded stumps, mounting plates, pipe connections up to the first flange and instrumentation pipes. The pipeline system should be considered separately, as must the pressure relief device. The scenarios for a pressurised storage tank aboveground are set out in Table 13. An overview of the parts that are included in the generic scenarios for the storage tank is displayed in Table 14. Table 13 Scenarios for a pressurised storage tank aboveground
Frequency (per annum)
1. Instantaneous release of entire contents
5 × 10⁻⁷
2. Release of entire contents in 10 min. in a continuous and constant stream 5 × 10⁻⁷ 3. Continuous release of contents from a hole with an effective diameter of 10
mm
1 × 10⁻⁵

Reference Manual Bevi Risk Assessments version 3.1 – Module C 01-01-2009
page 32 of 90
Table 14 Parts included in the scenario for a pressurised storage tank aboveground Included in the default scenarios Not included in the default scenarios
- Welded stumps - Mounting plates - Instrumentation pipes - Pipe connections up to the first flange
- Transport pipelines from the (quick-closing) valve
- Vapour return pipe - Pressure relief device - Pipeline system
Points for consideration:
1. The scenarios and frequencies are not dependent on the location where the storage tanks are situated, inside or outside a building.
2. In establishments there may be a substantial difference between permitted quantity of
hazardous substance and the quantity of hazardous substance that is usually present in that establishment. The permitted quantity of substance is used in the QRA calculation.
3. The fill level of a storage tank can vary depending on time. If this variation is included in the
permit and is sufficiently large so that inclusion of the variation results in a significant shift in the risk, the variation in fill levels must be included in the calculations by assuming a few representative fill levels and the associated probability of their occurrence.
4. Storage tanks can be used to store different substances at different times. The situation that is
permitted is critical for the QRA calculation. If large quantities of different substances are stored, example substances are used in the QRA. The permitted substance or the example substance for the most hazardous permitted category is then used in the calculation.
5. For small tanks the duration of the outflow for the 10 mm hole is less than 10 minutes. For
these tanks, too, the three scenarios as stated in Table 13 should be included. In addition, the influx of matter through the connecting pipework must be taken into account for the source term.
6. If the pipe connection up to the first flange is longer than ten meters, the pipe connection
should be included as a separate pipe section.

Reference Manual Bevi Risk Assessments version 3.1 – Module C 01-01-2009
page 33 of 90
3.5 Underground/mounded pressurised storage tanks 3.5.1 Definition A storage tank is an underground or mounded pressurised storage tank if its maximum permissible pressure is greater than 0.5 bar of overpressure and the tank is surrounded on all sides by inert matter, such as earth. An underground or mounded pressurised storage tank is mainly used for storage of LPG. 3.5.2 Characteristics By default the following items are present in the case of an underground/mounded pressurised tank for storing pressurized liquefied gases.
− One or several transport pipes, connected to the top of the tank − Vapour return pipe, connected to the vapour phase − Quick-closing valves (present in liquid pipelines, also possible in vapour return pipe) − A pressure relief device in the vapour phase − Instrumentation for level, pressure (temperature)
3.5.3 Scenarios The scenarios and failure frequencies for an underground/mounded pressurised storage tank apply to the storage tank with welded stumps, mounting plates, pipe connections up to the first flange and instrumentation pipes. The pipeline system should be considered separately, as should the pressure relief device. The scenarios for an underground/mounded pressurised storage tank are set out in Table 15. An overview of the parts that are included in the generic scenarios is displayed in Table 16. Table 15 Scenarios for an underground/mounded pressurised storage tank
Frequency (per annum)
1 Instantaneous release of entire contents (see point 1)
5 × 10⁻⁷
2. Release of entire contents in 10 min. in a continuous and constant stream 5 × 10⁻⁷ 3. Continuous release from a hole with an effective diameter of 10 mm
1 × 10⁻⁵
Table 16 Parts included in the scenarios for an underground/mounded pressurised storage tank
Included in the default scenarios Not included in the default scenarios - Welded stumps - Mounting plates - Instrumentation pipes - pipe connections up to the first flange
- Transport pipes from the (quick-closing) valve
- Vapour return pipe - Pressure relief device - Pipeline system

Reference Manual Bevi Risk Assessments version 3.1 – Module C 01-01-2009
page 34 of 90
Points for consideration:
1. A basic failure frequency equal to 5 × 10⁻⁷ per annum is assumed for the instantaneous failure of the underground storage tanks of LPG. It is assumed that the causes that lead to a fire ball are not possible, which means that a section of the event tree does not apply. The method of input in the calculation package is described in Module B.
2. In establishments there may be a substantial difference between permitted quantity of
hazardous substance and the quantity of hazardous substance that is usually present in that establishment. The permitted quantity of substance is used in the QRA calculation.
3. The fill level of a storage tank can vary depending on time. If this variation is included in the
permit and is sufficiently large that the inclusion of the variation results in a significant shift in the risk, the variation in fill level must be included in the calculations by assuming a few representative fill levels and the associated probability of their occurrence.
4. The scenarios and failure frequencies of a storage facility aboveground must be used for a
storage tank that is placed in a cellar. 5. If the pipe connection up to the first flange is longer than ten meters, the pipe connection
should be included as a separate pipe section.

Reference Manual Bevi Risk Assessments version 3.1 – Module C 01-01-2009
page 35 of 90
3.6 Atmospheric storage tanks 3.6.1 Definition Atmospheric storage tanks are used for storing liquids such as petroleum products, acrylonitrile, methanol and acetone, and liquified cooled gases, such as ammonia, chlorine and methane. A storage tank is an atmospheric storage tank if its maximum permissible pressure is less than or equal to 0.5 bar of overpressure. Generally the overpressure is a maximum of 70 mbar. 3.6.2 Characteristics Atmospheric storage tanks can be subdivided according to the structure. The following categorisation is used for failure frequencies: Single containment atmospheric tank A single containment atmospheric tank is a tank with a primary container for the liquid. If a shell is present, then it is intended for insulation. The shell is not designed to contain the liquid in the event of a failure of the primary container. Atmospheric tank with a protective outer shell The tank consists of a primary container for the liquid and a protective shell that is designed so that in the event of a failure of the primary container it collects the liquid, but not the vapour. The shell is not resistant to withstanding stresses such as explosions (static compression stress of 0.3 bar for 300 ms), fragments and cold thermal stress. Double containment atmospheric tank The tank consists of a primary container for the liquid and a protective shell that in the event of a failure of the primary container collects the liquid, and is able to withstand all possible stresses, such as explosions (static compression stress of 0.3 bar for 300 ms), fragments and cold thermal stress. The shell cannot contain any vapour. Full containment atmospheric tank The tank consists of a primary container for the liquid and a secondary container. The latter is designed to collect both the liquid and the vapour in the event of a failure of the primary container and can withstand all possible stresses, such as explosions (static compression stress of 0.3 bar for 300 ms), fragments and cold thermal stress. The outer roof is supported by the second containment housing and is able to withstand stresses, such as explosions. Membrane tank The membrane tank consists of a primary container and a secondary container. The primary container consists of a non-self-supporting membrane that under normal operating conditions contains the liquid and the vapour. The secondary container is made of concrete and supports the first containment housing. If the inner tank fails, all liquid is collected in the secondary container and no vapour is released in an uncontrolled manner. The outer roof is an integral part of the secondary container. In-ground atmospheric tank An in-ground atmospheric tank is a storage tank with a liquid level less than or equal to ground level.
Reference Manual Bevi Risk Assessments version 3.1 – Module C 01-01-2009
page 36 of 90
Mounded atmospheric tank A mounded atmospheric tank is a storage tank that is completely covered with a layer of soil and in which the level of liquid is above ground level. The following items can be present in the case of an atmospheric storage tank, depending on the type of design:
− Drainage pipe from the floor of the tank − rain water outlet from floating roof − Liquid inlet and drainage pipes − Vapour return pipe (solid roof) − Inert gas pipe (solid roof) − Pressure/vacuum valve (solid roof) − Mixer − Steam heating (for heavy oil, for example) − Cooling installation (cryogenic tanks) − Liquid level indicator − Alarms for high temperature and low/high level − Fire protection in the form of foam − Bund
3.6.3 Scenarios The scenarios and failure frequencies for an atmospheric storage tank apply to the storage tank with pipe connections up to the first flange and instrumentation pipes. The pipeline system should be considered separately. The scenarios for an atmospheric storage tank are set out in Table 17 – Table 23. An overview of the parts that are included in the generic scenarios is displayed in Table 24. Table 17 Scenarios for single containment atmospheric storage tanks
Frequency (per annum)
1. Instantaneous release of entire contents
5 × 10⁻⁶
2. Release of entire contents in 10 min. in a continuous and constant stream 5 × 10⁻⁶ 3. Continuous release from a hole with an effective diameter of 10 mm
1 × 10⁻⁴

Reference Manual Bevi Risk Assessments version 3.1 – Module C 01-01-2009
page 37 of 90
Table 18 Scenarios for atmospheric storage tanks with a protective outer shell Frequency
(per annum) 1. Instantaneous failure of primary container and outer shell; release of the entire
contents
5 × 10⁻⁷
2. Instantaneous failure of primary container; release of the entire contents into the intact outer shell
5 × 10⁻⁷
3. Failure of the primary container and outer shell; release of the entire contents in 10 min. in a continuous and constant stream
5 × 10⁻⁷
4. Failure of the primary container; release of the entire contents in 10 min. in a continuous and constant stream into the intact outer shell
5 × 10⁻⁷
5. Failure of primary container; continuous release from a hole with an effective
diameter of 10 mm into the intact outer shell
1 × 10⁻⁴
Table 19 Scenarios for double containment atmospheric storage tanks
Frequency (per annum)
1. Instantaneous failure of primary container and outer shell; release of the entire
contents
1.25 × 10⁻⁸
2. Instantaneous failure of primary container; release of the entire contents into the intact outer shell
5 × 10⁻⁸
3. Failure of the primary container and outer shell; release of the entire contents in 10 min. in a continuous and constant stream
1.25 × 10⁻⁸
4. Failure of the primary container; release of the entire contents in 10 min. in a continuous and constant stream into the intact outer shell
5 × 10⁻⁸
5. Failure of primary container; continuous release from a hole with an effective
diameter of 10 mm into the intact outer shell
1 × 10⁻⁴
Table 20 Scenarios for full containment atmospheric storage tanks
Frequency (per annum)
1. Instantaneous failure of primary and secondary container; release of the entire
contents
1 × 10⁻⁸
Reference Manual Bevi Risk Assessments version 3.1 – Module C 01-01-2009
page 38 of 90
Table 21 Scenarios for membrane tanks Frequency
(per annum) 1. Instantaneous failure of primary and secondary container; release of the entire
contents
1 × 10⁻⁸
Table 22 Scenarios for in-ground atmospheric storage tanks
Frequency (per annum)
1. Instantaneous failure of the tank and ground cover; evaporation from a pool of
liquid the size of the tank surface area
1 × 10⁻⁸
Table 23 Scenarios for mounded atmospheric storage tanks
Frequency (per annum)
1. Instantaneous failure of tank and soil cover; release of the entire contents
1 × 10⁻⁸
Table 24 Parts included in the scenarios for an atmospheric storage tank
Included in the default scenarios Not included in the default scenarios - Instrumentation pipes - Pipe connections up to the first flange - Connections for steam heating, rain water
drainage, etc. - Pressure/vacuum valve
- Pipeline system - Cooling installation for cryogenic storage
Points for consideration:
1. In establishments there may be a substantial difference between permitted quantity of hazardous substance and the quantity of hazardous substance that is usually present in thatestablishment. The permitted quantity of substance is used in the QRA calculation.
2. The fill level of a tank can vary depending on time. If this variation is included in the permit
and is sufficiently large that the inclusion of the variation results in a significant shift in the risk, the variation in fill level must be included in the calculations by assuming a few representative fill levels and the associated probability of their occurrence.
3. Storage tanks can be used to store different substances at different times. The situation that is
permitted is critical for the QRA calculation. If large quantities of different substances are stored, example substances are used in the QRA. The permitted substance or the example substance for the most hazardous permitted category is then used in the calculation.
4. If the pipe connection up to the first flange is longer than ten meters, the pipe connection
should be included as a separate pipe section. 5. Pipeline connections up to the first flange are assumed to be inside the protective outer shell.
If the first flange is outside the outer shell and there is a floor inlet, for the scenarios in Table
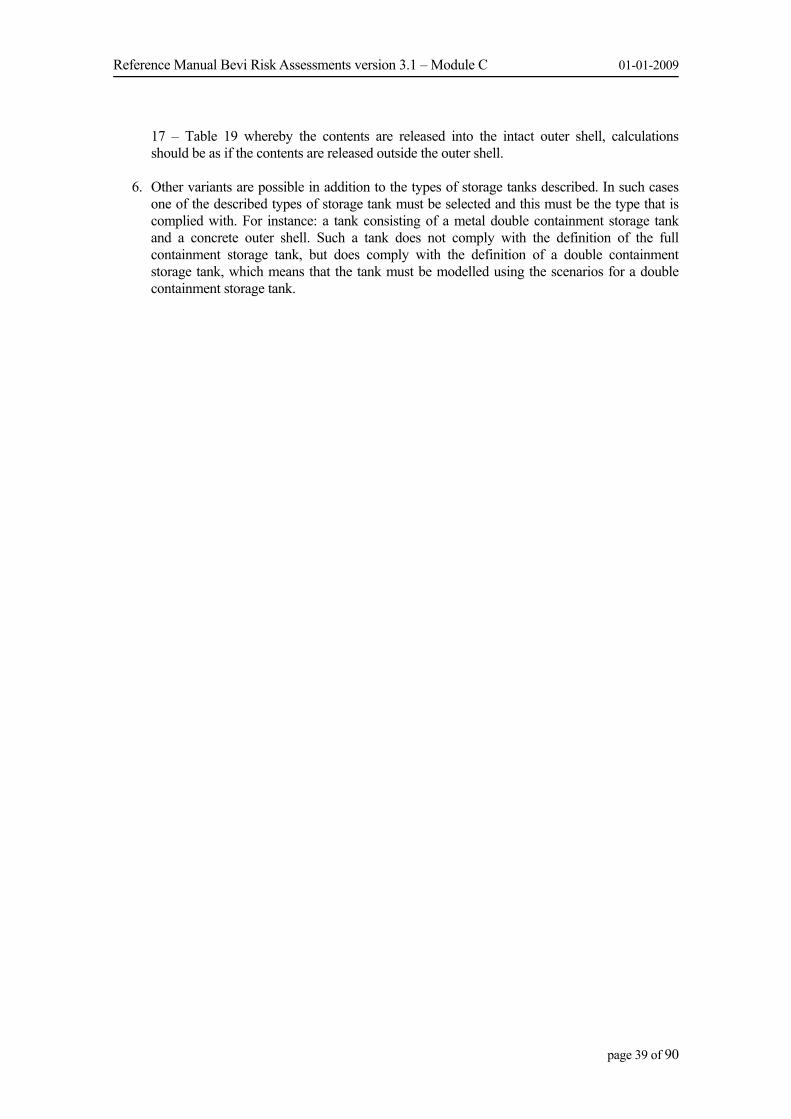
Reference Manual Bevi Risk Assessments version 3.1 – Module C 01-01-2009
page 39 of 90
17 – Table 19 whereby the contents are released into the intact outer shell, calculations should be as if the contents are released outside the outer shell.
6. Other variants are possible in addition to the types of storage tanks described. In such cases
one of the described types of storage tank must be selected and this must be the type that is complied with. For instance: a tank consisting of a metal double containment storage tank and a concrete outer shell. Such a tank does not comply with the definition of the full containment storage tank, but does comply with the definition of a double containment storage tank, which means that the tank must be modelled using the scenarios for a double containment storage tank.

Reference Manual Bevi Risk Assessments version 3.1 – Module C 01-01-2009
page 40 of 90
3.7 Gas containers 3.7.1 Definition Gas containers are large, sliding tanks in which gases are stored at (near-) atmospheric pressure. 3.7.2 Characteristics A characteristic feature of a gas container is that the pressure of the tank is constant and the volume of the tank varies. For this purpose the tanks have an external steel frame, in which the top of the tank can move. 3.7.3 Scenarios The scenarios and failure frequencies for a gas container apply to the gas container with pipe connections up to the first flange and instrumentation pipes. The pipeline system should be considered separately. The scenarios for a gas container are set out in Table 25. An overview of the parts that are included in the generic scenarios is displayed in Table 26. Table 25 Scenarios for gas containers
Frequency (per annum)
1. Instantaneous release of entire contents
5 × 10⁻⁶
2. Release of entire contents in 10 min. in a continuous and constant stream 5 × 10⁻⁶ 3. Continuous release from a hole with an effective diameter of 10 mm
1 × 10⁻⁴
Table 26 Parts included in the scenarios for a gas container
Included in the default scenarios Not included in the default scenarios - Instrumentation pipes - Pipe connections up to the first flange
- Pipeline system - Safety valve

Reference Manual Bevi Risk Assessments version 3.1 – Module C 01-01-2009
page 41 of 90
3.8 Pipelines 3.8.1 Characteristics Various subdivisions into types of pipelines can be made, such as process pipes and transport pipes, underground pipes, pipes at ground level and pipes on a pipe bridge, gas pipes and liquid pipes, metal pipes, plastic pipes and coated pipes. Pipes are connected by means of flanges and welds; screw connections or snap-on connections are also used for pipes with a small diameter. Valves can also be present in pipes. 3.8.2 Scenarios For scenarios and failure frequencies no distinction is made between process pipes or transport pipes, the materials from which a pipeline is made, the presence of cladding, the design pressure of a pipeline or its location on a pipe bridge. A distinction is made between aboveground pipes and underground pipes. The scenarios and failure frequencies for a pipeline apply to the pipeline with connections, such as flanges, welds and valves. The scenarios for pipelines aboveground are given in Table 27, and the scenarios for underground pipes are given in Table 28. An overview of the parts that are included in the generic scenarios is displayed in Table 29. Table 27 Scenarios for pipelines aboveground
Frequency (per meter per annum)
nominal diameter
< 75 mm
Frequency (per meter per
annum)
75 mm ≤ nominal diameter ≤ 150
mm
Frequency (per meter per
annum)
nominal diameter > 150 mm
1. Rupture in the pipeline
1 × 10⁻⁶
3 × 10⁻⁷
1 × 10⁻⁷
2. Leak with an effective diameter of 10% of the nominal diameter, up to a maximum of 50 mm
5 × 10⁻⁶ 2 × 10⁻⁶ 5 × 10⁻⁷

Reference Manual Bevi Risk Assessments version 3.1 – Module C 01-01-2009
page 42 of 90
Table 28 Scenarios for underground transport pipelines Frequency
(per meter per annum)
Pipeline in pipe
bay
Frequency (per meter per annum)
Pipeline complies with NEN 3650
Frequency (per meter per annum)
Other pipelines
1. Rupture in the pipe
7 × 10⁻⁹
1.525 × 10⁻⁷
5 × 10⁻⁷
2. Leak with an effective diameter
of 20 mm
6.3 × 10⁻⁸ 4.575 × 10⁻⁷ 1.5 × 10⁻⁶
Table 29 Parts included in the scenarios for pipelines
Included in the default scenarios Not included in the default scenarios - Connections (flanges, welds) - Valves
- pumps (see paragraph 3.11)
Notes:
1. Pipelines can be located inside or outside a building. This does not affect the scenarios and failure frequencies.
2. The location of the rupture is important for the outflow rate. By default a pipe length up to
the rupture equal to 5 meters is assumed. If the scenario carries a significant risk contribution, a further refinement can be made by calculating with various pipe lengths in accordance with the table set out below:
pipe section Pipe length to the rupture
0 – 20 m 5 m 20 – 50 m 30 m
50 – 100 m 70 m 100 – 200 m 130 m
… … The pipe length to the rupture is calculated from the vessel upstream or from the vessel out of which there is the largest outflow. In the case of a leak the location of the leak is not relevant to the outflow rate; a leak is modelled as a hole in a tank, taking into account the pump pressure.
Example: A discharge pipe aboveground (DN100) with a length of 150 meters runs out of a tank. Pipe rupture carries a significant risk contribution. The rupture scenarios are given in Table 30.

Reference Manual Bevi Risk Assessments version 3.1 – Module C 01-01-2009
page 43 of 90
Table 30 Scenarios for a pipeline aboveground (DN100, length 150 meters) Outflow Frequency (per year) Rupture 5 meters from the vessel 20 × 3 × 10-7 Rupture 30 meters from the vessel 30 × 3 × 10-7 Rupture 70 meters from the vessel 50 × 3 × 10-7 Rupture 130 meters from the vessel 50 × 3 × 10-7 Leakage 150 × 2 × 10-6
3. To be able to draw up a representative risk contour for long transport lines, failure locations must be selected that are located at a regular distance from one another. The number must be sufficiently high to guarantee that the risk contour does not change significantly when the number of failure locations is increased. An acceptable initial distance between two failure locations is 50 meters.
4. The failure of connections such as flanges and welds is assumed to be included in the failure
frequencies for the pipes. Consequently, a minimum length of 10 meters must always be used.
5. The diameter of a pipe can vary over the distance. One pipe diameter, a weighted average, is
assumed in the QRA calculation. It must be indicated in the report how this weighted average is determined.
6. Transport pipelines aboveground can be compared under certain conditions with
(underground) pipes in a pipe bay. The necessary conditions for this, amongst other things, are that external damage is excluded, there are few to no flanges and accessories present and the pipe is clearly marked. In very specific situations the use of a lower failure frequency for transport pipes aboveground can be justified, such as the failure frequency of (underground) pipes in a pipe bay. Lower failure frequencies are used in specific situations, particularly for natural gas pipes. The use of failure frequencies for transport pipes aboveground that are lower than the values in Table 27 must be submitted and approved on a case-by-case basis by the competent authority (article 8b of the Revi).

Reference Manual Bevi Risk Assessments version 3.1 – Module C 01-01-2009
page 44 of 90
3.9 Reactor vessel and process vessel 3.9.1 Definitions In reactor vessels changes in the chemical characteristics of substances take places. Examples of reactor vessels are continuous, semi-batch and batch reactors. A change in the physical characteristics of the substances takes place in process vessels, for example the temperature or phase. This also includes filters and vessels in which substances are mixed. Distillation columns and condensers are described separately. Vessels in which only the quantity of substance changes, must be considered as being (pressurised) storage. A buffer vessel in a process installation can be seen as an example of this. 3.9.2 Characteristics The following items are present as standard in the case of a reactor:
− Pipes for the delivery and removal of substances − Instrumentation for level, pressure (temperature) − Pressure relief device (optional) − Quick-closing valves (optional) − Cooling, stirrer
Facilities may also be present for adding an inhibitor to quickly stop the reaction. The following items are present as standard in the case of a process vessel:
− Pipes for the delivery and removal of substances − Instrumentation for level, pressure (temperature) − Pressure relief device (optional) − Quick-closing valves (optional)
3.9.3 Scenarios The scenarios for reactor vessels and process vessels are set out in Table 31, the parts included in Table 32. Table 31 Scenarios for reactor vessels and process vessels
Frequency (per annum)
1. Instantaneous release of entire contents of the reactor vessel/processor vessel
5 × 10⁻⁶
2. Release of entire contents in 10 min. in a continuous and constant stream 5 × 10⁻⁶ 3. Continuous release from a hole with an effective diameter of 10 mm
1 × 10⁻⁴

Reference Manual Bevi Risk Assessments version 3.1 – Module C 01-01-2009
page 45 of 90
Table 32 Parts included in the scenarios for a reactor vessel/process vessel Included in the default scenarios Not included in the default scenarios
- Instrumentation pipes - Pipe connections up to the first flange
- Pipelines - Pressure relief device
Points for consideration:
1. The composition of the contents of the (batch) reactor vessel / process vessel and the conditions in the reactor vessel/process vessel vary with time. If relevant a few representative situations and the associated time-adjusting frequency must therefore be calculated.

Reference Manual Bevi Risk Assessments version 3.1 – Module C 01-01-2009
page 46 of 90
3.10 Distillation column 3.10.1 Definition A distillation column is used for separating a mixture by means of difference in vapour pressure. 3.10.2 Characteristics The following items are present as standard in the case of a distillation column (see also Figure 4). − Column − Condenser and reflux vessel − Reboiler − Pump − Pipes between the column and the condenser, between the column and reflux vessel,
between the column and the reboiler and between the condenser and the reflux vessel − Supply pipe for mixture, drainage pipes for top and bottom product − Pressure relief − Quick-closing valves (optional) − Instrumentation for level, pressure, reflux, temperature
Condensor
Refluxvat Reboiler
Figure 4 Diagram of a distillation column 3.10.3 Scenarios The scenarios and failure frequencies for the distillation column are set out in Table 33. In addition scenarios must be included for the condenser (paragraph 3.12), pumps (paragraph 3.11), the various pipes (paragraph 3.8) and the vessels connected with the column (paragraphs 3.5 and 3.9). Each stretch of pipe between the various parts must be modelled separately. The scenarios and failure frequencies for the transport pipes as from the shut-off valves are set out in paragraph 3.7, and for the pressure relief device in paragraph 3.13.

Reference Manual Bevi Risk Assessments version 3.1 – Module C 01-01-2009
page 47 of 90
Table 33 Scenarios for distillation column Frequency
(per annum) 1. Instantaneous release of entire contents of the column
5 × 10⁻⁶
2. Release of entire contents in 10 min. In a continuous and constant stream 5 × 10⁻⁶ 3. Continuous release from a hole with an effective diameter of 10 mm
1 × 10⁻⁴
3.10.4 Example The scenarios from Table 33 must be included for the distillation unit as set out in Figure 4. This is examined in more detail in Table 34. Notes for Table 34:
1. In the event of a failure of any of the parts such as the reflux vessel, the influx from other installation parts, such as the column, must be taken into account.
2. The 10 mm hole must by default be divided between the two sections.
3. The scenarios for the condenser are set out in paragraph 3.12. It is assumed in the example
that the design pressure of the casing is less than the pressure in the pipe. As the contents of the condenser are limited, the outflow from the connecting pipework is critical.

Reference Manual Bevi Risk Assessments version 3.1 – Module C 01-01-2009
page 48 of 90
Table 34 Scenarios for the distillation unit from Figure 4 Component Scenario Frequency
(per annum) Column 1. Instantaneous release
5 × 10⁻⁶
2. Release in 10 min. 5 × 10⁻⁶
3a. 10 mm hole, rectifying section 3b. 10 mm hole, stripping section
5 × 10⁻⁵
5 × 10⁻⁵
Condenser 1. Rupture 10 pipes
1 × 10⁻⁵
2. Rupture in the pipe 1 × 10⁻³
3. Leakage
1 × 10⁻²
Reflux vessel 1. Instantaneous release
5 × 10⁻⁷
2. Release in 10 min.
5 × 10⁻⁷
3. 10 mm hole
1 × 10⁻⁵
Reboiler 1. Instantaneous release
5 × 10⁻⁶
2. Release in 10 min.
5 × 10⁻⁶
3. 10 mm hole
1 × 10⁻⁴
Pipe Column – Condenser
Rupture
Leakage
Pipe Condenser – Reflux vessel
Rupture
Leakage
Pipe Reflux vessel – Column
Rupture
Leakage
Pipe Column – Reboiler
Rupture
Leakage
Pipe Reboiler – Column
Rupture
Leakage
Pumps Catastrophic failure Leakage

Reference Manual Bevi Risk Assessments version 3.1 – Module C 01-01-2009
page 49 of 90
3.11 Pumps and compressors 3.11.1 Characteristics Pumps can be subdivided roughly into two different types: reciprocating pumps and centrifugal pumps. This last category can be further subdivided into ‘canned pumps’ (or ‘sealless pumps’) and pumps with seals (gasket). A canned pump can be defined as an ‘encapsulated’ pump where the process liquid is located in the space around the rotor (‘impeller’) and in which case gaskets are not used. Compressors can be subdivided roughly into two types: reciprocating compressors and centrifugal compressors. 3.11.2 Scenarios The scenarios and failure frequencies for pumps and compressors are set out in Table 35 and Table 36. Table 35 Scenarios for centrifugal pumps and centrifugal compressors Canned (without gasket)
Frequency (per annum)
With gasket Frequency (per annum)
Catastrophic failure
1 × 10⁻⁵
1.0 × 10⁻⁴
Leak (10 % diameter)
5 × 10⁻⁵
4.4 × 10⁻³
Table 36 Scenarios for reciprocating pumps and reciprocating compressors Frequency
(per annum) Catastrophic failure
1.0 × 10⁻⁴
Leak (10 % diameter)
4.4 × 10⁻³
Notes:
1. There is no difference in failure frequency between pumps with a single gasket and pumps with a double gasket.
2. The scenarios only apply to the time that the pump or compressor is in operation. 3. The catastrophic failure of a pump is modelled as a pipe rupture of the supply pipe to the
pump. The leak scenario is modelled as a leak in the supply pipe to the pump.

Reference Manual Bevi Risk Assessments version 3.1 – Module C 01-01-2009
page 50 of 90
3.12 Heat exchangers and condensers 3.12.1 Definition In a heat exchanger heat is transferred from one (liquid) substance to another. The different liquids are separated from one another by a solid wall to prevent mixing. Condensers can be classified as heat exchangers as they share the same design types and only differ in function: in condensers a phase change occurs from gas to liquid. 3.12.2 Characteristics and scenarios A distinction can be made between different types of heat exchanger:
− pipe heat exchangers where the hazardous substance is located outside the pipes (Table 37); − pipe heat exchangers where the hazardous substance is located inside the pipes, and where
the casing has a design pressure that is greater than or equal to the maximum pressure of the hazardous substance occurring in the pipe (Table 38);
− pipe heat exchangers where the hazardous substance is located inside the pipes, and where the casing has a design pressure that is less than the maximum pressure of the hazardous substance occurring in the pipe (Table 39).
− pipe heat exchangers where the hazardous substance is located both inside the pipes and inside the casing (Table 40).
− plate heat exchangers where the hazardous substance is located inside the channels between the various plates (Table 37).
Table 37 Scenarios for pipe heat exchangers where the hazardous substance is located outside the
pipes and for plate heat exchangers Frequency
(per annum) 1. Instantaneous release of entire contents
5 × 10⁻⁵
2. Release of entire contents in 10 min. In a continuous and constant stream 5 × 10⁻⁵ 3. Continuous release from a hole with an effective diameter of 10 mm
1 × 10⁻³
Table 38 Scenarios for pipe heat exchangers where the hazardous substance is located inside the
pipes and where the casing has a design pressure that is greater than or equal to the maximum pressure of the hazardous substance occurring in the pipe
Frequency 1. Rupture of 10 pipes at the same time
1 × 10⁻⁶

Reference Manual Bevi Risk Assessments version 3.1 – Module C 01-01-2009
page 51 of 90
Table 39 Scenarios for pipe heat exchangers where the hazardous substance is located inside the pipes and where the casing has a design pressure that is less than or equal to the maximum pressure of the hazardous substance occurring in the pipe
Frequency (per annum)
1. Rupture of 10 pipes at the same time
1 × 10⁻⁵
2. Rupture of 1 pipe
1 × 10⁻³
3. Leak with an effective diameter of 10% of the nominal diameter of one pipe,
up to a maximum of 50 mm
1 × 10⁻²
Notes:
1. The substances are released directly into the atmosphere in all scenarios. It is assumed that contamination of the refrigerant does not lead to external risks. If the heat exchanger is equipped with safety provisions, for example with a safety valve, this must be taken into account in determining the outflow.
2. In the event of a rupture of 10 pipes at the same time, an effective pipe diameter equal to the
total surface area of the outflow must be calculated with.
3. The supply from the connected pipelines must also be taken into consideration. For a pipe heat exchanger containing the hazardous substance in the casing this means that, in addition to the instantaneous release of the contents of the casing, a pipe rupture of the supply pipe must also be included in the scenario.
4. If in addition to the hazardous substance in the pipes a hazardous substance is also present in
the casing of the heat exchanger, in the event of a rupture of the pipe the outflow of 2 hazardous substances must be taken into account (see Table 40).
Table 40 Scenarios for pipe heat exchangers where the hazardous substance is located both
inside the pipes and inside the casing Scenarios casing has a design pressure > max pressure of hazardous substance occurring in the pipe
* Outflow of substance from casing → see scenarios in Table 37 * Outflow of substance from casing and substance from pipes → Rupture of 10 pipes simultaneously:10-6
casing has a design pressure ≤ max pressure of hazardous substance occurring in the pipe
* Outflow of substance from casing → see scenarios in Table 37 * Outflow of substance from casing and substance from pipes → see scenarios in Table 39
5. Given the construction of plate heat exchangers, where the hazardous substance is in the
channels between the plates, a leak or rupture of the casing will give rise to an outflow. For modelling, the scenarios of pipe heat exchangers containing hazardous substances outside the pipelines are used ( see Table 37).

Reference Manual Bevi Risk Assessments version 3.1 – Module C 01-01-2009
page 52 of 90
3.13 Pressure relief device 3.13.1 Definition A pressure relief device is a component that opens if the pressure in the system exceeds a preset pressure. Amongst other things, safety valves and rupture disks are categorised as being pressure relief devices. 3.13.2 Scenarios The scenario for opening a pressure relief device is included in Table 41. The scenarios and frequencies apply both to safety valves and rupture disks and combinations of these. This scenario only needs to be included if opening a pressure relief device leads to an emission involving risks to the surrounding area. Table 41 Scenarios for opening a pressure relief device
Frequency (per annum)
1. Outflow at the maximum outflow rate
2 × 10⁻⁵

Reference Manual Bevi Risk Assessments version 3.1 – Module C 01-01-2009
page 53 of 90
3.14 Transport units 3.14.1 Definition Transport units are understood to mean: road tankers, tank wagons and ships that are located inside an establishment and/or that are involved in a loading and/or unloading activity of an establishment. For the scenarios relating to loading, reference is made to chapter 3.15. Atmospheric road tankers (or tank wagons) are defined as road tankers (tank wagons) for transporting hazardous substances, with the exception of the substances that fall into ADR category 2. Pressurised tankers (pressurised tank wagons) are defined as being tankers (tank wagons) for transporting hazardous substances that fall into ADR category 2. 3.14.2 Characteristics Included under transport units are not only the fixed liquid or gas tanks, but also the fixed pipes and accessories on or under these tanks, such as riser pipes, flanges and interconnections for connecting feed/discharge hoses. 3.14.3 Scenarios The failure frequencies displayed in this paragraph must be adjusted for the number of transport units and the portion of time that these are present per annum. 3.14.3.1 Road tanker Road tankers are understood to mean transport vehicles with fixed tanks, as well as removable tanks. In addition, they include battery wagons and, insofar as these are fitted on a transport vehicle: tank containers, swap body tanks and MEGCs (multiple element gas containers). For the scenarios for tankers at an establishment, a distinction is made between the following categories:
− tankers with an atmospheric tank (Table 42) − tankers with a pressurised tank (Table 43)
Table 42 Scenarios for road tankers with an atmospheric tank
Frequency (per annum)
1. Instantaneous release of entire contents
1 × 10⁻⁵
2. Release of entire contents from the largest connection 5 × 10⁻⁷

Reference Manual Bevi Risk Assessments version 3.1 – Module C 01-01-2009
page 54 of 90
Table 43 Scenarios for road tankers with a pressurised tank Frequency
(per annum) 1. Instantaneous release of entire contents
5 × 10⁻⁷
2. Release of entire contents from the largest connection 5 × 10⁻⁷ Points for consideration:
1. If compartmentalising atmospheric tanks, for the scenario involving the release of the entire contents from the largest connection, each compartment must be considered as being a separate tank, in which case the failure frequency of 5 × 10⁻⁷ per annum is divided by the number of compartments. For instantaneous scenarios the compartmentalised tanker must be considered to be a single tank.
2. If there are no connections for an atmospheric tank located on the side or bottom of the tank,
the scenario involving the release of the entire contents from the largest connection does not need to be included.
3. No scenarios are included for Loss of Containment as a result of external damage to tankers
or fire in the surrounding area. It is assumed that sufficient measures are taken to prevent external damage to the tank, such as lining them up in isolation and/or a low speed. It is also assumed that a loaded tanker is not lined up close to flammable liquids, or close to such a quantity of flammable materials that the heat radiation from a fire would result in failure of the tanker. If such a situation is present, it must be averted preferably by taking measures.
There are situations in which fire in the surrounding area and/or external damage cannot be ruled out. An example of this is an LPG tanker at an LPG filling station during loading. In cases like this an additional BLEVE scenario needs to be added. See the calculation method for LPG filling stations.
3.14.3.2 Tank wagons For the scenarios for tank wagons at an establishment a distinction is made between the following categories:
− tank wagons with an atmospheric tank (Table 44) − tank wagons with a pressurised tank (Table 45)
Table 44 Scenarios for tank wagons with an atmospheric tank
Frequency (per annum)
1. Instantaneous release of entire contents
1 × 10⁻⁵
2. Release of entire contents from the largest connection 5 × 10⁻⁷

Reference Manual Bevi Risk Assessments version 3.1 – Module C 01-01-2009
page 55 of 90
Table 45 Scenarios for tank wagons with a pressurised tank Frequency
(per annum) 1. Instantaneous release of entire contents
5 × 10⁻⁷
2. Release of entire contents from the largest connection 5 × 10⁻⁷ Points for consideration:
1. If compartmentalising atmospheric tanks, for the scenario involving the release of the entire contents from the largest connection, each compartment must be considered as being a separate tank, in which case the failure frequency of 5 × 10⁻⁷ per annum is divided by the number of compartments. For instantaneous scenarios the compartmentalised rail tank wagon must be considered to be a single tank.
2. If there are no connections for an atmospheric tank located on the side or bottom of the tank,
the scenario involving the release of the entire contents from the largest connection does not need to be included.
3. No scenarios are included for external damage to tank wagons. It is assumed that sufficient
measures are taken to prevent external damage to the tank, such as column guards and/or a low speed. It is also assumed when calculating the frequency that a loaded tank wagon is not lined up close to flammable liquids, or close to such a quantity of flammable materials that the heat radiation from a fire would result in the failure of the tank wagon. If such a situation is present, it must be averted preferably by taking measures. For the calculation method with regard to external impact and fire in shunting yards (with a public function), please refer to the ‘Calculation protocol for the transportation of hazardous substances by rail’ [11].
3.14.3.3 Ships There are no scenarios for intrinsic failure for ships. It is assumed that loading takes place for most of the time that a ship is present, and the loading scenarios are dominant compared to intrinsic failure. The only scenarios that are relevant in addition to loading are external damage as a result of ship collisions. These are very much determined by the local situation. In the case that a ship is located in a (small) port outside the transport routes, the probability of a collision that leads to an outflow is so small that it does not need to be taken into consideration. In other cases the basic failure frequency for accidents, f0, has to be determined based upon the specific route section. If no information is known, the calculation must be completed using a general basic failure frequency for accidents, f0. This is equal to 6.7 × 10⁻¹¹ × T × t × N, where T is the total number of ships per annum on the transport route or in the port, t is the average loading time for each ship (in hours) and N is the number of loading operations per annum. The scenarios for ships are set out in Table 46 – Table 49.

Reference Manual Bevi Risk Assessments version 3.1 – Module C 01-01-2009
page 56 of 90
Table 46 Scenarios for gas tankers Frequency
1. Continuous release of 180 m3 in 1800 s
0.00012 × f0
2. Continuous release of 90 m3 in 1800 s
0.025 × f0
Table 47 Scenarios for semi-gas tankers (refrigerated)
Frequency 1. Continuous release of 126 m3 in 1800 s
0.00012 × f0
2. Continuous release of 32 m3 in 1800 s
0.025 × f0
Table 48 Scenarios for double containment liquid tankers
Frequency 1. Continuous release of 75 m3 in 1800 s
0.0015 × f0
2. Continuous release of 20 m3 in 1800 s
0.006 × f0
Table 49 Scenarios for single containment liquid tankers
Frequency 1. Continuous release of 75 m3 in 1800 s
0.1 × f0
2. Continuous release of 30 m3 in 1800 s
0.2 × f0

Reference Manual Bevi Risk Assessments version 3.1 – Module C 01-01-2009
page 57 of 90
3.15 Loading activities Loading takes place from a storage tank to a transport unit (road tanker, tank wagon or ship) or from a transport unit to a storage tank. The following items are present as standard for a loading operation.
− Security measures to protect the transport unit from colliding or being moved − Hose or loading arm for loading materials in their liquid phase − Quick-closing valves in the liquid pipes with emergency stop-buttons − Pump for loading the substance − Vapour return pipe, connected to the vapour phase − Instrumentation for level, pressure (temperature)
The scenarios for loading are set out in Table 50. Table 50 Scenarios for loading activities
Frequency Loading/unloading
arm (per hour)
Frequency Loading/unloading
hose (per hour)
1. Rupture of loading/unloading arm or loading/unloading hose 2. Leak in loading/unloading arm or
loading/unloading hose with an effective diameter of 10% of the nominal diameter, up to a maximum of 50 mm.
3 × 10⁻⁸
3 × 10⁻⁷
4 × 10⁻⁶
4 × 10⁻⁵
In addition, when loading flammable substances the failure of the road tanker (or tank wagon) as a result of a domino effect must be taken into account. These scenarios are set out in Table 51. Table 51 Additional scenarios for loading flammable substances for road tankers and tank wagons
Type of tanker/tank wagon Scenario
Frequency (per hour)
1. Atmospheric 2. Pressure
Instantaneous release of entire contents,
pool fire
Instantaneous release of entire contents,
BLEVE
5.8 × 10⁻⁹
5.8 × 10⁻¹⁰
Points for consideration:
1. The additional scenarios for loading flammable substances must also be included for substances that are modelled as being both flammable and toxic.

Reference Manual Bevi Risk Assessments version 3.1 – Module C 01-01-2009
page 58 of 90
4. Brzo establishments as defined in article 2 under a Bevi - Measures and system reactions
The calculation method for Brzo establishments is set out in chapters 2 to 4. The inclusion of measures and system reactions for Brzo establishments is described in this chapter. The applicable measures and system reactions specific to other categories are described in the chapters 5 and thereafter. 4.1 Introduction Measures are aimed at preventing a Loss of Containment (preventative measures., see chapter 3) and at minimising the effects given a Loss of Containment (mitigating measures). An overview is given in this chapter of the way repression systems are included in the QRA. In addition it indicates how to calculate using system reactions such as a change in pumping rate. The following repression systems are included in a QRA calculation.
− Bund (see paragraph 4.2.1) − Blocking systems (see paragraph 4.2.2) − Excess flow valves (see paragraph 4.2.3) − Non-return valve (see paragraph 4.2.4) − Immobilisers and break-away couplings (see paragraph 4.2.5) − Intervention by operators (see paragraph 4.2.6) − Fire protection systems (see paragraph 4.2.7) − Other repression systems (see paragraph 4.2.8)
4.2 Repression systems 4.2.1 Bund 4.2.1.1 Definition and characteristics A bund consists of a contained or recessed horizontal area around a tank for the purpose of limiting the spread of a pool of liquid. The contents of the bund are at least equal to the storage capacity of the tank. If several tanks are present in the bund, the contents are at least equal to the storage capacity of the largest tank plus 10% of the storage capacity of the other tanks. 4.2.1.2 Modelling A bund is included in the calculation by limiting the maximum surface area of the pool to the surface areal of the bund for continuous scenarios and 1.5 × the surface area of the bund for instantaneous scenarios. If it is demonstrated that overtoppingm is not possible (see, for example, [8, 9]), then a maximum surface area of the pool can be calculated that is equal to the surface area of the bund for all scenarios. This is the case if the height of the bank is greater than the fluid column.
l If there are several tanks in one tank pit, the calculation is done using the surface area that is available for the liquid that has flowed out, in other words the net surface area. m the phenomenon that in the event of a catastrophic failure of the tank a tidal wave occurs as a result of which a proportion of the liquid spills over the edge of the tank bund and gets outside the tank bund.

Reference Manual Bevi Risk Assessments version 3.1 – Module C 01-01-2009
page 59 of 90
4.2.1.3 Example An atmospheric tank with acrylonitrile is installed in a 2000 m2 bund. The scenarios as set out in Table 52 must be used in the QRA. Table 52 Scenarios for an acrylonitrile tank in a 2000 m2 bund LOC Frequency Size of pool of liquid Instantaneous 5 × 10⁻⁶ per annum 3000 m2 10 minutes of outflow 5 × 10⁻⁶ per annum 2000 m2 10 mm hole 1 × 10⁻⁴ per annum 2000 m2 4.2.2 Blocking systems 4.2.2.1 Definition and characteristics Blocking systems are used to limit the released quantity following a LOC. A blocking system consists of a detection system, for example gas detection, combined with shut-off valves. The shut-off valves can be closed automatically or manually. The effectiveness of a blocking system is determined by various factors, such as the position of gas detection monitors and their distribution throughout the various wind directions. Furthermore, the detection limit and the response time of the system as well as the operator's intervention time are also relevant. The following conditions must be met to include the operation of a blocking system in the risk analysis:
− An automatic detection system must be present that results in signalling within the control room or automatic control of the blocking valves. An example of this is a gas detection system with sufficiently sensitive monitors and adequate detection points. In the case of signalling in the control room this room must be continuously staffed.
− The detection system and the shut-off valves must be regularly tested. For situations in which there is no automatic detection system but instead only (visual) monitoring by an operator, please refer to paragraph 4.2.6. 4.2.2.2 Modelling The effect of a blocking system must be determined using a specific event tree, in which case the failure of the system is also considered. The default values specified here for three representative systems can be used as a guideline. It should be emphasised that the values set out below are only included to give an impression of generally accepted values. The actual situation must be taken as a basis for a QRA, particularly if the probabilities of failure and reaction times vary significantly from the default values specified here.
1 Automatic blocking system An automatic blocking system is a system in which the detection of the leak and the closing of the blocking valves takes place automatically. Action by an operator is not necessary. The probability of failure per operation is equal to 0.001, the time required for the closing of the blocking valves is equal to 2 minutes.

Reference Manual Bevi Risk Assessments version 3.1 – Module C 01-01-2009
page 60 of 90
2 Semi-automatic blocking system A semi-automatic blocking system is a system in which the detection of the leak takes place automatically and leads to an alarm signal in a continuously staffed control room. After validation of the signal the operator closes the blocking valves by actuating a switch in the control room. The probability of failure per operation is equal to 0.01, the time required for closing the blocking valves is equal to 10 minutes.
3 Non-automated blocking system
A non-automated blocking system is a system in which the detection of the leak takes place automatically and leads to an alarm signal in a continuously staffed control room. The operator does not have the facilities to shut off the blocking valves by actuating a switch in the control room, but has to take action outside the control room. For such a system the time required to effectively perform the required actions is so long that there is no effect on the QRA, given the maximum duration of an outflow of 30 minutes that is generally applied.
If several blocking systems are present, the probability of failure of the entire blocking system must be determined. This is not necessarily equal to the product of the individual probabilities of failure for each blocking system, because often ‘common mode failures’ apply. In practice it appears to be extremely difficult to achieve a probability of failure of 0.001 or lower for (a combination of) blocking systems. If for operations a probability of failure of less than 0.001 is used for calculation in a QRA, it must be explicitly substantiated using a fault tree analysis, taking ‘common mode failures’ into account.
4.2.2.3 Example A 10 meter pipe (3") is connected with the liquid phase of a pressure vessel of ammonia (content of 100 tonnes). A blocking shut-off valve is present between the pipe and the tank. The scenarios for a rupture in the pipe are set out for the various systems in Table 53. Table 53 Scenarios for a pipe rupture (3", 10 meter) to an ammonia pressure vessel (content of 100
tonnes) for different types of blocking systems Blocking system Operation Frequency Flow rate Duration of
outflow None
n/a
3 × 10⁻⁶ per annum
16.5 kg/s 1800 s
Automatic blocking system
fails
works
3 × 10⁻⁹ per annum
2.997 × 10⁻⁶ per annum
16.5 kg/s 16.5 kg/s
1800 s120 s
Semi-automatic blocking system fails works
3 × 10⁻⁸ per annum 2.97 × 10⁻⁶ per
annum
16.5 kg/s 16.5 kg/s
1800 s600 s
Non-automated blocking system n/a 3 × 10⁻⁶ per annum 16.5 kg/s 1800 s

Reference Manual Bevi Risk Assessments version 3.1 – Module C 01-01-2009
page 61 of 90
4.2.3 Excess flow valve 4.2.3.1 Definition An excess flow valve is a valve that closes if the flow rate exceeds a set value. 4.2.3.2 Characteristics An excess flow valve is a passive system, in other words the valve closes automatically if the flow rate exceeds a set value, for example because the pressure on a valve exceeds the spring pressure. A system in which a detector emits a signal as a result of which a valve is closed is not an excess flow valve, but a blocking system (see paragraph 4.2.2). 4.2.3.3 Modelling An excess flow valve is included in a QRA. Its operation depends on the ratio between the calculated outflow rate and the set value of the excess flow valve. The probabilities of failure as set out in Table 54 apply in respect of this. Table 54 Probabilities of failure of excess flow valve Ratio outflow rate and set value Probability of not
closing outflow rate ≤ set value 1 set value < outflow rate ≤ 1.2 x set value 0.12 Outflow rate > 1.2 x set value 0.06 The response time of the excess flow valve is equal to five seconds. 4.2.3.4 Example When loading a road tanker with 20 tonnes of LPG (see Figure 5) two excess flow valves are present, namely internally (EFV-1 between the tanker and the pump, set value 13.1 kg/s) and after the pump (EFV-2 between the pump and the filling point, set value 7.4 kg/s). Based upon the outflow flow rates [10], the probabilities of failure for the various LOCs are set out in Table 55, the resulting scenarios are set out in Table 56.
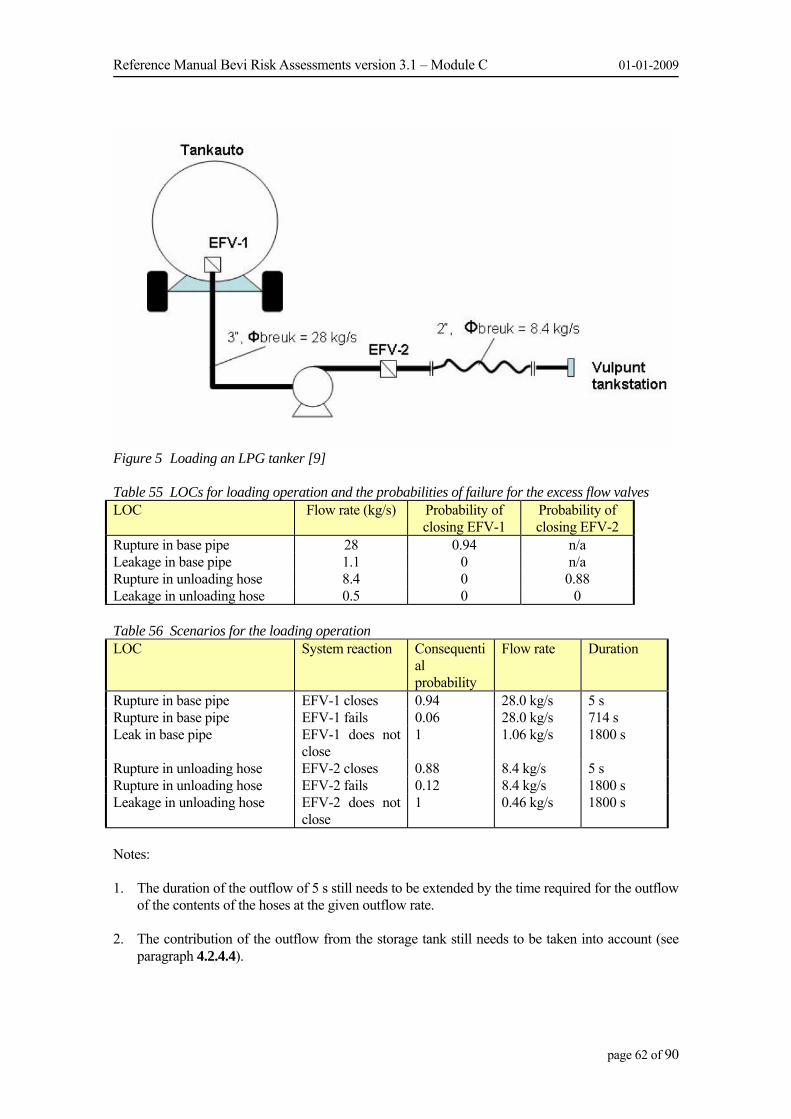
Reference Manual Bevi Risk Assessments version 3.1 – Module C 01-01-2009
page 62 of 90
Figure 5 Loading an LPG tanker [9] Table 55 LOCs for loading operation and the probabilities of failure for the excess flow valves LOC Flow rate (kg/s) Probability of
closing EFV-1 Probability of closing EFV-2
Rupture in base pipe 28 0.94 n/a Leakage in base pipe 1.1 0 n/a Rupture in unloading hose 8.4 0 0.88 Leakage in unloading hose 0.5 0 0 Table 56 Scenarios for the loading operation LOC System reaction Consequenti
al probability
Flow rate Duration
Rupture in base pipe EFV-1 closes 0.94 28.0 kg/s 5 s Rupture in base pipe EFV-1 fails 0.06 28.0 kg/s 714 s Leak in base pipe EFV-1 does not
close 1 1.06 kg/s 1800 s
Rupture in unloading hose EFV-2 closes 0.88 8.4 kg/s 5 s Rupture in unloading hose EFV-2 fails 0.12 8.4 kg/s 1800 s Leakage in unloading hose EFV-2 does not
close 1 0.46 kg/s 1800 s
Notes: 1. The duration of the outflow of 5 s still needs to be extended by the time required for the outflow
of the contents of the hoses at the given outflow rate.
2. The contribution of the outflow from the storage tank still needs to be taken into account (see paragraph 4.2.4.4).

Reference Manual Bevi Risk Assessments version 3.1 – Module C 01-01-2009
page 63 of 90
4.2.4 Non-return valve 4.2.4.1 Definition A non-return valve is a valve that closes when the direction of the flow rate is against the set direction. 4.2.4.2 Characteristics A non-return valve is a passive system, in other words the valve automatically closes when return flow occurs. A system in which a detector emits a signal as a result of which a valve is closed is not a non-return valve, but a blocking system (see paragraph 4.2.2). 4.2.4.3 Modelling A non-return valve is not generally very reliable. If it is not regularly tested, the non-return valve is not included in a QRA. If a non-return valve is regularly tested, it is included in a QRA. The default response time is equal to five seconds and the default probability of failure is equal to 0.06 per operation. 4.2.4.4 Example When loading from an LPG tanker into a storage tank, return flow will occur in the event of a rupture of the loading hose. The outflow rate from the storage tank is equal to 7 kg/s. If a non-return valve is present, the contribution of the return flow to the rupture scenario is set out in Table 57. Table 57 Contribution of the return flow from the storage tank to the rupture scenario LOC System reaction Consequenti
al probability
Flow rate Duration
Rupture in unloading hose
Non-return valve closes 0.94 7 kg/s 5 s
Rupture in unloading hose
Non-return valve fails 0.06 7 kg/s 1800 s
4.2.5 Breakaway couplings and immobilisers Breakaway couplings and immobilisers are standard facilities. It is assumed that the presence and effective operation of these facilities are included in the failure frequencies. For this reason breakaway couplings and immobilisers are not included in the QRA as mitigating measures.
Reference Manual Bevi Risk Assessments version 3.1 – Module C 01-01-2009
page 64 of 90
4.2.6 Intervention by operators 4.2.6.1 Description During a loading operation an operatorn is often present on-site to supervise the process and if needed operate shut-off valves using an emergency stop device. The intervention of an operator during loading can be included in the QRA, provided the following conditions are met: 1. From the start to the end of the loading operation the operator present on-site has a view of the
loading operation and the loading/unloading hose or arm. In particular, the operator is not sitting in the cabin of the road tanker or inside a building during the loading operation.
2. The presence of the operator on-site is guaranteed by means of a facility such as a deadman’s handle or by a procedure in the safety management system and is checked during inspections.
3. The process of actuating the emergency stop device by the operator present in the event of a leak during the loading operation is laid out in a procedure.
4. The operator present on-site is adequately trained and is also familiar with the applicable procedures.
5. The emergency stop device is positioned according to the applicable standards, so that an emergency button can be actuated within a short time irrespective of the direction of the outflow.
If these conditions are met, the duration of the outflow can be limited to two minutes in the QRA. If one of these conditions is not met, the duration of the outflow to be observed in the QRA amounts to 30 minutes. The effective operation of an emergency stop device has a probability of failure of 0.1 per operation. 4.2.6.2 Example When loading ammonia into a road tanker (outflow rate of 8.4 kg/s) there is continuous supervision by the operator. The presence of the operator is guaranteed by a procedure. The operator has the possibility to press an emergency button immediately, which stops the loading operation and closes valves. The scenarios for loading are set out in Table 58. Table 58 Loading scenarios with the continuous presence of an operator LOC System reaction Consequential
probability Flow rate Duration
Rupture of loading hose
Intervention by operator 0.9 8.4 kg/s 120 s
Rupture of loading hose
No intervention by operator
0.1 8.4 kg/s 1800 s
Leak in loading hose Intervention by operator 0.9 0.46 kg/s 120 s Leak in loading hose No intervention by
operator 0.1 0.46 kg/s 1800 s
Notes: 1. The duration of the outflow needs to be extended by the time required for the outflow of the
contents of the hoses at the given outflow rate.
2. Any contribution from the outflow from the tanker also needs to be taken into account.
n When loading a driver can also be regarded an operator

Reference Manual Bevi Risk Assessments version 3.1 – Module C 01-01-2009
page 65 of 90
4.2.7 Fire suppression systems (restriction of fire surface area) The method for rating fire suppression systems for PGS 15 storage facilities is laid out in chapter 8. 4.2.8 Other repression systems Various other repression systems can be accommodated to limit the consequences of a LOC, wherever possible. Examples include water screens to minimise the dispersion of substances (soluble in water) into the atmosphere and the use of foam to reduce evaporation of the pool. Such repression systems can be rated in the QRA calculations on condition that the effectiveness of the system is demonstrated to the competent authority in advance by means of, for example, testing. The effect of a repression system is recorded in the QRA as follows: 1. Determine the response time of the system, treact. 2. Determine the effectiveness of the system. 3. Set the source term for the time period 0 to treact equal to the source term when not using the
repression system. 4. Adjust the source term in the time period following treact according to the effectiveness of the
repression system. 5. Allow for the probability of failure upon operation of the repression system. This probability
must be calculated using methods such as a fault tree analysis. A default value is 0.05 per operation.
4.3 System reactions System reactions must be taken into account in the QRA, such as a change in the pumping rate if the counterpressure falls way. 4.3.1 Pumps The presence of pumps in pipelines and their volumetric flow must be included when calculating the outflow. In the event of a rupture downstream of the pump, by default an outflow rate of 1.5 times the nominal pumping rate (50% increase due to loss of pressure) can be assumed if the pumping rate determines the outflowo. In special cases it is possible to determine what the outflow rate is based upon the pump characteristics. The operation of pump protection systems and failure of a pump can also be taken into account.
o In a pressurized liquefied gas the outflow rate is often determined by the back pressure

Reference Manual Bevi Risk Assessments version 3.1 – Module C 01-01-2009
page 66 of 90
5. Stevedoring companies as set out in article 2.1 under b Bevi A description of the calculation method that fits in better with the use of SAFETI-NL is being devised for stevedoring companies. When the calculation method is available, it will be included in this place in the manual. Until the new description is available, the advice when carrying out QRAs is to use the Report for stevedoring companies – Risk analyses Legislation and Regulations [11].

Reference Manual Bevi Risk Assessments version 3.1 – Module C 01-01-2009
page 67 of 90
6. Shunting yards as set out in article 2.1 under c Bevi
A calculation method that fits in with the use of SAFETI-NL is being devised for shunting yards. When the calculation method is available, it will be included in this place in the manual. Until the new calculation method is available, the advice when carrying out QRAs is to use the Protocol [12].

Reference Manual Bevi Risk Assessments version 3.1 – Module C 01-01-2009
page 68 of 90
7. LPG filling stations as set out in article 2.1 under e Bevi Fixed distances are used for LPG filing stations. Tables will be available for the accountability of group risk and an instrument is under development. Only in specific cases a calculation for group risk only can be done.

Reference Manual Bevi Risk Assessments version 3.1 – Module C 01-01-2009
page 69 of 90
8. PGS15 establishments as set out in article 2.1 under f Bevi A calculation method is developed for PGS15 establishments. The method is available in Dutch. When the translation of the calculation method is available, it will be included in this place in the manual.

Reference Manual Bevi Risk Assessments version 3.1 – Module C 01-01-2009
page 70 of 90
9. Ammonia cooling installations as set out in article 2.1 under g Bevi A specific calculation method is described for these establishments. Whilst this calculation method is not available, one must revert to the description for ammonia cooling installations as set out in the report ‘Distance tables for ammonia cooling installations’ [13].

Reference Manual Bevi Risk Assessments version 3.1 – Module C 01-01-2009
page 71 of 90
10. Mining establishments as set out in article 2.1.d or 2.1.h under Bevi A calculation method that fits in with the use of SAFETI-NL is being devised for mining establishments. When the calculation method is available, it will be included in this place in the manual. At the current time a properly devised calculation method is not available. Until the new calculation method is available, the advice when carrying out QRAs wherever possible is to fit in with the calculation method for Brzo establishments.

Reference Manual Bevi Risk Assessments version 3.1 – Module C 01-01-2009
page 72 of 90
11. Other categories for Bevi art. 2.1d or 2.1.h A calculation method that fits in with the use of SAFETI-NL is being devised for all these establishments. Until the new calculation method is available, the advice when carrying out QRAs wherever possible is to fit in with the calculation method for Brzo establishments.

Reference Manual Bevi Risk Assessments version 3.1 – Module C 01-01-2009
page 73 of 90
nes.
12. Accountability Appendix An explanation is included in this chapter on the various chapters in the Reference Manual. 12.1 Chapter2 - Subselection The subselection for the QRA is mainly based on the system from the Purple Book and the ‘Study into uniformity in the subselection method for the QRA’ report [14] by Tebodin. Compared to the method described in PGS 3, the most important amendments are the selection based upon maximum effect distances, the refinement of the categorisation of toxic liquids by boiling point and the conditions for using the 50% rule. In addition to these differences, amendments to wording and additions have been made to make things clearer. 2.2.2.2 Reaction products and toxic products In the report by Tebodin the following is put forward: “It should be set out in CPR 18 that the company must research where potentially hazardous combustion products and reaction products may occur and where ‘run-away’ reactions may occur. The containment systems in which these products and reactions can occur must be included in the subselection.” If reaction products and ‘run-away’ reactions could lead to lethal effects outside the establishment, this is an important point for consideration in the QRA, in which case the probability of an occurrence can also play an important role. The subselection is less suitable for this, because the probability of an occurrence is not expressed in it. It has therefore been decided to include the fact that reaction products and ‘run-away’ reactions need to be considered in the QRA itself. The risk analysis method for CPR 15 businesses is drawn up for the storage of hazardous substances in quantities from 10 tonnes (CPR 15-2) and pesticides from 400 kg (CPR 15-3). In the meantime the CPR 15 guidelines have been replaced by the PGS 15 guideline [15]. Reference is therefore now made to the PGS 15 guideline instead of the CPR 15 guideliThe PGS 15 guideline also applies to the storage of hazardous substances up to 10 tonnes. The Bevi only applies to storage facilities from 10 tonnes. This means that storage facilities for pesticides involving quantities between 400 kg and 10 tonnes do not fall under the Bevi. In the Revi [1] reference is still made to CPR 15-2 (lower limit of 10 tonnes for hazardous substances) and CPR 15-3 (lower limit of 400 kg for pesticides). Lower limits of 10 tonnes for hazardous substances and 400 kg for pesticides are therefore included in the subselection. 2.2.2.3 Bulk shipping activities Bulk loading was a point for consideration in the subselection because the failure frequency was not taken into account in the subselection. This could have a wrong outcome in two ways for the loading operation and the presence of transport units in an establishment. Firstly there was the possibility that the loading operation was not selected due to the presence of a large storage tank, even though the loading operation makes a significant contribution to the risks as a result of the relatively high failure frequency. Secondly there was the possibility that a storage tank was not selected because a transport unit had a greater selection number, even though the transport unit was perhaps present for only a fraction of the time. In the report by Tebodin [14] it is therefore proposed to always include bulk loading in the QRA. This proposal has been adopted. A few large chemical businesses use a subselection for bulk loading in consultation with the competent authority. Thus, the possibility has been kept open of not including a (part of the) bulk loading in the QRA if it is demonstrated that this contribution is negligible. It has also been added that in a situation in which a transport unit is used as a storage tank, this can be considered in the subselection. The failure frequencies of the transport unit itself are in fact comparable with the failure frequencies of a storage tank.

Reference Manual Bevi Risk Assessments version 3.1 – Module C 01-01-2009
page 74 of 90
2.2.2 Scope of the subselection The report [14] by Tebodin proposes including a list of ’extremely hazardous substances’, such as phosgene, ethylene oxide, hydrogen fluoride and LPG. It is also specified in the report that this list is superfluous if the other measures are used. On this basis it has been decided not to include a list of ‘extremely hazardous substances’. 2.3 The subselection The method is based on the Tebodin report (where the effect approach is stage 1 and the selection numbers represent stage 2) with the amendments as discussed in the Unification working group. The latter mainly infers that there is a possibility of not using the effect approach, but to start directly with the selection numbers (minutes to the meeting of 21 October 2004). In addition the value X = 5 was chosen for the minimum number of selected containment systems. 2.3.3 Selection based upon effect distances The maximum effect distance and the method for determining this distance are defined here. The choice has been made in favour of 1% fatality for D5 (as a frequently occurring, average weather class) and F1.5 (as an unfavourable weather class for toxic substances) and the most unfavourable scenario. Often the so-called ‘10 minutes scenario’ provides larger effect distances than the ‘instantaneous scenario’. It is better to work on the basis of the ‘instantaneous scenario’ for smaller system contents. Several substances and pressures may occur inside a containment system. It has not been explicitly specified how to deal with this. It is assumed that in practice this is self-evident and does not give rise to large-scale discussions. 2.3.4.2.1 Substance quantity Q It was included in the Purple Book that ‘Only the quantity of respirable powder is relevant for toxic substances in solid form’. Because this involves PGS 15 storage facilities, which have now been left out of the subselection, this point has been omitted. 2.3.4.2.3 Limit G The categorisation of toxic liquids is displayed by boiling point in paragraph 2.3.4.2.3. This categorisation is a refinement of the categorisation in the Purple Book. The recategorisation is substantiated in Appendix J of the study by Tebodin. In short it comes down to the fact that some toxic liquids do not have a limit value in the case of the existing categorisation from the Purple Book (limit value infinite), whereas the substances have consequences for external risks. An example of this is acrylonitrile. According to the categorisation in the Purple Book this substance is given a limit value of infinite, whereas it is often used as an example substance for toxic liquids. This problem has been tackled by the recategorisation. The definition of explosive substances was copied from the Brzo. 2.3.4.2.4 Calculating the indication number No relationship is established in the Purple Book between the inclusion of substances that are both toxic and flammable in the subselection and in the QRA. This resulted in a containment system containing ammonia having both a flammable and toxic indication number, but then only being calculated as a toxic substance. This is illogical. Consequently, a one-to-one relationship has now been established between the classification in the QRA and in the subselection. 2.3.4.3 Calculating selection number S The proposal in the Tebodin report to no longer calculate the selection number on the other side of the water has not been taken up, in accordance with the discussion of the working group dated 21 October 2004. Instead a note has been included about the value of the risk contours on the water. By

Reference Manual Bevi Risk Assessments version 3.1 – Module C 01-01-2009
page 75 of 90
the change in the selection (par. 3.5), the selection number S no longer needs to be calculated for each containment system at the closest point in a (specified) residential area. 2.3.4.4 Selection of containment systems It is indicated in paragraph 2.3.4.4 under what conditions this 50% rule may be used:
1. For each point on the site boundary at least three containment systems with a selection number > 1 are selected.
2. The use of the 50% rule must be made transparent by specifying for each point on the site boundary which containment systems are selected and which containment systems with a selection number greater than 1 are not selected.
3. Containment systems with a negligibly small failure frequency (< 1 × 10⁻⁸ per annum) must be ignored when applying the 50% rule. The same applies in respect of containment systems with negligible effects for external safety as a result of provisions that are present.
These conditions are explained as follows in the study by Tebodin: “Re. 1. If by applying the 50% rule only 1 or 2 containment systems are assigned on a point on the site boundary, then the 50% rule may not be used for this point, but the three containment systems with the largest selection numbers are selected. It still applies that the containment systems must have a selection number greater than one to be able to be assigned. Using this measure the probability is smaller that containment systems making a contribution to risk are not considered in a QRA because they are not supposed to be assigned due to the presence of a dominant containment system in the subselection. The minimum number of containment systems per point on the site boundary is established based on experience with ranking the contribution of scenarios to calculated risks. The risks at a specific point are virtually always determined by a few scenarios (less than 10 scenarios). Assuming that a minimum of 3 scenarios are considered for each containment system in a QRA, the lower limit for each point on the site boundary is set at 3 containment systems. Re. 2. It must be specified in the report for the QRA which containment systems with a selection number greater than one are not considered in the QRA and by which containment systems they are overshadowed. These may therefore be several containment systems. In addition it must be indicated for these ‘dominant’ containment systems, for what portion of time per annum there is a probability that accident scenarios occur. Based on this information the author and evaluator of the subselection can make an assessment of the relative contribution of the selected containment systems to the risk being calculated. If, given the possible effects, a dominant containment system has a negligible contribution to risk, then such a containment system should not be able to eliminate other containment systems when applying the 50% rule. Re. 3. When completing the QRA, scenarios are devised for the selected containment systems. In so doing, consequential probabilities and actual facilities are taken into account. In accordance with PGS 3 (paragraph 3.1), the contribution of a scenario to external risk is negligible if the probability of failure of the scenario is less than 10-8 per annum or if lethal injury cannot occur outside the site boundary as a result of the scenario. If when devising scenarios for a containment system it is evident that the probabilities of failure or the foreseen effects are so small that no significant contribution is expected to the external risks being calculated, then this containment system should not be considered when applying the 50% rule. Where this is the case the subselection must be completed again, with this containment system not being considered.” 2.3.5.1 Transport pipelines In the case of transport pipelines, for flammable liquids a quantity is selected based upon the contents of a pipe. The basic assumption is a flow speed of 1 – 2 m/s and a closing time of 120 s for

Reference Manual Bevi Risk Assessments version 3.1 – Module C 01-01-2009
page 76 of 90
the shut-off valves. This means that the quantity of outflow amounts to around 240 m of pipe (rounded to 250 meters). For toxic and flammable (pressurised liquefied) gases, a simple approach was selected based upon effect distances. For flammable gases calculations were completed in respect of this using SAFETI-NL version 6.51. The most important choices are set out in Table 59. The effect distance was determined for the jet fire (distance up to 1% fatality) and the ‘flash fire envelope’; the results are set out in Figure 6. It is evident from this that the effect distances for the flash fire envelope are a factor of 2 – 3 greater than for the jet fire. For the report the largest distance was selected, in other words the largest distance to the ‘flash fire envelope’. Table 59 Scenarios for the calculation of effect distances. Parameter Value Note Scenario Rupture in pipe to the
vessel with a pipe length of 10 m
Pipe rupture (short pipeline) with continuous outflow
Conditions Saturated pressurised liquid at 20 °C
A temperature higher than the default temperature as a conservative approach; 8 °C is only maintained for ethene, i.e. just below the critical temperature.
Pump head 20 m Liquid head 0 m
Increased pressure in the pipe as a result of a pump
Outflow Height 1 m
Direction horizontal
Roughness length 0.3 m
Default for the Netherlands
Substance Ethene Propene Butene
These substances provide larger effect distances than ethane, propane and butane

Reference Manual Bevi Risk Assessments version 3.1 – Module C 01-01-2009
page 77 of 90
0
200
400
600
800
1000
1200
1400
1600
0 100 200 300 400
leidingdiameter (mm)
afst
and
(m)
etheen jet fireetheen flash firepropeen jet firepropeen flash firebuteen jet firebuteen flash fire
Figure 6 Effect distances for ethene, propene and butene for a jet fire (largest 1% fatality
distance) and a flash fire (largest distance to the ‘flash fire envelope)’ 2.4 Example The example is adapted according to the changes. Unlike the example in the PGS 3, it has now been included for hydrochloric acid that a 30% solution is not toxic, and therefore does not need to be included. 12.2 Chapter 3 Scenarios 3.2 Assumptions It is explicitly recorded in the Purple Book that the failure frequencies for pressure vessels apply to the situation in which failure due to corrosion, fatigue caused by vibrations, operator errors and external impact is ruled out. No additional failure frequencies are included in a default QRA for these specific causes of failure. Consequently, a more generic text has now been included, namely that ‘sufficient measures have been taken against all foreseen failure mechanisms’. 3.2.2 External damage and domino effects It is laid down in the questions and answers of the Purple Book that the impact of airplanes crashing must be included in the QRA if this frequency is greater than 10% of the default frequency of catastrophic failure. In such cases the frequency of instantaneous failure must be increased by the location-specific risk as a result of airplanes crashing in situ to build up a good picture of the risk. An objection was raised against this during discussion of the Risk Assessments Reference Manual because (1) the calculation of the risk contours of an airport, on which basis the risk of crashing must be determined, is not yet clear and unchanged, (2) a company cannot influence these risks. On the other hand a location inside the risk contours of an airport leads to an increased risk. Consequently, for the time being it is stipulated that the failure frequency is increased by the frequency of external damage as a result of crashing airplanes. The same approach was adopted for wind turbines and other types of external damage. At a local level it is simpler to avoid installing wind turbines in the vicinity of installations containing hazardous substances. In a number of locations it is also prohibited to position a wind turbine close to an installation containing hazardous substances.

Reference Manual Bevi Risk Assessments version 3.1 – Module C 01-01-2009
page 78 of 90
The probability of internal domino effects is minimised by an effective layout of an establishment. Domino effects may also be already (partly) included in the default failure frequencies. Consequently, domino effects within one establishment are not explicitly included in a QRA, unless there are situations in which the failure of one component clearly leads to the failure of another component. 3.2.5 Cut-off limit The cut-off limit for a scenario is equal to 1 × 10⁻⁹ per annum. In the Purple Book the cut-off limit was equal to 1 × 10⁻⁸ per annum. This change has been introduced because the group risk must be presented in an FN graph to a frequency of 1 × 10⁻⁹ per annum. A BLEVE scenario with a frequency of occurring between 1 × 10⁻⁸ per annum and 1 × 10⁻⁹ per annum therefore has a visible contribution within the FN curve. This means that a reliable FN curve is only achieved for a cut-off limit of 1 × 10⁻⁹ per annum. 3.3 Parts of a containment system The following sources have been consulted for the description of the characteristics, scenarios and failure frequencies: − Committee for the Prevention of Disasters caused by hazardous substances. Guidelines for
Quantitative Risk Assessment. PGS 3. [16] − F.P. Lees. Loss Prevention in the process industries [17] − J.R. Taylor. Hazardous Materials Release and Accident Frequencies for Process plants [18] − AMINAL. Handboek kanscijfers voor het opstellen van een veiligheidsrapport {Probability
statistics manual for drawing up a safety report}. [19] − HSL. Failure Rate and Event Data for Use in Risk Assessment (FRED) [20] − B.J.M. Ale, G.A.M. Golbach, D. Goos, K. Ham, L.A.M. Janssen, S.R. Shield. Benchmark risk
analysis models [21]. − Safety reports of various companies. Based upon these references an overview was produced of the parts that must be recorded in the Reference Manual Bevi Risk Assessments. 3.4 Pressurised storage tank, aboveground A storage tank is defined as a pressurised storage tank if its maximum permissible pressure is greater than 0.5 bar of overpressure. This is based on the Pressure Equipment Directive (PED). The complete text of the PED can be found on the web site http://eur-lex.europa.eu/nl. In it the following is specified: “Given that equipment that is pressurised to a maximum of 0.5 bar does not involve an appreciable pressure risk; that its free traffic within the Community may not therefore be impeded; that this directive is therefore applicable to equipment with a maximum permissible pressure PS of more than 0.5 bar”. For this the ‘maximum permissible pressure PS’ is defined as “the maximum pressure specified by the manufacturer for which the equipment was developed. This pressure is determined at a location specified by the manufacturer, namely wherever the protective or safety facilities are connected or the top of the equipment, or, if this is not suitable, another specified location”. 3.5 Underground/mounded pressurised storage tanks The scenarios involving an underground storage tank are based on the scenarios for a LPG storage tank aboveground, in which case the BLEVE scenario is ruled out because being irradiated by a fire below the tank or a jet is not deemed possible. This is illustrated in Figure 7 for a storage facility of more than 10 tonnes of LPG.
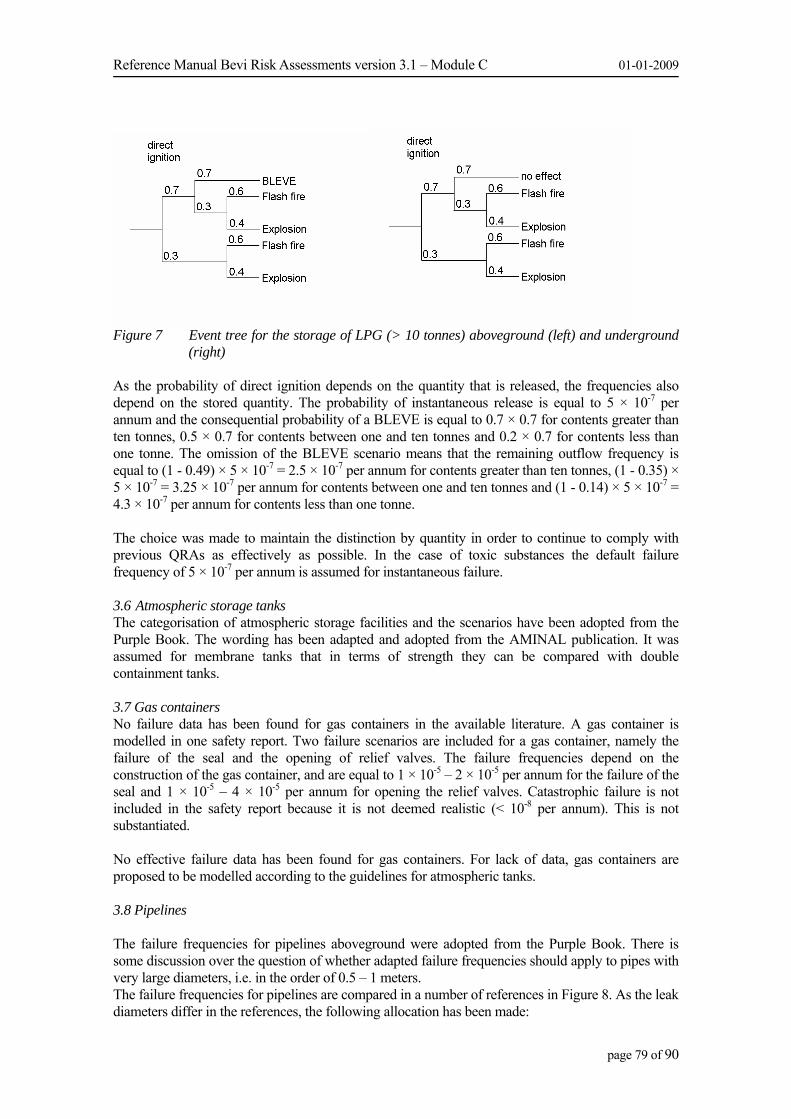
Reference Manual Bevi Risk Assessments version 3.1 – Module C 01-01-2009
page 79 of 90
Figure 7 Event tree for the storage of LPG (> 10 tonnes) aboveground (left) and underground
(right) As the probability of direct ignition depends on the quantity that is released, the frequencies also depend on the stored quantity. The probability of instantaneous release is equal to 5 × 10⁻⁷ per annum and the consequential probability of a BLEVE is equal to 0.7 × 0.7 for contents greater than ten tonnes, 0.5 × 0.7 for contents between one and ten tonnes and 0.2 × 0.7 for contents less than one tonne. The omission of the BLEVE scenario means that the remaining outflow frequency is equal to (1 - 0.49) × 5 × 10-7 = 2.5 × 10⁻⁷ per annum for contents greater than ten tonnes, (1 - 0.35) × 5 × 10-7 = 3.25 × 10⁻⁷ per annum for contents between one and ten tonnes and (1 - 0.14) × 5 × 10-7 = 4.3 × 10⁻⁷ per annum for contents less than one tonne. The choice was made to maintain the distinction by quantity in order to continue to comply with previous QRAs as effectively as possible. In the case of toxic substances the default failure frequency of 5 × 10⁻⁷ per annum is assumed for instantaneous failure. 3.6 Atmospheric storage tanks The categorisation of atmospheric storage facilities and the scenarios have been adopted from the Purple Book. The wording has been adapted and adopted from the AMINAL publication. It was assumed for membrane tanks that in terms of strength they can be compared with double containment tanks. 3.7 Gas containers No failure data has been found for gas containers in the available literature. A gas container is modelled in one safety report. Two failure scenarios are included for a gas container, namely the failure of the seal and the opening of relief valves. The failure frequencies depend on the construction of the gas container, and are equal to 1 × 10⁻⁵ – 2 × 10⁻⁵ per annum for the failure of the seal and 1 × 10⁻⁵ – 4 × 10⁻⁵ per annum for opening the relief valves. Catastrophic failure is not included in the safety report because it is not deemed realistic (< 10-8 per annum). This is not substantiated. No effective failure data has been found for gas containers. For lack of data, gas containers are proposed to be modelled according to the guidelines for atmospheric tanks. 3.8 Pipelines The failure frequencies for pipelines aboveground were adopted from the Purple Book. There is some discussion over the question of whether adapted failure frequencies should apply to pipes with very large diameters, i.e. in the order of 0.5 – 1 meters. The failure frequencies for pipelines are compared in a number of references in Figure 8. As the leak diameters differ in the references, the following allocation has been made:

Reference Manual Bevi Risk Assessments version 3.1 – Module C 01-01-2009
page 80 of 90
− pipe rupture: rupture and leak with hole diameter > 0.5 × pipe diameter − leakage: leak with hole diameter < 0.5 × pipe diameter
Breuk leiding 10 m
1.E-07
1.E-06
1.E-05
1.E-04
1.E-03
0 200 400 600 800 1000Leiding diameter (mm)
Faal
freq
uent
ie le
idin
g/jr.
AMINAL Bovengronds
FRED
TNO
Paarse boek
Lek leiding 10 m
1.00E-06
1.00E-05
1.00E-04
1.00E-03
0 200 400 600 800 1000Leiding diameter (mm)
Faal
frequ
entie
lei
ding
/jr.
AMINAL Bovengronds
FRED
TNO
Paarse Boek
Figure 8 Failure frequency for pipe rupture and leakage as a function of pipe diameter for a pipe
length of 10 meters in accordance with AMINAL, FRED, TNO and the Purple Book It is evident from the comparison that the values in the Purple Book for rupture are higher by a factor of 2 – 5 than AMINAL and FRED for pipes in the order of 0.5 – 1 meters, and are comparable in terms of leakage. It should be noted that the ‘Large leak’ AMINAL scenario (leak diameter 36 - 45% of the pipe diameterp) is added in this comparison to the leak scenarios. The frequency of the combination of AMINAL ‘pipe rupture’ and ‘large leak’ scenarios is comparable for pipes in the order of 0.5 – 1 meters diameter with the ‘Pipe rupture’ scenario from the Purple Book. It has therefore been decided to observe the Purple Book for failure frequencies, even for large pipe diameters. To assess the influence of the pipe length up to the rupture location, a few test calculations were completed using SAFETI-NL. For storage of sulphur dioxide and chlorine (100 tonnes, 10 °C) for a pipe 100 mm in diameter, it was investigated how the initial outflow rate varies with the location of the rupture and the impact on risk. The initial outflow rate is displayed in Figure 9 as a function of the location of the rupture for liquid sulphur dioxide, liquid chlorine and vaporous sulphur dioxide. The source term of the vaporous sulphur dioxide is multiplied by a factor of 10 to keep the scale of the graph equal, and varies between 5 and 1 kg/s. The impact on the risk contour is calculated for a pipe with a length of 100 meters. Three different calculations were completed:
− a maximum flow rate (outflow from a 0.1 meter pipe length) over the entire length; − an average flow rate (outflow from a 50 meter pipe length) over the entire length; − a distribution over three pipe sections, namely 0 – 20 meters (outflow from 0.1 meter pipe
length), 20 – 50 meters (outflow from 20 meter pipe length) and 50 – 100 meters (outflow from 50 meter pipe length).
The results are displayed for the liquid outflows in Figure 9, Figure 10 and Figure 11 (the pipe runs from –50 to +50 m). It is evident from the calculations that a substantial shift can occur in the risk contours, depending on the choice of pipe length for the outflow. It has therefore been stipulated that for intervals greater than 10 meters it is necessary to calculate using several outflow locations. A distribution over 0 – 20 m, 20 – 50 meters, 50 – 100 meters, 100
p The AMINAL recommendation for the “large leak” scenario has a leak diameter equal to 36% of the pipe diameter. In the reference to the underlying data, the leak diameter is equal to 45% of the pipe diameter.

Reference Manual Bevi Risk Assessments version 3.1 – Module C 01-01-2009
page 81 of 90
– 200 meters, 200 – 500 meters is proposed. The calculation of the outflow rate is completed at approximately 1/3 of the distance, i.e. 5 m, 30 m, 70 m, 130 m, etc.
uitstroomdebiet
0
10
20
30
40
50
60
0 20 40 60 80 100
leidinglengte (m)
debi
et (k
g/s)
SO2Cl2SO2damp x 10
Figure 9 Outflow rate as a function of pipe length as calculated using SAFETI-NL.
PR voor chloor
1.E-08
1.E-07
1.E-06
1.E-05
-5000 -3000 -1000 1000 3000 5000
locatie (m)
PR (p
er ja
ar)
max. debietgem. debietverdeling
Figure 10 Location-specific risk as a function of the distance for a pipe containing chlorine as
calculated using SAFETI-NL.

Reference Manual Bevi Risk Assessments version 3.1 – Module C 01-01-2009
page 82 of 90
PR voor SO2
1.E-08
1.E-07
1.E-06
1.E-05
-1000 -500 0 500 1000
locatie (m)
PR (p
er ja
ar)
max. debietgem. debietverdeling
Figure 11 Location-specific risk as a function of the distance for a pipe containing sulphur dioxide
as calculated using SAFETI-NL. 3.10 Distillation column The failure figures for the distillation column have been adopted from the Purple Book. It is now specified in an example how to calculate using the various pipes and drums. 3.11 Pumps and compressors Pumps The Purple Book makes a distinction between three different types of pumps:
− Pumps without additional provisions − Pumps with a wrought steel containment − Canned pumps
AMINAL has a different categorisation for pumps, namely − Centrifugal pumps with a single gasket − Centrifugal pumps with a double gasket − Reciprocating pumps
The AMINAL categorisation is used because it is more in keeping with practice. The failure frequency follows the Purple Book as regards the gasket-free pumps (sealless, canned). For centrifugal pumps with a gasket AMINAL is followed, in which case the small leak (equivalent leak diameter of 5 mm) is not included due to its limited relevance to external safety. The difference between centrifugal pumps with a single gasket and centrifugal pumps with a double gasket can only be traced in terms of the failure frequency of the smallest leak (equivalent leak diameter of 5 mm). A double gasket is not deemed effective for the scenarios with the largest outflow, namely equivalent leak diameter of 25 mm and equivalent leak diameter equal to the largest pipe. Given the low importance of an equivalent leak diameter of 5 mm, centrifugal pumps with a single gasket and centrifugal pumps with a double gasket can be defined in a QRA for external safety using the same scenarios, which means that the distinction is not relevant. The leak scenario with an equivalent diameter of 25 mm is in keeping with the corresponding scenario in the Purple Book, which is 10 % of the diameter of the pipe. For reciprocating pumps AMINAL stipulates a failure frequency 10 times higher compared with centrifugal pumps. On the other hand reference is made in AMINAL to a literature source in which a comparable failure frequency is stipulated for reciprocating pumps and centrifugal pumps. As there is insufficient documentary evidence for the increase by a factor of 10 for reciprocating

Reference Manual Bevi Risk Assessments version 3.1 – Module C 01-01-2009
page 83 of 90
pumps, it has been decided not to deviate from the highest value for the catastrophic failure of pumps in the Purple Book (10-4/annum). The failure frequencies for reciprocating pumps are equal to centrifugal pumps with a gasket. Compressors Compressors are not explicitly included in the Purple Book. AMINAL has the following categorisation for compressors:
− Centrifugal compressors − Reciprocating compressors
The failure frequencies of compressors are in keeping with the failure frequencies for pumps. This is based on the following information:
− In the TNO study no distinction is made between failure frequencies for pumps and failure frequencies for compressors either.
− AMINAL does make a distinction between failure statistics for these 2 items but for most scenarios comes out with comparable statistics for each type (centrifugal and reciprocating): - For the centrifugal type: the leak scenario gives a factor 5 difference; catastrophic failure
remains equal. - For the reciprocating type: both for the leak scenario and for catastrophic failure there is a
factor 2 difference. As the available data for compressors is very scarce, there is no deviation for reciprocating compressors from the corresponding data available for pumps. 3.13 Pressure relief device It is recorded in the Purple Book that opening a pressure relief device, such as a safety valve or a safety disc, only results in an emission if the pressure relief device is in direct contact with the substance and the emission takes place directly into the atmosphere. This restriction means that the failure frequency only applies to spontaneous opening. The effective operation of a pressure relief device, namely it opening as a result of excessive pressure in the vessel, is then not included. This appears to be incorrect given the purpose of the pressure relief device. It is therefore more logical to allow the failure frequency to apply both in the case of a spontaneous opening and in opening in the case of an event, and to delete the clause ‘the safety device is in direct contact with the substance and’. Consideration must be given in designing an installation to the fact that a pressure relief device can open. The opening of a pressure relief device may not lead to further risks for the surrounding area. If this is adequately guaranteed, the opening of the pressure relief device does not need to be included in the QRA. 3.14 Transport units Road tankers for the transportation of ADR category 2 are considered as being pressure vessels. This also applies to subcategory 3 (deeply cooled liquefied gases). The test pressure is at least 3 bar of overpressure in this ADR 2 subcategory. The test pressure for vacuum-insulated tanks for liquid nitrogen, argon or oxygen is approx. 5.5 bar; road tankers for deeply cooled liquefied carbon dioxide have a test pressure of 26 bar. On this basis it was decided to also consider tankers for the transportation of this subcategory as pressure vessels. 3.15 Loading activities For loading, the failure frequencies were adopted from the Purple Book. The failure frequencies for loading from ships have been adjusted in accordance with the ‘Failure frequency for loading ships’ notice [22].

Reference Manual Bevi Risk Assessments version 3.1 – Module C 01-01-2009
page 84 of 90
Contrary to the Purple Book, the ‘instantaneous failure as a result of a fire below the tanker’ scenario for transport units is now directly linked to the loading operation. Linking the scenario to a loading operation was done based on reference [22], according to which a BLEVE can occur due to a fire following a prolonged leak of LPG (after ignition), a fire in the surrounding area or an external impact. A prolonged leak is caused by:
− failure of the vapour return pipe (between the tanker and the loading installation) − failure of the loading installation vapour pipe − failure of the liquid pipe downstream and upstream of the pump − failure of the loading installation liquid pipe
All causes of a prolonged leak are linked to the loading operation. It is therefore asserted that the BLEVE as a result of a leak in the connections below the tank followed by ignition does not need to be included for parked tankers without loading activities. The frequency of this scenario for pressurised tanks was derived from the calculations for a LPG filling station [23]. The frequency of a prolonged fire as a result of a leak during the loading operation is equal to 0.2 × 0.29 × 10-6 for 100 loading operations (50 hours), in other words 1.2 × 10-
9 per hour of loading. In the calculation for LPG filling stations, the probability of a BLEVE varies, given a prolonged fire, from 0.19 – 0.73 depending on the fill level of the tank. For the generic approach a factor of 0.5 is maintained for this, in other words 5.8 × 10⁻¹⁰ per hour of loading. In keeping with the Purple Book, the frequency for atmospheric tanks was taken a factor of 10 higher. 12.3 Chapter 4 – Measures and system reactions 4.1 Introduction The inclusion of mitigating measures such as blocking systems in the quantitative risk analysis is not self-evident [18]. Rating or not rating these systems depends on the way in which the failure frequencies are determined. It is possible that the failure frequencies are based on data for which a lower limit is used for reporting, for example, only incidents in which more than 100 kg of hazardous substance is released or only incidents that lead to effects outside the establishment. The successful operation of a repression system then results in an incident possibly not being recorded in the database, which means that the failure frequency only displays a proportion of the incidents, namely the fraction where the mitigating measures also fail. The inclusion of mitigating measures in the QRA in such cases leads to an underestimation of the risk. In accordance with the usual calculation method up to now it is assumed that the mitigating measures in the QRA can be rated, for example by shortening the duration of the outflow. In a review of the failure frequencies this assumption needs to be explicitly examined once again. To determine the repression systems that may be present in an installation, a few references were consulted, namely the Purple Book [16], the AMINAL report [Probability Statistics Manual] [19], the ‘Hazardous Materials Release and Accident Frequencies for Process Plant’ report by J.R. Taylor [18] and the HSL FRED reports [20].
− The Purple Book describes a bund, blocking systems (automatic, remotely operated and manual), sprinkler installations, water screens and foam blankets as repression systems. In addition, after publication of the Purple Book questions have come in about excess flow valves, intervention by operators and breakaway couplings for ship loading. All of these systems have now been included in the calculation regulations.
− The AMINAL report has recorded failure statistics for valves (emergency shut-down valve, non-return valve, excess-flow valve and relief valve). These are set out in the Reference Manual. In addition general failure data is recorded for human activity. This data is so general that it is not described.
− The ‘Hazardous Materials Release and Accident Frequencies for Process Plant’ report by J.R. Taylor cites a large number of systems, namely excess-flow valves, manual shut-off valves, non-return valves (check valves), safety relief valves, automatic emergency stop, gas

Reference Manual Bevi Risk Assessments version 3.1 – Module C 01-01-2009
page 85 of 90
detection and alarm, bund, emergency shut-down valves, emergency cooling system, switches (circuit breakers), instrumentation and fire-fighting systems. A number of these are included in the calculation regulations. The following systems were described.
Relief valve A relief valve is a mitigating measure to prevent catastrophic
failure of a tank. Failure to open when operating a relief valve can lead to failure of the tank. The functioning of a relief valve is assumed to be included in the frequency of a Loss of Containment.
Automatic emergency stop
An automatic emergency stop is a full series of system reactions, such as closing blocking valves, and is not considered separately.
Gas detection and alarm Gas detection is part of a chain of system reactions that must eventually lead to the closing of blocking valves, for example. The parts of the chain are not considered separately.
Emergency cooling system
The failure of an emergency cooling system can lead to the failure of an installation component. This mechanism is assumed to be included in the frequency of a Loss of Containment.
Switches Switches for disabling a pump, for example, are part of a chain of system reactions that must eventually prevent a LoC from taking place (preventative measure) or that lead to the closing of blocking valves, for example. The parts of the chain are not considered separately.
Instrumentation Instrumentation forms part of a chain of system reactions that must eventually prevent a LoC from taking place (preventative measure) or that lead to the closing of blocking valves, for example. The parts of the chain are not considered separately.
− The HSL provides failure data for a manual valve, a remotely operated shut-off valve (ROSOV), an automatic shut-off valve (ASOV) and an excess flow valve (XSFV). These are included in the Reference manual.
4.2.1 Bund The dimensions of a bund are based on PGS 30: if several tanks are present in the bund, the contents are at least equal to the storage capacity of the largest tank plus 10% of the storage capacity of the other tanks [24]. The contents of the bund are often designed for 110% of the capacity of the largest tank [7,8]. It is assumed in existing QRAs that a bund is effective and the maximum pool size is equal to the size of the bund. In practice it is evident that this is not always the case, and overtopping is a serious problem. As a result, a proportion of the hazardous substance can get outside the bund, even if the capacity of the bund is greater than the storage capacity of the tank [7,8]. In addition the impact of the liquid can exert such large forces on the walls of the bund, that failure of the wall can occur. The strength of the bund wall must therefore be significantly greater than the hydrostatic pressure. The HSE has carried out a number of experiments to determine what fraction may get outside the bund [7,8]. An example of the results is displayed in Figure 12. It is evident from this that for a bund with a capacity of 110%, the percentage of overtopping varies from 20 – 70%, depending on the configuration. The hazard is determined by the quantity of liquid that evaporates. This quantity is proportional to the surface area of the pool. The liquid that gets outside the bund can spread over a large surface area and therefore make a large contribution to the cloud, more so than is evident based upon the relative mass outside the bund.

Reference Manual Bevi Risk Assessments version 3.1 – Module C 01-01-2009
page 86 of 90
A variety of approaches are possible for modelling the bund.
1. Modelling according to the Purple Book In this approach it is assumed for all scenarios that the entire quantity of the mass that has flowed out remains inside the bund.
2. Specific modelling based upon HSE reports
In this approach, it is assumed for catastrophic failure that overtopping takes place. The amount of overtopping is calculated based upon a few parameters such as the ratio in height and the ratio in radius of the tank and the bund.
3. Generic modelling based upon HSE reports
In this approach, it is assumed for catastrophic failure that overtopping takes place. The amount of overtopping is taken to be an average of 33%, and is translated in the QRA by increasing the surface area of the bund by 50%.
This approach is followed in the calculation regulations and it outlines that for instantaneous scenarios it is necessary to calculate using 1.5 × the surface area of the bund. This corresponds with an approach in which 1/3 of the mass gets outside the bund and the contribution to evaporation is proportional to the mass ratio.
0
20
40
60
80
100
0 0.1 0.2 0.3 0.4 0.5
h/H
% ov
erto
pp
ing
experimentsLJMU correlation
Figure 12 Experimental results and correlation for a simulation of a bund with a capacity of 110%.
The percentage of overtopping is displayed as a function of the ratio between the bank height (h) and the height of the fluid column (H) for three different configurations (R/H = 2.5, 1 and 0.5 where R is the radius of the tank and H is the height of the tank).
By extrapolating the correlation of Figure 12 it follows on that the percentage of overtopping is less than 5% if the bank height (h) is equal to 0.9 – 1.2 times the height of the fluid column (H). It can be concluded from this that overtopping does not need to be included if the height of the bund wall is higher than the height of the fluid column. 4.2.2 Blocking systems In the literature a distinction is made between manually operated valves, remotely operated valves and automatic valves. The description from the Purple Book is adopted in the Reference manual.

Reference Manual Bevi Risk Assessments version 3.1 – Module C 01-01-2009
page 87 of 90
− Manual valve
For a manual operated valve (excluding human failure) the HSL reports give a failure frequency of 1 × 10⁻⁴ per operation.
For ESD (Emergency Shut Down) valves, AMINAL specifies that there are two extreme situations. If the ESD valve needs to be activated locally, the probability of failure correlates with the “failure of the operator to act in a stressful situation”. This probability is in the order of 0.2 to 0.3. In the other extreme situation the ESD valve is automatically closed based upon a variety of different kinds of measurements (pressure, temperature, …).
For manually operated shut-off valves, the Purple Book specifies default values for the shut-off time of the blocking valves (30 minutes) and the probability of failure (0.01 per operation). A manually operated blocking system is described as a system in which leak detection is automatic. Upon detection a signal is emitted in the control room. The operator checks the signal, goes to the location where the blocking valves are situated and closes the valves manually. In practice a default shut-off time of 30 minutes means that manually operated shut-off valves are not included in the QRA, because by default a shut-off time of 30 minutes is calculated.
− Remotely operated shut-off valve (ROSOV)
For a remotely operated valve (including human failure) the HSL reports give a failure frequency of 3 × 10⁻² per operation.
For remotely operated shut-off valves the Purple Book specifies default values for the shut-off time of the blocking valves (10 minutes) and the probability of failure (0.01 per operation). A remotely operated blocking system is described as a system in which leak detection is automatic. Upon detection a signal is emitted in the control room. The operator checks the signal and closes the blocking valves by actuating a switch in the control room.
− Automatic shut-off valve (ASOV)
For an automatic valve the HSL reports give a failure frequency of 1 × 10⁻² per operation. AMINAL stipulates a failure frequency that is equal to 3.7 × 10⁻² per annum if the ESD valve
is part of a computerised system. For a test interval of six months this correlates with the HSL valueq.
For an automatic blocking system the Purple Book specifies default values for the shut-off time of the blocking valves (2 minutes) and the probability of failure (0.001 per operation). An automatic blocking system is described as being a system in which leak detection and closing of blocking valves is automatic. Action by an operator is not necessary. The probability of failure is therefore extremely low compared with the default value of the HSE.
4.2.3 Excess flow valve The Purple Book does not provide information about the inclusion or not of an excess flow valve in the QRA.
For an excess flow valve the HSL reports give a failure frequency of 1.3 × 10⁻² per operation if tested annually and a failure frequency higher by a factor of 10 if tested every 10 years.
AMINAL specifies 0.3 per annum as the value. For a test interval of one year the failure frequency is then equal to 0.15 per operation.
For the LPG filling stations distance table, TNO calculates the impact of an excess flow valve [9]. For the operation of the excess flow valve TNO states:
q The probability of failure per operation, Pfail, is related to the probability of failure per annum, ffail, and the test interval, Ttest, by the relationship Pfail =0.5 × ffail × Ttest.

Reference Manual Bevi Risk Assessments version 3.1 – Module C 01-01-2009
page 88 of 90
“It is evident from the product information for excess flow valves that the functioning reliability of these EFVs depends greatly on the conditions under which they are installed or used. Causes of failure (that is: failure to close in the event of a large leak or pipe rupture) are:
− Mechanical damage, ageing or soiling; these causes must be ruled out by periodic inspection and maintenance.
− Increased resistance in the pipe system in which the EFV is fitted, for example by bends, long pipelines, narrowings or a pump downstream of the EFV; due to such restrictions the flow rate does not increase sufficiently in the case of a pipe rupture to allow the EFV to close.
− Lower (vapour) pressure in the system as a result of low temperature; in this situation the pressure in a situation of free outflow can be lower than the closing flow rate of the EFV. This condition is more critical the smaller the margin is between the outflow rate and the closing flow rate of the excess flow valve.”
“Due to a lack of sufficiently specific information, the following probabilities of failure are proposed for use in this study:
− For EFV-1 in the base pipeline: P = 0.06, being the generic failure statistic according to [9] and [25].
− For EFV-2 in the unloading hose: P = 0.12, being the upper limit of the reliability range according to [5]. In this way a penalty is built in for the low margin between the closing flow rate of EFV-2 (7.4 kg/s) and the maximum outflow rate in the event of a rupture in the hose (8.4 kg/s).”
TNO calculates using a closing time of five seconds. It is proposed that the modelling of TNO for LPG filling stations is followed. The ratio between the outflow rate and the set value of the excess flow valve for EFV-2 is equal to 1.14. An (unsubstantiated) difference of a factor of 1.2 is taken as the threshold for the effective operation of the excess flow valve. 4.2.4 Non-return valve A non-return valve can fail upon operation. The response time is equal to five seconds with a probability of failure equal to 0.06 per operation. This value is based on the 'LPG Integraal' [25]. For a non-return valve AMINAL recommends a value of 2.8 × 10⁻³ per annum. The value is adopted from the LPG Integraal. 4.2.5 Breakaway couplings and immobilisers It is assumed that break-away couplings and immobilisers are default provisions, and the failure frequencies are therefore applicable to systems in which these provisions are present. 4.2.6 Intervention by operators AMINAL gives generic values for human action, varying from a probability of failure of 10-5 for extremely improbable errors for which it is hard to conceive they might occur, to a probability of failure of 0.1 – 1 for a failure to take the correct action that should follow from a creative thought process and for which only a limited time is available. In the Purple Book (§4.4) intervention by operators is only discussed in relation to blocking systems. A form of automatic detection is assumed for this, after which an operator can intervene. In the case of loading operations, particularly, an operator is often present on-site who is able to operate a valve in the road tanker or pipeline by actuating an emergency stop device. In response to questions about this subject, it is suggested the intervention of an operator when loading be included in the QRA, provided the following conditions are met. If the conditions are met, the duration of the outflow can be limited to two minutes. If one of these conditions is not met, it is expected that any

Reference Manual Bevi Risk Assessments version 3.1 – Module C 01-01-2009
page 89 of 90
outflow will continue for longer than two minutes. Without further justification, the duration of the outflow to be observed in the QRA then amounts to 30 minutes. The effective operation of an emergency stop facility by an operator has a probability of failure of 0.1 per operation. This figure, taken from the ‘LPG-Integraal’ study, concerns the ‘failure to stop a pump by a driver’ under ‘high-stress conditions’ [25]; technical failure is not included in the consequential probability, and is assumed to be small compared with human failure. If the emergency stop facility does not work properly, the duration of the outflow is 30 minutes. 4.2.8 Other repression systems The text was taken from the Purple Book. 4.3.1 Pumps The text was taken from the Purple Book.

Reference Manual Bevi Risk Assessments version 3.1 – Module C 01-01-2009
page 90 of 90
References
[1] External Safety Establishments Regulations. [2] http://www.rivm.nl/milieuportaal/bibliotheek/databases/probitrelaties.jsp [3] www.rivm.nl/milieuportaal/bibliotheek/modellen/safeti-nl.jsp. For toxicity data see
http://www.rivm.nl/milieuportaal/bibliotheek/databases/serida.jsp [4] Hazardous Substances Publication series 1. Methods for determining possible damage
(‘Green book’). Ministry of VROM [Housing, Spatial Planning and the Environment], 2005 [5] D. Riedstra. Wind turbines at a safe distance? Environment Magazine annual volume 16,
number 8, page 36 – 39, 2005. [6] H. Braam, G.J. van Mulekom, R.W. Smit. Manual for Risk Zoning of Wind Turbines, 2nd
updated version. SenterNovem, 2005 [7] Circular storage of explosive substances for civil use. Characteristic EV/2006268085, 19 July
2006. [8] W.A. Atherton. An experimental investigation of bund wall overtopping and dynamic
pressures on the bund wall following catastrophic failure of a storage vessel. HSE Research Report 333, 2005.
[9] A.M. Thyer, I.L. Hirst, S.F. Jagger. Bund overtopping – the consequences of catastrophic tank failure. Journal of Loss Prevention in the Process Industries 15 (2002) 357 – 363
[10] J.M. Ham, A.W.T. van Blanken. TNO report R 2004/107, 2004 [11] AVIV and Haskoning. Stevedoring companies. Risk-analyses. Laws and Regulations. 1994 [12] Oranjewoud/Save. Calculation protocol for the Transportation of hazardous substances by
rail, Report number 060333-q53, 2006 [13] P.A.M. Uijt de Haag. Distance table for ammonia cooling plants. RIVM report
620100003/2005. [14] L.P. Sluijs, W.J. Oudshoorn. Study into uniformity in the subselection method for the QRA,
Tebodin document 3800317, 2004. [15] Hazardous substances Publication Series 15. Storage of packaged hazardous substances.
Ministry of VROM [Housing, Spatial Planning and the Environment], 2005 [16] Hazardous Substances Publication Series 3. Guidelines for quantitative risk analysis
(‘Purple Book’). Ministry of VROM [Housing, Spatial Planning and the Environment], 2005 [17] F.P. Lees. Loss Prevention in the process industries. Butterworth-Heinemann, Second
edition, 1996. ISBN 0 7506 1547 8 [18] J.R. Taylor. Hazardous Materials Release and Accident Frequencies for Process plants.
Version 1 issue 6, Taylor Associates ApS [19] AMINAL. Probability statistics manual for drawing up a safety report. Coordinated version
2.0, 01/10/2004. [20] HSL. Failure Rate and Event Data for Use in Risk Assessment (FRED), issue 1, RAS/99/20,
1999 and HSL. New Failure Rates for Land Use Planning QRA Update RAS/00/22, 2000 [21] Ale BJM, Golbach GAM, Goos D, Ham K, Janssen LAM, Shield SR. Benchmark risk
analysis models. RIVM report 610066015, 2001 [22] P. Uijt de Haag. Loading failure frequency for ships. RIVM notice 01-02-2002. [23] TNO, “Reductie BLEVE-frequentie van een LPG tankauto op een autotankstation”, report
no. 85-01237, February 28th 1985 (Dutch report). [24] Infomil. Revised version 2004. Checklist CPR 9-6: Liquid petroleum products [25] LPG "Integraal study", Report 6, section report 1113 LPG probability assessment.

Reference Manual Bevi Risk Assessments version 3.1 - Glossary 01-01-2009
page 1 of 5
Reference Manual Bevi Risk Assessments
Glossary Version Version 3.1
Date 01.01.09

Reference Manual Bevi Risk Assessments version 3.1 - Glossary 01-01-2009
page 2 of 5
Glossary 1% lethality distance The distance to the location where an unprotected person has a
1% probability of dying for a given scenario and weather class Assignment number Measure for the danger of an installation, irrespective of its
location Atmospheric storage tank Storage tank in which the maximum permitted pressure is less
than or equal to 0.5 bar of overpressure Generally the overpressure is a maximum of 70 mbar.
Expert group on Probit relationships
Committee of subject experts in the field of toxicology, which determines the procedure for working out probit relationships and determines the probit relationships.
Competent authority Authority licensing the activity with dangerous substances BLEVE Boiling Liquid Expanding Vapour Explosion; results from the
sudden failure of a vessel containing liquid at a temperature well above its normal (atmospheric) boiling point. A BLEVE of flammables results in a large fire ball (if ignited)
Flammable (hazardous) substances
Flammable (hazardous) substances are: − inflammable substances (category 0, 1 and 2) − category 3 and 4 substances if the process temperature is
higher than the flash point CPR-15 establishments Storage of hazardous substances in accordance with the CPR 15
directive Dispersion Mixing and spreading of substances in the air Domino effect The effect that Loss of Containment in one installation leads to
Loss of Containment in other installations Dose A measure of integral exposure; a function of concentration and
exposure time Pressure vessel Pressurised storage vessel in which the maximum permitted
pressure is more than 0.5 bar of overpressure Operator Any natural person or corporate entity who operates or holds an
establishment or installation or, if provided for by national legislation, has been given decisive economic power in the technical operation thereof
Explosion A sudden release of energy that causes a blast Fault tree analysis The evaluation of an unwanted event, the top event in the fault
tree. Given a top event, a fault tree is drawn up using a deduction method (top-down), which can be used to determine the cause (or causes) of the unwanted event
Jet fire Combustion of materials emitted from an opening with great force
Flash Part of a superheated liquid that evaporates rapidly due to a relatively rapid depressurisation, until the resulting vapour/liquid mixture has cooled to below boiling point at the end pressure. Superheat is the extra heat of a liquid made available by decreasing the liquid’s temperature, for instance, by vaporisation, until the vapour pressure equals that of the surroundings
Flash fire The combustion of a flammable vapour and air mixture in which the flame passes through the mixture at a rate less than sonic velocity so that negligible damaging overpressure is generated

Reference Manual Bevi Risk Assessments version 3.1 - Glossary 01-01-2009
page 3 of 5
Flash evaporation See Flash FN curve Log-log graph: the X-axis represents the number of deaths and
the y-axis the cumulative frequency of the accidents, with the number of deaths equal to N or more
Frequency The number of times an outcome is expected to occur in a given period of time (see also probability)
Vapour cloud explosion The explosion resulting from ignition of a cloud of flammable vapour, gas or spray mixed with air, in which flames accelerate to significantly high velocities to produce significant overpressure
Event tree A diagram of success and failure combinations are used to identify event sequences leading to all possible consequences of a given initiating event
Limit value Measure of the dangerous properties of a substance based on both the physical and the toxic/explosive/flammable properties of the substance
Group risk (societal risk) the frequency (per year) that a group of at least a certain size will at one time become victims of an accident
Blocking system Suppression system to isolate (part of) an installation to prevent (further) outflow
Establishment The whole area under the control of an operator where dangerous substances are present in one or more installations, including common or related infrastructures or activities
Containment system One or several devices, any parts of which are permanently in open contact with one another, and which are intended to contain one or multiple substances. A Loss of Containment in one containment system will not lead to the release of significant quantities of hazardous substance from other containment systems
Installation A technical unit within an establishment where hazardous substances are produced, used, handled or stored
Probability Measure of the likelihood of an occurrence, expressed as a dimensionless number between 0 and 1. Risk is defined as the probability that within a fixed time period, usually one year, an unwanted effect occurs. Consequently, risk is a dimensionless number. However, risk is often expressed in units of frequency, ‘per year’. Since failure frequencies are low, the probability that an unwanted effect will occur within a fixed time period of one year is, practically speaking, equal to the frequency of occurence per year. In this Reference Manual, frequency is used to denote the risk
K0 liquid Liquid substances and preparations with a flash point less than 0 °C and a boiling point (or the start of a boiling range) less than or equal to 35 °C
K1 liquid Liquid substances and preparations having a flash point less than 21 °C, which are not, however, extremely flammable
K2 liquid Liquid substances and preparations having a flash point greater than or equal to 21 °C and less than or equal to 55 °C
K3 liquid Liquid substances and preparations with a flash point greater than 55 °C and less than or equal to 100 °C
K4 liquid Liquid substances and preparations having a flash point greater than 100 °C
LC50 Median lethal concentration, i.e. the concentration of a

Reference Manual Bevi Risk Assessments version 3.1 - Glossary 01-01-2009
page 4 of 5
substance whereby 50% of test organisms die. LC50 (rat, inh, 1h) is the concentration in air lethal to rats after one hour of exposure
LFL Lower flammability limit; below this concentration too little flammable gas is present in the air to maintain combustion
LOC See Loss of Containment event. Loss of Containment Event resulting in the release of material to the atmosphere Nominal pumping rate Normal flow of material through a pump Explosive substances Explosive substances are:
a. 1°. substances and preparations that present an explosion hazard due to shock, friction, fire or other causes of ignition (risk phrase R2); 2°. pyrotechnic substances. A pyrotechnic substance is understood to be a substance or mixture of substances with the purpose of producing heat, light, sound, gas or smoke or a combination of these phenomena by means of non-explosive, self-propagating exothermic chemical reactions; 3°. explosive or pyrotechnic substances and preparations that are contained in objects; b. substances and preparations that present a serious danger of explosion as a result of shock, friction, fire or other ignition causes (risk phrase R3)
Ignition source A thing able to ignite a flammable cloud, e.g. due to the presence of sparks, hot surfaces or open flames
Operator Any individual operating technical equipment Pasquill class Classification to qualify the stability of the atmosphere,
indicated by a letter ranging from A, for very unstable, to F, for stable
PGS15 facilities Storage of hazardous substances in accordance with the PGS15 directive.
Location-specific risk The probability that during a period of one year a person will become the victim of an accident, in which case this person is in a particular location permanently and without protection. Often (as in this Reference Manual) the probability of an incident in one year is superseded by the frequency of an incident in one year
Pool fire The combustion of material evaporating from a layer of liquid Probit Number directly related to probability by a numerical
transformation Process vessel Vessel in which a change in the physical properties of the
substance occurs, e.g. temperature or phase QRA See Quantitative Risk Analysis Quantitative Risk Analysis A numerical evaluation of probabilities, effects and
consequences of incidents and their combination into measures of risk
Reactivity Measure for the flame acceleration in a gas/air mixture Reactor vessel Vessel in which a chemical change of the substances occurs Repression system System to limit the release of substances into the environment
given a certain event Risk The combination of probability and effect. In this Reference
Manual the effect is (acute) death as a result of an accident involving hazardous substances
Risk contour Line on a map connecting points having equal risk Roughness length Artificial length scale appearing in relationships describing the

Reference Manual Bevi Risk Assessments version 3.1 - Glossary 01-01-2009
page 5 of 5
wind speed over a surface and characterising the roughness of the surface. The roughness length of a pipeline determines the resistance in the pipe, the roughness length of the surroundings determines the wind speed at ground level
SAFETI-NL Software program for performing QRA calculations in the Netherlands. The program is a version of the SAFETI program by DNV specifically produced for the Netherlands
Selection number Measure of the hazard of an installation at a specific location Tank bund A tank bund consists of an enclosed or recessed area around a
tank the purpose of which is to limit the spread of a pool of liquid
Compressed liquefied gas Gas that is compressed to a pressure that is equal to the saturation vapour pressure at storage temperature, so that the majority is condensed into its liquid phase
Safety Report Report on the safety of an establishment, as required in the Besluit risico’s Zware Ongevallen
Safety valve Valve (or here also rupture disk) designed to automatically vent excess pressure
Fluid column Vertical distance between the liquid level and the location of the hole
Free field calculation Calculation method in which ignition sources outside the establishment are not taken into account. If a flammable cloud is not ignited inside the establishment, ignition is assumed to occur outside the establishment at maximum cloud area. The free field method is used for calculating the Location-Specific Risk
Fire ball A fire, burning rapidly enough for the burning mass to rise into the air as a cloud or ball
Weather class Combination of Pasquill stability and wind speed. Weather class D5 means Pasquill category D and wind speed 5 m/s