Embed Size (px)
Citation preview

Recycled Plastic Fibers for Asphalt Mixtures
FINAL REPORT August 1999
Submitted by
NJDOT Research Project Manager Mr. Robert Baker
FHWA NJ 2000-04
In cooperation with
New Jersey Department of Transportation
Division of Research and Technology and
U.S. Department of Transportation Federal Highway Administration
Dr. Ali Maher** Professor and Chairman
Dr. Mohammed Labib* Professor
** Dept. of Civil & Environmental Engineering Center for Advanced Infrastructure & Transportation (CAIT)
Rutgers, The State University Piscataway, NJ 08854-8014
* Dept. of Civil & Environmental Engineering New Jersey Institute of Technology (NJIT)
323 Martin Luther King Boulevard Newark, NJ 07102

Disclaimer Statement
"The contents of this report reflect the views of the author(s) who is (are) responsible for the facts and the
accuracy of the data presented herein. The contents do not necessarily reflect the official views or policies of the New Jersey Department of Transportation or the Federal Highway Administration. This report does not constitute
a standard, specification, or regulation."
The contents of this report reflect the views of the authors, who are responsible for the facts and the accuracy of the
information presented herein. This document is disseminated under the sponsorship of the Department of Transportation, University Transportation Centers Program, in the interest of information exchange. The U.S. Government assumes no
liability for the contents or use thereof.

1. Report No. 2 . G o v e r n m e n t A c c e s s i o n N o .
T E C H N I C A L R E P O R T S T A N D A R D T I T L E P A G E
3 . R e c i p i e n t ’ s C a t a l o g N o .
5 . R e p o r t D a t e
8 . P e r f o r m i n g O r g a n i z a t i o n R e p o r t N o .
6. P e r f o r m i n g O r g a n i z a t i o n C o d e
4 . T i t l e a n d S u b t i t l e
7 . A u t h o r ( s )
9 . P e r f o r m i n g O r g a n i z a t i o n N a m e a n d A d d r e s s 1 0 . W o r k U n i t N o .
1 1 . C o n t r a c t o r G r a n t N o .
1 3 . T y p e o f R e p o r t a n d P e r i o d C o v e r e d
1 4 . S p o n s o r i n g A g e n c y C o d e
1 2 . S p o n s o r i n g A g e n c y N a m e a n d A d d r e s s
1 5 . S u p p l e m e n t a r y N o t e s
16. A b s t r a c t
17. K e y W o r d s
19. Secu r i t y C l a s s i f ( o f t h i s r e p o r t )
Form DOT F 1700.7 (8-69)
20. S e c u r i t y C l a s s i f . ( o f t h i s p a g e )
18. D i s t r i b u t i o n S t a t e m e n t
2 1 . N o o f P a g e s 22. P r i c e
August 1999
NJIT & CAIT/Rutgers
Final Report 3/6/1996 - 3/31/1999
FHWA 2000-04
New Jersey Department of Transportation CN 600 Trenton, NJ 08625
Federal Highway Administration U.S. Department of Transportation Washington, D.C.
The use of recycled fibers in asphalt mixtures were found to be beneficial in some cases only such as when fishing nets were used. In these successful cases, the fibers could be uniformly and consistently incorporated into the asphalt mixture without segregation or introduction of excessive air voids. Fibers typically obtained from recycling operations such as from carpets and car seats were difficult to use with the dry mixing process that was developed at NJIT. The latter sources of fibers produced waste that was entangled. This is why the results were inconsistent with regard to the effect of fibers on the performance of the mixture. Available recycled fibers did not produce consistent results as judged by the Marshall test. The final conclusion of the program was to pursue a systematic study primarily based on using the Superpave design Schedule. The final approach was to use virgin fibers first to clearly understand how fibers affect the mechanical properties of the mixture, and then apply the results to the use of recycled fibers – all the work was to follow the Superpave design approach. A comprehensive review of the results is included in this report.
Recycled Fibers, Asphalt Mixtures, Fibers, Fishing Net, Marshall Stability, and Recycling
Unclassified Unclassified
93
FHWA 2000-04
Dr. Mohammed Labib and Dr. Ali Maher
Recycled Plastic Fibers for Asphalt Mixtures

ii
TABLE OF CONTENTS Page Summary and Conclusions 1 Main Results 1 Synopsis 1 Results and Discussion 2 Results Set I 4 Results Set II 9 Title Page 10 Outline 11 Introduction 12 Application of Spectroscopic Techniques in the Characterization 16 Transmission Electron Microscopy and its Applications 25 Results Set III 51 Title Page 52 Table of Contents 53 List of Figures 54 List of Tables 55 Introduction 56 Materials and Experimental Methods 59 Results and Discussion 64 Conclusions and Recommendations 75 References 77 Appendix 1 78 Appendix 2 82 Results Set IV 83 Title Page 84 Introduction 85 Importance of Using Superpave Level 3 85 Study Scheme 86 Experiment Work 87

iii
ACKNOWLEDGMENTS This project was conducted in cooperation and under sponsorship of the New Jersey Department of Transportation (NJDOT). The principal investigators express their gratitude to the NJDOT for funding the research described herein.

I
i
L
I
1 1 L I
L
i
i
L L
I
L
L
Recycled Plastic Fibers for Asphalt Mixtures
Dr. M. E. Labib
I. Summary and Conclusions:
The objective of the program was to explore the applicability of using recycled plastic fibers to improve the mechanical properties and the performance of asphalt mixtures. The program was limited in scope, with the initial intention to explore the potential of this application. The total funding at $24,674. The project was only allocated for one year. Mr. Song Gu, a graduate student, was assigned to pursue this program. Mr. Gu has left NJlT to pursue a professional engineering career in the area of structural analysis with a consulting firm in New Jersey.
The main results of the program were as follows: 1. A complete literature survey was conducted to estimate the availability of fibers
for this major application. Production information of non-cellulose fibers in the United States was compiled and reviewed - Attached a s Results Set I.
matrix interface and its implication of the micro- and macro-mechanics of composite materials was conducted and summarized in the form of a report. Attached as Results - Set I1
3. A dry process for mixing recycled fishing net fibers for making asphalt mixture for initial investigation was developed during this program - Attached as Results Set 111.
4. Preliminary experimental evaluations of asphalt mixtures made with various recycled fibers using the Marshall stability test were conducted. This part is described in this final report summary. The results were variable and inconsistent.
using Superpave schedule was developed for future work. Attached as Results Set IV.
2. An elaborate review of the literature regarding the state of the art of fiber-
5 . An elaborate test program for evaluating fiber-containing asphalt mixtures
Synopsis: The use of recycled fibers in asphalt mixtures were found to be beneficial in some cases only such as when fishing nets were used. In these successful cases, the fibers could be uniformly and consistently incorporated into the asphalt mixture without segregation or introduction of excessive air voids. Fibers typical obtained form recycling operations such as from carpets and car seats were difficult to use with the dry mixing process that was developed at NJIT. The latter sources of fibers produced waste that was entangled. This why the results inconsistent with regard to the effect of fibers on the performance of the mixture. Available recycled fibers did not produce consistent results ,as judged by the Marshall test. The final
1
I
i I
i I
i
i
i
i
L
'I L
conclusion of the program was to pursue a systematic study primarily based on using the Superpave design Schedule. The final approach was to use virgin fibers first to clearly understand how fiibers affect the mechanical properties of the mixture, and then apply the results to the use of recycled fibers - all the work was to follow the Superpave design approach. A comprehensive review of the results is included in this report.
11. Results and Discussion
The results of this program will be divided into several sections as follows:
1. Information regarding US organic fiber production:
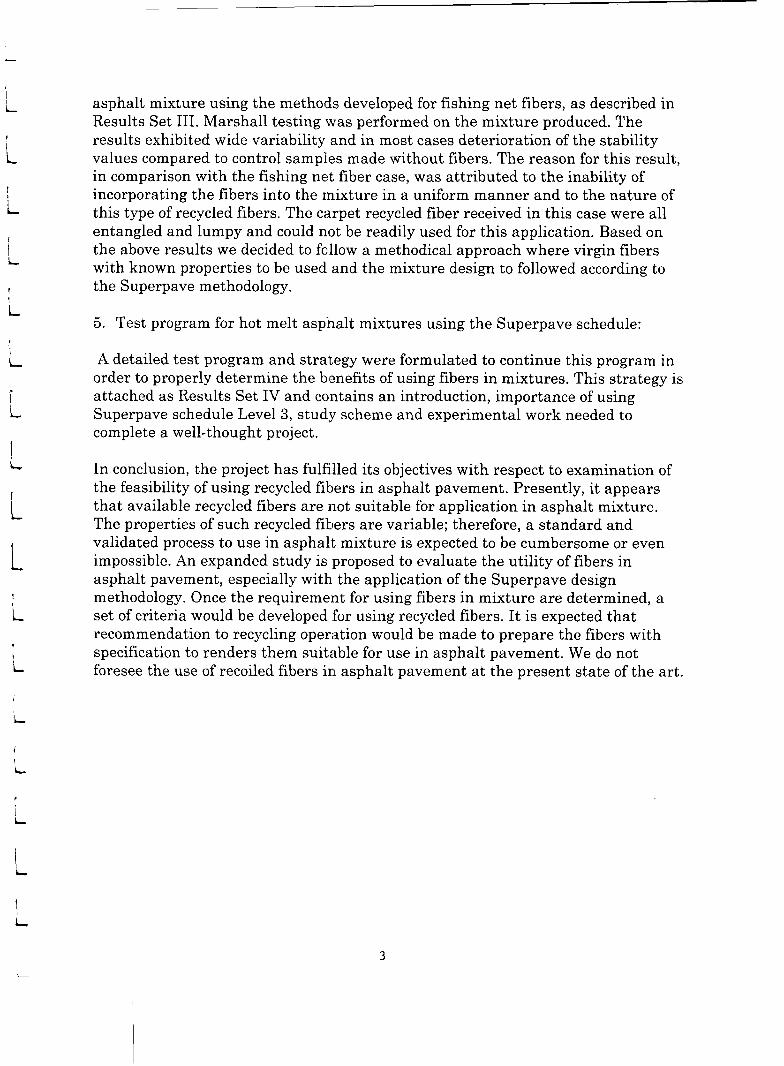
A market research regarding the type and nature of fibers produced in the US was conducted and summarized. It is estimated that about 3,000 million tones of plastic fibers is produced in the US every year. These are as follows: 68% nylon, 19% polypropylene, 10% polyester and 3% other types. Based on this information, we decided to explore both nylon and polypropylene. The results of this research is attached as Results Set I.
2. in polymer matrix composites and implication such properties on the mechanical and performance properties of such composites:
Literature research regarding the characterization of fiber surfaces
Since the asphalt-fiber interface case is similar, in principle, to the fiber-polymer case, we devoted part of the investigation to defining characterization methods that can be used in the project. This s iha t ion of fibers in asphalt mixture is, however, much more complex compared to the pqlprmer composites case. The detail of this research is attached as Results Set 11.
3. reinforcement - mixing process development and initial results:
The development of duratble asphalt pavements using fishing nets as
The study of evaluating the utility recycled fibers in asphalt mixtures started with the use of fishing net fibers, and was expanded during this program. We have studied the effect of fiber type on the mechanical and physical properties as judged by the Marshall stability results and by the voids analysis of asphalt mixtures. Based on the results, polypropylene fibers produced better results compared to nylon fibers. The details of this analysis are attached as Results Set 111.
4. Summary of preliminary experiments:
Samples of nylon recycled plastic fibers were obtained from a carpet recycling company in Atlanta. The fibers were incorporated at different percentage into
I L
2
i
i
I 1 L
asphalt mixture using the methods developed for fishing net fibers, as described in Results Set 111. Marshall testing was performed on the mixture produced. The results exhibited wide variability and in most cases deterioration of the stability values compared to control samples made without fibers. The reason for this result, in comparison with the fishing net fiber case, was attributed to the inability of incorporating the fibers into the mixture in a uniform manner and to the nature of this type of recycled fibers. The carpet recycled fiber received in this case were all entangled and lumpy and could not be readily used for this application. Based on the above results we decided to folllow a methodical approach where virgin fibers with known properties to be used and the mixture design to followed according to the Superpave methodology.
5 . Test program for hot melt aspjhalt mixtures using the Superpave schedule:
i
L
i
A detailed test program and strategy were formulated to continue this program in order to properly determine the benefits of using fibers in mixtures. This strategy is attached as Results Set IV and contains a n introduction, importance of using Superpave schedule Level 3, stud;y scheme and experimental work needed to complete a well-thought project.
In conclusion, the project has fulfilled its objectives with respect to examination of the feasibility of using recycled fibers in asphalt pavement. Presently, it appears that available recycled fibers are not suitable for application in asphalt mixture. The properties of such recycled fibers are variable; therefore, a standard and validated process to use in asphalt mixture is expected to be cumbersome or even impossible. An expanded study is proposed to evaluate the utility of fibers in asphalt pavement, especially with the application of the Superpave design methodology. Once the requirement for using fibers in mixture are determined, a set of criteria would be developed €or using recycled fibers. It is expected that recommendation to recycling operation would be made to prepare the fibers with specification to renders them suitable for use in asphalt pavement. We do not foresee the use of recoiled fibers in asphalt pavement at the present state of the art.
i
i
L , i L
3

i
i
RESULTS SET I
I L
I L
i
4

PRODUCTION INFORMATION ABOUT U.S. ORGANIC FIBERS-NONCELLULOSIC
i Department of Civil Engineering, NJIT
L October 20, 1996
i Establishments primarily engaged in manufacturing noncellulosic or
synthetic fibers comprise the manmade organic fibers industry. The fibers yarn, staple, or tow suitabe for
further manufacturing on spindles, looms, knitting machines, or other textile processing equipment. Sythetic fibers accounted for about 90% of manmade fibers output in 1993. Marimade fibers constituted approximatly 25% of the larger U.S. synthetic materials industry, which also encompassed plastics and rubbers.
Synthetic materials, in turn, represented about 25% of the overall
Lare created in the form of monofil.ament,
L 1
$ 3 0 0 billion per year U.S. chemical industry.
The portions of each part clf application of sythetic noncellulosics
The major synthetic noncellulosics are polyster, nylon, acrylic, and of these items can be
seen in Table 1. and Table 2. Each item percentage of the total synthetic noncellulosics materials is shown in Fig 2. And Fig 3 and 4 are ploted to show the percentages of each uses from polyster and nylon separately.
1 L
1
‘the olefins. The volumes of production and capacity
fibers are shown in Fig 1.
i Over the past decade, olfins fibers (polypropylene and polyethylene) ‘Lhave been the fastest-growing manufactured fiber category. Growth has been spurred by the increasing use of olefins in a variety of products; more , than 5 0 % of demand is for carpets and carpet backing, primarily for
\ commercial uses. In addition to various industrial applications, other &uses of olefins are for nonwoven products such as disposable fabrics and medical garments.
f
i Acrylic is used in apparel (sweaters, fleecewear, and hosiery). Acrylic fibers compete with polyster and cotton in apparel uses. Home
I furnishings (primarily blankets and draps) and industrial uses (filters, reinforcements for friction products such as brake linings) account
for the remaining acrylic demand.
Table 3 refers to the production of U.S. carpet fiber market in 1993
According to Modern Plastics Jan. 1995, in the recycled PET markets in 1993 and 1994, the volumes of recycled fibers are 210 and 240 million
L
i 3ounds respectively. The largest company competing in the synthetic fibers industry in
Lthe early 199Os, E . I . du Pont de Nemours of Delaware planed to develop nylon recycling technology to beqin marketing recyclable fibers by 1997, the company hoped to eventually corner 85% of the used nylon market.
5 -
The second manufacturer of synthetic fibers in the early b990s, Hoechest Celanses Corp., introduced a 100% recyclable, all-polyster carpet - system in 1993.
References
1.
2.
3.
4.
Standard & Poor's Industry Surveys. NY S&P's Corporation
Encyclopedia of American Industries. Vol.1, Gale Research
Modern Plastics Jan. 1995
Carpet & Rug Industry Oct. 1993
1996
Inc. 1994
Table 1
Table 2

L
Type
i
Volume (mil Ibs) I Percent of the total carpet
, L
Nylon Polypropylene Polyster fiber O t h m ir?ci:;dinS wool and cotten L orai -
1 L
fibers (%) I900 08 527 I!, 2x0 I 0 66 -9
177; 100
i
L
L
i L
i L \
i L
L
I L
i I L
Fig.1 Fibers Products Distriblution
B 20%
A- Floor covering, 32 1 G mil lbs B- Industrial production R: other cons tiiiirr
goods (tires, rope, medical and surgical supplies, electrical equipment, reinforced plastics and coated and protected fibers). 2649 mil lbs
C- Apparel, 2459 iiiil lbs D- Home textile, 851.3 mil lbs E- Esports, 378.4 mil Ibs
Fig.3 Distribution of the products of polyster fibers
M 5% L
Fig.2 Distribution of different kinds of sythetic fibers
I 4%
G 30%
Fig.4 Distribution of the products of nylon
0
80% 75%
J- Textiles, apparel, home firnlishillgs K- Rubber reinforcement L- Other industrial products M- Carpets

L
Table 1
Table 2
L
I L
I L
I
I L
1 i
A- Floor covering, 32 16 mil Ibs B- Industrial production Kt other coiismcr
goods (tires, rope, medical and surgical supplies, electrical equipment, reinforced plastics and coated and protected tibcrs), 2649 mil Ibs
C- Apparel, 2459 mil Ibs D- Home textile, 851.3 mil lbs E- Exports, 378.3 mil Ibs
J- Textiles, apparel, hoine fiimishiiigs K- Rubber reinforcement L- Other industrial products M- Carpets
Table 3 Production of US Carpet Fiber in 1993 year
Volume (mil Ibs) Percent of the total carpet fibers (YO)
I900 68 527 I9
Polyster fiber 2x0
Others including wool and cotten Total
I L
i L I L
8

I L
I
L
L
i RESULTS SET I1
L
i
i L
I
L
i
L
9

PRESENTATION
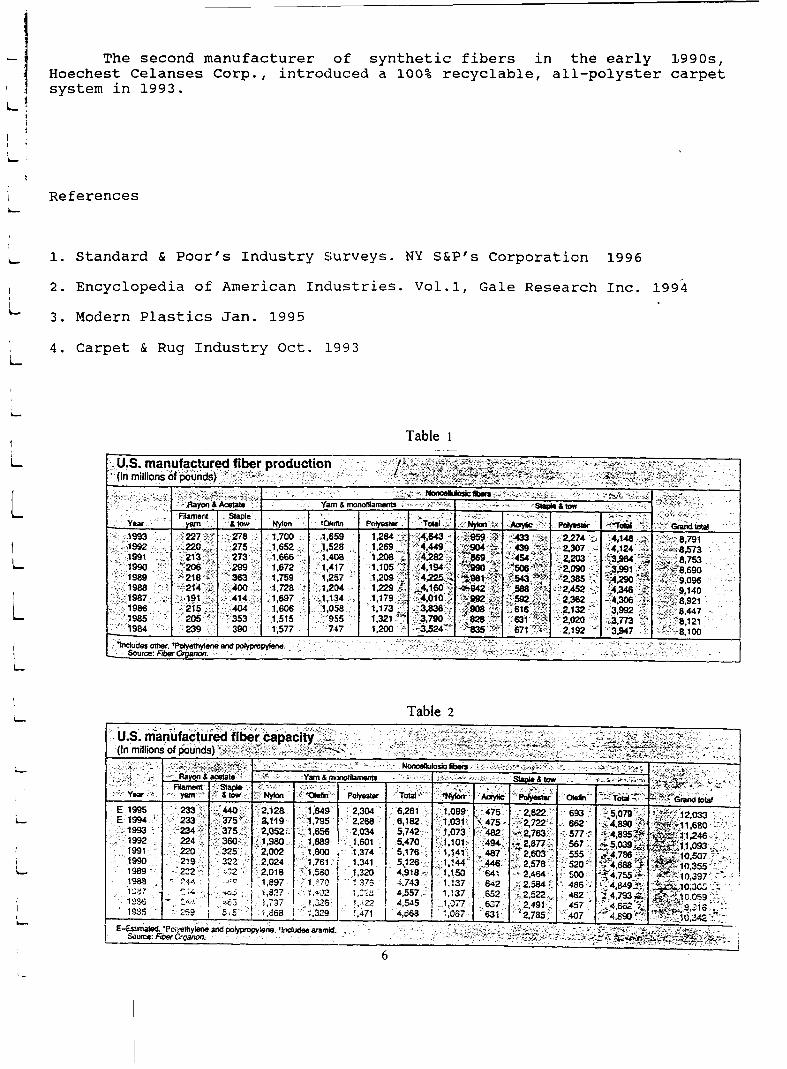
LITERATURE RESEARCH OF CHARACTERIZING FILLER OR FIBER SURFACES IN POLYMER COMPOSITES
I
i i
1 L i L
i
L
I
i
SONG GU
Department of Civil & Environmental Enweering New Jersey Institute of Technology
May 1997
I
L
10
i i I
LITERATURE RESEARCH OF CHARACTERIZING FILLER
OR FIBER SURFACES IN POLYMER COMPOSITES
1. Introduction
! i
L
!
L
i
L
L
i
1.1. Polymer composites with fillers (fibers) 1.2. Purpose of using surface-reactive chemicals or surface treatments 1.3. Objective of characterization of filler (fiber) surfaces in the composites 1.4. Analytical techniques
2. Application of spectroscopic techniques in the characterization
2.1. Introduction 2.2. Application of X-ray photospectroscopy in the characterization 2.3. Application of Secondary Ion Mass Spectroscopy in the characterization 2.4. Comparison of X P S with SIMS 2.5. Application of Fourio~r Transform Infkared Spectroscopy
3. Transmission Electron Microscopy and its Applications
3.1. Introduction 3.2. Basic principles 3.3. TEM operation 3.4. Application and Examples
L
I
i
- _ 11

I
L
i 1. INTRODUCTION
1.1. Polymer cornposites with fillers (fibers)
i
Introducing fillers (fibers) into polymers may substantially modify the properties and cost of material.
L i I L
i
L
Exl: Carbon fibers constituting a material essentially characterized by a high specific strength and stiffness, in comparison with the other currently available engineering materials. These fibers are mainly used as reinforcing agent in composites along with a light-weight matrix, commonly an epoxy resin.
Ex2: Silica is dispersed in methyl methacrylate, which is commonly used for moulding into articles such as kitchen sinks, baths and bathroom fitments, to obtain strong chemical bonding between fillers and the matrix, and to achieve the improved mechanical properties of the final component.
Most commonly used fillers :
Silica, aluminum hydroxide, calcium carbonate, alumina silicates, titanium dioxide.
L Most commonly used surface treatment of fibers:
i
I
i
Oxidative, amine.
12 i

I
i I
i
I
L
i
i
L
I I L
i
1.2. Purpose of using surface-reactive chemicals or surface treatment
Using surface chemicals or surface treatments (for fibers):
For optimization the interaction between the filler and matrix, including:
1. Enhancing the strength of adhesion between filler (fiber) and matrix; 2. Improving the wetting by the polymer, and hence the dispersion within the
polymer.
Surface-reactive chemic,als having a single functionality :
Reactive towards the filler surface and to improve the wetting.
Ex: Steric acid used to surface modify carbonate for improving the rheology when filling into polypropylene
Surface-reactive component having dual functionality:
Being capable of reaction with the filler surface, and also cross-linking into the polymer matrix to form continuous c:hemical bonding between the filler particles and the polymer matrix.
Ex: 3-(trimethoxysilyl) propyl methacrylate (MPS) used in methyl methacrylate filling with silica.
L
13
I
i
I L
1.3. Objective of characterization of filler (fiber) surfaces in the composites
i
To achieve the work below:
I
i
L
I L
Design the surface modifier with functional groups Determination of adhesion in surface Comparison of surface and matrix compositions Surface failure analysis
We should have:
A comprehensive analysis of all the chemical moieties at the filler surface and their precise special arrangement.
Acid-base theory:
L
i
Acid-base interactivity is normally used for the surface chemistry to predict melt and composite properties
I
Adhesion mechanism for fiber surface treatment
1. Increasing the mechanical interlocking and physical bonds; 2. Improving and control the interfacial chemical bonding.
14

i
~ L
i
i
L
i
I
L
L
L
1.4. Analytical techniques
The techniques have been divided into two groups.
First groups:
To characterize the surface of fillers by understanding their reactivity with probe molecules.
Including: flow m&r&mmtq, inverse gas c h r o m a t m y . (which are not discussed here)
Second groups:
Spectroscopic techniques, which uniquely provide elemental and chemical analysis of only the outer few nanometers of the surface under investigation.
Including:
XPS, SIMS and DRIFT FTIR.
L
L
15

2. Application of spectroscopic techniques in the characterization
L
2.1. Introduction
Technique requirement for surface characterization:
Surface modification of base filler ptarticles can range from the absorption of less than one monolayer of a surfactant to the precipitation of a coating many nanometres (IOE-9 M) thick.
L
I
L
i L-
i L
I I L.
Surface composition analysis therefore requires methods that posses sampling depths of order of 1 - 10 nm and which can characterize both inorganic and organic species.
Ultrahigh vacuum (UHV)-baseld surface spectroscopic techniques close to meeting the requirements:
X-ray phontonelectron spectroscopy Secondary ion mass spectrometry (st,atic)
Because of charging problems with highly insulating powers and beam damage to organic materials. Auger electron spectroscopy (AES) fails in this field.
Other spectroscopy techniques most commonly used:
Diffuse reflectance Fourier transform infrared spectroscopy
Other physical techniques commonly used:
Transition electron microscopy Scanning electron microscopy
16

L
I L
i 1
! i
L I
L
I
L
2.2. Application of X-ray photospectroscopy in the characterization
Basic theory:
In XPS, a beam of soft x ray (1 -5ke V) illuminates the material to be studied and the energy spectrum of the resulting photoemitted electrons is measured by a suitable spectrometer. Each x-ray photon is usually completely absorbed by a single electron in the sample, providing enough of the escaping electron is :
Ee = hv - Eb
Where Ee is the kinetic energy of the escaping electron. hv is the x-ray photon energy and Eb is the binding energy of the electron in the material.
If the incident x-ray energy is known and the escaping electron energy is measured, the original binding energy can be calculated. Since each element has a unique set of binding energies. the binding energy in turn #determines the element from which the electron came. These binding energies can bre calculated or determined experimentally from x- ray absorption or emission measurements.
One of the most valuable features of XPS is its ability to distinguish different chemical bonding configurations as well as different elements.
t 17

L Special features of X P S :
i
,
i
1. The least destructive of all the electron or ion spectroscopy techniques
2. Surface sensitivity (absolutely sensitivity between 0.01 -0.3% at., depending on the element), but not suitable for trace analysis.
3 . Quantitative and chemical state analysis capabilities.
4. Detect all elements except hydrogen and helium. I
i L
L
5 . Relatively poor spatial resolution, compared to electron-impact and ion-impact techniques.
6. Depending on the element XPS c,an be a slow technique if the extent of chemical detail to extracted is large. Analysis times may vary from a few minutes to many hours.
I
1 L
Application in surface characterization:
1
L
1. Examination for and identification of surface contaminants.
2. Evaluation of thin-film coatings.
3. Failure analysis for adhesion between components.
4. Effectiveness of surface treatmenls of polymers and plastics.
i L-
18

i L 1
L
I
L
i L
I L
Figure
a. Binding energy (eV) rl! c
'T I
Binding energy (eV)
(a) XPS survey spectra of uncoated commercial TiO, pigment. Figure pigment.
X n - E a
c
a. Binding energy (ev)
Binding energy (eV)
(continued) (b) XPS survey spectra of coated commerclal TiOl Note the marked attenuation of Ti 2p signal following coatmg.
19

L
f L 1 I L
i
L
I
L
L
L
2.3. Application of Secondary Ion Mass Spectroscopy in the characterization
Basic principle
Static SIMS entails the bombardment of a sample surface with an energetic beam of particles, resulting in the emission of surfaces atoms and clusters. These ejected species subsequently become either positively or negatively charged and are referred to as secondly ions. The secondly ions are the actual analytical signal in SIMS. A mass spectrometer is used to separate the secondly ions with respect to their charge-to-mass ratios. The atomic ions give an elemental identification. whereas the clusters can information on the chemical groups.
The mass spectrum of the clusters obtained represents a fingerprint of the compounds analyzed. The data may be acquired over relatively small areas(um or less) for a localized analysis or larger areas (mm) for a macrocharacterization. Further? by monitoring a particular charge-to-mass ratio (i.e. a particular chemical group), one can obtain chemical maps depicting the lateral distribution of a specific fragment or compound.
Special Features of SIMS (static)
1. High surface sensitivity.
2. Complete inicrochemical analysis by providing mass spectral data (both positive and negative spectrometry), as well as chemical mapping.
L L
20

I L
Applications in surface charactierization
1. Comparison of surface and bulk compositions. 2. Failure analysis. 3. Determination of adhesion or delamination mechanisms.
1 I
L
L
1
1 c-
L
i
I
I
1 L
23 21 I I
mlz
Figure ToF SIMS spectra from coated pigment givlng XPS spectrum of Fig. 3.Qbj: (a) Positive ion spectrum; annotated peaks are due to Na' (mlr 23). A l * (27). Tit (48). TiO' (a), TiO(0H)' (81). ZrO' (106) and ZrO(0H)' (123).
79
I
100 120 I& 160 180 200
mlz
Figure (conrinued) (b) Negative ion spectrum. Linnoiated peaks are due to PO2 (63) . PO, (79). H,PO; (97). J I I other peaks are molecular fragments from organic rpecie\
2 1

L
I L
i I
L
i
2.4. Comparison of XIPS with SIMS
The main X P S advantages:
1. More developed chemical state a.nalysis capability. 2. Some what more accurate e1eme:ntal analysis. 5 . Far fewer problems with induced sample damage and charging effects for insulators. 4. Least destructive to the sample (SIMS is an intrinsically destructive technique).
The advantages of SIMS:
f
1. Sensitivity in surface characterization. 2. Good at trace analysis, (not for XPS). 3. Probes even less deeply at the surface. 4. Spatial resolution is better. 5. Detects H.
Conclusion:
The two techniques are very complementary in respect of quantification. structural insight, sampling depth and in situations such as filler surface analysis, where layered systems involving both organic and inorganic components are involved, SIMS is a valuable adjunct to XPS.
i
22

L
1 L
I
I L
L
I I L
1
i.
2.5. Application of Fouriour Transform Infrared Spectroscopy
Fundamentals of vibrational spectroscopy
Vibrational spectroscopy is concerned with the detection of transition between energy levels in molecules which result froin vibrations of the interatomic bonds. The vibrational frequencies are shown to be characteristic of particular functional groups i n molecules. They are sensitizes to the molecular environment, chain conformations and morphology and so afford a useful method for polymer analysis.
When molecular vibrations result in a change in the bond dipole moment, as a consequence of change in the electron distribution in the bond, it is possible to stimulate transitions between energy levels by interaction with EM radiation of the appropriate frequency. In effect , when the vibrating dipole is in phase with the electric vector of the incident radiation the vibrations are enhanced and there is transfer of energy from the incident radiation to the molecule. It is the detection of this energy absorption which constitutes IR spectroscopy. In practice, the spectral transitions are detected by scanning through the frequency whilst continuously monitoring the transmitted light intensity. The energies of molecular vibrations of interest for analytical work correspond to EM wavelengths in the range 2.5-25um o r ,when expressed conventionally in terms of wavenumber, 4000-400cm- 1 (frequency in wavenumber (cm- 1 )=10000/wavelengtli in um). Some spectrometers operate in the near infra-red region (NIH) 0.7 to 2.5um (4000 to 1400 cm-1) and others in the far irifra-red (FIR) 50 to 800 urn (200 to 12 cm-1).
i
L 23

Special features and applications of DRIFT
1. Giving intimate structural detail of the molecules under examination.
2. No need of elaborate preparation (grinding etc.) which can modify the chemical nature of the material.
3. The spectra of uncoated filler is able to be subtracted from that of the coated specimen. creating a difference spectra of the: surface coating. The accumulation of data from multiple scans permits spectra to build up from small concentrations, for example. monolayers, of surface coatings
79.548
67.331
z - 55.115 3 .- 2 42.698 E
f-
- E
? 30.662 16.465 I
1781 8.2490 I I I l I ! I l
4ooo 3200 2400 lboo Roo
Wave number (cm-')
Figure Transmission infrared spectrum of rnaleinized polybu ladicne
35 261
33 719
32 171
30623
h 5
B
Y
5 29075 i:
27 525
?S 919 4
Wave nurnher (crn-')
Figure DRIFT infrared difference spectrum of m.ignesium hydroxide subtracted from magnesium hydroxide coated with malcinlzed poLy butadiene.
24

3. Transmission Electron Microscopy and its Applications
I L
i L,
3.1. Introduction
Transmission Electron Microscopy (TEM) has, in three decades time, become a mainstay in the repertoire of characterization tlcchniques for materials scientists. TEM’s strong cards are its high lateral spatial resolution (better than 0.2 nm “point-to -point” on some instruments. Although such high resolution examination is seldom possible with polymers, it is possible to obtain infcrmation within the range 1 - 100 nm with varying degrees of difficulty.) and its capability to provide both image and diffraction information from a single sample. In addition, the highly energetic beam of electrons used in TEM interacts with sample matter to produce characteristic radiation and particles; these signals often are measures to provide materials characterization using EDS, EELS, EXELFS, backscattered and secondary electron imaging, to name a few possible techniques.
There are two types of TEM, the conventional TEM (CTEM) and the scanning TEM (STEM). CTEM is mainly discussed here and the STEM will be dealt with briefly later.
i L.
1 L.
25

t L. i
3.2. Basic principles
i I ! i.
1. I L.
i.
In TEM, a focused electron beam is incident on a thin (less than 200 nm) sample. The signal in TEM is obtained from both. undeflected and deflected electrons that penetrate the sample thickness. A series of magnetic lenses at and below the sample position are responsible for delivering the signal to a detector, usually a fluorescent screen, a film plate, or a video camera. Accompanying this signal transmission is a magnification of the spatial information in the signal by as little as 50 times to as much as a factor of 1,000,000. This remarkable magnification range is facilitated by the small wavelenth of the incident electrons, and is the key to the unique capabilities associated with TEM analysis.
Layout of the TEM
The CTEM can be likened to the light microscope operated in transmission, consisting of a source (of electron instead of light), a condenser system, a specimen stage, an objective lens and a projector system. A major difference follows from the ready interaction of electron with matter (including gas) for in the TEM the path from source to detector must be in vacuum so that the only origin of scattering is the specimen.
26

I L
L
I i
I i
t
L
i i
i
1
L
L
L 1 i i
Figure Schematic diagram of ,a TEM instrument, showing the sample and the principal1 lenses within a TEM column.
27
j 'i
' /
. .
"A 1 location of a thin
4
L
L
1 i L
L L
Selected. Area Apenure
I L
L
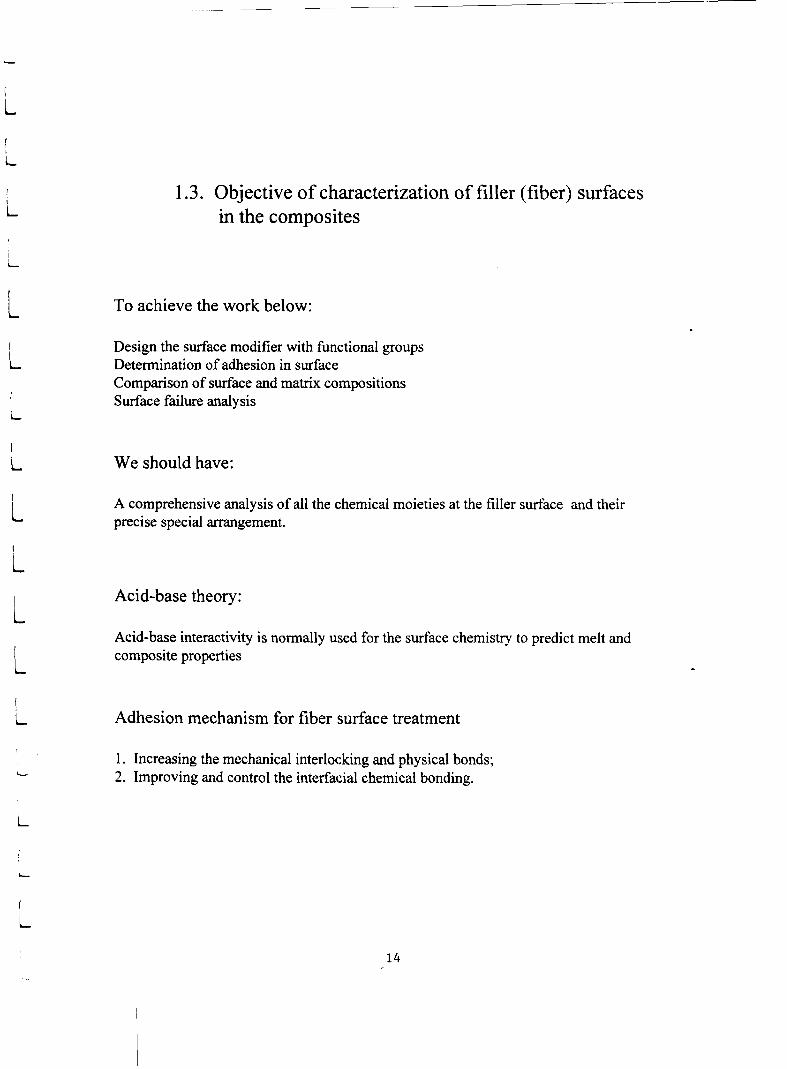
Figure
IllCldCIll Cloclloll
Pro-Finld 0 1 1i1n OJbOCllVO LL!III:
Port rI,*i,i nl ti,,-
. . . . . . . . . .
). Obloct~vu Lcns
Rack-Focal Plane 01 the Objective Lens
Schematic representation for the ray paths of both unscattered and scattered electrons beneath tho sample.
L
i
L L
28
L
L
Resolution
1 I L
I
i i
,
i
- In light microscopy the ultimate resolution is diffraction-limited and is of the order of the wavelength, i.e. around 500nm for visible light. Thus to form images of detail smaller than this, radiation of smaller Wavelength is required and this led to the development of the TEM. Moving electron have a wave nature, and after 1 OOkv acceleration the wavelength is approximately 0.0037nm. This is below atomic dimensions, but resolution now becomes limited by the aberration of the lenses andor by the deficiencies of the detection system (e.g. the phosphor screen on which the image is displayed). Higher voltages produce shorter wavelengths and although this in itself is not of any benefit when resolution is determined by other factors, it permits the construction of lenses with slightly better image forming characteristics.
A second motive for building TEM with higher voltages is that electron penetration increases, permitting the use of thicker specimen.
High lateral spatial resolution is maintained via the use of extremely thin samples. In most TEM experiments, samples are thinned usually to less than 200nm. For most materials this insures relatively few scattering events as each electron traverses the sample. Not only does this limit spreading of the probe, but much of the coherency of the incident sources is also retained.
Sensitivity
I t
i TEM has no inherent ability to distinguish atomic species. Nonetheless, electron scattering is exceedingly sensitive to the target element. Heavy atoms having large, positively charged nuclei, scatter electrons more effectively and to higher angles of deflection, than do light atoms.
1
L
29

L I L
L
I
1
L
L
I
i
Electron optics
At the top of the TEM column is an electron source or gun. An electrostatic lens is used to accelerate electron emitted by the filament to a high potential (typically 100- 1000kv) and to focus the electrons to a cross-over just above the anode (the diameter of the cross- over image can be from 0.5 to 30 urn, depending on the type of gun). The electrons at the cross-over image of the filament are delivered to the specimen by the next set of lenses on the column, the condensers.
Most modern TEMs use a two-stage condenser lens system that makes it possible to:
1 produce a highly demagnified image of cross-over at the specimen, such that only a very small sample region is illu.minated (typically < 1 um).
2 Focus the beam at “infinity” to ]produce nearly parallel illumination at the specimen.
The former procedure is the method (of choice during operation in the image mode. while the latter condition is desirable for maximizing source coherency in the diffraction mode.
The specimen is immersed in the next lens encountered along the column, the objective lens. The objective lens is a magnetic lens. Instrumental resolution is limited primarily by the spherical aberration of the objective lens.
The final set of magnetic lenses bene,ath the specimen are jointly referred to as post- specimen lenses. Their primary task is to magnify the signal transferred by the objective lens. Modern instruments typically contain four post-specimen lenses: diffraction, intermediate, projector 1, and projector 2 (in order of appearance below the specimen). They provide a TEM with its tremendous magnification flexibility.
I L
30

I L
Collectively, the post-specimen lenses serve one of two purposes: they magnify either the diffraction pattern from the sample produced at the back focal plane of the objective lens; or they magnify the image produced at the image plane of the objective lens. These optical planes are illustrated in the electron ray diagram in Figure . By varying the lenses’ strength so as to alternate between these two object planes. the post- specimen lenses deliver either a magnified diffraction pattern or a magnified image of the specimen to the detector.
I L I I L
4
The purpose of apertures is to filter either the source or the transmitted signal. The most important diaphragm is called the objective aperture. This aperture lies in the back focal plane of the objective lens. In this plane the scattered electron waves recombine to form a diffraction pattern. Inserting an aperture in this plane effectively blocks certain scattered waves. Use of a small objective aperture while operating in the image mode, which blocks all diffracted beams (as in this example), can serve to enhance significantly image contrast. Use of a large objective aperture, that allows the passage of many diffracted beams, is the modus operandi for the technique referred to as high-resolution transmission electron microscopy (HRTEM).
i
I
i L
L
31 L
1 I
c
1
I
3.3. TEM operation
Diffraction mode
TEM offers two methods of specimen observation, diffraction mode and image mode. In diffraction mode, an electron diffraction pattern is obtained on the fluorescent screen, where the post-specimen lenses are set to examine the information in the transmitted signal at the back focal plane of the objective lens.
I
The diffraction pattern is entirely equivalent to an X-ray diffraction pattern: t
L 1
i
L
i t
A single crystal will produce a spot pattern on the screen, a polycrystal will produce a power or ring pattern (assuming the illuminated area includes a sufficient quantity of crystallites), and a glassy or amorphous material will produce a series of diffuse halos.
Image mode
The image mode produces an image of the illuminated sample area. as in Figure . The image can contain contrast brought about by several mechanisms: mass contrast, due to spatial separations between distinct atomic constituents; thickness contrast, due to nonuniformity in sample thickness; diffraction contrast, which in the case of crystalline materials results from scattering of the incident electron wave by structural defects; and phase contrasts.
32
In image mode, the post-specimen leinses are to examine the information in the transmitted signal at the image plane of the objective lens. Here. the scattered electron waves finally recombine, forming an image with recognizable details related to the sample microstructure (or atomic structure).
I
1.

L
1 L
i i 1
1.
L
b C
Figure la1 Diffraction pattern 'from a single crystal Fe thin film, oriented with the [a011 crystal axis parallel t o the incident electron beam direction. (b) Diffrrctlon pattern from a polycrystalline thin fi lm of Pd,Si. Ic) Diffraction pattern from the same film as in (c), following irradiation of the fi lm with 400-keV Kr' ions. See text for discussio'n (b, c Courtesy of M. Nastasi, Los Alamos National Laboratory)
L Figure High-resolution tr8nsmisa;ion electron microscopy image of an epitaxial thin
film of Y,Ba,Cu,O,-,,grovm on LaAIO,, shown in cross section. (Courtesy of T. E. Mitchell, Los Alamos National Laboratory)
i i
33

L 1 L
L i I
1 L
1 L I .cc
I
i
t
Specimen
Objective lens
Back focal plane
Flrst interrnedlate image
I I I I
Objective aperture
1 1 : ,'I..
I \ I \
I \
I \ I
I \
I
\
\
I c \
4
F I G U R E (a) Paths of electron beams near to the objective lens. Electrons passing through the specimen undeviated are shown by solid lines. examples of diffracted beams are shown by dashed and dotted lines respectively: (b) objective aperture set for bright field (c) objec- tive aperture set for (simple) dark Geld (d) tilted illumination for high resolution dark Geld.
34

c
I
Three primary image modes used in TEM work:
i Bright-field microscopy Dark-field microscopy High-resolution-electron microscopy
L Specimen preparation
L The most difficult, yet at the same time, most important aspect of the TEM technique is the preparation of high-quality thin foils for observation. Sample preparation was divided into two categories, one for thin films and one for bulk materials:
Thin-films, particularly metal layers, were often deposited on substrate and later removed by some sort of technique involving dissolution of the substrate.
Bulk materials were cut and polished into thin slabs, which were then either electropolished or ion-milled.
I
i 3.4. Applications and examples
Advantages of the TEM:
I 1. It provides detailed structural information at the level down to atomic dimensions.
2. It can be rapidly adjusted to provide an electron diffraction pattern from a selected area, facilitating investigation of crystal structure and orientation, and enabling particular morphological features to be identified.
Main disadvantage of the TEM:
It can be used only on thin samples, less than 1 um thick, and preferably less than 100 nni thick.
i
L
35

L
i
L
L
L
I L
I
L
' I 'I
36

L
I L
1 t L 1 I 1
L
I i
F I G U R E Simple dark field image of a multilayered stack of solution grown polyethylene cvstals. showing moire patterns and. near the bottom left-hand corner. a screw dislocation network.
I i
37

L
Applications in surface study:
I i 1. Crazes in thin films.
2. Observe directly an image of the intersurface.
STEM
L 1
In STEM the lenses above the specimen are used to focus the electron beam into a very fine probe at the specimen. The probes scanned across the specimen under the command of scanning coils in the same way as in the SEM. The interaction of the electron beam with the specimen produces various signals, including secondary electrons and X-rays are used to produce images or elemental analysis in the same way as in the SEM, given the appropriate detectors and counters.
During STEM imaging the beam moves rapidly from one position to the next so that destruction of the specimen does not necessarily take place, even the intensity is very high within the prob.
L L
c


I L
Fig. 3.10 Transverse cross-section ofthe tiber M40 sliowng carbon lavers parallel to the surface
Fig. 3 1 1 Transverse cross-section c't'tlie tiber M40 showng carbon-laver edges at the surface.
L
40

1 , 2I20/97 15~49 L
I I I L
L I L
i
i i I L
i I L
L
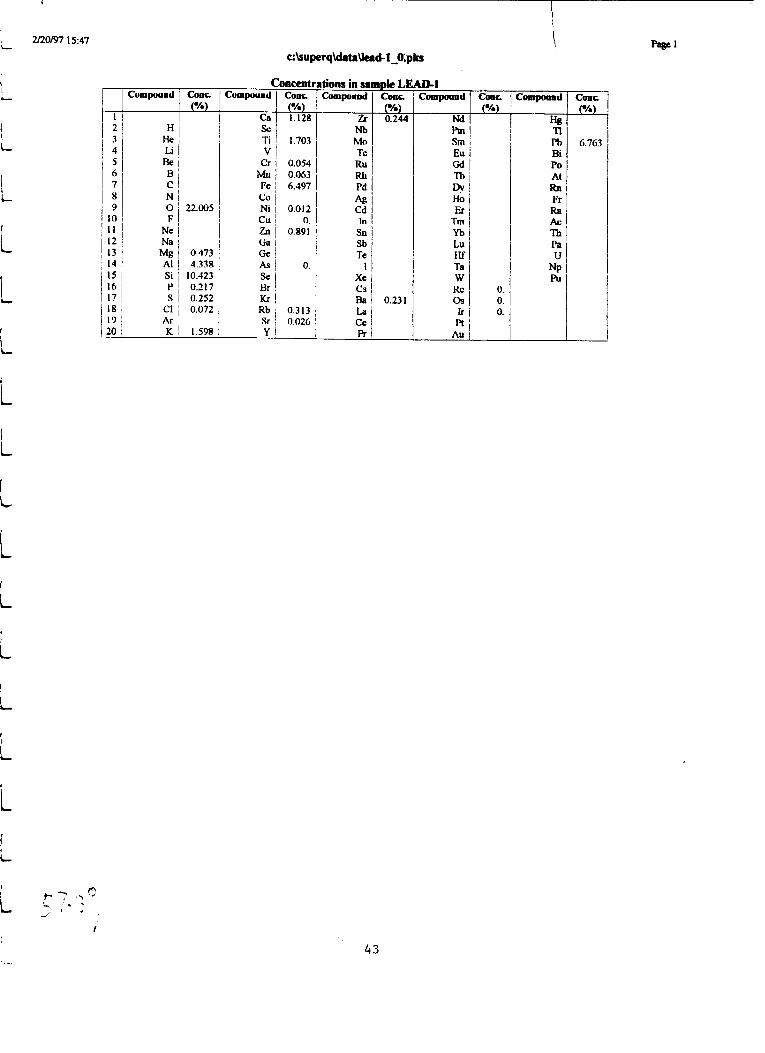
2 3 4 5 6 7 8 9
10 1 1 12 13 14 15 16 17 18 I9 20 -
H He Li Bc B C N 0 F Ne Nil M g Al si P S
c1 Ar K
- COOC
(%)
38.401
0.825 7.571
18.189 0.379 0.439 0.125
2.789 -
Cumpound
Ca sc Ti V
Cr Mn Fe co Ni cu zn (;a Ge As se Br k Rb Sr Y
COOC
1 .%9
2.172
0.095 0.11
11.337
0.022 0.
1.554
0.
0.546 0.045
tions in sa Compound
zr Nb MO re RU w Pd An Cd In Sn Yb TC3
I xc CS Ba La ce R .___
k LEAD-1
0.427 Nd Hg
0.404
-
Hf! Ta I w l Kc ! 0. 0s I 0. k j 0. p t l
Au 1
Ti Ph Bi Po At Rn R Ra h 7h Pa U NP Pu
- COOC
11.802
c 41

-- .-_. .d .J ,
c:\superq\drtaUead-l-O.pb
L
f I
L
1 L
L
42
, WOWI 15147 L
\ L
f L
i L L
i L
L
L
1
i
-
- I 2 3 4 5 6 7
9
11 12 13 14 1s 16 17 18 I9
n in
zo
CampHmod
H He Li Be B C N 0 F Ne Na
Al Si P S
c1 Ar K
M s
- CUOC
22.005
0.473 4.338
10.123 0.217 0.252 0.072
1.598 -
CampHmod
Ca sc Ti V Cr
MI1 Pe CO Ni cu zn cia Ge As se Br Kr
,ncmt hnsinssmpkL1 Caor ~ompouod
1.128 Zr 0.244
1.703
0.054 0.063 6.197
0.012 0.
0.891
0.
Rb 0.313 Sr 1 o.nx Yl
~
Nb MO Tc Ru Rll Pd 4 Cd In sn Sb Te
I xc CO Ba La Ce R
0.23 1
Nd Pm Srn Eu Gd TI, Dv Ho Er
Tm Yb Lu Hf Ta W Kc 0 s Ir rt
Au
0. 0.
I I
0. j
I , i_
4 3

L
L 'i
L 1 i L
L
1 t
i L
Cumpuund
He :I Li
81
B C N 0
1 1 1 Ne
9 10 I F
12 i Na 13 I w 14 1 rl 203
17 j SO3 18 c1 19 1 Ar 20 ~ K
- Cunf =
0.784 8.197
22.298 0.4Y8 0.628 0.072
1.598 -
t :WIlpuuOd
CaO sc:
Ti02 V
Cr203 Ma02 Fe203
C O Ni0 cuo Zn0 cia Ge
As203 se Br Kr Rb SrO Y
COOC
1.579
2.841
0.079 0.1
9.288
0.0 16 F0.
1.109
=
FO.
0.3 13 0.03 -
Nb MO Tc Ru Rh Pd Aa Cd In Sn Sb Te
I Xe CS
BaO Lu Ce R --
0.258
4 Srn I
Eu i Gd l
Compwnd
Hs n rho
Bi Po
., . J
i.
4 4
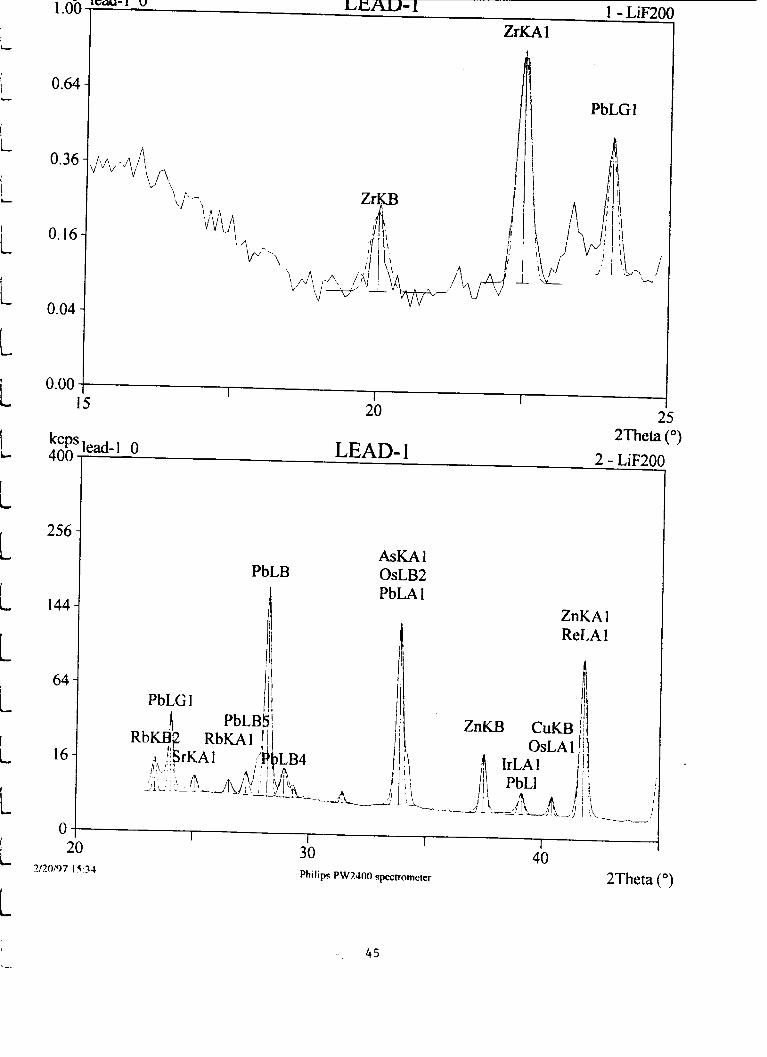
I -L*200 ZrKAl
0.64 -
\ I\ v
cIn I I 0.00 $
15
kCP 400
256
I44
64
16
0 . n L
25 LU
2Theta ( O )
2 - LiF20 lead-1 0 LEAD- 1
PbLB
I i PbLG 1
ASKA1 OsLB2 PbLA 1
ZnKA 1 ReLA 1
I I - I I
30 40
4 5
- 2Theta (")

~
I L
I L
L I L
I L
L I i L L L L L L I L L L i
TiICB FeIiB I BaLB3
CuKAl ii 2AsKAI TiKAl IrLl I/ 2PbLAI CaKAl K-KA I 16 -
CrKA lBalLB 1 nKAlBaLBZ B
0 100 1, 50 0
256 - FeKAl 2PbLB3
0.0 -1 I I I
100 I20 140
144 -
64-
Philips ~ W 2 4 n n spectrometer
46
2Theta (")
L ..
I L
i
i
I
L
i
L
I i
i (
i L L
L i
L I L
i
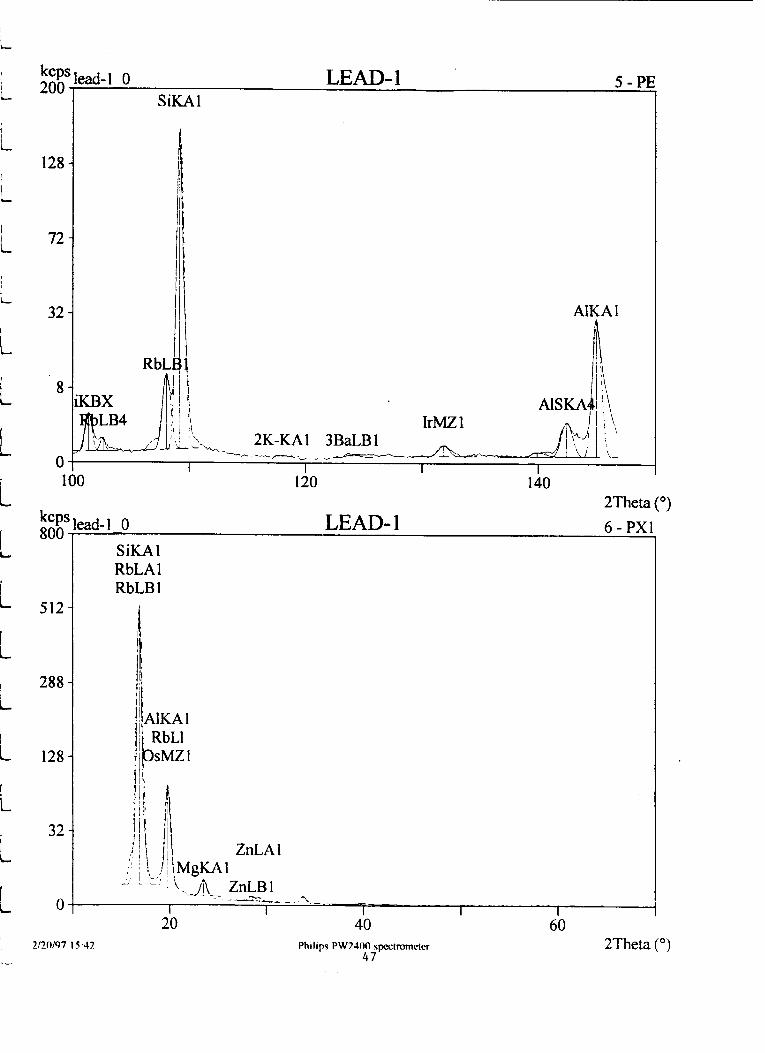
200 k~~sleaci-l o LEAD- 1 5 - PI SiKAl
2Theta (") lead-1 0 LEAD- 1 6 - PXI
RbLAl RbLB 1
512
288
128
32
0
. _ Philips PWZ1OMl spcctmmcter 2Theta (")
47

Sample identification lead1 14-mar-1997 10:43
' 2500 L
L ounts]
L L
L i L
1 L L L L i 1
I L
1 L
I
1600
900
400
100
0 . 0 I I
0 20 40 I
60 I I I
80 1 0 0 120 [;
LDI . SD LEAD1 . DI

le: C:\AXE\DATA\LEADl.DI 14-mar-1997 1 0 : 4 6 ~
'-;lips Analytical PC-APD, Diffraction software
68 .235 73 .450 75 .620 !- 77.635
81 .445
92 .780 95 .010 96 .240 i 98.745
102 .450 104.105 L 106.585 114 .475 118.390 L L20.280
I i
L L L L L
1 . 3 7 3 3 1 1 .28815 1 .25648 1 . 2 2 8 8 3 1 .20034 1 .18442 1 .18070 1 .15329 1 .08172 1 .06385 1 .04468 1 .03457 1 .01492 0 .98803 0.97680 0 .96081 0.91600 0 .89681 0 .88819
1 . 3 7 6 7 3 1 .29135 1 . 2 5 9 6 1 1 .23188 1 .20333 1 .18736 1 . 1 8 3 6 3 1 .15616 1 . 0 8 4 4 1 1 .06649 1 .04728 1 .03714 1 .01744 0 .99049 0 .97923 0 .96320 0 .91827 0.89904 0.89040
0 .250 0 .150 0 .200 0 .150 0 .150 0 .150 0 .150 0.150 0 . I 5 0 0.300 0 .800 0 .150 0 .150 0.800 0 .500 0 . :I50 0.1150 0.:300 0.600
69 28 30 49 36 36 6 1 25 36 11 1 4 27 1 7 11
7 22 35 1 2
5
1 0 7 7 6 5 5 5 6 4 4 4 4 4 4 5 5 6 5 5
2 . 9 1 . 2 1 . 3 2 . 0 1 . 5 1 .5 2 . 5 1 . 0 1 . 5 0 . 5 0 . 6 1.1 0 . 7 0 . 5 0 . 3 0 . 9 1 . 4 0 . 5 0 . 2
1 . 7 2 1 . 0 4 1 . 7 4 0 . 9 1 0 . 9 2 1 . 4 9 1 . 0 2 1 . 1 0 1 . 7 0 0 . 8 0 1 . 7 6 1 . 7 6 1 . 0 7 1 . 5 3 0 . 7 6 0 . 9 0 1.10 1.15 0 . 9 3
L 49
i

i
L L L i i 1 L L L L L L L L 1 I L I
L-
NAME
1. QuartzLow
d Qm S Y ~
Osbornite, Syn
Chromium Titanium Hydri
Titanium Oxide
Iron Carbide
Despujolsite
Wuelfingite, Syn
Barium Zinc Phosphate
Potassium Barium Chromic
Auglesite, Syn
Lithium Titanium Phosphate
Calcium Zirconium Oxide
Gismondite
Sanidine, disordered
Anorthite, ordered
Lead Styphnate (basic)
Sodium Zinc Cyanide
Calcium Mangauese Oxide
Biotite- 1 \ 1 TM\RG,Ferri
Giniite
Lead Phosphate
/
50
FORMULA
5i02
5i02
TiN
Cr1.8TiH5.3
t102
Fe3C
Ca3Mn(S04)2(OH)6,3H20
Zn(OH);!
BaZn(P04)2
K2B a( CrO4)2
pb504
LiTi2(P04)3
Ca6Zr 19044
(Ca,K2) A12Si208.4H20
K(Si3A1)08
C aA12 S i208
C 12H1 ON603 1Pb 13
NaZn( CN)4
Ca2Mn308
K(Mg,Fe)3(Si3Al)O 1 o(OH,F)2
FeFe4(P04)(OH)2.2H20
Pb3(P04)2

RESULTS I11
51

L..
i i i L
L L
L I L
THE DEVELOPMENT OF DURABLE ASPHALT PAVEMENTS
USING FISHING NETS AS REINFORCEMENT
by
Frank Spadafora
ENE 700B - 208
A Master's Project
Submitted to Dr. Mohamed E. Labib
November 17,1994
52
I L i
I L
I
i, 1 L
L 1 t t I
L
1 i L L
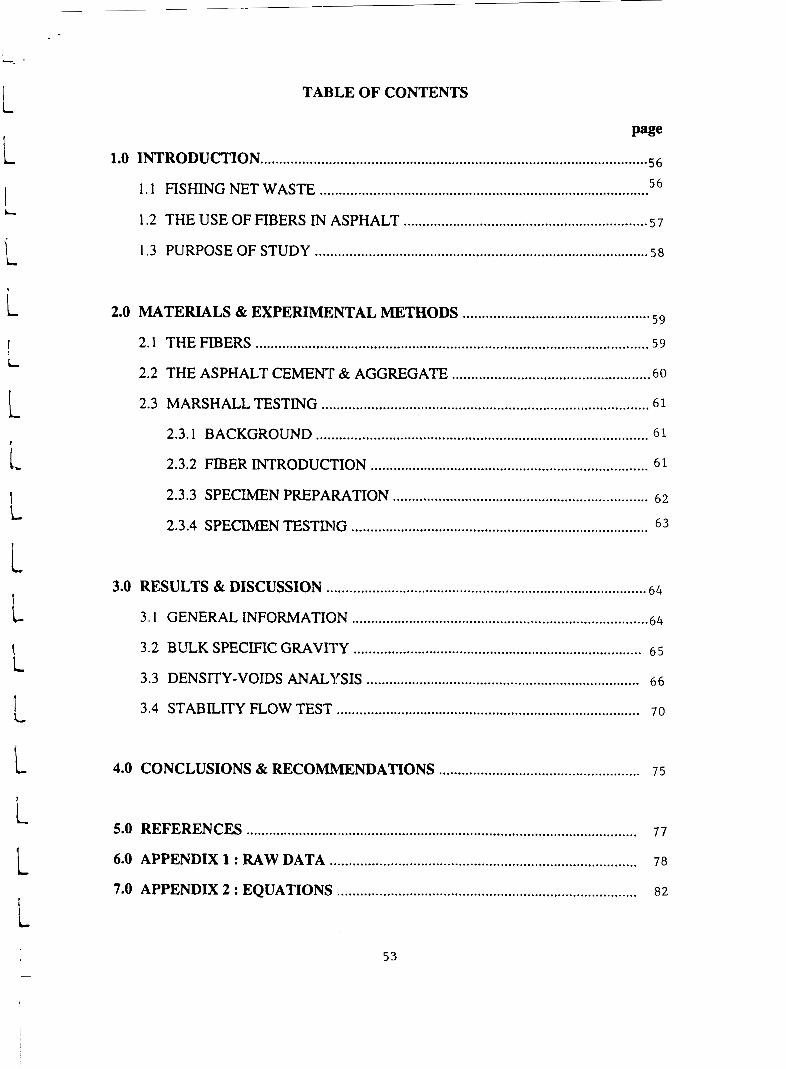
TABLE OF CONTENTS
Page
56 ..................................................................................................... 1.0 INTRODUCTION 56 1 . 1 FISHING NET WASTE ......................................................................................
1.2 THE USE OF FIBERS IN ASPHALT ................................................................ 5 7
1.3 PURPOSE OF STUDY ....................................................................................... 58
................................................. 59
2.1 THE FIBERS ........................................................................................................ 5.9
2.0 MATERIALS dQ EXPERIMENTAL METHODS
2.2 THE ASPHALT CEMENT & AGGREGATE .................................................... 60
2.3 MARSHALL TESTING ...................................................................................... 61
2.3.1 BACKGROUND ....................................................................................... 61
2.3.2 FIBER INTRODUCTION ......................................................................... 61
2.3.3 SPECIMEN PREPARATION 6 2 ................................................................... 2.3.4 SPECIMEN TESTING .............................................................................. 63
3.0 RESULTS & DISCUSSION .................................................................................... 64
3 . I GENERAL INFORMATION .............................................................................. 64
3.2 BULK SPECIFIC GRAVRY 6 5 ............................................................................ 3.3 DENSITY-VOIDS ANALYSIS ........................................................................ 66
3.4 STABILITY FLOW TEST ................................................................................ 7 0
4.0 CONCLUSIONS & RECOMMENDATIONS ..................................................... 7 5
5.0 REFERENCES ....................................................................................................... 7 7
78
82
6.0 APPENDIX 1 : RAW DATA ..................................................................................
7.0 APPENDIX 2 : EQUATIONS ...............................................................................
53

L
\ i
i
i 1
i
I
i.
I L
LIST OF FIGURES
Page
AIR VOID 96 vs. FIBER 9% ...................................................................................... 67 1
2 VMA % vs. FIBER % ............................................................................................... 69
3 FLOW vs. FIBER % .................................................................................................. 7 1
4 STABILITY vs. FDBER % ......................................................................................... 7 3
I L
I
, I L
c 1
L
5 4

I
i LIST OF TABLES
Page 1 SIEVE ANALYSIS OF AGGliEGATE ..................................................................... 60
2 DENSITY & BULK SPECIFIC GRAVITY ............................................................. 65
i .......................................................................................... 68
3 AIR VOID % & VMA 9%
4 MARSHALL FLOW & STABILITY ....................................................................... 74
i.
L
L
I
!
- 55

1
i
1 L
I
I L
I
L I
i
1.0 INTRODUCTION
1 . 1 FISHING NET WASTE
Discarded fishing nets and ropes remain to be a major marine pollutant problem.
Fishing nets discarded at sea entangle and kill marine mammals, birds and fish, disable
ships, and aesthetically degrade beiiches. Worldwide it is estimated that 287 million
pounds of netting are discarded annually, and at least 2 million pounds in the United
States alone. Concerns for the growing use and disposal of plastic items at sea led to the
implementation of Annex V of MARPOL at the end of 1988. This treaty and resultant US
law prohibited the disposal of any plastic item at sea and mandated that these items be
brought ashore for disposall.
Although these restrictions have substantially reduced the problem of marine debris
and the associated environmental hiuards, another severe problem has resulted: the land
based disposal of used and obsolete fishing nets. The fishing net industry currently
disposes of their unwanted fishing gear in landfills or stock it in storage area. A limited
amount of nylon gill netting is baled and shipped overseas for reprocessing. In other
instances some materials are incinerated. However, problems have been experienced due
to the insufficient capacity of the landfills and the air pollution associated with
incinerators.
Many efforts have been made to resolve these problems. One study demonstrated
that fishing nets and ropes could be melt recycled. However, from an economic
standpoint, considerable questions remain due to the high costs of sorting , cleaning, and
preparing for the melting process. In other work it was found that it may be possible to
use degradable polymer material in fishing nets and other fishing gear2. This could
partially alleviate the burden of fishing net wastes in the future, but research in this field
is still in its infancy.
56

L
i L
1 L
1
i
1.2 THE USE OF FIBERS IN ASPHALT
Legislation has been enacted by several states in recent years to either mandate the
usage of some waste materials, such as fishing gear, or to examine the feasibility of such
usage. About 450 million megagrams of hot mix asphalt (HMA) is produced in the
United States alone at a cost of about $12 billion. The HMA industry has been pressured
in recent years to incorporate a wide range of waste materials into hot mix asphalt
pavemend.
The deterioration of asphalt concrete pavements due to loading stresses and
environmental exposure has warranted the development of new methods for improving
pavement properties and extending pavement life. Some investigators have found the
most practical way this can be achieved is by incorporating fibers into asphalt, thus
forming a composite. The impact of fiber reinforced asphalt has been recognized for
several years. Earlier, and now abandoned, technology was based on using asbestos fibers
as reinforcement to make airport ruiiway pavement with high performance4. Another
study, Polyester Fibers In Asphalt Paving Mixtures, prepared by Clemson University,
showed that the addition of virgin polyester fibers into asphalt significantly improved
pavement properties. In addition, eight more studies conducted by the Departments of
Transportation of Delaware and Oregon showed that adding fibers to asphalt mixes
improved pavement performance. The research indicates that the fiber reinforced asphalt
is superior to conventional mixes for : overlays (maintenance), bridge membranes, and
composite and multi-course asphalt applicationss.
I i
L 1
L
57

i ,
L
L
1.3 PURPOSE OF STUDY
With the need to recycle fishing nets and the knowledge that fibers may improve
asphalt pavement properties, we performed a study to test the development of durable
pavement materials using shredded fishing nets as a source for reinforcing fibers. The
novel product would be ideal for use in the transportation sector near disposal centers for
fishing nets. The product would solve the problem of marine waste disposal while
potentially extending the life and improving the properties of asphalt pavements.
The purpose of this limited study was to determine how different types and amounts
of fishing net fibers affect the charalcteristics of asphalt pavement. The study also allowed
for the identification of many important engineering concerns which must be addressed in
future, and more extensive, studies in this area. This report is an overview of the study
which was conducted.
L I
L
L L
L L
58

i
L
L
L
i
L
1
2.0 MATERIALS & EXPERIMENTAL METHODS
2.1 THEFIBERS
Two types of fibers were obtained from the New Jersey Marine Science Consortium
in Fort Hancock, New Jersey: a moriofiliment gill net and a trawl net. The nets were
shredded using a shredding machine: and the resulting fibers had the following
c harac tens tics:
The trawl net is made of a red nylon material. The shredded fibers are curly and
range from 1/4" to 1" in length. Original intact net is made up of three strands spiraled
together to make up a single strand of about 1/16" in diameter. Each of the three strands is
made up of about 300 individual fibers each. These single fibers are very fine, less than
1/100" in diameter. Shredded fibers are present in all possible stages, from single fibers to
fully intact strands some even maintaining the knots present in the original netting. The
nylon fibers tend to be strong and tough with very high tensile strengths (50,000 psi).
Nylon has a melting point of 250°C and the fibers tend to absorb some of the asphalt
cement.
The monofiliment trawl net is :made of a polypropylene material. The shredded
fibers are straight and range from 1/41" to 1" in length. The fibers are present in bunches of
one to four and are each about 1/64" (0.5 mm) in diameter. The fibers are of one color
each, with each being one of the following colors: green, blue, orange, red, brown, or
clear. Polypropylene rope fibers also have high tensile strengths (59,000 psi). They have
a softening point of 150°C and will not absorb asphalt cement.
Knots still intact in either of the nets are considerably strong and will pose no
physical problems. Minor contaminants and mixed coloration of these waste materials
pose difficulties for many potential applications but show no significant adverse effects
on the quality of fiber reinforced asphalt. Therefore, it is not necessary to sort or wash the
nets prior to their use.
59

I
1.
SIEVE % ACCEPTABLE %
# PASSING RANGE
314" 98.88 97- 100
318" 75.98 60 - 90
##4 53.84 50 - 79
#I0 41.58 36 - 67
#40 21.15 17-44
#70 9.53 9 - 29
#200 4.0 3 - 8 J
1
i L.
I L.
2.2 THE ASPHALT CEMENT t9r AGGREGATE
The binder used in the preparation of test specimens throughout the experiment was
AC-20 asphalt cement. Through previous testing (ASTM D 70) the specific gravity of the
asphalt cement was determined to I>e 1.029 . The amount of asphalt used in each test
specimen was kept constant at 7% by weight of total aggregate.
The aggregate mixture used was made up of 83.3 95 crushed rock and 16.7% sand.
The gradation was chosen to meet I~STM standard specifications. A sieve analysis of the
gradation was performed (ASTM C: 136) to verify this. The results of this analysis are
presented in TABLE 1. The gradation will remain constant for this limited experiment to
allow for easy comparison of the results. Through previous testing (ASTM C 127/128)
the average bulk specific gravity of the total aggregate was determined to be 2.80.
L.
TABLE 1
SIEVE ANALYSIS OF AGGREGATE
I
L.
1 L.
L.
60

: I L.
L.
i.
I I L.
I
L.
L.
L.
2.3.0 MARSHALL TESTING
2.3.1 BACKGROUND
A number of different methods have been developed for the design and testing of
hot mix asphalt paving mixtures. Two of these methods, the Marshall and the Hveen, are
the most commonly used and have been successful for a number of years. Although each
method has its merits, the Marshall is the most versatile and has become the most widely
used in the United States for highway type pavements. The two principal features of the
Marshall test are a density-voids analysis and a stability-flow test of compacted test
specimens. The American Society of Testing Materials has adopted the standardized
Marshall method as test number ASTM D 1559 : Resistance of Plastic Flow of
Bituminous Mixtures Using Marsh!ll Apparatus.
2.3.2 FBER INTRODUCTION
The process of fiber introduction into the mixture is not specified by ASTM and is
of great importance. There are two potential method for the introduction of the fibers: the
wet process and the dry process. The wet process blends the fibers with the asphalt
cement prior to incorporating the binder into the mixture. The dry process mixes the fiber
with the aggregate before the addition of he asphalt cement. For this limited study the dry
process was chosen as the singular rnethod for a number of reasons. Experimentally the
dry process is the easiest to perform and allows for the best fiber distribution in the mix.
Also, because the fibers used do not melt in the asphalt cement there are no apparent
special benefits to the wet process. In addition, the field work done on fiber reinforced
asphalt has generally used the dry process6,7, possibly due to the production problems of
introducing the fibers directly into thle asphalt cement. Another reason for using the dry
process is that it minimizes the major problem of clumping or balling together of fibers in
the mix.
6 1

L
I L
I
L
I I
I I L
I
I
I I L
I L
1 i I
L
For fiber reinforced asphalt to be used extensively an effective method for the
introduction of fibers must be found. This problem has plagued much of the previous
work using fibers in asphalt pavements. Fibers and fiber clumps attract asphalt cement
faster than the aggregates. The result is frequent clumping of the fibers and inadequate
aggregate coating. These clumps of fibers reduce the strength of the material and may
also mar the surface of the finished pavement. Early research specified longer mix times
to remedy the problem. But over mixing tends to cause aggregate separation. Such a mix
has low stability qualities because the interlocking friction between the aggregates does
not reach its full potential. Studies have been undertaken to remedy this problem, usually
involving a separate feed for the introduction of the fibers simultaneously with the
aggregate6.7.
2.3.3 SPECIMEN PREPARATION
The first step in the preparaticln of specimens is the introduction of the fibers. As
previously discussed the fibers are added directly to the dry aggregate. The pre weighed
fibers are added to the pre weighed aggregate and mixed thoroughly. The mixing is
continued until the fibers are evenly distributed throughout the mixture.
The next step is the heating of the materials. The aggregate-fiber mixture is heated
in an oven at 150°C. The asphalt cement was heated in a heating bowl at a temperature
of about 200°C . The materials are heated for at least one hour before being used. The
asphalt is then added to the heated aggregate-fiber mixture and mixed vigorously until a
well coated homogeneous mixture results.
The entire batch is then placed in a preheated (150°C) compaction mold. This mold
consists of a base plate, a forming mold, and a collar extension secured to a compaction
pedestal. The mold cylinders are 4 inches in diameter by three inches in height. After the
mixture is spaded vigorously in the mold it is ready for compaction. The compaction
hammer consists of a flat, circular tamping face and a 10 pound sliding weight with a free
62

i
L 1 L I
i
fall of 18 inches. 75 blows are applied to each side of the specimen. The specimen is then
allowed to cool at least one hour in the mold before being removed from the mold with an
extrusion jack. After sitting overnight the specimens are then ready to be tested.
2.3.4 SPECIMEN TESTING
First the height and the weight of the samples are recorded. The bulk specific
gravity is then determined according, to the designation ASTM D 1 188 : Bulk Specific
Gravity of Compacted Bituminous Mixtures Using Paraffin Coated Specimens. In this
procedure the specimen is coated with wax, re weighed, and then suspended in water in
order to determine its volume. Using this data the bulk specific gravity of each specimen
can be calculated and a density-voids analysis can be performed.
After the determination of the 'bulk specific gravity the stability and flow tests are
performed. The testing apparatus consists of a compression testing device fitted with a
breaking head. The breaking head consists of an upper and a lower cylindrical segment
each having an inside radius of curvature of 2 inches. The testing device is equipped with
load and deformation indicating devices which are recorded by computer.
Each cooled specimen is then immersed in a water bath at 60°C for 30 minutes
prior to testing. The specimen is then removed and immediately placed in the lower
segment of the breaking head. The upper segment is placed on top of the specimen and
the complete assembly is put into place on the testing machine. A load is then applied to
the specimen by means of a constant rate of movement of 2 inches per minute applied by
the testing machine head until the maximum load is reached. The stability and flow for
each specimen is recorded by computer throughout the test.
6 3
L-.
I I
I L.
i I
i.
L 1 L
L i L
I
L
1.
3.0 RESULTS & DISCUSSION
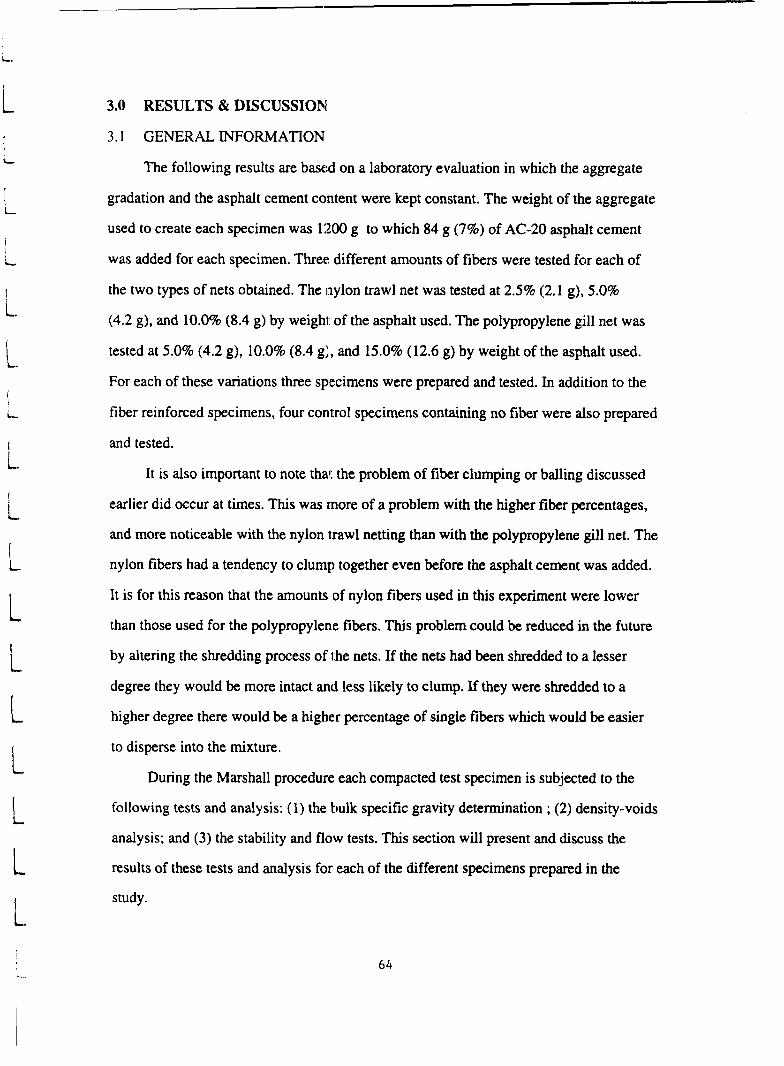
3.1 GENERAL INFORMATION
The following results are based on a laboratory evaluation in which the aggregate
gradation and the asphalt cement content were kept constant. The weight of the aggregate
used to create each specimen was 1200 g to which 84 g (7%) of AC-20 asphalt cement
was added for each specimen. Three different amounts of fibers were tested for each of
the two types of nets obtained. The nylon trawl net was tested at 2.5% (2.1 g), 5.0%
(4.2 g), and 10.0% (8.4 g) by weight of the asphalt used. The polypropylene gill net was
tested at 5.0% (4.2 g), 10.0% (8.4 g)l, and 15.0% (12.6 g) by weight of the asphalt used.
For each of these variations three specimens were prepared and tested. In addition to the
fiber reinforced specimens, four control specimens containing no fiber were also prepared
and tested.
It is also important to note that the problem of fiber clumping or balling discussed
earlier did occur at times. This was more of a problem with the higher fiber percentages,
and more noticeable with the nylon trawl netting than with the polypropylene gill net. The
nylon fibers had a tendency to clump together even before the asphalt cement was added.
It is for this reason that the amounts of nylon fibers used in this experiment were lower
than those used for the polypropylene fibers. This problem could be reduced in the future
by altering the shredding process of the nets. If the nets had been shredded to a lesser
degree they would be more intact anti less likely to clump. If they were shredded to a
higher degree there would be a higher percentage of single fibers which would be easier
to disperse into the mixture.
During the Marshall procedure each compacted test specimen is subjected to the
following tests and analysis: (1) the bulk specific gravity determination ; (2) density-voids
analysis; and (3) the stability and flow tests. This section will present and discuss the
results of these tests and analysis for each of the different specimens prepared in the
study.
64
1 L.
BULK SPECIFIC
GRAVITY
2.497
2.47 8
2.44'9
2.40.5
2.47:3
2.455
2.420 I
DENSITY THEORETICAL
BULK S. G. (PCf)
2.5 17 155.40
2.517 154.60
2.517 152.79
2.5 18 150.09
2.517 154.32
2.5 18 153.17
2.5 19 151.04 L
1 L I I L
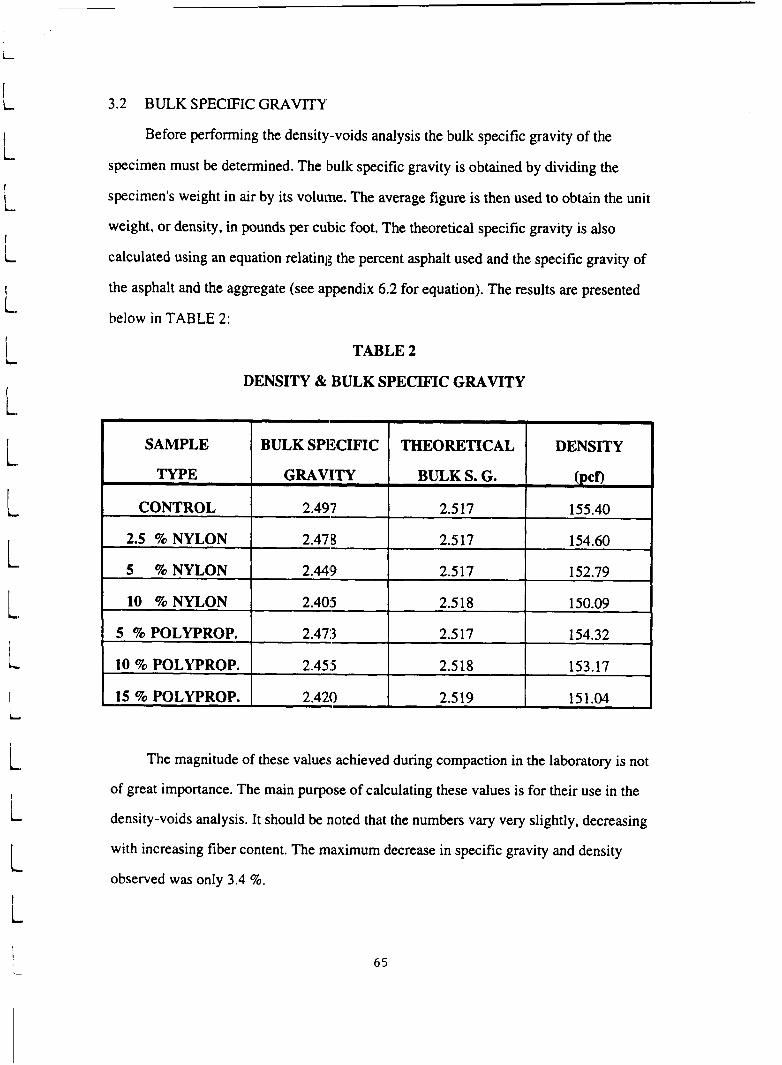
3.2 BULK SPECIFIC GRAVITY
Before performing the density-voids analysis the bulk specific gravity of the
specimen must be determined. The bulk specific gravity is obtained by dividing the
specimen's weight in air by its voluine. The average figure is then used to obtain the unit
weight, or density, in pounds per cubic foot. The theoretical specific gravity is also
calculated using an equation relating the percent asphalt used and the specific gravity of
the asphalt and the aggregate (see appendix 6.2 for equation). The results are presented
below in TABLE 2:
TABLE 2
DENSITY & BULK SPECIFIC GRAVITY
SAMPLE
TYPE
CONTROL
2.5 %NYLON
5 %NYLON
10 %NYLON
5 %POLYPROP.
10 % POLYPROP.
15 % POLYPROP.
The magnitude of these values achieved during compaction in the laboratory is not
of great importance. The main purpose of calculating these values is for their use in the
density-voids analysis. It should be noted that the numbers vary very slightly, decreasing
with increasing fiber content. The maximum decrease in specific gravity and density
observed was only 3.4 %.
65

1 L
1 I t i I 1. 1 I
i
I I L
3.3.0 DENSITY-VOIDS ANALYSIIS
Two properties of the compacted specimen are determined in the density-voids
analysis: the percent voids in the mineral aggregate and the air voids percent in the total
mix. The air voids percentage represents the value obtained by dividing the bulk specific
gravity of the specimen by the theoretical specific gravity, multiplying by 100 and then
subtracting from 100 (see appendix 6.2 for equation)g.
The air void % in a compacted specimen is suggested by most agencies to be
between 3 and 5 % . Low air void R? is important in order to minimize the aging of the
asphalt cement films within the aggiregate mass and also minimize the possibility that
water can get into the mix, penetrate the thin asphalt cement film, and strip the asphalt
cement off the aggregate$. As shown by the bar graph (FIGURE 1) the air void 9i of the
specimens prepared are close to the specified range. For the most part the values seem
slightly low. This could be caused by the fact that the amount of asphalt cement absorbed
by the fibers and the aggregate could not be taken into account.
In general the air void 9i increased with increasing fiber content for both the nylon
and polypropylene fibers. The value,s are presented in TABLE 3 at the end of this section.
In both cases the air voids % of specimens with fibers is substantially higher than the
control value. It is also important to note that the air void 9% for the nylon reinforced
specimens were about one and a half times greater than the air void % for the
polypropylene reinforced specimens. This could be due to the tendency of the nylon fibers
to clump together and the lower density of the nylon fibers. Overall these results were as
expected. The values are close enough to the suggested range to be acceptable and further
optimization of the mix design could easily bring the value within the specified limits.
The percent voids in the mineral aggregate (VMA) represents that volume of the
compacted specimen which is not occupied by aggregate and absorbed asphalt. This value
is calculated using an equation which relates the bulk specific gravity of the specimen, the
specific gravity of the aggregate, and the percent of asphalt cement used (see appendix
66

FIGURE 1 : AIR VOID % vs FIBER %
4.5 I 4.49
1 . . . . . . . . . . .
. . . . . . . . . . . . .
. . . . . . . . . . . . .
. . . . . 2'.74- - - - - -
IPOLYPROP I 4 1 3.92 . . . . . . . . . . . . .
I NYLON I 3.5 $ n 0 > U
3 a- - 2.5
2 . - - _ .
1.57
1.5 a CONTROL: 1.046
- 1 0.5 0 t
2.5 5 10 15 FIBER % (by wt. of asphalt)

I
SAMPLE
CONTROL
2.5 % NYLON
5 %NYLON
10 %NYLON
5 %POLYPROP.
10 % POLYPROP.
15 % POLYPROP.
I I
AIRVOID % VMA %
1.046 16.878
1.570 17.296
2.737 18.253
4.49 1 19.683
1.764 17.436
2.53 1 18.035
3.916 19.155
L
I I
I L
6.2 for equation). This total amount of voids significantly affects the performance of a
mixture because if the VMA is to small, the mix may suffer durability problems, and if
the V M A is to large, the mix may slhow stability problems and be economical to produce.
The VMA should be sufficient to allow for thermal expansion of the asphalt and
aggregate under summer temperatures without a loss in stability, yet low enough to keep
out harmful air and moisture which could effect the durability of the pavements.
The recommended minimum V M A for the aggregate gradation used in this study has
been proposed by the Asphalt Institute to be approximately 14% . As shown in the bar
graph (FIGURE 2) and in TABLE 3 the values of V M A for all specimens prepared were
above the minimum recommended V M A % and well within the normally acceptable
range of VMA values. In general the V M A increased with increasing fiber content for
both types of nets. In all cases the V M A was higher in the fiber reinforced specimens than
in the control specimens. The V M A values were also higher for the specimens with the
nylon netting compared with those containing the polypropylene fibers. Overall These
values were very acceptable. In all cases the V M A was close enough to the recommended
value that no adverse effects would be expected.
TABLE 3
AIR ‘VOID % & VMA %
6 8

r- r- I I r- r- r-- r-- r. I !-- ! - - - - - - ! - - I
0 &-
a s >
20 19.5
19 18.5
i 8 17.5
17 16.5
16 15.5
15
FIGURE 2 : VMA Yo vs FIBER Yo
i--- 19.68
. .
. . .
-1 730 -
. . . . . . . .
. . - - . .
18.25 . . _ _
. . . . .
19.15 POLYPROP
NYLON
CONTROL : 16.878
2.5 5 10 15 FIBER Yo (by wt. of asphalt)

L.
1 L.
i L
I I
L
i i
3.4 STABLLITY FLOW TEST
Two of the most important physical properties of the specimens are determined
during the actual Marshall test: the flow and the stability. The flow value represents the
total vertical deformation or strain occurring in the specimen between no load and
maximum load during the stability test in hundredths of an inch. High flow values usually
indicate a mix which will experience permanent deformation under traffic. Low flow
values indicate a mix with higher thian normal voids and insufficient asphalt for
durability. Mixtures with low flow values may experience premature cracking due to
mixture brittleness during the life of the pavements.
For Marshall designs subjected to 75-blows per side the maximum flow value is 168.
As shown in the bar graph (FIGURE: 3) and summarized in TABLE 4, the values of flow
for the specimens tested are well below this value. These values are also below the
minimum recommended flow value of 8 . Since the samples do not contain higher than
normal voids and have more than a sufficient amount of asphalt, it is expected that the
flow meter was not working correctly. Although there is a trend in the results, all of the
average values fell in the short range of 4 to 5 , As with all previous results the flow value
increased with increasing fiber content for both types of fibers. It is also important to
note that the flow values for both tyFcs of net were almost identical at the fiber contents
of 5% and 10%.
Overall the flow values for all specimens were very low. This is more likely due to
an error in the testing equipment than in the mix design. This must be studied much
closer because if the values are accurate, the mix designs must be altered to increase the
flow value. More importantly, it can be observed that the addition of fibers in the asphalt
pavement did not have any significant adverse effects on the flow characteristics of the
specimens.
The most important physical property measured in this study is the stability. The
Marshall stability represents the maximum load resistance in pounds that a standardized
70
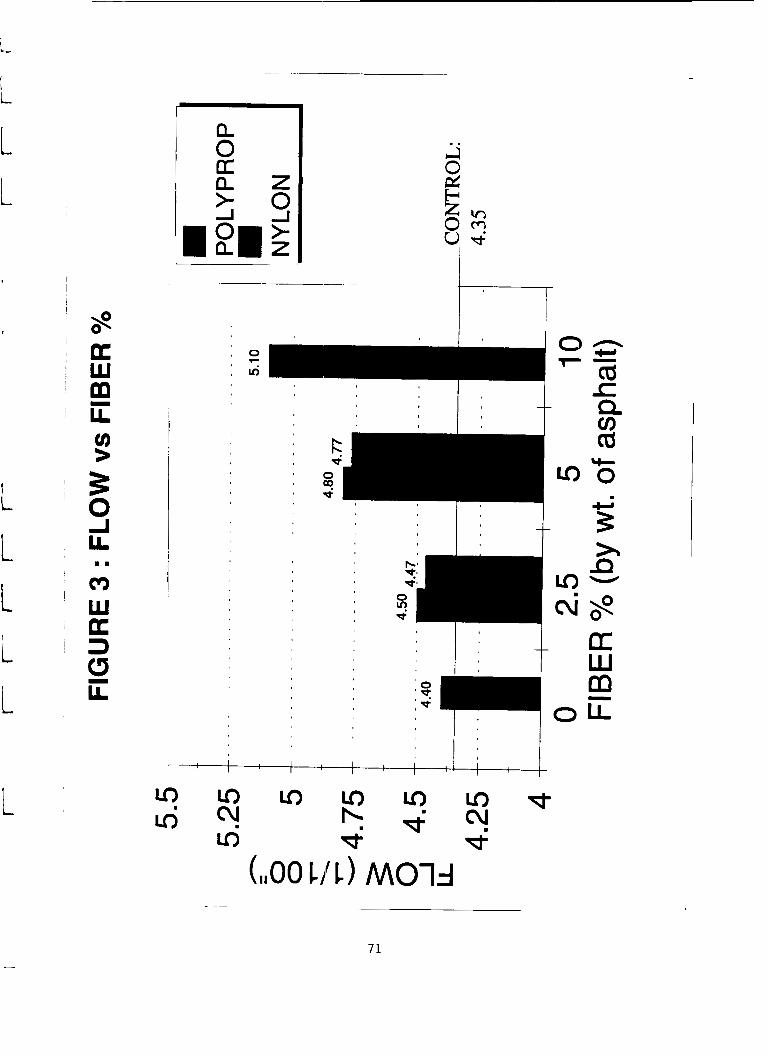
L
/ v ) >
0 I
: I : I --

L.
I I
L.
I t.
i. ,
I L. 1
1 L.
I
L.
i.
1. t.
specimen will develop at 60°C at a loading rate of 2 inches per minute. The stability
value is recorded by computer. Measured stability values for specimens which depart
from the standard thickness of 2.5 inches are converted to an equivalent value by means
of a conversion factor (see appendix 6.2 for calculations). The stability is the ability of the
asphalt paving mixture to resist deformation from imposed load$.
Stability is dependent upon both internal friction an cohesion. The cohesion varies
with the viscosity and amount of asphalt cement in the mixture. The internal friction is a
function of the frictional and interlocking resistance of the aggregate in the mixture.
Frictional resistance varies with the ,surface roughness and angularity of aggregate and the
area particle contact. It is therefore important to take a close look to see how the addition
of fibers to the mix affects the stability values.
The results of the stability test are presented in the bar graph (FIGURE 4) and
summarized in TABLE 4. The Marsliall design criteria for stability for a specimen
subjected to 75 compaction blows 011 each side is 1800 lbs. At or above this value the
pavement is suitable for use in high traffic areas. For none of the specimens was the
average stability below this value. The average corrected stability for the four control
specimens was 2088 lbs. For the nylon fibers at 2.5% the stability was only slightly
improved at 2097 lbs. As more nylon fibers were added the stability decreased slightly.
At %5 the stability was 1924 Ibs and at 10% was 1890 Ibs. The results for the nylon fibers
therefore only showed improvement for the smallest amount of fiber addition. This is
probably due to the affect of clumping of the fibers, which much more of a problem with
the nylon fibers. This problem can be: alleviated by finding a better way to disperse the
fibers homogeneously throughout the: mixture. In addition the mix design could be
optimized for each fiber percentage, allowing for the best possible stability. Taking into
account these problems the results were still encouraging. Even at the highest fiber
percentage, with an unoptimized mix design and a high degree of fiber clumping, the
decrease in stability was only 9.5%
72
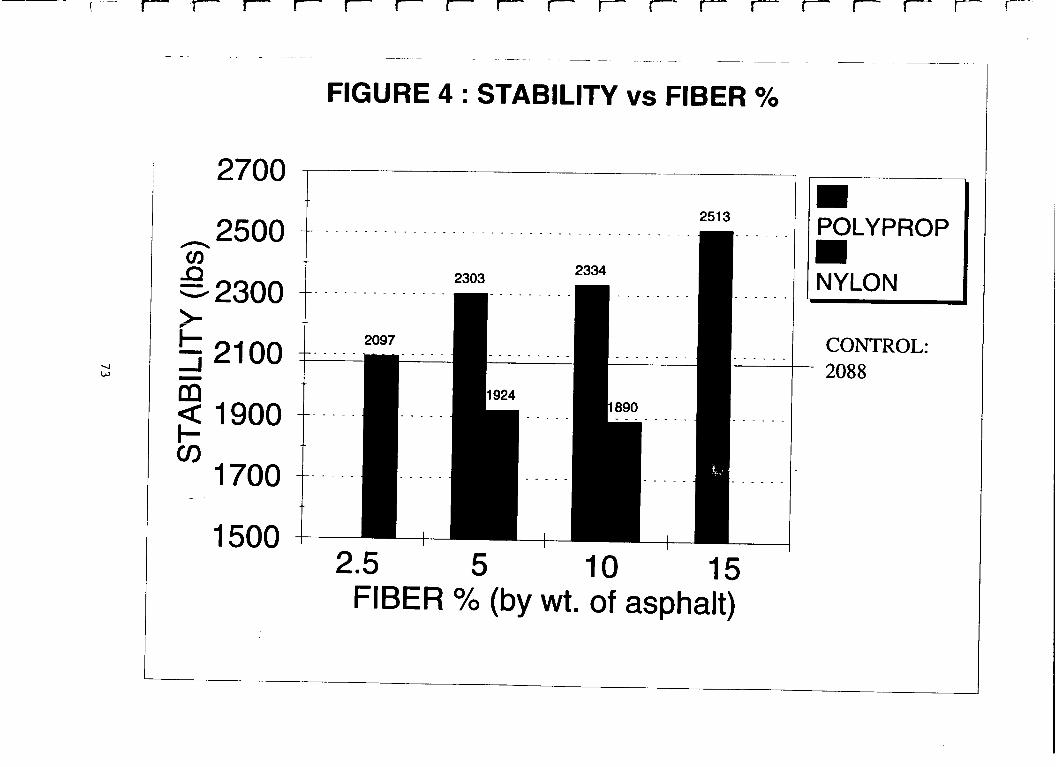
r- T- I r- r- r I r r- I I- I I I r- I- r--
FIGURE 4 : STABILITY vs FIBER %
2700
n 2500 cn 13 J 2300
21 00
1900
1700
1500
2513
_ _ . _
2097
- . . . . . . .
2303
- . . . . _
2334
2.5 5 10 15 FIBER % (by wt. of asphalt)
POLYPROP m NYLON
CONTROL: - 2088
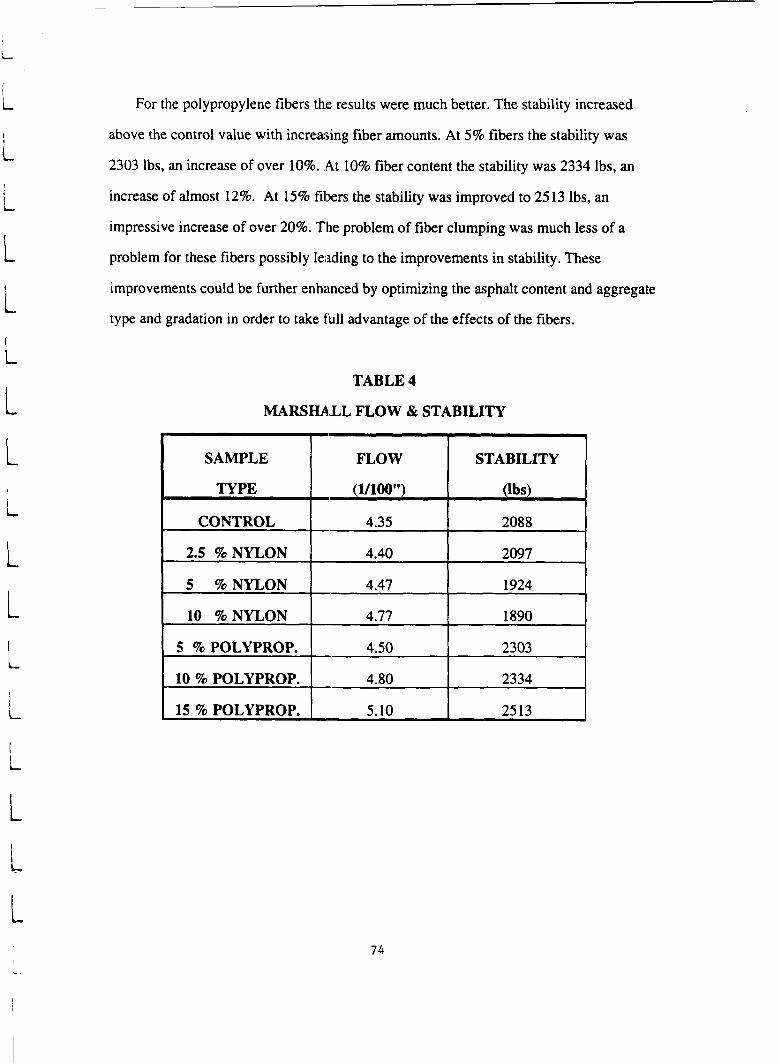
For the polypropylene fibers the results were much better. The stability increased
CONTROL
2.5 96 NYLON
5 %NYLON
10 %NYLON
5 %POLYPROP.
10 ?lo POLYPROP.
15 % POLYPROP.
L
4.35 2088
4.40 2097
4.47 1924
4.77 1890
4.50 2303
4.80 2334
5.10 25 13
L L
1
L
i i
above the control value with increasing fiber amounts. At 5% fibers the stability was
2303 Ibs, an increase of over 10%. .At 10% fiber content the stability was 2334 lbs, an
increase of almost 12%. At 15% fibers the stability was improved to 2513 lbs, an
impressive increase of over 20%. The problem of fiber clumping was much less of a
problem for these fibers possibly leading to the improvements in stability. These
improvements could be further enhanced by optimizing the asphalt content and aggregate
type and gradation in order to take full advantage of the effects of the fibers.
TABLE 4
MARSJULL FLOW & STABILITY
L
74

1
1
L
L
1
i
L
4.0 CONCLUSIONS & RECOMMENDATIONS
Overall the effects of the fibers on the properties of the specimens were acceptable.
For the density-voids analysis the fibers did not cause the values to exceed the suggested
range of values. For the stability results the nylon fibers caused some mixing problems
and led to a slight decrease in the stability for fiber amounts. The nylon fibers did not
adversely affect the stability enough to disregard its use in the mix at high values. On the
other hand, the polypropylene fibers were very successful at increasing the stability, and
even larger amounts of fiber asphalt could be considered.
The results of this study are therefore very promising. The polypropylene fibers
increased the stability significantly with no adverse affects on any of the other properties
measured. While the nylon fibers, although decreasing the stability slightly, also had no
significant adverse affects on any of the other properties. It can be concluded that the
positives are significant enough to justify the use of waste fishing nets in asphalt
pavement.
One reason that these preliminary results are impressive is that it should be possible
to improve them significantly through further research. By performing an extensive
Marshall mix design, the optimum asphalt cement content for each fiber type and each
fiber amount could be determined. In addition the aggregate gradation, aggregate type,
and size and state of the fibers could be altered so that the positive affects of the fibers on
the internal friction of the mixture could be optimized. The viscosity grade of the asphalt
could also be varied to determine its affects on the properties of a fiber reinforced asphalt
pavement.
Another important variation possible in the design of a fiber reinforced asphalt
pavement, as discussed earlier, is the process of adding the fibers to the mix. The point at
which the fibers are added to the mixture could significantly change the properties of the
pavement. This concept should be combined with lab and field research done on the use
of fiber reinforced asphalt pavements. Studies have been and are currently being
7 5 c

I I
L
L i
I I
I
conducted involving the improvement of the of the fiber addition process. Previous with
fiber reinforced pavements has been plagued by inherent mix problems that could raise
production costs and inhibit usage. Therefore the advantages and disadvantages of adding
the fibers to either the aggregate (dry process) or the asphalt cement (wet process) on a
large scale must be determined. Most of the successful work in this area involves a
separate feed to input the fibers simiiltaneously with the aggregate. Experimentally, this is
best represented by the dry process used in this study. The benefits, if any, of the wet
process should be determined so that the results may be compared.
In addition to extensive variations in the mix design, it would be advantageous to
study a wider range of properties of the specimens produced. Tests such as freeze-thaw
resistance, tensile strength testing, penetration testing, and creep testing (as a measure of
rut resistance), which were not availiible at this stage, should be performed. This will
allow for a greater understanding of ithe affects o fishing net fibers in asphalt pavements.
In conclusion, there is little debate that a need exists to effectively deal with the
problem of fishing net waste. With the recent push to incorporate waste materials in hot
mix asphalt, a possible solution has become apparent. An important consideration is the
affect of incorporating such a waste material on the quality and performance of the hat
mix asphalt pavement. Of course it would not be economically feasible to complicate the
production of asphalt pavements if the result was a pavement with a shorter life and
higher maintenance costs. The results of this study show that the addition of fishing net
waste fibers does not have any signifiicant adverse affects on the properties of asphalt
pavement specimens, and in many cases the fibers actually improve important properties.
It is therefore imperative that more extensive research be undertaken so that fibers
derived from fishing nets can begin to be incorporated into actual asphalt pavements.
L 76

5.0 REFERENCES \ L
i i
I
L
L
i
1 i L L L i L L 1 i L
I L
L.
Pearce, John B. "Marine Vessel Debris: A North American Perspective," Marine Pollution Bulletin, December, I 992.
Gonsalves, K.E. "Degradable Materials for the Marine Environment," Polymeric Materials Science & Engineering, Vol. 63.
Ciesielski, S.K. and Collins, R..I. "Current Nationwide Status of the Use of Waste Materials in Hot Mix Asphalt Mixtures and Pavements," Use of Waste Materials in Hot Mix Asphalt, ASTM STP 1 193.
Heiberg, A.J. "Asbestos Reinforced Pavevent for Runway Usage," Id. Eng. Chem., VOl. 43.
Kandhal, P.S. "Waste Materials in Hot Mix Asphalt: An Overview," Use of Waste Materials in Hot Mix Asphalt, ASTM STP 1 193.
Echols, J.B. "New Mix Method for Fiber-Reinforced Asphalt," Public Works, July, 1989.
Munn, W.D. "Fiber Reinforced Hot Mix Promises Improved Stability," Highway and Heavy Construction, September, 1989.
"The Asphalt Handbook," Asphalt Institute, MS-4, Lexington, KY, 1989.
7 7

L
t
L I 6.0 APPENDIX 1
RAW DATA
78

HOT MIX DESIGN DATA BY THE MARSHALL METHOD
NYLON FIBERS:
10.0-A 8.40 84.00 6.50 0.96 1226.70 1233.70 525.00 2.368 2.518 147.77
10.0-B 8.40 84.00 6.50 0.96 1250.90 1258.7Q 525.RQ 2.415 2.518 150.69
10.0-c 8.40 84.00 6.50 1.00 1247.20 1254.50 520.00 2.433 2.518 151.79
Gac:
Geff:
Air Void V.M.A. Stabilil
% % Meas.
1.96 17.624 1991.00
1.37 17.131 1938.00
1.38 17.133 2120.00
2.66 18.186 1792.00
:.:: I 20.920 2130.00 *-....--

HOT MIX DESIGN DATA BY THE MARSHALL METHOD
POLYPROPYLENE FIBERS:
2162.16 4.20
2219.36 4.40
2527.20 4.90
2428.40 4.50
~3207.871 5.20 1 - --

HOT MIX DESIGN DATA BY THE MARSHALL METHOD
CONTROLS:
I Geff: 2.80 I

7.0 APPENDIX 2 : EQUATIONS;
L
Nomenclature: %AC : percent of aspahlt by weight of mix SG : specific gravity Geff : specific gravity of aggregate Gac : specific gravity of asphalt cement VMA : voids in mined aggregate
L Eauations:
L L I I I,
L L I L
L 1
(1) %AC= wt. of amha It wt. of mix (asphalt + aggregate + fibers)
(2) BULKSG = L volume I- (wt. w/wax - dry wt.)
(3) THEORSG = L 1 - (%AIC/100) + f%AC/1001
Gef€ Gac
(4) AIRVOIDS % = 100- (1OOX 1 THEOR SG
(6) Adj. Stability = Stability >: Correction Factor
L L
82

RESULTS SET IV
8 3

TEST PROGRAM ON HOT ASPHALT MIXTURE WITH FIBERS USING; SUPERPAVE SCHEDULE
Department of Civil & Environmental Engineering New Jersey Institute of Technology
November 10, 1997
INTRODUCTION
IMPORTANCE OF USING SUPERPAVE LEVEL 3
STUDY SCHEME
EXPERIMENT WORK
84
INTRODUCTION
The research program of reinforcing the asphalt concrete pavement with plastic fibers consist of two parts of test process.
PART 1. Marshall Test:
A traditional empirical test method for HAM design, being performed at NJIT.
PART 2. SUPERPAVE LEVEL 3:
It is a test method to determine some fundamental properties using specimens that have undergone specific preconditioning.
Two new, sophisticated pieces of laboratory equipment-Repetitive Simple Shear Tester (RSST) and Indirect Tension Tester (IDTT) will be used to measure specific engineering properties of the laboratory compacted asphalt mix.
Performance is predicted on the basis of statistical correlation between laboratory results obtained under a given set of conditions and field observations.
Asphalt content can be selected based on desired pavement performance in fatigue and permanent deformaiion.
This is achievable with the current state of knowledge and is basically the approach proposed by some other researches.
It is the main part of the whole experiment program.
IMPORTANCE OF USING SUPERPAVE LEVEL 3
Comparing with other test metlnods, the importance to use Superpave Level 3 is obvious.
85

From Marshall Test, values of Marshall stability and flow are recorded. Since it is an empirical test method, it is difficult to establish the relationships between the records and some important fundamental properties, such as resistance to fatigue cracking, rutting and low- temperature cracking. Actual1 y there are no such correlation available now.
For Superpave Level 1, specimens are fabricated under a given set of conditions to determine their volumetric characteristics. Asphalt content is based on compactability data. There are no methods to predict the fundamental performance properties.
For Level 2, it is basically the concept followed by the Marshall test. Limits are set on those variables based on prior experience. Asphalt content is based on limits, ranges, or extreme values of the variables evaluated. Still fundamental performance properties are not available here.
For Level 4, it consists of the determination of fundamental properties of the mix (and /or components) and evolution of those properties with time, aging, strain and tress levels and moisture. Predication of behavior is made through an elaborate set of computer simulations. This approach is beyond the current state of knowledge. Asphalt content would be selected based on predicted pavement performance, which would be very close to actual periormance.
In a word, Superpave Level 3 is the only method available to predict how well HAM will perform in the field based on some fundamental properties.
STUDY SCHEME
1. A typical phase of pavement section would be selected to design for this study. Design requirement, supposed information of all the engineering conditions (traffic loading, geotechnical condition and climate data) would be determined with the help of NJDOT.
86

2. For comparison, both HAM with and without fibers will be designed in parallel for the different pavement section under the same design perquisite conditions.
3 . RSST will be running to evaluate the rutting propensity of the mixes, such as the No. of cycles that :yields maximum allowable shear strain under the preconditioning requirement of design.
4. IDTT will be performed to get the important mechanical engineering parameters, such as time & temperature dependent stiffness and failure limits at low in-service temperatures.
5. Analysis the test results of RSST to predict fatigue resistance property for each pavement.
6. Applying the results from 1:DTT to the strength analysis of the pavement sections, to see if the low temperature failure would be happened.
7. Conclusion.
EXPERIMENT WORK
Selection of Nylon Fibers:
The ultimate objective of the research is to specify using recycled plastic fibers for HAM blending. In this phase, we are going to try nylon fibers and start with virgin fibers. Two kind of monofil nylon fiber would be used for choice, 20 dpf and 45 dpf , which are supplied by Dupont.
Specimen Variable Factors:
The factors on fiber’s length, diameter, blending stiffness, curling shape influence, physical and chemical surface treatment would be investigated in the study.

Preliminary test on bonding properties between fiber and binder/HAM would be carried on to determine the selection of the length of fiber.
Procedure to Evaluate the Rutting Propensity of a Mix:
(1). Determine the number of 13SALs for the design life; (2). Select the maximum allowable rut depth; (3). Determine mean highest 5'-day pavement temperature on site at a depth of top layer. (4). Execute RSST at constant height (CH) at the ESALs and the temperature; ( 5 ) . Determine the number of cycles in RSST that yields maximum allowable shear strain, giving the relationship between shear strain and the number of cycles obtained from RSST.
Scope of Indirect Tension Test:
( 1 ). Determine temperature dlependent elastic modules suitable for linear elastic layer analysis of the asphalt concrete layer;
(2). Determine time and temperature dependent stiffness suitable for linear viscoelastic or pseudo-viscoelastic analysis of thermal response of the asphalt concrete layer.
(3). Determine time and temperature dependent failure limits at low in- service temperatures(stress, str8ain, energy).
Other Preparations:
Since the testers are not established in NJIT, a test center must be chosen for the study program. Work shop training for using these testers are needed.
88


![Behavior of Low Grade Steel Fiber Reinforced Concrete Made ...2 AdvancesinCivilEngineering the use of metal waste recycled fibers as reinforcements [14–16] and the use of recycled](https://img.dokumen.tips/doc/110x75/60a5f249716e3e345543e77d/behavior-of-low-grade-steel-fiber-reinforced-concrete-made-2-advancesincivilengineering.jpg)


