Embed Size (px)
Citation preview

Recurrence quantification analysis for the identification of burst phase synchronisationE. L. Lameu, S. Yanchuk, E. E. N. Macau, F. S. Borges, K. C. Iarosz, I. L. Caldas, P. R. Protachevicz, R. R.Borges, R. L. Viana, J. D. Szezech, A. M. Batista, and J. Kurths
Citation: Chaos 28, 085701 (2018); doi: 10.1063/1.5024324View online: https://doi.org/10.1063/1.5024324View Table of Contents: http://aip.scitation.org/toc/cha/28/8Published by the American Institute of Physics
CHAOS 28, 085701 (2018)
Recurrence quantification analysis for the identification of burst phasesynchronisation
E. L. Lameu,1,2 S. Yanchuk,3 E. E. N. Macau,1,4 F. S. Borges,5 K. C. Iarosz,2,6,7,8 I. L. Caldas,6
P. R. Protachevicz,9 R. R. Borges,10 R. L. Viana,11 J. D. Szezech, Jr.,9,12 A. M. Batista,6,7,8,9,12 andJ. Kurths2,7
1National Institute for Space Research, São José dos Campos, São Paulo 12227-010, Brazil2Department of Physics, Humboldt University, Berlin 12489, Germany3Institute of Mathematics, Technical University of Berlin, Berlin 10623, Germany4ICT-Institute of Science and Technology, Federal University of São Paulo, São José dos Campos, São Paulo 12231-280, Brazil5Center for Mathematics, Computation, and Cognition, Federal University of ABC, São Bernardo do Campo, São Paulo09606-045, Brazil6Institute of Physics, University of São Paulo, São Paulo 05508-900, Brazil7Potsdam Institute for Climate Impact Research, Potsdam 14473, Germany8Institute for Complex Systems and Mathematical Biology, University of Aberdeen, SUPA, Aberdeen AB24 3UE, United Kingdom9Program of Post-graduation in Science, State University of Ponta Grossa, Ponta Grossa, Paraná 84030-900, Brazil10Department of Mathematics, Federal University of Technology—Paraná, Ponta Grossa, Paraná 84016-210, Brazil11Department of Physics, Federal University of Paraná, Curitiba, Paraná 80060-000, Brazil12Department of Mathematics and Statistics, State University of Ponta Grossa, Ponta Grossa, Paraná 84030-900, Brazil
(Received 31 January 2018; accepted 22 March 2018; published online 21 August 2018)
In this work, we apply the spatial recurrence quantification analysis (RQA) to identify chaotic burstphase synchronisation in networks. We consider one neural network with small-world topology andanother one composed of small-world subnetworks. The neuron dynamics is described by the Rulkovmap, which is a two-dimensional map that has been used to model chaotic bursting neurons. Weshow that with the use of spatial RQA, it is possible to identify groups of synchronised neuronsand determine their size. For the single network, we obtain an analytical expression for the spatialrecurrence rate using a Gaussian approximation. In clustered networks, the spatial RQA allows theidentification of phase synchronisation among neurons within and between the subnetworks. Ourresults imply that RQA can serve as a useful tool for studying phase synchronisation even in networksof networks. Published by AIP Publishing. https://doi.org/10.1063/1.5024324
One of the most relevant phenomena observed in vari-ous coupled systems is synchronisation. There are experi-mental evidences of synchronisation, e.g., in power grids,electronic circuits, and neural networks. With this inmind, we investigate methods for identifying synchronousbehaviour in coupled systems with burst dynamics. Burstis a dynamic behaviour where signals are fired with highfrequency. We build a network composed of bursting neu-rons by means of coupled Rulkov maps not only in singlenetworks but also in a network of networks which mimicsbetter the brain topology. The study of neural synchroni-sation is important due to the fact that it can be related notonly to memory processes but also to pathological condi-tions, where abnormal neural synchronisation can lead toneurological disorders. Recurrence quantification analysis(RQA) is a method of nonlinear data analysis that has beenused to investigate dynamical systems. We show that RQAcan be used successfully as a diagnostic tool to study thetransition to synchronisation in neural bursting networks.
I. INTRODUCTION
Neural synchronisation has been observed during dif-ferent tasks, at rest, and within different frequency bands.1
Womelsdorf et al.2 suggested that synchronisation has rel-evant consequences for neural interactions, contributing to
cognitive functions. Nevertheless, synchronous behaviour inthe brain is also related to neurological disorders.3 Motorsymptoms of Parkinson’s disease are associated with synchro-nised oscillatory activity in some parts of the brain.4 Similarly,epileptic seizures are related to abnormal synchronised firingof neurons.5
In this work, we study synchronisation in neural networksof coupled Rulkov maps. We consider two cases: the first isa single small-world network and the second is a networkof networks6,7 which mimics better the brain topology. TheRulkov map8 is a two-dimensional iterated map developed tomodel neurons with burst dynamics. We analyse a topologyaccording to small-world property because it exhibits highlevels of clustering and short path lengths.9 There are manyreports about the existence of small-world brain functionalnetworks.10,11 Lameu et al.12 observed bursts synchronisationin the cat cerebral cortex modelled by means of coupled small-world networks of Rulkov neurons. They also studied theeffects of perturbations on the cat cerebral cortex to suppressburst synchronisation.13
We apply RQA as a very efficient alternative method toidentify phase synchronisation in the two networks consid-ered here. The RQA was developed in the late 1980s.14 Santoset al. used RQA to identify chimera states and chimera col-lapse in coupled dynamical systems15 and neural network.16
Recurrence plots have been used as a numerical tool to study
1054-1500/2018/28(8)/085701/8/$30.00 28, 085701-1 Published by AIP Publishing.
085701-2 Lameu et al. Chaos 28, 085701 (2018)
time series of dynamical systems.17 The recurrence matrix isobtained by comparing distances between different points ona trajectory in the phase space. If the distance is smaller thana specific threshold, the corresponding points are consideredto be recurrent and the corresponding matrix element is set toone (otherwise it is zero). For example, recurrence plots showwhether a system possesses periodic, chaotic, or stochasticbehaviour. Vasconcelos et al.18 applied an extension of theusual recurrence concept to study spatial disorder in a net-work at a fixed time. They applied the laminarity and trappinglength19 concepts to observe synchronisation in a lattice oflogistic maps. In this work, our main intention is to show thata new measure inspired by laminarity, we call as laminarityinspired, and recurrence rate can be used as diagnostic toolsof neural phase synchronisation.
This paper is organised as follows: Sec. II introduces theRulkov map. Section III defines the order parameter and thespatial recurrence quantification analysis. In Sec. IV, we applythe spatial RQA to a neural network with small-world prop-erties to identify neural phase synchronisation. In Sec. V, weuse the collective dynamics measurement in a network of net-works, where the subnetworks have small-world properties.Section VI concludes the article.
II. BURSTING NEURAL MODEL
The model proposed by Rulkov8 is a model for a neurongenerating spiking and bursting activity, and it is given by thetwo-dimensional iterated map
xn+1 = α
1 + x2n
+ yn,
yn+1 = yn − σxn − β,(1)
where n is the discrete time, xn is the fast dynamical vari-able that represents the membrane potential, and yn is theslow dynamical variable. The nonlinearity parameter α isresponsible for the spiking timescale, and the small param-eters σ and β describe the slow timescale. In our simulations,we consider σ = β = 0.001, α uniformly distributed in theinterval [4.1, 4.4], resulting in non-identical neurons, and ini-tial conditions x0 and y0 randomly distributed in the interval[−1, 1].
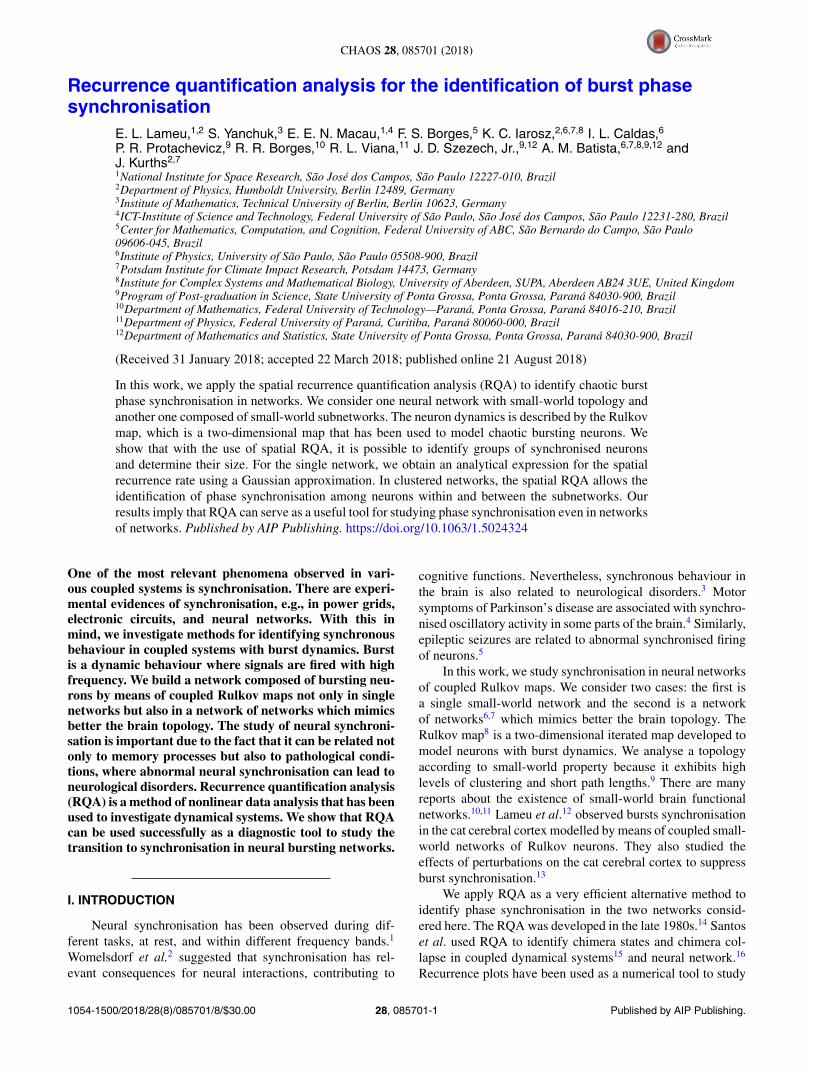
In Figs. 1(a) and 1(b), we see that the time evolution ofxn and yn exhibits bursts and regular saw-tooth oscillations,respectively. A burst starts when yn has a local maximum in awell-defined instant of time nk . The time interval of a burst isgiven by nk+1 − nk (Fig. 1). We can associate the phase withthe time evolution of the bursts,
φn = 2πn − nk
nk+1 − nk, (2)
where k is an integer.
III. COLLECTIVE DYNAMICS MEASUREMENT
A. Order parameter
Synchronisation20,21 can be measured by the Kuramotoorder parameter,22 applied in different kinds of synchronousbehaviours, such as power-grids,23–25 Hamiltonian systems,26
FIG. 1. Time evolution n of the (a) fast xn and (b) slow yn variables in theRulkov map, where nk denotes when the neural burst starts.
and neural networks.27 The order parameter is defined as
rnei�n = 1
N
N∑
i=1
eiφ(i)n , (3)
where rn and �n are the amplitude and the angle of a cen-troid phase vector, respectively, and N (i = 1, 2, . . . , N) is thetotal number of neurons. The amplitude of rn ranges from 0to 1. For desynchronised phases, one finds rn � 1, namely,the phases of the bursts are out of synchrony. When rn = 1,all phases are identical, i.e., the bursts are synchronised. Wecalculate the Kuramoto order parameter in order to com-pare with RQA and to show that RQA provides substantialcomplementary information, such as patterns of synchronisedstructures.
B. Recurrence quantification analysis
The recurrence concept was presented by Eckmannet al.17 through the recurrence plot (RP) of dynamical sys-tems. Zbilut and Webber28 introduced recurrence quantifi-cation analysis (RQA) which14 has been used as a tool forthe study of many nonlinear dynamical systems, e.g., theexploration of cardiac signals29 or electrostatic fluctuationsin fusion plasma.30 We identify neural phase synchronisationby means of methods based on spatial recurrence rate andlaminarity inspired.
The spatial recurrence rate RR is defined as
RRn = 1
N2
N∑
i,j=1
Ri,j(n), (4)
where n corresponds to the time and the Ri,j(n) is the N × Nrecurrence matrix at time n. Ri,j(n) is given by
Ri,j(n) = �(l − |φ(i)n − φ(j)
n |), (5)
where l is the threshold distance, �(·) is the Heaviside func-tion, and φ
(j)n is the phase of neuron j at time n. The nonzero
elements of the spatial recurrence matrix Ri,j(n) at a giventime n represent recurrent phases, namely, the pairs of neuronswhich have phase differences smaller than the threshold l.
085701-3 Lameu et al. Chaos 28, 085701 (2018)
In our approach, RRn varies in the interval [0, 1] and givesinformation about the proportion of synchronised pairs ofneurons in the network. We are also interested in verify-ing whether pairs of synchronised neurons are isolated ororganised in groups. To do that, we use the laminarity inspired
Ln =∑N
v=vminvP(v)
∑Nv=1 vP(v)
, (6)
where P(v) is the number of columns in Ri,j(n) with exactly vnonzero elements, normalised by N . The laminarity inspired(Ln) is the ratio between the number of oscillator pairs belong-ing to synchronised groups of size v ≥ vmin and the totalnumber of synchronised pairs [points in Ri,j(n)]. We choosevmin = lN/2, while a more detailed explanation for this choicewill be given in Sec. IV B. Through the RP, we also calculatethe average size of the structures S,
Sn =∑N
v=vminvP(v)
N∑N
v=vminP(v)
. (7)
IV. SMALL-WORLD NETWORK
A. Numerical results
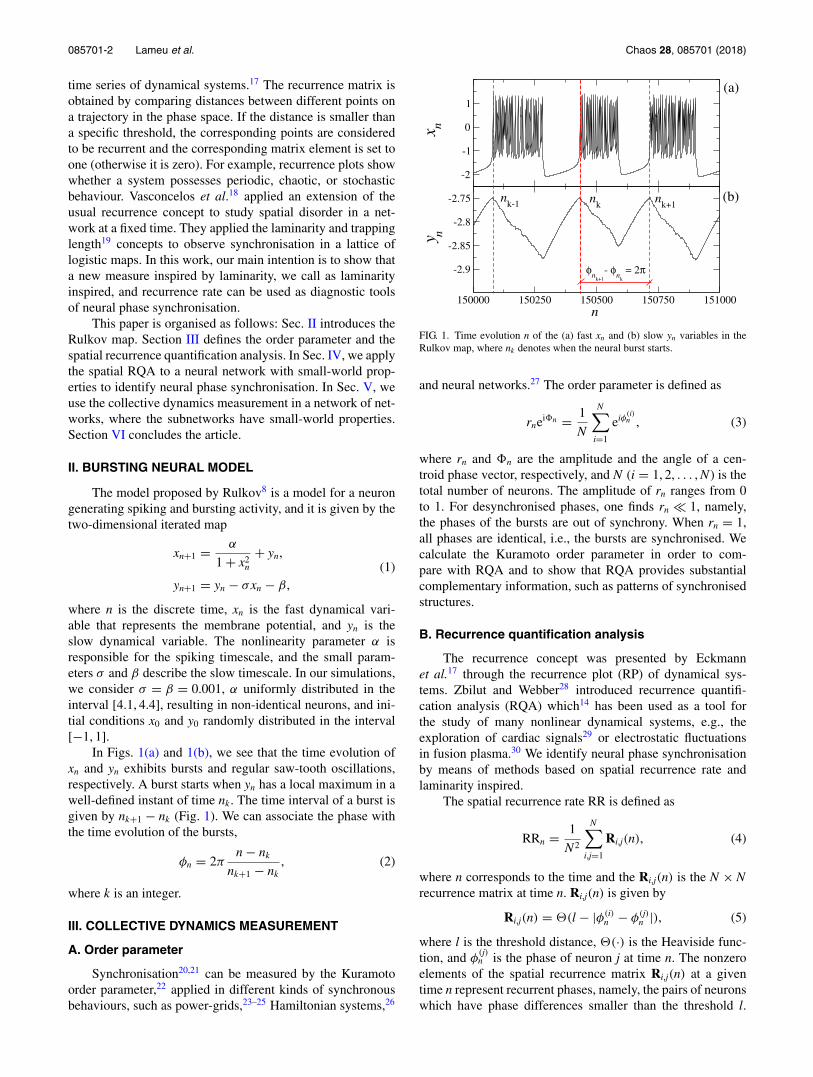
Coupled dynamical systems have been used to describebehaviours of neural networks. There are experimental evi-dences that some anatomical connections in the brain havesmall-world properties.10,11 We consider a small-world topol-ogy formulated by Newman and Watts,31 where a regular
network with periodic boundary conditions [Fig. 2(a)] istransformed into a small-world network [Fig. 2(b)] addingshortcuts. Figure 2(c) shows the adjacency matrix for sucha network with N = 200 neurons, where the black pointsindicate the pairs of connected neurons. All neurons are con-nected locally with the first two neighbours [Fig. 2(a)], andthen shortcuts are randomly chosen with probability p = 0.1[Fig. 2(b)].
We consider a mean-field coupling among the connectedneurons,
x(i)n+1 = α(i)
1 + (x(i)n )2
+ y(i)n + ε
k(i)
∑
j∈I
x(j)n ,
y(i)n+1 = y(i)
n − σx(i)n − β,
(8)
where ε is the coupling strength and each neuron i is coupledwith a set I comprising k(i) other neurons in the network withN neurons.
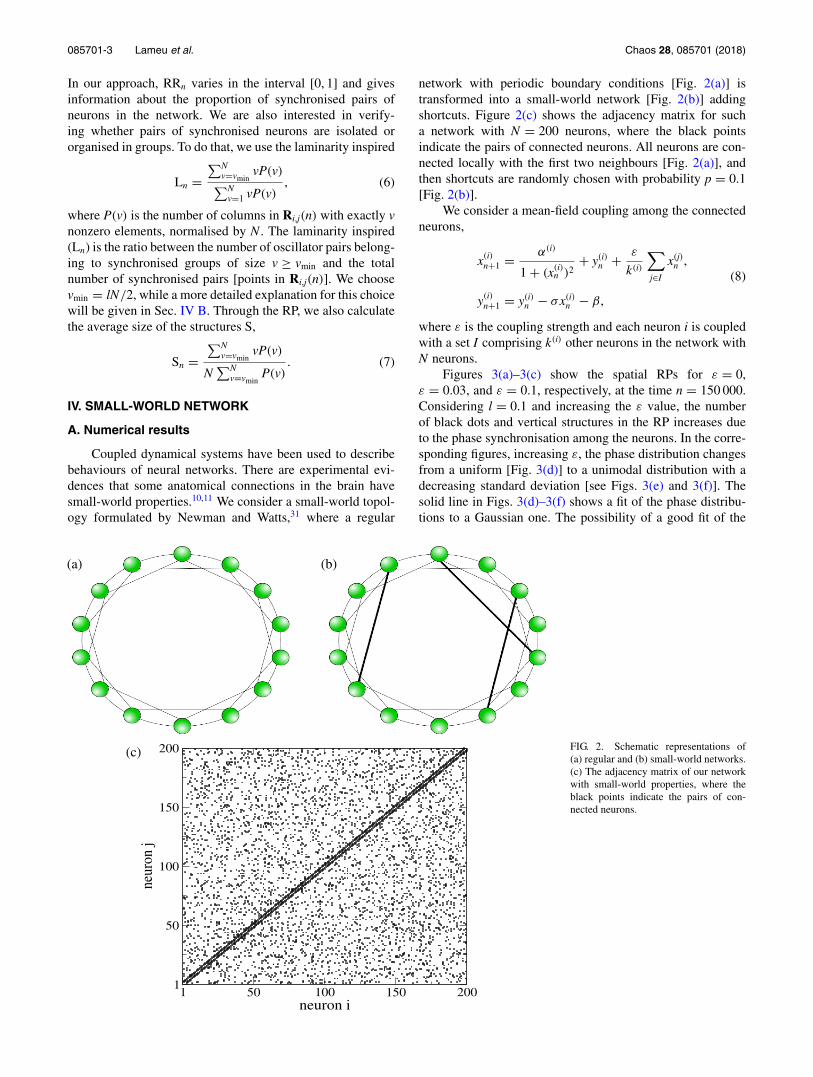
Figures 3(a)–3(c) show the spatial RPs for ε = 0,ε = 0.03, and ε = 0.1, respectively, at the time n = 150 000.Considering l = 0.1 and increasing the ε value, the numberof black dots and vertical structures in the RP increases dueto the phase synchronisation among the neurons. In the corre-sponding figures, increasing ε, the phase distribution changesfrom a uniform [Fig. 3(d)] to a unimodal distribution with adecreasing standard deviation [see Figs. 3(e) and 3(f)]. Thesolid line in Figs. 3(d)–3(f) shows a fit of the phase distribu-tions to a Gaussian one. The possibility of a good fit of the
FIG. 2. Schematic representations of(a) regular and (b) small-world networks.(c) The adjacency matrix of our networkwith small-world properties, where theblack points indicate the pairs of con-nected neurons.
085701-4 Lameu et al. Chaos 28, 085701 (2018)
data by a Gaussian distribution allows for an analytical studyof r and RR, as described in Sec. IV B.
We also calculate the time evolution of the quantitiesrn, RRn, Ln, and Sn for ε = 0, ε = 0.03, and ε = 0.1, asshown in Figs. 3(g)–3(i), respectively. For the uncoupled neu-rons (ε = 0), all the RQA measurements have small values,showing no synchronous behaviour, and in accordance withthe small rn values. For ε = 0.03, RRn exhibits that about15% of the neuron pairs are recurrent, and the increasing ofLn indicates that more than 80% of them are part of a syn-chronised group of neurons. However, as shown by Sn, thesizes of these groups are small and oscillate around 0.15.Therefore, for ε = 0.03 and l = 0.1, through the RQA, it ispossible to observe the presence of a large amount of smallsynchronised neural groups. The rn also display synchroni-sation in the network, but it does not give any informationabout synchronised groups. Increasing ε to 0.1, rn and Ln
have values near unity due to the wide-spread synchroni-sation. The values of RRn and Sn also increase showingthat there are more synchronised pairs of neurons and largergroups.
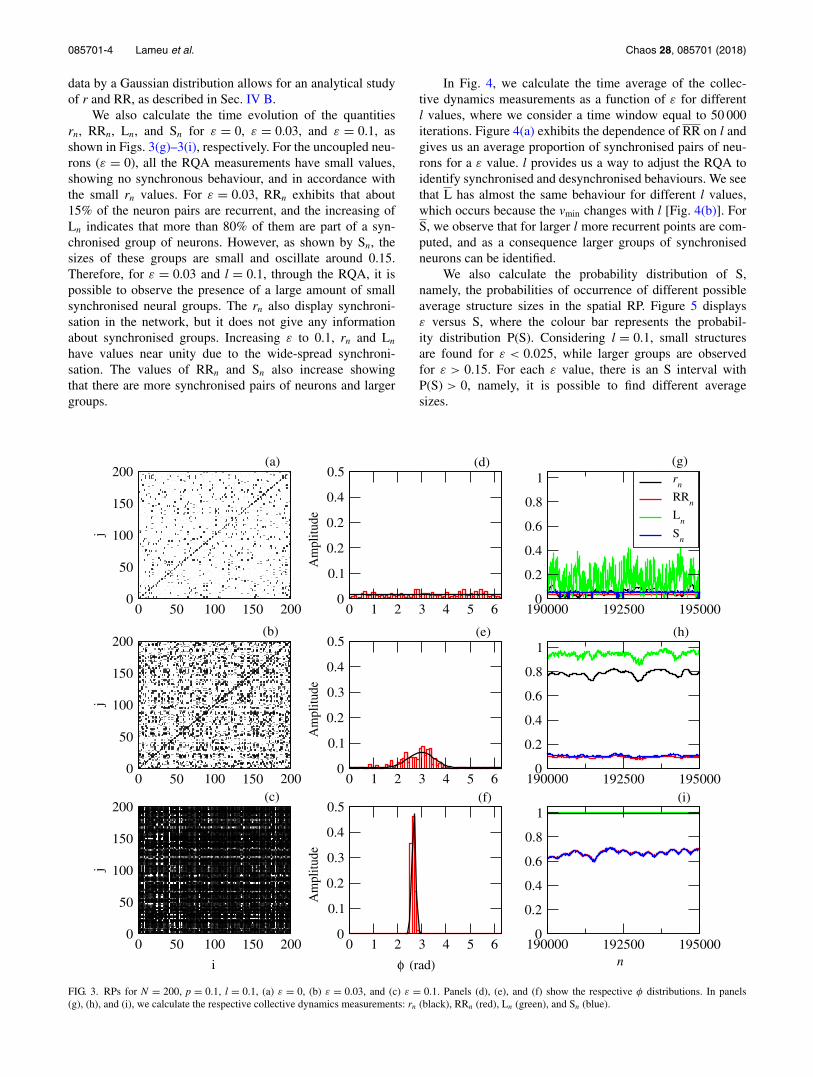
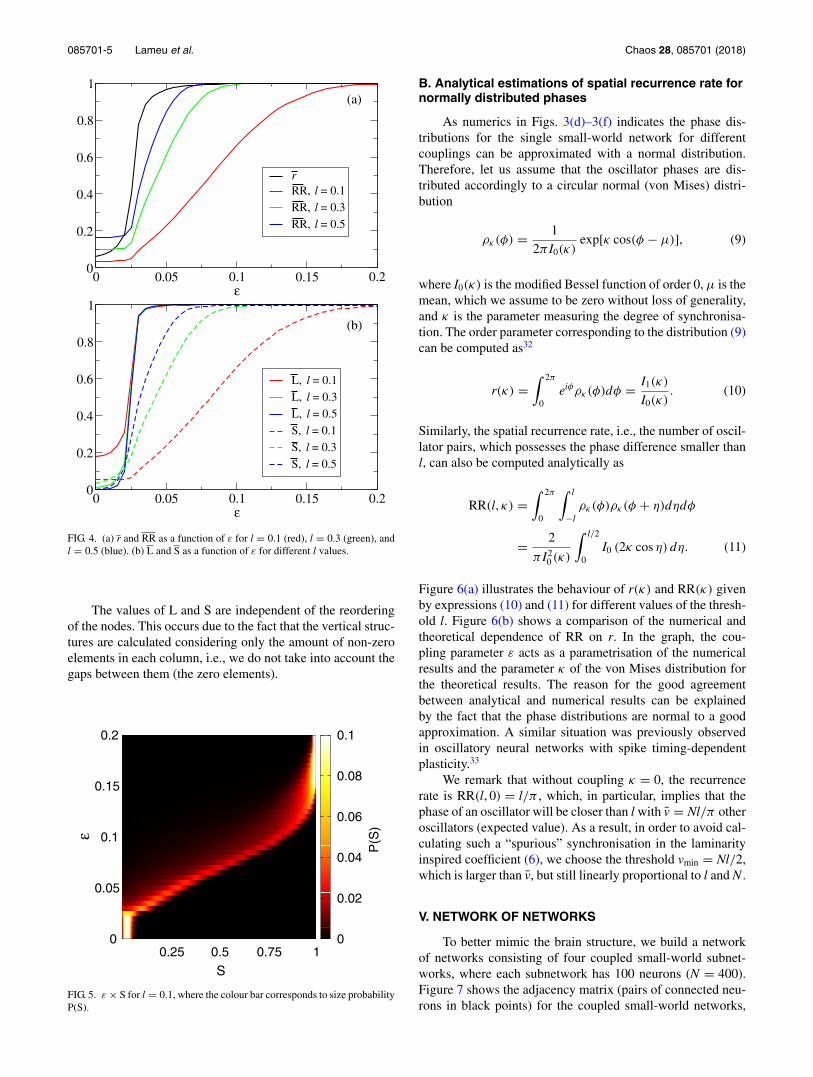
In Fig. 4, we calculate the time average of the collec-tive dynamics measurements as a function of ε for differentl values, where we consider a time window equal to 50 000iterations. Figure 4(a) exhibits the dependence of RR on l andgives us an average proportion of synchronised pairs of neu-rons for a ε value. l provides us a way to adjust the RQA toidentify synchronised and desynchronised behaviours. We seethat L has almost the same behaviour for different l values,which occurs because the vmin changes with l [Fig. 4(b)]. ForS, we observe that for larger l more recurrent points are com-puted, and as a consequence larger groups of synchronisedneurons can be identified.
We also calculate the probability distribution of S,namely, the probabilities of occurrence of different possibleaverage structure sizes in the spatial RP. Figure 5 displaysε versus S, where the colour bar represents the probabil-ity distribution P(S). Considering l = 0.1, small structuresare found for ε < 0.025, while larger groups are observedfor ε > 0.15. For each ε value, there is an S interval withP(S) > 0, namely, it is possible to find different averagesizes.
FIG. 3. RPs for N = 200, p = 0.1, l = 0.1, (a) ε = 0, (b) ε = 0.03, and (c) ε = 0.1. Panels (d), (e), and (f) show the respective φ distributions. In panels(g), (h), and (i), we calculate the respective collective dynamics measurements: rn (black), RRn (red), Ln (green), and Sn (blue).
085701-5 Lameu et al. Chaos 28, 085701 (2018)
FIG. 4. (a) r and RR as a function of ε for l = 0.1 (red), l = 0.3 (green), andl = 0.5 (blue). (b) L and S as a function of ε for different l values.
The values of L and S are independent of the reorderingof the nodes. This occurs due to the fact that the vertical struc-tures are calculated considering only the amount of non-zeroelements in each column, i.e., we do not take into account thegaps between them (the zero elements).
FIG. 5. ε × S for l = 0.1, where the colour bar corresponds to size probabilityP(S).
B. Analytical estimations of spatial recurrence rate fornormally distributed phases
As numerics in Figs. 3(d)–3(f) indicates the phase dis-tributions for the single small-world network for differentcouplings can be approximated with a normal distribution.Therefore, let us assume that the oscillator phases are dis-tributed accordingly to a circular normal (von Mises) distri-bution
ρκ(φ) = 1
2π I0(κ)exp[κ cos(φ − μ)], (9)
where I0(κ) is the modified Bessel function of order 0, μ is themean, which we assume to be zero without loss of generality,and κ is the parameter measuring the degree of synchronisa-tion. The order parameter corresponding to the distribution (9)can be computed as32
r(κ) =∫ 2π
0eiφρκ(φ)dφ = I1(κ)
I0(κ). (10)
Similarly, the spatial recurrence rate, i.e., the number of oscil-lator pairs, which possesses the phase difference smaller thanl, can also be computed analytically as
RR(l, κ) =∫ 2π
0
∫ l
−lρκ(φ)ρκ(φ + η)dηdφ
= 2
π I20 (κ)
∫ l/2
0I0 (2κ cos η) dη. (11)
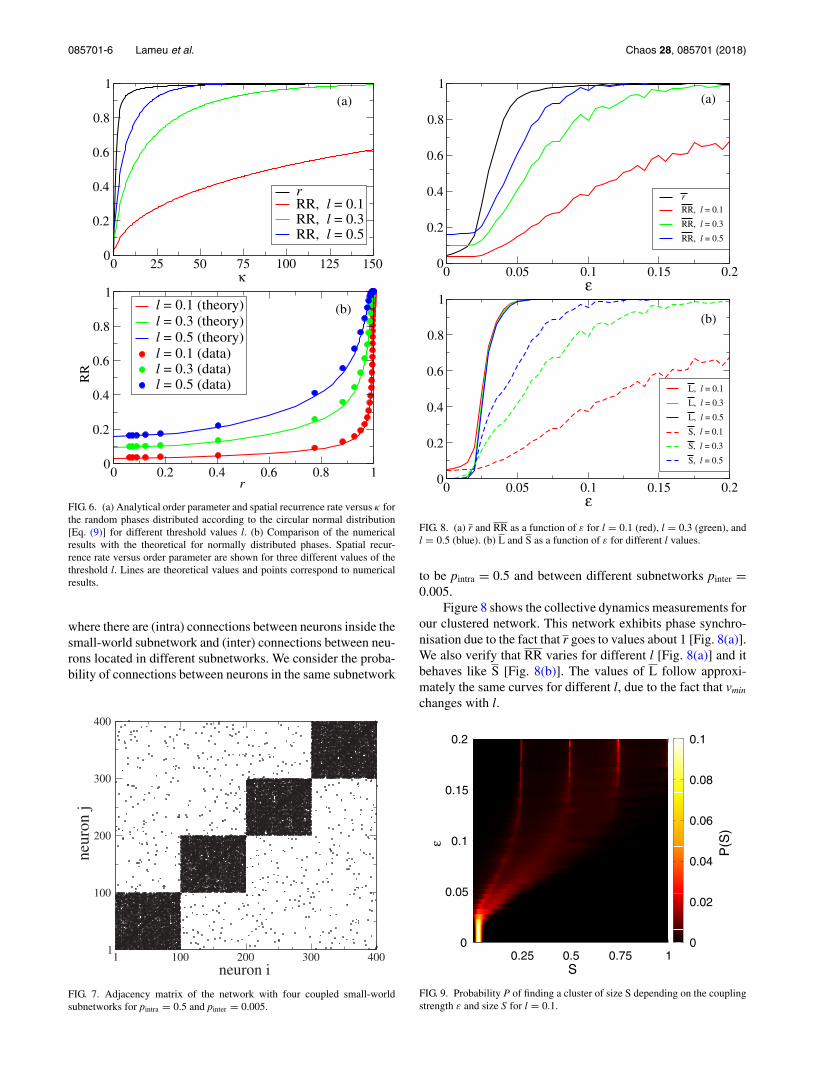
Figure 6(a) illustrates the behaviour of r(κ) and RR(κ) givenby expressions (10) and (11) for different values of the thresh-old l. Figure 6(b) shows a comparison of the numerical andtheoretical dependence of RR on r. In the graph, the cou-pling parameter ε acts as a parametrisation of the numericalresults and the parameter κ of the von Mises distribution forthe theoretical results. The reason for the good agreementbetween analytical and numerical results can be explainedby the fact that the phase distributions are normal to a goodapproximation. A similar situation was previously observedin oscillatory neural networks with spike timing-dependentplasticity.33
We remark that without coupling κ = 0, the recurrencerate is RR(l, 0) = l/π , which, in particular, implies that thephase of an oscillator will be closer than l with v̄ = Nl/π otheroscillators (expected value). As a result, in order to avoid cal-culating such a “spurious” synchronisation in the laminarityinspired coefficient (6), we choose the threshold vmin = Nl/2,which is larger than v̄, but still linearly proportional to l and N .
V. NETWORK OF NETWORKS
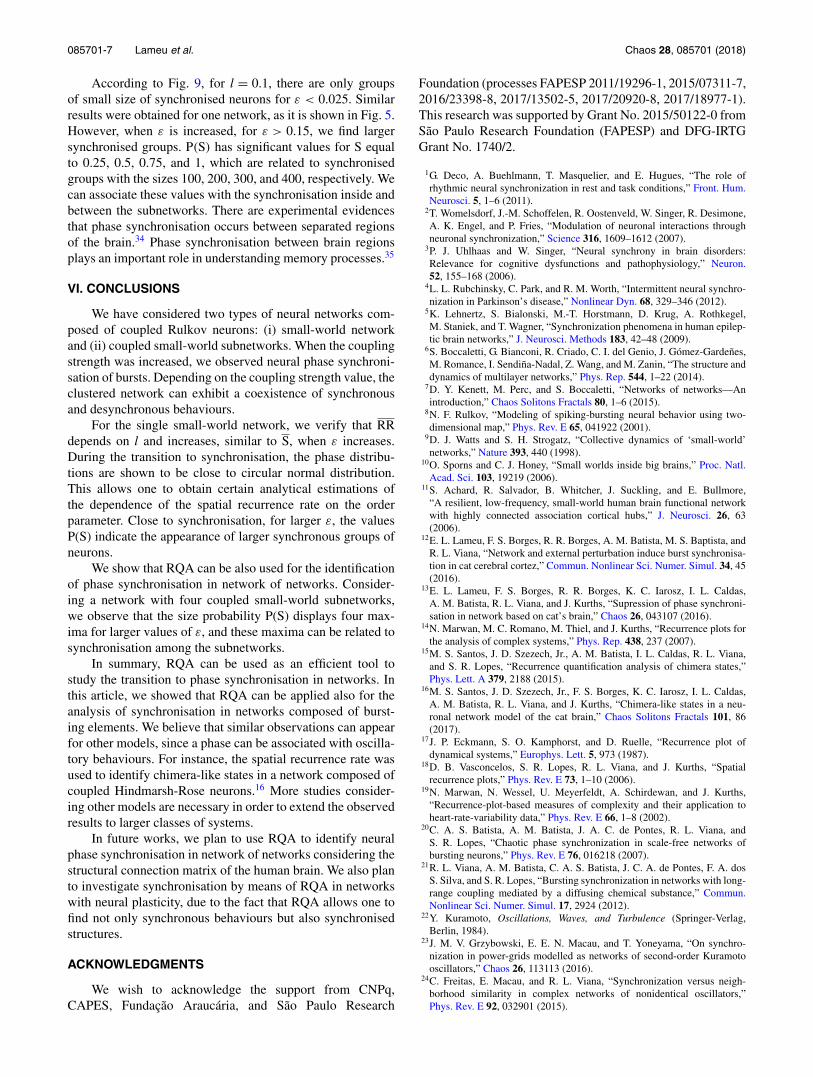
To better mimic the brain structure, we build a networkof networks consisting of four coupled small-world subnet-works, where each subnetwork has 100 neurons (N = 400).Figure 7 shows the adjacency matrix (pairs of connected neu-rons in black points) for the coupled small-world networks,
085701-6 Lameu et al. Chaos 28, 085701 (2018)
FIG. 6. (a) Analytical order parameter and spatial recurrence rate versus κ forthe random phases distributed according to the circular normal distribution[Eq. (9)] for different threshold values l. (b) Comparison of the numericalresults with the theoretical for normally distributed phases. Spatial recur-rence rate versus order parameter are shown for three different values of thethreshold l. Lines are theoretical values and points correspond to numericalresults.
where there are (intra) connections between neurons inside thesmall-world subnetwork and (inter) connections between neu-rons located in different subnetworks. We consider the proba-bility of connections between neurons in the same subnetwork
FIG. 7. Adjacency matrix of the network with four coupled small-worldsubnetworks for pintra = 0.5 and pinter = 0.005.
FIG. 8. (a) r and RR as a function of ε for l = 0.1 (red), l = 0.3 (green), andl = 0.5 (blue). (b) L and S as a function of ε for different l values.
to be pintra = 0.5 and between different subnetworks pinter =0.005.
Figure 8 shows the collective dynamics measurements forour clustered network. This network exhibits phase synchro-nisation due to the fact that r goes to values about 1 [Fig. 8(a)].We also verify that RR varies for different l [Fig. 8(a)] and itbehaves like S [Fig. 8(b)]. The values of L follow approxi-mately the same curves for different l, due to the fact that vmin
changes with l.
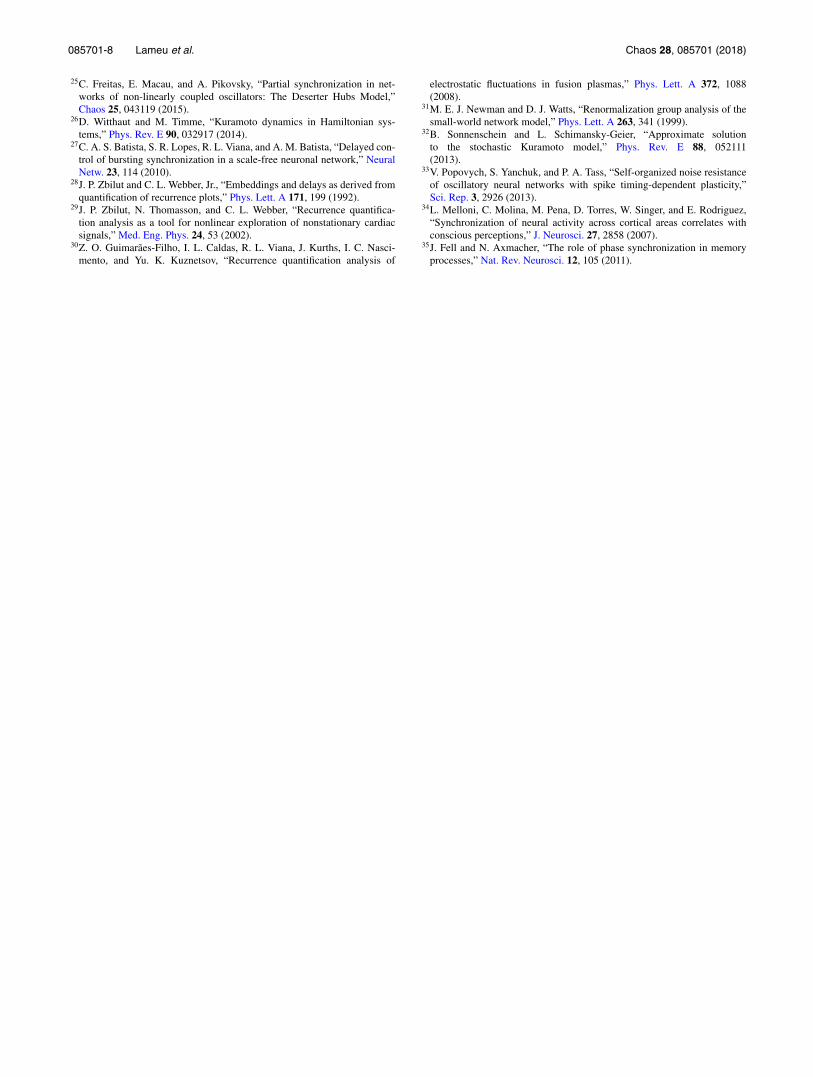
FIG. 9. Probability P of finding a cluster of size S depending on the couplingstrength ε and size S for l = 0.1.
085701-7 Lameu et al. Chaos 28, 085701 (2018)
According to Fig. 9, for l = 0.1, there are only groupsof small size of synchronised neurons for ε < 0.025. Similarresults were obtained for one network, as it is shown in Fig. 5.However, when ε is increased, for ε > 0.15, we find largersynchronised groups. P(S) has significant values for S equalto 0.25, 0.5, 0.75, and 1, which are related to synchronisedgroups with the sizes 100, 200, 300, and 400, respectively. Wecan associate these values with the synchronisation inside andbetween the subnetworks. There are experimental evidencesthat phase synchronisation occurs between separated regionsof the brain.34 Phase synchronisation between brain regionsplays an important role in understanding memory processes.35
VI. CONCLUSIONS
We have considered two types of neural networks com-posed of coupled Rulkov neurons: (i) small-world networkand (ii) coupled small-world subnetworks. When the couplingstrength was increased, we observed neural phase synchroni-sation of bursts. Depending on the coupling strength value, theclustered network can exhibit a coexistence of synchronousand desynchronous behaviours.
For the single small-world network, we verify that RRdepends on l and increases, similar to S, when ε increases.During the transition to synchronisation, the phase distribu-tions are shown to be close to circular normal distribution.This allows one to obtain certain analytical estimations ofthe dependence of the spatial recurrence rate on the orderparameter. Close to synchronisation, for larger ε, the valuesP(S) indicate the appearance of larger synchronous groups ofneurons.
We show that RQA can be also used for the identificationof phase synchronisation in network of networks. Consider-ing a network with four coupled small-world subnetworks,we observe that the size probability P(S) displays four max-ima for larger values of ε, and these maxima can be related tosynchronisation among the subnetworks.
In summary, RQA can be used as an efficient tool tostudy the transition to phase synchronisation in networks. Inthis article, we showed that RQA can be applied also for theanalysis of synchronisation in networks composed of burst-ing elements. We believe that similar observations can appearfor other models, since a phase can be associated with oscilla-tory behaviours. For instance, the spatial recurrence rate wasused to identify chimera-like states in a network composed ofcoupled Hindmarsh-Rose neurons.16 More studies consider-ing other models are necessary in order to extend the observedresults to larger classes of systems.
In future works, we plan to use RQA to identify neuralphase synchronisation in network of networks considering thestructural connection matrix of the human brain. We also planto investigate synchronisation by means of RQA in networkswith neural plasticity, due to the fact that RQA allows one tofind not only synchronous behaviours but also synchronisedstructures.
ACKNOWLEDGMENTS
We wish to acknowledge the support from CNPq,CAPES, Fundação Araucária, and São Paulo Research
Foundation (processes FAPESP 2011/19296-1, 2015/07311-7,2016/23398-8, 2017/13502-5, 2017/20920-8, 2017/18977-1).This research was supported by Grant No. 2015/50122-0 fromSão Paulo Research Foundation (FAPESP) and DFG-IRTGGrant No. 1740/2.
1G. Deco, A. Buehlmann, T. Masquelier, and E. Hugues, “The role ofrhythmic neural synchronization in rest and task conditions,” Front. Hum.Neurosci. 5, 1–6 (2011).
2T. Womelsdorf, J.-M. Schoffelen, R. Oostenveld, W. Singer, R. Desimone,A. K. Engel, and P. Fries, “Modulation of neuronal interactions throughneuronal synchronization,” Science 316, 1609–1612 (2007).
3P. J. Uhlhaas and W. Singer, “Neural synchrony in brain disorders:Relevance for cognitive dysfunctions and pathophysiology,” Neuron.52, 155–168 (2006).
4L. L. Rubchinsky, C. Park, and R. M. Worth, “Intermittent neural synchro-nization in Parkinson’s disease,” Nonlinear Dyn. 68, 329–346 (2012).
5K. Lehnertz, S. Bialonski, M.-T. Horstmann, D. Krug, A. Rothkegel,M. Staniek, and T. Wagner, “Synchronization phenomena in human epilep-tic brain networks,” J. Neurosci. Methods 183, 42–48 (2009).
6S. Boccaletti, G. Bianconi, R. Criado, C. I. del Genio, J. Gómez-Gardeñes,M. Romance, I. Sendiña-Nadal, Z. Wang, and M. Zanin, “The structure anddynamics of multilayer networks,” Phys. Rep. 544, 1–22 (2014).
7D. Y. Kenett, M. Perc, and S. Boccaletti, “Networks of networks—Anintroduction,” Chaos Solitons Fractals 80, 1–6 (2015).
8N. F. Rulkov, “Modeling of spiking-bursting neural behavior using two-dimensional map,” Phys. Rev. E 65, 041922 (2001).
9D. J. Watts and S. H. Strogatz, “Collective dynamics of ‘small-world’networks,” Nature 393, 440 (1998).
10O. Sporns and C. J. Honey, “Small worlds inside big brains,” Proc. Natl.Acad. Sci. 103, 19219 (2006).
11S. Achard, R. Salvador, B. Whitcher, J. Suckling, and E. Bullmore,“A resilient, low-frequency, small-world human brain functional networkwith highly connected association cortical hubs,” J. Neurosci. 26, 63(2006).
12E. L. Lameu, F. S. Borges, R. R. Borges, A. M. Batista, M. S. Baptista, andR. L. Viana, “Network and external perturbation induce burst synchronisa-tion in cat cerebral cortez,” Commun. Nonlinear Sci. Numer. Simul. 34, 45(2016).
13E. L. Lameu, F. S. Borges, R. R. Borges, K. C. Iarosz, I. L. Caldas,A. M. Batista, R. L. Viana, and J. Kurths, “Supression of phase synchroni-sation in network based on cat’s brain,” Chaos 26, 043107 (2016).
14N. Marwan, M. C. Romano, M. Thiel, and J. Kurths, “Recurrence plots forthe analysis of complex systems,” Phys. Rep. 438, 237 (2007).
15M. S. Santos, J. D. Szezech, Jr., A. M. Batista, I. L. Caldas, R. L. Viana,and S. R. Lopes, “Recurrence quantification analysis of chimera states,”Phys. Lett. A 379, 2188 (2015).
16M. S. Santos, J. D. Szezech, Jr., F. S. Borges, K. C. Iarosz, I. L. Caldas,A. M. Batista, R. L. Viana, and J. Kurths, “Chimera-like states in a neu-ronal network model of the cat brain,” Chaos Solitons Fractals 101, 86(2017).
17J. P. Eckmann, S. O. Kamphorst, and D. Ruelle, “Recurrence plot ofdynamical systems,” Europhys. Lett. 5, 973 (1987).
18D. B. Vasconcelos, S. R. Lopes, R. L. Viana, and J. Kurths, “Spatialrecurrence plots,” Phys. Rev. E 73, 1–10 (2006).
19N. Marwan, N. Wessel, U. Meyerfeldt, A. Schirdewan, and J. Kurths,“Recurrence-plot-based measures of complexity and their application toheart-rate-variability data,” Phys. Rev. E 66, 1–8 (2002).
20C. A. S. Batista, A. M. Batista, J. A. C. de Pontes, R. L. Viana, andS. R. Lopes, “Chaotic phase synchronization in scale-free networks ofbursting neurons,” Phys. Rev. E 76, 016218 (2007).
21R. L. Viana, A. M. Batista, C. A. S. Batista, J. C. A. de Pontes, F. A. dosS. Silva, and S. R. Lopes, “Bursting synchronization in networks with long-range coupling mediated by a diffusing chemical substance,” Commun.Nonlinear Sci. Numer. Simul. 17, 2924 (2012).
22Y. Kuramoto, Oscillations, Waves, and Turbulence (Springer-Verlag,Berlin, 1984).
23J. M. V. Grzybowski, E. E. N. Macau, and T. Yoneyama, “On synchro-nization in power-grids modelled as networks of second-order Kuramotooscillators,” Chaos 26, 113113 (2016).
24C. Freitas, E. Macau, and R. L. Viana, “Synchronization versus neigh-borhood similarity in complex networks of nonidentical oscillators,”Phys. Rev. E 92, 032901 (2015).
085701-8 Lameu et al. Chaos 28, 085701 (2018)
25C. Freitas, E. Macau, and A. Pikovsky, “Partial synchronization in net-works of non-linearly coupled oscillators: The Deserter Hubs Model,”Chaos 25, 043119 (2015).
26D. Witthaut and M. Timme, “Kuramoto dynamics in Hamiltonian sys-tems,” Phys. Rev. E 90, 032917 (2014).
27C. A. S. Batista, S. R. Lopes, R. L. Viana, and A. M. Batista, “Delayed con-trol of bursting synchronization in a scale-free neuronal network,” NeuralNetw. 23, 114 (2010).
28J. P. Zbilut and C. L. Webber, Jr., “Embeddings and delays as derived fromquantification of recurrence plots,” Phys. Lett. A 171, 199 (1992).
29J. P. Zbilut, N. Thomasson, and C. L. Webber, “Recurrence quantifica-tion analysis as a tool for nonlinear exploration of nonstationary cardiacsignals,” Med. Eng. Phys. 24, 53 (2002).
30Z. O. Guimarães-Filho, I. L. Caldas, R. L. Viana, J. Kurths, I. C. Nasci-mento, and Yu. K. Kuznetsov, “Recurrence quantification analysis of
electrostatic fluctuations in fusion plasmas,” Phys. Lett. A 372, 1088(2008).
31M. E. J. Newman and D. J. Watts, “Renormalization group analysis of thesmall-world network model,” Phys. Lett. A 263, 341 (1999).
32B. Sonnenschein and L. Schimansky-Geier, “Approximate solutionto the stochastic Kuramoto model,” Phys. Rev. E 88, 052111(2013).
33V. Popovych, S. Yanchuk, and P. A. Tass, “Self-organized noise resistanceof oscillatory neural networks with spike timing-dependent plasticity,”Sci. Rep. 3, 2926 (2013).
34L. Melloni, C. Molina, M. Pena, D. Torres, W. Singer, and E. Rodriguez,“Synchronization of neural activity across cortical areas correlates withconscious perceptions,” J. Neurosci. 27, 2858 (2007).
35J. Fell and N. Axmacher, “The role of phase synchronization in memoryprocesses,” Nat. Rev. Neurosci. 12, 105 (2011).