Embed Size (px)
Citation preview
Recruiting and Enrollment
Derek Skaggs, Director of Admissions
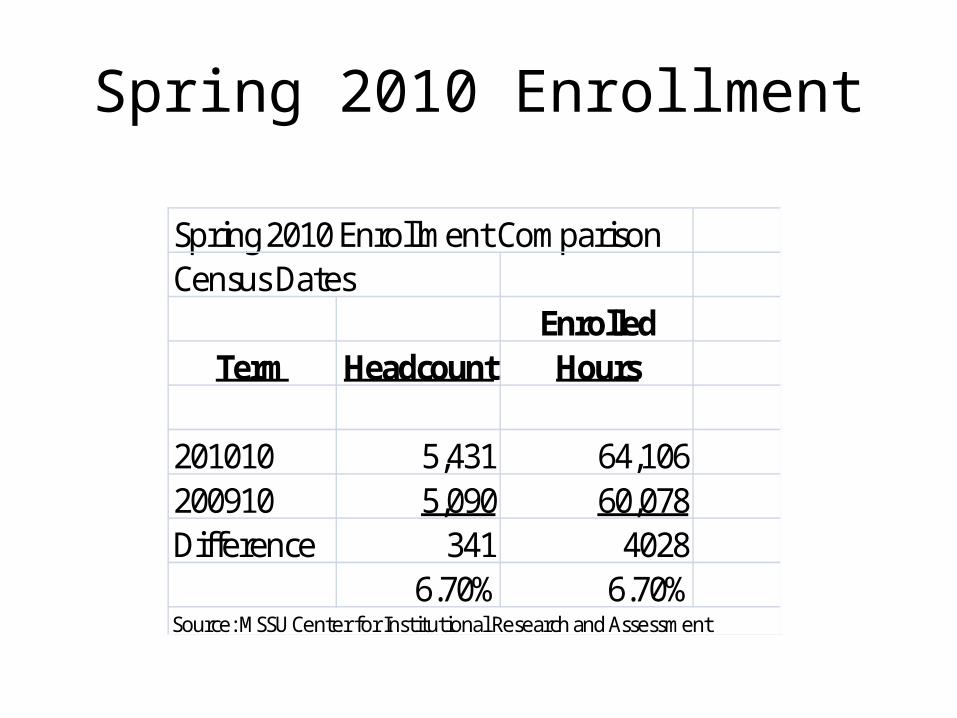
Spring 2010 Enrollment
Spring 2010 Enrollment Comparison Census Dates
EnrolledTerm Headcount Hours
201010 5,431 64,106200910 5,090 60,078Difference 341 4028
6.70% 6.70%Source: MSSU Center for Institutional Research and Assessment
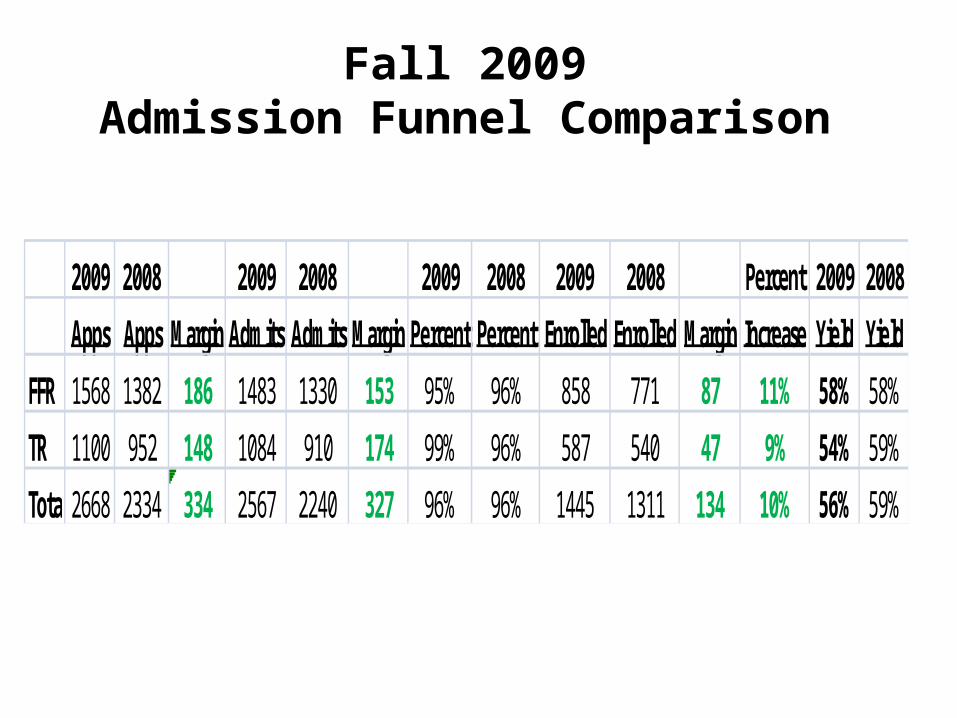
Fall 2009 Admission Funnel Comparison
2009 2008 2009 2008 2009 2008 2009 2008 Percent 2009 2008
Apps Apps Margin Admits Admits Margin Percent Percent Enrolled Enrolled Margin Increase Yield Yield
FFR 1568 1382 186 1483 1330 153 95% 96% 858 771 87 11% 58% 58%
TR 1100 952 148 1084 910 174 99% 96% 587 540 47 9% 54% 59%
Total 2668 2334 334 2567 2240 327 96% 96% 1445 1311 134 10% 56% 59%
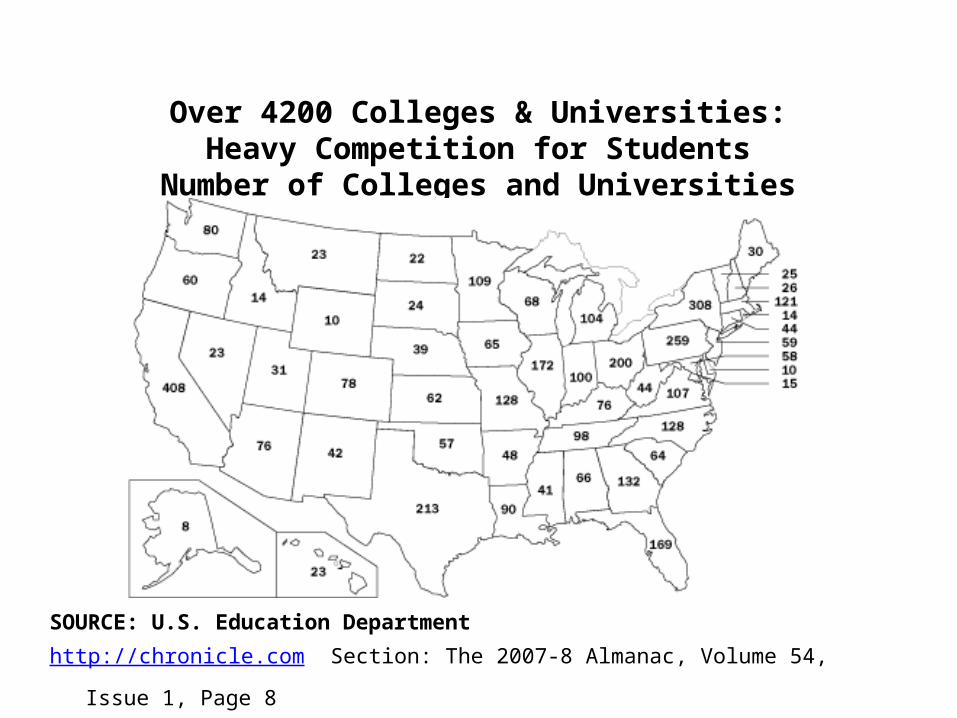
Over 4200 Colleges & Universities:Heavy Competition for Students
Number of Colleges and Universities
SOURCE: U.S. Education Department
http://chronicle.com Section: The 2007-8 Almanac, Volume 54, Issue 1, Page 8
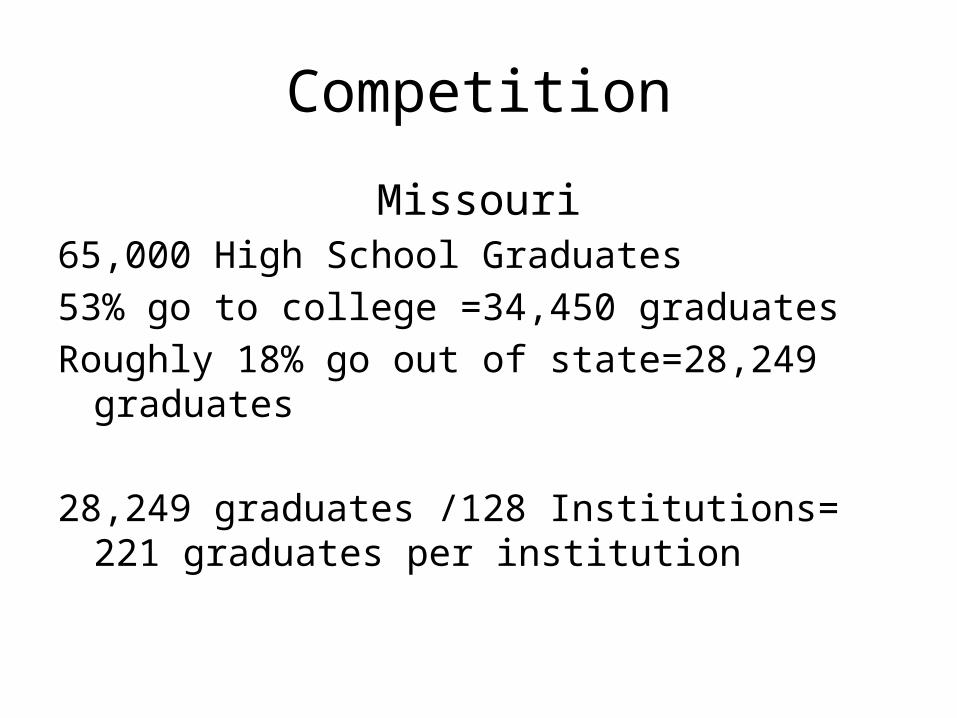
Competition
Missouri65,000 High School Graduates53% go to college =34,450 graduatesRoughly 18% go out of state=28,249 graduates
28,249 graduates /128 Institutions= 221 graduates per institution
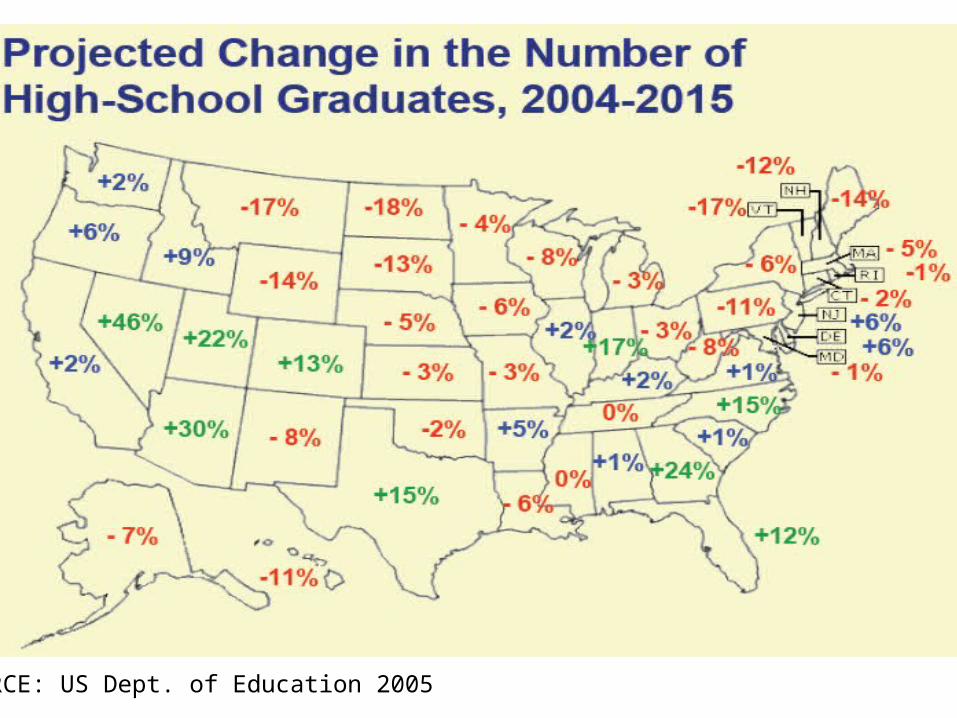
SOURCE: US Dept. of Education 2005
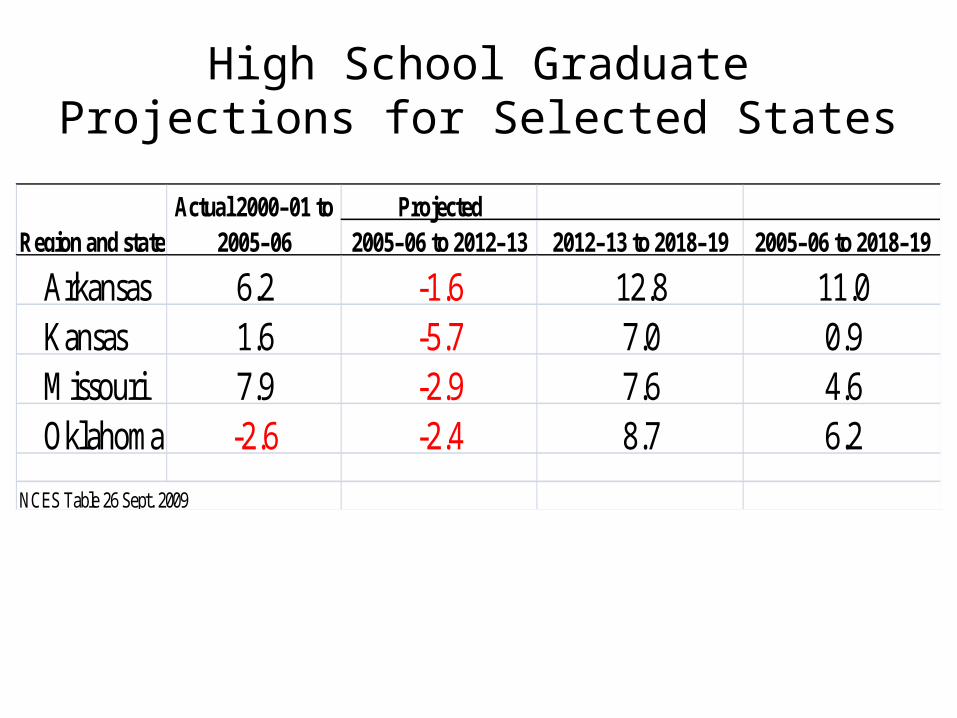
High School Graduate Projections for Selected States
Projected2005–06 to 2012–13 2012–13 to 2018–19 2005–06 to 2018–19
Arkansas 6.2 -1.6 12.8 11.0 Kansas 1.6 -5.7 7.0 0.9 Missouri 7.9 -2.9 7.6 4.6 Oklahoma -2.6 -2.4 8.7 6.2
NCES Table 26 Sept. 2009
Region and stateActual 2000–01 to
2005–06
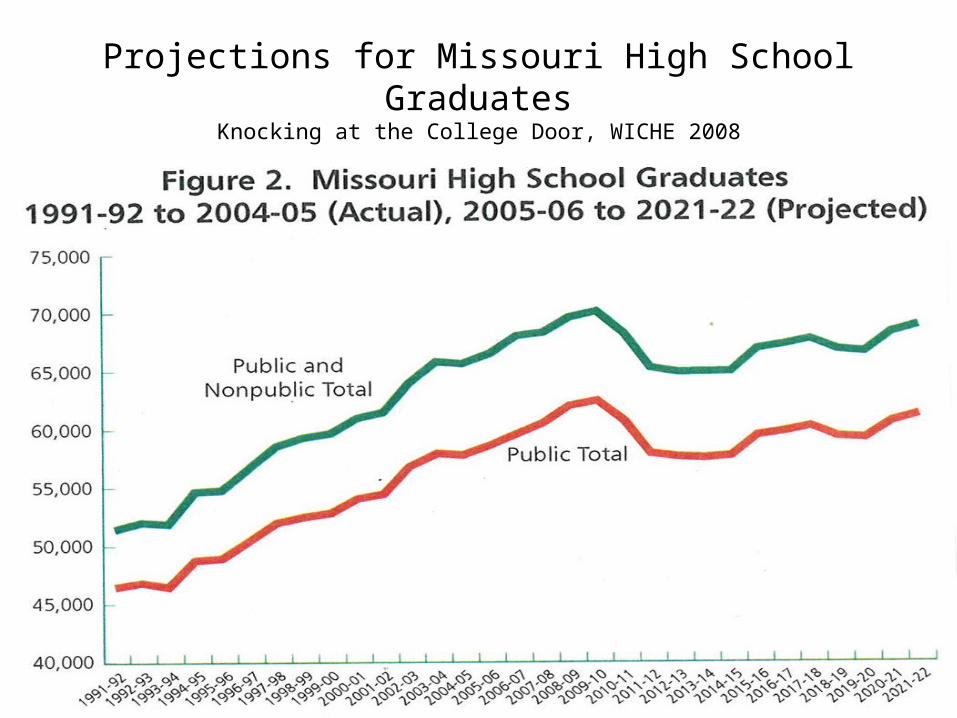
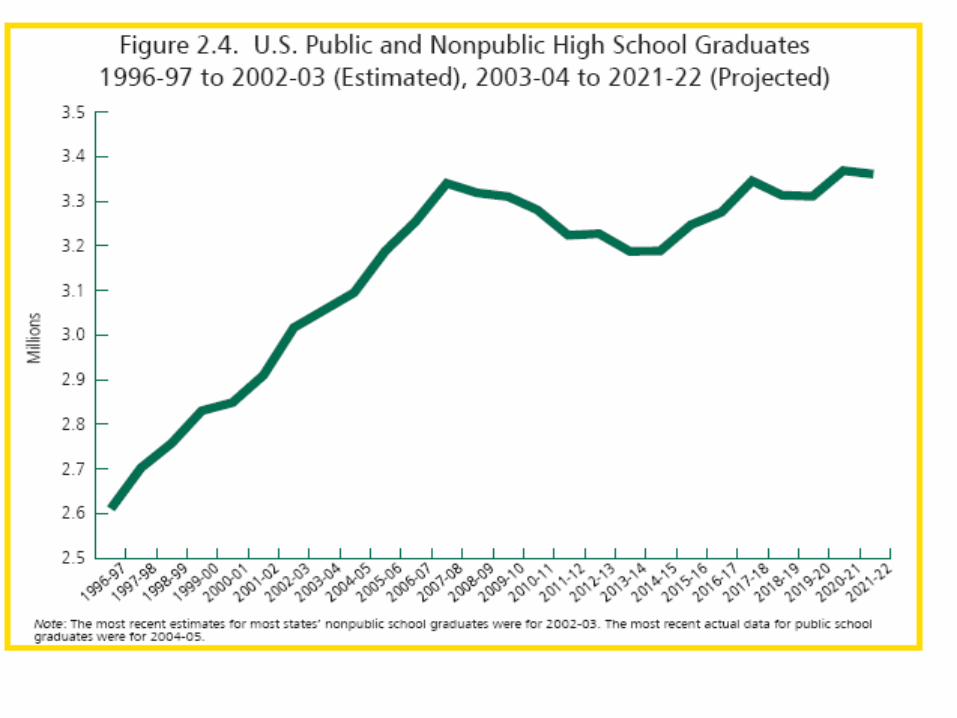
Projections for Missouri High School GraduatesKnocking at the College Door, WICHE 2008
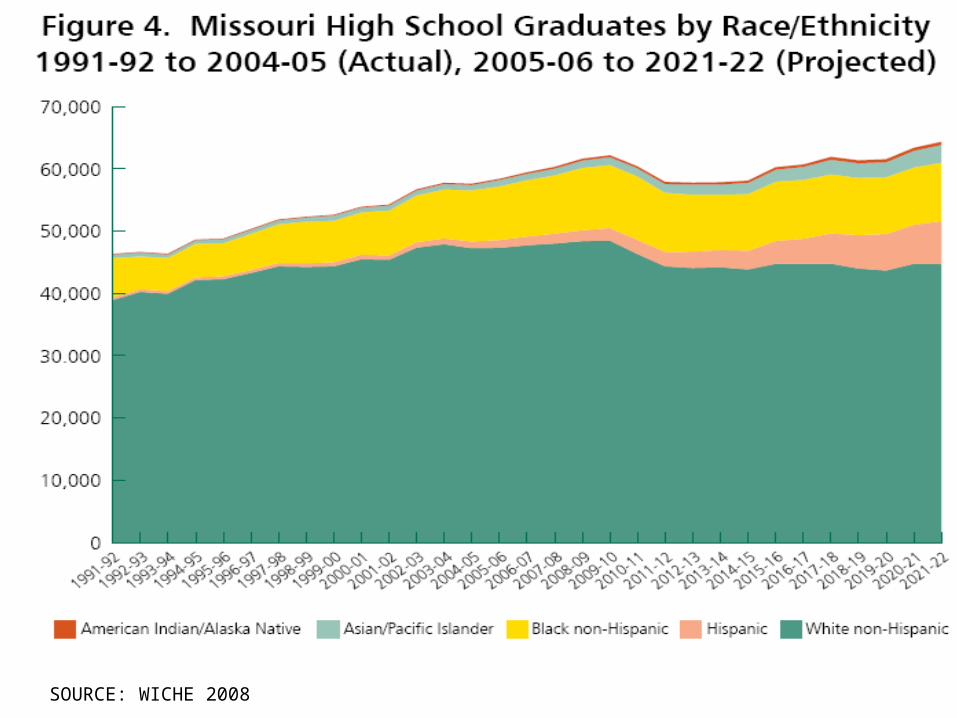
SOURCE: WICHE 2008
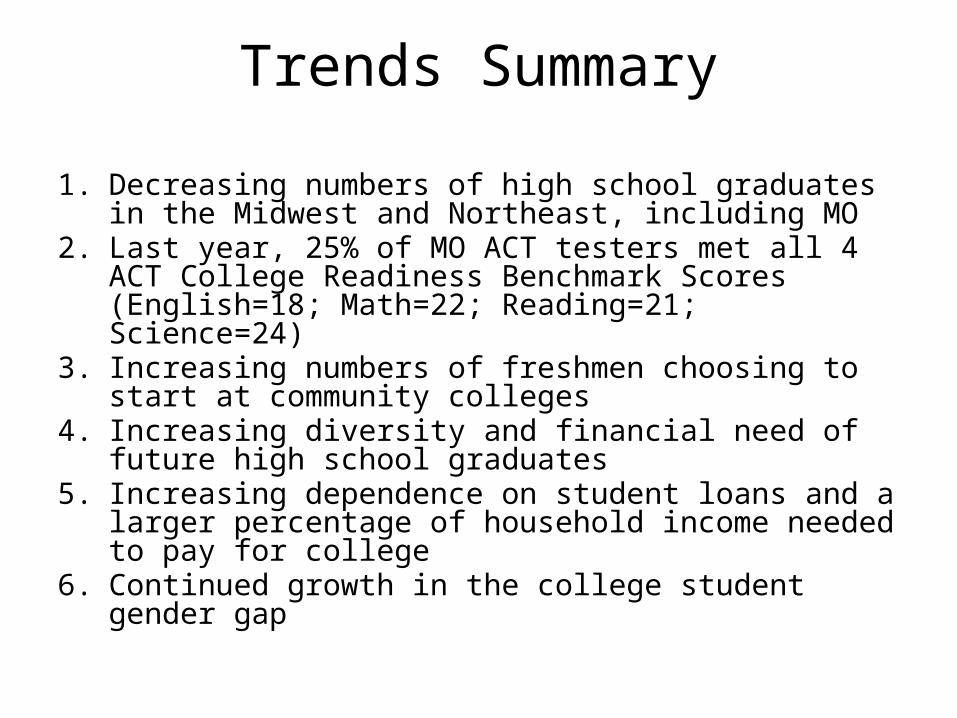
Trends Summary
1. Decreasing numbers of high school graduates in the Midwest and Northeast, including MO
2. Last year, 25% of MO ACT testers met all 4 ACT College Readiness Benchmark Scores (English=18; Math=22; Reading=21; Science=24)
3. Increasing numbers of freshmen choosing to start at community colleges
4. Increasing diversity and financial need of future high school graduates
5. Increasing dependence on student loans and a larger percentage of household income needed to pay for college
6. Continued growth in the college student gender gap
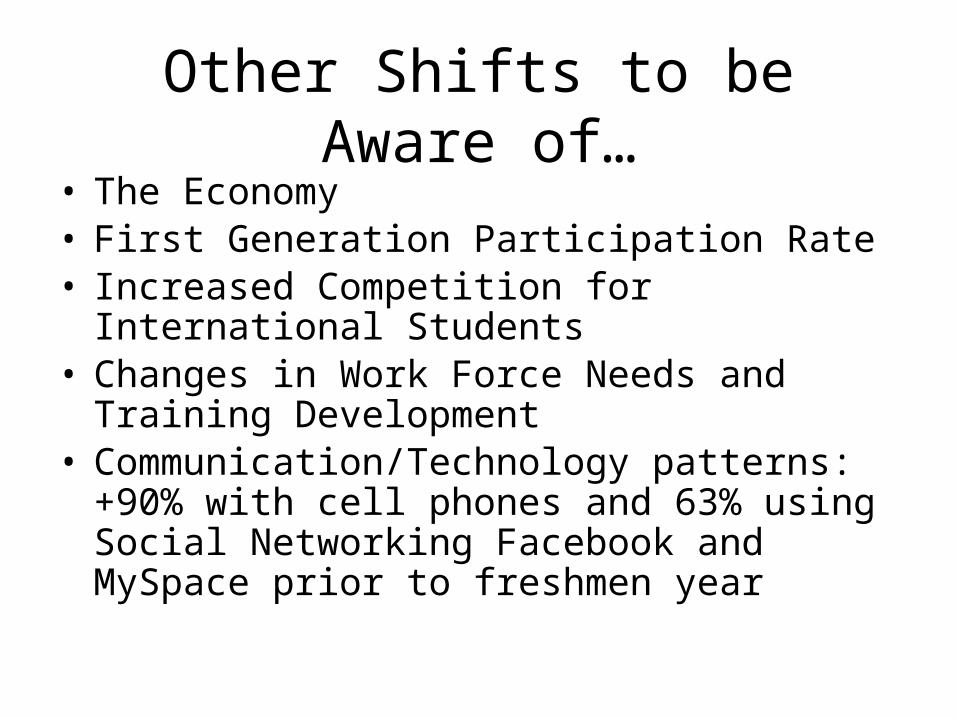
Other Shifts to be Aware of…
• The Economy• First Generation Participation Rate• Increased Competition for International Students• Changes in Work Force Needs and Training
Development• Communication/Technology patterns: +90% with cell
phones and 63% using Social Networking Facebook and MySpace prior to freshmen year
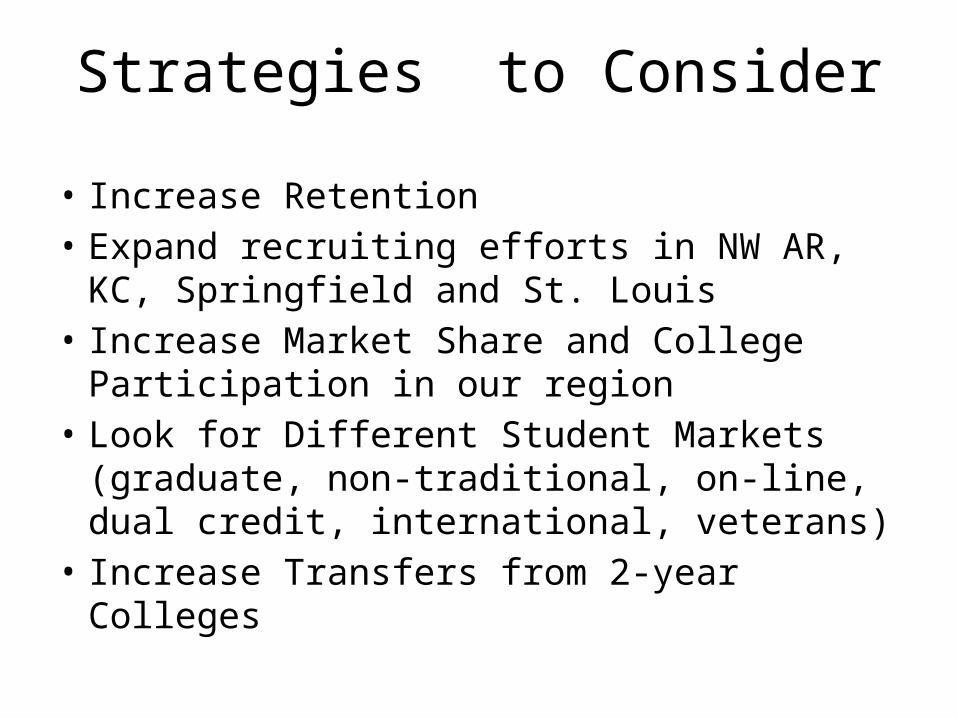
Strategies to Consider
• Increase Retention• Expand recruiting efforts in NW AR, KC,
Springfield and St. Louis• Increase Market Share and College Participation
in our region• Look for Different Student Markets (graduate,
non-traditional, on-line, dual credit, international, veterans)
• Increase Transfers from 2-year Colleges
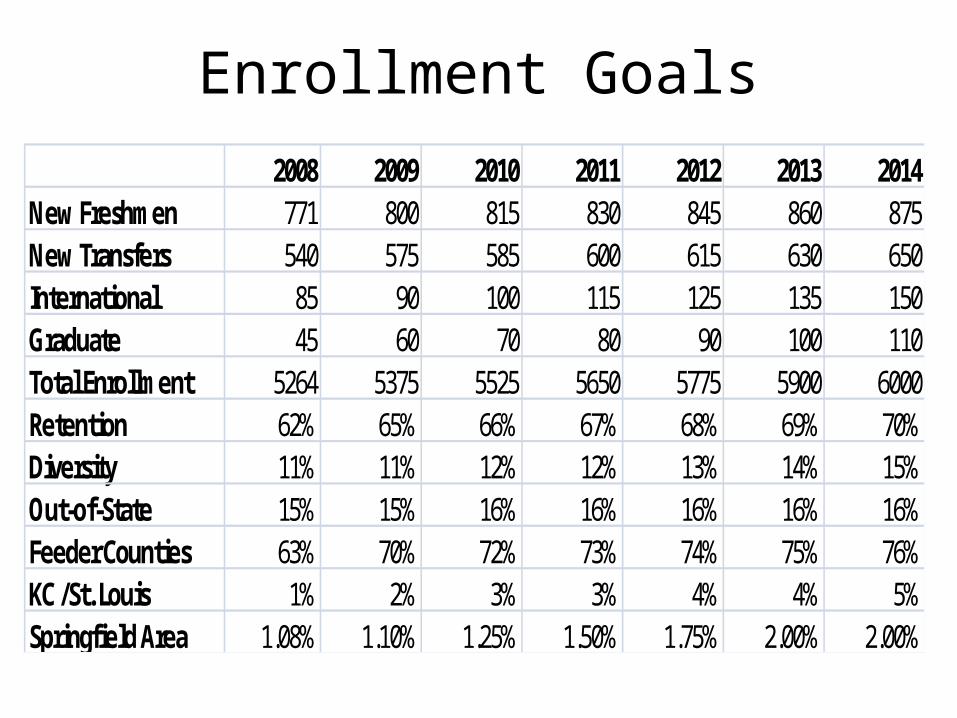
Enrollment Goals2008 2009 2010 2011 2012 2013 2014
New Freshmen 771 800 815 830 845 860 875New Transfers 540 575 585 600 615 630 650International 85 90 100 115 125 135 150Graduate 45 60 70 80 90 100 110Total Enrollment 5264 5375 5525 5650 5775 5900 6000Retention 62% 65% 66% 67% 68% 69% 70%Diversity 11% 11% 12% 12% 13% 14% 15%Out-of-State 15% 15% 16% 16% 16% 16% 16%Feeder Counties 63% 70% 72% 73% 74% 75% 76%KC /St. Louis 1% 2% 3% 3% 4% 4% 5%Springfield Area 1.08% 1.10% 1.25% 1.50% 1.75% 2.00% 2.00%
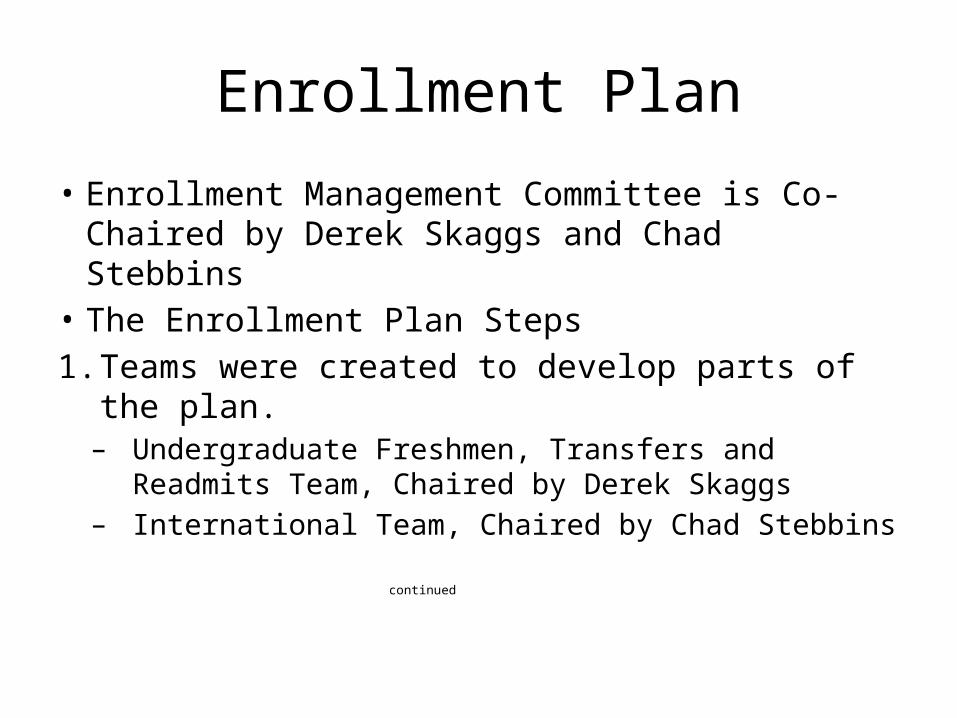
Enrollment Plan
• Enrollment Management Committee is Co-Chaired by Derek Skaggs and Chad Stebbins
• The Enrollment Plan Steps1. Teams were created to develop parts of the
plan.– Undergraduate Freshmen, Transfers and Readmits
Team, Chaired by Derek Skaggs– International Team, Chaired by Chad Stebbins
continued
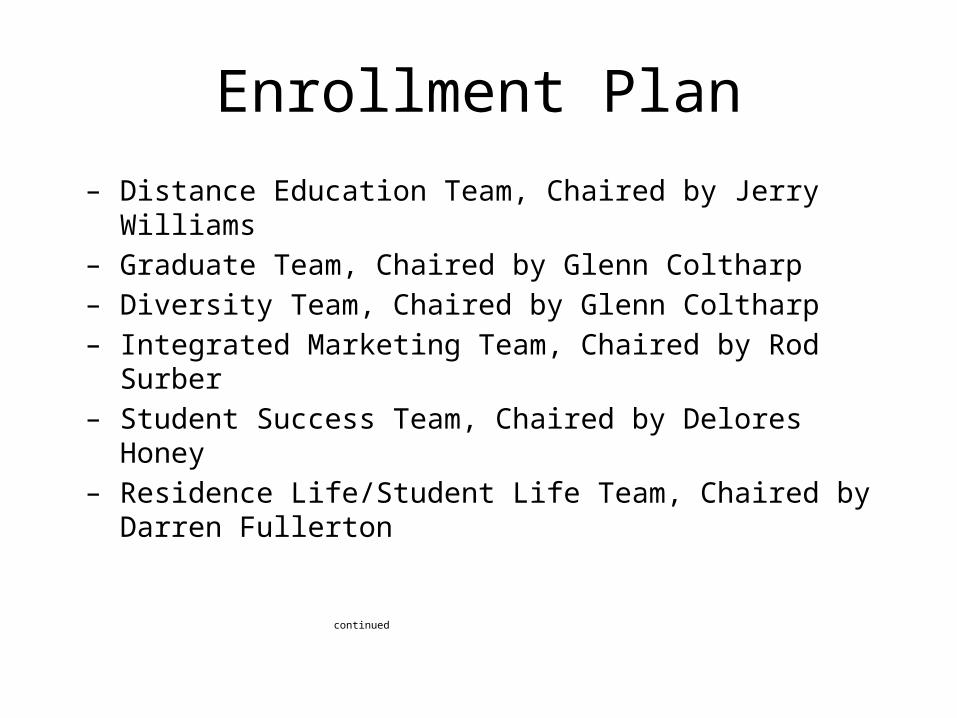
Enrollment Plan
– Distance Education Team, Chaired by Jerry Williams– Graduate Team, Chaired by Glenn Coltharp– Diversity Team, Chaired by Glenn Coltharp– Integrated Marketing Team, Chaired by Rod Surber– Student Success Team, Chaired by Delores Honey– Residence Life/Student Life Team, Chaired by
Darren Fullerton
continued
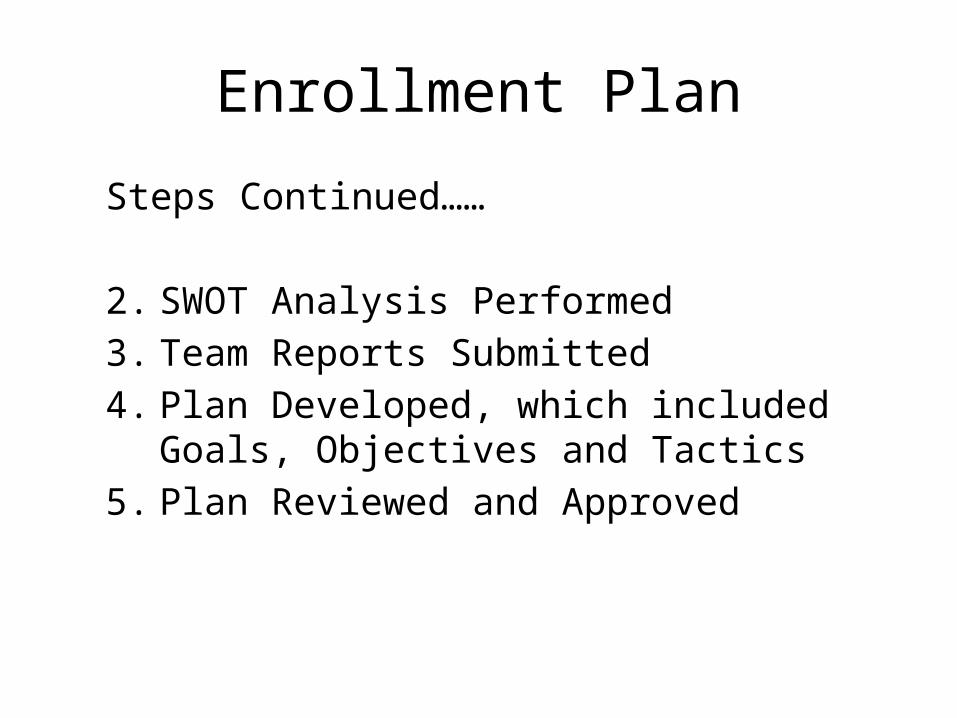
Enrollment Plan
Steps Continued……
2. SWOT Analysis Performed3. Team Reports Submitted4. Plan Developed, which included Goals,
Objectives and Tactics5. Plan Reviewed and Approved
Enrollment Plan
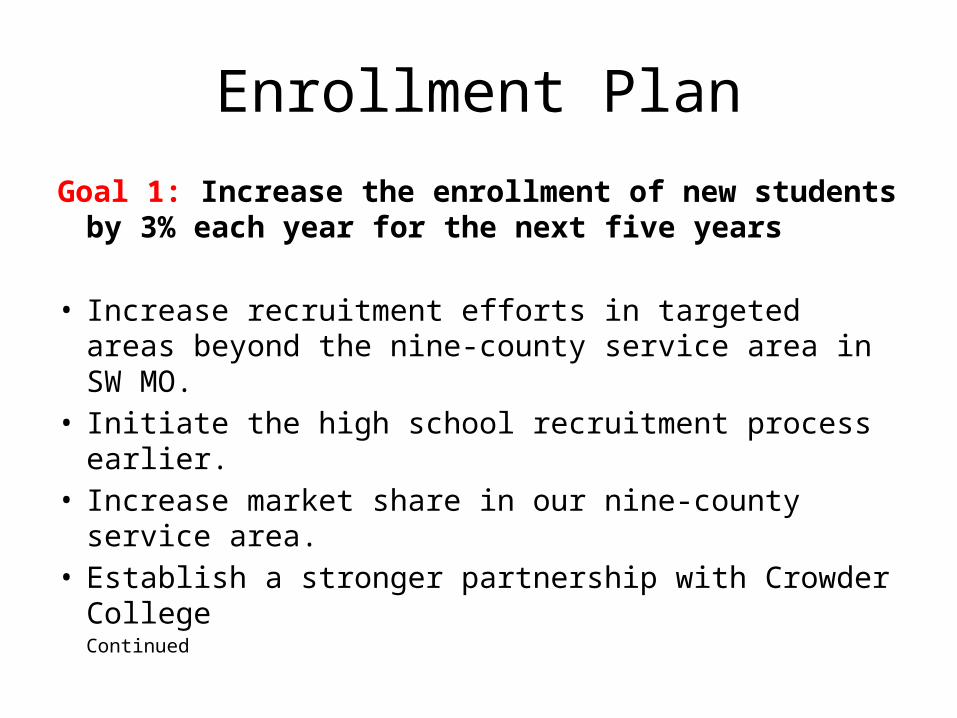
Goal 1: Increase the enrollment of new students by 3% each year for the next five years
• Increase recruitment efforts in targeted areas beyond the nine-county service area in SW MO.
• Initiate the high school recruitment process earlier.• Increase market share in our nine-county service
area.• Establish a stronger partnership with Crowder
CollegeContinued
Enrollment Plan
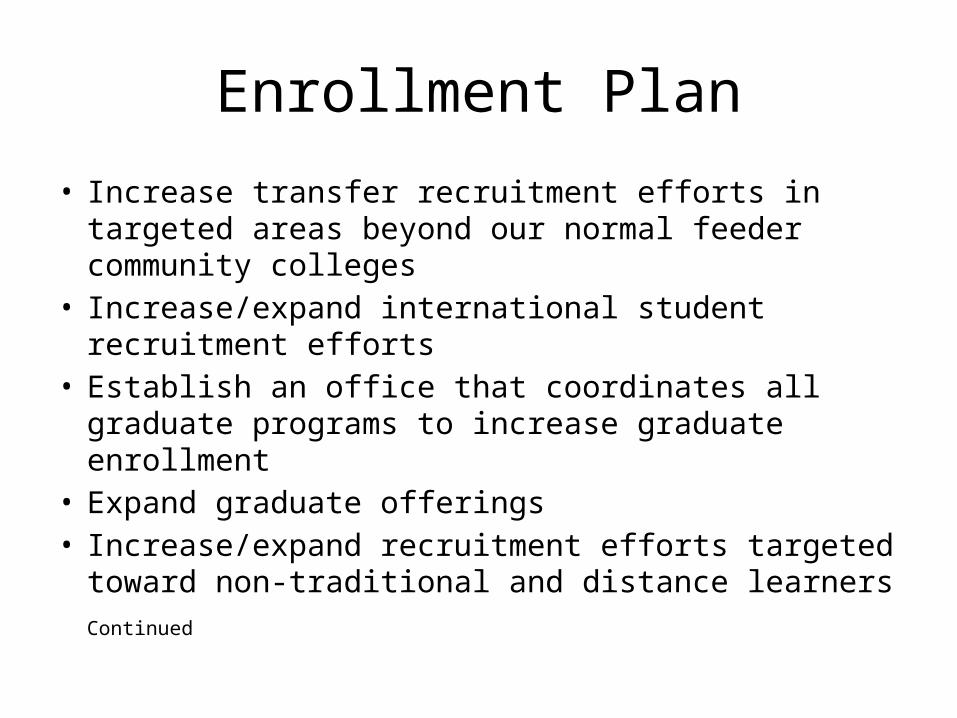
• Increase transfer recruitment efforts in targeted areas beyond our normal feeder community colleges
• Increase/expand international student recruitment efforts
• Establish an office that coordinates all graduate programs to increase graduate enrollment
• Expand graduate offerings• Increase/expand recruitment efforts targeted toward
non-traditional and distance learnersContinued
Enrollment Plan
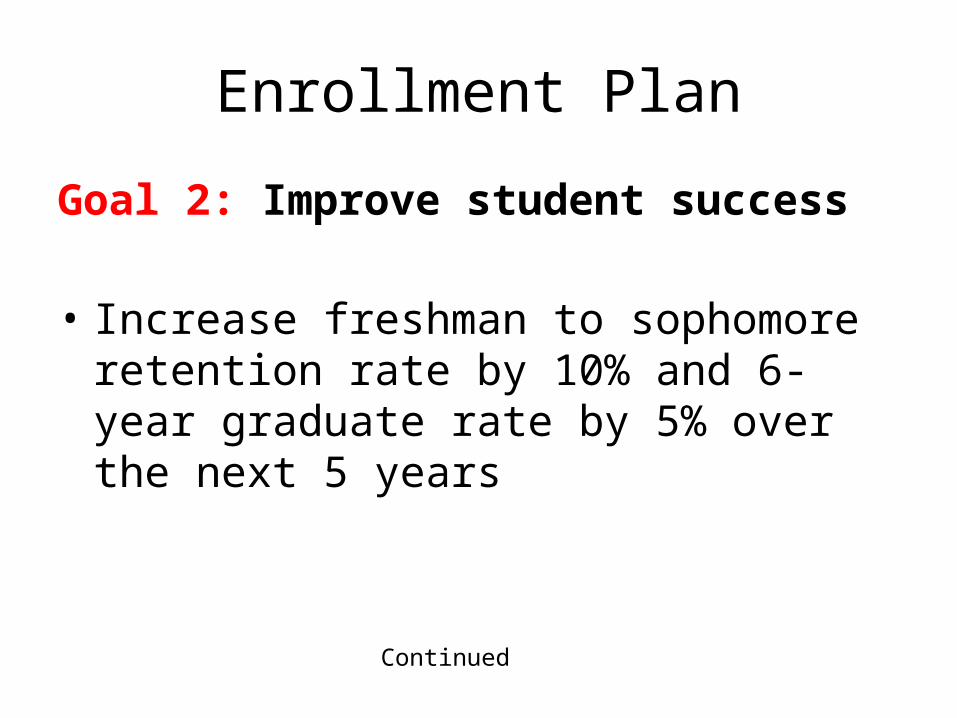
Goal 2: Improve student success
• Increase freshman to sophomore retention rate by 10% and 6-year graduate rate by 5% over the next 5 years
Continued

Enrollment Plan
Goal 3: Enhance the image of MSSU
• Expand marketing and public relations efforts in our immediate community and other targeted areas such as Springfield, Kansas City, St. Louis, Northeast Oklahoma, Southeast Kansas and Northwest Arkansas
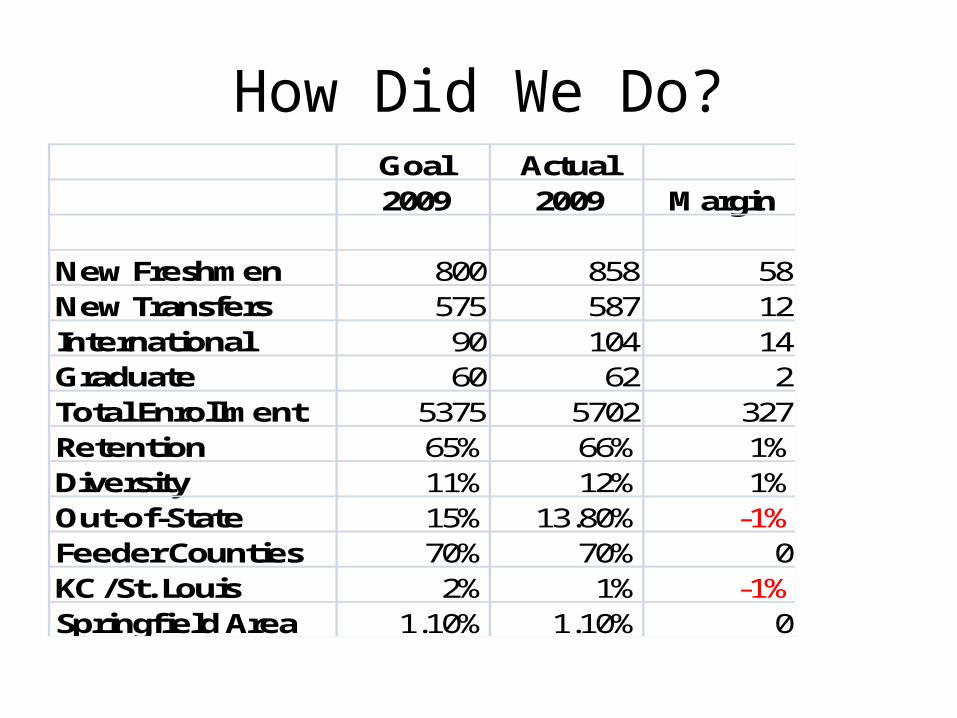
How Did We Do?Goal Actual2009 2009 Margin
New Freshmen 800 858 58New Transfers 575 587 12International 90 104 14Graduate 60 62 2Total Enrollment 5375 5702 327Retention 65% 66% 1%Diversity 11% 12% 1%Out-of-State 15% 13.80% -1%Feeder Counties 70% 70% 0KC /St. Louis 2% 1% -1%Springfield Area 1.10% 1.10% 0
The Entire Campus Must be Engaged in the Solution
“Changing demographics is not simply an issue for enrollment managers—and enrollment managers cannot “do magic” to perpetuate the status quo.
Trustees, presidents, deans, faculty, and other administrators need to engage in some serious strategic planning to project manageable goals, not only from the institution’s perspective, but also from the perspective of providing access and opportunity to this new group of students.”
SOURCE: College Board. (2005). “The Impact of Demographic Changes on Higher Education”