Embed Size (px)
Citation preview

Q4 2014 Full year report January−December
For further information please contact Investor relations at + 46 (0) 703 699 2714 / [email protected] or Public relations at + 46 (0) 703 699 2709 / [email protected]
Corrected version. Non-controlling interest for Q4 2014 has been changed to SEK 24m (from SEK 0m). No change to the full year number.
Record Sales & Profits Up
Q4 2014 Highlights ■ Net sales up 6% at constant FX & up 2% on an organic basis
■ Operating income before associated company income and non-recurring items up 2% to SEK 468m (461)
■ Total EBIT of SEK 611m (417) and net income of SEK 471m (261)
■ Basic earnings per share of SEK 6.70 (3.68)
■ Cash flow from operations of SEK 338m (396), with net debt position of SEK 362m (772) equivalent to 0.2x trailing 12 month EBITDA (excl. non-recurring items)
■ Board of Directors to propose increased annual cash dividend of SEK 11.00 (10.50) per share, representing pay-out ratio of 57% (56) excluding non-recurring items
■ Adverse FX movements to impact 2015 reported earnings (see page 2 - CEO comments)
Financial Overview
(SEKm) 2014
Oct-Dec2013
Oct-Dec2014
Jan-Dec 2013
Jan-Dec
Net sales 4,371 4,068 15,746 14,073
Growth at constant FX 6% 14% 11% 8%
Organic growth at constant FX 2% 6% 4% 5%
EBIT before associated company income and non-recurring items
468 461 1,272 1,309
Margin before associated company income and non-recurring items
10.7% 11.3% 8.1% 9.3%
Associated company income * 143 104 558 576
EBIT before non-recurring items 611 564 1,830 1,885
Non-recurring items (NRI) ** 0 -147 -155 -147
Total EBIT 611 417 1,675 1,738
Net Income 471 261 1,172 1,168
Basic Earnings per Share (SEK) 6.70 3.68 17.10 16.39
Net debt 362 772 362 772
Cash flow from operations 338 396 1,337 1,348
* Including MTG’s SEK 74m (USD 11.5m) Q1 2014 participation in USD 29.9m of non-recurring charges incurred by associated company CTC Media in Q4 2013. Including a net positive impact of SEK 18m in Q4 2014 relating to the closure of Raduga TV.
** Comprising in 2014 the SEK 160m non-cash net impairment charge related to MTG’s interest in the Ukrainian satellite pay-TV platform; SEK 70m of organisational restructuring charges and other costs; and the SEK 76m net gain from the sale of Zitius in Sweden. Comprising in 2013 the non-cash net impairment related to MTG’s interest in the Raduga Russian satellite pay-TV platform.

Q4 2014 Modern Times Group MTG AB 2(21)
President & CEO’s comments Delivering on strategy Our fourth quarter results again delivered a combination of organic and acquisition-led growth to generate higher sales and profits. Our strong cash flow generation and overall financial position are reflected in the proposed 5% higher annual dividend payment of SEK 11 per share, which is equivalent to a 57% pay-out ratio. We are delivering on our strategic plans and moving towards our objective of being the leading digital entertainment company in each of our major markets. Our Nordic broadcasting business again delivered higher sales and profits, as the growth in our online businesses more than compensated for lower linear viewing levels and declining advertising markets. The Emerging Markets businesses grew their sales on a combined basis but higher profits in the free-TV business were offset by negative pay-TV earnings impacts. We have continued to enrich the content offering across all of our platforms with exclusive deals for premium sports and studio rights. Our commitment to show the best content on multiple devices reflects media consumption trends and has driven higher online and mobile subscriber volumes and viewing shares, and led to the even broader availability of our entertainment products on third party networks. Russia The law prohibiting the sale of advertising on pay-TV channels in Russia has taken effect from the beginning of 2015. An amendment to the law that would allow advertising on pay-TV channels with 75% Russian content is now pending Presidential signature. We are continuing to explore the options available to our Russian operations and holdings in order to comply with the amendments to the Russian law regarding foreign ownership of Russian mass media companies from the beginning of 2016. We are working with a range of potential solutions, in order to best protect the interests of the stakeholders in these entertainment businesses that we have built into some of the most popular in Russia. FX & Outlook We are being impacted by significant adverse FX movements and, especially, the impact of the appreciation of the US dollar on our group-wide programming costs, and the depreciation of the Russian ruble on our Russian pay-TV channel business. Based on these changes, our US dollar content costs would be inflated by approximately SEK 200m in 2015, net of forward currency hedges, and the profits for our pay-TV emerging markets business would be negatively impacted by approximately SEK 100m in 2015. We are accelerating and extending actions to balance costs and optimize investments across the Group. The operations continue to perform well independent of the currency effects. We are both developing our existing businesses and acquiring complementary new companies. As a result, we already have established digital leadership positions in a number of fields and will add to these across our unique footprint. We are offsetting falling linear viewing with higher prices as linear TV continues to offer attractive return on investment for advertisers, and we are attracting larger and larger online audiences, while remaining well positioned to capitalize on media spend growth in the emerging markets. All of which is contributing to our positive operating performance. Jørgen Madsen Lindemann President & Chief Executive Officer “The results for the quarter again demonstrate the progress that we are making towards our strategic goals. We do have substantial FX headwinds right now, but the operations continue to perform well.”

Q4 2014 Modern Times Group MTG AB 3(21)
Significant Events during and after the quarter
1 October - Nickelodeon content on Viaplay MTG announced that it had secured the exclusive stand-alone video on-demand rights to programming from top children’s entertainment brand Nickelodeon in the Nordic region until 2020.
15 October - Russian Mass Media law amended MTG announced that the proposed amendments to the Russian Mass Media law had now become law following signature by the Russian President. The amendments reduce the permitted level of aggregate foreign ownership of Russian mass media from 50% direct ownership to 20% direct or indirect ownership or control, and apply to both existing and future ownership structures. The legislation will come into force from 1 January 2016. Please see www.ctcmedia.ru regarding the change in legislation and the actions being taken by CTC Media. MTG is also working independently with its own financial and legal advisers to decide on what actions will be taken regarding its Russian holdings and operations.
1 December - Raduga TV to close down MTG announced that the Russian digital satellite TV platform Raduga TV would stop its broadcasting services on 5 December 2014 as it had not been granted the required broadcasting license from the local media regulator. MTG also announced that it would launch five new High Definition pay-TV channels in Russia during 2015.
2 December - Viaplay inks partnership agreement with Tele2 MTG announced that Viaplay was entering a partnership with Swedish telecom operator Tele2 to offer Viaplay to Tele2’s 3.7 million mobile and mobile broadband subscribers in Sweden.
2 December - MTG prolongs golf rights MTG announced that it has reached an agreement to extend its exclusive rights to the PGA European tour, the Ryder Cup, The World Golf Championships, the British Open Championship, the US PGA Championship, the LPGA and the Asian Tour in the Nordics and the Baltics until the end of 2018.
A full list of MTG corporate events can be found at www.mtg.com.

Q4 2014 Modern Times Group MTG AB 4(21)
Operating Review Group sales were up 6% in the quarter and up 11% for the full year at constant FX, and up 2% and 4% on an organic basis for the two respective periods. The performance primarily reflected the growth in the Nordic pay-TV and Nice Entertainment content businesses.
Net Sales & y-o-y (year-on-year) Growth at constant FX(SEKm (left side); % (right side)) Q4 2014 Net Sales & y-o-y Growth at Constant FX by Segment
(SEKm (left side); % (right side))
Operating costs were up 6% in the quarter and up 12% for the full year at constant FX, and up 2% and 5% on an organic basis for the two respective periods. The increase primarily reflected the growth in the Nordic pay-TV business, investments in MTGx, and the consolidation of acquired businesses. Operating income, when excluding associated company income and non-recurring items, amounted to SEK 468m (461) in the quarter and SEK 1,272m (1,309) for the full year, with operating margins of 10.7% (11.3) and 8.1% (9.3) for the two respective periods.
EBIT excl. associated income and NRIs & EBIT margin(SEKm (left side); % (right side)) *
Q4 2014 EBIT by Segment(SEKm)
* Quarterly fluctuations reflect seasonality of advertising markets
Net interest income totalled SEK 14m (-13) in the quarter and SEK -1m (-46) for the full year. Other financial items amounted to SEK 20m (41) and SEK -23m (34), and included a SEK -1m (26) non-cash impact in the quarter and SEK -34m (-13) for the full year due to the change in value of the option element of the 250m CDON Group convertible bond, which was repurchased in December. The Group reported income before tax of SEK 645m (445) in the quarter and SEK 1,652m (1,726) for the full year, with net income of 471m (261) in the quarter and SEK 1,172m (1,168) for the full year; and basic earnings per share of SEK 6.70 (3.68) and SEK 17.10 (16.39) for the two respective periods.
-6
-3
0
3
6
9
12
15
18
0
200
400
600
800
1 000
1 200
1 400
1 600
FTVScandi
PTVNordic
FTV EM PTV EM Nice,MTGx,Radio
Net salesy-o-y sales growth at constant FX
36%
FTVScandinavia
PTV Nordic FTVEmergingMarkets
PTVEmergingMarkets
Nice, MTGx,Radio
0
50
100
150
200
250
0
3
6
9
12
15
0
500
1 000
1 500
2 000
2 500
3 000
3 500
4 000
4 500
5 000
2013Q1
2013Q2
2013Q3
2013Q4
2014Q1
2014Q2
2014Q3
2014Q4
Net salesy-o-y sales growth at constant FX
0
3
6
9
12
15
0
100
200
300
400
500
2013Q1
2013Q2
2013Q3
2013Q4
2014Q1
2014Q2
2014Q3
2014Q4
EBIT excl associated income & one-off items
EBIT margin

Q4 2014 Modern Times Group MTG AB 5(21)
Free-TV Scandinavia
Sales down 5% at constant FX but margin up
(SEKm) 2014
Oct-Dec2013
Oct-Dec2014
Jan-Dec 2013
Jan-Dec
Net sales 1,111 1,149 4,109 4,110Change y-o-y -3% 0% 0% -1%Change y-o-y at constant FX -5% 1% -2% 0%
Costs 890 935 3,476 3,442Change y-o-y -5% 4% 1% 2%
EBIT 220 214 633 668EBIT margin 19.8% 18.6% 15.4% 16.3% The sales decline at constant FX reflected the combination of lower sales in Sweden, stable sales in Denmark and higher sales in Norway. The Swedish and Danish TV advertising markets are estimated to have declined while the Norwegian market is estimated to have grown. Operating costs were down at constant FX, as the Group continued to balance investments with market conditions and audience share development.
The Swedish and Norwegian media house audience shares were down y-o-y, while the Danish share was up.
Commercial share of viewing (%) (Target audience: 15-49) Commercial share of viewing (%)
(Target audience: 15-49)
31,8
16,9
25,230,5
15,4
27,5
0
10
20
30
40
Sweden Norway Denmark
2013 Q4 2014 Q4
0
5
10
15
20
25
30
35
40
45
2013Q1
2013Q2
2013Q3
2013Q4
2014Q1
2014Q2
2014Q3
2014Q4
Sweden Norway Denmark

Q4 2014 Modern Times Group MTG AB 6(21)
Pay-TV Nordic
Sales up 6% at constant FX with margin expansion
(SEKm) 2014
Oct-Dec2013
Oct-Dec2014
Jan-Dec 2013
Jan-Dec
Net sales 1,472 1,368 5,756 5,335Change y-o-y 8% 6% 8% 5%Change y-o-y at constant FX 6% 7% 7% 6%
Costs 1,288 1,203 5,047 4,716Change y-o-y 7% 11% 7% 11%
EBIT 184 165 709 619EBIT margin 12.5% 12.0% 12.3% 11.6%
The sales growth in constant FX continued to be driven by the expansion of Viaplay. Operating costs were also up, and reflected the ongoing investments in content, technology and marketing.
The total premium subscriber base was up quarter-on-quarter (q-o-q) and y-o-y, as the growth in the third party network subscriber base more than offset the ongoing decline in the satellite base. Premium satellite ARPU continued to rise to SEK 5,254 (5,075), and was up 2% y-o-y at constant FX following the previously introduced price increases.
Premium subscribers (excluding Viaplay) (000’s) Annualised Average Revenue per Premium Satellite Subscriber
(ARPU) and Growth at constant FX (SEK (left side); % (right side))
0,0
1,3
2,5
3,8
5,0
6,3
3 000
3 500
4 000
4 500
5 000
5 500
2013Q1
2013Q2
2013Q3
2013Q4
2014Q1
2014Q2
2014Q3
2014Q4
ARPU (SEK) y-o-y growth at constant FX
0
200
400
600
800
1 000
1 200
2013Q1
2013Q2
2013Q3
2013Q4
2014Q1
2014Q2
2014Q3
2014Q4
Satellite subscribers 3rd party networks subscribers

Q4 2014 Modern Times Group MTG AB 7(21)
Free-TV Emerging Markets
Sales down 5% at constant FX but margin up
(SEKm) 2014
Oct-Dec2013
Oct-Dec2014
Jan-Dec 2013
Jan-Dec
Net sales 762 784 2,409 2,445Change y-o-y -3% 16% -1% 20%Change y-o-y at constant FX -5% 18% -3% 24%
Costs 671 701 2,278 2,230Change y-o-y -4% 23% 2% 19%
EBIT 91 83 131 215EBIT margin 12.0% 10.6% 5.4% 8.8%
The sales decline at constant FX primarily reflected lower sales in the Czech Republic, which were only partly offset by growth in the Baltics and Bulgaria. Operating costs were reduced in the Czech Republic in particular and only partly offset by the launch in Tanzania (January 2014).
Commercial share of viewing (%) * Target audience: Baltics 15-49, Czech Republic 15-54, Bulgaria 18-49
Commercial share of viewing (%) *Target audience: Baltics 15-49, Czech Republic 15-54, Bulgaria 18-49
* The source for Bulgarian audience data has been changed as of Q4 2014 from GARB to Nielsen’s Mediaresearch, which is a well-established international data source. All four quarters in 2014 as well as the full year figure are now based on the new source. The universe has also expanded from Q1 2014 to include seven new channels.
Sales for the Baltic free-TV operations were up 2% at constant FX. Sales were up in Estonia and Latvia but down in Lithuania. The Latvian and Lithuanian TV advertising markets are estimated to have declined in the quarter while the Estonian TV advertising market is estimated to have grown. The media house audience shares were down in Estonia and Lithuania but up in Latvia, and MTG remains the largest media house in each of the Baltic countries.
Sales for the Czech operation were down 15% at constant FX and reflected tough y-o-y comparisons and the highly competitive market environment. The Czech TV advertising market is estimated to have declined in the quarter, while MTG’s media house audience share was up.
The Bulgarian operation generated 12% constant FX sales growth, following both organic growth and the consolidation of Net Info (November 2013). The Bulgarian TV advertising market is estimated to have been flat in the quarter, and MTG’s media house audience share reached 41.1%.
51,8
34,136,9
50,2
36,341,1
0
10
20
30
40
50
60
Pan-Baltic Czech Republic Bulgaria
2013 Q4 2014 Q4
0
10
20
30
40
50
60
2013Q1
2013Q2
2013Q3
2013Q4
2014Q1
2014Q2
2014Q3
2014Q4
Pan-Baltic Czech Republic Bulgaria

Q4 2014 Modern Times Group MTG AB 8(21)
Pay-TV Emerging Markets
15% sales growth at constant FX with margin erosion
(SEKm) 2014
Oct-Dec2013
Oct-Dec2014
Jan-Dec 2013
Jan-Dec
Net sales 355 307 1,225 1,089Change y-o-y 16% 19% 13% 9%Change y-o-y at constant FX 15% 21% 14% 12%
Costs 330 256 1,121 960Change y-o-y 29% 1% 17% 12%
EBIT 25 51 104 129EBIT margin 7.1% 16.7% 8.5% 11.9% Please note that MTG’s 50% ownership interest in Raduga has been accounted for as an equity participation with effect from 1 January 2014 due to changes in IFRS rules. Results for prior periods have been adjusted in the Group’s reporting for the purposes of comparison. Raduga ceased broadcasting on 5 December 2014, which resulted in a net positive impact of SEK 18m in Q4 2014.
The sales and cost growth at constant FX reflected the consolidation of Trace (July 2014).
The wholesale mini-pay channel business has added 39 million subscriptions y-o-y, with an underlying decrease of 3 million when excluding the contribution from Trace. The combined satellite pay-TV subscriber base continued to decline, which was primarily due to the geopolitical situation in Ukraine.
The non-recurring and non-cash impairment of the intangible assets related to the satellite platforms in Russia and Ukraine (in Q4 2013 and Q2 2014, respectively) are not included in the segment operating results.
Please see page 12 (Other Information) regarding the risks and uncertainties arising from the amendments to the Russian Mass Media law.
Wholesale mini-pay channel subscriptions * (000's) Satellite subscribers **
(000's)
* Including Trace from Q3 2014. ** Subscriber numbers have been restated to exclude Raduga subscribers following the closure of the business.
20 000
40 000
60 000
80 000
100 000
120 000
140 000
2013Q1
2013Q2
2013Q3
2013Q4
2014Q1
2014Q2
2014Q3
2014Q4
0
50
100
150
200
250
300
350
400
2013Q1
2013Q2
2013Q3
2013Q4
2014Q1
2014Q2
2014Q3
2014Q4

Q4 2014 Modern Times Group MTG AB 9(21)
CTC Media The Group reports its equity participation in the earnings of CTC Media, Inc. with a one quarter time lag due to the fact that CTC Media reports its financial results after MTG. MTG’s participation in CTC Media’s US dollar reported results is translated into Swedish krona at the average currency exchange rate for the MTG reporting period. The Group owned 37.9% (37.9%) of CTC Media’s issued shares at the end of the quarter. CTC Media reported its third quarter financial results on 29 October 2014. Please see www.ctcmedia.ru for further information about CTC Media.
Please see page 12 (Other Information) regarding the risks and uncertainties that stems from the new Russian Mass Media law.
MTG participation in CTC Media results * (SEKm) CTC Media dividends received by MTG
(SEKm)
* Including MTG’s USD 11.5m Q1 2014 participation in USD 29.9m of non-recurring charges incurred by associated company CTC Media in Q4 2013. Nice Entertainment, MTGx, MTG Radio
16% organic sales growth & profitable
(SEKm) 2014
Oct-Dec2013
Oct-Dec2014
Jan-Dec 2013
Jan-Dec
Net sales 815 593 2,778 1,537Change y-o-y 37% 87% 81% 8%Change y-o-y at constant FX 36% 89% 80% 10%
Costs 806 581 2,809 1,586Change y-o-y 39% 84% 77% 12%
EBIT 9 11 -32 -49EBIT margin 1.1% 1.9% -1.1% -3.2%
The sales growth at constant FX was primarily organic but also reflected the consolidation of Nice Entertainment (November 2013). The organic growth in the content production businesses continued to be very healthy driven by Strix Drama, Paprika Latino and DRG, while the radio businesses reported double digit growth.
The increase in operating costs also reflected the organic growth, the consolidation of the acquired businesses, and ongoing investments by MTGx.
0
50
100
150
200
250
2013Q1
2013Q2
2013Q3
2013Q4
2014Q1
2014Q2
2014Q3
2014Q4
0
20
40
60
80
100
2013Q1
2013Q2
2013Q3
2013Q4
2014Q1
2014Q2
2014Q3
2014Q4

Q4 2014 Modern Times Group MTG AB 10(21)
Financial Review
Cash Flow
Net cash flow from operations Cash flow from operations before changes in working capital amounted to SEK 338m (396) in the quarter and SEK 1,337m (1,348) for the full year, and included CTC Media dividend payments of SEK 82m (62) and SEK 297m (246), respectively. Depreciation and amortisation charges totaled SEK 33m (63) in the quarter and SEK 168m (190) for the full year. The Group reported a SEK 288m (16) change in working capital in the quarter and SEK -143m (-130) for the full year. Net cash flow from operations totaled SEK 625m (412) and SEK 1,194m (1,218) for the two respective periods.
Investing activities Acquisitions of subsidiaries amounted to SEK - (678m) in the quarter and SEK 223m (905) for the full year, while cash flow from the divestment of subsidiaries totaled SEK 230m (-) for the full year. Group capital expenditure on tangible and intangible assets totaled SEK 75m (100) in the quarter and SEK 217m (319) for the full year. Total cash flow used in investing activities therefore amounted to SEK 75m (778) and SEK 211m (1,224) for the two respective periods.
Acquisitions and divestments The sale of 80% of Zitius Service Delivery AB to TeliaSonera AB was completed in May 2014 and gave rise to a capital gain of SEK 76m.
Total cash flow related to the acquisition of 75% of Trace Partners SAS in June 2014 amounted to SEK 280m. The agreement also includes an option to acquire the remaining 25% of the shares in 2017 or 2018. The preliminary fair value for the net identifiable assets including goodwill was SEK 357m, of which SEK 267m comprised goodwill (existing distribution networks and future potential new customers and programmes) and SEK 72m related to other intangible assets. Transaction costs totalled SEK 12m and are reported in the ‘Other operating expenses’ line of the Group’s income statement. Trace’s results are reported within the Group’s ‘Pay-TV Emerging Markets’ business segment. Acquisitions during 2013 related to Nice Group, DRG and Novemberfilm, for a total consideration of SEK 905m for the full year.
Financing activities Cash flow from financing activities amounted to SEK -367m (687) in the quarter and SEK -1,204m (103) for the full year, and primarily comprised a decrease in borrowings of SEK -618m (750) in the quarter and SEK -778m (876) to SEK 1,055m (1,829), which compared with SEK 1,649m at the end of the third quarter of 2014. Further, the SEK 250m CDON convertible bond was repurchased during the quarter. The full year figure also comprised a SEK 700m (666) annual cash dividend to the shareholders. The net change in cash and cash equivalents therefore amounted to SEK 183m (321) in the quarter and SEK -221m (97) for the full year. The Group had cash and cash equivalents of SEK 643m (765) at the end of the period, compared to SEK 382m as at 30 September 2014.
Net debt & Liquid funds The Group's net debt position, which is defined as cash and cash equivalents and interest bearing assets less interest bearing liabilities, amounted to SEK 362m (772) at the end of the period, and compared to a net debt position of SEK 928m at the end of the third quarter. The Group’s available

Q4 2014 Modern Times Group MTG AB 11(21)
liquid funds, including unutilised credit and overdraft facilities, totaled SEK 6,498m (5,569) at the end of the period, and compared to SEK 6,150m as at 30 September 2014.
Net debt to equity (%)
Net debt to last 12 months’ EBITDA (excl. NRI) (Ratio)
Holdings in listed companies The book value of the Group’s shareholding in associated company CTC Media was SEK 1,984m (1,931) at the end of the period, and compared with the SEK 2,269m (USD 292m) public equity market value of the shareholding as at the close of trading on the last business day of December 2014.
Related Party Transactions Related party transactions are of the same character and of similar amounts as the transactions described in the 2013 Annual Report.
Parent Company Modern Times Group MTG AB is the Group’s parent company and responsible for Group-wide management, administration and finance functions.
(SEKm) 2014
Oct-Dec2013
Oct-Dec2014
Jan-Dec 2013
Jan-Dec
Net sales 12 10 45 46Net interest and other financial terms 123 122 435 536Income before tax and appropriations 49 40 207 318
Net interest and other financial items were stable in the quarter and lower for the full year, which primarily reflected the lower prevailing interest rate levels. The parent company had cash and cash equivalents of SEK 402m (429) at the end of the period, compared to SEK 127m at the end of the third quarter of 2014. SEK 5,750m (4,800) of the SEK 5,750m of total available credit facilities, including a SEK 250m overdraft facility, was unutilised at the end of the reporting period.
The total number of outstanding shares was 66,630,189 (66,622,711) at the end of the quarter and excluded the 865,000 Class C shares and 151,935 Class B shares held by MTG in treasury. The total number of issued shares did not change during the period.
0
10
20
30
2013Q1
2013Q2
2013Q3
2013Q4
2014Q1
2014Q2
2014Q3
2014Q4
-0,5
0,0
0,5
1,0
1,5
2,0
2013Q1
2013Q2
2013Q3
2013Q4
2014Q1
2014Q2
2014Q3
2014Q4

Q4 2014 Modern Times Group MTG AB 12(21)
Other Information Accounting policies This Interim report has been prepared according to ‘IAS 34 Interim Financial Reporting’ and ‘The Annual Accounts Act’. The interim report for the parent company has been prepared according to the Annual Accounts Act - Chapter 9 ‘Interim Report’.
The Group's consolidated accounts and the parent company accounts have been prepared according to the same accounting policies and calculation methods as were applied in the preparation of the 2013 Annual Report, with the exception of the consolidation of joint ventures, which, in accordance with IFRS 11 Joint Arrangements, is accounted for using the equity method instead of the proportional method. The figures for 2013 have been restated accordingly for the purpose of comparison. Further, IFRS 10 Consolidated Financial Statements replaced IAS 27 Consolidated and Separate Financial Statements, which identifies the concept of control. The new standard has not had any impact on which companies are consolidated in the Group’s accounts.
Risks and uncertainties Significant risks and uncertainties exist for the Group and the parent company. MTG has large scale business interests in Russia, which are affected by recent amendments to the Russian Mass Media Law to reduce the permitted level of aggregate foreign ownership in Russian mass media companies to 20% direct or indirect ownership or control from the beginning of 2016. These changes apply to both MTG’s pay-TV businesses and to MTG’s 38% shareholding in CTC Media Inc. (“CTC Media”), the Delaware (US) registered and NASDAQ (US) listed company that owns the leading Russian independent media company. As of today, the existing ownership structures of these businesses do not comply with the amended Law and therefore will need to take steps to come into compliance with the Law before the end of 2015. Furthermore, the EU and US have imposed sanctions on named parties in Russia that have ownership interests in Telcrest Investments Limited, which owns approximately 25% of CTC Media, and could therefore limit the potential outcomes for CTC Media. MTG is working closely with its advisors to best protect its various Russian business interests, but changes to the structure or ownership of CTC Media and MTG’s pay-TV businesses could result in loss of value for MTG shareholders.
The risks and uncertainties also include the prevailing economic and business environments in other markets and the impact of the Eurozone, as well as the Crimean crisis; commercial risks related to expansion into new territories; other political and legislative risks related to changes in rules and regulations in the various territories in which the Group operates; exposure to foreign exchange rate movements and the US dollar, Russian Rubles and Euro linked currencies in particular; and the emergence of new technologies and competitors. Risks and uncertainties are also described in more detail in the 2013 Annual Report, which is available at www.mtg.com.
2015 Annual General Meeting The 2015 Annual General Meeting will be held on Tuesday 19 May 2015 in Stockholm. Shareholders wishing to have matters considered at the Meeting should submit their proposals in writing to [email protected] or to The Company Secretary, Modern Times Group MTG AB, Box 2094, SE-103 13 Stockholm, Sweden, at least seven weeks before the Meeting, in order that such proposals may be included in the notices to the Meeting. Further details of the time and place, and when and how to register will be published in advance of the Meeting.
The Board of Directors will propose the payment of an annual ordinary cash dividend of SEK 11.00 (10.50) per share to the Annual General Meeting of shareholders in May. The total proposed dividend

Q4 2014 Modern Times Group MTG AB 13(21)
payment would therefore amount to approximately SEK 734m (700), based on the maximum potential number of outstanding ordinary shares. The Board of Directors will propose that the remainder of the Group’s retained earnings for the year ended 31 December 2014 be carried forward into the accounts for 2015. The proposal is in line with the dividend policy to distribute a minimum of 30 per cent of each year’s recurring net profit to shareholders in the form of an annual ordinary cash dividend.
Financial calendar MTG’s financial results for the first quarter 2015 will be published on 22 April 2015.
The Annual Report will be made available at www.mtg.com and from the Company’s head office at Skeppsbron 18, Stockholm, Sweden, no later than 10 April 2015.
Conference Call The company will host a conference call today at 09.00 Stockholm local time, 08.00 London local time and 03.00 New York local time. To participate in the conference call, please dial:
Sweden: +46 (0) 8 5033 6538 UK: +44 (0) 20 3427 1905 US: +1 646 254 3367
The access pin code for the call is 7523722. To listen to the conference call online and for further information, please visit www.mtg.com.
* * *
Any questions? www.mtg.com Facebook: facebook.com/MTGAB Twitter: @mtgab [email protected] (or Per Lorentz +46 73 699 27 09) [email protected] (or Stefan Lycke +46 73 699 27 14)
London, 4 February 2015 Jørgen Madsen Lindemann, President & Chief Executive Officer
Modern Times Group MTG AB Skeppsbron 18 P.O. Box 2094 SE-103 13 Stockholm, Sweden Registration number: 556309-9158 MTG (Modern Times Group MTG AB (publ.)) is an international entertainment group. Our operations span six continents and include TV channels and platforms, online services, content production businesses and radio stations. We are also the largest shareholder in CTC Media, which is Russia’s leading independent media company. Our shares are listed on Nasdaq OMX Stockholm (‘MTGA’ and ‘MTGB’).
The information in this announcement is that which MTG is required to disclose according to the Securities Market Act and/or the Financial Instruments Trading Act, and was released at 07:30 CET on 4 February 2015.
This report has not been reviewed by the Group’s auditors.

Q4 2014 Modern Times Group MTG AB 14(21)
Condensed consolidated income statement
(SEKm) 2014
Oct-Dec2013
Oct-Dec 2014
Jan-Dec 2013
Jan-Dec
Net sales 4,371 4,068 15,746 14,073Cost of goods and services -2,706 -2,380 -9,779 -8,471Gross income 1,665 1,688 5,967 5,601
Selling and administrative expenses -1,193 -1,169 -4,492 -4,121Other operating revenues and expenses, net -3 -59 -203 -171Share of earnings in associated companies and joint ventures 143 104 558 576One-off items 0 -147 -155 -147Operating income (EBIT) 611 417 1,675 1,738
Net interest 14 -13 -1 -46Other financial items 20 41 -23 34Income before tax 645 445 1,652 1,726
Tax -174 -184 -480 -558Net income for the period 471 261 1,172 1,168
Attributable to: Equity holders of the parent 446 245 1,139 1,092Non-controlling interest 24 16 33 76Net income for the period 471 261 1,172 1,168
Basic earnings per share (SEK) 6.70 3.68 17.10 16.39Diluted earnings per share (SEK) 6.69 3.67 17.07 16.37 Condensed consolidated statement of comprehensive income
(SEKm) 2014
Oct-Dec2013
Oct-Dec 2014
Jan-Dec 2013
Jan-Dec
Net income for the period 471 261 1,172 1,168Other comprehensive income Items that are or may be reclassified to profit or loss net of tax: Currency translation differences 82 -10 424 -141Cash flow hedge 64 8 136 15Share of other comprehensive income of associates -322 20 -407 -76Other comprehensive income for the period -175 18 153 -202
Total comprehensive income for the period 296 279 1,325 966
Total comprehensive income attributable to: Equity holders of the parent 294 273 1,316 900Non-controlling interest 2 6 9 66Total comprehensive income for the period 296 279 1,325 966
Shares outstanding at the end of the period 66,630,189 66,622,711 66,630,189 66,622,711
Basic average number of shares outstanding 66,630,189 66,622,711 66,627,771 66,619,668Diluted average number of shares outstanding 66,729,184 66,711,259 66,709,088 66,697,519
Q4 2014 Modern Times Group MTG AB 15(21)
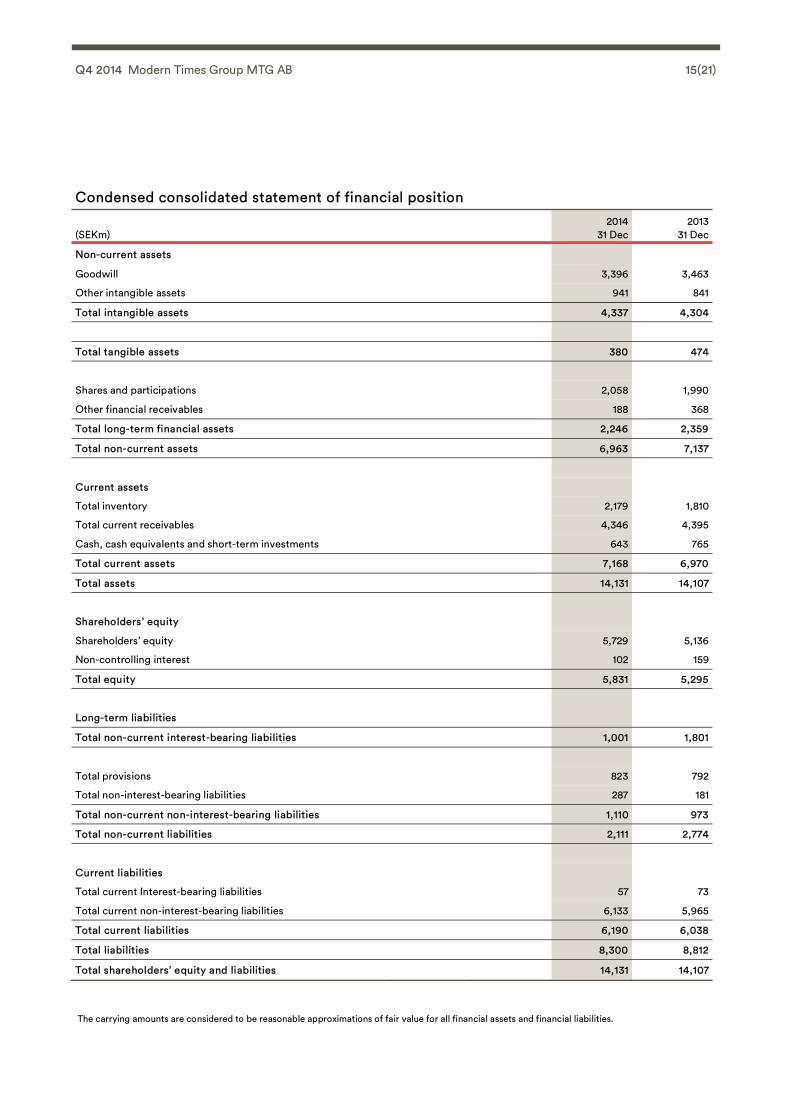
Condensed consolidated statement of financial position
(SEKm) 2014
31 Dec 2013
31 Dec
Non-current assets
Goodwill 3,396 3,463
Other intangible assets 941 841
Total intangible assets 4,337 4,304
Total tangible assets 380 474
Shares and participations 2,058 1,990
Other financial receivables 188 368
Total long-term financial assets 2,246 2,359
Total non-current assets 6,963 7,137
Current assets
Total inventory 2,179 1,810
Total current receivables 4,346 4,395
Cash, cash equivalents and short-term investments 643 765
Total current assets 7,168 6,970
Total assets 14,131 14,107
Shareholders’ equity
Shareholders’ equity 5,729 5,136
Non-controlling interest 102 159
Total equity 5,831 5,295
Long-term liabilities
Total non-current interest-bearing liabilities 1,001 1,801
Total provisions 823 792
Total non-interest-bearing liabilities 287 181
Total non-current non-interest-bearing liabilities 1,110 973
Total non-current liabilities 2,111 2,774
Current liabilities
Total current Interest-bearing liabilities 57 73
Total current non-interest-bearing liabilities 6,133 5,965
Total current liabilities 6,190 6,038
Total liabilities 8,300 8,812
Total shareholders’ equity and liabilities 14,131 14,107
The carrying amounts are considered to be reasonable approximations of fair value for all financial assets and financial liabilities.

Q4 2014 Modern Times Group MTG AB 16(21)
Condensed consolidated statement of cash flows
(SEKm) 2014
Oct-Dec2013
Oct-Dec 2014
Jan-Dec 2013
Jan-Dec
Cash flow from operations 338 396 1,337 1,348
Changes in working capital 288 16 -143 -130
Net cash flow from operations 625 412 1,194 1,218
Proceeds from sales of shares 0 - 230 -
Acquisitions of subsidiaries and associates 0 -678 -223 -905
Investments in other non-current assets -75 -100 -217 -319
Cash flow used in investing activities -75 -778 -211 -1,224
Net change in loans -618 750 -778 876
Dividends to shareholders - - -700 -666
Other cash flow from/to financing activities 250 -62 273 -106
Cash flow used in financing activities -367 687 -1,204 103
Net change in cash and cash equivalents for the period 183 321 -221 97
Cash and cash equivalents at the beginning of the period 382 447 765 739
Translation differences in cash and cash equivalents 78 -4 99 -71
Cash and cash equivalents at end of the period 643 765 643 765 Condensed consolidated statement of changes in equity
(SEKm) 2014
31 Dec 2013
31 Dec
Opening balance 5,295 5,134
Net loss/income for the year 1,172 1,168
Other comprehensive income for the year 153 -202
Total comprehensive loss/income for the year 1,325 966
Effect of employee share option programmes 1 18
Share of option changes in equity of associates 4 -62
Change in non-controlling interests -6 3
Dividends to shareholders -700 -666
Dividends to non-controlling interests -88 -98
Closing balance 5,831 5,295
Q4 2014 Modern Times Group MTG AB 17(21)
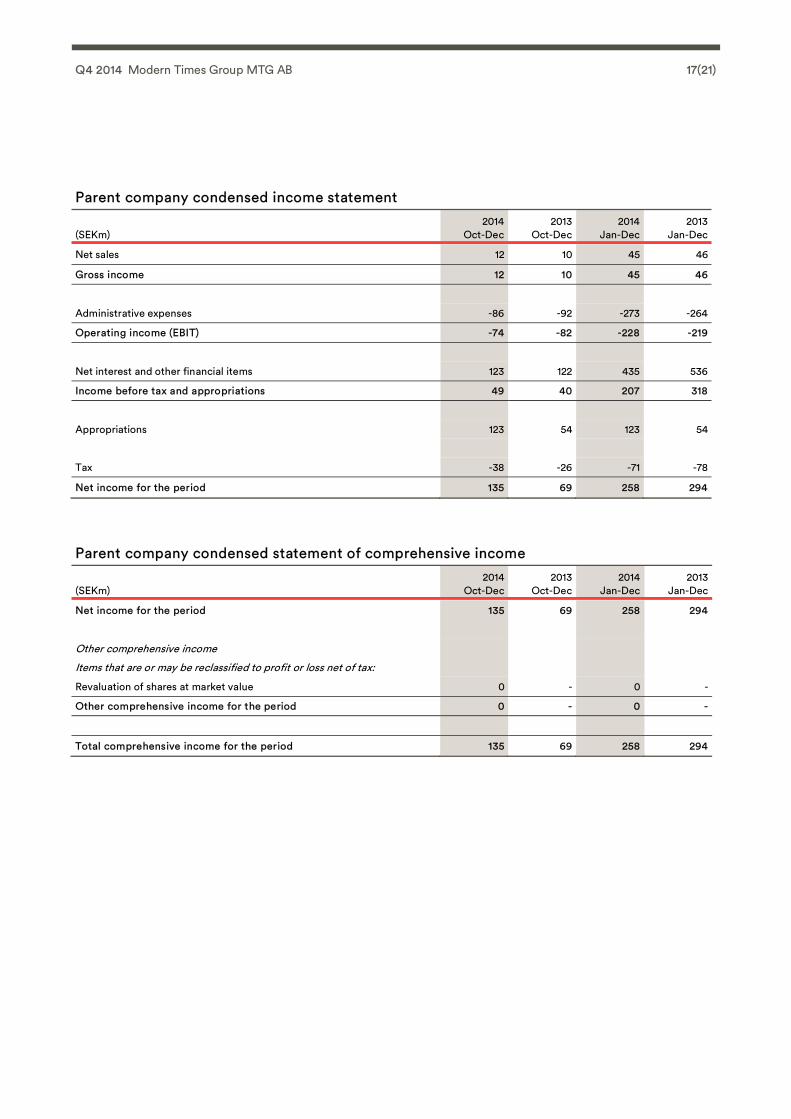
Parent company condensed income statement
(SEKm) 2014
Oct-Dec2013
Oct-Dec 2014
Jan-Dec 2013
Jan-Dec
Net sales 12 10 45 46
Gross income 12 10 45 46
Administrative expenses -86 -92 -273 -264
Operating income (EBIT) -74 -82 -228 -219
Net interest and other financial items 123 122 435 536
Income before tax and appropriations 49 40 207 318
Appropriations 123 54 123 54
Tax -38 -26 -71 -78
Net income for the period 135 69 258 294
Parent company condensed statement of comprehensive income
(SEKm) 2014
Oct-Dec2013
Oct-Dec 2014
Jan-Dec 2013
Jan-Dec
Net income for the period 135 69 258 294
Other comprehensive income
Items that are or may be reclassified to profit or loss net of tax:
Revaluation of shares at market value 0 - 0 -
Other comprehensive income for the period 0 - 0 -
Total comprehensive income for the period 135 69 258 294

Q4 2014 Modern Times Group MTG AB 18(21)
Parent company condensed balance sheet
(SEKm) 2014
31 Dec 2013
31 Dec
Non-current assets
Capitalized expenditure 2 -
Machinery and equipment 1 2
Shares and participations 6,398 6,397
Other financial receivables 566 438
Total non-current assets 6,967 6,838
Current assets
Current receivables 10,273 13,196
Cash, cash equivalents and short-term investments 402 429
Total current assets 10,675 13,626
Total assets 17,642 20,463
Shareholders’ equity
Restricted equity 338 338
Non-restricted equity 7,124 7,565
Total equity 7,462 7,904
Long-term liabilities
Interest-bearing liabilities 1,024 1,779
Provisions 2 4
Non-interest-bearing liabilities 294 16
Total long-term liabilities 1,320 1,798
Current liabilities
Other interest-bearing liabilities 8,294 7,259
Non-interest-bearing liabilities 566 3,503
Total current liabilities 8,860 10,762
Total shareholders’ equity and liabilities 17,642 20,463

Q4 2014 Modern Times Group MTG AB 19(21)
Net Sales − Business segments
(SEKm) Q1
2013 Q2
2013Q3
2013Q4
2013Full year
2013Q1
2014Q2
2014 Q3
2014 Q4
2014Full year
2014
Free-TV Scandinavia 993 1,080 887 1,149 4,110 1,034 1,065 900 1,111 4,109
Pay-TV Nordic 1,310 1,349 1,308 1,368 5,335 1,404 1,439 1,441 1,472 5,756
Free-TV Emerging Markets 512 692 457 784 2,445 504 680 463 762 2,409
- Baltics, Czech & Bulgaria 478 648 422 741 2,289 472 640 431 721 2,264Pay-TV Emerging Markets 245 269 268 307 1,089 266 271 333 355 1,225
Central operations, elim & others -54 -53 -39 -52 -197 -48 -61 -92 -93 -294
Total Viasat Broadcasting 3,007 3,337 2,881 3,557 12,783 3,159 3,394 3,045 3,607 13,205
Nice, MTGx, Radio 242 336 367 593 1,537 483 799 681 815 2,778
Group central operations 56 55 69 58 237 60 57 57 61 235
Eliminations -96 -122 -126 -140 -484 -104 -141 -115 -112 -472
TOTAL OPERATIONS 3,209 3,605 3,191 4,068 14,073 3,597 4,109 3,669 4,371 15,746
Organic Growth at constant FX 2.3% 5.6% 4.8% 6.0% 4.7% 5.3% 2.7% 5.5% 2.4% 3.8%
FX -2.6% -3.1% -0.2% -1.0% -1.7% -0.4% 0.6% 2.5% 1.8% 1.2%
Divestments -3.8% -2.6% 0.0% 0.0% -1.7% 0.0% -0.4% -1.3% -1.1% -0.7%
Acquisitions 3.0% 3.0% 4.4% 7.8% 4.6% 7.2% 11.1% 8.3% 4.3% 7.6%
Total growth -1.1% 2.9% 9.1% 12.8% 6.0% 12.1% 14.0% 15.0% 7.5% 11.9% Operating income (EBIT) − Business segments
(SEKm) Q1
2013 Q2
2013Q3
2013Q4
2013Full year
2013Q1
2014Q2
2014 Q3
2014 Q4
2014Full year
2014
Free-TV Scandinavia 127 209 118 214 668 92 200 120 220 633
Pay-TV Nordic 146 152 156 165 619 155 184 186 184 709
Free-TV Emerging Markets 26 140 -34 83 215 -25 121 -57 91 131
- Baltics, Czech & Bulgaria 38 145 -24 92 251 -12 137 -35 109 199
Pay-TV Emerging Markets -1 52 27 51 129 22 19 39 25 104
Associated Company CTC Media 235 113 127 111 586 182 116 109 133 540
Central operations, elim & others -2 -14 -4 -14 -34 0 0 -18 18 0
Total Viasat Broadcasting 531 651 391 610 2,184 426 640 378 673 2,117
Nice, MTGx, Radio -17 3 -46 11 -49 -64 11 12 9 -32
Group central ops & elims -60 -76 -57 -57 -250 -61 -62 -61 -71 -255
TOTAL OPERATIONS EXCL NRI 454 578 289 564 1,885 301 589 329 611 1,830
Non-recurring items - - - -147 -147 - -155 0 0 -155
TOTAL EBIT 454 578 289 417 1,738 301 434 329 611 1,675
TOTAL EXCL CTC MEDIA AND NRI 219 466 161 454 1,300 119 473 221 478 1,290

Q4 2014 Modern Times Group MTG AB 20(21)
Key performance indicators
Q1
2013 Q2
2013Q3
2013Q4
2013Full year
2013Q1
2014Q2
2014 Q3
2014 Q4
2014Full year
2014
GROUP Sales growth (%) -1.1 2.9 9.1 12.8 6.0 12.1 14.0 15.0 7.5 11.9Sales growth at constant FX (%) 1.5 6.1 9.1 13.8 7.7 12.5 13.4 12.5 5.7 10.7Change in operating costs (%) * 2.9 6.0 14.2 21.0 11.0 16.5 15.8 14.1 8.2 13.4Operating margin (%) * 6.8 12.9 5.1 11.3 9.3 3.3 11.5 5.9 10.7 8.1
Return on capital employed (%) 32 31 29 29 26 25 25 25Return on equity (%) 30 28 25 25 22 24 24 24Equity to assets ratio (%) 46 40 40 38 39 35 39 41Liquid funds (SEKm) 6,459 6,170 6,018 5,569 6,315 6,149 6,150 6,498Net debt (SEKm) -17 206 373 772 738 987 928 362FREE-TV SCANDINAVIA Sales growth (%) -3.0 -2.7 1.3 0.2 -1.1 4.1 -1.4 1.4 -3.4 0.0Sales growth at constant FX (%) -1.0 -0.4 0.8 0.7 0.0 4.0 -2.9 -1.4 -5.2 -1.6Change in operating costs (%) 0.0 1.3 3.8 4.2 2.3 8.7 -0.8 1.4 -4.8 1.0Operating margin (%) 12.8 19.3 13.3 18.6 16.3 8.9 18.8 13.3 19.8 15.4
Commercial share of viewing (%) 1 Sweden (15-49) 32.4 32.7 34.7 31.8 33.1 39.1 30.5 31.0 30.5Norway (15-49) 17.3 19.5 17.3 16.9 17.7 15.3 17.9 16.0 15.4Denmark (15-49) 25.4 26.2 25.8 25.2 25.6 25.6 26.6 25.1 27.5PAY-TV NORDIC Sales growth (%) 1.8 4.4 7.0 6.4 4.9 7.1 6.7 10.2 7.6 7.9Sales growth at constant FX (%) 3.5 6.7 6.9 7.0 6.0 7.2 5.4 7.9 6.0 6.6Change in operating costs (%) 9.8 12.5 12.0 10.6 11.2 7.3 4.9 9.0 7.0 7.0Operating margin (%) 11.1 11.3 11.9 12.0 11.6 11.0 12.8 12.9 12.5 12.3
Subscriber data ('000s) Premium subscribers 1,003 989 970 977 978 970 969 982 - of which, satellite 580 569 563 559 553 546 535 526 - of which, 3rd party networks 424 421 407 418 425 425 434 456Basic satellite subscribers 45 44 42 40 37 36 35 33Premium satellite ARPU (SEK) 4,955 4,978 5,089 5,075 5,044 5,164 5,302 5,254FREE-TV EMERGING MARKETS Sales growth (%) 18.7 23.6 23.8 16.2 20.1 -1.7 -1.8 1.3 -2.8 -1.5Sales growth at constant FX (%) 25.2 30.6 21.2 17.9 23.5 -1.8 -3.6 -1.0 -4.9 -3.1Change in operating costs (%) 14.9 17.9 17.8 22.7 18.7 8.6 1.1 6.0 -4.2 2.2Operating margin (%) 5.0 20.2 -7.4 10.6 8.8 -4.9 17.8 -12.4 12.0 5.4
Commercial share of viewing (%) Estonia (15-49) 37.6 42.9 39.3 44.3 41.0 41.0 39.9 38.1 42.1Latvia (15-49) 55.4 57.9 59.1 61.1 58.2 55.0 59.7 58.7 61.9Lithuania (15-49) 44.4 43.3 48.1 49.0 46.3 47.3 44.5 43.9 45.0Czech Republic (15-54) 2 37.5 35.9 36.0 34.1 35.9 33.3 34.4 35.6 36.3Bulgaria (18-49) 3 34.0 32.5 32.8 36.9 34.2 35.7 35.1 35.9 41.1Hungary (18-49) 7.4 7.2 7.8 7.8 7.5 7.5 6.4 7.1 7.3PAY-TV EMERGING MARKETS Sales growth (%) 4.5 3.9 6.1 19.3 8.6 8.3 0.9 24.4 15.6 12.5Sales growth at constant FX (%) 10.0 9.5 6.7 20.8 12.0 9.8 7.9 24.9 14.7 14.4Change in operating costs (%) 22.5 7.9 17.5 1.4 11.7 -0.9 16.5 22.4 28.9 16.8Operating margin (%) -0.3 19.3 10.2 16.7 11.9 8.2 6.9 11.7 7.1 8.5
Subscriber data ('000s) Satellite subscribers 4 366 360 360 364 358 344 326 306Mini-pay subscriptions 5 85,153 89,915 91,380 92,223 94,837 94,197 130,559 131,089ASSOCIATED COMPANY CTC MEDIA
Share of viewing (%) CTC Russia (6-54) 11.3 11.6 11.6 10.9 11.3 10.8 10.2 10.3 9.7Domashny Russia (females 25 - 59) 3.0 3.5 3.9 3.5 3.5 3.1 3.3 3.7 3.1Peretz (DTV) Russia (25-59) 2.5 2.3 2.3 2.3 2.4 2.4 1.9 2.1 2.0Channel 31 Kazakhstan (6-54) 13.4 12.6 14.1 12.7 13.2 11.7 13.7 14.9 15.4
1. The universe expanded to include the Discovery and TLC channels, all of the TV4 Group channels, and the TV3 Sport 1 and 2 channels from Q1 2013. 2. The universe expanded from Q1 2013 to include three new CME channels and Prima ZOOM. 3. The source has been changed as of Q4 2014 to Nielsen’s Mediaresearch. All four quarters in 2014 as well as the full year figure are now based on the new source. The universe
has also expanded from Q1 2014 to include seven new channels. 4. Have been restated following the closure of Raduga. 5. Includes Trace subscriptions from Q3 2014. * based on operating income excl. associated income and non-recurring items. For definitions, please refer to the 2013 Annual Report under the heading “Definitions”. Data on CTC, CDON and Commercial share of viewing made available after each quarter on www.mtg.com.
Q4 2014 Modern Times Group MTG AB 21(21)
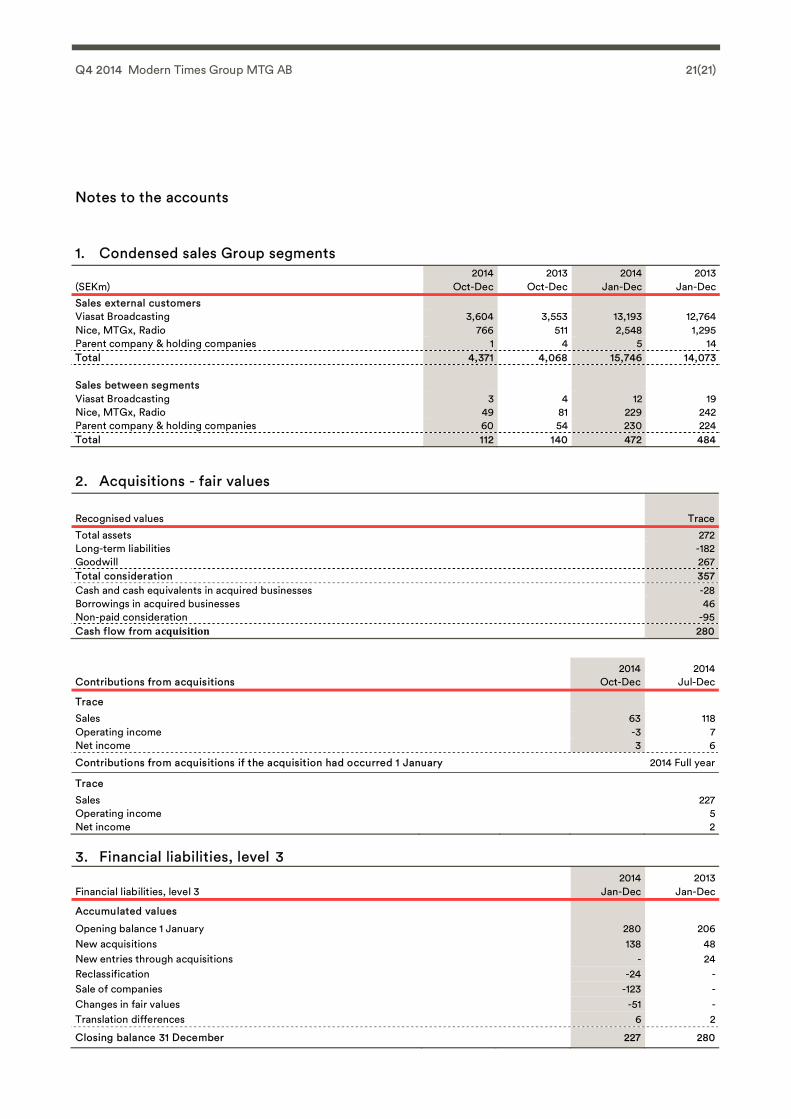
Notes to the accounts
1. Condensed sales Group segments
(SEKm) 2014
Oct-Dec2013
Oct-Dec 2014
Jan-Dec 2013
Jan-DecSales external customers Viasat Broadcasting 3,604 3,553 13,193 12,764Nice, MTGx, Radio 766 511 2,548 1,295Parent company & holding companies 1 4 5 14Total 4,371 4,068 15,746 14,073
Sales between segments Viasat Broadcasting 3 4 12 19Nice, MTGx, Radio 49 81 229 242Parent company & holding companies 60 54 230 224Total 112 140 472 484 2. Acquisitions - fair values
Recognised values Trace
Total assets 272Long-term liabilities -182Goodwill 267Total consideration 357Cash and cash equivalents in acquired businesses -28Borrowings in acquired businesses 46Non-paid consideration -95Cash flow from acquisition 280
Contributions from acquisitions 2014
Oct-Dec 2014
Jul-Dec
Trace
Sales 63 118Operating income -3 7Net income 3 6
Contributions from acquisitions if the acquisition had occurred 1 January 2014 Full year
Trace
Sales 227Operating income 5Net income 2 3. Financial liabilities, level 3
Financial liabilities, level 3 2014
Jan-Dec 2013
Jan-Dec
Accumulated values
Opening balance 1 January 280 206New acquisitions 138 48New entries through acquisitions - 24Reclassification -24 -Sale of companies -123 -Changes in fair values -51 -Translation differences 6 2
Closing balance 31 December 227 280


![Alternateur - Alternator - EUROREPAR...TOYOTA Avensis (T22) 1998ccm 1AC-FTV 1638109180 TOYOTA Corolla (_E11_)[1CD-FTV] 1638109180 TOYOTA Corolla (_E11_)[1CD-FTV] 1638109180 VOLVO S60](https://img.dokumen.tips/doc/110x75/5e8d8bc24f3a5f478d7422a1/alternateur-alternator-eurorepar-toyota-avensis-t22-1998ccm-1ac-ftv-1638109180.jpg)