Embed Size (px)
Citation preview
RECONSTRUCTED TEMPERATURE AND PRECIPITATIONON A MILLENNIAL TIMESCALE FROM TREE-RINGS
IN THE SOUTHERN COLORADO PLATEAU, U.S.A.
MATTHEW W. SALZER and KURT F. KIPFMUELLER1
Laboratory of Tree-Ring Research, The University of Arizona, Tucson, Arizona 85721, U.S.A.E-mail: [email protected]
1Present address: Department of Geography, University of Minnesota, Minneapolis,MN 55455, U.S.A.
Abstract. Two independent calibrated and verified climate reconstructions from ecologicallycontrasting tree-ring sites in the southern Colorado Plateau, U.S.A. reveal decadal-scale climatictrends during the past two millennia. Combining precisely dated annual mean-maximum temperatureand October through July precipitation reconstructions yields an unparalleled record of climaticvariability. The approach allows for the identification of thirty extreme wet periods and thirty-fiveextreme dry periods in the 1,425-year precipitation reconstruction and 30 extreme cool periods and26 extreme warm periods in 2,262-year temperature reconstruction. In addition, the reconstructionswere integrated to identify intervals when conditions were extreme in both climatic variables(cool/dry, cool/wet, warm/dry, warm/wet). Noteworthy in the reconstructions are the post-1976warm/wet period, unprecedented in the 1,425-year record both in amplitude and duration, anomalousand prolonged late 20th century warmth, that while never exceeded, was nearly equaled in magnitudefor brief intervals in the past, and substantial decadal-scale variability within the Medieval WarmPeriod and Little Ice Age intervals.
1. Introduction
Conditions in the natural environment, which change over time, establish limits onhuman societies and other biotic communities. There is increasing evidence thatthe climate is now changing, and has changed rapidly in the past, and that suchabrupt shifts could significantly impact human society. Paleoclimatic proxies withinterannual resolution and spanning centuries to millennia are necessary to definenatural climate variability and thus help discriminate ongoing anthropogenic effectson climate. This study examines two long proxy records of climate, a precipitationreconstruction and a temperature reconstruction developed from tree rings on thesouthern Colorado Plateau.
High-resolution millennial-length paleoclimatic reconstructions are relativelyrare. Most paleoclimatic research of this nature generates a single reconstructed cli-matic variable. Reconstructions of both precipitation and temperature from a singleregion, on the other hand, allow more complete inferences about past and presentclimate, and so enable a better understanding of recent climatic trends in the contextof the late Holocene. We developed two independent time-series of climatic recon-structions from tree-ring chronologies that have distinctive climatic sensitivities.
Climatic Change (2005) 70: 465–487DOI: 10.1007/s10584-005-5922-3 c© Springer 2005
466 MATTHEW W. SALZER AND KURT F. KIPFMUELLER
We examine changes in both variables on a millennial timescale using these tree-ring-based, annually dated, calibrated, and verified temperature and precipitation re-constructions from the southern Colorado Plateau. In the Sierra Nevada, Graumlich(1993) used a nonlinear response surface technique to reconstruct both temperatureand precipitation. Here, we apply an approach similar to that of LaMarche (1974)and Graybill and Funkhouser (1999) that makes use of tree-ring data from differentelevations to reconstruct and integrate time series of temperature and precipitation.
Blending of temperature and precipitation histories allows evaluation of theirphysical interaction on multiple spatiotemporal scales. For example, it is hypothe-sized from first principles and observed in instrumental data that soil moisture andcloud cover inversely affect local and regional temperatures. However, there maybe important and telling cases where this does not hold true. For example, undercertain circumstances a warming trend could be associated with wetter, and notdrier, conditions. Rather than local sensible heat, the warming could be imbeddedin continental, hemispheric, or global-scale processes. In such cases, independenttemperature and precipitation reconstructions from the same region might be use-ful to sort out anomalous warming or cooling events over the last 1,470 yearsthat are not associated with regional precipitation variability; these events mightthen be linked to extraregional processes. In addition, such anomalous periods ofwarm-wet and cool-dry could have far-reaching biological effects and interestingconsequences for regional ecosystems.
2. Data and Methods
2.1. ECOLOGICAL MODEL
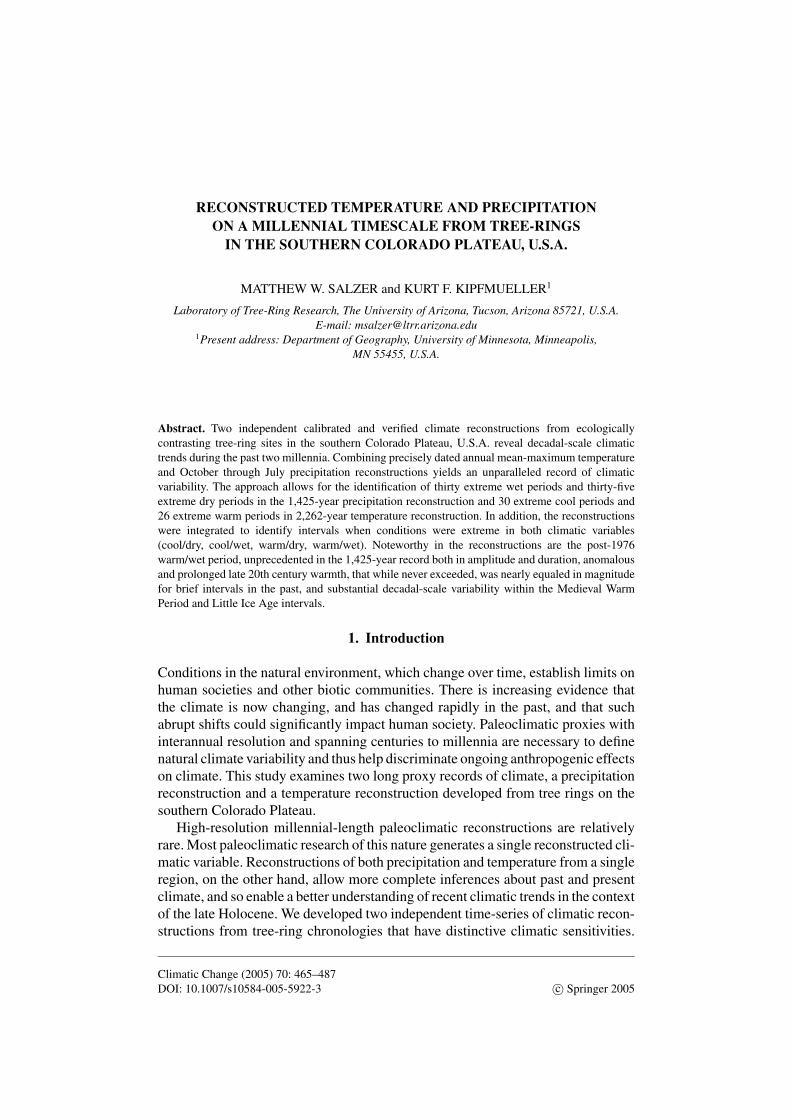
Climatically responsive trees useful in dendroclimatology contain quantifiable vari-ables (e.g., ring-width) that are the result of internal tree processes directly or in-directly limited by climatic factors. It follows that the most responsive trees arefound near distributional edges and ecotonal boundaries, where climatic factors aremost limiting. Hence, boundary areas, such as the lower forest border and subalpinetreeline, are ideal for developing tree-ring chronologies at both the cold and aridlimits of trees (Figure 1). On the southern Colorado Plateau, lower elevation pines(Pinus ponderosa and Pinus edulis) and Douglas-fir (Pseudotsuga menziesii) pro-vide information on past precipitation, while high elevation Bristlecone Pine (Pinusaristata) renders details about prior temperatures. Through a comparison of thesetwo growth records, paleoclimatic insight unobtainable from either record alone isgenerated, allowing an integrated view of temperature and precipitation variations.
2.2. TREE-RING AND CLIMATE DATA
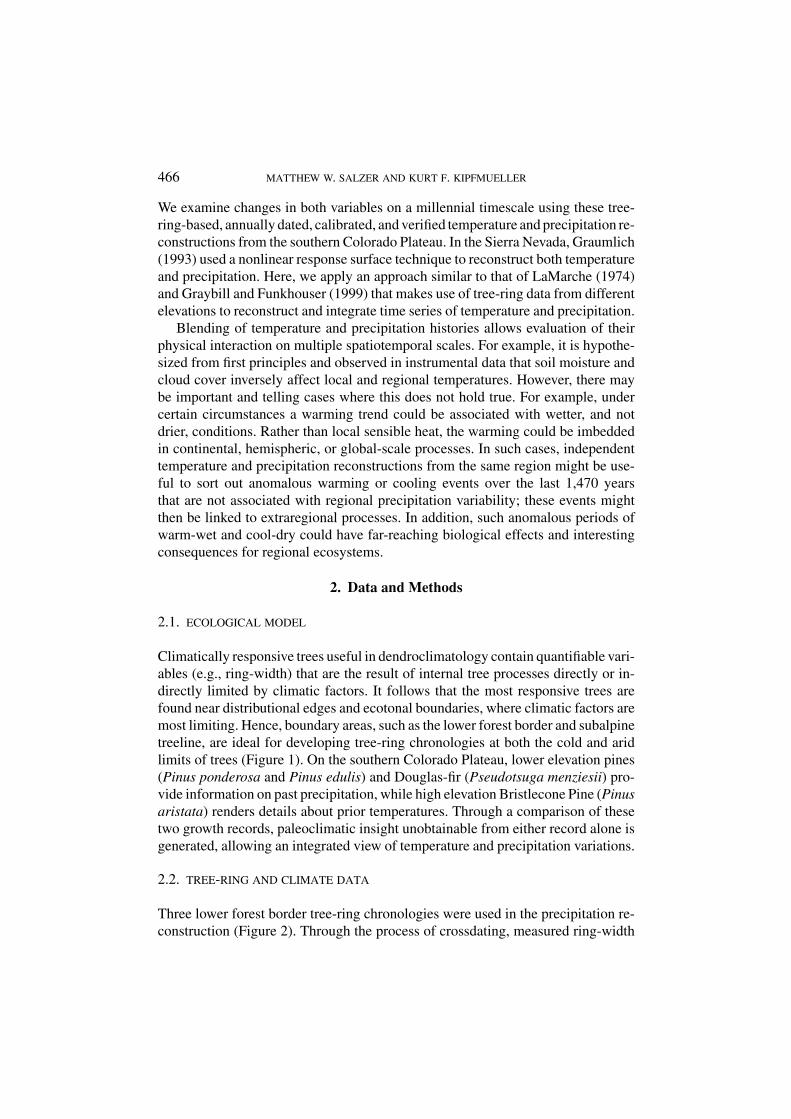
Three lower forest border tree-ring chronologies were used in the precipitation re-construction (Figure 2). Through the process of crossdating, measured ring-width
RECONSTRUCTED TEMPERATURE AND PRECIPITATION 467
Figure 1. Ecological model of climate and tree-growth emphasizes growth responses to differentclimatic variables at differing elevations.
Figure 2. Map of Arizona and adjoining states showing location of the tree-ring site(s) used in thetemperature (diamond) and precipitation (circle) reconstructions.
series of construction timbers from archaeological sites are appended to the ear-lier portions of measured series from living trees at the three sites to substantiallylengthen the records. The chronologies are derived from ponderosa pine (P. pon-derosa), pinon (P. edulis), and Douglas-fir (P. menziesii) from elevations of approx-imately 1,890–2,290 m in northern Arizona (Flagstaff and Canyon de Chelly) andsouthern Utah (Navajo Mountain). They were originally developed as part of theSouthwest Paleoclimate Project (Dean and Robinson, 1978) and are on file at theLaboratory of Tree-Ring Research at the University of Arizona. The precipitationreconstruction calibration uses climate data from NOAA Climate Division Two(Northeast) for Arizona over the period 1896–1988.
468 MATTHEW W. SALZER AND KURT F. KIPFMUELLER
To build a tree-ring chronology that reflects past temperature variability, upper-treeline Bristlecone Pine (P. aristata), whose ring-width variability is a function oftemperature, were sampled at timberline in the San Francisco Peaks (∼3,536 m),where temperature is most limiting to growth (Figure 2). Increment core and sawedsamples were collected from living and dead Bristlecone Pine on both AgassizPeak and Humphreys Peak. Long chronologies were constructed by crossdating thedeadwood samples with the living tree specimens. Prior to AD 659 the chronologyis composed entirely from deadwood material. The individual growth rings of eachsample were measured to the nearest 0.01 mm. The measured series were convertedto standardized tree-ring indices by fitting a modified negative exponential curve,a straight line, or a negatively sloped line to the series. This process removes theage/size related growth trend and transforms the ring-width measurement valuesinto ring-width index values for each individual ring in each series (Fritts, 1976).Several statistics were calculated to gauge the reliability of the tree-ring series(Cook and Kairiukstis, 1990; Wigley et al., 1984) (Table I).
Through conservative standardization techniques and the use of relatively longseries, care was taken to preserve low-frequency information in the chronology
TABLE IChronology statistics for tree-ring chronologies used in Northern Arizona climatereconstructions
Precipitation sensitive chronologiesTemp. Sens.
Chronologya CDC NAV FLA SFP
Speciesb PIED/PIPO/PSME PIED PIPO PIAR
Timespan 1–1990 340–1989 570–1987 −663–1997
Number of trees (radii) 54 (120) 22 (54) 31 (65) 139 (233)
Mean length of series 238 308 238 384
Mean series intercorrelation 0.76 0.83 0.78 0.54
Mean sensitivity 0.46 0.64 0.45 0.22
EPSc 0.94 0.95 0.92 0.92
First order autocorrelation 0.33 0.20 0.42 0.71
Signal/noise ratio 15.57 19.65 10.91 10.70
% Variance in 1st PC 48 70 57 38
First year SSSd > 0.85 (trees) 465 (7) 402 (2) 769 (4) 167 (13)
aChronologies: CDC: Canyon de Chelly; NAV: Navajo Mtn.; FLA: Flagstaff; SFP: SanFrancisco Peaks.bSpecies: PIED: Pinus edulis; PIPO: Pinus ponderosa; PSME: Pseudotsuga menziesii; PIAR:Pinus aristata.cEPS: Expressed population signal.dSSS: Subsample signal strength.
RECONSTRUCTED TEMPERATURE AND PRECIPITATION 469
(Cook et al., 1995). A regional curve standardization (RCS) approach (Briffa et al.1992a), which has been used in some dendroclimatic studies to resolve multi-decadal to centennial trends, was considered but rejected. In general, RCS wasdevised for chronologies built from short series that use heavy detrending. TheSFP chronology was built from relatively long segment lengths (Table I) and aconservative standardization process was employed. Additionally, we could notmeet the necessary assumptions critical to successfully applying this technique: itwas impossible to ascertain pith or near-pith dates from the deadwood material dueto the irregular growth form of Bristlecone Pine, and we are not able to demonstratethat the age structure of the samples are evenly distributed.
To create the mean site chronology, the annual standardized indices of treegrowth were averaged. A single chronology was developed from samples collectedat two sites on Humphreys Peak and one site on Agassiz Peak. The SFP chronologyextends from 663 BC–AD 1997. In total, 234 series (130 trees) are used. Theperiod before 266 BC is considered less reliable than the rest of the chronologyas six or fewer series cover this interval. The climate data used in the temperaturereconstruction calibration are from the Fort Valley Experimental Research Station,which is part of the United States Historical Climatology Network. The station data,from an elevation of 2,239 m and approximately 4.5 km from the high elevationSFP tree-ring sites, span the period 1909–1994.
2.3. BIOLOGICAL MODEL
Correlation and response function analyses were used to investigate the climate–treegrowth relationship with the lower elevation tree-ring chronologies and the precip-itation data. Growth processes of lower elevation trees in the American Southwestoften are limited by climatic conditions during a period before the actual growingseason (Fritts, 1976). Ring-width variability can reflect changes in precipitationamounts from the fall/winter seasons prior to the trees’ growing season through thegrowing season of ring formation. The period from the previous October throughJuly of the growing season was determined to be the interval when precipitationhad the greatest effect on tree growth. Monthly values for this period were summedfor the individual years to create the final climate series used in the reconstruction.Consequently, one variable being reconstructed is prior October through currentJuly precipitation.
Correlation and response function analysis shows that the high elevation SFPtree-ring chronology correlated most significantly with monthly mean-maximumtemperatures. The results of several physiological experiments with upper treelinepines (Tranquillini, 1964; Schulze et al., 1967; Mooney et al., 1966) suggest thatnet photosynthesis at upper treeline is most influenced by the length of the warmseason and daily maximum temperatures. While the growth response to temperatureof these upper-treeline Bristlecone Pines is complex, two points are clear: first, the

470 MATTHEW W. SALZER AND KURT F. KIPFMUELLER
most significant and easily understood climate/tree-growth relationship is increasedgrowth with increased daytime (maximum) temperatures, and second, the mostimportant effect of temperature on growth is not immediate. The strongest statisti-cal relationship between mean-maximum temperature and the tree-ring chronologyoccurred during the year prior to the year of growth. Other Bristlecone Pine stud-ies (Fritts, 1969; LaMarche, 1973; LaMarche and Stockton, 1974) have suggestedthat growth, especially radial growth of the stem, depends on reserves of storedfood produced during earlier periods. On the San Francisco Peaks, the period fromJanuary through December prior to the growth year is the interval when mean-maximum temperatures (daytime highs) had the most significant effect upon treegrowth. Monthly mean-maximum values for this period were averaged for the years1909–1994 to create the final climate series used in the reconstruction. Accordingly,the variable being reconstructed is annual mean-maximum temperature. This vari-able can be considered a general measure of how warm it gets during the daytimesof a given year.
2.4. STATISTICAL MODEL
For the precipitation reconstruction, the October through July precipitation climateseries was log-transformed prior to the calibration. This procedure results in theclimate data being more normally distributed and more linearly related to the tree-ring data. A stepwise multiple linear regression model was developed using the“standard” (Cook 1985) tree-ring chronologies from Flagstaff, Navajo Mountain,and Canyon de Chelly. The pool of potential predictors includes nine variables: thethree chronologies lagged −1, 0, and +1 years from the precipitation year (previ-ous October–July). Predictors were allowed to enter the model stepwise in orderof importance until R2 reached a maximum and root-mean-square-error (RMSE)a minimum. Three predictors were used in the final model: The three chronolo-gies at lag 0. The inclusion of additional predictors beyond these three does notincrease calibration R2 or decrease RMSE substantially, indicating that predictorsfour through nine do not improve the quality of the reconstruction.
Validation was done using the predicted residual sum of squares (PRESS)method (Weisberg, 1985). Crossvalidation statistics indicate a successful recon-struction. The validation reduction of error statistic (RE), which is analogous tocalibration R2, is 0.71. Any positive value of this statistic indicates that the modeldoes a better predictive job than the calibration period mean. Also indicative of agood reconstruction, the validation RMSE remains low and does not differ muchfrom the calibration RMSE in this three-predictor model. Analysis of residualsdoes not indicate any violations of model assumptions. The residuals are inde-pendent of both predictor and predictand values. They are essentially normallydistributed and show no apparent trends. The Durbin-Watson statistic demonstratesacceptable autocorrelation in the residuals. The regression model explains 74% of

RECONSTRUCTED TEMPERATURE AND PRECIPITATION 471
Figure 3. Comparison of observed instrumental climate data (thick line) and regression based val-ues predicted by the tree-ring chronologies (thin line). (A) Calibration between the upper elevationBristlecone Pine tree-ring chronology (year 1) and maximum annual temperature (year -1) for theperiod 1909–1994 (calibration r 2 = 0.46, validation RE = 0.42). (B) Calibration between low eleva-tion pine tree-ring chronologies (year1) and October (year -1) to July (year 1) log10 precipitation forthe period 1896–1988 (calibration r 2 = 0.74, validation RE = 0.71).
the variance in the precipitation with a calibration period of 1896–1988 (Table II)(Figure 3B).
A similar approach was taken to create a quantitative temperature reconstruc-tion, but with only one tree-ring chronology as a predictor. The modern part ofthe SFP tree-ring chronology was compared to the instrumental mean-maximumtemperature data, and a linear regression equation was generated from the period ofoverlap that retrodicts past temperatures for the period corresponding to the lengthof the tree-ring “standard” (Cook, 1985) chronology. Because these trees respond toclimate over a period extending into the previous growing season, the temperaturevariability was statistically modeled using linear regression and a lagged relation-ship where mean-maximum annual temperature at year (t −1) can be reconstructedfrom tree-ring index at year (t). A simple linear regression was used with a singlepredictor and no log-transforms.
The SFP chronology explains 46% of the variance in the temperature dataover the 1909–1994-calibration period (Figure 3A). This compares favorably withsome other tree-ring based temperature reconstructions (Briffa et al., 1990, 1992b,1994; Graumlich, 1993; Jacoby and D’Arrigo, 1989; Jacoby et al., 1985; Lara andVillalba, 1993; Luckman et al., 1997; Scuderi, 1993). As with the precipitationreconstruction, validation was done with the PRESS (Weisberg, 1985) method,crossvalidation statistics indicate a successful reconstruction, and residual analysisdoes not indicate any violations of model assumptions. The validation RE is 0.42(Table II).
472 MATTHEW W. SALZER AND KURT F. KIPFMUELLER
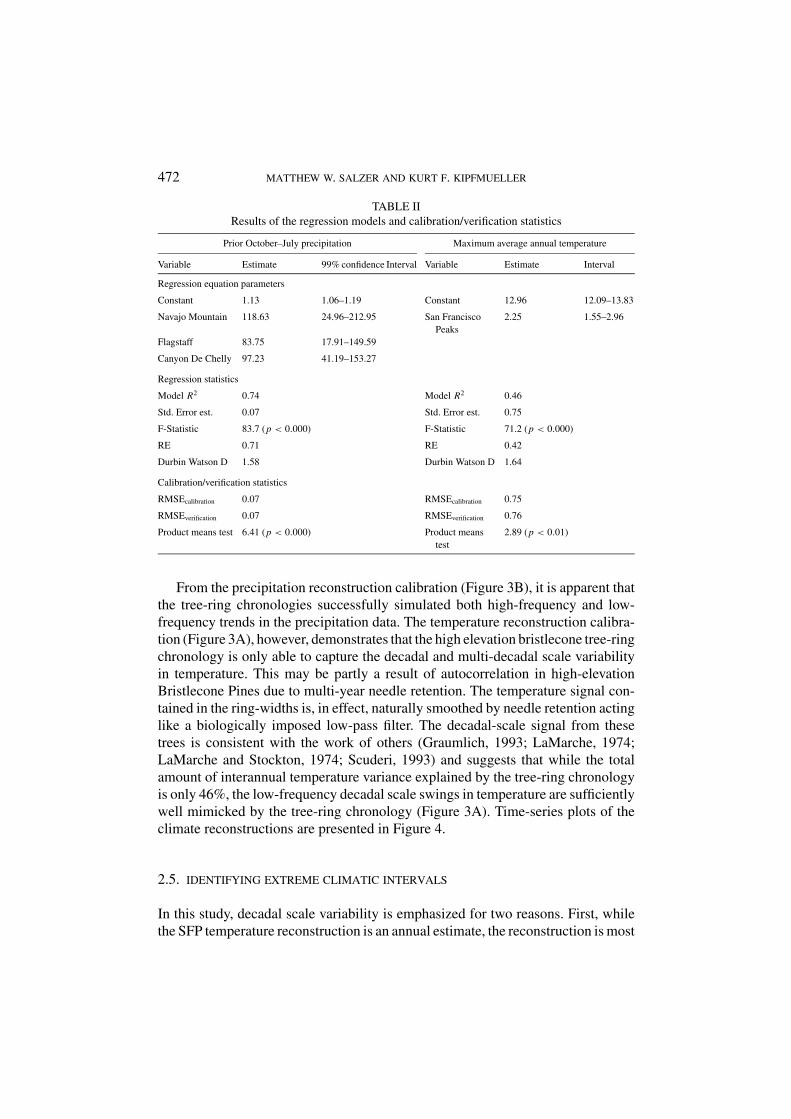
TABLE IIResults of the regression models and calibration/verification statistics
Prior October–July precipitation Maximum average annual temperature
Variable Estimate 99% confidence Interval Variable Estimate Interval
Regression equation parameters
Constant 1.13 1.06–1.19 Constant 12.96 12.09–13.83
Navajo Mountain 118.63 24.96–212.95 San FranciscoPeaks
2.25 1.55–2.96
Flagstaff 83.75 17.91–149.59
Canyon De Chelly 97.23 41.19–153.27
Regression statistics
Model R2 0.74 Model R2 0.46
Std. Error est. 0.07 Std. Error est. 0.75
F-Statistic 83.7 (p < 0.000) F-Statistic 71.2 (p < 0.000)
RE 0.71 RE 0.42
Durbin Watson D 1.58 Durbin Watson D 1.64
Calibration/verification statistics
RMSEcalibration 0.07 RMSEcalibration 0.75
RMSEverification 0.07 RMSEverification 0.76
Product means test 6.41 (p < 0.000) Product meanstest
2.89 (p < 0.01)
From the precipitation reconstruction calibration (Figure 3B), it is apparent thatthe tree-ring chronologies successfully simulated both high-frequency and low-frequency trends in the precipitation data. The temperature reconstruction calibra-tion (Figure 3A), however, demonstrates that the high elevation bristlecone tree-ringchronology is only able to capture the decadal and multi-decadal scale variabilityin temperature. This may be partly a result of autocorrelation in high-elevationBristlecone Pines due to multi-year needle retention. The temperature signal con-tained in the ring-widths is, in effect, naturally smoothed by needle retention actinglike a biologically imposed low-pass filter. The decadal-scale signal from thesetrees is consistent with the work of others (Graumlich, 1993; LaMarche, 1974;LaMarche and Stockton, 1974; Scuderi, 1993) and suggests that while the totalamount of interannual temperature variance explained by the tree-ring chronologyis only 46%, the low-frequency decadal scale swings in temperature are sufficientlywell mimicked by the tree-ring chronology (Figure 3A). Time-series plots of theclimate reconstructions are presented in Figure 4.
2.5. IDENTIFYING EXTREME CLIMATIC INTERVALS
In this study, decadal scale variability is emphasized for two reasons. First, whilethe SFP temperature reconstruction is an annual estimate, the reconstruction is most
RECONSTRUCTED TEMPERATURE AND PRECIPITATION 473
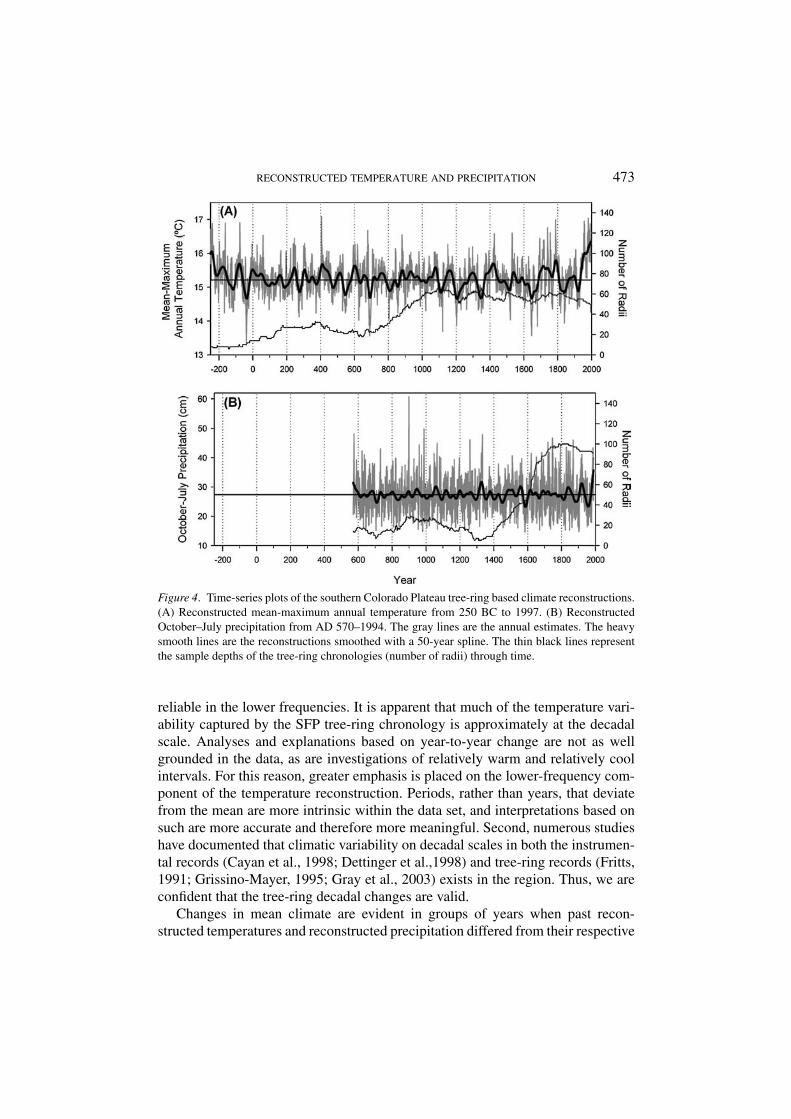
Figure 4. Time-series plots of the southern Colorado Plateau tree-ring based climate reconstructions.(A) Reconstructed mean-maximum annual temperature from 250 BC to 1997. (B) ReconstructedOctober–July precipitation from AD 570–1994. The gray lines are the annual estimates. The heavysmooth lines are the reconstructions smoothed with a 50-year spline. The thin black lines representthe sample depths of the tree-ring chronologies (number of radii) through time.
reliable in the lower frequencies. It is apparent that much of the temperature vari-ability captured by the SFP tree-ring chronology is approximately at the decadalscale. Analyses and explanations based on year-to-year change are not as wellgrounded in the data, as are investigations of relatively warm and relatively coolintervals. For this reason, greater emphasis is placed on the lower-frequency com-ponent of the temperature reconstruction. Periods, rather than years, that deviatefrom the mean are more intrinsic within the data set, and interpretations based onsuch are more accurate and therefore more meaningful. Second, numerous studieshave documented that climatic variability on decadal scales in both the instrumen-tal records (Cayan et al., 1998; Dettinger et al.,1998) and tree-ring records (Fritts,1991; Grissino-Mayer, 1995; Gray et al., 2003) exists in the region. Thus, we areconfident that the tree-ring decadal changes are valid.
Changes in mean climate are evident in groups of years when past recon-structed temperatures and reconstructed precipitation differed from their respective
474 MATTHEW W. SALZER AND KURT F. KIPFMUELLER
long-term means. To identify climatic periods that were well above or below thelong-term mean, a 10-year smoothing spline (Cook and Peters, 1981) was fit to thereconstructed temperature and precipitation time series. The original and spline re-constructed values were converted to standard deviation units, or Z scores (Johnson,1994). This technique quantifies the deviations from the long-term average. Usingthe spline data, periods were identified that diverged from mean conditions by atleast 1.1 SD. This reference point was proposed by Dean (1988) to determine cli-mate episodes potentially significant to the physical environment and to humanpopulations. The beginning and ending years of the extreme climatic periods weredefined using the nonsmoothed data because spline values are influenced by pre-ceding (past) and following (future) data. The minimum length for periods wasestablished at five years. The beginning year for an extreme period was determinedas that point when the original reconstructed value first substantially deviated frommean conditions (<−0.5 SD or >0.5 SD). The ending year for periods was definedas that point when average conditions (>−0.5 SD and <0.5 SD) returned for morethan two consecutive years or when conditions substantially deviated (<−1.0 SDand >1.0 SD) in the other direction for more than a single year. During each extremeperiod, the smoothed reconstructed values deviate from the long-term average byat least 1.1 SD for at least one year.
3. Deviations from Mean Conditions
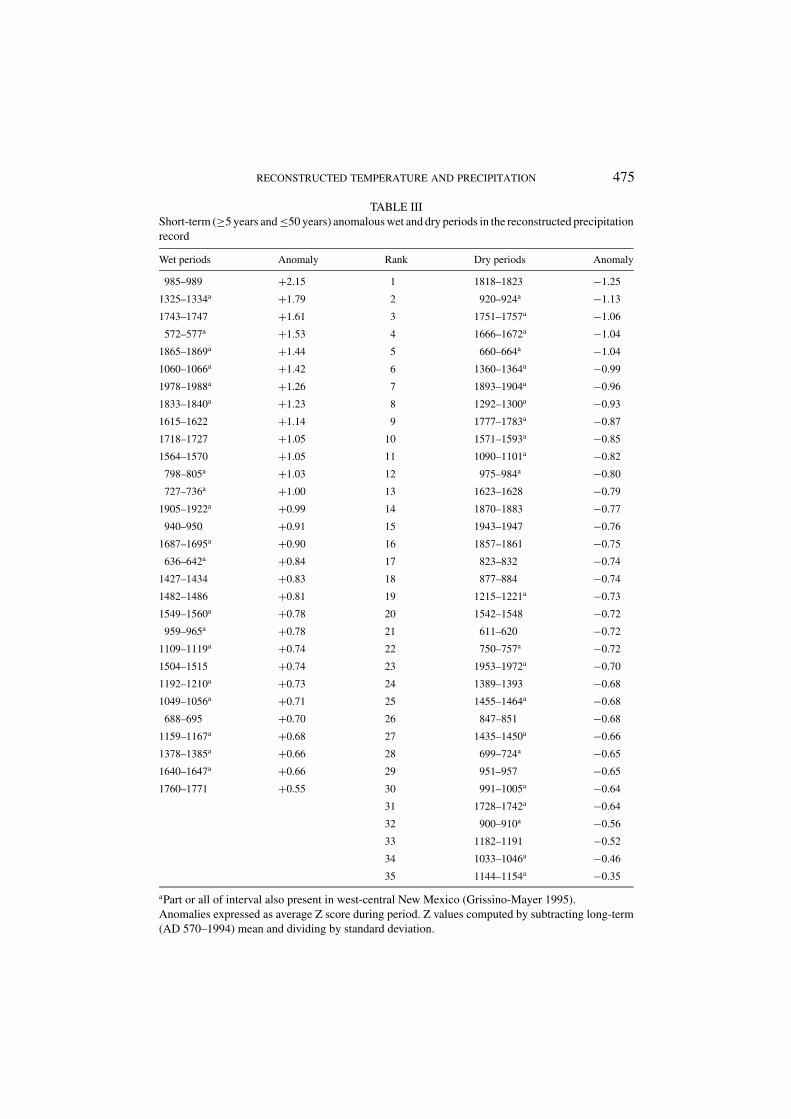
Thirty-five extreme-dry periods and 30 extreme-wet periods (Table III) were iden-tified in the 1,425-year precipitation reconstruction. Wet and dry periods rangefrom five to twenty-six years in length. The driest interval was the six-year pe-riod from 1818 to 1823; the wettest was the 5-year period from 985 to 989. Thelongest drought is twenty-six years, from 699 to 724. The 1905–1922 eighteen-year period is the longest wet interval in the precipitation reconstruction. Manyof the wet and dry periods in Table III correspond temporally with dry andwet conditions elsewhere in the Southwest. Twenty-two of the 35 dry periods(63%), including 11 of the top 12, and 19 of the 30 wet periods (63%) over-lap with similar severe short-term droughts and short-term wet periods describedby Grissino-Mayer (1995) for west-central New Mexico. This suggests that theseepisodes, especially the most severe droughts, are often regional rather than localphenomena.
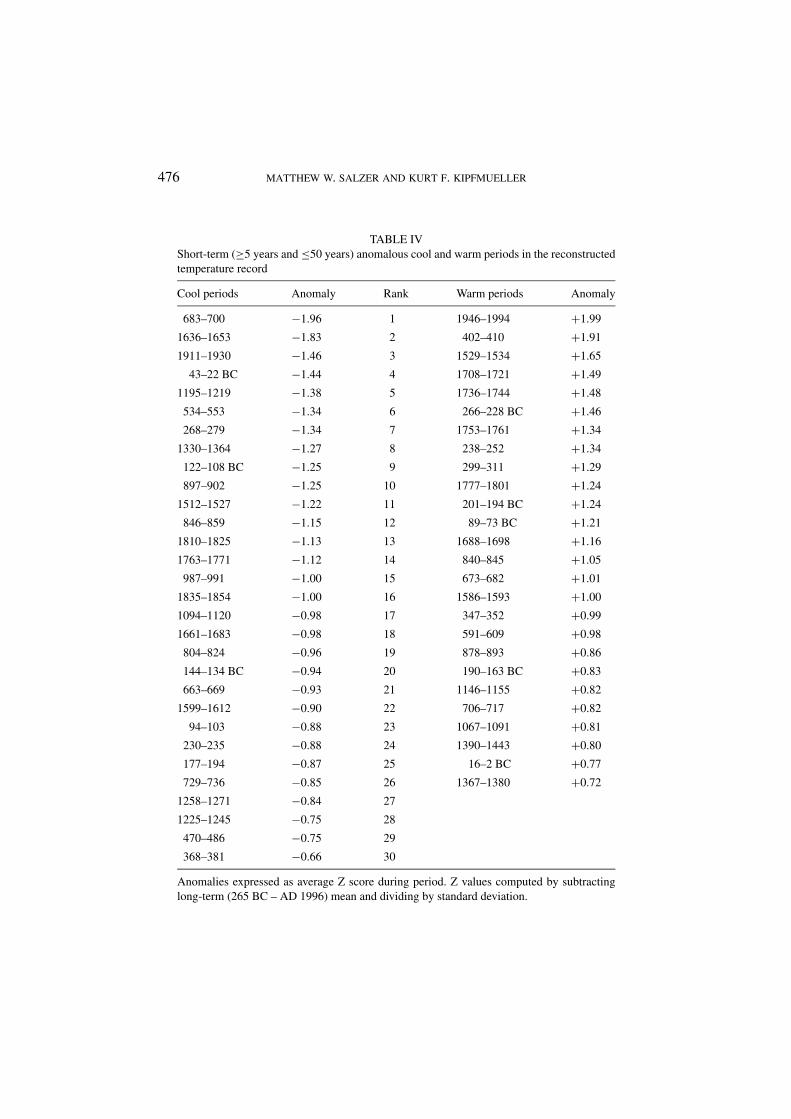
In the analysis of the temperature data, the 663–267 BC portion was omittedfrom the examination due to low sample size during this early part of the tree-ringchronology. Thirty extremely cool and 26 extremely warm intervals were identifiedbetween 266 BC and AD 1996 (Table IV). The intervals range from five to 49 years.The coldest period identified was an eighteen year interval from AD 683–700. Thelongest cool period was the 35 years from 1330 to 1364. The late 20th century49-year period from 1946 to 1996 is the warmest period identified and also the
RECONSTRUCTED TEMPERATURE AND PRECIPITATION 475
TABLE IIIShort-term (≥5 years and ≤50 years) anomalous wet and dry periods in the reconstructed precipitationrecord
Wet periods Anomaly Rank Dry periods Anomaly
985–989 +2.15 1 1818–1823 −1.25
1325–1334a +1.79 2 920–924a −1.13
1743–1747 +1.61 3 1751–1757a −1.06
572–577a +1.53 4 1666–1672a −1.04
1865–1869a +1.44 5 660–664a −1.04
1060–1066a +1.42 6 1360–1364a −0.99
1978–1988a +1.26 7 1893–1904a −0.96
1833–1840a +1.23 8 1292–1300a −0.93
1615–1622 +1.14 9 1777–1783a −0.87
1718–1727 +1.05 10 1571–1593a −0.85
1564–1570 +1.05 11 1090–1101a −0.82
798–805a +1.03 12 975–984a −0.80
727–736a +1.00 13 1623–1628 −0.79
1905–1922a +0.99 14 1870–1883 −0.77
940–950 +0.91 15 1943–1947 −0.76
1687–1695a +0.90 16 1857–1861 −0.75
636–642a +0.84 17 823–832 −0.74
1427–1434 +0.83 18 877–884 −0.74
1482–1486 +0.81 19 1215–1221a −0.73
1549–1560a +0.78 20 1542–1548 −0.72
959–965a +0.78 21 611–620 −0.72
1109–1119a +0.74 22 750–757a −0.72
1504–1515 +0.74 23 1953–1972a −0.70
1192–1210a +0.73 24 1389–1393 −0.68
1049–1056a +0.71 25 1455–1464a −0.68
688–695 +0.70 26 847–851 −0.68
1159–1167a +0.68 27 1435–1450a −0.66
1378–1385a +0.66 28 699–724a −0.65
1640–1647a +0.66 29 951–957 −0.65
1760–1771 +0.55 30 991–1005a −0.64
31 1728–1742a −0.64
32 900–910a −0.56
33 1182–1191 −0.52
34 1033–1046a −0.46
35 1144–1154a −0.35
aPart or all of interval also present in west-central New Mexico (Grissino-Mayer 1995).Anomalies expressed as average Z score during period. Z values computed by subtracting long-term(AD 570–1994) mean and dividing by standard deviation.
476 MATTHEW W. SALZER AND KURT F. KIPFMUELLER
TABLE IVShort-term (≥5 years and ≤50 years) anomalous cool and warm periods in the reconstructedtemperature record
Cool periods Anomaly Rank Warm periods Anomaly
683–700 −1.96 1 1946–1994 +1.99
1636–1653 −1.83 2 402–410 +1.91
1911–1930 −1.46 3 1529–1534 +1.65
43–22 BC −1.44 4 1708–1721 +1.49
1195–1219 −1.38 5 1736–1744 +1.48
534–553 −1.34 6 266–228 BC +1.46
268–279 −1.34 7 1753–1761 +1.34
1330–1364 −1.27 8 238–252 +1.34
122–108 BC −1.25 9 299–311 +1.29
897–902 −1.25 10 1777–1801 +1.24
1512–1527 −1.22 11 201–194 BC +1.24
846–859 −1.15 12 89–73 BC +1.21
1810–1825 −1.13 13 1688–1698 +1.16
1763–1771 −1.12 14 840–845 +1.05
987–991 −1.00 15 673–682 +1.01
1835–1854 −1.00 16 1586–1593 +1.00
1094–1120 −0.98 17 347–352 +0.99
1661–1683 −0.98 18 591–609 +0.98
804–824 −0.96 19 878–893 +0.86
144–134 BC −0.94 20 190–163 BC +0.83
663–669 −0.93 21 1146–1155 +0.82
1599–1612 −0.90 22 706–717 +0.82
94–103 −0.88 23 1067–1091 +0.81
230–235 −0.88 24 1390–1443 +0.80
177–194 −0.87 25 16–2 BC +0.77
729–736 −0.85 26 1367–1380 +0.72
1258–1271 −0.84 27
1225–1245 −0.75 28
470–486 −0.75 29
368–381 −0.66 30
Anomalies expressed as average Z score during period. Z values computed by subtractinglong-term (265 BC – AD 1996) mean and dividing by standard deviation.

RECONSTRUCTED TEMPERATURE AND PRECIPITATION 477
TABLE VReconstructed cool and warm intervals from three other published millennial-length tempera-ture reconstructions; the associated overlapping extreme periods in the SFP reconstruction arein parentheses
COOL (SFP) WARM (SFP)
Scuderi (1993) 172–194 (177–194) 408–427 (402–410)
Sierra Nevada 542–561 (534–553) 1439–1458 (1390–1443)
2000 years 800–819 (804–824) 1786–1805 (1777–1801)
1817–1836 (1810–1825)
Graumlich (1993) 1604–1623 (1599–1612) 1150–1169 (1146–1155)
Sierra Nevada 1628–1647 (1636–1653) 1354–1373 (1367–1380)
1000 years 1751–1770 (1763–1771)
Briffa et al. (1990) 795–814 (804–824)
Fennoscandia 848–867 (846–859)
1400 Years 1344–1363 (1330–1364)
1601–1620 (1599–1612)
warm interval with the longest duration. While trees at some temperature-sensitivesites in the high northern latitudes are now showing declines in growth (Barberet al., 2000; Kipfmueller, 2003; Vaganov et al., 1999), it is extremely rare inthis reconstruction for temperatures to approach 20th century levels. There was a54-year warm interval from 1390 to 1443, but only during brief intervals in the 200sBC, the early AD 400s, the mid 1500s, and the 1700s did warmth rival 20th centurylevels.
Although there are no other millennial length temperature reconstructions fromthe Colorado Plateau to compare to the record of extreme warm and extreme coolintervals, a comparison with two long tree-ring based reconstructions from theSierra Nevada of California is possible. Scuderi (1993) listed the six coldest andsix warmest twenty year periods between AD 1 and 1980; four of the six coldestand three of the six warmest overlap with extreme periods in the SFP reconstruc-tion (Table V). Similarly, Graumlich (1993) identified five extremely cold and fiveextremely warm twenty year intervals between AD 800 and 1988; three of thefive coldest and two of the five warmest overlap with like extreme periods in theSFP reconstruction. Expanding the comparison spatially, Briffa et al. (1990) iden-tified five extreme cold and extreme warm twenty year intervals between AD 500and 1990 for northern Fennoscandia. Four of the five coldest substantially overlapwith contemporaneous extreme cool periods in the SFP reconstruction, suggest-ing that these events, particularly the coldest intervals, are hemispheric in scale(Table V).

478 MATTHEW W. SALZER AND KURT F. KIPFMUELLER
Figure 5. Twenty-five-year running correlation between the southern Colorado Plateau temperatureand precipitation reconstructions from AD 570 to 1994. The correlations are for 25-year intervalsplotted on the center year and moving in one-year increments. Dashed lines indicate 95% confidenceinterval.
4. Cool/Dry, Cool/Wet, Warm/Dry, and Warm/Wet Intervals
Temperature and precipitation are usually out-of-phase in the American Southwest.Due to cloud cover and sensible heat effects, when it is dry it is usually warmand when it is wet it is usually cool. In fact, the temperature and precipitationmeteorological data used to generate the two reconstructions has a correlation of−0.41 (p < 0.001), while the two reconstructions have a correlation of −0.16(p < 0.001) The correlation of the reconstructions, while still significant, is lowerthan the correlation of the meteorological station data due to the large number ofobservations in the common interval (570–1989) and to the inherent noise in the tree-ring chronologies. The correlation of the smoothed reconstructions is −0.21 overthe 570–1989 period. When integrating the reconstructions however, it became clearthat the two reconstructed variables are not always behaving oppositely. A plot of25-year running correlation coefficients (Figure 5) demonstrates that, while the twotime series are predominately out-of-phase at this timescale, with repeated episodesof high negative correlations, departures from this scheme (positive correlations)do occur when it is warm/wet and when it is cool/dry.
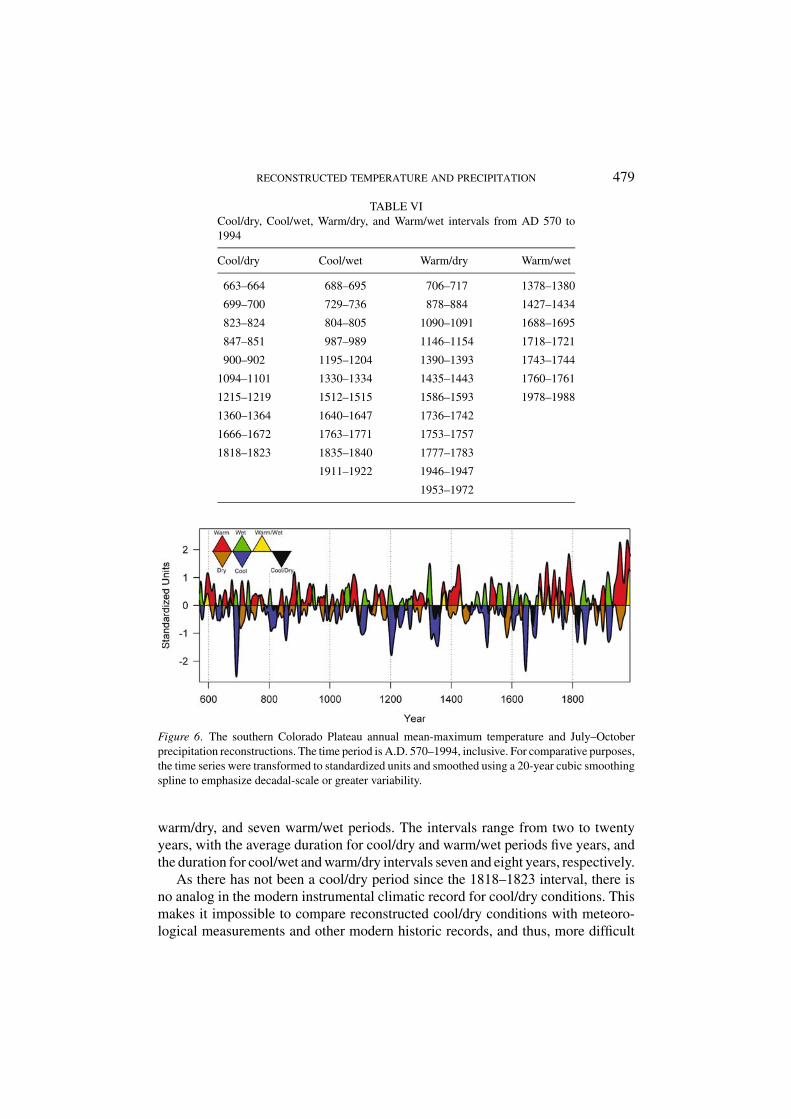
We smoothed both reconstructions and superimposed them on each other(Figure 6). We then compared the wet, dry, warm, and cool periods determinedabove and intervals of overlap were identified, when conditions were extreme inboth climate variables: cool/dry, cool/wet, warm/dry, or warm/wet (Table VI). Forthese analyses only the period during which the chronologies overlap, AD 570–1988, is considered. In total, 40 intervals greater than one year were identified inthe 1,425-year period of record, including ten cool/dry, eleven cool/wet, twelve
RECONSTRUCTED TEMPERATURE AND PRECIPITATION 479
TABLE VICool/dry, Cool/wet, Warm/dry, and Warm/wet intervals from AD 570 to1994
Cool/dry Cool/wet Warm/dry Warm/wet
663–664 688–695 706–717 1378–1380
699–700 729–736 878–884 1427–1434
823–824 804–805 1090–1091 1688–1695
847–851 987–989 1146–1154 1718–1721
900–902 1195–1204 1390–1393 1743–1744
1094–1101 1330–1334 1435–1443 1760–1761
1215–1219 1512–1515 1586–1593 1978–1988
1360–1364 1640–1647 1736–1742
1666–1672 1763–1771 1753–1757
1818–1823 1835–1840 1777–1783
1911–1922 1946–1947
1953–1972
Figure 6. The southern Colorado Plateau annual mean-maximum temperature and July–Octoberprecipitation reconstructions. The time period is A.D. 570–1994, inclusive. For comparative purposes,the time series were transformed to standardized units and smoothed using a 20-year cubic smoothingspline to emphasize decadal-scale or greater variability.
warm/dry, and seven warm/wet periods. The intervals range from two to twentyyears, with the average duration for cool/dry and warm/wet periods five years, andthe duration for cool/wet and warm/dry intervals seven and eight years, respectively.
As there has not been a cool/dry period since the 1818–1823 interval, there isno analog in the modern instrumental climatic record for cool/dry conditions. Thismakes it impossible to compare reconstructed cool/dry conditions with meteoro-logical measurements and other modern historic records, and thus, more difficult
480 MATTHEW W. SALZER AND KURT F. KIPFMUELLER
to assess the cultural and ecological impact of this type of climate anomaly. Inter-estingly, the largest volcanic eruption in modern historic times, Tambora in 1815,occurred shortly before this reconstructed cool/dry period. This is also a cool periodin Scuderi’s (1993) Sierra Nevada reconstruction. Perhaps this rare and somewhatcounterintuitive type of southwestern U.S.A. climatic combination (cool/dry) oc-curs when strong La Nina events coincide with large volcanic eruptions. The in-teractions are complex and more work is needed in this area. Preliminary analysesdo, however, tend to support the temporal coincidence of large explosive volcaniceruptions and seven of the ten cool/dry intervals listed in Table VI, including 1818–1823, 1666–1672, 1360–1364, 1215–1219, 900–902, 823–824, and 699–700 (seeSalzer, 2000a, pp. 112–115).
The 1950s drought in the Southwest provides a modern analog for extremewarm/dry conditions. This drought brought about high levels of plant mortalityin shrublands, woodlands, and forests as well as regional scale shifts in speciescomposition (Betancourt et al., 1993; Swetnam and Betancourt, 1998). There isalso evidence that the reconstructed warm/dry interval in the late 16th century(1586–1593), also identified by Stahle et al. (2000) across much of North America,may have contributed to widespread coniferous tree mortality (Swetnam and Be-tancourt, 1998; Swetnam and Brown, 1992).
Cool/wet conditions in the 1910s provide an analog for past cool/wet circum-stances. This is a period of extremely high runoff in the Colorado River basin(Stockton, 1975). Additionally, the cool/wet interval beginning in 1911 may haveled to a pulse of heavy tree recruitment in Southwestern forests (Allen et al., 1998).
4.1. POST-1976 CLIMATE (WARM/WET 1978–1988)
The warm/wet interval beginning in the late 1970s is the first since the 1760sand corresponds to a post-1976 climate regime shift in the Pacific expressed inthe American Southwest as abnormally wet winters and springs (Swetnam andBetancourt, 1998). The long dendroclimatic reconstructions presented here revealthe unusual nature of post-1976 climate in this region. There has been some de-bate regarding the nature of the relationship between the post-1976 climate regimeshift and greenhouse gas induced global warming, as time series modeling sug-gests post-1976 climatic behavior occurs once every thousand years (Trenberthand Hoar, 1996, 1997). From Figure 6, it is clear the temperature increase in thelatter half of the twentieth century is anomalous compared to warm periods of thepast, and that warm/wet conditions, extreme until 1988, have actually persistedto some degree to the end of the record. The reconstruction data do not directlyaddress whether the post-1976 climate shift and greenhouse warming are causallylinked, and the precipitation reconstruction does exhibit decadal-scale changes inthe past 1, 425 years, from dry periods to periods with equal or greater amounts ofprecipitation than the late 20th century, suggesting that such shifts may represent

RECONSTRUCTED TEMPERATURE AND PRECIPITATION 481
natural variability. However, when both climatic variables are considered, the post-1976 climate history of prolonged, extreme wetness and warmth is unique in therecord.
There is some evidence that unusual warm/wet intervals can be important bi-ologically, as they represent ideal conditions for pulses of woody plant establish-ment in the southwestern U.S.A. The unprecedented nature of post-1976 conditionscan be seen in other millennial-length tree-ring chronologies from the AmericanSouthwest, where recent growth trends compare favorably with the late twentiethcentury warm/wet period (Swetnam and Betancourt, 1998). Unequaled post-1976growth in these higher elevation chronologies has been attributed to CO2 enrich-ment (Graybill and Idso, 1983; LaMarche et al., 1984), but may be the result ofunusually warm/wet conditions. In particular, a combination of wet springs andlonger growing seasons would favor enhanced growth at higher elevations. Bothtemperature and precipitation influence growth processes with the impact of tem-perature increasing with elevation (Fritts, 1991). Concomitant with the climatechange are a multitude of documented changes in environmental conditions sincethe mid-1970s (Ebbesmeyer et al., 1991).
5. Medieval Warm Period and Little Ice Age
It has become a popular notion that global climate in the last millennium consistedof a Medieval Warm Period (MWP) followed by a Little Ice Age (LIA). Thereis some uncertainty regarding the extent and timing of these episodes given thenatural spatial variability of climate and the spatial and temporal resolution of thedata used to define them (Hughes and Diaz, 1994). We find considerable temperatureand precipitation variability on decadal and multi-decadal scales during the MWPand LIA intervals, which further demonstrates the complexity of these intervals.
There are both cold and warm periods within the MWP and LIA in the recon-structions without any clear evidence for sustained warmth or cold as these episodesare traditionally interpreted. When Lamb’s (1977) northern European dates for theMWP (1000–1300) and LIA (1550–1850, main phase: 1550–1700) are comparedto the climatic reconstructions presented above, the southern Colorado Plateau datashow a high degree of decadal and multi-decadal scale variability in both temper-ature and precipitation during both the MWP and LIA. In the San Francisco Peaksdata, the MWP period contains two reconstructed extremely warm periods (1067–1091, 1146–1155) and three reconstructed extremely cool periods (1094–1120,1195–1219, 1225–1245). The LIA interval contains six cool periods (1599–1612,1636–1653, 1661–1683, 1763–1771, 1810–1825, 1835–1854) and six warm pe-riods (1586–1593, 1688–1698, 1708–1721, 1736–1744, 1753–1761, 1777–1801),although four of the six warm episodes post-date the main phase of Lamb’s LIA.
The lower elevation tree-ring record of extreme wet and dry intervals is not
482 MATTHEW W. SALZER AND KURT F. KIPFMUELLER
disproportionately affiliated with either of the two northwestern European climateintervals. Five wet and five dry periods occur during the MWP, nine wet and sevendry during the LIA. This is consistent with the findings of Dean (1994) for theColorado Plateau.
Longer intervals can be identified when, for example, warmer conditions occurmore often than cool conditions. This is the case for the period from 870–1090although this interval is not devoid of cool episodes. Conversely, intervals coolerthan they are warm, from 1600–1685 and 1810 to 1930, are separated by a relatively,yet not consistently, warm 18th century. Longer dry and wet intervals are harderto identify as the precipitation reconstruction is characterized by more frequentalternating wet and dry periods.
It has been suggested that the LIA period is marked by high interannual tem-perature variability (Briffa et al., 1990). The SFP data support this notion for muchof the LIA. A running-variance calculation of overlapping 25-year periods showshigh variance in temperature from 1630 to 1815. In addition, there is a long periodof temperature and precipitation high variance overlap in the 18th century. Inter-estingly, beginning around 1690 and through the 18th century, the characteristicsof both time-series changed; the variance shifted to shorter periods (Figure 6). Thecause of this shift remains unclear, but it is undoubtedly linked to natural ratherthan anthropogenic forcing, and carries with it a myriad of implications for thecultural-ecological landscape.
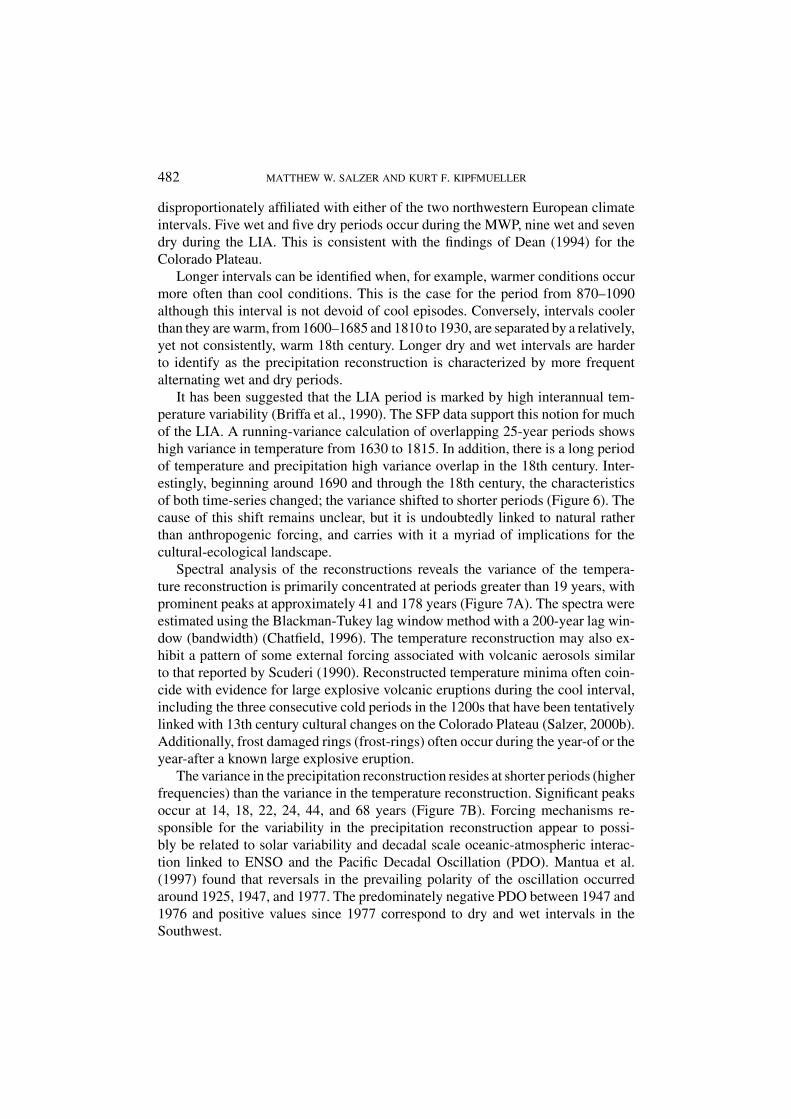
Spectral analysis of the reconstructions reveals the variance of the tempera-ture reconstruction is primarily concentrated at periods greater than 19 years, withprominent peaks at approximately 41 and 178 years (Figure 7A). The spectra wereestimated using the Blackman-Tukey lag window method with a 200-year lag win-dow (bandwidth) (Chatfield, 1996). The temperature reconstruction may also ex-hibit a pattern of some external forcing associated with volcanic aerosols similarto that reported by Scuderi (1990). Reconstructed temperature minima often coin-cide with evidence for large explosive volcanic eruptions during the cool interval,including the three consecutive cold periods in the 1200s that have been tentativelylinked with 13th century cultural changes on the Colorado Plateau (Salzer, 2000b).Additionally, frost damaged rings (frost-rings) often occur during the year-of or theyear-after a known large explosive eruption.
The variance in the precipitation reconstruction resides at shorter periods (higherfrequencies) than the variance in the temperature reconstruction. Significant peaksoccur at 14, 18, 22, 24, 44, and 68 years (Figure 7B). Forcing mechanisms re-sponsible for the variability in the precipitation reconstruction appear to possi-bly be related to solar variability and decadal scale oceanic-atmospheric interac-tion linked to ENSO and the Pacific Decadal Oscillation (PDO). Mantua et al.(1997) found that reversals in the prevailing polarity of the oscillation occurredaround 1925, 1947, and 1977. The predominately negative PDO between 1947 and1976 and positive values since 1977 correspond to dry and wet intervals in theSouthwest.
RECONSTRUCTED TEMPERATURE AND PRECIPITATION 483
Figure 7. Estimated spectra from reconstructed temperature (A) and precipitation (B) in NorthernArizona. Dashed lines indicate the 95% confidence limit of the estimated spectrum and horizontaldotted line constitutes the null continuum.
484 MATTHEW W. SALZER AND KURT F. KIPFMUELLER
6. Summary and Conclusions
Combined temperature and precipitation reconstructions from the same region al-low for the determination of past warm, cool, wet, and dry intervals (Figure 6,Tables III–VI). In addition, it is possible to determine periods when the unusual cli-matic combinations of cool/dry and warm/wet occurred (Figure 6, Table VI). Theunderlying processes responsible for the onset of such anomalous combinationsremain largely untested, although there is some indication of an association betweencool/dry intervals and explosive volcanism. There are past cool and warm periodsin our temperature reconstruction that overlap with extremely cool and warm pe-riods in the Sierra Nevada and in Fennoscandia (Briffa et al., 1990; Graumlich,1993; Scuderi, 1993). There are also indications of some correspondence betweencool/dry and warm/wet intervals on the southern Colorado Plateau and extreme cooland warm periods reported in the other regions (Tables V and VI). If explosive vol-canism acts as a forcing mechanism for cool/dry episodes, these hemispheric-scalelinkages would be expected. This also suggests, albeit with a limited comparison,that the anomalous periods of cool/dry and possibly of warm/wet might be usedto sort out global from regional cooling and warming events, at least as a firstapproximation.
The warmth of the 20th century, while never exceeded, was approached forbrief intervals in the past when natural forcing mechanisms produced considerablewarmth (Table IV, Figures 4 and 6).The second half of the 20th century is thewarmest interval in the period of record, which suggests the possibility that warm-ing from human activity has increased temperature outside the range of naturalvariability. The increase in precipitation following the 1976 climate regime shiftin the Pacific is not outside the range of past climatic variability for precipitation.However, when superimposed on anomalous late-twentieth century warming, theensuing warm/wet climatic conditions are anomalous. The warm/wet climate is un-precedented in the 1,425-year record in both amplitude and duration. Humans andother biotic populations of the southern Colorado Plateau were unacquainted withthis association of prolonged extreme wetness and warmth. As the next extremedry interval occurs, which appears to be the case for the first few years of the 21stcentury, in all likelihood the drought will be exacerbated by the continued warmconditions. This combination of warm/dry will, no doubt, have profound environ-mental and cultural consequences on the southern Colorado Plateau and elsewherein the semi-arid American Southwest.
Acknowledgements
The research necessary for this paper was supported by The Laboratory of Tree-Ring Research at The University of Arizona, National Science Foundation grantNSF-ATM 0213962 from the Earth System History Program, Desert Archaeology
RECONSTRUCTED TEMPERATURE AND PRECIPITATION 485
Inc. of Tucson Arizona, and the Arizona Department of Transportation. Logisticalhelp was received from the United States Forest Service and Arizona Snowbowl.Help with fieldwork was received from Rex Adams, Jim Parks, Chris McPhee, IanParker, and Alison McDonald. Jim Parks and Angelica Clemens helped with labo-ratory analyses. The discussion benefited from the expertise of Julio L. Betancourt,Malcolm K. Hughes, Thomas W. Swetnam, Jeffrey S. Dean, V. A. S. McCord,Gary Funkhouser, anonymous reviewers, and many other individuals within thepaleoclimatic community.
References
Allen, C. D., Betancourt, J. L., and Swetnam, T. W.: 1998, ‘Landscape changes in the SouthwesternUnited States: Techniques, long-term data sets, and trends’, Sisk, T. (ed.), Perspectives on theland use history of north America: A context for understanding our changing environment, USGSBiological Science Report USGS/BRD/BSR 1998–03, pp. 71–84.
Barber, V. A., Juday, G. P., and Finney, B. P.: 2000, ‘Reduced growth of Alaskan white spruce in thetwentieth century from temperature-induced drought stress’, Nature 405, 668–672.
Betancourt, J. L., Pierson, E. A., Aasen-Rylander, K., Fairchild-Parks, J. A., and Dean, J. S.: 1993,‘Influence of history and climate on New Mexico Pinyon-Juniper Woodlands’ in Proceedings ofmanaging pinyon-juniper ecosystems for sustainability and social needs, USDA Forest ServiceGeneral Tech. Report, RM-236, Santa Fe, NM, pp. 42–62.
Briffa, K. R., Bartholin T. S., Eckstein, D., Jones, P. D., Karlen, W, Schweingruber, F. H., andZetterberg, P.: 1990, ‘A 1,400-year tree-ring record of summer temperatures in Fennoscandia’,Nature 346, 434–439.
Briffa, K. R., Jones, P. D., Bartholin, T. S., Eckstein, D., Schweingruber, F. H., Karlen, W., andZetterberg, P.: 1992a: ‘Fennoscandian summers from AD 500: Temperature change on short andlong timescales’, Clim. Dyn. 7, 111–119.
Briffa, K. R., Jones, P. D., and Schweingruber, F. H.: 1992b, ‘Tree-ring density reconstructions ofsummer temperature patterns across Western North America since 1600, J. Climatol. 5, 735–744.
Briffa, K. R., Jones, P. D., and Schweingruber, F. H.: 1994, ‘Summer temperatures across NorthernNorth America: Regional reconstructions from 1760 using tree-ring densities’, J. Geophys. Res.99(D12), 25,835–25,844.
Cayan, D. R., Dettinger, M. D., Diaz, H. F., and Graham, N.: 1998, ‘Decadal variability of precipitationover Western North America’, J. Clim. 11, 3148–3166.
Chatfield, C.: 1996, The Analysis of Timeseries: an Introduction, 5th edn., Chapman and Hall, NewYork.
Cook, E. R.: 1985, A Time Series Approach to Tree-Ring Standardization, Ph.D. Dissertation, Labo-ratory of Tree-Ring Research, University of Arizona, Tucson.
Cook, E. R. and Peters, K.: 1981, ‘The smoothing spline: a new approach to standardizing forestinterior tree-ring width series for dendroclimatic studies’, Tree-Ring Bull. 41, 45–53.
Cook, E. R. and Kairiukstis, L.: 1990, Methods of Dendrochronology, Kluwer, Dordrecht.Cook, E. R., Briffa, K. R., Meko, D. M., Graybill, D., and Funkhouser, G.: 1995, ‘The “segment
length curse” in long tree-ring chronology development for palaeoclimatic studies’, Holocene 5,229–237.
Dean, J. S.: 1988, ‘Dendrochronology and paleoenvironmental reconstruction on the ColoradoPlateaus’, in Gumerman, G. J. (ed), The Anasazi in a Changing Environment, CambridgeUniversity Press, Cambridge, pp. 119–167.

486 MATTHEW W. SALZER AND KURT F. KIPFMUELLER
Dean, J. S.: 1994, ‘The medieval warm period on the Southern Colorado Plateau’, Clim. Change 26,225–241.
Dean, J. S. and Robinson, W. J.: 1978, ‘Expanded tree-ring chronologies for the Southwestern UnitedStates’, Chronology Series III, Laboratory of Tree-Ring Research, The University of Arizona,Tucson.
Dettinger, M. D., Cayan, D. R., Diaz, H. F., and Meko, D. M.: 1998, ‘North-South precipitation patternsin Western North America on interannual-to-decadal timescales’, J. Clim. 11, 3095–3111.
Ebbesmeyer, C. C., Cayan, D. R., McLain, D. R., Nichols, F. H., Peterson, D. H., and Redmond, K.T.: 1991, ‘1976 step in the Pacific climate: Forty environmental changes between 1968–1975 and1977–1984’, in Proceedings of Seventh Annual Pacific Climate (PACLIM) Workshop, CaliforniaDepartment of Water Resources, pp. 115–126.
Fritts, H. C.: 1969, ‘Bristlecone pine in the White Mountains of California, growth and ring-widthcharacteristics’, Papers of the Laboratory of Tree-Ring Research IV, The University of Arizona,Tucson.
Fritts, H. C.: 1976, Tree-Rings and Climate, Academic Press, London.Fritts, H. C.: 1991, Reconstructing Large-Scale Climatic Patterns from Tree-Ring Data, University
of Arizona Press, Tucson.Graumlich, L. J.: 1993, ‘A 1000-year record of temperature and precipitation in the Sierra Nevada’,
Quater. Res. 39, 249–255.Gray, S. T., Betancourt, J. L., Fastie, C. L., and Jackson, S. T.: 2003, ‘Patterns and sources of multi-
decadal oscillations in drought-sensitive tree-ring records from the Central and Southern RockyMountains’, Geophys. Res. Lett. 30, 1316.
Graybill, D. A. and Funkhowser, G. S.: 1999, ‘Dendroclimatic reconstructions during the past millen-nium in the Southern Sierra Nevada and Owens Valley, California’, in Rose, M. R. and Wigand,P. E. (eds), Proceedings of the Southern California Climate Symposium, Technical Report No. 11,Natural History Museum of Los Angeles County, pp. 239–269.
Graybill, D. A. and Idso, S. B.: 1993, ‘Detecting the aerial fertilization effect of atmospheric CO2
enrichment in tree-ring chronologies’, Global Biogeochem. Cycles 7, 81–95.Grissino-Mayer, H. D.: 1995, Tree-Ring Reconstructions of Climate and Fire History at El Malpais
National Monument, New Mexico, Ph.D. Dissertation, Laboratory of Tree-Ring Research, TheUniversity of Arizona, Tucson, University Microfilms International, Ann Arbor.
Hughes, M. K. and Diaz, H. F.: 1994, ‘Was there a medieval warm period, and if so, where and when?,Clim. Change 26, 109–142.
Jacoby, G. C., Cook, E. R., and Ulan, L. D.: 1985, ‘Reconstructed summer degree days in CentralAlaska and Northwestern Canada since 1524, Quater. Res. 23, 18–26.
Jacoby, G. C. and D’Arrigo, R.: 1989, ‘Reconstructed Northern Hemisphere annual temperaturesince 1671 based on high latitude tree-ring data from North America’, Clim. Change 14, 39–59.
Johnson, R. A.: 1994, Miller and Freund’s Probability and Statistics for Engineers, 5th edn., Prentice-Hall, Englewood Cliffs, New Jersey.
Kipfmueller, K. F.: 1993, Fire-Climate-Vegetation Interactions in Subalpine Forests of the Selway-Bitteroot Wilderness Area, Idaho and Montana, USA, Ph.D. Dissertation, Laboratory of Tree-RingResearch, Department of Geography, The University of Arizona, Tucson, University MicrofilmsInternational, Ann Arbor.
LaMarche, V. C. Jr.: 1973, ‘Holocene climatic variations inferred from treeline fluctuations in theWhite Mountains, California’, Quater. Res. 3, 632–660.
LaMarche, V. C. Jr.: 1974, ‘Paleoclimatic inferences from long tree-ring records’, Science 183, 1043–1048.
LaMarche, V. C. Jr. and Stockton, C. W.: 1974, ‘Chronologies from temperature-sensitive BristleconePines at upper treeline in Western United States’, Tree-Ring Bull. 34, 21–45.
RECONSTRUCTED TEMPERATURE AND PRECIPITATION 487
LaMarche, V. C., Graybill, D. A., Fritts, H. C., and Rose, M. R.: 1984, ‘Increasing atmosphericcarbon dioxide: Tree-ring evidence for growth enhancement in natural vegetation’, Science 225,1019–1021.
Lamb, H. H.: 1977, Climate: Past, Present, and Future, Methuen, London.Lara, A. and Villalba, R.: 1993, ‘A 3620-year temperature record from Fitzroya cupressoides tree
rings in Southern South America’, Science 260, 1104–1106.Luckman, B. H., Briffa, K. R., Jones, P. D., and Schweingruber, F. H.: 1997, ‘Tree-ring based recon-
struction of summer temperatures at the Columbia Icefield, Alberta, Canada, AD 1073–1983’,Holocene 7, 375–389.
Mantua, N. J., Hare, S. R., Zhang, Y., Wallace, J. M., and Francis, R. C.: 1997, ‘A Pacific interdecadalclimate oscillation with impacts on salmon production’, Bull. Am. Meteorol. Soc. 78(6),1069–1079.
Mooney, H. A., West, M., and Brayton, R.: 1966, ‘Field measurements of the metabolic responses ofBristlecone Pine and big sagebrush in the White Mountains of California’, Bot. Gaz. 127, 105–113.
Salzer, M. W.: 2000a, Dendroclimatology in the San Francisco Peaks Region of Northern Arizona,U.S.A., Ph.D. Dissertation, Laboratory of Tree-Ring Research, Department of Geosciences, TheUniversity of Arizona, Tucson, University Microfilms International, Ann Arbor.
Salzer, M. W.: 2000b, ‘Temperature variability and the Northern Anasazi: Possible implications forregional abandonment’, Kiva 64(4), 295–318.
Schulze, E. D., Mooney, H. A., and Dunn, E. L.: 1967, ‘Wintertime photosynthesis of BristleconePine (Pinus aristata) in the White Mountains of California’, Ecology 48, 1044–1047.
Scuderi, L. A.: 1990, ‘Tree-ring evidence for climatically effective volcanic eruptions’, Quater. Res.34, 67–85.
Scuderi, L. A.: 1993, ‘A 2000-year tree ring record of annual temperatures in the Sierra NevadaMountains’, Science 259, 1433–1436.
Stahle, D. W., Cook, E. R., Cleaveland, M. K., Therrell, M. D., Meko, D. M., Grissino-Mayer, H.D., Watson, E., and Luckman, B. H.: 2000, ‘Tree-ring data document 16th century megadroughtover North America’, EOS 81, 121–125.
Stockton, C. W.: 1975, Long Term Streamflow Records Reconstructed from Tree-Rings, Universityof Arizona Press, Tucson.
Swetnam, T. W. and Betancourt, J. L.: 1998, ‘Mesoscale disturbance and ecological response todecadal climatic variability in the American Southwest’, J. Clim. 11, 3128–3147.
Swetnam, T. W. and Brown, P. M.: 1992, ‘Oldest known conifers in the Southwestern United States:Temporal and spatial patterns of maximum age’, in Proceedings of the Workshop on Old-GrowthForests in the Rocky Mountains and Southwest: The Status of Our Knowledge, USDA ForestService General Tech. Report RM-GTR 213, Portal, AZ, pp. 24–38.
Tranquillini, W.: 1964, ‘The physiology of plants at high altitudes’, Ann. Rev. Plant Physiol. 15,345–362.
Trenberth, K. E. and Hoar, T. J.: 1996, ‘The 1990–1995 El Nino-Southern Oscillation event: Longeston record’, Geophys. Res. Lett. 23, 57–60.
Trenberth, K. E. and Hoar, T. J.:1997, ‘El Nino and climate change, Geophys. Res. Lett. 24, 3057–3060.Vaganov, E. A., Hughes, M. K., Kirdyanov, A. V., Schweingruber, F. H., and Silkin, P. P.: 1999,
‘Influence of snowfall and melt timing on tree growth in subarctic Eurasia’, Nature 400, 149–151.Weisberg, S.: 1985, Applied Linear Regression, 2nd edn., Wiley, New York.Wigley, T. M. L., Briffa, K. R., and Jones, P. D.:1984, On the average value of correlated time series,
with applications in dendroclimatology and hydometeorology’, J. Clim. Appl. Meteorol. 23,201–213.
(Received 16 July 2001; in revised form 21 June 2004)