Embed Size (px)
Citation preview

Reclaimed Water Feasibility Study
Appendices
March 2008
King Street Center, KSC-NR-0512
201 South Jackson Street Seattle, WA 98104
http://dnr.metrokc.gov/wtd/

For comments or questions, contact: Christie True King County Wastewater Treatment Division 201 South Jackson Street KSC-NR-0512 Seattle, WA 98104-3856 206- 684-1236 [email protected] This information is available in alternative formats on request at 206-684-1280 (voice) or 711 (TTY).

Appendices A. Washington Reuse Class Standards B. Comparison of Reclaimed Water Regulations and Standards for Selected Sites C. Examples of Developing Technologies in Use (CA, NV, AZ, FL, CO) D. Developing Reuse Technologies E. Washington Case Studies F. Construction Costs for Treatment Technologies G. Summary of UV Sizing and Cost Tool H. 2005 Annual Survey of Wholesale Customers: Summary of Results, Seattle Public Utilities I. Out of State Case Studies J. Summary of Case Studies K. Stakeholder Program Summary

Appendix A Washington Reuse Class Standards

Reclaimed Water Feasibility Study A-1
Appendix A Washington Reuse Class Standards
(Source: Chapter E1 Water Reclamation and Reuse 2006, Criteria for Sewage Works Design (Orange Book)
Table 1 summarizes the treatment and water quality requirements for each reuse class in Washington State. Table 2 contains the reuse class and additional water quality and treatment requirements for various reuse applications in Washington.
Table 1. Reuse Class and Water Quality Requirements
Disinfection (Total Coliform/100 mL) Not to Exceed Class
Oxidized BOD and TSS
(mg/L) Coagulated
Filtered Turbidity (NTU) 7-day Median Single Sample
A 30 Yes 2 2.2 23
B 30 No No 2.2 23
C 30 No No 23 240
D 30 No No 240 No standard
Table 2. Treatment Requirements by Reuse Application Type
Reuse Application1 Treatment Requirements
Direct Aquifer Recharge Injection
Nonpotable Aquifers Class A plus BOD and TSS ≤ 5 mg/L
Potable Aquifers Class A plus Reverse Osmosis
BOD and TSS ≤ 5 mg/L
Total Coliforms 1/100 mL, TOC ≤ 1.0 mg/L
Nitrogen ≤ 10 mg/L, Turbidity ≤ 0.1 mg/L
Meet Groundwater Standards
Meet Drinking Water MCLs
Surface Percolation for Groundwater Recharge Class A plus Nitrogen Removal
Meet Groundwater Standards
Meet Drinking Water Standards
Stream Flow Augmentation
Class A plus project specific requirements
Meet Federal Water Pollution Control Act
Meet Surface Water Standards
Meet EPA Clean Water Act

Appendix A. Washington Reuse Class Standards
A-2 Reclaimed Water Feasibility Study
Reuse Application1 Treatment Requirements
Wetlands2 Class A-D plus project specific requirements
BOD and TSS 20 mg/L, Nitrogen 3 mg/L
Total Phosphorus 1 mg/L
Meet toxicity standards for NH3-N
Meet Surface Water Standards
Meet EPA Clean Water Act
Irrigation of Nonfood Crops Use specific Class C or D
Irrigation of Food Crops
Spray irrigation or surface irrigation of root crops
Surface irrigation no contact to edible portion of crops
Surface irrigation of orchards & vineyards
Class A or better
Class B or better
Class D or better
Landscape Irrigation
Open access areas
Restricted areas
Class A or better
Class C or better
Impoundments
Non-restricted recreational impoundments
Restricted recreational impoundments
Landscape Impoundments
Class A or better3
Class B or better
Class C or better
Commercial and Industrial Uses
Uses with potential human exposure
Class A or better
Fish hatchery basins Class B or better
Dust control and making concrete Class C or better
Flushing of sanitary sewers Class D or better 1 Not a complete list of uses. See 1997 Washington Stds and Chapter 90.46 RCW for a complete list. 2 Shall not exceed Washington Chronic Toxicity Stds (173-201A-040) for freshwater systems or Washington
Surface Water Quality Stds (173-201A) for Arsenic, Cadmium, Copper, Lead, Mercury, Nickel, and Zinc. 3 Reclaimed water cannot be used in swimming pools unless authorized by the Dept. of Health and Ecology.
Groundwater Protection Regulations The Washington water quality standards for ground waters (173-200 WAC) contain standards to maintain the quality and protect existing and future groundwater from contamination. The groundwater quality criteria are separated into primary contaminants, secondary contaminants, radionuclides, and carcinogens. Table 3 contains some of the required primary and secondary contaminant levels for reclaimed water used for direct recharge of potable aquifers. Refer to WAC 173-200 Table 1 for a complete list of the required primary and secondary contaminant, radionuclide, and carcinogen levels. Although the nitrate limits differ between WAC 173-200 and Chapter 90.46 RCW, nitrate limits specified in Chapter 90.46 RCW (less than or equal to 10 mg/L) are specific for recharge of potable aquifers Additionally, a ground water monitoring

Appendix A. Washington Reuse Class Standards
Reclaimed Water Feasibility Study A-3
program and sampling at monitoring wells is required for direct recharge of potable and nonpotable aquifers by the State of Washington.
If reclaimed water is used for wetlands, a hydrogeologic evaluation, in addition to treatment and water quality requirements specified in Chapter 90.46 RCW, must be performed prior to application to ensure protection of the groundwater.
The Underground Injection Control Program (UIC) protects groundwater quality in the State of Washington by regulating discharges to underground injection wells. Permitted aquifer recharge wells and injection wells used as part of a reclaimed water project are classified as Class V injection wells under the UIC regulation (WAC 173-218). Class V wells are usually shallow injection wells that inject fluids above the uppermost groundwater aquifer.
Table 3. Groundwater Recharge Water Quality Criteria
Parameter1 Concentration
Barium 1 mg/L
Cadmium 0.01 mg/L
Chromium 0.05 mg/L
Lead 0.05 mg/L
Mercury 0.002 mg/L
Selenium 0.01 mg/L
Silver 0.01 mg/L
Fluoride 4 mg/L
Total Dissolved Solids 500 mg/L
Chloride 250 mg/L
Sulfate 250 mg/L
Copper 1.0 mg/L
Total Coliform 1/100 mL
Manganese 0.05 mg/L
Zinc 5 mg/L
pH 6.5 to 8.5
Iron 0.3 mg/L 1 Primary and Secondary contaminants, WAC 173-200 also contains limits on Radionuclides
and carcinogens.

Appendix B Comparison of Reclaimed Water Regulations
and Standards for Selected States

Appendix B. Comparison of Reclaimed Water Regulations and Standards for Selected States
Standards Washington Oregon Colorado California Arizona Florida TexasLevel I: Biological Treatment Disinfected Tertiary Class A+: Filtration & N removal
Disinfected Secondary-2.2 Class A: Filtration
Disinfected Secondary-23 Class B+: N Removal Secondary with basic disinfection Type 2: Primary Treatment
Undisinfected Secondary Class B: Disinfected Secondary
Class C: Stabilization pond or lagoon system
Level IV: 2 NTU 24-hour mean, 5 NTU 5% of time during 24-hour period. Hourly sampling frequency.
Secondary w/ filtration CBOD 20 mg/L annual average, TSS 5 mg/L (single sample), Total chlorine residual 1 mg/L
Type 1: On a 30-day average shall have a quality of BOD5 or CBOD5 5 mg/L, Turbidity 3 NTU
Level I, II, and III: No limits on turbidity. Secondary w/ basic disinfection CBOD 20 mg/L annual average, TSS 10 mg/L (single sample), Total chlorine residual 0.5 mg/L
Type 2: (for a system other than a pond system) BOD5 20 mg/L, CBOD5 15 mg/L
Class B, C, and D 30 mg/L BOD and TSS Category 2: Turbidity - 3 NTU monthly average, 5 NTU < 5% of samples
Membrane filtration 0.2 NTU <5% of daily samples. Max 5 NTU
N Removal (Class A+/B+): Total nitrogen < 10 mg/L (5 sample geometric mean)
Wetlands (receiving) CBOD and TSS 5 mg/L, total nitrogen 3 mg/L, total phosphorus 1 mg/L, total ammonia 2 mg/L annual average, TSS 10 mg/L (single sample)
Type 2: (for a pond system) BOD5 30 mg/L,
Disinfection Indicator
Total coliform Total coliform E. coli and Total Coliform Total Coliform Fecal Coliform Fecal Coliform, Cryptosporidium, Giardia Fecal Coliform
Additional monitoring requirements. Pathogen removal expectation: (Viable cysts/PFU per 100 L) Microbe Avg. Max Cryptosporidium 1.4 5.0 Giardia 5.8 22
Stricter limits for direct aquifer recharge, surface percolation groundwater recharge, stream flow augmentation, and wetlands.
Level I no limit on total coliforms. Agricultural standards vary for total coliforms and E.coli
Secondary-23 Total Coliform: weekly median 23 MPN/100mL, only 1 sample >240 MPN/100mL per month
Class C: Fecal coliform < 1000 cfu/100mL (7 sample median), 4000 cfu/100mL maximum
Secondary w/ basic disinfection fecal coliform 200 cfu/100 mL annual and monthly mean, max in one sample of 400 cfu/100mL
Type 2: (for a pond system) Fecal Coliform 200 CFU/100 mL geometric mean, not to exceed in any single sample 800 CFU/100 mL.
Type 1: Disinfected Secondary Treatment
Type 1: Fecal Coliform 20 CFU/100 mL geometric mean, not to exceed in any single sample 75 CFU/100 mL.
Type 2: (for a system other than a pond system) Fecal Coliform 200 CFU/100 mL geometric mean, not to exceed in any single sample 800 CFU/100 mL.
Secondary w/ filtration and disinfection 75% of fecal coliform tests must be non detect in a 30-day period, maximum in one sample of 25 cfu/100mL
Enterovirus 0.044 0.165
Tertiary Total Coliform: weekly median 2.2 MPN/100mL, only 1 sample > 23 MPN/100mL per month, max 240 MPN/100mL
Category 1 and Category 2: 126 E. coli/100mL monthly geometric mean and 235 E. coli/100mL monthly maximum
Class A+/A: No detectable fecal coliform organisms (7-sample median, i.e. 4 of 7 must be ND), 23 cfu/100mL single sample maximum
Class A/B Total Coliform: weekly median 2.2 MPN/100mL, only 1 sample not to exceed 23 MPN/100mL
Treatment Classes
Category 2: Secondary w/ filtration and disinfection
Category 1: Secondary w/ disinfection
Disinfection Standards
Class D Total Coliform: weekly median 240 MPN/100mL
Residential Irrigation and unrestricted recreational uses: Total coliforms 2.2 MPN/100 mL (7-day median), not to exceed 23 MPN/100 mL any sample.
Secondary w/ filtration and disinfection
Secondary w/ nitrification for wetlands
Class A: 30 mg/L BOD and TSS, Filtered turbidity does not exceed an average of 2 NTU, determined monthly and which does not exceed 5 NTU at any time. Stricter limits for direct aquifer recharge, surface percolation groundwater recharge, stream flow augmentation, and wetlands.
Category 1: 30 mg/L TSS daily max Filtration (Class A+/A): Turbidity < 2 NTU 24-hour average, not to exceed 5 NTU
Class A: Oxidized, Coagulated, Filtered and Disinfected at a minimum
Class B-D: Oxidized and Disinfected at a minimum
Level IV: Biological treatment, disinfection, clarification, coagulation, and filtration.
Level II and Level III: Biological Treatment and disinfection
Treatment Standards
Filtered Wastewater: Turbidity - 2 NTU daily average, 5 NTU < 5% of daily samples, never exceed 10 NTU
Class C Total Coliform: weekly median 23 MPN/100mL, only 1 sample not to exceed 240 MPN/100mL
Level IV: 2.2 total coliforms/mL 7-day median, 23 total coliforms/mL maximum.
Level III: 2.2 total coliforms/mL 7-day median, 23 total coliforms/mL maximum.
Level II: 23 total coliforms/mL 7-day median, 240 total coliforms/mL in two consecutive samples.
Secondary-2.2 Total Coliform: weekly median 2.2 MPN/100mL, only 1 sample >23 MPN/100mL per month
Class B+/B: Fecal coliform < 200 cfu/100mL (7-sample median), 800 cfu/100mL single sample maximum
Reclaimed Water Feasibility Study B-1

Appendix B. Comparison of Reclaimed Water Regulations and Standards for Selected States
Standards Washington Oregon Colorado California Arizona Florida TexasFiltration Design Requirements
Filtration unit process must have reliability features and design features specified in the Orange Book Chapter E1 October 2006
Oxidized, coagulated, clarified wastewater which has been passed through natural undisturbed soils or filter media, such as sand or diatomaceous earth, so that the turbidity as determined by an approved laboratory method does not exceed requirements.
See Design Criteria for WW treatment facilities
Tertiary: coagulated and filtered at a maximum of 5 gpm/sf in media gravity, upflow or pressure filters; or 2 gpm/sf in automatic backwash filters
Chemical feed facilities for coagulant or polymer must be present, but not necessarily operated if filtration meets turbidity standards
Chemical feed facilities for coagulant must be present, but not necessarily operated if filtration meets TSS standards
Filtration must be employed as a unit operation to supplement suspended solids removal for those treatment facilities with tertiary effluent limitations (suspended solids effluent quality equal to or less than 10 mg/liter)
Chemical, physical or biological means to destroy pathogens to meet requirements.
Tertiary Chlorine: 450 mg-min/L CT with a modal contact time of 90 minutes
Specific CT values (25, 40, 120) for different pre-chlorination coliform levels
UV: 5 log removal of MS2 or polio virus Minimum contact time at peak hourly flow of 15 minutes at specified total chlorine residual
Class D: irrigation of trees, fodder, fiber, and seed crops, orchards and vineyards, crops with sufficient processing to destroy all pathogens, flushing of sanitary sewers, wetlands.
Level I: Fodder, fiber, and seed crops not for human ingestion and commercial timber. Oregon recommends that irrigation no be performed for 30 days prior to harvest.
Category 1: Cooling towers, concrete mixing and washout, dust control, soil compaction, closed loop cooling system, restricted access irrigation, mechanized street cleaning, zoo operations
Undisinfected Secondary: surface irrigation of orchards and vineyards; fodder, fiber, and seed crops; flushing sanitary sewers
Class C: pasture and livestock watering for non-dairy animals, irrigation of sod farms, irrigation of fiber, seed, forage, and similar crops, silviculture
Class C: ornamental plants for commercial use, pasture for dairy animals, restricted access areas, landscape impoundments, street sweeping, brush dampening, dust control, dampening of soil for compaction, water jetting for consolidation of backfill around pipelines, dumping water from aircrafts for fire fighting, making concrete, boiler feed, and all Class D uses.
Category 2: Category 1 plus unrestricted access irrigation, non-residential fire protection
Secondary-23: pasture for milking animals, restricted access irrigation, cooling w/o cooling tower or misting, boiler feed, nonstructural fire fighting, backfill consolidation around nonpotable piping, concrete mixing, soil compaction, dust control, cleaning roads, non-contact process water
Class B: street cleaning, materials washing and sieving, concrete and cement mixing, livestock watering and pasture for dairy animals, soil compaction and similar construction activities, dust control, landscape impoundment, restricted access landscape irrigation, golf course irrigation, surface irrigation of orchards and vineyards
Class B: restricted recreational impoundments, fish hatchery basins, washing of corporation yards, lots, and sidewalks, and all Class C and D uses.
Colorado regulation is not applicable to agricultural recycled water use
Secondary-2.2: surface irrigation of food crops w/o contact, restricted recreational impoundments
Class A: snowmaking, vehicle and equipment washing (not self-service), commercial closed loop air conditioning, spray irrigation of orchards and vineyards, fire protection systems, toilet and urinal flushing, open access landscape irrigation, school and residential irrigation, recreational impoundments, irrigation of food crops
Class A: groundwater recharge, indirect potable reuse, stream flow augmentation, open access wetlands, toilet and urinal flushing, hydrant or sprinklers in buildings, spray street washing, decorative fountains, nonrestricted recreational impoundments, irrigation of open access areas, root crops, all food crops, plus all uses listed for Class B-D
Level IV: unrestricted use. No direct public contact during irrigation cycle.
Tertiary: food crops w/ contact, unrestricted irrigation, flushing toilets, decorative fountains, unrestricted recreational impoundments, cooling w/ cooling towers or misting, industrial process water w/ contact, structural fire fighting, commercial laundries, backfill around potable pipes, artificial snow making, car washes
(1) See 2004 Guidelines for Water Reuse, EPA, January 2005 for a similar comparison for 40 states with standards or regulations.
Uses
Disinfection Design Requirements
Chlorination: Minimum contact time of 30 min. UV: Minimum contact time 5-7 seconds. Ozone: Case-by-case basis
Chlorine disinfection must have features to allow for uninterrupted chlorine feed as well as reliability features and alarms. All other disinfection unit processes must have reliability features and alarms. Design features specified in the Orange Book Chapter E1 October 2006.
Meet Standards
Level II and Level III: processed food crops, surface irrigation of orchards and vineyards. Fodder, fiber, and seed crops not for human ingestion, pasture for animals (no animals present during irrigation), sod, ornamental nursery stock, Christmas trees, firewood, commercial timber. Oregon recommends that irrigation no be performed for 3 days prior to harvest. Difference between level uses are the buffer distances for irrigation.
Type 1: Residential irrigation, urban uses (public parks & golf courses), fire protection (sprinklers or hydrants), irrigation of food crops where reclaimed water may have direct contact with the edible part of the crop, unless the food crop undergoes a pasteurization process, irrigation of pastures for milking animals, maintenance of impoundments or natural water bodies for recreational activities, toilet or urinal flush water, and other similar activities where the potential for unintentional human exposure may occur
Type 2: Irrigation of sod farms, silviculture, remote irrigation sites, bordered (fenced), private irrigation sites, irrigation site is not used by the public during the times when irrigation operations are in progress (i.e. golf courses, cemeteries), irrigation site is restricted from public access by law, irrigation of food crops where the reclaimed water is not likely to have direct contact with the edible part of the crop, irrigation of animal feed crops other than pasture for milking animals, maintenance of impoundments or natural water bodies where direct human contact is not likely, soil compaction or dust control, cooling tower makeup water, irrigation or other non-potable uses of reclaimed water at a WW treatment facility
CT =>20, and minimum contact time of 20 minutes, and minimum residual is 0.5mg/L. Maximum residual is 4mg/L per grab sample, or that necessary to protect aquatic life
Applications with secondary w/filtration and disinfection do not differentiate between unrestricted and restricted urban reuse.
Secondary treatment with basic disinfection uses include agricultural irrigation of non-food crops.
Reclaimed Water Feasibility Study B-2

Appendix C Examples of Developing Technologies in Use
(CA, NV, AZ, FL, CO)

Reclaimed Water Feasibility Study C-1
Appendix C Examples of Developing Technologies
in Use (CA, NV, AZ, FL, CO)
This appendix contains a summary of reclaimed water projects that have been implemented in California, Nevada, Arizona, Florida, and Colorado. Information presented here includes the technologies employed, the application for the reclaimed water, the process capacity, age, product quality, costs for capital and O&M, and operations advantages and disadvantages if available.
C.1 California .................................................................................................................... C-2
C.1.1 Davis ................................................................................................................... C-2 C.1.2 LA County Sanitation District ............................................................................ C-3 C.1.3 Dublin San Ramon Services District .................................................................. C-5 C.1.4 Carmel Area Wastewater District ....................................................................... C-7 C.1.5 Petaluma.............................................................................................................. C-9 C.1.6 West Basin Municipal Water District ................................................................. C-9 C.1.7 Orange County Water District .......................................................................... C-11 C.1.8 City of Turlock.................................................................................................. C-13 C.1.9 Daly City........................................................................................................... C-14 C.1.10 City of Watsonville ........................................................................................... C-14 C.1.11 City of Roseville ............................................................................................... C-15
C.2 Nevada ...................................................................................................................... C-17 C.2.1 Clark County Water Reclamation District ........................................................ C-17
C.3 Arizona...................................................................................................................... C-19 C.3.1 City of Phoenix ................................................................................................. C-19 C.3.2 Fountain Hills Sanitary District ........................................................................ C-21
C.4 Florida ....................................................................................................................... C-23 C.4.1 Sarasota County ................................................................................................ C-23 C.4.2 Southwest Florida Water Management District................................................ C-23
C.5 Colorado.................................................................................................................... C-25 C.5.1 Centennial Water and Sanitation District ......................................................... C-25

Examples of Developing Technologies in Use (CA, NV, AZ, FL, CO)
C-2 Reclaimed Water Feasibility Study
C.1 California
C.1.1 Davis
The City of Davis (CA) has completed the predesign for a new 7.5 mgd average dry weather flow (8.9 mgd maximum month) water pollution control plant. The high effluent quality demanded by California regulators is due to discharge to a municipal water supply with a high potential for public contact. The primary and secondary treatment process is composed of clarification and plug-flow activated sludge process with full nitrification and partial denitrification (MLE configuration). The tertiary treatment process is composed of ultra-filtration (UF) membranes followed by ultraviolet (UV) disinfection. The use of UF membranes ahead of UV provides for a multiple barrier of pathogen reduction and allows for advanced treatment by coupling chemical addition with the UF membranes. The predesign is based upon Zenon UF membranes and Trojan UV3000Plus UV disinfection. The predesign costs for such treatment are shown below in Table 1. These costs are in 2007 dollars.
Table 1. Davis Water Pollution Control Plant Cost Estimates
Treatment Process Average
Flow (mgd)
Construction Cost 1 Without Overland Flow
(2007$)
Membrane Filtration and Pumping 7.5 $21,100,000
UV 7.5 $5,700,000 1 Construction costs 5-7-07 include 25% contingency. Does not include sitework. Information from Water Pollution Control Plant Improvement Project (Carollo, 2007).
As part of the initial analysis for treatment technologies for this project, the potential combination of ozone with UV in series was examined. Using ozone ahead of UV results in an increased Ultraviolet Transmittance (UVT), which dramatically reduces the UV cost portion of the O&M costs (due to increased UV efficiency), see ozone/UV post membrane versus ozone post membrane O&M costs. The costs for such treatment are shown below in Table 2. Notice the flow to be treated was originally assumed to be higher than later determined in Table 2.

Examples of Developing Technologies in Use (CA, NV, AZ, FL, CO)
Reclaimed Water Feasibility Study C-3
Table 2. Ozone, UV, and Ozone/UV Costs Estimates for Davis CA
Design Case 1 Design
UV Dose mJ/cm2
Design UVT,
% Operational
UVT, %
Design Ozone Dose, mg/L
Total Estimated
Construction Cost (2006$)
Total Estimated O&M Cost
(2006$)
UV post media 100 55 60 0 $9,900,000 $359,000
Ozone/UV post media 100 65 75 3 $9,350,000 $419,960
UV post membrane 80 65 70 0 $5,400,000 $184,000
Ozone post membrane NA NA NA 5 $7,087,500 $388,267
Ozone/UV post membrane 80 75 80 3 $6,950,000 $340,960
1 Design flow 10.5 mgd, operational flow 8 mgd.
Note: Costs shown are planning level estimates for Davis CA made in 2006. UV costs are lower due to the use of an in-vessel UV technology. The UV technology used in Table 1 was a higher cost open channel system.
C.1.2 LA County Sanitation District
The LA County Sanitation District (LACSD) operates 11 wastewater treatment facilities, 10 of which are classified as water reclamation plants (WRPs). The effluent quality at the WRPs ranges from undisinfected secondary to coagulated, filtered, disinfected tertiary. During fiscal year 2004-05 the District reclaimed 37.2% (193 mgd) of the total amount of effluent produced at all the plants combined. The combined water reclamation capacity at the 10 WRPs is now 256.3 mgd. Table 3 contains a summary of the WRPs.
At a number of the WRPs the effluent goes to percolation basins for soil aquifer treatment (SAT) and groundwater recharge. Reclaimed water meeting the State of California’s Title 22 tertiary recycled water quality (Title 22) followed by SAT has been shown to reduce EDCs and PhACs and result in pathogen free water. Because groundwater recharge is indirect potable reuse (IPR), LACSD is constantly looking for cost-effective methods to provide greater public health protection. In response to trace levels of adenovirus in their Title 22 effluent, LACSD is converting from chlorination to UV disinfection at a number of their WRPs, starting with Lancaster WRP and Whittier Narrows WRP.
The Lancaster WRP is a conventional filtration/chlorination plant that is splitting off 2 mgd of primary effluent and producing a high quality of reclaimed water using a membrane bioreactor (MBR, provided by Zenon) followed by UV disinfection (80mJ/cm2 dose, 1 mgd of treatment provided by Wedeco (TAK55 HP) and 1 mgd of treatment provided by Trojan (UV3000Plus)). Construction of the 2 mgd split stream treatment was completed in 2007. Projects to upgrade and expand the existing Lancaster WRP to 18 mgd and to provide additional recycled water storage capacity will be released for bidding and construction in 2007 (lacsd.org). Upgrading the oxidation ponds to conventional activated sludge treatment is planned as part of the upgrade.

Examples of Developing Technologies in Use (CA, NV, AZ, FL, CO)
C-4 Reclaimed Water Feasibility Study
Table 3. LA County Sanitation District WRP Summary
WRP Startup Capacity (mgd) Treatment
Quantity Reclaimed2
(mgd) Recycled Water End Use
La Canada 1962 0.2
Primary, secondary (extended aeration), chlorine disinfection
0.12 Irrigation (golf course)
Long Beach 1973 25
Primary, secondary, tertiary, chlorine disinfection, dechlorination
18.5
Irrigation (schools, golf courses, parks, and greenbelts) Re-pressurization of oil-bearing strata
Los Coyotes 1970 37
Primary, secondary, tertiary, chlorine disinfection, dechlorination
32.9
Irrigation (schools, golf courses, parks, and greenbelts) Industrial uses (carpet dying and concrete mixing)
Pomona 1926
Stage 1 1966
13
Primary, secondary, tertiary, chlorine disinfection, dechlorination
10.5
Irrigation (schools, golf courses, parks, greenbelts, etc.) Irrigation and dust control at the Spadra Landfill Industrial use by local paper manufacturers Remaining put into San Jose Creek channel
San Jose Creek 1971 100
Primary, secondary, tertiary, chlorine disinfection, dechlorination
81.2 Groundwater recharge Irrigation (parks, schools and greenbelts)
Whittier Narrows 1962 15 Primary, secondary,
tertiary, chlorination 7.6
Groundwater recharge into the Rio Hondo and San Gabriel Coastal Spreading Grounds Irrigation (adjacent nursery)
Valencia 1967 21.6
Primary, secondary, tertiary, chlorine disinfection, dechlorination
16.0 Reuse
Saugus 1962 7
Primary, secondary, tertiary, chlorine disinfection, dechlorination
4.1 Santa Clara River or Reuse
Lancaster 1959 16
Primary, secondary (aerated oxidation ponds), disinfection Seasonal - tertiary (phosphorus reduction and dual-media filtration)
12.3
Irrigation, ponds, impoundments, storage reservoirs Seasonal tertiary effluent to Apollo Lakes Park
Palmdale3 1953 15 Primary, secondary (aerated oxidation ponds) 9.9
Irrigation (Los Angeles Depart. of Airports’ property)
1 Information from lacsd.org 2 Fiscal Year 2004-05 3 Planning an upgrade to the existing treatment processes and add new tertiary treatment facilities. 4 Whittier Narrows and Lancaster are to be expanded.

Examples of Developing Technologies in Use (CA, NV, AZ, FL, CO)
Reclaimed Water Feasibility Study C-5
The Whittier Narrows WRP (WNWRP), upon construction (construction begins in 2007), will utilize sand filtration (conventional deep bed filtration) followed by UV disinfection (100mJ/cm2 dose, all flow treated by a Trojan UV3000Plus) to treat 24.2 mgd of reclaimed water, with a low dose of sodium hypochlorite supplied prior to filtration to reduce biofilm growth and to provide an additional disinfection barrier to adenovirus. UV disinfection was needed at WNWRP due to NDMA effluent levels that were affecting groundwater wells.
The central components for both WRPs mentioned above were constructed too long ago to have cost relevance here. However, the costs for the MBR and UV systems at Lancaster and the cost to implement the combined hypochlorite and UV system at Whittier Narrows are detailed here (Table 4). The costs shown are in 2007 dollars.
Table 4. Whittier Narrows and Lancaster LACSD WRP Cost Summary 1
Plant Process Flow (mgd)
Equipment Costs
(2007$)
Construction Costs
(2007$)
Engineering Costs
(2007$)
Whittier Narrows UV 2 24.2 $1,711.428 $5,700,000 3 $1,500,000 4
Lancaster MBR 5 1.0 - $3,600,000 8 $542,000 9
Lancaster UV 6 1.0 - $345,000 8 $52,000 9
Lancaster UV 7 1.0 - $402,000 8 $61,000 9 1 Information provided by LACSD. 2 Total number of lamps at WNWRP 768 (192 per train). 3 Costs in 2007 dollars. WNWRP estimated construction costs based on a construction cost factor
(3.33) relative to equipment costs. 4 Engineering cost includes design and construction management. 5 Zenon MBR 6 Wedeco UV TAK55HP 7 Trojan UV3000 Plus 8 Lancaster construction costs based on installed cost plus 10% general conditions, 15%
contractor overhead and profit, and 7.75% sales tax. 9 Engineering, legal, and administration costs based on 50% of construction costs.
C.1.3 Dublin San Ramon Services District
The Dublin San Ramon Services District (DSRSD) provides high quality reclaimed water for golf course irrigation by further treating secondary effluent from a conventional activated sludge plant. DSRSD currently has two reclaimed water treatment trains.
The first treatment train originally planned on the use of microfiltration (MF) and reverse osmosis (RO) followed by UV disinfection for IPR through direct injection into the groundwater. The MF system was initially designed to produce 3 mgd of effluent for the RO system. The RO and UV system were designed to treat 2.5 mgd.

Examples of Developing Technologies in Use (CA, NV, AZ, FL, CO)
C-6 Reclaimed Water Feasibility Study
Currently the DSRSD does not utilize the RO component of the system and the UV system has been expanded to treat the full 3 mgd of flow from the MF system. The pressurized MF system (Memcor 9010MC) has a nominal 0.2-micron pore size. Installed in 1998, the system has been in semi continuous operation for 8 years. The system operates during dry weather months to produce reclaimed wastewater for irrigation purposes. Typical times between membrane clean-in-place (CIP) for the DSRSD MF system is 1,000 hours. The RO system is supplied by Hydronautics (ESPA model). The UV system is a vertical IDI 40VLS UV system in a single channel, utilizing low-pressure (LP) 80-watt lamps.
The costs of the 2.5 mgd MF/RO/UV system for high quality demineralized wastewater are presented here (Table 5). These costs are in 1998 dollars.
The second treatment train utilizes continuous backwash sand filtration followed by UV disinfection, with the capability to treat 10.5 mgd of reclaimed water for irrigation purposes. The sand filtration system is a continuous backwash upflow filter manufactured by Andritz. The sand media depth is 80 inches with a nominal sand media size of 1.27 to 1.38 millimeters. It is commonly operated at 3 gpm/ft2 with 24 mg/L of PAC added to enhance performance. The UV system is a LP high-output (LPHO) horizontal lamp system supplied by Wedeco (model TAK55 HP). The system was installed in 2005. Costs for these facilities are also shown in Table 5.
The facility participated in a WateReuse Research Foundation project (WRF 02-009) to assess the use of ozone with optional hydrogen peroxide, downstream of their existing MF system and sand filters. The results and costs for implementation of ozone following both types of filtration systems are detailed in the “Developing Technologies” section.
Table 5. DSRSD Clean Water Revival Plant Costs
Method Flow (mgd)
Total Project Construction Cost
MF/RO/UV (Memcor 9010MC, Hydranautics ESPA, IDI 40 VLS)1 2.5 $10,198,024 (1998$)
Sand Filtration (continuous backwash) and Wedeco TAK55HP UV2 10.5 ~$7,500,000 (2005$) 1 Construction costs 1997-98, includes change orders, prepurchased MF system, and prepurchased RO
membranes. Does not include pipeline to the wells. 2 Information from Overaa Construction, the general contractor for the project. Dollars are for year 2005.
The approximate equipment cost of the sand filters was $865,000 and the UV was approximately $1,460,000. Electrical costs were approximately $10,000 and $80,000 for the sand filters and UV system, respectively. The civil cost for the structures was very expensive due to site conditions.

Examples of Developing Technologies in Use (CA, NV, AZ, FL, CO)
Reclaimed Water Feasibility Study C-7
C.1.4 Carmel Area Wastewater District
In 1994, the Carmel Area Wastewater District (CAWD), Pebble Beach Community Services District, Monterey Peninsula Water Management District, and Pebble Beach Company formed a public/private joint venture to produce and deliver recycled water for irrigation to seven golf courses in Pebble Beach, California, including world-renowned Pebble Beach Golf Course. Through this venture, they began the Water Reclamation Project, including tertiary treatment by sand filtration followed by chlorine disinfection at the CAWD wastewater treatment plant. Shortly after start of operation of the new tertiary facilities, the golf courses began experiencing some problems with the turf grass, due to high sodium and total dissolved solids (TDS) concentrations. To remedy the problem, the team began a Salinity Management Project with the intent of improving the water quality and increasing the quantity of recycled water available for irrigation (Farina, 2007). Table 6 contains the turf grass water quality criteria and the current CAWD California Title 22 requirements.
Microfiltration (MF) followed by reverse osmosis (RO) was selected to meet these water quality criteria. MF will also allow the treatment facilities to continue to meet the California Title 22 requirements for unrestricted use of recycled water. Several chemical feed systems, such as calcium hydroxide and gypsum, were included to help meet the turf grass water quality criteria and to help stabilize the corrosive RO permeate. RO was necessary to remove sufficient amounts of sodium and TDS (Farina, 2007).
Table 6. Carmel Area Water District Recycled Water Quality Requirements
Limits Parameter
Mean Maximum
Total Coliforms (CFU/100 mL) 2.2 (7-day mean) 23
BOD5 (mg/L) 10 25
Turbidity (NTU) 1 0.2, 0.5
Total Suspended Solids (mg/L) 10 25
Settleable Solids (mL/L) 0.1
Total Dissolved Solids (mg/L) 1200
pH 2 Minimum 6.5 8.4
Sodium Adsorption Ratio (SAR) 3 3
Adjusted SAR 3 4
Electro-conductivity (μmhos/cm) 3 350-450
Sodium (mg/L) 3 55 1 Title 22 requirement for reclaimed water treated with low pressure membrane process is 0.2
NTU no more than 5% of the time within a 24-hour period and no more than 0.5 NTU at any time.
2 Turf grass water quality pH optimum 6.3 to 7.3. 3 Turf grass irrigation water quality criteria.

Examples of Developing Technologies in Use (CA, NV, AZ, FL, CO)
C-8 Reclaimed Water Feasibility Study
The treatment system consists of submerged MF with an RO system utilizing Hydranautics ESPA-2 membranes. This system was piloted at the CAWD for six months, which provide valuable information for proceeding with the design of the full scale MF/RO system (Farina, 2007). Table 7 contains the design criteria proposed for the full-scale design. Table 8 contains the negotiated guaranteed maximum construction cost in 2007 dollars. The plant is still under construction; therefore the cost is still fluctuating.
Table 7. Carmel Area Water District MF/RO Design Criteria
Parameter 1 Criteria 1
MF Filtrate Capacity (mgd) 1.9
MF minimum overall recovery (%) 91
MF minimum flux (GFD) 24
Number of MF cells 3
RO permeate capacity (mgd) 1.2
RO recovery (%) 75
RO minimum flux (gfd) 10
Number of RO skids 3
RO array 10:4
Design blend ration (%RO permeate: %MF filtrate) 80:20 1 (Farina, 2007)
Table 8. Carmel Area Water District MF/RO Plant Costs
CAWD Plant Total Project Construction Cost (2007$) 1
MF/RO Plant $18,000,000 1 Negotiated guaranteed maximum price total construction costs 2007, includes
MF/RO building and complete MF/RO system, post treatment, and modifications to the existing WWTP. Does not include any tertiary chlorination facilities, pumping facilities or change orders.

Examples of Developing Technologies in Use (CA, NV, AZ, FL, CO)
Reclaimed Water Feasibility Study C-9
C.1.5 Petaluma
The City of Petaluma has embarked upon a project to replace its existing wastewater plant built in 1938 with a new water recycling facility. One of the primary goals of the project is to design and build an ecologically and economically sustainable facility. The new 8 mgd Water Recycling Facility, now under construction, will provide 4 mgd of Title 22 water to golf courses, parks, vineyards and schools and an additional 4 mgd of disinfected secondary effluent to agricultural grazing lands.
The selected processes included headworks, odor control using soil bed biofilters, extended aeration secondary treatment, secondary clarifiers, RAS/WAS pump stations, modifications to the existing oxidation ponds for storage and wet weather treatment, tertiary treatment, and biosolids treatment and storage. The City Council elected advanced wetlands treatment for metals, organics, and nutrient removal. Thirty acres of vegetative wetlands will remove algae from the oxidation ponds. Forty-five acres of polishing wetlands will provide advanced treatment of the effluent prior to river discharge.
Tertiary treatment includes continuous backwash filters and ultraviolet light (UV) disinfection (100 mJ/cm2 dose provided by an IDI Ozonia 40VLS HO UV system), to meet California Title 22 unrestricted reuse standards. The tertiary process is sized at 4 mgd (peak capacity of 5 mgd) to meet the initial demand for urban reuse. Future uses include more golf course irrigation, irrigation of vineyards, business parks, schools, and city parks.
The remainder of the secondary effluent will be stored in the ponds and used to continue serving existing agricultural users. Effluent will be discharged to the Petaluma River during the winter months. Landscaping around the wetlands will be irrigated with recycled water.
In addition to cleaning up sewage, the wetlands will provide rich habitat for a variety of waterfowl, shorebirds, raptors, fish, mammals, reptiles and amphibians. At the same time, the marshes will provide flood-control benefits by slowing down and dispersing runoff from winter storms.
The total construction cost for the complete 8 mgd facility as well as the costs for the filtration, UV disinfection, and wetlands was $110,000,000. Filtration and UV costs for 4 mgd of flow are $5,000,000 and $2,332,000 respectively. The filtration costs include filter air and chemical systems for sodium hypochlorite, alum, and polymer.
C.1.6 West Basin Municipal Water District
In 1995, the West Basin Municipal District constructed the West Basin Water Recycling Facility (WBWRF) to provide high quality reclaimed water to meet the needs of various municipal, commercial, and industrial applications (westbasin.com). Today, the facility is the largest water plant of its type in the United States and has the ability to provide six (6) different types of “designer” or custom made recycled water to meet specific needs of its customers (westbasin.com).

Examples of Developing Technologies in Use (CA, NV, AZ, FL, CO)
C-10 Reclaimed Water Feasibility Study
During 2004-2005, the WBWRF produced more than 8 billion gallons of recycled water. After two successful expansions, the facility has moved forward with a $55 million Phase IV Expansion Project (westbasin.com). The expansion will increase the production of recycled water for the groundwater basin by 5 mgd and will increase the production of Title 22 recycled water by 10 mgd.
Each “designer” water undergoes various advanced treatment processes and is used for applications such as: landscape irrigation, cooling towers, refineries, and innovative applications such as street weeping and toilet flushing. All of the types of custom-made water meet the treatment and water quality requirements specified in the California Department of Health Services Water Recycling Criteria for each recycled water application. High-quality recycled water produced at the WBWRF is also used for groundwater recharge by direct injection of the South Bay’s groundwater basin to prevent seawater intrusion (westbasin.com).
The six types of “designer” water are summarized in Table 9. West Basin was contacted for “designer” water capital and O&M costs, but did not provide the information.
Table 9. West Basin WRF Six Types of “Designer” Recycled Water
Recycled Water Type Description Recycled Water Application
Disinfected Tertiary Water
Secondary wastewater that has been filtered and disinfected
Wide variety of industrial and irrigation uses
Amended Tertiary Water
Secondary wastewater that has been filtered, disinfected, and conditioned
Specifically used for sports turf
Nitrified Water Tertiary water that has been nitrified to remove ammonia Industrial cooling towers
Softened Reverse Osmosis Water
Secondary wastewater that has been pre-treated by either lime clarification or MF, followed by RO and disinfection
Groundwater Recharge2
Pure Reverse Osmosis Water
Secondary wastewater that has been treated by MF, followed by RO and disinfection
Low-pressure boiler feed water
Ultra-Pure Reverse Osmosis Water
Secondary wastewater that has been treated by MF, followed by RO, disinfection, and a second-pass RO
High-pressure boiler feed water
1 Information from westbasin.com recycling program. 2 Exceeds state and federal drinking water standards.

Examples of Developing Technologies in Use (CA, NV, AZ, FL, CO)
Reclaimed Water Feasibility Study C-11
C.1.7 Orange County Water District
The Orange County Water District (OCWD) manages the massive groundwater basin that underlies the northwest half of the county, supplying about 75 percent of the District's total water demand. The remaining 25 percent is obtained through the Colorado River Aqueduct and the State Water Project via the Metropolitan Water District of Southern California.
As the area grew, heavy pumping to sustain the region's agricultural economy lowered the water table below sea level and saltwater from the Pacific Ocean encroached as far as five miles inland. To prevent further intrusion and to provide basin management flexibility, the District began to operate a hydraulic barrier system. A series of 23 multi-point injection wells four miles inland deliver fresh water into the underground aquifers to form a water mound, blocking further passage of seawater.
In the mid-1960s, OCWD began a pilot-scale reclamation project that developed into the now-famous Water Factory 21, located in Fountain Valley, CA. The first blended reclaimed water from Water Factory 21 (Fountain Valley, CA) was injected into the coastal barrier in October 1976. At Water Factory 21, secondary treated effluent is treated by chemical clarification, recarbonation, multimedia filtration, granular activated carbon, reverses osmosis, and chlorination. Water Factory 21 product water is a blend of 5 mgd reverse osmosis-treated water, 9 mgd carbon adsorption-treated water, and 8.6 mgd deep well water. This blend, with a total dissolved solids (TDS) content of 500 milligrams per liter (mg/L) or lower, meets all California Department of Health Services primary and secondary drinking water standards. The product water also complies with the injection requirements of the California Regional Water Quality Control Board, Santa Ana Region.
By using recycled water, wastewater discharged to the ocean has been reduced by 15,000 acre-feet annually, and OCWD has reduced its dependency on State Water Project and Colorado River supplies.
The RO system (200-325 psi) was designed as two parallel 2.5 mgd systems. The system consists of six spiral-wound cellulose acetate membranes placed end-to-end inside an eight-inch diameter fiberglass-reinforced vessel 23 feet long. There are six banks of membranes, each containing 42 vessels, arranged in a three-stage "inverted triangle" pattern (24 vessels, 12 vessels, 6 vessels) to provide 85 percent recovery (ocwd.com). Ninety percent of TDS is removed by RO. The concentrated brine (15 percent of the total input) is returned to the County Sanitation Districts for disposal via their ocean outfall. Table 10 contains the costs for Water Factory 21.

Examples of Developing Technologies in Use (CA, NV, AZ, FL, CO)
C-12 Reclaimed Water Feasibility Study
Table 10. OCWD Water Factory 21 Costs
Item Construction Cost (mid 1970’s $)1
Investigations and Improvements $2,275,000
Wastewater Reclamation $13,400,000
Injection Barrier Facilities $1,430,000
Deep Wells $732,000
Reverse Osmosis $3,000,000
Total $20,837,000 1 Construction costs from mid 70’s 2 Information from ocwd.com.
The Groundwater Replenishment (GWR) System, a joint project between the Orange County Water District and the Orange County Sanitation District, is the largest water purification project of its kind in the world. The goal of the GWR project is to help increase Orange County’s water independence by providing a locally controlled, drought-proof supply of safe, high-quality water. GWR System purified water will exceed all state and federal drinking water standards.
Highly treated wastewater will be treated by a three-step process – microfiltration, reverse osmosis, and ultraviolet light with hydrogen peroxide disinfection. The advanced oxidation process (UV/H2O2) was designed to target a 1.2 log reduction of NDMA (from 150 to 10 μg/L). The MF and RO process of the GWR is a 70 mgd system supplied by US Filter (submerged MF membranes Memcor CMF-S) and by Hydranautics RO. The advanced oxidation process of the GWR is a 70 mgd UVPhox system (Trojan Technologies) consisting of nine trains with three vessels per train. The UV system will have 3,888 low-pressure high intensity lamps total (each lamp is 257 watts). Hydrogen peroxide will be dosed at 5 mg/L.
Roughly, half of the water from the GWR System will be injected into Orange County’s seawater barrier. The seawater barrier is an underground pressure ridge of water formed by injection wells along the coast of Orange County. The remaining water will be piped to percolation basins, or large lakes in Anaheim, where the water will be filtered through clay, sand, and rock as it percolates to the deep aquifers of the groundwater basin. Table 11 contains the costs of the GWR projects. The dollars shown are year 2007 dollars.

Examples of Developing Technologies in Use (CA, NV, AZ, FL, CO)
Reclaimed Water Feasibility Study C-13
Table 11. OCWD GWR Costs
System Flow (mgd)
Engineering Costs
(2007$)
Construction Cost
(2007$)
Total Capital Cost
(2007$)
Annual Power Cost
(2007$)
Annual UV/H2O2 O&M Cost (2007$)
MF 86 - - $74,000,000 1 - -
RO 70 - - $78,000,000 2 - -
UV/H2O2 70 $250,000 $9,600,000 3 $10,440,000 $380,000 4 $240,000 5/ $584,000 6 1 Installed capital cost - MF facility (bldg, infrastructure, electrical equipment) capital cost $49,000,000, MF equipment
$25,000,000. 2 Installed capital cost - RO facility (bldg, infrastructure, electrical equipment) capital cost $67,000,000, RO equipment
$11,000,000. 3 Construction costs 2007, includes structural canopy over equipment and a climate control building for all SCADA related
panels, transformers, and switchgear. The building is sized for future expansion of the GWR project and includes some electrical equipment for other processes such as RO decarbonators. Construction costs include a 10% contingency and are escalated to midpoint of construction.
4 Estimated power cost to produce 70 mgd with 90% online factor. Power rate specific. 5 Annual estimated lamp and ballast replacement cost. 6 Hydrogen peroxide at 5 mg/L for 70 mgd using non-NSF grade 50% solution ($0.30/pound). The capital cost of the
hydrogen peroxide storage facility is approximately $6,000,000. 7 Information from OCWD.
C.1.8 City of Turlock
The City of Turlock received a Cease and Desist Order and new waste discharge requirement in 2001. The order requires that treatment be upgraded to meet California Title 22 tertiary requirements and stringent limits for metals, salinity, and trace organics before May 2006. To satisfy the order a wastewater treatment facilities upgrade/expansion project was begun that included a water recycling facility. The first phase of the project involved evaluating the feasibility of eliminating discharges of treated effluent to the San Joaquin River. Groundwater recharge of tertiary treated effluent for two areas was evaluated: east of Turlock, where groundwater levels are dropping due to agricultural over-draft, and west of Turlock. The feasibility study concluded that, at the east-side site, salinity from Turlock's effluent would degrade the high-quality aquifer, and necessitate salt-removal processes such as electrodialysis or reverse osmosis. On the west-side site, the high groundwater table has reduced the depth of available soil strata required by the California Department of Health Services, resulting in the need for advanced treatment at this site as well. Due to the high cost of conveyance and treatment, groundwater recharge was not explored further. The second phase of the project evaluated alternatives for using tertiary Title 22 effluent and “zero” and seasonal discharge. It was concluded that zero or seasonal discharge would require significant land area and that it would require long-term future planning as land sites are acquired. In the meantime, Turlock will treat the effluent to meet Title 22 requirements for continued discharge to the San Joaquin River. The City will be implementing an agricultural irrigation program over the next several years.
The 20 mgd treatment facilities include a high-rate flocculation/sedimentation process followed by cloth media disk filters. Filtered effluent is disinfected with gaseous chlorine. Disinfection

Examples of Developing Technologies in Use (CA, NV, AZ, FL, CO)
C-14 Reclaimed Water Feasibility Study
occurs in chlorine contact basins to extend the contact time as required to meet total coliform limits of 2.2 MPN/100ml. The two-step process of high-rate flocculation/sedimentation and filtration was chosen after extensive pilot testing. Turlock's wastewater plant receives strong industrial wastes, mostly dairy processing, and is vulnerable to plant upsets. The two-step process provides a high level of reliability in meeting the Title 22 turbidity limit of 2 NTU. The total construction cost for the 20 mgd water recycling facility was $40,000,000, with $4,290,000 and $2,030,000 for flocculation/filtration and disinfection respectively. The cost shown is in year 2007 dollars.
C.1.9 Daly City
Daly City’s Reclamation Facility provides approximately 2.8 mgd of disinfected tertiary recycled water to meet California Title 22 requirements for unrestricted use. The recycled water is used for irrigation of the Lake Merced Golf Club, the Olympic Club, the San Francisco Golf Club, the athletic fields at Westlake, Marchbank Parks, along with the landscape median irrigation on John Daly Boulevard. Construction of the Daly City's Reclamation Facility was a multi-agency collaboration that included Daly City, the North San Mateo County District, a subsidiary of Daly City, along with the San Francisco Public Utilities Commission (SFPUC).
The goal of the project was to reduce groundwater withdrawal for Daly City, which relies on groundwater for part of their raw water supply. The source of water to the reclamation facility is secondary effluent from Daly City's 10.3-mgd pure oxygen activated sludge plant.
The tertiary treatment facility includes a secondary effluent pump station; chemical feed equipment for flocculation/coagulation; pH adjustment; SAR adjustment and residual disinfectant; flocculation basins; Dynasand filtration; and chemical disinfection using sodium hypochlorite. A recycled effluent pump station and 11,000 feet of pipelines to provide recycled water to the golf courses was constructed. The total construction cost for the water recycling facility was $7,360,000 (2004 dollars).
C.1.10 City of Watsonville
The Watsonville Area Water Recycling Project (Recycling Project), a joint project with the City of Watsonville and the Pajaro Valley Water Management Agency (PVWMA), will supply recycled water for irrigation purposes in the Pajaro Valley. The existing Watsonville wastewater treatment facility treats approximately 8,000 acre-feet of wastewater each year (AFY). Originally, the wastewater was treated to an advanced secondary treatment level and discharged a mile off shore in Monterey Bay (pvwma.dst.ca.us). As part of the Recycling Project the wastewater treatment facility will be upgraded with advanced tertiary treatment facilities to treat the water to Title 22 standards. The treatment includes coagulation, sedimentation, cloth media filtration, and UV disinfection. Approximately 4,000 AFY of the secondary treated wastewater will be diverted and treated to Title 22 standards. The recycled water will be combined with 3,000 AFY of blending water from groundwater wells and the existing Harkins Slough Recharge Project for use during the irrigation

Examples of Developing Technologies in Use (CA, NV, AZ, FL, CO)
Reclaimed Water Feasibility Study C-15
season (Spring to Fall). During the rest of the year when there is not enough demand for recycled water, it will be discharged to the Bay. Future phases of the Recycling Project will be pursued if winter storage for the treated water can be found (pvwma.dst.ca.us). The recycling project will reduce the discharge to Monterey Bay by 50 percent. Table 12 contains some of the 7.7 mgd facility costs in January 2008 dollars.
Table 12. City of Watsonville Recycled Water Facility Costs
Element Construction Cost (2008$) 1
Ballasted Flocculation (Densadeg) $3,860,000
Cloth Filtration (Hydrotech) $2,260,000
UV System (Trojan) $4,380,000 1 Construction costs include 12% contingency and a 6.9% Jan 2008 Construction cost
ENR adjustment.
C.1.11 City of Roseville
The City of Roseville, CA operates the Dry Creek Wastewater Treatment Plant (DCWWTP), which is a full tertiary recycled water facility with an average design treatment capacity of 18 million gallons per day (mgd) and a peak hour wet weather flow of 54 mgd. The DCWWTP discharges most of the plant flow to the Dry Creek, while a portion of this flow is used for water recycling activities within the city. The existing recycled water capacity at the DCWWTP is 7.2 mgd with an expected buildout recycled water demand for the DCWWTP of 11.3 mgd. Disinfection to Title 22 water recycling standards is currently achieved by gaseous chlorine followed by dechlorination with sulfur dioxide. Although chlorine gas is the most widely used disinfectant for municipal wastewater in the United States, there are several safety concerns associated with the use, storage, and transportation of chlorine gas. Most safety concerns are due to the human health impacts that would result from an accidental release of the chlorine gas.
In addition to the safety concerns there are also concerns that the use of chlorine as a disinfectant would result in the generation of disinfectant byproducts in the plant effluent that could potentially exceed future discharge permit limits for the Dry Creek. In order to address various safety and permit concerns over the continued use of gaseous chlorine, an alternative disinfection study was conducted in August of 2003 to evaluate alternative disinfection strategies. As a result of this study UV disinfection was determined to be the highest ranked alternative of all of the disinfection alternatives studied (Carollo, 2003). Replacing gaseous chlorine with UV light as the disinfection process would alleviate the city’s safety concerns with the use of gaseous chlorine while enabling the city to meet future permit limits for disinfection by products (i.e., THMs etc.).
To prevent disinfection byproduct formation in the plant, no chlorine will be used in the plant processes and in the plant utility water. There will, however, be a need to provide a chlorine residual to the recycled water as it leaves the plant. As part of the preliminary design process, it

Examples of Developing Technologies in Use (CA, NV, AZ, FL, CO)
C-16 Reclaimed Water Feasibility Study
was determined that an on-site sodium hypochlorite generation system would be used to provide sodium hypochlorite which would be used to provide a chlorine residual (i.e. to prevent regrowth in the recycled water distribution system) to the recycled water leaving the plant. As a result of the chlorine conversion to Ultraviolet Light Disinfection Project, a 2400 lamp Trojan UV3000Plus disinfection system is being installed at the Dry Creek WWTP. The UV Disinfection system was designed to deliver a UV dose of 100 mJ/cm2 to 45 mgd, meeting the Title 22 Water Recycling Requirements. The capital and estimated O&M costs for this system is presented in Table 13.
Table 13. Estimated Costs for UV Disinfection Facility at the Dry Creek WWTP
Treatment Process
Average Flow (mgd)
Peak Flow (mgd)
Construction Cost (2006$)1, 2
Annual O&M Cost (2006$) 3
UV Disinfection
System 18 45 $31,532,000 $540,000
1 Based on Contractor’s bid to whom the project was awarded (2006). 2 Construction cost includes in addition to a 2400 lamp Trojan UV3000Plus disinfection system the following:
Modifications to the existing yard piping, the installation of covers for the secondary clarifier launders, installation of covers for the existing tertiary filters, modifications to the plant electrical system, an additional standby generator, an on-site sodium hypochlorite generation system with a tank farm, and modifications to the existing chlorine contact basins that will allow them to be used as recycled water storage facilities.
3 O&M for UV system includes power (power at $0.07 per kilowatt-hour, chemicals, lamp replacement, ballast replacement, quartz sleeve replacement, wiper replacement, and labor.

Examples of Developing Technologies in Use (CA, NV, AZ, FL, CO)
Reclaimed Water Feasibility Study C-17
C.2 Nevada
C.2.1 Clark County Water Reclamation District
The Clark County Water Reclamation District (District) treats wastewater to meet requirements for discharge and to provide effluent reuse water for on-site use with chemical feed systems and washdown operations, golf courses, and substations located throughout the valley (Carollo, 2006). Currently the Advanced Wastewater Treatment Plant (AWT) provides all of the reuse water. Blended effluent from the AWT and the Central Plant (CP) is discharged to Lake Mead, which is the main drinking water source to Southern Nevada. In order to address concerns with the quality of the effluent to Lake Mead (primarily concerns regarding trace EDCs and PhACs in the effluent) and to continue to provide high quality reuse water to its customers the District explored three disinfection alternatives (Carollo, 2006). The post filtration (both sand and membrane filtration examined) disinfection alternatives explored included UV light alone, UV in series with ozone, and UV in series with Peracetic Acid (PAA). The alternatives were based on meeting a worst-case scenario limit of 2.2 MPN/100 mL for total coliforms and a target UV dose of 100 mJ/cm2. Table 14 gives a summary of the comparative costs for these technologies for different flow targets.
Table 14. Clark County Water Reclamation District Disinfection Cost Estimates
Method # Trains
Flow (mgd)
System Footprint (Feet)
Power Draw (kW)
Construction Cost (2006$)1
Annual O&M Cost (2006$)2
3 30 203 x 118 (Contactors) 60 x 61 (Chem. feed bldg) 10 $6,400,000 $7,700,000 Peracetic
Acid 10 125 226 x 428 (Contactors)
100 x 106 (Chem. feed bldg) 22 $21,000,000 $32,000,000
3 30
105 x 74 (Contactors) 45 x 30 (Ozone generation facility) 32 x 24 (LOX facility)
521 $45,700,000 $1,500,000
Ozone
6 125
276 x 86 (Contactors) 112 x 100 (Ozone generation facility) 88 x 24 (LOX facility)
2084 $174,000,000 $5,750,000
1 Construction costs 2006, include 30% contingency, 15% for general conditions, 12% for general contractor overhead and profit, 8% sales tax, 20% for engineering, legal and administration fees, and 2% for owner’s reserve for change order.
2 General O&M assumptions are: 1) cost for energy is based upon $0.08 per kilowatt-hour, 2) the labor rate is $50 per hour, 3) chemical costs are included.
3 Information from Integrated Facilities Master Plan (Carollo, 2006).
The CCWRD has chosen to incrementally replace their tertiary treatment facilities with ultrafiltration (UF) followed by ozone. The first installment of these technologies is under design and will treat 20 mgd. The ozone system targets a design dose of five (5) mg/l with a 20-minute contact time. Costs for the UF and ozone system are detailed below in Table 15.

Examples of Developing Technologies in Use (CA, NV, AZ, FL, CO)
C-18 Reclaimed Water Feasibility Study
Table 15. Estimated Construction and O&M Costs for UF and Ozone
Treatment Process
Average Flow (mgd)
Peak Flow (mgd)
Direct Cost (2007$) 1
Annual O&M Cost (2007$)2
Membranes 160 320 $63,680,000 $4,535,000
Ozone 160 320 $28,148,000 $2,313,000 1 Direct costs 4-4-2007. Does not include contingency, general conditions, contractor overhead and profit, or
sales tax. 2 O&M for membranes include all tertiary facilities costs, except ozone (power at $0.08 per kilowatt-hour,
chemicals, membrane replacements, labor, other equipment power and materials). Ozone O&M costs include power, labor, materials, and oxygen.
3 Information from Clark County Water Reclamation District Integrated Facilities Master Plan (Carollo, 2006) .

Examples of Developing Technologies in Use (CA, NV, AZ, FL, CO)
Reclaimed Water Feasibility Study C-19
C.3 Arizona
C.3.1 City of Phoenix
The Cave Creek Water Reclamation Plant (CCWRP) currently utilizes a medium pressure Trojan UV4000 system for disinfection of reclaimed water. While proven effective at meeting non-detect fecal coliform targets when in top operational condition, maintaining top condition has proven problematic and costly. To increase confidence in the disinfection system, CCWRP currently adds approximately 2 mg/L of sodium hypochlorite prior to filtration and an additional 10 to 15 mg/L after UV disinfection. The high dose of chlorine results in unacceptable concentrations of various disinfection by-products (DBPs).
The reclaimed water treatment standards and water quality parameters vary by the CCWRP permitted uses (Table 16) and are regulated by the Aquifer Protection Permit (APP) and the AZPDES Permit, both issued by the Arizona Department of Environmental Quality (ADEQ). Other limit requirements include a total residual chlorine limit (0.004 mg/L daily average and 0.008 mg/L daily maximum), and total trihalomethanes (0.10 mg/L) at the discharge to the tributary. Other potential disinfection byproducts of interest include Haloacetic Acids (HAAs) and Bromate; the former from reactions with chlorine, and the later from reactions with ozone. Stage 1 D/DBP regulations; maximum allowable concentrations are 0.06 mg/L and 0.01 mg/L for HAAs and Bromate, respectively. Because of the long-term concerns regarding O&M costs and DBP formation resulting from the use of sodium hypochlorite, the City of Phoenix has looked into alternative oxidants to use with the existing UV system. The four oxidants looked at that would be capable of operation in series with the existing UV system were Peracetic Acid (PAA), Hydrogen peroxide (H2O2), ozone (O3), and sodium hypochlorite (NaOCl). After a literature review of the four oxidants, only PAA, O3, and further characterization of NaOCl were recommended for bench-scale testing (Carollo, 2006). Table 17 contains a summary of the results.
Examples of Developing Technologies in Use (CA, NV, AZ, FL, CO)
C-20 Reclaimed Water Feasibility Study
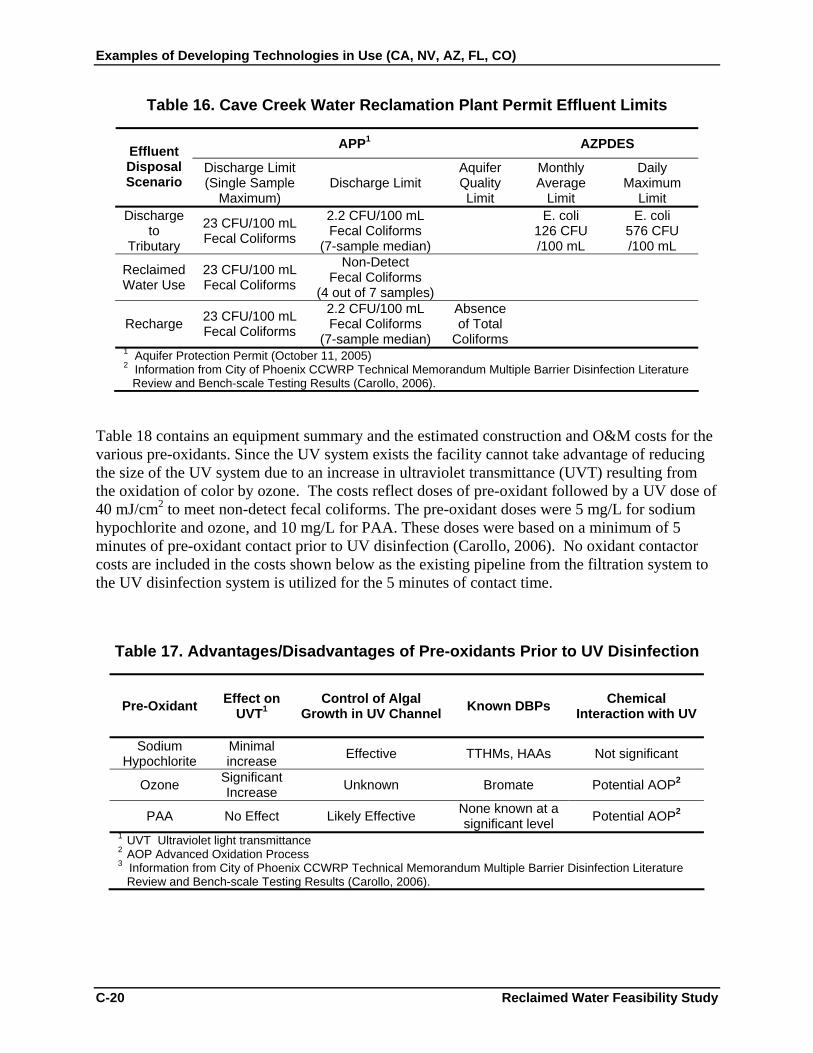
Table 16. Cave Creek Water Reclamation Plant Permit Effluent Limits
APP1 AZPDES Effluent Disposal Scenario
Discharge Limit (Single Sample
Maximum) Discharge Limit
Aquifer Quality Limit
Monthly Average
Limit
Daily Maximum
Limit Discharge
to Tributary
23 CFU/100 mL Fecal Coliforms
2.2 CFU/100 mL Fecal Coliforms
(7-sample median)
E. coli 126 CFU /100 mL
E. coli 576 CFU /100 mL
Reclaimed Water Use
23 CFU/100 mL Fecal Coliforms
Non-Detect Fecal Coliforms
(4 out of 7 samples)
Recharge 23 CFU/100 mL Fecal Coliforms
2.2 CFU/100 mL Fecal Coliforms
(7-sample median)
Absence of Total
Coliforms
1 Aquifer Protection Permit (October 11, 2005) 2 Information from City of Phoenix CCWRP Technical Memorandum Multiple Barrier Disinfection Literature
Review and Bench-scale Testing Results (Carollo, 2006).
Table 18 contains an equipment summary and the estimated construction and O&M costs for the various pre-oxidants. Since the UV system exists the facility cannot take advantage of reducing the size of the UV system due to an increase in ultraviolet transmittance (UVT) resulting from the oxidation of color by ozone. The costs reflect doses of pre-oxidant followed by a UV dose of 40 mJ/cm2 to meet non-detect fecal coliforms. The pre-oxidant doses were 5 mg/L for sodium hypochlorite and ozone, and 10 mg/L for PAA. These doses were based on a minimum of 5 minutes of pre-oxidant contact prior to UV disinfection (Carollo, 2006). No oxidant contactor costs are included in the costs shown below as the existing pipeline from the filtration system to the UV disinfection system is utilized for the 5 minutes of contact time.
Table 17. Advantages/Disadvantages of Pre-oxidants Prior to UV Disinfection
Pre-Oxidant Effect on UVT1
Control of Algal Growth in UV Channel Known DBPs Chemical
Interaction with UV
Sodium Hypochlorite
Minimal increase Effective TTHMs, HAAs Not significant
Ozone Significant Increase Unknown Bromate Potential AOP2
PAA No Effect Likely Effective None known at a significant level Potential AOP2
1 UVT Ultraviolet light transmittance 2 AOP Advanced Oxidation Process 3 Information from City of Phoenix CCWRP Technical Memorandum Multiple Barrier Disinfection Literature
Review and Bench-scale Testing Results (Carollo, 2006).

Examples of Developing Technologies in Use (CA, NV, AZ, FL, CO)
Reclaimed Water Feasibility Study C-21
Table 18. Equipment Summary and Estimated Construction and O&M Costs
Pre-Oxidant Footprint (Feet)
Construction Cost Based Upon
Design Values (2007$)1
Annual O&M Cost (2007$)2
Sodium Hypochlorite 29 x 27 $416,000 $58,000
Ozone Ozone generation facility 70 x 50 LOX storage facility 40 x 30 $4,770,000 $145,600
PAA 44 x 27 $554,000 $495,000 1 Construction costs 2006, include 30% contingency, 15% for general conditions, 12% for general contractor
overhead and profit, 8% sales tax, 20% for engineering, legal and administration fees, and 2% for owner’s reserve for change order.
2 General O&M assumptions are: 1) the average annual power cost is based upon $0.065 per kilowatt-hour, 2) the labor rate is $50 per hour.
3 Information from City of Phoenix CCWRP Technical Memorandum Multiple Barrier Disinfection Literature Review and Bench-scale Testing Results (Carollo, 2006).
At this time, the CCWRP has decided to add a low dose of sodium hypochlorite upstream of the existing UV system.
C.3.2 Fountain Hills Sanitary District
The Fountain Hills Sanitary District provides reclaimed water for aquifer storage and recovery (ASR) wells and for irrigation of three golf courses and three town parks (az-fhsd.gov).
Wastewater is treated by the activated sludge process with nitrification/denitrification at the Fountain Hills Wastewater Treatment Plant (WWTP). After clarification, the secondary effluent is filtered through cloth disk filters (Carollo, 2004).
A portion of the filtered effluent is disinfected by chlorine. The unchlorinated portion of the tertiary treated effluent, or reclaimed water, is pumped to the Advanced Water Treatment Facility (AWTF) for advanced treatment to be used in aquifer storage and recovery (ASR) wells and for irrigation of three golf courses and three town parks.
The AWTF has a current capacity of 2.92 mgd, with a future expansion capacity of 3.6 mgd.
The tertiary effluent enters the AWTF and is treated through a microfiltration system with membranes having a pore size of 0.1 micro-meters (um). The membrane filter effluent, or filtrate, is disinfected with low-pressure high output UV light and pumped to ASR wells for injection and storage in the aquifer. Water can be recovered through the same wells during times of the year when the reclaimed water demand exceeds the reclaimed water supply (Carollo, 2004). The finished product (reclaimed water) exceeds all Arizona Department of Environmental Quality standards for reuse (az-fhsd.gov).

Examples of Developing Technologies in Use (CA, NV, AZ, FL, CO)
C-22 Reclaimed Water Feasibility Study
The UV disinfection system (Wedeco TAK55 HP) consists of a single open channel with three banks of low-pressure high output UV lamps. Each bank has 48 lamps. The design dose was 80 mJ/cm2 (Carollo, 2004).
A 0.5 mg/L chlorine residual will be maintained in the filtrate to prevent growth of a biofilm on the well screen or gravel pack which may degrade or severely impact the performance of the ASR wells (Carollo, 2004).
Treatment objectives are to meet all Arizona Department of Environmental Quality standards for reuse including total nitrogen of less than 10 mg/L and non-detect fecal coliforms.
The construction costs, estimated by the engineer, for the UV disinfection system, chlorination system, modifications at the AWTF and flow diversion at the WWTP were $1,125,000 (May 2004). The estimated costs included contractor’s overhead and profit of 15 percent and a 15 percent contingency. The construction costs for the AWTF are contained in Table 19.
Table 19. Construction Costs for Fountain Hills AWTF
Treatment Process Average Flow (mgd) Construction Cost (2000/2001$) 1
AWTF2 2.0 $6,000,000
ASR Wells - $750,000 each 1 Construction costs from 2000/2001 2 Includes 4 Pall microfiltration racks and associated equipment, building housing all the equipment,
influent and effluent storage tank (total volume 1 MG, and a standby generator). 3 Information from Chris Kiriluk District Engineer.

Examples of Developing Technologies in Use (CA, NV, AZ, FL, CO)
Reclaimed Water Feasibility Study C-23
C.4 Florida
C.4.1 Sarasota County
The Central County Water Reclamation Plant (CR0P) in Sarasota County has recently completed the expansion design of an existing reuse plant from 2 to 5.5 mgd, which includes a 1.5 mgd side-stream treatment with UV disinfection for groundwater injection as part of an ASR project. The construction cost for the UV system (100 mJ/cm2 dose using an Aquionics medium pressure InLine reactor) was approximately $940,000 (January 2005 dollars). After the expansion project went to bid the County decided not to go forward with the side-stream treatment and ASR well. Currently regulatory issues are holding up approval.
C.4.2 Southwest Florida Water Management District
The Southwest Florida Water Management District (SFWMD) recently completed a preliminary design of advanced wastewater treatment to produce 6.46 mgd for steamflow augmentation. The objective of SFWMD was to reduce nutrients (nitrates and phosphates), pathogens, and various micropollutants (endocrine disrupters and pharmaceutically active compounds) to a level that would not impact aquatic life in the potential discharge location (the Hillsborough River). Table 20 contains the treatment goals. The treatment technologies employed include low-pressure RO (~200 psi two stage, nominal pore size 0.001 to 0.0001 μm), with MF (nominal pore size 0.1 μm) as pretreatment and advanced oxidation utilizing UV and hydrogen peroxide (H2O2).
Table 20. SFWMD Treatment Goals
Parameter Effluent Target
Nitrate and Nitrate (as N) < 1.2 mg/L
Orthophosphate (as P) < 0.5 mg/L
NDMA ~90 % reduction 1
1,4 Dioxane ~70 % reduction 1
Erythromycin ~70 % reduction 2
Tetracycline >90 % reduction 2
Caffeine ~70 % reduction 2
Bisphenol A and Triclosan >90 % reduction 2
DEET ~90 % reduction 2 1 Target percent reduction for the UV/H2O2 system operated by the Orange County
Water District, CA. These targets were used as the basis of costing for this project. 2 Examples of expected removal rates via UV/H2O2 treatment (Trojan Technologies).

Examples of Developing Technologies in Use (CA, NV, AZ, FL, CO)
C-24 Reclaimed Water Feasibility Study
Cost estimates for MF/RO followed by two UV/H2O2 options are contained in Table 21. These costs do not include pumping and water post-treatment. The MF/RO costs are based on a 90 percent recovery rate and 24 gfd flux rate for MF and a 75 percent recovery rate abd 10 gfd flux rate for RO. The UV/H2O2 options both include a 5-mg/L H2O2 dose post MF/RO prior to UV. The Trojan UVPhox™ treatment system was used as the basis for the cost estimate. The options differ by the RO effluent quality (UVT).
Table 21. SFWMD Estimated Construction and O&M Costs
Method # Trains/ Channels
Total # of
lamps Footprint
(Square Footage) Power Draw (kW)
Construction Cost (2006$)1
Annual O&M Cost (2006$) 2
MF/RO 4 NA 28,000 1150 $39,000,000 $2,000,000
UV/H2O2 Option 1
(95% UVT) 1 432 6,300 (electrical bldg)
1,300 (equipment pad) 80 $4,118,000 $360,000
UV/H2O2 Option 2
(90% UVT) 2 864 6,700 (electrical bldg)
1,600 (equipment pad) 155 $6,601,000 $470,000
1 Construction costs May 2006, include 30% contingency, 15% for general conditions, 12% for general contractor overhead and profit, 7% sales tax, 20% for engineering, legal and administration fees, and 2% for owner’s reserve for change order.
2 General O&M assumptions are: 1) cost for energy is based upon $0.08 per kilowatt-hour, 2) the labor rate is $50 per hour, 3) chemical costs are included.
3 Information from SFWMD Estimated Costs for Reclaimed Water Low Pressure RO and Advanced Oxidation Treatment System June 2006 Carollo.

Examples of Developing Technologies in Use (CA, NV, AZ, FL, CO)
Reclaimed Water Feasibility Study C-25
C.5 Colorado
C.5.1 Centennial Water and Sanitation District
The Centennial Water and Sanitation District, located outside of Denver Colorado, has purchased a satellite reclamation system from Great Circle Water Incorporated (GCW). One substantial hurdle to recycled water use is the high cost of centralized wastewater treatment and recycled water distribution systems, which are used to take the recycled wastewater to far off points of need. GCW is targeting the distributed use of recycled water, with their treatment system producing the recycled water at the point of need. It is the goal of GCW that the water produced will be low in cost, odor, and suspended solids and thoroughly disinfected. This satellite system (Point of Need Water Recycling System) is innovative as it employs a series of physical processes and UV disinfection to reduce pathogens to below public health regulated levels while leaving in the nutrients, which are beneficial to plant growth. The GCW system does not employ conventional biological treatment. The GCW Point of Need Water Recycling System treatment stages include vortex separation in combination with fine filtration and gas floatation to remove settleable, floatable, and suspended solids followed by oxidation to remove odor and destroy putrescible compounds and UV disinfection. The GCW system to be installed for Centennial Water District will pull raw wastewater from the collection system and utilize up to 50,000 gallons per day (gpd) for golf course irrigation. Solids are returned to the wastewater collection system. GCW is currently working with the State of Colorado and the State of California to conduct validation testing of their PONWRS with the goal of obtaining approval by these bodies for the use of the their system in water recycling applications. The initial purchase price for the equipment to treat the 50,000 gpd was $250,000. This price includes all components, but excludes the costs of installation, and construction of sewer access. Operating costs are projected by GCW, to be less than $1.15 per 1000 gallons for a 7-module installation producing 200 acre-feet per year. This estimate includes all costs for: effluent sampling and analysis, energy, operational and service labor, supplies, replacement parts, and off-site monitoring. A 50,000-gpd module has a footprint of 160 square feet. Energy use for the module is less than 4.0 kWh per 1000 gallons (information from GCW). The estimated total project costs are $660,000, based upon year 2007 dollars. It should be clearly noted that the concept and value of the PONWRS is to reduce or eliminate costly reclaimed water pumping and conveyance infrastructure costs.

Appendix D Developing Reuse Technologies

Reclaimed Water Feasibility Study D-1
Appendix D Developing Reuse Technologies
The objective of this Appendix is to review emerging treatment technologies that are either being implemented or have significant potential for implementation in the next 5 years. One of the important end-products of this Appendix is an understanding of cost to implement these developing reclaimed water technologies. The treatment costs detailed here were utilized further in Chapter 3 in comparison with other more common treatment technologies. Some detail on each technology is provided here due to the novel nature of these technologies.
D.1 Technologies Developed Under WRF 02-009
The WateReuse Research Foundation (WRF) has funded Duke University, Carollo Engineers, and the United States Department of Agriculture to conduct WRF 02-009, Innovative Treatment Technologies for Reclaimed Water. The goal of the project was to find and demonstrate reclaimed water treatment technologies that can robustly destroy pathogens and microconstituents at a cost substantially below that of reverse osmosis (RO). The project includes detailed benchtop, pilot, and full-scale investigations of conventional and emerging (yet market ready) technologies.
Benchtop testing for a range of technologies was at Duke University. The proof of technology in the field, through pilot-scale studies, was performed by Carollo. The results from two pilot scale investigations are very encouraging, O3/H2O2 and UV/H2O2. A third pilot test is underway, investigating the combined effect of peracetic acid (PAA) and UV disinfection. Sufficient data is available for all but the last technology to provide costs to treat 1 MGD of filtered effluent. Treatment targets include 5-log reduction of virus, non-detect coliform, and 90% destruction of a range of hormones that are commonly present in untreated wastewater.
D.1.1 Ozone and Ozone/Hydrogen Peroxide
The disinfection of wastewater with ozone relies on production of an unstable molecule, which is a powerful oxidant to destroy pathogens. Since the ozone molecule is highly unstable, ozone must be generated and applied immediately on-site. Ozone is generated when oxygen (O2) molecules are disassociated into oxygen or ‘O’ atoms by a high voltage current, which collide and form an unstable bond with other O2 molecules. Mechanisms for destruction of pathogens by ozone include cell lysis, direct destruction of cell wall, reactions with radical by-products of ozone decomposition, damage to constituents of nucleic acids, and depolymerization by breaking carbon-nitrogen bonds (EPA, 1999). Buffle et al. (2006) found that ozone quickly reacts with wastewater organics to form various radicals, including the hydroxyl radical. This work suggests that ozone is not the primary mechanism for disinfection or pollutant destruction in wastewater. Likely, the hydroxyl radical is responsible for disinfection and pollutant destruction in wastewater.

Appendix D. Developing Reuse Technologies
D-2 Reclaimed Water Feasibility Study
Ozone disinfection has primarily been applied to drinking water treatment. However, in recent years, there is increasing interest in ozone for wastewater applications. Recent pilot-scale and benchtop-scale studies have shown that ozone in conjunction with hydrogen peroxide addition effectively destroyed greater than 90% of various endocrine disrupting compounds (EDCs) and pharmaceutically active compounds (PhACs) at ozone doses of less than 3 mg/L in membrane and media filtered wastewater (WRF 02-009; Snyder et al., 2006). These studies support that besides providing a barrier to pathogens, ozone with peroxide addition also provides the benefits of micropollutant destruction.
The pilot-scale ozone system tested as part of WRF 02-009 was the HiPOx system supplied by Applied Process Technology (Applied). The HiPOx Plus System (HiPOx) is a compact ozone contactor for wastewater disinfection purposes, and/or an advanced oxidation process (AOP) that provides bromate control while treating for residual and trace recalcitrant volatile organic contaminants, EDCs, and PhACs. The HiPOx is designed to provide 90 seconds of in-pipe contact time with the applied ozone dose and an option to add hydrogen peroxide at a 7:10 molar ratio of peroxide to ozone.
HiPOx incorporates high pressure, high-precision distribution of ozone and efficient mixing to maximize mass transfer of ozone (i.e. gas to liquid phases). HiPOx uses a series of injection modules where ozone is injected at 5-30 psig. Post-injection, the water flows through a mixing section, followed by a reaction zone that is designed to satisfy the contact time. A critical design feature of the distributed-injection approach is the low, local concentrations of ozone. Most ozone applications require a contacting basin with a detention time of 8-12 minutes when ozone is delivered via fine bubble diffusers. However, the efficient, pressurized mixing of the HiPOx unit allows for adequate disinfection at a much smaller contact time, and thus the economic trade off is money spent on a large contacting basin. In addition, maintenance of the HiPOx system is much simpler than accessing diffusers in deep contacting basins.
Presented here are the design criteria and cost of two HiPOx Systems that are based upon the following assumptions:
Option A has an ozone dose of 5 mg/L, and Option B has an ozone dose of 12 mg/L. Option A is assumed to represent a HiPOx system that will treat membrane filtered water, whereas Option B is assumed to represent a HiPOx system that will treat sand filtered water. Dose levels are based upon the latest research as part of WRF 02-009.
The costs presented for HiPOx system(s) are normalized to the Seattle, Washington Engineering News Record Construction Cost Index (ENRCCI) of 7865 for July 2007.
Both Options A and B will operate continuously at 1 MGD.
There are no site constraints for the ozone facility construction.
The LOX bulk tank will be rented for approximately $300/mo.
Power is at $0.08 per kW/hr.
The facility that will house the HiPOx system is climate-controlled.
Standby generators are not included in this cost estimate.

Appendix D. Developing Reuse Technologies
Reclaimed Water Feasibility Study D-3
Table 1. Ozone/Hydrogen Peroxide Design Criteria
Design Parameter Units Option A Option B
Average Daily Flow mgd 1 1
Peak Flow mgd 1 1
Contact Time sec 90 90
Ozone Dose mg/L 5 12
Required Ozone Production ppd 42 100
Hydrogen Peroxide Dose mg/L 2.5 6.0
Required Hydrogen Peroxide Production (1) gpd 6.3 15
Assumes 7:10 molar ration of peroxide to ozone, 35% solution.
Table 2. Ozone/Hydrogen Peroxide Cost, Energy, and Footprint
Option Facility Footprint
Annual Power Draw (kWh)
Annual Energy Cost
Annual O&M Cost
Construction Cost
A 40’ x 40’ 418,630 $33,490 $89,000 $2,035,000
B 40’ x 40’ 545,650 $43,652 $126,000 $2,319,000
Costs 2007
D.1.2 UV/Hydrogen Peroxide
The disinfection of wastewater with UV is well proven, relying upon destruction of DNA or RNA bonds to stop microbiological reproduction. The addition of hydrogen peroxide to UV results in the formation of the hydroxyl radical, due to the splitting of hydrogen peroxide by UV irradiation. Little research has been done examining the disinfection of wastewater with UV/hydrogen peroxide and the ability of the hydroxyl radical to destroy pollutants (EDCs, PhACs) in wastewater effluent.
As part of WRF 02-009, a pressurized UV reactor was installed at the Pinellas County South Cross Bayou Water Reclamation Facility. Hydrogen peroxide was dosed upstream of the UV reactor. The UV system, a low-pressure high-output (LPHO) in-vessel system, was supplied by Trojan Technologies, Inc. (Trojan) of London, Ontario, Canada. The UV system is a UVLogic 30AL50A, which is a 30 lamp reactor. The 30AL50A is an L shaped reactor.
Pilot test results indicate that the 30AL50, with two in series, attains the 100 mJ/cm2 dose for reclaimed water at a flow of 1 mgd at 65% UVT. The addition of 10 mg/L of hydrogen peroxide to this UV reactor resulted in 90% destruction of various trace pollutants.
Presented here are the design criteria and cost of a different pressurized UV reactor that will soon undergo performance demonstration with UV/hydrogen peroxide, the Aquionics InLine 400+ system.

Appendix D. Developing Reuse Technologies
D-4 Reclaimed Water Feasibility Study
100 mJ/cm2 UV dose with 10 mg/L hydrogen peroxide. Dose levels are based upon the latest research as part of WRF 02-009.
The costs presented for UV system are normalized to the Seattle, Washington Engineering News Record Construction Cost Index (ENRCCI) of 7865 for July 2007.
The UV system is continuously operated at 1 mgd.
There are no site constraints for the UV facility construction.
Power is at $0.08 per kW/hr.
The facility that will house the UV system electrical components is climate-controlled.
Standby generators are not included in this cost estimate.
Table 3. UV/Hydrogen Peroxide Design Criteria
Design Parameter Units Criteria
Average Daily Flow mgd 1
Peak Flow mgd 1
UV Dose1 mJ/cm2 100
Hydrogen Peroxide Dose2 mg/L 10 1 Aquionics InLine 400+ with four lamps 2 35% Hydrogen peroxide
Table 4. UV/Hydrogen Peroxide Cost, Energy, and Footprint
Facility Footprint Annual Power Draw (kWh)
Annual Energy Cost
Annual O&M Cost1
Construction Cost2
Chemical Facility 20 ft x 30 ft
UV equipment pad 9 ft x 8 ft
Electrical bldg for UV 9 ft x 7 ft
38,540 $7,800 $47,100 $717,313
1 Includes labor at $55/hr, replacement parts and sensor calibrations, and chemical costs for 10,300 gallons of 35% hydrogen peroxide at $3/gallon. 2 Construction cost (2007) includes a 30% contingency, 10% general conditions, 15% general contractor overhead and profit, 8.8% sales tax, and a 15% bid market allowance.

Appendix D. Developing Reuse Technologies
Reclaimed Water Feasibility Study D-5
D.1.3 PAA/UV
Substantial investigations of the synergistic effect of combining UV with Peracetic Acid (PAA) have been done in Europe. Recent work by Carollo has shown that a 10 mg/L dose of PAA upstream of UV at a dose of 50 mJ/cm2 results in non-detect coliform levels. No investigation of virus kill has been performed to date. Due to the lack of virus disinfection data, no costs for PAA/UV is performed at this time.
As part of WRF 02-009 at 1 mgd PAA/UV pilot will demonstrate virus and pollutant destruction ability. The PAA will be supplied by Enviro-Tech Chemical Services and the UV reactor will be supplied by Aquionics. The Aquionics reactor is an InLine 400+ medium pressure reactor. Costs for PAA/UV will be provided should results be available before the completion of this project.
D.1.4 TiO2/UV
One of the latest innovations to in the water reuse industry is the emergence of photocatalysis. One of the more promising photocatalysis processes is the Photo-Cat technology by Purifics. The Photo-Cat utilizes a light activated titanium dioxide slurry catalyst. The result is the efficient generation of the hydroxyl radical, the superoxide radical, the photo-generated hole, and the aquious electron for both disinfection and pollutant destruction. As part of WRF 02-009, a Photo-Cat system will be piloted in North Carolina on filtered secondary effluent. Costs for TiO2/UV will be provided should results be available before the completion of this project.
D.2 Pasteurization
The City of Santa Rosa, California and Ryan Pasteurization and Power (RP&P) are currently investigating the disinfection of reclaimed water using a pasteurization system. Pasteurization disinfection performance is dependant upon contact time and temperature. Low contact time coupled with high temperature known as “flash pasteurization”, has proven in the past to be very effective in the food industry and proven effective recently for reclaimed water disinfection.
The RP&P pasteurization pilot system consists primarily of a plate-type pre-heater (a water-to-water heat exchanger) and a stack-type heat exchanger (air-to-water heat exchanger). The first one is used as the heat recovery unit, while the latter one is used as the main heat input unit. A critical component of the RP&P pasteurization system is the sustainable use of waste heat to disinfect the reclaimed water.
The City of Santa Rosa is looking to disinfect their dry weather base flow of 10 mgd using pasteurization. The costs to do so are under development and will be included should these costs be available before completion of this report.

Appendix E Washington Case Studies

Reclaimed Water Feasibility Study E-1
Appendix E Washington Case Studies
1.1 Carnation Wastewater Treatment Facility ...................................................................... 2 1.2 City of Chehalis .............................................................................................................. 5 1.3 City of College Place, Walla Walla County ................................................................... 8 1.4 City of Ephrata, Grant County ...................................................................................... 10 1.5 City of Everett............................................................................................................... 12 1.6 Holmes Harbor Sewer District, Island County ............................................................. 14 1.7 LOTT Alliance, Thurston County................................................................................. 16 1.8 City of Medical Lake, Spokane County........................................................................ 19 1.9 North Bay Case Inlet, Mason County ........................................................................... 21 1.10 City of Quincy, Grant County....................................................................................... 23 1.11 Royal City, Grant County ............................................................................................. 25 1.12 City of Sequim, Clallam County................................................................................... 27 1.13 City of Snoqualmie, King County ................................................................................ 29 1.14 City of Walla Walla, Walla Walla County ................................................................... 31 1.15 City of Yelm, Thurston County .................................................................................... 32

Appendix E. Washington Case Studies
E-2 Reclaimed Water Feasibility Study
1.1 Carnation Wastewater Treatment Facility Contact: Susanna Leung, Project Engineer, Carollo Engineers; 206-684-6532. Spoke with 5/16/07; reviewed 9/07/07.
Date Operational: 2008 (est.)
Design Capacity: Design capacity is 0.37 mgd average annual. Estimate flow at startup of the facility is 0.2 mgd. All water produced by the treatment plant will be Class A reclaimed water.
Uses: Discharge to a natural wetland as part of a wetland enhancement project. The wetland is located at Chinook Bend Natural Area in the Snoqualmie River Floodplain north of the city of Carnation, WA. The wetland enhancement project is a partnership between King County agencies and Ducks Unlimited, a non-profit wetland conservation group. Reclaimed water will benefit the wetland enhancement project by providing additional water to wetland that will be used to inundate invasive plant species.
Objectives: Strict discharge requirements for the Carnation Wastewater Treatment Facility required treatment to Washington State Class A reclaimed water standards. King County WTD’s objective in the reclaimed water wetland enhancement project is to achieve beneficial reuse of reclaimed water rather than discharge directly to Snoqualmie River. The reclaimed water wetland enhancement project will be the primary discharge. A river outfall adjacent to the wetland discharge is also included as an element of the facility. The river discharge would be used if treated water does not meet class A standards.
Capital Funding:
The Carnation Wastewater Treatment Facility is being constructed by King County under an agreement with the City of Carnation to replace existing on-site septic system currently serving the City. Total costs are estimated to be $19.65 million. State Revolving Fund loans are financing $1.2 million for design and $14 million for construction and construction management services.
Class A reclaimed water and wetlands discharge upgrades plus dual-discharge improvements cost an additional $3.046 million.
Working with King County staff, Ducks Unlimited obtained $166,000 to fund the design, permitting, construction, and wetlands enhancement for this project:
King Conservation District $14,000 King County Water Works Grant $30,000 North American Wetland Conservation Act Grant $122,000

Appendix E. Washington Case Studies
Reclaimed Water Feasibility Study E-3
Additionally, an Aquatic Lands Enhancement Account Projects (ALEA) grant for approximately $400,000 was secured for upgrading the parking lot, a river and wetland overlook and ADA trails at the Chinook Bend Natural Area. King County obtained an additional $297,300 in grant funds from the Interagency for Outdoor Recreation Aquatic Lands Enhancement Account for the project. These funds will be used to fund public access and environmental education improvements to the site.
Operation Cost Funding: The estimated cost for operation of wastewater treatment facility is $625,000/year, per Rick Butler e-mail, 7/6/07. This does not include debt service or replacements of large equipment. O&M and monitoring of the wetlands is estimated to cost $10,000/year.
What are your revenue strategies? The reclaimed water produced by the Carnation Treatment Plant will be discharged to enhance the natural wetland at the Chinook Bend Natural Area owned by King County. The treatment plant is being constructed with financing from King County and City of Carnation. The county partnered with Ducks Unlimited (DU), a non-profit organization dedicated to creating wildlife habitat, to design the wetland. See information previously listed under capital funding regarding funds secured to date related to the wetland enhancement portion of the project.
In the future, other reclaimed water uses may be identified that generate other sources of revenue.
Rates: The initial City of Carnation sewer rate is estimated at approximately $88 per month per customer. The sewer rate revenues are divided between the City of Carnation and King County to cover facility costs.
Did you implement any cost sharing strategies? Developed partnerships and obtained grants.
Have you assigned value to environmental or other benefits?
A dollar value was not developed for the environmental benefit of the reclaimed water wetland enhancement project. The project stakeholders, including local citizens, the Snoqualmie Tribe, and non-profit environmental advocacy groups, enthusiastically support the reclaimed water wetland project over a river outfall.
Primary, Secondary & Tertiary Technologies: Fine screens / MBR / UV disinfection.
What is your experience with the treatment technology? This is the first MBR plant in King County’s system. Extensive pilot testing has been performed.
Distribution System: Reclaimed water flows through a one (1) mile 12-inch pipe from plant to wetland.
System Problems and Solutions: None at this time.

Appendix E. Washington Case Studies
E-4 Reclaimed Water Feasibility Study
Other Features: King County’s Water and Land Resources Division is another partner that over the long-term will monitor and maintain the Chinook Bend wetland in accordance with the requirements set forth in an end-user agreement. The work includes periodic monitoring of plants and animals in and around the wetland and maintenance of native wetland and riparian plant species.
References:
Carnation Wetland Enhancement Fund Development Effort memo, dated October 3, 2006.
Susanna Leung, personal communication, May 16, 2007.
Rick Butler, Supervisor, King County. E-mail, July 6, 2007 (O&M costs).
Steve Tolzman, Water Quality Planner Project Manager, King County. E-mail, August 9, 2007.
Christie True, Division Director, King County. Review comments, August 9, 2007.
Jo Sullivan, Water Quality Planner Project Manager, King County. E-mail, October 8, 2007.

Appendix E. Washington Case Studies
Reclaimed Water Feasibility Study E-5
1.2 City of Chehalis Contact: Patrick Wiltzius, WW Division Superintendent, City of Chehalis; 360-767-6444. Spoke with 5/16/07; reviewed 8/21/07.
Date Operational: WWTP – March 2007
Tertiary currently in startup testing; should be online this summer.
Design Capacity:
6 mgd AWWF flow
3.5 mgd – Class A
Current WWTP flow 1.3 mgd avg. for year
When river flow drops below a 1,000 cfs, WWTP cannot discharge to the river; could be 6-8 months (a bad year) per year.
Uses:
Class A required only when percolating into the ground during cold weather (low river flow + trees are dormant).
Objectives:
Replaced 50-year-old trickling filter plant with a brand-new WWTP to meet TMDLs on river discharge for dry weather.
Capital Funding:
Total capital - $37.6 million:
Design - $3.5 million
Seismic stabilization - $1 million
Site fill - $1 million
Poplar plantation - $1.8 million
Construction - $27 million for plant + outfall/RW distribution (est. < $1 million tertiary - sand filters and polymer system, piping)
CM - $3.3 million
$32 million 0% loan from Ecology

Appendix E. Washington Case Studies
E-6 Reclaimed Water Feasibility Study
$144K grant from EPA – State & Tribal Assistance Grant (STAG)
$5 million grant – Ecology
Remainder shared by regional partners & the City.
Operation Cost Funding:
Estimate $1.95 million total:
New plant O&M was $980K/year and estimate new to be similar.
Estimate $119K/year for plantation.
Administration - $850K
What are your revenue strategies?
We’re not marketing reclaimed water.
Could use poplars for chip for pulpwood or lumber (saw logs). We’re doing lumber, as it brings higher price.
Plantation is 250 acres, divided into 11 management units. Will harvest 2 units, or 50-60 acres per year. Have to wait 6-7 years before can harvest; the trees were planted 3 years ago. Need to harvest trees when they are < 15 years old to avoid reclassification from agriculture to forest.
Poplars have large leaves with high evapotranspiration.
Rates:
Wastewater rates:
2007 – inside City limits - $35.93 + $4.32/100 ccf
Standard residential WW connection charge – $3,030
Did you implement any cost sharing strategies?
N/A
Have you assigned value to environmental or other benefits? N/A
Primary and Secondary Technologies: SBR, UV disinfection
Tertiary Technology:
Coagulation/Upflow sand filters/UV/chlorine – have to have residual in pipeline all the way out to plantation.

Appendix E. Washington Case Studies
Reclaimed Water Feasibility Study E-7
Selected sand filters because it is a tried and true conservative technology used in water treatment. No moving parts.
What is your experience with the treatment technology?
TSS < 4 and so is BOD – crystal clear
Distribution System:
Share effluent line for ¼ mile – shut river valve and pump to plantation. Total distance from WWTP to plantation is about 2 miles.
System Problems and Solutions: None.
Other Features: N/A

Appendix E. Washington Case Studies
E-8 Reclaimed Water Feasibility Study
1.3 City of College Place, Walla Walla County
Contact: Paul Hartwig, Director, City of College Place; 509-529-1200, [email protected]. Contacted 5/9/07.
Date Operational: 2001
Design Capacity:
Design - 1.64 mgd
Average - 0.9 mgd
Uses:
The plant is currently not rated as class A, and the effluent is used to irrigate farmland.
According to a report by the Washington State Department of Ecology (Cupps and Morris. “Case Studies in Reclaimed Water Use: Creating New Water Supplies Across Washington State”, 2005.), the facility provides effluent to augment summertime flows in Garrison Creek as part of a water shed enhancement program.
Objectives: Irrigate farmland.
Capital Funding:
Design and construction of new plant - $16.4 million
Spent about $20 million total on plant, land, and wetlands construction
Operation Cost Funding:
$430,000 (from Cupps and Morris. “Case Studies in Reclaimed Water Use: Creating New Water Supplies Across Washington State”, 2005.)
What are your revenue strategies? N/A
Rates:
$620 - connection (sewer)
$46/mo (sewer)
Did you implement any cost sharing strategies? N/A
Have you assigned value to environmental or other benefits? N/A
Primary and Secondary Technologies: SBR

Appendix E. Washington Case Studies
Reclaimed Water Feasibility Study E-9
Tertiary Technology: Coagulation, Cloth disk filters, UV
What is your experience with the treatment technology? N/A
Distribution System: N/A
System Problems and Solutions: N/A
Other Features: N/A

Appendix E. Washington Case Studies
E-10 Reclaimed Water Feasibility Study
1.4 City of Ephrata, Grant County Contact: Wes Crago, City Administrator, City of Ephrata; 509-754-4601 ext. 157. Spoke with 5/9/07; reviewed 8/07.
Date Operational: 2000
Design Capacity:
1.22 mgd - design
0.55 average
Uses: G.W. recharge, fishing pond, plan to use for irrigation in the future
Objectives: N/A
Capital Funding:
$6.1 million – upgraded the original plant, but it is pretty much a brand new plant (kept 1 clarifier and 1 pump house from original plant)
Operation Cost Funding: $780,000
What are your revenue strategies? N/A
Rates:
Hook up - $750.00
$29/month for sewer
Did you implement any cost sharing strategies? No
Have you assigned value to environmental or other benefits? Extensive public campaign, the public wanted it.
Primary and Secondary Technologies: Oxidation ditch, clarifier
Tertiary Technology: Coag/sand filter/UV
What is your experience with the treatment technology?
N/A
Distribution System: Potential for private developer to use reclaimed water, but reclaimed water use is very low.

Appendix E. Washington Case Studies
Reclaimed Water Feasibility Study E-11
System Problems and Solutions: N/A
Other Features: N/A
Any political issues?
Extensive public campaign, the public wanted it.

Appendix E. Washington Case Studies
E-12 Reclaimed Water Feasibility Study
1.5 City of Everett Contact: Robert Waddle, Operations Superintendent, City of Everett; 425-257-8927. Spoke with 5/16/07; reviewed 8/24/07.
Date Operational: January 2005
Design Capacity:
21 mgd secondary treatment; no tertiary. Kimberly-Clark (K-C) just pulls a portion off the 42” effluent discharge line into K-C’s 16” stainless steel line for cooling water use. It’s a redundant system, as K-C can use untreated water from the lake that serves as Everett’s water supply.
K-C demand averages 6 mgd.
Currently offline because K-C has a break in their cooling system.
Uses:
Class C, with waiver from Department of Health for non-contact, non-aerosol. Just have to meet NPDES permit 200 cfu of fecal coliform and 0.1 to 0.5 for residual chlorine at the site of reuse.
Cooling water for Kimberly-Clark – about 6 mgd.
Objectives:
Benefit to the City if K-C consistently uses effluent, as it frees up water that can be treated and sold for other uses.
Capital Funding: None to Everett.
K-C paid for flange connection, 16” stainless line to their boiler house. Probably < 100’ of pipe.
Operation Cost Funding:
$20,000-$30,000 per year for sampling shed & on site monitoring of fecal coliform and Cl when K-C is using the water.
What are your revenue strategies?
The negligible O&M costs are recovered in wastewater rates.
Rates: N/A
Did you implement any cost sharing strategies K-C paid for their distribution system.
Have you assigned value to environmental or other benefits? N/A

Appendix E. Washington Case Studies
Reclaimed Water Feasibility Study E-13
Primary and Secondary Technologies: N/A
Tertiary Technology: N/A
Distribution System:
42” effluent outfall line to K-C and they have a 16” stainless line. Have a pressure sustaining valve on the system. Joint outfall 60” ID that goes to deep water
Issues: N/A

Appendix E. Washington Case Studies
E-14 Reclaimed Water Feasibility Study
1.6 Holmes Harbor Sewer District, Island County
Contact: Ken Eckelberger, Office Manager, Holmes Harbor Sewer District; 360-331-4636, [email protected]. Spoke with 5/9/07; reviewed 9/5/07.
Date Operational: 1995
Design Capacity: 0.1 mgd design; 0.04 mgd average daily flow.
Uses: Irrigate a golf course
Objectives: Plant designed for STEP, and they also have grinder pumps
Capital Funding:
Capital cost of the plant was $1.7 million and the collection system was $666,666. Bond and legal costs were approximately $1.3 million.
Operation Cost Funding: In 2007 - $295,000
What are your revenue strategies? N/A
Rates:
Utility local improvement district (ULID) - $4 million
$1500 - hookup, the customer must install septic tank effluent pumping (STEP), electric, and connect to system (costs $6,000 - $10,000)
$165/quarter + state excise tax - sewer rate
Did you implement any cost sharing strategies?
Only operate in their boundaries.
Have you assigned value to environmental or other benefits? N/A
Primary and Secondary Technologies: SBRs
Tertiary Technology: Coag/sand filter/Cl2
What is your experience with the treatment technology? N/A
Distribution System: N/A
System Problems and Solutions: N/A

Appendix E. Washington Case Studies
Reclaimed Water Feasibility Study E-15
Other Features: N/A
Any political issues?
Not permitted to discharge to Puget Sound, so effluent is used for irrigation.

Appendix E. Washington Case Studies
E-16 Reclaimed Water Feasibility Study
1.7 LOTT Alliance, Thurston County
Contact: Karla Fowler, Director of Planning and Programs, LOTT Alliance; 360-664-2333 ext. 1112. Reviewed 8/22/07.
Date Operational:
Budd Inlet – 2005.
Hawks Prairie (Martin Way) – 2006.
Design Capacity:
Budd Inlet Reclaimed Water Plant - 1 mgd (up to 1.5 mgd peak).
Martin Way Reclaimed Water Plant (part of the Hawks Prairie Reclaimed Water Satellite system) - 2 mgd (expandable to 5 mgd).
Uses:
Budd Inlet - Irrigation, in-plant use, equipment and boat washing, dust suppression.
Hawks Prairie – Irrigation, toilet flushing, constructed wetlands, groundwater infiltration.
Objectives:
1. Meet current and future wastewater treatment capacity needs throughout the LOTT service area.
2. Public value – treasure LOTT’s treated wastewater as a valuable, long-term resource to be cleaned and restored, reused, then ultimately returned to the environment.
3. Showcase the product – Class A Reclaimed Water – to help maintain and gain public support for use of this new water resource.
Capital Funding:
Budd Inlet - added sand filters - $2.8 million; financed through a ~ $15 million bond issuance for a lot of different projects.
Hawks Prairie - $32.7 million (Plant - $21.1 million; Ponds - recharge $7.2 million; Pipeline $4.4 million), financed primarily through a SRF loan from the Department of Ecology, 1.5% interest.
Water that isn’t used by customers goes to groundwater infiltration.
Operation Cost Funding:
Budd Inlet - No Response

Appendix E. Washington Case Studies
Reclaimed Water Feasibility Study E-17
Hawks Prairie - No Response
Contact Laurie Pierce (360) 528.5727 - contacted on 5/9 for O&M and info on treatment plant operations
What are your revenue strategies?
Built main reclaimed water distribution line in lieu of an outfall. Sell water for nominal fee to purveyors, as they will build the distribution infrastructure and distribute to other users.
Budd Inlet Reclaimed Water Plant - Olympia is the purveyor - $1/year.
Hawks Prairie Reclaimed Water Satellite - The purveyors are Lacey & Olympia – sell to them for $1/year.
Rates:
Rate structure was part of long range Wastewater Resource Management Plan
Monthly rate – $25.50/ERU. Will increase by $1.50 per year starting in 2008 through 2012. Used to fund all operations and maintenance, 91% of system upgrade capital projects, and 12% of new capacity capital projects.
For additional information and the current sewer charges fact sheet see the Lott Alliance website: http://www.lottonline.org.
Connection fee - $3.448.70 in 2007. Increases by $64.10 through 2019. Will increase an additional $150 per year from 2008 through 2012. Used to fund 88% of new capacity capital projects and 9% of system upgrade capital projects.
Did you implement any cost sharing strategies? N/A
Have you assigned value to environmental or other benefits? N/A
Primary and Secondary Technologies: N/A
Tertiary Technology:
Budd Inlet Reclaimed Water Plant – Sand filter system.
Martin Way Reclaimed Water Plant – Membrane bioreactor.
What is your experience with the treatment technology? N/A
Distribution System:
From Budd Inlet Reclaimed Water Plant – Put in reclaimed water pipeline between Budd Inlet Reclaimed Water Plant and LOTT’s Capitol Lake Pump Station. The line was routed through the state’s Heritage Park and Marathon Park where it’s used for irrigation.

Appendix E. Washington Case Studies
E-18 Reclaimed Water Feasibility Study
From Martin Way Reclaimed Water Plant (Hawks Prairie - reclaimed line between plant and pond (3 miles).
System Problems and Solutions: N/A
Other Features: N/A
Any political issues?
Community wanted it; strong community support for treating to a high level so the water could be put to beneficial use. Massive public involvement in planning.
The major political issue involved funding allocations for new capacity projects. There was a strong desire for growth to pay for growth to the extent feasible.

Appendix E. Washington Case Studies
Reclaimed Water Feasibility Study E-19
1.8 City of Medical Lake, Spokane County
Contact: Doug Ross, City Administer, City of Medical Lake; 509-299-6860. Spoke with 5/14/07.
Steve Cooper, Lead Operator, City of Medical Lake; [email protected]. Reviewed 9/5/07.
Date Operational: 2000
Design Capacity: 1 mgd
Uses:
Discharge average of 300,000 gpd to West Medical Lake
Also discharge to Deep Creek when process needs to go offline (he says this is very important - Plan B when not Class A)
Objectives: N/A
Capital Funding:
Essentially built a brand new plant - $14 million
They designed the plant from the start as a reclaimed water plant so he can’t really break up the costs, but he guesses that the tertiary treatment added about $8 million
Operation Cost Funding: $700,000/yr
What are your revenue strategies?
Not charging. Right now we’re trying to get the right to withdraw from the Lake just for our own City uses. WA State Veteran’s Cemetery will be first opportunity to charge and we anticipate we will be charging within the next two years. There’s also a City park right next to the plant that we’re working to get on the system. We don’t know yet how we will structure rates.
We wholesale water as well as buy wholesale water and are in a water-poor area, so need to use recycled water for irrigation.
Rates:
$30/mo for sewer
$1250 connection fee
They raised rates proactively and banked the money to lessen the amount of debt when the plant was built.

Appendix E. Washington Case Studies
E-20 Reclaimed Water Feasibility Study
Did you implement any cost sharing strategies? State pays half the O&M costs.
Have you assigned value to environmental or other benefits? N/A
Primary and Secondary Technologies: Ox ditch
Tertiary Technology: Coag/Filters/UV
What is your experience with the treatment technology?
.
Plant operates well.
Distribution System: N/A
System Problems and Solutions: N/A
Other Features:
Virtually odor free - a neighborhood has been built around the plant. When built, the plant was in the middle of a field.
We’ve got the best operator in the NW.
What issues have come up? Must clean UV regularly.
Any political issues? No complaints.

Appendix E. Washington Case Studies
Reclaimed Water Feasibility Study E-21
1.9 North Bay Case Inlet, Mason County
Contact: Tom Moore, Utilities and Waste Management Program Manager, North Bay Case Inlet; 360-427-9670 ext. 652, [email protected]. Contacted 5/8/07; reviewed 8/22/07.
Date Operational: 2000
Design Capacity:
0.37 - design
0.15 average
Uses: 1119 accounts of various status as of August 22, 2007
Objectives: Improve the water quality of North Bay/Case Inlet
Capital Funding:
New Facility
Plant itself - $6.2-$6.5 million
Total - $22 million
- Approx. $1.6 million with debt service
Operation Cost Funding:
O&M costs intermingled between 3 plants - total not including debt service = $447,939
What are your revenue strategies? Mason County is currently investigating the feasibility and rate impacts associated with combining all of Mason County owned sewer and water systems into a single utility with a common rate structure.
Rates:
Commissioner did not want to exceed $50/month. Recently conducted a financial assessment and it was determined that they need to charge $86/month and an $8,500 hookup fee.
It is difficult on existing customers. $80 - $90 common for small utilities.
Did you implement any cost sharing strategies? Yes. Currently administrative and some capital equipment costs are shared where possible.
Have you assigned value to environmental or other benefits? Yes, protecting jobs is important (Shellfish tourism).

Appendix E. Washington Case Studies
E-22 Reclaimed Water Feasibility Study
Primary and Secondary Technologies: SBR
Tertiary Technology: Coag/Cloth disk filters/UV
What is your experience with the treatment technology?
Feels like they missed out on MBR by a few years
Would rather not have cloth disk filters - they don’t save you during plant upsets. We’ve found it’s imperative that the secondary plant operates at optimum performance to meet reclaimed water standards with our current tertiary treatment equipment.
Distribution System:
Water still abundant, as water rights get harder to obtain they may have more opportunities to distribute water
System Problems and Solutions:
Filters are now meeting our expectations and designed performance levels.
Many of our pump stations are located on or near marine waters. When a problem occurs that results in an overflow, a shellfish harvesting closure usually follows. Mason County is constantly striving to improve pump station reliability to prevent overflows related to malfunctions - including electrical upgrades, installations of redundant alarm systems, and increasing overflow containment capacities.
It’s hard to get experts and technicians to our rural location.
Other Features: Collection System - Progressive Cavity E-1 Grinder Pumps.
What issues have come up? Pump station overflows. Grinder pump failures due primarily to poor installation by contractors. High per capita operating costs due to the relatively small size of the utility.
Any political issues? Substantial rate increases are always a difficult decision for our elected officials.

Appendix E. Washington Case Studies
Reclaimed Water Feasibility Study E-23
1.10 City of Quincy, Grant County
Contact: Tim Snead, City Administrator, Quincy; 509-787-3523, [email protected]. Spoke with 5/14/07.
Date Operational: 2002
Design Capacity: 1.25 mgd - design
Uses: .85 mgd to groundwater recharge.
We’re just percolating into the ground and doing a hydrogeological study to capture as much of the RW as possible and drill a well that will be part of potable water supply.
We looked into supplying reclaimed water to new industry through purple pipe, but it’s a 4 mile run across a canal to the facilities; too expensive. Microsoft, Intuit and Yahoo + two other high tech are huge facilities, that are obtaining their own water rights to cool their facilities and the City will provide their other water needs with potable water.
Objectives: According to a report by the Washington State Department of Ecology (Cupps and Morris. “Case Studies in Reclaimed Water Use: Creating New Water Supplies Across Washington State”, 2005.), the city of Quincy is in a water limited area and the area’s groundwater basin is closed to new water rights appropriations. Additional water supplies will be needed to accommodate expected growth.
Capital Funding: $5.9 million, no distribution.
Operation Cost Funding:
Budget = $98,000/year to EarthTech to manage domestic WWTP plant.
What are your revenue strategies?
Zero revenue; groundwater recharge. Don’t anticipate future customers.
O&M and debt service recovered through wastewater rates.
Rates: N/A
Did you implement any cost sharing strategies? N/A
Have you assigned value to environmental or other benefits? N/A
Primary and Secondary Technologies: SBR
Tertiary Technology: Sand filters, UV
What is your experience with the treatment technology?

Appendix E. Washington Case Studies
E-24 Reclaimed Water Feasibility Study
Domestic system’s been good. Industrial plant is problematic.
Distribution System: N/A
System Problems and Solutions:
Cooling water from manufacturing facilities is too clean to go into our system as it will kill all the bugs. Msoft Phase 1 is currently discharging and we can handle Ph 2, but no more. We’re looking into other options, including irrigation, etc.

Appendix E. Washington Case Studies
Reclaimed Water Feasibility Study E-25
1.11 Royal City, Grant County
Contact: Todd Perry, Public Works Director, Royal City; 509-346-2263, [email protected]. Reviewed 8/24/07.
Anita Sather, Finance Director, Royal City; [email protected]. Contacted 5/14/07.
Date Operational: 2000
Design Capacity:
0.25 mgd -design
0.15 - average
Uses: aquifer recharge, hydrant for tanker trucks.
Can irrigate if they can get the water up to the irrigation site.
Lease a sprayfield instead of using it ourselves.
Objectives: N/A
Capital Funding: Almost $4 million for plant.
Operation Cost Funding: $300,000.
What are your revenue strategies?
We have rates and we’re ready for it, but we don’t have distribution system yet.
I believe either Quincy or Ellensburg is selling reclaimed water.
Rates: The municipal ordinance/code for sewer use and reclaimed water was obtained from the City. Chapter 12.10.070 E.states “…may be separately metered… and appropriate rates will be established by the City Council for the use of reclaimed water.”
Current rates of:
$0.25/1,000 gal inside City limits;
$0.35/1,000 gal inside the UGA;
$0.75/1,000 gal at a metered “filling” station for trucks at the WRF.
Rates were established based on cost recovery of pump and electricity used to get water to an adjacent field that used to be our sprayfield. We served this farmer for a while by mixing

Appendix E. Washington Case Studies
E-26 Reclaimed Water Feasibility Study
reclaimed water with Bureau water, but he is farming a crop that needs more water than we could supply so he now uses Bureau water exclusively.
Plans to install purple pipe to park and ball fields, but need higher population to produce enough wastewater to serve. Will revisit rates when there’s more demand.
Did you implement any cost sharing strategies? N/A
Have you assigned value to environmental or other benefits? N/A
Primary and Secondary Technologies: Extended aeration activated sludge with ultraviolet disinfection
Tertiary Technology: N/A
What is your experience with the treatment technology? Works well with little maintenance.
Distribution System: Still trying to expand to irrigate parks.
System Problems and Solutions: N/A
Other Features: N/A
What issues have come up? N/A
Any political issues?
Farmers don’t mind, we are just unable to deliver to them at this time.
The state pretty much only lets the City use the water for recharge.

Appendix E. Washington Case Studies
Reclaimed Water Feasibility Study E-27
1.12 City of Sequim, Clallam County Contact: James Bay, Public Works Director, Sequim; 360-683-4908. Did not speak with. Following information obtained from Cupps and Morris. “Case Studies in Reclaimed Water Use: Creating New Water Supplies Across Washington State”, 2005.
Date Operational: 1999
Design Capacity:
0.8 mgd - design
0.5 mgd - average
Uses: Irrigation of public landscapes, dust control and street cleaning.
Objectives: N/A
Capital Funding:
SRF loan of $5.3 million
Centennial Clean Water Fund grant of $3.4 million
Operation Cost Funding: Some O&M costs recovered using base and volume charges of $37.00.
What are your revenue strategies? N/A
Rates:
All reclaimed water must be paid for. Rate structure is a flat base service charge based on meter size + declining block usage charge. Current rates are:
Sequim Reuse Water Base Service Charge
Meter Size
¾” $4.25
1” $5.69
1-1/2” $9.17
2” $13.38
3” $24.60
Source: Section 13.112.060, Sequim Municipal Code.

Appendix E. Washington Case Studies
E-28 Reclaimed Water Feasibility Study
Sequim Reuse Water Consumption Charge
From To Rate/c.f.
Zero 5,000 $.004
5,001 20,000 $.003
20,001 50,000 $.002
50,001 And above $.001
Source: Section 13.112.060, Sequim Municipal Code.
Did you implement any cost sharing strategies? N/A
Have you assigned value to environmental or other benefits? N/A
Primary and Secondary Technologies: N/A
Tertiary Technology: N/A
What is your experience with the treatment technology? N/A
Distribution System: N/A
System Problems and Solutions: N/A
Appendix E. Washington Case Studies
Reclaimed Water Feasibility Study E-29
1.13 City of Snoqualmie, King County
Contact: Kirk Holmes, Public Works Director, Snoqualmie; 425-831-4919 ext 12, [email protected]. Spoke with 5/11/07; reviewed 8/22/07.
Date Operational: 1998 (Ph I); 2002 (Ph II).
Design Capacity:
3.9 mgd design.
Avg 865,000 gallons/day when operating in the summer, – May 15-September 30.
Reclaimed water system only operates in the summer when there is irrigation demand.
Uses: Irrigate a golf course, plus 6 other landscape irrigation customers.
Objectives:
Weyerhaeuser and the City did not have adequate water rights to serve the density and development objectives.
Capital Funding:
$18 million for Class A treatment plant, including Ph 2 expansion
$4 million for distribution system
Operation Cost Funding:
2007 budget - $165,000, includes tertiary, and getting water from plant to the lake (base cost)
Only operational 4.5 months per year.
What are your revenue strategies?
City operates an Irrigation District with 6 customers, including Homeowners Association, Business Park Association, etc. Weyerhaeuser golf course also pays for reclaimed water at “bulk rates”, which is currently under negotiation, based on actual cost data for past couple of years.
Proposed 2008 Rates:
Goal is to recover 100% of costs, using cost-based rates. 2006 City policy directs all utilities (e.g., stormwater, solid waste, reclaimed water, etc.) to pay for themselves.
Rate increase proposal for Base Rate + Volume Rate:

Appendix E. Washington Case Studies
E-30 Reclaimed Water Feasibility Study
Base Rate of $2400/month for the golf course (Weyerhaeuser hasn’t been paying a base rate, only a volume charge), and $16.80/zone/month for other customers. There are 768 zones, of which the City owns over 300.
Volume Rate of $1.63/ccf to $2.67/ccf.
Did you implement any cost sharing strategies?
Weyerhaeuser Development Corporation paid entire capital cost of $22 million.
Have you assigned value to environmental or other benefits? N/A
Primary and Secondary Technologies: N/A
Tertiary Technology: N/A
What is your experience with the treatment technology?
Well-designed and well run. No problems.
Distribution System:
Water is pumped to Eagle Lake. Pump house has two pumps from there, one to golf course, and one to irrigation district.
System Problems and Solutions:
The only glitch is having to shut down and start up the effluent discharge to the Snoqualmie River every year, since the reclaimed system is only operational in the summer.
What issues have come up?
Renegotiating billing rate with Weyerhaeuser.
Any political issues? N/A

Appendix E. Washington Case Studies
Reclaimed Water Feasibility Study E-31
1.14 City of Walla Walla, Walla Walla County
Contact: Frank Nicholson, Utility Engineer, City of Walla Walla; 509-527-4537. Date Operational: Class A by 2008 Design Capacity: 20 mgd peak 9.6 mgd design capacity Uses: Irrigation Objectives: N/A Capital Funding: About $30 million total Upgraded plant in three phases: Phase 1 - added basins and clarifiers - $20 million - ended construction in 2000 Phase 2 - added UV and coagulation and sand filters - $6.1 million - construction ended 2004 Phase 3 - Add redundancy, sand filter rehab and emergency storage - out to bid right now, approx. $7 million (projected completion 2008). Operation Cost Funding: $1.3 million What are your revenue strategies? Current water rights limit ability to sell effluent. Rates: Increase 3% a year Did you implement any cost sharing strategies? N/A Have you assigned value to environmental or other benefits? N/A Primary and Secondary Technologies: Trickling filter, oxidation ditch, and clarifier. Tertiary Technology: Sand filter/UV. What is your experience with the treatment technology? Very happy with technology Distribution System: Irrigation diversion boxed on their property - irrigation folks take it from there System Problems and Solutions: N/A Any political issues? People want more reclaimed water.

Appendix E. Washington Case Studies
E-32 Reclaimed Water Feasibility Study
1.15 City of Yelm, Thurston County
Contact: Shelly Badger, City Administrator, City of Yelm; 360-458-8405. Contacted 5/10/07; reviewed 8/22/07.
Jon Yanasak, WWTP/Reuse System Manager, City of Yelm; 360-458-8411. Contacted 5/9/07; reviewed 8/23/07.
Jim Doty, Water Reclamation Plant Operator, City of Yelm. Contacted 8/24/07.
Date Operational: 1999
Design Capacity:
1 mgd - design
Per July 2007 Discharge Monitoring Report, influent daily average: 0.303 MGD, and influent daily maximum for the month was 0.336 MGD.
Uses: Irrigation of city streetscapes, parks, school grounds, wash school buses, construction companies, groundwater recharge, wetland park including catch and release trout pond.
Objectives: N/A
Capital Funding:
Total $9,630,850
Recycle water distribution line = $473,429
Cochrane Park = $771,928 – build wetland park, infiltration galleries, catch and release pond
Class A treatment plant = $7,414,277
Administration (including legal) = $211,522
Design Engineering = $759,694
Operation Cost Funding:
Reclaimed water and wastewater revenues and expenses are combined in one fund.
Total revenues for 2007 budget are $2,982,000; $7,000 is recycled water revenue from irrigation customers (schools, City, churches, 1 residential).
Total expenses for 2007 budget are $2,982,000.
2007 O&M expenses = $1,193,471

Appendix E. Washington Case Studies
Reclaimed Water Feasibility Study E-33
RW Facilities Maintenance - $36,000 (distribution)
Debt Service + Reserves = $1,752,529
What are your revenue strategies?
We have a combined sewer/reclaimed rate that goes into a combined fund. We are charging irrigation customers for reclaimed water.
Rates:
Reclaimed - Reclaimed water rates are currently $0.92/1,000 gallons. The rate is 80% of the base (lowest tier) of the potable water rate.
2007 Sewer rate - $41.06/month; $5725 – hookup
Did you implement any cost sharing strategies? N/A
Have you assigned value to environmental or other benefits? N/A
Primary and Secondary Technologies: SBRs (STEP)
Tertiary Technology: Coagulation/sand filters/Cl2
What is your experience with the treatment technology?
Nitrogen removal difficult in SBRs when it is cold (<11°C)
Distribution System: Piped to irrigation places
System Problems and Solutions:
Use of reclaimed water in mitigating water rights. The City has applied for additional water rights and plans to use a portion of our reclaimed water to mitigate impacts of additional potable water withdrawals.

Appendix F Construction Costs for Treatment
Technologies

Reclaimed Water Feasibility Study F-1
Appendix F Treatment Technologies
Construction Costs
Construction Costs for Treatment Technologies
Project Dollars (Year)a Technology Capacity
(mgd) Construction
Costb Cost Detailsc
Brightwater Plant, King County, WA 2004 MBR, chlorination 24.0 $280,000,000 Estimated cost for entire liquid stream
WWTP
Budd Inlet, WA 2004 Sand filters 1.0 $2,800,000 Cost Includes the sand filter facility
City of Cheney, WA 1994 Chlorination 1.5 $15,700,000 Cost includes screens, grit removal, oxidation ditch, wetlands
City of College Place, WA 2000 Cloth filters, UV 1.7 $16,400,000 Cost for entire WWTP
City of Ephrata, WA 2000 Sand filters, UV 1.1 $6,840,000 Cost for entire WWTP
City of Medical Lake, WA 1999 Sand filters, UV 1.0 $14,000,000 Cost for entire WWTP
City of Phoenix, AZ 2006 Ozone 12.5 $4,770,000 Estimated cost includes ozone facilities
City of Quincy, WA 2002 Sand filters, UV 1.3 $5,900,000 Cost for entire WWTP
City of Royal City, WA 2000 Cloth filters, UV 0.3 $3,660,000 Cost includes chemical coagulation and
re-aeration basin
Carmel, CA 2007 MF/RO 1.9 $18,000,000 Cost includes modifications to WWTP
Carnation, WA 2006 MBR, UV 0.2 $14,000,000 Cost for entire WWTP
Clark County, NV 2006 Peracetic acid 30.0 $6,400,000 Estimated cost includes contactors and building
Clark County, NV 2006 Peracetic acid 125.0 $21,000,000 Estimated cost includes contactors and building
Clark County, NV 2006 Ozone 30.0 $45,700,000 Estimated cost includes contactors and ozone facilities
Clark County, NV 2006 Ozone 125.0 $174,000,000 Estimated cost includes contactors and ozone facilities
Davis, CA 2007 UV open channel 7.5 $5,700,000 Estimated cost
Davis, CA 2007 UF 7.5 $21,100,000 Estimated cost
Dublin San Ramon Services District, CA 2005 Sand filters, UV 10.5 $7,500,000 Cost includes all facility components
except pipelines to wells
Dublin San Ramon Services District, CA 1997 MF/RO/UV 2.5 $10,198,024 Cost includes all facility components
except pipelines to wells
Fountain Hills, AZ 2000 MF 2.0 $6,000,000 Cost for complete MF facility
Fountain Valley, CA 2007 MF 86.0 $74,000,000 Includes building, electrical equipment
Fountain Valley, CA 2007 RO 70.0 $78,000,000 Includes building, electrical equipment
Fountain Valley, CA 2007 UV/hydrogen peroxide 70.0 $10,440,000 Cost following RO, includes building, canopy, electrical, instrumentation & control
Hawks Prairie, WA 2004 MBR, UV 2.0 $21,100,000 Cost of entire reclaimed water plant
Holmes Harbor, WA 1995 Sand filters, 0.1 $1,700,000 Cost of entire treatment facility

Appendix F. Treatment Technologies Construction Costs
F-2 Reclaimed Water Feasibility Study
Project Dollars (Year)a Technology Capacity
(mgd) Construction
Costb Cost Detailsc
chlorination
Lancaster LACSD, CA 2007 UV 1.0 $402,000 Cost is for one train (the plant has two
UV trains)
Lancaster LACSD, CA 2007 UV 1.0 $345,000 Cost is for one train (the plant has two
UV trains)
Modesto CA 2007 MBR 28.0 $78,000,000 Cost for entire MBR facility
North Bay, WA 2000 Cloth filters, UV 0.37 $6,500,000 Cost for entire WWTP
Petaluma, CA 2005 Filters, UV 4.0 $110,000,000 Includes WWTP and construction of wetlands
Petaluma, CA 2005 Filters, chlorination 4.0 $5,000,000 Air system for filter cleaning & chemical systems (hypochlorite, alum, polymer)
Roseville, CA 2006 UV 45.0 $31,532,000 Estimated cost, includes modifications to WWTP
Sarasota, FL 2005 UV 1.5 $940,000 Cost for only UV system facility
Sequim, WA 2004 Media filters, UV 0.67 $5,300,000 Includes upgrades of WWTP to Class A
Snoqualmie, WA 1998 Sand filters, UV 3.9 $18,000,000 Includes upgrades of WWTP to Class A
South Plant, King County, WA 1995 Sand filters,
chlorination 1.3 $2,240,000 Includes chemical coagulation system
Southwest, FL 2006 MF/RO 6.5 $39,000,000 Estimated cost
Southwest, FL 2006 UV/hydrogen peroxide 6.5 $4,118,000 Estimated cost following RO with a UVT of 95%
Southwest, FL 2006 UV/hydrogen peroxide 6.5 $6,601,000 Estimated cost following RO with a UVT of 90%
Sunland Sewer, WA 1999 Cloth filters, chlorination 0.16 $910,000 Includes tertiary upgrades
Turlock, CA 2006 Chlorination 20.0 $2,030,000 Cost for only chlorination facility. The entire Turlock Facility cost $40 million.
Turlock, CA 2006 Cloth filters 20.0 $3,010,000 Cost for only cloth filter facility. The entire Turlock Facility cost $40 million.
Turlock, CA 2006 High rate flocculation/ sedimentation 20.0 $4,290,000
Cost for only flocculation/sedimentation facility. The entire Turlock Facility cost $40 million.
Walla Walla, WA 2008 Sand filters 10.0 $1,100,000 Replacement of existing filters in kind
Watsonville, CA 2007 High rate flocculation/ sedimentation 7.7 $3,860,000 Cost for only treatment technology
Watsonville, CA 2007 Cloth filters 7.7 $2,260,000 Cost for only treatment technology
Watsonville, CA 2007 UV 7.7 $4,380,000 Cost for only treatment technology
Whittier Narrows LACSD, CA 2007 UV 24.2 $5,700,000 Cost for UV system only
Yelm, WA 2007 Chlorination 1.0 $9,100,000 Includes upgrades of WWTP to Class A
LACSD = LA County Sanitation District; MBR = membrane bioreactor; MF = micro-filter; RO = reverse osmosis; UF = ultra-filter; UV = ultraviolet; UVT = UV transmittance; WWTP = wastewater treatment plant. a These costs were normalized to 2007 Seattle dollars to develop the cost curves shown in Figure 3-2 in Chapter 3 of the feasibility study. b All costs are actual costs, unless indicated as estimates in the Cost Details column. c See Appendices C and E in the feasibility study for more comprehensive descriptions of these projects.

Appendix G Summary of UV Sizing and Cost Tool

Reclaimed Water Feasibility Study G-1
Appendix G Summary of UV Sizing and Costing Tool
For purposes of this evaluation, the location factor for Seattle, WA was utilized.
Site Specific Design Criteria Since this is a feasibility study and design flow and UV transmittance (UVT) data are unknown, a cost curve was developed to analyze potential costs associated with reclaimed water UV disinfection. A flow range of 1 to 50 million gallons per day (mgd) each for both 55% and 65% UVT values were used to develop these costs. A design transmittance of 55% and design dose of 100 mJ/cm2 is recommended by the 2003 UV Disinfection Guidelines (hereafter referred to as the Guidelines) for disinfection following conventional media filtration. The Guidelines recommend a design dose and transmittance of 80 mJ/cm2 and 65%, respectively, for UV disinfection following membrane filtration.
Additional design information assumptions are listed below:
Design Information The following information was utilized for this estimate:
• Design Flow -1mgd, 5 mgd, 10 mgd, 25 mgd, and 50 mgd;
• Design UV Dose - 100 mJ/cm2 and 80 mJ/cm2;
• Effluent Fecal Coliform Limit - 2.2 MPN/100 mL; and
• Filtered Secondary Effluent UVT - 55% and 65%
Figure 1 shows the cost curve for the design conditions listed above.
Total Project Cost for Open Channel UV as a Function of Flow and UVT
y = 329949x + 3E+06
y = 859243x + 3E+06
$0
$5,000,000
$10,000,000
$15,000,000
$20,000,000
$25,000,000
$30,000,000
$35,000,000
$40,000,000
$45,000,000
$50,000,000
0 10 20 30 40 50 60Flow, mgd
Cos
t
55% UVT, 100mJ/cm^2
65% UVT, 80mJ/cm^2
Figure 1. Cost Curve Analysis

Appendix G. Summary of UV Sizing and Costing Tool
G-2 Reclaimed Water Feasibility Study
UV Reactor Design The UV reactor design considered for the analysis is an open channel UV design and each channel is designed with one redundant (standby) bank per channel. The open channel UV reactor designs are shown in Table 1.
Table 1. Open Channel UV Reactor Sizing
Design UVT, % Design Dose, mJ/cm2
Design Flow, mgd Total # Lamps
55% 100 1 96
65% 80 1 48
55% 100 5 480
65% 80 5 192
55% 100 10 960
65% 80 10 384
55% 100 25 2400
65% 80 25 896
55% 100 50 4800
65% 80 50 1792
UV Cost Comparison Total estimated construction costs and total estimated project costs are listed in Table 2.
Table 2. UV System Cost Estimates Year dollars?
Design UVT, %
Design Dose,
mJ/cm2
Design Flow, mgd
Total Estimated Construction Costs
Total Estimated Project Costs
55% 100 1 $2,990,000 $4,040,000
65% 80 1 $2,580,000 $3,480,000
55% 100 5 $5,420,000 $7,320,000
65% 80 5 $3,650,000 $4,930,000
55% 100 10 $8,440,000 $11,390,000
65% 80 10 $4,700,000 $6,350,000
55% 100 25 $18,230,000 $24,610,000
65% 80 25 $8,630,000 $11,660,000
55% 100 50 $34,070,000 $45,990,000
65% 80 50 $14,530,000 $19,620,000
Costs in 2007 dollars.

Appendix G. Summary of UV Sizing and Costing Tool
Reclaimed Water Feasibility Study G-3
Costs for the open channel UV system include a number of important, but not all essential items. It is our experience that engineering and plant operations staff generally selects most of the items listed below, and thus they should be included in the preliminary budget estimate.
A dedicated electrical building to house UV controls (depends upon plant-specific power needs and distribution, UV controls often placed under canopy).
A canopy covering the entire UV reactor (a nice addition for operations staff, but not required).
A 10-foot wide lay-down area covered by the canopy for equipment offloading by plant staff (a nice addition for operations staff, but not required).
Easy lift channel covers (not required, but very helpful to operations staff).
The following items may be necessary to be installed as part of a UV disinfection project and will significantly add to the Total Estimated Project Costs. For this cost estimate however, the items listed below are not included in the cost estimate listed in Table 2:
Influent and effluent piping to and from the new UV disinfection system.
Covers for the secondary clarifiers launders-to prevent algae growth in the launders.
Standby power generators.
The Total Estimated Project Costs are based upon new construction with no geotechnical complications. Total Estimated Construction Costs include 30% contingency for all non-UV costs, 10% contingency for general conditions, 15% for general contractor OH&P, 8.8% sales tax, and 15% for bid market allowance, resulting in the Total Estimated Construction Cost. The Total Estimated Project Cost adds 30% to the total estimated construction cost for engineering, legal, and administration, and adds 5% for owners reserve for change orders. Costs shown have a +50% to -30% level of accuracy.

Appendix H 2005 Annual Survey of Wholesale Customers: Summary of Results, Seattle Public Utilities

2005 ANNUAL SURVEY OF WHOLESALE CUSTOMERS:
SUMMARY OF RESULTS
August 2006

3/4" mtr ch Includes Seasonal Inclined BlockPurveyor: per month Minimum Winter Summer* 1st 2nd 3rd 4th 5th Break Points**W.D. 20 $15.25 0 $1.25 $2.06 - - - - - -W.D. 45 $13.50 0 - - $1.75 $2.75 $3.75 - - 5/25W.D. 49 $8.80 0 - - $2.10 - - - - -W.D. 90 $17.25 2.5 - - $2.20 $2.60 $3.10 - - 8/13W.D. 119*** $22.25 0 Block Block $1.55/$1.94*** $2.30/$2.86*** $3.10/$3.88*** $3.91/$4.89*** - 7/14/21W.D. 125 $9.50 0 $1.95 $2.35 - - - - - -Bellevue $11.45 0 - - $2.28 $3.15 $4.05 $6.02 - 10/15/50Bothell $9.72 0 - - $1.97 $2.87 $3.72 $4.74 $5.41 5/10/15/25Cedar River $10.00 0 - - $1.94 $3.08 $3.69 $5.98 - 5 /15/25Coal Creek $13.30 0 - - $2.12 $2.76 $3.52 $5.05 - 5/15/50Duvall $19.35 2 - - $2.87 $3.70 $4.52 $5.35 $6.18 4/6/8/10Edmonds $8.26 0 - - $1.71 - - - - -Lake Forest Park $25.24 0 - - $2.20 - - - - -Highline $7.00 0 $2.91 $3.80 - - - - - -Kirkland $10.27 2 - - $2.88 $3.78 - - - 12Mercer Island*** $5.84 0 Block Block $1.14 $1.81 $2.99/$3.14*** $4.10/$4.80*** - 4/8/12Northshore $11.00 0 - - $1.80 $2.75 $3.70 $4.65 - 6.5/8.5/12.5Olympic View*** $10.76 0 Block Block $1.53/$1.64*** $2.24/$2.56*** - - - 20Redmond $8.72 0 - - $1.23 $2.39 $3.54 $4.69 - 5/11/20Renton $11.03 0 - - $1.85 $1.98 - - - 10Shoreline $17.46 0 - - $1.66 $1.80 $2.20 $3.14 $4.20 2/4/9/20Skyway $10.10 0 - - $2.50 $3.70 $4.20 $4.67 - 10/15/20Soos Creek*** $8.50 0 Block Block $1.15 $2.25/$2.70*** $2.70/$3.24*** $3.10/$3.72*** - 5/10/15Tukwila $6.00 0 $2.15 $2.98 - - - - - -Woodinville $10.01 0 - - $2.26 $3.34 $4.31 $5.38 - 6/12/25
Seattle*** $6.90 0 $2.53 Block $2.88 $3.35 $8.55 - - 5/18* All utilities with seasonal rates use a 4 month peak season except Soos Creek which has a 3 month peak season.** Break Points are the number of ccf per month at which the next rate block is attained. For example, W.D. 45 charges $1.75 per ccf for the first 5 ccf consumed, $2.75 per ccf for the next 20 ccf per month, and $3.75 per ccf for all consumption in excess of 25 ccf per month.*** WD 119, Mercer Island, Olympic View, Soos Creek, and Seattle have both seasonal and block rates. For example, WD 119's 2nd block rate of $2.30/ccf increases to $2.86 during the peak season.
A Comparison of 2005 Residential Rates Table 1.1
Seattle Public Utilities 12

A Comparison of 2005 Commercial Rates2" mtr ch Includes Seasonal Inclined Block
Purveyor: per month Minimum Winter Summer* 1st 2nd 3rd 4th 5th Break Points**W.D. 20 $72.70 0 $1.25 $2.06 - - - - - -W.D. 45 $13.50 0 - - $1.75 $2.75 $3.75 - - 5/25W.D. 49 $112.80 0 - - $2.10 - - - - -W.D. 90 $50.00 2.5 - - $3.10 - - - - -W.D. 119*** $35.21 0 Block Block $1.55/$1.94*** $2.30/$2.86*** $3.10/$3.88*** $3.91/$4.89*** - 7/14/21W.D. 125 $31.50 0 $1.95 $2.35 - - - - - -Bellevue $52.68 0 $2.33 $3.26 - - - - - -Bothell $94.78 0 $2.29 $3.92 - - - - - -Cedar River $44.57 0 - - $1.94 $3.08 $3.69 $5.98 - 5 /15/25Coal Creek $70.75 0 $2.44 $3.19 - - - - - -Duvall $19.35 2 - - $2.87 $3.70 $4.52 $5.35 $6.18 4/6/8/10Edmonds $57.36 0 - - $1.71 - - - - -Lake Forest Park $209.74 0 - - $2.20 - - - - -Highline $66.00 0 $2.91 $3.80 - - - - - -Kirkland $45.10 0 - - $3.34 - - - - -Mercer Island $42.87 0 $1.21 $3.31 - - - - - -Northshore $67.50 0 - - $2.55 $2.85 $3.15 $3.45 - 34.5/45/66.5Olympic View*** $39.13 0 Block Block $1.53/$1.64*** $2.24/$2.56*** - - - 160Redmond $46.75 0 $1.62 $2.49 - - - - - -Renton $30.94 0 - - $1.85 - - - - -Shoreline $65.32 0 - - $2.28 $4.20 - - - 100Skyway $98.41 0 - - $2.48 $3.33 - - - $20.00Soos Creek*** $42.67 0 Block Block $1.15 $2.25/$2.70*** $2.70/$3.24*** $3.10/$3.72*** - 5/10/15Tukwila $50.00 0 $2.78 $3.83 - - - - - -Woodinville $80.73 0 - - $2.74 $3.01 - - - prior winter avg
Seattle $22.00 0 $2.00 $3.35 - - - - - -* All utilities with seasonal rates use a 4 month peak season except Soos Creek which has a 3 month peak season.** Break Points are the number of ccf per month at which the next rate block is attained. For example, W.D. 45 charges $1.75 per ccf for the first 5 ccf consumed, $2.75 per ccf for the next 20 ccf per month, and $3.75 per ccf for all consumption in excess of 25 ccf per month.*** WD 119, Olympic View, and Soos Creek have both seasonal and block rates. For example, WD 119's 2nd block rate of $2.30/ccf increases to $2.86 during the peak season.
Table 1.2
Seattle Public Utilities 13

Appendix I Out of State Case Studies

Reclaimed Water Feasibility Study I-1
Appendix I Out of State Case Studies
This appendix provides more information on case studies of reclaimed water systems in Arizona, California and Florida that are summarized in Chapter 5 of the report.
1.1 City of Phoenix, Arizona (Maricopa County)...............................................................I-2 1.2 Monterey County Water Recycling Projects, California ..............................................I-6 1.3 Santa Rosa Subregional Reclamation System, California (Sonoma County).............I-10 1.4 South Bay Water Recycling (SBWR), California (Santa Clara County)....................I-14 1.5 West Basin Municipal Water District, California (Los Angeles County) ..................I-18 1.6 St. Petersburg, Florida (Pinellas County) ...................................................................I-22

Appendix I. Out of State Case Studies
I-2 Reclaimed Water Feasibility Study
1.1 City of Phoenix, Arizona (Maricopa County) Contacts:
Paul Kinchella, Superintendent, Water Treatment Plant Engineering, City of Phoenix Water Services Department; 602-534-9839. Spoke with 5/23/07.
Jill Celaya, Budget Supervisor, Management Services, City of Phoenix Water Services Department; 602-256-4397. Spoke with 5/23/07; reviewed 8/23/07.
Andy Terrey, City of Phoenix Water Services Department, Project Coordinator, Distribution and Collection Engineering; 602-256-3433. Spoke with 5/24/07; reviewed 8/21/07.
Date Operational: Cave Creek Phase 1 - 2001
Design Capacity:
Cave Creek WRF – Phase 1 - 8 mgd. Currently averages 3.3 mgd.
23rd Ave – 1930 activated sludge – Current capacity is 63 mgd, with 50 mgd average flow.
91st Ave is a regional wwtp – 1959 5 mgd trickling filter; 1960’s 45 mgd activated sludge; 180 mgd design capacity; 130-140 mgd average flow. Current expansion to 205 mgd to handle loadings.
Mesa, Tempe, Scottsdale, Glendale & Cave Creek send solids to 91st Ave. Doesn’t count as reclaimed water by Arizona Department of Environmental Quality.
Both 23rd Ave & 91st Ave. are loadings limited because reclamation plants upstream are discharging solids. Between 1990 and now, BOD was 210 m/l, now it’s 560 m/l.
Uses: (Uses and Quantity)
Cave Creek – landscape irrigation of golf courses, schools, parks, cemetery, etc. Surplus reclaimed water is recharged to the aquifer during the winter months.
23rd Ave - exchange 30,000-35,000 acre-feet with Roosevelt Irrigation District (RID) and get potable water in exchange from Salt River Project; or groundwater credits.
91st Ave - Serves Palo Verde Nuclear Generating Station (cooling water) and Buckeye Irrigation District.
Objectives: (Why reclaim water)
23rd Ave & 91st Ave - Effluent disposal.

Appendix I. Out of State Case Studies
Reclaimed Water Feasibility Study I-3
Cave Creek – potable water offset, reduce wastewater flows to 23rd Ave & 91st Ave.
Capital Funding:
The city bonds almost everything through revenue bonds, paying ½ percent more than they would for General Obligation bonds, but don’t have to go to the public.
Loans from the Water Infrastructure Finance Authority paid for 23rd Avenue upgrades in the 1990’s – had to pay Federal labor rates, but got to negotiate.
91st Ave – City of Phoenix sells bonds to pay the City’s share (50-70% of any project). The City then bills other cities monthly for funds to capitalize plant improvements. The billing amount is adjusted every 6 months.
Operation Cost Funding:
Cave Creek – Annual O&M cost:
• 2005/06 Actual - $3,124,726
• 2006/07 Actual - $3,035,613
• 2007/08 Budget – $3,330,031
Cave Creek Revenues
• 2005/06 Actual - $1,431,041 (46%)
• 2006/07 Actual (est.) - $1,622,996 (51%)
• 2007/08 Budget - $1,727,420 (52%)
91st Ave. is regional facility – each City is charged a different rate – 75-80 cents/1,000 gallons (just O&M).
23rd Ave. is charged the same as 91st Ave.
What are your revenue strategies?
Development fees and Impact Fees + Water Resources Fee
Cave Creek funded through water enterprise fund. They are currently studying what percentage of costs to allocate to wastewater, given heavy demands on water enterprise finances.
23rd Ave & 91st Ave funded from wastewater rates – no tax or GO funds; it’s all rate-funded.
Rates:

Appendix I. Out of State Case Studies
I-4 Reclaimed Water Feasibility Study
Cave Creek RW rate is 80% of potable rate, which varies with season of the year. Rates have been increasing 9% recently.
23rd Ave & 91st Ave. are contract rates, mostly 25+ years old and very inexpensive.
Did you implement any cost sharing strategies (i.e., on-site storage)
Several golf courses have their own storage for their own use.
Regular water meter and hookup fees are waived for RW customers.
WWTP & distribution system are part of the Water Enterprise Fund. Going to have to get some funds from wastewater too.
New customers pay a Buy-in Fee (in lieu of the water development fee), to pay for their percentage use of the capacity of the system. The fees vary widely, depending on how far the customer is from the WRF. To simplify the system and accommodate customers that are furthest away, they are considering changing to an approach like an Improvement District, where all customers in a particular pressure zone pay the same amount.
They do not expect to recover capital costs through this fee, as there are too few customers. They believe a holistic approach is required that views RW as part of the regional wastewater and water resources plan, recognizing that the system will not pay for itself and that costs should be shared by wastewater as well as water users. They are currently looking at what percentage of costs should be charged to wastewater users. Water customers have paid the costs not recovered through RW revenues to date.
The current business model goal is to provide RW to customers with turf area > 5 acres. This is a limited customer base spread over a large geographic area. They are currently looking to transition to more groundwater recharge. Ideally, they could just treat to a higher level that could go directly into the water impoundment for water treatment plant nearby, but this is currently politically infeasible.
Have you assigned value to environmental or other benefits? N/A
Primary and Secondary Technologies:
Cave Creek - Activated sludge with nitrification/denitrification.
23rd Ave - Activated sludge with nitrification/denitrification.
91st Ave – Activated sludge with nitrification/denitrification. Palo Verde takes effluent before disinfection.
Tertiary Technology:
Cave Creek – Parkson Dynasand Upflow sand continuous backwash filters + UV.
23rd Ave - Deep bed anthracite filters.

Appendix I. Out of State Case Studies
Reclaimed Water Feasibility Study I-5
91st Ave – none.
What is your experience with the treatment technology? N/A
Distribution System:
Developer pays cost of distribution pipe to their site. The City will pay for over sizing and recover costs through Buy-in Fees charged to new customers.
Other Features:
Cave Creek – Phoenix north of CAP canal requires turf areas 5 acres or larger use RW – golf courses, parks, cemetery, playgrounds, schools, etc.
References:
Paul Kinchella, City of Phoenix, personal communication, May 23, 2007.
Jill Celaya, City of Phoenix, Budget, personal communication, 5/23/07.
Andy Terry, City of Phoenix, Water Engineering, personal communication, 5/24/07.
http://phoenix.gov/WATER/wtrswrrates.html

Appendix I. Out of State Case Studies
I-6 Reclaimed Water Feasibility Study
1.2 Monterey County Water Recycling Projects, California Contacts:
Bob Holden, Monterey Regional Water Pollution Agency (MRWPCA); 831-645-4634; [email protected]. Spoke with 6/1/07; reviewed 8/24/07.
Jim Slater, Monterey County Water Resources Agency; 831-755-4849. Spoke with 6/1/07.
Keith Grand, Marsh Risk and Insurance Services; 415-743-7571. Spoke with 6/1/07.
Date Operational: 1998.
Design Capacity: 29.6 mgd
Current flow = 21-22 mgd, limited by supply. Growth in wastewater produced is less than originally projected. Demand is at least twice the supply during peak summer months and is supplemented by groundwater.
Uses: Agricultural irrigation, including lettuce, celery, broccoli, cauliflower, strawberries, artichokes, and spinach.
100% design level for urban project for golf courses, other landscape uses, including residential.
Conceptual stage of groundwater recharge – indirect potable – during winter only.
There is also talk going on about collecting the agriculture drainage water and returning it to the treatment plant.
RW constitutes about 67% of the agricultural customer demand, with remainder met by groundwater pumping. Goal is to reduce groundwater pumping to 0, so there is a new project to build a dam and use river water instead of groundwater.
Objectives: 1) Reduce agricultural groundwater pumping to reduce seawater intrusion.
Capital Funding:
Intent is to recover through property tax assessments and water usage charges.
$78 million capital cost funded through USBR low-interest loans (40-year terms), SRF (20-year term), and local bonds (Crook, 2004, Holden, 2007).
Debt service ($40 million capital 10 years ago) is paid through property tax assessments. Beneficiaries of the project are those that live over the intruded aquifers and especially those that are receiving the water ~ 12,000 acres (Slater, 2007).

Appendix I. Out of State Case Studies
Reclaimed Water Feasibility Study I-7
We retired some of the local bonds early and we’re accumulating funds to pay off/prepay USBR and State loans.
Dam project to withdraw water from the river is being funded through property tax assessments begun two years ago. The zone of benefit is property owners throughout the entire County. Currently preparing to go back to the public under Prop. 218 to increase the assessment, as the costs have increased over the estimates; the difference between the original assessment and the additional amount will be paid by the growers rather than the whole County. The dam O&M costs will be paid entirely by those receiving water.
Operation Cost Funding:
Annual O&M costs of tertiary treatment and distribution system are a little over $5 million (budget based on revenues; probably will come under). The unknown factor is how much water will be sold, so it’s an estimate; tend to estimate conservatively to avoid going back to ask for more money.
Annual debt service payments to USBR and State are about $4-5/million.
Operations costs are reimbursed by MCWRA, as many MRWPCA customers have no direct benefit from the system. MRWPCA customers pay only for secondary treatment as they have an outfall and no regulatory requirement beyond secondary treatment.
The County purchased a liability insurance policy beyond the regular countywide policy, which is reimbursed to the County by MRWPCA and part of the RW O&M costs. Current annual cost is about $230,000 for about $40 million coverage in pollution contamination and $33 million excess general liability.
Four policies provide the coverage. One is for public officials decisions that operate similar to Directors & Officers insurance in the private sector. It covers claims brought as a result of decisions made regarding the RW program. For instance, if the officials decided to reduce the amount of water made available and that caused crop damage. The pollution contamination policy covers claims made for property damage or personal damage due to pollution contamination from RW system. Excess general liability policies cover claims for injuries, etc. that don’t involve pollution.
AIG is a big writer of pollution contamination policies and there are several others that do pollution coverage. This would be the type of insurer that would cover RW programs.
When project was about to come online about 10 years ago, the County determined it needed to protect itself because it was direct contact with raw foods (lettuce, etc.). Coverage protects the County for problems arising from County actions. For instance, if too much chlorine ends up in the RW and burns crops, or they don’t meet their delivery quality standards. There have been no claims to date. At the outset of the program, the growers had issues with the water because it’s different (higher nutrients required modifying fertilizer practices), but problems were resolved as the growers learned to work with the water.

Appendix I. Out of State Case Studies
I-8 Reclaimed Water Feasibility Study
We irrigate around 12,000 acres. Original coverage was ~ $40 million (don’t know why – if was value of crop). After 9/11, our insurance rates went form $125K/year to $300K/year and coverage limits dropped somewhat. No other carrier was offering to jump in to put in bids. As of late, more companies are willing to offer competitive packages, so our rate is ~$230K/year and heading down. The e-coli incident did not attract the attention of the insurance industry so far. It is not known if other RW programs carry insurance.
Agriculture users also have coverage, but the extent of coverage is not known. During the e coli breakout, there were a series of questions they posed to the County’s insurance carrier about what the County insurance covered versus what their insurance covers.
Cost Sharing Strategies: N/A
Rates:
Rates are designed to recover full costs of program and reviewed/adjusted annually to cover the operations (including debt service) budget. Annual revenue is $9-10 million/year. About half the revenue comes from all property owners in zone of benefit through property tax assessment, and half from growers through property tax assessment + water delivery charges. Revenues consist of two components:
Property Tax Assessment – Designed to recover annual debt service (capital costs) and O&M costs. Beneficiaries of the project are those that live over the intruded aquifer and especially those that are receiving the water (~ 12,000 acres). The new dam project (designed to eliminate groundwater pumping) was determined to benefit all property owners over aquifers that are intruded, which means almost everyone in the County is also paying this assessment. They did a study to analyze the benefits to different classes of property owners. All entities in the zones of benefit pay the assessment whether they take reclaimed water or not. The growers pay Zone 2B, 2Y, and 2Z assessments, a total of $252.57/acre/year at 2006/07 rates. Non-growers pay Zone 2Y and 2Z charges only; in 2006/07 these range from $1.18 for dry farmers to $98.07 for commercial and industrial accounts. Homeowners pay $11.25/year.
Water Delivery Charge – Designed to recover a small amount of annual O&M costs is $17.63/ac-ft.
Tertiary Technology:
Flocculation using polyaluminum chloride or alum and polymers. Filtration using dual media filters. Gaseous chlorine disinfection.
Distribution System:
46 miles of transmission and distribution pipe, 8-51 inches in diameter.
22 supplemental wells to augment RW during peak demand.
112 flow-metered turnouts for irrigation piping connections.

Appendix I. Out of State Case Studies
Reclaimed Water Feasibility Study I-9
Pressure, conductivity, flow, and chlorine residual monitoring stations; centralized control system; 3 booster pump stations; cathodic protection for ferrous metal piping.
2-person crew to maintain.
System Problems and Solutions: N/A
Political:
The treatment facilities are owned by MRWPCA and the distribution system is owned by the County. MRWPCA is a contractor that operates the tertiary and distribution systems. Monterey County Water Recycling Projects formed in 1992 through inter-agency partnership between MRWPCA and Monterey County Water Resources Agency (MCWRA).
The growers are happy, as original cost projections were about double the actual RW costs, and they are paying relatively little for water. They initiated the project, as they needed the water; it wasn’t introduced by the County. The fear from the growers at beginning of project was not about the water, but about the perception that they wouldn’t be able to sell their product; these fears never materialized.
To ensure all wastewater would belong to the agricultural users forever, the County told the MRWPCA they could take some of the water for an urban project. The urban project will have to reimburse the agriculture project for any water they take. Because of County agreement with USBR, before the urban project can take any water, they have to do a full Federal EIS. They will not be able to use the agricultural distribution system.
By agreement, MRWPCA and MCWRA indemnify and hold harmless each other. There are no agreements with the growers. Dealings with the growers are covered by MCWRA ordinances. (For questions about those ordinances, please contact Jim Slater.)
No contracts or “hold harmless” agreements. There are general guidelines and growers are advised that a certain amount of testing geared toward food safety was done on specific crops 10-12 years ago.
References:
Crook, J., May 2004. Innovative Applications in Water Reuse: Ten Case Studies, WateReuse Association, p. 38-41.
Bob Holden, MRWPCA, personal communication, June 1, 2007.
Jim Slater, Monterey County Water Resources Agency, personal communication, June 1, 2007.
Keith Grand, Marsh Risk and Insurance Services, personal communication, June 1, 2007.
Appendix I. Out of State Case Studies
I-10 Reclaimed Water Feasibility Study
1.3 Santa Rosa Subregional Reclamation System, California (Sonoma County) Contact: Dan Carlson, Deputy Director of Sub-Regional Operations; 707-543-3357; [email protected] . Spoke with 5/8/07; reviewed 8/22/07.
Date Operational: 1960s (agriculture); early 1990s (urban irrigation); 2003 (conveyance system to Geysers steamfield.
Currently in Environmental Impact Review stage of:
1) Expansion of reuse system – additional urban and storage (project development stage), additional to Geysers (negotiation).
2) Discharge compliance project – Is it more cost effective to discharge to Russian River (higher flow) rather than Laguna Santa Rosa?
Design Capacity:
Design capacity = 21.34 mgd average daily flow (ADF)
Current ADF = 16.5 mgd
Expansion – 25.9 mgd at build out 20 years out
Reclaimed water usage was 88%, 89%, and 82% of the ADF for 2004, 2005, and 2006, respectively. 2006 percentage is lower due to higher rainfall, not lower usage. The system delivers roughly 11 mgd to the Geysers (4.1 billion gallons or 12,580 acre-feet per year). Irrigation usage is seasonal and accounts for roughly 2.6 billion gallons per year, with discharge between 1 and 1.5 billion gallons per year (7,980 acre-feet per year, with discharge between 3,070 and 4,605 acre-feet per year).
Uses: Agriculture (85% of total irrigation); urban landscape irrigation; recharge Geysers steam field for power generation.
Objectives:
1) Meet more stringent effluent disposal requirements.
2) Water supply issues are driving the planned expansion of urban reuse, and this will be the first time in the history of the system that costs will be partially funded by water.
Capital Funding:
The sub-regional reclaimed water system is essentially two systems. The original agricultural irrigation system consists of a low-pressure backbone and 17 reservoirs and has been expanded

Appendix I. Out of State Case Studies
Reclaimed Water Feasibility Study I-11
to include urban irrigation customers. The Geysers steamfield recharge system is a high-pressure pipeline and related facilities. An outline of capital improvements follows:
1975-1985 - Initial agricultural irrigation system backbone and storage facilities were built with $30 million in Clean Water grant funds. The water supplied was secondary treatment.
1989-Treatment process upgraded to tertiary, full Title 22.
1990 – First urban irrigation customer was a golf course on the agricultural backbone. The City funded the $2 million project.
1994-95 – Rohnert Park Urban Reuse project constructed (300 mgd), $6 million capital costs funded through revenue bonds.
1997 – Last expansion of the irrigation system. $3 million project for storage, conveyance and a pumping system to serve Gallo Wineries was split 50/50 between Gallo and the City.
2000-2004 - Geysers Recharge Project constructed consisting of a high-pressure pipeline, pump stations, steam field piping and injection wells. Capital costs were $275 million with Calpine Corporation paying $75 million and rest was financed with SRF loans and roughly 5% in small grants.
Capital & O&M costs for the expansion currently under consideration is proposed to be funded 40% by water and 60% by wastewater. This is significant, as it is the first time potable water users will help fund the reclaimed water system. In the past, 100% of the subsidy has been absorbed by the wastewater utility.
Operation Cost Funding:
Annual O&M costs (excluding debt service) for the sub-regional system is about $25 million. Calpine provides 80% of the power required to pump reclaimed water to steamfield.
Cost Sharing Strategies
No cost sharing on the agricultural/irrigation system until the 50/50 cost sharing with Gallo in 1998. The Geysers paid approx. $75 million of the capital project costs.
Rates:
The pricing policy for urban irrigation customers is currently under review. Current policy, dating to 1992 is:
Ag users > 100 acres receive an incentive to use reclaimed water
Ag users < 100 acres receive reclaimed water for free.
In 1997, pricing for urban irrigation customers was established at 75% of equivalent potable water cost (i.e., well users pay 75% of cost to operate their well; water utility customers pay 75%

Appendix I. Out of State Case Studies
I-12 Reclaimed Water Feasibility Study
of potable water rates). An incentive of one-year’s free water was given to encourage users to sign up. Cost bases are re-evaluated every 3 years.
Agricultural users originally signed 20-year agreements with the Utility that are renegotiated in 10-year increments and staggered, so they are renegotiated at different times. The original customers were dryland farmers, obtaining feed from the Central Valley with Federally subsidized water at $10/ac-ft. To encourage the farmers to allow the Sub-regional System (Utility) to dispose of effluent on their lands, the System paid an incentive, which they still pay. As water subsidies decrease in the Central Valley, the Utility will begin to eliminate the incentives to the farmers. The Utility wants to retain the agricultural customers, as they offer several benefits: 1) they use the most water; 2) they are closest to the WRF and can use the water most cost-effectively; 3) the largest users were on wells before the reclaimed water systems and have said they will go back to well water in recent negotiations (which the Utility does not want, as water scarcity is now an issue; and 4) the system was built mostly with Clean Water Grants so there isn’t a need to recoup the capital costs. Urban irrigation customers cost the Utility $10,000-$20,000 / acre to establish service, so while they pay for reclaimed water, they cost more to service.
The Geysers and the Utility signed 30-year agreement in 1998 that the Geysers would pay $75 million in capital costs and provide the power to deliver the reclaimed water. In return, the Utility would pay $200 million in capital costs and deliver 11 mgd.
When the current pricing structures were established, the primary driver for the reclaimed water system was effluent disposal. This is still a strong driver, however, potable water offset is now a driver as well. The Utility is constrained in its bargaining power with agricultural users, which are large customers. Urban irrigation users pay more for the reclaimed water, but they are generally more expensive to service.
Tertiary Technology: Anthracite gravity filters, UV disinfection (partly to keep salts down, although they have relatively low salt content at about 425 mg/l..
Distribution System: Agricultural irrigation system includes 1.8 billion gallons of storage. A peak irrigation day will use 30-35 mgd, so need the storage.
System Problems and Solutions: Seems like the debate over the safety of recycled water keeps re-occurring in somewhat different form. Dan reported that he just read the California SWRCB is beginning to talk about having utilities indemnify future liability related to groundwater recharge.
Political: City of Santa Rosa manages the recycling and distributes it on behalf of the cities of Cotati, Rohnert Park, Santa Rosa and Sebastopol, and portions of the unincorporated area of Sonoma County.
References:
Recycled Water: Safe, Successful Use in Hundreds of Cities in California and Throughout America, Redwood City Public Works Services Department, p. 19.

Appendix I. Out of State Case Studies
Reclaimed Water Feasibility Study I-13
USEPA Guidelines for Water Reuse, Chapter 2, Types of Reuse Applications, p. 64-65.
http://ci.santa-rosa.ca.us/default.aspx?PageId=2219
Dan Carlson, Sub-Regional Reclamation System, personal communication, May 8, 2007.

Appendix I. Out of State Case Studies
I-14 Reclaimed Water Feasibility Study
1.4 South Bay Water Recycling (SBWR), California (Santa Clara County) Contact: Eric Hansen, City of San Jose Water Resources Division, South Bay Water Recycling; (408) 277-3671; [email protected]. Spoke with 5/23/07 & 6/1/07; reviewed 8/23/07.
Date Operational: 1989
Design Capacity:
Design 167 mgd and average flow of entire treatment plant 110 mgd.
Design 50 mgd and average flow of reclaimed water portion 10 mgd.
Peak hours are about 40 mgd. Annual average ~ 10 mgd.
Uses:
In FY 05-06, 8600 ac-ft total volume delivered, mostly irrigation. In FY 06-07, 10,000 ac-ft total volume delivered, mostly irrigation.
4 major power plants came on line between 2001-2005, increasing the importance of SBWR’s 24/7 year round operation.
Commercial and industrial cooling towers, manufacturing, and several dual-plumbed buildings.
Objectives:
1) Meet more stringent effluent disposal requirements;
2) Currently reviewing how recycled water can help to meet future water supply needs.
Capital Funding:
The tertiary treatment plant cost about a quarter of a billion in capital funding.
Phase I - 108” diameter pipe from filter building to transmission station provides adequate Cl contact time to meet Title 22; transmission pump station; 60 miles of distribution pipe; 4 million gallon reservoir.
$140 million cost. $35 million funded through Title XVI; only received $28 million to date. Congress approved the project under Title XVI without providing additional budget, so USBR has to fund out of ongoing annual budget and has been reimbursing SBWR for over 10 years for work that has been long since completed.
Remainder funded through State funding and sewer service and use charges.

Appendix I. Out of State Case Studies
Reclaimed Water Feasibility Study I-15
Balance of 108 miles of pipe funded by developers to extend system to new development.
Recent extension to power plant. $22 million for 7 miles of pipe. The costs of construction were shared between the City, the Santa Clara Valley Water District, and Capine. The power plant is charged the industrial rate for 1-2 mgd with a max capacity of 5 mgd. SCVWD will use 5 mgd once development occurs.
Operation Cost Funding: (O&M; debt service; reserves - cost for each process)
2005/06 Actual O&M = $5.3 million
What are your revenue strategies?
Goal is 100% funded through revenue. Currently, reliant on reimbursement from SCVWD of $115/ac-ft. sold every year. This reimbursement kicks in when SCVWD can’t meet their demand with local sources (groundwater) and they import a stated minimum amount from Hetch Hetchy.
• 2005/06 Actual SCVWD reimbursement = $986,000 ($115 * 8,600 ac-ft).
• 2005/06 Actual RW Revenue = $2.5 million, including SCVWD reimbursement. Shortfall just under $1 million.
Rates:
Wholesale RW rate of $475 /ac-ft. is the current price of untreated water from SCVWD. There are discounts for irrigation, industrial and agricultural customers:
• Irrigation Rate = $310/ac-ft ($165/ac-ft discount)
• Industrial & Agriculture Rate- $110/ac-ft ($365/ac-ft discount)
The rate structure was designed to include appropriate changes in rates without requiring additional Council action. First, the reclaimed water wholesale rate is indexed to the Santa Clara groundwater pump charge.
• Wholesale RW rate indexes the SCVWD groundwater pump charge. Increases in the Santa Clara groundwater pumping charge automatically increase wholesale rates.
• The price of recycled water is appropriately set by adjusting the discount to potable rates.
Volumetric retail rates vary by water purveyor, and range from 20%-92% below potable water rates. The largest discounts are given to industrial and agricultural users.
Did you implement any cost sharing strategies (i.e., on-site storage)
Developers pay for system extensions.

Appendix I. Out of State Case Studies
I-16 Reclaimed Water Feasibility Study
To get program started in 1987, retrofit incentives were offered to achieve desired volume. Connection and retrofit construction costs have been reimbursed for customers in Santa Clara and San Jose. Milpitas still has about 60 planned retrofits.
There is no longer a need for incentives, however, the Bay Area Section of WateReuse is sponsoring a program June 15, 2007 for Bay Area industries to tell them about using RW and develop new markets for RW.
Have you assigned value to environmental or other benefits?
Valued wetlands production using contingent valuation approach.
Steve Cassover at UC Santa Cruz is starting a project to value reduced risk by providing drought-proof water supply in order to validate the portfolio approach to water supply planning. He wants to monetize the risk reduction that reuse and desalination bring due to their drought-proof nature.
Primary and Secondary Technologies: N/A
Tertiary Technology: N/A
What is your experience with the treatment technology? N/A
Distribution System:
108 miles of pipe, transmission pump station, another pump station, 9.5 million gallons of reservoir storage, serving the cities of Milpitas, Santa Clara and San José.
(2) 2.75 mg reservoirs (2007).
(1) 4 mg reservoir (1999).
Other Features:
Plans to expand the system could ultimately result in recycling an additional 40,000 acre-feet per year. The Santa Clara Valley Water District is considering supporting future expansions to the recycled water system.
System Problems and Solutions:
SBWR incorporates liability waivers in their “right of entry” agreements. They tell customers that using RW is a State requirement and the City passes on the liability of use to the users. RW users claimed that the salts in RW killed redwood trees. The SBWR program did not agree, and invested in studies to determine cause of death – potential causes are sudden oak death syndrome, the fact that they are planted in non-native area, poor draining, lack of proper irrigation, etc. Now SBWR has hired soils/horticultural expert to perform site reviews prior to retrofit.
Political Issues:

Appendix I. Out of State Case Studies
Reclaimed Water Feasibility Study I-17
Cities of San Jose and Santa Clara own the wwtp and sell wwtp capacity to 9 agencies. San Jose is the administrator for the treatment plant and SBWR under the Joint Powers Agreement. SBWR gets manufactured water from the treatment plant and distributes it.
Program participants include: Santa Clara, cities of San Jose and Milpitas, County Sanitation Districts 2 & 3, West Valley Sanitation District, Burbank and Sunol Sanitary Districts, Cupertino Sanitary District, Santa Clara Valley Water District, San Jose Water Company, and the Great Oaks Water Company.
SBRW has O&M agreements with partner cities for pipe going through their area. The cities submit bills for pipe replacement and are reimbursed from Joint Powers Fund.
References:
Recycled Water: Safe, Successful Use in Hundreds of Cities in California and Throughout America, Redwood City Public Works Services Department, p. 17.
A Closer Look at Some California Water Recycling Projects, p. 5.
http://www.sanjoseca.gov/sbwr/
Eric Hansen, City of San Jose, personal communication, May 23, 2007 & 6/1/07.

Appendix I. Out of State Case Studies
I-18 Reclaimed Water Feasibility Study
1.5 West Basin Municipal Water District, California (Los Angeles County) Contact: Joe Walters, Recycled Water Manager; 310-660-6208. Spoke with 5/10/07.
Date Operational: 1995; Ph IV which added 15 mgd is virtually complete.
Design Capacity:
52 mgd capacity (includes Ph IV);
12.5 mgd for salt water barrier.
2006 - 23,653 ac-ft.
24 mgd produced in 2002. Treatment facilities include West Basin Water Recycling Plant and a satellite MF/RO plant.
Table 1. 2002 WBMWD Recycled Water Production and Prices
Use Type of Treatment Quantity (mgd)
Percentage of Total
Price (compared to Imported
Water)
Irrigation Disinfected tertiary 2.5 10% 25-40 percent less
Industrial cooling makeup water
Nitrified and disinfected tertiary 7.4 30% 20 percent less
Groundwater recharge
Lime treatment, reverse osmosis, disinfected tertiary
6.5 26% 10 percent less
Low pressure boiler feed water
Microfiltration, RO, disinfection 5.8 24% Equal or slightly
higher
High pressure boiler feed water
Microfiltration, RO, disinfection, second pass RO
2.4 10% Equal or slightly higher
Source: (Crook, 2004).
Uses: Landscape irrigation, industrial cooling and boiler feed water, commercial applications, and groundwater recharge.
Objectives: 1) Reduce dependence on imported water by 50%; 2) Improve water supply reliability by providing a drought proof local water source; 3) Reduce wastewater effluent discharge to Santa Monica Bay by 25%; and 4) prevent continued salt-water intrusion of the groundwater basin.

Appendix I. Out of State Case Studies
Reclaimed Water Feasibility Study I-19
Capital Funding:
Total capital costs, including land, through 2003 were $365 million. WBMWD revenue bonds, USBR grants and low interest State loans funded $200 million Phase I facilities.
Early – partnered with USBR – 25% of pipelines
Last 3-4 years, Army Corps of Engineers is building the pipeline projects and WBMWD pays back 25% of that. Pipeline laterals.
Operation Cost Funding: 2002 operating costs were $14.8 million.
2006 O&M - $14.899 million
RW Sales – 2006 = $15.68 million, including $5.9 million (~ 38%) of MWD Local Resource Program payments.
Local Resource program with MWD – MWD determined it would be cost-effective if member agencies could produce water on a local basis, so they invest in developing local water supplies and pay WBMWD $250/ac-ft. for reclaimed water produced.
Did you implement any cost sharing strategies?
We serve the City of Torrance outside of our service area. They were working on streets and they put in a recycled water line, to be repaid by WBMWD when they sign up customers. The customers have yet to sign up, so Torrance has yet to be paid.
Toyota funded the pipe when streets were going in, with the agreement that WBMWD would pay back the cost.
Have you assigned value to environmental or other benefits?
Seawater barrier –every gallon of effluent we take reduces the amount of secondary effluent discharged to the ocean. We currently take about 10% of Hyperion plant’s output and our buildout plan will use 30% of their output.
Carbon footprint – RW uses < 500 kWh/ac-ft. Imported Colorado River water uses 2,000 kWh; the State Water Project uses 3,000 kWh/ac-ft.
Rates: WBMWD sells imported water for $510/ac-ft. Recycled water rates vary depending on level of treatment.
Tertiary Technology:

Appendix I. Out of State Case Studies
I-20 Reclaimed Water Feasibility Study
Table 2. WBMWD Recycled Water Treatment Technologies
Use Type of Treatment Treatment Technology
Irrigation Disinfected tertiary Ferric chloride coagulant addition, flocculation basins, anthracite mono-media filters, sodium hypochlorite disinfection.
Industrial cooling makeup water
Nitrified and disinfected tertiary
Tertiary process above, followed by biofilters at satellite package plants for nitrification, sodium hypochlorite for complete ammonia destruction and disinfection.
Groundwater recharge, low pressure boiler feed water
Lime treatment, RO, disinfected tertiary
5 mgd – Decarbonation, chemical coagulation and clarification using lime, recarbonation, tri-media filtration (anthracite, garnet, and sand), sulfuric acid and scale inhibitor addition, RO, decarbonation, sodium hypochlorite disinfection, and lime addition. 2.5 mgd – Hypochlorite addition, straining, microfiltration, sulfuric acid and scale inhibitor addition, RO, decarbonation, sodium hypochlorite disinfection, and lime addition.
High pressure boiler feed water
Microfiltration, RO, disinfection, second pass RO
RO process above, followed by second pass RO.
Source: (Crook, 2004).
Distribution System: Tertiary treated water for non-potable irrigation, industrial and commercial use is stored in a 5 million gallon reservoir and pumped to a 75 mile long distribution system. Second pass RO is pumped to storage tanks at Chevron and Exxon refineries.
System Problems and Solutions: N/A
Other Features: Five different qualities of recycled water, or “designer waters”, are produced to meet specific user needs. RO concentrate is discharged into Los Angeles’ wastewater treatment plant outfall.
Political: WBMWD is a public agency water wholesaler, so they had to execute a purchase agreement with the City of Los Angeles to purchase secondary effluent from Hyperion wastewater treatment plant. They also signed an Agreement with Metropolitan Water District to secure local project rebate of up to $250/ac-ft for 25 years.
References:
Recycled Water: Safe, Successful Use in Hundreds of Cities in California and Throughout America, Redwood City Public Works Services Department, p. 19.
Crook, J., May 2004. Innovative Applications in Water Reuse: Ten Case Studies, WateReuse Association, p. 38-41.
Appendix I. Out of State Case Studies
Reclaimed Water Feasibility Study I-21
http://www.westbasin.com/
Joe Walters, WBMWD, personal communication, May 10, 2007.

Appendix I. Out of State Case Studies
I-22 Reclaimed Water Feasibility Study
1.6 St. Petersburg, Florida (Pinellas County) Contact: Evelyn Rosetti, Manager, Special Projects, City of St. Petersburg; 727-893-7297. Spoke with 5/8/07; reviewed 10/8/07.
Date Operational: 1977-87
Design Capacity: 2006 average flow was 34 mgd; 20 mgd reclaimed for beneficial uses.
Uses: Landscape irrigation, including 10,000 residential accounts; fire protection (backup only); cooling water. Reclaimed water not sold is deep well injected.
Objectives:
1) Meet more stringent effluent disposal requirements;
2) Meet future water supply needs.
Capital Funding: Capital cost to date is $135 million to upgrade treatment plants and build the distribution system. The U.S. EPA provided $100 million and the City contributed $20 million. $15 million is recoverable through the Voluntary Assessment Program and $11 million has been recovered to date from developments to which distribution is extended. Residents pay for extending the distribution system to serve them through the Voluntary Assessment Program, which typically ranges between $500 and $1,200 per customer, depending on actual costs of construction.
Operation Cost Funding: Current annual operating cost is $5.2 million. Revenues are $1.6 million. The remaining $3.6 million is subsidized by the City’s water and wastewater utilities, each paying half (Crook, 2004).
Cost Sharing Strategies: Not aware of any.
Valuation of Environmental or Other Benefits: Not aware of any.
Rates: Reclaimed water rates were initially established based on market comparison of what other utilities were charging. Currently, the monthly residential reclaimed rate is effectively a flat rate of $14.36 for the first ac-ft., $8.22 each additional ac-ft. The utility charged a flat rate of $10.36 for many years, and began increasing rates $1/year four years ago. A $1/year rate increase equates to about $120,000/year. Evelyn believes that expense increases are outpacing rate increases, but doesn’t have specific figures (Rosetti, 2007).
Residential rates are tiered to encourage conservation. Current residential potable water rate is $7.57/month + [$1.05/1,000 gallons (up to 2,400 gallons) + $1.74/1,000 gallons (next 2,400 gallons) + $2.97/1,000 gallons (next 7,000 gallons) + $4.48/1,000 gallons (over 15,000 gallons)] + $1.69/1,000 gallons (Tampa Bay Water charge). Current residential wastewater rate is $8.98 + $3.44/1,000 gallons.

Appendix I. Out of State Case Studies
Reclaimed Water Feasibility Study I-23
Water, wastewater and reclaimed water services are accounted for in one fund, water and wastewater revenues are roughly equal. The subsidy for reclaimed water is shared 50/50 between water and wastewater services. When the system was implemented initially, the benefit was more heavily weighted to wastewater, but as evidence of potable water limits increased, the City began splitting the benefit 50/50.
Tertiary Technology: Four water reclamation facilities (WRFs) with secondary, coagulation, filtration, and disinfection.
Distribution System: 80 miles of trunk and transmission mains at least 16” in diameter, and 215 miles of small diameter distribution pipe. Transmission mains from all four WRFs are connected to maintain pressure in the system when any one plant is offline. Five City owned and four private booster pump stations.
System Problems and Solutions: Residential backflow issues due to thermal expansion from hot water heaters, chloride impacts on landscape plants, and inadequate supply issues are described on pages 32-33 of Innovative Applications in Water Reuse: Ten Case Studies, WateReuse Association, May 2004.
Other Features: Opted for interruptible supply, so fire protection is backup only.
Political: N/A.
Lessons Learned: Be cognizant that as demand grows over time, there is not an unlimited supply of reclaimed water; take care with what is committed to in use agreements (Rosetti, 2007).
References:
Crook, J., May 2004. Innovative Applications in Water Reuse: Ten Case Studies, WateReuse Association, p. 3-33.
http://www.stpete.org/c2g/information/reclaimedwater.htm#anchor , accessed 5/3/07.
2005 Reuse Inventory Report: Charges for Use of Reclaimed Water, Appendix H.
http://www.dep.state.fl.us/water/reuse/docs/inventory/AppH.pdf , accessed 5/3/07
St. Pete water rates - http://www.stpete.org/c2g/information/water.htm#anchor , accessed 5/3/07.
St. Pete wastewater rates - http://www.stpete.org/c2g/information/wastewater.htm#anchor , accessed 5/3/07.
Evelyn Rosetti, City of St. Petersburg, personal communication, May 8, 2007.

Appendix J Summary of Case Studies

King County Reclaimed Water Feasibility StudyAppendix JSummary of Case Studies
Project Year Recycled Water Type
Uses Average Daily (MGD)
Design Capacity (MGD)
Construction Cost O&M Cost Funding Sources Monthly Rate Connection Fees
Monthly Rate Connection Fee
Notes References
Washington Case StudiesCity of Chehalis, Lewis County 2007 Class A required
only when percolating into the ground during cold weather (low river flow and trees are dormant)
Poplar forest irrigation 1.3 3.5 $37,600,000 -$1.95 million, including $850,000 for administration and $119,000 for plantation. -New plant O&M $980,000 year
- 0% loan from Ecology ($32 million)-Grant from Ecology ($5 million)-Grant from EPA – State & Tribal Assistance Grant (STAG) ($144,000)-Remainder shared by regional partners and the City
- - $35.93 + $4.32/100 ccf
$3,030 - Cupps and Morris 2005; Patrick Wiltzius - Personal Communication 2007
City of College Place, Walla Walla County
2001 Class C Use effluent to irrigate farmland
0.9 1.6 $16,400,000 $430,000 -Public Works Trust Fund Loan ($ 7 million)-Centennial Clean Water Fund Grant ($ 2.5 million)-SRF Loan ($ 5.6 million)
- - $46.00 $620 - Cupps and Morris 2005; Kathy Cupps - Personal Communication 2007; Paul Hartwig - Personal Communication 2007
City of Ephrata, Grant County 2000 Class A -G.W. recharge -fishing pond -plan to use for irrigation in the future
0.6 1.2 $6,100,000 $780,000 -Centennial Clean Water Fund Grant ($ 1.97 million)-SRF Fund Loan ($ 5.35 million)
- - $29.00 $750 - Cupps and Morris 2005; Wes Crago - Personal Communication 2007
City of Everett, Snohomish County
2005 Class C(with waiver from Department of Health for non-contact, non-aerosol)
Kimberly-Clark cooling water
6.0 21.0 Kimberly-Clark paid for flange connection, 16” stainless line to their boiler house.
$20,000-$30,000/year for sampling watershed & on site monitoring of fecal coliform and chlorine when Kimberly-Clark is using the water
Kimberly-Clark paid capital, negligible O&M covered by wastewater rates
- - - - - Cupps and Morris 2005; Robert Waddle - Personal Communication 2007
Holmes Harbor Sewer District, Island County
1995 Class A Seasonal irrigation of golf course
0.03 - 0.04 0.1 $3,700,000 $295,000 -Business Park Association.-ULID sewer revenue bonds and property assessments
- - -$58.33 for homes-$ 48.33 for lots
$1,500 - Cupps and Morris 2005; Ken Eckelberger - Personal Communication 2007
King CountyCarnation Treatment Facility 2008 est. Class A Wetland enhancement 0.2 0.4 $14,000,000 -$625,000 for treatment
and distribution -$10,000 for wetland monitoring
-$1.2 million SRF for design -$14,085,238 SRF for construction -$14,000 from King Conservation District -King County Water Works Grant of $30,000 -North American Wetland Conservation Act Grant of $122,000 -Interagency for Outdoor Recreation Aquatic Lands Enhancement Account: $395,350
- - $88 est. - - Susanna Leung, Project Engineer, Carollo Engineers -Personal Communication
LOTT Alliance, Thurston CountyBudd Inlet Treatment Facility 2005 Class A -Irrigation
-equipment & boat washdown-dust suppression
1.0 1.5 $ 2.8 million WRF upgrade to Class A
$127,000 -One project financed under bond issuance ($15 million)
$1/year to purveyors who sell and distribute to customers
- $25.50/ERU $3,449 Monthly rates - proposed annual increases of $1.50 and $150 per month, respectively for monthly and connection fees through 2012.
Cupps and Morris 2005; Karla Fowler - Personal Communication 2007
Hawks Prairie Satellite Facility 2006 Class A -Irrigation-toilet flushing-constructed wetlands-groundwater infiltration
2.0 2.0 Total cost of $32.8 million. -Class A Reclaimed Water Plant - $ 21.1 million-Constructed Wetlands Ponds and Groundwater Recharge Basins - $ 7.2 million-Conveyance Lines - $ 4.4 million
- -1.5% SRF Loan $1/year to purveyors who sell and distribute to customers
- $25.50/ERU $3,449 Connection fee increases by $64.10 through 2019. Will increase an additional $150 per year from 2008 through 2012.
Cupps and Morris 2005; Karla Fowler - Personal Communication 2007
WastewaterReclaimed WaterFlow
King County Reclaimed Water Feasibility Study Page 1 of 4 Appendix J

King County Reclaimed Water Feasibility StudyAppendix JSummary of Case Studies
Project Year Recycled Water Type
Uses Average Daily (MGD)
Design Capacity (MGD)
Construction Cost O&M Cost Funding Sources Monthly Rate Connection Fees
Monthly Rate Connection Fee
Notes ReferencesWastewaterReclaimed WaterFlow
City of Medical Lake, Spokane County
2000 Class A -Lake water -creek water-in-house use
- 1.0 $14,000,000 $700,000 -Public Works Trust Fund Design loan ($ 96,000)-Centennial Clean Water Fund Grant ($ 2.5 million)-Public Works Trust Fund ($ 1.5 million)-Capital Improvement Fund from City ($ 1.0 million)-Department of Social and Health Services Grant ($ 9 million)-State pays half of O&M
No charge - $30.00 $1,250 - Cupps and Morris 2005; Doug Ross - Personal Communication 2007; Steve Cooper - Personal Communication 2007
North Bay/Case Inlet, Mason County
2000 Class A Improve the water quality of North Bay/Case Inlet
0.2 0.4 $22,000,000 $1.6 million with debt service
-Ecology (Grant $5 million, Loan $9 million)-USDA Rural Development (Grant $3.74 million, Loan $ 5.2 million)
- - -$ 86.00 Lot-$ 15.00 Vacant Lot
$8,500 - Cupps and Morris 2005; Tom Moore - Personal Communication 2007
City of Quincy, Grant County 2002 Class A Aquifer recharge 0.9 1.3 $5,900,000 $98,000 -USDA Rural Development Loan ($ 2.7 million)-SRF Loan ($ 2.5 million)-Design-Build Option under Washington's Water Quality Joint Development Act lowered cost
- - $29.00 $750 - Cupps and Morris 2005; Tim Snead - Personal Communication 2007
City of Royal City, Grant County 2000 Class A -Aquifer recharge-in-house use
0.2 0.3 $4,000,000 $300,000 -SRF Loan for planning ($ 73,845)-USDA Rural Development Grant ($ 1.8 million)-USDA Rural Development Loan ($ 640,000)-Centennial Clean Water Fund Grant ($ 985,000)-Community Development Block Grant ($ 750,000)-SRF Loan ($ 245,525)-City Funds ($ 79,585)
$0.25/1,000 gal inside City limits; $0.35
inside the UGA; and $0.75 at a metered “filling” station for trucks at the WRF
- $39.25 -$1,598 (System Development Fee)-$550 (Connection Fee)
- Cupps and Morris 2005; Todd Perry - Personal Communication 2007, Anita Sather - Personal Communication 2007
City of Sequim, Clallam County 1999 Class A -Irrigation of public landscapes-dust control-street cleaning
0.5 0.8 -$ 5.3 million WWTP upgrade to Class A-$ 3.4 million demonstration project to plan, design & construct RW distribution system and educational park
$ 2.4 million (2004) -SRF Loan ($ 5.3 million)-Centennial Clean Water Fund Grant ($3.4 million)
Base charge + volume charge
- $37.00 $3,000 - Cupps and Morris 2005
City of Snoqualmie, King County 1998 (Phase I), 2002 (Phase II)
Class A Urban irrigation 0.9 3.9 $ 18 million for upgrades for Phase II. $ 4 million for
distribution
$165,000 (only operational for 4 months)
Irrigation district rate revenues $16.80 per zone + volume usage rate of
$1.63 to $2.67/ccf
- $24.50 (same as drinking water rate)
-$1,000 (in Snoqualmie Ridge)-$2,500 (Outside Snoqualmie Ridge)
- Cupps and Morris 2005; Kirk Holmes, Public Works Director - Personal Communication 2007
Sunland Sewer District, Callam County
1999 Currently Class D but plan to go to
Class A
Sprayfield Irrigation 0.09 - 0.12 0.2 - $440,000 (Includes water & wastewater O&M; includes lease of spray field)
-SRF Loan ($ 76,000)-Public Works Trust Fund Loan ($ 910,000)-Public Works Trust Fund Loan ($ 25,000)
- - $31.00 - $50 (Existing Customers)-$1,074 (New Customers)
- Cupps and Morris 2005
City of Walla Walla, Walla Walla County
2008 Class A -Agricultural use-stream flow enhancement
5.7 9.6 -$ 20 million - Phase 1-$ 6.1 million - Phase 2-$ 7 million - Phase 3
$1,300,000 -Public Works Trust Fund Loan ($5.16 million)
- - $31.46 $ 58/foot - Cupps and Morris 2005; Frank Nicholson - Personal Communication 2007
City of Yelm, Thurston County 1999 Class A -irrigation of city streetscapes, parks-irrigation of school grounds-wash school buses-construction companies -groundwater recharge-wetland park including catch and release trout pond
0.3 1.0 $9,600,000 $1,200,000 -State Planning Grant ($ 250,000)-Centennial Clean Water Fund Grant ($ 3.4 million)-USDA Loan ($ 3.9 million)-USDA Grant ($ 344,449)-Utility Local Improvement District ($ 2 million)-City Funds ( $30,901)
$0.92/1,000 gallons; 80% of base (lowest tier) potable water
rate
- -41.06(roughly 80%
of drinking water rate)
$5,725 - Cupps and Morris 2005; Shelly Badger, City Administrator - Personal Communication 2007
King County Reclaimed Water Feasibility Study Page 2 of 4 Appendix J

King County Reclaimed Water Feasibility StudyAppendix JSummary of Case Studies
Project Year Recycled Water Type
Uses Average Daily (MGD)
Design Capacity (MGD)
Construction Cost O&M Cost Funding Sources Monthly Rate Connection Fees
Monthly Rate Connection Fee
Notes ReferencesWastewaterReclaimed WaterFlow
Arizona Case StudyCity of Phoenix, Maricopa CountyCave Creek WRF – Phase 1 2001 - -Urban Irrigation
-aquifer recharge -cooling water for Nuclear Station
3.3 8.0 - · 2005/06 Actual - $3,124,726· 2006/07 Actual - $3,035,613· 2007/08 Budget – $3,330,031
-Revenue bonds Recycled water rate is 80% of potable rate
-Existing water users waived from connection fee. -New usrs are charged a buy-in-fee.
No Charge No Charge Several golf courses provide their own storage. Developers pay for distribution pipelines.
Paul Kinchella, Superintendent, Water Treatment Plant Engineering, City of Phoenix Water Services Department;Jill Celaya, Budget Supervisor, Management Services, City of Phoenix Water Services Department;Andy Terrey, City of Phoenix Water Services Department, Project Coordinator, Distribution and Collection Engineering - Personal Communication 2007
23rd Ave - - - 50.0 63.0 - 75-80 cents/1,000 gallons (just O&M)
-Wastewater rates only Contract Rates - - - - -
91st Ave (regional wwtp) - - - 130.0-140.0 180-5 mgd trickling filter, 45 mgd activated sludge Current expansion to 205 mgd)
- 75-80 cents/1,000 gallons (just O&M)
-Wastewater rates only - - - - - -
California Case StudiesMonterey County Water Recycling Projects
1998 - -Agricultural irrigation. -At 100% design for urban golf courses. -Conceptual stage for groundwater recharge. RW constitutes to 67% of agricultural use.
21.0-22.0 29.6 $78,000,000 $5,000,000-Current annual cost- $230,000 for about $40 million coverage in pollution contamination and $33 million excess general liability
-USBR 40 year low-interest loans. Annual debt service payments to USBR and State are about $4-5 million-SRF 20 year loan -Local bonds -Debt service ($40 million capital 10 years ago) is paid through property tax assessments-Operations costs up to secondary treatment are paid by MCWRA
'-Homeowners pay $11.25/year. Irrigation customers pay $287.87 per AF/year--Water Delivery Charge of $17.63/ac-ft.
- - - Revenues consist of Property Tax Assessment and the Water Delivery Charge designed to capture O&M costs.-
Bob Holden, Monterey Regional Water Pollution Agency (MRWPCA), Jim Slater, Monterey County Water Resources Agency - Personal Communication 2007; Keith Grand, Marsh Risk and Insurance Services - Personal Communication 2007Crook 2004; Holden 2007
Santa Rosa Subregional Reclamation System, Sonoma County
-1960s (agriculture)-early 1990s
(urban irrigation)-2003
(conveyance system to Geysers
steamfield)
- -Agriculture (85% of total irrigation)-urban landscape irrigation-recharge Geysers steam field for power generation
16.5 21.34-Expansion –
25.9 mgd
- $30,000,000 (1975-1985)-$ 2,000,000 (1990)-$6,000,000 (1994-1995)-$3,000,000 (1997)
$25,000,000 -Clean Water Fund Grant -The City of Santa Rosa-Revenue bonds-Gallo Wineries and the City-SRF loans and roughly 5% in small grants
-Small agricultural users (<100 acres) receive reclaimed water for free.-Urban irrigation customers pay 75% of potable rate. -Geysers signed a 30-year agreement to pay $75 million in capital costs and in return for 11 mgd.
- - - - Dan Carlson, Deputy Director of Sub-Regional Operations - Personal Communication 2007
South Bay Water Recycling (SBWR), Santa Clara County
1989 - -Agricultural irrigation-commercial and industrial cooling towers-manufacturing-several dual-plumbed buildings a-power
11010.0
(reclaimed water)
16750.0 (reclaimed
water)
-$22 million (Recent extension to power plant )
$5,300,000 -Title XVI ($28 million)-The City of San Jose-the Santa Clara Valley Water District-Cal Pine
-Irrigation Rate = $310/ac-ft ($165/ac-ft discount)-Industrial & Agriculture Rate- $110/ac-ft ($365/ac-ft discount)-Whole sale rate of $475/ac-ft
- - - - Eric Hansen, City of San Jose Environmental Services Department - Personal Communication 2007
King County Reclaimed Water Feasibility Study Page 3 of 4 Appendix J

King County Reclaimed Water Feasibility StudyAppendix JSummary of Case Studies
Project Year Recycled Water Type
Uses Average Daily (MGD)
Design Capacity (MGD)
Construction Cost O&M Cost Funding Sources Monthly Rate Connection Fees
Monthly Rate Connection Fee
Notes ReferencesWastewaterReclaimed WaterFlow
West Basin Municipal Water District, Los Angeles County
1995 - Landscape irrigation, industrial cooling and boiler feed water, commercial applications, and groundwater recharge
24.0 52.0 $365,000,000 $14,899,000 -WBMWD revenue bonds-USBR grants -low interest State loans for Phase I ($200 million)-Army Corps pays 75% of pipeline projects
Imported water sold at $510/ac-ft. RW rates vary depending on level of treatment.
- - - - Joe Walters, PM of RW - Personal Communication 2007
Florida Case StudySt. Petersburg, Pinellas County 1977-87 Landscape irrigation,
including 10,000 residential accounts; fire protection (backup only); cooling water; reclaimed water not sold is deep well injected
20.0 42.0 $135,000,000 $5,200,000 - EPA ($100 million), the City ($20 million), Voluntary Assessment Program and subsidy from the City’s water and wastewater utilities.-O&M expenditures subsidized by City's water and wastewater utilities, each paying half.
-$14.36 for the first ac-ft.-$8.22 each additional ac-ft
- -$8.98 + $3.44/1000 gallons
- -Current Residential Water Ratef: $7.57/month + [$1.05/1,000 gallons (up to 2,400 gallons) + $1.74/1,000 gallons (next 2,400 gallons) + $2.97/1,000 gallons (next 7,000 gallons) + $4.48/1,000 gallons (over 15,000 gallons)] + $1.69/1,000 gallons (Tampa Bay Water charge)
Evelyn Rosetti - Personal communication 2007
King County Reclaimed Water Feasibility Study Page 4 of 4 Appendix J

Appendix K Stakeholder Program Summary

Reclaimed Water Feasibility Study K-1
Appendix K Stakeholder Program Summary
Reclaimed Water Public and Stakeholder Opinions, September 2007 Introduction King County Council Ordinance 15602 passed in September 2006, directs King County’s Department of Natural Resources and Parks (DNRP) to complete a feasibility study concerning development of a reclaimed water program by December 2007. In addition to other study criteria, DNRP is required to conduct a comprehensive regional market analysis. This memorandum summarizes King County’s stakeholder outreach efforts to collect input from reclaimed water briefings and presentations. King County reached out to county water purveyors, jurisdictions, and utilities located within King County, business and agricultural representatives, and conducted public focus groups to engage stakeholders in reclaimed water discussions. This report details general and specific information presented during outreach encounters, and assesses the understanding, broad concern and support about the potential use of reclaimed water in King County. Background The history of King County’s reclaimed water program and the environmental ethic demonstrated by King County residents provide important input and context for understanding people’s opinions about reclaimed water. History of Reclaimed Water in King County 1997 Since 1997, King County’s existing treatment plants, South Plant in Renton and West Point in Seattle’s Discovery Park have produced and used reclaimed water. It is used as process water for operations at both plants in lieu of potable water. The South Plant also uses Class A reclaimed water for on-site irrigation, as well as piping it to irrigate nearby sports fields. 1999 The Regional Wastewater Services Plan, adopted by the King County Council in 1999, highlights specific policies regarding water reuse. A significant component of the plan calls for the County to expand production and use of reclaimed water over the next 30 years. 2001 Reclaimed water was a key criterion in the Brightwater siting process. The specific criterion stated that “King County shall seek NTF sites that provide opportunity for water reclamation and reuse.” (North Treatment Facility, or NTF, was the terminology used prior to the name Brightwater.)

Appendix K. Stakeholder Program Summary
K-2 Reclaimed Water Feasibility Study
The Brightwater policy siting criteria were based on public comments that were refined by a 24-member siting advisory committee chosen from all sectors in King and Snohomish Counties. The King County Executive reviewed the committee’s suggestions before transmitting them to the King County Council who reviewed and revised the policy siting criteria and adopted them in Ordinance 14043 in February 2001. 2002 MBR treatment technology is selected for the Brightwater Treatment System and Carnation Treatment Plant because it will protect receiving waters by creating cleaner effluent than conventional treatment processes. MBR can treat water to meet Washington State’s strict reclaimed water standards which means it is safe for many uses in industry and irrigation. 2004-2007 From 2004 to 2007, the County continues to communicate and gather input from the public and stakeholders through meetings, events, briefings and focus groups, as well as various government agencies and local water and sewer districts. The results of these efforts demonstrate broad general support for reclaimed water use and specific concerns that must be addressed. Environmental Ethic Part of assessing reclaimed water’s potential in King County is understanding how people value it and the opportunities it presents. The environmental ethic in the Puget Sound region gives some context for this discussion. Residents of King County and Seattle (the County’s most populous city), have also pledged to be good stewards of the environment, and even volunteer to pay more for basic services, if it will protect the environment. Examples include the 100,000 Seattle City Light customers who have signed up to participate in the Seattle Green Power program since January 2002. Through this program, these individuals agree to pay higher monthly utility bills so their power is supplied through renewable sources including wind, solar and hydro power. In 2006, Washington State voters passed Initiative 937 requiring large utility companies to obtain 15 percent of their annual energy load from renewable energy resources by 2020. Recent years have also shown increased concern for the decline of the fresh and marine waters of Puget Sound due to industrial pollutants, land use and the potential increase of effluent discharge. In the spring of 2007, Governor Christine Gregoire convened the Puget Sound Partnership with representatives from statewide environmental, scientific, and other interested organizations in an effort to protect the water and shorelines of Puget Sound. Reflecting strong public interest in the environment, King County has become a leader in this area. King County is a leader in regional global warming initiatives such as the Cool Counties Climate Stabilization Initiative, and its commitment to reducing carbon emissions to 80 percent below current levels by 2050. The County is also instrumental in efforts to help restore Puget Sound and salmon recovery efforts. The County’s Water Conservation Program has saved more than 43 million gallons of water through partnerships with government agencies, businesses, and nonprofit organizations.

Appendix K. Stakeholder Program Summary
Reclaimed Water Feasibility Study K-3
A review of literature and stakeholder feedback indicates that many people think increasing the use of reclaimed water for irrigation and industry fits logically within this environmental ethic. In 1992, the Washington State Legislature passed the Reclaimed Water Act, Chapter 90.46, to encourage and facilitate reclaimed water use, provide new basic water supplies to meet future needs, protect public health and safety, protect and enhance our environment, gain public confidence and support for reclaimed water and find cost-effective solutions. In 2007, legislation reaffirmed the commitment to reclaimed water and recognized the importance of the following benefits of reclaimed water use: consistent, reliable water supply as Washington faces climate change challenges, reduced discharge of treated wastewater into Puget Sound, more water in our rivers and streams for salmon recovery, and more effective management of the Columbia River's water.
Public and Stakeholder Process For the feasibility study, King County used a range of tools to understand public and stakeholder opinions including a statistically valid phone survey of random residents, in-depth focus group discussions with randomly selected participants, and interviews with public agencies and water and sewer districts. The County also looked at recent input from other efforts including a 2006 Reclaimed Water Technical Committee, letters received in 2005 regarding the Brightwater Backbone, a specific reclaimed water project, and a 2007 conference on reclaimed water in Washington State that included a “Statement of Support”. Public Input Focus groups In late April and early May 2007, King County’s Wastewater Treatment Division conducted four focus group sessions to gauge public perception of reclaimed water and to gain a stronger understanding of potential agricultural and business interests. Participants of the public focus group sessions were recruited randomly from areas near the Brightwater Reclaimed Water System and the South Treatment Plant. A total of 21 people participated in these sessions, giving input on their familiarity with the concept of reclaimed water, their comfort level with its potential usages, and their concerns for implementation. Ideas on effective methods of educating and creating awareness about reclaimed water were also gathered during the focus group sessions. The results demonstrate that there is support for the County to implement a reclaimed water system and that there are many questions that need to be answered. Many of the participants felt the environmental benefits of such a system would be a primary reason for support. Some participants admitted to being relatively unfamiliar with the concept at the beginning of the focus group. In the public focus group sessions, there was a substantial increase in acceptance of reclaimed water once participants learned of its success in other parts of the country. The increased support for reclaimed water by the end of the focus group session suggests the importance education could play in expanding reclaimed water to the region. All participants

Appendix K. Stakeholder Program Summary
K-4 Reclaimed Water Feasibility Study
agreed that adequate outreach and education would be necessary for public support of the County’s plan. Safety was a primary concern of focus group participants. They felt that credible data from an unbiased third party would help to gain public acceptance of such a system. Representatives from the agricultural focus group session also recognized the importance of providing information to satisfy public health and safety concerns. While the farmers agreed that reclaimed water could have a role within the agricultural system, they insisted upon extensive safety testing. They felt they could not take the risk of growing their agricultural products with reclaimed water unless their customer base was confident that it was safe. As the individuals learned more about the practical and successful uses of reclaimed water, their concern shifted from safety to economics. Participants from the public focus groups wanted to know who would pay for the water source and its maintenance as well as how taxpayer dollars would be impacted. Farmers and business owners wanted cost comparisons of potable versus reclaimed water as well as the cost of constructing piping and transporting water to their farms. They felt that reclaimed water rates should be less expensive than potable water rates.
Public surveys King County’s annual Water Quality Survey gathers input from 400 randomly selected county residents. Results from the 2006 survey showed that 82% of those interviewed demonstrated support for reusing as much wastewater as possible for a variety of purposes. Furthermore, 70% of the interviewees had no concerns about applying reclaimed water for a variety of uses. These findings suggest strong support for the County to take advantage of the opportunity to introduce reclaimed water as a viable new water source. The survey further shows that public support for the environment and the region’s native species, policies and programs that protect and preserve the rivers, lakes, streams, and oceans as well as the animals living within these bodies of water. The results from the public surveys also show residents are worried that the environment is more threatened in 2006 than in years past. The majority of those interviewed (78%) said they would be willing to pay at least $1.50 more per month on their sewer bills to reduce the level of effluent released into Puget Sound each year. Nearly all those in favor of improved environmental plans for the region (72%) said they would pay more money each month on their sewer bill so that the County could build a reclaimed water system. Agencies and Water and Sewer District Input As part of King County’s stakeholder outreach effort, staff in the Wastewater Treatment Division conducted 19 interviews with various government agencies and water and sewer districts to discuss benefits, drawbacks, and decision-making factors regarding reclaimed water. In addition to the stakeholder interviews, many government agencies submitted letters of support for implementing a reclaimed water program. Agency input from letters and interviews demonstrate both support and opposition for reclaimed water efforts.

Appendix K. Stakeholder Program Summary
Reclaimed Water Feasibility Study K-5
Stakeholder interviews In 2007, 19 interviews were conducted with component agencies, water and sewer districts and utilities, cities and other jurisdictions (See the stakeholder interview matrix in appendix K-1). The various agencies shared their thoughts about the benefits and drawbacks for reclaimed water, the drivers for building a regional reclaimed water program, decision-making factors, and existing challenges. Stakeholders considered the primary benefits to be water conservation, increased water supply, reduced levels of discharges into Puget Sound and other waterways, offsetting peak consumer demands and general environmental benefits. Drawbacks stated included cost, reclaimed water quality, endocrine disrupting chemicals, and communicating the benefits to a generally suspicious public. When asked to prioritize decision-making criteria including economics, environmental benefits, water quality, and social factors all those interviewed chose economics as the number one constraint in supporting reclaimed water. Many agencies echoed the feedback heard through focus groups with the public such as the need for credible, unbiased data to demonstrate that reclaimed water is safe to use, and that environmental benefits must be demonstrated to justify costs. Agencies also indicated that the cost, public perception, and the debate over how to implement the system and share costs are the largest challenges facing implementation of a reclaimed water program.
Reclaimed Water Technical Committee: The Washington State Reclaimed Water Use Act requires regional water supply planning in the state of Washington to consider the opportunities for use of reclaimed water, particularly if the use of reclaimed water will augment or replace the need for potable water. (Ch. 90.46.120 RCW). In February 2005, King County and the Cascade Water Alliance signed a Memorandum of Understanding on water resource and water supply planning, which led to multi-party scoping for regional water planning. Planning was initiated in October 2005, with a multi-year schedule for studying water resource conditions and management approaches related to meeting the combined needs of water for people and fish from all available sources, including reclaimed water and conservation. This regional water supply planning process is an effort to develop substantive technical information regarding current and emerging water resource management issues in and around King County. The work of this planning process is expected to produce information and recommendations in seven topic areas: water demand forecast, water supply assessment, climate change impacts, reclaimed water, tributary stream flows, source exchange strategies, and small water systems. Technical committees were formed to focus on these seven topic areas. King County convened a self-selected reclaimed water technical committee that included representatives from cities, water and wastewater utilities and agencies, and the state Department of Ecology. This committee defined their purpose early on to identify a uniform framework that could be used to evaluate the full economic, environmental, and social benefits and costs of potential projects.

Appendix K. Stakeholder Program Summary
K-6 Reclaimed Water Feasibility Study
Committee members expressed opinions ranging from support to concern over the development of a reclaimed water program by King County. Members identified benefits that could result from a reclaimed water program, including a reduction in the amount of effluent released into Puget Sound, potential to reduce the amount of irrigation water drawn from salmon-bearing rivers and streams, conservation of the existing water supply, and increased security for the region in times of future droughts. Some of the barriers discussed by the committee include the cost of infrastructure and treatment, the policy issues regarding water rights, and water quality testing to ensure the water has met the necessary safety criteria. The committee met ten times during 2006 and focused upon identifying many of the regional benefits and barriers to reclaimed water use, accumulating data about potential users, and identifying and evaluating a framework published by the national WateReuse Association that is designed to evaluate the environmental, social, and economic benefits of potential reclaimed water projects. Letters A number of letters were submitted to King County in 2005, after the County developed a proposal for the Brightwater Reclaimed Water System (Backbone). Although they were written about a specific project, the letters also give information about the level of support for reclaimed water programs in general from organizations such as People for Puget Sound, the Washington State Department of Ecology, and local government agencies and jurisdictions including the Cities of Bothell and Tukwila, and the Covington Water District. Agencies that submitted letters are interested in reclaimed water efforts to reduce effluent discharge to Puget Sound and to add another component to future water supply planning. On November 17, 2005, Kathy Fletcher, Executive Director for the People for Puget Sound, submitted a letter of support for a reclaimed water system. “We strongly support water reclamation as preferable to increased storage or additional supply development and believe that we must make tough decisions now to prepare for the future.” Historically, there has been political support for the use of reclaimed water at the state level. In 1992, the Washington State Legislature passed the Reclaimed Water Use Act. Through this bill, the state legislature demonstrated its support for recycling water while still assuring the health and safety of residents as well as the environment. In 2006 and 2007, the legislature directed the Departments of Health and Ecology to develop standards for reusing treated wastewater from treatment plants and to encourage development of water reclamation infrastructure. In November 2005, a letter in support of reclaimed water was written from the Department of Ecology to King County’s Department of Natural Resources. “Ecology Director Jay Manning believes that the current approach to reclaimed water is underutilized. While economic forces alone are unlikely to create a market for reclaimed water, Ecology is prepared to work with proponents of reclaimed water to realize opportunities for its application and to make it more competitive.” Local agencies and jurisdictions as well as tribal governments also submitted comments to King County. The Covington Water District has indicated support and has requested that King County consider siting a satellite facility in their jurisdiction. The Comprehensive Plans of the cities of Kent, Bothell, Redmond, Sammamish, and Woodinville all directly or indirectly support the use of reclaimed water. The Muckleshoot Indian Tribe Fish Commission also indicated support for reclaimed water efforts because of stream and habitat benefits. In a letter dated October 25, 2005 they wrote, “The Muckleshoot Indian Tribe Fish Commission would like to reiterate its support

Appendix K. Stakeholder Program Summary
Reclaimed Water Feasibility Study K-7
for reclaimed water as a tool to help reduce impacts to salmon habitat. For many years, the Tribe has advocated the use of reclaimed water and water conservation to offset existing and expanded water withdrawals. Reclaimed water, along with expanded conservation measures, can be used to help leave more water in our rivers and streams for fish.”
Reclaimed Water Statement of Support
A further demonstration of support for the use of reclaimed water in Washington State is the Reclaimed Water Statement of Support initiated at the Washington State Reclaimed Water Conference in June 2007. The Washington State Departments of Ecology and Health, King County, the WateReuse Association, the LOTT Alliance, Spokane County, numerous cities, and sewer, water, and utility districts, and many other public entities, organizations and individuals throughout the state signed the statement encouraging and promoting development and use of reclaimed water statewide. Conclusion King County’s stakeholder outreach effort offered the County insight into implementing a regional reclaimed water program that directly informs the Reclaimed Water Feasibility Study. Several themes emerged from discussions with local agencies, sewer and water districts and utilities, agricultural and business interests and the general public:
• Cost is an important factor in decision-making for agencies as well as the public. It will be important to demonstrate the actual cost of reclaimed water as well as the benefits.
• Outreach efforts with stakeholders suggest environmental benefits of reclaimed water are a primary reason for support of the program
• While there is consensus about significant environmental benefits such as protecting fish, cleaning up Puget Sound, and using reclaimed water in lieu of potable and drinking water, cost is still the most important consideration
• Credible research must be provided in order to substantially address the health and safety concerns of stakeholders.
• The cost, public perception, and the debate over how to introduce and fund a reclaimed water system are the major challenges to implementing such a program.
Reclaimed water is a concept with the potential to be available and useful in King County. Input from county stakeholders suggests there is significant support behind such a system, but there are particular concerns needing to be addressed in order for reclaimed water to be successfully implemented.

APPENDIX KSTAKEHOLDER PROGRAM SUMMARY
STAKEHOLDER OPINIONS MATRIX
5 years 10 years 30 years Conservation Goals Industry Instream Flows Source Exchange Irrigation Sustainability Wetlands Migration Water Supply Other Economics
noneregionally, not in district
regionally; district dependent on facility location/costs
not adverse to RW but want satellite plants instead of BW
building purple pipe throughout KC not feasible
Toilet rebates popular; can meet goals w/o RW
Local industry; business park no no no no n/a no; in good shape
watching Woodinville's project for outcomes #1 factor in making decision
need by 2013 continue to use continue to useconservation, upstream flows, wetlands mitigation
EDCs (not enough info) costs but quantitative offset top priority
waiting on WA regulations another top priority none possibly parks possibly yes development a factor
city might have differing views about environmental benefits highest concern
none wait and see for land useincrease water supply if used with satellite plants
EDCs, cost-benefit; duplicating transmission lines
impact on single-family irrigators
golf course, small use in parks possibly but concerns
possible with more information
might mandate for new golf courses
premature to con-sider for environ not aware of any
potential for aquifer recharge
not enough known about RW & climate change
Highest concern/most influential factor
current plans increase as able likely regional needs for RW replaces potable suppliesCost; building infrastructure to connect to system yes yes no no yes yes yes eventually; not currently
KC in negotiations with city for large-scale RW use benefits could mitigate costs
none nonemaybe for parks or center medians would save Snow Pack smell, public perception
wait and see what other jurisdictions are deciding
none; no need in small jurisdiction no no Maybe Parks wouldn't affect goals no supply none given if saved $ on potable
noneenough time to implement
wants RW now; is advocate for use
keeps discharge out of streams; irrigation use
As potable rates increase RW use up if fiscally sound
could cut back on potable if used RW process water
meet instream flows through SPU
same as instream flows
golf courses but too $ to pump uphill
goals are informed by SPU direction future issue
growth, climate change and water rights
look at stranded costs, make it cost-effective
wish this wasn't a high factor but it is
none none regionallyreliability, green power; asset for irrigation, industrial supply
how to sell to public aware of EDCs; high cost updating Comp Plan no
if high enough water quality no yes n/a n/a growth a factor
RW could stretch limited water rights; increase # of customers Number one priority
too soon depends on costyes if skimming or main distributed
offset peak demands of outdoor watering
Sees as "treated sewage" against use near children reduce peak flows
Timing for RW use re: land use no no outdoor watering
could help meet council goals no no none
want cost benefit <1; with environmental costs
too soon yes; new sourceneed re: climate impacts, development
Reliable; replaces freshwater; Master Plan will explore
EDCs and other unknowns; not enough research yes
Industrial park could use ASAP no no
RW replace freshwater supply
RW not in current goals yet exploring RW use
current & future growth depletion
Need skimming plants for most beneficial use
Understand significant start up costs
none noneregional systems; replace existing pipe w/purple pipe
If using RW increases potable supply want green credits
EDCs; pesticide use by farmers; raises river temp
Goals met with low impact development no no
worry about RW raising water temp
golf courses but too $ to pump uphill no no
yes; growth built out might need RW
might lay purple pipe if replace water pipes
skimming plants better approach than BW
none nonemaybe regionally if cost-effective source
Eliminates need for supplemental source cost ratepayers too much upfront Doesn't fit with current goals none none none no large irrigators no none not applicable to our needs none given First priority
none none aquifer recharge if legal"perceived" env/ecological benefits cost, quality, EDCs follows SPU direction none no no none not included in goals no
ludicrous to doubt SPU's supply
if climate change driver would look at de-sal first cost #1 driver
none small 5-10 mgd noneCost, people won't support; no "green ethic" in Seattle COST (x 3)
If less costly than potable n/a no most likely use
What does that word mean? n/a no none given Cost is only consideration
not feasibleclose to source (Boeing plans) regionally in a huge way
environmental benefits should be priority with all
High costs to convey from plant (located too far away)
want it to meet peak demands uses by major industry
Maplewood & Cedar River no
most problematic demand no future issue
future issue; know it's coming
Explore geographically advantageous distribution lines
yes but development will push use
nonesmall if cost-effective
regionally but skimming facility best frees up drinking water
cost; don't want to see used for aquifer recharge yes no except for gravel pit no
mitigation but KC closed basin possible no haven't explored
no; part of Cascade Water Alliance
would consider RW from reverse osmosis Primary
little to none very littleSPU has water for 60 yrs; won't consider for 30 - 40 very few current benefits extremely high costs; EDCs perhaps but not for long time not a current driver ultimately possible not a driver not a driver
far from clear if RW would do this not a driver
Improving Puget Sound water quality is a driver
Will continue to keep open mind toward RW use
extremely more expensive than potable
Exploring since 1992
Comp Plan directs use
We WILL operate skimming plants
stretches water supply; good quality effluent w/high nutrients
EDCs, lost revenues; higher fees for users
yes; Comp Plan explored using RW to meet goals none worried about EDCs EDCs cause worry yes (but none given) yes no
Water supply fine; RW is beneficial Will pay if owns own sewage
Identified use sites
always look for new opps
used significantly throughout region
quality nutrients, "right" use of resource; high green ethic yes yes no no yes yes no
saves supply whether need is present or not
Believes KC should already be supplying RW
always a consideration but benefits outweigh
Have homegrown MBR for septic system Main driver
DriversProjected UseBenefits Drawbacks
Page 1 of 2

APPENDIX KSTAKEHOLDER PROGRAM SUMMARY
STAKEHOLDER OPINIONS MATRIX
Environment Water Quality Social Factors Other
no no noyes; cost, EDCs (people already have knowledge)
can't access infrastructure without KC subsidy
qualified yes; golf course but only if package plant public perception; cost
opportunity to support Environmental Plan
want to maintain current high quality population and land use mitigation
want skimming plant option & backbone from south plant
EDCs, negative public perception due to lack of education Golf course, Boeing plant Large scale recreation
cost; infrastructure; ability to site skimming plant MasterBuilders can't think of any
Need mass media education campaign; explore hauling RW to sites before extending infrastructure
would considerconsider but hard to convince public
player down the road; RW technology may improve making it cheaper to use
Critical Areas Ordinance meets stewardship needs
EDCs, health implications, cost, water quality, does it help environment?
Some areas have their own water right golf course
cost, no infrastructure; public perception potential end users
Drivers not vetted; survey with valid questions
Saw Solid Waste skew survey questions to get what they wanted; afraid RW team will do the same
yes yes will review public survey information to identify drivers
Abandoned city water lines as potential conduits
will coordinate with city for public outreach campaign none stated industrial, business park, wetlands
Connecting to distribution line; funding (will seek grants, other money w/KC) Prepare info for city councils
Explore RW "filling station" w/automatic card reader
potentially public perception would driveanticipating more land tagged for parks development
negative perception; costs for re-plumbing; long-term costs a factor for small cities
no industry; maybe a cemetery or a small lake
Might replace golf course drawing from lake
small jurisdiction, mostly residential; not likely to need RW schools
how it's paid for -- will state contribute?
Familiar from living in St. Pete, FL; totally support RW use, just not applicable to small town far from source
Storage augments potable; rates rise w/fixed costs Don't hide data from the public
population growth and land use likely factors would like to see RW use progress
health issues; financial feasibility; perceived water rich environment
Newcastle Golf Course, brick plant, city parks
wells; lake pumping for lawns, boat lifts
Debate over who pays and who owns the sewage none
Why those who won't benefit paying for BW
KC not drinking another system's wastewater; BW fantastic idea but cost is prohibitive
Especially use for benefit to fish, wetlands must ensure water quality population growth follow Rules Advisory Committee
Trust; EDCs; water quality; liability; selling against "water rich" perception Golf course, industry
District plan can't use sewage; would have to be pumped for most non-potable users
Exec should meet w/Council, Exec
How to keep cheap with liability; Codes
some people region can dig exempt wells; abuse of this permission leading to increased aquifer depletion
evaluate quantifiable benefits acceptance critical thru public ed noDetermine who owns sewer prior to RW use
cost (include potable water offset; promote environmental stewardship
peak jumps; parks; some potential users have own wells
City parks; industrial; some environmental mitigation See "barriers" column New high school personnel;
Show public full costs; prove env benefits
Airtight, unbiased feasibility study; exec summary to their Council; need enterprise fund (separate from agencies)
env benefits; improves salmon spawning water quality currently not issue;
Growth/development major concern;
Imminent use for aquifer recharge, wells, wetlands
educate & inform public; dwindling freshwater supply will help convince
With RW use domestic water may last "forever"
self-supply golf club may consider; future city water needs
public worried about exposure; will back RW when domestic supplies lessen can't think of any
Don't extend costs 20 yrs will box in new choices
Knows must share debt; on-site storage tanks at industrial park; can flush discharge to wetland, re-fill
no no no yesenergy issues w/pumping from BW; need small skimming plants
Sahalle service area but they have their own water
golf course, a few along the lake and valley
EDCs, cost; KC not reaching out to rural area customers; seen as heavy handed Exec-to-Exec discussions
explore feasibility of small skimming plants
wells/groundwater users using district system as redeveloped; no feasibility study on BW; who pays?
yes, if proven that it protects fish yes, if promotes water quality
no; long-term supply contracts fix quantity & will cover potential growth
If legal mandate of course would use RW
Economics #1 barrier; People have psychological aversion to idea of RW
None; Golf courses have Lk Washington water rights All have enough water already
Irrigation requires new costly delivery system; not feasible unless cost-effective Talk to major irrigators
Who will pay to make it cost-effective?
not convinced RW benefits environment; may harm
SPU water high quality; don't need RW
The factors are figured into SPU long term outlook
EDCs, perception of water quality; aesthetics (ick factor) none Possibly a cemetery public perception City of Edmonds Would you use by choice
KC ahead of its time promoting RW; DNRP/WTD responding to political pressure
no no
No data proving climate change; man didn't cause, doesn't have to fix it
Soil better for absorbing EDCs; should not discharge RW none
Not supplying golf course "somebody" else is
explain to public the true cost of RW (don't ask if willing to pay extra on sewer bill) sewer rate payers explain why we're paying for BW
RW too expensive so will encourage illegal pumping from rivers
Absolute priorityWant highest quality RW, Class A (?)
Can overcome public barriers through education and demonstrated need
want to use; prior plans not implemented
marketplace won't accept cost until driven to do so; EDCs, who pays for monitoring
92 study identified Longacres as likely to benefit from replacing
city park next to high volume development; industrial uses
building infrastructure; plant location too far away; other logistics
Council & public officials, Boeing Use for fire response;
Need to evaluate potential customers every 6 yrs. Could RW ever be cheaper than potable?
maybecould reduce impacts to GW quality
acceptance by public a huge obstacle
parents unglued when mention use for playgrounds evidence of safety
small -- maybe for irrigation if need shown carwashes golf courses
who pays? Cities think it should be free; it's a sewer cost; Environmental groups
determine economics of making it work
BW too costly to transmit water; decentralized skimming plants cost effective
lack of proven environmental benefits unknown impacts of EDCs
population growth not driver; additional water supply not needed
proven water supply need; resolve public perception of RW
golf courses, cemeteries, industrial process users
some golf courses, cemeteries; industrial
cost; lack of infrastructure; lack of proven need; negative public perception
potential users & retail customers
What would RW use solve? What benefits?
Much more cost-effective and efficient ways to reach same and more results as RW
EDC research must prove benefit Existing water supply high quality
RW never cheaper than potable; it's a valuable resource
Observing Carnation permitting; WA lagging in clear-cut regulations
have to "stage" introduction and don't make them pay all at once or will have revolt jr/sr. schools; city parks
possibly some private corporations
securing funding for yet another utility; infrastructure; fight for sewage ownership
Good that you're talking to utilities Why KC is pushing RW
Used in other parts of country; KC should not own sewage
RW use supports green ethicEcological and health benefits important
land use; provide quality recreation for residents;
Public education, information promotes acceptance
yes, though mainly used as green option agrees 100% with using
Ready to contract to use RW for irrigation
Usual public acceptance barriers Explore decentralized RW production
Anything else we should ask? Other CommentsReplace / Supplement Existing Supplies
Current potable users as potential RW users Challenges to Use Anyone else we should
meet with?Barriers to Public AcceptanceFactors
Page 2 of 2