Embed Size (px)
Citation preview
Recent advances of genome mapping and marker-assistedselection in aquaculture
Gen Hua Yue
Molecular Population Genetics Group, Temasek Life Sciences Laboratory, 1 Research Link, National University of
Singapore, Singapore, 117604, Singapore
AbstractAquaculture is the fastest growing sector in agriculture. Substantial genetic gains
have been achieved in a few cultured species using conventional selective breeding
approaches. However, the majority of fish and shellfish species remain in their wild
state. Due to the recognition of the enormous potential of marker-assisted selection
(MAS) to speed up genetic gain through early selection, aquaculture scientists have
constructed linkage maps in over 40 species and mapped quantitative trait loci
(QTL) for important traits in over 20 species since the 1990s. Although MAS and
genomic selection (GS) have not been widely used in aquaculture, their application
in breeding programmes is expected to be a fertile area of research. In this paper, I
summarized the recent advances of linkage and QTL mapping, as well as MAS in
aquaculture species. I also discussed the potentials of genome-wide association
studies (GWAS) and GS in aquaculture species.
Keywords Fish, genome mapping, GS, GWAS, MAS, QTL
Correspondence:
Gen Hua Yue,
Molecular Population
Genetics Group,
Temasek Life Sci-
ences Laboratory,
1 Research Link,
National University
of Singapore,
117604 Singapore,
Singapore
Tel.: 65-68727405
Fax: 65-68727007
E-mail: genhua@tll.
org.sg
Received 29 May
2012
Accepted 30 Dec
2012
Introduction 2
Linkage mapping 2
DNA markers and genotyping 2
Reference families for linkage mapping 3
Linkage analysis of markers 4
Status of linkage mapping 5
Mapping of quantitative trait loci 5
Important traits in QTL analyses in aquaculture species 5
Families for mapping QTL 6
Methods to detect QTL 7
Software for QTL mapping 7
Factors affecting QTL analysis 7
Status of QTL mapping in aquaculture species 7
QTL mapping in tilapia 8
QTL mapping in Atlantic salmon 8
QTL mapping in rainbow trout 8
QTL mapping in Asian seabass 9
QTL mapping in Japanese flounder 9
© 2013 Blackwell Publishing Ltd DOI: 10.1111/faf.12020 1
F I SH and F I SHER I E S

QTL mapping in Kuruma prawn 10
QTL mapping in Pacific oyster 10
Marker-assisted selection 11
Conclusions and future directions 12
Acknowledgements 15
References 15
Introduction
There are over 30 000 teleost fish and hundreds
of thousands of shellfish species on earth. Accord-
ing to the recent FAO estimate, only <400 species
have been cultured, of which carps, tilapia and
oysters have the largest worldwide production.
Fish genetics programmes became more prevalent
in the 1900s due to the development of knowledge
of breeding and inheritance. Selective breeding
programmes for genetic enhancement began in
the 1960s (Gjedrem and Baranski 2009). Until
now, selective breeding has been conducted for
over 60 fish and shellfish species (Gjedrem and
Baranski 2009). However, some important traits,
such as disease resistance, feed conversion rate
(FCR), fatty acid profiling and flesh quality are dif-
ficult to measure on selection candidates, but have
major effects on the productivity and profitability
of many aquaculture species.
With the rapid development of sequencing tech-
nologies, it is now easy to detect and characterize
a large number of DNA markers in species of
interest using next-generation sequencing and
polymerase chain reaction (PCR). Large numbers
of codominant DNA markers, such as microsatel-
lites, have been identified in major aquaculture
species (Liu 2011), Linkage maps have been con-
structed for some important aquaculture species
since the first report of the linkage map of tilapia
(Oreochromis spp., Cichlidae) in 1998 (Kocher et al.
1998). The availability of linkage maps makes it
possible to identify quantitative trait loci (QTL) for
important traits on the whole genome of the spe-
cies of interest to assist the selection of desired
traits. QTL for important traits (e.g. cold and salin-
ity tolerance, sex determination, growth traits and
disease resistance) have been mapped in over 20
aquaculture species. A recent paper of marker-
assisted selection (MAS) in fish breeding schemes
(Sonesson and Meuwissen 2009) demonstrated
that MAS would be especially valuable for traits
that are difficult to record on the candidates for
selection such as disease resistance, fillet quality,
feed efficiency and sexual maturation.
Aquaculture genetics (Liu and Cordes 2004),
breeding programmes (Hulata 2001), DNA mak-
ers and their applications (Liu and Cordes 2004),
aquaculture genomics (McAndrew and Napier
2010) and the principle of marker-assisted breed-
ing schemes (Rothschild and Ruvinsky 2007)
have already been reviewed in detail. However,
the recent rate of advances of linkage and QTL
mapping, and MAS in aquaculture species has
been rapid and has not been summarized yet.
The aim of this paper is to summarize the recent
advance of genome mapping and MAS in impor-
tant aquaculture species and discuss the future
directions.
Linkage mapping
A linkage map is an ordered listing of genetic
markers located along the length of the chromo-
somes in the genome. Construction of a linkage
map requires four major components: polymorphic
markers, genotyping platforms, reference families
and software for analysis of linkage between pair-
wise markers and among markers.
DNA markers and genotyping
DNA markers are variable DNA sequences in a
genome that can be differentiated using biochem-
ical methods. Currently, two types of DNA mark-
ers, microsatellites (Weber 1990) and single
nucleotide polymorphism (SNP) (Wang et al.
1998), are the most widely used in linkage map-
ping due to their abundance, ease and high
throughput of scoring. The advantages and dis-
advantages of the two types of markers for map-
ping can be found in the review of Liu and
Cordes (2004). More recently, a new type of
DNA polymorphism, copy number variation
(CNV) was discovered in humans (Sebat et al.
2004). The application of CNV in aquaculture
2 © 2013 Blackwell Publishing Ltd, F ISH and F ISHER IES
Genome mapping and MAS in food fish G H Yue

just came into sight recently (Shirak et al. 2008;
Bai et al. 2011).
Microsatellites are short tandemly repeated
(1–6 bp) DNA sequences found throughout a gen-
ome (Weber 1990). Currently, due to the advent
of the next-generation sequencing technologies
(Metzker 2009), resequencing of a genome of
three giga bases (Gb) costs <1000 USD using the
Illumina’s Hiseq 2000. Microsatellites can be eas-
ily identified in genome sequences using software,
such as RepeatFinder (Volfovsky et al. 2001), Sci-
Roko (Kofler et al. 2007) and many more (see
review Sharma et al. 2007). There are a number
of approaches for genotyping microsatellites (Guic-
houx et al. 2011). Currently, most laboratories are
using DNA sequencers (e.g. ABI3130 and
ABI3730xl) for genotyping microsatellites. The
ABI3730xl genotyping platform is currently the
most-high-throughput platform for genotyping mi-
crosatellites.
SNP describes polymorphisms caused by point
mutations at a given nucleotide position within a
locus (Sachidanandam et al. 2001). A number of
methods for identifying SNPs in non-model organ-
isms have already been described in detail (Du
et al. 2010). Although whole-genome sequences
for the majority of aquaculture species are not
available yet (Liu 2011), it is now possible to
develop a large number of SNPs using next-gener-
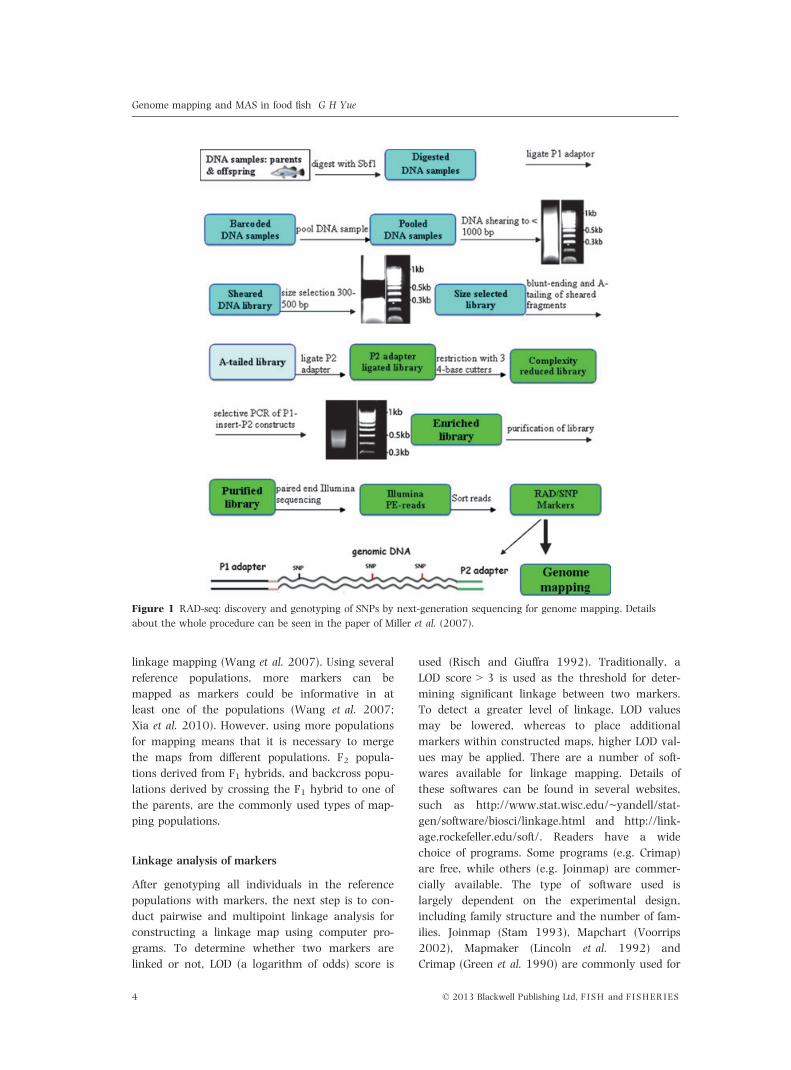
ation sequencing technologies (Miller et al. 2007,
2012; Davey et al. 2011), such as restriction site–
associated DNA sequencing (i.e. RAD-seq) (Fig. 1).
RAD markers are mainly SNPs which can be used
for linkage mapping (Le Bras et al. 2011). To use
the RAD makers for linkage mapping, it is impor-
tant to isolate RAD tags. RAD tags are the geno-
mic DNA sequences immediately flanking each
instance of a particular restriction enzyme cutting
site on the whole genome (Miller et al. 2007).
Once RAD tags have been isolated, they can be
analysed using bioinformatic tools to genotype
DNA sequence polymorphisms (Houston et al.
2012). Recently, the draft genome sequences of
two aquaculture species (i.e. Atlantic cod, Gadus
morhua, Gadidae and Pacific oyster Crassostrea
gigas, Ostreidae) have already been published (Star
et al. 2011; Zhang et al. 2012). The genomes of at
least 11 aquaculture species are being sequenced.
These species are salmon (Salmo salar, Salmoni-
dae), catfish (Ictalurus punctatus, Ictaluridae), Nile
tilapia (Oreochromis niloticus, Cichlidae), rainbow
trout (Oncorhynchus mykiss, Salmonidae), common
carp (Cyprinus carpio, Cyprinidae), grass carp (Cte-
nopharyngodon idella, Cyprinidae), large yellow
croaker (Pseudosciaena crocea Sciaenidae), orange-
spotted grouper (Epinephelus coioides, Serranidae),
half-smooth tongue sole (Cynoglossus semilaevis,
Cynoglossidae), Japanese flounder (Paralichthys oli-
vaceus, Paralichthyidae) and Asian seabass (Lates
calcarifer, Latidae). From these sequencing efforts,
a large number of SNPs is expected to be identi-
fied. There are over 30 different methods from six
technologies that can be used in genotyping SNPs
(Perkel 2008). In aquaculture species, several plat-
forms have been applied in genotyping SNPs (Liu
2011). Genotyping SNP using next-generation
sequencing technologies (Fig. 1) could be the most
cost-effective and high-throughput approach for
genotyping large number of SNPs and samples.
However, the total cost for genotyping a larger
number (e.g. 10 000) of SNPs in many (e.g. 200)
individuals is currently still quite substantial
(>75 000 USD). With declining sequencing costs,
it is expected that next-generation sequencing will
replace other platforms for genotyping of a large
number of SNPs in the near future.
CNV is a form of structural variation (Sebat
et al. 2004). CNV corresponds to relatively large
regions of the genome that have been deleted or
duplicated on certain chromosomes. As CNVs in
human were associated with a number of human
diseases, they are also potentially associated with
important traits in aquaculture species (Shirak
et al. 2008; Bai et al. 2011). Next-generation
sequencing enables the rapid identification of
CNVs (Mills et al. 2011). CNVs can be genotyped
using Taqman technology (Graubert et al. 2007),
microarray (Komura et al. 2006; Wang and
Bucan 2010) and next-generation sequencing
(Mills et al. 2011). Next-generation sequencing will
be the most attractive method for genotyping a
large number of CNVs in the next few years.
Reference families for linkage mapping
Constructing a linkage map requires one or more
reference populations/families where DNA markers
segregate (Wang et al. 2007). Population sizes
used in constructing a linkage map ranges from
dozens to a few hundred individuals. However, for
high-resolution mapping, a large number of indi-
viduals (>500 individuals) are required to detect
rare recombinants. F1 families generated by cross-
ing genetically diverse individuals can be used for
© 2013 Blackwell Publishing Ltd, F I SH and F I SHERIES 3
Genome mapping and MAS in food fish G H Yue
linkage mapping (Wang et al. 2007). Using several
reference populations, more markers can be
mapped as markers could be informative in at
least one of the populations (Wang et al. 2007;
Xia et al. 2010). However, using more populations
for mapping means that it is necessary to merge
the maps from different populations. F2 popula-
tions derived from F1 hybrids, and backcross popu-
lations derived by crossing the F1 hybrid to one of
the parents, are the commonly used types of map-
ping populations.
Linkage analysis of markers
After genotyping all individuals in the reference
populations with markers, the next step is to con-
duct pairwise and multipoint linkage analysis for
constructing a linkage map using computer pro-
grams. To determine whether two markers are
linked or not, LOD (a logarithm of odds) score is
used (Risch and Giuffra 1992). Traditionally, a
LOD score > 3 is used as the threshold for deter-
mining significant linkage between two markers.
To detect a greater level of linkage, LOD values
may be lowered, whereas to place additional
markers within constructed maps, higher LOD val-
ues may be applied. There are a number of soft-
wares available for linkage mapping. Details of
these softwares can be found in several websites,
such as http://www.stat.wisc.edu/~yandell/stat-
gen/software/biosci/linkage.html and http://link-
age.rockefeller.edu/soft/. Readers have a wide
choice of programs. Some programs (e.g. Crimap)
are free, while others (e.g. Joinmap) are commer-
cially available. The type of software used is
largely dependent on the experimental design,
including family structure and the number of fam-
ilies. Joinmap (Stam 1993), Mapchart (Voorrips
2002), Mapmaker (Lincoln et al. 1992) and
Crimap (Green et al. 1990) are commonly used for
Figure 1 RAD-seq: discovery and genotyping of SNPs by next-generation sequencing for genome mapping. Details
about the whole procedure can be seen in the paper of Miller et al. (2007).
4 © 2013 Blackwell Publishing Ltd, F ISH and F ISHER IES
Genome mapping and MAS in food fish G H Yue

linkage mapping in aquaculture species. For con-
structing high-density linkage maps, Crimap and
Joinmap may perform better, as they can handle
large data sets easily.
Status of linkage mapping
Although linkage mapping for aquaculture spe-
cies was initiated later as compared with other
agricultural animals, it has progressed substan-
tially over the last 25 years (Kocher and Kole
2010). In Table S1, I have summarized the sta-
tus of linkage maps in aquaculture species. Link-
age maps have been constructed in over 40
aquaculture species. Currently, linkage maps are
being constructed for other species, such as fresh-
water pearl mussel (Hyriopsis cumingii, Unionidae;
J.L. Li, personal communication). In several spe-
cies, such as tilapia (Lee et al. 2005; Guyon et al.
2012), catfish (Kucuktas et al. 2009; Ninwichi-
ana et al. 2012), Asian seabass (Wang et al.
2011b), Japanese flounder (Castano-Sanchez et al.
2010; Song et al. 2012), European sea bass (Vol-
ckaert et al. 2007), salmon (Lien et al. 2011) and
rainbow trout (Rexroad et al. 2008; Palti et al.
2011, 2012; Guyomard et al. 2012), second gen-
eration linkage maps are already available. Map-
ping of more codominant markers onto the
linkage maps is ongoing for a number of species.
Although linkage mapping has progressed rapidly
in aquaculture species, several problems still exist.
Firstly, as shown in Table S1, most linkage maps
were constructed using both dominant (e.g. AFLP
& RAPD) and codominant markers (mainly mi-
crosatellites). The maps based on dominant mark-
ers are not as useful as those constructed with
codominant markers, as dominant markers are
not easily transferable between different laborato-
ries. Secondly, the reference families used for link-
age mapping are rather small, ranging from 41
to 192 individuals. The small reference family
could make the ordering of DNA markers diffi-
cult. Thirdly, the density of most linkage maps is
still very low, although it is already smaller than
20 cM and enough for a preliminary QTL analy-
sis. Fourthly, in some species (e.g. common carp,
half-smooth tongue sole), different researcher
groups constructed several linkage maps using
different markers and different reference families,
and only very few markers were common among
these linkage maps, making the merge of these
maps an uphill task. Some sort of coordination
among different researcher groups working on
linkage mapping of the same species is required
to avoid repeated work and wasting resources. It
is also of note that in shrimp, prawns and crabs,
and clams, oysters and mussels, the construction
of linkage maps using microsatellites is problem-
atic because microsatellites in these species are
usually very difficult to genotype (Scarbrough
et al. 2002). Genotyping difficulties include non-
amplification of one of the two alleles at a given
locus and large slippage effect. These difficulties
are probably due to the very long repeats of mi-
crosatellites, and null alleles resulting from high
mutation rates in primer binding sites in the
flanking regions of microsatellites in these species
(Scarbrough et al. 2002). Other codominant
markers (e.g. SNPs) may be the better markers
for constructing linkage maps in these species.
Mapping of quantitative trait loci
Most economically important traits such as
growth, flesh quality and disease resistance are
controlled by a number of genes, environmental
factors and their interactions. The underlying sin-
gle genes usually have small effects. QTL are chro-
mosomal regions (single gene or gene clusters)
determining a quantitative character (Geldermann
1975). The purpose of mapping QTL is to under-
stand the numbers and effects of genes that deter-
mine a trait and to assist in selective breeding to
accelerate genetic improvement of important traits
(Naish and Hard 2008). The mechanisms of QTL
mapping can be found in the paper of Doerge
(2002).
Important traits in QTL analyses in aquaculture
species
Growth traits including growth rate, body weight
and length are the most important traits in aqua-
culture species (Gjedrem and Baranski 2009).
They can be easily measured. Due to their high
heritability in most aquaculture species, they can
be improved using traditional selection methods.
QTL analysis for growth traits has been conducted
in almost all species, in which QTL analyses have
been performed (see details in the section ‘Status
of QTL mapping in aquaculture species’), such as
Asian seabass (Wang et al. 2006, 2008a), rain-
bow trout (Wringe et al. 2010) and tilapia (Cnaani
et al. 2003).
© 2013 Blackwell Publishing Ltd, F I SH and F I SHERIES 5
Genome mapping and MAS in food fish G H Yue
In most aquaculture species, feed accounts for
about 65–75% of the total production cost (Gjed-
rem and Baranski 2009). Even in salmon industry,
feed accounts for about 50% of the total cost (Ma-
rineharvest 2012). Therefore, FCR is another
important trait. Feed intake of each individual is
generally difficult to measure in aquaculture spe-
cies due to unequal feed intake over days and the
requirement of a single tank to raise each fish in
each of the reference families. No QTL analysis on
FCR has been conducted in aquaculture species so
far.
Meat quality traits include fat percentage and
distribution, fatty acid profiling, colour, texture
and dressing percentage (Gjedrem and Baranski
2009). In most cases, accurate measurements of
these traits can only be conducted in slaughtered
individuals (Derayat et al. 2007; Baranski et al.
2010). QTL for fat percentage and distribution
(Derayat et al. 2007) as well as flesh colour (Bar-
anski et al. 2010) were mapped on the genome of
salmon.
Sexual maturation is also an important trait as
it leads to reduced growth, low FCR and decreased
fillet quality in several aquaculture species (Mar-
tyniuk et al. 2003; Moghadam et al. 2007; Kutt-
ner et al. 2011). Therefore, selection for later
maturation has been carried out in some species.
As phenotypic selection of this trait is difficult and
time-consuming, MAS in fingering stage is pre-
ferred. QTL for sexual maturation have been anal-
ysed in rainbow trout (Martyniuk et al. 2003),
salmon (Araneda et al. 2009) and Arctic charr
(Moghadam et al. 2007; Kuttner et al. 2011).
Sex determination (SD) is controlled by one or
more genetic factors, environment and their inter-
actions. SD factors are located on sex chromo-
somes and/or on autosomes. In some species, sex
is significantly related to growth. For example, in
tilapia, males grow much quicker than females
(Eshel et al. 2012), while in common carp, females
are much bigger than males at the same age (Sun
and Liang 2004). Therefore, sex is regarded as an
important trait in aquaculture species. QTL analy-
sis for SD has been conducted some fish species,
such as tilapia (Lee et al. 2004), salmon (Davidson
et al. 2009) and rainbow trout (Alfaqih et al.
2009).
Disease resistance is one of the most frequently
researched traits in QTL studies as diseases repre-
sent one of the major challenges and bottlenecks
in aquaculture (Ozaki et al. 2001; Khoo et al.
2004; Moen et al. 2004; Fuji et al. 2006; Gilbey
et al. 2006; Houston et al. 2008). To quantify the
resistance of each individual to pathogens, chal-
lenge experiments were often conducted. Usually,
survival, death and the time of survival are
recorded. QTL for disease resistance have been
mapped in several aquaculture species, such as
salmon (Houston et al. 2008), trout species (Khoo
et al. 2004), Japanese flounder (Fuji et al. 2006)
and oysters (Yu and Guo 2006; Lallias et al.
2009; Sauvage et al. 2010).
Salinity tolerance and temperature tolerance are
two traits of interest for some fish species, such as
tilapia (Rengmark et al. 2007; Yan and Wang
2010), rainbow trout (Le Bras et al. 2011), Arctic
charr (Norman et al. 2011) and Asian seabass
(Bai et al. 2012). The purpose of selecting for
salinity and temperature tolerance is to develop
fishes that could reproduce and grow in areas of
higher salinity and lower/higher temperature. Tol-
erance to salinity and low/high temperature is
usually measured by a challenge under high salin-
ity and high/low temperature, respectively (Danz-
mann et al. 1999; Somorjai et al. 2003;
Rengmark et al. 2007; Yan and Wang 2010; Nor-
man et al. 2011). QTL for salinity tolerance and
temperature tolerance have been identified in some
species, such as rainbow trout (Danzmann et al.
1999; Le Bras et al. 2011).
Gene expression levels can be analysed as quan-
titative traits (Hubner et al. 2005). To dissect the
transcriptional regulation of the entire transcrip-
tome, QTL (eQTL) for gene expressions have been
conducted in model organisms (Gilad et al. 2008).
To date, this analysis relies upon the use of segre-
gating populations. No such study has been
reported in aquaculture species.
Families for mapping QTL
In many cultured fish species, large numbers of
offspring can be generated during spawning, thus
any kinds of families can be easily obtained.
Although F2 families are commonly used for QTL
mapping, in marine fishes such as Pacific oyster,
Asian seabass and Japanese flounder, F1 families
have been used in QTL mapping (Wang et al.
2006; Ozakil et al. 2007; Guo et al. 2012). This is
mainly because in these species, the parents used
for constructing the reference families segregate at
both DNA markers and phenotypic values. To
increase the power for QTL mapping, parents can
6 © 2013 Blackwell Publishing Ltd, F ISH and F ISHER IES
Genome mapping and MAS in food fish G H Yue

be selected based on genotypes at marker loci
(Wang et al. 2006). This strategy has been used in
setting up reference families for QTL mapping in
Asian seabass (Wang et al. 2006). Another issue
related to the power of the QTL mapping is the
family size. The optimum number of family size in
the QTL mapping population depends on the
intrinsic power of the experiment. Usually, large
family sizes (>300 individuals) are needed for
detecting QTL of small effects.
Methods to detect QTL
Basically, three methods are frequently used for
mapping QTL and estimating their effects, namely
single-marker association analysis (SMAA), simple
interval mapping (SIM) and composite interval
mapping (CIM) (Crosses 2001; Flint and Mott
2001; Doerge 2002). The SMAA is the simplest
approach for identifying QTL associated with sin-
gle markers based on linkage disequilibrium (LD)
(Edwards et al. 1987). The major advantage of the
SMAA is that it does not require reference families
or a complete linkage map and can be applied in
any population raised under the same conditions.
However, the major disadvantage of this method is
its low power for detecting QTL, allowing only
QTL closely linked to the marker to be identified.
The SIM uses a large number (usually > 100) of
informative DNA markers evenly covering the
entire genome (<20 cM/marker space) and analy-
ses intervals between neighbouring pairs of linked
markers along each LG simultaneously, thus
increasing the power of QTL mapping in compari-
son with the SMAA (Lander and Botstein 1989;
Haley and Knott 1992). In the CIM, the interval
mapping was combined with linear regression.
The CIM also includes additional genetic markers
in the statistical model in addition to an adjacent
pair of linked markers for interval mapping (Jan-
sen 1993). The main advantage of the CIM is its
higher precision and power at mapping QTL as
compared to the SMAA and SIM, especially when
linked QTL are involved. The interaction among
detected QTL can also be examined (Korol et al.
2012). Details of methods of QTL mapping can be
found in published papers (e.g. Edwards et al.
1987) and reviews (e.g. Doerge 2002). More new
methods for QTL mapping are being developed
(Korol et al. 2012) to improve the accuracy of
QTL mapping. In aquaculture species, the CIM has
often been used to map QTL for important traits
(Robison et al. 2001; Zimmerman et al. 2005;
Drew et al. 2007; Jin et al. 2012), due to its
higher precision and power at mapping QTL.
Software for QTL mapping
A large number of softwares are now available
for QTL analysis using different methods. A com-
plete list of the programs can be found on the
following websites http://linkage.rockefeller.edu/
soft and http://www.stat.wisc.edu/~yandell/stat-
gen/software/biosci/linkage.html. Most of the pro-
grams were developed as stand-alone software
packages. Researchers can easily select one suit-
able for their experimental designs for QTL map-
ping. The software such as MapMaker/QTL
(Lincoln et al. 1992), Map Manager (Manly et al.
2001), QTL Express (Seaton et al. 2002) and
MapQTL (Ooien et al. 1996) have been frequently
used in QTL analysis in aquaculture species. In
our hand, MapQTL is easy to use and it is very
fast to generate results in the format of table and
figures. However, the software is not free soft-
ware, and a licence fee must be paid. GridQTL
(http://www.gridqtl.org.uk/) is the enhanced ver-
sion of QTL Express and is web-based free soft-
ware, which can perform QTL mapping on a
variety of population types. Furthermore, Grid-
QTL enables higher-resolution detection of QTL
by adding a linkage disequilibrium–linkage analy-
sis (LDLA) tool in tandem with a haplotyping
analysis. An epistasis option for two-QTL determi-
nation in F2 populations is also implemented.
This software has been extensively used in QTL
mapping in livestock since 2006 (e.g. Siwek et al.
2010), while in aquaculture species, it just has
been used recently (Gutierrez et al. 2012). There-
fore, it is expected that its use in QTL mapping
in aquaculture species will substantially increase.
PROC QTL procedure in the SAS package can
also be used for mapping binary trait loci (Hu
and Xu 2009). This software package can per-
form QTL mapping in almost all lines of crossing
experiments. However, this software is not a free-
ware. MapManager and QTX are commonly used
to perform single-marker analysis (Manly et al.
2001; Joehanes and Nelson 2008). MapMaker/
QTL (Lincoln et al. 1992) and QGene (Joehanes
and Nelson 2008) have been used to conduct
SIM, whereas MapQTL (Ooien et al. 1996), Car-
tographer (Basten et al. 2003), MapManager QTX
(Basten et al. 2003) and PROC QTL (Hu and Xu
© 2013 Blackwell Publishing Ltd, F I SH and F I SHERIES 7
Genome mapping and MAS in food fish G H Yue

2009) have been used to perform CIM in aqua-
culture species. Other programs developed using
the R package [e.g. R/qtl (Broman et al. 2003)
and R/qtlbim (Yandell et al. 2007)] may also be
used in QTL mapping in aquaculture species. As
these above-mentioned programs were developed
by different researchers, they usually require spe-
cific formats of data. Users have to prepare their
data using different formats before they can
switch between these different programs, espe-
cially when both continuous and categorical
traits are involved. Therefore, it could be a good
idea to develop some software to convert data
formats for QTL mapping using different soft-
wares. It is not uncommon that QTL detected
using different softwares are slightly different,
especially when the effects of QTL are small.
Therefore, it is advisable to use at least two soft-
wares for QTL mapping to ensure the accuracy
and reliability of QTL analyses.
Factors affecting QTL analysis
The power of mapping QTL can be influenced by
a number of factors, such as genetic properties of
QTL, experiment design, environmental effects,
marker density and informativeness, genotyping
errors and precision of trait measurement. Details
about how these factors influence the power of
QTL mapping can be found in some very good
reviews (e.g. Crosses 2001; Flint and Mott 2001;
Doerge 2002). In mapping QTL, the main errors
are genotyping errors and mistakes in phenotypic
evaluation, which can lead to a wrong estima-
tion of the order and distance between markers
on the whole genome (Hackett and Broadfoot
2003). The accuracy of the measurement of phe-
notypic values of traits is of great importance for
the accurate locating of QTL and estimating of
QTL effects. In model organisms such as mouse
(Gates et al. 2011) and agronomic plant species
(Iyer-Pascuzzi et al. 2010), tools have been devel-
oped to automatically measure traits (e.g. weight
and length). However, in aquaculture species,
such tools are still not available. Researchers in
the field of molecular breeding may cooperate
with mechanic engineers to develop such tools to
measure traits of aquaculture species precisely
and efficiently. In addition, QTL mapping studies
should be verified in different populations (Wang
et al. 2008a; Moen et al. 2009). Such verifica-
tions may involve independent populations
constructed from the same parental genotypes or
closely related genotypes used in the primary
QTL mapping study. Sometimes, larger population
sizes may be required.
Status of QTL mapping in aquaculture species
QTL analyses for important traits have been con-
ducted for more than 20 aquaculture species
including finfish, mussels and crustaceans (see
details in Table S2). Among these over 20 species,
tilapia is one of the most important freshwater
food fish species, whereas salmon and rainbow
trout are the major cultured marine food fish spe-
cies (Gjedrem and Baranski 2009). Pacific oyster is
the most popular shellfish species and has been
cultured for hundreds of years (Plough and Hedge-
cock 2011). Asian seabass (Wang et al. 2006),
Japanese flounder (Fuji et al. 2006) and Kuruma
prawn (Li et al. 2006) represent relatively new
species for marine aquaculture. In tilapia, Atlantic
salmon, rainbow trout, Pacific oyster, Asian sea-
bass, Japanese flounder and Kuruma prawn, QTL
for some important traits have been mapped, and
some QTL were verified in different populations.
Therefore, I have summarized the advances of QTL
mapping in these seven representative species to
give readers a brief overview on the status of QTL
mapping in aquaculture species. More information
about QTL mapping in other aquaculture species
can be found in Table S2.
QTL mapping in tilapia
QTL have been identified for cold tolerance and
body size (Cnaani et al. 2004), temperature toler-
ance (Cnaani et al. 2003), general disease resis-
tance and immune response (Cnaani et al. 2004),
body colour (Lee et al. 2005), SD (Lee et al. 2004;
Shirak et al. 2008; Eshel et al. 2012) and salinity
tolerance (Rengmark et al. 2007). QTL for innate
immunity, response to stress, biochemical blood
parameters (Cnaani et al. 2004) and body size
were confirmed in additional experiments (Cnaani
et al. 2004). In the following two paragraphs, I
have summarized details about QTL for SD and
salinity tolerance as these two traits are very
important to ensure the profitability and sustain-
ability of tilapia production.
The SD loci have been extensively searched for
in tilapia species. In the Nile and Mozambique
tilapia (Oreochromis Spp.), sex is determined by
XX/XY (male heterogametic) (Carrasco et al.
8 © 2013 Blackwell Publishing Ltd, F ISH and F ISHER IES
Genome mapping and MAS in food fish G H Yue

1999), while in the species blue tilapia (Oreochr-
omis aureus),
the SD system is a WZ/ZZ (female heterogamet-
ic). Several sex-linked markers have been identi-
fied in O. niloticus and O. aureus and mapped to
different LGs (Lee et al. 2003, 2004; Shirak et al.
2006; Eshel et al. 2010, 2012). In purebred
O. niloticus, the QTL for SD were detected on LG
1 and LG 23 (Lee et al. 2003; Eshel et al. 2010,
2012), while in O. niloticus 9 O. aureus hybrids,
a QTL for SD was mapped on LG 3 (Lee et al.
2005). In Nile tilapia, Lee et al. (2003) reported
that two microsatellites UNH995 and UNH104
on LG 1 were a few centimorgans away from a
major SD locus. More recently, Eshel et al.
(2012) reported that a major QTL for SD was
located between SSR markers ARO172 and
ARO177 on LG 23. Twelve adjacent markers
located near the QTL were homozygous in
females and either homozygous for the alterna-
tive allele or heterozygous in males. This segment
was defined as the sex region. It seems that at
least two major sex determining loci on different
LG 1 and LG 23 determine the sex in Nile tila-
pia. However, it is not known whether and how
these two loci interact with each other. Further
study on their interactions is required. Recently,
Shirak et al. (2008) found that the CNV of lipo-
calins was associated with SD. They found that
females with the high male-specific protein copy
(MSPC) number were more frequent by more
than twofold compared with males. In other spe-
cies blue tilapia (Oreochromis aureus, Cichlidae),
SD is controlled by a major QTL on LG 3. Eleven
microsatellite markers located near the major
QTL were associated with phenotypic sex (Lee
et al. 2004). Three markers UNH168, GM271
and UNH131 on LG 3 were located a few centi-
morgans away from the SD locus. The putative
W chromosome haplotype was able to predict
the sex of 97% of male and 85% of female indi-
viduals. Markers on LG 1 were also strongly
associated with sex. Analysis of epistatic interac-
tions among QTL for SD on LG1 and LG 3
revealed that the QTL (the W haplotype) on LG
3 may act as a dominant male repressor,
whereas the QTL (the Y haplotype) on LG 1 may
function as dominant male determiner. Although
it is known that in tilapia species, sex is deter-
mined by several major loci, other loci with
small effects and environmental factors may also
be involved. It is also possible that the sex of
tilapia species is determined by a network of
genes and environmental effects. The interactions
among genes and environmental factors may be
very complicated, and warrant further study.
QTL for salinity tolerance were mapped on two
chromosomes using a pure O. niloticus F2 full-sib
family with 292 individuals (Lee 2003). However,
markers linked to the salt tolerance have not been
released. Recently, candidate genes for salt toler-
ance, such as genes beta haemoglobin, Ca2+-trans-
porting plasma membrane ATPase, pro-
opiomelanocortin and beta-actin, were mapped in
Nile tilapia (Rengmark et al. 2007) to an existing
linkage map (Lee et al. 2005). Further study on
QTL for salinity tolerance is required to develop
new salinity-tolerant tilapia varieties.
QTL mapping in Atlantic salmon
QTL analyses have been conducted for resistance
to the infectious pancreatic necrosis (IPN) virus
(Houston et al. 2007, 2008; Storset et al. 2007;
Moen et al. 2009), Cryptobia salmositica (Ozaki
et al. 2005), Gyrodactylus salaries infection (Gilbey
et al. 2006), susceptibility to Lepeophtheirus (Ghar-
bi et al. 2009) and infectious salmon anaemia
(Moen et al. 2005, 2007), growth and harvest
traits (Reid et al. 2005; Houston et al. 2009a; Bar-
anski et al. 2010; Vasemagi et al. 2010), sex
(Davidson et al. 2009), body lipid percentage (Der-
ayat et al. 2007) and flesh colour (Baranski et al.
2010). In the following paragraphs, we have
focused on some details about QTL for resistance
to IPN, flesh colour and body lipid percentage
because disease resistance and meat quality are
economically important in breeding salmon and
other fish species.
A major QTL affecting resistance to IPN was
identified on LG 21 by several independent experi-
ments (Ozaki et al. 2001; Houston et al. 2007,
2008, 2009b; Moen et al. 2009; Gheyas et al.
2010a,b). These studies showed the QTL for IPN
explained over 45% of the phenotypic variance
(PV). Three DNA markers (SSa0285BSFU, Alu333
and SSa0374BSFU/II) on LG 21 were closely
linked to the QTL for resistance to IPN. In a family
where both parents were segregating for the QTL,
and in offspring homozygous for resistant QTL
alleles, there was no mortality, whereas in off-
spring homozygous for susceptible QTL alleles, the
mortality was 100%. Other studies also confirmed
the major QTL for resistance to IPN on LG 21 (e.g.
Gheyas et al. 2010a). These studies indicate that
© 2013 Blackwell Publishing Ltd, F I SH and F I SHERIES 9
Genome mapping and MAS in food fish G H Yue
the resistance to IPN is determined by a major
locus and some other loci with small effects.
Three significant QTL for flesh colour were
mapped on Chr 6, Chr 26 and Chr 4 in an F2 pop-
ulation. Two QTL for flesh colour on Chr 6 and
26 accounted for 24% of the PV. In addition, 32
suggestive QTL with smaller effects were also iden-
tified (Baranski et al. 2010). This study suggests
that the trait of flesh colour was determined by
many QTL.
For body lipid percentage, a QTL scan on the
whole genome was carried out in five large full-sib
families including 10 parents and 153 offspring
(Derayat et al. 2007). The study found evidence of
a significant QTL for fat percentage on linkage
groups LNS 16. The microsatellite marker
Ssa0016NVH (at position of 1.3 cM) was found to
be tightly linked to QTL affecting fat percentage.
However, the study did not report the effect of the
QTL on the PV of lipid percentage. After the publi-
cation of Derayat et al. (2007), more than 5 years
have passed, yet no other paper on QTL for this
trait were published, suggesting that study on
body lipid percentage is a difficult task. It is also
possible because measuring of body fat percentage
and composition is expensive. As the body lipid
percentage and composition are important quality
traits, further QTL analysis for these traits using
more DNA markers in other mapping families is
required.
QTL mapping in rainbow trout
QTL mapping was conducted for a number of
traits, such as thermal tolerance (Jackson et al.
1998; Danzmann et al. 1999; Perry et al. 2001,
2005; Somorjai et al. 2003), spawning time (SPT)
(Sakamoto et al. 1999; O’Malley et al. 2003; Coli-
hueque et al. 2010), embryonic development (Rob-
ison et al. 2001; Sundin et al. 2005; Easton et al.
2011; Xu et al. 2011), growth traits (Martyniuk
et al. 2003; O’Malley et al. 2003; Martinez et al.
2005; Moghadam et al. 2007; Wringe et al.
2010), stress (Drew et al. 2007; Vallejo et al.
2009), salinity tolerance (Le Bras et al. 2011),
resistance to IPN (Rodriguez et al. 2004; Zimmer-
man et al. 2004; Ozakil et al. 2007; Barroso et al.
2008; Baerwald et al. 2011), infectious hemato-
poietic necrosis (IHN) (Khoo et al. 2004), bacterial
cold-water disease (Vallejo et al. 2010) and natu-
ral killer cell-like activity (Zimmerman et al.
2004). The QTL for thermal tolerance, SPT and
stress resistance are quite interesting.
In 1998, QTL for thermal tolerance were first
identified (Jackson et al. 1998). Two QTL for upper
temperature tolerance were mapped near the mi-
crosatellite loci Omy325UoG and Ssa14DU (Jack-
son et al. 1998). The two QTL were located on
different LGs and accounted for 13 and 9% of the
overall additive genetic variance in upper tempera-
ture tolerance. A marker allele associated with a
QTL enhanced thermal resistance in one genomic
background showed the opposite association in the
other genomic background (Danzmann et al.
1999). Potential candidate genes (e.g. small heat
shock proteins, HSP-90 genes and COUP-TFII)
associated with heat tolerance have been recently
identified using a positional candidate gene
method (Quinn et al. 2011).
In an early attempt to map QTL for SPT (Sa-
kamoto et al. 1999), thirteen QTL markers for
SPT were mapped on seven LGs. A recent study
(Colihueque et al. 2010) using microsatellites
linked and unlinked to QTL for SPT showed that
QTL for SPT also influenced the double annual
reproductive cycle (DARC) trait. In two case–con-
trol comparisons, three linked markers (Omy-
FGT12TUF, One3ASC and One19ASC) had
significant levels of allelic frequency differentia-
tion and marker-character association. Further-
more, alleles of One3ASC and One19ASC had
significantly higher frequencies in populations
carrying the DARC trait. These results suggest
that QTL for SPT and DARC are somewhat
related.
A major QTL affecting stress response was
detected using Bayesian methods of complex segre-
gation analysis (Vallejo et al. 2009). The QTL
explained 22–39% of the PV. However, this QTL
has not been confirmed in other populations.
Interval and composite interval mapping were
used to map QTL for post-stress cortisol levels in
doubled haploid offspring of an OSU 9 Arlee
hybrid (Drew et al. 2007). Two significant QTL
with opposing additive effects on cortisol levels
were detected, explaining 43% of the PV. It seems
that the stress response is determined by a few
major QTL and some other QTL with smaller
effects. However, in the study of Drew et al.
(2007), the QTL were mapped in large chromo-
somal regions (>5 cM). Therefore, it is essential to
narrow down the QTL in smaller chromosomal
regions by genotyping more DNA markers near
the detected QTL to make maker-assisted selection
for stress response possible.
10 © 2013 Blackwell Publishing Ltd, F ISH and F ISHER IES
Genome mapping and MAS in food fish G H Yue
QTL mapping in Asian seabass
In Asian seabass, QTL analyses have been mainly
conducted for growth traits (Wang et al. 2006,
2008a, 2011b), adaptive traits (Wang et al.
2011a), cold tolerance (Bai et al. 2012) and fatty
acid profiling (Xia et al. unpublished data).
For growth traits at the age of 3 months post-
hatch, interval mapping and multiple QTL model
mapping detected five significant and 27 sugges-
tive QTL on ten LGs in an F1 family comprising
380 individuals (Wang et al. 2006). Among the
five significant QTL, three QTL for body weight,
total body length and standard body length,
respectively, were located on the same position
near the microsatellite Lca287 on LG 2, account-
ing for 28.8, 58.9 and 59.7% of the PV. Two
additional QTL affecting body weight were mapped
on LG 2 (near the marker Lca371) and 3, explain-
ing 6.4 and 8.8% of the PV, respectively. On LG
23, some suggestive QTL for growth traits were
also detected. In another study (Wang et al.
2008a), the previously detected QTL for body
weight and length linked to marker Lca371 on LG
2 were confirmed in two different populations (i.e.
the MAC and THAI families), whereas other QTL
previously identified on LG2 (near the marker
Lca287), LG 3 and 23 were only detected in one
of the two families. QTL for body weight and
length were detected in a region on LG 10 where
the IGF2 and tyrosine hydroxylase 1 (TH1) genes
are located in the MAC family, but not in the
THAI family. Significant epistatic interactions were
identified between markers Lca287 on LG 2 and
IGF2 on LG 10 for growth traits QTL in the F1family (i.e. MAC family) generated using brooders
from Singapore, but not in the F1 family (i.e. THAI
family) produced using brooders from Thailand.
Effects of the IGF2, TH1 and parvalbumin 1 candi-
date genes were family specific. Recently, by geno-
typing more DNA markers in the significant QTL
regions, Wang et al. fine-mapped some QTL for
growth traits in chromosomal regions between 0.3
and 6 cM (Wang et al. 2011b). These results indi-
cate that most QTL are family specific in Asian
seabass.
Recently, Xia et al. (unpublished data) con-
ducted a whole-genome scan for growth traits and
fatty acid profiles at the age of 6 and 9 months
post-hatch in an F2 family consisting of 359 F2individuals (unpublished data). They found nine
significant QTL for body weight measured at
6 months post-hatch and nine other QTL for body
weight measured at 9 months post-hatch, respec-
tively. Five of these QTL were located at similar
intervals on LG 5, 7, 15, 21 and 24, explaining
2.8–10% of the PV, respectively. However, QTL on
LG 2, 3, 6, 9, 11, 13, 18 and 23 were detected
only at one of the two stages. These data suggest
that QTL for growth in different developing stages
may differ although the growth traits were highly
correlated at the age of 3 and 9 months post-
hatch (Wang et al. 2008b).
Four QTL for total omega-3 polyunsaturated
fatty acid content in flesh of 314 fishes (at the age
of 9 months) from an F2 family were recently
mapped on LG 6 and 23, explaining 3.8–6.3% of
the PV. Two QTL with a large PV ranging from
17.2 to 36.4% were detected for DPA3 (C22:5 n-
3) on LG 2 and LG 6 (Xia et al. unpublished data).
These results suggest the percentages of different
omega-3 polyunsaturated fatty acids were deter-
mined by several chromosomal regions with rela-
tively small effects.
In addition to the whole-genome scans, analyses
of associations between SNPs in candidate genes
and traits including growth (Xu et al. 2006; He
et al. 2012) and cold tolerance (Bai et al. 2012)
have been also performed. Polymorphisms in pro-
lactin and parvalbumin genes were associated
with growth traits (Xu et al. 2006; He et al.
2012). The polymorphisms in the calreticulin gene
were associated with cold tolerance (Bai et al.
2012). However, these significant associations
must be examined in different families to ascertain
whether these associations are family specific or
universal.
QTL mapping in Japanese flounder
Whole-genome scans for QTL focused on resis-
tance to lymphocystis disease (Fuji et al. 2006,
2007; He et al. 2008a), Streptococcus iniae infec-
tion (Ozaki et al. 2010) and reproductive traits
(He et al. 2008a,b). Candidate gene method was
used in the analysis of associations between SNPs
in genes and reproductive traits (He et al. 2008a,
b). Using a segregating population with 136 indi-
viduals, a significant QTL for the resistance to
lymphocystis disease was mapped on LG 15. A
microsatellite marker (Poli.9-8TUF) located in the
QTL explained 50% of the total PV in the experi-
mental population (Fuji et al. 2006). An allele of
the microsatellite Poli9-8TUF that had a domi-
nant effect and was associated with resistance to
lymphocystis disease has been used in selection
© 2013 Blackwell Publishing Ltd, F I SH and F I SHERIES 11
Genome mapping and MAS in food fish G H Yue
of fish resistant to lymphocystis disease (Fuji
et al. 2007).
QTL mapping in Kuruma prawn
QTL analysis was focused on growth traits in Kuru-
ma prawn. Li et al. (2006) used AFLP markers to
map QTL for body weight, total length (TL) and car-
apace length (CL) in one full-sib Penaeus japonicus
family with 102 F2 individuals. No significant mar-
ker–trait association was detected in the female
map, whereas one QTL for CL and TL was identified
on LG 1 of the male map using interval mapping.
The same region and one other suggestive QTL on
LG 25 of the male map were detected by composite
interval mapping. The two QTL were located on the
end of LGs. One AFLP marker was located in the
QTL region in LG 1 and one in the middle of LG 25.
The AFLP markers located in the major QTL region,
accounting for 16% of the PV, were further charac-
terized (Lyons et al. 2007). Flanking sequences
were analysed, and allelic variants responsible for
segregation patterns of these markers were identi-
fied. The genomic sequence surrounding the AFLP
marker 7.21a, located in the QTL, contained a gene
called the elongation of very long chain fatty acids–
like (ELOVL) protein. However, in recent years, no
other papers on mapping QTL for other traits have
been published, which may be due to the lack of a
dense linkage map with codominant DNA markers
in this species.
QTL mapping in Pacific oyster
QTL mapping has been recently conducted for
growth traits (Guo et al. 2012), disease resistance
(Sauvage et al. 2010) and inbreeding depression
(Plough and Hedgecock 2011).
Sauvage et al. (2010) conducted a QTL analysis
for survival of summer mortality and the load of Os-
treid Herpes virus type 1 using five F2 full-sib families
generated in a divergent selection experiment for
resistance to summer mortality. Five significant
QTL were mapped on four LGs (i.e. V, VI, VII and
IX). They analysed QTL in single full-sib families
and revealed differential QTL segregation between
families. QTL for the two recorded traits were
located in very similar locations. Guo et al. (2012)
conducted a preliminary QTL analysis for growth
traits and identified three significant QTL explaining
0.6–13.9% of the PV. They mapped one QTL for sex
on LG 6 and found that the heritabilities of sex for
paternal alleles and maternal alleles on that locus
C15 were 39.8 and 0.01%, respectively.
Recently, Plough and Hedgecock (2011) carried
out a quite interesting whole-genome search for
QTL for inbreeding depression in two F2 hybrid
families. They located the causative deleterious
mutations and characterized their mode of gene
action. They found 14–15 viability QTL (vQTL) in
the two families. In general, genotypic frequencies
at vQTL suggested selection against recessive or
partially recessive alleles. Their results support the
dominance theory of inbreeding depression. How-
ever, they did not detect epistasis among vQTL,
suggesting unlinked vQTL presumably had inde-
pendent effects on survival. They, for the first time,
tracked segregation ratios of vQTL-linked markers
through the life cycle, to determine their stage-spe-
cific expression. In the earliest life stages, almost
all vQTL did not exist, confirming zygotic viability
selection. Over 90% of vQTL were expressed before
the juvenile stage, mostly (50%) at metamorpho-
sis. They estimated that, altogether, selection on
vQTL caused 96% mortality in these families,
accounting for nearly all the actual mortality.
Their study suggests that it is essential to further
study the genetic load caused substantial mortality
in inbred Pacific oysters, particularly during a crit-
ical developmental transition stage (i.e. metamor-
phosis).
Although QTL mapping for important traits
progressed quickly in aquaculture species, there
are still some issues that need to be addressed.
The majority of QTL analyses were conducted
with very small sample size (<200 individuals)
and a few markers (<150) covering only part of
the genome, which may lead to some important
QTL for the traits of interest being missed. Fur-
thermore, some recent studies have proposed that
QTL positions and effects should be evaluated/
confirmed in independent populations, because
QTL mapping based on typical population sizes
results in a low power of QTL detection and a
large bias of QTL effects (Crosses 2001; Doerge
2002). Unfortunately, due to constraints, such as
lack of research funding and time, and possibly a
lack of understanding of the need to confirm the
results of QTL mapping, QTL mapping studies are
rarely confirmed. Some notable exceptions are
the confirmation of QTL associated with growth
traits in Asian seabass (Wang et al. 2008a) and
rainbow trout (Fuji et al. 2007; Wringe et al.
2010), and disease resistance in salmon (Moen
et al. 2009) and Japanese flounder (Fuji et al.
2007).
12 © 2013 Blackwell Publishing Ltd, F ISH and F ISHER IES
Genome mapping and MAS in food fish G H Yue
Marker-assisted selection
The advantages of MAS are obvious as compared
with the conventional selective breeding (Lande
and Thompson 1990). MAS is especially useful for
traits that are difficult to measure, exhibit low her-
itability and/or are expressed late in development.
Implementation of MAS requires DNA markers
that are tightly linked to QTL for traits of interest
based on QTL mapping or association studies
(Lande and Thompson 1990). Ideally, the DNA
markers should be the causative mutation under-
lying the phenotypic variation. QTL studies in
aquaculture species covered a wide range of traits
including growth, meat quality, egg production,
disease resistance, stress resistance, reproduction
and other traits. The results of these studies pro-
vide a good starting point to search for QTL within
breeding populations. Of the QTL from experimen-
tal crosses, only a small number of them have
been followed up by confirmation and fine-map-
ping. The responsible mutations in genes have not
been described for detected QTL. However, there
are already a few applications of MAS in commer-
cial breeding programmes in aquaculture species
(Ozaki et al. 2012).
In Japanese flounder, an allele of the microsatel-
lite Poli9-8TUF located in the major QTL for resis-
tance to LD showed a significant and dominant
effect on resistance to the disease (Fuji et al.
2007). Fuji et al. (2007) developed a new popula-
tion of Japanese flounder using MAS with the
marker Poli9-8TUF. They selected a female homo-
zygous for the favourable allele (B-favourable) and
a male with a higher growth rate and good body
shape, but without the resistant allele as parents.
In the females, the marker Poli9-8TUF is tightly
linked to the QTL for resistance to LD; therefore, a
female was selected as the LD-resistant parent.
The B-favourable allele was transmitted from the
mother to the progeny. All the progeny are het-
erozygotes with the LD-R allele, and field tests
showed the progeny was really resistant to LD,
while the control group without B-favourable
alleles showed incidences of 4.5 and 6.3% of mor-
tality due to lymphocystis disease. These results
clearly demonstrate that MAS is an efficient strat-
egy for breeding. MAS lymphocystis disease–resis-
tant flounder had a market penetration rate of
35% in Japan in 2012 (Ozaki et al. 2012).
In salmon, IPN is a major problem in farming.
Three markers (SSa0285BSFU, Alu333 and
SSa0374BSFU/II) on LG 21, significantly associ-
ated with resistance to IPN, are being applied in
the selection for resistance to IPN in several com-
panies producing salmon (e.g. Marine Harvest)
(Moen et al. 2009). The GenoMar AS in coopera-
tion with the Temasek Life Sciences Laboratory in
Singapore is doing the genotyping service for sal-
mon breeding companies to implant the MAS for
resistance to IPN. However, the outcome of the
MAS for resistance to IPN has not been released
yet.
The application of MAS in breeding programmes
means that brooders are now able to be selected
according to both genotypes and performance
records, rather than on performance alone. How-
ever, to date, little is known about the economic
benefits gained from MAS in aquaculture species.
Information of this nature is essential because the
additional genetic gains depend on the magnitude
of the allelic effects, and thus, the marginal
increase should offset the costs of applying the
technology (e.g. genotyping and manpower costs).
Conclusions and future directions
Genetic linkage maps, the necessary framework for
any MAS programme, have been constructed for
over 40 aquaculture species and are being con-
structed for other species. However, the density of
the maps varies considerably among species. The
majority of the linkage maps were constructed by
using a combination of dominant (e.g. RAPD and
AFLP) and codominant markers (e.g. microsatel-
lites and SNPs). In the future, linkage maps should
be constructed using only codominant markers, as
they are easily transferable between different labo-
ratories, and identification of codominant markers
is no longer expensive due to the rapid develop-
ment of sequencing technologies. In shrimp,
prawns and crabs, and clams, oysters and mussels,
SNPs may be the better markers for constructing
linkage maps because microsatellites are very diffi-
cult to genotype in these species (Scarbrough et al.
2002). It is necessary to integrate different linkage
maps of a species into a consensus map. Ideally, a
reference linkage map for a species should be con-
structed using the same reference families by dif-
ferent research groups.
Although QTL analyses have been carried out
for some economically important traits in over 20
aquaculture species, most QTL were only mapped
in large spaces between markers, and only QTL
© 2013 Blackwell Publishing Ltd, F I SH and F I SHERIES 13
Genome mapping and MAS in food fish G H Yue
with moderate-to-large effects were detected with
the current experimental design. Only a few QTL
have been confirmed and fine-mapped in different
genetic backgrounds. Further confirmation and
fine-mapping of identified QTL for traits of interest
in different populations are essential for future
MAS. For FCR, which is one of the most important
traits in aquaculture industry, no QTL analysis
has been conducted due to the difficulty in mea-
suring FCR. It is essential to establish effective
methods to measure FCR for mapping QTL for this
trait.
Marker-assisted selection has only been applied
in selection of resistance to lymphocystis disease in
Japanese flounders and resistance to IPN in sal-
mon. Currently, MAS has not played a major role
in genetic improvement programmes in the major-
ity of aquaculture species (Sonesson 2007; Ozaki
et al. 2012). However, the rapid advances in
sequencing technologies and statistical analysis of
large data will soon create a lot of information
that can be exploited for the genetic improvement
of aquaculture species. The cost for genotyping a
large number of DNA markers will substantially
decrease in the near future. The eventual applica-
tion of MAS in practical breeding programmes will
be largely dependent on the economic benefits. For
the time being, the application of MAS will be lim-
ited to QTL of moderate-to-large effect. Observable
phenotypes will remain an important component
of genetic improvement programmes because it
takes into account the collective effect of all genes.
Integration of MAS with the conventional selective
breeding may be the most effective way for genetic
improvement in aquaculture species. It is expected
that more breeding companies will be integrating
MAS strategies into conventional breeding pro-
grammes to improve breeding stocks.
Because the QTL approaches only detect QTL
with moderate-to-large effects for MAS, the QTL
with small effects may be missed. Therefore,
researchers are now working towards identifying
huge numbers of DNA variations associated with
traits in the whole-genome sequences in humans,
model organisms and agronomic species, that is,
genome-wide association studies (GWAS) (Hirsch-
horn and Daly 2005; McCarthy et al. 2008).
GWAS, also called as whole-genome association
study, is an examination of a large number of
variations (e.g. >500 000 SNPs) in the whole gen-
ome of a large number (e.g. >2000) of individualsof a particular species to see how many variations
differ from individual to individual (Hirschhorn
and Daly 2005; McCarthy et al. 2008). Different
variations are then associated with different traits,
such as diseases and growth. In humans, this
technique has led to the discovery of associations
of particular genes with a number of common dis-
eases (Hirschhorn and Daly 2005; McCarthy et al.
2008). The main advantage of GWAS is their high
ability to detect very small effects of marker–trait
associations, as they are based on linkage disequi-
librium. Because natural populations are usually
used in GWAS, recombination that accumulates
over many generations of the population may
break any long-range associations between mark-
ers and traits leaving short stretches of the gen-
ome associated with the trait. If alleles at marker
loci are significantly associated with superior phe-
notypes, they can be used for selection across
breeding populations. The MAS using genetic
markers associated with traits of interest, which
are identified in GWAS, is called genomic selection
(GS). Simulation results and limited experimental
results suggest that breeding values can be pre-
dicted with high accuracy using SNPs along the
whole genomes (Goddard and Hayes 2007; Sones-
son 2007; Sonesson and Meuwissen 2009). GS is
better suited to breeding programmes of aquacul-
ture species, which aims to maintain a large
genetic variation to maintain the sustainability of
breeding programmes, that is, brooder stocks with
a large number of families. In contrast, the QTL
approach is ideal for within-family selection
because most QTL detected are family specific, and
only a few are universal (Sonesson 2007). A
major concern for GWAS and GS in aquaculture
species is the high cost. Even now in humans, a
GWAS with 2000 individuals genotyped with
1 million SNPs costs over 1 million USD (McCar-
thy et al. 2008), which is still too expensive for
aquaculture industry. The recent development of
rapid, high-throughput and cost-effective genotyp-
ing techniques by direct sequencing has drastically
reduced the cost of genotyping SNPs, which makes
GWAS and GS feasible. It is expected that in the
next few years, the cost of genotyping by sequenc-
ing will be reduced substantially (at least 10 folds).
To our best knowledge, GWAS are being started in
a few aquaculture species. In Singapore, the
National Research Foundation has funded 10 mil-
lion Singapore dollars to the Temasek Life Science
Laboratory for genome sequencing, GWAS and GS
in Asian seabass. On the other hand, QTL
14 © 2013 Blackwell Publishing Ltd, F ISH and F ISHER IES
Genome mapping and MAS in food fish G H Yue
mapping remains largely a research tool to
improve our understanding of the number, distri-
bution and mode of action of QTL controlling eco-
nomically important traits in aquaculture species.
QTL can also play a role in GWAS as a vehicle for
validating and confirming significant SNP correla-
tions identified in association populations (Thu-
mma et al. 2005). In the near future, GWAS
promise to yield numerous SNP markers that
could be used in GS for early selection of superior
alleles associated with a wide range of traits. As
the efficiency of techniques for DNA sequencing,
SNP discovery, genotyping and other molecular
procedures improves further and experimental
costs decrease, the opportunities to incorporate GS
into breeding programmes for aquaculture species
will surely increase.
Acknowledgements
I would like to thank my colleagues Drs Jun Hong
Xia, Wang Le and Feng Liu, as well as Ms Grace
Lin for critical comments on previous versions of
this manuscript, and Ms May Lee and Grace Lin
for English correction. This research is supported
by the National Research Foundation Singapore
under its Competitive Research Program (CRP
Award No. NRF-CRP002-001).
References
Alfaqih, M.A., Brunelli, J.P., Drew, R.E. and Thorgaard,
G.H. (2009) Mapping of five candidate sex-determining
loci in rainbow trout (Oncorhynchus mykiss). BMC
Genetics 10, 2.
Araneda, C., Lam, N., Diaz, N.F. et al. (2009) Identifica-
tion, development, and characterization of three molec-
ular markers associated to spawning date in Coho
salmon (Oncorhynchus kisutch). Aquaculture 296, 21–26.
Baerwald, M.R., Petersen, J.L., Hedrick, R.P., Schisler, G.
J. and May, B. (2011) A major effect quantitative trait
locus for whirling disease resistance identified in rain-
bow trout (Oncorhynchus mykiss). Heredity 106, 920–
926.
Bai, Z.Y., Yuan, Y., Yue, G.H. and Li, J.L. (2011) Molecu-
lar cloning and copy number variation of a ferritin
subunit (Fth1) and its association with growth in
freshwater pearl mussel Hyriopsis cumingii. PLoS ONE
6, e22886.
Bai, Z.Y., Zhu, Z.Y., Wang, C.M., Xia, J.H., He, X.P. and
Yue, G.H. (2012) Cloning and characterization of the
calreticulin gene in Asian seabass (Lates calcarifer). Ani-
mal 6, 683–687.
Baranski, M., Moen, T. and Vage, D.I. (2010) Mapping of
quantitative trait loci for flesh colour and growth traits
in Atlantic salmon (Salmo salar). Genetics, Selection,
Evolution 42, 17.
Barroso, R.M., Wheeler, P.A., LaPatra, S.E., Drew, R.E.
and Thorgaard, G.H. (2008) QTL for IHNV resistance
and growth identified in a rainbow (Oncorhynchus my-
kiss) x Yellowstone cutthroat (Oncorhynchus clarki bou-
vieri) trout cross. Aquaculture 277, 156–163.
Basten, C.J., Weir, B.S. and Zeng, Z.B. (2003) QTL Cartog-
rapher, version 1.17. A reference manual and tutorial
for QTL mapping. Department of Statistics, North Caro-
lina State University, Raleigh, NC.
Broman, K.W., Wu, H., Sen, S. and Churchill, G.A.
(2003) R/qtl: QTL mapping in experimental crosses.
Bioinformatics 19, 889–890.
Carrasco, L.A.P., Penman, D.J. and Bromage, N. (1999)
Evidence for the presence of sex chromosomes in the
Nile tilapia (Oreochromis niloticus) from synaptonemal
complex analysis of XX, XY and YY genotypes. Aqua-
culture 173, 207–218.
Castano-Sanchez, C., Fuji, K., Ozaki, A. et al. (2010) A
second generation genetic linkage map of Japanese
flounder (Paralichthys olivaceus). BMC Genomics 11,
554.
Cnaani, A., Hallerman, E.M., Ron, M. et al. (2003) Detec-
tion of a chromosomal region with two quantitative
trait loci, affecting cold tolerance and fish size, in an F-
2 tilapia hybrid. Aquaculture 223, 117–128.
Cnaani, A., Zilberman, N., Tinman, S., Hulata, G. and
Ron, M. (2004) Genome-scan analysis for quantitative
trait loci in an F2 tilapia hybrid. Molecular Genetics and
Genomics 272, 162–172.
Colihueque, N., Cardenas, R., Ramirez, L., Estay, F. and
Araneda, C. (2010) Analysis of the association
between spawning time QTL markers and the biannual
spawning behavior in rainbow trout (Oncorhynchus
mykiss). Genetics and Molecular Biology 33, 578–582.
Crosses, E. (2001) Review of statistical methods for QTL
mapping in experimental crosses. Lab Animal 30, 44–52.
Danzmann, R.G., Jackson, T.R. and Ferguson, M.M.
(1999) Epistasis in allelic expression at upper tempera-
ture tolerance QTL in rainbow trout. Aquaculture 173,
45–58.
Davey, J.W., Hohenlohe, P.A., Etter, P.D., Boone, J.Q.,
Catchen, J.M. and Blaxter, M.L. (2011) Genome-wide
genetic marker discovery and genotyping using next-
generation sequencing. Nature Reviews Genetics 12,
499–510.
Davidson, W.S., Huang, T.K., Fujiki, K., von Schalburg,
K.R. and Koop, B.F. (2009) The sex determining loci
and sex chromosomes in the family salmonidae. Sexual
Development 3, 78–87.
Derayat, A., Houston, R.D., Guy, D.R. et al. (2007) Map-
ping QTL affecting body lipid percentage in Atlantic
salmon (Salmo salar). Aquaculture 272, S250–S251.
© 2013 Blackwell Publishing Ltd, F I SH and F I SHERIES 15
Genome mapping and MAS in food fish G H Yue

Doerge, R.W. (2002) Mapping and analysis of quantita-
tive trait loci in experimental populations. Nature
Reviews Genetics 3, 43–52.
Drew, R.E., Schwabl, H., Wheeler, P.A. and Thorgaard,
G.H. (2007) Detection of QTL influencing cortisol levels
in rainbow trout (Oncorhynchus mykiss). Aquaculture
272, 183–194.
Du, Z.Q., Ciobanu, D.C., Onteru, S.K. et al. (2010) A
gene-based SNP linkage map for pacific white shrimp,
Litopenaeus vannamei. Animal Genetics 41, 286–294.
Easton, A.A., Moghadam, H.K., Danzmann, R.G. and Fer-
guson, M.M. (2011) The genetic architecture of
embryonic developmental rate and genetic covariation
with age at maturation in rainbow trout Oncorhynchus
mykiss. Journal of Fish Biology 78, 602–623.
Edwards, M., Stuber, C. and Wendel, J. (1987) Molecu-
lar-marker-facilitated investigations of quantitative-
trait loci in maize. I. Numbers, genomic distribution
and types of gene action. Genetics 116, 113–125.
Eshel, O., Shirak, A., Weller, J. et al. (2010) Fine map-
ping of a locus on linkage group 23 for sex determina-
tion in Nile tilapia (Oreochromis niloticus). Animal
Genetics 42, 222–224.
Eshel, O., Shirak, A., Weller, J., Hulata, G. and Ron, M.
(2012) Linkage and physical mapping of sex region on
LG23 of Nile tilapia (Oreochromis niloticus). G3: Genes -
Genomes - Genetics 2, 35–42.
Flint, J. and Mott, R. (2001) Finding the molecular basis
of quantitative traits: successes and pitfalls. Nature
Reviews Genetics 2, 437–445.
Fuji, K., Kobayashi, K., Hasegawa, O., Coimbra, M.R.M.,
Sakamoto, T. and Okamoto, N. (2006) Identification of
a single major genetic locus controlling the resistance
to lymphocystis disease in Japanese flounder (Paralich-
thys olivaceus). Aquaculture 254, 203–210.
Fuji, K., Hasegawa, O., Honda, K., Kumasaka, K., Sakam-
oto, T. and Okamoto, N. (2007) Marker-assisted breed-
ing of a lymphocystis disease-resistant Japanese
flounder (Paralichthys olivaceus). Aquaculture 272, 291
–295.
Gates, H., Mallon, A.M. and Brown, S.D.M. (2011) High-
throughput mouse phenotyping. Methods 53, 394–
404.
Geldermann, H. (1975) Investigations on inheritance of
quantitative characters in animals by gene markers I.
Methods. Theoretical and Applied Genetics 46, 319–330.
Gharbi, K., Glover, K.A., Stone, L.C. et al. (2009) Genetic
dissection of MHC-associated susceptibility to Lepeopht-
heirus salmonis in Atlantic salmon. BMC Genetics 10,
20.
Gheyas, A.A., Haley, C.S., Guy, D.R. et al. (2010a) Effect
of a major QTL affecting IPN resistance on production
traits in Atlantic salmon. Animal Genetics 41, 666–
668.
Gheyas, A.A., Houston, R.D., Mota-Velasco, J.C. et al.
(2010b) Segregation of infectious pancreatic necrosis
resistance QTL in the early life cycle of Atlantic salmon
(Salmo salar). Animal Genetics 41, 531–536.
Gilad, Y., Rifkin, S.A. and Pritchard, J.K. (2008) Reveal-
ing the architecture of gene regulation: the promise of
eQTL studies. Trends in Genetics 24, 408–415.
Gilbey, J., Verspoor, E., Mo, T.A. et al. (2006) Identifica-
tion of genetic markers associated with Gyrodactylus
salaris resistance in Atlantic salmon Salmo salar. Dis-
eases of Aquatic Organisms 71, 119–129.
Gjedrem, T. and Baranski, M. (2009) Selective Breeding in
Aquaculture: An Introduction. Springer, New York.
Goddard, M.E. and Hayes, B.J. (2007) Genomic selection.
Journal of Animal Breeding and Genetics 124, 323–330.
Graubert, T.A., Cahan, P., Edwin, D. et al. (2007) A
high-resolution map of segmental DNA copy number
variation in the mouse genome. PLoS Genetics 3, e3.
Green, P., Falls, K. and Crooks, S. (1990) Documentation
for CRI-MAP, version 2.4. Washington University
School of Medicine, St. Louis, MO.
Guichoux, E., Lagache, L., Wagner, S. et al. (2011) Cur-
rent trends in microsatellite genotyping. Molecular
Ecology Resources 11, 591–611.
Guo, X., Li, Q., Wang, Q.Z. and Kong, L.F. (2012)
Genetic mapping and QTL analysis of growth-related
traits in the Pacific oyster. Marine Biotechnology 14,
218–226.
Gutierrez, A.P., Lubieniecki, K.P., Davidson, E.A. et al.
(2012) Genetic mapping of quantitative trait loci (QTL)
for body-weight in Atlantic salmon (Salmo salar) using
a 6.5 K SNP array. Aquaculture 358–359, 61–70.
Guyomard, R., Boussaha, M., Krieg, F., Hervet, C. and
Quillet, E. (2012) A synthetic rainbow trout linkage
map provides new insights into the salmonid whole
genome duplication and the conservation of synteny
among teleosts. BMC Genetics 13, 15.
Guyon, R., Rakotomanga, M., Azzouzi, N. et al. (2012) A
high-resolution map of the Nile tilapia genome: a
resource for studying cichlids and other percomorphs.
BMC Genomics 13, 222.
Hackett, C. and Broadfoot, L. (2003) Effects of genotyp-
ing errors, missing values and segregation distortion in
molecular marker data on the construction of linkage
maps. Heredity 90, 33–38.
Haley, C.S. and Knott, S.A. (1992) A simple regression
method for mapping quantitative trait loci in line
crosses using flanking markers. Heredity 69, 315–324.
He, F., Wen, H.S., Dong, S.L. et al. (2008a) Identification of
single nucleotide polymorphism cytochrome P450-c19a
and its relation to reproductive traits in Japanese floun-
der (Paralichthys olivaceus). Aquaculture 279, 177–181.
He, F., Wen, H.S., Dong, S.L. et al. (2008b) Identification
of estrogen receptor [alpha] gene polymorphisms by
SSCP and its effect on reproductive traits in Japanese
flounder (Paralichthys olivaceus). Comparative Biochemis-
try and Physiology Part B: Biochemistry and Molecular
Biology 150, 278–283.
16 © 2013 Blackwell Publishing Ltd, F ISH and F ISHER IES
Genome mapping and MAS in food fish G H Yue

He, X.P., Xia, J.H., Wang, C.M., Pang, H.Y. and Yue, G.
H. (2012) Significant associations of polymorphisms in
the prolactin gene with growth traits in Asian seabass
(Lates calcarifer). Animal Genetics 43, 233–236.
Hirschhorn, J.N. and Daly, M.J. (2005) Genome-wide
association studies for common diseases and complex
traits. Nature Reviews Genetics 6, 95–108.
Houston, R.D., Guy, D.R., Hamilton, A. et al. (2007)
Mapping QTL affecting resistance to infectious pancre-
atic necrosis (IPN) in Atlantic salmon (Salmo salar).
Aquaculture 272, S269.
Houston, R.D., Haley, C.S., Hamilton, A. et al. (2008)
Major quantitative trait loci affect resistance to infec-
tious pancreatic necrosis in Atlantic salmon (Salmo sa-
lar). Genetics 178, 1109–1115.
Houston, R.D., Bishop, S.C., Hamilton, A. et al. (2009a)
Detection of QTL affecting harvest traits in a commer-
cial Atlantic salmon population. Animal Genetics 40,
753–755.
Houston, R.D., Haley, C.S., Hamilton, A. et al. (2009b)
The susceptibility of Atlantic salmon fry to freshwater
infectious pancreatic necrosis is largely explained by a
major QTL. Heredity 105, 318–327.
Houston, R., Davey, J., Bishop, S. et al. (2012) Charac-
terisation of QTL-linked and genome-wide restriction
site-associated DNA (RAD) markers in farmed Atlantic
salmon. BMC Genomics 13, 244.
Hu, Z. and Xu, S. (2009) PROC QTL- A SAS procedure
for mapping quantitative trait loci. International Journal
of Plant Genomics 2009, 141234.
Hubner, N., Wallace, C.A., Zimdahl, H. et al. (2005) Inte-
grated transcriptional profiling and linkage analysis for
identification of genes underlying disease. Nature Genet-
ics 37, 243–253.
Hulata, G. (2001) Genetic manipulations in aquaculture:
a review of stock improvement by classical and mod-
ern technologies. Genetica 111, 155–173.
Iyer-Pascuzzi, A.S., Symonova, O., Mileyko, Y. et al.
(2010) Imaging and analysis platform for automatic
phenotyping and trait ranking of plant root systems.
Plant Physiology 152, 1148–1157.
Jackson, T.R., Ferguson, M.M., Danzmann, R.G. et al.
(1998) Identification of two QTL influencing upper
temperature tolerance in three rainbow trout (On-
corhynchus mykiss) half-sib families. Heredity 80, 143–
151.
Jansen, R.C. (1993) Interval mapping of multiple quanti-
tative trait loci. Genetics 135, 205–211.
Jin, S., Zhang, X., Jia, Z., Fu, H., Zheng, X. and Sun, X.
(2012) Genetic linkage mapping and genetic analysis
of QTL related to eye cross and eye diameter in com-
mon carp (Cyprinus carpio L.) using microsatellites and
SNPs. Aquaculture 259, 176–182.
Joehanes, R. and Nelson, J.C. (2008) QGene 4.0, an
extensible Java QTL-analysis platform. Bioinformatics
24, 2788–2789.
Khoo, S.K., Ozaki, A., Nakamura, F. et al. (2004) Identifi-
cation of a novel chromosomal region associated with
infectious hematopoietic necrosis (IHN) resistance in
rainbow trout Oncorhynchus mykiss. Fish Pathology 39,
95–101.
Kocher, T.D. and Kole, C. (2010) Genome Mapping and
Genomics in Fishes and Aquatic Animals. Springer, New
York.
Kocher, T.D., Lee, W.J., Sobolewska, H., Penman, D. and
McAndrew, B. (1998) A genetic linkage map of a cich-
lid fish, the tilapia (Oreochromis niloticus). Genetics 148,
1225–1232.
Kofler, R., Schlotterer, C. and Lelley, T. (2007) SciRoKo:
a new tool for whole genome microsatellite search and
investigation. Bioinformatics 23, 1683–1685.
Komura, D., Shen, F., Ishikawa, S. et al. (2006) Genome-
wide detection of human copy number variations
using high-density DNA oligonucleotide arrays. Gen-
ome Research 16, 1575–1584.
Korol, A., Frenkel, Z., Orion, O. and Ronin, Y. (2012)
Some ways to improve QTL mapping accuracy. Animal
Genetics 43, 36–44.
Kucuktas, H., Wang, S.L., Li, P. et al. (2009) Construc-
tion of genetic linkage maps and comparative genome
analysis of catfish using gene-associated markers.
Genetics 181, 1649–1660.
Kuttner, E., Moghadam, H.K., Skulason, S., Danzmann,
R.G. and Ferguson, M.M. (2011) Genetic architecture
of body weight, condition factor and age of sexual
maturation in Icelandic Arctic charr (Salvelinus alpi-
nus). Molecular Genetics and Genomics 286, 67–79.
Lallias, D., Gomez-Raya, L., Haley, C.S. et al. (2009)
Combining two-stage testing and interval mapping
strategies to detect QTL for resistance to bonamiosis in
the European flat oyster Ostrea edulis. Marine Biotech-
nology 11, 570–584.
Lande, R. and Thompson, R. (1990) Efficiency of mar-
ker-assisted selection in the improvement of quantita-
tive traits. Genetics 124, 743–756.
Lander, E.S. and Botstein, D. (1989) Mapping Mendelian
factors underlying quantitative traits using RFLP link-
age maps. Genetics 121, 185–199.
Le Bras, Y., Dechamp, N., Krieg, F. et al. (2011) Detec-
tion of QTL with effects on osmoregulation capacities
in the rainbow trout (Oncorhynchus mykiss). BMC
Genetics 12, 46.
Lee, W.J. (2003) Detection of QTL for salinity tolerance
in tilapia. Plant and Animal Genomes XI Conference
W24.
Lee, B.Y., Penman, D. and Kocher, T. (2003) Identifica-
tion of a sex-determining region in Nile tilapia (Ore-
ochromis niloticus) using bulked segregant analysis.
Animal Genetics 34, 379–383.
Lee, B.Y., Hulata, G. and Kocher, T.D. (2004) Two
unlinked loci controlling the sex of blue tilapia (Ore-
ochromis aureus). Heredity 92, 543–549.
© 2013 Blackwell Publishing Ltd, F I SH and F I SHERIES 17
Genome mapping and MAS in food fish G H Yue

Lee, B.Y., Lee, W.J., Streelman, J.T. et al. (2005) A sec-
ond-generation genetic linkage map of tilapia (Oreochr-
omis spp.). Genetics 170, 237–244.
Li, Y.T., Dierens, L., Byrne, K. et al. (2006) QTL detection
of production traits for the Kuruma prawn Penaeus
japonicus (Bate) using AFLP markers. Aquaculture 258,
198–210.
Lien, S., Gidskehaug, L., Moen, T. et al. (2011) A dense
SNP-based linkage map for Atlantic salmon (Salmo sa-
lar) reveals extended chromosome homeologies and
striking differences in sex-specific recombination pat-
terns. BMC Genomics 12, 615.
Lincoln, S., Daly, M. and Lander, E. (1992) Mapping
genes controlling quantitative traits with MAPMAKER/
QTL 1.1. Whitehead Institute Technical Report. White-
head Institute, Cambridge, MA.
Liu, Z.J. (2011) Next Generation Sequencing and Whole Gen-
ome Selection in Aquaculture. Wiley-Blackwell, New York.
Liu, Z. and Cordes, J. (2004) DNA marker technologies
and their applications in aquaculture genetics. Aqua-
culture 238, 1–37.
Lyons, R.E., Dierens, L.M., Tan, S.H., Preston, N.P. and
Li, Y. (2007) Characterization of AFLP markers associ-
ated with growth in the kuruma prawn, Marsupenaeus
japonicus, and identification of a candidate gene. Mar-
ine Biotechnology 9, 712–721.
Manly, K.F., Cudmore, R.H. Jr and Meer, J.M. (2001)
Map Manager QTX, cross-platform software for genetic
mapping. Mammalian Genome 12, 930–932.
Marineharvest. (2012) The Marineharvest Salmon Industry
Handbook 2012. Marineharvest, Bergen, pp. 41.
Martinez, V., Thorgaard, G., Robison, B. and Sillanpaa,
M.J. (2005) Posterior evidence of multiple QTL influ-
encing early development in double haploid lines of
rainbow trout, Oncorhynchus mykiss. Aquaculture 247,
25–25.
Martyniuk, C.J., Perry, G.M.L., Mogahadam, H.K., Fergu-
son, M.M. and Danzmann, R.G. (2003) The genetic
architecture of correlations among growth-related
traits and male age at maturation in rainbow trout.
Journal of Fish Biology 63, 746–764.
McAndrew, B. and Napier, J. (2010) Application of
genetics and genomics to aquaculture development:
current and future directions. Journal of Agricultural
Science 149, 143–151.
McCarthy, M.I., Abecasis, G.R., Cardon, L.R. et al. (2008)
Genome-wide association studies for complex traits:
consensus, uncertainty and challenges. Nature Reviews
Genetics 9, 356–369.
Metzker, M.L. (2009) Sequencing technologies the next
generation. Nature Reviews Genetics 11, 31–46.
Miller, M.R., Dunham, J.P., Amores, A., Cresko, W.A.
and Johnson, E.A. (2007) Rapid and cost-effective
polymorphism identification and genotyping using
restriction site associated DNA (RAD) markers. Genome
Research 17, 240–248.
Miller, M.R., Brunelli, J.P., Wheeler, P.A. et al. (2012) A
conserved haplotype controls parallel adaptation in
geographically distant salmonid populations. Molecular
Ecology 21, 237–249.
Mills, R.E., Walter, K., Stewart, C. et al. (2011) Mapping
copy number variation by population-scale genome
sequencing. Nature 470, 59–65.
Moen, T., Fjalestad, K.T., Munck, H. and Gomez-Raya, L.
(2004) A multistage testing strategy for detection of
quantitative trait loci affecting disease resistance in
Atlantic salmon. Genetics 167, 851–858.
Moen, T., Munck, H. and Raya, L.G. (2005) A genome
scan reveals a QTL for resistance to infectious salmon
anaemia in Atlantic salmon (Salmo salar). Aquaculture
247, 25–26.
Moen, T., Sonesson, A.K., Hayes, B., Lien, S., Munck, H.
and Meuwissen, T.H.E. (2007) Mapping of a quantita-
tive trait locus for resistance against infectious salmon
anaemia in Atlantic salmon (Salmo Salar): comparing
survival analysis with analysis on affected/resistant
data. BMC Genetics 8, 53.
Moen, T., Baranski, M., Sonesson, A.K. and Kjoglum, S.
(2009) Confirmation and fine-mapping of a major QTL
for resistance to infectious pancreatic necrosis in Atlan-
tic salmon (Salmo salar): population-level associations
between markers and trait. BMC Genomics 10, 368.
Moghadam, H.K., Poissant, J., Fotherby, H., Haidle, L.,
Ferguson, M.M. and Danzmann, R.G. (2007) Quantita-
tive trait loci for body weight, condition factor and age
at sexual maturation in Arctic charr (Salvelinus alpi-
nus): comparative analysis with rainbow trout (On-
corhynchus mykiss) and Atlantic salmon (Salmo salar).
Molecular Genetics and Genomics 277, 647–661.
Naish, K.A. and Hard, J.J. (2008) Bridging the gap
between the genotype and the phenotype: linking
genetic variation, selection and adaptation in fishes.
Fish and Fisheries 9, 396–422.
Ninwichiana, P., Peatman, E., Liu, H. et al. (2012) Sec-
ond generation of catfish genetic linkage map and inte-
gration of catfish genetic linkage and physical maps
using BAC-anchored microsatellites. G3: Genes - Ge-
nomes - Genetics 10, 1233–1241.
Norman, J.D., Danzmann, R.G., Glebe, B. and Ferguson,
M.M. (2011) The genetic basis of salinity tolerance
traits in Arctic charr (Salvelinus alpinus). BMC Genetics
12, 81.
O’Malley, K.G., Sakamoto, T., Danzmann, R.G. and Fer-
guson, M.M. (2003) Quantitative trait loci for spawn-
ing date and body weight in rainbow trout: testing for
conserved effects across ancestrally duplicated chromo-
somes. Journal of Heredity 94, 273–284.
Ooien, J.W., Boer, M., Jansen, R. and Maliepaard, C.
(1996) MapQTL 4.0. Software for the calculation Of
QTL positions on genetic maps. Order 501, 6204.
Ozaki, A., Sakamoto, T., Khoo, S. et al. (2001) Quantita-
tive trait loci (QTLs) associated with resistance/suscep-
18 © 2013 Blackwell Publishing Ltd, F ISH and F ISHER IES
Genome mapping and MAS in food fish G H Yue

tibility to infectious pancreatic necrosis virus (IPNV) in
rainbow trout (Oncorhynchus mykiss). Molecular Genet-
ics and Genomics 265, 23–31.
Ozaki, A., de Leon, F.G., Glebe, B., Woo, P.T.K., Fergu-
son, M.M. and Danzmann, R.G. (2005) Identification
of QTL for resistance to Cryptobia salmositica infection
in Atlantic salmon (Salmo salar): a model for pathogen
disease resistance QTL? Aquaculture 247, 27–27.
Ozaki, A., Okamoto, H., Yamada, T. et al. (2010) Linkage
analysis of resistance to Streptococcus iniae infection in
Japanese flounder (Paralichthys olivaceus). Aquaculture
308, S62–S67.
Ozaki, A., Araki, K., Okamoto, H. et al. (2012) Progress
of DNA marker-assisted breeding in maricultured fin-
fish. Bulletin of Fisheries Research Agency 35, 31–37.
Ozakil, A., Khoo, S.K., Yoshiura, Y. et al. (2007) Identifi-
cation of additional quantitative trait loci (QTL)
responsible for susceptibility to infectious pancreatic
necrosis virus in rainbow trout. Fish Pathology 42,
131–140.
Palti, Y., Genet, C., Luo, M.C. et al. (2011) A first genera-
tion integrated map of the rainbow trout genome.
BMC Genomics 12, 180.
Palti, Y., Genet, C., Gao, G.T. et al. (2012) A second gen-
eration integrated map of the rainbow trout (Oncorhyn-
chus mykiss) genome: analysis of conserved synteny
with model fish genomes. Marine Biotechnology 14,
343–357.
Perkel, J. (2008) SNP genotyping: six technologies that
keyed a revolution. Nature Methods 5, 447–454.
Perry, G.M.L., Danzmann, R.G., Ferguson, M.M. and Gib-
son, J.P. (2001) Quantitative trait loci for upper ther-
mal tolerance in outbred strains of rainbow trout
(Oncorhynchus mykiss). Heredity 86, 333–341.
Perry, G.M.L., Ferguson, M.M., Sakamoto, T. and Danz-
mann, R.G. (2005) Sex-linked quantitative trait loci
for thermotolerance and length in the rainbow trout.
Journal of Heredity 96, 97–107.
Plough, L.V. and Hedgecock, D. (2011) Quantitative trait
locus analysis of stage-specific inbreeding depression in
the Pacific oyster Crassostrea gigas. Genetics 189,
1473–1486.
Quinn, N.L., McGowan, C.R., Cooper, G.A., Koop, B.F.
and Davidson, W.S. (2011) Identification of genes
associated with heat tolerance in Arctic charr exposed
to acute thermal stress. Physiological Genomics 43,
685–696.
Reid, D.P., Szanto, A., Glebe, B., Danzmann, R.G. and Fer-
guson, M.M. (2005) QTL for body weight and condition
factor in Atlantic salmon (Salmo salar): comparative
analysis with rainbow trout (Oncorhynchus mykiss) and
Arctic charr (Salvelinus alpinus). Heredity 94, 166–172.
Rengmark, A.H., Slettan, A., Lee, W.J., Lie, O. and Ling-
aas, F. (2007) Identification and mapping of genes
associated with salt tolerance in tilapia. Journal of Fish
Biology 71, 409–422.
Rexroad, C.E., Palti, Y., Gahr, S.A. and Vallejo, R.L.
(2008) A second generation genetic map for rainbow
trout (Oncorhynchus mykiss). BMC Genetics 9, 74.
Risch, N. and Giuffra, L. (1992) Model misspecification
and multipoint linkage analysis. Human Heredity 42,
77–92.
Robison, B.D., Wheeler, P.A., Sundin, K., Sikka, P. and
Thorgaard, G.H. (2001) Composite interval mapping
reveals a major locus influencing embryonic develop-
ment rate in rainbow trout (Oncorhynchus mykiss).
Journal of Heredity 92, 16–22.
Rodriguez, M.F., LaPatra, S., Williams, S., Famula, T.
and May, B. (2004) Genetic markers associated with
resistance to infectious hematopoietic necrosis in rain-
bow and steelhead trout (Oncorhynchus mykiss) back-
crosses. Aquaculture 241, 93–115.
Rothschild, M.F. and Ruvinsky, A. (2007) Marker-
Assisted Selection for Aquaculture Species. In: Aquacul-
ture Genome Technologies (ed. Z.J. Liu). Blackwell Pub-
lishing, Iowa, pp. 199–214.
Sachidanandam, R., Weissman, D., Schmidt, S.C. et al.
(2001) A map of human genome sequence variation
containing 1.42 million single nucleotide polymor-
phisms. Nature 409, 928–933.
Sakamoto, T., Danzmann, R.G., Okamoto, N., Ferguson,
M.M. and Ihssen, P.E. (1999) Linkage analysis of
quantitative trait loci associated with spawning time in
rainbow trout (Oncorhynchus mykiss). Aquaculture 173,
33–43.
Sauvage, C., Boudry, P., de Koning, D.J., Haley, C.S., Heur-
tebise, S. and Lapegue, S. (2010) QTL for resistance to
summer mortality and OsHV-1 load in the Pacific oyster
(Crassostrea gigas). Animal Genetics 41, 390–399.
Scarbrough, J.R., Cowles, D.L. and Carter, R.L. (2002)
Microsatellites in shrimp species. In: Modern approaches
to the study of Crustacea (eds E. Escobar-Brones and
F. Alvarez). Kluwer Academic Publisher, New York,
pp. 291–299.
Seaton, G., Haley, C.S., Knott, S.A., Kearsey, M. and Vis-
scher, P.M. (2002) QTL Express: mapping quantitative
trait loci in simple and complex pedigrees. Bioinformat-
ics 18, 339–340.
Sebat, J., Lakshmi, B., Troge, J. et al. (2004) Large-scale
copy number polymorphism in the human genome.
Science 305, 525.
Sharma, P.C., Grover, A. and Kahl, G. (2007) Mining mi-
crosatellites in eukaryotic genomes. Trends in Biotech-
nology 25, 490–498.
Shirak, A., Seroussi, E., Cnaani, A. et al. (2006) Amh and
Dmrta2 genes map to tilapia (Oreochromis spp.) linkage
group 23 within quantitative trait locus regions for sex
determination. Genetics 174, 1573–1581.
Shirak, A., Golik, M., Lee, B.Y. et al. (2008) Copy num-
ber variation of lipocalin family genes for male-specific
proteins in tilapia and its association with gender.
Heredity 101, 405–415.
© 2013 Blackwell Publishing Ltd, F I SH and F I SHERIES 19
Genome mapping and MAS in food fish G H Yue

Siwek, M., Slawinska, A., Nieuwland, M. et al. (2010) A
quantitative trait locus for a primary antibody
response to keyhole limpet hemocyanin on chicken
chromosome 14-Confirmation and candidate gene
approach. Poultry Science 89, 1850–1857.
Somorjai, I.M.L., Danzmann, R.G. and Ferguson, M.M.
(2003) Distribution of temperature tolerance quantita-
tive trait loci in Arctic charr (Salvelinus alpinus) and
inferred homologies in rainbow trout (Oncorhynchus
mykiss). Genetics 165, 1443–1456.
Sonesson, A.K. (2007) Within-family marker-assisted
selection for aquaculture species. Genetics, Selection,
Evolution 39, 301–317.
Sonesson, A.K. and Meuwissen, T.H.E. (2009) Testing
strategies for genomic selection in aquaculture breed-
ing programs. Genetics, Selection, Evolution 41, 37.
Song, W., Pang, R., Niu, Y. et al. (2012) Construction of
high-density genetic linkage maps and mapping of
growth-related quantitative trail loci in the Japanese
flounder (Paralichthys olivaceus). PLoS ONE 7, e50404.
Stam, P. (1993) Construction of integrated genetic link-
age maps by means of a new computer package: Join-
Map. The Plant Journal 3, 739–744.
Star, B., Nederbragt, A.J., Jentoft, S. et al. (2011) The
genome sequence of Atlantic cod reveals a unique
immune system. Nature 477, 207–210.
Storset, A., Strand, C., Wetten, M., Kjøglum, S. and
Ramstad, A. (2007) Response to selection for resis-
tance against infectious pancreatic necrosis in Atlantic
salmon (Salmo salar L.). Aquaculture 272, S62–S68.
Sun, X.W. and Liang, L.Q. (2004) A genetic linkage map
of common carp (Cyprinus carpio L.) and mapping of a
locus associated with cold tolerance. Aquaculture 238,
165–172.
Sundin, K., Brown, K.H., Drew, R.E., Nichols, K.M.,
Wheeler, P.A. and Thorgaard, G.H. (2005) Genetic
analysis of a development rate QTL in backcrosses of
clonal rainbow trout, Oncorhynchus mykiss. Aquaculture
247, 75–83.
Thumma, B.R., Nolan, M.F., Evans, R. and Moran, G.F.
(2005) Polymorphisms in cinnamoyl CoA reductase
(CCR) are associated with variation in microfibril angle
in Eucalyptus spp. Genetics 171, 1257–1265.
Vallejo, R.L., Rexroad, C.E., Silverstein, J.T., Janss, L.L.G.
and Weber, G.M. (2009) Evidence of major genes
affecting stress response in rainbow trout using Bayes-
ian methods of complex segregation analysis. Journal of
Animal Science 87, 3490–3505.
Vallejo, R.L., Wiens, G.D., Rexroad, C.E. et al. (2010) Evi-
dence of major genes affecting resistance to bacterial
cold water disease in rainbow trout using Bayesian
methods of segregation analysis. Journal of Animal Sci-
ence 88, 3814–3832.
Vasemagi, A., Gross, R., Palm, D., Paaver, T. and Prim-
mer, C.R. (2010) Discovery and application of inser-
tion-deletion (INDEL) polymorphisms for QTL mapping
of early life-history traits in Atlantic salmon. BMC Ge-
nomics 11, 156.
Volckaert, F., Batargias, C., Chatziplis, D. et al. (2007) A
second generation linkage map of European sea bass.
Aquaculture 272, S316–S316.
Volfovsky, N., Haas, B.J. and Salzberg, S.L. (2001) A
clustering method for repeat analysis in DNA
sequences. Genome Biology 2, 0027.1–0027.11.
Voorrips, R. (2002) MapChart: software for the graphical
presentation of linkage maps and QTLs. Journal of
Heredity 93, 77–78.
Wang, K. and Bucan, M. (2010) Copy number variation
detection via high-density SNP genotyping. Cold Spring
Harbor Protocols 2008, pdb. top46.
Wang, D.G., Fan, J.B., Siao, C.J. et al. (1998) Large-scale
identification, mapping, and genotyping of single-
nucleotide polymorphisms in the human genome. Sci-
ence 280, 1077–1082.
Wang, C.M., Lo, L.C., Zhu, Z.Y. and Yue, G.H. (2006) A
genome scan for quantitative trait loci affecting
growth-related traits in an F1 family of Asian seabass
(Lates calcarifer). BMC Genomics 7, 274.
Wang, C.M., Zhu, Z.Y., Lo, L.C. et al. (2007) A microsat-
ellite linkage map of Barramundi, Lates calcarifer.
Genetics 175, 907–915.
Wang, C.M., Lo, L.C., Feng, F., Zhu, Z.Y. and Yue, G.H.
(2008a) Identification and verification of QTL associ-
ated with growth traits in two genetic backgrounds of
Barramundi (Lates calcarifer). Animal Genetics 39,
34–39.
Wang, C.M., Lo, L.C., Zhu, Z.Y. et al. (2008b) Estimating
reproductive success of brooders and heritability of
growth traits in Asian sea bass (Lates calcarifer) using
microsatellites. Aquaculture Research 39, 1612–1619.
Wang, C.M., Lo, L.C., Zhu, Z.Y. et al. (2011a) Mapping
QTL for an adaptive trait: the length of caudal fin in
Lates calcarifer. Marine Biotechnology 13, 74–82.
Wang, C.M., Bai, Z.Y., He, X.P. et al. (2011b) A high-res-
olution linkage map for comparative genome analysis
and QTL fine mapping in Asian seabass, Lates calcarif-
er. BMC Genomics 12, 174.
Weber, J.L. (1990) Informativeness of human (dC-dA)n.
(dG-dT)n polymorphisms. Genomics 7, 524–530.
Wringe, B.F., Devlin, R.H., Ferguson, M.M., Moghadam,
H.K., Sakhrani, D. and Danzmann, R.G. (2010)
Growth-related quantitative trait loci in domestic and
wild rainbow trout (Oncorhynchus mykiss). BMC Genet-
ics 11, 63.
Xia, J.H., Liu, F., Zhu, Z.Y. et al. (2010) A consensus
linkage map of the grass carp (Ctenopharyngodon idella)
based on microsatellites and SNPs. BMC Genomics
11, 135.
Xu, Y., Zhu, Z., Lo, L. et al. (2006) Characterization of
two parvalbumin genes and their association with
growth traits in Asian seabass (Lates calcarifer). Animal
Genetics 37, 266–268.
20 © 2013 Blackwell Publishing Ltd, F ISH and F ISHER IES
Genome mapping and MAS in food fish G H Yue
Xu, P., McIntyre, L.M., Scardina, J., Wheeler, P.A.,
Thorgaard, G.H. and Nichols, K.M. (2011) Transcrip-
tome profiling of embryonic development rate in rain-
bow trout advanced backcross introgression lines.
Marine Biotechnology 13, 215–231.
Yan, B.A. and Wang, Z.H. (2010) Growth, salinity toler-
ance and microsatellite analysis of the F-2 reciprocal
hybrids of Oreochromis niloticus x Sarotherodon galilaeus
at different salinities. Aquaculture Research 41, 336–344.
Yandell, B.S., Mehta, T., Banerjee, S. et al. (2007) R/qtl-
bim: QTL with Bayesian interval mapping in experi-
mental crosses. Bioinformatics 23, 641–643.
Yu, Z.N. and Guo, X.M. (2006) Identification and map-
ping of disease-resistance QTLs in the eastern oyster,
Crassostrea virginica Gmelin. Aquaculture 254,
160–170.
Zhang, G.F., Fang, X.D., Guo, X.M. et al. (2012) The oys-
ter genome reveals stress adaptation and complexity of
shell formation. Nature 490, 49–54.
Zimmerman, A.M., Evenhuis, J.P., Thorgaard, G.H. and
Ristow, S.S. (2004) A single major chromosomal
region controls natural killer cell-like activity in rain-
bow trout. Immunogenetics 55, 825–835.
Zimmerman, A.M., Wheeler, P.A., Ristow, S.S. and
Thorgaard, G.H. (2005) Composite interval mapping
reveals three QTL associated with pyloric caeca num-
ber in rainbow trout, Oncorhynchus mykiss. Aquaculture
247, 85–95.
Supporting Information
Additional supporting information may be found
in the online version of this article:
Table S1. Linkage maps published for important
aquaculture species.
Table S2. Quantitative trait loci reported for
aquaculture species.
© 2013 Blackwell Publishing Ltd, F I SH and F I SHERIES 21
Genome mapping and MAS in food fish G H Yue