Embed Size (px)
Citation preview

Recent advancements of flowcytometry: new applicationsin hematology and oncologyExpert Rev. Mol. Diagn. 14(1), 67–81 (2014)
Janghee Woo*1,Alexandra Baumann1
and Vivian Arguello2
1Department of Medicine, Albert
Einstein Medical Center, 5501 Old York
Road, Philadelphia, PA 19141, USA2Department of Pathology, Albert
Einstein Medical Center, Philadelphia,
PA, USA
*Author for correspondence:
Tel.: +1 215 456 3880
Fax: +1 215 456 7926
Flow cytometry offers great diagnostic opportunities in the vast majority of hematologic andoncologic diseases with multiple cellular and molecular information within an individual cell. Wewill discuss various applications of flow cytometry, particularly in hematology and oncology, inaddition to general principles and limitations of flow cytometry. They include nucleic acidanalyses in cancer cells, new methods for assessing rare circulating tumor cells anddisease-specific applications in malignancy with emphasis on diagnosis and treatment ofhematologic malignancy, including minimal residual disease. With improvement of monoclonalantibodies, fluorescence and laser technology, flow cytometry now offers new avenues ofassessing cellular functionality through examination of intracellular compartments.High-throughput quantitative analysis, advancements of in vivo flow cytometry and assessmentof minimal residual diseases, as exampled in patient stratification and prediction of leukemiatherapeutic response, will further make flow cytometry indispensable in medicine.
KEYWORDS: applications • flow cytometry • in vivo flow cytometry and standardization of flow cytometry
• minimal residual disease • qualitative and functional assays
General principlesFlow cytometry has been widely used in clini-cal and basic laboratory for diagnostic andresearch purposes, since Mack Fulwyler firstdeveloped the current type of flow cytometersin 1965 [1]. Flow cytometry provides rapidand simultaneous analysis of multiple charac-teristics of single cells. Recent advancement incomputational methodology and optical tech-nology enables simultaneous analysis of 20 fea-tures within an individual cell in a quantitativeand qualitative manner. The characteristicsmeasured by flow cytometry include cell size,cytoplasmic complexity/granularity, nucleicacid content and various intracellular/membrane proteins. This review will illustratethe general principles of flow cytometry andprovide an overview of applications in clinicallaboratory and basic research.
Flow cytometry measures physical propertiessuch as cell size and cellular complexity, aswell as the fluorescence emitted by a widerange of dyes and fluorophore-conjugated anti-bodies. It can analyze several thousand par-ticles/cells per second, using a sheath fluid,
optical systems and a detector. Inside a flowcytometer, there are four main components:fluidics (generating a sheath fluid consisting ofsingle cells), excitation optics (consisting ofmultiple lasers), collection optics (transmittingthe emitted wavelengths to the photomultipliertube/detector arrays in multiple angles) andanalyzer (transforming electrical signals to digi-tal signals and displaying quantitative andqualitative data) (FIGURE 1). Fluorophore-conjugated antibody or fluorescent dyes canlabel various compartments of cells in manyapplications prior to applying them to flowcytometry. Acquisition of cells in suspensiontakes place in entry and a stream of single cellsis directed into a hydrodynamically focusedstream of liquid, allowing the cells to individu-ally pass through the point where a beam oflight is intercrossed. Subsequently, cells scatterlight and the fluorophore, conjugated withantibodies, can be excited by the light beam.Each fluorochrome has specific excitation spec-tra. This excited energy is released as a photonof light with specific spectral properties,unique to different fluorochromes. There arevarious types of lasers available in flow
www.expert-reviews.com 10.1586/14737159.2014.862153 � 2014 Informa UK Ltd ISSN 1473-7159 67
Review
Exp
ert R
evie
w o
f M
olec
ular
Dia
gnos
tics
Dow
nloa
ded
from
info
rmah
ealth
care
.com
by
Nyu
Med
ical
Cen
ter
on 1
0/15
/14
For
pers
onal
use
onl
y.
cytometry, and they are generally fiber launched fixed-wavelength lasers (monochromic light), allowing specific fluoro-chromes to be excited in particular wavelength. Other excita-tion optics consist of beam shaping optics, and achromaticfocusing lenses that produce beam spots that are spatially
separated and concentrated to optimizetargeting lasers to the center of a sheathstream. Collection optics enable collec-tion of each specific fluorescent lightfrom all ranges of emitted spectra (multi-ple fluorophores). Multiple detectors areaimed at the intersection of stream andlight beam: one in line with the lightbeam: forward scatter (FSC) and severalperpendicular to it: side scatter (SSC), aswell as multiple fluorescence detectors(FIGURE 1). Physical properties can be meas-ured by FSC and SSC. FSC representsthe size of particles or cells, and the SSCrepresents the internal complexity orgranularity of the particle/cell. Thesephysical properties define and resolve cer-tain cell populations (lymphocytes, gran-ulocytes and red blood cells) from themixture, such as leukocytes (FIGURE 2).Emitted light is collected via optics thatdirect the light to a series of filters anddichronic mirrors that isolate particularwavelength lights. This allows separationof one specific wavelength light from thefull spectrum of emitted lights originatingfrom multiple lasers. Multiple detectors(photomultiplier tubes) receiving specificwavelengths process and digitize signalsfor computer analysis.
The resulting information is displayedin a histogram, 2- or 3D plot, illustratingthe intensity and abundance in multiplevariables (fluorochromes). The desiredregions on these plots will be seriallyselected for subsequent analysis. A seriesof subset extraction or gating can becreated with fluorescence intensity andantigen expression like leukocyte com-mon antigen (CD45) or other markersof interest (i.e., CD34, CD38). Specificgating protocols are applied for diag-nostic and clinical purposes. Popula-tions of interest can be selected in FSCand SSC. For example, lymphocytesseparate from granulocytes in the initialFSC-SSC plot (first gating), and thenCD4/CD8 expression in T lymphocytesand CD20 expression in B lymphocytescan be analyzed in the given popula-
tion, with fluorescence conjugated antibodies labelingspecific antigen-expressing cells. Multiple fluorochromesexcited in similar wavelengths and emitted in different wave-lengths allow simultaneous examination of multiple antigensin one single assay. In addition to flurochrome-conjugated
Side scatter detector
Dichromic mirrorsLasers
Bandpass filter
Fluorescence channels
To PMT/CCD
Forward scatter detector
A
B
Figure 1. Schematic representation of a flow cytometer. (A) A single cell in suspen-sion in sheath fluid is directed to intersect lasers. The intersection of a single cell andlight leads to scattering light and the light is subsequently detected by two detectors,forward and side scatter detector, to provide information of cellular size and internalcomplexity. Fluorescent dyes or fluorochromes conjugated with antibodies can be acti-vated by different types of lasers and emitted in a specific wavelength to have multipledetectors to receive the specific wavelength signals in each detector by dichromic mir-rors. Recent flow cytometers have up to four lasers and 18 or more detectors installed,and enable to simultaneously detect the same number of antigens or phenotypic fea-tures in one single cell. The signals are amplified and processed for analysis and displayon a screen. (B) A flow cytometer in clinical laboratory.
Review Woo, Baumann & Arguello
68 Expert Rev. Mol. Diagn. 14(1), (2014)
Exp
ert R
evie
w o
f M
olec
ular
Dia
gnos
tics
Dow
nloa
ded
from
info
rmah
ealth
care
.com
by
Nyu
Med
ical
Cen
ter
on 1
0/15
/14
For
pers
onal
use
onl
y.

antibodies, fluorescent dyes intercalate with nucleic acid suchas DNA or RNA, and assess DNA content, cell cycle andploidity. TABLE 1 describes common applications of flowcytometry in clinical and basic laboratory.
Despite the many advantages and unique features of flowcytometry, there are a few limitations. For instance, cellsmust exist in a single-cell suspension in order to be analyzedby the flow cytometer. This limits its application exclusivelyto blood, bone marrow and lymph nodes in which cells arereadily dissociated. While recent improvements of enzymesand dissociating techniques have broadened the possibility ofits use in organized tissues and solid tumors [2], investigatorsoften face complications with cell viability and functionalalteration following disruption of natural cell-to-cell interac-tions and tissue architectures. Another important limitationto flow cytometry is a lack of standardization in antigenmarkers, fluorescence, antibody combinations, instrumenta-tion set-up and analysis software. This lack in standardizationbecomes problematic as more lasers and fluorescence arebeing added to instruments and as up to 18 parameters areable to be analyzed simultaneously. However, it may improvein the foreseeable future since recent efforts for standardiza-tion of procedures, assays and software have been initiated inEurope [3]. As technology is further developed, flow cytome-try continues to generate enormous amounts of data. Itmakes analyses more complex and requires specialized train-ing to maintain the instruments that analyze data, but allowsinvestigators to appropriately examine multiple markerswithin individual cells. Although limitations exist, flowcytometry has become a vital method in hematology andoncology with unique advantages over other methods. Wewill introduce the new features and applications of this evolv-ing technology in the following sections and briefly discuss anew generation of technology that is overcoming limitationswithin the ‘Five-year view’ section.
Applications in DNA analysis
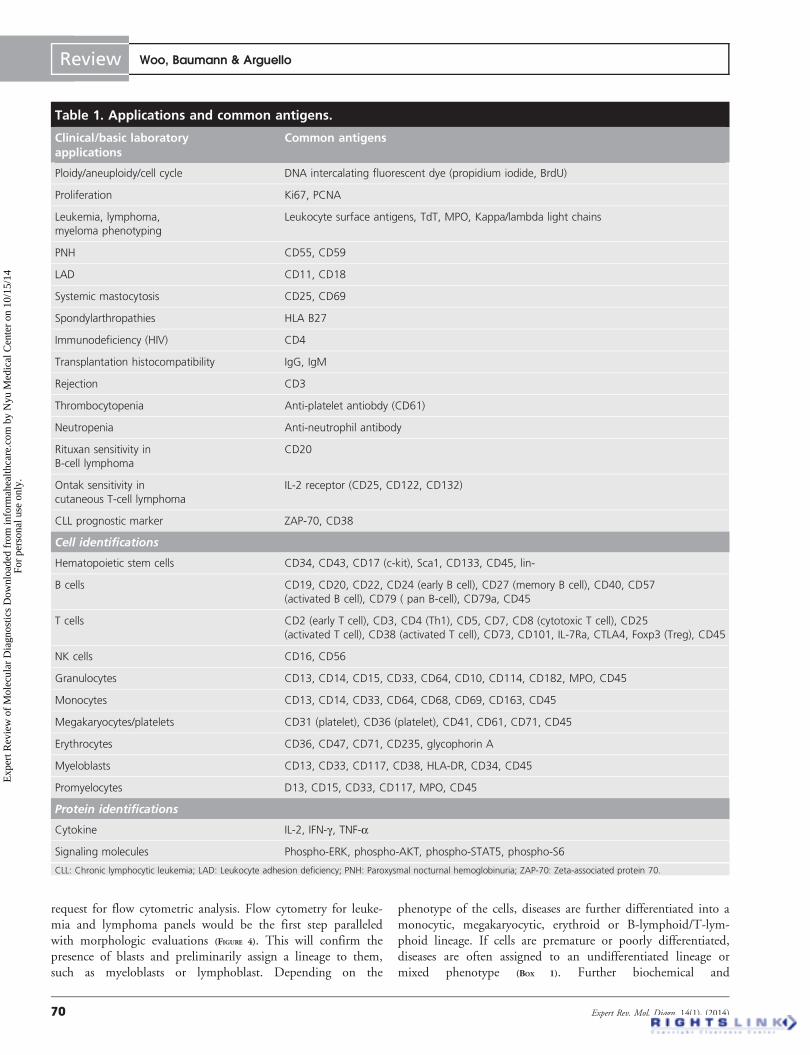
Fluorescent dyes can intercalate into nucleic acids and can bedetected by flow cytometry at the single cell level in millions ofcells. The compiled data from the analysis represents the DNA/RNA content in individual cells and can be analyzed for chro-mosomal ploidy and cell cycle, of particular interest in cancerdiagnosis, as well as reticulocytes and platelet count in hematol-ogy. Various dyes are available: propidium iodide (PI, mostwidely used), DAPI (DNA specific), DRAQ5 (one of theVybrant DyeCycle compounds or Hoechst 33342 for viablecells) and thiazole orange (RNA specific). The fluorescent sig-nals from the dyes are directly proportional to the amount ofDNA in the nucleus and can identify a relative change in thecells of interest compared with the cells carrying normalamounts of DNA (2n). The number of chromosomes in agerm cell or gamete is haploid, noted letter n. The number ina somatic cell is diploid, characterized as 2n. Occasionally,some somatic cells may be tetraploid (4n) or even octaploid(8n). The number of chromosomes in a tumor is frequentlygreater than 2n (hyperdiploid) but sometimes less (hypodi-ploid). An abnormal number of chromosomes is called aneu-ploidy and this is reflected by a change in the amount ofDNA (FIGURE 3). In general, DNA aneuploidy is associated witha worse prognosis in many types of cancers, but correlated witha better outcome in rhabdomyosarcoma, neuroblastoma andacute lymphoblastic leukemia (ALL) in children [4]. Hyperdi-ploidy in ALL tends to have a better prognosis; whereas, hypo-diploid cells in multiple myeloma and myelodysplasticsyndromes predict worsen outcome [4].
Applications in hematologic malignancy
Diagnosis & classification of leukemia & lymphoma
In a typical case, the presence of immature blast cells or atypi-cal lymphocytes in peripheral blood, bone marrow or enlargedlymph nodes in addition to severe cytopenia(s) warrants a
56.2
0
28
0
1023
1023 100
ADJADJUN 1
101 102
43.6
0.0840.11
103
FS lin CD3-PC5 CD34
CD
10
SS
lin
A B C
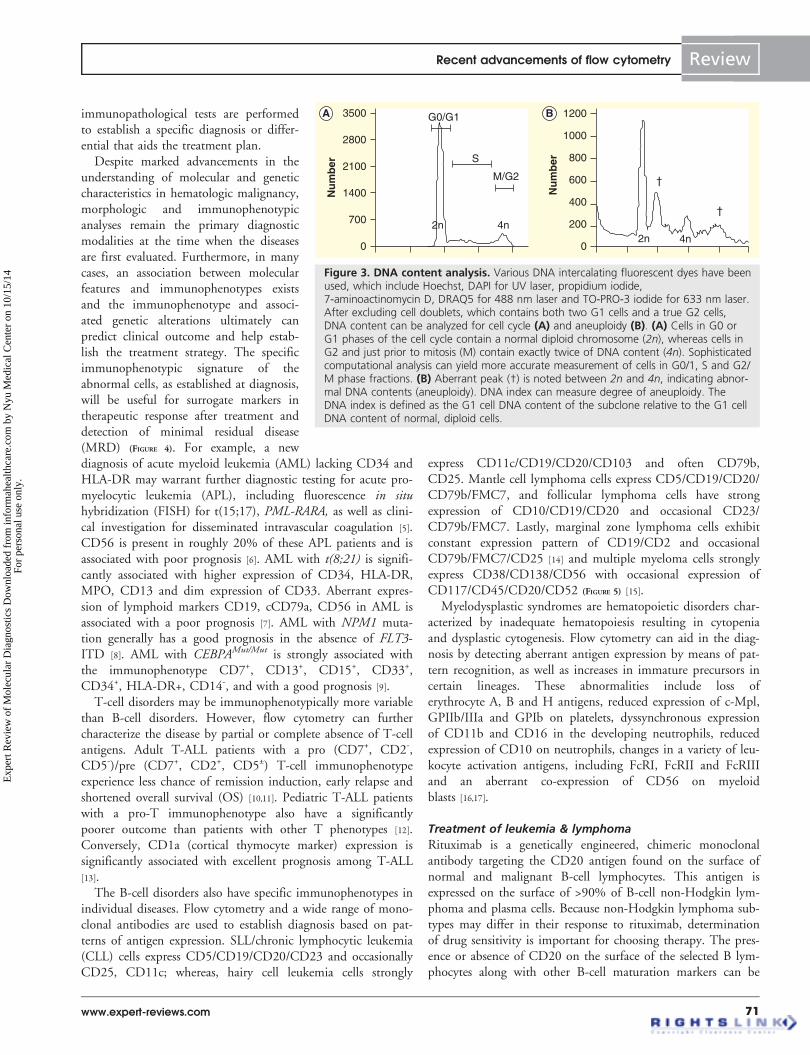
Figure 2. Data from flow cytometry. (A) Forward scatter and side scatter plots. By size and intracellular granularity, cells in blood canbe identified in granulocytes, lymphocytes and reticulocytes. Population of interest in the plot (gating) can be further analyzed in the his-togram (B) and 2- or 3D plot (C) with appropriate fluorescence-conjugated antibodies. (B) Histogram. X-axis represents fluorochromeintensity, which corresponds to level of expression of the antigen and Y-axis represents frequency, which can be used for estimatingantigen-positive population. (C) 3D plot. Each axis represents level of expression of each antigen and dots represent each individual cellwith corresponding antigens. Z axis represents frequency as contor.
Recent advancements of flow cytometry Review
www.expert-reviews.com 69
Exp
ert R
evie
w o
f M
olec
ular
Dia
gnos
tics
Dow
nloa
ded
from
info
rmah
ealth
care
.com
by
Nyu
Med
ical
Cen
ter
on 1
0/15
/14
For
pers
onal
use
onl
y.
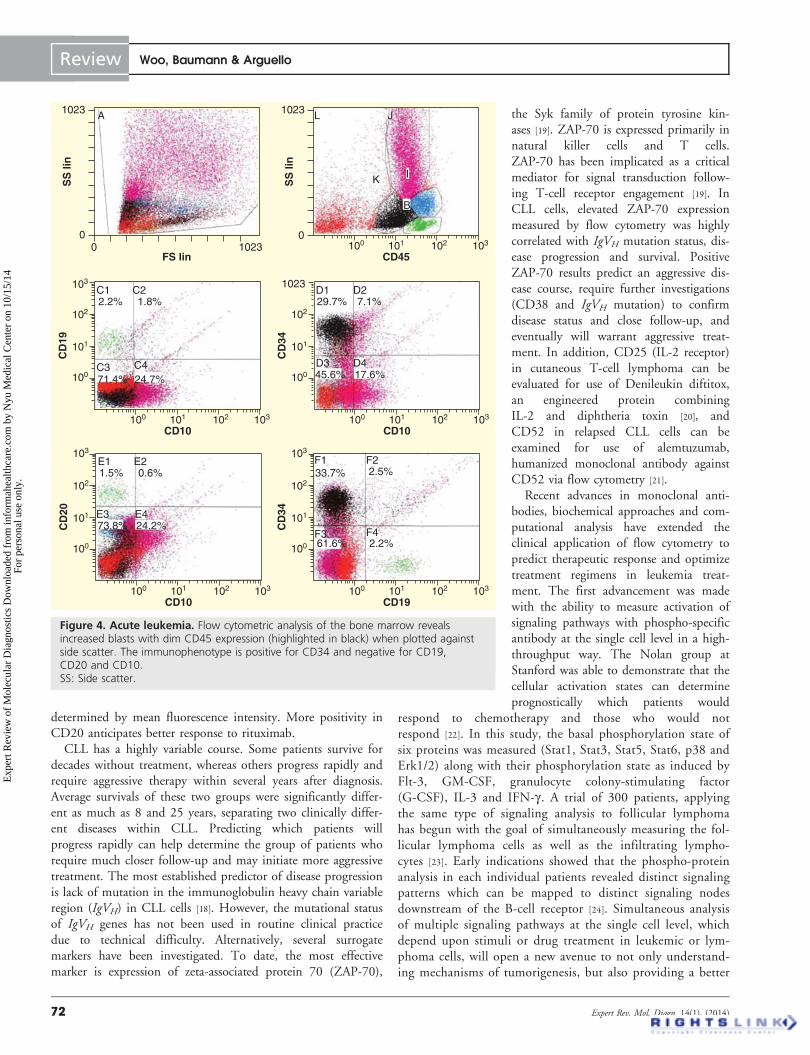
request for flow cytometric analysis. Flow cytometry for leuke-mia and lymphoma panels would be the first step paralleledwith morphologic evaluations (FIGURE 4). This will confirm thepresence of blasts and preliminarily assign a lineage to them,such as myeloblasts or lymphoblast. Depending on the
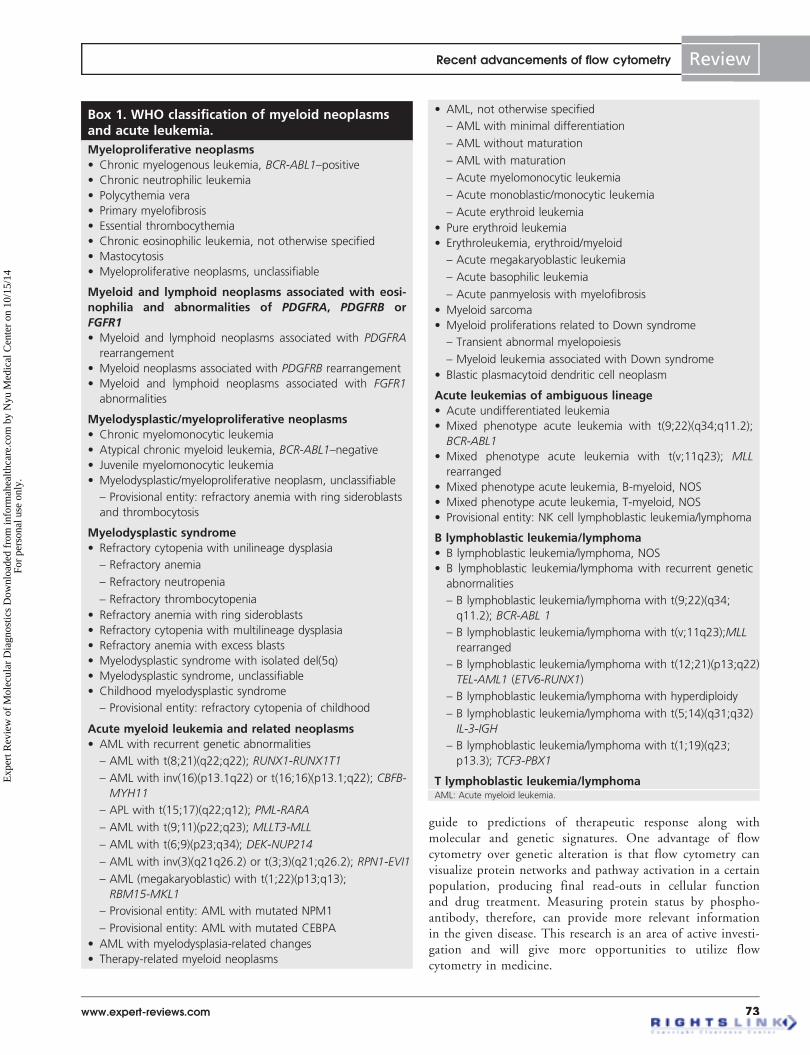
phenotype of the cells, diseases are further differentiated into amonocytic, megakaryocytic, erythroid or B-lymphoid/T-lym-phoid lineage. If cells are premature or poorly differentiated,diseases are often assigned to an undifferentiated lineage ormixed phenotype (BOX 1). Further biochemical and
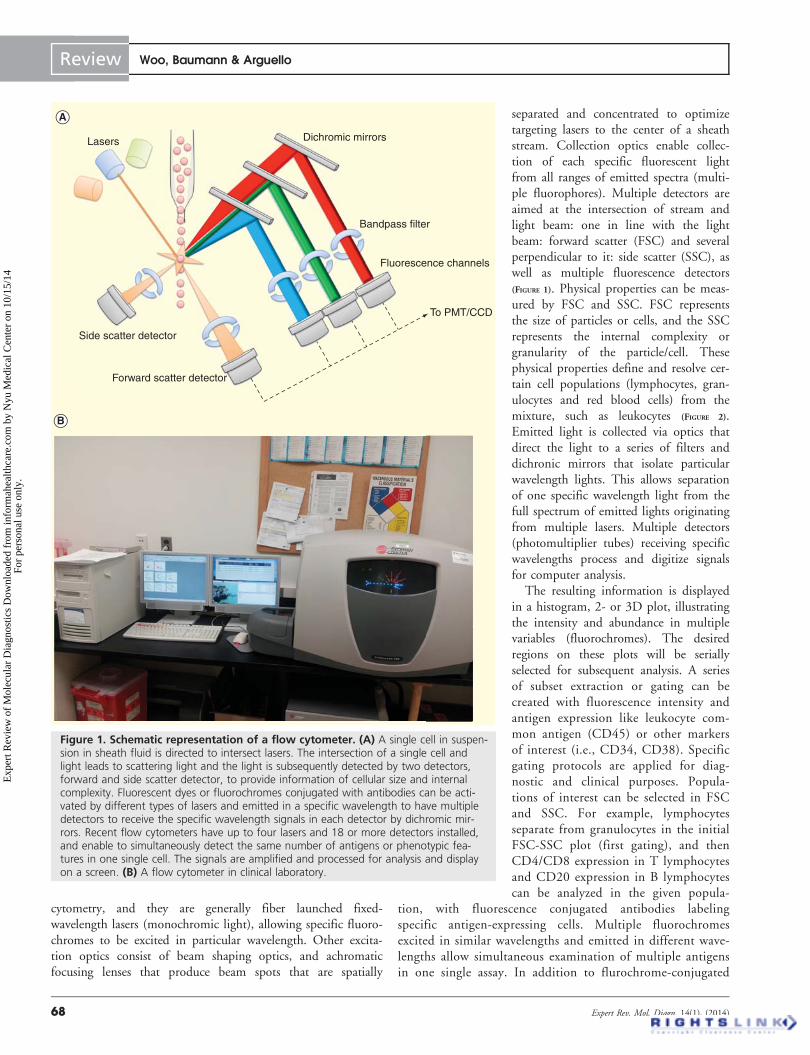
Table 1. Applications and common antigens.
Clinical/basic laboratoryapplications
Common antigens
Ploidy/aneuploidy/cell cycle DNA intercalating fluorescent dye (propidium iodide, BrdU)
Proliferation Ki67, PCNA
Leukemia, lymphoma,
myeloma phenotyping
Leukocyte surface antigens, TdT, MPO, Kappa/lambda light chains
PNH CD55, CD59
LAD CD11, CD18
Systemic mastocytosis CD25, CD69
Spondylarthropathies HLA B27
Immunodeficiency (HIV) CD4
Transplantation histocompatibility IgG, IgM
Rejection CD3
Thrombocytopenia Anti-platelet antiobdy (CD61)
Neutropenia Anti-neutrophil antibody
Rituxan sensitivity in
B-cell lymphoma
CD20
Ontak sensitivity in
cutaneous T-cell lymphoma
IL-2 receptor (CD25, CD122, CD132)
CLL prognostic marker ZAP-70, CD38
Cell identifications
Hematopoietic stem cells CD34, CD43, CD17 (c-kit), Sca1, CD133, CD45, lin-
B cells CD19, CD20, CD22, CD24 (early B cell), CD27 (memory B cell), CD40, CD57
(activated B cell), CD79 ( pan B-cell), CD79a, CD45
T cells CD2 (early T cell), CD3, CD4 (Th1), CD5, CD7, CD8 (cytotoxic T cell), CD25
(activated T cell), CD38 (activated T cell), CD73, CD101, IL-7Ra, CTLA4, Foxp3 (Treg), CD45
NK cells CD16, CD56
Granulocytes CD13, CD14, CD15, CD33, CD64, CD10, CD114, CD182, MPO, CD45
Monocytes CD13, CD14, CD33, CD64, CD68, CD69, CD163, CD45
Megakaryocytes/platelets CD31 (platelet), CD36 (platelet), CD41, CD61, CD71, CD45
Erythrocytes CD36, CD47, CD71, CD235, glycophorin A
Myeloblasts CD13, CD33, CD117, CD38, HLA-DR, CD34, CD45
Promyelocytes D13, CD15, CD33, CD117, MPO, CD45
Protein identifications
Cytokine IL-2, IFN-g, TNF-a
Signaling molecules Phospho-ERK, phospho-AKT, phospho-STAT5, phospho-S6
CLL: Chronic lymphocytic leukemia; LAD: Leukocyte adhesion deficiency; PNH: Paroxysmal nocturnal hemoglobinuria; ZAP-70: Zeta-associated protein 70.
Review Woo, Baumann & Arguello
70 Expert Rev. Mol. Diagn. 14(1), (2014)
Exp
ert R
evie
w o
f M
olec
ular
Dia
gnos
tics
Dow
nloa
ded
from
info
rmah
ealth
care
.com
by
Nyu
Med
ical
Cen
ter
on 1
0/15
/14
For
pers
onal
use
onl
y.
immunopathological tests are performedto establish a specific diagnosis or differ-ential that aids the treatment plan.
Despite marked advancements in theunderstanding of molecular and geneticcharacteristics in hematologic malignancy,morphologic and immunophenotypicanalyses remain the primary diagnosticmodalities at the time when the diseasesare first evaluated. Furthermore, in manycases, an association between molecularfeatures and immunophenotypes existsand the immunophenotype and associ-ated genetic alterations ultimately canpredict clinical outcome and help estab-lish the treatment strategy. The specificimmunophenotypic signature of theabnormal cells, as established at diagnosis,will be useful for surrogate markers intherapeutic response after treatment anddetection of minimal residual disease(MRD) (FIGURE 4). For example, a newdiagnosis of acute myeloid leukemia (AML) lacking CD34 andHLA-DR may warrant further diagnostic testing for acute pro-myelocytic leukemia (APL), including fluorescence in situhybridization (FISH) for t(15;17), PML-RARA, as well as clini-cal investigation for disseminated intravascular coagulation [5].CD56 is present in roughly 20% of these APL patients and isassociated with poor prognosis [6]. AML with t(8;21) is signifi-cantly associated with higher expression of CD34, HLA-DR,MPO, CD13 and dim expression of CD33. Aberrant expres-sion of lymphoid markers CD19, cCD79a, CD56 in AML isassociated with a poor prognosis [7]. AML with NPM1 muta-tion generally has a good prognosis in the absence of FLT3-ITD [8]. AML with CEBPAMut/Mut is strongly associated withthe immunophenotype CD7+, CD13+, CD15+, CD33+,CD34+, HLA-DR+, CD14-, and with a good prognosis [9].
T-cell disorders may be immunophenotypically more variablethan B-cell disorders. However, flow cytometry can furthercharacterize the disease by partial or complete absence of T-cellantigens. Adult T-ALL patients with a pro (CD7+, CD2-,CD5-)/pre (CD7+, CD2+, CD5±) T-cell immunophenotypeexperience less chance of remission induction, early relapse andshortened overall survival (OS) [10,11]. Pediatric T-ALL patientswith a pro-T immunophenotype also have a significantlypoorer outcome than patients with other T phenotypes [12].Conversely, CD1a (cortical thymocyte marker) expression issignificantly associated with excellent prognosis among T-ALL[13].
The B-cell disorders also have specific immunophenotypes inindividual diseases. Flow cytometry and a wide range of mono-clonal antibodies are used to establish diagnosis based on pat-terns of antigen expression. SLL/chronic lymphocytic leukemia(CLL) cells express CD5/CD19/CD20/CD23 and occasionallyCD25, CD11c; whereas, hairy cell leukemia cells strongly
express CD11c/CD19/CD20/CD103 and often CD79b,CD25. Mantle cell lymphoma cells express CD5/CD19/CD20/CD79b/FMC7, and follicular lymphoma cells have strongexpression of CD10/CD19/CD20 and occasional CD23/CD79b/FMC7. Lastly, marginal zone lymphoma cells exhibitconstant expression pattern of CD19/CD2 and occasionalCD79b/FMC7/CD25 [14] and multiple myeloma cells stronglyexpress CD38/CD138/CD56 with occasional expression ofCD117/CD45/CD20/CD52 (FIGURE 5) [15].
Myelodysplastic syndromes are hematopoietic disorders char-acterized by inadequate hematopoiesis resulting in cytopeniaand dysplastic cytogenesis. Flow cytometry can aid in the diag-nosis by detecting aberrant antigen expression by means of pat-tern recognition, as well as increases in immature precursors incertain lineages. These abnormalities include loss oferythrocyte A, B and H antigens, reduced expression of c-Mpl,GPIIb/IIIa and GPIb on platelets, dyssynchronous expressionof CD11b and CD16 in the developing neutrophils, reducedexpression of CD10 on neutrophils, changes in a variety of leu-kocyte activation antigens, including FcRI, FcRII and FcRIIIand an aberrant co-expression of CD56 on myeloidblasts [16,17].
Treatment of leukemia & lymphoma
Rituximab is a genetically engineered, chimeric monoclonalantibody targeting the CD20 antigen found on the surface ofnormal and malignant B-cell lymphocytes. This antigen isexpressed on the surface of >90% of B-cell non-Hodgkin lym-phoma and plasma cells. Because non-Hodgkin lymphoma sub-types may differ in their response to rituximab, determinationof drug sensitivity is important for choosing therapy. The pres-ence or absence of CD20 on the surface of the selected B lym-phocytes along with other B-cell maturation markers can be
0 0
200
400
600
800
1000
1200
2n2n
4n4n
Nu
mb
er
Nu
mb
er
M/G2
G0/G1
S
700
1400
2100
2800
3500
†
†
A B
Figure 3. DNA content analysis. Various DNA intercalating fluorescent dyes have beenused, which include Hoechst, DAPI for UV laser, propidium iodide,7-aminoactinomycin D, DRAQ5 for 488 nm laser and TO-PRO-3 iodide for 633 nm laser.After excluding cell doublets, which contains both two G1 cells and a true G2 cells,DNA content can be analyzed for cell cycle (A) and aneuploidy (B). (A) Cells in G0 orG1 phases of the cell cycle contain a normal diploid chromosome (2n), whereas cells inG2 and just prior to mitosis (M) contain exactly twice of DNA content (4n). Sophisticatedcomputational analysis can yield more accurate measurement of cells in G0/1, S and G2/M phase fractions. (B) Aberrant peak (†) is noted between 2n and 4n, indicating abnor-mal DNA contents (aneuploidy). DNA index can measure degree of aneuploidy. TheDNA index is defined as the G1 cell DNA content of the subclone relative to the G1 cellDNA content of normal, diploid cells.
Recent advancements of flow cytometry Review
www.expert-reviews.com 71
Exp
ert R
evie
w o
f M
olec
ular
Dia
gnos
tics
Dow
nloa
ded
from
info
rmah
ealth
care
.com
by
Nyu
Med
ical
Cen
ter
on 1
0/15
/14
For
pers
onal
use
onl
y.
determined by mean fluorescence intensity. More positivity inCD20 anticipates better response to rituximab.
CLL has a highly variable course. Some patients survive fordecades without treatment, whereas others progress rapidly andrequire aggressive therapy within several years after diagnosis.Average survivals of these two groups were significantly differ-ent as much as 8 and 25 years, separating two clinically differ-ent diseases within CLL. Predicting which patients willprogress rapidly can help determine the group of patients whorequire much closer follow-up and may initiate more aggressivetreatment. The most established predictor of disease progressionis lack of mutation in the immunoglobulin heavy chain variableregion (IgVH) in CLL cells [18]. However, the mutational statusof IgVH genes has not been used in routine clinical practicedue to technical difficulty. Alternatively, several surrogatemarkers have been investigated. To date, the most effectivemarker is expression of zeta-associated protein 70 (ZAP-70),
the Syk family of protein tyrosine kin-ases [19]. ZAP-70 is expressed primarily innatural killer cells and T cells.ZAP-70 has been implicated as a criticalmediator for signal transduction follow-ing T-cell receptor engagement [19]. InCLL cells, elevated ZAP-70 expressionmeasured by flow cytometry was highlycorrelated with IgVH mutation status, dis-ease progression and survival. PositiveZAP-70 results predict an aggressive dis-ease course, require further investigations(CD38 and IgVH mutation) to confirmdisease status and close follow-up, andeventually will warrant aggressive treat-ment. In addition, CD25 (IL-2 receptor)in cutaneous T-cell lymphoma can beevaluated for use of Denileukin diftitox,an engineered protein combiningIL-2 and diphtheria toxin [20], andCD52 in relapsed CLL cells can beexamined for use of alemtuzumab,humanized monoclonal antibody againstCD52 via flow cytometry [21].
Recent advances in monoclonal anti-bodies, biochemical approaches and com-putational analysis have extended theclinical application of flow cytometry topredict therapeutic response and optimizetreatment regimens in leukemia treat-ment. The first advancement was madewith the ability to measure activation ofsignaling pathways with phospho-specificantibody at the single cell level in a high-throughput way. The Nolan group atStanford was able to demonstrate that thecellular activation states can determineprognostically which patients would
respond to chemotherapy and those who would notrespond [22]. In this study, the basal phosphorylation state ofsix proteins was measured (Stat1, Stat3, Stat5, Stat6, p38 andErk1/2) along with their phosphorylation state as induced byFlt-3, GM-CSF, granulocyte colony-stimulating factor(G-CSF), IL-3 and IFN-g . A trial of 300 patients, applyingthe same type of signaling analysis to follicular lymphomahas begun with the goal of simultaneously measuring the fol-licular lymphoma cells as well as the infiltrating lympho-cytes [23]. Early indications showed that the phospho-proteinanalysis in each individual patients revealed distinct signalingpatterns which can be mapped to distinct signaling nodesdownstream of the B-cell receptor [24]. Simultaneous analysisof multiple signaling pathways at the single cell level, whichdepend upon stimuli or drug treatment in leukemic or lym-phoma cells, will open a new avenue to not only understand-ing mechanisms of tumorigenesis, but also providing a better
00 0
1023 1023
1023 103102101100
FS lin CD45
SS
lin
SS
lin
A L
K
J
I
B
103102101100
100
101
102
103
CD10
CD
19
1023
103102101100
100
101
102
CD10
CD
34C1 D1 D2C2
C3 D3 D4C424.7% 45.6% 17.6%71.4%
2.2% 29.7%1.8%
103102101100
100
101
102
103
CD10
CD
20
103102101100
100
101
102
103
CD19
CD
34
E1 F1 F2
F4F3
E3 E4
E21.5% 33.7%
61.6% 2.2%
2.5%0.6%
73.8% 24.2%
7.1%
Figure 4. Acute leukemia. Flow cytometric analysis of the bone marrow revealsincreased blasts with dim CD45 expression (highlighted in black) when plotted againstside scatter. The immunophenotype is positive for CD34 and negative for CD19,CD20 and CD10.SS: Side scatter.
Review Woo, Baumann & Arguello
72 Expert Rev. Mol. Diagn. 14(1), (2014)
Exp
ert R
evie
w o
f M
olec
ular
Dia
gnos
tics
Dow
nloa
ded
from
info
rmah
ealth
care
.com
by
Nyu
Med
ical
Cen
ter
on 1
0/15
/14
For
pers
onal
use
onl
y.
guide to predictions of therapeutic response along withmolecular and genetic signatures. One advantage of flowcytometry over genetic alteration is that flow cytometry canvisualize protein networks and pathway activation in a certainpopulation, producing final read-outs in cellular functionand drug treatment. Measuring protein status by phospho-antibody, therefore, can provide more relevant informationin the given disease. This research is an area of active investi-gation and will give more opportunities to utilize flowcytometry in medicine.
Box 1. WHO classification of myeloid neoplasmsand acute leukemia.
Myeloproliferative neoplasms• Chronic myelogenous leukemia, BCR-ABL1–positive
• Chronic neutrophilic leukemia
• Polycythemia vera
• Primary myelofibrosis
• Essential thrombocythemia
• Chronic eosinophilic leukemia, not otherwise specified
• Mastocytosis
• Myeloproliferative neoplasms, unclassifiable
Myeloid and lymphoid neoplasms associated with eosi-nophilia and abnormalities of PDGFRA, PDGFRB orFGFR1• Myeloid and lymphoid neoplasms associated with PDGFRA
rearrangement
• Myeloid neoplasms associated with PDGFRB rearrangement
• Myeloid and lymphoid neoplasms associated with FGFR1
abnormalities
Myelodysplastic/myeloproliferative neoplasms• Chronic myelomonocytic leukemia
• Atypical chronic myeloid leukemia, BCR-ABL1–negative
• Juvenile myelomonocytic leukemia
• Myelodysplastic/myeloproliferative neoplasm, unclassifiable
– Provisional entity: refractory anemia with ring sideroblasts
and thrombocytosis
Myelodysplastic syndrome• Refractory cytopenia with unilineage dysplasia
– Refractory anemia
– Refractory neutropenia
– Refractory thrombocytopenia
• Refractory anemia with ring sideroblasts
• Refractory cytopenia with multilineage dysplasia
• Refractory anemia with excess blasts
• Myelodysplastic syndrome with isolated del(5q)
• Myelodysplastic syndrome, unclassifiable
• Childhood myelodysplastic syndrome
– Provisional entity: refractory cytopenia of childhood
Acute myeloid leukemia and related neoplasms• AML with recurrent genetic abnormalities
– AML with t(8;21)(q22;q22); RUNX1-RUNX1T1
– AML with inv(16)(p13.1q22) or t(16;16)(p13.1;q22); CBFB-
MYH11
– APL with t(15;17)(q22;q12); PML-RARA
– AML with t(9;11)(p22;q23); MLLT3-MLL
– AML with t(6;9)(p23;q34); DEK-NUP214
– AML with inv(3)(q21q26.2) or t(3;3)(q21;q26.2); RPN1-EVI1
– AML (megakaryoblastic) with t(1;22)(p13;q13);
RBM15-MKL1
– Provisional entity: AML with mutated NPM1
– Provisional entity: AML with mutated CEBPA
• AML with myelodysplasia-related changes
• Therapy-related myeloid neoplasms
• AML, not otherwise specified
– AML with minimal differentiation
– AML without maturation
– AML with maturation
– Acute myelomonocytic leukemia
– Acute monoblastic/monocytic leukemia
– Acute erythroid leukemia
• Pure erythroid leukemia
• Erythroleukemia, erythroid/myeloid
– Acute megakaryoblastic leukemia
– Acute basophilic leukemia
– Acute panmyelosis with myelofibrosis
• Myeloid sarcoma
• Myeloid proliferations related to Down syndrome
– Transient abnormal myelopoiesis
– Myeloid leukemia associated with Down syndrome
• Blastic plasmacytoid dendritic cell neoplasm
Acute leukemias of ambiguous lineage• Acute undifferentiated leukemia
• Mixed phenotype acute leukemia with t(9;22)(q34;q11.2);
BCR-ABL1
• Mixed phenotype acute leukemia with t(v;11q23); MLL
rearranged
• Mixed phenotype acute leukemia, B-myeloid, NOS
• Mixed phenotype acute leukemia, T-myeloid, NOS
• Provisional entity: NK cell lymphoblastic leukemia/lymphoma
B lymphoblastic leukemia/lymphoma• B lymphoblastic leukemia/lymphoma, NOS
• B lymphoblastic leukemia/lymphoma with recurrent genetic
abnormalities
– B lymphoblastic leukemia/lymphoma with t(9;22)(q34;
q11.2); BCR-ABL 1
– B lymphoblastic leukemia/lymphoma with t(v;11q23);MLL
rearranged
– B lymphoblastic leukemia/lymphoma with t(12;21)(p13;q22)
TEL-AML1 (ETV6-RUNX1)
– B lymphoblastic leukemia/lymphoma with hyperdiploidy
– B lymphoblastic leukemia/lymphoma with t(5;14)(q31;q32)
IL-3-IGH
– B lymphoblastic leukemia/lymphoma with t(1;19)(q23;
p13.3); TCF3-PBX1
T lymphoblastic leukemia/lymphomaAML: Acute myeloid leukemia.
Recent advancements of flow cytometry Review
www.expert-reviews.com 73
Exp
ert R
evie
w o
f M
olec
ular
Dia
gnos
tics
Dow
nloa
ded
from
info
rmah
ealth
care
.com
by
Nyu
Med
ical
Cen
ter
on 1
0/15
/14
For
pers
onal
use
onl
y.

Minimal residual disease in leukemia
Minimal residual disease & flow cytometry
The presence of MRD following therapy for ALL and AMLhas been shown to be an important prognostic marker [25,26].Current treatment strategies in AML include the administrationof induction chemotherapy, aiming at a morphologic completeremission of less than 5% of myeloblasts in bone marrow. Thetreatment is followed by consolidation therapy or allogenicstem cell transplantation, depending on the risk of disease.Stem cell transplantation does not guarantee cure of the diseaseand more often than not, carries significant risks of morbidityand mortality. Several clinical predictors have been proposed todirect subsequent therapies following induction. However,more than 35% of patients with favorable risk cytogeneticsdevelop relapsed disease in AML [27], and it becomes clear thatmore precise tools are required to predict the course of diseaseand guide post-remission therapies. In ALL, assessment of min-imal MRD is now well established in the management of mostchildhood ALL and many adult ALL, with several studies
clearly showing the utility of differentassays in identifying MRD and allowingtailored therapy for individuals [25].Quantification of minimal residual leuke-mic cells can estimate the reduction ofdisease burden following induction andpredict disease outcome. This can be auseful tool to direct subsequenttherapies [25,26].
The assays used to detect MRD in leu-kemia include PCR to identify and/orquantitate recurrent fusion transcripts ormutated or overexpressed genes, and mul-ticolor flow cytometry to detectleukemia-associated immunophenotypes(LAIPs). LAIPs are defined as the pres-ence of a combination of antigens and/orflow cytometric physical abnormalitiesthat are absent or very infrequent in nor-mal bone marrow [28]. They include asyn-chronous expression of antigens (i.e.,aberrant expression of antigens acrossmaturation stages, such as coexpression ofearly and late antigens), cross-lineageexpression of lymphoid markers andoverexpression or lack of expression oflineage-appropriate markers [29]. Advancesin flow cytometry have enabled routineuse of polychromatic cytometry to extendsimultaneous assessment of more thanfive markers in individual leukemic cells.The sensitivity of multicolor flow cytom-etry is 1 in 1000–10,000 of nucleatedbone marrow cells [30], depending on theantibody panels and the number ofLAIPs identifiable in a particular case [29].
ALL cells express surface markers that clearly disclose theirorigin as B- or T-lymphoid precursors [31]. Flow cytometricstudies can faithfully detect these markers and track MRD dur-ing courses of therapy. For example, T-lineage ALL cellsexpress the immunophenotypic features of early T-cell progeni-tors and thymocytes (CD3+/TdT+ ± CD5+). These immuno-phenotypic features are exclusively found in the thymus duringnormal development, but these LAIPs can be found in thebone marrow and peripheral blood of MRD cells whenpresent [32]. Some surface antigens are normally expressed dur-ing lymphohematopoiesis but found in abnormal combinationsin leukemic cells, namely asynchronous expression. These phe-notypes are most widely utilized in MRD of B-lineage ALL,using combination of antibodies against CD9/CD10/CD19/CD20/CD34/CD45 [31,33]. In contrast to most cases of ALL,LAIPs in AML may be heterogeneous, with several blast popu-lations with different LAIPs often identified in a singlecase [29]. It was suggested there is potential for phenotypic shiftsbetween the diagnosis and relapse samples. For example,
0
1023
103102101100
CD45
SS
lin
K
JI
B
103102101100
100
101
102
103
cKappa
CD
138
E1 E2
E3 E4
35.7%
38.7% 14.5%
11.1%
103102101100
100
101
102
103
cLambda
CD
138
G1 G2
G3 G4
1.2%
0.9%
45.3%
103102101100
100
101
102
103
cLambda
CD
19F1 F2
F3 F4
0.0%
1.1% 95.7%
3.2%
103102101100
100
101
102
103
CD19
CD
138
H1 H2
H4
40.2%
0.8%
5.1%
52.6%H353.9%
Figure 5. Multiple myeloma. Bone marrow analysis with increased proportion ofCD45 negative population (highlighted in red), composed of CD138 positive cells withaberrant selective surface lambda light chain, diagnostic for plasma cell neoplasm.
Review Woo, Baumann & Arguello
74 Expert Rev. Mol. Diagn. 14(1), (2014)
Exp
ert R
evie
w o
f M
olec
ular
Dia
gnos
tics
Dow
nloa
ded
from
info
rmah
ealth
care
.com
by
Nyu
Med
ical
Cen
ter
on 1
0/15
/14
For
pers
onal
use
onl
y.
Baer et al. examined samples at diagnosis and relapse from136 patients with AML and showed phenotypic changes in theleukemia cells in 91% of patients, using nine panels of threeantibodies [34]. In addition, selection of antibody combinationsremains to be standardized. In order to address this, the Euro-pean Leukemia Net laboratory network established consensuspanels of antibodies and the immunophenotypic reference pat-terns for bone marrow myeloid maturation [35]. Despite theimmunophenotype shift of the leukemia cells at relapse andvariable antibody panels in different laboratories, it is generallyrecommended to use comprehensive panels of antibodies atdiagnosis and in MRD assays to identify baseline LAIPs, andthen to detect as many conserved and newly presenting LAIPsas possible during post-chemotherapy monitoring.
Recent investigation demonstrated that MRD in multiplemyeloma can be assessed by flow cytometry using a combina-tion of six antibodies against CD138/CD45/CD38/CD19/CD56/CD27 with 0.01% threshold of CD19-/CD56+/CD27weak/CD45weak myeloma cells [36]. The authors foundMRD at day 100 after autologous transplantation was predic-tive of overall outcome in patients with multiple myeloma. InCLL, MRD quantification has been shown to independentlypredict OS and progression-free survival in patients withCLL [37], following immunophenotypic standardization of CLLcells [38]. Finally, EuroFlow Consortium [3] has recently pro-vided laboratory protocols and software tools for fully standar-dized eight-color flow cytometric immunophenotyping ofnormal and malignant leukocytes in bone marrow and blood.It remains to be fully incorporated in clinical practice andMRD detection.
Clinical significance of MRD detection by flow cytometry
Acute lymphoblastic leukemia
A commonly used cut-off level to define MRD positivity is0.01% of bone marrow mononuclear cells. This level wasselected base on the typical limit of detection for routine flowcytometric and molecular assays, and it has been shown to dis-criminate patients with different risks of relapse. In a recentanalysis of 402 patients with B-lineage ALL, 183 (45.5%) hadexcellent response to treatment with MRD <0.01% after19 days of treatment [39]. A simplified flow cytometric MRDtest with a minimum panel of antibodies reliably demonstrateddetection of residual leukemia on day 15–26 of treatment [40].In this study, B-lineage ALL MRD was measured as the per-centage of CD19+ cells expressing CD10 or CD34, after gatingon CD19+ cells with lymphoid morphology. Among 84 uni-formly treated children, the 10-year incidence of relapse orremission failure was 28.8% for the 42 patients with 0.01% ormore leukemic cells versus 4.8% for the 42 patients with lowerlevels of MRDs on day 19. Borowitz et al. [33] reported thatthe presence of MRD in day-8 blood and day-29 marrow ofchildhood ALL was associated with shorter event-free survival(EFS) in all risk groups. Even patients with 0.01–0.1% day-29MRD had poorer outcome compared with patients negative forMRD patients (59 vs 88%; 5-year EFS), and demonstrated
that end-induction MRD is the single most powerful prognos-tic marker in all risk groups. They used the two-antibody com-binations CD20-FITC/CD10-PE/CD45-PerCP/CD19-APCand CD9-FITC/CD34-PE/CD45-PerCP/CD19-PE to identifyleukemic cells. Holowiecki et al. used flow cytometry to esti-mate MRD in 116 patients with Philadelphia-negative ALLenrolled in the Polish Adult leukemia Group ALL4-2002 MRD study and found that MRD ‡0.1% after remis-sion induction therapy was an independent predictor for relapsein both standard- and high-risk groups [41]. Elorza et al. [42]
reported that the presence of MRD (‡0.01%) identified agroup of patients with a 9.5-fold higher risk of relapse and a3.2-fold higher risk of death than those without MRD. Theestimated EFS rates at 2 years for the MRD-negative and -posi-tive subgroups were 74 and 20% (p = 0.004) and OS rateswere 80 and 20%, respectively (p = 0.005) [42].
Patients with higher level of MRD showed higher rate oftransplantation failure and relapse. In Philadelphia-negativeALL, MRD detected by flow cytometry in bone marrow sam-ples of patients with ALL before initiation of conditioning forallogenic stem cell transplantation was a significant predictor offailure post-transplantation [43]. Estimated disease-free survivalfor the MRD-positive and MRD-negative groups at transplantwas 33.3 and 73.5%, respectively (p = 0.03). An independentstudy [44] further confirmed that quantification of MRD levelsby flow cytometry at time of transplant predicts outcome aftermyeloablative allogeneic transplantation in ALL. OS was52.3 ± 7.6, 28.6 ± 13.8 and 0% for MRD-negative, low levels(£0.1%) and intermediate-high levels (>0.1%), respectively(p < 0.001).
Acute myeloid leukemia
Immunophenotypic MRD assessment has been shown benefi-cial for risk stratification and directed therapy in AML, despitethat variable surface antigens are tested and immunophenotypeshifts occur during the course of therapy. MRD assessmentusing flow cytometry has been integrated into the risk stratifica-tion in order to guide consolidation therapy in AML.
Venditti et al. [45] reported that an MRD level of 3.5 � 10-4
cells or higher after consolidation was significantly associatedwith poor OS and relapse-free survival in AML patientstreated with induction followed by autologous transplantation(AML-10) or serial consolidation (AML-13). The samegroup [46] reported that post-consolidation MRD, measured byflow cytometry, can predict outcomes following autologusstem cell transplantation. All patients (12 out of 12 patients)who were in the high-risk group relapsed at a median time of7 months; whereas in the low-risk group, 5 out of 19 patientsrelapsed at a median time of 11 months and 14 remained inremission for 56 months (p = 0.00004). Buccisano et al. [47]
were able to confirm a threshold of 1 in 3.5 � 104 leukemiacells as predictive of outcome, measured by multiparametricflow cytometry. Post-consolidation MRD status more faith-fully predicts disease outcome, relapse rate, OS and relapse-free survival than post-induction MRD status or karyotype in
Recent advancements of flow cytometry Review
www.expert-reviews.com 75
Exp
ert R
evie
w o
f M
olec
ular
Dia
gnos
tics
Dow
nloa
ded
from
info
rmah
ealth
care
.com
by
Nyu
Med
ical
Cen
ter
on 1
0/15
/14
For
pers
onal
use
onl
y.
100 patients with AML [47]. An independent analysis was per-formed in unselected patients with AML, who were in com-plete remission after induction and consolidation, with anextensive combination of antibody panels and found that theMRD after consolidation therapy was the only parameter asso-ciated with poorer OS [48]. Pre-transplantation MRD alsoaffects the outcome of hematopoietic stem cell transplantationin AML [49]. MRD was identified by 10-color multiparametricflow cytometry as a cell population showing deviation fromnormal antigen expression patterns when compared with nor-mal or regenerating marrow at any level. Two-year estimatesof OS in MRD-positive patients were 30.2%, which was sig-nificantly worse than 76.6% in MRD-negative patients; 2-yearestimates of relapse were 64.9 and 17.6% for MRD-positiveand MRD-negative patients. MRD-positive transplantationwas associated with increased overall mortality (hazard ratio:4.05) and relapse (hazard ratio: 8.49) relative to MRD-negative transplantation, after multivariate adjustment [49].
Through measurements of MRD by flow cytometry andwith subsequent risk-directed therapy there was improved sur-vival outcome in childhood AML [50]. An intensified inductionregimen with gemtuzumab ozogamicin was determined,depending on levels of MRD. Patients were subsequently strati-fied into consolidation chemotherapy or hematopoietic stemcell transplantation, based on MRD and genetic abnormalities.The risk-adapted therapy based on genetic features and sequen-tial MRD measurements enabled patients with AML to achievea 3-year EFS of 63% and an OS of 71%, which was signifi-cantly better than current clinical outcomes of a 3-year EFD of40–50%, and an OS of 50–60%, shown in multipletrials [51–53]. A morphologic remission in hematologic malig-nancies has a limited role as the therapeutic end point due tothe subjective nature of examination and a lack of sensitivity.Evaluation of MRD will be more desirable during the courseof therapies. Within such methods as cytogenetics and RT-PCR, multiparametric flow cytometry offered a rapid, sensitiveand specific measurement of MRD in ALL and many AMLs,particularly when performed by an experienced laboratory [54].MRD detection by flow cytometry can further predict the clin-ical outcome and stratify patients to guide consolidation ther-apy and allogenic stem cell transplantation in acute leukemia.The application was recently broadened to assess clinical out-comes of CLL [37], multiple myeloma [36] and lymphoma [55].
In vivo flow cytometry & applications in cancer biology
Despite marked advancements in technology, conventionalex vivo flow cytometry has many limitations. Removing cellsfrom the body for analysis can result in the alteration of cellu-lar properties and inherit the inability to analyze native cellularbiology, such as cell-to-cell interactions or cell metabolism.Sampling and subsequent analysis at discrete time points maybe time-consuming and can lead to low sensitivity for detectionof rare events due to limited volume and discontinuity of sam-pling. By contrast, contiguous monitoring of in vivo flowcytometry offers advantages over these limitations and provides
new insights of understanding disease biology and new optionsof the early diagnosis of many diseases, such as cancer, hemato-logic disorders and infection [56].
In vivo flow cytometry images individual cells within flowingblood or lymph, substituting as the sheath fluid seen in con-ventional flow cytometry. A laser light induces unique physicalphenomena which can be measured by corresponding cytome-try techniques, such as fluorescence, photoacoustic andphotothermal methods.
Fluorescence detection utilizes multiphoton fluorescent tech-niques [56,57]. Multiphoton fluorescence employs pulsed long-wavelength light to excite fluorophores, minimizing scatteringin the tissue and suppressing background. The techniqueincreases the depth of light penetration in the deeper tissue ofliving organisms with minimal phototoxicity. The propertiesand advantages of multiphoton flow cytometry was discussedin great detail elsewhere by Tkaczyk and Tkaczyk [57]. Forexample, multiphoton flow cytometry was applied to identifyrare events such as circulating tumor cells (CTCs) in peripheralblood. There are very limited tools to detect these low numbersof tumor cells. Current diagnostic imaging technologies,including computed tomography, magnetic resonance imagingand positron emission tomography can detect micrometastasesonly to a resolution of 2–3 mm [58]. In vivo flow cytometry cir-cumvents sampling limitations and enables detection ofextremely rare events (<1 CTC per ml of peripheral blood) bydirectly measuring fluorescence-labeled cells in the peripheralvasculature [59]. A femtosecond Ti:Sapphire laser was used fortwo photon excitation, and fluorescence was collected by ax40 IR water-immersion objective and filtered with a HQ520 nm/40 nm bandpass filter for FITC detection or a600 nm/65 nm filter for rhodamine. M109 murine lung cancercells were implanted subcutaneously on the back of a BALB/cmouse, and folate-rhodamine was injected through tail veinsfor in vivo labeling. By 2 weeks after implantation, 1.4 CTCs/min could be detected in the vasculature of the ear and thecounts increased exponentially with tumor growth despite noevidence of metastatic disease within 4 weeks [59].
Fluorescence-based in vivo flow cytometry has limitations,such as fluorescence toxicity, high intensity continuous wavelasers and limited resolution in deeper tissues. Photoacousticflow cytometry has some advantages over these limitations,including non-radiative relaxation of absorbed laser energy intoheat and accompanying acoustic effects. In photoacoustic flowcytometry, cells of interest in the bloodstream are exposed to alaser light, and the laser-induced photoacoustic waves aredetected with an ultrasound probe on the skin. Multiplex pho-toacoustic flow cytometry allows detection of multiple cellularfeatures in individual cells [60]. Circulating tumor cells targetedby two-color nanoparticles are illuminated by laser pulses atwavelengths of 639 and 900 nm at 10-ms delay. In order tolabel cancer cells in vivo, magnetic nanoparticles are conjugatedto the amino-terminal fragment of the urokinase plasminogenactivator, which serves as a dual magnetic and photoacousticcontrast agent at 639 nm. An additional photoacoustic contrast
Review Woo, Baumann & Arguello
76 Expert Rev. Mol. Diagn. 14(1), (2014)
Exp
ert R
evie
w o
f M
olec
ular
Dia
gnos
tics
Dow
nloa
ded
from
info
rmah
ealth
care
.com
by
Nyu
Med
ical
Cen
ter
on 1
0/15
/14
For
pers
onal
use
onl
y.
was used to increase sensitivity and specificity. Golden carbonnanotubes have a higher photoacoustic contrast at 900 nm fortargeting the folate receptors in cancer cells. The authors wereable to observe that flash photoacoustic signals at both 639 and900 nm gradually increased within 8–10 min after injection ofnanoparticles within 1 week of inoculation in MDAMB231 xenograft models [60]. Breast cancer cells in lymphnodes were detected before the establishment of nodal metasta-sis, using the identical technique with nanoparticles [61]. In vivophotoacoustic flow cytometry has also demonstrated its poten-tial for label-free counting of single melanoma CTCs (B16F10)within blood and lymphatic vessels of a melanoma-bearingmouse [62]. The same group further employed high-pulse repe-tition rate Yb-doped fiber-lasers with a higher pulse energy (upto 50 mJ) at 1064 nm and combined it with the enhanced con-trast of nanoparticles [63]. It demonstrated greater sensitivityand specificity than prior systems. In mice with inoculatedB16F10 melanoma cells, circulating melanoma cells in earmicrocirculation and abdominal wall vessels were detected onthe fourth day after inoculation. The circulating tumor cellswere more detected in abdominal wall blood vessels comparedwith ones in the ear, indicating the advantage of high-speedphotoacoustic flow cytometry for monitoring fast moving, cir-culating tumor cells in relatively large vessels [63].
The above-mentioned methods have shown promise in detectingcirculating tumor cells in the vasculature. However, only peripheralblood vessels with small diameter can be assessed by these methods.This limitation necessitates long-term monitoring to detect suchrare events as well as prolonged immobilization or anesthesia tomaintain an appropriate position. More sensitive and minimallyinvasive fiber-optic probes were developed to access large blood ves-sels deep inside the body to increase the sampled blood volumewith a two-photon optical fiber fluorescence probe [64]. Chang et al.monitored the minute-by-minute depletion dynamics ofMCA-207 mouse sarcoma cells in a live mouse to demonstrate thelong-term monitoring of circulating cells in blood vessels. Thedetection of fluorescence from the tip of a fiber probe inserted intothe blood circulation achieved higher sensitivity in detecting GFP-expressing cells. A two-channel, two-photon optical fiber fluores-cence probe was used. The Ti:Sapphire oscillator produced800-nm pulses at a repetition rate of 76 MHz and the fluorescencesignal was collected back by the same fiber and separated from theexcitation beam by a dichroic mirror at 730 nm, which was furtherseparated into two wavelength channels by another dichronicmirror at 610 nm. The GFP-transfected MCA-207 cells weredual-labeled with membrane-binding lipophilic dye (1,1´-diocta-decyl-3,3,3´,3´-tetramethylindoldicarbocyanine, 4-chlorobenzene-sulfonate, DiD) and injected into the mice. These in vivoexperiments show that the overall detection efficiency for identifi-able events that occur simultaneously in both channels is 27%among total number of injected cells, which was consistent within vitro experiments [64]. The ability to access large vessels, detectmultiple fluorescence molecules and monitor circulating cells for along period of time make this method clinically more applicable,with advances of faithful labeling methods such as monoclonal
antibody or nanoparticles. Applications of in vivo flow cytometryare expanding in many different fields and diseases [65–68]. The useof in vivo flow cytometry in medicine is a potentially powerfulapproach for disease detection and treatment and becomes an activearea of research. However, clinical standardization of the techniquesand clinical benefits from these applications remain to be investi-gated. For example, clinical trials of the early detection of circulat-ing tumor cells by in vivo flow cytometry and survival outcomesfrom early intervention will be critical for future utilizationand application.
Expert commentaryFlow cytometry is a powerful tool with the capacity of analyz-ing thousands of single cells within seconds, while obtainingmultiple cellular parameters that may yield important diagnos-tic information. Despite marked advancements in the under-standing of the molecular and genetic characteristics ofhematologic malignancies, morphologic and immunopheno-typic analyses remain the primary diagnostic modalities. Thespecific immunophenotypic signature of malignant cells, asestablished at diagnosis and during the course of treatment, isused for evaluation of therapeutic response after treatment anddetection of MRD. Quantification of minimal residual leuke-mic cells can estimate the reduction of disease burden followinginduction therapy and predict disease outcome. It can alsodirect subsequent therapies to modified chemotherapy or earlystem cell transplantation. The measurement of MRD hasbecome a standard of care in most ALL and AML patients, butits use can be extended to multiple myeloma and CLL.Recently, the European Leukemia Net and the EuroFlow Con-sortium established standardized protocols and software tools toanalyze immunophenotypes of normal and malignant leuko-cytes in bone marrow and blood, employing eight-colorflow cytometry.
In vivo flow cytometry has been developed to overcome sam-pling error and the alteration of the bio-physical properties ofthe cells of interest following ex vivo processing. New advancesin multiphoton cytometry, photoacoustic and photothermalmethods in combination with enhanced contrast nanoparticlesand minimally invasive fiber-optic probes enable detection ofrare circulating tumor cells in blood or lymphatic vessels beforemetastasis or tumor formation occurs in mice models. In vivoflow cytometry will improve survival outcome and ultimatelybenefit cancer patients, provided the disease can undergo earlyintervention following detection of rare circulating tumor cells,as shown in MRD of hematologic malignancy.
In addition to immunophenotypic analysis of surface anti-gens, flow cytometry can also assay intracellular antigens suchas DNA, cytokines and phosphorylated signaling proteins.Therefore, the applications in flow cytometry allow functionalanalysis and help establish therapeutic strategies to stratify high-risk cancer patients and predict therapeutic response. Further-more, less expensive and more capable instruments will createmore opportunities to help diagnose disease and influence clini-cal management in the future.
Recent advancements of flow cytometry Review
www.expert-reviews.com 77
Exp
ert R
evie
w o
f M
olec
ular
Dia
gnos
tics
Dow
nloa
ded
from
info
rmah
ealth
care
.com
by
Nyu
Med
ical
Cen
ter
on 1
0/15
/14
For
pers
onal
use
onl
y.

Five-year viewAdvances in monoclonal antibodies, optics and computationcontinue to innovate technology and make the application offlow cytometry more feasible and broad. It is extensively usedin numerous applications, particularly in hematology andoncology, to identify specific blood cell populations anddiagnose types of neutropenia, thrombocytopenia, anemia,leukemia and lymphoma. New advances in MRD detectionand in vivo flow cytometry have been made as discussed. Animportant step is to now standardize each application tofacilitate clinical feasibility and reproducibility. There shouldbe standardization of antibody panels, and laboratory proce-dures, such as processing and analysis protocols for clinicalsamples. These efforts have been initiated by multiple Euro-pean organizations. The standardization of such laboratoryprotocols will help establish clinical flow cytometry as a crit-ical and universal tool in the assessment of hematologicdiseases.
Most applications of in vivo flow cytometry have beentested in animal models. However, despite the existence oftheoretical assertions and promising animal data, no humanclinical trial has been performed that demonstrates that earlydetection of tumor cells in circulation can benefit patientswith various types of cancer. Four questions still need to beaddressed: whether circulating tumor cells can be detectedwith reasonable reproducibility in a clinical setting, whetherdetected circulating tumor cells can predict early microscopicmetastasis prior to radiographic evidence of macro-metastasis,whether early microscopic disease can be treated with currentchemotherapeutic and biological agents, and whether earlydetection of disease can be translated into better patient out-comes. As techniques evolve to become more feasible in clini-cal application, well-designed clinical trials using in vivo flowcytometry need to be conducted to demonstrate the utility ofthis method.
Significant advancements in lasers, fluorochromes, quan-tum dots and computer processing software led to the cur-rent state-of-the-art in 18-color flow cytometry. However,
fluorescence-based flow cytometry is inherently limited bythe number of spectrally resolvable fluorochromes. In orderto overcome this limitation, a new platform has been devel-oped to combine flow cytometry and mass spectrometry,called mass cytometry, using stable element isotope-conjugated antibodies [69]. The cells are atomized and ion-ized, and mass spectrometry subsequently measures heavyelements, which were previously labeled by antibodiesagainst multiple antigens. It offers single-cell analysis of atleast 40 simultaneous measurements, and theoretically iscapable of measuring 70–100 parameters at one time. Thefirst commercial version of the mass cytometer, called theCyTOF, is now produced and available [70]. It is limited bylower sensitivity and lower throughput, but has greater reso-lution and can achieve simultaneous measurements. How-ever, introduction of quantum dots, which serve as reporters,commercial chelating polymers, which allow attachment tomore metal atoms per antibody and mechanical improve-ment of mass cytometry instrumentation have improved sen-sitivity and throughput [71,72]. This technology was onlyrecently developed and is not widely used in the clinical set-ting. Continual improvements will be expected in the nextfew years as well as advancements in fluorescence flowcytometry to make these applications more feasible and reli-able in patient care. This will be critical in understandingthe complexity of many diseases and improving patient out-comes through precise diagnosis, serial monitoring and earlyintervention of disease.
Financial & competing interests disclosure
The authors have no relevant affiliations or financial involvement with
any organization or entity with a financial interest in or financial con-
flict with the subject matter or materials discussed in the manuscript.
This includes employment, consultancies, honoraria, stock ownership or
options, expert testimony, grants or patents received or pending or
royalties.
No writing assistance was utilized in the production of this
manuscript.
Key issues
• Flow cytometry is a powerful tool with the capacity to analyze thousands of single cells within seconds, while obtaining multiple cellular
parameters that may yield important diagnostic information.
• The specific immunophenotypic signature of malignant cells, as established at diagnosis and during the course of treatment, is used for
evaluation of therapeutic response after treatment and detection of minimal residual disease.
• Quantification of minimal residual leukemic cells can estimate the reduction of disease burden following induction therapy and help pre-
dict disease outcome. Recently, the European LeukemiaNet and the EuroFlow Consortium have established standardized protocols and
software tools to analyze immunophenotypes of normal and malignant leukocytes in bone marrow and blood, employing eight-color
flow cytometry.
• New advances in multiphoton cytometry, including photoacoustic and photothermal methods, in combination with enhanced contrast
nanoparticles enabled detection of rare circulating tumor cells in blood or lymphatic vessels before metastasis or tumor formation occurs
in vivo.
• Flow cytometry can assay intracellular antigens such as DNA, cytokines and phosphorylated signaling proteins, which allows functional
analysis and helps establish therapeutic strategies to stratify high-risk cancers and predict therapeutic response.
Review Woo, Baumann & Arguello
78 Expert Rev. Mol. Diagn. 14(1), (2014)
Exp
ert R
evie
w o
f M
olec
ular
Dia
gnos
tics
Dow
nloa
ded
from
info
rmah
ealth
care
.com
by
Nyu
Med
ical
Cen
ter
on 1
0/15
/14
For
pers
onal
use
onl
y.

References
Papers of special note have been highlighted as:
• of interest
•• of considerable interest
1 Fulwyler MJ. Electronic separation of
biological cells by volume. Science150(3698), 910–911 (1965).
2 Ho LL, Sinha A, Verzi M, Bernt KM,
Armstrong SA, Shivdasani RA.
DOT1L-mediated H3K79 methylation in
chromatin is dispensable for Wnt
pathway-specific and other intestinal
epithelial functions. Mol. Cell Biol. 33(9),1735–1745 (2013).
3 Kalina T, Flores-Montero J,
van der Velden VH et al. EuroFlowstandardization of flow cytometer
instrument settings and
immunophenotyping protocols. Leukemia26(9), 1986–2010 (2012).
•• Standardization of clinical flow cytometry
and analyzing software for normal and
malignant cells in peripheral blood and
bone marrow.
4 Duque RE, Andreeff M, Braylan RC,
Diamond LW, Peiper SC. Consensus review
of the clinical utility of DNA flow
cytometry in neoplastic hematopathology.
Cytometry 14(5), 492–496 (1993).
• Clinical prognosis and chromosome
abnormality in hematologic malignant
diseases.
5 Peters JM, Ansari MQ. Multiparameter
flow cytometry in the diagnosis and
management of acute leukemia. Arch.Pathol. Lab Med. 135(1), 44–54 (2011).
•• Overview of clinical applications of
multiparameter flow cytometry in acute
leukemia.
6 Paietta E, Goloubeva O, Neuberg D et al.A surrogate marker profile for PML/RAR
alpha expressing acute promyelocytic
leukemia and the association of
immunophenotypic markers with
morphologic and molecular subtypes.
Cytometry B Clin. Cytom. 59(1), 1–9(2004).
7 Khoury H, Dalal BI, Nevill TJ et al. Acutemyelogenous leukemia with t(8;21)-
identification of a specific
immunophenotype. Leuk. Lymphoma44(10), 1713–1718 (2003).
8 Falini B, Mecucci C, Tiacci E et al.Cytoplasmic nucleophosmin in acute
myelogenous leukemia with a normal
karyotype. N. Engl. J. Med. 352(3),254–266 (2005).
9 Haferlach C, Mecucci C, Schnittger S et al.AML with mutated NPM1 carrying a
normal or aberrant karyotype show
overlapping biologic, pathologic,
immunophenotypic, and prognostic features.
Blood 114(14), 3024–3032 (2009).
10 Coustan-Smith E, Mullighan CG, Onciu M
et al. Early T-cell precursor leukaemia:
a subtype of very high-risk acute
lymphoblastic leukaemia. Lancet Oncol.10(2), 147–156 (2009).
11 Vitale A, Guarini A, Ariola C et al. AdultT-cell acute lymphoblastic leukemia:
biologic profile at presentation and
correlation with response to induction
treatment in patients enrolled in the
GIMEMA LAL 0496 protocol. Blood107(2), 473–479 (2006).
12 Uckun FM, Gaynon PS, Sensel MG et al.Clinical features and treatment outcome of
childhood T-lineage acute lymphoblastic
leukemia according to the apparent
maturational stage of T-lineage leukemic
blasts: a Children’s Cancer Group study.
J. Clin. Oncol. 15(6), 2214–2221 (1997).
13 Niehues T, Kapaun P, Harms DO et al.A classification based on T cell
selection-related phenotypes identifies a
subgroup of childhood T-ALL with
favorable outcome in the COALL studies.
Leukemia 13(4), 614–617 (1999).
14 Brown M, Wittwer C. Flow cytometry:
principles and clinical applications in
hematology. Clin. Chem. 46(8 Pt 2),
1221–1229 (2000).
15 Lin P, Owens R, Tricot G, Wilson CS.
Flow cytometric immunophenotypic analysis
of 306 cases of multiple myeloma. Am. J.Clin. Pathol. 121(4), 482–488 (2004).
16 Kussick SJ, Fromm JR, Rossini A et al.Four-color flow cytometry shows strong
concordance with bone marrow morphology
and cytogenetics in the evaluation for
myelodysplasia. Am. J. Clin. Pathol. 124(2),170–181 (2005).
17 Malcovati L, Della Porta MG, Lunghi M
et al. Flow cytometry evaluation of
erythroid and myeloid dysplasia in patients
with myelodysplastic syndrome. Leukemia19(5), 776–783 (2005).
18 Hamblin TJ. Searching for surrogates for
IGHV mutations in chronic lymphocytic
leukemia. Leuk. Res. 35(11), 1432–1435(2011).
19 Crespo M, Bosch F, Villamor N et al.ZAP-70 expression as a surrogate for
immunoglobulin-variable-region mutations
in chronic lymphocytic leukemia. N. Engl.J. Med. 348(18), 1764–1775 (2003).
20 Wilcox RA. Cutaneous T-cell lymphoma:
2011 update on diagnosis, risk-stratification,
and management. Am. J. Hematol. 86(11),928–948 (2011).
21 Pettitt AR, Jackson R, Carruthers S et al.Alemtuzumab in combination with
methylprednisolone is a highly effective
induction regimen for patients with chronic
lymphocytic leukemia and deletion of
TP53: final results of the national cancer
research institute CLL206 trial. J. Clin.Oncol. 30(14), 1647–1655 (2012).
22 Irish JM, Hovland R, Krutzik PO et al.Single cell profiling of potentiated
phospho-protein networks in cancer cells.
Cell 118(2), 217–228 (2004).
•• First demonstration of intracellular
phospho flow cytometry and applications
in malignant cells.
23 Irish JM, Anensen N, Hovland R et al.Flt3 Y591 duplication and
Bcl-2 overexpression are detected in acute
myeloid leukemia cells with high levels of
phosphorylated wild-type p53. Blood109(6), 2589–2596 (2007).
24 Irish JM, Czerwinski DK, Nolan GP,
Levy R. Kinetics of B cell receptor signaling
in human B cell subsets mapped by
phospho-specific flow cytometry. J.Immunol. 177(3), 1581–1589 (2006).
• Clinical application of phospho-specific
flow cytometry in B cells.
25 Campana D. Minimal residual disease in
acute lymphoblastic leukemia. HematologyAm. Soc. Hematol. Educ. Program 2010,
7–12 (2010).
• Minimal residual disease (MRD) and
clinical application in acute lymphoblastic
leukemia.
26 Ravandi F, Jorgensen JL. Monitoring
minimal residual disease in acute myeloid
leukemia: ready for prime time? J. NatlCompr. Canc. Netw. 10(8), 1029–1036(2012).
• MRD and clinical applications in acute
myeloid leukemia.
27 Lodewyck T, Cornelissen JJ. Allogeneic
stem cell transplantation in acute myeloid
leukemia: a risk-adapted approach. BloodRev. 22(6), 293–302 (2008).
28 Buccisano F, Maurillo L, Del Principe MI
et al. Prognostic and therapeutic
implications of minimal residual disease
detection in acute myeloid leukemia. Blood119(2), 332–341 (2012).
29 Kern W, Bacher U, Haferlach C,
Schnittger S, Haferlach T. The role of
multiparameter flow cytometry for disease
Recent advancements of flow cytometry Review
www.expert-reviews.com 79
Exp
ert R
evie
w o
f M
olec
ular
Dia
gnos
tics
Dow
nloa
ded
from
info
rmah
ealth
care
.com
by
Nyu
Med
ical
Cen
ter
on 1
0/15
/14
For
pers
onal
use
onl
y.

monitoring in AML. Best Pract. Res. Clin.Haematol. 23(3), 379–390 (2010).
30 Grimwade D, Vyas P, Freeman S.
Assessment of minimal residual disease in
acute myeloid leukemia. Curr. Opin. Oncol.22(6), 656–663 (2010).
31 Campana D. Role of minimal residual
disease monitoring in adult and pediatric
acute lymphoblastic leukemia. Hematol.Oncol. Clin. North Am. 23(5), 1083–1098,vii (2009).
32 Coustan-Smith E, Sandlund JT, Perkins SL
et al. Minimal disseminated disease in
childhood T-cell lymphoblastic lymphoma:
a report from the children’s oncology group.
J. Clin. Oncol. 27(21), 3533–3539 (2009).
33 Borowitz MJ, Devidas M, Hunger SP et al.Clinical significance of minimal residual
disease in childhood acute lymphoblastic
leukemia and its relationship to other
prognostic factors: a Children’s Oncology
Group study. Blood 111(12), 5477–5485
(2008).
34 Baer MR, Stewart CC, Dodge RK et al.High frequency of immunophenotype
changes in acute myeloid leukemia at
relapse: implications for residual disease
detection (Cancer and Leukemia Group B
Study 8361). Blood 97(11), 3574–3580
(2001).
35 Arnoulet C, Bene MC, Durrieu F et al.Four- and five-color flow cytometry analysis
of leukocyte differentiation pathways in
normal bone marrow: a reference document
based on a systematic approach by the
GTLLF and GEIL. Cytometry B Clin.Cytom. 78(1), 4–10 (2010).
36 Rawstron AC, Child JA, de Tute RM et al.Minimal residual disease assessed by
multiparameter flow cytometry in multiple
myeloma: impact on outcome in the
medical research council myeloma IX study.
J. Clin. Oncol. 31(20), 2540–2547 (2013).
37 Bottcher S, Ritgen M, Fischer K et al.Minimal residual disease quantification is an
independent predictor of progression-free
and overall survival in chronic lymphocytic
leukemia: a multivariate analysis from the
randomized GCLLSG CLL8 trial. J. Clin.Oncol. 30(9), 980–988 (2012).
38 Rawstron AC, Villamor N, Ritgen M et al.International standardized approach for flow
cytometric residual disease monitoring in
chronic lymphocytic leukaemia. Leukemia21(5), 956–964 (2007).
• Standardizatioin of clinical flow cytometry
in chronic lymphocytic leukemia.
39 Campana D. Molecular determinants of
treatment response in acute lymphoblastic
leukemia. Hematology Am. Soc. Hematol.Educ. Program 366–373 (2008).
40 Coustan-Smith E, Ribeiro RC, Stow P et al.A simplified flow cytometric assay identifies
children with acute lymphoblastic leukemia
who have a superior clinical outcome. Blood108(1), 97–102 (2006).
41 Holowiecki J, Krawczyk-Kulis M, Giebel S
et al. Status of minimal residual disease after
induction predicts outcome in both
standard and high-risk Ph-negative adult
acute lymphoblastic leukaemia. The Polish
Adult Leukemia Group ALL 4-2002 MRD
Study. Br. J. Haematol. 142(2), 227–237(2008).
42 Elorza I, Palacio C, Dapena JL, Gallur L,
Sanchez de Toledo J, Diaz de Heredia C.
Relationship between minimal residual
disease measured by multiparametric flow
cytometry prior to allogeneic hematopoietic
stem cell transplantation and outcome in
children with acute lymphoblastic leukemia.
Haematologica 95(6), 936–941 (2010).
43 Sanchez J, Serrano J, Gomez P et al.Clinical value of immunological monitoring
of minimal residual disease in acute
lymphoblastic leukaemia after allogeneic
transplantation. Br. J. Haematol. 116(3),686–694 (2002).
44 Sanchez-Garcia J, Serrano J,
Serrano-Lopez J et al. Quantification of
minimal residual disease levels by flow
cytometry at time of transplant predicts
outcome after myeloablative allogeneic
transplantation in ALL. Bone MarrowTransplant. 48(3), 396–402 (2013).
45 Venditti A, Buccisano F, Del Poeta G et al.Level of minimal residual disease after
consolidation therapy predicts outcome in
acute myeloid leukemia. Blood 96(12),
3948–3952 (2000).
46 Venditti A, Maurillo L, Buccisano F et al.Pretransplant minimal residual disease level
predicts clinical outcome in patients with
acute myeloid leukemia receiving high-dose
chemotherapy and autologous stem cell
transplantation. Leukemia 17(11),
2178–2182 (2003).
47 Buccisano F, Maurillo L, Gattei V et al.The kinetics of reduction of minimal
residual disease impacts on duration of
response and survival of patients with acute
myeloid leukemia. Leukemia 20(10),
1783–1789 (2006).
48 Kern W, Voskova D, Schoch C,
Hiddemann W, Schnittger S, Haferlach T.
Determination of relapse risk based on
assessment of minimal residual disease
during complete remission by
multiparameter flow cytometry in unselected
patients with acute myeloid leukemia. Blood104(10), 3078–3085 (2004).
49 Walter RB, Gooley TA, Wood BL et al.Impact of pretransplantation minimal
residual disease, as detected by
multiparametric flow cytometry, on
outcome of myeloablative hematopoietic cell
transplantation for acute myeloid leukemia.
J. Clin. Oncol. 29(9), 1190–1197 (2011).
50 Rubnitz JE, Inaba H, Dahl G et al.Minimal residual disease-directed therapy
for childhood acute myeloid leukaemia:
results of the AML02 multicentre trial.
Lancet Oncol. 11(6), 543–552 (2010).
• MRD-guided therapeutic intervention in
childhood acute myeloid leukemia.
51 Rubnitz JE, Crews KR, Pounds S et al.Combination of cladribine and cytarabine is
effective for childhood acute myeloid
leukemia: results of the St Jude
AML97 trial. Leukemia 23(8), 1410–1416
(2009).
52 Lange BJ, Smith FO, Feusner J et al.Outcomes in CCG-2961, a children’soncology group phase 3 trial for untreated
pediatric acute myeloid leukemia: a report
from the children’s oncology group. Blood111(3), 1044–1053 (2008).
53 Becton D, Dahl GV, Ravindranath Y et al.Randomized use of cyclosporin A (CsA) to
modulate P-glycoprotein in children with
AML in remission: Pediatric Oncology
Group Study 9421. Blood 107(4),
1315–1324 (2006).
54 Coustan-Smith E, Campana D. Should
evaluation for minimal residual disease be
routine in acute myeloid leukemia? Curr.Opin. Hematol. 20(2), 86–92 (2013).
55 Bottcher S, Ritgen M, Kneba M. Flow
cytometric MRD detection in selected
mature B-cell malignancies. Methods Mol.Biol. 971, 149–174 (2013).
56 Tuchin VV, Tarnok A, Zharov VP. In vivoflow cytometry: a horizon of opportunities.
Cytometry A 79(10), 737–745 (2011).
• Overview of in vivo flow cytometry and
applications.
57 Tkaczyk ER, Tkaczyk AH. Multiphoton
flow cytometry strategies and applications.
Cytometry A 79(10), 775–788 (2011).
• Overview of multiphoton flow cytometry
and applications.
58 Benaron DA. The future of cancer imaging.
Cancer Metastasis Rev. 21(1), 45–78 (2002).
59 He W, Wang H, Hartmann LC, Cheng JX,
Low PS. In vivo quantitation of rare
circulating tumor cells by multiphoton
Review Woo, Baumann & Arguello
80 Expert Rev. Mol. Diagn. 14(1), (2014)
Exp
ert R
evie
w o
f M
olec
ular
Dia
gnos
tics
Dow
nloa
ded
from
info
rmah
ealth
care
.com
by
Nyu
Med
ical
Cen
ter
on 1
0/15
/14
For
pers
onal
use
onl
y.
intravital flow cytometry. Proc. Natl Acad.Sci. USA 104(28), 11760–11765 (2007).
• Fluorescence-based detection of rare
circulating tumor cells in vivo.
60 Galanzha EI, Shashkov EV, Kelly T,
Kim JW, Yang L, Zharov VP. In vivomagnetic enrichment and multiplex
photoacoustic detection of circulating
tumour cells. Nat. Nanotechnol. 4(12),855–860 (2009).
• Photoacoustic detection of circulating
tumor cells in vivo.
61 Galanzha EI, Kokoska MS, Shashkov EV,
Kim JW, Tuchin VV, Zharov VP. In vivofiber-based multicolor photoacoustic
detection and photothermal purging of
metastasis in sentinel lymph nodes targeted
by nanoparticles. J. Biophotonics 2(8–9),528–539 (2009).
62 Galanzha EI, Shashkov EV, Spring PM,
Suen JY, Zharov VP. In vivo, noninvasive,label-free detection and eradication of
circulating metastatic melanoma cells using
two-color photoacoustic flow cytometry
with a diode laser. Cancer Res. 69(20),7926–7934 (2009).
63 Nedosekin DA, Sarimollaoglu M, Ye JH,
Galanzha EI, Zharov VP. In vivo ultra-fastphotoacoustic flow cytometry of circulating
human melanoma cells using near-infrared
high-pulse rate lasers. Cytometry A 79(10),
825–833 (2011).
64 Chang YC, Ye JY, Thomas TP et al.Fiber-optic multiphoton flow cytometry in
whole blood and in vivo. J. Biomed. Opt.15(4), 047004 (2010).
65 Galanzha EI, Sarimollaoglu M,
Nedosekin DA, Keyrouz SG, Mehta JL,
Zharov VP. In vivo flow cytometry of
circulating clots using negative photothermal
and photoacoustic contrasts. Cytometry A79(10), 814–824 (2011).
66 Galanzha EI, Shashkov E, Sarimollaoglu M
et al. In vivo magnetic enrichment,
photoacoustic diagnosis, and photothermal
purging of infected blood using
multifunctional gold and magnetic
nanoparticles. PLoS ONE 7(9), e45557
(2012).
67 Galanzha EI, Zharov VP. Photoacoustic
flow cytometry. Methods 57(3), 280–296(2012).
68 Nedosekin DA, Juratli MA,
Sarimollaoglu M et al. Photoacoustic andphotothermal detection of circulating tumor
cells, bacteria and nanoparticles in
cerebrospinal fluid in vivo and ex vivo. J.Biophotonics 6(6–7), 523–533 (2013).
69 Bendall SC, Nolan GP, Roederer M,
Chattopadhyay PK. A deep profiler’s guideto cytometry. Trends Immunol. 33(7),323–332 (2012).
•• A comprehensive review of mass cytometry.
70 Bandura DR, Baranov VI, Ornatsky OI
et al. Mass cytometry: technique for real
time single cell multitarget immunoassay
based on inductively coupled plasma
time-of-flight mass spectrometry. Anal.Chem. 81(16), 6813–6822 (2009).
71 Chattopadhyay PK. Quantum dot
technology in flow cytometry. Methods CellBiol. 102, 463–477 (2011).
72 Majonis D, Herrera I, Ornatsky O et al.Synthesis of a functional metal-chelating
polymer and steps toward quantitative mass
cytometry bioassays. Anal. Chem. 82(21),8961–8969 (2010).
Recent advancements of flow cytometry Review
www.expert-reviews.com 81
Exp
ert R
evie
w o
f M
olec
ular
Dia
gnos
tics
Dow
nloa
ded
from
info
rmah
ealth
care
.com
by
Nyu
Med
ical
Cen
ter
on 1
0/15
/14
For
pers
onal
use
onl
y.