Embed Size (px)
Citation preview
This journal is© the Owner Societies 2014 Phys. Chem. Chem. Phys., 2014, 16, 23779--23791 | 23779
Cite this:Phys.Chem.Chem.Phys.,
2014, 16, 23779
ReaxFF reactive molecular dynamics on siliconpentaerythritol tetranitrate crystal validates themechanism for the colossal sensitivity†
Tingting Zhou,*ab Lianchi Liu,ac William A. Goddard III,*a Sergey V. Zybina andFenglei Huangd
Recently quantum mechanical (QM) calculations on a single Si-PETN (silicon-pentaerythritol tetranitrate)
molecule were used to explain its colossal sensitivity observed experimentally in terms of a unique Liu
carbon-silyl nitro-ester rearrangement (R3Si–CH2–O–R2 - R3Si–O–CH2–R2). In this paper we
expanded the study of Si-PETN from a single molecule to a bulk system by extending the ReaxFF reac-
tive force field to describe similar Si–C–H–O–N systems with parameters optimized to reproduce QM
results. The reaction mechanisms and kinetics of thermal decomposition of solid Si-PETN were investi-
gated using ReaxFF reactive molecular dynamics (ReaxFF-RMD) simulations at various temperatures
to explore the origin of the high sensitivity. We find that at lower temperatures, the decomposition of
Si-PETN is initiated by the Liu carbon-silyl nitro-ester rearrangement forming Si–O bonds which is not
observed in PETN. As the reaction proceeds, the exothermicity of Si–O bond formation promotes the
onset of NO2 formation from N–OC bond cleavage which does not occur in PETN. At higher tempera-
tures PETN starts to react by the usual mechanisms of NO2 dissociation and HONO elimination; however,
Si-PETN remains far more reactive. These results validate the predictions from QM that the significantly
increased sensitivity of Si-PETN arises from a unimolecular process involving the unusual Liu rearrange-
ment but not from multi-molecular collisions. It is the very low energy barrier and the high exothermicity
of the Si–O bond formation providing energy early in the decomposition process that is responsible.
1. Introduction
The explosive properties of pentaerythritol tetranitrate (PETN,C–(CH2–O–NO2)4) have been studied thoroughly both experimen-tally1–9 and theoretically.10–16 It has good detonation velocityand pressure, slightly below those of RDX (cyclotrimethylenetrinitramine) but well above TNT (trinitrotoluene),17 making itextensively used in blasting cap fillings, detonation cords,
demolition devices, industrial explosives, etc.2,17 However, it isquite sensitive to impact, more so than RDX and much morethan TNT. Recently, its silicon analogue, silicon-pentaerythritoltetranitrate (Si-PETN, Si–(CH2–O–NO2)4), was synthesized by thenitration of tetrakis (hydroxymethyl) silane with excess nitricacid (100%) in 1,2-dichloroethane at 0 1C.18 Si-PETN has amolecular structure isomorphic with PETN, with the centralcarbon atom replaced by a silicon atom. Unexpectedly, it exhibitsa dramatically enhanced sensitivity, exploding upon every con-tact with a Teflon spatula,18 making it extremely dangerous anddifficult to study, particularly by experiments. On one occasion acrystalline material was selected for X-ray diffraction studies, butit exploded under the microscope. Because of its extreme sensi-tivity, it was characterized only by means of NMR spectroscopy. Asignificant degree of decomposition of Si-PETN was observed by29Si NMR spectroscopy after 12 h of synthesis, showing that thedecomposition products of Si-PETN must contain a siloxanefeature of the type –OSi–(CH2OR)2O–, which is quite differentfrom its carbon analogue PETN but is fully in agreement withDFT calculations.18
To uncover the origin of this highly increased sensitivity ofSi-PETN compared to PETN, Klapotke et al.18 studied the
a Materials and Process Simulation Center, California Institute of Technology,
139-74, Pasadena, California, 91125, USA. E-mail: [email protected] Institute of Applied Physics and Computational Mathematics, Beijing, 100094,
P. R. China. E-mail: [email protected] School of Chemistry and Chemical Engineering, Shanghai Jiao Tong University,
Shanghai, 200240, P. R. Chinad State Key Laboratory of Explosion Science and Technology,
Beijing Institute of Technology, Beijing, 100081, P. R. China
† Electronic supplementary information (ESI) available: Comparisons of ReaxFFand QM energies for Si–C, Si–O, and Si–N bond dissociations are shown in Fig. S1.Comparisons of ReaxFF and QM bending energies for Si–O–C, O–Si–C, C–Si–C,and Si–O–N angles are presented in Fig. S2. The bond-order cutoffs for each pairof atoms used to identify molecular species in the fragment analysis are tabulatedin Table S1. The ReaxFF force field parameters used in this paper are collected in‘‘ESI-ffield.txt’’. See DOI: 10.1039/c4cp03781b
Received 22nd August 2014,Accepted 16th September 2014
DOI: 10.1039/c4cp03781b
www.rsc.org/pccp
PCCP
PAPER
Publ
ishe
d on
17
Sept
embe
r 20
14. D
ownl
oade
d by
Cal
ifor
nia
Inst
itute
of
Tec
hnol
ogy
on 0
4/12
/201
4 16
:24:
54.
View Article OnlineView Journal | View Issue

23780 | Phys. Chem. Chem. Phys., 2014, 16, 23779--23791 This journal is© the Owner Societies 2014
electrostatic potential as well as natural bond orbital of the twocompounds using DFT calculations at the B3LYP/6-31G(d) leveland concluded that the increased sensitivity of Si-PETN is likelydue to the greater tendency to form Si–O bonds, compared tothe formation of C–O bonds in the case of PETN. Then Liuet al.19 carried out extensive studies of the unimoleculardecomposition reaction pathways for both Si-PETN and PETNby DFT calculations using the unrestricted hybrid functionalUB3LYP as well as UM06 at the 6-311G** level. They examinedthe reaction energies or activation barriers for five distinctreaction pathways: (1) O–NO2 bond rupture to dissociate NO2;(2) NO3 dissociation; (3) the formation of CH2O and NO2; (4)HONO elimination; (5) Si–O bond formation. The results indi-cate that the barrier for Si–O bond formation in Si-PETN is32.0 kcal mol�1, lower than the barriers for other reactions, e.g. thebarrier for O–NO2 bond rupture in Si-PETN is 35.6 kcal mol�1 andin PETN is 39.0 kcal mol�1, and the barrier for the centralC–O bond breaking in PETN is 80.1 kcal mol�1. They attributedthe colossal sensitivity of Si-PETN to the low barrier and highexothermicity of the rearrangement reaction in which the g Oattacks the central Si atom, makes a new Si–O bond and breaks aSi–C bond, a pathway not available to PETN. The transition state ofthe rearrangement reaction in Si-PETN is formed by bending theC–ONO2 angle, breaking the partial Si–C bond, and making theSi–O bond concurrently with a five coordinate Si. The barrier for thisLiu carbon-silyl nitro-ester rearrangement is lower than for thenormal reactions in PETN: O–NO2 bond breaking (39.0 kcal mol�1)and HONO elimination (39.2 kcal mol�1). Furthermore, they foundthat the overall rearrangement is quite exothermic (45 kcal mol�1),whereas the initial step of PETN (O–NO2 bond dissociation) isendothermic by 39 kcal mol�1. Murray et al.20 later investigatedcomputationally why the barrier of the rearrangement is so muchlower for Si-PETN than for PETN. Their reaction force analysis foundthat most of the difference between the rearrangement barriers forthe two compounds comes about in the initial stages of the process,in which Si-PETN benefits from a 1,3 electrostatic interactioninvolving a positive s-hole on the silicon and the negative linkingoxygen, and the central silicon is more able than carbon totemporarily expand its coordination sphere.
Sensitivity is an extremely important issue for energetic materials(EMs); however, no clear understanding about the molecular andstructural determinants controlling their sensitivity to externalstimuli has been well established. Although its high instabilityprohibits its applications in munitions, Si-PETN could providevaluable information about the nature of sensitivity in EMs. Usingfirst-principles DFT with an empirical van der Waals correction, Linet al.21 predicted the stable equilibrium structures and equation ofstate for Si-PETN. Their results suggest that a phase transition at amuch lower pressure than PETN may explain the inherent instabil-ity of Si-PETN. To help settle the issue, we consider it would be mostuseful to understand the atomistic processes involved in thermaldecomposition and explosion. Although the quantum mechanics(QM) methods usually applied to the studies of chemical reactionprocesses are not capable of treating the spatial and time scalesinvolved, we expect that ReaxFF reactive molecular dynamics(ReaxFF-RMD) simulations are in principle well-suited to explore
the complicated chemistry behind thermal decomposition andexplosion of bulk Si-PETN. This is because similar ReaxFF reactiveforce fields for other materials have been validated to predictaccurately both the reactivity of bonds and mechanical propertiesof condensed phases.16,22–31 The studies of anisotropic sensitivity ofPETN and HMX,16,24 thermal decomposition of HMX (cyclotetra-methylene tetranitramine), TATB (triamino-trinitrobenzene), andRDX,25–27 shock dynamics of RDX and PBX (plastic bonded explo-sives),28–31 and so forth using ReaxFF-RMD lead to the results inaccordance with available experimental data, making it practical todescribe chemical reactions occurring under various conditionsduring the large scale dynamical processes involving millions ofatoms with currently available computational facilities.
To explore the thermal induced chemistry and the reasonsfor dramatically enhanced sensitivity in Si-PETN, we extendedthe ReaxFF parameters aiming at providing accurate descrip-tions of chemical and physical properties for solid Si-PETN.Using ReaxFF-RMD simulations, we can predict crystal struc-tures and simulate changes in bonding associated with thedecomposition of Si-PETN and observe the distribution ofproducts formed, gaining insight into how decomposition isinitiated and proceeds. By performing simulations at varioustemperatures, the temperature-dependent reaction rates can bedetermined, allowing us to directly calculate kinetic parametersfor the Si-PETN decomposition process. The rest of this paperis organized as follows: Section 2 describes computationalmethods; force field training results are provided in Section3.1 followed by several validation tests in Section 3.2, andthermal decomposition mechanisms are given in Section 3.3;and conclusions are drawn in Section 4. We consider that thesesimulations are critical to understand the initial decompositionmechanisms in solid Si-PETN and its colossal sensitivity.
2. Computational methodology2.1 The ReaxFF reactive force field
On the basis of the bond order/bond distance relationship,32,33
ReaxFF22,23 allows for an accurate description of bond breakingand bond formation, including a smooth transition from non-bonded to bonded systems. The connectivity-dependent inter-actions such as valence angles and torsion angles are also bondorder-dependent so that their energy contributions disappearupon bond dissociation. Since the bond orders are updated everyiteration, the connectivity of the system can continuously change.Furthermore, ReaxFF incorporates nonbonded (van der Waals andCoulombic) interactions between every atom pair regardless ofconnectivity, with the repulsion of atoms at close range beingavoided by shielding and the long-range attraction supplementedby low gradient correction. Additional potential energy correctionsto properly describe bond dissociation and formation in differentchemical environments are also considered.
The potential functions used in this application of ReaxFF areshown in eqn (1), which are the same as those reported recently:34
Etotal = Ebond + Elp + Eover + Eunder + Eval + Epen + Ecoa + Etors
+ Econj + EH-bond + Evdw + Ecoulomb + Elg (1)
Paper PCCP
Publ
ishe
d on
17
Sept
embe
r 20
14. D
ownl
oade
d by
Cal
ifor
nia
Inst
itute
of
Tec
hnol
ogy
on 0
4/12
/201
4 16
:24:
54.
View Article Online
This journal is© the Owner Societies 2014 Phys. Chem. Chem. Phys., 2014, 16, 23779--23791 | 23781
where Elp corresponds to the lone pair energy penalty based onthe number of lone pairs around an atom, Eover to the energypenalty for overcoordinated atoms, Eunder to the energy con-tribution for the resonance of the p-electron between attachedundercoordinated atomic centers, Epen to the energy penaltyneeded to reproduce the stability of systems with double bondssharing an atom in a valence angle, Ecoa to the three-bodyconjugation term to describe the stability of –NO2 groups, Econj
to the contribution of conjugation effects to molecular energy,and Elg to the contribution of long range London dispersion.
ReaxFF reactive force field coupled with the moleculardynamics method provides nearly the accuracy of the bestQM but at a computational cost of solving Newton’s equationof motion on nuclei only, making it practical to simulatecomplicated processes with large size and long time scale.
2.2 Quantum mechanics calculations
We developed the Si-PETN ReaxFF force field to accuratelyreproduce the first-principles QM interactions in Si–C–H–N–Osystems and to provide a way to extend the first-principlesaccuracy to much larger length and time scales needed to examinethe processes of interest here. The training set was extended byadding QM data for systems relevant to Si-PETN chemistry to theReaxFF training set for energetic materials34 (C–H–O–N interac-tions) combined with that for PDMS35 (Si–C–O–H interactions).These include Si–N in H2NSiH3 and the SiQN in HNQSiH2
scanned to represent silicon–nitrogen bond energy and dissocia-tion pathways, Si–O–N in H3SiONH2 scanned to represent Si–O–Nangle bending energy, as well as reaction pathways for theSi-PETN molecule. QM data were derived from DFT calculationsusing the B3LYP functional36,37 and the Pople 6-311G** basis set38
as implemented in the Jaguar 7.5 program package.39 The com-plete QM-derived training set includes atomic bond energy curves,dissociation energies, angle bending energy curves, charge dis-tributions, equation of state, and other relevant material proper-ties, such as heats of formation, energies for molecules withunder- and over-coordinated atoms, reaction pathways, andothers, for all possible interactions among Si, C, H, O, and N.
2.3 Reactive molecular dynamics simulations
X-ray diffraction measurements determined that the spacegroup of the PETN crystal under ambient conditions is P421cwith the S4 molecular point group.4,40 Experimental and DFTcalculations also predicted that the PETN molecule has S4
symmetry in the crystalline phase under ambient condi-tions.13,14 PETN has been found experimentally to have threecrystalline phases5,40,41 where the most stable PETN-I hascrystal symmetry P421c with two formula units per unit cell.41
The crystal structure data for Si-PETN are unavailable experi-mentally due to its extreme instability. By replacing the centralcarbon atom of PETN by silicon, Lin et al.21 relaxed threedifferent types of Si-PETN crystal structures by DFT calculationsand found that the most stable structure is Si-PETN-I (P421cspace group, S4 molecule symmetry). Hence, the Si-PETN crystalwith P421c space group and S4 molecule symmetry served as thebasic structure for the calculations reported here.
The developed force field was validated by predicting mole-cular and crystal structures of Si-PETN. We replaced the centralcarbon atom of PETN with a silicon atom without changing theCartesian atomic coordinates to prepare the initial Si-PETNstructure. The optimized molecular structure was obtained byenergy minimization using the Shanno conjugate gradientmethod.42 The procedure to predict crystal structure by ReaxFFinvolved minimization of a 2 � 2 � 3 supercell including 696atoms to optimize the atomic positions as well as cell para-meters followed by isothermal–isobaric molecular dynamics(NPT-MD) simulations at atmospheric pressure to relax internalstresses. Two temperatures were initiated using a MaxwellBoltzmann distribution of velocities at 5 and 300 K. Here, weused the Nose–Hoover thermostat (100 fs damping constant)and the Rahman Parrinello barostat (1000 fs damping con-stant) to control temperature and pressure, respectively. TheNPT-MD simulations were performed for 40 ps with the last20 ps used for statistical calculation of equilibrium lattice para-meters. A time step of 0.2 fs was employed in these simulations.
The equilibrium crystal structure at 300 K was then used as theinitial structure to investigate the thermal decomposition mechan-isms and kinetics of bulk Si-PETN at six temperatures: 1000, 1200,1400, 1600, 1800, and 2000 K. The material was quickly heatedfrom 300 K to target temperatures (e.g. the system was heated from300 K to 1600 K in 0.1 ps) using a canonical (NVT) ensemble priorto observing any reactive events. Thereafter, molecular dynamicssimulations with the NVT ensemble were performed at these targettemperatures for at least 20 picoseconds. To consider the influenceof an increase in temperature on decomposition mechanisms andkinetics due to energy release from exothermal reactions, addi-tional RMD simulations were carried out using a microcanonical(NVE) ensemble at the initial temperatures of 1200, 1400, 1600 and1800 K for at least 100 picoseconds. The time step in these RMDsimulations of thermal decomposition was set to 0.1 fs to describecorrectly the high-temperature, thermally induced chemical reac-tions under homogeneous conditions. The results from thesesimulations were used to investigate the kinetics of decompositionand product distributions as a function of temperature. Thealgorithm of molecule recognition in the product analysis usesthe connection table and bond orders calculated by ReaxFF at eachstep and records the molecular components and their composi-tions every 50 fs. In this analysis, appropriate bond-order cutoffsfor each pair of atoms were used to identify molecular species inthe systems, which are tabulated in Table S1 of the ESI.† The bond-order cutoffs do not affect the simulations but only the interpreta-tion in terms of chemical components.
All MD simulations were performed using the ‘‘Large-scaleAtomic/Molecular Massively Parallel Simulator’’ (LAMMPS)43 molec-ular dynamics program from Sandia National Laboratories.
3. Results and discussion3.1 Development of the ReaxFF force field
We started with recently derived ReaxFF parameters for C/H/N/Ofrom ref. 35 and Si/C/O/H from ref. 36 and then optimized these
PCCP Paper
Publ
ishe
d on
17
Sept
embe
r 20
14. D
ownl
oade
d by
Cal
ifor
nia
Inst
itute
of
Tec
hnol
ogy
on 0
4/12
/201
4 16
:24:
54.
View Article Online
23782 | Phys. Chem. Chem. Phys., 2014, 16, 23779--23791 This journal is© the Owner Societies 2014
parameters to minimize the differences between QM and ReaxFFresults. These optimized parameters are available in a ‘‘ffield’’file in the ESI.† The results of fitting with respect to the originalC/H/O/N training set are consistent with the published values,34
while the results with respect to Si/C/O/H are not quite the samesince the parameters for Si/C/O/H were obtained using a differentpotential function35 that does not include the extra inner wall44
exponential and the low gradient34 long-range van der Waalsattraction. Here, only the new results for the systems relevant toSi-PETN are presented.
To obtain the silicon nitrogen bond energy, we used thedissociation pathway for the Si–N single bond in H2NSiH3 andthe SiQN double bond in HNQSiH2. In performing DFTcalculations, we determined ground-state structures throughfull geometry optimizations. Then, dissociation profiles werecalculated by constraining only the bond length of interest andre-optimization of the remaining internal coordinates. To opti-mize the ReaxFF parameters, the DFT results for the singletcase were used around the equilibrium bond distance while thedissociation limit was fitted against the DFT results for thetriplet state. The trends in ReaxFF dissociation energy as well asequilibrium bond distance for Si–C/Si–O/Si–N are in goodagreement with the QM data as shown in Fig. S1 of the ESI.†
The valence angle parameters were optimized to representangle bending energies from DFT calculations on various mole-cules. For each case, the geometry of the representative moleculewas optimized with the angles of interest fixed to obtain anglebending energies relative to the optimal geometry. These includevarious molecules in the training set to cover possible Si/N/C/O/Hvalence angle combinations, such as Si–O–N, C–Si–C, Si–Si–C,Si–C–Si, O–C–Si, Si–O–C, O–Si–C, etc. The results for the fourtypical angles C–Si–C, Si–O–C, Si–O–N, and O–Si–C presenting inSi-PETN from ReaxFF are in reasonable agreement with thosefrom QM calculations (see Fig. S2 of the ESI†). The parametersrelated to the torsion angle were also optimized to better describethe molecular structure of Si-PETN, in particular the dihedrals likeSi–C–O–N and C–Si–C–O that are easy to be distorted.
Liu et al.19 examined the reaction energies or activationbarriers for five distinct reaction pathways related to thedecomposition of gas phase Si-PETN by QM calculations, whichwere added to the training set of this force field. The obtainedenergies from ReaxFF along with those from QM are collectedin Table 1. Although there are some differences in these
energies from the two methods, the relative positions of thesereactions in ReaxFF are consistent with QM results. Thus theinitial reaction mechanism favors Si–O bond formation com-pared to O–NO2 bond cleavage.
3.2 Molecular and crystal structures of Si-PETN
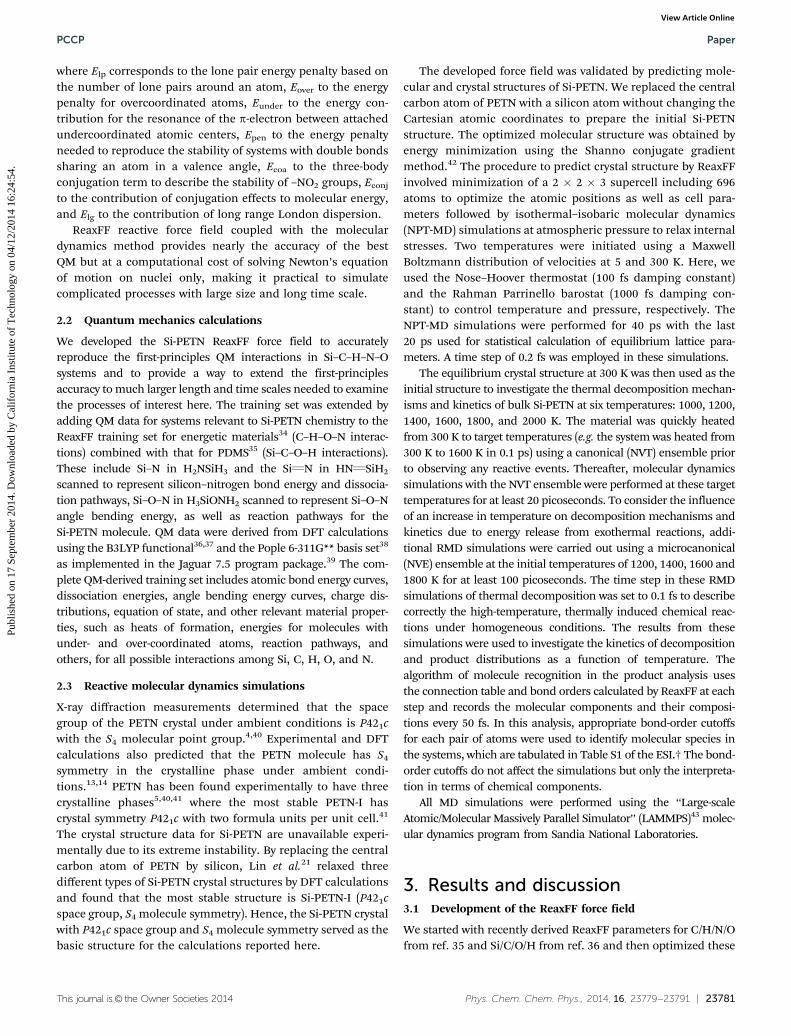
11 low energy conformers with various symmetries have beensuggested for the PETN molecule by DFT calculations.14 Usingthe same Cartesian atomic coordinates and replacing thecentral carbon atom by silicon, we employed both the QMmethod (B3LYP/6-311G**) and the ReaxFF force field to opti-mize these structures and to compare their stabilities. Asshown in Fig. 1, the optimized structures from ReaxFF agreewell with those from QM, with the RMSD for all conformerssmaller than 0.96 Å, validating that the ReaxFF force fielddescribes well the Si-PETN molecular structures. Additionally,the molecule with S4 symmetry has the lowest energy from bothQM and ReaxFF calculations. Critical bonds, angles, as well astorsions presenting in this structure are summarized inTable 2, showing excellent consistency in the results from QMand ReaxFF. We did not include the 10 higher energy confor-mers in optimizing ReaxFF parameters since our focus was onthe exploration of the reasons for the high sensitivity ratherthan molecular conformation transformation.
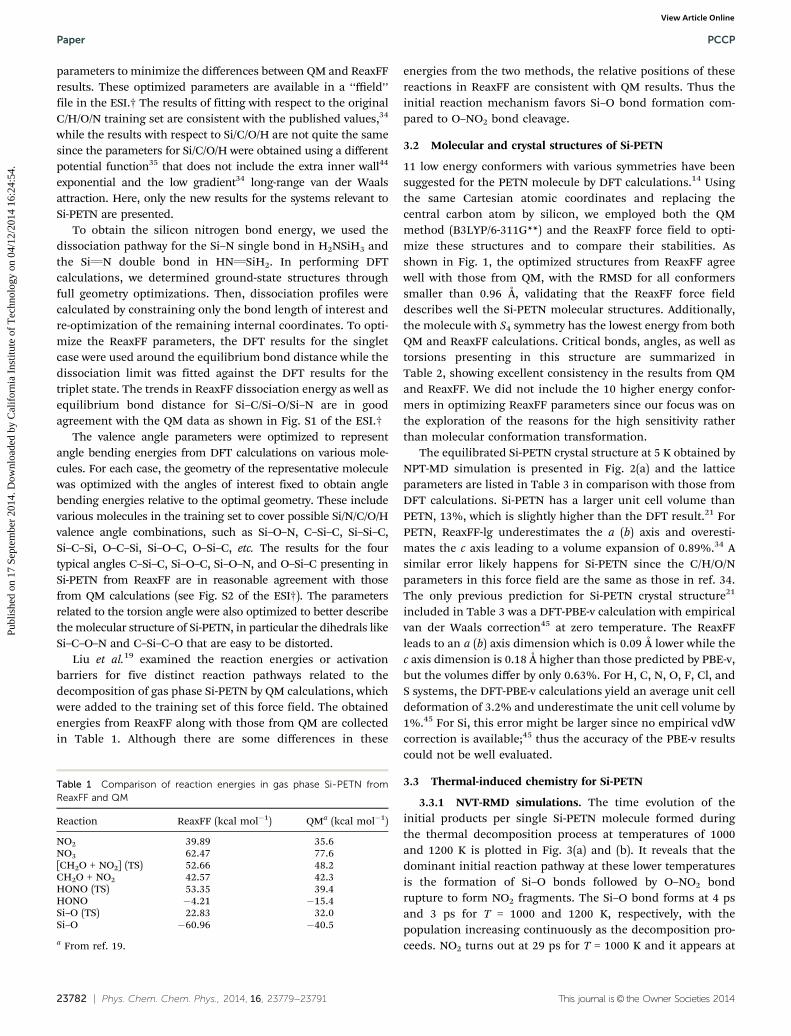
The equilibrated Si-PETN crystal structure at 5 K obtained byNPT-MD simulation is presented in Fig. 2(a) and the latticeparameters are listed in Table 3 in comparison with those fromDFT calculations. Si-PETN has a larger unit cell volume thanPETN, 13%, which is slightly higher than the DFT result.21 ForPETN, ReaxFF-lg underestimates the a (b) axis and overesti-mates the c axis leading to a volume expansion of 0.89%.34 Asimilar error likely happens for Si-PETN since the C/H/O/Nparameters in this force field are the same as those in ref. 34.The only previous prediction for Si-PETN crystal structure21
included in Table 3 was a DFT-PBE-v calculation with empiricalvan der Waals correction45 at zero temperature. The ReaxFFleads to an a (b) axis dimension which is 0.09 Å lower while thec axis dimension is 0.18 Å higher than those predicted by PBE-v,but the volumes differ by only 0.63%. For H, C, N, O, F, Cl, andS systems, the DFT-PBE-v calculations yield an average unit celldeformation of 3.2% and underestimate the unit cell volume by1%.45 For Si, this error might be larger since no empirical vdWcorrection is available;45 thus the accuracy of the PBE-v resultscould not be well evaluated.
3.3 Thermal-induced chemistry for Si-PETN
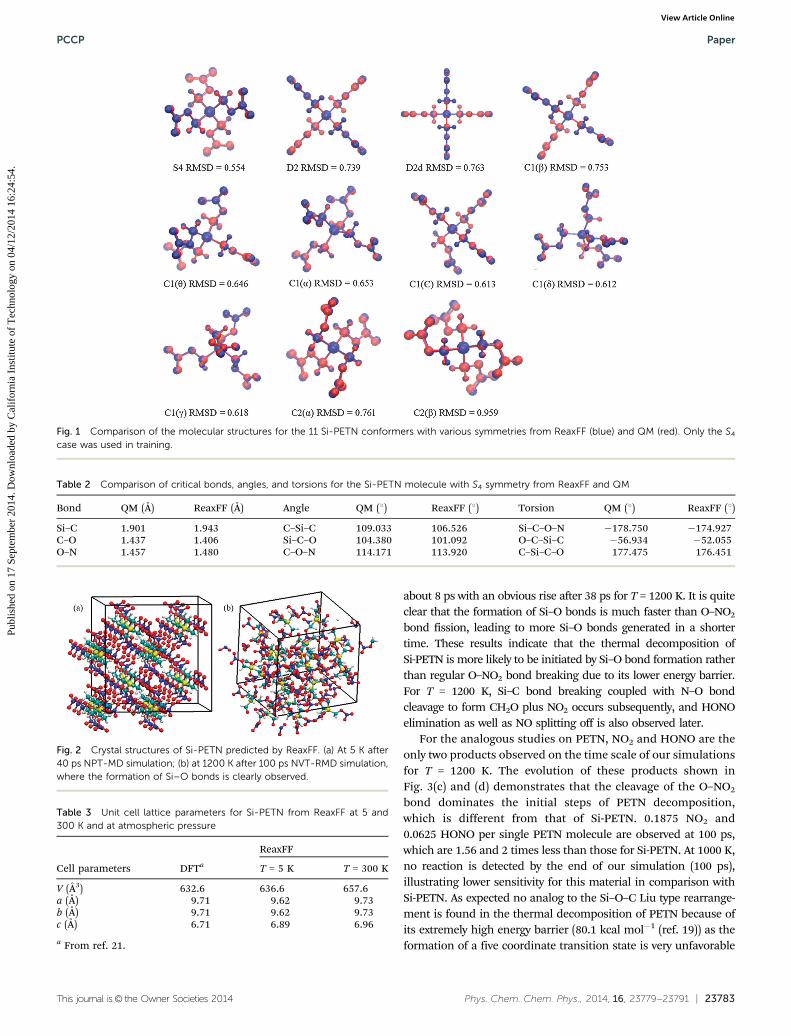
3.3.1 NVT-RMD simulations. The time evolution of theinitial products per single Si-PETN molecule formed duringthe thermal decomposition process at temperatures of 1000and 1200 K is plotted in Fig. 3(a) and (b). It reveals that thedominant initial reaction pathway at these lower temperaturesis the formation of Si–O bonds followed by O–NO2 bondrupture to form NO2 fragments. The Si–O bond forms at 4 psand 3 ps for T = 1000 and 1200 K, respectively, with thepopulation increasing continuously as the decomposition pro-ceeds. NO2 turns out at 29 ps for T = 1000 K and it appears at
Table 1 Comparison of reaction energies in gas phase Si-PETN fromReaxFF and QM
Reaction ReaxFF (kcal mol�1) QMa (kcal mol�1)
NO2 39.89 35.6NO3 62.47 77.6[CH2O + NO2] (TS) 52.66 48.2CH2O + NO2 42.57 42.3HONO (TS) 53.35 39.4HONO �4.21 �15.4Si–O (TS) 22.83 32.0Si–O �60.96 �40.5
a From ref. 19.
Paper PCCP
Publ
ishe
d on
17
Sept
embe
r 20
14. D
ownl
oade
d by
Cal
ifor
nia
Inst
itute
of
Tec
hnol
ogy
on 0
4/12
/201
4 16
:24:
54.
View Article Online
This journal is© the Owner Societies 2014 Phys. Chem. Chem. Phys., 2014, 16, 23779--23791 | 23783
about 8 ps with an obvious rise after 38 ps for T = 1200 K. It is quiteclear that the formation of Si–O bonds is much faster than O–NO2
bond fission, leading to more Si–O bonds generated in a shortertime. These results indicate that the thermal decomposition ofSi-PETN is more likely to be initiated by Si–O bond formation ratherthan regular O–NO2 bond breaking due to its lower energy barrier.For T = 1200 K, Si–C bond breaking coupled with N–O bondcleavage to form CH2O plus NO2 occurs subsequently, and HONOelimination as well as NO splitting off is also observed later.
For the analogous studies on PETN, NO2 and HONO are theonly two products observed on the time scale of our simulationsfor T = 1200 K. The evolution of these products shown inFig. 3(c) and (d) demonstrates that the cleavage of the O–NO2
bond dominates the initial steps of PETN decomposition,which is different from that of Si-PETN. 0.1875 NO2 and0.0625 HONO per single PETN molecule are observed at 100 ps,which are 1.56 and 2 times less than those for Si-PETN. At 1000 K,no reaction is detected by the end of our simulation (100 ps),illustrating lower sensitivity for this material in comparison withSi-PETN. As expected no analog to the Si–O–C Liu type rearrange-ment is found in the thermal decomposition of PETN because ofits extremely high energy barrier (80.1 kcal mol�1 (ref. 19)) as theformation of a five coordinate transition state is very unfavorable
Fig. 1 Comparison of the molecular structures for the 11 Si-PETN conformers with various symmetries from ReaxFF (blue) and QM (red). Only the S4
case was used in training.
Table 2 Comparison of critical bonds, angles, and torsions for the Si-PETN molecule with S4 symmetry from ReaxFF and QM
Bond QM (Å) ReaxFF (Å) Angle QM (1) ReaxFF (1) Torsion QM (1) ReaxFF (1)
Si–C 1.901 1.943 C–Si–C 109.033 106.526 Si–C–O–N �178.750 �174.927C–O 1.437 1.406 Si–C–O 104.380 101.092 O–C–Si–C �56.934 �52.055O–N 1.457 1.480 C–O–N 114.171 113.920 C–Si–C–O 177.475 176.451
Fig. 2 Crystal structures of Si-PETN predicted by ReaxFF. (a) At 5 K after40 ps NPT-MD simulation; (b) at 1200 K after 100 ps NVT-RMD simulation,where the formation of Si–O bonds is clearly observed.
Table 3 Unit cell lattice parameters for Si-PETN from ReaxFF at 5 and300 K and at atmospheric pressure
Cell parameters DFTa
ReaxFF
T = 5 K T = 300 K
V (Å3) 632.6 636.6 657.6a (Å) 9.71 9.62 9.73b (Å) 9.71 9.62 9.73c (Å) 6.71 6.89 6.96
a From ref. 21.
PCCP Paper
Publ
ishe
d on
17
Sept
embe
r 20
14. D
ownl
oade
d by
Cal
ifor
nia
Inst
itute
of
Tec
hnol
ogy
on 0
4/12
/201
4 16
:24:
54.
View Article Online
23784 | Phys. Chem. Chem. Phys., 2014, 16, 23779--23791 This journal is© the Owner Societies 2014
for carbon compared with silicon. Therefore, these investigationsat lower temperatures uncover clearly that the main differenceof the initial decomposition mechanisms between condensedSi-PETN and PETN is the Liu carbon-silyl nitro-ester rearrange-ment in Si-PETN. This leads to the formation of Si–O bondsaccompanied by a large energy release, promoting O–NO2 bondbreaking as well as other reactions, making Si-PETN much moresensitive than PETN.
Decomposition becomes more active with increasing tem-perature. Fig. 3(e) and (f) and 4 exhibit the detailed speciesevolution at 1600 and 2000 K (for clarity, only components withrelatively high abundance are shown), where we see that thedecomposition process can be partitioned into two stages:
The initial stage includes the following reaction pathways:(1) The Liu carbon-silyl nitro-ester rearrangement to form a
new Si–O bond while retaining the CO bond,
(2) NO2 dissociation due to O–NO2 bond rupture,(3) CH2O formation from Si–C bond breaking accompanied
by O–NO2 bond cleavage, and(4) HONO elimination via the hydrogen transfer to –NO2.The second exothermic stage has reactions involving the
generation of intermediates and final products, such as NO,NO3, HO, HNO3, H2O, etc.
Si–O bond formation and NO2 dissociation are found to be thepredominant initial reaction pathways followed by CH2O andHONO elimination, the population of which increase significantlyat elevated temperatures. No significant NO3 formation is observed,which is expected because of the high dissociation energy for theCH2–ONO2 bond. The quantities of these initial products declinequickly at later times due to secondary reactions that lead to quickconsumption of these molecules and fast production of intermedi-ates as well as stable reaction species, such as HO, NO, H2O, etc.
Fig. 3 Time evolution of products during NVT-RMD simulations of Si-PETN and PETN at various temperatures. The decomposition of Si-PETN isinitiated by Si–O bond formation at lower temperatures.
Paper PCCP
Publ
ishe
d on
17
Sept
embe
r 20
14. D
ownl
oade
d by
Cal
ifor
nia
Inst
itute
of
Tec
hnol
ogy
on 0
4/12
/201
4 16
:24:
54.
View Article Online
This journal is© the Owner Societies 2014 Phys. Chem. Chem. Phys., 2014, 16, 23779--23791 | 23785
Evolution of Si–O bonds arisen from the Liu rearrangementplotted in Fig. 4(a) shows that this rearrangement starts earlywith the number of Si–O bonds increasing monotonically on
the time scale of our simulations. The rate of Si–O bondformation rises rapidly with the increase in temperature, thenumber of which approaches about 1.25 and 4.125 per singleSi-PETN molecule for T = 1600 and 2000 K, respectively. Itmanifests that a few silicon atoms form 5 or even 6 Si–O bonds,e.g. 16.67% silicon atom forms 5 Si–O bonds and 4.17% forms 6Si–O bonds after 20 ps simulation at 2000 K. The Liu rearrange-ment of Si-PETN leads to the formation of Si–O–CH2–O–NO,which subsequently decomposes to Si–O–CH2 and NO2 orSi–O–NO and CH2O. Indeed, we see both Si–O–C and Si–O–Nentities, the populations of which as functions of time andtemperature are presented in Fig. 4(b) and (c). It is clearly seenthat the time evolution for Si–O–C and Si–O–N is almost thesame for T r 1600 K: the quantities of the two entities risemonotonously with the increase in temperature and duration.For T = 2000 K, the number of Si–O–N entities goes downgradually after reaching the maximum at 9.8 ps due to second-ary reactions that consume the reactant, whereas the popula-tion of Si–O–C entities goes up at a higher rate from thebeginning to the end to reach a stable value. These resultsindicate that the decomposition of Si–O–CH2–O–NO is likely toform Si–O–C and Si–O–N entities with a similar probability forT r 1600 K, but favors the formation of Si–O–C entities athigher temperatures.
The time evolution of potential energy at various tempera-tures reveals the dependence of rate and degree of thermaldecomposition on the system temperature. For normal nitramineexplosives (such as HMX, TATB, RDX),25,27 the total potentialenergy increases initially in the endothermic process of mole-cule breakdown until the secondary reactions are initiated inthe partially decomposed solid material, which begins torelease energy due to the exothermic formation of small mole-cules. Transition to the energy-releasing state follows afterreaching the maximum of the potential energy during theendothermic stage of the decomposition, and it happens earlierat more elevated temperatures. These are reflected totally inPETN; however, a significant difference in the potential energyprofile of Si-PETN is observed as shown in Fig. 5. The energyremains almost unchanged or even decreases in the initialstage, and it begins to go down dramatically at an earlier timeand at a higher rate in the second stage for Si-PETN thanfor PETN.
At 1200 K, potential energy decreases slightly for Si-PETNwith an obvious energy release after 70 ps, whereas it remainsalmost unchanged for PETN even after 100 ps. At this tempera-ture, the primary initial decomposition mechanism for Si-PETNis Si–O bond formation accompanied by a large energy release.Although some endothermic reactions occur later, the quanti-ties of their products are smaller than Si–O bonds. Conse-quently, the total effect is the release of energy, leading to thedecrease of potential energy. In the case of PETN, the decom-position process at this temperature is extremely slow with asmall number of O–NO2 bond breaking that absorb energy after50 ps. Therefore, potential energy keeps almost stable. At 1600 K,potential energy keeps almost unchanged within the first 10 psand then goes down dramatically for Si-PETN, while it increases
Fig. 4 Time evolution of products formed due to Si–C–O rearrangementduring NVT-RMD simulations of Si-PETN at 1200, 1600, and 2000 K. Suchrearrangement was not observed during the thermal decomposition ofPETN.
PCCP Paper
Publ
ishe
d on
17
Sept
embe
r 20
14. D
ownl
oade
d by
Cal
ifor
nia
Inst
itute
of
Tec
hnol
ogy
on 0
4/12
/201
4 16
:24:
54.
View Article Online
23786 | Phys. Chem. Chem. Phys., 2014, 16, 23779--23791 This journal is© the Owner Societies 2014
from the beginning and starts to decrease after reaching themaximum at about 16 ps for PETN. At this temperature, Si–Obond formation and O–NO2 bond cleavage are the dominantinitial reaction pathways for Si-PETN, releasing 40.5 kcal mol�1
and absorbing 35.6 kcal mol�1 energy,19 respectively, leading toa slight decrease of potential energy in the first stage. Thedecomposition of PETN is initiated by endothermic O–NO2 bondbreaking (39.0 kcal mol�1 (ref. 19)), resulting in the increase ofpotential energy. Potential energy decreases as decompositionproceeds, the rate of which is directly related to the progress ofexothermic reactions. Since more drastic reactions occur forSi-PETN than for PETN during this stage, more energy is releasedat a higher rate for Si-PETN, elucidating its highly increasedsensitivity. Thus, the difference in the potential energy betweenSi-PETN and PETN has arisen from the early occurrence of theexothermic Liu Si–C–O rearrangement in Si-PETN, which pro-vides energy early in the decomposition process that acceleratessubsequent reactions, leading to earlier and faster energy releasefor Si-PETN compared with PETN.
To analyze the thermal decomposition reaction kinetics, wefocused on two critical reaction pathways: the Liu Si–C–O rear-rangement forming Si–O bonds and the bond rupture of O–NO2
to dissociate NO2. The time evolution of the Si–O bond and thefree NO2 molecule taken from NVT-RMD simulations at tempera-tures from 1200 to 1800 K was used to obtain the reaction rate k.The data used to obtain the NO2 dissociation rate were from thebeginning to the point at which its quantity reaches the max-imum and the data for Si–O bond formation throughout thewhole simulation time were used. The reaction rate was obtainedfrom an exponential fit of the data sets described above at eachtemperature. Fig. 6 presents the logarithm of the reaction rate asa function of reciprocal temperature, including the linear fittingaccording to the Arrhenius law to obtain the activation barrier Ea
and the pre-exponential factor A:
ln k ¼ �Ea
RTþ lnA (2)
The derived activation barriers for Si–O bond formation andNO2 dissociation in solid Si-PETN are 23.59 and 30.56 kcal mol�1
compared to 32.0 and 35.6 kcal mol�1 from QM studies19 on thegas phase, respectively. Table 1 shows that ReaxFF underesti-mates the barrier for Si–O bond formation in an isolatedmolecule by B9 kcal mol�1 compared with the QM result, andsuch energy differences would affect the dynamics of reactionsfor bulk Si-PETN in the MD simulations, resulting in a lowerbarrier. ReaxFF predicts a close barrier for NO2 dissociation toQM data in the gas phase, but the barrier decreases in the solidphase. This can be explained by the earlier reaction of Si–O bondformation accompanied by a huge energy release, which pro-motes O–NO2 bond cleavage. The activation barrier for Si–Obond formation is B7 kcal mol�1 lower than that for NO2
dissociation, confirming that the Liu Si–C–O rearrangement ofSi-PETN is more favorable than NO2 split off. Similar NVT-RMDstudies on bulk PETN led to a barrier of 33.71 kcal mol�1 for NO2
Fig. 5 Potential energy profile during NVT-RMD simulations of Si-PETN and PETN at 1200 K and 1600 K. It shows a faster energy release for Si-PETNcompared with PETN.
Fig. 6 Logarithm of reaction rates (ln k) for Si–O bond formation (redcircles) and NO2 dissociation (black up triangles) in Si-PETN along with therate for NO2 detachment in PETN (blue down triangles) vs. inversetemperature (1/T) based on NVT-RMD simulations in the temperaturerange of 1200–1800 K. The corresponding lines passing through thesedata are results fit to eqn (2). The activation barrier for Si–O bondformation is B7 kcal mol�1 lower than that for NO2 dissociation, confirm-ing that the Liu Si–C–O rearrangement of Si-PETN is more favorable thanO–NO2 bond cleavage.
Paper PCCP
Publ
ishe
d on
17
Sept
embe
r 20
14. D
ownl
oade
d by
Cal
ifor
nia
Inst
itute
of
Tec
hnol
ogy
on 0
4/12
/201
4 16
:24:
54.
View Article Online
This journal is© the Owner Societies 2014 Phys. Chem. Chem. Phys., 2014, 16, 23779--23791 | 23787
fission, which is higher than that for Si-PETN. In addition, thehuge amount of energy released by Si–O bond formation inSi-PETN is sufficient to trigger the following NO2 dissociation,
resulting in a higher reaction rate than that for PETN as shownin Fig. 6, making Si-PETN more sensitive than PETN.
The calculated barrier for NO2 loss in PETN of 34 kcal mol�1
is lower than the values extracted from fits of models toexperimental results (40 kcal mol�1 from Tarver et al.9 and47 kcal mol�1 from Rogers et al.6,7). However, caution mustbe exercised when comparing calculated kinetics based onatomistic details of molecular transformation with thoseextracted using empirical models based on ‘‘ignition times’’.Tarver et al.9 developed a four-step chemical kinetic model forthe thermal decomposition of PETN based on time to thermalexplosion measured in a new one dimensional time to explo-sion (ODTX) apparatus. The kinetic parameters of the modelwere fitted to reproduce the ODTX in experiments. Rogerset al.6,7 estimated the kinetic parameters from calorimetryexperiments near the melting temperature of PETN. OurReaxFF RMD yields reaction rates for temperatures of 1200–1800 K, while most of the experimental data were obtained attemperatures below B500 K, requiring extrapolation of themeasured rates to much higher temperatures. We can expectthat additional reaction channels and autocatalytic processesin the solid phase may be activated at higher temperatures thatmight invalidate such extrapolations. Moreover, the experi-mental measurements are done on substantially larger samples
Fig. 7 Potential energy as a function of time during NVE-RMD simulations of Si-PETN and PETN at various temperatures. The black lines are fits of theexothermic stage to eqn (3), which suggest a higher rate for energy release in Si-PETN.
Fig. 8 Logarithm of the exothermic reaction rate (ln k) vs. inverse tem-perature (1/T) during NVE-RMD simulations of Si-PETN and PETN in the1200–1800 K range. The open circles and the solid line represent calcu-lated values and linear fitting for Si-PETN, and the open triangle and thedashed line represent those for PETN. The figure reveals a higher reactionrate and a lower activation energy for Si-PETN than for PETN.
Fig. 9 Temperature as a function of time during NVE-RMD simulations of Si-PETN and PETN. It is shown that the temperature rises to a higher value in ashorter time for Si-PETN compared with PETN.
PCCP Paper
Publ
ishe
d on
17
Sept
embe
r 20
14. D
ownl
oade
d by
Cal
ifor
nia
Inst
itute
of
Tec
hnol
ogy
on 0
4/12
/201
4 16
:24:
54.
View Article Online
23788 | Phys. Chem. Chem. Phys., 2014, 16, 23779--23791 This journal is© the Owner Societies 2014
Fig. 10 Time evolution of products during NVE-RMD simulations of Si-PETN and PETN at 1200 and 1600 K.
Paper PCCP
Publ
ishe
d on
17
Sept
embe
r 20
14. D
ownl
oade
d by
Cal
ifor
nia
Inst
itute
of
Tec
hnol
ogy
on 0
4/12
/201
4 16
:24:
54.
View Article Online
This journal is© the Owner Societies 2014 Phys. Chem. Chem. Phys., 2014, 16, 23779--23791 | 23789
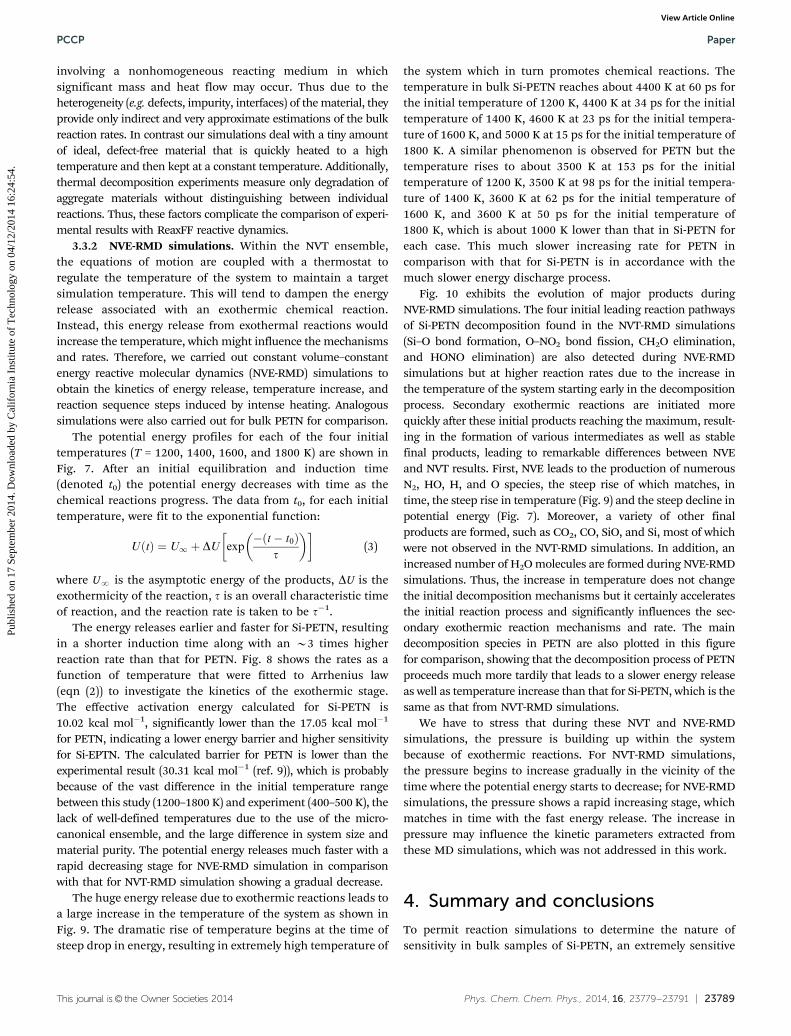
involving a nonhomogeneous reacting medium in whichsignificant mass and heat flow may occur. Thus due to theheterogeneity (e.g. defects, impurity, interfaces) of the material, theyprovide only indirect and very approximate estimations of the bulkreaction rates. In contrast our simulations deal with a tiny amountof ideal, defect-free material that is quickly heated to a hightemperature and then kept at a constant temperature. Additionally,thermal decomposition experiments measure only degradation ofaggregate materials without distinguishing between individualreactions. Thus, these factors complicate the comparison of experi-mental results with ReaxFF reactive dynamics.
3.3.2 NVE-RMD simulations. Within the NVT ensemble,the equations of motion are coupled with a thermostat toregulate the temperature of the system to maintain a targetsimulation temperature. This will tend to dampen the energyrelease associated with an exothermic chemical reaction.Instead, this energy release from exothermal reactions wouldincrease the temperature, which might influence the mechanismsand rates. Therefore, we carried out constant volume–constantenergy reactive molecular dynamics (NVE-RMD) simulations toobtain the kinetics of energy release, temperature increase, andreaction sequence steps induced by intense heating. Analogoussimulations were also carried out for bulk PETN for comparison.
The potential energy profiles for each of the four initialtemperatures (T = 1200, 1400, 1600, and 1800 K) are shown inFig. 7. After an initial equilibration and induction time(denoted t0) the potential energy decreases with time as thechemical reactions progress. The data from t0, for each initialtemperature, were fit to the exponential function:
UðtÞ ¼ U1 þ DU exp� t� t0ð Þ
t
� �� �(3)
where UN is the asymptotic energy of the products, DU is theexothermicity of the reaction, t is an overall characteristic timeof reaction, and the reaction rate is taken to be t�1.
The energy releases earlier and faster for Si-PETN, resultingin a shorter induction time along with an B3 times higherreaction rate than that for PETN. Fig. 8 shows the rates as afunction of temperature that were fitted to Arrhenius law(eqn (2)) to investigate the kinetics of the exothermic stage.The effective activation energy calculated for Si-PETN is10.02 kcal mol�1, significantly lower than the 17.05 kcal mol�1
for PETN, indicating a lower energy barrier and higher sensitivityfor Si-EPTN. The calculated barrier for PETN is lower than theexperimental result (30.31 kcal mol�1 (ref. 9)), which is probablybecause of the vast difference in the initial temperature rangebetween this study (1200–1800 K) and experiment (400–500 K), thelack of well-defined temperatures due to the use of the micro-canonical ensemble, and the large difference in system size andmaterial purity. The potential energy releases much faster with arapid decreasing stage for NVE-RMD simulation in comparisonwith that for NVT-RMD simulation showing a gradual decrease.
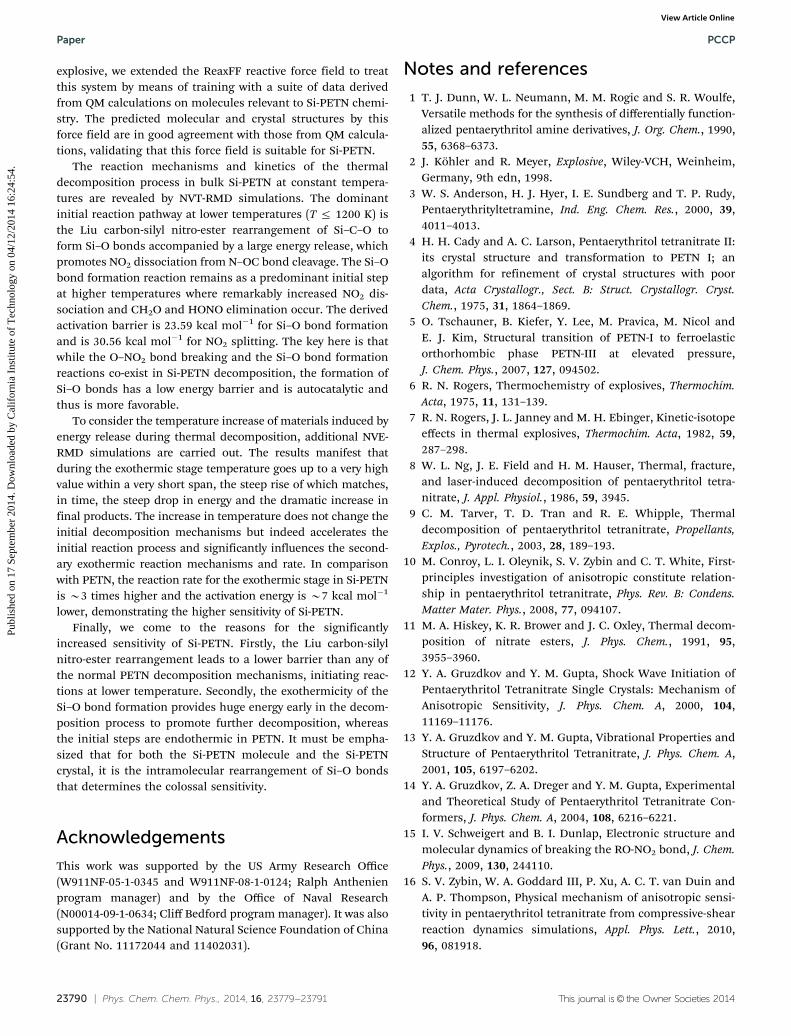
The huge energy release due to exothermic reactions leads toa large increase in the temperature of the system as shown inFig. 9. The dramatic rise of temperature begins at the time ofsteep drop in energy, resulting in extremely high temperature of
the system which in turn promotes chemical reactions. Thetemperature in bulk Si-PETN reaches about 4400 K at 60 ps forthe initial temperature of 1200 K, 4400 K at 34 ps for the initialtemperature of 1400 K, 4600 K at 23 ps for the initial tempera-ture of 1600 K, and 5000 K at 15 ps for the initial temperature of1800 K. A similar phenomenon is observed for PETN but thetemperature rises to about 3500 K at 153 ps for the initialtemperature of 1200 K, 3500 K at 98 ps for the initial tempera-ture of 1400 K, 3600 K at 62 ps for the initial temperature of1600 K, and 3600 K at 50 ps for the initial temperature of1800 K, which is about 1000 K lower than that in Si-PETN foreach case. This much slower increasing rate for PETN incomparison with that for Si-PETN is in accordance with themuch slower energy discharge process.
Fig. 10 exhibits the evolution of major products duringNVE-RMD simulations. The four initial leading reaction pathwaysof Si-PETN decomposition found in the NVT-RMD simulations(Si–O bond formation, O–NO2 bond fission, CH2O elimination,and HONO elimination) are also detected during NVE-RMDsimulations but at higher reaction rates due to the increase inthe temperature of the system starting early in the decompositionprocess. Secondary exothermic reactions are initiated morequickly after these initial products reaching the maximum, result-ing in the formation of various intermediates as well as stablefinal products, leading to remarkable differences between NVEand NVT results. First, NVE leads to the production of numerousN2, HO, H, and O species, the steep rise of which matches, intime, the steep rise in temperature (Fig. 9) and the steep decline inpotential energy (Fig. 7). Moreover, a variety of other finalproducts are formed, such as CO2, CO, SiO, and Si, most of whichwere not observed in the NVT-RMD simulations. In addition, anincreased number of H2O molecules are formed during NVE-RMDsimulations. Thus, the increase in temperature does not changethe initial decomposition mechanisms but it certainly acceleratesthe initial reaction process and significantly influences the sec-ondary exothermic reaction mechanisms and rate. The maindecomposition species in PETN are also plotted in this figurefor comparison, showing that the decomposition process of PETNproceeds much more tardily that leads to a slower energy releaseas well as temperature increase than that for Si-PETN, which is thesame as that from NVT-RMD simulations.
We have to stress that during these NVT and NVE-RMDsimulations, the pressure is building up within the systembecause of exothermic reactions. For NVT-RMD simulations,the pressure begins to increase gradually in the vicinity of thetime where the potential energy starts to decrease; for NVE-RMDsimulations, the pressure shows a rapid increasing stage, whichmatches in time with the fast energy release. The increase inpressure may influence the kinetic parameters extracted fromthese MD simulations, which was not addressed in this work.
4. Summary and conclusions
To permit reaction simulations to determine the nature ofsensitivity in bulk samples of Si-PETN, an extremely sensitive
PCCP Paper
Publ
ishe
d on
17
Sept
embe
r 20
14. D
ownl
oade
d by
Cal
ifor
nia
Inst
itute
of
Tec
hnol
ogy
on 0
4/12
/201
4 16
:24:
54.
View Article Online
23790 | Phys. Chem. Chem. Phys., 2014, 16, 23779--23791 This journal is© the Owner Societies 2014
explosive, we extended the ReaxFF reactive force field to treatthis system by means of training with a suite of data derivedfrom QM calculations on molecules relevant to Si-PETN chemi-stry. The predicted molecular and crystal structures by thisforce field are in good agreement with those from QM calcula-tions, validating that this force field is suitable for Si-PETN.
The reaction mechanisms and kinetics of the thermaldecomposition process in bulk Si-PETN at constant tempera-tures are revealed by NVT-RMD simulations. The dominantinitial reaction pathway at lower temperatures (T r 1200 K) isthe Liu carbon-silyl nitro-ester rearrangement of Si–C–O toform Si–O bonds accompanied by a large energy release, whichpromotes NO2 dissociation from N–OC bond cleavage. The Si–Obond formation reaction remains as a predominant initial stepat higher temperatures where remarkably increased NO2 dis-sociation and CH2O and HONO elimination occur. The derivedactivation barrier is 23.59 kcal mol�1 for Si–O bond formationand is 30.56 kcal mol�1 for NO2 splitting. The key here is thatwhile the O–NO2 bond breaking and the Si–O bond formationreactions co-exist in Si-PETN decomposition, the formation ofSi–O bonds has a low energy barrier and is autocatalytic andthus is more favorable.
To consider the temperature increase of materials induced byenergy release during thermal decomposition, additional NVE-RMD simulations are carried out. The results manifest thatduring the exothermic stage temperature goes up to a very highvalue within a very short span, the steep rise of which matches,in time, the steep drop in energy and the dramatic increase infinal products. The increase in temperature does not change theinitial decomposition mechanisms but indeed accelerates theinitial reaction process and significantly influences the second-ary exothermic reaction mechanisms and rate. In comparisonwith PETN, the reaction rate for the exothermic stage in Si-PETNis B3 times higher and the activation energy is B7 kcal mol�1
lower, demonstrating the higher sensitivity of Si-PETN.Finally, we come to the reasons for the significantly
increased sensitivity of Si-PETN. Firstly, the Liu carbon-silylnitro-ester rearrangement leads to a lower barrier than any ofthe normal PETN decomposition mechanisms, initiating reac-tions at lower temperature. Secondly, the exothermicity of theSi–O bond formation provides huge energy early in the decom-position process to promote further decomposition, whereasthe initial steps are endothermic in PETN. It must be empha-sized that for both the Si-PETN molecule and the Si-PETNcrystal, it is the intramolecular rearrangement of Si–O bondsthat determines the colossal sensitivity.
Acknowledgements
This work was supported by the US Army Research Office(W911NF-05-1-0345 and W911NF-08-1-0124; Ralph Anthenienprogram manager) and by the Office of Naval Research(N00014-09-1-0634; Cliff Bedford program manager). It was alsosupported by the National Natural Science Foundation of China(Grant No. 11172044 and 11402031).
Notes and references
1 T. J. Dunn, W. L. Neumann, M. M. Rogic and S. R. Woulfe,Versatile methods for the synthesis of differentially function-alized pentaerythritol amine derivatives, J. Org. Chem., 1990,55, 6368–6373.
2 J. Kohler and R. Meyer, Explosive, Wiley-VCH, Weinheim,Germany, 9th edn, 1998.
3 W. S. Anderson, H. J. Hyer, I. E. Sundberg and T. P. Rudy,Pentaerythrityltetramine, Ind. Eng. Chem. Res., 2000, 39,4011–4013.
4 H. H. Cady and A. C. Larson, Pentaerythritol tetranitrate II:its crystal structure and transformation to PETN I; analgorithm for refinement of crystal structures with poordata, Acta Crystallogr., Sect. B: Struct. Crystallogr. Cryst.Chem., 1975, 31, 1864–1869.
5 O. Tschauner, B. Kiefer, Y. Lee, M. Pravica, M. Nicol andE. J. Kim, Structural transition of PETN-I to ferroelasticorthorhombic phase PETN-III at elevated pressure,J. Chem. Phys., 2007, 127, 094502.
6 R. N. Rogers, Thermochemistry of explosives, Thermochim.Acta, 1975, 11, 131–139.
7 R. N. Rogers, J. L. Janney and M. H. Ebinger, Kinetic-isotopeeffects in thermal explosives, Thermochim. Acta, 1982, 59,287–298.
8 W. L. Ng, J. E. Field and H. M. Hauser, Thermal, fracture,and laser-induced decomposition of pentaerythritol tetra-nitrate, J. Appl. Physiol., 1986, 59, 3945.
9 C. M. Tarver, T. D. Tran and R. E. Whipple, Thermaldecomposition of pentaerythritol tetranitrate, Propellants,Explos., Pyrotech., 2003, 28, 189–193.
10 M. Conroy, L. I. Oleynik, S. V. Zybin and C. T. White, First-principles investigation of anisotropic constitute relation-ship in pentaerythritol tetranitrate, Phys. Rev. B: Condens.Matter Mater. Phys., 2008, 77, 094107.
11 M. A. Hiskey, K. R. Brower and J. C. Oxley, Thermal decom-position of nitrate esters, J. Phys. Chem., 1991, 95,3955–3960.
12 Y. A. Gruzdkov and Y. M. Gupta, Shock Wave Initiation ofPentaerythritol Tetranitrate Single Crystals: Mechanism ofAnisotropic Sensitivity, J. Phys. Chem. A, 2000, 104,11169–11176.
13 Y. A. Gruzdkov and Y. M. Gupta, Vibrational Properties andStructure of Pentaerythritol Tetranitrate, J. Phys. Chem. A,2001, 105, 6197–6202.
14 Y. A. Gruzdkov, Z. A. Dreger and Y. M. Gupta, Experimentaland Theoretical Study of Pentaerythritol Tetranitrate Con-formers, J. Phys. Chem. A, 2004, 108, 6216–6221.
15 I. V. Schweigert and B. I. Dunlap, Electronic structure andmolecular dynamics of breaking the RO-NO2 bond, J. Chem.Phys., 2009, 130, 244110.
16 S. V. Zybin, W. A. Goddard III, P. Xu, A. C. T. van Duin andA. P. Thompson, Physical mechanism of anisotropic sensi-tivity in pentaerythritol tetranitrate from compressive-shearreaction dynamics simulations, Appl. Phys. Lett., 2010,96, 081918.
Paper PCCP
Publ
ishe
d on
17
Sept
embe
r 20
14. D
ownl
oade
d by
Cal
ifor
nia
Inst
itute
of
Tec
hnol
ogy
on 0
4/12
/201
4 16
:24:
54.
View Article Online

This journal is© the Owner Societies 2014 Phys. Chem. Chem. Phys., 2014, 16, 23779--23791 | 23791
17 T. R. Gibbs and A. Popolato, LASL explosive property data,University of California Press, Berkeley, US, 1980.
18 T. M. Klapotke, B. Krumm, R. Ilg, D. Troegel and R. Tacke,The Sila-Explosives Si(CH2N3)4 and Si(CH2ONO2)4: SiliconAnalogues of the Common Explosives Pentaerythrityl Tetraazide,C(CH2N3)4, and Pentaerythritol Tetranitrate, C(CH2ONO2)4,J. Am. Chem. Soc., 2007, 129, 6908–6915.
19 W. G. Liu, S. V. Zybin, S. Dasgupta, T. M. Klapotke andW. A. Goddard III, Explanation of the Colossal DetonationSensitivity of Silicon Pentaerythritol Tetranitrate (Si-PETN)Explosive, J. Am. Chem. Soc., 2009, 131, 7490–7491.
20 J. S. Murray, P. Lane, A. Nieder, T. M. Klapotke andP. Politzer, Enhanced detonation sensitivities of siliconanalogs of PETN: reaction force analysis and the role ofs-hole interactions, Theor. Chem. Acc., 2010, 127, 345–354.
21 Y. Lin, M. M. Budzevich, A. C. Landerville, I. I. Oleynik andC. T. White, Physical and chemical properties of a newenergetic materials SiPETN, AIP Conf. Proc., 2009, 1195,474–477.
22 A. C. T. van Duin, S. Dasgupta, F. Lorant and W. A. GoddardIII, ReaxFF: A Reactive Force Field for Hydrocarbons, J. Phys.Chem. A, 2001, 105, 9396–9409.
23 A. C. T. van Duin, A. Strachan, S. Stewman, Q. Zhang, X. Xuand W. A. Goddard III, ReaxFFSiO Reactive Force Field forSilicon and Silicon Oxide Systems, J. Phys. Chem. A, 2003,107, 3803–3811.
24 T. T. Zhou, S. V. Zybin, Y. Liu, F. L. Huang andW. A. Goddard III, Anisotropic shock sensitivity forb-octahydro-1,3,5,7-tetranitro-1,3,5,7-tetrazocine energeticmaterial under compressive-shear loading from ReaxFF-lgreactive dynamics simulations, J. Appl. Physiol., 2012,111, 124904.
25 L. Z. Zhang, S. V. Zybin, A. C. T. van Duin, S. Dasgupta andW. A. Goddard III, Carbon Cluster Formation during ThermalDecomposition of Octahydro-1,3,5,7-tetranitro-1,3,5,7-tetrazocineand 1,3,5-triamino-2,4,6-trinitrobenzene High Explosives fromReaxFF Reactive Molecular Dynamics Simulations, J. Phys. Chem.A, 2009, 113, 10619–10640.
26 T. T. Zhou and F. L. Huang, Effects of Defects on ThermalDecomposition of HMX via ReaxFF Molecular DynamicsSimulations, J. Phys. Chem. B, 2011, 115, 278–287.
27 A. Strachan, E. Kober, A. C. T. van Duin, J. Oxgaard andW. A. Goddard III, Thermal Decomposition of RDX fromreactive dynamics, J. Chem. Phys., 2005, 122, 054502.
28 A. Strachan, A. C. T. van Duin, D. Chakraborty, S. Dasguptaand W. A. Goddard III, Shock Waves in High-Energy Materials:The Initial Chemistry Events in Nitramine RDX, Phys. Rev.Lett., 2003, 91, 098301.
29 K. Nomura, R. K. Kalia, A. Nakano, P. Vashishta, A. C. T. vanDuin and W. A. Goddard III, Dynamic Transition in theStructure of an Energetic Crystal during Chemical Reactionsat Shock Front Prior to Detonation, Phys. Rev. Lett., 2007,99, 148303.
30 K. Nomura, R. K. Kalia, A. Nakano and P. Vashishta, Reac-tive nanojets: Nanostructure-enhanced chemical reactionsin a defected energetic crystal, Appl. Phys. Lett., 2007,91, 183109.
31 Q. An, S. V. Zybin, W. A. Goddard III, A. Jaramillo-Botero,M. Blanco and S. N. Luo, Elucidation of the Dynamics forHot-spot Initiation at Nonuniform Interfaces of HighlyShocked Materials, Phys. Rev. B: Condens. Matter Mater.Phys., 2011, 84, 220101.
32 J. Tersoff, New empirical approach for the structure andenergy of covalent systems, Phys. Rev. B: Condens. MatterMater. Phys., 1988, 37, 6991–7000.
33 D. W. Brenner, Empirical potential for hydrocarbons for usein simulating the chemical vapor decomposition of diamondfilms, Phys. Rev. B: Condens. Matter Mater. Phys., 1990, 42,9458–9471.
34 L. C. Liu, Y. Liu, S. V. Zybin, H. Sun and W. A. Goddard III,ReaxFF-lg: Correction of the ReaxFF Reactive Force Field forLondon Dispersion with Applications to the Equations ofState for Energetic Materials, J. Phys. Chem. A, 2011, 115,11016–11022.
35 K. Chenoweth, S. Cheung, A. C. T. van Duin, W. A. GoddardIII and E. M. Kober, Simulations on the Thermal Decom-position of a Poly(dimethylsiloxane) Polymer Using theReaxFF Reactive Force Field, J. Am. Chem. Soc., 2005, 127,7192–7202.
36 A. D. Becke, Density-functional thermochemistry. III. Therole of exact exchange, J. Chem. Phys., 1993, 98, 5648.
37 C. T. Lee, W. T. Yang and R. G. Parr, Development of theColle-Salvetti correlation-energy formula into a functionalof the electron density, Phys. Rev. B: Condens. Matter Mater.Phys., 1988, 37, 785–789.
38 R. Krishnan, J. S. Binkley, R. Seeger and J. A. Pople, Self-consistent molecular orbital methods. XX. A basis set forcorrelated functions, J. Chem. Phys., 1980, 72, 650.
39 Jaguar, Schrodinger, LLC, New York, 7.5 edn, 2008.40 J. W. Conant, H. H. Cady, R. R. Ryan, J. L. Yarnell and
J. M. Newsam, Informal Report LA-7756-MS, Los AlamosNational Laboratory, Los Alamos, NM, 1979.
41 A. D. Booth and F. J. Llewellyn, The crystal structure ofpentaerythritol tetranitrate, J. Chem. Soc., 1947, 837–846.
42 D. F. Shanno, Conjugate Gradient Methods with InexactSearches, Math. Oper. Res., 1978, 3, 244–256.
43 S. J. Plimpton, Fast Parallel Algorithm for Short-RangeMolecular Dynamics, Comput. Phys., 1995, 117, 1–19.
44 Q. An, Y. Liu, S. V. Zybin, H. Kim and W. A. Goddard III,Anisotropic Shock Sensitivity of Cyclotrimethylene Trinitra-mine (RDX) from Compress and Shear Reactive Dynamics,J. Phys. Chem. C, 2012, 116, 10198–10206.
45 M. A. Neumann and M. A. Perrin, Energy Ranking ofMolecular Crystal Using Density Functional Theory Calcula-tions and an Empirical van der Waals Correction, J. Phys.Chem. B, 2005, 109, 15531–15541.
PCCP Paper
Publ
ishe
d on
17
Sept
embe
r 20
14. D
ownl
oade
d by
Cal
ifor
nia
Inst
itute
of
Tec
hnol
ogy
on 0
4/12
/201
4 16
:24:
54.
View Article Online


![excitation Zijun Yu and Elliot R. Bernstein …sites.chem.colostate.edu/bernsteinlab/239.pdf · Decomposition of pentaerythritol tetranitrate [C(CH2ONO2)4] following electronic excitation](https://img.dokumen.tips/doc/110x75/5b6445627f8b9a6c178d1f15/excitation-zijun-yu-and-elliot-r-bernstein-siteschem-decomposition-of-pentaerythritol.jpg)