Embed Size (px)
Citation preview
Leading Partners in Science
Reality, magic potions & clairvoyance
Harry Clark
Director
New Zealand Agricultural GHG Research Centre (NZAGRC)
Copyright © 2010 New Zealand Agricultural Greenhouse Gas Research Centre 30 MARCH 2017 | 1
Leading Partners in Science
The Reality of reducing agricultural GHG emissions in New Zealand – guiding principles
• Is the mitigation option effective?
• Does the mitigation option have other impacts?
• Is the mitigation option likely to be cost-effective?
• Can the mitigation option be integrated into current & future NZ farming systems?
• What is the impact at the national scale?
Copyright © 2010 New Zealand Agricultural Greenhouse Gas Research Centre 30 MARCH 2017 | 2
Leading Partners in Science
Do we currently have any solutions available now?
• Increasing ‘efficiency’ reduces emissions per unit of product but reduction in absolute emissions depends on the quantity of product produced
• Several feed types have good scientific evidence that they can reduce CH4 emissions – e.g. concentrates, forage rape
• Reducing dietary N concentrations & N fertiliser use can reduce N2O emissions
Copyright © 2010 New Zealand Agricultural Greenhouse Gas Research Centre 30 MARCH 2017 | 3
Leading Partners in Science
Do these solutions pass the Reality test?
• Concentrate – % in diet, cost, general applicability
• Forage rape - ↑N2O, limited % in diet
• Reducing dietary N concentrations – cost, general applicability
• Reducing N fertiliser – ↓forage product, small % of emissions
Copyright © 2010 New Zealand Agricultural Greenhouse Gas Research Centre 30 MARCH 2017 | 4
Leading Partners in Science
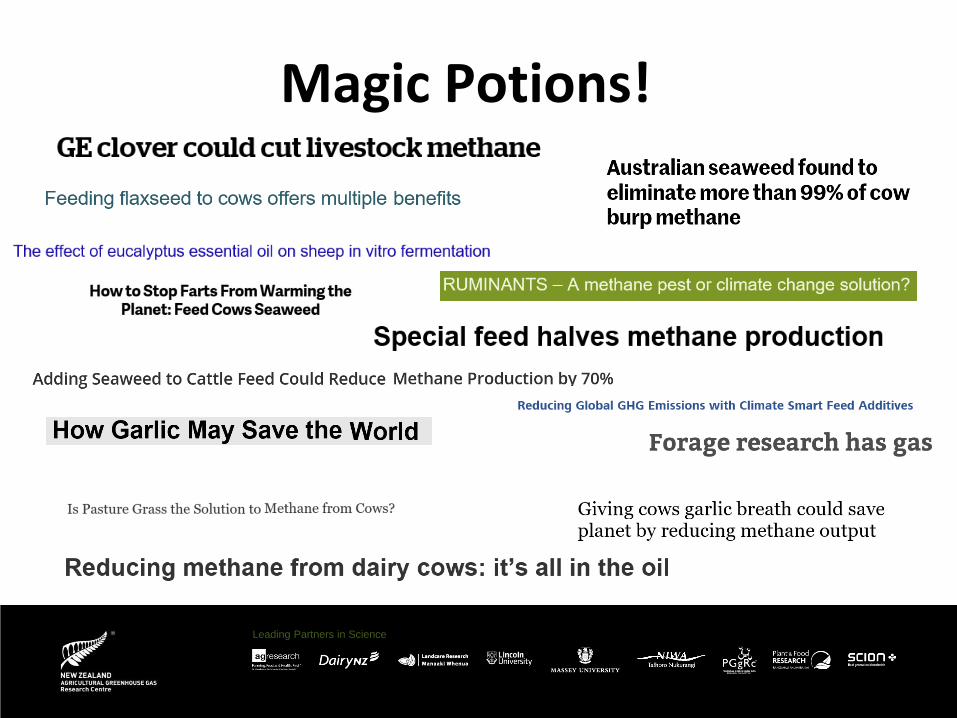
Magic Potions!
Leading Partners in Science
Magic Potions!
• Strong Advocacy, Light Evidence
• Marketing & justification for funding/resources
• Even where results are quoted they are often in-vitro, uncontrolled, non-replicated & short term; credibility issue
• Even where credible results are presented any solution has to pass the ‘Reality’ test
• There are no shortcuts!
Copyright © 2010 New Zealand Agricultural Greenhouse Gas Research Centre 30 MARCH 2017 | 6
Leading Partners in Science
Clairvoyance – what will New Zealand’s agricultural emissions be in 2050?
Copyright © 2010 New Zealand Agricultural Greenhouse Gas Research Centre 30 MARCH 2017 | 7
Leading Partners in Science
• Scenario approach – not a forecast!!!!
• NZ inventory tool used for emissions estimates
• Based on currently available agricultural land
no major change into/out of livestock; may not be realistic
Dairy sector continues to expand at expense of sheep & beef;
relative commodity prices & water quality issues could change
this
• Individual animal performance continues to improve in all sectors
Methodology and key assumptions
Leading Partners in Science
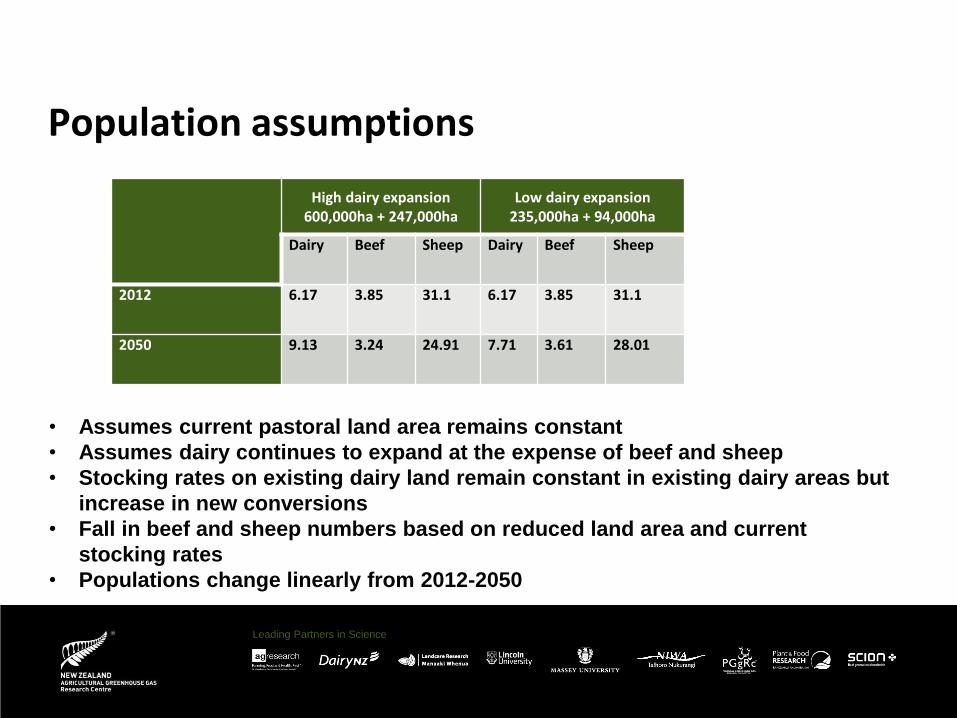
Population assumptions
High dairy expansion 600,000ha + 247,000ha
Low dairy expansion235,000ha + 94,000ha
Dairy Beef Sheep Dairy Beef Sheep
2012 6.17 3.85 31.1 6.17 3.85 31.1
2050 9.13 3.24 24.91 7.71 3.61 28.01
• Assumes current pastoral land area remains constant
• Assumes dairy continues to expand at the expense of beef and sheep
• Stocking rates on existing dairy land remain constant in existing dairy areas but
increase in new conversions
• Fall in beef and sheep numbers based on reduced land area and current
stocking rates
• Populations change linearly from 2012-2050
Leading Partners in Science
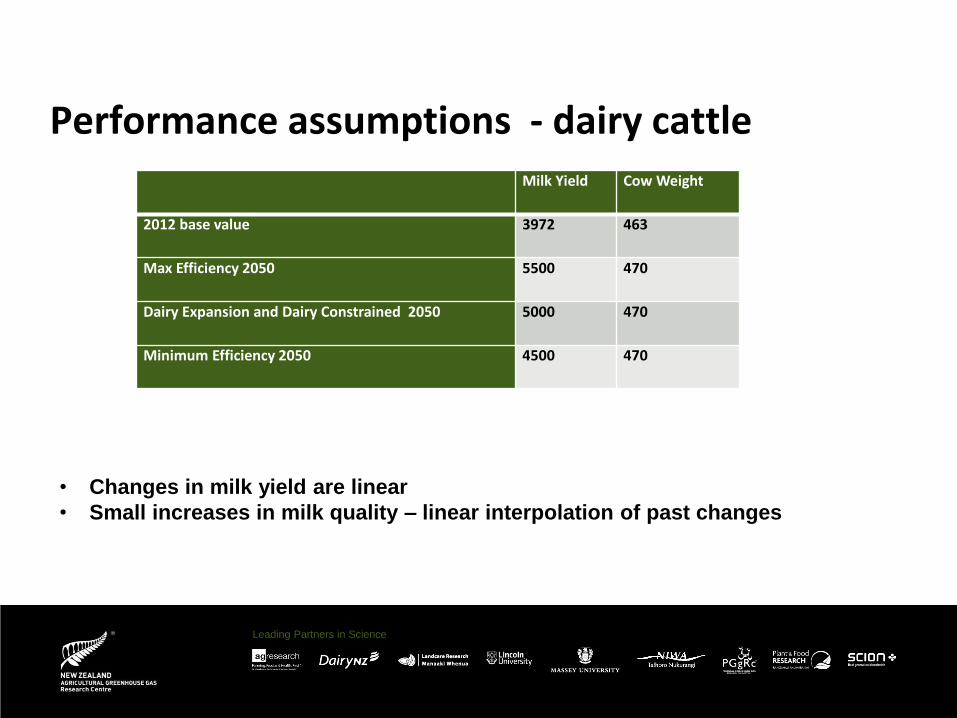
Performance assumptions - dairy cattleMilk Yield Cow Weight
2012 base value 3972 463
Max Efficiency 2050 5500 470
Dairy Expansion and Dairy Constrained 2050 5000 470
Minimum Efficiency 2050 4500 470
• Changes in milk yield are linear
• Small increases in milk quality – linear interpolation of past changes
Leading Partners in Science
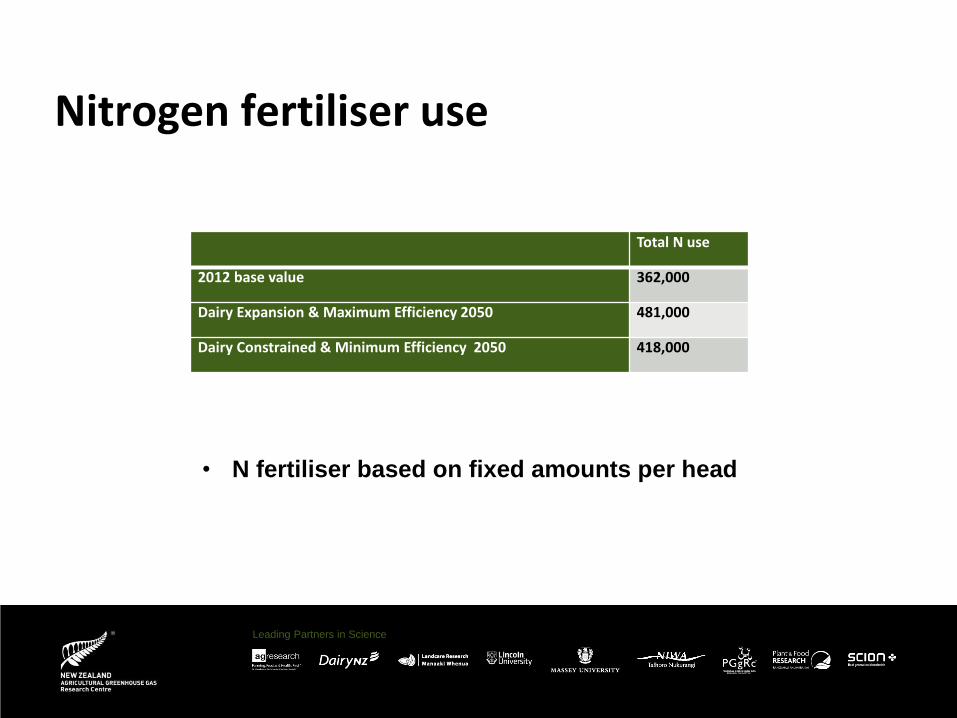
Nitrogen fertiliser use
Total N use
2012 base value 362,000
Dairy Expansion & Maximum Efficiency 2050 481,000
Dairy Constrained & Minimum Efficiency 2050 418,000
• N fertiliser based on fixed amounts per head
Leading Partners in Science
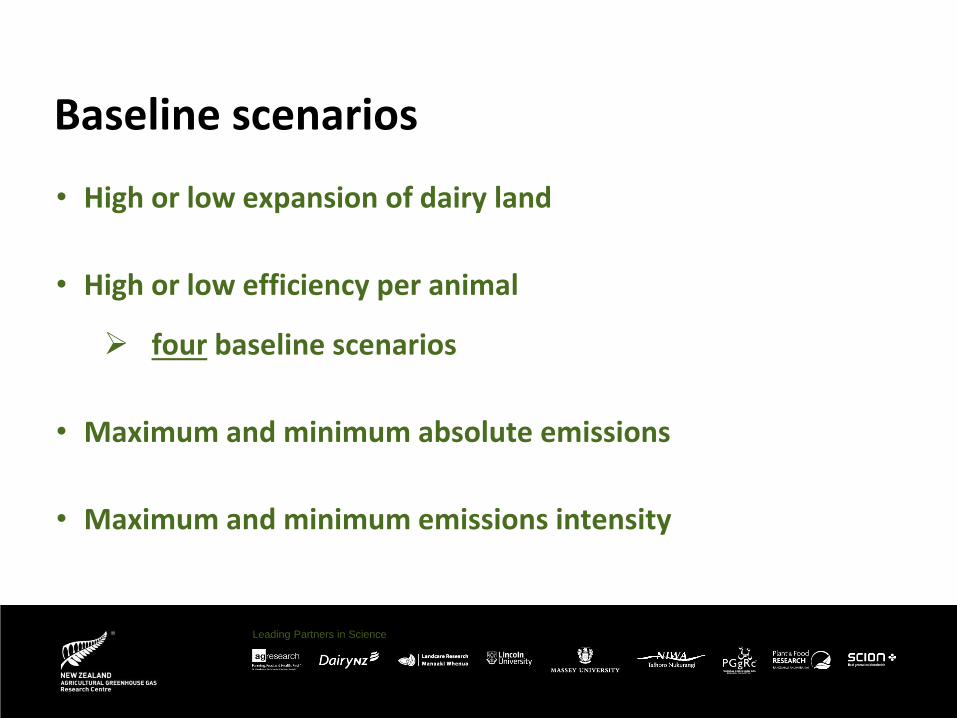
Warming is proportional to cumulative CO2 emissionsBaseline scenarios
• High or low expansion of dairy land
• High or low efficiency per animal
four baseline scenarios
• Maximum and minimum absolute emissions
• Maximum and minimum emissions intensity
Leading Partners in Science
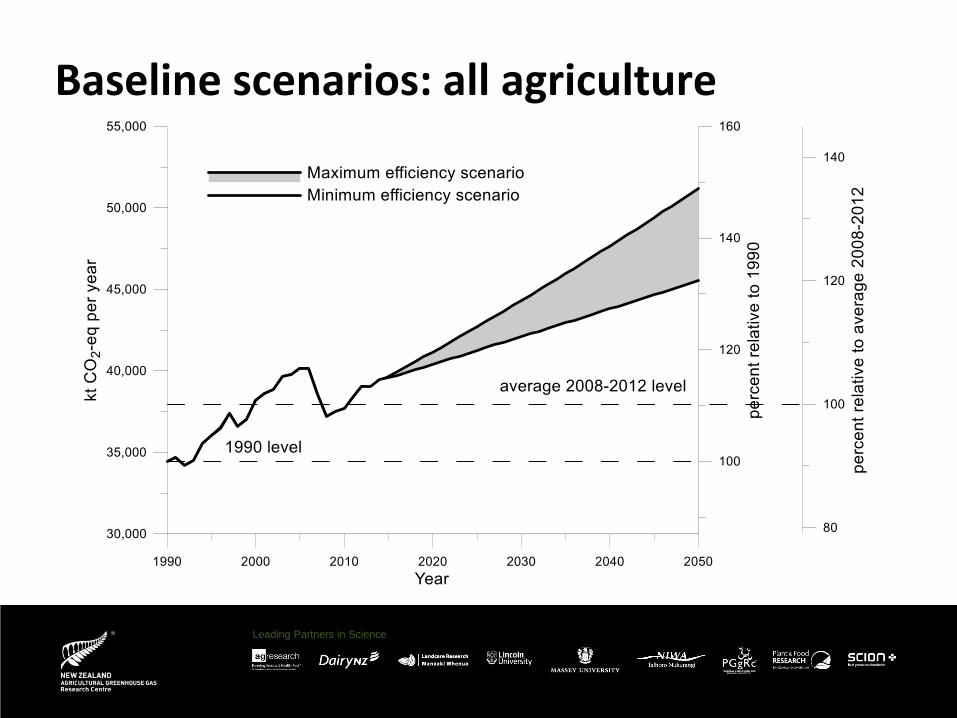
Warming is proportional to cumulative CO2 emissionsBaseline scenarios: all agriculture
Leading Partners in Science
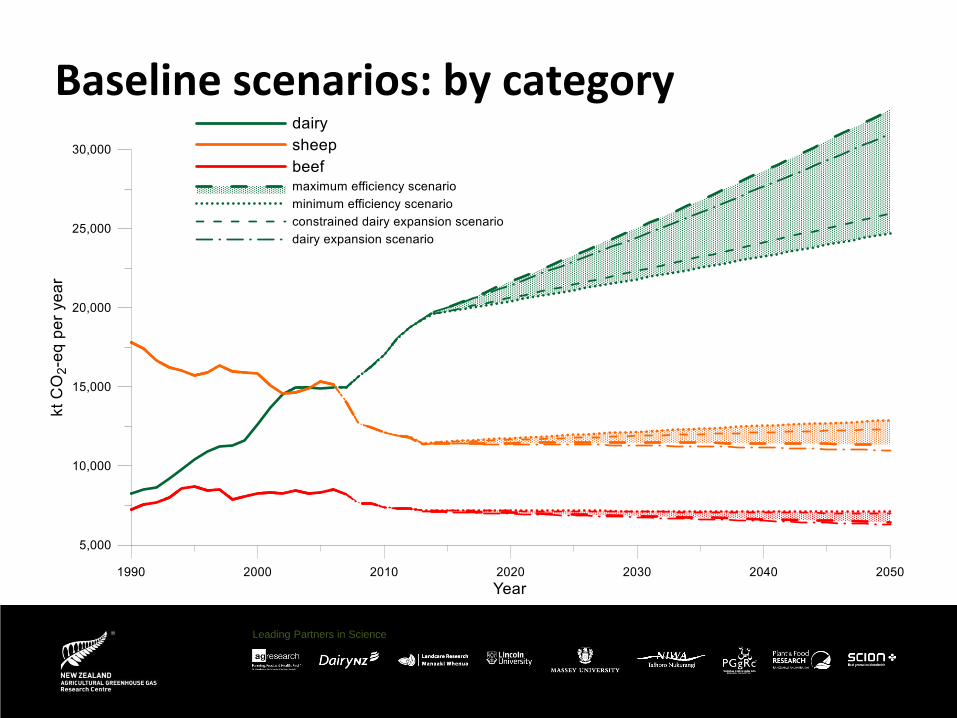
Warming is proportional to cumulative CO2 emissionsBaseline scenarios: by category
Leading Partners in Science
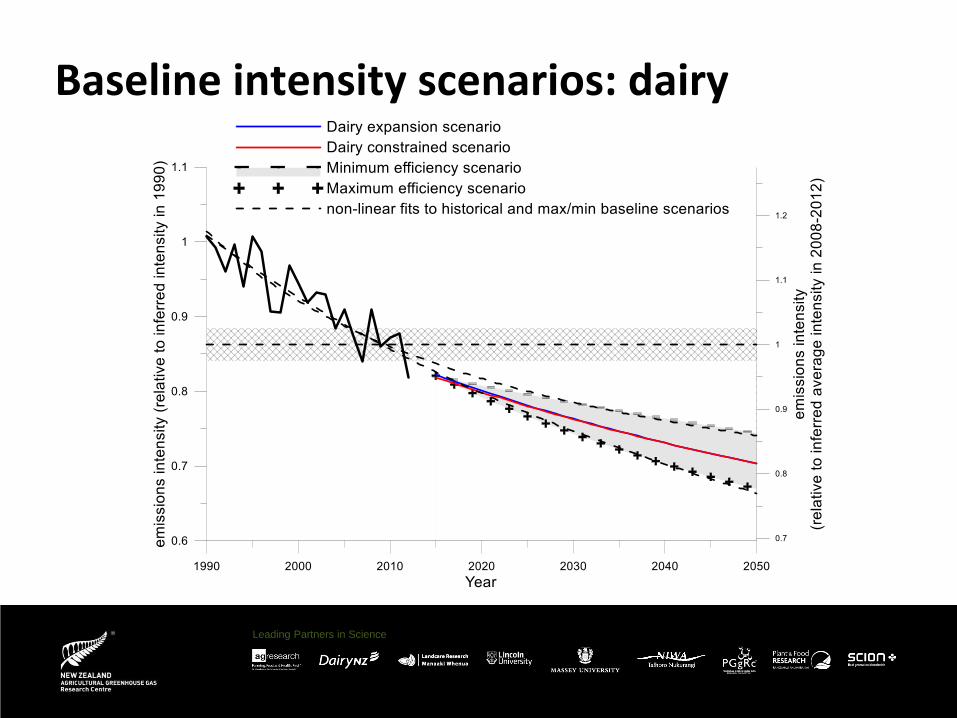
Warming is proportional to cumulative CO2 emissionsBaseline intensity scenarios: dairy
Leading Partners in Science
Warming is proportional to cumulative CO2 emissionsBaseline scenarios summary
• Absolute emissions will continue to increase
• Emissions intensity will continue to decline, but at a gradually slower rate as productivity increases
• Lifting productivity significant mitigation option for emissions intensity – but increases absolute emissions without constraints on animal numbers or total production
Leading Partners in Science
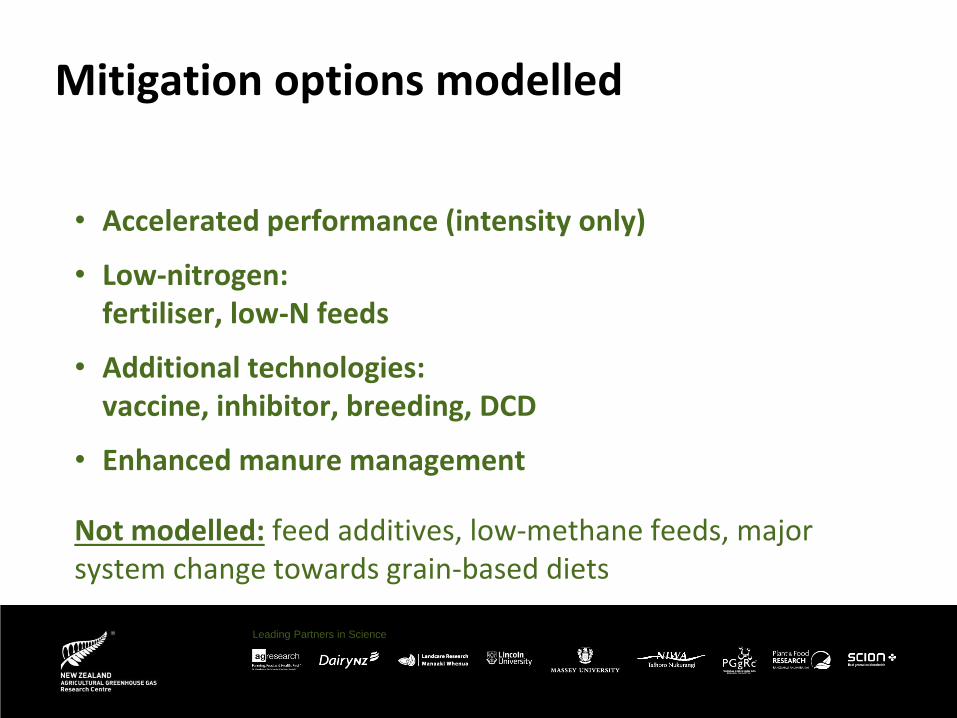
Warming is proportional to cumulative CO2 emissionsMitigation options modelled
• Accelerated performance (intensity only)
• Low-nitrogen:fertiliser, low-N feeds
• Additional technologies:vaccine, inhibitor, breeding, DCD
• Enhanced manure management
Not modelled: feed additives, low-methane feeds, major system change towards grain-based diets
Leading Partners in Science
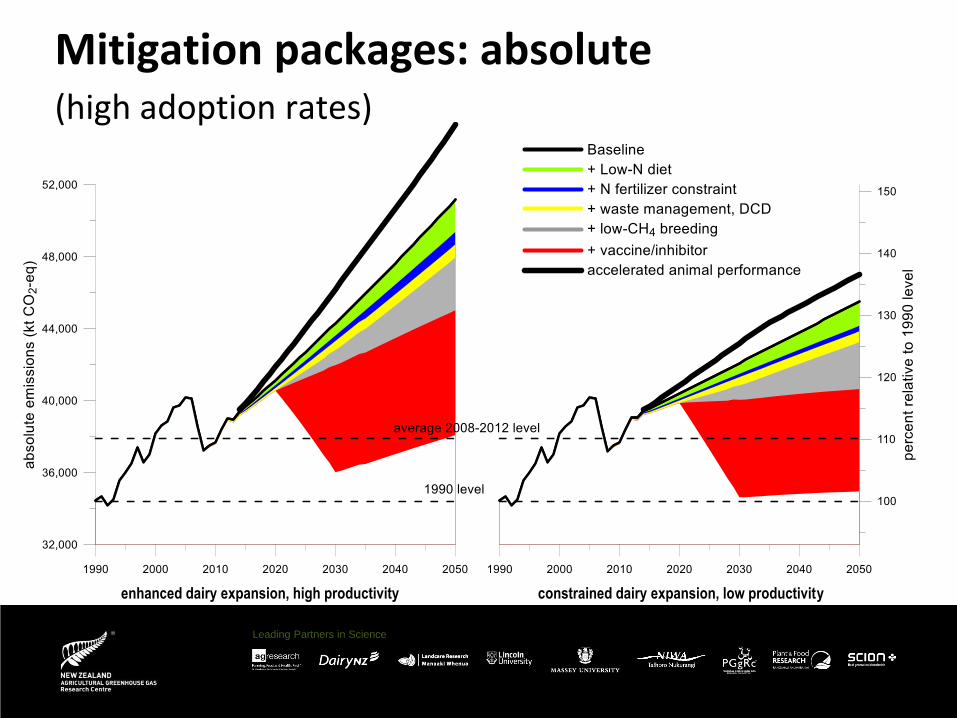
Warming is proportional to cumulative CO2 emissionsMitigation packages: absolute(high adoption rates)
enhanced dairy expansion, high productivity constrained dairy expansion, low productivity
Leading Partners in Science
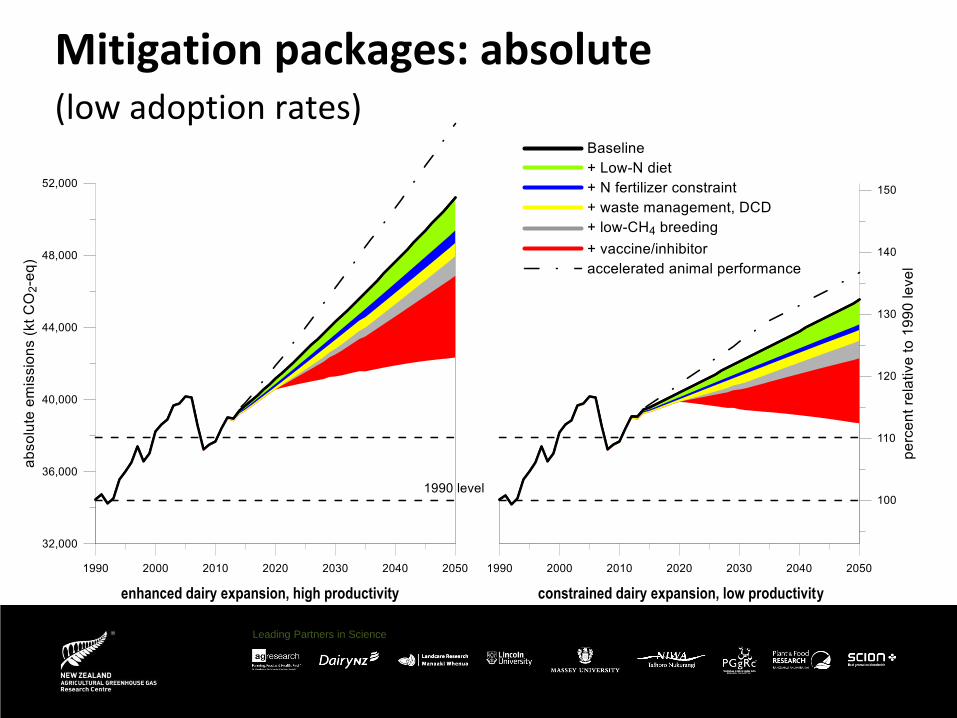
Warming is proportional to cumulative CO2 emissionsMitigation packages: absolute(low adoption rates)
enhanced dairy expansion, high productivity constrained dairy expansion, low productivity
Leading Partners in Science
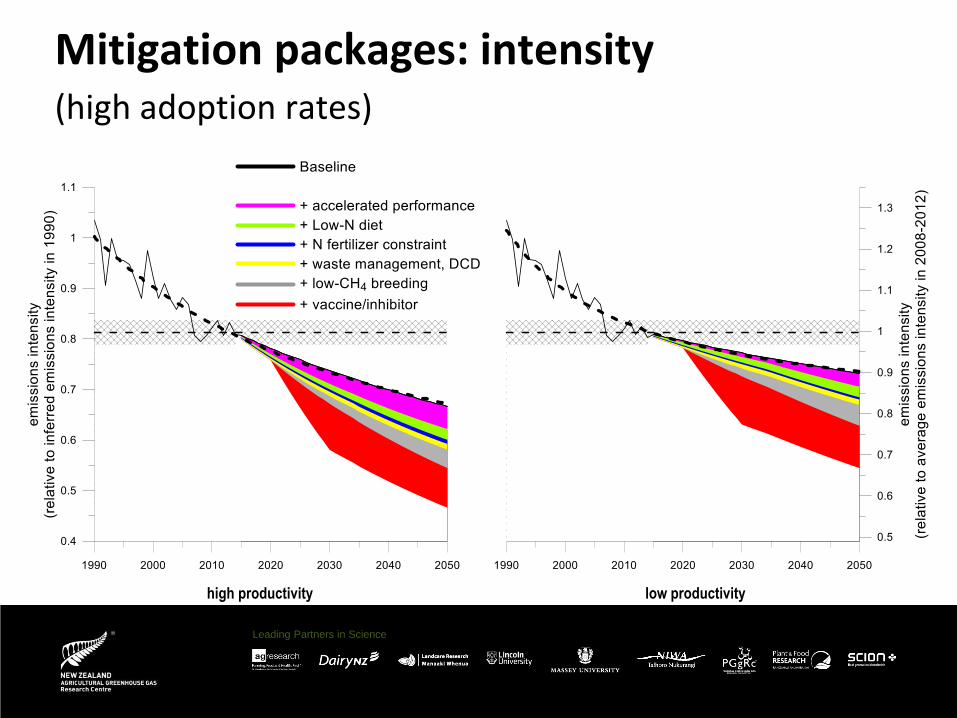
Warming is proportional to cumulative CO2 emissionsMitigation packages: intensity(high adoption rates)
high productivity low productivity
Leading Partners in Science
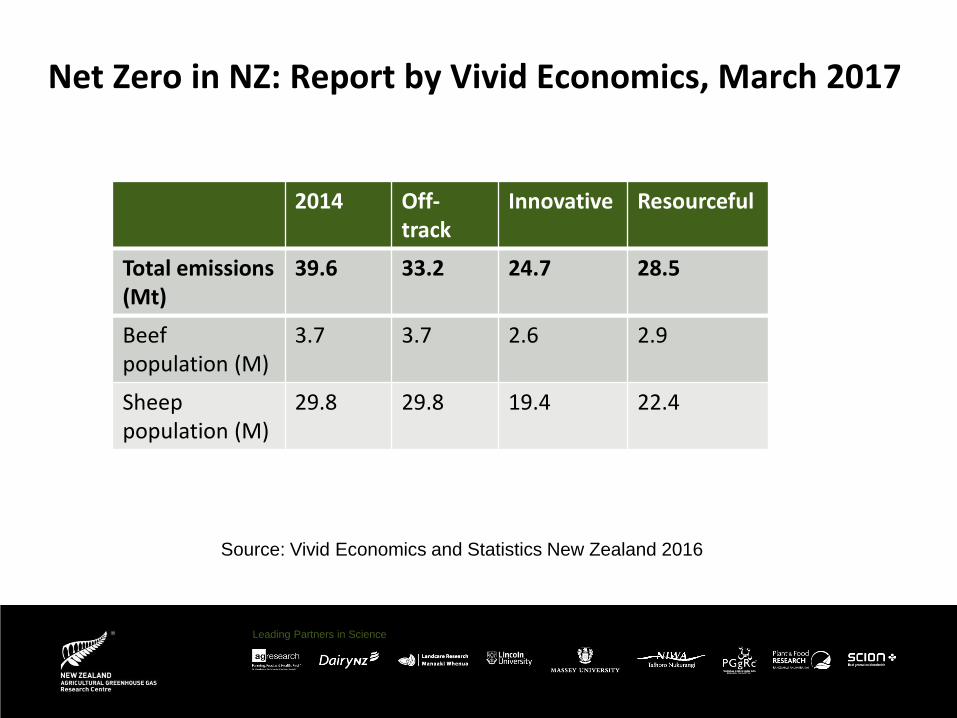
Dairy population (M)
6.7 6.7 5.4 6.0
Beef population (M)
3.7 3.7 2.6 2.9
Sheep population (M)
29.8 29.8 19.4 22.4
Total emissions (Mt)
39.6 33.2 24.7 28.5
Net Zero in NZ: Report by Vivid Economics, March 2017
Source: Vivid Economics and Statistics New Zealand 2016
2014 Off-track
Innovative Resourceful
Leading Partners in Science
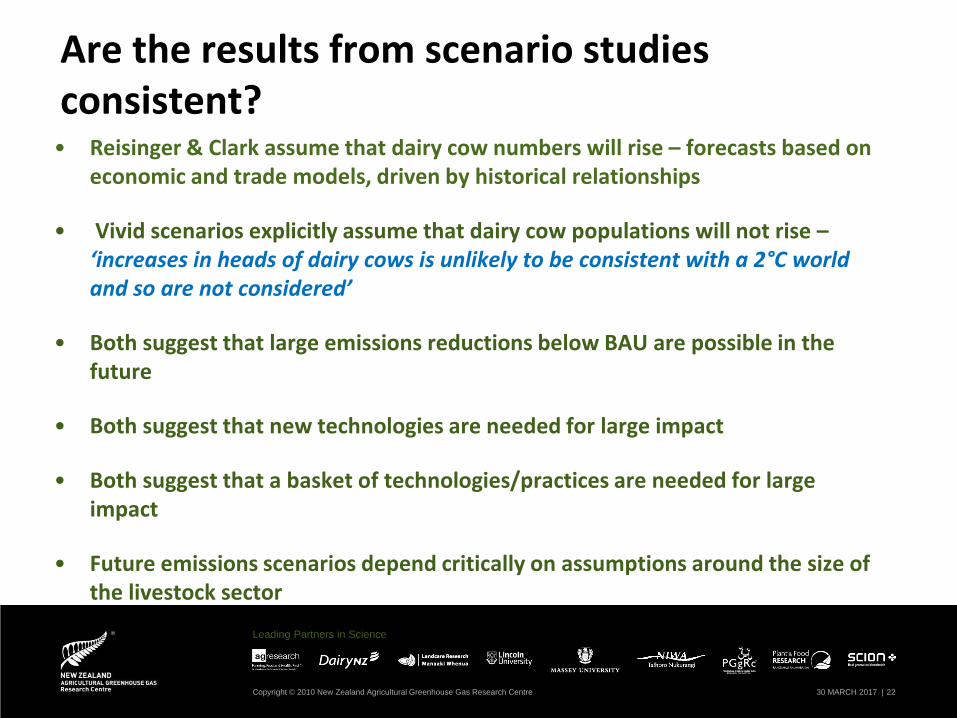
Are the results from scenario studies consistent?• Reisinger & Clark assume that dairy cow numbers will rise – forecasts based on
economic and trade models, driven by historical relationships
• Vivid scenarios explicitly assume that dairy cow populations will not rise –‘increases in heads of dairy cows is unlikely to be consistent with a 2°C world and so are not considered’
• Both suggest that large emissions reductions below BAU are possible in the future
• Both suggest that new technologies are needed for large impact
• Both suggest that a basket of technologies/practices are needed for large impact
• Future emissions scenarios depend critically on assumptions around the size of the livestock sector
Copyright © 2010 New Zealand Agricultural Greenhouse Gas Research Centre 30 MARCH 2017 | 22


![[Guia Elite Potions]](https://img.dokumen.tips/doc/110x75/5571f27649795947648c974c/guia-elite-potions.jpg)