Embed Size (px)
Citation preview

Real Time Measurement of Oxygen by Integrating a Clark
Sensor with Low Cost Printed Circuit Board Technology and
Solid Electrolyte Membrane
By
Ayda Niazi
A thesis submitted to
The University of Birmingham
for the degree of
DOCTOR OF PHILOSOPHY
COLLEGE OF ENGINEERING AND PHYSICAL SCIENCE
SCHOOL OF MECHANICAL ENGINEERING
JANUARY 2016

University of Birmingham Research Archive
e-theses repository This unpublished thesis/dissertation is copyright of the author and/or third parties. The intellectual property rights of the author or third parties in respect of this work are as defined by The Copyright Designs and Patents Act 1988 or as modified by any successor legislation. Any use made of information contained in this thesis/dissertation must be in accordance with that legislation and must be properly acknowledged. Further distribution or reproduction in any format is prohibited without the permission of the copyright holder.

II
Abstract A prototype of a miniaturized Clark type electrochemical oxygen sensor integrated with a 3D
printed in vitro cell culturing platform is designed and developed for the purpose of
monitoring the cellular oxygen consumption by the solution flowing through the cultured
cells on the platform. Oxygen respiration indicates a cell's metabolic activity, so by
measuring a chemical's oxygen content as it passes through a cell chamber, we can measure
that chemical's potential effectiveness. This miniature micro sensor is designed and fabricated
on a printed circuit board for the first time and integrated with a solid electrolyte membrane
and 3D printed cell culturing platform to ensure robustness and low manufacturing cost.
Hence the sensor is aimed at enabling the pharmaceutical industry to rapidly test chemical
products on animal and cancer cells; and has been designed to be low cost and suitable for
mass production.
The cell culturing platform’s prototype, which contains inlet and outlet pipes and a cell
culturing chamber, was manufactured by The Eden250™ 3D Printing System using the Objet
biocompatible material MED610™. The presented oxygen sensor configuration consists of
two identical series of working, reference and counter microelectrodes, placed before and
after the cell culturing chamber. It was manufactured by combining printed circuit board
technology and laser micro machining techniques to create microscale microelectrode
spacing. The usual electrolyte solution is replaced with a solid polymer electrolyte
membrane, Nafion (perfluorosulfunic acid membrane, DuPont Company), which removed
requirement for extra humidification and increased the shelf life of the dissolved oxygen
sensing system. The solid polymer electrolyte also ensured robustness and good electrical
conductivity for sensing. The sensor functions without humidification or any special
condition and has a long shelf life. The sensitivity of the oxygen sensor was tested in
different oxygen concentration in gas and liquid states and was calibrated with measurements

III
from a Portable Multi-Gas Analyser provided by Super Systems Europe and a Gold probe
dissolved oxygen analyser. The prototype can detect the small changes in oxygen
concentration in the range of 0 to 5 μA current and has a response time of less than 5 seconds.

IV
I dedicate this thesis to my parents.

V
Acknowledgment First I would like to thank my supervisor Dr. Carl Anthony for his kind help, wisdom and
supervision during the period of my research course. I wish to thank Super Systems Europe
group for their productive cooperation and their kind help to provide sensor calibration
testing facilities.
I would like to thank my colleagues Aydin, Nasim, Tianshi, Ali Kubba, and Haseena at the
micro and nano technology centre of Birmingham University and my dear friends Fatima and
Mahyar.
I also wish to thank department of Chemical Engineering to provide Gold probe dissolved
oxygen analyser to calibrate my sensors.
I would like to specially thank Mr. Alan Yates for his kind help and guidance with circuit
design and fabrication.
I would particularly like to thank my father, Annemohammed Niazi for his unwavering
moral, emotional and financial support and endless inspiration and my mother, sister and
brothers, Sarah, Anya, Nasin, Poulad, Behzad and Timor for their love and emotional support
throughout my academic life. Finally I would like to thank my best friend James for his
endless encouragement, love and support throughout the period of my research course.
Ayda Niazi
Birmingham
January 31, 2016

VI
List of Publications During the course of this project, the following Conference Proceedings have been published:
Ayda Niazi, Carl Anthony, Development of oxygen sensor by integrating the low cost
printed circuit board technology and solid electrolyte membrane, ICBES
(International Conference on Biomedical Engineering and Systems) Prague, Czech
Republic, August 2014.
Ayda Niazi, Carl Anthony, Real time measurement of oxygen by integrating a Clark
sensor with printed circuit board technology and solid electrolyte, MNE (International
Conference on Micro and Nano Engineering), September 2014.
Ayda Niazi, Carl Anthony, Modelling of the oxygen consumption of cells in the cell
culturing platform, COMSOL Conference, Cambridge, UK, September 2014.
Also a journal paper is submitted and under review:
Ayda Niazi, Carl Anthony, Comparison of six miniaturized oxygen sensors,
fabricated by printed circuit board technology and solid polymer electrolyte in liquid
and gas state measurements.

VII
Contents
Abstract ..................................................................................................................................... II
Acknowledgment ...................................................................................................................... V
List of Publications .................................................................................................................. VI
Contents ................................................................................................................................. VII
List of Figures ........................................................................................................................... X
List of Tables ........................................................................................................................ XIII
1. Introduction ........................................................................................................................ 1
1.1. Introduction ................................................................................................................. 1
1.2. Aims and Objectives ................................................................................................... 3
1.3. Thesis Overview .......................................................................................................... 5
2. Literature Review ............................................................................................................... 6
2.1. Introduction ................................................................................................................. 6
2.2. Biosensors ................................................................................................................... 6
2.3. Classification of Oxygen Biosensors .......................................................................... 8
2.3.1. Optical oxygen sensors ........................................................................................ 8
2.3.2. Electrochemical oxygen sensors ........................................................................ 10
2.3.2.1. Clark-type oxygen sensor theory of operation ........................................... 12
2.4. Electrochemistry of Clark type oxygen sensor ......................................................... 15
2.4.1. Electrodes ........................................................................................................... 18
2.4.1.1. Working Electrode ...................................................................................... 18
2.4.1.2. Reference Electrode .................................................................................... 18
2.4.1.3. Counter electrode ........................................................................................ 19
2.4.2. Gas Permeable Membrane (Teflon membrane) ................................................. 19
2.4.3. Electrolyte .......................................................................................................... 20
2.4.3.1. Solid Polymer Electrolyte ........................................................................... 20
2.5. Electrical Double Layer ............................................................................................ 22
2.6. Transport Process ...................................................................................................... 24
2.6.1. Diffusion of planar (rectangular) electrodes ...................................................... 27
2.6.2. Diffusion of spherical electrodes ....................................................................... 28
2.6.3. Diffusion of microdisc electrodes ...................................................................... 29
2.7. Kinetics of electrode reactions .................................................................................. 31
2.7.1. Heterogeneous electrochemical reactions .......................................................... 32
2.8. Electrochemical measurement techniques ................................................................ 34

VIII
2.8.1. Cyclic voltammetry ............................................................................................ 34
2.8.2. Chronoamperometry .......................................................................................... 37
2.9. Microelectrodes ......................................................................................................... 38
2.9.1. The capacitive current effect .............................................................................. 39
2.9.2. The Ohmic drop effect ....................................................................................... 40
2.10. Review of State of Art in electrochemical oxygen sensor in biological applications
40
2.11. Summary ................................................................................................................ 53
3. Design of Oxygen Sensor ................................................................................................. 54
3.1. Introduction ............................................................................................................... 54
3.2. Design of the electrochemical oxygen sensor ........................................................... 54
3.2.1. Design theory of microelectrodes for the oxygen sensor................................... 55
3.2.1.1 Working electrode design ........................................................................... 60
3.2.1.2 Reference and Counter electrode design .................................................... 60
3.2.2. Design of three-electrode sensor on the printed circuit board ........................... 61
3.3. Design of the control circuit board ............................................................................ 64
3.3.1. Theory of design ................................................................................................ 64
3.3.2. LTspice software design and simulation............................................................ 65
3.3.3. Final design of the control circuit ...................................................................... 68
3.4. Design of the cell culturing platform ........................................................................ 69
3.4.1. Modelling the oxygen respiration of cells ......................................................... 71
3.5. Final design ................................................................................................................... 76
3.6. Summary ....................................................................................................................... 76
4. Materials and Fabrication ................................................................................................. 77
4.1. Introduction ............................................................................................................... 77
4.2. Materials and Fabrication .......................................................................................... 77
4.2.1. PCB Oxygen sensor ........................................................................................... 77
4.2.1.1. Materials for the sensor’s electrodes .......................................................... 78
4.2.1.2. Fabrication of PCB sensors ........................................................................ 79
4.2.2. Control circuit fabrication .................................................................................. 87
4.2.3. Cell culturing platform fabrication .................................................................... 88
4.2.3.1. Material for cell culturing platform ............................................................ 89
4.2.3.2. Fabrication (cell culturing platform) .......................................................... 89
4.2.4. Integration of oxygen sensor and cell culturing platform .................................. 96

IX
4.2.4.1. Nafion membrane application .................................................................... 97
4.3. Summary ................................................................................................................... 98
5. Tests and Results .............................................................................................................. 99
5.1. Introduction ............................................................................................................... 99
5.2. Technical problems associated with the PCB oxygen sensor with solid electrolyte
membrane ............................................................................................................................. 99
5.3. Gas state measurement ............................................................................................ 102
5.3.1. Experimental setup........................................................................................... 102
5.3.2. Sensor characterization .................................................................................... 104
5.3.3. Cyclic voltammetry .......................................................................................... 104
5.3.4. Voltage step measurement (chronoamperometry) ........................................... 106
5.3.5. Sensor performance ......................................................................................... 106
5.4. Liquid state measurement........................................................................................ 113
5.4.1. Experimental setup........................................................................................... 113
5.4.2. Sensor performance ......................................................................................... 115
5.5. Summary ................................................................................................................. 117
6. Conclusion ...................................................................................................................... 118
6.1. Suggestions for Future Work .................................................................................. 120
References .............................................................................................................................. 122

X
List of Figures Figure 2.1 Clark and Lyons electrode system [15]. ................................................................... 7
Figure 2.2 Generic Optical Fluorescence Dissolved Oxygen Analyzer Configuration [16]. .... 9
Figure 2.3 the classic two electrode (Platinum and Ag/AgCl) Clark sensor [26].................... 12
Figure 2.4 Diagram of current/voltage features of dissolved gas sensing electrode. Region 1
shows the redox reaction under kinetic control. Region 2 corresponds to the redox reaction
under diffusion limited conditions. Region 3 signifies additional redox reactions occurring
[25]. .......................................................................................................................................... 13
Figure 2.5 Diagram of the reaction mechanism on the sensor [25]. ........................................ 15
Figure 2.6 (a) Diagram of Galvanic cell, (b) illustration of Electrolytic cell [30]. .................. 16
Figure 2.7 Chemical compound of Nafion (Du Pont) is a perfluorinated polysulfonate
polyelectrolyte.......................................................................................................................... 21
Figure 2.8 Schematic of double layer in a liquid at contact with a negatively-charged solid. 22
Figure 2.9 Diagram of electron transfer at the surface of the electrode [37]. .......................... 24
Figure 2.10 Change of current with time according to the Cottrell equation. ......................... 28
Figure 2.11 Concentration profiles for several times after the start a Cottrell experiment. .... 31
Figure 2.12 WE’s potential vs. time variation in cyclic voltammetric experiment. ................ 35
Figure 2.13 cyclic voltammetric behaviour of a macroelectrode for a reversible reaction. .... 36
Figure 2.14 Cyclic voltammogram for a microelectrode at a reversible reaction [39]. ........... 37
Figure 2.15 Potential step in chronoamperometry to obtain a diffusion-limited current of the
electroactive species................................................................................................................. 37
Figure 2.16 The resulting plot current-time (Chronoamperogram) [31]. ................................ 39
Figure 2.17 Typical CVs obtained for the 2 mM FcA solution containing different E. coli
concentration of 0, 0.25, 0.5, 0.75, 1, 1.25, 1.5, 1.75, and 2 Optical density/mL [43]. ........... 42
Figure 2.18 Fabricated DO microelectrode array sensor is packed on a PCB carrier and a
scanning electron micrograph (SEM) of the recessed electrode [46]. ..................................... 43
Figure 2.19 Calibration curves for the recessed DO microelectrodes array against saline
(0.85% NaCl solution) and a mineral salt solution [46]. ......................................................... 44
Figure 2.20 The arrangement of a miniature sensor. It’s made up of (a) a glass substrate with
a groove made by SU8 photoresist and (b) a container substrate with an oxygen-permeable
membrane. W, C and R are the working, counter and reference electrode, respectively [6]. . 45
Figure 2.21 Calibration curve for the oxygen sensor. The trial was conducted in a 10mM PBS
solution (pH 7.0) by adding Na2SO3. Applied voltage: −0.7V [6]. ........................................ 46
Figure 2.22 The fabricated array reservoir-type oxygen sensor [3]. ........................................ 47
Figure 2.23 (a) Reproducibility of the fabricated Clark-type sensor. (b) Linearity curve of the
fabricated Clark-type sensor [17]............................................................................................. 47
Figure 2.24 Basic diagram of the sensing system [48] ............................................................ 48
Figure 2.25 Calibration curve of the sensor [48]. .................................................................... 48
Figure 2.26 Pictorial depiction and single element cross-section of the dissolved gas sensor
test matrix [5]. .......................................................................................................................... 49

XI
Figure 2.27 CV calibration measurement of 10 μm, 20 μm, 40 μm, and 80 μm working
electrode diameter, 8 electrode array sets. ............................................................................... 50
Figure 2.28 Cross sectional and top view of the oxygen sensor [50]. ..................................... 51
Figure 2.29 Response of the output current when oxygen concentration varies by
implementing on a SABER simulator [50]. ............................................................................. 51
Figure 3.1 Illustration of a three-electrode cell. ....................................................................... 55
Figure 3.2 Different types of microelectrode and their diffusion fields. ................................. 57
Figure 3.3 Illustration of the (a) linear diffusion field at short times and (b) spherical diffusion
field at long times at the microdisc. ......................................................................................... 59
Figure 3.4 PCB layouts of ten sensors with 20 mm x 40 mm chip dimension. ....................... 63
Figure 3.5 Sensors designed with Diptrace software with minimum precision of 100 microns.
.................................................................................................................................................. 64
Figure 3.6 Design of the sensor showing the expected dimension after Laser micromachining
to achieve 20 microns precision. .............................................................................................. 64
Figure 3.7 Schematic of the circuit using ideal Op-Amps. ...................................................... 65
Figure 3.8 I_sense behaviour when the resistance R2 is varied. ............................................. 67
Figure 3.9 Schematic of the circuit considering two parallel designs for two oxygen sensor. 68
Figure 3.10 PCB schematic of the external circuitry designed by Diptrace. ........................... 69
Figure 3.11 Cell culturing platform and the PCB sensor platform .......................................... 70
Figure 3.12 Cross section view of the cell culturing platform. ................................................ 70
Figure 3.13 Reduction of oxygen in the cell culturing chamber at steady state study. ........... 74
Figure 3.14 Transient reduction of oxygen in the cell culturing chamber in 10 second. ......... 74
Figure 3.15 Comparison of O2 concentrations between inlet and outlet pipes while increasing
the inlet velocity of the inlet fluid. ........................................................................................... 75
Figure 3.16 Integration of the sensor platform and the cell culturing platform with Nafion
membrane, PTFE membrane and O’ rings. ............................................................................. 76
Figure 4.1 A. Covering the base material with photoresist to create circuit structures, covering
the conductor pattern using the negative process. B. Developing the exposed material,
removing the copper not covered by the photoresist. C. Removing the photo-laminate used as
etching mask. ........................................................................................................................... 80
Figure 4.2 A. Drilling of holes, metallisation of the entire circuit board including the inside of
the borehole with a thin copper layer. B. Covering with photoresist to create the circuit
structures, Applying and exposing the film. C. Developing the exposed material, reinforcing
the circuit structures to their final thickness with an additional copper layer. D. Covering with
a Tin layer as an etching mask. ................................................................................................ 81
Figure 4.3 A. Removing the photoresist and the copper not covered by the Tin resist,
removing the metal resist. B. Applying a photo-sensitive solder-stop layer, Applying and
exposing the film, developing the material. C. Applying a solder able surface e.g. chemical
nickel-gold, covering the solder mask lacquer, Labelling with screen printing, milling the end
profile. ...................................................................................................................................... 82
Figure 4.4 Oxygen sensors fabricated by PCB fabrication method and with ENIG coating.
Sensors shown from A to E in this figure coincide with dimension shown on Table 3.3 of
chapter three. ............................................................................................................................ 82
Figure 4.5 Reconfigurable Lasea Multi-Axis Laser Micro Machining platform. .................... 83

XII
Figure 4.6 Main component technologies of the laser micro machining platform. ................. 84
Figure 4.7 Oxygen sensors fabricated by PCB fabrication method with further laser
micromachining. Sensors shown from F to J in this figure coincide with dimension shown on
Table 3.3 of chapter three. ....................................................................................................... 85
Figure 4.8 Alicona G4 InfiniteFocus (IF) system. ................................................................... 86
Figure 4.9 Principal of operation for Alicona G4 InfiniteFocus system [57]. ......................... 87
Figure 4.10 3D image of sensor J shown at Figure 4.7 produced using Alicona InfiniteFocus
system. ..................................................................................................................................... 87
Figure 4.11 Fabricated control circuit board............................................................................ 88
Figure 4.12 Schematic of a Transwell. .................................................................................... 95
Figure 4.13 PCB oxygen sensor and cell culturing platform after fabrication. ....................... 96
Figure 4.14 Integrated PCB oxygen sensor, cell culturing platform and control circuit. ........ 97
Figure 4.15 Nafion and PTFE membranes after being hot pressed onto the PCB ................... 97
Figure 5.1 PCB sensors prepared for hot pressing. ................................................................ 100
Figure 5.2 Measurement instrumentation inside a tin box. .................................................... 101
Figure 5.3 New cell culturing chip with improved features. ................................................. 101
Figure 5.4 Diagram of the experiment setup. ........................................................................ 103
Figure 5.5 Experimental setup and instrumentation system. ................................................. 103
Figure 5.6 CV measurements of six sensors with WE diameter ranging from 20μm to
900μm.The measured current by the control circuit, increased by increasing the voltage. ... 105
Figure 5.7 Step response plot of sensor A to F. ..................................................................... 106
Figure 5.8 Step linearity response at 2.25V. .......................................................................... 107
Figure 5.9 Step linearity response at 2V. ............................................................................... 107
Figure 5.10 Step linearity response at 1.8V. .......................................................................... 108
Figure 5.11 Step linearity response at 1.6V. .......................................................................... 108
Figure 5.12 CV linearity response of the sensor with 20 μm diameter of WE. ..................... 109
Figure 5.13 CV linearity response of two electrode’s set at individual PCB sensor chip. .... 109
Figure 5.14 Diagram of liquid state experimental setup. ....................................................... 114
Figure 5.15 Experimental setup and instrumentation system for liquid state measurements.
................................................................................................................................................ 114
Figure 5.16 Step linearity response at 2.5V. .......................................................................... 115
Figure 5.17 Step linearity response at 2.25V. ........................................................................ 115
Figure 5.18 Step linearity response at 2V. ............................................................................. 116
Figure 5.19 Step linearity response at 1.8V. .......................................................................... 116
Figure 5.20 Step linearity response at 1.6V. .......................................................................... 116

XIII
List of Tables Table 2.1The general form of Fick’s second law considering every coordinate system. ........ 26
Table 2.2 Boundary conditions for diffusion at planar (rectangular) electrodes. .................... 27
Table 2.3 Boundary conditions for diffusion at spherical electrodes ...................................... 28
Table 2.4 The concentration variation when a concentration gradient imposed on the
electrode surface. ..................................................................................................................... 30
Table 3.1 Critical dimension of the electrodes with different their special form of diffusion
field in the steady state. ............................................................................................................ 57
Table 3.2 Estimates of the timescales is shown where Cottrell behaviour or a steady state
response can be expected for microsphere electrodes with different size. .............................. 59
Table 3.3 Dimensions and area ratios of the WE, RE and CE................................................. 62
Table 4.1 Specifications of the laser sources used for the surface machining of sensors E to J
of Table 3.3. ............................................................................................................................. 85
Table 4.2 Contact angle measurements. a) Measurements made immediately after PDMS was
treated in oxygen plasma. b) Measurements made after 40 min following treatment in oxygen
plasma. c) No significant change observed in measurements made immediately after and
following 40 min after plasma treatment [60]. ........................................................................ 91
Table 4.3 Surface Roughness Measurements [60]. .................................................................. 92
Table 4.4 Typical dimension of cell culturing wells and their average cell yield volume. ..... 95

Introduction
1
1. Introduction
1.1. Introduction
The Clark type oxygen sensor is extensively used among the diverse instruments to measure
oxygen in many clinical researches, fermentation monitoring and biosensor developments [1].
It was invented by Leland C. Clark in 1956 to detect low levels of oxygen [2].
As an electrochemical sensor, it has a low deviation among the sensors and produces good
repeatability and reproducibility. In the past two decades there have been various
developments on the Clark type sensors which can now be fabricated utilizing MEMS
technology. Miniaturized dissolved oxygen sensors have been frequently produced using
silicon-based and poly dimethyl siloxane (PDMS) materials for their ease of applying micro
fabrication processes such as lithography, spincoating and wet/dry-etching on them [3-6].
However it has been proven to be difficult to incorporate these miniaturized sensors in the
environment due to their need for rehydration, sophisticated sealing systems to prevent
leakage or drying of liquid electrolyte and continuous maintenance [3, 4, 6].
Usage of a solid electrolyte eliminates the need of rehydration while increasing the shelf life,
as described by Glen W. McLaughlin and co-workers [5]. Solid state proton conductive
matrix (PCM) as an electrolyte was coated on the oxygen sensor that was fabricated using
silicon wafer and microfabrication techniques. Further it was encapsulated in a bio inert
polytetrafluoroethelene (PTFE), which improved the performance of the microfabricated
electrode matrix and was shown to have a linear response over 0 – 300 mmHg of dissolved
oxygen concentration through cyclic voltammetry (CV) and voltage step (VS) measurements.

Introduction
2
Though there were issues of robustness and short shelf life due to the fragile behaviour of
silicon [5].
Recently printed circuit board technology has created a potential as a MEMS platform for
developing microsensors due to their advantages of robustness, acknowledged commercial
production methods and good connectivity to standard systems [7]. “Having the advantages
of robustness, easy connectivity to standard electrical systems and firm commercial
fabrication techniques, PCB (Printed circuit board) makes it easy to fabricate microelectrode
features like pads and tracks with gold coating and strong connectivity, which is difficult to
achieve in silicon wafer processing and standard MEMS techniques” [7].
In this thesis, the potential of using printed circuit board technology as a miniaturized
biological oxygen sensor platform, having advantages of reduced price and advanced
production technology has been investigated.
Prospective applications of the oxygen monitoring device include pharmacological product
testing. E.g., monitoring the cellular respiration during the examination of new chemical
products on the animal cells can point to specific state of metabolism of that cell, which is
affected by the chemical product. Oxygen is an important regulator of normal cell behaviour.
It is one of the most important indicators of biological activity during cell culture and
microbial development. Theoretically, the concentration of oxygen in a solution containing
live cells will demonstrate key statuses of those cells, since the living cells will consume
oxygen from solution and thus reduce its concentration. The damaged cells will consume a
lower amount of oxygen due to their decreased metabolic activities; dead cells won’t
consume any oxygen so there won’t be any reduction in the oxygen concentration [8].

Introduction
3
1.2. Aims and Objectives
The aim of this project is to design an integrated oxygen sensor with cell culturing platform
to allow monitoring the cellular respiration of the cultured cells simultaneously. And to
develop a system suitable for mass production that enables the pharmaceutical industry to
rapidly test chemical products on animal and cancer cells and measures that chemical's
potential effectiveness.
It was decided to use miniaturized Clark type oxygen sensor as a cellular respiration
monitoring device. It is possible to measure the respiration of cells in a given time by
utilizing two simultaneously operating oxygen sensors that measure the oxygen concentration
of the fluid or gas medium, before and after being exposed to cells. By this method reduction
of the oxygen concentration in the fluid or gas medium can be calculated after being exposed
to cells. Consequently, the effects of different drugs and chemicals on the metabolism of the
cells can be investigated by reading the oxygen level of the solution or gas under test before
and after adding the drugs and toxins to the cells. The objective is to produce this
miniaturized Clark type oxygen sensor using the low cost printed circuit board technology
having advantages of robustness and advanced fabrication techniques, which permits easy
fabrication of microelectrode features like pads and tracks with gold coating and strong
connectivity on its surface with a precision of 100 microns. A Laser micromachining process
is going to be used to machine sensors with dimensions smaller than 100 microns.
In addition a cell culturing platform prototype was developed utilizing a 3D printing device,
which can produce complex features inside the chip with the potential for cells to grow and
adhere to its chamber and can be easily integrated with a PCB based miniature oxygen
sensor, allowing the measurement of oxygen concentration by the oxygen sensors as the test
solution or gas is flowing through the cultured cells and pipes on the cell culturing platform.

Introduction
4
It is considered to be designed having lighter, stronger and smaller dimensions to reduce the
overall cost and lead time by integrating flow channels and fittings using the most advanced
technologies. Printed circuit board technology and micro fabrication techniques such as laser
micro-machining will be used to achieve the high precision to increase the accuracy of the
sensor.
The usual electrolyte solution will be replaced with a solid polymer electrolyte membrane,
Nafion (perfluorosulfunic acid membrane, DuPont Company), which removes requirement
for extra humidification and increases the product shelf life. The prototype is aimed to detect
changes in the 0-5 μAmp range, having response time of less than 5 seconds.
The cell culturing platform’s prototype, which contains an inlet and outlet pipes and a cell
culturing chamber, will be manufactured by The Eden250™ 3D Printing System using the
Objet biocompatible material MED610™. The presented oxygen sensor configuration
consists of two identical series of working, reference and counter microelectrodes, placed
before and after the cell culturing chamber. The sensitivity of the PCB oxygen sensor will be
tested in different oxygen concentration in gas and liquid states and calibrated with
measurements from a Portable Multi-Gas Analyzer provided by Super Systems Europe and a
Gold probe dissolved oxygen analyser provided by Chemical engineering, University of
Birmingham.

Introduction
5
1.3. Thesis Overview
The structure of this thesis consists of five main chapters. In first chapter a concise
introduction is given about the objective of this research, highlighting the advantages and
improvements.
In the second chapter a broad overview about the background theories of the electrochemical
oxygen sensors is described. Microelectrodes and their electrochemical reactions are
explored. Further the state of the art has been explored comparing the most recent researches
in the development of electrochemical oxygen sensors in biological applications and
discussing the cons and pros.
In the third chapter, the design of microelectrode based oxygen sensors will be described.
Design of an electronic control circuit is explored which will be used to control the applied
voltage to electrodes and record the data being measured using data acquisition modules. The
cell culturing platform design will be presented and along with Finite Element Analysis. The
final design of the integrated oxygen sensor platform will be demonstrated.
In the fourth chapter, different materials used in electrode design will be introduced, as well
as materials used for the cell culturing platform and different fabrication processes such as
PCB fabrication, Laser micromachining and 3D printing. Material preparation and fabrication
processes for the control circuit will be described.
In the fifth chapter, the results of the sensor examination will be shown. It will be tested by
liquid and gas medium and the experimental setups will be demonstrated. Cyclic
voltammetry and voltage step measurements will be carried out. The sensitivity, linearity and
reproducibility of the sensor will be investigated.
In the last chapter a general conclusion and further ideas for future work will be given.

Literature Review
6
2. Literature Review
2.1. Introduction
In this chapter a brief overview of electroanalysis and biosensors is given. Different types of
oxygen biosensor is outlined and introduced. Fundamentals of electrochemistry are defined as
well as diffusion process in electrochemistry and kinetics of electrochemical reactions.
Microelectrodes and their electrochemical reactions are explored. Finally the state of art in
electrochemical oxygen sensors in biological applications has been reviewed.
Electroanalysis is a method in analytical chemistry, which study an analyte by measuring the
potential and current in an electrochemical device encompassing the analyte [9].
Improvements in the electroanalysis created the fast developments of biosensors. First of all,
in the development of biosensors, appropriate bioreceptor, immobilization method and a
transducer should be considered. These sensors allow the analysis with high level of
sensitivity, selectivity, faster and cheaper cost in principle. Among the numerous applications
of these sensors, they are being used in different areas such as clinical analysis and online
control processes for industrial or environmental or in vivo studies. The detectable element in
a biosensor is a biological compound which distinguishes this sensor from other physical or
chemical sensors [10].
2.2. Biosensors
A biosensor is an analytical device that converts a biological reaction into an electrical signal
and combines a biological element (e.g. Glucose) and a physicochemical detector.
Biological and biochemical processes have a significant function in biology and
biotechnology [11]. In the past it has been problematic to convert biological data to electrical
Literature Review
7
signal directly, however in the recent years with the application of biosensing it has been
easier to overcome these problems [12].
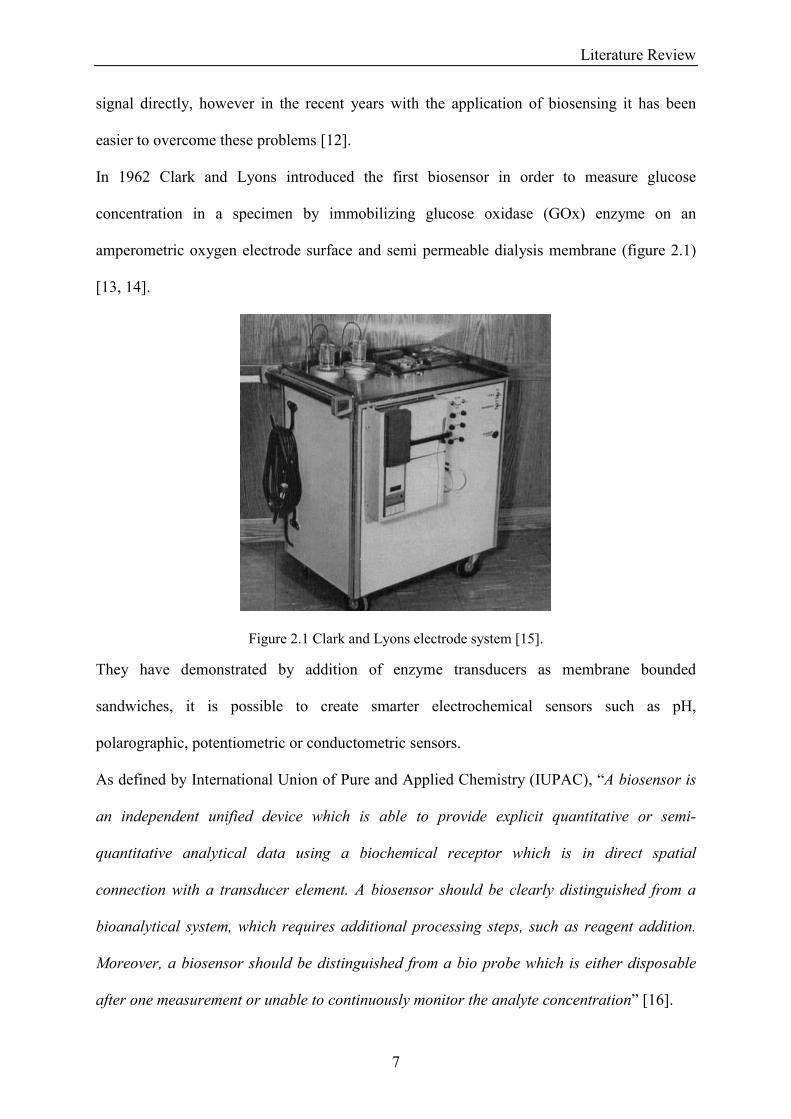
In 1962 Clark and Lyons introduced the first biosensor in order to measure glucose
concentration in a specimen by immobilizing glucose oxidase (GOx) enzyme on an
amperometric oxygen electrode surface and semi permeable dialysis membrane (figure 2.1)
[13, 14].
Figure 2.1 Clark and Lyons electrode system [15].
They have demonstrated by addition of enzyme transducers as membrane bounded
sandwiches, it is possible to create smarter electrochemical sensors such as pH,
polarographic, potentiometric or conductometric sensors.
As defined by International Union of Pure and Applied Chemistry (IUPAC), “A biosensor is
an independent unified device which is able to provide explicit quantitative or semi-
quantitative analytical data using a biochemical receptor which is in direct spatial
connection with a transducer element. A biosensor should be clearly distinguished from a
bioanalytical system, which requires additional processing steps, such as reagent addition.
Moreover, a biosensor should be distinguished from a bio probe which is either disposable
after one measurement or unable to continuously monitor the analyte concentration” [16].

Literature Review
8
A biosensor is a device of two components combination; 1) A bioreceptor is an element of a
biosensor such as enzyme, DNA probe and antibody, which is immobilized and sensitive to
identify the analyte, respectively enzyme substrate, complementary DNA and antigen.
Enzymes are the most commonly employed type of bioreceptor in biosensors.
2) A transducer transforms the chemical fluctuation produced from the reaction of the analyte
and the bioreceptor into an electronic signal. The intensity of generated signal is directly or
inversely proportional to the analyte concentration [13].
However it is not always the enzyme substrate or antigen that needs to be detected in a
biological assay. Another class of biosensor deals with the measurement of oxygen consumed
in living organisms. As mentioned previously oxygen consumption acted as an indicator of
cell metabolism is an important factor in biological analysis [8]. Oxygen sensors have a
variety of biomedical and industrial applications, for example measuring the exhaust gas
concentration of oxygen for internal combustion engines in automobiles or determining the
partial pressure of oxygen in divers breathing gas. Scientists use oxygen sensors to measure
respiration or production of oxygen in an organism [17]. Oxygen sensors are used in oxygen
analysers in medical applications such as anaesthesia monitoring, respirators and oxygen
concentrators.
2.3. Classification of Oxygen Biosensors
2.3.1. Optical oxygen sensors
The optical oxygen sensor measures the oxygen concentration optically with the aid of a
chemical transducer, which is a chemical film with fluorescence properties (related to the
oxygen concentration) attached at the tip of the optical cable. A transducer is a device that
converts one form of energy to another, in here converts optical form of energy to chemical.

Literature Review
9
In the absence of oxygen the fluorescence is at maximum and at the presence of oxygen, its
molecules collide with the fluorescent film, quenching the photoluminescence [18].
Figure 2.2 shows a general optical fluorescence dissolved oxygen analyzer schematic. The
blue light having about 470 nm wavelength is transmitted to the sensing element causing the
dye material to release a pink beam having more than 600 nm wavelength. The light detector
reacts to the pink light. There is no chemical reaction between the oxygen molecules and the
dye material on the chemical film, though the oxygen extinguishes the quantity of the pink
beam by producing different transition states for the excited dye electrons. Measured oxygen
concentration is proportional to the quantity of active fluorescence quenching detected by the
light detector. The electronic analyzer processes the output of the light detector and
temperature sensor and generates a readable oxygen concentration in parts per million (ppm)
[19].
Figure 2.2 Generic Optical Fluorescence Dissolved Oxygen Analyzer Configuration [16].
The optical oxygen sensor is mainly sensitive at low oxygen concentration. Its sensitivity
reduces as the dissolved oxygen increases since the fluorescence signal to oxygen ratio is

Literature Review
10
nonlinear [20]. There is no oxygen consumption and it’s not sensitive to stirring. They can be
utilized for instantaneous monitoring of oxygen production in water splitting reactions as
described by Calzaferri and his co-workers who used this method broadly to observe the
hydrogen production in water splitting research [21].
However the optical oxygen sensors have higher initial acquisition cost, slower measurement
response time than traditional electrochemical sensors and consume more power than
traditional electrochemical sensors.
Alternatively, electrochemical oxygen sensors are very sensitive, since they can detect
electron flow from one molecule. Electrochemical systems are unique in many ways to
overcome problems in optical sensors such as optimising dye loading concentration, photo
bleaching, and reactive oxygen species concentration outside the limited range of detection.
Moreover, electrochemical sensors are faster, simpler to use, and operate at a lower cost
compared to optical systems.
2.3.2. Electrochemical oxygen sensors
The electrochemical oxygen sensor is the most common type of oxygen sensor for measuring
oxygen dissolved in a liquid or gas. Among them, the Clark-type electrode is the most
commonly employed electrochemical sensor and its basic principle is that there is a cathode
and an anode submersed in an electrolyte. Oxygen is an electroactive element, which leads a
change in current intensity. This change is proportional to the concentration of oxygen.
Oxygen enters the sensor through a permeable membrane by diffusion, and is reduced at the
cathode, creating a measurable electrical current [22].
The relationship between oxygen concentration and the current which is being measured is
linear. Oxygen can be measured in the sample under the test considering a two-point
calibration of 0% and 100% air saturation. However there are limitations in this method, such

Literature Review
11
as that oxygen is consumed while doing measurements at a rate identical to the diffusion in
the electrodes. To get correct measurements, the sensor should be stirred constantly and
stagnation of water should be avoided. The bigger the electrode’s size, there will be more
oxygen consumption and sensitivity for stirring also increases. In macro sensors since the
electrolyte is being consumed quickly, over time, it causes a drift in the output signal. On the
other hand it is possible to miniaturize the Clark-type sensors down to a tip size of 10 µm.
The oxygen consumption in these miniaturized sensors is little and its sensitivity to stirring is
insignificant and they can be utilized in stagnant samples such as sediments or inside plant
tissue. Utilizing solid electrolyte eliminates the possibility of liquid electrolyte evaporation or
consumption, which reduces or removes the sensor conductivity and eventually functionality
[22].
The considered electrochemical reaction would generate a measurable current (amperometric
detection), a measurable potential or charge accumulation (potentiometric detection) or
measurable conductivity change of a medium; for example the change of the electrical
conductivity of cell solution (conductometric detection) between electrodes. Amperometry is
a measurement method for current, done at a constant potential. Voltammetry is another
method in which the electrical current is measured while a specific variation of the potential
is being exerted.
Electrochemical oxygen sensors have benefits that they can detect without harming the
system. Their application in industrial and environmental analysis is vital such as the control
of food manufacturing processes, evaluation of food quality and control of fermentation due
to their precise detection, simple use and low cost [23, 24].

Literature Review
12
2.3.2.1. Clark-type oxygen sensor theory of operation
In this sensor the current is measured that result from the electrochemical reduction of the
oxygen, which is dissolved in the solution under the test. The current demonstrates the
concentration of the oxygen.
This sensor needs to be enclosed in oxygen permeable membrane to improve the
measurement accuracy by eliminating other electroactive species that produce reduction
current signal. Furthermore it enables the measurement of dissolved oxygen in sensitive
biological media for example blood.
The classic design of this sensor is a two electrode system being placed in an electrolyte
solution and the electrodes does not reduce easily as shown in figure 2.3 [25].
Figure 2.3 the classic two electrode (Platinum and Ag/AgCl) Clark sensor [26]
To reduce the diffusion time of the oxygen the oxygen, permeable membrane will be located
close to the cathode [27]. The oxygen dissolved in the media passes through the membrane
and will reduce at the cathode where a fixed potential is applied and the current flowing
between the cathode and the anode will be constant under the diffusion limited current
conditions. There are three regions of function in this sensor as can be seen in figure 2.4. In
the first region the reaction is kinetically controlled and the nature of current is in an
exponential proportion to the applied voltage. The current’s behaviour is independent of the
applied voltage in region two and it is called the diffusion limited region. Since the sensitivity

Literature Review
13
of the current to applied voltage is independent in this section, usually the sensor operates in
this region. The current and voltage has an exponential nature in region three same as region
one [25].
Figure 2.4 Diagram of current/voltage features of dissolved gas sensing electrode. Region 1 shows the
redox reaction under kinetic control. Region 2 corresponds to the redox reaction under diffusion
limited conditions. Region 3 signifies additional redox reactions occurring [25].
The behaviour in the diffusion limited condition can be defined by equation (1) and shows
that in an equilibrium condition the produced current is proportional to the concentration of
the oxygen as shown by equation (2). The current has a linear relationship with the dissolved
oxygen concentration in the medium under diffusion limited condition.
(1)
(2)
Where i is the current (A), n is the number of oxidised electrons (reduced), F is Faraday
constant (C/mol), A is the area of electrode (cm2) and C(x,t) is the concentration of
electroactive species at distance x and time t.
According to Henry’s law when a solution is equilibrated with the surrounding atmosphere, at
a constant temperature, the concentration of the dissolved oxygen in the solution is in direct
proportion to the partial pressure of the oxygen in the atmosphere air [28]. This relationship
can be shown by equation (3) that declares as the molar fraction of oxygen dissolved in the

Literature Review
14
solution move towards the dilute values, the partial pressure of the oxygen on top of the
solution is directly proportional to the amount of the oxygen dissolved in the solution.
(3)
In this equation the partial pressure of the specified gas, Pi (Pa), is equal to the molar fraction
of that specified gas yi (%), multiplied by the gas pressure of all the gases P (Pa). Henry
states that the Pi (Pa) is equal to the amount of dissolved oxygen in a solution multiplied by
an empirically measured constant Ki (Pa) for different solutions and gases. The Ki for oxygen
in a solution is 4.40×10⁹ (Pa) [28]. By this method we can determine the concentration of the
dissolved oxygen in a solution at equilibrium state.
In a two electrode system there are drift caused by parasitics inside the sensor, to solve this
issue a three electrode configuration is selected. Oxygen reduces in the cathode (working
electrode) in two steps [29]. At the surface of the working electrode, oxygen first transforms
to hydrogen peroxide and then reduces further to water. This process is presented in figure
2.5. Oxygen concentration in the solution is a factor to advance these processes. The
equations (4 and 5) show the reactions taking place at the working electrode, the equation (6)
is the net of first two reactions. The equation (7) shows that the product from the working
electrode is converted back to reactants at the anode or counter electrode [22].
(4)
(5)
(6)
(7)

Literature Review
15
Figure 2.5 Diagram of the reaction mechanism on the sensor [25].
In the three electrodes configuration there is significantly less consumption of the metal
electrodes contrary to the two electrodes Clark sensor, which is causing the electrodes to
degrade quicker. In the commercial Clark sensors, a shared counter and reference electrode is
being used for example Ag/AgCl electrodes (two electrodes configuration). A Potassium
Chloride (KCl) solution is being used as an electrolyte because the movements of the K+
and
Cl- are coordinated, reducing the ionic gradients. The full consumption of the electrodes can
be prevented by fabricating large counter electrode in the standard configuration, though it’s
not possible in the micro dimensions [22].
However in the Ag/AgCl microelectrode, the consumption of the electrodes decreases the life
of the sensor to minutes. Hence a practical Clark sensor should not allow for consumption of
the electrode’s material. Therefore a new design is presented by usage of a solid polymer
electrolyte such as Nafion as an ion transport medium and different material and design
configuration for the electrodes.
2.4. Electrochemistry of Clark type oxygen sensor
Alessandro Volta at the start of nineteenth century presented the outcomes of his research to
the Royal Society of London as a “Voltaic piles” (artificial electrical organ), which was the

Literature Review
16
first electrochemical cell [30]. Nicholson and Carlisle described the process of using
electricity to decompose water to hydrogen and oxygen, which was the first move in the
creation of fuel cells [31]. In 1833 Faraday practiced the first quantifiable studies of
electrolysis [32]. Since 1950’s the topic has progressed extensively in experimental,
theoretical and application section and led to the development of microelectrodes application
[10].
An electrochemical reaction is the interaction of electrical energy and chemical change. It
involves electric charges moving between the interface of electrodes and the electrolyte (or
ionic solution). When the electrical current occurs naturally after a chemical reaction, it is
called electrochemical reaction such as in a battery or galvanic cell as shown in figure 2.6.a.
Otherwise, if it is produced through applying an external electrical energy by an external
circuit in order to raise reaction at the electrodes, it is called electrolysis as it can be seen in
figure 2.6.b.
Figure 2.6 (a) Diagram of Galvanic cell, (b) illustration of Electrolytic cell [30].
The redox (oxidation and reduction) reaction involves transfer of electrons from one chemical
species to another molecules or atoms in a solution or on the electrode surface until the
electroneutrality is attained.
(a) (b)

Literature Review
17
This process is governed by Faraday’s law, which states that the total amount of electrical
charge passed through the cell is proportional to the amount of chemical change produced
and the current generated is called Faradaic current [32].
There are two categories of redox reactions (half-reactions) that are distinguished by the
changes in the oxidation state of the element. The compound that loses electrons is said to be
oxidized (reduction reaction) and the one that gains electrons is said to be reduced (oxidation
process) [33].
If the reactants are in the same phase the reaction is called a homogeneous reaction, while in
the heterogeneous reaction, the reactants are in two or more phases. Usually the reactions
take place on the solid electrode surface, immersed in the electrolyte solution and are
connected through the solution and external electrical circuit. If the electrolyte is different for
each electrode, then they can be linked by a salt bridge. The charge transfer process simply
can be presented as O for oxidized species and R for reduced species by equation (8) [33].
(8)
Where, O obtains n electrons to transform into R. The electrons in the electrode have a
maximum energy when distributed around the Fermi level, which is the top of the collection
of electron’s energy levels at absolute zero temperature.
For a reduction process, the electrons in the electrode must have a minimum energy to
transfer from the electrode to the receptor orbital in O. For oxidation, the energy of the
electrons of R must be equal to or higher than the electrode’s Fermi level in order to be
transferred to the electrode [33].
The electrode’s material, surface modification or dimensions affects highly the detection
capability of the electrochemical oxygen sensor. In the next section the main components of
an electrochemical oxygen sensor are defined in more detail.
Literature Review
18
2.4.1. Electrodes
Electrodes are electrically conductive materials that are in proximity of the electrolyte of the
system. They implement the half reaction over an extensive time so the choice of their
material is vital. Normally, the electrode is made from a noble metal, such as platinum or
gold in order to reduce their corrosion and reactions with the chemicals. All three electrodes
can be made of different or same materials to complete the cell reaction depending on the
design of the sensor [9].
2.4.1.1. Working Electrode
The electrochemical reaction occurs in the working electrode. It is at the boundary between
the WE (working electrode) and the solution that significant electron transfer occurs. Based
on the reaction taking place at this electrode, whether it’s a reduction or oxidation, it can be
stated as cathodic or anodic respectively. Several aspects need to be regarded in material of
WE. Ideally it should display fast and repeatable redox reaction with the oxygen upon
electron transfer without electrode’s surface getting impurities. The electrode that performs in
the electrolyte solution should allow for the highest amount of oxygen characterization. The
cost of the material, its capability to be shaped into functional geometries, the ease of surface
replacement and toxicity are the other factors that should be considered. WE generally have
been created from platinum, gold, carbon and mercury. The potential of the WE is controlled
with respect to a RE (reference electrode) and the current passes between the WE and the CE
(counter electrode) [9].
2.4.1.2. Reference Electrode
The RE is essential to deliver a steady and repeatable potential against the WE, which is the
sensing electrode and requires an external driving voltage. The potential of the WE by itself
cannot be considered in isolation and it must be compared with another electrode. Since
frequent electrochemical reaction occurs on the surface of the WE, its potential does not stay
Literature Review
19
constant and its performance deteriorates over time. To improve this problem, the RE is
presented to act as reference in measuring and controlling the WE's potential and the current
doesn’t pass through it. It is positioned close to the WE inside the electrolyte and maintains
the value of the fixed voltage applied to the WE. The current flows through the WE and the
CE while the oxygen particles react at the WE and their magnitude is proportional to the
concentration of oxygen [9].
2.4.1.3. Counter electrode
When the CE works as a cathode, the WE operates as an anode and vice versa. The CE’s
surface area is bigger than that of the WE. The half reaction occurring at the CE should be
rapid for not limiting the change at the WE. In a three electrode electrochemical sensor, the
CE is utilized for voltammetric analysis or other reactions that involves the flow of electric
current. The CE is different from the RE that is recognized to gauge the potential of the WE,
and the WE, where the reaction occurs. The CE balances the charge added or removed by the
WE and allows the balancing current at the WE to flow. In a two electrode system, where
there are WE and RE, the second electrode conducts both functions of the RE and CE in one
and it becomes very difficult for the electrode to maintain a continuous potential while
passing current to the reactions occurring at the WE. For this reason the CE is introduced and
the combination of these three electrodes brands the modern three electrode system. The CE
is usually made of electrochemically inert materials such as gold, platinum or carbon [9].
2.4.2. Gas Permeable Membrane (Teflon membrane)
Gas permeable membrane is a hydrophobic film with appropriate porosity to protect and
cover the sensor’s electrodes and electrolyte, and regulates the amount of gas (preferably
oxygen in here) permeating through its pores and approaching the surface of the electrodes.
Usually they are produced from thin, low porosity Teflon membranes. They have different
porosity and choosing the right pore size permits transmission of appropriate amount of gas
Literature Review
20
molecules to WE and to filter out unwanted particles. It also prevents the liquid electrolyte
from evaporating or leaking as well as mechanically protecting the sensors system [27, 34].
2.4.3. Electrolyte
The electrolyte is a substance that splits into ions in the appropriate ionizing solvents for
example water and assists the transport of ionic charges through the electrodes and the sensor
reaction to occur.
When a voltage is exerted on the electrodes that are in the electrolyte, the chemical reaction
will take place at the cathode using the electrons produced from the anode. As a result a
positive charge will grow around the anode and a negative charge develops around the
cathode in the electrolyte. At this stage the ions of the electrolyte exert a neutralizing effect
on these charges and the reaction will endure. If the electrolyte vaporizes, the sensor’s
response will decline. Usually the Electrolyte is a solution of salt in water dissociated as a
result of thermodynamic reactions. A solid salt such as sodium chloride dissolves into its
ionic elements when it’s mixed with water, based on the following reaction shown in
equation (9 and 10) [27]:
2H2O + 2e− → 2OH
− + H2 (9)
2NaCl(s) → 2 Na+
(aq) + Cl2(aq) + 2e− (10)
2.4.3.1. Solid Polymer Electrolyte
Solid electrolytes or superionics demonstrate high values of ionic conductivity as a result of
the fast diffusion of ionic species through a lattice shaped by the immobile counter ions. The
Polymer Electrolyte Membrane (PEM) is a semipermeable membrane generally created from
ionomers, they are designed to conduct protons. [35].

Literature Review
21
Solid polymer electrolyte is different from the liquid and gel electrolyte since the ionic salt is
dissolved directly into a high molecular weight polymer and after removing the solvent, the
resultant will be the solvent free polymer electrolyte. Typically the polymer is an insulating
and relatively high dielectric material such as Polyethylene Oxide (PEO), Poly (Methyl
Methacrylate) (PMMA), Polyacrylonitrile (PAN), Polyphosphazenes, Siloxane. The salt has
low lattice energy and provides charge transportation. Solid Polymeric Electrolyte (SPE) is
generally involved as a Proton exchange membrane (PEM) in the fuel cells fabrication that
are predicted to be highly utilized in the transportation industry [36].
2.4.3.1.1. Nafion Membrane
Nafion®117 (DuPont™) is a perfluorinated polysulfonate polyelectrolyte cation exchange
membrane and usually it is used as a SPE material. Its general chemical formula is shown in
figure 2.7.
Figure 2.7 Chemical compound of Nafion (Du Pont) is a perfluorinated polysulfonate polyelectrolyte.
The values of x, y and z varies from 1 to 13. The sulfonized fluoride group is hydrolysed to
form the strongly acidic sulfonic cationic exchange site. The hydrated Nafion membrane
provides a highly acidic environment, equivalent to 10wt% H2SO4 solution. Nafion 117 is a
non-reinforced film based on chemically stabilized perfluorosulfonic acid/PTFE copolymer
in the acid (H+) form of 183 micrometers (7.2mil) in thickness, Basic Weight of 360(g/m²)
and Conductivity 0.10 min (S/cm), which is selected as the electrolyte for the sensor creation.
Hydrated hydrogen ions move across the solid electrolyte membrane by moving from one
fixed sulfonic acid group to the nearby one. Nafion membrane was used in macro size

Literature Review
22
amperometric sensors, as well as being more compatible with integrated microsensor
fabrication process than liquid electrolytes [29]. Electrochemical sensors with SPE exhibit
advantages over sensors with liquid electrolyte including minimum change in electrolyte
concentration and eliminating a liquid electrolyte which leads to a limited life sensor [37] .
Nafion has displayed biocompatibility that makes it interesting in the production of
biosensors. It was demonstrated to be stable when it’s used in the human body or cell
culturing. Yet there is considerable research to be done in this area [37, 38].
2.5. Electrical Double Layer
Figure 2.8 Schematic of double layer in a liquid at contact with a negatively-charged solid.
When an electronic conductor is exposed to a solid or liquid electrolyte, a boundary of two
parallel layers of charged ions develops between the interfaces of two phases, which is called
the electrical Double Layer (DL) as shown in figure 2.8. The first layer consists of negative
or positive ions which are adsorbed to the body of conductor as a result of chemical reactions.
The diffuse layer or the second layer consists of freely moving ions that is connected loosely
to the first layer by the Coulomb force and screening the first layer electrically. The moving
ions in the diffuse layer are affected by the thermal motion and electrical reaction [9].

Literature Review
23
The ions scatter on the boundary in an order depending on the electrode’s material, for
example its exposed crystallographic surface. Several models of DL have been proposed
since 1853, which have evolved by time [9].
The Helmholtz is the first model of DL, which consists of two layers of opposite charge
formed at the both sides of the interface in a rigid order, similar to the structure in the parallel
plate capacitor. However it does not consider factors such as diffusion of ions in the
electrolyte and the possibility of adsorption onto the surface. Gouy and Chapman reflected
that the applied potential and electrolyte concentration affect the thickness of the double layer
(capacity) where the extremely small ions can go to the proximity of the electrode’s surface
and move freely in the diffuse layer [39].
Stern united the both abovementioned models and supposed that the double layer was shaped
by a rigid layer of ions close to the electrode interface and a diffuse layer spreading into the
bulk solution, which is named the outer Helmholtz plane (OHP). Grahame advanced the
Stern model and mentioned the existence of specific adsorption, where some ionic or
uncharged species which have lost their solvation shell can penetrate the Stern layer. The
inner Helmholtz plane (IHP) passes through the centres of these specifically adsorbed ions.
Bockris, Devanathan and Müller Model consider the physical behaviour of the solvent in the
interfacial region. The dipoles of the solvent molecules such as water near the interface
would have a fixed orientation depending to the charge in the electrode. This orientation has
big influence on the permittivity of the solvent that varies with field strength. Permittivity is
the measure of the resistance that is encountered when forming an electric field in a medium.
The permittivity of a medium describes how much electric field (more correctly, flux) is
generated per unit charge in that medium [39].

Literature Review
24
2.6. Transport Process
The electrochemical reaction at the electrode interface in a simple approach consist of mass
transport of the electroactive species to the electrode surface then the electron-transfer
through the interface and the transport of the product to the solution. The rate of reaction in
the electrodes is regulated by the slowest pace in the path. It considers mass transport
(transport of reactants or products to or from the electrode surface), electrode kinetics
(heterogeneous electron transfer) as shown in the figure 2.9.
Figure 2.9 Diagram of electron transfer at the surface of the electrode [37].
In the pre equilibrium stage the reactants contact the electrode surface (1) and alter the order
in the ionic atmosphere (2), alignment of the solvent dipole (3) and the distance of ligands
and the central ion (4). Then electron transfer occurs (5) following by an inverse relaxation
stage (6) [39].
In a Nernstian (reversible) reaction, the mass transport is limited and the rate of the
electroactive species, v, reaching to the electrodes surface controls the reaction, directed by
the equation (11) of flux (J) where the electroactive species is carried to the surface by mass
transport for oxidation [39].
(11)
Wherein:
J(x,t) – Flux (mol cm-2
s-1
)
Electrode
Step 2-4
Electron
Transfer
(step5)
Kd,O
Diffusion (Step6)
Kd,R
Diffusion (Step1)
Step 6
Kc Ka
R*
O*
R∞
O∞
Solution

Literature Review
25
i – Current (A)
n – Number of electrons oxidized or reduced
F – Faraday constant (C/mol)
A – Area of the electrode (cm2)
Flux is the number of particles passing through a unit area in a unit of time and can be
affected by diffusion, convection and migration. Presence of concentration gradient of
electroactive species causes the natural motion of diffusion, which happens for all species.
Existence of pumping, gas bubbling or stirring affects the thermal and density gradient in the
solution generating the natural convection motion. Passage of charged particles along an
electric field causes the migration motion due to presence of dipoles in the species. Nernst-
Planck equation defines the overall flux in the electrode by a differential equation as the sum
of each effects and when it’s reduced to one dimension shown in equation (12) [39]:
(12)
Wherein:
J(x, t) – Flux (mol cm-2
s-1
)
D – Diffusion coefficient (cm2 s
-1)
– Concentration gradient (at distance x and time t)
Z – Charge of the electroactive specie
F – Faraday constant (C/mol)
C∞ – Concentration of the electroactive specie (mol/cm3)
R – Gas constant (8.314 J mol-1
K-1
)
T – Temperature (K)
– Potential gradient (at distance x and time t)
Diffusion Migration Convection

Literature Review
26
V(x, t) – Hydrodynamic velocity.
It becomes complex when all three effects happen together though considering the existence
of electrolyte and stagnant solution, the effects of migration and convection can be
suppressed respectively and the equation will be reduced to diffusion, demonstrated by
equation (13). According to Fick’s first law, the electrochemical reaction creates the
concentration gradient close to the interface of the electrode inside the electrical DL [39]:
(13)
Merging the equation (13) with the first expression of the flux with current at equation (11)
generates the equation (14) for the current for oxidation:
(14)
Fick’s second law defines the time dependent diffusional flux as equation (15):
(15)
The general form of Fick’s second law considering any coordinate system described as
equation (16):
(16)
Laplace operator can be demonstrated at every coordinate system as shown in table 2.1.
Table 2.1The general form of Fick’s second law considering every coordinate system.
Coordinates Laplace operator Fick’s 2nd
law
Cartesian
x Axis
x,y,z Axis
Cylindrical

Literature Review
27
Spherical
Consequently the concentration and flux can be expressed as a function of time and position
in Fick’s law as shown in equation (17), where the diffusion limited current can be measured
having defined the boundary situations [39]:
(17)
2.6.1. Diffusion of planar (rectangular) electrodes
Diffusion at rectangular electrodes can be reflected considering boundary conditions listed at
table 2.2 considering Fick’s second law at Equation (15).
Table 2.2 Boundary conditions for diffusion at planar (rectangular) electrodes.
Boundary conditions Definition
At t=0s without reaction there won’t be any
change in the concentration gradient.
Very far from the surface, there won’t be
difference in the concentration.
At the surface x=0 there is no concentration.
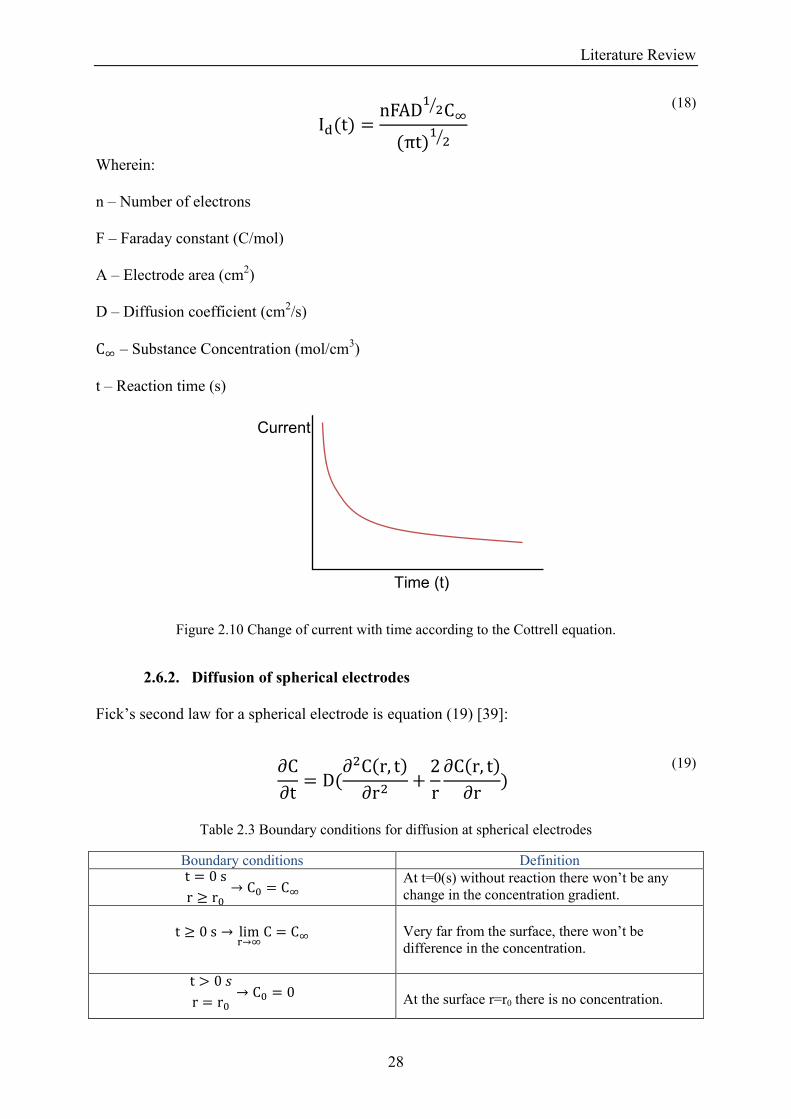
Considering the boundary conditions, the Cottrell equation is acquired which illustrates that
as the time increases the diffusion limited current drops as shown in figure 2.10 And equation
(18):
r
x
Literature Review
28
(18)
Wherein:
n – Number of electrons
F – Faraday constant (C/mol)
A – Electrode area (cm2)
D – Diffusion coefficient (cm2/s)
– Substance Concentration (mol/cm3)
t – Reaction time (s)
Figure 2.10 Change of current with time according to the Cottrell equation.
2.6.2. Diffusion of spherical electrodes
Fick’s second law for a spherical electrode is equation (19) [39]:
(19)
Table 2.3 Boundary conditions for diffusion at spherical electrodes
Boundary conditions Definition
At t=0(s) without reaction there won’t be any
change in the concentration gradient.
Very far from the surface, there won’t be
difference in the concentration.
At the surface r=r0 there is no concentration.
Current
Time (t)

Literature Review
29
The Cottrell equation including a spherical term (radius of electrode), time and boundary
conditions as listed on table 2.3 will be equation (20):
(20)
Diffusion is linear in short times and the second term is negligible compared to the first.
Consequently the equation (18) is attained;
(18)
The full equation should be considered in the case of microelectrodes and short times which
complicates the transport process. At macro sized electrodes and in longer times the second
term governs (equation (21)). However as a consequence of the convection effects, steady
state never attained, contrary to the microelectrodes that the steady state is gained quicker due
to the smaller distance and area [39].
(21)
2.6.3. Diffusion of microdisc electrodes
In this case the current is described using the equation (20) for the spherical electrode
regardless of the non-uniform flux to the electrode’s surface by replacing
, since a is
the radius of the microdisc. The equation considering time becomes equation (22) [39]:
(22)
Diffusion becomes linear in short time same as equation (18), though in the long time
becomes equation (23):
Spherical Term

Literature Review
30
(23)
By substituting area we obtain a formula that is used as a steady state current equation
(equation (24)):
(24)
It is also advantageous to find when the steady state and transient modes become dominant
and how they are related with the radius of the electrode. Thus a dimensionless factor (X) has
been derived when the steady state dominates the overall current to a specified range such as
10 times more, to measure the lower limit of time.
(25)
Furthermore using the Fick’s second law and chronopotentiometry method, the distribution of
the electroactive species on the interface can be attained. Normally a steady current is exerted
to induce the redox reaction on the electrode’s surface and the output potential is measured in
time. Table 2.4 shows the concentration variation equation when a concentration gradient
imposed on the electrode surface considering time that is achieved formerly employing the
Laplace transform and matching boundary conditions applied, excluding the third condition
[39].
Table 2.4 The concentration variation when a concentration gradient imposed on the electrode
surface.
Time variant Concentration variation with time
Planar electrode Planar electrode
Spherical electrode Spherical electrode

Literature Review
31
In a Cottrell experiment the change in concentration with time and distance has been shown
in figure 2.11.
Figure 2.11 Concentration profiles for several times after the start a Cottrell experiment.
The region close to the electrode’s surface with concentration gradient is the diffusion layer
and its thickness, δ is time dependent as shown in figure 2.10. Nernst expressed an estimative
formula for this thickness as equation (26):
(26)
After this is applied to Cottrell equation (Equation (15)), the thickness can be calculated by
equation (27), verifying that the steady state cannot be acquired in macro sized electrodes in
long times.
(27)
2.7. Kinetics of electrode reactions
The heterogeneous electrochemical reaction engages transfer of charges on the electrode’s
surface and occurs between two species in an electrochemical pair same as the structure of
our sensor, usually between the solid electrode (working electrode) and the electrolyte [39].

Literature Review
32
2.7.1. Heterogeneous electrochemical reactions
Considering the general expression of the current response with concentration gradient
(equation (28)) and the one electron reduction process with forward and backward rate
constants of kf and kb as shown in equation (29):
(28)
(29)
And the net reaction rate of :
(30)
Integrating them with the equation (15), the equation will be:
(31)
The rate constants of Kf and Kb were linked by Butler and Volmer with the reversible formal
potential Ef0, a transfer coefficient of α and a standard rate constant of K0 [40, 41]. Ef
0 is used
as a replacement for E0 since the measurements are not typically carried out under standard
criteria such as unit activity, temperature and pressure. The α is the gradient of the transition-
state energy profile and affects the profile of the voltammetric response. Its value ranges from
zero to one. Normally in the reversible reactions and for metal electrodes, α is 0.5. The rate of
reaction is controlled by the potential of the electrochemical sensor and at a particular
potential Kf and Kb is the same, and defined as a heterogeneous rate constant of K0, wherein
at other potentials it can be defined in terms of K0 as equations (32 and 33):
(32)
Kf
Kb

Literature Review
33
(33)
At this instant it can be related to current density in which E is the equilibrium potential at
equation (34):
(34)
Kf and Kb are equal at equilibrium so the anode and cathode have equivalent currents, as
shown by equation (35):
(35)
Equation (35) is the principle connection between the current flow and the applied voltage
inside the sensor, which predicts in equilibrium state the net current flow is zero and CO and
CR become equal. However a stable Faradaic motion can be foreseen as the exchange current
i0 and its linked to k0 by equation (36):
(36)
And reduce further:
(37)
With equation (37) which is acknowledged as current-overpotential equation, it’s likely to
study the kinetics of reaction with variation of i0. With higher amount of i0, the current
change will be higher on the E-E0 and the kinetics reaction will be faster.
Tafel equation (η) has been defined as a limitation to Butler-Volmer formula when applied to
high overpotential schemes:
(38)
When it’s linearized:

Literature Review
34
(39)
This formula presents a Tafel plot, where b is known as the ‘Tafel slope’ and elucidates the
mechanism of the reaction. a give details about the exchange current density and rate
constant. If the Tafel plot is a straight line, it is useful to study the non-reversible and
nonequilibrium conditions, which is not possible with Nernst kinetics [39].
2.8. Electrochemical measurement techniques
2.8.1. Cyclic voltammetry
Cyclic voltammetry (CV) is a technique of potentiodynamic and electroanalytical
measurement. It studies the electrochemical properties and half-cell activity of an analyte,
oxygen in research. It is utilized in many engineering procedures and analytical chemistry
and presents information about the analyte, kinetics of heterogeneous reactions,
thermodynamics of redox process and adsorptions process while measuring the current as the
potential changes. It is necessarily accomplished in a three electrode sensor structure via WE,
RE and CE to prevent current pass through the RE and changing its potential by reactions of
different species. The current should pass through WE and CE since RE controls the potential
passing through the WE as mentioned before.
The Working electrode’s potential varies linearly with scan rate υ against time and ends when
it gets to a fixed potential value, and then the potential slope of the working electrode is
reversed back as shown in figure 2.12. This sequence can occur several times through a
single trial until a set cycle number is acquired. The applied potential (volts) to the electrode
controlled while the current was being measured (amperes) [39].

Literature Review
35
Figure 2.12 WE’s potential vs. time variation in cyclic voltammetric experiment.
The I = f (E) is a cyclic voltammogram curve of the reaction, which is the plot of the current
versus the applied voltage at the working electrode. The contrary is the amperometry method,
which is not very usual. The current is the outcome of redox reactions of the electroactive
species in solution (Faradaic current) and the double layer charging (Capacitive current) [39].
Recalling the redox couple (equation (29)), before applying voltage, there is reduced form of
R in the electrochemical sensor, while exertion of the voltage with constant scan rate begins
the faradaic current rises exponentially caused by the concentration of R on the electrode.
The concentration gradient and the current increase as the applied voltage is getting closer to
the redox potential, which is positioned at midpoint between the anodic and cathodic peak
potentials. Maximum mass transfer of R takes place after passing the redox potential, and
then it deteriorates as a result of reduction of R. At that time the potential is directed in the
opposite way and the oxidised product O is transformed back into R. In an equilibrium
condition or a standard reversible cyclic voltammetry, the heights of the anodic and cathode
peak are equal as shown in Figure 2.13. The profile of the curve is determined by the rate of
change in the applied potential and the condition of the solution under the test, whether it is
stagnant or flowing [39].
Time
Voltage

Literature Review
36
Figure 2.13 cyclic voltammetric behaviour of a macroelectrode for a reversible reaction.
The Randles Sevcik equation determines the applied potential’s scan rate relation with the
peak current via:
(40)
Wherein:
ipa – Anodic peak current (A)
n – Number of electrons
D – Diffusion coefficient (cm2 s
-1)
C – Bulk concentration (mol cm-3
)
υ – Scan rate (V s-1
)
A – Electrode area (cm2)
Microelectrodes exhibit an S-shaped CV profile (figure 2.14) since the mass transport is ruled
by radial diffusion. As stated earlier in the steady state, a constant current is generated as a
limiting or steady-state current [39].

Literature Review
37
Figure 2.14 Cyclic voltammogram for a microelectrode at a reversible reaction [39].
2.8.2. Chronoamperometry
Chronoamperometry (CA) is an electrochemical method to determine the diffusion limited
current of Id. A controlled Stepped potential is exerted to the working electrode at t=0s in a
medium comprised of oxidized or reduced species and it’s varied from a point of no electrode
reaction to a value that all species arrive to the electrode surface and get involved in the
reaction as shown in figure 2.15. The current outcome from the faradaic processes is
observed as a function of time.
Figure 2.15 Potential step in chronoamperometry to obtain a diffusion-limited current of the
electroactive species.
CA also generates high charging currents that exponentially decay with time. The Faradaic
current also decays as described in the Cottrell equation with time. However sometimes it is
slower than the charging decay for example in sensors with no supporting electrolyte. CA
provides a better signal to noise ratio, when it’s compared to other amperometric practices
and mainly examined on a three electrode sensor as the current is integrated over longer time
periods [39].
Current
Voltage
Steady
state
Current
All electrodes are involved in reaction
No electrode reaction
E1
E0
Time
Voltage

Literature Review
38
2.9. Microelectrodes
A microdisc has been used to measure the oxygen in muscle tissue for the first time as a
microelectrode in 1940 [42]. The microelectrodes were practically begun to be used in the
electrochemical studies in 1980 when Fleischmann and co-workers found that they have
qualitative and quantitative advantages. Since then there have been exceptional progress in
electrochemical science [43]. Electrochemical techniques had some disadvantages and
shortcomings when used with macro sized electrodes, which were improved after
introduction of microelectrodes to electroanalysis. Microelectrodes were cost efficient and
easily put into practice [9].
There were question on the size of the electrodes so they could be considered as
microelectrodes. A general concept is if at least one dimension of an electrode is smaller than
the size of its diffusion layer, it could be considered as microelectrode [9]. There were
various perceptions on the size of the microelectrodes such as bigger than 50 µm, 25 µm,
between 0.1 and 50 µm or between 0.8 and 50 µm. Microelectrodes exist in many shapes and
styles for example disc, cylinder, band, ring, sphere, and hemisphere. The key dimension of
disc, sphere, cylinder or hemisphere electrodes is their radius and the key dimension of the
band, cylinder or ring electrodes is their width. Among them microdisc is the most significant
shape and normally created from platinum, gold or carbon isolated in glass or plastic from
electric surrounding. Many definition and theories exist in the literature regarding the
microelectrodes types and their mathematical relations with the diffusion limited current [35,
39, 44].
The response of the microelectrodes is unlike that of the macro electrodes and due to their
minimized interface, they have the advantage of lower detection limit. Capacitive effects and
ohmic drops have minimal effect on their response and sometimes they can be utilized even
in the lack of the electrolyte [9, 36, 39, 43].

Literature Review
39
2.9.1. The capacitive current effect
As stated before Faradaic current (IF) results from the electron transfer in the electrochemical
reaction. Though in an electrochemical process when the applied potential varies, the double
layer capacitances charges or discharges, triggering the capacitive current (IC) to rise without
any charge transfer as shown in figure 2.16. This is also called the double layer current or
non-faradaic current. In this current there is no charge transfer though affects the amassing or
elimination of the electrical charge on the electrode and electrolyte’s interface. In a steady
potential, the capacitive current is zero however if there is any change in the physical
environment of the experiment for example in the temperature or the geometries of the
electrode, it can change.
Figure 2.16 The resulting plot current-time (Chronoamperogram) [31].
When a potential scan rate is applied to an RC circuit which is in series, it will have the
capacitive current passing through it. A formula for the capacitive current has been presented
in the equation (41), where ΔE is the potential step, C is the double layer capacity and t is
time. Considering the comparative figure and the formula, the capacitive current decays to
zero exponentially compared to the faradaic current and it can be ignored in longer terms
[43].
(41)
Where R is the resistance.

Literature Review
40
Microelectrodes are helpful in the range of less than 50 μs and in the investigation of the fast
processes, since the IC is exponentially related to the surface area and can be ignored. As
much as the potential scan rate is slower and the electrode’s dimension is smaller the current
ratio of faradaic current to capacitive current will improve.
2.9.2. The Ohmic drop effect
In the electrochemical process, the electrode has a resistance of R so when the current passes
through the electrolyte and electrode, a potential is created that reduces the applied potential
to the WE, causing the ohmic drop and has a negative effect on the accuracy of the results.
This effect is greater if the flowing current and the resistance of the electrolyte are higher,
though it is very low at the microelectrodes due to the minor current flow.
According to the Cottrell equation at short time, if the diffusion in the reaction is linear, the
current and eventually the ohmic drop will be in direct proportion to the radius of the
microelectrode and both will decrease if the radius gets smaller. But at the steady state at long
time (equation (24)), the current is proportional only to the radius of the electrode, which has
no effect on the Ohmic drop. To reduce the ohmic drop effect, a high resistivity electrolyte
that reduces the current flow through itself, could be chosen, which results in small current
being produced and requires utilization of costly and sensitive apparatus [43].
2.10. Review of State of Art in electrochemical oxygen sensor in
biological applications
There are three important factors in characterising a sensor; Capability of the sensor to
quantitatively measure the test gas (oxygen) in the certain environment (sensitivity), its
ability to detect the particular gas without interference of other substances (selectivity) and
how fast the changes in signal can be observed by change in the concentration of the gas
(response time). Moreover size, power consumption, stability and reversibility are the

Literature Review
41
important features that affect the sensor’s performance. It’s important to be able to monitor
oxygen within the ambient surroundings, which is essential in the food processing, medical
and pharmaceutical industries. The Clark oxygen sensors and aqueous electrochemical cells
are best suited for these applications. In this section, some of the recent electrochemical
techniques and devices invented so far for the purpose of cellular respiration measurements
will be reviewed.
Nga-Chi Yip et al. demonstrated an electrochemical mediator assay by measuring oxygen to
evaluate the number of cells and their chemical toxicity for the purpose of monitoring cells
metabolism. In this process they compared the catalytic properties of the 2 mM ferrocene
carboxylic acid (FcA) and 2 mM ferrocene methanol (FcMeoh) solutions (oxygenated and
deoxygenated) separately when interacted with oxygen species. This system is used to detect
the oxygen consumption of Escherichia coli DH5-α (E. coli) and the results can be
accomplished in minutes. In this experiment the electrochemical cell was made of 3 mm
diameter glassy carbon working electrode, Ag/AgCl reference electrode and platinum counter
electrode. A data acquisition software and a Gamry 600 potentiostat were used to run the
experiments. Cyclic voltammetry (CV) study performed several times to investigate the
assay. Before each CV study, the glassy carbon electrode was polished with 50 nm alumina
powder for 5 minutes. The CV initiated by applying 0V potential at scan rates from 5 to 2000
mV s-1
with a switching potential of 0.6 V and end potential of 0V [45].

Literature Review
42
Figure 2.17 Typical CVs obtained for the 2 mM FcA solution containing different E. coli
concentration of 0, 0.25, 0.5, 0.75, 1, 1.25, 1.5, 1.75, and 2 Optical density/mL [43].
One of the examples of this assay is shown in figure 2.17, which demonstrates the increase in
number of E. coli leads to an increase in oxygen consumption since the E. coli would be
constantly consuming oxygen, and hence, a decrease in the electrocatalytic O2 peak current.
It also proves the decrease in the electrocatalytic O2 peak current is proportional to the
increase in E. coli cell numbers, which is logical [45].
In this assay oxygen consumption per E.coli has been determined by comparison of several
CVs, which cannot be trusted since the solution under the test is stagnant and the
electrochemical cell itself consumes oxygen during the electrochemical process, there is no
flow or stirring in the fluid under the test, resulting in inaccurate results, cellular death and
infection could follow during long hours of experiments. Usage of platinum electrode as CE
leads to creation of platinum oxide, which makes the system toxic and not fully
biocompatible. Polishing the working electrode every single time for 5 minutes and renewing
the catalytic solution would make the process time consuming and costly. The chemical
content of the FcA and FcMeoh catalytic solutions may interfere with and alter the properties
of cells since difference in behaviour observed for FcA and FcMeOH in terms of the position
of peak potentials, which is caused by the different functional groups as FcA contains a
O2 peak current

Literature Review
43
carbonyl and FcMeOH a hydroxyl [45]. It’s also difficult to carry out this process at places
other than biological cell labs and special conditions, it’s not portable.
To solve this issue many oxygen sensor devices with different design and structure have been
invented. Here we explore some of the most recent inventions and designs to understand the
problems and required improvement to create the best possible solution.
Jin-Hwan Lee et al. presented design and application of a Needle-type dissolved oxygen
(DO) microelectrode array (MEA) sensors for in situ measurements. The 10mm long sensor
probes were fabricated by dynamic etching technique and sharpened to micro meter
dimensions and packaged on a PCB carrier as can be seen on figure 2.18. Inside a recess
fabricated at the tip of each microelectrode, a gold sensing electrode was used.
Figure 2.18 Fabricated DO microelectrode array sensor is packed on a PCB carrier and a scanning
electron micrograph (SEM) of the recessed electrode [46].
Performance of these sensors was characterized by measuring the oxygen concentration of
saline solutions with an Ag/AgCl reference electrode. The DO MEA displayed a quick 15 s
linear response in the 0–21% O2 (0–9 mg/L) range (figure 2.19). The sensor was used for
evaluation of DO micro profiles in a multi-species aerobic bacterial film. It was able to

Literature Review
44
penetrate samples to measure DO and the time for 90% response was typically less than 20 s
[46].
Figure 2.19 Calibration curves for the recessed DO microelectrodes array against saline (0.85% NaCl
solution) and a mineral salt solution [46].
Although the recessed structure with inner cathode improved sensitivity and stability of the
DO microelectrode, the fabrication process was very lengthy. Its fabrication sequence
consisted of: 1) form glass probes by dicing; 2) taper probes in HF-based etchant; 3) use
meniscus etching to sharpen probes; 4) deposit Au conductive layer; 5) use silver epoxy to
establish electrical connections; 6) coat microelectrodes with Parylene insulating layer and
recess tips by beveling and etching. These steps were generally very difficult to manufacture,
necessitated trained people to use, and must be applied in a laboratory under firmly controlled
circumstances. Additionally, because of the minor signals involved, the sensors were subject
to electrical interference and need to be used inside a well-grounded Faraday cage. This
sensor required a separate reference electrode to perform the electrochemical reaction and
was not integrated in one sensor. The time consuming, costly fabrication process of this
sensor and brittle nature of the probes doesn’t guarantee a long shelf time and multiple usages
during the extended period of time.

Literature Review
45
More recently, Ching Wu’s and Yasukawa’s group have presented the Fabrication of a
miniature Clark oxygen sensor combined with microstructure, which consisted of a glass
substrate with a three electrode configuration, connected by a groove, and a PDMS container,
and covered with a PDMS oxygen permeable membrane as shown in figure 2.20. O2 plasma
bonding method was used to assemble the substrates.
Figure 2.20 The arrangement of a miniature sensor. It’s made up of (a) a glass substrate with a groove
made by SU8 photoresist and (b) a container substrate with an oxygen-permeable membrane. W, C
and R are the working, counter and reference electrode, respectively [6].
It was used for measurement of the adhering cells respiration. Alginate sol electrolyte was
used. The sensor had the response time of 13.4 s, linearity with a correlation coefficient of
0.993, and lifetime of at least 60 h. One of the advantages of this sensor is its fast response to
a change in oxygen concentration (90% response time, 6.8 s), which is useful to monitor the
kinetics of oxygen variation in biological samples. The response of the sensor is due to the
Usage of the thin membrane for oxygen permeation (7μm) and the vicinity of the measuring
container to the detection electrode. Figure 2.21 demonstrates the calibration curve for the
oxygen sensor. The experiment has been carried out in a 10mM PBS solution (pH 7.0) by
adding Na2SO3 and applied voltage of −0.7V in 0–7 ppm (0–7 mg/L) range [6].

Literature Review
46
Figure 2.21 Calibration curve for the oxygen sensor. The trial was conducted in a 10mM PBS solution
(pH 7.0) by adding Na2SO3. Applied voltage: −0.7V [6].
This work has found to be effective in the measurement of the cellular respiration; however
usage of PDMS container and oxygen permeable membrane makes it difficult to keep the
same properties stable in the long term. Prior to each experiment the device needs to be
fabricated fresh, which is time consuming and expensive considering the materials being
used. Additionally, if the attachment between the PDMS and the glass material doesn’t yield
a good sealing, the external PBS will pour into the groove and affect the pH value of the
electrolyte. Extended operation of the working electrode at certain voltages for example
−0.4V caused it to become transparent and damaged it seriously, which was revealed in a
microscopy observation at 33 hour [6].
Jungil Park’s group at Korea University, Seoul have published their work in the development
of the array type oxygen sensors. Their research focuses on the fabrication and use of 2 X 3
array oxygen sensor for measuring cellular respiration level [3, 17, 47]. This oxygen sensor
array was able to measure the cellular respiration level in a solution containing cells
simultaneously from various samples. The oxygen sensor comprised of Clark-type sensors of
2 x 3 array type on the substrate as demonstrated in figure 2.22.

Literature Review
47
Figure 2.22 The fabricated array reservoir-type oxygen sensor [3].
18μm PDMS was used as a permeable membrane of the Clark-type sensor. Having 90%
response time of about 10 sec from full oxygen (air-saturated) state to zero-oxygen state
(figure 2.23(a) and (b)), it was reported to present linearity correlation coefficient of 0.997.
Figure 2.23 (a) Reproducibility of the fabricated Clark-type sensor. (b) Linearity curve of the
fabricated Clark-type sensor [17].
However in order to attain reproducible results it was necessary to maintain supply of liquid
electrolyte constantly. For such devices, using liquid electrolyte created challenges of high
maintenance.
(a) (b)

Literature Review
48
In 1999 Jayashri Gopalakrishna and his co-workers developed one of the first oxygen sensors
that utilized a solid electrolyte instead of liquid electrolyte and investigated the Performance
of Solid Polymer Electrolyte (SPE) based Oxygen Sensor without External Humidification.
The sensor’s working, reference and counter electrodes were made of porous C/Pt based, Gas
Diffusion Electrodes (GDE). The functionality of the sensor is tested without external
humidification of the test gases. Basic diagram of the sensing system is shown in figure 2.24.
To attain internal humidification of the Nafion membrane, the oxygen reduction principle and
back diffusion of water, is used. The sensor responds to oxygen concentrations from 10 ppm
to 20% as shown in figure 2.25.
Figure 2.24 Basic diagram of the sensing system [48]
Figure 2.25 Calibration curve of the sensor [48].

Literature Review
49
The proper cleaning of a Nafion membrane was essential to the successful sensor
performance.
The oxidation reaction at counter electrode yields water. This water evaporates and
dehydrates the membrane. By using Teflon bonded platinum as the counter electrode,
membrane dehydration can be avoided. Additionally the hydrophobic nature of Teflon helps
the Nafion membrane to sustain water and membrane dehydration can be prevented by the
back diffusion of water and internal humidification of membrane. In dry gas measurements
the sensor output signal was 35% lower than the humidified sensor output signal.
In this study, the maintenance free operation of the sensor is reached and removed the need of
gas humidification system [48].
Glen W. McLaughlin and his colleagues have pioneered in the development of solid-state
dissolved oxygen sensor test matrix having deposited solid-state proton conductive matrix
(PCM) as solid electrolyte on a silicon wafer substrate and encapsulated in a bio-inert
polytetrafluoroethelene (PTFE) film. Four different working electrode diameters: 10 μm, 20
μm, 40 μm, and 80 μm are arrayed. Figure 2.26 shows the Pictorial depiction and single
element cross-section of the dissolved gas sensor test matrix.
Figure 2.26 Pictorial depiction and single element cross-section of the dissolved gas sensor test matrix
[5].

Literature Review
50
In this sensor the number of elements arranged in each set also differs in four stages: 1, 2, 4,
and 8. Therefore, each column of the matrix have the same working electrode diameter, while
each row has arrays of the same number of electrode elements.
It was reported, through cyclic voltammetry (CV) and voltage step (VS) measurements, the
device displayed a linear response with respect to dissolved oxygen concentration over a
range of 0 – 300 mmHg with a response time constant of 0.51 s (±0.087 s). CV measurements
results for the electrode sets are shown in figure 2.27 [49].
Figure 2.27 CV calibration measurement of 10 μm, 20 μm, 40 μm, and 80 μm working electrode
diameter, 8 electrode array sets.
In this sensor, unlike standard Clark cell configurations, there is no net consumption of either
electrode. This sensor performed more accuracy and sensitivity with respect to changes
caused by cellular respiration [5]. However the electrodes were fabricated using micro
fabrication techniques, which is a time consuming and expensive process and was difficult to
incorporate it into a sealed packaging due to its significant reduction in robustness after
fabrication process.
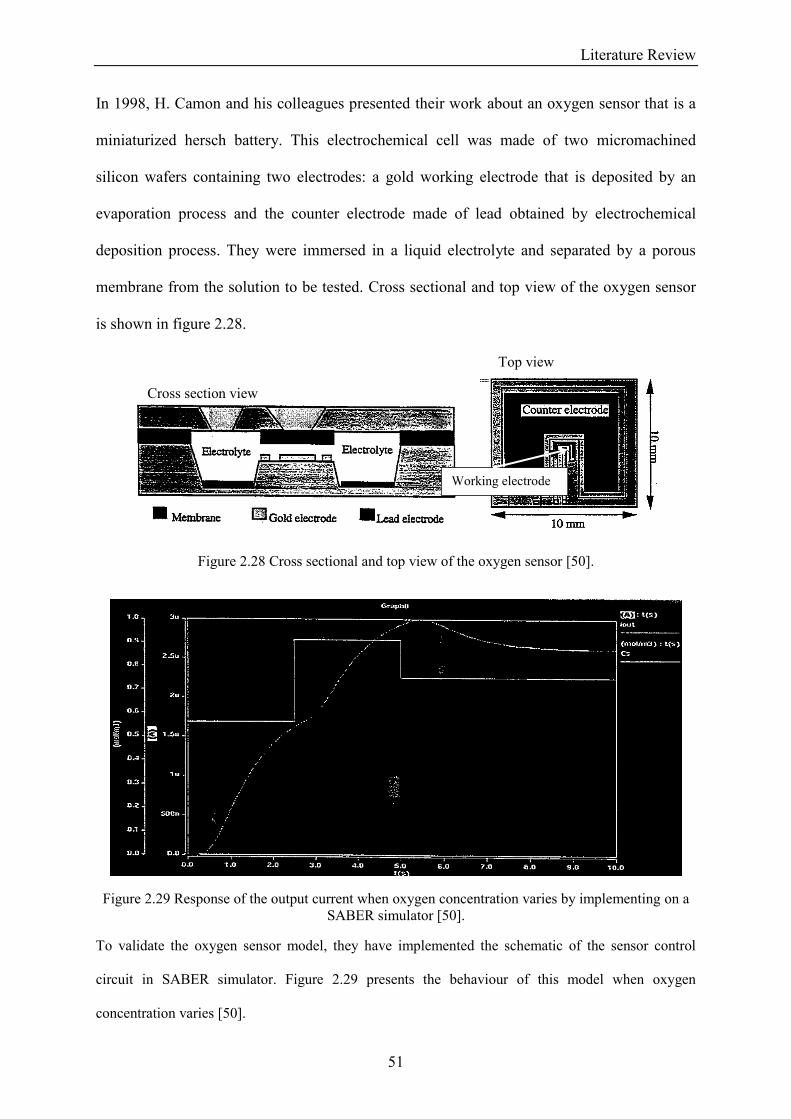
Literature Review
51
In 1998, H. Camon and his colleagues presented their work about an oxygen sensor that is a
miniaturized hersch battery. This electrochemical cell was made of two micromachined
silicon wafers containing two electrodes: a gold working electrode that is deposited by an
evaporation process and the counter electrode made of lead obtained by electrochemical
deposition process. They were immersed in a liquid electrolyte and separated by a porous
membrane from the solution to be tested. Cross sectional and top view of the oxygen sensor
is shown in figure 2.28.
Figure 2.28 Cross sectional and top view of the oxygen sensor [50].
Figure 2.29 Response of the output current when oxygen concentration varies by implementing on a
SABER simulator [50].
To validate the oxygen sensor model, they have implemented the schematic of the sensor control
circuit in SABER simulator. Figure 2.29 presents the behaviour of this model when oxygen
concentration varies [50].
Working electrode
Top view
Cross section view
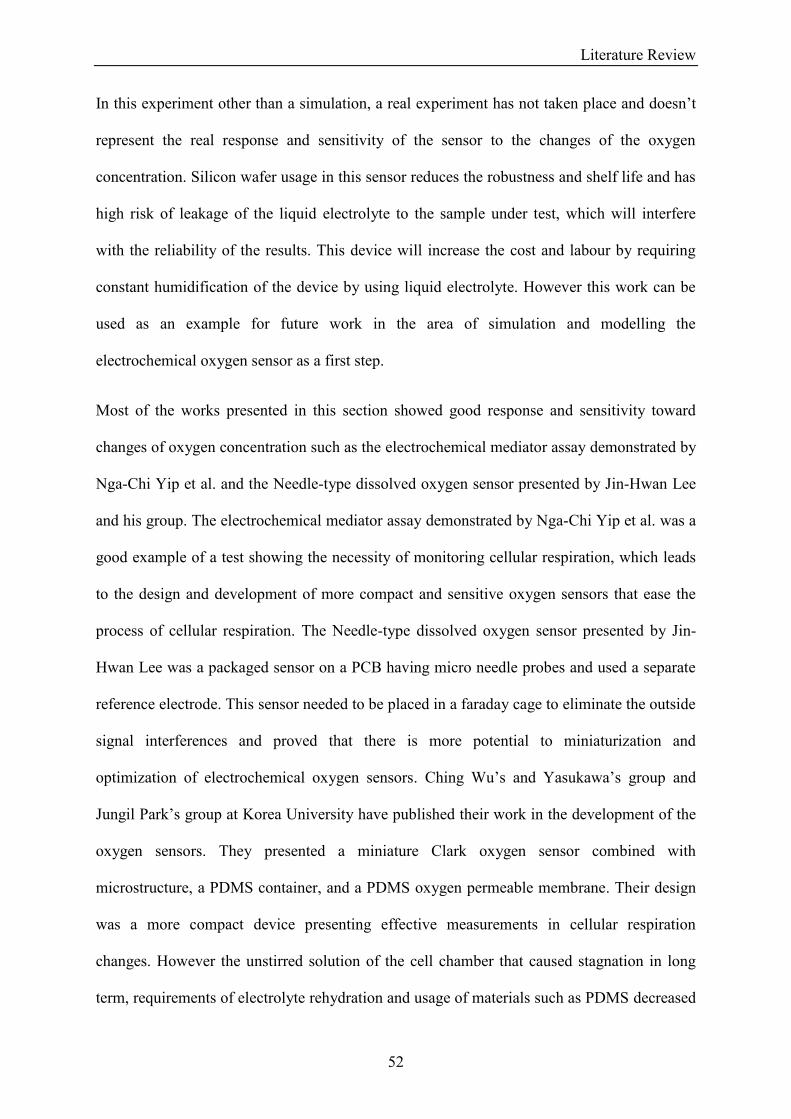
Literature Review
52
In this experiment other than a simulation, a real experiment has not taken place and doesn’t
represent the real response and sensitivity of the sensor to the changes of the oxygen
concentration. Silicon wafer usage in this sensor reduces the robustness and shelf life and has
high risk of leakage of the liquid electrolyte to the sample under test, which will interfere
with the reliability of the results. This device will increase the cost and labour by requiring
constant humidification of the device by using liquid electrolyte. However this work can be
used as an example for future work in the area of simulation and modelling the
electrochemical oxygen sensor as a first step.
Most of the works presented in this section showed good response and sensitivity toward
changes of oxygen concentration such as the electrochemical mediator assay demonstrated by
Nga-Chi Yip et al. and the Needle-type dissolved oxygen sensor presented by Jin-Hwan Lee
and his group. The electrochemical mediator assay demonstrated by Nga-Chi Yip et al. was a
good example of a test showing the necessity of monitoring cellular respiration, which leads
to the design and development of more compact and sensitive oxygen sensors that ease the
process of cellular respiration. The Needle-type dissolved oxygen sensor presented by Jin-
Hwan Lee was a packaged sensor on a PCB having micro needle probes and used a separate
reference electrode. This sensor needed to be placed in a faraday cage to eliminate the outside
signal interferences and proved that there is more potential to miniaturization and
optimization of electrochemical oxygen sensors. Ching Wu’s and Yasukawa’s group and
Jungil Park’s group at Korea University have published their work in the development of the
oxygen sensors. They presented a miniature Clark oxygen sensor combined with
microstructure, a PDMS container, and a PDMS oxygen permeable membrane. Their design
was a more compact device presenting effective measurements in cellular respiration
changes. However the unstirred solution of the cell chamber that caused stagnation in long
term, requirements of electrolyte rehydration and usage of materials such as PDMS decreased

Literature Review
53
the shelf life and increased the price. Jayashri Gopalakrishna and his co-workers developed
an oxygen sensor that used a solid electrolyte instead of liquid electrolyte which made it
possible to use an electrochemical oxygen sensor without the need of maintenance and
external humidification. This method made it conceivable to have miniaturized oxygen
sensors without needing electrolyte rehydration and as a result to have a more integrated
sensor. Glen W. McLaughlin and his colleagues developed a solid-state dissolved oxygen
sensor test matrix having deposited PCM as solid electrolyte on a silicon wafer substrate and
encapsulated in a bio-inert PTFE film. This sensor showed effective accuracy and sensitivity
to changes caused by cellular respiration. However usage of expensive and time consuming
fabrication techniques was a disadvantage in developing this sensor, and brittle nature of the
silicon wafer after fabrication course made it difficult to incorporate this sensor into a sealed
integrated packaging.
Due to problems associated with the aforementioned sensors, a design has been proposed that
is being made from a material with good mechanical properties such as PCB and Nafion
membrane as a solid electrolyte to reduce cost and time being consumed for maintenance of
rehydrating the sensor.
2.11. Summary
In this chapter overview of biosensor and different types of oxygen sensors has been
presented. Fundamentals of electrochemistry and the Clark type oxygen sensor have been
reviewed. Electrochemical measurement techniques such as cyclic voltammetry and
chronoamperometry have been explained. Summary of microelectrodes behaviour in the
electrochemical reaction is also given. State of art in the field of electrochemically working
oxygen sensors for the purpose of cell culturing was presented.

Design of Integrated Oxygen Sensor
54
3. Design of Oxygen Sensor

Design of Integrated Oxygen Sensor
55

Design of Integrated Oxygen Sensor
56

Design of Integrated Oxygen Sensor
57

Design of Integrated Oxygen Sensor
58

Design of Integrated Oxygen Sensor
59

Design of Integrated Oxygen Sensor
60

Design of Integrated Oxygen Sensor
61

Design of Integrated Oxygen Sensor
62

Design of Integrated Oxygen Sensor
63

Design of Integrated Oxygen Sensor
64

Design of Integrated Oxygen Sensor
65

Design of Integrated Oxygen Sensor
66

Design of Integrated Oxygen Sensor
67

Design of Integrated Oxygen Sensor
68

Design of Integrated Oxygen Sensor
69

Design of Integrated Oxygen Sensor
70

Design of Integrated Oxygen Sensor
71

Design of Integrated Oxygen Sensor
72

Design of Integrated Oxygen Sensor
73

Design of Integrated Oxygen Sensor
74

Design of Integrated Oxygen Sensor
75

Design of Integrated Oxygen Sensor
76

Materials and Fabrication
77
4. Materials and Fabrication
4.1. Introduction
In this chapter material preparation and fabrication processes for different parts of the oxygen
sensor including the sensor’s electrodes, control circuit and cell culturing platform will be
described.
An introduction to different materials used in electrode design will be given, as well as
materials used for the cell culturing platform and different fabrication processes such as PCB
fabrication, Laser micromachining and 3D printing.
4.2. Materials and Fabrication
Material selection and fabrication process is a step in the process of creating any physical
object. In this context, the main goal of material selection and fabrication process is to
minimize cost while meeting product performance goals. Logical selection of the best
fabrication method and material for a given application begins with properties and costs of
candidate materials and process.
4.2.1. PCB Oxygen sensor
Printed circuit boards (PCB) is used in every electronic product. Printing circuits with PCBs
is cheaper and faster than other wiring procedures such as wire wrap and point-to-point
construction, as components are mounted and wired with one single part (with requirement
for additional design to lay out the circuit). Also, operator wiring errors are eliminated.
A PCB mechanically and electrically links electronic components such as conductive pads (in
this case micro disks and ring electrodes), tracks and other features etched from copper sheets
that are laminated onto a non-conductive substrate. PCBs can be single sided (one copper
Materials and Fabrication
78
layer), double sided (two copper layers) or multi-layer (outer and inner layers). Conductive
features on different layers are connected with plated-through holes called vias.
4.2.1.1. Materials for the sensor’s electrodes
PCBs are mainly produced from FR-4 glass epoxy. It is an insulating substrate, and since low
currents are being measured during the experiments, it will be important to insulate the
sensor. The choice of the material for the electrodes is very important since they implement
the half reaction over extended times. To reduce cost and to maintain the simplicity of the
design, all three electrodes are fabricated from the same conductive material to complete the
electrochemical reaction.
Electrode reactions take place at the electrodes thus its material should be chosen considering
the redox behaviour of the oxygen, its potential window, electrical conductivity, mechanical
properties, surface reproducibility, cost, availability and toxicity. Among the range of
different material, the most popular are noble metals (platinum, gold, silver), glassy carbon
and mercury [54].
Glassy carbon is mainly used in the study of supercapacitors and known as current collectors
and they are more desirable than graphite because of their high density and low porosity
which produces smooth surfaces after polishing and consequently minimised double layer
current effect. However it is very expensive and not suitable for commercial development. It
is very brittle, and difficult to prepare into a desirable electrode shape. The resistance of
glassy carbon is not minor and it disturbs high power performance [55].
Electrodes have also been made from mercury since it has a smooth and uncontaminated
surface free from any adsorbed analyte or impurity. The self-renewing electrode does not
need to be cleaned or polished like a solid electrode. However, due to its toxicity and
constantly changing surface area, mercury is gradually being substituted by environmental

Materials and Fabrication
79
friendly solid electrode materials. Mercury electrodes are not suitable for monitoring
oxidisable compounds because of their anodic limit potential range. Therefore, solid
electrodes with extended anodic potential windows have drawn significant attention [54].
Among the extensive choice of noble metals, platinum and gold are mostly used. They have
good electron-transfer kinetics, high conductivity (low background currents) and large anodic
potential range.
In this work, copper is etched from PCB as the electrodes. In a double layer PCB, a thin layer
of copper foil is coated to both sides of an FR4 sheet and circuitry interconnections are etched
into copper layers. Copper other than being a good electrical conductor, is easily
manufactured and shaped into the desired features and can produce a mirror-like surface
finish [54].
One of the disadvantages of copper is its proneness to corrosion such as oxidation at
relatively normal temperatures, which reduces its shelf life [54]. To solve this problem, a thin
layer of Electroless nickel and immersion gold plating on the copper electrodes is considered.
Also problem of high resistivity can be overcome by using gold-coated copper electrodes
[55].
Electroless nickel immersion gold (ENIG) is a type of surface plating used for printed circuit
boards. It comprises of electroless nickel plating covered with a thin layer of immersion gold,
which protects the nickel from oxidation. ENIG creates an even layer on copper pads for
good solderability and improved resistance to corrosion and wear while preserving electrical
conductivity. Nickel acts as a diffusion barrier for copper while the thin immersion gold layer
over nickel protects the Nickel from oxidation [56].
4.2.1.2. Fabrication of PCB sensors
In this section, the manufacturing process of a double layer circuit board has been explained
in order to etch the electrodes of the oxygen sensor. A double layer PCB of 1.55 mm

Materials and Fabrication
80
thickness, and copper thickness of 35 microns with Nickel/Gold (4-7 μm Ni/0.05-0.1 μm Au)
surface finish is chosen for this design. FR4 (glass-reinforced epoxy laminate) is the base
material for the double layer PCB. FR4 is a composite material consisting of a woven
fibreglass cloth and an epoxy resin binder which is pressed together with copper foil and is
flame resistant. The base material is cleaned and the photosensitive laminate is applied, next
an image from a photo instrument is transferred through exposure and the potential
conductive pattern is generated. The following three production steps all take place in one
system. In the first step the layout generated by the exposure process is developed by means
of a chemical process and the unexposed parts of the laminate are removed. In the next step
the unprotected copper is etched away to create the conductive parts that was imaged. Finally
the polymerized photo laminate is removed. These three steps are called developing, etching
and resist stripping as shown in Figure 4.1. Before next process is carried out, an automated
optical inspection takes place.
Figure 4.1 A. Covering the base material with photoresist to create circuit structures, covering the
conductor pattern using the negative process. B. Developing the exposed material, removing the
copper not covered by the photoresist. C. Removing the photo-laminate used as etching mask.
Once these steps have been completed, holes are drilled. The next step after the drilling is the
through hole plating process. In this process the holes are cleaned, activated and given a thin
copper coating to create a vertical electrical connection between the conductive layers. The
outer layers are then processed, initially laminate is applied. In the photopositive method, the
areas that are not needed for the PCB layout are exposed; the aim is to expose the areas that
will subsequently be plated. In the following step the unexposed laminate is removed, then
A B C

Materials and Fabrication
81
the exposed copper areas, the copper coating is plated up and the final copper thickness is
attained. A layer of tin is applied to protect the copper layer for the next three processes.
These steps are shown in Figure 4.2.
Figure 4.2 A. Drilling of holes, metallisation of the entire circuit board including the inside of the
borehole with a thin copper layer. B. Covering with photoresist to create the circuit structures,
Applying and exposing the film. C. Developing the exposed material, reinforcing the circuit structures
to their final thickness with an additional copper layer. D. Covering with a Tin layer as an etching
mask.
The next stage is photoresist stripping, in which the polymerized photoresist is removed, and
then the areas that are not covered with tin are removed in an alkaline etching process, finally
the protective tin coating is removed. At this point the circuit board is already electronically
functional. Now the protective and finishing processes are accomplished. The first step of
these finishing processes is to apply a photo sensitive layer of solder resist; this protects the
PCB against corrosion and mechanical damage and during soldering. It prevents solder from
being applied to the areas covered with solder resist on the PCB. It also improves the
electrical properties and dielectric strength. Same as the previous photo processes the desired
surfaces are protected against exposure, in the subsequent development process the solderable
area, pads and the component holes are uncovered. Then surface finish is applied, which is
the electroless nickel immersion gold. Temporary solder resists or protective tapes can be
A B
C D

Materials and Fabrication
82
applied depending on the requirements of the solder processes, one of the last steps is
application of the desired annotation via screen printing. The final mechanical processing
ensures that the PCB gets its final shape, which is done by milling as shown in Figure 4.3. At
the end further electrical, optical and dimensional inspections of the PCB are carried out. The
explained procedure is carried out at Wurth Electronics Company, which is a leading
manufacturer of PCB and Inductive components.
Figure 4.3 A. Removing the photoresist and the copper not covered by the Tin resist, removing the
metal resist. B. Applying a photo-sensitive solder-stop layer, Applying and exposing the film,
developing the material. C. Applying a solder able surface e.g. chemical nickel-gold, covering the
solder mask lacquer, Labelling with screen printing, milling the end profile.
Figure 4.4 shows the oxygen sensors fabricated by the above-mentioned method; they are
illustrating the final shape of the sensor from A to E shown on Table 3.3 of chapter three.
Images are taken with Alicona microscope.
Figure 4.4 Oxygen sensors fabricated by PCB fabrication method and with ENIG coating. Sensors
shown from A to E in this figure coincide with dimension shown on Table 3.3 of chapter three.
Würth Elektronik specifies a standard tolerance of +0.10/-0.05 mm for the pad used on the
PCB.
A B C
A E D B C
300μm

Materials and Fabrication
83
The actual deviation from the design of the delivered units was less than 0.01mm, measured
with the Alicona microscope.
4.2.1.2.1. Laser micromachining of PCB sensors
It was not possible to fabricate the sensor mentioned in the Table 3.3 from F to J with the
PCB fabrication method described for sensor A to E due to their small dimensions being in
the range of 20 μm to 100 μm. For this reason Laser micromachining technique was used
further to machine the electrodes on the PCB. The repeatability of the laser machine is +/-
0.75 µm, with accuracy per axis of +/- 2µm. Measured deviation from design was about 2µm
for the 20 µm pad, which was the highest deviation measured.
Figure 4.5 Reconfigurable Lasea Multi-Axis Laser Micro Machining platform.
In this method the base copper pad, which is ENIG coated and created by the PCB
manufacturing method, is further machined with Lasea Multi-Axis Laser Micro Machining
device (Figure 4.5) to achieve dimension down to 20 μm. This process carried out using
facilities located at Laser Micro Processing (LMP) Group of University of Birmingham,
School of Mechanical Engineering.

Materials and Fabrication
84
Figure 4.6 Main component technologies of the laser micro machining platform.
The laser micro processing platform is a hybrid system that integrates a novel beam delivery
system and a multi axis setup for recognizing the relative beam-workpiece movements in
performing structuring, polishing and texturing of free form surfaces. It has a reconfigurable
laser micro machining platform that integrates 3 optical axes and 5 mechanical axes as shown
in Figure 4.6. In specific, the platform combines innovatively the capabilities:
a) Two laser sources; a Satsuma femtosecond laser (5W) and a MOPA-based Yb fibre
laser (50W), to realise different and at the same time complementary laser spot
characteristics.
b) Optical axes, X & Y beam deflectors and a Z module, for beam spatial modulation.
c) Focusing F-theta telecentric lenses for machining different field sizes with their
corresponding beam spot diameters.
d) XYZ mechanical axes (stages) to machine surfaces with dimensions bigger than the
scan field.
e) Rotary axes (stages) to change the incident direction of the beam for machining free
form surfaces and axisymmetric workpieces.

Materials and Fabrication
85
f) Integrated high resolution camera and confocal microscope for automated process
setting and a beam expander to condition the beam diameter to the requirements of
any specific processing task [57].
Table 4.1 Specifications of the laser sources used for the surface machining of sensors E to J of Table
3.3.
Ultrafast Ytterbium-based laser: Satsuma
Nominal wavelength
Beam quality
Pulse duration
Average power
Pulse energy
Repetition rate
1030 nm
M2 <1.3
350 fs
5 W
< 10 µJ
0 - 2 MHz
Table 4.1 illustrates the specifications used to machine the surface of sensor F to J of table
3.3. Graphical structure of the features to be machined was designed by Solidworks software
and transformed to a DXF file format and imported to the control software of the device for
multi axis machining process. Figure 4.7 shows Sensors F to J of Table 3.3 after laser
machining.
Figure 4.7 Oxygen sensors fabricated by PCB fabrication method with further laser micromachining.
Sensors shown from F to J in this figure coincide with dimension shown on Table 3.3 of chapter three.
200μm
CE
RE
WE
G H I J F

Materials and Fabrication
86
4.2.1.2.2. Alicona Microscope
Images shown in Figure 4.4 and Figure 4.7 are captured by Alicona G4 InfiniteFocus (IF)
system microscope (Figure 4.8) for conducting high resolution 3D surface measurements.
This procedure performed using facilities located at LMP Group of University of
Birmingham, School of Mechanical Engineering.
Figure 4.8 Alicona G4 InfiniteFocus (IF) system.
This system uses Focusvariation sensor that comprises a special optic, a white LED which
emits modulated light and a vertical axis with a linear encoder with high resolution. This
encoder provides accurately z-positions with 10 nm resolution. The limited depth of the optic
focus is used to measure the specimen topography. Throughout the measurement the distance
between objective and specimen is altered, so the depth of focus of the objective is moved on
the specimen surface topography. The variation of focus in every point is measured and
produces 3D dataset color information. The principle of operation for Alicona G4 IF system
is shown in Figure 4.9 [57].
The specimen is illuminated by modulated light. This light is transferred through the optic
and focused through a beam splitter onto the specimen. Coaxial illumination is produced. The
light is reflected by the specimen and projected on to the digital sensor in the precision
optic. As the distance between the specimen and objective is varied the change of sharpness
is measured. The correct interaction between modulated light and continuous vertical

Materials and Fabrication
87
movement of the sensor are essential for the quality of the measurement. For every position
on the object the sharp regions are measured. The variation of the sharpness values is used for
the measurement of the 3D-position [57].
Figure 4.9 Principal of operation for Alicona G4 InfiniteFocus system [57].
3D image of sensor J from Figure 4.7 that was taken with Alicona G4 IF system is
demonstrated in Figure 4.10.
Figure 4.10 3D image of sensor J shown at Figure 4.7 produced using Alicona InfiniteFocus system.
4.2.2. Control circuit fabrication
The layout of the PCB for control circuit board was designed using Diptrace as a double layer
circuit board and was shown in Figure 3.10 of section 3.3.3. Then it was printed as a mirrored
1. Sensor
2. Optic
3. White Light
4. Semi transparent
mirror
5. Objective
6. Specimen
7. Vertical scanning
2
3 4
1
2
6
7
5

Materials and Fabrication
88
printout on to an opaque film to produce a contact print (black tracks) to use with photo
positive laminate (pre – coated). This was exposed using a UV source for about 160 to 180
seconds, the resulting artwork on the laminate was developed using an alkali developer. Then
washed and dried in an oven at 60 to 70ºC then etched using Ferric Chloride. The exact time
for etching is dependent on both concentration of the etchant and the temperature. The
resulting board as shown in Figure 4.11 had the tracks coated in the etching resistant paint,
this is then removed using a suitable solvent (Acetone). The board was then drilled using
Tungsten Carbide drills. The dust removed carefully (Vacuum) then the board sprayed with
flux to prevent oxidation of the bare copper prior to assembly of the electronic components
on to the board which was then soldered and tested and proven to work.
Figure 4.11 Fabricated control circuit board.
4.2.3. Cell culturing platform fabrication
A cell culturing platform is going to be used in the cellular respiration measurement
experiments, so it needs to have a solid structure, non-brittle and easy to disassemble and drill
holes and attach fluidic channels to them while incorporating interior channels inside the
platform. The Eden250™ 3D Printing System provides the perfect way to manufacture this
part in the desired shape [7]. One of the materials being used in this printer is Objet Bio-
Compatible material MED610™, which is supplied in sealed, ready-to-load cartridges [7].

Materials and Fabrication
89
More information is given below about the Eden250™ 3D Printing System, MED610 and
reviews about cell culturing methods and biocompatible surface enhancements.
4.2.3.1. Material for cell culturing platform
At this point a biomaterial with appropriate biochemical and mechanical characteristics is
required to display high bio conformity for the purpose of cell culturing. Among the existing
three dimensionally printable materials the choice is limited due to their low chemical or
biological compatibility. MED610 is a biocompatible material available for 3D printing and
due to its mechanical robustness can be exploited as a material for the cell culturing platform.
Objet Bio-Compatible MED610™ is a rigid material featuring dimensional stability and
colourless transparency. This material is desirable for applications requiring prolonged skin
contact of over 30 days and short term mucosal-membrane contact of up to 24 hours. But
there is no report available regarding its biocompatible properties for the cell culturing
applications in the literature. However it has 5 medical approvals including Cytotoxicity,
Genotoxicity, Delayed Type Hypersensitivity, Irritation and USP Plastic Class VI and can be
used on all Objet Eden printers. It is also been produced under the ISO 13485:2003
certification that ensures, every batch of the material goes under bio-compatibility conformity
testing, before it is packaged. These standards endorse bio-compatibility of MED610 for the
purpose of cell culturing [58].
4.2.3.2. Fabrication (cell culturing platform)
Solid object 3D printing can creates prototypes having several faces of features and covering
large area in one round of printing up to 480 cm2 and a height up to 26 cm.
However limited resolution and minimal surface roughness, which it leaves on the surface
after printing, are of the major drawbacks of this printer. Even though the resolution of the
printer has been stated to be 42μm, 84μm and 16μ in X, Y and Z directions respectively, it is

Materials and Fabrication
90
not possible to fabricate channels having diameter less than 250 μm using this printer [58].
However considering the dimensions of the cell culturing platform designed in chapter 3, it is
sufficient to use this method to manufacture the part without needing dimensions smaller than
250 μm.
The device prints the structure of platform in layer by layer techniques by selectively
applying droplets of light curable material (MED610) in three dimensions without any
requirements for mask, alignment, timed exposure or development. The CAD file of the
platform which was designed by Solidworks is converted into a STL file format and
transferred to the 3D printer.
4.2.3.2.1. Surface treatment of cell culturing chamber
The scope of this device is to measure effectively the respiration rate of the cultured cells.
Cells are not cultured at this stage of project; however methods of appropriate cell culturing
and surface modification for making the surface of the chamber more compatible with cells
are investigated and suggested.
Surface modifications are done to enhance their hydrophilic properties, cell adhesion and
growth. Existing biomaterials for cell culturing are mainly plastics but some types of plastics
have a hydrophobic surface, which makes it difficult for cells to attach and grow. Extensive
research has been done in this area on different materials.
Parylene-C is known for having the maximum level of biocompatibility for polymers labelled
by the United States Pharmacopeia as a Class IV polymer, making it acceptable for long-term
implantation. It has already been used in a set of biomedical devices such as cardiovascular
implants, wireless neural interfaces, and catheters. This material retains many desirable assets
such as chemical inertness and resistance to biological degradation in medical application. A
thin film is created when coating the considered surface, using chemical vapour deposition
method [59-61]. It is desirable to use this material in medical devices, due to its advantages in

Materials and Fabrication
91
its deposition process, which offers excellent adhesion, a solvent-free environment, and high
accuracy and control over film thickness, highly resistant to hydrolytic degradation and stable
in a biological environment [60-63].
This sort of coating is ideal for the cell culturing platform however it has not been possible to
actually coat any of them with this material because of not having access to the system. The
following section describes the work has been done to prove the validity of this type of
coating and that it is a good way of improving the cell culturing platform.
Tracy Y. Chang and her group have demonstrated an experiment, which compares the surface
properties and cell and protein compatibility of eight biomaterials used in bio-mems
application. These materials are glass, polystyrene, Parylene-C, plasma-treated Parylene-C,
fibronectin-coated Parylene-C, PDMS, plasma-treated PDMS, fibronectin-coated PDMS
[60].
In their experiment, the surface hydrophobicity and roughness of Parylene-C has been
measured and its results been compared to those of tissue culture-treated polystyrene, poly
(dimethylsiloxane) (PDMS), and glass. Parylene-C and PDMS have also been treated with air
plasma and their surfaces been coated with fibronectin to show that it is possible to modify
the surface properties of Parylene-C with biochemical treatments. Table 4.2 shows the
contact angle measurements on static drops of water on substrates utilizing a contact angle
measurement system (Phoenix 300 plus, SEO) to provide information about hydrophobicity
of the surfaces. Whatever the contact angle is higher the surface is more hydrophobic.
Table 4.2 Contact angle measurements. a) Measurements made immediately after PDMS was treated
in oxygen plasma. b) Measurements made after 40 min following treatment in oxygen plasma. c) No
significant change observed in measurements made immediately after and following 40 min after
plasma treatment [60].

Materials and Fabrication
92
Both of the Parylene-C and PDMS became hydrophilic after plasma treatment but only
Parylene-C substrate kept its hydrophilic properties over time and also it exhibited higher
degree of nano scale surface roughness (>20 nm) than the other substrates.
Table 4.3 Surface Roughness Measurements [60].
Surface roughness values were evaluated with atomic force microscopy (AFM) (Q-Scope
250, Quesant Instrument Corporation) using noncontact mode with a cantilever tip (NCS 16,
Quesant). Areas of 50 μm × 50 μm were randomly chosen on the substrates to scan. It can be
observed from the Table 4.3 that Parylene-C, plasma treated parylene-C and fibronectin
coated parylene-C has highest surface roughness, which means they can produce more
surface for cells to attach and cells elongate better in the direction of roughness. This
roughness is because of the irregularities in the deposition process of parylene-C with usage
of vapour deposition process, which were further increased with fibronectin molecules
adsorbed onto the surface.
The level of protein adsorption of bovine serum albumin (BSA) and immunoglobulin G (IgG)
proteins on these eight surfaces were evaluated. In general parylene-C had high BSA and IgG

Materials and Fabrication
93
adsorption, whereas surface treatments on parylene-C reduced level of adsorption of these
proteins.
Also the degree of cell adhesion and distribution of two mammalian cell types, NIH-3T3
fibroblasts and AML-12 hepatocytes has been investigated on these substrates, and it was
detected that adhesion of both cell types to surface-treated parylene-C were comparable to
standard tissue culture polystyrene. NIH-3T3 cells didn’t adhere to the plain parylene-C and
PDMS but surface treatment increased the attachment of these cells to these surfaces. The
same behaviour occurred at the adhesion of AML-12 to the same surfaces.
Shape factor measurements were carried out and indicates whatever it is closer to
1(dimensionless), the cells are rounder and it means that they have not elongated well and
less adhesive, but whatever its closer to zero it means they are taller and thinner and
elongated on the surface and in the direction of the roughness well. The NIH-3T3 spread well
on fibronectin-coated parylene-C and PDMS in contrast to the other substrates. Shape factor
was not a satisfactory measurement for AML-12 cells proliferation on the surfaces because of
their non-axial distribution.
Both cell types did not attach to plain PDMS and parylene-C, and they remained in rounder
shapes and simply rinsed away and were considerably less adhesive than tissue culture
polystyrene and glass. There wasn’t a significant change between the adhesiveness of both
types of cells to both plasma treated and fibronectin coated surface. Surface treated parylene-
C stayed hydrophilic and more favourable for cell adhesion, even though the surface of the
plain parylene-C was quite rough (>20 nm) and hydrophobic, so it was more suitable than
both surface treated and plain PDMS, which their induced hydrophilicity decreased and cells
did not attach onto them.

Materials and Fabrication
94
Parylene-C coating is biocompatible, pinhole-free, conformable, and are great barriers against
diffusion of humidity and gases as well as being chemically inactive and unaffected by acids
and bases, and creating excellent device protection against attacks from corrosion, bacteria
and fungi. It is possible to improve surface adhesiveness after Parylene-C coating by surface
modification methods of plasma treatment and fibronectin coating.
4.2.3.2.2. Cell culturing method
As mentioned in previous section, the methods of cell culturing have not been carried out in
this research. After consultation with researchers at School of Biosciences at University of
Birmingham, several adherent cell populations such as fibroblast, Caco-2 cells are proposed
for culturing. However, the presence of surface treatments is necessary on the chamber.
Depending on the cell type used, these surface treatment materials could be fibronectin,
collagen or matrigel.the following information describes the key features of cell culturing that
would need to be considered when this process takes place
There are different Sterilization methods depending on the material of the cell culturing
platform. In this case, the material would not stand the heating and pressure in an autoclave,
though a brief time (a few hours) under UV light lamp which can also be combined with
some immersion in ethanol afterwards would be sufficient. It’s recommended to put the
chamber in a hood and let the UV lamp on for the typical time to sterilize the place, then
immerse it in absolute ethanol for 10 minutes and let it dry in a sterile Petri dish.
In the typical cell culturing procedures when cells are maintained in incubators, media (cell
culturing fluid) has to provide with signalling molecules (calf serum), minerals and elements
(salts), carbon source (sugars) and protection from contamination (antibiotics). These are
necessary for growing the cells to a high number and keeping them for long time. However,

Materials and Fabrication
95
for brief experiments (after growth) e.g. a few hours (3-6) media can be substituted with
media such as HBSS with fewer substances (therefore less probability for interferences).
Figure 4.12 Schematic of a Transwell.
In an alternative method cells also can be cultured in transwells, which it can be later
transferred to the cell culturing chamber. Transwell is a membrane containing chamber that
goes in a well as can be seen in Figure 4.12. These are accessible to any cell culturing
laboratory and it’s possible to culture adherent cells on them (with appropriate dimension)
and then transfer to chamber. However with this method modification to the shape of the cell
culturing chamber will be necessary considering the inlet and outlet pipes position. Typical
dimension of Transwells will match the ones of cell culturing wells and is shown in Table 4.4
along with information about their average cell yield.
Table 4.4 Typical dimension of cell culturing wells and their average cell yield volume.

Materials and Fabrication
96
4.2.4. Integration of oxygen sensor and cell culturing platform
At this stage the PCB oxygen sensor, cell culturing platform (and the control circuit) that are
fabricated (Figure 4.13) can be assembled together and be prepared for experimentation and
testing of the sensors. Prior to assembly, Nafion membrane is applied to the PCB sensor. A
thin laminated PTFE oxygen permeable membrane is applied on top of the Nafion prior to the
experiment, to limit diffusion of other species.
Figure 4.13 PCB oxygen sensor and cell culturing platform after fabrication.
After placing the O’ rings to seal the cell culturing platform to the PCB, two platforms are
fastened and tightened to each other with four screws as shown in Figure 4.14. O’ rings seal
the sensors from the outside environment and from each other.

Materials and Fabrication
97
Figure 4.14 Integrated PCB oxygen sensor, cell culturing platform and control circuit.
4.2.4.1. Nafion membrane application
Nafion 117 membrane was used as a solid electrolyte with 183 μm thickness and 360 (g/m2)
basis weights. First, a small area of the membrane (5mm x 5mm for each oxygen sensor) was
cleaned by immersing in 60ºC deionised water for one hour, which is a standard operation to
ensure a good adhesion between the electrodes and Nafion membrane, then dried with
nitrogen gas and left in room temperature in a container for 24 hours. The membrane was
then ready for hot pressing. Membrane was hot pressed to the top of the electrodes on the
printed circuit board in the oven for 2 hours at 120ºC, which were found to be the optimum
duration and temperature for higher sensitivity and faster response time in the sensor. The
PCB sensor was cleaned with deionised water and ethanol before hot pressing. Nafion
membrane after being hot pressed onto the PCB is shown in Figure 4.15.
Figure 4.15 Nafion and PTFE membranes after being hot pressed onto the PCB
Nafion Membrane PTFE Membrane

Materials and Fabrication
98
4.3. Summary
In this chapter fabrication of the PCB oxygen sensor, cell culturing platform has been
described. Material choices were explained and their important properties are introduced,
further their appropriate manufacturing methods are shown. Oxygen sensors were fabricated
using PCB fabrication method and laser Micromachining process were applied to reach
smaller dimensions using Lasea laser machining station. Control circuit were fabricated using
PCB manufacturing methods and electronic parts were soldered. Material choice of MED610
and fabrication method utilizing Eden 250 3D printer of the cell culturing platform also
explained and further methods of surface enhancement and cell culturing were suggested. In
final stage device integration was explained and images of the final assembled device
illustrated.

Tests and Results
99
5. Tests and Results
5.1. Introduction
In this chapter, the characterisation of the fabricated oxygen sensor is described. It was tested
by liquid and gas medium and the experimental setups are demonstrated. Cyclic voltammetry
and voltage step measurements are evaluated. The sensitivity, linearity and reproducibility of
the sensor are examined and investigated. In this experiment sensor A to F of Table 3.3 of
section 3.2.2 are tested, sensors G to J due to problems with Laser machining process were
not machined as desired, the depth of laser beam machining were not sufficient to separate
the three electrodes from each other and prevented the electrodes to function as a three-
electrode sensor, however this problem can be overcome by changing the parameters of laser
machining in future. Out of five sensors that were laser machined only sensor F with WE
diameter of 20 μm was found to be functional.
As described in section 3.3 the control circuit is measuring the resultant current as a voltage
output and to transfer this to current the shunt resistors and the gain of the Op-Amp should be
considered. I_Sense gives sensitivity of 1 V/μA or 1 mV/nA. If this sensitivity needed to be
changed it is possible to adjust either the local gain of the Op-Amps or the shunt sensing
resistors.
5.2. Technical problems associated with the PCB oxygen sensor with
solid electrolyte membrane
Nafion membrane is a flexible polymeric membrane, and the formation of a well-defined
attachment between the electrode structure on the PCB and the membrane has found to be
difficult. In the process of hot pressing there was a need for an intermediate layer to prevent

Tests and Results
100
Nafion membrane getting attached and stuck to the pressing surfaces. For this reason a plastic
film that is being peeled off from a double sided Cleanroom adhesive tape is used as a non-
sticky surface between the Nafion membrane on the PCB and the hot pressing surfaces.
Figure 5.1 PCB sensors prepared for hot pressing.
The PCB and Nafion membrane are hot pressed between two aluminium plates and clamped
by metallic paper clips as illustrated in Figure 5.1. This found to be sufficient since too much
pressure would damage the PCB chips at high temperatures. Even though that it has been
tried to process the hot pressing as identical condition as possible, there were problems
associated with the attachment of the Nafion membranes. Sometimes they did not stick and
fell off and sometimes they stick very well. Or even when they stick very well, while taking
measurements, two identical set of sensors on the same PCB chip showed different response
at the same testing conditions.
The output current lowered when the sensor was exposed extensively in the gas stream due to
an increase in the resistance of the membrane (and dehydrated state of membrane) and
decreased the reaction rate (current density). This problem was the reason in which higher
voltage were applied to WE of the sensors.
The liquid state experiments were conducted while the syringe pump was pumping the water
with stabilized dissolved oxygen concentration through the sensor and the commercial

Tests and Results
101
oxygen meter probe was measuring the dissolved oxygen concentration of the fluid that was
being pumped. Even though only one parameter was changing (such as applied voltage to
WE or Oxygen concentration) and the other parameters kept fixed, there was a sinusoidal
wave noise, affecting the measurements. This problem reduced significantly by removing the
oxygen probe from the beaker (containing the water sample) after the dissolved oxygen was
stabilized and placing the measurement instrumentation inside a tin box (Figure 5.2).
However wasn’t removed completely.
Figure 5.2 Measurement instrumentation inside a tin box.
After many tests were taken cell culturing platform became brittle and showed signs of
leakage and its sealing became weaker. A new cell culturing chip was designed and produced
with stronger sealing and improved features and deeper chamber to allow easier cell culturing
process as shown in Figure 5.3.
Figure 5.3 New cell culturing chip with improved features.

Tests and Results
102
5.3. Gas state measurement
In this experiment, the sensor is exposed to different concentration of gas and its results are
evaluated.
5.3.1. Experimental setup
A diagram of the experiment setup is shown in the Figure 5.4. In order to get test points for
testing the sensor, air is blended with Nitrogen. Air is pumped with an aquarium pump and
mixed with 99.9999% purity Nitrogen gas and directed to a portable gas analyser provided by
Super Systems Europe Company. The ratio of oxygen is regulated using flow meters down to
0%, 5%, 10%, 15% and 20% (maximum oxygen concentration in the ambient air) and
verified using the gas analyser as an existing commercial sensor to allow a more accurate
assessment to be carried out. The output gas from the gas analyser is directed and flows into
the PCB oxygen sensor platform while the percentage of the oxygen is being monitored using
the gas analyser. Electrochemical measurements of the PCB oxygen sensor are conducted
using a computerized measurement system comprising of a laboratory power supply and a
computer equipped with Data acquisition unit (DAQFactory Express and LabJack). All tests
are done in room temperature of 22ºC.
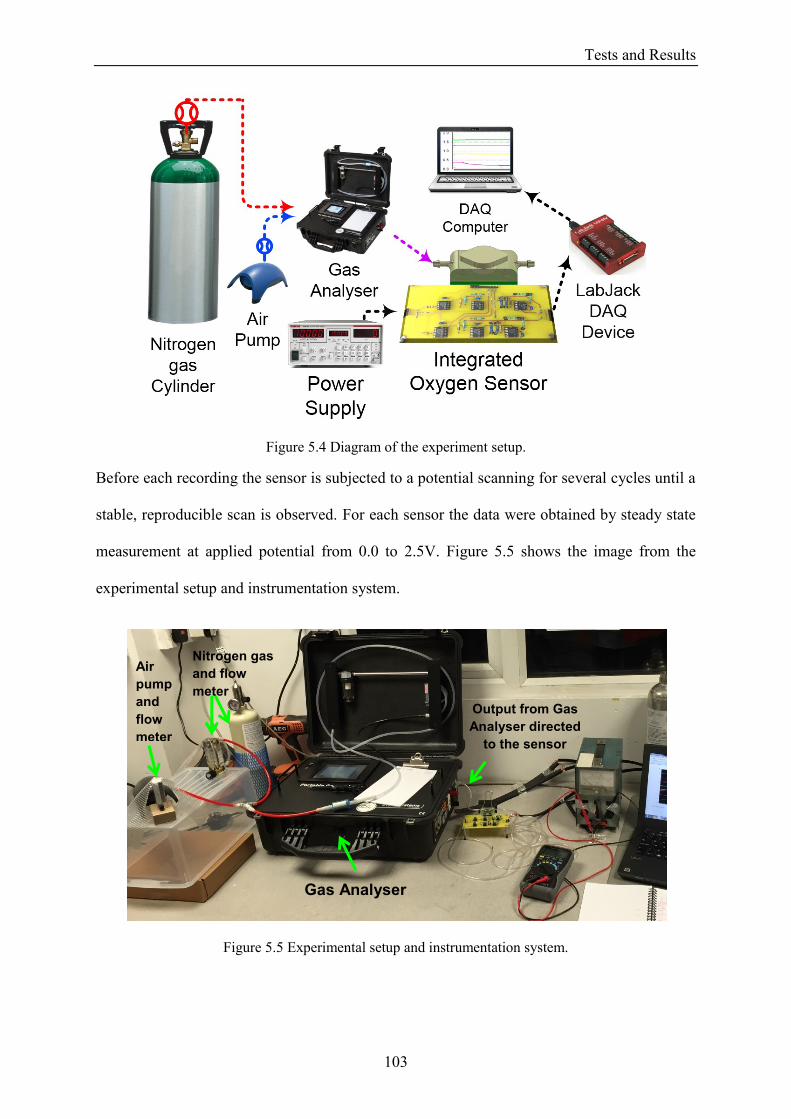
Tests and Results
103
Figure 5.4 Diagram of the experiment setup.
Before each recording the sensor is subjected to a potential scanning for several cycles until a
stable, reproducible scan is observed. For each sensor the data were obtained by steady state
measurement at applied potential from 0.0 to 2.5V. Figure 5.5 shows the image from the
experimental setup and instrumentation system.
Figure 5.5 Experimental setup and instrumentation system.
Gas Analyser
Output from Gas
Analyser directed
to the sensor
Nitrogen gas
and flow
meter
Air
pump
and
flow
meter

Tests and Results
104
5.3.2. Sensor characterization
Measurements of the six electrode set (sensors A to F) were made to determine the
performance of the sensor using cyclic voltammetry (CV) and chronoamperometric methods.
CV is done to determine the bias points of the device and to verify that no other competing
reactions exists at the certain bias point. Chronoamperometric measurement is used to
determine the dynamic behaviour of the device.
5.3.3. Cyclic voltammetry
Cyclic voltammetry of sensors A to F were made over a voltage range of 0 to 3V applied to
the WE at a step increment of 100 mV/s, starting at 0V bias, and current from the WE to CE
is plotted versus the applied voltage. The output current is generated by the oxygen reduction
reaction at the WE. This experiment is done while sensor was exposed to fresh air (20%
oxygen). The maximum voltage that was possible to supply the Op-amp was 5V. However
4V is considered to be the maximum voltage supplied to the circuit to prevent damaging the
Op-amps.
Therefore after the set potential is reached (0-3 V interval, 100 mV/s step increaments), WE
potential is ramped in the opposite direction to return to its initial point as shown in Figure
5.6. This process can be repeated as many times as desired.

Tests and Results
105
Figure 5.6 CV measurements of six sensors with WE diameter ranging from 20μm to 900μm.The
measured current by the control circuit, increased by increasing the voltage.
In Figure 5.6 the maximum voltage that was applied was from 0 to 3V, the point where the
amplifiers saturate is shown in figure 5.6, each sensor presented consistent response while
increasing the voltage and decreasing it in the opposite direction. Also the response of the
sensor depending on their WE size was different, sensor F having WE diameter of 20μm
showed lower current response at lower bias voltages compared to other sensors. At low bias
voltage, the reaction at the WE is in kinetic control region and the current is dependant
strongly to the applied voltage. At bigger bias points the oxygen transport to WE goes into
the diffusion limited region, which is independent of the applied voltage. Kinetic control
range of this reaction is from bias level of 0V to 1.6. Since the sensors are exposed to air and
there is no change of oxygen concentration it can be seen that diffusion control region ranges
from 1.6V to 2.25V. These bias points are chosen to make linearity measurement of the
electrodes and to allow determining the maximum level of oxygen concentration within in the
0
0.5
1
1.5
2
2.5
3
3.5
4
4.5
0 0.5 1 1.5 2 2.5 3 3.5
Sensor A
Sensor B
Sensor C
Sensor D
Sensor E
Sensor F
Voltage (V)
Current (μA)
At this point, amplifiers saturate.

Tests and Results
106
diffusion limited region. After this region, the current can be seen to increase quickly by the
applied potential and is not related to the oxygen concentration.
5.3.4. Voltage step measurement (chronoamperometry)
Figure 5.7 shows the response time of each sensor after voltage is applied by increment of
100 mV in 1 second intervals. The range of applied voltage is varied from 0 to 4V. The
measurements were performed 0.5 second after introducing the voltage and as the sensor
were placed in room atmospheric condition (20% oxygen). It can be observed that the IV
characteristic of the sensors can be considered to be linear.
Figure 5.7 Step response plot of sensor A to F.
5.3.5. Sensor performance
Figure 5.8 to 5.11 shows the linearity of the step response measurements of the 6 sensor set
with working electrode of 20 μm, 300 μm, 400 μm, 500 μm, 600 μm and 900 μm between
bias voltages of 1.6V to 2.25V. The results are taken separately for each bias voltage of 1.6V,
1.8V, 2V and 2.25V. The graphs show that the current/oxygen concentration has a linear
relationship as anticipated.
0
0.5
1
1.5
2
2.5
3
3.5
4
4.5
0.00 10.00 20.00 30.00 40.00 50.00 60.00 70.00
Sensor A
Sensor B
Sensor C
Sensor D
Sensor E
Sensor F
Time (s)
Current (μA)

Tests and Results
107
Figure 5.8 Step linearity response at 2.25V.
Figure 5.9 Step linearity response at 2V.
0
0.1
0.2
0.3
0.4
0.5
0.6
0 5 10 15 20 25
Sensor A
Sensor B
Sensor C
Sensor D
Sensor E
Sensor F
Oxygen concentration (% Atm)
0
0.02
0.04
0.06
0.08
0.1
0.12
0.14
0.16
0.18
0 5 10 15 20 25
Sensor A
Sensor B
Sensor C
Sensor D
Sensor E
Sensor F
Current (μA)
Current (μA)
Oxygen concentration (% Atm)

Tests and Results
108
Figure 5.10 Step linearity response at 1.8V.
Figure 5.11 Step linearity response at 1.6V.
The offset currents at the zero oxygen concentration level are mainly caused for two reasons:
1) the capacitive current effect and 2) Solid polymer electrolyte Nafion membrane’s
resistance. The capacitive current effect is caused by the sensor capacitance due to the
constant sweep rate of the measurement (I = CdV/dt). The resistance of the Nafion membrane
also increases proportionally as the area of the electrodes becomes bigger. These two aspects
contribute to create bigger offset currents for electrodes with bigger dimension.
0
0.02
0.04
0.06
0.08
0.1
0.12
0.14
0 5 10 15 20 25
Sensor A
Sensor B
Sensor C
Sensor D
Sensor E
Sensor F
0
0.01
0.02
0.03
0.04
0.05
0.06
0.07
0.08
0.09
0 5 10 15 20 25
Sensor A
Sensor b
Sensor C
Sensor D
Sensor E
Sensor F
Oxygen concentration (% Atm)
Oxygen concentration (% Atm)
Current (μA)
Current (μA)

Tests and Results
109
Figure 5.12 shows CV linearity measurement of the sensor with 20 μm diameter of WE when
exposed to oxygen concentration of 0 to 20%. The current response of the sensor between
bias voltages of 1.6V to 2.25V was below the measurement capabilities of the
instrumentation. For that reason its linearity was measured when voltage up to 3.8V was
applied to its WE. As it can be seen it shows consistent linearity as the oxygen concentration
increased.
Figure 5.12 CV linearity response of the sensor with 20 μm diameter of WE.
Figure 5.13 CV linearity response of two electrode’s set at individual PCB sensor chip.
0
0.2
0.4
0.6
0.8
1
1.2
1.4
0 1 2 3 4 5
20% O2
15% O2
10% O2
5% O2
0% O2
0
0.5
1
1.5
2
2.5
3
3.5
4
4.5
0 0.5 1 1.5 2 2.5 3
I_sense 1
I_sense 2
Current (μA)
Current (μA)
Voltage (V)
Voltage (V)

Tests and Results
110
Figure 5.13 shows the CV performance of two identical set of electrodes with 600 μm
diameter of WE on the same PCB sensor chip. It was measured at the same time by the
control circuit having ability to measure two sensor’s performance. Two sensors show
consistent linearity. This size is shown randomly and the other sensors perform in the same
way. The small nonconformity between their responses is due to the electronic parts that were
used in the control circuit such as resistors with different percentage of precision. In the next
page the data on the effect of exposure to a gas stream with different concentration of oxygen
at different bias voltages are shown.

Tests and Results
111
Applied at 2.25 V
Gas O2% Sensor A Sensor B Sensor C Sensor D Sensor E Sensor F
20 0.2224709 0.1755983 0.3286283 0.3552284 0.5377693 0.04807335
15 0.135668 0.1092853 0.3096383 0.2122588 0.2470123 0.01236635
10 0.07439526 0.06337634 0.2780223 0.1714104 0.1704973 0.01236635
5 0.01312256 0.03787135 0.2062043 0.09992555 0.09398234 0.007265354
0 0.008016503 0.007265354 0.1653963 0.06418314 0.04807335 0.007265354
Applied at 2.1 V
Gas O2% Sensor A Sensor B Sensor C Sensor D Sensor E Sensor F
20 0.1254558 0.08888134 0.1602953 0.1663043 0.1704973 0.01746735
15 0.08460737 0.03787135 0.1449923 0.1254558 0.1092853 0.01236635
10 0.04375891 0.01236635 0.09378034 0.06907708 0.07867934 0.01236635
5 0.03865285 0.007265354 0.06337634 0.04375891 0.03787135 0.007265354
0 0.008016503 0.007265354 0.05317434 0.03354679 0.03787135 0.007265354
Applied at 2 V
Gas O2% Sensor A Sensor B Sensor C Sensor D Sensor E Sensor F
20 0.08971343 0.04297235 0.07236635 0.1305619 0.1194873 0.01236635
15 0.04886497 0.02256835 0.05867934 0.08460737 0.06847734 0.01236635
10 0.008016503 0.01236635 0.0497903 0.03822862 0.04807335 0.01236635
5 0.008016503 0.007265354 0.02807335 0.01312256 0.03277035 0.007265354
0 0.008016503 0.007265354 0.01236635 0.01312256 0.007265354 0.007265354
Applied at 1.8 V
Gas O2% Sensor A Sensor B Sensor C Sensor D Sensor E Sensor F
20 0.03865285 0.01236635 0.08378034 0.04986497 0.05827534 0.007265354
15 0.02312256 0.01236635 0.02236635 0.03786497 0.02766935 0.007265354
10 0.01312256 0.01236635 0.01236635 0.01822862 0.007265354 0.007265354
5 0.008016503 0.007265354 0.01236635 0.008016503 0.007265354 0.007265354
0 0.002910445 0.007265354 0.01236635 0.002910445 0.007265354 0.007265354

Tests and Results
112
Applied at 1.65 V
Gas O2% Sensor A Sensor B Sensor C Sensor D Sensor E Sensor F
20 0.01312256 0.007265354 0.007265354 0.02333468 0.01236635 0.007265354
15 0.008016503 0.007265354 0.007265354 0.008016503 0.01236635 0.007265354
10 0.008016503 0.01236635 0.007265354 0.01312256 0.007265354 0.007265354
5 0.008016503 0.01236635 0.007265354 0.008016503 0.007265354 0.007265354
0 0.008016503 0.007265354 0.007265354 0.002910445 0.007265354 0.007265354
Applied at 1.5 V
Gas O2% Sensor A Sensor B Sensor C Sensor D Sensor E Sensor F
20 0.008016503 0.007265354 0.007265354 0.01822862 0.01746735 0.007265354
15 0.008016503 0.007265354 0.007265354 0.008016503 0.01236635 0.007265354
10 0.008016503 0.007265354 0.007265354 0.008016503 0.007265354 0.007265354
5 0.008016503 0.007265354 0.007265354 0.008016503 0.007265354 0.007265354
0 0.002910445 0.007265354 0.007265354 0.002910445 0.007265354 0.007265354
Applied at 1.4 V
Gas O2% Sensor A Sensor B Sensor C Sensor D Sensor E Sensor F
20 0.008016503 0.007265354 0.007265354 0.01312256 0.02256835 0.007265354
15 0.008016503 0.007265354 0.007265354 0.002910445 0.01236635 0.007265354
10 0.008016503 0.007265354 0.007265354 0.008016503 0.007265354 0.007265354
5 0.002910445 0.007265354 0.007265354 0.008016503 0.007265354 0.007265354
0 0.002910445 0.007265354 0.007265354 0.002910445 0.007265354 0.007265354

Tests and Results
113
5.4. Liquid state measurement
At this stage, the sensor is tested with different concentration of dissolved oxygen in water
and its results are investigated.
5.4.1. Experimental setup
Diagram of the experiment setup with liquid medium is shown in the Figure 5.14. The
condition is almost the same as the gas state measurements; however instead of using gas
analyser, a dissolved oxygen meter probe is used to verify the percentage of the dissolved
oxygen in water. In order to get test points for testing the sensor, air is blended with Nitrogen.
Air is pumped with an aquarium pump and mixed with 99.9999% purity Nitrogen gas and the
gas mixture was fed and bubbled into a glass beaker containing water where the dissolved
oxygen is being monitored by a commercial dissolved oxygen meter probe provided by the
School of Chemical Engineering of University of Birmingham. The ratio of oxygen is
regulated inside the water using flow meters down to 0%, 25%, 50%, 75% and 100% and
verified using the oxygen meter probe as an existing commercial sensor to achieve accurate
evaluation. Then the liquid is directed and pumped through the PCB oxygen sensor platform
by a syringe pump with flow rate of 5 ml/min. The measurements are conducted using the
same computerized measurement system equipped with Data acquisition unit (DAQFactory
Express and LabJack) and room temperature of 22ºC.

Tests and Results
114
Figure 5.14 Diagram of liquid state experimental setup.
Each sensor is subjected to a potential scanning for several cycles to achieve a stable,
reproducible scan prior to testing. And the data were attained by steady state measurement at
applied potential from 0.0 to 2.5V. Figure 5.15 shows an image from the experimental setup
for liquid state measurements.
Figure 5.15 Experimental setup and instrumentation system for liquid state measurements.
Dissolved oxygen
probe in a water
containing beaker
Syringe Pump

Tests and Results
115
5.4.2. Sensor performance
Figure 5.16 to 5.20 shows the linearity of the step response measurements of the 6 sensor set
with working electrode of 20 μm, 300 μm, 400 μm, 500 μm, 600 μm and 900 μm between
bias voltages of 1.6V to 2.5V. The results are taken separately for each bias voltage of 1.6V,
1.8V, 2V, 2.25V and 2.5V. The graphs show that the current/oxygen concentration has a
linear relationship as expected, however sensors C and E with Diameter of WE being 500 μm
and 900μm has found to be more sensitive to the change of dissolved oxygen in water.
The offset currents at the zero oxygen concentration level are produced by: 1) the capacitive
current effect and 2) Solid polymer electrolyte Nafion membrane’s resistance as explained
before.
Figure 5.16 Step linearity response at 2.5V.
Figure 5.17 Step linearity response at 2.25V.
0
0.5
1
1.5
2
2.5
3
3.5
4
4.5
0 50 100 150
Sensor F
Sensor A
Sensor B
Sensor C
Sensor D
Sensor E
0
0.5
1
1.5
2
2.5
0 50 100 150
Sensor F
Sensor A
Sensor B
Sensor C
Sensor D
Sensor E
Oxygen concentration (% Atm)
Oxygen concentration (% Atm)
Current (μA)
Current (μA)

Tests and Results
116
Figure 5.18 Step linearity response at 2V.
Figure 5.19 Step linearity response at 1.8V.
Figure 5.20 Step linearity response at 1.6V.
0
0.1
0.2
0.3
0.4
0.5
0.6
0.7
0.8
0 50 100 150
Sensor F
Sensor A
Sensor B
Sensor C
Sensor D
Sensor E
0
0.05
0.1
0.15
0.2
0.25
0.3
0.35
0 50 100 150
Sensor F
Sensor A
Sensor B
Sensor C
Sensor D
Sensor E
0
0.05
0.1
0.15
0.2
0.25
0.3
0 20 40 60 80 100 120
Sensor F
Sensor A
Sensor B
Sensor C
Sensor D
Sensor E
Oxygen concentration (% Atm)
Oxygen concentration (% Atm)
Oxygen concentration (% Atm)
Current (μA)
Current (μA)
Current (μA)

Tests and Results
117
5.5. Summary
In this chapter tests and measurements were conducted to investigate the functionality of the
PCB made oxygen sensor integrated with the 3D printed cell culturing platform. A series of
experiments were designed to identify the appropriate design features (size of the electrodes).
Six set of sensors with different WE diameter were tested in gas and liquid state and exposed
to different concentration of oxygen in liquid and gas. Experimental setup for gas and liquid
state measurements were demonstrated. The results of CV and step linearity measurements
were shown to be consistent with the size of the electrodes. The sensors have shown
sufficient electrocatalytical activity (high output current density). The current was
proportional to the oxygen concentration under diffusion controlled region. Information
provided in this chapter could be used to further improve the functionally of the sensor. The
size of the WE could be used to determine the desired response from the device and by
improving the adhesion of Nafion membrane, technique for constructing optimized oxygen
sensors can be attained.

Conclusion
118
6. Conclusion
In this research an integrated oxygen sensor with cell culturing platform that is capable of
monitoring the cellular respiration of the cultured cells was designed and developed, which is
suitable for mass production and to be used in pharmaceutical industries. The prototype is the
first micro electrochemical oxygen sensor built using high precision printed circuit board
technology that incorporates Nafion 117 membrane as a solid electrolyte. The integration of a
3D printed cell culturing sample chamber with this sensor is an original innovation. A
miniaturized Clark type oxygen sensor as a cellular respiration monitoring device has several
advantages including robustness and advanced fabrication techniques allow easy production
of optimal microelectrode features like pads and tracks with gold coating and strong
connectivity on its surface.
The electrochemical oxygen sensor’s configuration designed using microelectrodes and the
theory of its design was explained. Overview about the background theories and fundamental
of the electrochemical oxygen sensors was given. The state of the art and the most recent
studies in this field were explored and a new idea considering the previous studies was
developed. A three electrode sensor configuration is chosen and to prevent current passing
through the reference electrode, the counter electrode is introduced, which balances the
charge added or removed by the working electrode and allows the balancing current at the
working electrode to flow. Usage of microelectrodes improved some of the disadvantages
and shortcomings of macro sized electrodes when electrochemical techniques were applied.
Additionally they were cost efficient and easily put into practice. Due to their minimized
interface, they are capable of lower detection limit. Capacitive effects and Ohmic drops (iR)
have minimal effect on their response. The sensor and its electrodes were made on the PCB.

Conclusion
119
Since low currents are being measured during the experiments, it will be important to insulate
the sensor and PCBs are insulating substrate, made from FR-4 glass epoxy. Electrodes
implement the half reaction over extended times so its material type is important. To reduce
cost and to maintain the simplicity of the design, all three electrodes are fabricated from the
same conductive material to complete the electrochemical reaction. Copper is etched from
PCB as the electrodes. Copper is prone to corrosion such as oxidation at relatively normal
temperatures, which reduces its shelf life to solve this issue, a thin layer of Electroless nickel
and immersion gold plating on the copper electrodes is considered.
The electronic control circuit board is designed and developed to control the electrochemical
oxygen sensor and record data during the measurements, which was an aanalogue circuitry to
condition the low level signals to a point where they can be measured using Data Acquisition
(DAQ) modules such as LabJack. The LT spice simulation was performed to show the
functionality of this circuit.
A cell culturing platform prototype is developed utilizing a 3D printing device and a material
choice of MED610, having complex features inside the chip with the potential for cells to
grow and adhere to its chamber. Using 3D printing technology provided the freedom of
designing complex shape and features contrary to the conventional silicon wafer manufacture
techniques. The cell culturing platform was designed that its critical features coincide with
the design of the oxygen sensor on the PCB. The oxygen respiration of cells in the cell
culturing chamber was modelled using Finite Element Analysis software COMSOL, which is
a solver and Simulation software package for various physics and engineering applications,
especially coupled phenomena, or multiphysics. Further methods of surface enhancement and
cell culturing were suggested.
Experiments were designed and carried out and the functionality of the sensors was verified.
Six set of sensors with different WE diameter were tested in gas and liquid state and exposed

Conclusion
120
to different concentration of oxygen in liquid and gas. The results of CV and step linearity
measurements were presented to be consistent with the size of the electrodes. The current was
proportional to the oxygen concentration under diffusion controlled region.
Current medical oxygen sensors are encapsulated aqueous based devices. Despite being large,
they have inconsistent performance and limited shelf lives. The use of aqueous based
electrolytes reduces their shelf life. Microfabrication methods while improving device
consistency and reducing the size, they increase the cost and reduce the robustness of the
sensor while being incorporated in cell culturing platforms.
Instead of electrolyte solution, a solid polymer electrolyte membrane, Nafion membrane was
used, which removed requirement for extra humidification and extended shelf life. The
prototype successfully detected the changes in the current affected by oxygen concentration,
in the 0-5 μAmp range, having response time of less than 5 seconds. When exposed to
different gas concentration, the sensor was more consistent in function than the time when
exposed to liquid sample.
6.1. Suggestions for Future Work
It is possible to improve further the functionally of the sensor by finding an appropriate
condition for Nafion membrane application during the hot pressing. As presented in section
5.4, Nafion membrane hot pressed between two aluminium plates, clamped between metal
clips. It has been tried to do the measurement with the sensors that were Nafion coated
successfully and in similar condition in the aspect of Nafion adhesion. However there was not
an identical pressure all over the surface of the PCB considering the two identical sensors on
the same chip or two different chips from each other, which was anticipated while comparing
the results that were different, however they are not presented here. It will be ideal to design a

Conclusion
121
system which could be capable of hot pressing these chips with Nafion membrane in an equal
condition.
It is important to test the sensor with the living cells, so in the next stage to improve this
sensor, it is suggested to culture cells on the cell culturing platform after surface treatments,
and test the functionality of the sensor with living organisms.
The sensors with different electrodes size and diameter were fabricated and tested separately.
For each sensor, a separate experiment has been carried out. It has been tried to create similar
testing conditions for each sensor, though it’s likely that sometimes the stages of experiment
were not exactly the same. To solve this issue, it’s suggested to design a new set of sensors
with different sizes that are located on the same PCB (like an array) and be tested at the same
time and log its data on the same device (requiring a Labjack device with more ports of
connection). In this way, it’s easier to analyse and compare the different sized sensor to each
other and have a better understanding.
In this project the design of the sensor’s electrodes are inspired by the existing previous
miniature electrochemical sensors and in a way to minimize the cost and fabrication time by
miniaturization. As a future work it is recommended to explore mathematical rationalization
and simulation to justify and predict the sensor’s reaction before manufacturing. In this way,
it’s possible to optimize the design.

References
122
References 1. Wilson, G.S., Bioelectrochemistry. 2002, New York: Wiley.
2. Clark, L.C., Electrochemical device for chemical analysis. 1956.
3. Park, J., et al., A reservoir-type oxygen sensor with 2×3 array for measuring cellular
respiration levels. Sensors and Actuators B: Chemical, 2013. 176: p. 913-920.
4. Lee, Y.J. and J.Y. Park, A Highly Miniaturized Dissolved Oxygen Sensor Using a
Nanoporous Platinum Electrode Electroplated on Silicon. Journal of Korean physical
society, 2011. 58: p. 1505-1510.
5. McLaughlin, G.W., et al., Microfabricated solid-state dissolved oxygen sensor.
Sensors and Actuators B 83, 2002: p. 138-148.
6. Wu, C.-C., et al., Fabrication of miniature Clark oxygen sensor integrated with
microstructure. Sensors and Actuators B: Chemical, 2005. 110(2): p. 342-349.
7. Cheneler, D., et al., Printed circuit board as a MEMS platform for focused ion beam
technology. Microelectronic Engineering, 2011. 88(1): p. 121-126.
8. Chien, S., Metabolic Management. In: Madame Curie Bioscience Database, 2000.
Landes Bioscience.
9. Wang, J., Analytical Electrochemistry. Second Edition ed. 2000, New York: Wiley-
VCH Publishers.
10. Dixon, B.M., J.P. Lowry, and R.D. O'Neill, Characterization in vitro and in vivo of
the oxygen dependence of an enzyme/polymer biosensor for monitoring brain glucose.
Journal of Neuroscience Methods, 2002. 119(2): p. 135-142.
11. Bănică, F.-G., Chemical Sensors and Biosensors: Fundamentals and Applications.
2012, Chichester, UK: John Wiley & Sons, Ltd.
12. Cavalcanti A, S.B., Zhang M, Kretly LC (2008). "Nanorobot Hardware Architecture
for Medical Defense" (PDF). Sensors 8 (5): 2932–2958. doi:10.3390/s8052932,
Nanorobot Hardware Architecture for Medical Defense. Sensors 2008: p. 2932–2958.
13. Sassolas A, B.L.J., Leca-Bouvier B.D (2011) Immobilization Strategies to Develop
and E.B.B.A. 489-571, Immobilization Strategies to Develop Enzymatic Biosensors
Biotechnology Advances. 2011: p. 489-571.
14. Nambiar, S. and J.T.W. Yeow, Conductive polymer-based sensors for biomedical
applications. Biosensors and Bioelectronics, 2011. 26(5): p. 1825-1832.
15. LC Jr CLARK and C. LYONS, Electrode systems for continuous monitoring in
cardiovascular surgery. 1960. 102: p. 29-45.
16. Thevenot, D.R., et al., Electrochemical biosensors: recommended definitions and
classification, Pure Appl. Vol. 7. 1999: Biosens Bioelectron. .
17. Park, J., et al., 2 X 3 Array Oxygen Sensor for Measuring Cellular Respiration Level,
in 4th IEEE International Conference on Nano/Micro Engineered and Molecular
Systems. 2009: Shenzhen, China.
18. Biran, I. and D.R. Walt, Chapter 1 - Optrode-Based Fiber Optic Biosensors (Bio-
Optrode), in Optical Biosensors Present and Future F.S. Ligler and C.A.R. Taitt,
Editors. 2004, Elsevier Science: Amsterdam. p. 5-16.
19. Enews, I.T.A.I. Dissolved Oxygen Analyzers. 2010; Available from:
http://www.instrument.org/2014home/index.html.
20. Permyakov, E.A., Luminescent Spectroscopy of Proteins. 1992 CRC Press

References
123
21. Lanz, M., D. Schürch, and G. Calzaferri, Photocatalytic oxidation of water to O2 on
AgCl-coated electrodes. Journal of Photochemistry and Photobiology A: Chemistry,
1999. 120(2): p. 105-117.
22. Bisen, P.S. and A. Sharma, Introduction to Instrumentation in Life Sciences. 26 Sep
2012, CRC Press. p. 53.
23. Arora, P., et al., Biosensors as innovative tools for the detection of food borne
pathogens. Biosensors and Bioelectronics, 2011. 28(1): p. 1-12.
24. Kuila, T., et al., Recent Advances in Graphene-Based Biosensors, Biosensors and
Bioelectronics. Biosensors and Bioelectronics, 2011. 26: p. 4637– 4648.
25. McLaughlin, G.W., Microfluidic and biosensor applications of fluoropolymer films,
in Departement of Electrical Engineering. 2001, Stanford University: Stanford,
California.
26. Cunningham, B., [Illinois] ECE 416 Electrochemical Sensors. 2013.
27. Clark, L.C., Monitor and Control of Blood and Tissue Oxygen Tension,”
Transactions of the American Society of Artificial Internal Organs. Transactions of
the American Society of Artificial Internal Organs 1956. 2: p. 144-156.
28. Alberty, R.A. and R.J. Silbey, Physical Chemistry Second Edition. 1996, New York:
John Wiley & Sons, Inc.
29. Maruyama, J., M. Inaba, and Z. Ogumi. Rotating ring-disk electrode study on the
cathodic oxygen reduction at Nafion®-coated gold electrodes. Journal of
Electroanalytical Chemistry 1998; Available from:
http://www.sciencedirect.com/science/article/pii/S0022072898003623.
30. Network, I.G.H. Milestones:Volta's Electrical Battery Invention, 1799. 18 October
2015]; Available from: http://www.ieeeghn.org/.
31. Chemistry, R.S.o. Enterprise and electrolysis. Chemistry World 2003 25 September
2015].
32. Ehl, G. and A. Ihde, Faraday's Electrochemical Laws and the Determination of
Equivalent Weights. Journal of Chemical Education, 1954. 31: p. 226–232.
33. Aguiar, F.A.S., Characterisation of electrode microarrays produced
photolithographically and with thiol self-assembled monolayers on gold electrodes, in
Department of Chemistry. 2009, Durham University: Durham, United Kingdom.
34. Kovacs, G.T.A., Micromachined Transducers Source book. 1998, New York: NY:
McGraw-Hill.
35. West, A.R., Solid Electrolytes. Berichte der Bunsengesellschaft für physikalische
Chemie, 1989. 93(11): p. 1235-1241.
36. Smitha, B., S. Sridhar, and A.A. Khan, Solid polymer electrolyte membranes for fuel
cell applications—a review. Journal of Membrane Science, 2005. 259(1–2): p. 10-26.
37. Heitner-Wirguin, C., Recent advances in perfluorinated ionomer membranes:
structure, properties and applications. Journal of Membrane Science, 1996. 120(1): p.
1-33.
38. Chen, D., et al., PVDF-Nafion nanomembranes coated microneedles for in vivo
transcutaneous implantable glucose sensing. Biosensors and Bioelectronics, 2015. 74:
p. 1047-1052.
39. Brett, C.M.A. and A.M.O. Brett, Electrochemistry: principles, methods, and
applications. 1993, Oxford Oxford science publications.
40. Erdey-Gruz, T. and M. Volmer, Z. Physik. Chem. 1930. 150A: p. 203 – 213.
41. Butler, J.A.V., Transactions of the Faraday Society. 1924. 19: p. 729 – 733.
42. Glasstone, S., The Electrochemistry of solution. second edition ed. 1937, London:
Methuen.

References
124
43. Inczedy, J., T. Lengyel, and A.M. Ure, Compendium of Analytical Nomenclature. The
Orange Book. Vol. Definitive rules 1997. 1998, Oxford: Blackwell Science.
44. Pletcher, D., Microelectrodes: Theory and Applications, ed. I. Montenegro, M. A.
Queirós, and J.L. Daschbach. 1991.
45. Yip, N.-C., et al., Real-time electrocatalytic sensing of cellular respiration.
Biosensors and Bioelectronics, 2014. 57: p. 303-309.
46. Lee, J.-H., et al., Needle-type dissolved oxygen microelectrode array sensors for in
situ measurements. Sensors and Actuators B: Chemical, 2007. 128(1): p. 179-185.
47. Park, J., et al., Array type dissolved oxygen sensor and measurement system for
simultaneous measurement of cellular respiration level. Transducers, 2009.
48. Gopalakrishna, J., W. Wlodarski, and P. Iles, Performance of Solid Polymer
Electrolyte based Oxygen Sensor without External Humidification. IEEE, 1999.
49. McLaughlin, G.W., et al., Solid-state Dissolved Oxygen Sensor Test Matrix Using a
Pulsed-plasma Deposited PTFE Film, in The 11th International Conference on Solid-
State Sensors and Actuators. 2001: Munich, Germany.
50. H. Camon, et al. From Layout to System Simulation: An Example of an Oxygen
Sensor. in The 1998 International Conference on Modeling and Simulation of
Microsystems. 1998.
51. C.M. Bautista-Rodriguez, et al., Effect of a Rigid Gas Diffusion Media Applied as
Distributor of Reagents in a PEMFC in Operation, Part I: Dry Gases. International
Journal of Electrochemical Science, 2009. 13.
52. M. Brischwein, D. Grundl, and W. X. Zhang, Finite Element Modelling of
Microphysiometry on Cellular Specimen, in World congress on medical physics and
biomedical engineering. 2009: Munich, Germany. p. 30-33.
53. A. R. Oller, et al. Growth of mammalian cells at high oxygen concentrations.
54. I. J. Langmuir, J. Am. Chem. Soc., 1917. 39 p. 1848 – 1906.
55. Laurent, J.Y., Development of micro fuel cell by using microelectronic process for
next generation of portable equipment, in 3rd European PEFC Forum. 2005: Atomic
Energy Commision - DTEN.
56. G. Milad and M. Orduz. Surface Finishes in a Lead Free World. 2 December 2015].
57. The Advanced Manufacturing Technology Centre, U.o.B. Lasea Multi-Axis Laser
Micro Machining Centre [cited 2015 5 December ]; Available from:
http://www.birmingham.ac.uk/facilities/advanced-manufacturing/index.aspx.
58. [cited 2012 27th August].
59. A . Sharma, et al., Long term in vitro function stability and recording longevity of
fully integrated wireless neural interfaces based on the Utah Slant Electrode Array.
Neural Eng. , 2011.
60. T.Y. Chang, et al., Cell and protein compatibility of Parylene-C surfaces. Langmuir,
2007. 23: p. 11718–11725.
61. E. Meng, P.Y. Li, and Y.C.J. Tai, Plasma removal of Parylene-C. Micromech.
Microeng., 2008: p. 180.
62. J. Lahann, Vapor-based polymer coatings for potential biomedical applications.
Polym. Int., 2006. 55: p. 1361–1370.
63. J.B. Fortin and T.M. Lu, A model for the chemical vapor deposition of poly (para-
xylylene) (Parylene) thin films. Chem. Mater., 2002. 14: p. 1945–1949.