Embed Size (px)
Citation preview

September 2013
NPCC
2013 MARITIMES AREA
COMPREHENSIVE REVIEW OF RESOURCE
ADEQUACY
NEW BRUNSWICK SYSTEM OPERATOR
NOVA SCOTIA POWER INCORPORATED
MARITIME ELECTRIC COMPANY, LIMITED
NORTHERN MAINE ISA, INC.
Approved by the RCC December 3, 2013

2013 Maritimes Area Comprehensive Review
Of Resource Adequacy
ii
This page intentionally left blank.

I
EXECUTIVE SUMMARY
The 2013 Maritimes Area Comprehensive Review of Resource Adequacy, covering the
period of January 2014 through December 2018, has been prepared to satisfy the
compliance requirements as established by the Northeast Power Coordinating Council
(NPCC). The guidelines for this review are specified in the NPCC Regional Reliability
Directory #1 Appendix D (Adopted: December 1, 2009). This review supplants the
previous Comprehensive Review that was performed in 2010 and approved by the RCC
on September 9, 2010.
Table 1 provides a summary of the major assumptions and results of this review.
Table 1: Summary of Major Assumptions and Results
MAJOR ASSUMPTIONS
Load Forecast 2013 (all jurisdictions)
Load Shape 2011/12 (all years)
Resource Adequacy Criterion Loss of Load Expectation not more than 0.1 days/year
Maritimes Required Reserve 20% of peak firm load
Interconnection Benefits 300 MW
NB to NS tie capability Reduced from 300 MW to 150 MW
Maritime Link project
153 MW of purchases from Newfoundland to Nova
Scotia is forecast for Jan. 1, 2018 coincident with an
assumed retirement of a 153 MW Nova Scotia
generator
RESULTS
Year Expected Number of Firm Load Disconnections
days/year
2014
2015
2016
2017
2018
0.012
0.011
0.007
0.006
0.005
The 2014 coincident peak demand forecast for the Maritimes Area is 5,242 MW, which is
183 MW below the 5,425 MW peak demand forecast in the 2010 review. This reduced

II
peak demand forecast reflects load decreases in mining, forestry and pulp and paper
industries, slower customer load growth in reaction to higher charges for electricity, and
energy efficiency programs. The average annual demand growth over the 2014–2018
study period of this review is 0.05%, which is higher than the -0.01% annual demand
growth forecast in the 2010 review.
The reserve criterion for the Maritimes Area is 20%, and adherence to this criterion is
demonstrated to comply with the NPCC resource adequacy criterion.
Beginning with the 2011 Maritimes Area Interim Review of Resouce Adequacy, tie
capability from NB to NS was reduced from 300MW to 150 MW to account for increased
southeastern NB loads.
The NPCC resource adequacy criterion of a Loss of Load Expectation (LOLE) of not
more than 0.1 days per year of firm load disconnections is not exceeded by the Maritimes
Area for all years covered by this review, and varies between 0.005 to 0.012 days/yr for
the base load forecast. The Maritimes Area is also shown to adhere to its own 20% reserve
criterion in all years for the base load forecast, with minimum reserve levels varying
between 45% and 46%.
Sensitivity analyses were run to determine the effects of high load growth, zero wind
generation, and removing all external tie benefits on LOLE. The sensitivity results are
shown in Table 2 and meet the NPCC resource adequacy criterion in all years.
Table 2: Summary of LOLE Results
Year
Base Case
LOLE
High Load
Growth
LOLE
Zero Wind
LOLE
No Tie
Benefits
LOLE
days/year days/year days/year days/year
2014 0.012 0.012 0.049 0.013
2015 0.011 0.012 0.058 0.012
2016 0.007 0.011 0.038 0.007
2017 0.006 0.014 0.036 0.006
2018 0.005 0.016 0.028 0.005
Beginning October 1, 2013, the New Brunswick System Opertor will be amalgamated
with New Brunswick Power Corporation. This restructuring will have no impact on the
reliability of the Maritimes Area.

III
TABLE OF CONTENTS
EXECUTIVE SUMMARY ................................................................................................. I
TABLE OF CONTENTS .................................................................................................. III
List of Tables .............................................................................................................. IV
List of Figures ............................................................................................................. IV
1.0 INTRODUCTION .................................................................................................. 1
2.0 RESOURCE ADEQUACY CRITERION .............................................................. 3
2.1 Statement of Resource Adequacy Criterion .......................................................... 3
2.2 Emergency Operating Procedures ......................................................................... 3
2.3 Maritimes Area Required Reserve ........................................................................ 5
2.4 Relationship of Reserve Criterion to NPCC Reliability Criterion ........................ 5
2.5 Recent Reliability Studies ..................................................................................... 5
2.6 Load Forecast Uncertainty .................................................................................... 5
2.7 Intra-Area Transmission Capacity Limits ............................................................. 7
3.0 RESOURCE ADEQUACY ASSESSMENT .......................................................... 9
3.1 Comparison of Forecast and Required Reserve – Base Case ................................ 9
3.2 LOLE results – High Load Growth ....................................................................... 9
3.3 LOLE Results – Zero Wind ................................................................................. 10
3.4 LOLE Results – No Tie Benefits ......................................................................... 10
3.5 Contingency Plans ............................................................................................... 12
3.6 Proposed Changes to Market Rules ..................................................................... 12
4.0 FORECAST RESOURCE CAPACITY MIX ...................................................... 13
4.1 Forecast Resource Capacity Mix ......................................................................... 13
4.2 Reliability Impact of Resource Diversification Strategy..................................... 14
APPENDIX A DESCRIPTION OF RESOURCE RELIABILITY MODEL ............... 15
APPENDIX B DESCRIPTION OF RELIABILITY PROGRAM ............................... 25

IV
List of Tables
Table 1: Summary of Major Assumptions and Results ................................................. I
Table 2: Summary of LOLE Results ............................................................................. II
Table 3: Comparison of Load Forecasts ....................................................................... 1
Table 4: LOLE days/year – Base Case with Load Forecast Uncertainty ...................... 6
Table 5: Forecast, Minimum, and Required Reserve Levels – Base Case ................... 9
Table 6: Loads and LOLE Results – High Load Growth............................................ 10
Table 7: Capacity and LOLE Results – Zero Wind .................................................... 10
Table 8: Capacity and LOLE Results – No Tie Benefits ............................................ 11
Table 9: Forecast Capacity Resource Mix .................................................................. 13
Table A - 1: Maritimes Area Load Forecast ...................................................................... 16
Table A - 2: Maritimes Area Resources ............................................................................ 18
Table A - 3: Summary of Changes in Capacity ................................................................. 21
Table A - 4: Maritimes Area Forced Outage Rates ........................................................... 22
List of Figures
Figure 1: Comparison of Load Forecasts ....................................................................... 2
Figure 2: LOLE (days/year) – Base Case with Load Forecast Uncertainty ................... 6
Figure 3: Maritimes Area Transmission Capacity Limits .............................................. 8
Figure 4: LOLE Results – All Base and Sensitivity Cases .......................................... 12
Figure 5: Forecast Capacity Resource Mix .................................................................. 13

1
1.0 INTRODUCTION
The 2013 Maritimes Area Comprehensive Review of Resource Adequacy,
covering the period of January 2014 through December 2018, has been prepared
to satisfy the compliance requirements as established by the Northeast Power
Coordinating Council (NPCC). The guidelines for this review are specified in
NPCC Directory #1 Appendix D, Guidelines for Area Review of Resource
Adequacy (Adopted: December 1, 2009). This review supplants the previous
Comprehensive Review that was performed in 2010 and approved by the RCC on
September 9, 2010.
The Maritimes Area is a winter peaking area with separate jurisdictions and
regulators in New Brunswick, Nova Scotia, Prince Edward Island (PEI), and
Northern Maine. The New Brunswick System Operator (NBSO) is the Reliability
Coordinator for the Maritimes Area. Beginning October 1, 2013, NBSO will be
amalgamated with the New Brunswick Power Corporation (NB Power). This
restructuring will have no impact on the reliability of the Maritimes Area.
Table 3 and Figure 1 provide a comparison of the load forecasts in the 2013 and
2010 reviews. The coincident peak demand forecast for 2014 is 5,242 MW, which
is 183 MW below the 5,425 MW forecast in the 2010 Comprehensive Review.
This reduced peak demand forecast reflects load decreases in mining, forestry and
pulp and paper industries, slower customer load growth in reaction to higher
charges for electricity, and energy efficiency programs. The average annual
demand growth over the period of this review is 0.05%, which is higher than the -
0.01% average demand growth forecast in the 2010 review.
Table 3: Comparison of Load Forecasts
Winter Peak
(Month of
January)
2013
Review
MW
2010
Review
MW
2014
2015
2016
2017
2018
5,242
5,286
5,267
5,267
5,253
5,425
5,444
N/A
N/A
N/A
Five Year Period 2014 – 2018 2011 – 2015
Annual Average
Growth Rate 0.05% -0.01%

2
Figure 1: Comparison of Load Forecasts
5200
5250
5300
5350
5400
5450
5500
2014 2015 2016 2017 2018
Co
incid
ent
Peak -
MW
Year
2010 Review
2014 Review

3
2.0 RESOURCE ADEQUACY CRITERION
2.1 Statement of Resource Adequacy Criterion
For planning purposes, New Brunswick, Nova Scotia, PEI and Northern
Maine individually apply a capacity based criterion in determining their
required reserves.
New Brunswick, Nova Scotia and PEI each plans for a reserve equal to the
largest generator or 20% of the firm load. PEI plans for a reserve equal to
15% of its firm load. As a simplification, this review applies the 20%
reserve criterion to the Maritimes Area as a whole because of the
relatively small size of PEI compared to the rest of the Maritimes Area.
Thermal and hydro generators are considered available at the Dependable
Maximum Net Capability (DMNC) in the determination of the reserve
margin.
The NPCC resource adequacy criterion (from NPCC Directory #1 Design
and Operation of the Bulk Power System, Section 5.2 (Adopted: December
1, 2009) states:
The probability (or risk) of disconnecting firm load due to
resource deficiencies shall be, on average, not more than
one day in ten years as determined by studies conducted for
each Resource Planning and Planning Coordinator Area.
Compliance with this criterion shall be evaluated
probabilistically, such that the loss of load expectation
(LOLE) of disconnecting firm load due to resource
deficiencies shall be, on average, no more than 0.1 day per
year. This evaluation shall make due allowance for demand
uncertainty, scheduled outages and deratings, forced
outages and deratings, assistance over interconnections
with neighboring Planning Coordinator Areas, transmission
transfer capabilities, and capacity and/or load relief from
available operating procedures.
2.2 Emergency Operating Procedures
Although this document presents a review of resource adequacy for the
interconnected Maritimes Area, each separate system remains under the
exclusive control of its System Operator for purposes of economic
dispatch. For reliability purposes, however, reserve sharing agreements do
exist and the systems operate as an Area in accordance with NPCC criteria
and guidelines.

4
The particular actions taken by the Energy Coordinator/Dispatcher when
faced with a developing or sudden capacity shortage are based upon the
assessment of which of a number of possible actions are best suited to the
prevailing system conditions. The actions initiated are based upon
previous experience in dealing with similar situations and, if the situation
permits, usually after consultation with other System Operations personnel
similarly experienced in this regard. In practice, the corrective actions that
are taken are one or more of the following Emergency Operation
Procedures (EOP):
1. Synchronize and load all available hydro generators.
2. Bring on-line generators up to their DMNC.
3. Cancel economy and other external interruptible sales.
4. Begin start-up procedures for “cold-standby” thermal generators.
5. Synchronize and load combustion turbines.
6. Purchase capacity from Hydro-Québec.
7. Purchase capacity from New England.
8. Cut interruptible sales to industrial customers.
9. Maximize MVAR support (capacitor banks, synchronous
condensers) if capacity shortage is causing a low voltage condition
in a particular area.
10. Implement a 5% voltage reduction at selected substations within
Nova Scotia (1–5 MW)
11. Appeal to the public for voluntary customer load reduction.
12. Disconnect customer loads as necessary to correct either a local or
widespread problem.
Some or all of the above steps may be used in varying sequence to meet a
capacity shortage depending on the generation pattern in effect at the time
and whether or not the shortage results in localized internal system
problems.
Although steps 10 and 11 are valid, the level of assistance available from
these procedures is not modeled in this study.

5
2.3 Maritimes Area Required Reserve
The Maritimes Area employs a reserve criterion of 20% of firm load. The
required installed reserve is shown in Section 3.1.
2.4 Relationship of Reserve Criterion to NPCC Reliability Criterion
To relate the Maritimes Area reserve criterion of 20% to the NPCC
resource adequacy criterion as stated in Section 2.1, LOLE was evaluated
with the Maritimes Area firm load scaled so that the reserve was equal to
20%. The results showed that a Maritimes Area reserve of 20%
corresponds to an LOLE of approximately 0.096 days per year. An
additional 10 MW of load was required to establish an LOLE of 0.1 days
per year.
The preceding leads to the conclusion that the Maritimes Area reserve
criterion meets the NPCC resource adequacy criterion.
2.5 Recent Reliability Studies
System Operators in New Brunswick, Nova Scotia, PEI, and Northern
Maine individually conduct internal reviews of their capacity requirements
by comparison of generation sources with forecast loads according to the
reserve criterion described previously.
The results presented in this review are based upon an evaluation
conducted during the third quarter of 2013 for the period 2014 through
2018. This review supplants the previous Comprehensive Review that was
performed in 2010 and approved by the RCC on September 9, 2010.
Interim reviews of resource adequacy for the Maritimes Area were
completed in the years 2011 and 2012 covering the years 2012–2015 and
2013–2015 respectively. The results of the interim reviews for the two
overlapping years 2014 and 2015 compare well with the results of this
review. The NPCC resource adequacy criterion was met in both years for
all base and sensitivity cases. The same is true for this review.
2.6 Load Forecast Uncertainty
To determine load forecast uncertainty (LFU) an analysis of the historical
load forecasts of the Maritimes Area utilities has shown that the standard
deviation of the load forecast errors is approximately 4.6% based upon the
four year lead time required to add new resources. To incorporate LFU,
two additional load models were created from the base load forecast by
increasing it by 4.6 and 9.2 percent (one or two standard deviations)

6
respectively. The reliability analysis was repeated for these two load
models.
It is assumed that the forecast error is approximately normally distributed
around the forecast value and that the contribution to system LOLE is
negligible when loads are less than the forecast value by more than ½ a
standard deviation. These assumptions result in weighting factors of 0.383,
0.242, and 0.067 for the three results obtained using the base, 4.6 percent
increased, and 9.2 percent increased load models respectively.
The results of the LFU evaluation as indicated in Table 4 and Figure 2
demonstrate that the Maritimes Area system meets the NPCC resource
adequacy criterion of no more than 0.1 days/year from 2014 to 2018.
Table 4: LOLE days/year – Base Case with Load Forecast Uncertainty
Calendar Year
Expected Number of
Firm Load Disconnections
days/year
2014 0.012
2015 0.011
2016 0.007
2017 0.006
2018 0.005
Figure 2: LOLE (days/year) – Base Case with Load Forecast Uncertainty
0.00
0.02
0.04
0.06
0.08
0.10
0.12
2014 2015 2016 2017 2018
LO
LE
(d
ays/y
ear)
Year
NPCC Criterion
Maritimes LOLE

7
2.7 Intra-Area Transmission Capacity Limits
Within the Maritimes Area, the areas of Nova Scotia, PEI, and Northern
Maine are each connected only to New Brunswick as per Figure 3. A
transmission congestion issue of consequence to the LOLE results occurs
for only one of these three interconnections, the tie between New
Brunswick and Nova Scotia.
Beginning with the 2011 Maritimes Area Interim Review of Resource
Adequacy, tie capacity from NB to NS was reduced from 300 MW to 150
MW to account for increased southeastern NB loads.
Transmission capacity limits between Northern Maine and New
Brunswick were not modeled for this analysis. These normal limits are a
result of parallel operation of four lines (two 138 kV, two 69 kV) that
Northern Maine keeps below thermal ratings to ensure that the trip of one
of these lines doesn’t overload the others. Should one or more
contingencies occur in Northern Maine, the lines can be switched from
parallel to radial operating modes. This effectively allows a high enough
transfer limit from New Brunswick to meet the peak load in Northern
Maine.

8
Figure 3: Maritimes Area Transmission Capacity Limits
**
The 550 MW import capability from New England into New Brunswick is conditionally firm
depending on the status of generators in Maine. The unconditional firm import capability from New
England to New Brunswick is 300 MW.

9
3.0 RESOURCE ADEQUACY ASSESSMENT
3.1 Comparison of Forecast and Required Reserve – Base Case
In the comparison of the forecast and required reserve, the following
definitions apply. The required reserve of 20% is the reserve criterion of
the Maritimes Area. The forecast reserve is the actual reserve that will
occur for the load forecast and resource plan used in this study.
Table 5 and Figure 4 represent the results of the reserve comparison for
the base load forecast. The forecast reserve levels reflect reserves
calculated using wind generation levels at the hour of the Maritimes Area
coincident peak demand. In 2014, the wind generation modelled on peak
was 449 MW. Based on the wind and load shapes modelled, the minimum
hourly reserve expected during 2014 is 2170 MW coinciding with wind
generation of 203 MW. In each year of the analysis, the forecast reserve is
greater than the required reserve.
Table 5: Forecast, Minimum, and Required Reserve Levels – Base Case
Month
Of
January
Forecast
Capacity
Coincident
Peak Load
Inter.
Load
Forecast
Reserve
Minimum Required
Reserve Hourly
Reserve
MW MW MW MW % MW % MW %
2014 7,274 5,242 250 2,282 46 2,170 45 998 20
2015 7,347 5,286 251 2,312 46 2,173 45 1,007 20
2016 7,390 5,267 250 2,373 47 2,215 45 1,003 20
2017 7,403 5,267 251 2,387 48 2,211 45 1,003 20
2018 7,417 5,253 251 2,415 48 2,223 46 1,000 20
Forecast Reserve (%) = [Forecast Capacity – (Peak Load – Inter. Load)]*100%
(Peak Load – Inter. Load)
Minimum Reserve (%) = Minimum of Hourly [Capacity – (Load – Inter. Load)]*100%
(Load – Inter. Load)
3.2 LOLE results – High Load Growth
Table 6 and Figure 4 illustrate LOLE results if the average annual growth
rate is 1% higher than forecast (i.e. 1.05% per year versus 0.05% per
year). The results show that the NPCC resource adequacy criterion is met
in all years.

10
Table 6: Loads and LOLE Results – High Load Growth
Month
Of
January
High Load
Growth
Load
Base
Case
Load
Difference
High Load
Growth
LOLE
Base Case
LOLE
MW MW MW days/year days/year
2014 5,242 5,242 0 0.012 0.012
2015 5,297 5,286 11 0.012 0.011
2016 5,353 5,267 86 0.011 0.007
2017 5,409 5,267 142 0.014 0.006
2018 5,466 5,253 213 0.016 0.005
3.3 LOLE Results – Zero Wind
In a change from the 2010 review, the Maritimes Area no longer assigns a
fixed capacity credit to wind generation. Instead, simulated hourly wind
capacity values were netted against corresponding hourly load values.
Simulated wind capacity during peak demand varies between 449 MW
and 559 MW for the 2014 to 2018 period of this review. A sensitivity
analysis was performed with the wind capacity on the system set to zero
output for all hours. Table 7 and Figure 4 illustrate LOLE results for the
zero wind generation scenarios. The results show that Maritimes Area is
not reliant on wind capacity to meet the NPCC resource adequacy
criterion.
Table 7: Capacity and LOLE Results – Zero Wind
Month
Of
January
Zero Wind
Capacity
Base
Case
Capacity
Difference
Zero Wind
Capacity
LOLE
Base Case
LOLE
MW MW MW days/year days/year
2014 6,825 7,274 -449 0.049 0.012
2015 6,825 7,347 -522 0.058 0.011
2016 6,858 7,390 -532 0.038 0.007
2017 6,858 7,403 -545 0.036 0.006
2018 6,858 7,417 -559 0.028 0.005
3.4 LOLE Results – No Tie Benefits
In the 2010 Comprehensive Review, zero interconnection tie benefits were
assumed. Since 2011, NBSO has assumed 300 MW of tie benefits to New

11
Brunswick in its resource adequacy assessments. These tie benefits are on
a 2011 decision by the New Brunswick Market Advisory Committee to
recognize the lowest historical Firm Transmission Capacity posted from
summer peaking New England to winter peaking New Brunswick since
the commissioning of the second 345 kV tie between these systems in
December 2007. To the extent that future capacity purchases from New
England to New Brunswick occur across this interface, these tie benefits
will be reduced accordingly. Tie benefits from other neighbouring
jurisdictions were not considered by the New Brunswick Market Advisory
Committee because they also experience peak loads in winter.
In the CP-8 report Review of Interconnection Assistance Reliability
Benefits (June 1, 2011) the range of estimated annual tie benefit potential
for the Maritimes Area for 2011 was 1076 – 1353 MW and 1,252 and
1,536 MW in the year 2015. Based on this study, the 300 MW of tie
benefits assumed for this 2013 Comprehensive Review is conservative. A
sensitivity analysis performed for this review shows that the Area does not
require interconnection assistance to meet the NPCC resource adequacy
criterion. The results are shown in Table 8.
Table 8: Capacity and LOLE Results – No Tie Benefits
Month
Of
January
No Tie
Benefits
Capacity
BaseCase
Capacity Difference
No Tie
Benefits
LOLE
Base Case
LOLE
MW MW MW days/year days/year
2014 6,974 7,274 -300 0.013 0.012
2015 7,047 7,347 -300 0.012 0.011
2016 7,090 7,390 -300 0.007 0.007
2017 7,103 7,403 -300 0.006 0.006
2018 7,117 7,417 -300 0.005 0.005

12
Figure 4: LOLE Results – All Base and Sensitivity Cases
3.5 Contingency Plans
The Maritimes Area utilities’ forecast high and low load growth scenarios,
and their impact on the generation dispatch is continually being evaluated
to address load and resource uncertainties. In the event of a higher than
expected growth in load, a number of options would be considered. These
options include the purchases of capacity and/or energy, the advancement
of base load generation additions, and the installation of combustion
turbines.
3.6 Proposed Changes to Market Rules
On October 19, 2011 the New Brunswick government released its new
energy blueprint, a three year energy strategy aimed at reducing and
stabilizing energy prices, providing energy security, ensuring reliability of
the electrical system, environmental responsibility, and providing effective
regulation. The plan will amalgamate the NB Power group of companies
and the New Brunswick System Operator into a single vertically
integrated Crown utility as of October 1, 2013. This restructuring will
have no impact on the reliability of the Maritimes Area.

13
4.0 FORECAST RESOURCE CAPACITY MIX
4.1 Forecast Resource Capacity Mix
Table 9 and Figure 5 illustrate the forecast resource capacity mix for the
Maritimes Area. Appendix A, Section 1.2, Table A-2 presents a detailed
list of all capacity resources for the Maritimes Area.
Table 9: Forecast Capacity Resource Mix
Month
of
January
Oil Coal Hydro Nuclear Gas Wind Gas/Oil Tie
Benefits Biomass
% % % % % % % % %
2014 26 23 18 9 7 6 4 4 2
2015 25 23 18 9 7 7 4 4 2
2016 26 23 18 9 7 7 4 4 2
2017 26 23 18 9 7 7 4 4 2
2018 26 21 20 9 7 8 4 4 2
Figure 5: Forecast Capacity Resource Mix
0%
10%
20%
30%
40%
50%
60%
70%
80%
90%
100%
2014 2015 2016 2017 2018
Cap
acit
y M
ix
Year
Biomass
Tie Capacity
Gas/Oil
Wind (on pk)
Gas
Nuclear
Hydro
Coal
Oil

14
4.2 Reliability Impact of Resource Diversification Strategy
As can be seen from Table 9 and the associated Figure 5, the Maritimes
Area has a diversified mix of resources such that there is not a high degree
of reliance upon any one type or source of fuel. This resource
diversification also provides flexibility to respond to any future
environmental issues, such as potential restrictions to greenhouse gas
emissions.

15
APPENDIX A DESCRIPTION OF RESOURCE RELIABILITY
MODEL
16
DESCRIPTION OF RESOURCE RELIABILITY MODEL
1.0 Load Model
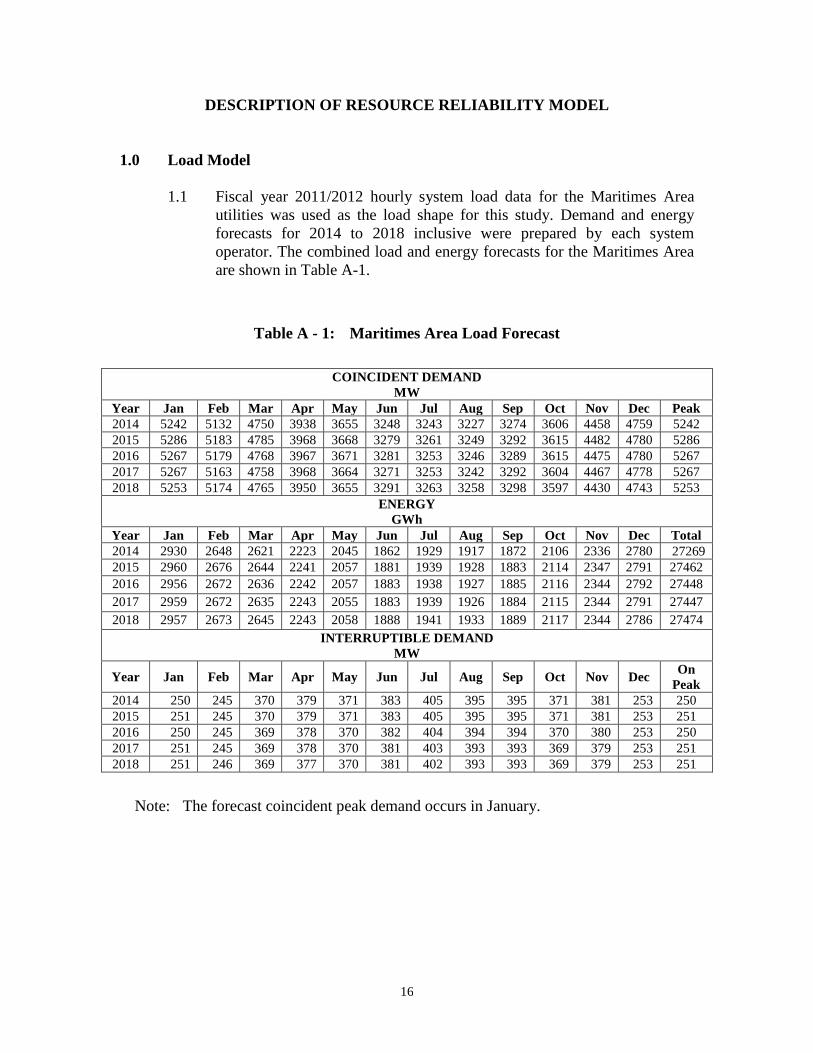
1.1 Fiscal year 2011/2012 hourly system load data for the Maritimes Area
utilities was used as the load shape for this study. Demand and energy
forecasts for 2014 to 2018 inclusive were prepared by each system
operator. The combined load and energy forecasts for the Maritimes Area
are shown in Table A-1.
Table A - 1: Maritimes Area Load Forecast
COINCIDENT DEMAND
MW Year Jan Feb Mar Apr May Jun Jul Aug Sep Oct Nov Dec Peak
2014 5242 5132 4750 3938 3655 3248 3243 3227 3274 3606 4458 4759 5242
2015 5286 5183 4785 3968 3668 3279 3261 3249 3292 3615 4482 4780 5286
2016 5267 5179 4768 3967 3671 3281 3253 3246 3289 3615 4475 4780 5267
2017 5267 5163 4758 3968 3664 3271 3253 3242 3292 3604 4467 4778 5267
2018 5253 5174 4765 3950 3655 3291 3263 3258 3298 3597 4430 4743 5253
ENERGY
GWh
Year Jan Feb Mar Apr May Jun Jul Aug Sep Oct Nov Dec Total
2014 2930 2648 2621 2223 2045 1862 1929 1917 1872 2106 2336 2780 27269
2015 2960 2676 2644 2241 2057 1881 1939 1928 1883 2114 2347 2791 27462
2016 2956 2672 2636 2242 2057 1883 1938 1927 1885 2116 2344 2792 27448
2017 2959 2672 2635 2243 2055 1883 1939 1926 1884 2115 2344 2791 27447
2018 2957 2673 2645 2243 2058 1888 1941 1933 1889 2117 2344 2786 27474
INTERRUPTIBLE DEMAND
MW
Year Jan Feb Mar Apr May Jun Jul Aug Sep Oct Nov Dec On
Peak
2014 250 245 370 379 371 383 405 395 395 371 381 253 250
2015 251 245 370 379 371 383 405 395 395 371 381 253 251
2016 250 245 369 378 370 382 404 394 394 370 380 253 250
2017 251 245 369 378 370 381 403 393 393 369 379 253 251
2018 251 246 369 377 370 381 402 393 393 369 379 253 251
Note: The forecast coincident peak demand occurs in January.

17
1.2 Load forecast uncertainty (LFU) was considered in the analysis as
described in Section 2.5 of the main report.
1.3 Some entities within the Maritimes Area supply a portion of their own
electricity demand and energy requirements. Only the portions that are
supplied by the Maritimes Area utilities were included in the area forecast.
1.4 The load forecast in Table A-1 includes the impact of DSM and efficiency
programs.
2.0 Generator Resource Representation
Generator data for the four members of the Maritimes Area are presented in Table
A-2. Table A-3 presents a summary of changes in resource data for the period
2014 – 2018 inclusive. The following sections document the tabulated data.
2.1 Generator Ratings
2.1.1 Definition
The generator capacity ratings represented in Table A-2 are the
Dependable Maximum Net Capability (DMNC) winter ratings.
These are evaluated periodically to establish each generator’s
sustained maximum net output over a two consecutive hour period.
2.1.2 Procedure for Verifying Ratings
Ratings of NB Power generators are tested annually, reaching a
minimum of 95% of their declared capabilities for at least 1 full
hour. This conforms to NPCC unit testing standard Directory #9
Verification of Generator Gross and Net Real Power Capability.
Nova Scotia Power, Inc. (NSPI) also reviews generator capability
ratings on an annual basis. The past year’s operating data is
examined and the rating is based on the average of the top one
percent of two hour generator outputs.

18
Table A - 2: Maritimes Area Resources
New Brunswick Resources Plant Unit Type Capacity MW Notes
Point Lepreau 1 Nuclear 660
Diesel 5
Belledune
2 Coal 467
Coleson Cove 1 Oil 324
2 Oil 324
3 Oil 324
Bayside
6 Natural Gas 290 Capacity (Combined Cycle Operation)
Grandview
1
2
Natural Gas
Natural Gas
45
45
Grand Manan
3
Diesel
29
Millbank 1 Diesel 99 Summer Capacity = 90 MW
2
3
4
Diesel
Diesel
Diesel
99
99
99
Summer Capacity = 90 MW
Summer Capacity = 90 MW
Summer Capacity = 90 MW
Ste Rose
1
Diesel
99
Summer Capacity = 90 MW
NUG Purchases
Biomass/Hydro
55
Mactaquac
1
Hydro
109
2 Hydro 109
3 Hydro 109
4 Hydro 115
5 Hydro 112
6 Hydro 112
Beechwood 1 Hydro 36
2 Hydro 36
3 Hydro 41
Grand Falls 1 Hydro 16
2 Hydro 16
3 Hydro 16
4 Hydro 16
Tobique 1 Hydro 10
2 Hydro 10
Sisson
1 Hydro 9
Milltown 1 Hydro 3
Nepisiguit Falls
1
Hydro
11
NB Wind All Wind 120 Expected on during peak out of 294 MW installed
Tie Benefits 300
TOTAL CAPACITY 4369 Total Capacity as of January 2014
19
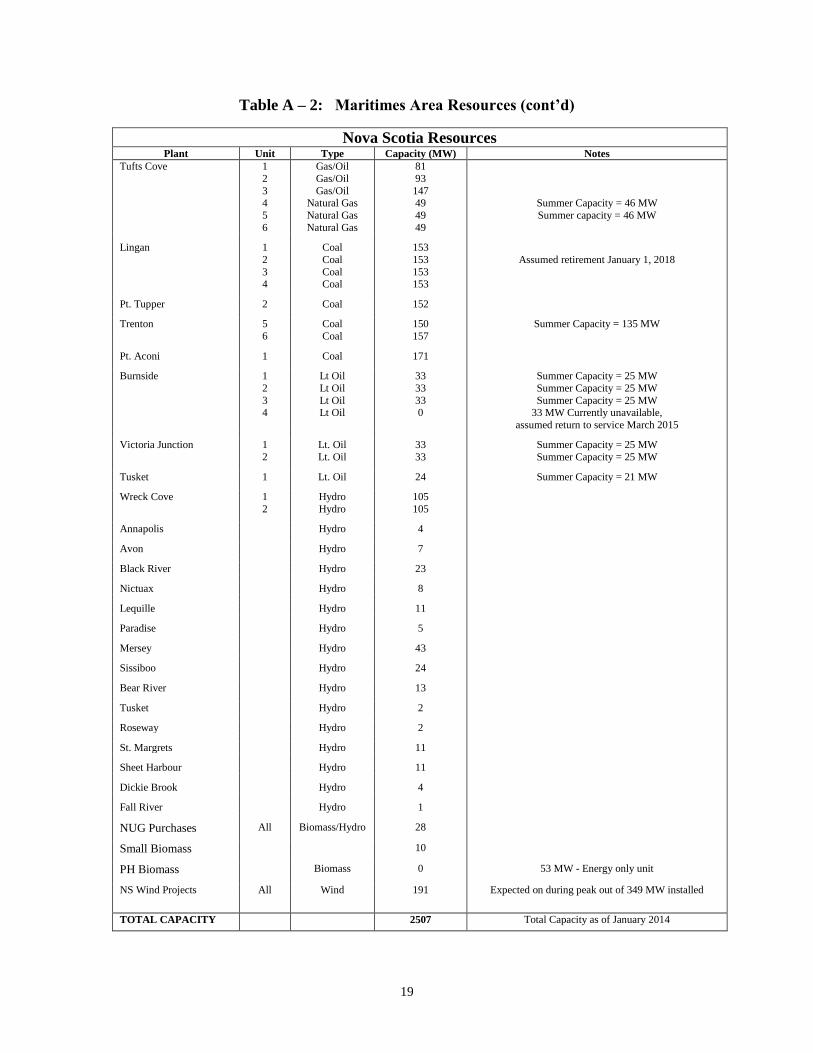
Table A – 2: Maritimes Area Resources (cont’d)
Nova Scotia Resources Plant Unit Type Capacity (MW) Notes
Tufts Cove 1
2
3 4
5
6
Gas/Oil
Gas/Oil
Gas/Oil Natural Gas
Natural Gas
Natural Gas
81
93
147 49
49
49
Summer Capacity = 46 MW
Summer capacity = 46 MW
Lingan
1
2
3 4
Coal
Coal
Coal Coal
153
153
153 153
Assumed retirement January 1, 2018
Pt. Tupper 2 Coal 152
Trenton
5
6
Coal
Coal
150
157
Summer Capacity = 135 MW
Pt. Aconi 1 Coal 171
Burnside
1
2
3 4
Lt Oil
Lt Oil
Lt Oil Lt Oil
33
33
33 0
Summer Capacity = 25 MW
Summer Capacity = 25 MW
Summer Capacity = 25 MW 33 MW Currently unavailable,
assumed return to service March 2015
Victoria Junction
1
2
Lt. Oil
Lt. Oil
33
33
Summer Capacity = 25 MW
Summer Capacity = 25 MW
Tusket 1 Lt. Oil 24 Summer Capacity = 21 MW
Wreck Cove
1
2
Hydro
Hydro
105
105
Annapolis Hydro 4
Avon Hydro 7
Black River Hydro 23
Nictuax Hydro 8
Lequille Hydro 11
Paradise Hydro 5
Mersey Hydro 43
Sissiboo Hydro 24
Bear River Hydro 13
Tusket Hydro 2
Roseway Hydro 2
St. Margrets Hydro 11
Sheet Harbour Hydro 11
Dickie Brook Hydro 4
Fall River Hydro 1
NUG Purchases All Biomass/Hydro 28
Small Biomass 10
PH Biomass Biomass 0 53 MW - Energy only unit
NS Wind Projects All Wind 191 Expected on during peak out of 349 MW installed
TOTAL CAPACITY 2507 Total Capacity as of January 2014

20
Table A – 2 Maritimes Area Resources (cont’d)
Prince Edward Island Resources Plant Unit Type Capacity
MW
Notes
Charlottetown
6
7
8
9
10
11
Oil
Oil
Oil
Oil
Oil
Diesel
5
7
10
19
19
49
Borden
1
2
Diesel
Diesel
15
25
Summer Capacity = 12 MW
Summer Capacity = 20 MW
Summerside Diesel Diesel 13 Owned by the City of Summerside
PEI Wind All Wind 103 Expected on during peak out of 204 MW installed
TOTAL CAPACITY 265 Total Capacity as of January 2014
Table A – 2 Maritimes Area Resources (cont’d)
Northern Maine Resources Plant Unit Type Capacity
MW
Notes
Tinker
Hydro
Diesel
35
1
Caribou Oil
Oil 22
Caribou
Diesel
Hydro
7
1
Boralex – Ashland (FF) Wood 33
Squa Pan
Hydro 1
EMEC 20
NMISA Wind All Wind 35 Expected on during peak out of 42 MW installed
TOTAL CAPACITY 133 Total Capacity as of January 2014

21
Table A - 3: Summary of Changes in Capacity
Year
January
Capacity
MW
December
Capacity
MW
Year
over
Year
Capacity
Change
MW
Explanation
-Total Capacities include tie benefits (MW)
-All wind capacity expected on peak (MW)
2014 7,307 7,380 +73 NS Wind (+73 MW on peak, +133 MW installed)
2015 7,380 7,390 +10 NS Wind (+10 MW on peak, +17 MW installed)
2016 7,390 7,403 +13 NS Wind (+13 MW on peak, +25 MW installed),
2017 7,403 7,417 +14 NS Wind (+14 MW on peak, +25 MW installed),
2018 7,417 7417 0 NS Lingan 2 retired -153 MW coal
Nfld. to NS purchase +153 MW hydro
2.2 Generator Unavailability Factors
2.2.1 Types of Unavailability Factors Represented
The types of unavailability factors represented in this reliability
assessment are forced outages and planned outages. Forced
outages include unplanned maintenance outages, deferrable forced
outages, starting failure outages and generator derating
adjustments. All except planned outages are included in the Forced
Outage Rates (FORs) presented in Table A-4. Planned outages are
scheduled manually for the reliability program based upon
projected maintenance schedules.
New Brunswick forced outage rates are calculated consistent with
the DAFOR (derating adjusted forced outage rate) calculation in
IEEE Standard 762-2006, Section 8.17.4.
NSPI uses the DAFOR (derating adjusted forced outage rate)
calculation for forced outage rates in IEEE Standard 762-2006,
Section 8.17.4. NSPI maintains a database of combustion turbine
and fossil generator reliability and performance data and is a
contributing utility to the Canadian Electricity Association
Equipment Reliability Information System (CEA-ERIS). The
CEA-ERIS also calculates DAFOR using the industry standard
definition as per IEEE 762-2006.
The forced outage rates for the smaller PEI and Northern Maine
systems are modeled using forced outage rates for generators of
similar size and fuel type in New Brunswick and Nova Scotia.
22
Most of the small diesel and oil fuelled generators in these systems
operate less than 100 hours per year, and statistics necessary for
calculating their DAFOR values are not available. The modeled
FOR values for generators in these systems are between 5 – 10 %.
2.2.2 Source of Unavailability Factors
Forced Outage Rates for existing generators are based on actual
outage data as well as on data of similar sized generators as
compiled by the Canadian Electricity Association (CEA).
FORs for new generators are based upon the utilities’ experience
with similar generators in conjunction with averages compiled by
the Canadian Electricity Association (CEA).
2.2.3 Maturity Considerations
Immature FORs were not used in this evaluation.
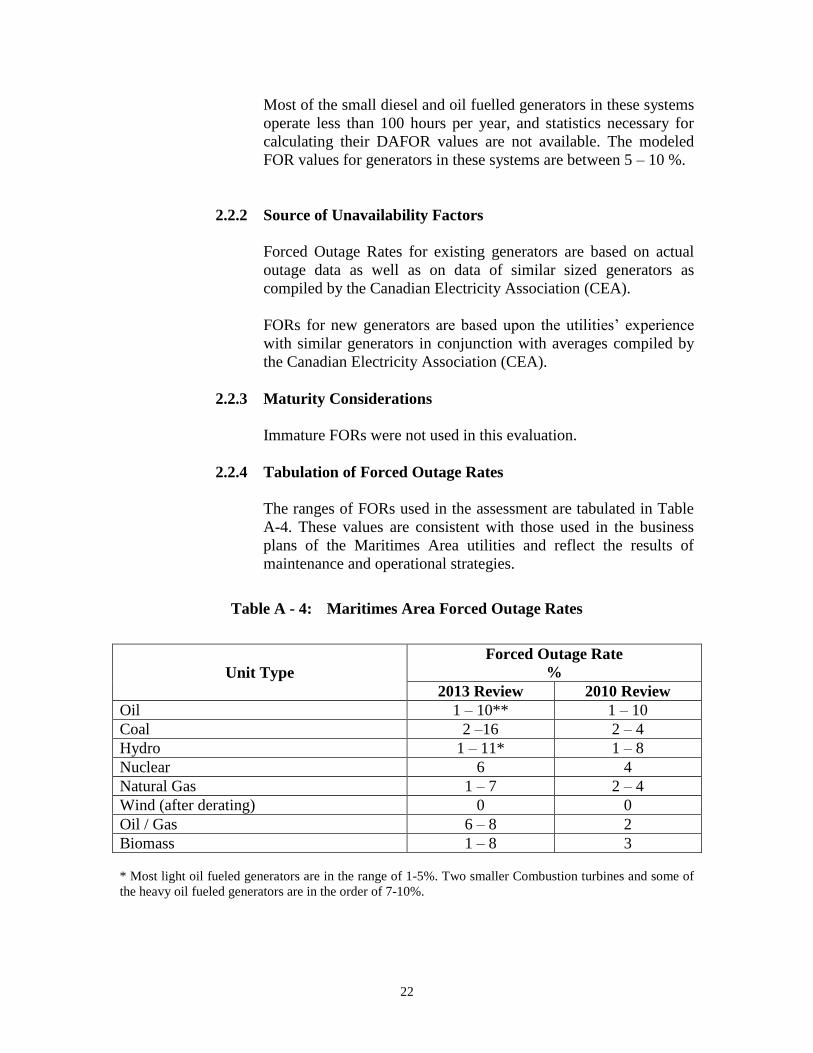
2.2.4 Tabulation of Forced Outage Rates
The ranges of FORs used in the assessment are tabulated in Table
A-4. These values are consistent with those used in the business
plans of the Maritimes Area utilities and reflect the results of
maintenance and operational strategies.
Table A - 4: Maritimes Area Forced Outage Rates
Unit Type
Forced Outage Rate
%
2013 Review 2010 Review
Oil 1 – 10** 1 – 10
Coal 2 –16 2 – 4
Hydro 1 – 11* 1 – 8
Nuclear 6 4
Natural Gas 1 – 7 2 – 4
Wind (after derating) 0 0
Oil / Gas 6 – 8
2
Biomass 1 – 8 3
* Most light oil fueled generators are in the range of 1-5%. Two smaller Combustion turbines and some of
the heavy oil fueled generators are in the order of 7-10%.

23
** One hydro plant (the 4 generator - 64MW Grand Falls plant in NB) had a forced outage rate as high as
11%. Its power house was flooded during an extreme weather event in 2011. All other hydo generators had
forced outage rates of 1%.
2.3 Purchase and Sale Representation
Purchases and sales are represented as an adjustment to the capacity or
load as appropriate.
2.4 Retirements
Retirements were considered by removing the generators from the model
at their retirement date. The only known retirement scheduled during the
2014 to 2018 period of this review is the January 1, 2018 retirement of the
Lingan 2 unit in Nova Scotia.
3.0 Representation of Interconnected Systems
Since 2011, NBSO has assumed 300 MW of tie benefits to New Brunswick in its
resource adequacy assessments. These tie benefits are based on a 2011 decision
by the New Brunswick Market Advisory Committee to recognize the lowest
historical Firm Transmission Capacity posted from summer peaking New England
to winter peaking New Brunswick since the commissioning of the second 345 kV
tie between these systems in December 2007. To the extent that future capacity
purchases from New England to New Brunswick occur across this interface, these
tie benefits will be reduced accordingly. Tie benefits from other neighbouring
jurisdictions were not considered by the New Brunswick Market Advisory
Committee because they also experience peak loads in winter.
In the CP-8 report Review of Interconnection Assistance Reliability Benefits (June
1, 2011) the range of estimated annual tie benefit potential for the Maritimes Area
for 2011 was 1076 – 1353 MW and 1,252 and 1,536 MW in the year 2015. Based
on this study, the 300 MW of tie benefits assumed for this 2013 Comprehensive
Review is conservative.
4.0 Modeling of Variable and Limited Energy Sources
Wind resources are modeled as simulated hourly values that are netted out against
the hourly loads. The hourly wind shapes are based upon historical hourly wind
generation values for the 2011-2012 fiscal year. New wind capacity forecast for a
Maritimes Area jurisdiction is modeled by scaling the historical wind generation
in that jurisdiction.
Under normal operating conditions, the hydro system is operated considerably
below its DMNC rating due to economics. However, if required to maintain
customer load, it would be operating at full capacity by utilizing the headponds
and other existing storage reservoirs. This is one of the options documented in the

24
Emergency Operating Procedures (Section 2.2 of the main report). Therefore, in
the evaluation, hydro generators are considered available for all hours during
which the generator is not on forced outage or maintenance. There are no seasonal
adjustments to the DMNC ratings of the hydro generators.
5.0 Modeling of Demand Side Management
The expected monthly demand and energy reduction due to Demand Side
Management programs for each System Operator is included in their respective
forecasts and in the combined Maritimes Area forecast in Table A-1.
6.0 Modeling of Non-Utility Generation
Small non-utility generators are aggregated into single units with operating
characteristics and FORs equivalent to other Maritimes Area generators of similar
size. These are tabulated in Table A-2 and are identified by type NUG. Larger
non-utility generators, such as Bayside 6, are shown separately because their size
is comparable to the larger utility generators on the system.
7.0 Other Assumptions
The study assumed that there would be no generator slippages or deratings due to
environmental constraints within the five-year timeframe of this review. Current
emission limits are specified as annual system volumes rather than generator
specific volumes, providing flexibility in the operation of the fleet.
Future regulations limiting greenhouse gas emissions and air pollutants are expected
for the 2020-2030 timeframe and could restrict the future utilization of fossil fuelled
generation. System Operators in the Maritimes Area will be tracking such standards
as they are implemented and may conduct analyses in the future regarding their
impact on resource adequacy.

25
APPENDIX B DESCRIPTION OF RELIABILITY PROGRAM

26
DESCRIPTION OF RELIABILITY PROGRAM
The program used for this assessment, LOLP, was originally developed at NB Power in
1984 to complete the Triennial Review of Resource Adequacy. Since that time the
program has been improved, and its capabilities expanded, with the most recent
modifications being completed during summer 2013.
The original program was a single area program that performed the classical LOLP
analysis based upon the weekday peak hour load, as well as an LOLH and EENS analysis
which is based upon all of the hourly loads. The results of the program were
benchmarked against the results of the IEEE reliability test system, as well as against the
results of the PICES program used by NSPI for the 1991 Triennial Review. The program
was further benchmarked by evaluating its results against those documented in the 1992
CIGRE Task Force 38-03-10 report “Composite Power System Reliability Analysis
Application to the New Brunswick Power Corporation System"”. In all cases, excellent
agreement of results was observed.
In the fall of 2007, modifications to the original program allowed it to perform a Monte
Carlo analysis of a multi-area system with intra-area tie limits. This Monte Carlo
simulation was written using MATLAB® software for programming and random number
generation, and it performs as follows:
For each daily coincident peak load, generation is simulated in each jurisdiction
of the Maritimes. In the case of wind generation, hourly wind generation
generation projections for the time of the Area coincident peak are netted against
the loads. This simulation uses random numbers against a generator’s Forced
Outage Rate to determine the status of each generator. Planned generator
maintenance is also enforced.
Generation surpluses or deficits are determined for each intra-area jurisdiction.
Because each jurisdiction other than New Brunswick (NB) is only connected to
NB, these surpluses and deficits can be transferred to New Brunswick.
Surpluses transferred to NB from another intra-area jurisdiction are limited by the
export limit of the jurisdiction.
Deficits in an intra-area jurisdiction other than NB that exceed the import
capability from NB results in a loss of load event. Otherwise, the deficit is
transferred to NB.
With all transfer-limited intra-area surpluses and deficits transferred to NB, it is
determined whether or not the simulated generation in NB plus transferred
surpluses is adequate to supply both the NB load and any transferred deficits. If
not, then a loss of load event occurs.
The Monte Carlo simulation is performed for each daily peak hour of the year,
and the yearly simulation is repeated 100,000 times to calculate the average
LOLE in days/year.
The base load shape for the program is system hourly net loads for each jurisdiction
comprising the Area. Monthly load shapes for the individual jurisdictions are created by
scaling the hourly loads to match the load forecast values of both demand and energy.

27
This method preserves the effects of load chronology as well as load coincidence
between the jurisdictions. This method is also identical between the new program and the
old program. A separate monthly load shape comprising only the peak load of each day is
created for the LOLE analysis.