Embed Size (px)
Citation preview
Ranking NZ river values – application of the River Values Assessment System (RiVAS)
Ken Hughey and Mary-Anne Baker2010
1
Acknowledgements
A big thanks to: • FRST, for funding the Envirolink Project
that led to development of this system;• The multiple participants who have worked
together, and ‘separately’ on system development.
2

The challenge• Need a ‘prioritisation’ tool now, for multiple
statutory and non statutory purposes.• A tool that works regionally but also has national
level application potential.• A tool that will work with the best available
information.• A tool that is user friendly.• A tool that, when applied, provides defensible
(e.g., Environment Court) results.
3
The approach• In late 2008 we established a project steering group.
• Initiated literature review. Some work, e.g., kayaking (but 20+ yrs ago); the Waters of National Importance project, but of limited value.
• No one had developed a system to look objectively/ quantitatively or in a standardised, user friendly way across a range of values.
• We developed a methodology, the River Values Assessment System (RiVAS).
• RiVAS applied to range of values at selected councils …
4
The values tested
• Salmonids – Tasman: done; subsequently, Marlborough; Hawkes Bay: in press
• Irrigation – Canterbury; Tasman: done
• Native Birdlife – Canterbury; Tasman: done
• Native fish – Wellington and Tasman: in progress
• Iwi – Southland: done
• Natural character – Marlborough; Tasman: done
• Swimming – Manawatu-Whanganui; Tasman: done
• Kayaking – West Coast; Tasman: done; subsequently, Hawkes Bay: in press
• Hydro – Bay of Plenty; Tasman: in progress
5
The method – multi-criteria driven, standardised numeric scale, and expert panel based approach• Very few ‘values’ have full or up-to-date, comparable or
quantitative, data, either nationally or regionally – notable exception is F&G NZ’s salmonid angling surveys.
• No contemporary data for some values, e.g., swimming or natural character, while others are mixed, e.g., native birdlife.
• Used the best available information - filled the gaps with expert judgement: there is no other way!
• Method built around key attributes of river values, populating where possible with real data, and then converting this information to numeric scales for ranking values = this is known as multi criteria analysis.
• Ultimately this led to us using expert panels and best available information as the cornerstones of the project.
6
Using the Best Available Information
• Mandated in Fisheries Act 1996 under the Information Principles (S10)
• Supported by numerous Environment Court decisions
• Bottom line: cannot wait forever for the collection of perfect data so we use the Best Available Information, in a precautionary way
• We are absolutely explicit about the data we use – nothing is hidden

Why we use Expert panels
• The most appropriate people to find, populate and interpret the Best Available Information are experts in the various values
• Experts are also best placed for identifying the attributes, indicators and importance thresholds of the values
• The choice and credibility of experts is vital – a credible panel tends to act cautiously because its members, by definition, have to remain credible
• An independent facilitator can keep experts ‘honest’• Independent peer reviewers are also an important
moderating influence
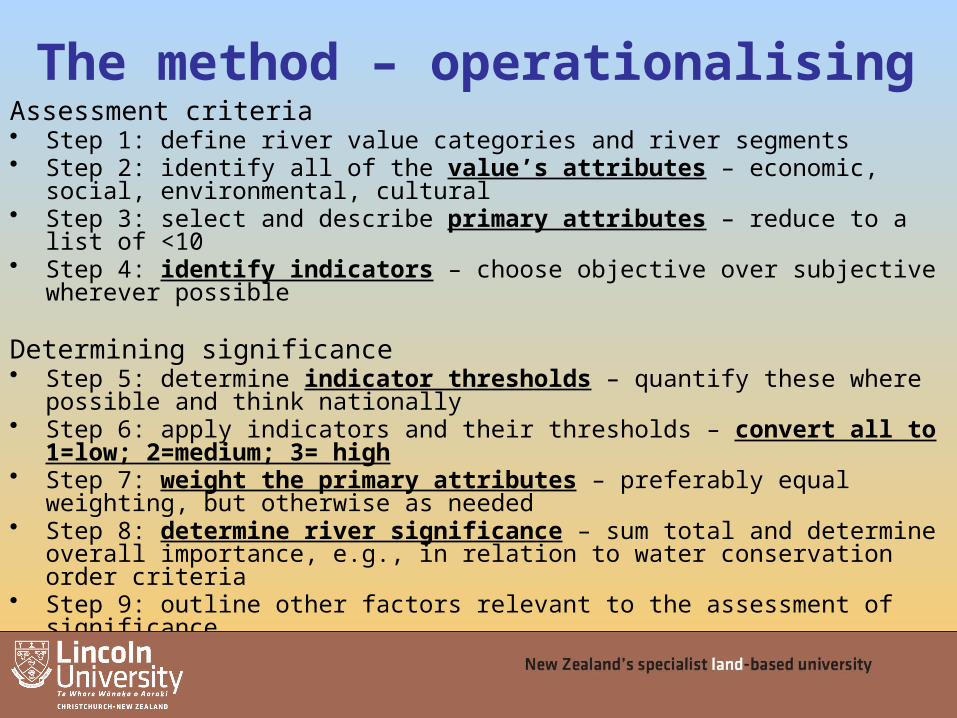
The method – operationalisingAssessment criteria • Step 1: define river value categories and river segments• Step 2: identify all of the value’s attributes – economic, social, environmental, cultural• Step 3: select and describe primary attributes – reduce to a list of <10• Step 4: identify indicators – choose objective over subjective wherever possible
Determining significance• Step 5: determine indicator thresholds – quantify these where possible and think nationally• Step 6: apply indicators and their thresholds – convert all to 1=low; 2=medium; 3= high• Step 7: weight the primary attributes – preferably equal weighting, but otherwise as needed• Step 8: determine river significance – sum total and determine overall importance, e.g., in
relation to water conservation order criteria• Step 9: outline other factors relevant to the assessment of significance
Method review• Step 10: review assessment process and identify future information needs, e.g., survey needs
9
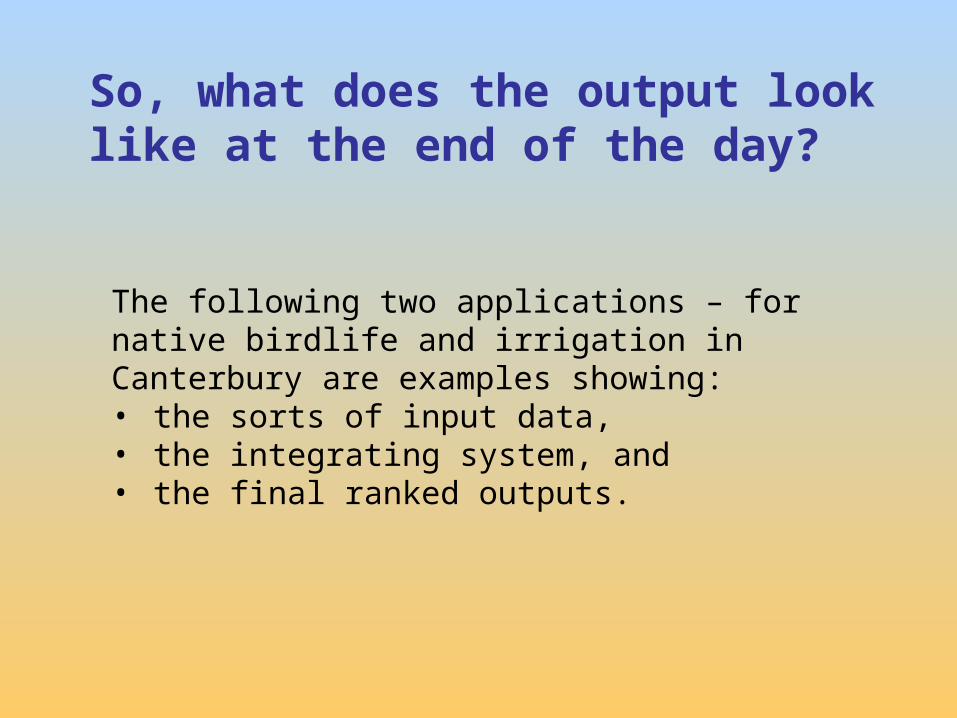
So, what does the output look like at the end of the day?
The following two applications – for native birdlife and irrigation in Canterbury are examples showing:• the sorts of input data, • the integrating system, and • the final ranked outputs.
Demonstration 1: Birdlife - Canterbury
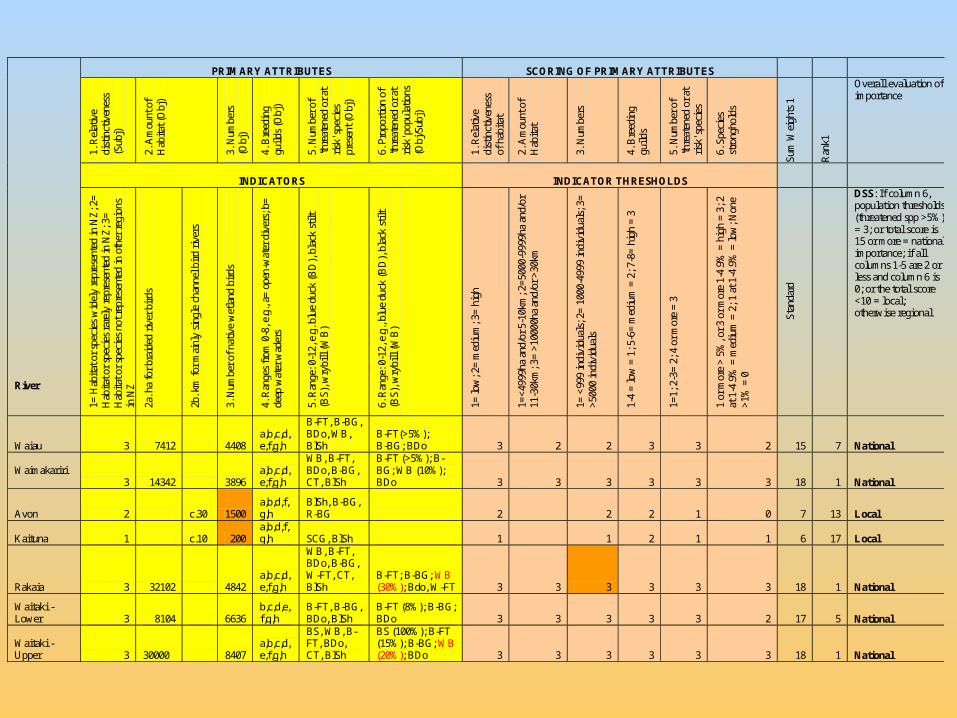
River
PRIMARY ATTRIBUTES SCORING OF PRIMARY ATTRIBUTES
1. R
elat
ive
dist
inct
iven
ess
(Sub
j)
2. A
mou
nt o
f H
abita
t (O
bj)
3. N
umbe
rs
(Obj
)
4. B
reed
ing
guil
ds (
Obj
)
5. N
umbe
r of
'th
reat
ened
or
at
risk
' spe
cies
pr
esen
t (O
bj)
6. P
ropo
rtio
n of
'th
reat
ened
or
at
risk
' pop
ulat
ions
(O
bj/S
ubj)
1. R
elat
ive
dist
inct
iven
ess
of h
abit
at
2. A
mou
nt o
f H
abita
t
3. N
umbe
rs
4. B
reed
ing
guil
ds
5. N
umbe
r of
'th
reat
ened
or
at
risk
' spe
cies
6. S
peci
es
stro
ngho
lds
Sum
Wei
ghts
1
Ran
k1
Overall evaluation of importance
INDICATORS
INDICATOR THRESHOLDS
1= H
abit
at o
r sp
ecie
s w
idel
y re
pres
ente
d in
NZ
; 2=
H
abita
t or
spec
ies
rare
ly r
epre
sent
ed in
NZ
; 3=
H
abita
t or
spec
ies
not r
epre
sent
ed in
oth
er r
egio
ns
in N
Z
2a. h
a fo
r br
aide
d ri
ver
bird
s
2b. k
m f
or m
ainl
y si
ngle
cha
nnel
bir
d ri
vers
3. N
umbe
r of
nat
ive
wet
land
bir
ds
4. R
ange
s fr
om 0
-8, e
.g.,
a= o
pen-
wat
er d
iver
s; b
=
deep
wat
er w
ader
s
5. R
ange
: 0-1
2, e
.g. b
lue
duck
(B
D),
bla
ck s
tilt
(B
S),
wry
bill
(W
B)
6. R
ange
: 0-1
2, e
.g.,
blue
duc
k (B
D),
bla
ck s
tilt
(B
S),
wry
bill
(W
B)
1= lo
w; 2
= m
ediu
m; 3
= h
igh
1=<
4999
ha a
nd/o
r 5-
10km
; 2=
5000
-999
9ha
and/
or
11-3
0km
; 3=
>10
000h
a an
d/or
>30
km
1= <
999
indi
vidu
als;
2=
100
0-49
99 in
divi
dual
s; 3
=
>50
00 in
divi
dual
s
1-4
= lo
w =
1; 5
-6=
med
ium
= 2
; 7-8
= h
igh
= 3
1=1;
2-3
= 2
; 4 o
r m
ore
= 3
1 or
mor
e >
5%
, or
3 or
mor
e 1-
4.9%
= h
igh
= 3
; 2
at 1
-4.9
% =
med
ium
= 2
; 1 a
t 1-4
.9%
= lo
w; N
one
>1%
= 0
Sta
ndar
d
DSS: If column 6, population thresholds (threatened spp >5%) = 3; or total score is 15 or more = national importance; if all columns 1-5 are 2 or less and column 6 is 0; or the total score <10 = local; otherwise regional
Waiau 3 7412 4408 a,b,c,d,e,f,g,h
B-FT, B-BG, BDo, WB, BlSh
B-FT(>5%); B-BG; BDo 3 2 2 3 3 2 15 7 National
Waimakariri 3 14342 3896
a,b,c,d,e,f,g,h
WB, B-FT, BDo, B-BG, CT, BlSh
B-FT (>5%); B-BG; WB (10%); BDo 3 3 3 3 3 3 18 1 National
Avon 2 c.30 1500 a,b,d,f,g,h
BlSh, B-BG, R-BG 2 2 2 1 0 7 13 Local
Kaituna 1 c.10 200 a,b,d,f,g,h SCG, BlSh 1 1 2 1 1 6 17 Local
Rakaia 3 32102 4842 a,b,c,d,e,f,g,h
WB, B-FT, BDo, B-BG, W-FT, CT, BlSh
B-FT; B-BG; WB (30%); Bdo, W-FT 3 3 3 3 3 3 18 1 National
Waitaki - Lower 3 8104 6636
b,c,d,e,f,g,h
B-FT, B-BG, BDo, BlSh
B-FT (8%); B-BG; BDo 3 3 3 3 3 2 17 5 National
Waitaki - Upper 3 30000 8407
a,b,c,d,e,f,g,h
BS, WB, B-FT, BDo, CT, BlSh
BS (100%); B-FT (15%); B-BG; WB (20%); BDo 3 3 3 3 3 3 18 1 National
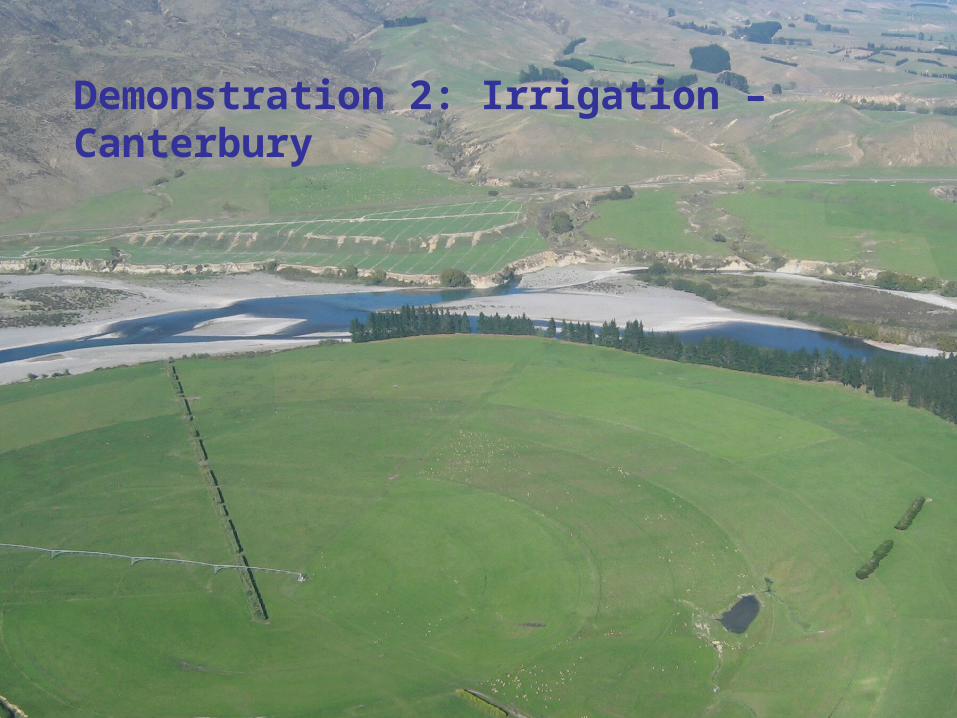
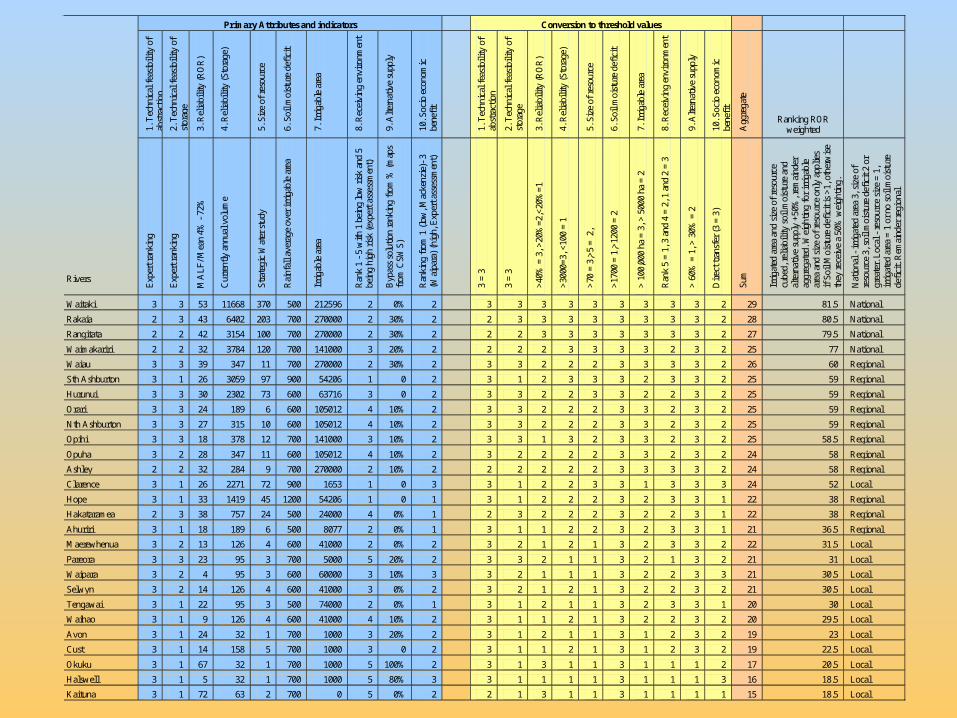
Demonstration 2: Irrigation – Canterbury
Rivers
Primary Attributes and indicators Conversion to threshold values
1. T
echn
ical
fea
sibi
lity
of
abst
ract
ion
2. T
echn
ical
fea
sibi
lity
of
stor
age
3. R
elia
bilit
y (R
OR
)
4. R
elia
bilit
y (S
tora
ge)
5. S
ize
of r
esou
rce
6. S
oil m
oist
ure
defi
cit
7. I
rrig
able
are
a
8. R
ecei
ving
env
iron
men
t
9. A
ltern
ativ
e su
pply
10. S
ocio
eco
nom
ic
bene
fit
Agg
rega
te
Ranking ROR weighted
Exp
ert r
anki
ng
Exp
ert r
anki
ng
MA
LF/
Mea
n 4%
- 7
2%
Cur
rent
ly a
nnua
l vol
ume
Stra
tegi
c W
ater
stu
dy
Rai
nfal
l ave
rage
ove
r ir
riga
ble
area
Irri
gabl
e ar
ea
Ran
k 1
- 5
with
1 b
eing
low
ris
k an
d 5
bein
g hi
gh r
isk
(exp
ert a
sses
smen
t)
Byp
ass
solu
tion
rank
ing
from
% (
map
s fr
om C
SWS)
Ran
king
fro
m 1
(lo
w, M
acke
nzie
)- 3
(W
aipa
ra)
(hig
h, E
xper
t ass
essm
ent)
3 =
3
3 =
3
>40
% =
3, >
20%
=2,<
20%
=1
>30
00=3
, <10
0 =
1
>70
= 3
,>5
= 2
,
>17
00 =
1,>
1200
= 2
> 1
00,0
00 h
a =
3, >
500
0 ha
= 2
Ran
k 5
= 1
, 3 a
nd 4
= 2
, 1 a
nd 2
= 3
> 6
0% =
1, >
30%
= 2
Dir
ect t
rans
fer
(3 =
3)
Sum
Irri
gate
d ar
ea a
nd s
ize
of r
esou
rce
cube
d, r
elia
bilit
y so
il m
oist
ure
and
alte
rnat
ive
supp
ly +
50%
, rem
aind
er
aggr
egat
ed. W
eigh
ting
for
irri
gabl
e ar
ea a
nd s
ize
of r
esou
rce
only
app
lies
if S
oil M
oist
ure
defi
cit i
s >1
, oth
erw
ise
they
rec
eive
a 5
0% w
eigh
ting.
Nat
iona
l - ir
riga
ted
area
3, s
ize
of
reso
urce
3, s
oil m
oist
ure
defi
cit 2
or
grea
ter.
Loc
al -
res
ourc
e si
ze =
1,
irri
gate
d ar
ea =
1 o
r no
soi
l moi
stur
e de
fici
t. R
emai
nder
reg
iona
l
Waitaki 3 3 53 11668 370 500 212596 2 0% 2 3 3 3 3 3 3 3 3 3 2 29 81.5 National
Rakaia 2 3 43 6402 203 700 270000 2 30% 2 2 3 3 3 3 3 3 3 3 2 28 80.5 National
Rangitata 2 2 42 3154 100 700 270000 2 30% 2 2 2 3 3 3 3 3 3 3 2 27 79.5 National
Waimakariri 2 2 32 3784 120 700 141000 3 20% 2 2 2 2 3 3 3 3 2 3 2 25 77 National
Waiau 3 3 39 347 11 700 270000 2 30% 2 3 3 2 2 2 3 3 3 3 2 26 60 Regional
Sth Ashburton 3 1 26 3059 97 900 54206 1 0 2 3 1 2 3 3 3 2 3 3 2 25 59 Regional
Hurunui 3 3 30 2302 73 600 63716 3 0 2 3 3 2 2 3 3 2 2 3 2 25 59 Regional
Orari 3 3 24 189 6 600 105012 4 10% 2 3 3 2 2 2 3 3 2 3 2 25 59 Regional
Nth Ashburton 3 3 27 315 10 600 105012 4 10% 2 3 3 2 2 2 3 3 2 3 2 25 59 Regional
Opihi 3 3 18 378 12 700 141000 3 10% 2 3 3 1 3 2 3 3 2 3 2 25 58.5 Regional
Opuha 3 2 28 347 11 600 105012 4 10% 2 3 2 2 2 2 3 3 2 3 2 24 58 Regional
Ashley 2 2 32 284 9 700 270000 2 10% 2 2 2 2 2 2 3 3 3 3 2 24 58 Regional
Clarence 3 1 26 2271 72 900 1653 1 0 3 3 1 2 2 3 3 1 3 3 3 24 52 Local
Hope 3 1 33 1419 45 1200 54206 1 0 1 3 1 2 2 2 3 2 3 3 1 22 38 Regional
Hakataramea 2 3 38 757 24 500 24000 4 0% 1 2 3 2 2 2 3 2 2 3 1 22 38 Regional
Ahuriri 3 1 18 189 6 500 8077 2 0% 1 3 1 1 2 2 3 2 3 3 1 21 36.5 Regional
Maerewhenua 3 2 13 126 4 600 41000 2 0% 2 3 2 1 2 1 3 2 3 3 2 22 31.5 Local
Pareora 3 3 23 95 3 700 5000 5 20% 2 3 3 2 1 1 3 2 1 3 2 21 31 Local
Waipara 3 2 4 95 3 600 60000 3 10% 3 3 2 1 1 1 3 2 2 3 3 21 30.5 Local
Selwyn 3 2 14 126 4 600 41000 3 0% 2 3 2 1 2 1 3 2 2 3 2 21 30.5 Local
Tengawai 3 1 22 95 3 500 74000 2 0% 1 3 1 2 1 1 3 2 3 3 1 20 30 Local
Waihao 3 1 9 126 4 600 41000 4 10% 2 3 1 1 2 1 3 2 2 3 2 20 29.5 Local
Avon 3 1 24 32 1 700 1000 3 20% 2 3 1 2 1 1 3 1 2 3 2 19 23 Local
Cust 3 1 14 158 5 700 1000 3 0 2 3 1 1 2 1 3 1 2 3 2 19 22.5 Local
Okuku 3 1 67 32 1 700 1000 5 100% 2 3 1 3 1 1 3 1 1 1 2 17 20.5 Local
Halswell 3 1 5 32 1 700 1000 5 80% 3 3 1 1 1 1 3 1 1 1 3 16 18.5 Local
Kaituna 3 1 72 63 2 700 0 5 0% 2 2 1 3 1 1 3 1 1 1 1 15 18.5 Local
Some of the lessons/questions to date• Expert panel selection sometimes challenging –
ultimately, credibility extremely important and willingness and ability to work within a collaborative.
• People sometimes sceptical/hesitant until they have worked through the process – ‘working through’ removes this concern, mostly.
• Need a preliminary scan to reduce the size of the task, i.e., based on the best available information remove rivers of no importance for this value.
15
Resource requirements• A ‘champion’ needed within council, and probably an
external consultant to run the project(s);• A credible multi stakeholder group must be established;• For some values, e.g., tangata whenua, considerable time is
needed for consultation and resource gathering;• Cost varies greatly – for first time national level
development of attributes etc then cost is greater than subsequent regional level applications (for latter: estimate of $3-6,000 per value application).
• Guidelines & reports available in the Hughey and Baker (2011) LEAP report 24 published by Lincoln University.
16


![Kathryn Hughey, MA, LPCC · 3/11/2020 · Kathryn Hughey, MA, LPCC Consent for Counseling and Mandatory Disclosure Statement Degrees and credentials: ... ce }f P ]ac Rgh X I dead](https://img.dokumen.tips/doc/110x75/5fa605ff21f0c9587b5c9758/kathryn-hughey-ma-lpcc-3112020-kathryn-hughey-ma-lpcc-consent-for-counseling.jpg)