Embed Size (px)
DESCRIPTION
A reliable, transparent & authentic ranking system is being implemented in the country for Higher Education by Govt of India.The primary purpose of this framework is to galvanize Indian institutions towardsa competitive environment that exists in the world today.
Citation preview

A Methodology for Ranking of
Engineering Institutions in India
Department of Higher EducationMinistry of Human Resource Development
Government of India2015

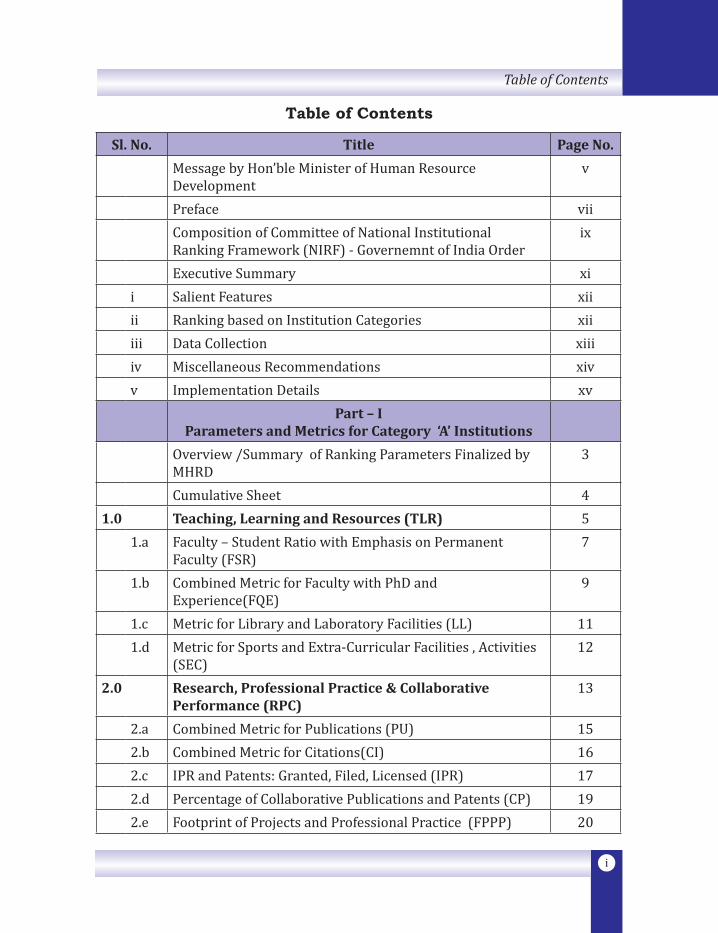
Table of Contents
Sl. No. Title Page No.
Message by Hon’ble Minister of Human Resource Development
v
Preface viiComposition of Committee of National Institutional Ranking Framework (NIRF) - Governemnt of India Order
ix
Executive Summary xii Salient Features xiiii Ranking based on Institution Categories xiiiii Data Collection xiiiiv Miscellaneous Recommendations xivv Implementation Details xv
Part – I Parameters and Metrics for Category ‘A’ Institutions
Overview /Summary of Ranking Parameters Finalized by MHRD
3
Cumulative Sheet 41.0 Teaching, Learning and Resources (TLR) 5
1.a Faculty – Student Ratio with Emphasis on Permanent Faculty (FSR)
7
1.b Combined Metric for Faculty with PhD and Experience(FQE)
9
1.c Metric for Library and Laboratory Facilities (LL) 111.d Metric for Sports and Extra-Curricular Facilities , Activities
(SEC)12
2.0 Research, Professional Practice & Collaborative Performance (RPC)
13
2.a Combined Metric for Publications (PU) 152.b Combined Metric for Citations(CI) 162.c IPR and Patents: Granted, Filed, Licensed (IPR) 172.d Percentage of Collaborative Publications and Patents (CP) 192.e Footprint of Projects and Professional Practice (FPPP) 20
i
Table of Contents
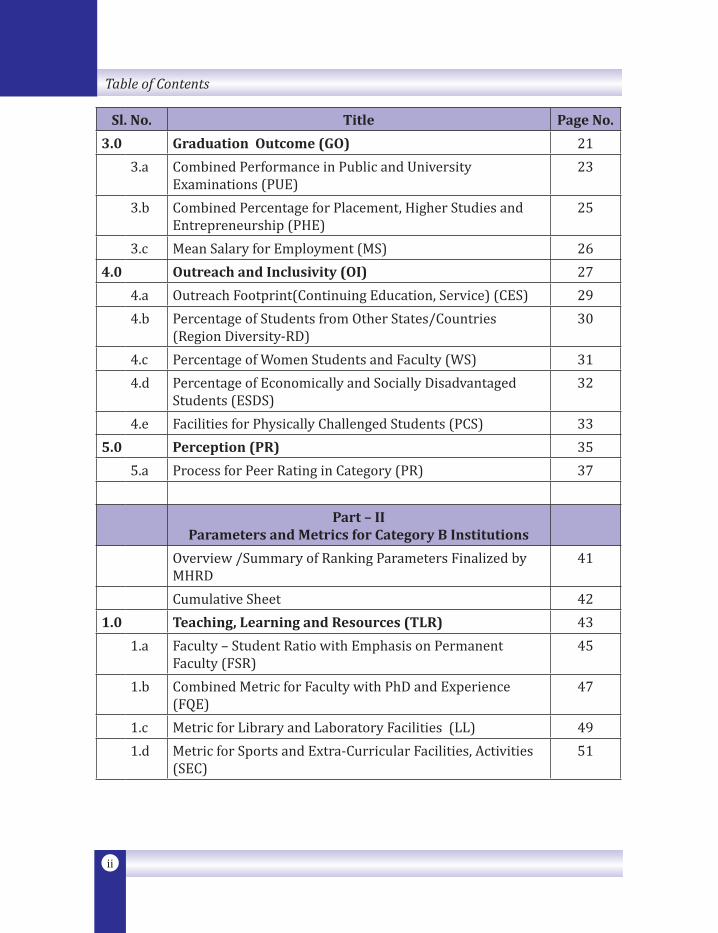
Sl. No. Title Page No.
3.0 Graduation Outcome (GO) 213.a Combined Performance in Public and University
Examinations (PUE)23
3.b Combined Percentage for Placement, Higher Studies and Entrepreneurship (PHE)
25
3.c Mean Salary for Employment (MS) 264.0 Outreach and Inclusivity (OI) 27
4.a Outreach Footprint(Continuing Education, Service) (CES) 294.b Percentage of Students from Other States/Countries
(Region Diversity-RD)30
4.c Percentage of Women Students and Faculty (WS) 314.d Percentage of Economically and Socially Disadvantaged
Students (ESDS)32
4.e Facilities for Physically Challenged Students (PCS) 335.0 Perception (PR) 35
5.a Process for Peer Rating in Category (PR) 37
Part – II Parameters and Metrics for Category B Institutions
Overview /Summary of Ranking Parameters Finalized by MHRD
41
Cumulative Sheet 421.0 Teaching, Learning and Resources (TLR) 43
1.a Faculty – Student Ratio with Emphasis on Permanent Faculty (FSR)
45
1.b Combined Metric for Faculty with PhD and Experience (FQE)
47
1.c Metric for Library and Laboratory Facilities (LL) 491.d Metric for Sports and Extra-Curricular Facilities, Activities
(SEC)51
ii
Table of Contents
Sl. No. Title Page No.
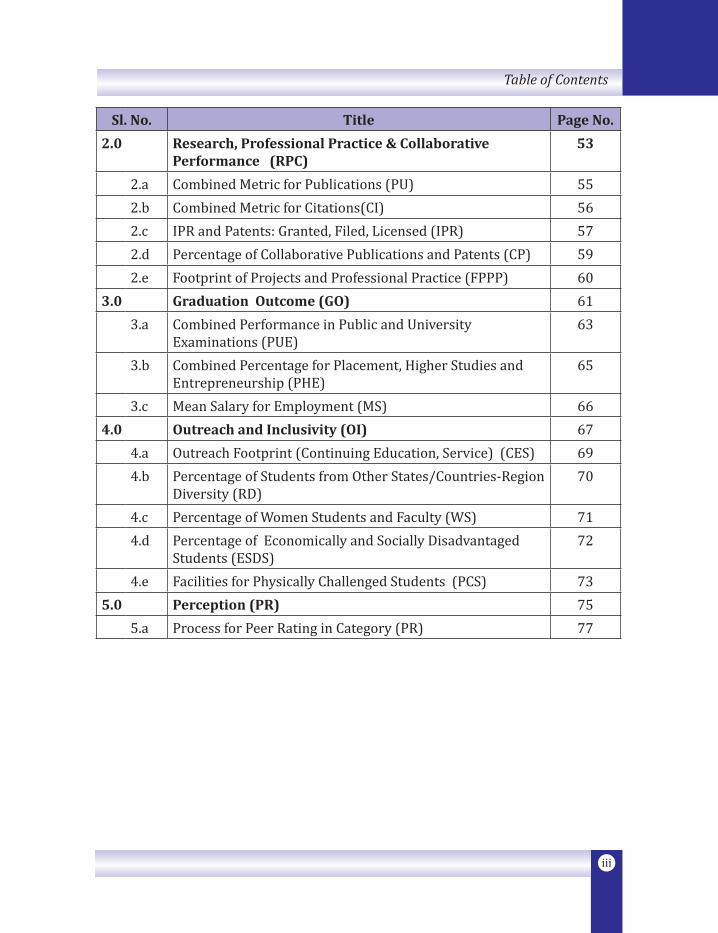
2.0 Research, Professional Practice & Collaborative Performance (RPC)
53
2.a Combined Metric for Publications (PU) 552.b Combined Metric for Citations(CI) 562.c IPR and Patents: Granted, Filed, Licensed (IPR) 572.d Percentage of Collaborative Publications and Patents (CP) 592.e Footprint of Projects and Professional Practice (FPPP) 60
3.0 Graduation Outcome (GO) 613.a Combined Performance in Public and University
Examinations (PUE) 63
3.b Combined Percentage for Placement, Higher Studies and Entrepreneurship (PHE)
65
3.c Mean Salary for Employment (MS) 664.0 Outreach and Inclusivity (OI) 67
4.a Outreach Footprint (Continuing Education, Service) (CES) 694.b Percentage of Students from Other States/Countries-Region
Diversity (RD) 70
4.c Percentage of Women Students and Faculty (WS) 714.d Percentage of Economically and Socially Disadvantaged
Students (ESDS)72
4.e Facilities for Physically Challenged Students (PCS) 735.0 Perception (PR) 75
5.a Process for Peer Rating in Category (PR) 77
iii
Table of Contents


v
Message
I am very pleased to launch the Ranking System Framework for Higher Educational Institutions of India. This is the first time that a reliable, transparent and authentic ranking system is being implemented in the country for Higher Education.
The primary purpose of this framework is to galvanize Indian institutions towards a competitive environment that exists in the world today. Clear definition and identification of key parameters can help institutions to work sincerely towards improving their ranking. These parameters are strong pointers of quality of scholarship of the faculty & students and the student-caring culture of the institutions. There is also a strong message in the chosen parameters, which is particularly relevant to the education scenario in our country.
I sincerely hope that institutions will use this ranking framework to introspect and make sincere efforts to improve their standing, which will be beneficial for the country. Ranking and Accreditation are two important tools for a movement towards quality, and I am happy that we are taking this strong step in the direction of a transparent and clearly defined ranking framework.
The Ranking framework will empower a larger number of Indian Institutions to participate in the global rankings, and create a significant impact internationally too. I see this as a sensitization process and an empowering tool, and not a tool for protection.
I appreciate the efforts of the Core Committee, which has delivered this long pending task in a very short time. I am confident that with this document and the consequent ranking of Higher Institutions, these Institutions will earn significant trust of students, academicians, industry and governments.
SMRITI ZUBIN IRANI


vii
PrefaceThis document represents the outcome of several intense deliberations of the Core Committee, set up by MHRD, to develop a ranking framework for academic institutions of India.
The wide diversity of academic institutions and Universities makes this an extremely challenging task. India’s higher educational system can be described as anything but simple. It has a complex multi-layered structure, with diversity of disciplines, levels and nature of financial support, autonomy, and many other parameters. At the top end of the spectrum, we have the IIT’s and the IISc, and several reputed Central Universities; at the middle level, we have a host of Central and State Universities, and some of the so-called Private and Deemed-to-be-Universities; and at the other end we have a large number of undergraduate colleges leading to a Bachelor’s degrees (and some times Diplomas) in a variety of disciplines like Sciences, Arts, Engineering and others. This is unlike most global practices, where the structures are well defined, and diversity of forms limited to a very few number. In the most generic structure, there is a comprehensive University with schools in many disciplines, each of which individually offers all levels of degree programs: from Bachelor’s to the Doctoral.
In the early stages of its work, it became clear to the Core Committee that a single ranking framework for such a complex scenario of institutions would be counter productive, and even meaningless. This led to the conclusion that a ranking framework should be designed that enables an apple-to-apple comparison. It was agreed, therefore, that institutions belonging to different sectoral fields, such as Engineering, Management, etc. should be compared separately in their own respective peer groups. Comprehensive universities, which encompass a large number of academic programs including Arts, Humanities, Sciences etc., should similarly form a separate peer group for comparison. Further, within each sectoral discipline, there is scope for separate ranking in two categories, viz., institutions, which are engaged in both Research and Teaching, and those primarily engaged in Teaching.
While this broad approach seemed to be of universal appeal, there remained the challenge of identifying a small set of nearly common parameters (with suitable possibility of tweaking to suit the needs of individual specific
Preface
viii
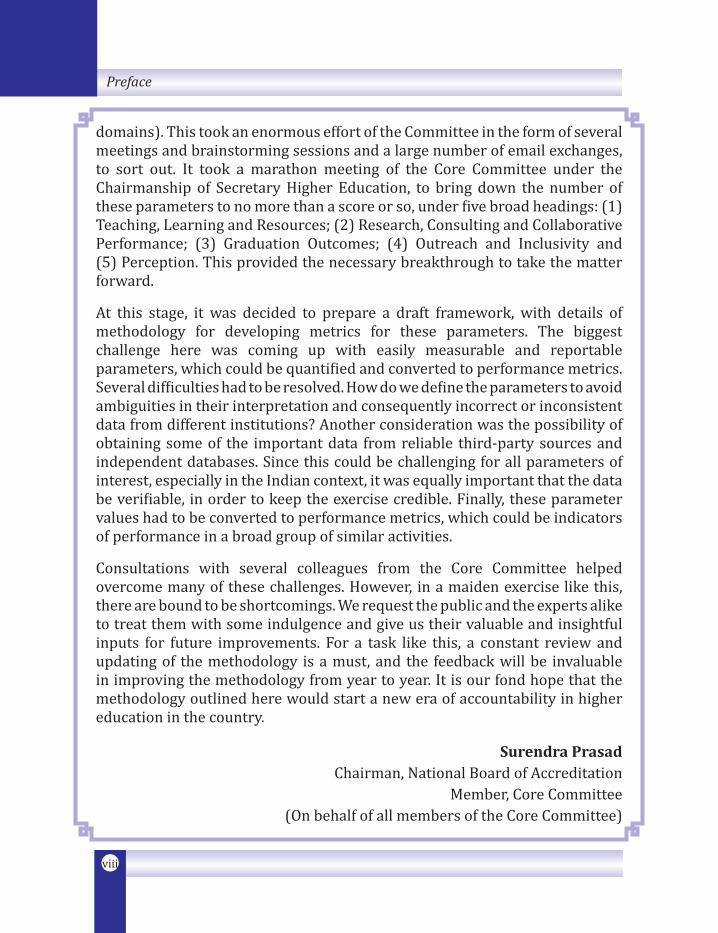
domains). This took an enormous effort of the Committee in the form of several meetings and brainstorming sessions and a large number of email exchanges, to sort out. It took a marathon meeting of the Core Committee under the Chairmanship of Secretary Higher Education, to bring down the number of these parameters to no more than a score or so, under five broad headings: (1) Teaching, Learning and Resources; (2) Research, Consulting and Collaborative Performance; (3) Graduation Outcomes; (4) Outreach and Inclusivity and (5) Perception. This provided the necessary breakthrough to take the matter forward.
At this stage, it was decided to prepare a draft framework, with details of methodology for developing metrics for these parameters. The biggest challenge here was coming up with easily measurable and reportable parameters, which could be quantified and converted to performance metrics. Several difficulties had to be resolved. How do we define the parameters to avoid ambiguities in their interpretation and consequently incorrect or inconsistent data from different institutions? Another consideration was the possibility of obtaining some of the important data from reliable third-party sources and independent databases. Since this could be challenging for all parameters of interest, especially in the Indian context, it was equally important that the data be verifiable, in order to keep the exercise credible. Finally, these parameter values had to be converted to performance metrics, which could be indicators of performance in a broad group of similar activities.
Consultations with several colleagues from the Core Committee helped overcome many of these challenges. However, in a maiden exercise like this, there are bound to be shortcomings. We request the public and the experts alike to treat them with some indulgence and give us their valuable and insightful inputs for future improvements. For a task like this, a constant review and updating of the methodology is a must, and the feedback will be invaluable in improving the methodology from year to year. It is our fond hope that the methodology outlined here would start a new era of accountability in higher education in the country.
Surendra PrasadChairman, National Board of Accreditation
Member, Core Committee(On behalf of all members of the Core Committee)
Preface

ix
F.No. 19-6/2013-TS.I (Sectt.)Government of India
Ministry of Human Resource DevelopmentDepartment of Higher Education
Technical Section-I
Shastri Bhawan, New Delhi,Dated the 09th October, 2014
ORDER
In the one-day Workshop on Ranking held on 21st August, 2014 where representatives of Central Universities, NITs, IIITs, SPAs and IISERs were invited, it was inter-alia decided to constitute a Committee on evolving a National Ranking Framework. Further, during the Hon’ble HRM’s conclave with the IIMs and Central Universities, it was decided that representatives of Central Universities and IIMs would also be included in the Committee to be constituted for evolving a National Ranking Framework in the country.
2. Pursuant to the above, a Committee comprising of the following is hereby constituted:-1. Secretary (HE), MHRD Chairperson2. Director, IIT-Kharagpur Member3. Director, IIT-Madras Member4. VC, Delhi University Member5. VC, EFL University, Hyderabad Member6. VC, Central University of Gujarat, Gandhinagar Member7. VC, JNU, New Delhi Member8. Director, IIM Ahmedabad Member9. Director, IIM Bangaluru Member10. Director, NIT, Warangal, Telangana Member11. Director, SPA, Delhi Member12. Director, ABV-IIITM, Gwalior Member13. Director, IISER, Bhopal Member14. Chairperson, NBA, New Delhi Member15. Director, NAAC, Bangaluru Member16. Additional Secretary (TE), MHRD Member Secretary
Government of India Order
x
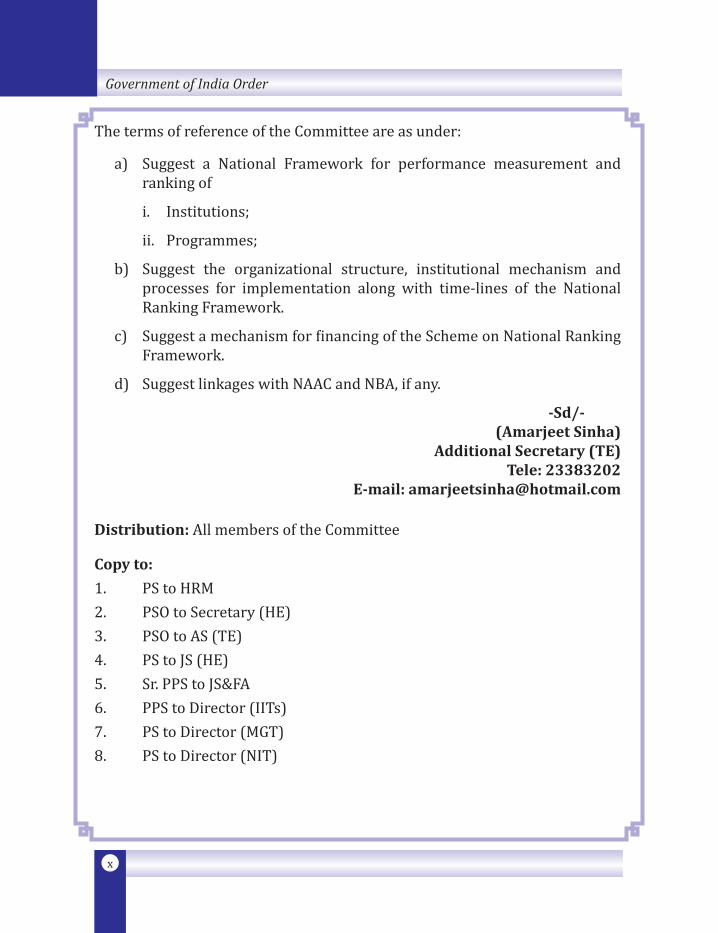
The terms of reference of the Committee are as under:
a) Suggest a National Framework for performance measurement and ranking of
i. Institutions;
ii. Programmes;
b) Suggest the organizational structure, institutional mechanism and processes for implementation along with time-lines of the National Ranking Framework.
c) Suggest a mechanism for financing of the Scheme on National Ranking Framework.
d) Suggest linkages with NAAC and NBA, if any.
-Sd/-(Amarjeet Sinha)
Additional Secretary (TE)Tele: 23383202
E-mail: [email protected]
Distribution: All members of the Committee
Copy to:
1. PS to HRM2. PSO to Secretary (HE)3. PSO to AS (TE)4. PS to JS (HE)5. Sr. PPS to JS&FA6. PPS to Director (IITs)7. PS to Director (MGT)8. PS to Director (NIT)
Government of India Order

xi
Executive Summary
Executive SummaryThis document presents a methodology to rank engineering institutions across the country. The methodology draws from the broad understanding arrived at by a Core Committee (CC) set up by Ministry of Human Resources Development (MHRD) regarding the broad parameters for ranking various Universities and Institutions. The ranking parameters proposed by the Core Committee are generic, and need to be adapted for evolving a detailed methodology for discipline specific rankings.
This document focuses on engineering institutions. The main features of the methodology proposed are as follows:
1. There will be an Implementation Core Committee(ICC), which will oversee the implementation of ranking work for the first year, after which a suitable Ranking Agency duly authorized to receive and verify the data, and declare the rankings, would be set up.
2. The document identifies a set of suitable forms in which these parameters can be easily measured and verified across a variety of institutions.
3. A strategy is proposed for calculating scores to measure the performance of an institution across each such parameter. This helps to obtain an overall score for obtaining the institution rank.
4. A two-category approach is proposed to ensure that an institution is compared with an appropriate peer group of institutions, and provide a level-playing field to all.
5. A system for data collection from public bodies and random sample checks is proposed for each parameter.

xii
A Methodology for Ranking of Engineering Institutions in India
1. Salient Features:
1.1 Methodology is based on developing a set of metrics for ranking of engineering institutions, based on the parameters agreed upon by the Core Committee (CC).
1.2 These parameters are organized into five broad heads, and have been further elaborated through suitable sub-heads. Each broad head has an overall weight assigned to it. Within each head, the sub-heads also have an appropriate weight distribution.
1.3 An attempt is made here to first identify the relevant data needed to suitably measure the performance score under-each sub-head. The emphasis here is on identifying data that is easy to generate and easily verifiable, if verification is needed. This is important in the interest of transparency.
1.4 A suitable metric is then proposed, based on this data, which computes a score under each sub-head. The sub-head scores are then added to obtain scores for each individual head. The overall score is computed based on the weights allotted to each head. The overall score can take a maximum value of 100.
1.5 The institutions can then be rank-ordered based on their scores.
2. Ranking Based on Institution Categories
2.1 In view of the diversity in nature and quality of Engineering institutions in the Country, it is proposed that ranking be done separately across two distinct categories.
2.2 The two caregories will be distinguished on the basis of their primary mandate as follows:
Category A: Institutions engaged in Research and Teaching.
Category B: Institutions engaged primarily in Teaching.
Category B institution may choose to be ranked in both categories.
2.3 All institutions that have been granted academic autonomy (by the appropriate authorities) will normally be classified as a
xiii
Executive Summary
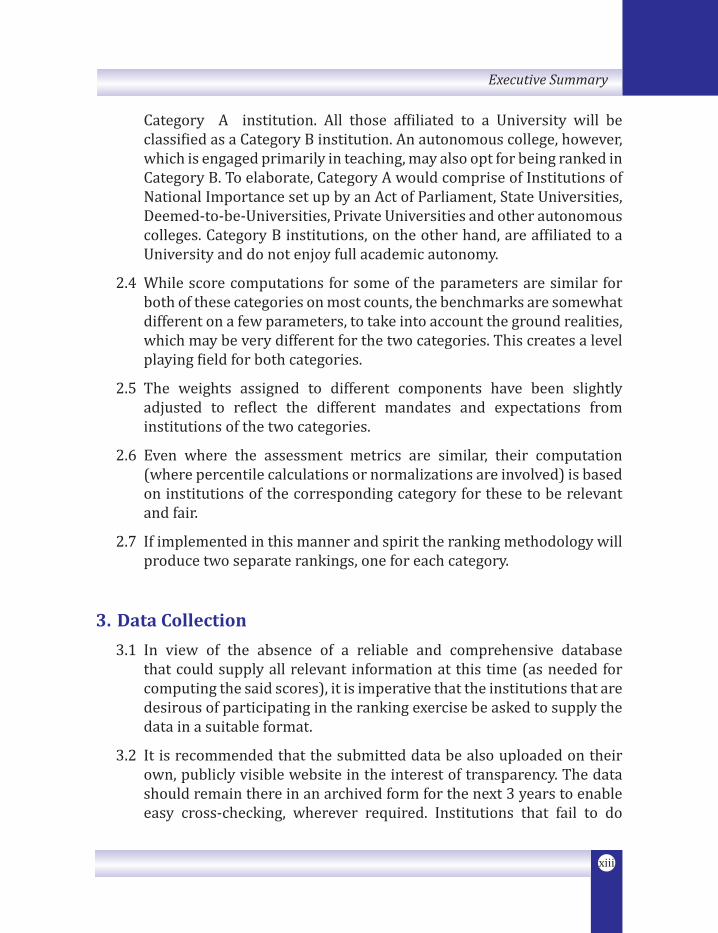
Category A institution. All those affiliated to a University will be classified as a Category B institution. An autonomous college, however, which is engaged primarily in teaching, may also opt for being ranked in Category B. To elaborate, Category A would comprise of Institutions of National Importance set up by an Act of Parliament, State Universities, Deemed-to-be-Universities, Private Universities and other autonomous colleges. Category B institutions, on the other hand, are affiliated to a University and do not enjoy full academic autonomy.
2.4 While score computations for some of the parameters are similar for both of these categories on most counts, the benchmarks are somewhat different on a few parameters, to take into account the ground realities, which may be very different for the two categories. This creates a level playing field for both categories.
2.5 The weights assigned to different components have been slightly adjusted to reflect the different mandates and expectations from institutions of the two categories.
2.6 Even where the assessment metrics are similar, their computation (where percentile calculations or normalizations are involved) is based on institutions of the corresponding category for these to be relevant and fair.
2.7 If implemented in this manner and spirit the ranking methodology will produce two separate rankings, one for each category.
3. Data Collection
3.1 In view of the absence of a reliable and comprehensive database that could supply all relevant information at this time (as needed for computing the said scores), it is imperative that the institutions that are desirous of participating in the ranking exercise be asked to supply the data in a suitable format.
3.2 It is recommended that the submitted data be also uploaded on their own, publicly visible website in the interest of transparency. The data should remain there in an archived form for the next 3 years to enable easy cross-checking, wherever required. Institutions that fail to do
xiv
A Methodology for Ranking of Engineering Institutions in India
this honestly or resort to unethical practices should be automatically debarred from participation in future Ranking Surveys for a period of two years. Their names may also be displayed on the Ranking Portal indicating the nature of their unethical conduct. An attempt should also be made by the Ranking Authority to maintain the archived form of this data for due diligence as needed.
3.3 The Ranking Authority or Agency or Board should be empowered to take up a random check on the institution records and audited accounts to ensure that the principles of ethical behavior are being adhered to.
3.4 For some of the parameters, the data could be populated from internationally available Databases (like Scopus, Web of Science, or Google Scholar). This is indicated in the Assessment Metrics. The Ranking Agency should directly access data from these resources, if necessary for a payment.
3.5 Similarly, some data can be made available through a national effort. For example, data about success in public examinations can be easily compiled, if all concerned bodies (UPSC, GATE, NET, CAT etc.) conducting such exams prepare an institution wise list providing details of the total number of aspirants and successful candidates from each institute.
3.6 Similarly Universities, including affiliating ones, should be able to provide examination results data in the appropriate format to evaluate the component of Graduate Outcomes.
4. Miscellaneous Recommendations
4.1 It is recommended that the proposed metrics be presented to the Core Committee (or another independent committee as deemed appropriate) for their comments and possible improvements, especially to assess the suitability of the metrics and data used for computing these. Suggestions may also be invited from the general public.
4.2 An Implementation Committee should be set up to oversee the process initially.
xv
Executive Summary
4.3 A few institutions from both Category A and B should be asked to fill the data from previous years to complete a mock exercise and validate the metrics proposed here.
5. Implementation Details
5.1 A suitable Ranking Authority/Agency should be identified or formed and empowered. Instead of creating another organization, however, it may also be visualized as a Virtual Authority, authorised to outsource parts of the work (including data analytics) to various survey organizations. The entire effort could be self- supporting if the institutions desiring to participate are charged an appropriate fee for this purpose. Initially, the ranking agency should be provided with a seed funding to roll out the process in a time-bound manner.
5.2 The Ranking Agency should invite institutions intending to participate in the ranking exercise to submit their applications in the given format by 31st December. The data should be submitted on an On-line facility created for this purpose.
5.3 The Ranking Agency will then extract the relevant information from this data and through software, compute the various metrics and rank institutions based on this data. As mentioned earlier, both these components of work could be outsourced suitably. This process shall be completed in about 3 months, and rankings published ahead of the next year’s admission schedule.

Part - IParameters and Metrics
for Category 'A' Institutions

3
Part - I : Parameters and Metrics for Category 'A' Institutions
Overview : Category 'A' Institutions
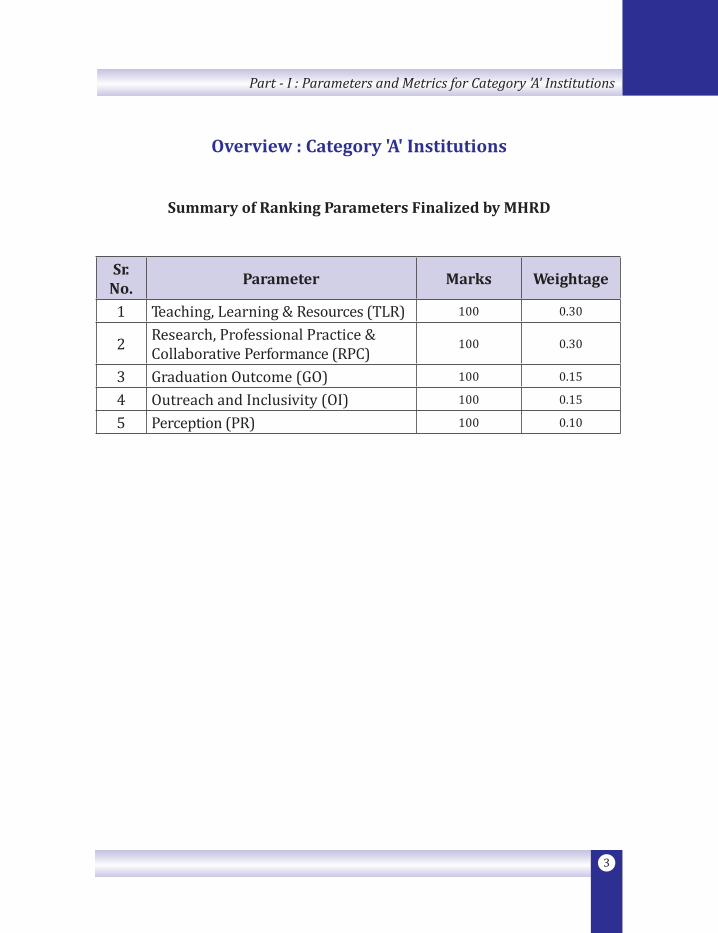
Summary of Ranking Parameters Finalized by MHRD
Sr. No. Parameter Marks Weightage
1 Teaching, Learning & Resources (TLR) 100 0.30
2 Research, Professional Practice & Collaborative Performance (RPC)
100 0.30
3 Graduation Outcome (GO) 100 0.15
4 Outreach and Inclusivity (OI) 100 0.15
5 Perception (PR) 100 0.10
4
A Methodology for Ranking of Engineering Institutions in India
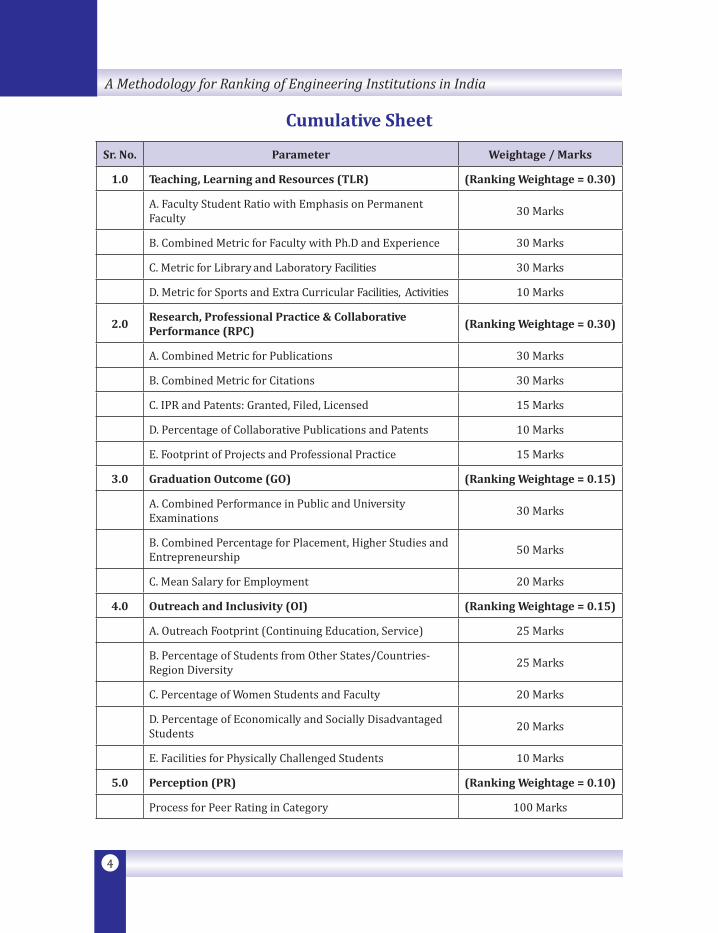
Cumulative Sheet
Sr. No. Parameter Weightage / Marks
1.0 Teaching, Learning and Resources (TLR) (Ranking Weightage = 0.30)
A. Faculty Student Ratio with Emphasis on Permanent Faculty 30 Marks
B. Combined Metric for Faculty with Ph.D and Experience 30 Marks
C. Metric for Library and Laboratory Facilities 30 Marks
D. Metric for Sports and Extra Curricular Facilities, Activities 10 Marks
2.0Research, Professional Practice & Collaborative Performance (RPC)
(Ranking Weightage = 0.30)
A. Combined Metric for Publications 30 Marks
B. Combined Metric for Citations 30 Marks
C. IPR and Patents: Granted, Filed, Licensed 15 Marks
D. Percentage of Collaborative Publications and Patents 10 Marks
E. Footprint of Projects and Professional Practice 15 Marks
3.0 Graduation Outcome (GO) (Ranking Weightage = 0.15)
A. Combined Performance in Public and University Examinations 30 Marks
B. Combined Percentage for Placement, Higher Studies and Entrepreneurship 50 Marks
C. Mean Salary for Employment 20 Marks
4.0 Outreach and Inclusivity (OI) (Ranking Weightage = 0.15)
A. Outreach Footprint (Continuing Education, Service) 25 Marks
B. Percentage of Students from Other States/Countries-Region Diversity 25 Marks
C. Percentage of Women Students and Faculty 20 Marks
D. Percentage of Economically and Socially Disadvantaged Students 20 Marks
E. Facilities for Physically Challenged Students 10 Marks
5.0 Perception (PR) (Ranking Weightage = 0.10)
Process for Peer Rating in Category 100 Marks
5
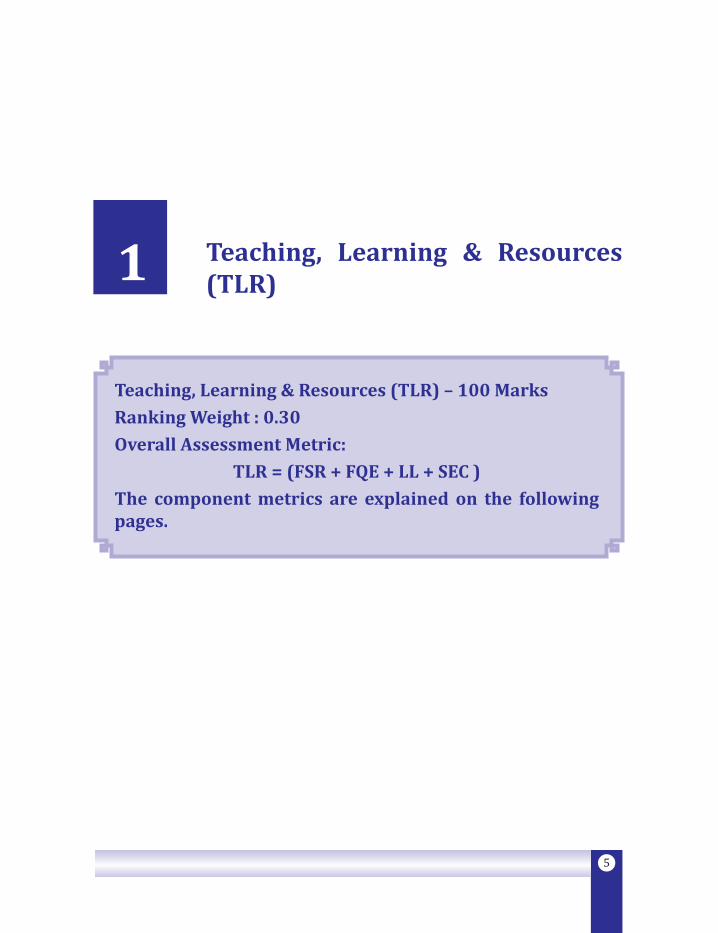
Teaching, Learning & Resources (TLR) – 100 Marks Ranking Weight : 0.30Overall Assessment Metric:
TLR = (FSR + FQE + LL + SEC )The component metrics are explained on the following pages.
1 Teaching, Learning & Resources (TLR)


7
Part - I : Parameters and Metrics for Category 'A' Institutions
1.a Faculty-Student Ratio with Emphasis on Permanent Faculty (FSR) – 30 Marks
Assessment will be based on the ratio of number of regular faculty members in the Institute and total sanctioned/approved intake considering all UG & PG Programs.
Regular appointment means faculty on full time basis with no time limit on their employment. However, faculty on contract basis for a period of not less than three (3) years, on gross salary similar to those who are permanent can also be included.
Only faculty members with Ph.D or M.Tech qualifications should be considered and counted here. Faculty members with a B.Tech (or equivalent qualification e.g., M.Sc) will not be counted.
Visiting faculty (with a Ph.D) who are visiting the institution on a full time basis for at least one semester can be included in the count for that semester.
The benchmark is set as a ratio of 1:10 for scoring maximum Marks.
Assessment metric will be the same for Category A and Category B Institutions.
FSR=30×[10×(F/N)]
Here,
N: Total number of sanctioned students in the institution considering all UG and PG Programs, including the Ph.D program.
F =F1 + 0.3F2
F1: Full time regular faculty of all UG and PG Programs in the previous year.
F2 : Eminent teachers/ faculty (with Ph.D) visiting the institution for atleast a semester on a full time basis can be counted (with a count of 0.5 for each such visiting faculty for a semester) in the previous year.
Expected ratio is 1:10 to score maximum Marks.
For F/N < 1: 50, FSR will be set to zero.
8
A Methodology for Ranking of Engineering Institutions in India
Data Collection:
From the concerned Institutions in prescribed format on an On-line facility. As mentioned in the preamble, an institution will be eligible for ranking, if all relevant, and updated data about the faculty members (in the previous three (3) years) is available on a publicly visible website. The data will be archived and also maintained by the ranking agency.
Data Verification:
By the Ranking Agency on a random sample basis.
9
Part - I : Parameters and Metrics for Category 'A' Institutions
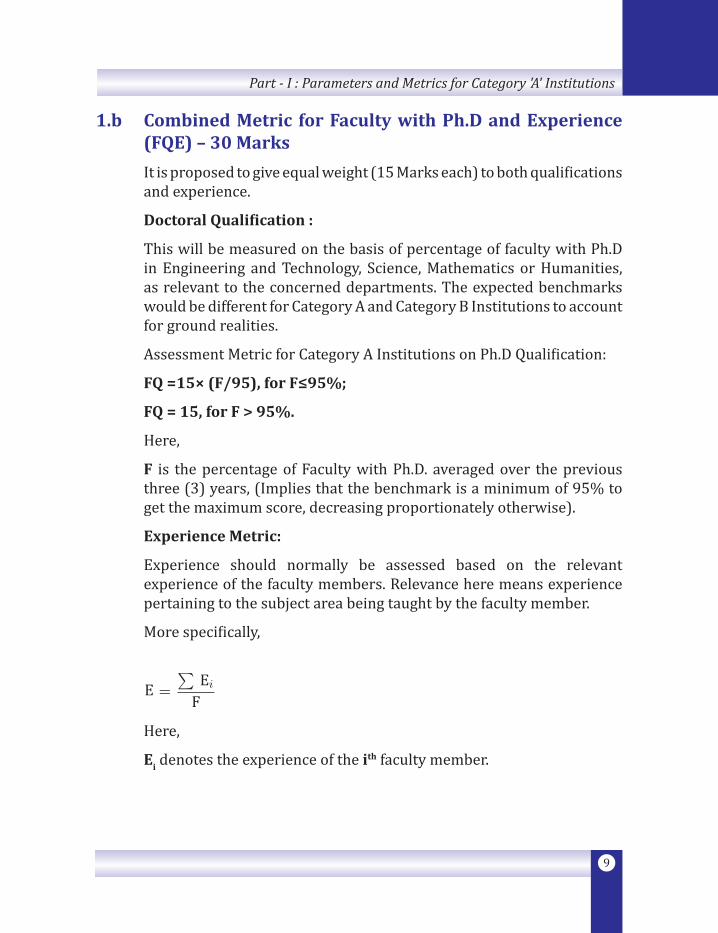
1.b Combined Metric for Faculty with Ph.D and Experience (FQE) – 30 Marks
It is proposed to give equal weight (15 Marks each) to both qualifications and experience.
Doctoral Qualification :
This will be measured on the basis of percentage of faculty with Ph.D in Engineering and Technology, Science, Mathematics or Humanities, as relevant to the concerned departments. The expected benchmarks would be different for Category A and Category B Institutions to account for ground realities.
Assessment Metric for Category A Institutions on Ph.D Qualification:
FQ =15× (F/95), for F≤95%;
FQ = 15, for F > 95%.
Here,
F is the percentage of Faculty with Ph.D. averaged over the previous three (3) years, (Implies that the benchmark is a minimum of 95% to get the maximum score, decreasing proportionately otherwise).
Experience Metric:
Experience should normally be assessed based on the relevant experience of the faculty members. Relevance here means experience pertaining to the subject area being taught by the faculty member.
More specifically,
Here,
Ei denotes the experience of the ith faculty member.
10
A Methodology for Ranking of Engineering Institutions in India
For simplicity, however, Ei may also be calculated from the age profile of the faculty members as follows:
Ei = Ai – 30, for Ai ≤ 45 years
Ei = 15, for Ai ≥ 45 years.
Assessment Metric for Experience:
FE = 15×(E/15), for E ≤ 15 years
FE = 15, for E > 15 years.
Here,
E is the average years of experience of all faculty members as calculated above.
This implies that the benchmark experience is to be 15 years to score maximum marks, decreasing proportionately otherwise.
Data Collection:
Institutions to submit information in a tabular form indicating faculty name, age, qualifications (indicating the University attended for the qualifying degree) and experience under the categories of academic and industrial. Updated data for the last three (3) years should be available on a publicly available website, and suitably archived for consistency check in subsequent years.
Data Verification:
On a random sampling basis.
Combined Metric for Faculty Qualifications and Experience:
FQE = FQ + FE
11
Part - I : Parameters and Metrics for Category 'A' Institutions
1.c Metric for Library and Laboratory Facilities (LL) – 30 Marks
It is proposed to give equal weights (15 Marks each) to Library and Laboratory facilities.
Library (LI):
LI = 15 × (Percentile parameter on the basis of annual expenditure (EXLI) on library resources per student)
EXLI = EXLIPS + EXLIES
EXLIPS = EXLIP/N
EXLIES = 2 × EXLIE/N
EXLIP: Actual Annual Expenditure on Physical Resources, Books, Journals, etc.
EXLIE: Actual Annual Expenditure on Electronic Resources, Books, Journals etc.
If this expenditure is below a threshold value to be determined separately for each category of institutions,
EXLI = 0
Laboratories (LB):
LB = 15 × (Percentile parameter on the basis of annual expenditure (EXLB) on creation and maintenance of laboratory resources)
If this expenditure is below a threshold value to be determined separately for each category of institutions, EXLB = 0
Combined Metric for Library and Lab Resources:
LL=LI + LB
12
A Methodology for Ranking of Engineering Institutions in India
1.d Metric for Sports and Extra-Curricular Facilities, Activities (SEC) – 10 Marks
Equal weights will be given to sports facilities, sports budget and top performances, and extra-curricular activities.
Extra-Curricular (EC) activities may typically include, but not be limited to Clubs/Forums, NCC, NSS etc.
Parameters to be used:
- Sports facilities area per student (A);
- Actual expenditure per student on Sports and EC activities (B); and
- Number of top positions in inter- college sports and EC events (C).
Each parameter to be evaluated on a percentile basis to obtain the parameters p(A), p(B) and p(C). Weights assigned to the 3 components are 0.5, 0.25 and 0.25 respectively.
p(C) = 1, if a college has at least 3 winners of a State or National level event.
Assessment Metric for Sports and Extracurricular Activities :
SEC = 10×[p(A)/2 + p(B)/4 + p(C)/4]
Data Collection:
To be obtained from the institutions.
Data Verification:
By Ranking Agency on a random sample basis.
13
Research, Professional Practice & Collaborative Performance (RPC) – 100 MarksRanking Weight : 0.30Overall Assessment Metric:
RPC = (PU + CI + IPR + CP + FPPP)The component metrics are explained on the following pages.
2 Research, Professional Practice & Collaborative Performance (RPC)

15
Part - I : Parameters and Metrics for Category 'A' Institutions
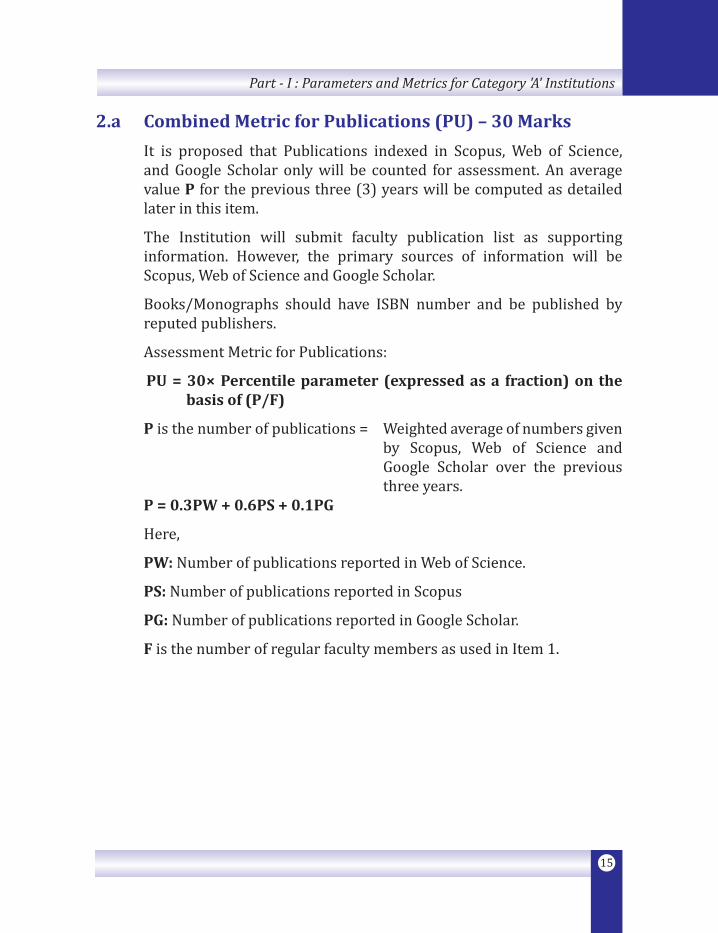
2.a Combined Metric for Publications (PU) – 30 Marks
It is proposed that Publications indexed in Scopus, Web of Science, and Google Scholar only will be counted for assessment. An average value P for the previous three (3) years will be computed as detailed later in this item.
The Institution will submit faculty publication list as supporting information. However, the primary sources of information will be Scopus, Web of Science and Google Scholar.
Books/Monographs should have ISBN number and be published by reputed publishers.
Assessment Metric for Publications:
PU = 30× Percentile parameter (expressed as a fraction) on the basis of (P/F)
P is the number of publications = Weighted average of numbers given by Scopus, Web of Science and Google Scholar over the previous three years.P = 0.3PW + 0.6PS + 0.1PG
Here,
PW: Number of publications reported in Web of Science.
PS: Number of publications reported in Scopus
PG: Number of publications reported in Google Scholar.
F is the number of regular faculty members as used in Item 1.
16
A Methodology for Ranking of Engineering Institutions in India
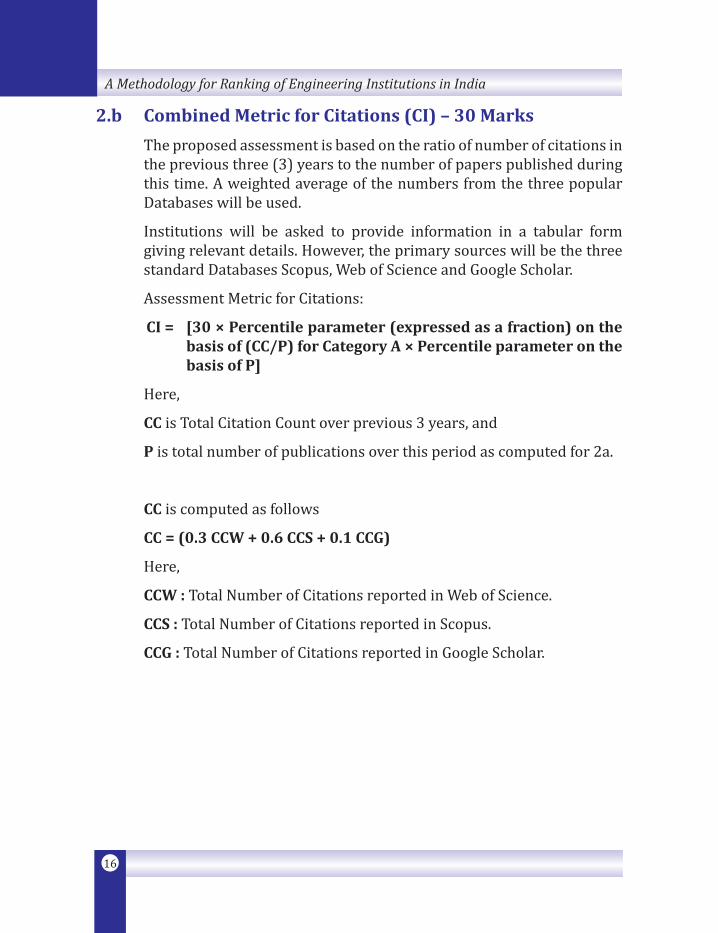
2.b Combined Metric for Citations (CI) – 30 Marks
The proposed assessment is based on the ratio of number of citations in the previous three (3) years to the number of papers published during this time. A weighted average of the numbers from the three popular Databases will be used.
Institutions will be asked to provide information in a tabular form giving relevant details. However, the primary sources will be the three standard Databases Scopus, Web of Science and Google Scholar.
Assessment Metric for Citations:
CI = [30 × Percentile parameter (expressed as a fraction) on the basis of (CC/P) for Category A × Percentile parameter on the basis of P]
Here,
CC is Total Citation Count over previous 3 years, and
P is total number of publications over this period as computed for 2a.
CC is computed as follows
CC = (0.3 CCW + 0.6 CCS + 0.1 CCG)
Here,
CCW : Total Number of Citations reported in Web of Science.
CCS : Total Number of Citations reported in Scopus.
CCG : Total Number of Citations reported in Google Scholar.
17
Part - I : Parameters and Metrics for Category 'A' Institutions
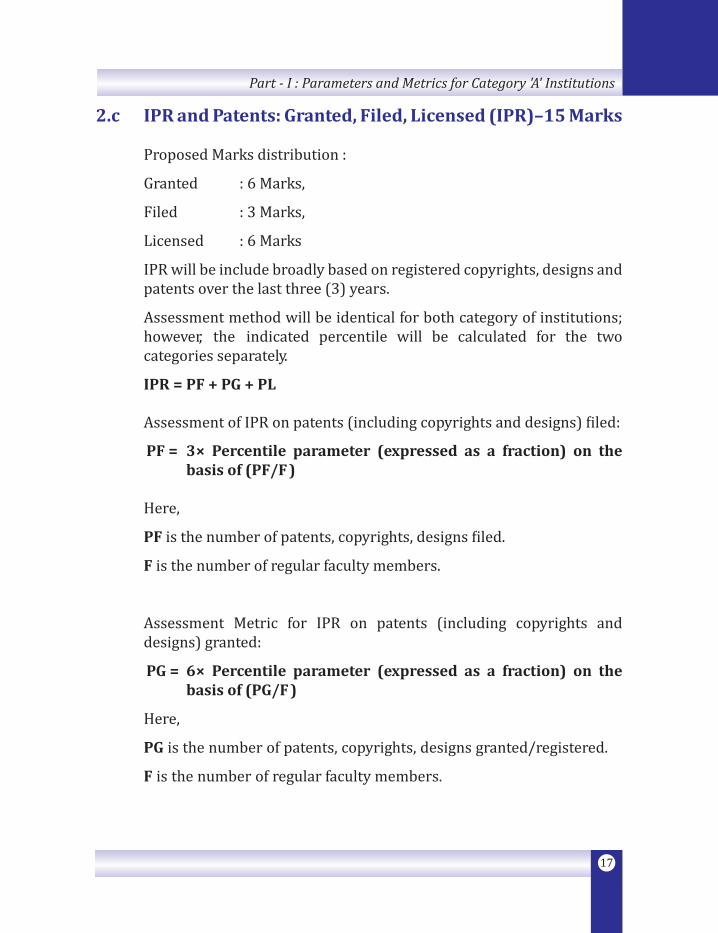
2.c IPR and Patents: Granted, Filed, Licensed (IPR)–15 Marks
Proposed Marks distribution :
Granted : 6 Marks,
Filed : 3 Marks,
Licensed : 6 Marks
IPR will be include broadly based on registered copyrights, designs and patents over the last three (3) years.
Assessment method will be identical for both category of institutions; however, the indicated percentile will be calculated for the two categories separately.
IPR = PF + PG + PL
Assessment of IPR on patents (including copyrights and designs) filed:
PF = 3× Percentile parameter (expressed as a fraction) on the basis of (PF/F )
Here,
PF is the number of patents, copyrights, designs filed.
F is the number of regular faculty members.
Assessment Metric for IPR on patents (including copyrights and designs) granted:
PG = 6× Percentile parameter (expressed as a fraction) on the basis of (PG/F )
Here,
PG is the number of patents, copyrights, designs granted/registered.
F is the number of regular faculty members.

18
A Methodology for Ranking of Engineering Institutions in India
Assessment Metric for IPR and Patents Licensed:
PL = 2 × I (P) + 4 × Percentile parameter (expressed as a fraction) based on (EP/F )
Here,
EP is the total earnings from patents etc. over the last 3 years.
I(P) = 1, if at least one patent was licensed in the previous 3 years (or) at least one technology transferred during this period; Otherwise,
I(P) = 0
F is the average number of regular faculty over this period.
Data Collection:
To be made available by the concerned institutes On-line.
Data Verification:
By Ranking Agency on a random sample basis.
19
Part - I : Parameters and Metrics for Category 'A' Institutions
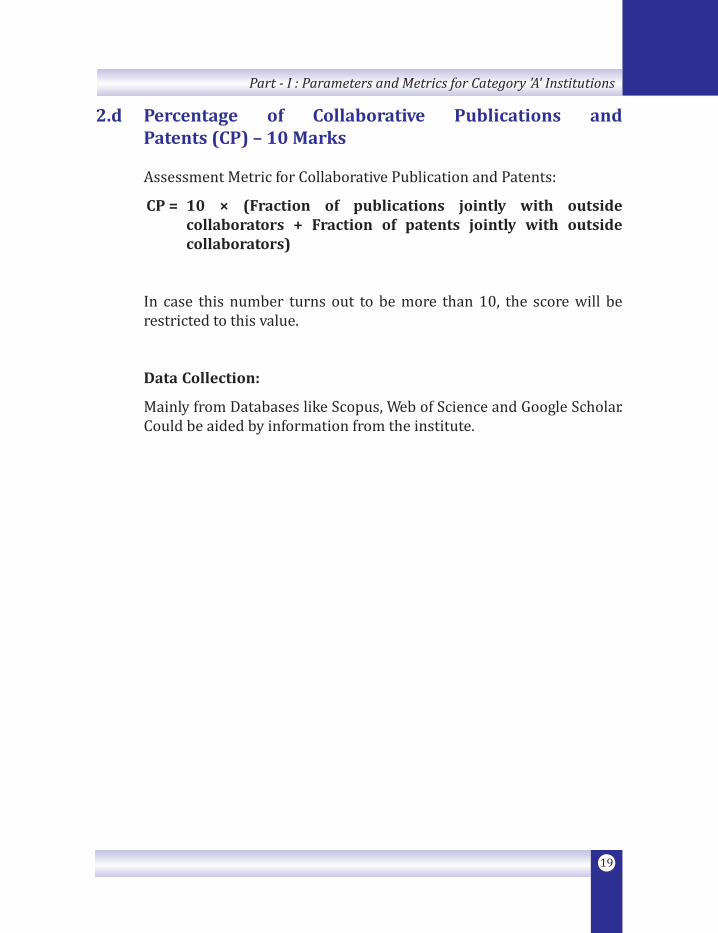
2.d Percentage of Collaborative Publications and Patents (CP) – 10 Marks
Assessment Metric for Collaborative Publication and Patents:
CP = 10 × (Fraction of publications jointly with outside collaborators + Fraction of patents jointly with outside collaborators)
In case this number turns out to be more than 10, the score will be restricted to this value.
Data Collection:
Mainly from Databases like Scopus, Web of Science and Google Scholar. Could be aided by information from the institute.
20
A Methodology for Ranking of Engineering Institutions in India
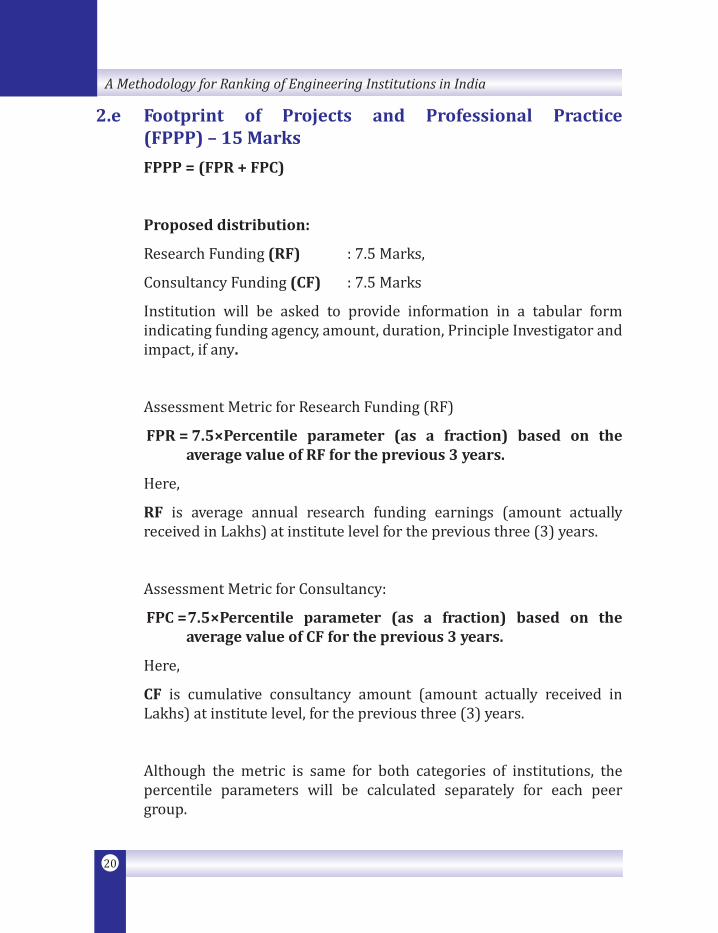
2.e Footprint of Projects and Professional Practice (FPPP) – 15 Marks
FPPP = (FPR + FPC)
Proposed distribution:
Research Funding (RF) : 7.5 Marks,
Consultancy Funding (CF) : 7.5 Marks
Institution will be asked to provide information in a tabular form indicating funding agency, amount, duration, Principle Investigator and impact, if any.
Assessment Metric for Research Funding (RF)
FPR = 7.5×Percentile parameter (as a fraction) based on the average value of RF for the previous 3 years.
Here,
RF is average annual research funding earnings (amount actually received in Lakhs) at institute level for the previous three (3) years.
Assessment Metric for Consultancy:
FPC = 7.5×Percentile parameter (as a fraction) based on the average value of CF for the previous 3 years.
Here,
CF is cumulative consultancy amount (amount actually received in Lakhs) at institute level, for the previous three (3) years.
Although the metric is same for both categories of institutions, the percentile parameters will be calculated separately for each peer group.
21
Graduation Outcome (GO) –100 MarksRanking Weight: 0.15Overall Assessment Metric:
GO = (PUE + PHE + MS)The component metrics are explained on the following pages.
3Graduation Outcome (GO)

23
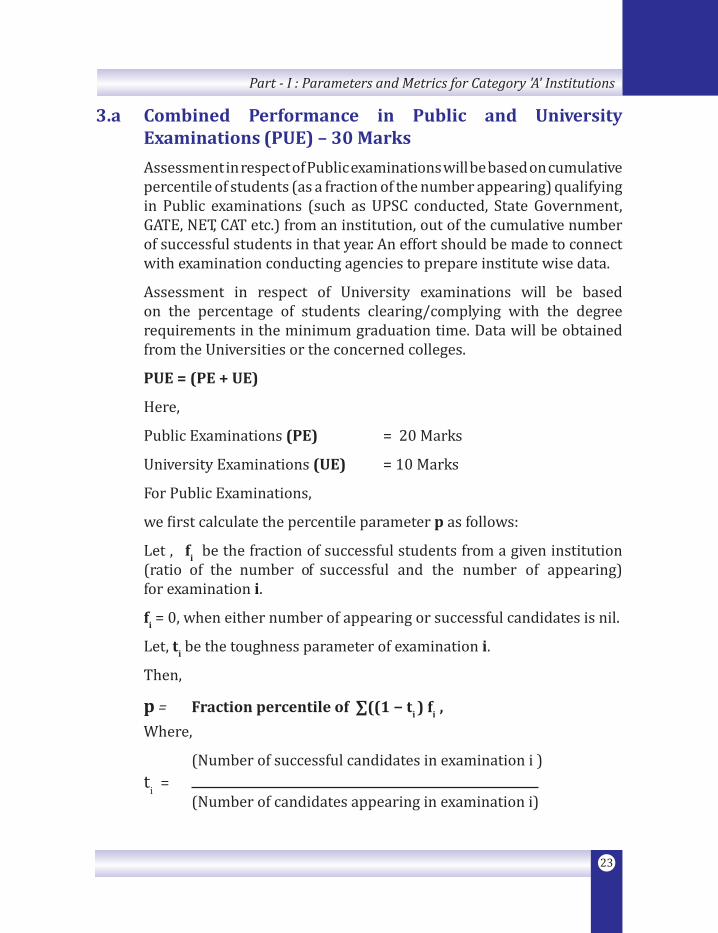
Part - I : Parameters and Metrics for Category 'A' Institutions
3.a Combined Performance in Public and University Examinations (PUE) – 30 Marks
Assessment in respect of Public examinations will be based on cumulative percentile of students (as a fraction of the number appearing) qualifying in Public examinations (such as UPSC conducted, State Government, GATE, NET, CAT etc.) from an institution, out of the cumulative number of successful students in that year. An effort should be made to connect with examination conducting agencies to prepare institute wise data.
Assessment in respect of University examinations will be based on the percentage of students clearing/complying with the degree requirements in the minimum graduation time. Data will be obtained from the Universities or the concerned colleges.
PUE = (PE + UE)
Here,
Public Examinations (PE) = 20 Marks
University Examinations (UE) = 10 Marks
For Public Examinations,
we first calculate the percentile parameter p as follows:
Let , fi be the fraction of successful students from a given institution (ratio of the number of successful and the number of appearing) for examination i.
fi = 0, when either number of appearing or successful candidates is nil.
Let, ti be the toughness parameter of examination i.
Then,
p = Fraction percentile of ∑((1 − ti ) fi ,
Where,
(Number of successful candidates in examination i ) ti = (Number of candidates appearing in examination i)
24
A Methodology for Ranking of Engineering Institutions in India
Cumulative data is thus weighted across different examinations according to their toughness index, which is measured by the ratio of successful candidates to the total number appearing.
PE = 20 × Cumulative percentile of students from the institution in the cumulative data of Public Examination
UE = 10 × (N/80)
Here,
N is the percentage of Students (as a fraction of those admitted for the batch, averaged over the previous three (3) years) graduating in minimum time.
Benchmark:
At least 80% students should graduate in minimum time to score maximum Marks.
Data Collection:
PE data from Examination Boards and bodies.
UE data from institutions to be verified on a random sampling basis, but preferably directly from the University examination sections, if possible.
25
Part - I : Parameters and Metrics for Category 'A' Institutions
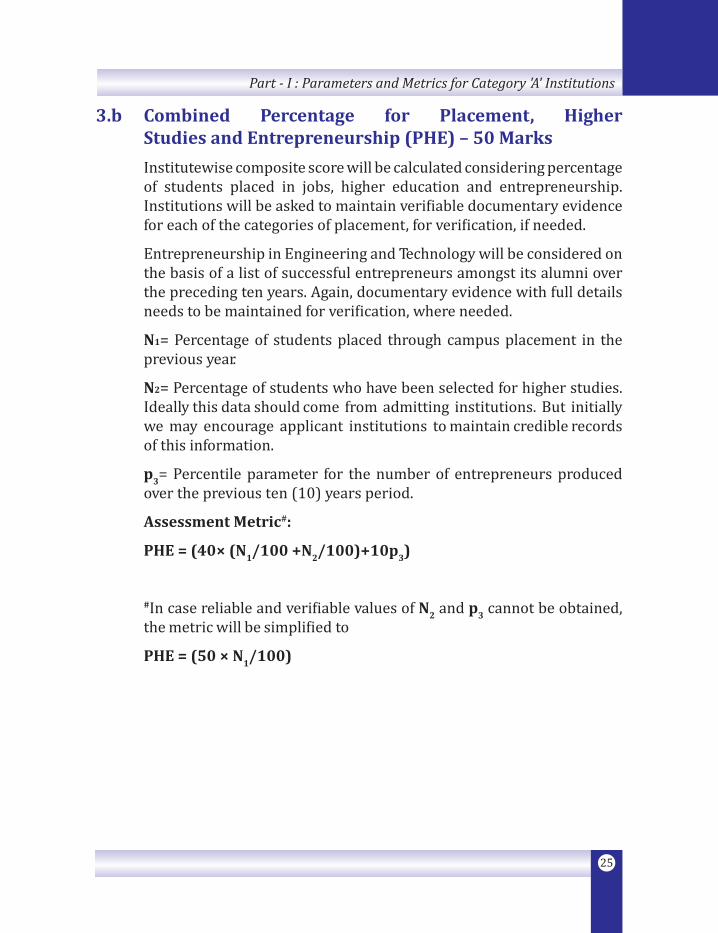
3.b Combined Percentage for Placement, Higher Studies and Entrepreneurship (PHE) – 50 Marks
Institutewise composite score will be calculated considering percentage of students placed in jobs, higher education and entrepreneurship. Institutions will be asked to maintain verifiable documentary evidence for each of the categories of placement, for verification, if needed.
Entrepreneurship in Engineering and Technology will be considered on the basis of a list of successful entrepreneurs amongst its alumni over the preceding ten years. Again, documentary evidence with full details needs to be maintained for verification, where needed.
N1= Percentage of students placed through campus placement in the previous year.
N2= Percentage of students who have been selected for higher studies. Ideally this data should come from admitting institutions. But initially we may encourage applicant institutions to maintain credible records of this information.
p3= Percentile parameter for the number of entrepreneurs produced over the previous ten (10) years period.
Assessment Metric#:
PHE = (40× (N1/100 +N2/100)+10p3)
#In case reliable and verifiable values of N2 and p3 cannot be obtained, the metric will be simplified to
PHE = (50 × N1/100)
26
A Methodology for Ranking of Engineering Institutions in India
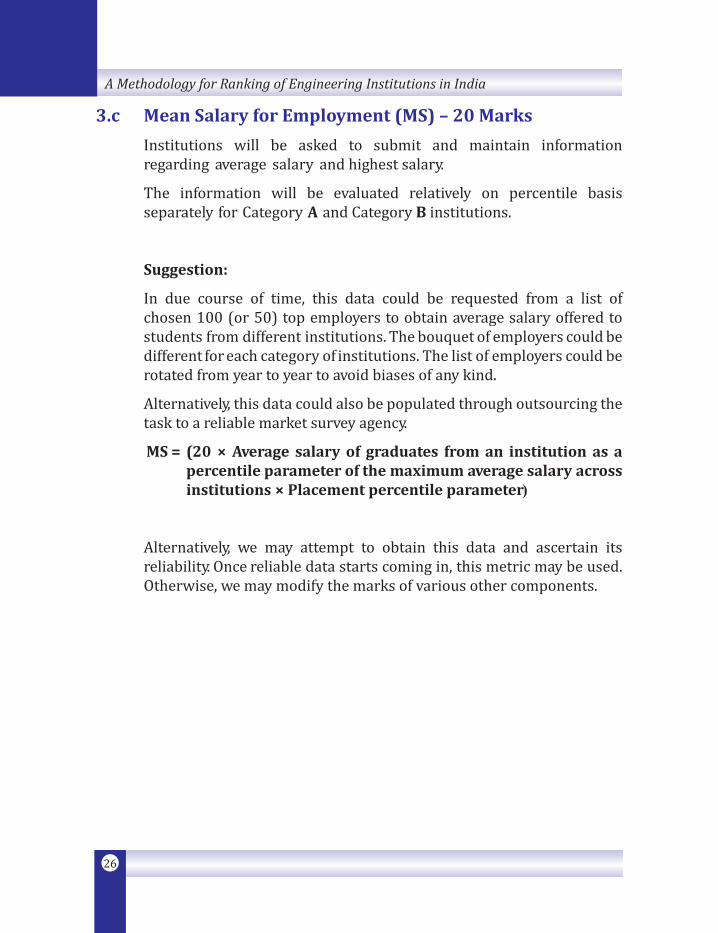
3.c Mean Salary for Employment (MS) – 20 Marks
Institutions will be asked to submit and maintain information regarding average salary and highest salary.
The information will be evaluated relatively on percentile basis separately for Category A and Category B institutions.
Suggestion:
In due course of time, this data could be requested from a list of chosen 100 (or 50) top employers to obtain average salary offered to students from different institutions. The bouquet of employers could be different for each category of institutions. The list of employers could be rotated from year to year to avoid biases of any kind.
Alternatively, this data could also be populated through outsourcing the task to a reliable market survey agency.
MS = (20 × Average salary of graduates from an institution as a percentile parameter of the maximum average salary across institutions × Placement percentile parameter)
Alternatively, we may attempt to obtain this data and ascertain its reliability. Once reliable data starts coming in, this metric may be used. Otherwise, we may modify the marks of various other components.

27
Outreach and Inclusivity (OI) – 100 Marks
Ranking Weight: 0.15
Overall Assessment Metric:
OI = (CES + RD+WS +ESDS + PCS)
The component metrics are explained on the following pages.
4Outreach and Inclusivity (OI)


29
Part - I : Parameters and Metrics for Category 'A' Institutions
4.a Outreach Footprint (Continuing Education, Service) (CES) – 25 Marks
Information to be sought from institutions regarding:
- Names and Number of CEP courses organized with participation numbers. Teacher Training and related outreach activities.
- Participation in technology enhanced programs like NPTEL, Virtual Labs or related activities like TEQIP etc.
- Interactions with industry.
- Facilitation of faculty in quality improvement.
- Any other activities falling in this category.
Assessment Metric
CES = (25 × Percentile parameter based on N)
Here,
N: Number of participation certificates issued per year (averaged over previous three ( 3) years) to Teachers/Industry Personnel etc. for outreach programs of six (6) days or more.
Percentile parameter calculated separately for each category of institutions.
30
A Methodology for Ranking of Engineering Institutions in India
4.b Percentage of Students from other States/Countries - Region Diversity (RD) – 25 Marks
Assessment Metric:
RD = (18 × Percentile fraction of total students admitted (averaged over past 3 years) from other states + 7 × Percentile fraction of students admitted (averaged over past 3 years) from other countries)
31
Part - I : Parameters and Metrics for Category 'A' Institutions
4.c Percentage of Women Students and Faculty (WS) – 20 Marks
WS=8 × (N1 /50) + 8 × (N2 /20)+(4 x N3/2)
Here,
N1 and N2 are the percentage of Women Students and faculty respectively.
N3 is the number of women members of eminence as Institute Head or on the Governing Board.
BenchMarks:
50% women students and 20% women faculty and 2 women as Institute Head or in the Governing Board expected to score maximum marks.

32
A Methodology for Ranking of Engineering Institutions in India
4.d Percentage of Economically and Socially Disadvantaged Students (ESDS) – 20 Marks
ESCS =20× (N/50)
Here,
N is the percentage of economically and socially disadvantaged Students averaged over the previous 3 years.
Benchmark:
50% economically and socially disadvantaged students should be admitted to score maximum marks.
33
Part - I : Parameters and Metrics for Category 'A' Institutions
4.e Facilities for Physically Challenged Students (PCS) –10 Marks
PDS = 10 Marks,
If the Institute provides full facilities for physically challenged students.
NAAC and NBA may be requested to provide their assessment, as possible.

35
Perception (PR) – 100 MarksRanking Weight: 0.1Overall Assessment Metric:
P = PRThe component metrics are explained on the following pages.
5Perception (PR)

37
Part - I : Parameters and Metrics for Category 'A' Institutions
5.a Process for Peer Rating in Category (PR) – 100 Marks
- This is to be done through a survey conducted over a large category of academics, institution heads, HR head of employers, members of funding agencies in Government, Private sector, NGOs, etc.
- Lists may be obtained from institutions and a comprehensive list may be prepared taking into account various sectors, regions, etc.
- Lists to be rotated periodically.
- This will be an On-line survey carried out in a time-bound fashion.

Part - IIParameters and Metrics
for Category 'B' Institutions

41
Part - II : Parameters And Metrics for Category 'B' Institutions
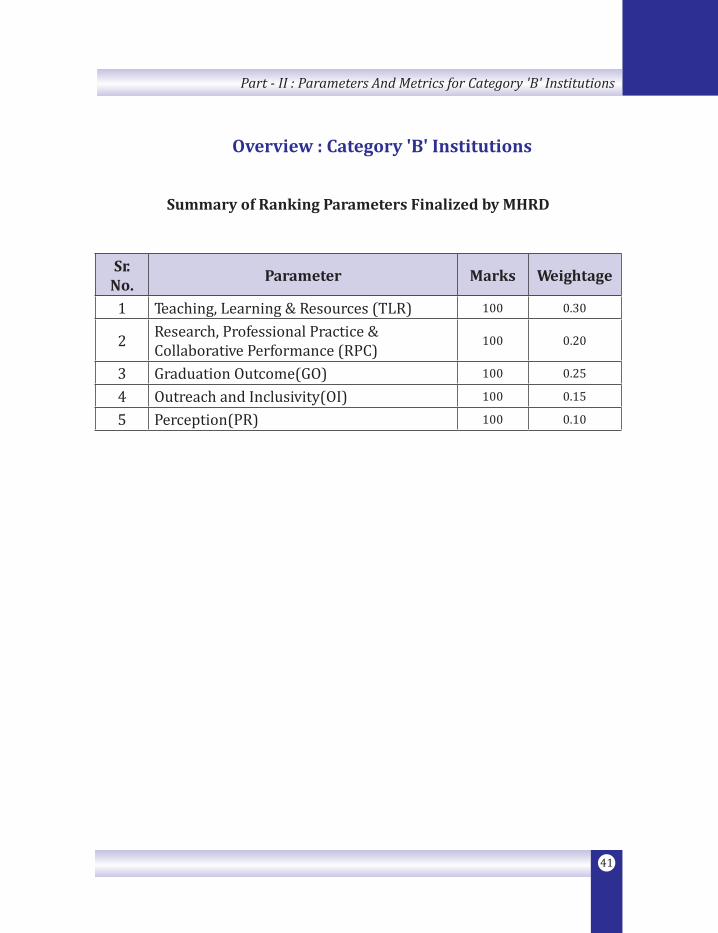
Overview : Category 'B' Institutions
Summary of Ranking Parameters Finalized by MHRD
Sr. No. Parameter Marks Weightage
1 Teaching, Learning & Resources (TLR) 100 0.30
2 Research, Professional Practice & Collaborative Performance (RPC)
100 0.20
3 Graduation Outcome(GO) 100 0.25
4 Outreach and Inclusivity(OI) 100 0.15
5 Perception(PR) 100 0.10
42
A Methodology for Ranking of Engineering Institutions in India
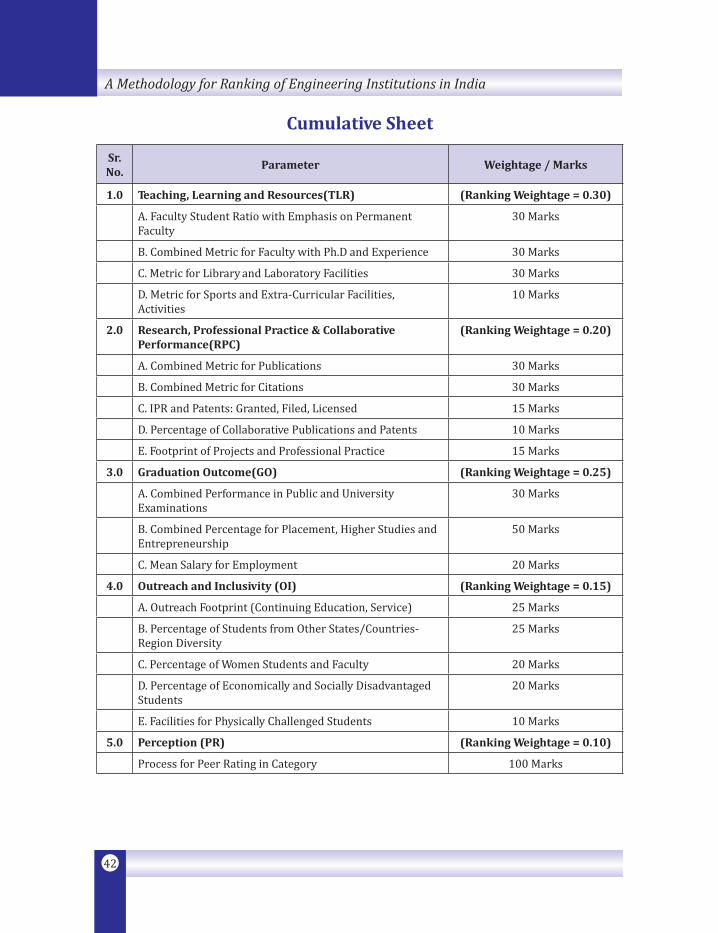
Cumulative Sheet
Sr. No.
Parameter Weightage / Marks
1.0 Teaching, Learning and Resources(TLR) (Ranking Weightage = 0.30)
A. Faculty Student Ratio with Emphasis on Permanent Faculty
30 Marks
B. Combined Metric for Faculty with Ph.D and Experience 30 Marks
C. Metric for Library and Laboratory Facilities 30 Marks
D. Metric for Sports and Extra-Curricular Facilities, Activities
10 Marks
2.0 Research, Professional Practice & Collaborative Performance(RPC)
(Ranking Weightage = 0.20)
A. Combined Metric for Publications 30 Marks
B. Combined Metric for Citations 30 Marks
C. IPR and Patents: Granted, Filed, Licensed 15 Marks
D. Percentage of Collaborative Publications and Patents 10 Marks
E. Footprint of Projects and Professional Practice 15 Marks
3.0 Graduation Outcome(GO) (Ranking Weightage = 0.25)
A. Combined Performance in Public and University Examinations
30 Marks
B. Combined Percentage for Placement, Higher Studies and Entrepreneurship
50 Marks
C. Mean Salary for Employment 20 Marks
4.0 Outreach and Inclusivity (OI) (Ranking Weightage = 0.15)
A. Outreach Footprint (Continuing Education, Service) 25 Marks
B. Percentage of Students from Other States/Countries- Region Diversity
25 Marks
C. Percentage of Women Students and Faculty 20 Marks
D. Percentage of Economically and Socially Disadvantaged Students
20 Marks
E. Facilities for Physically Challenged Students 10 Marks
5.0 Perception (PR) (Ranking Weightage = 0.10)
Process for Peer Rating in Category 100 Marks

43
Teaching, Learning & Resources (TLR) – 100 Marks
Ranking Weight: 0.30
Overall Assessment Metric:
TLR = (FSR + FQE + LL + SEC)
The component metrics are explained on the following pages.
1 Teaching, Learning & Resources (TLR)


45
Part - II : Parameters And Metrics for Category 'B' Institutions
1.a Faculty-Student Ratio with Emphasis on Permanent Faculty (FSR) – 30 Marks
Assessment will be based on the ratio of number of regular faculty members in the Institute and total sanctioned/approved intake considering all UG & PG Programs.
Regular appointment means faculty on full time basis with no time limit on their employment. However, faculty on contract basis for a period of not less than three (3) years, on gross salary similar to those who are permanent can also be included.
Only faculty members with Ph.D or M.Tech qualifications should be considered and counted here. Faculty members with a B.Tech (or equivalent qualification, e.g., M.Sc) will not be counted.
Visiting faculty (with a Ph.D) who are visiting the institution on a full time basis for at least one semester, can be included in the count for that semester.
The benchmark value is set as a ration of 1:10 for scoring maximum Marks.
FSR=30×[10×F/N)]
Here,
N: Total number of students studying in the institution considering all UG and PG Programs, excluding the Ph.D program.
F1= F1+0.3F2
F1 : Full time regular faculty of all UG and PG Programs in the previous year.
F2: Eminent teachers/ faculty (with Ph.D) visiting the institution for atleast a semester on a full time basis can be counted (with a count of 0.5 per semester per visiting faculty) in the previous year.
For F/N < 1: 50, FSR will be set to zero.

46
A Methodology for Ranking of Engineering Institutions in India
Data Collection:
From the concerned Institutions in prescribed format on an On-line facility. As mentioned in the preamble, an institution will be eligible for ranking, if all relevant, and updated data about the faculty members (in the previous three years) is available on a publicly visible website. The data will also be archived and maintained by the Ranking Agency.
Data Verification:
By the Ranking Agency on a random sample basis.
47
Part - II : Parameters And Metrics for Category 'B' Institutions
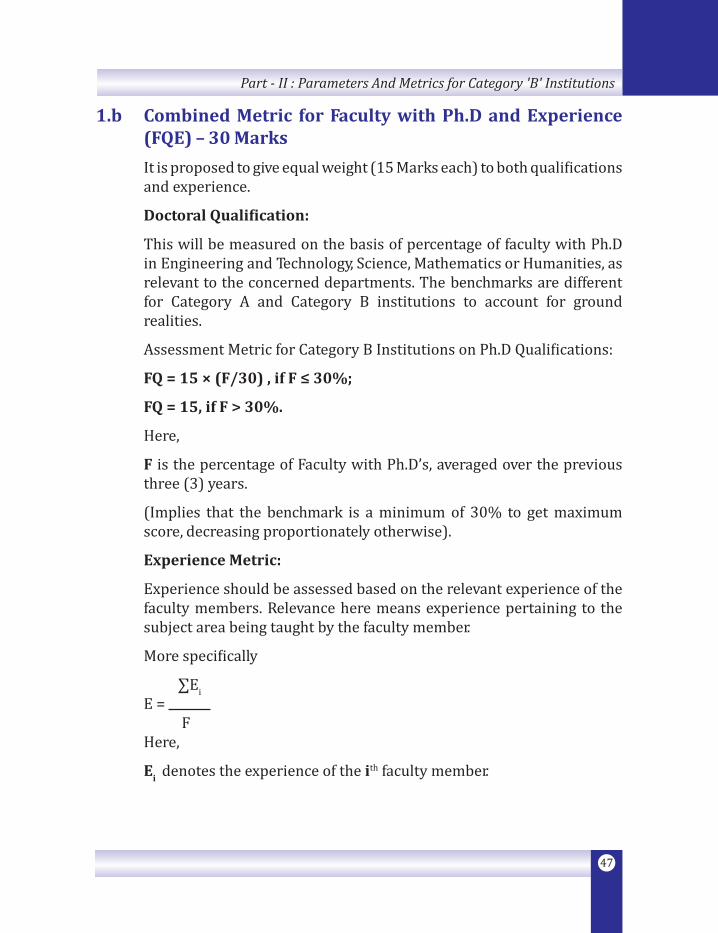
1.b Combined Metric for Faculty with Ph.D and Experience (FQE) – 30 Marks
It is proposed to give equal weight (15 Marks each) to both qualifications and experience.
Doctoral Qualification:
This will be measured on the basis of percentage of faculty with Ph.D in Engineering and Technology, Science, Mathematics or Humanities, as relevant to the concerned departments. The benchmarks are different for Category A and Category B institutions to account for ground realities.
Assessment Metric for Category B Institutions on Ph.D Qualifications:
FQ = 15 × (F/30) , if F ≤ 30%;
FQ = 15, if F > 30%.
Here,
F is the percentage of Faculty with Ph.D’s, averaged over the previous three (3) years.
(Implies that the benchmark is a minimum of 30% to get maximum score, decreasing proportionately otherwise).
Experience Metric:
Experience should be assessed based on the relevant experience of the faculty members. Relevance here means experience pertaining to the subject area being taught by the faculty member.
More specifically
∑EiE = FHere,
Ei denotes the experience of the ith faculty member.

48
A Methodology for Ranking of Engineering Institutions in India
For simplicity , however Ei may also be calculated from the age profile of the faculty members as follows:
Ei = Ai - 30, for Ai ≤ 45 years.
Ei = 15, for Ai ≥ 45 years.
Assessment Metric for Experience (for both Category A and Category B instituions):
FE =15×(E/15), for E ≤ 15 years
FE = 15, for E > 15 years.
Here,
E is the average years of experience of all faculty members as calculated above, in rounded years.
This implies that the benchmark experience is fifteen (15) years to score maximum Marks, decreasing proportionately otherwise.
Data Collection:
Institutions to submit information in a tabular form indicating faculty name, qualifications (indicating the University attended for the qualifying degree) and experience under the categories of academic and industrial. Updated data for the last three (3) years should be available on a publicly available website, and suitably archived for consistency check in subsequent years.
Data Verification:
On a random sampling basis.
Combined Metric for Faculty Qualifications and Experience:
FQE = (FQ + FE)
49
Part - II : Parameters And Metrics for Category 'B' Institutions
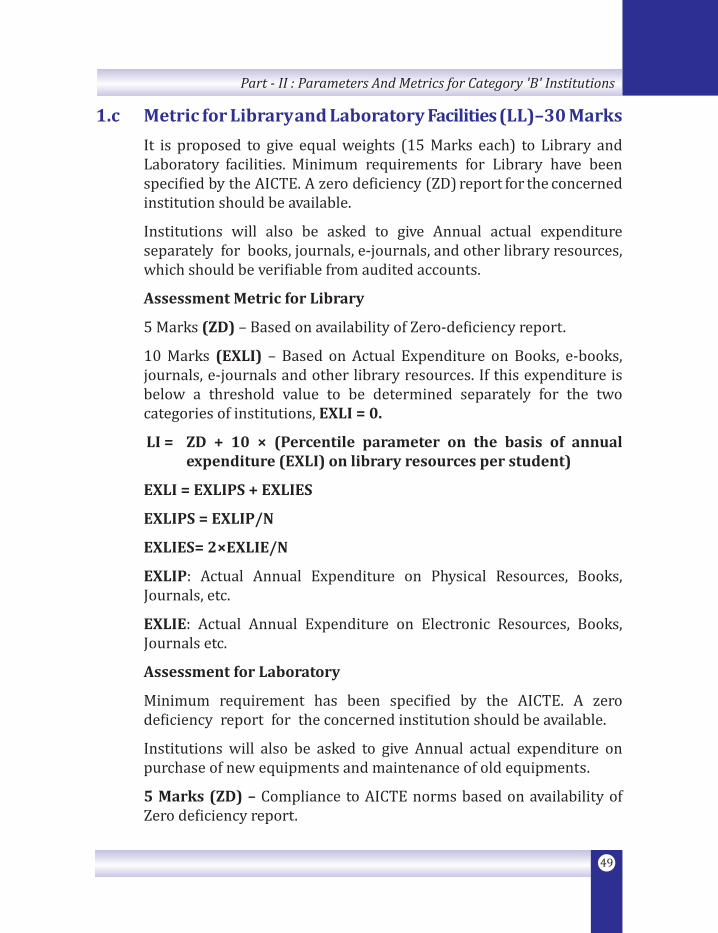
1.c Metric for Library and Laboratory Facilities (LL)–30 Marks
It is proposed to give equal weights (15 Marks each) to Library and Laboratory facilities. Minimum requirements for Library have been specified by the AICTE. A zero deficiency (ZD) report for the concerned institution should be available.
Institutions will also be asked to give Annual actual expenditure separately for books, journals, e-journals, and other library resources, which should be verifiable from audited accounts.
Assessment Metric for Library
5 Marks (ZD) – Based on availability of Zero-deficiency report.
10 Marks (EXLI) – Based on Actual Expenditure on Books, e-books, journals, e-journals and other library resources. If this expenditure is below a threshold value to be determined separately for the two categories of institutions, EXLI = 0.
LI = ZD + 10 × (Percentile parameter on the basis of annual expenditure (EXLI) on library resources per student)
EXLI = EXLIPS + EXLIES
EXLIPS = EXLIP/N
EXLIES= 2×EXLIE/N
EXLIP: Actual Annual Expenditure on Physical Resources, Books, Journals, etc.
EXLIE: Actual Annual Expenditure on Electronic Resources, Books, Journals etc.
Assessment for Laboratory
Minimum requirement has been specified by the AICTE. A zero deficiency report for the concerned institution should be available.
Institutions will also be asked to give Annual actual expenditure on purchase of new equipments and maintenance of old equipments.
5 Marks (ZD) – Compliance to AICTE norms based on availability of Zero deficiency report.
50
A Methodology for Ranking of Engineering Institutions in India
10 Marks (EXLB) – Based on Actual annual expenditure on purchase of new equipment, creating new lab infrastructure and maintenance.
EXLB = 0, if annual expenditure is below a certain threshold value, to be determined separately for each category of institutions.
LB = ZD + 10 × (Percentile parameter on the basis of annual expenditure (EXLB) on creation and maintenance of lab resources)
Combined Metric for Library and Lab Resources:
LL=(LI + LB)
51
Part - II : Parameters And Metrics for Category 'B' Institutions
1.d Metric for Sports and Extra-Curricular Facilities, Activities (SEC) – 10 Marks
Equal weight will be given to sports facilities, sports budget and top performances, and extracurricular activities.
Extra-Curricular (EC) activities may typically include, but not be limited to Clubs/Forums, NCC, NSS etc.
Assessment will be same for the two category of Institutions.
Parameters to be used:
- Sports facilities area per student (A);
- Actual expenditure per student on Sports and EC activities (B); and
- Number of top positions in inter- college sports and EC events (C).
Each parameter to be evaluated on a percentile basis to obtain the percentile parameter p(A), p(B) and p(C).
Weights assigned to the 3 components are 0.5, 0.25 and 0.25 respectively.
p(C) = 1, if a college has at least 3 winners of a state level or national event.
Assessment Metric for Sports and Extra Curricular Activities :
SEC = 10 × [p(A)/2 + p(B)/4 + p(C)/4]
Data Collection:
To be obtained from the institutions.
Data Verification:
By Ranking Agency on a random sample basis.

53
Research, Professional Practice & Collaborative Performance (RPC) – 100 Marks
Ranking Weight: 0.20
Overall Assessment Metric:
RPC = (PU + CI + IPR + CP + FPPP)
The component metrics are explained on the following pages.
2 Research, Professional Practice & Collaborative Performance (RPC)

55
Part - II : Parameters And Metrics for Category 'B' Institutions
2.a Combined Metric for Publications (PU) – 30 Marks
It is proposed that Publications indexed in Scopus, Web of Science, and Google Scholar only will be counted for assessment. An average value P for the previous three (3) years will be computed as detailed later in this item.
The Institution will submit faculty publication list as supporting information. However, the primary sources of information will be Scopus, Web of Science and Google Scholar.
Books/Monographs should have ISBN number and be published by reputed publishers.
Assessment Metric for Publications (Category B):
PU = 20× Percentile (expressed as a fraction) parameter on the basis of (P/F)
Here,
P is the number of publications = Weighted average of numbers given by Scopus, Web of Science and Google Scholar over the previous 3 years.
P = (0.3PW + 0.6PS + 0.1PG)
Here,
PW : Number of publications reported in Web of Science.
PS: Number of publications reported in Scopus
PG : Number of publications reported in Google Scholar.
F is the number of regular faculty members as used in Item 1.
Explanation:
Percentile parameter = Percentile value of (P/F)/100
Although the formulas are identical for both categories of institutions, the percentile parameter will be computed separately for each category.
56
A Methodology for Ranking of Engineering Institutions in India
2.b Combined Metric for Citations (CI) – 30 Marks
The proposed assessment is based on the ratio of number of citations in the previous three (3) years to the number of papers published during this time. A weighted average of the numbers from the three popular data bases will be used.
Institutions will be asked to provide information in a tabular form giving relevant details. However, the primary sources will be the three standard Databases: Scopus, Web of Science and Google Scholar.
Assessment Metric for Citations (Category B):
CI = 30 × Percentile (expressed as a fraction) parameter on the basis of (CC/P) for the B Category × Percentile parameter value on the basis of P
Here,
CC is Total Citation Count over previous 3 years and P is total number of publications over this period as computed in 2a.
CC is computed as follows:
CC = (0.3CCW + 0.6CCS + 0.1CCG)
Here,
CCW : Total Number of Citations reported in Web of Science.
CCS : Total Number of Citations reported in Scopus.
CCG : Total Number of Citations reported in Google Scholar.
57
Part - II : Parameters And Metrics for Category 'B' Institutions
2.c IPR and Patents: Granted, Filed, Licensed (IPR) – 15 Marks
Proposed Marks distribution –
Granted : 6 Marks,
Filed : 3 Marks,
Licensed : 6 Marks
IPR will be broadly based on registered copyrights, designs and patents over the last three (3) years.
Assessment method will be identical for both categories. However, the indicated percentile will be calculated for the two categories separately.
IPR = PF + PG + PL
Assessment of IPR on patents (including copyrights and designs) filed:
PF = 3×Percentile parameter (expressed as a fraction) on the basis of (PF/F)
Here,
PF is the number of patents, copyrights, designs filed.
F is the number of regular faculty members.
Assessment Metric for IPR on patents (including copyrights and designs) granted:
PG = 6×Percentile parameter (expressed as a fraction) on the basis of (PG/F )
Here,
PG is the number of patents, copyrights, designs granted/registered.
F is the number of regular faculty members.
58
A Methodology for Ranking of Engineering Institutions in India
Assessment Metric for IPR and Patents Licensed:
PL = 2×I(P) + 4 × Percentile parameter (expressed as a fraction) based on (EP/F )
Here,
EP is the total earnings from patents etc. over the last three (3) years.
I(P) = 1, if at least one patent was licensed in the previous three (3) years or atleast one technology transferred during this period;
Otherwise,
I(P) = 0
F is the average number of regular faculty over this period.
Data Collection:
To be made available by the concerned institutes On-line.
Data Verification:
By Ranking Agency on a Random Sample Basis.

59
Part - II : Parameters And Metrics for Category 'B' Institutions
2.d Percentage of Collaborative Publications and Patents (CP) – 10 Marks
Assessment Metric for Collaborative Publication and Patents:
CP = 10×(Fraction of publications jointly with outside collaborators + Fraction of patents jointly with outside collaborators).
In case this number turns out to be more than 10, the score will be restricted to this value.
Data Collection:
Mainly from Databases like Scopus, Web of Science and Google Scholar. Could be aided by information from the institute.
60
A Methodology for Ranking of Engineering Institutions in India
2.e Footprint of Projects and Professional Practice (FPPP) – 15 Marks
FPPP = (FPR + FPC)
Proposed distribution:
Research Funding(RF) : 7.5 Marks,
Consultancy Funding (CF) : 7.5 Marks
Institution will be asked to provide information in a tabular form indicating funding agency, amount, duration, Principle Investigator and impact, if any.
Assessment Metric for Research Funding:
FPR = 7.5 × Percentile parameter (as a fraction) based on the average value of RF for the previous 3 years.
Here,
RF is average annual research funding earnings (amount actually received in Lakhs) at institute level for the previous three (3) years.
Assessment Metric for Consultancy:
FPC = [7.5 × Percentile parameter (as a fraction) based on the average value of CF for the previous 3 years]
Here,
CF is cumulative consultancy amount (amount actually received in Lakhs) at institute level, for the previous three (3) years.
Although the metric is same for the two categories of institutions, the percentile parameters will be calculated separately for each peer group.

61
Graduation Outcome (GO) – 100 Marks
Ranking Weight: 0.25
Overall Assessment Metric:
GO = (PUE + PHE + MS)
The component metrics are explained on the following pages.
3Graduation Outcome (GO)


63
Part - II : Parameters And Metrics for Category 'B' Institutions
3.a Combined Performance in Public and University Examinations (PUE) – 30 Marks
Assessment in respect of Public examinations will be based on cumulative percentile of students (as a fraction of the number appearing) qualifying in Public examinations (such as UPSC conducted, State Government, GATE, NET, CAT etc. list to be notified) from an institution, out of the cumulative number of successful students in that year. An effort should be made to connect with examination conducting agencies to prepare institute wise data.
Assessment in respect of University examinations will be based on the percentage of students clearing/complying with the degree requirements in the minimum graduation time. Data should be obtained from the affiliating Universities, if possible.
PUE = (PE + UE)
Here,
Public Examinations (PE) = 10 Marks
University Examinations (UE) = 20 Marks
For Public Examinations, we first calculate the percentile parameter 'p' as follows:
Let fi be the fraction of successful students from a given institution (ratio of the number of successful and the number of appearing) for examination i.
fi = 0, if either the number of successful students or those appearing in the examination are nil.
Let ti be the toughness parameter of examination i.
Then,
p = Fraction percentile of ∑ (1-ti) fi ,
where
(Number of successful candidates in examination i) ti = (Number of candidates appearing in examination i)
64
A Methodology for Ranking of Engineering Institutions in India
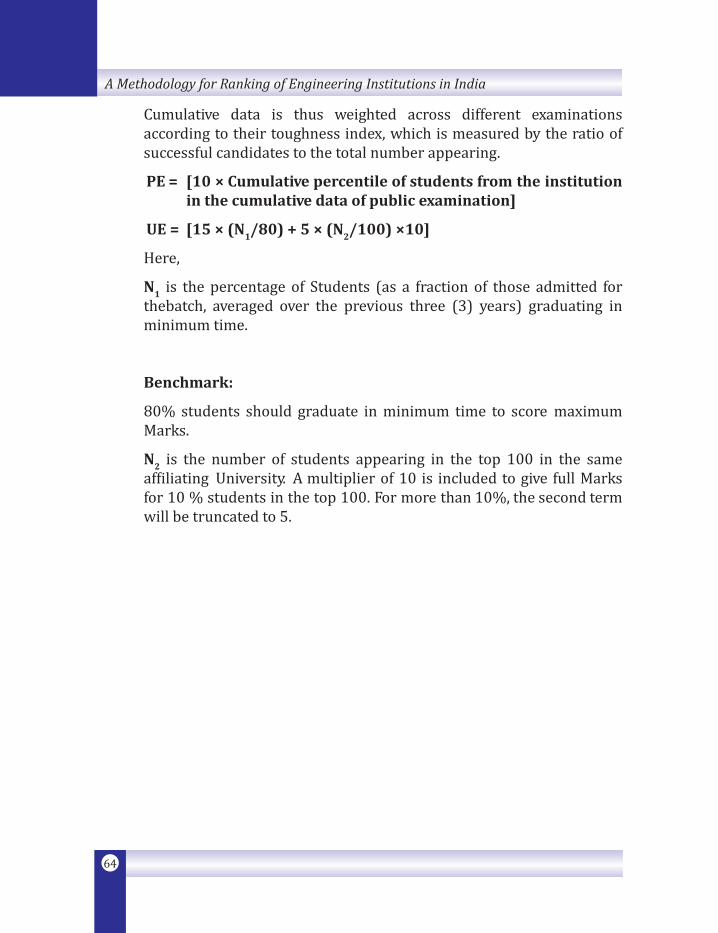
Cumulative data is thus weighted across different examinations according to their toughness index, which is measured by the ratio of successful candidates to the total number appearing.
PE = [10 × Cumulative percentile of students from the institution in the cumulative data of public examination]
UE = [15 × (N1/80) + 5 × (N2/100) ×10]
Here,
N1 is the percentage of Students (as a fraction of those admitted for thebatch, averaged over the previous three (3) years) graduating in minimum time.
Benchmark:
80% students should graduate in minimum time to score maximum Marks.
N2 is the number of students appearing in the top 100 in the same affiliating University. A multiplier of 10 is included to give full Marks for 10 % students in the top 100. For more than 10%, the second term will be truncated to 5.
65
Part - II : Parameters And Metrics for Category 'B' Institutions
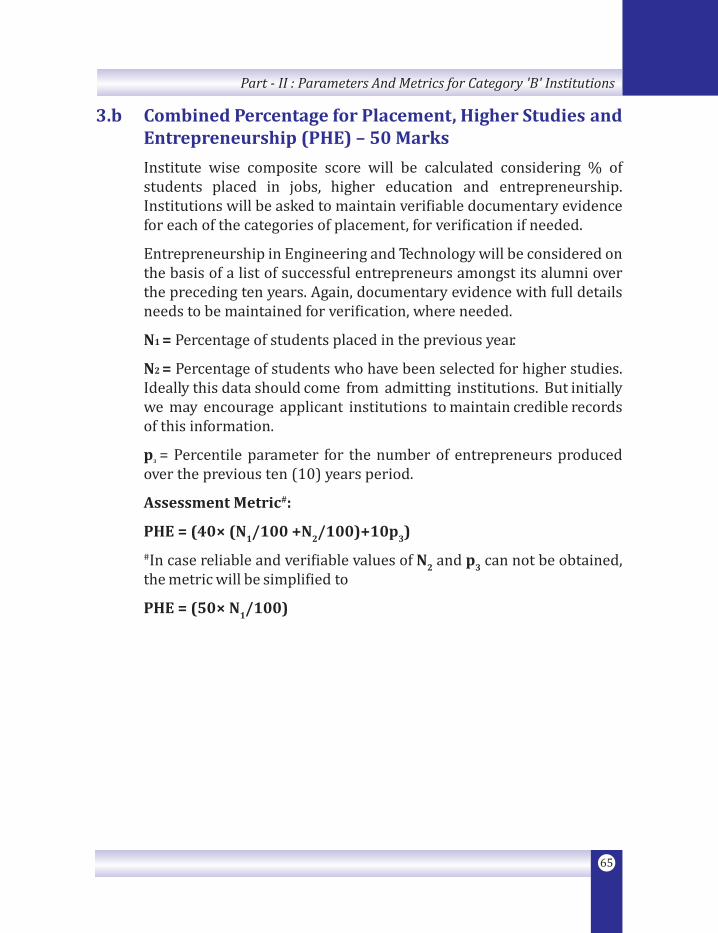
3.b Combined Percentage for Placement, Higher Studies and Entrepreneurship (PHE) – 50 Marks
Institute wise composite score will be calculated considering % of students placed in jobs, higher education and entrepreneurship. Institutions will be asked to maintain verifiable documentary evidence for each of the categories of placement, for verification if needed.
Entrepreneurship in Engineering and Technology will be considered on the basis of a list of successful entrepreneurs amongst its alumni over the preceding ten years. Again, documentary evidence with full details needs to be maintained for verification, where needed.
N1 = Percentage of students placed in the previous year.
N2 = Percentage of students who have been selected for higher studies. Ideally this data should come from admitting institutions. But initially we may encourage applicant institutions to maintain credible records of this information.
p3 = Percentile parameter for the number of entrepreneurs produced over the previous ten (10) years period.
Assessment Metric#:
PHE = (40× (N1/100 +N2/100)+10p3)
#In case reliable and verifiable values of N2 and p3 can not be obtained, the metric will be simplified to
PHE = (50× N1/100)

66
A Methodology for Ranking of Engineering Institutions in India
3.c Mean Salary for Employment (MS) – 20 Marks
Institutions will be asked to submit and maintain information regarding average salary and highest salary.
The information will be evaluated relatively on percentile basis separately for Category A and Category B institutions.
Suggestion:
In due course of time, this data could be requested from a list of chosen 100 (or 50) top employers to obtain average salary offered to students from different institutions. The bouquet of employers could be different for the two category of institutions. The list of employers could be rotated from year to year to avoid biases of any kind.
Alternatively, this data could also be populated through outsourcing the task to a reliable market survey agency.
MS = (20 × Average salary of graduates from an institution as a percentile parameter of the maximum average salary across institutions × Placement percentile parameter)
Alternatively, we may attempt to obtain this data and ascertain its reliability. Once reliable data starts coming in, this metric may be used. Otherwise, we may modify the marks of various other components.
67
Outreach and Inclusivity (OI) – 100 Marks
Ranking Weight: 0.15
Overall Assessment Metric:
OI = (CES + RD+ WS +ESDS + PCS)
The component metrics are explained on the following pages.
4Outreach and Inclusivity (OI)

69
Part - II : Parameters And Metrics for Category 'B' Institutions
4.a Outreach Footprint (Continuing Education, Service) (CES) – 25 Marks
Information to be sought from institutions regarding:
- Names and Number of CEP courses organized with participation numbers. Teacher Training and related outreach activities.
- Participation in technology enhanced programs like NPTEL, Virtual Labs or related activities like TEQIP etc.
- Interactions with industry.
- Facilitation of faculty in quality improvement.
- Any other activities falling in this category.
Assessment Metric
CES = (25 × Percentile parameter based on N)
Here,
N: Number of participation certificates issued per year (averaged over previous three ( 3) years) to Teachers/Industry Personnel etc. for outreach programs of six (6) days or more.
Percentile parameter calculated separately for each category of institutions.

70
A Methodology for Ranking of Engineering Institutions in India
4.b Percentage of Students from other States/Countries - Region Diversity (RD) – 25 Marks
Assessment Metric:
RD = [20 × Fraction of total students admitted (averaged over past 3 years) from other states + 5 × Fraction of students admitted (averaged over past 3 years) from other countries]
71
Part - II : Parameters And Metrics for Category 'B' Institutions
4.c Percentage of Women Students and Faculty (WS) – 20 Marks
WS= [8 × (N1 /50) + 8 × (N2 /20) + 4 × (N3 /2)]
Here,
N1 and N2 are the percentage of Women Students and faculty respectively.
N3 is the number of women members of eminence as Institute Head or on the Governing Board.
Benchmark:
50% women students and 20% women faculty and 2 women as Institute Head or in the Governing Board expected to score maximum Marks; linearly proportionate otherwise.
72
A Methodology for Ranking of Engineering Institutions in India
4.d Percentage of Economically and Socially Disadvantaged Students (ESDS) – 20 Marks
ESCS = [20 × (N/50)]
Here,
N is the percentage of economically and socially disadvantaged Students averaged over the previous three (3) years.
Benchmark:
50% economically and socially disadvantaged students should be admitted to score maximum marks.
73
Part - II : Parameters And Metrics for Category 'B' Institutions
4.e Facilities for Physically Challenged Students (PCS) – 10 Marks
PCS = 10 Marks,
If the Institute provides full facilities for physically challenged students
NAAC and NBA may be requested to provide this assessment.

74
A Methodology for Ranking of Engineering Institutions in India

75
Perception (PR) – 100 Marks
Ranking Weight: 0.10
Overall Assessment Metric:
P = PR
The process is explained on the following pages.
5Perception (PR)

77
Part - II : Parameters And Metrics for Category 'B' Institutions
5.a Process for Peer Rating in Category (PR) – 100 Marks
- This is to be done through a survey conducted over a large category of academics, institution heads, HR heads of employers, members of funding agencies in Government, private sector, NGOs, etc.
- Lists may be obtained from institutions and a comprehensive list may be prepared taking into account various sectors, regions, etc.
- Lists to be rotated periodically.
- This will be an On-line survey carried out in a time-bound fashion.
- For Category B institutions, the lists will have a significant representation of state level academics who are knowledgeable about the institutions in the state.